La Minita, TX Map & Demographics
La Minita Map
La Minita Overview
$45,156
PER CAPITA INCOME
$166,711
AVG FAMILY INCOME
$166,118
AVG HOUSEHOLD INCOME
0.33
INEQUALITY / GINI INDEX
187
TOTAL POPULATION
89
MALE POPULATION
98
FEMALE POPULATION
90.82
MALES / 100 FEMALES
110.11
FEMALES / 100 MALES
52.7
MEDIAN AGE
3.4
AVG FAMILY SIZE
3.1
AVG HOUSEHOLD SIZE
103
LABOR FORCE [ PEOPLE ]
56.9%
PERCENT IN LABOR FORCE
Income in La Minita
Income Overview in La Minita
Per Capita Income in La Minita is $45,156, while median incomes of families and households are $166,711 and $166,118 respectively.
| Characteristic | Number | Measure |
| Per Capita Income | 187 | $45,156 |
| Median Family Income | 52 | $166,711 |
| Mean Family Income | 52 | $138,088 |
| Median Household Income | 61 | $166,118 |
| Mean Household Income | 61 | $121,456 |
| Income Deficit | 52 | $0 |
| Wage / Income Gap (%) | 187 | 0.00% |
| Wage / Income Gap ($) | 187 | 100.00¢ per $1 |
| Gini / Inequality Index | 187 | 0.33 |
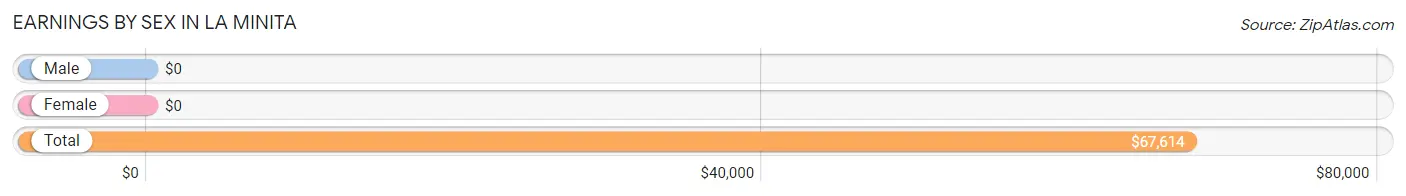
Earnings by Sex in La Minita
| Sex | Number | Average Earnings |
| Male | 55 (53.4%) | $0 |
| Female | 48 (46.6%) | $0 |
| Total | 103 (100.0%) | $67,614 |
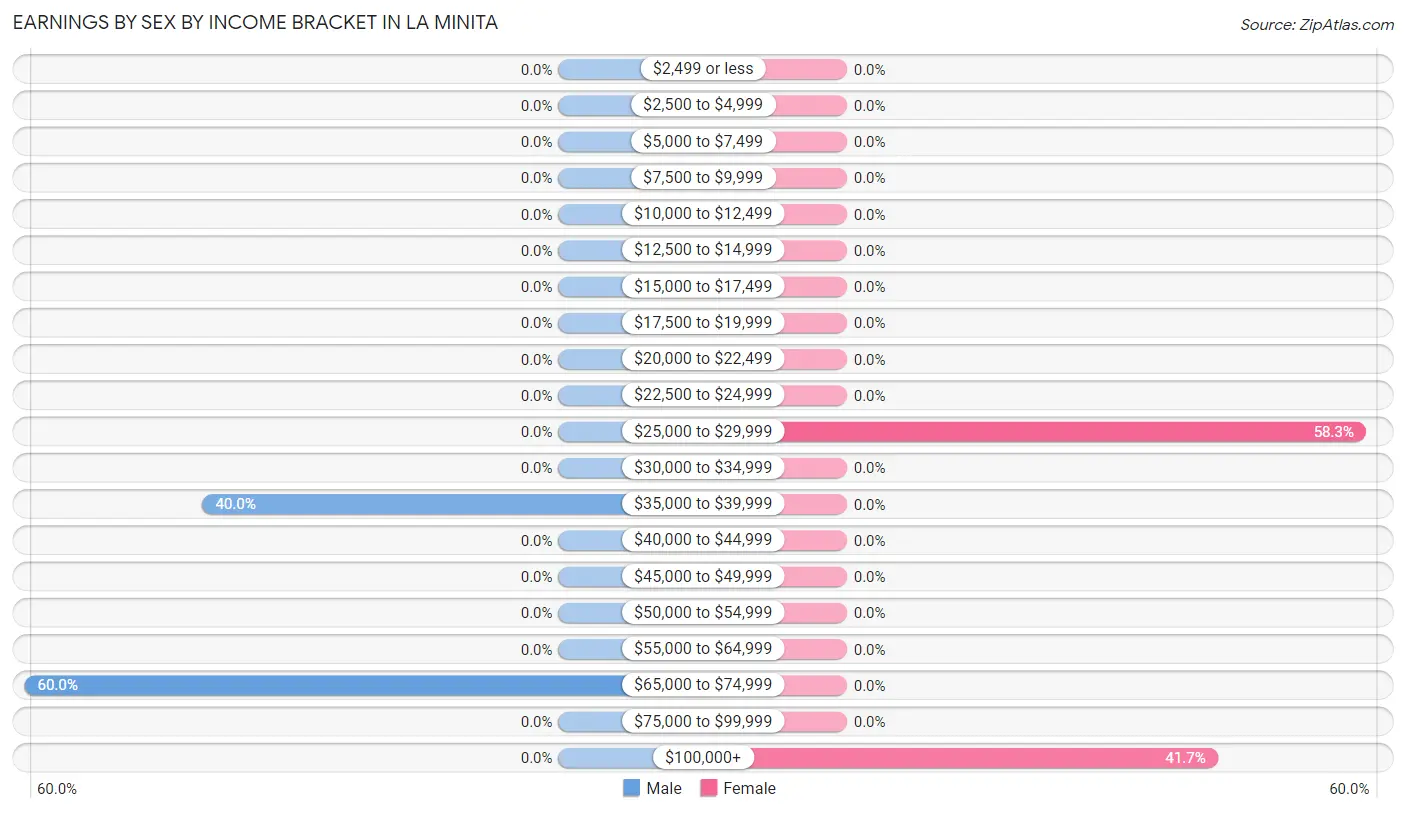
Earnings by Sex by Income Bracket in La Minita
The most common earnings brackets in La Minita are $65,000 to $74,999 for men (33 | 60.0%) and $25,000 to $29,999 for women (28 | 58.3%).
| Income | Male | Female |
| $2,499 or less | 0 (0.0%) | 0 (0.0%) |
| $2,500 to $4,999 | 0 (0.0%) | 0 (0.0%) |
| $5,000 to $7,499 | 0 (0.0%) | 0 (0.0%) |
| $7,500 to $9,999 | 0 (0.0%) | 0 (0.0%) |
| $10,000 to $12,499 | 0 (0.0%) | 0 (0.0%) |
| $12,500 to $14,999 | 0 (0.0%) | 0 (0.0%) |
| $15,000 to $17,499 | 0 (0.0%) | 0 (0.0%) |
| $17,500 to $19,999 | 0 (0.0%) | 0 (0.0%) |
| $20,000 to $22,499 | 0 (0.0%) | 0 (0.0%) |
| $22,500 to $24,999 | 0 (0.0%) | 0 (0.0%) |
| $25,000 to $29,999 | 0 (0.0%) | 28 (58.3%) |
| $30,000 to $34,999 | 0 (0.0%) | 0 (0.0%) |
| $35,000 to $39,999 | 22 (40.0%) | 0 (0.0%) |
| $40,000 to $44,999 | 0 (0.0%) | 0 (0.0%) |
| $45,000 to $49,999 | 0 (0.0%) | 0 (0.0%) |
| $50,000 to $54,999 | 0 (0.0%) | 0 (0.0%) |
| $55,000 to $64,999 | 0 (0.0%) | 0 (0.0%) |
| $65,000 to $74,999 | 33 (60.0%) | 0 (0.0%) |
| $75,000 to $99,999 | 0 (0.0%) | 0 (0.0%) |
| $100,000+ | 0 (0.0%) | 20 (41.7%) |
| Total | 55 (100.0%) | 48 (100.0%) |
Earnings by Sex by Educational Attainment in La Minita
| Educational Attainment | Male Income | Female Income |
| Less than High School | - | - |
| High School Diploma | - | - |
| College or Associate's Degree | - | - |
| Bachelor's Degree | - | - |
| Graduate Degree | - | - |
| Total | - | - |
Family Income in La Minita
Family Income Brackets in La Minita
According to the La Minita family income data, there are 39 families falling into the $150,000 to $199,999 income range, which is the most common income bracket and makes up 75.0% of all families.
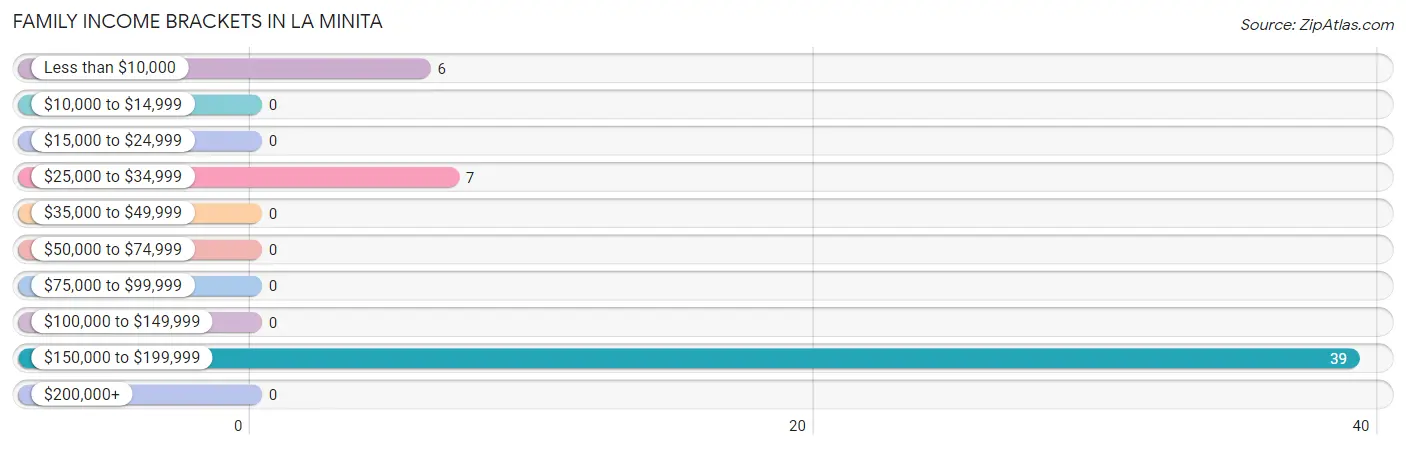
| Income Bracket | # Families | % Families |
| Less than $10,000 | 6 | 11.5% |
| $10,000 to $14,999 | 0 | 0.0% |
| $15,000 to $24,999 | 0 | 0.0% |
| $25,000 to $34,999 | 7 | 13.5% |
| $35,000 to $49,999 | 0 | 0.0% |
| $50,000 to $74,999 | 0 | 0.0% |
| $75,000 to $99,999 | 0 | 0.0% |
| $100,000 to $149,999 | 0 | 0.0% |
| $150,000 to $199,999 | 39 | 75.0% |
| $200,000+ | 0 | 0.0% |
Family Income by Famaliy Size in La Minita
| Income Bracket | # Families | Median Income |
| 2-Person Families | 32 (61.5%) | $0 |
| 3-Person Families | 0 (0.0%) | $0 |
| 4-Person Families | 20 (38.5%) | $0 |
| 5-Person Families | 0 (0.0%) | $0 |
| 6-Person Families | 0 (0.0%) | $0 |
| 7+ Person Families | 0 (0.0%) | $0 |
| Total | 52 (100.0%) | $166,711 |
Family Income by Number of Earners in La Minita
| Number of Earners | # Families | Median Income |
| No Earners | 13 (25.0%) | $0 |
| 1 Earner | 0 (0.0%) | $0 |
| 2 Earners | 39 (75.0%) | $0 |
| 3+ Earners | 0 (0.0%) | $0 |
| Total | 52 (100.0%) | $166,711 |
Household Income in La Minita
Household Income Brackets in La Minita
With 39 households falling in the category, the $150,000 to $199,999 income range is the most frequent in La Minita, accounting for 63.9% of all households.
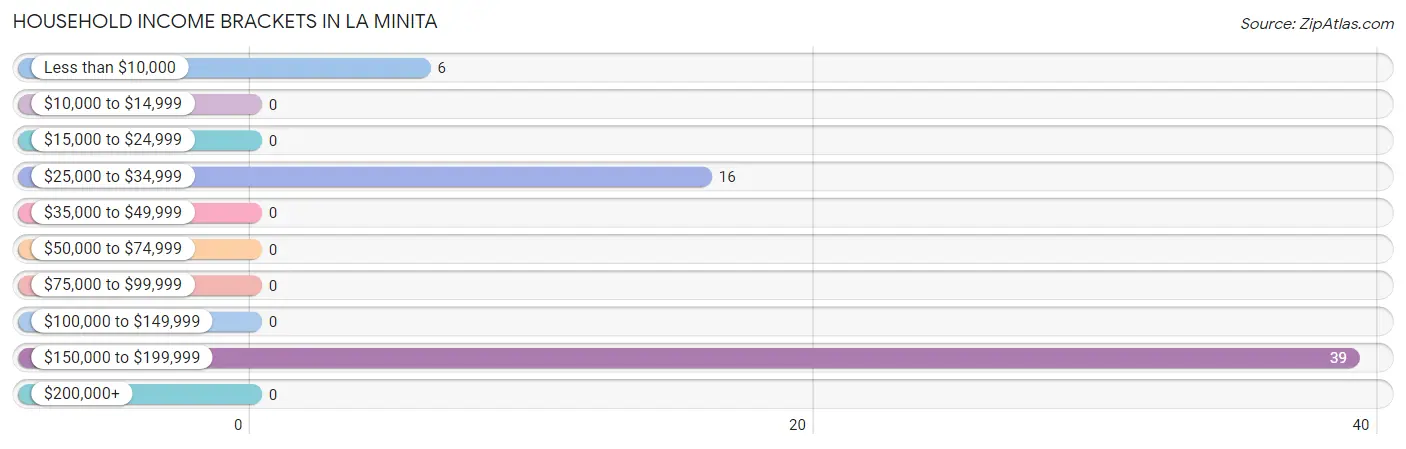
| Income Bracket | # Households | % Households |
| Less than $10,000 | 6 | 9.8% |
| $10,000 to $14,999 | 0 | 0.0% |
| $15,000 to $24,999 | 0 | 0.0% |
| $25,000 to $34,999 | 16 | 26.2% |
| $35,000 to $49,999 | 0 | 0.0% |
| $50,000 to $74,999 | 0 | 0.0% |
| $75,000 to $99,999 | 0 | 0.0% |
| $100,000 to $149,999 | 0 | 0.0% |
| $150,000 to $199,999 | 39 | 63.9% |
| $200,000+ | 0 | 0.0% |
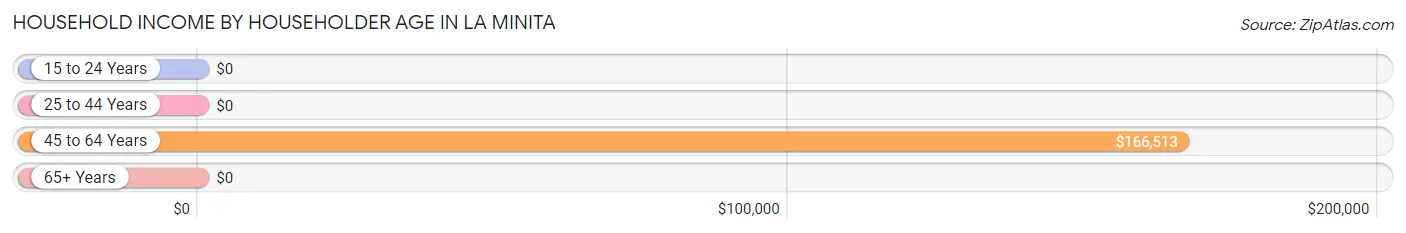
Household Income by Householder Age in La Minita
The median household income in La Minita is $166,118, with the highest median household income of $166,513 found in the 45 to 64 years age bracket for the primary householder. A total of 55 households (90.2%) fall into this category.
| Income Bracket | # Households | Median Income |
| 15 to 24 Years | 0 (0.0%) | $0 |
| 25 to 44 Years | 0 (0.0%) | $0 |
| 45 to 64 Years | 55 (90.2%) | $166,513 |
| 65+ Years | 6 (9.8%) | $0 |
| Total | 61 (100.0%) | $166,118 |
Poverty in La Minita
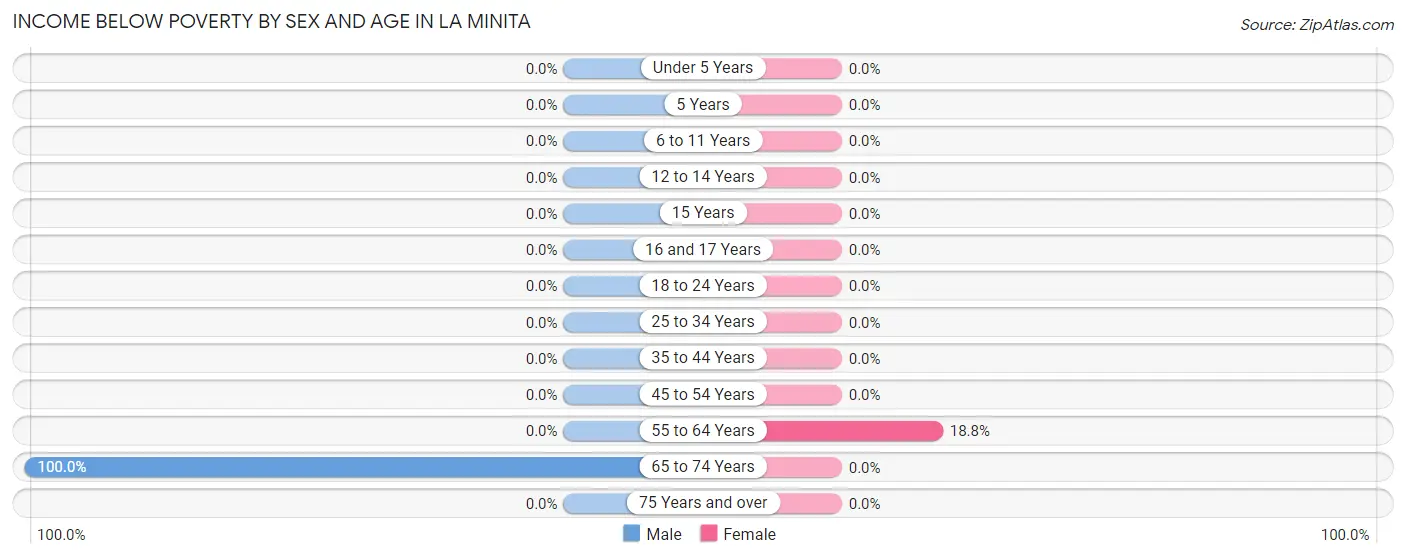
Income Below Poverty by Sex and Age in La Minita
With 6.7% poverty level for males and 6.1% for females among the residents of La Minita, 65 to 74 year old males and 55 to 64 year old females are the most vulnerable to poverty, with 6 males (100.0%) and 6 females (18.8%) in their respective age groups living below the poverty level.
| Age Bracket | Male | Female |
| Under 5 Years | 0 (0.0%) | 0 (0.0%) |
| 5 Years | 0 (0.0%) | 0 (0.0%) |
| 6 to 11 Years | 0 (0.0%) | 0 (0.0%) |
| 12 to 14 Years | 0 (0.0%) | 0 (0.0%) |
| 15 Years | 0 (0.0%) | 0 (0.0%) |
| 16 and 17 Years | 0 (0.0%) | 0 (0.0%) |
| 18 to 24 Years | 0 (0.0%) | 0 (0.0%) |
| 25 to 34 Years | 0 (0.0%) | 0 (0.0%) |
| 35 to 44 Years | 0 (0.0%) | 0 (0.0%) |
| 45 to 54 Years | 0 (0.0%) | 0 (0.0%) |
| 55 to 64 Years | 0 (0.0%) | 6 (18.8%) |
| 65 to 74 Years | 6 (100.0%) | 0 (0.0%) |
| 75 Years and over | 0 (0.0%) | 0 (0.0%) |
| Total | 6 (6.7%) | 6 (6.1%) |
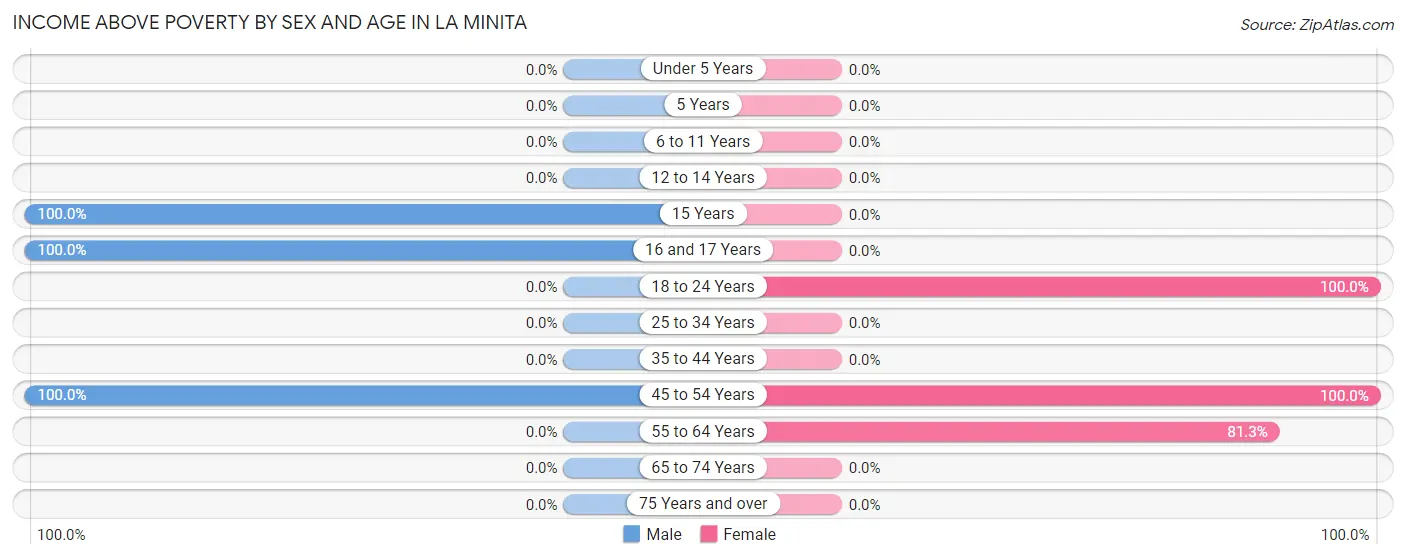
Income Above Poverty by Sex and Age in La Minita
According to the poverty statistics in La Minita, males aged 15 years and females aged 18 to 24 years are the age groups that are most secure financially, with 100.0% of males and 100.0% of females in these age groups living above the poverty line.
| Age Bracket | Male | Female |
| Under 5 Years | 0 (0.0%) | 0 (0.0%) |
| 5 Years | 0 (0.0%) | 0 (0.0%) |
| 6 to 11 Years | 0 (0.0%) | 0 (0.0%) |
| 12 to 14 Years | 0 (0.0%) | 0 (0.0%) |
| 15 Years | 6 (100.0%) | 0 (0.0%) |
| 16 and 17 Years | 22 (100.0%) | 0 (0.0%) |
| 18 to 24 Years | 0 (0.0%) | 37 (100.0%) |
| 25 to 34 Years | 0 (0.0%) | 0 (0.0%) |
| 35 to 44 Years | 0 (0.0%) | 0 (0.0%) |
| 45 to 54 Years | 55 (100.0%) | 29 (100.0%) |
| 55 to 64 Years | 0 (0.0%) | 26 (81.2%) |
| 65 to 74 Years | 0 (0.0%) | 0 (0.0%) |
| 75 Years and over | 0 (0.0%) | 0 (0.0%) |
| Total | 83 (93.3%) | 92 (93.9%) |
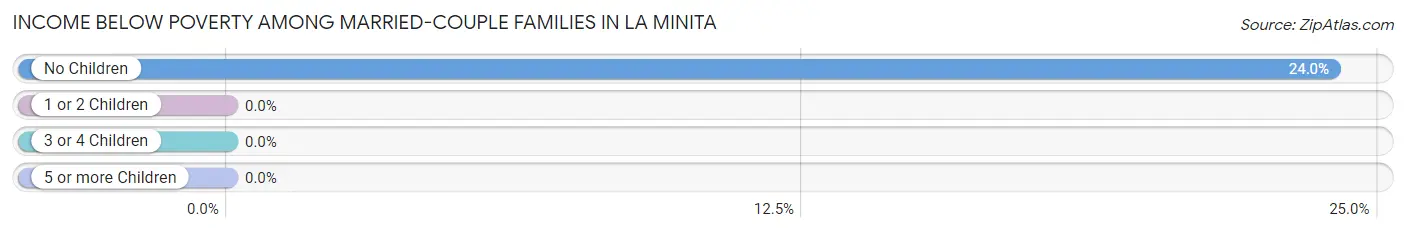
Income Below Poverty Among Married-Couple Families in La Minita
The poverty statistics for married-couple families in La Minita show that 13.3% or 6 of the total 45 families live below the poverty line. Families with no children have the highest poverty rate of 24.0%, comprising of 6 families. On the other hand, families with 1 or 2 children have the lowest poverty rate of 0.0%, which includes 0 families.
| Children | Above Poverty | Below Poverty |
| No Children | 19 (76.0%) | 6 (24.0%) |
| 1 or 2 Children | 20 (100.0%) | 0 (0.0%) |
| 3 or 4 Children | 0 (0.0%) | 0 (0.0%) |
| 5 or more Children | 0 (0.0%) | 0 (0.0%) |
| Total | 39 (86.7%) | 6 (13.3%) |
Income Below Poverty Among Single-Parent Households in La Minita
| Children | Single Father | Single Mother |
| No Children | 0 (0.0%) | 0 (0.0%) |
| 1 or 2 Children | 0 (0.0%) | 0 (0.0%) |
| 3 or 4 Children | 0 (0.0%) | 0 (0.0%) |
| 5 or more Children | 0 (0.0%) | 0 (0.0%) |
| Total | 0 (0.0%) | 0 (0.0%) |
Income Below Poverty Among Married-Couple vs Single-Parent Households in La Minita
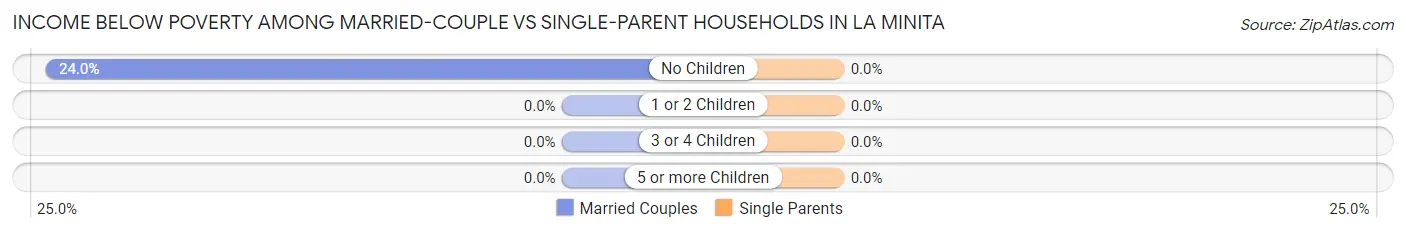
| Children | Married-Couple Families | Single-Parent Households |
| No Children | 6 (24.0%) | 0 (0.0%) |
| 1 or 2 Children | 0 (0.0%) | 0 (0.0%) |
| 3 or 4 Children | 0 (0.0%) | 0 (0.0%) |
| 5 or more Children | 0 (0.0%) | 0 (0.0%) |
| Total | 6 (13.3%) | 0 (0.0%) |
Race in La Minita
The most populous races in La Minita are Hispanic or Latino (187 | 100.0%), White / Caucasian (122 | 65.2%), and Two or more Races (65 | 34.8%).
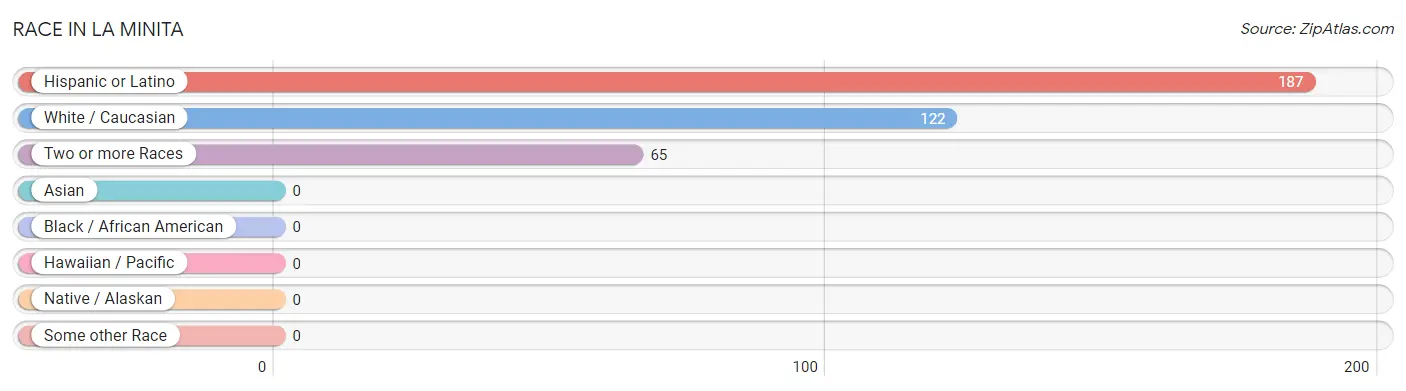
| Race | # Population | % Population |
| Asian | 0 | 0.0% |
| Black / African American | 0 | 0.0% |
| Hawaiian / Pacific | 0 | 0.0% |
| Hispanic or Latino | 187 | 100.0% |
| Native / Alaskan | 0 | 0.0% |
| White / Caucasian | 122 | 65.2% |
| Two or more Races | 65 | 34.8% |
| Some other Race | 0 | 0.0% |
| Total | 187 | 100.0% |
Ancestry in La Minita
The most populous ancestries reported in La Minita are , and Mexican (174 | 93.0%), together accounting for 93.0% of all La Minita residents.

| Ancestry | # Population | % Population |
| Mexican | 174 | 93.0% | View All 1 Rows |
Immigrants in La Minita
The most numerous immigrant groups reported in La Minita came from Central America (6 | 3.2%), Latin America (6 | 3.2%), and Mexico (6 | 3.2%), together accounting for 9.6% of all La Minita residents.
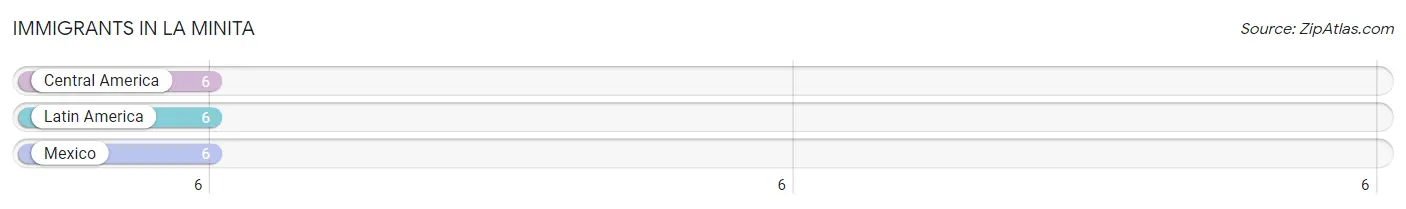
| Immigration Origin | # Population | % Population |
| Central America | 6 | 3.2% |
| Latin America | 6 | 3.2% |
| Mexico | 6 | 3.2% | View All 3 Rows |
Sex and Age in La Minita
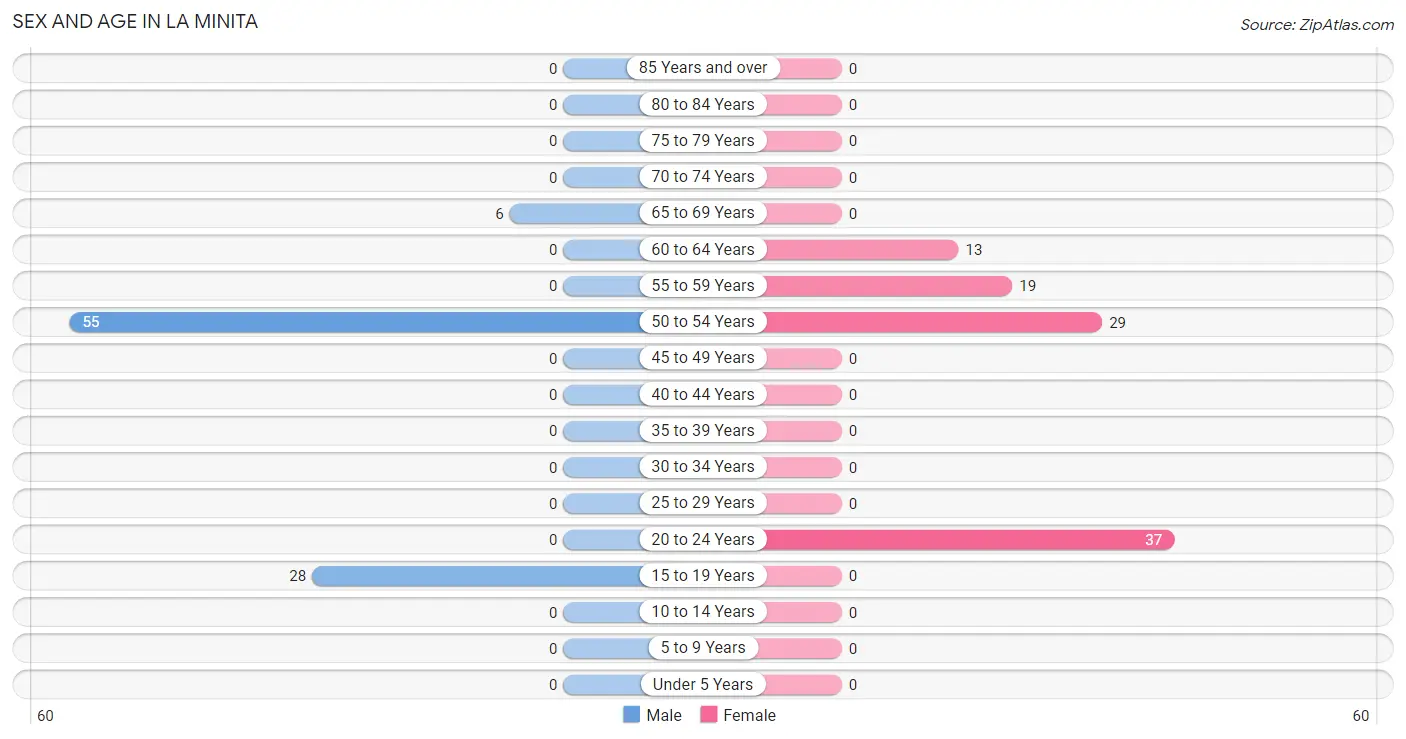
Sex and Age in La Minita
The most populous age groups in La Minita are 50 to 54 Years (55 | 61.8%) for men and 20 to 24 Years (37 | 37.8%) for women.
| Age Bracket | Male | Female |
| Under 5 Years | 0 (0.0%) | 0 (0.0%) |
| 5 to 9 Years | 0 (0.0%) | 0 (0.0%) |
| 10 to 14 Years | 0 (0.0%) | 0 (0.0%) |
| 15 to 19 Years | 28 (31.5%) | 0 (0.0%) |
| 20 to 24 Years | 0 (0.0%) | 37 (37.8%) |
| 25 to 29 Years | 0 (0.0%) | 0 (0.0%) |
| 30 to 34 Years | 0 (0.0%) | 0 (0.0%) |
| 35 to 39 Years | 0 (0.0%) | 0 (0.0%) |
| 40 to 44 Years | 0 (0.0%) | 0 (0.0%) |
| 45 to 49 Years | 0 (0.0%) | 0 (0.0%) |
| 50 to 54 Years | 55 (61.8%) | 29 (29.6%) |
| 55 to 59 Years | 0 (0.0%) | 19 (19.4%) |
| 60 to 64 Years | 0 (0.0%) | 13 (13.3%) |
| 65 to 69 Years | 6 (6.7%) | 0 (0.0%) |
| 70 to 74 Years | 0 (0.0%) | 0 (0.0%) |
| 75 to 79 Years | 0 (0.0%) | 0 (0.0%) |
| 80 to 84 Years | 0 (0.0%) | 0 (0.0%) |
| 85 Years and over | 0 (0.0%) | 0 (0.0%) |
| Total | 89 (100.0%) | 98 (100.0%) |
Families and Households in La Minita
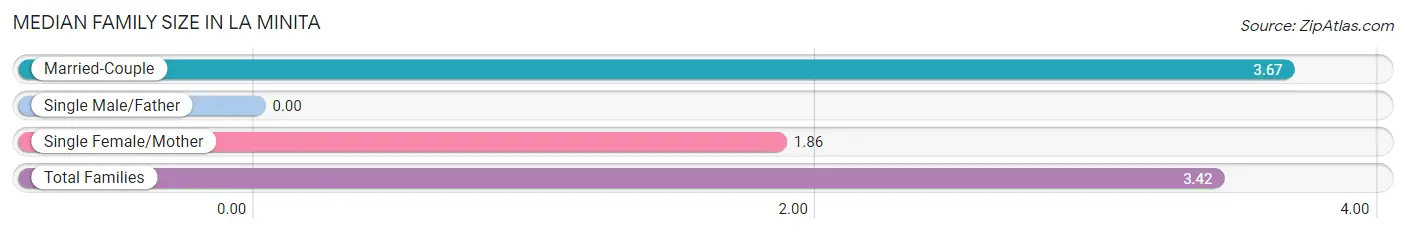
Median Family Size in La Minita
| Family Type | # Families | Family Size |
| Married-Couple | 45 (86.5%) | 3.67 |
| Single Male/Father | 0 (0.0%) | - |
| Single Female/Mother | 7 (13.5%) | 1.86 |
| Total Families | 52 (100.0%) | 3.42 |
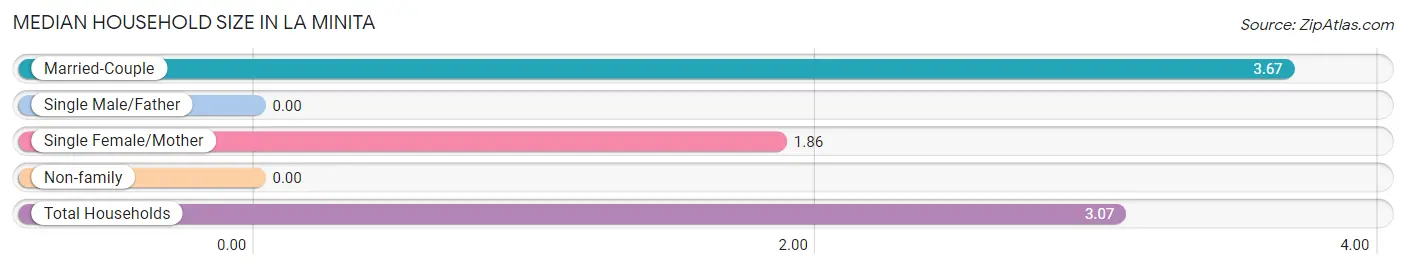
Median Household Size in La Minita
| Household Type | # Households | Household Size |
| Married-Couple | 45 (73.8%) | 3.67 |
| Single Male/Father | 0 (0.0%) | - |
| Single Female/Mother | 7 (11.5%) | 1.86 |
| Non-family | 9 (14.7%) | - |
| Total Households | 61 (100.0%) | 3.07 |
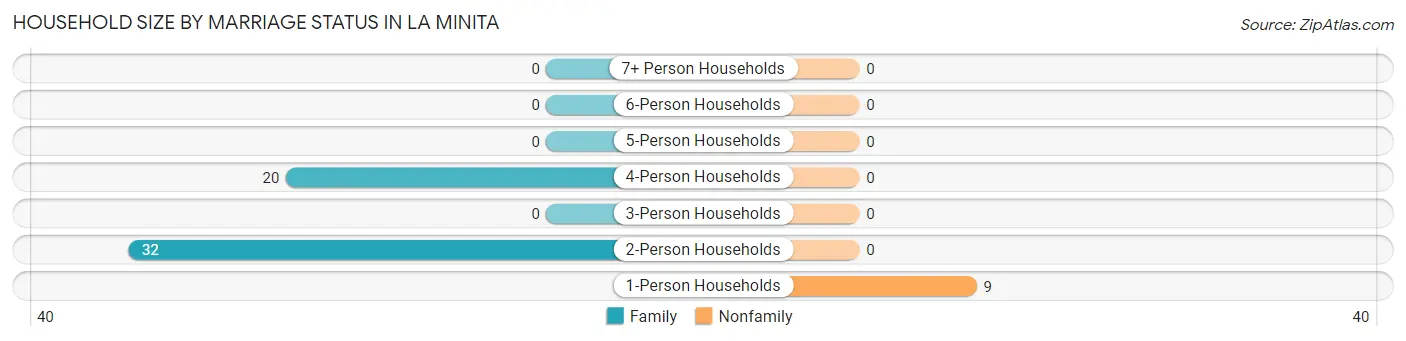
Household Size by Marriage Status in La Minita
Out of a total of 61 households in La Minita, 52 (85.3%) are family households, while 9 (14.7%) are nonfamily households. The most numerous type of family households are 2-person households, comprising 32, and the most common type of nonfamily households are 1-person households, comprising 9.
| Household Size | Family Households | Nonfamily Households |
| 1-Person Households | - | 9 (14.7%) |
| 2-Person Households | 32 (52.5%) | 0 (0.0%) |
| 3-Person Households | 0 (0.0%) | 0 (0.0%) |
| 4-Person Households | 20 (32.8%) | 0 (0.0%) |
| 5-Person Households | 0 (0.0%) | 0 (0.0%) |
| 6-Person Households | 0 (0.0%) | 0 (0.0%) |
| 7+ Person Households | 0 (0.0%) | 0 (0.0%) |
| Total | 52 (85.3%) | 9 (14.7%) |
Female Fertility in La Minita
Fertility by Age in La Minita
| Age Bracket | Women with Births | Births / 1,000 Women |
| 15 to 19 years | 0 (0.0%) | 0.0 |
| 20 to 34 years | 0 (0.0%) | 0.0 |
| 35 to 50 years | 0 (0.0%) | 0.0 |
| Total | 0 (0.0%) | 0.0 |
Fertility by Age by Marriage Status in La Minita
| Age Bracket | Married | Unmarried |
| 15 to 19 years | 0 (0.0%) | 0 (0.0%) |
| 20 to 34 years | 0 (0.0%) | 0 (0.0%) |
| 35 to 50 years | 0 (0.0%) | 0 (0.0%) |
| Total | 0 (0.0%) | 0 (0.0%) |
Fertility by Education in La Minita
| Educational Attainment | Women with Births | Births / 1,000 Women |
| Less than High School | 0 (0.0%) | 0.0 |
| High School Diploma | 0 (0.0%) | 0.0 |
| College or Associate's Degree | 0 (0.0%) | 0.0 |
| Bachelor's Degree | 0 (0.0%) | 0.0 |
| Graduate Degree | 0 (0.0%) | 0.0 |
| Total | 0 (0.0%) | 0.0 |
Fertility by Education by Marriage Status in La Minita
| Educational Attainment | Married | Unmarried |
| Less than High School | 0 (0.0%) | 0 (0.0%) |
| High School Diploma | 0 (0.0%) | 0 (0.0%) |
| College or Associate's Degree | 0 (0.0%) | 0 (0.0%) |
| Bachelor's Degree | 0 (0.0%) | 0 (0.0%) |
| Graduate Degree | 0 (0.0%) | 0 (0.0%) |
| Total | 0 (0.0%) | 0 (0.0%) |
Employment Characteristics in La Minita
Employment by Class of Employer in La Minita
Among the 103 employed individuals in La Minita, local government employees (42 | 40.8%), self-employed (incorporated) (33 | 32.0%), and private company employees (19 | 18.4%) make up the most common classes of employment.
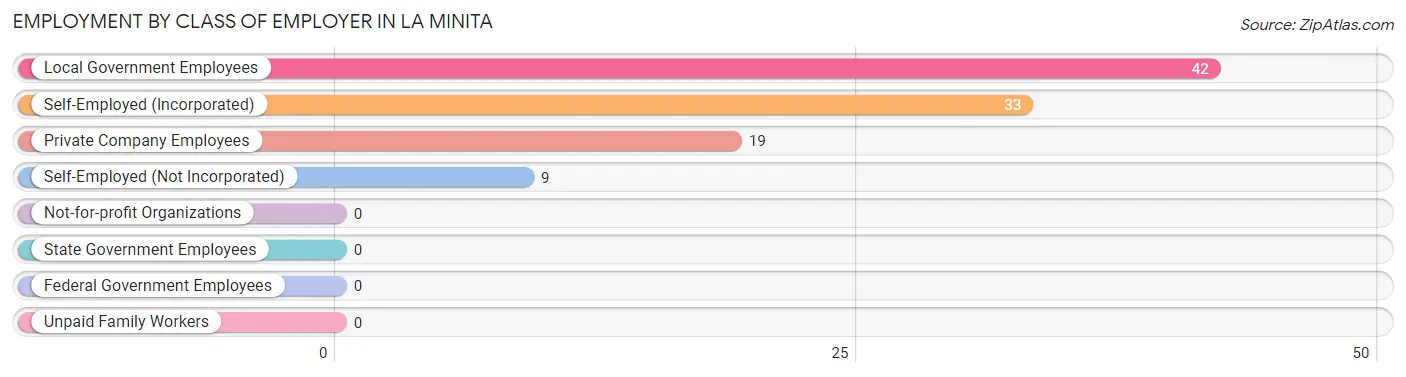
| Employer Class | # Employees | % Employees |
| Private Company Employees | 19 | 18.4% |
| Self-Employed (Incorporated) | 33 | 32.0% |
| Self-Employed (Not Incorporated) | 9 | 8.7% |
| Not-for-profit Organizations | 0 | 0.0% |
| Local Government Employees | 42 | 40.8% |
| State Government Employees | 0 | 0.0% |
| Federal Government Employees | 0 | 0.0% |
| Unpaid Family Workers | 0 | 0.0% |
| Total | 103 | 100.0% |
Employment Status by Age in La Minita
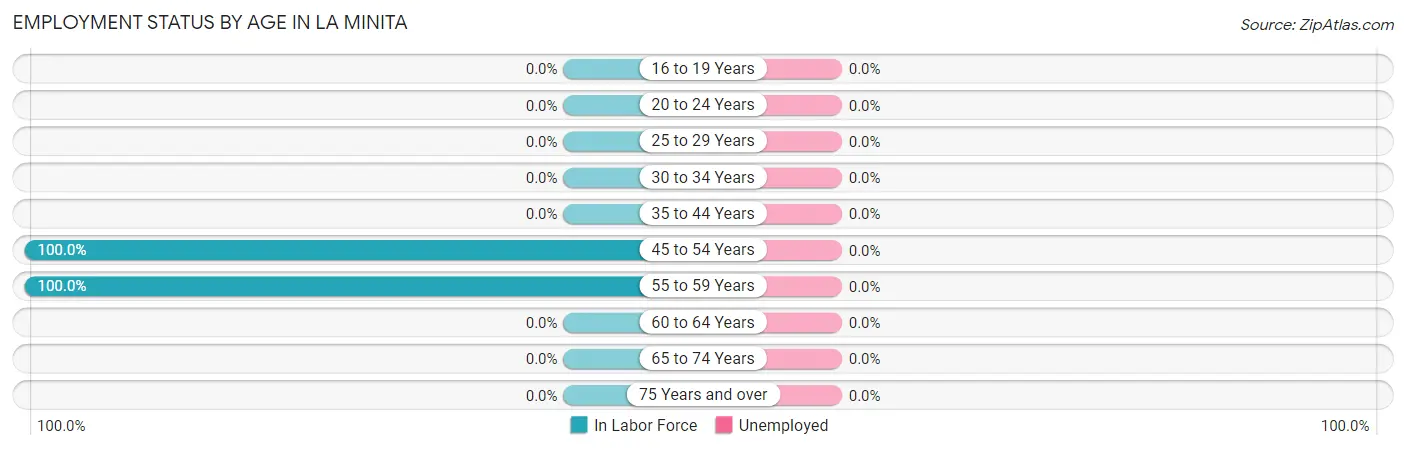
| Age Bracket | In Labor Force | Unemployed |
| 16 to 19 Years | 0 (0.0%) | 0 (0.0%) |
| 20 to 24 Years | 0 (0.0%) | 0 (0.0%) |
| 25 to 29 Years | 0 (0.0%) | 0 (0.0%) |
| 30 to 34 Years | 0 (0.0%) | 0 (0.0%) |
| 35 to 44 Years | 0 (0.0%) | 0 (0.0%) |
| 45 to 54 Years | 84 (100.0%) | 0 (0.0%) |
| 55 to 59 Years | 19 (100.0%) | 0 (0.0%) |
| 60 to 64 Years | 0 (0.0%) | 0 (0.0%) |
| 65 to 74 Years | 0 (0.0%) | 0 (0.0%) |
| 75 Years and over | 0 (0.0%) | 0 (0.0%) |
| Total | 103 (56.9%) | 0 (0.0%) |
Employment Status by Educational Attainment in La Minita
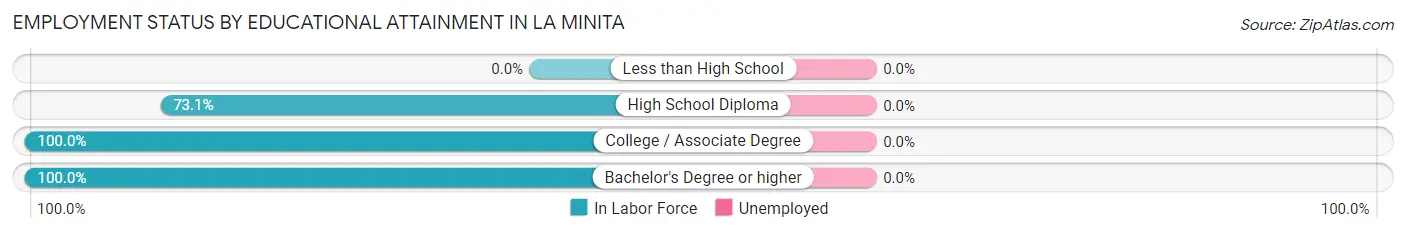
| Educational Attainment | In Labor Force | Unemployed |
| Less than High School | 0 (0.0%) | 0 (0.0%) |
| High School Diploma | 19 (73.1%) | 0 (0.0%) |
| College / Associate Degree | 64 (100.0%) | 0 (0.0%) |
| Bachelor's Degree or higher | 20 (100.0%) | 0 (0.0%) |
| Total | 103 (88.8%) | 0 (0.0%) |
Employment Occupations by Sex in La Minita
Management, Business, Science and Arts Occupations
The most common Management, Business, Science and Arts occupations in La Minita are , and Management (52 | 50.5%).
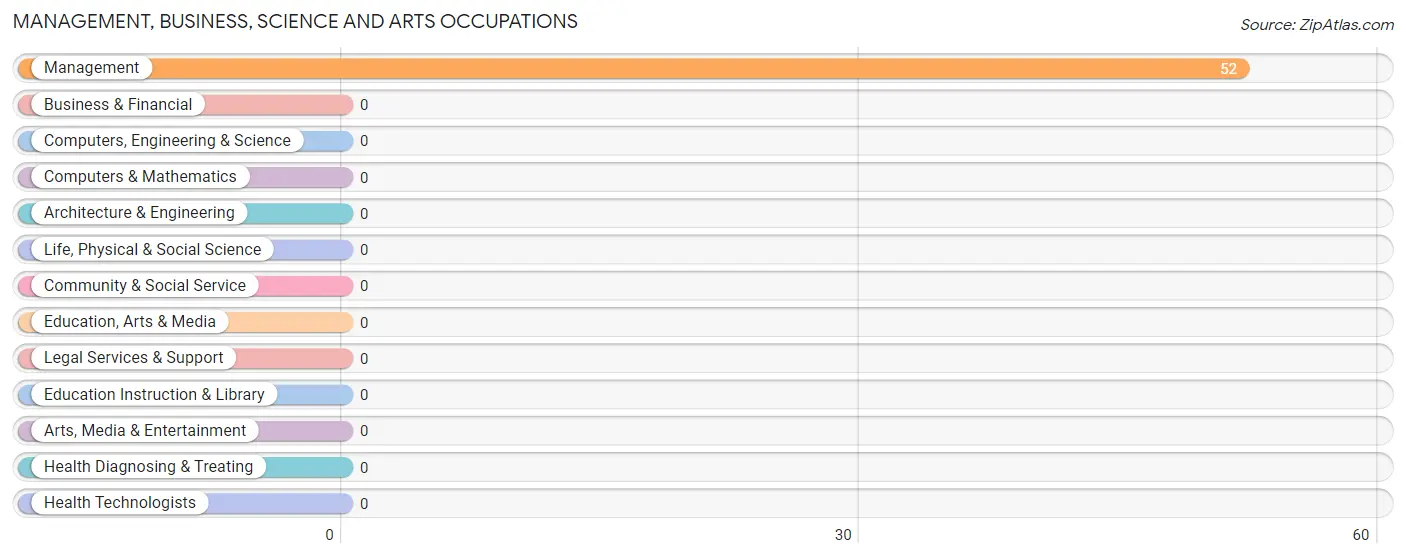
Management, Business, Science and Arts Occupations by Sex
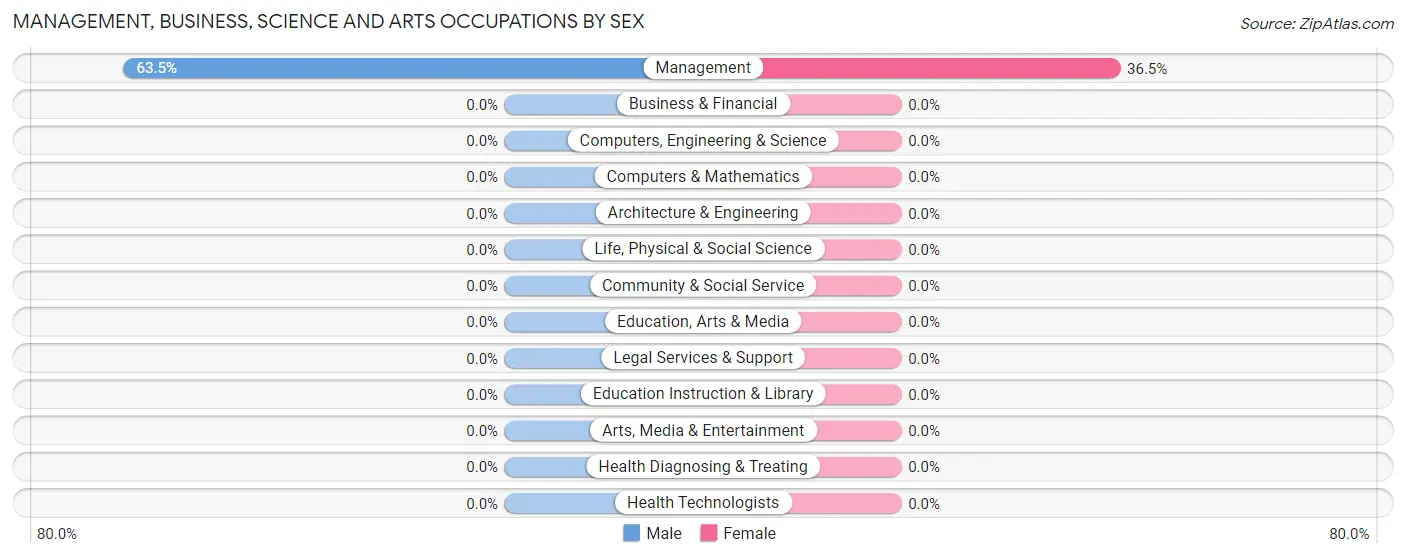
| Occupation | Male | Female |
| Management | 33 (63.5%) | 19 (36.5%) |
| Business & Financial | 0 (0.0%) | 0 (0.0%) |
| Computers, Engineering & Science | 0 (0.0%) | 0 (0.0%) |
| Computers & Mathematics | 0 (0.0%) | 0 (0.0%) |
| Architecture & Engineering | 0 (0.0%) | 0 (0.0%) |
| Life, Physical & Social Science | 0 (0.0%) | 0 (0.0%) |
| Community & Social Service | 0 (0.0%) | 0 (0.0%) |
| Education, Arts & Media | 0 (0.0%) | 0 (0.0%) |
| Legal Services & Support | 0 (0.0%) | 0 (0.0%) |
| Education Instruction & Library | 0 (0.0%) | 0 (0.0%) |
| Arts, Media & Entertainment | 0 (0.0%) | 0 (0.0%) |
| Health Diagnosing & Treating | 0 (0.0%) | 0 (0.0%) |
| Health Technologists | 0 (0.0%) | 0 (0.0%) |
| Total (Category) | 33 (63.5%) | 19 (36.5%) |
| Total (Overall) | 55 (53.4%) | 48 (46.6%) |
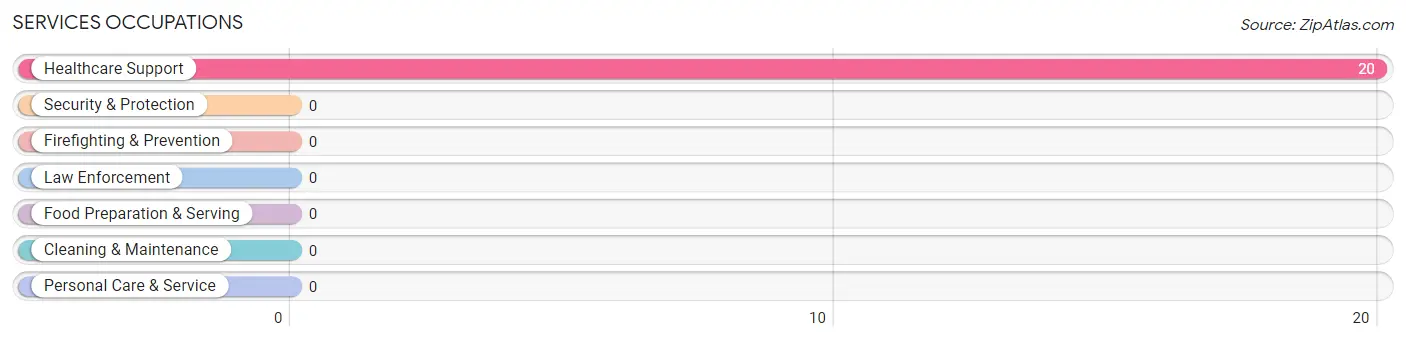
Services Occupations
The most common Services occupations in La Minita are , and Healthcare Support (20 | 19.4%).
Services Occupations by Sex
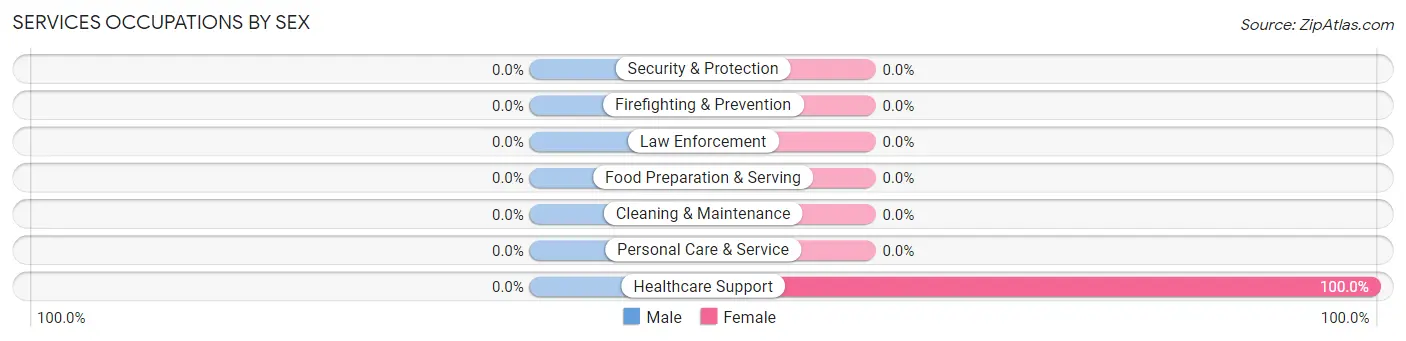
| Occupation | Male | Female |
| Healthcare Support | 0 (0.0%) | 20 (100.0%) |
| Security & Protection | 0 (0.0%) | 0 (0.0%) |
| Firefighting & Prevention | 0 (0.0%) | 0 (0.0%) |
| Law Enforcement | 0 (0.0%) | 0 (0.0%) |
| Food Preparation & Serving | 0 (0.0%) | 0 (0.0%) |
| Cleaning & Maintenance | 0 (0.0%) | 0 (0.0%) |
| Personal Care & Service | 0 (0.0%) | 0 (0.0%) |
| Total (Category) | 0 (0.0%) | 20 (100.0%) |
| Total (Overall) | 55 (53.4%) | 48 (46.6%) |
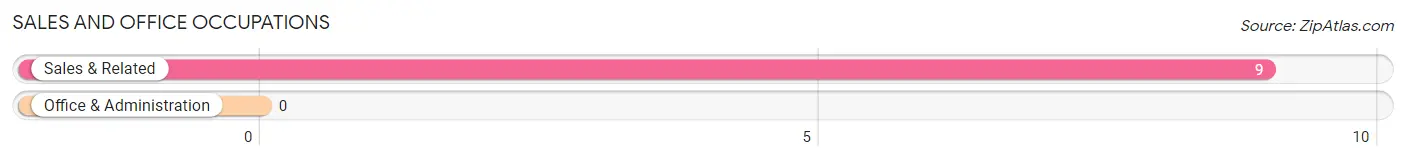
Sales and Office Occupations
The most common Sales and Office occupations in La Minita are , and Sales & Related (9 | 8.7%).
Sales and Office Occupations by Sex
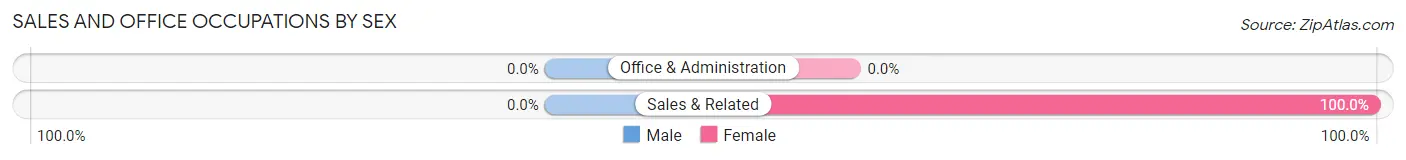
| Occupation | Male | Female |
| Sales & Related | 0 (0.0%) | 9 (100.0%) |
| Office & Administration | 0 (0.0%) | 0 (0.0%) |
| Total (Category) | 0 (0.0%) | 9 (100.0%) |
| Total (Overall) | 55 (53.4%) | 48 (46.6%) |
Natural Resources, Construction and Maintenance Occupations
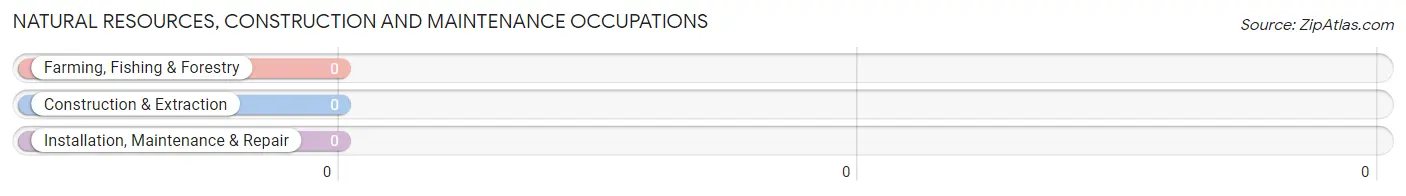
Natural Resources, Construction and Maintenance Occupations by Sex
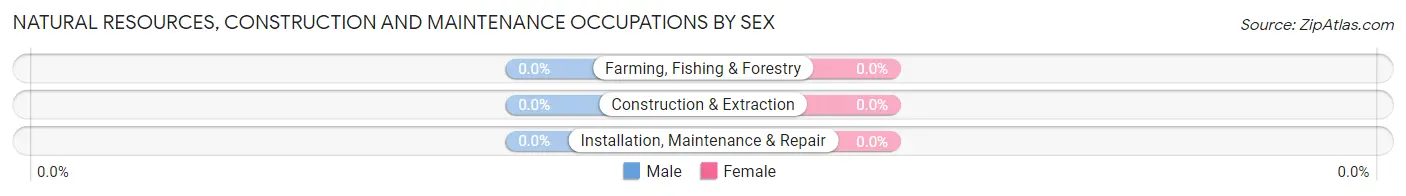
| Occupation | Male | Female |
| Farming, Fishing & Forestry | 0 (0.0%) | 0 (0.0%) |
| Construction & Extraction | 0 (0.0%) | 0 (0.0%) |
| Installation, Maintenance & Repair | 0 (0.0%) | 0 (0.0%) |
| Total (Category) | 0 (0.0%) | 0 (0.0%) |
| Total (Overall) | 55 (53.4%) | 48 (46.6%) |
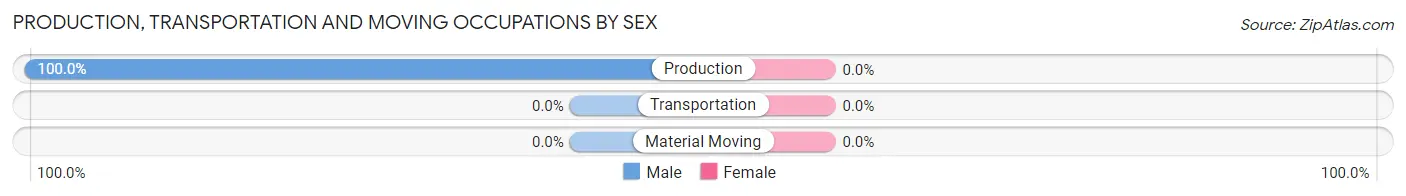
Production, Transportation and Moving Occupations
The most common Production, Transportation and Moving occupations in La Minita are , and Production (22 | 21.4%).
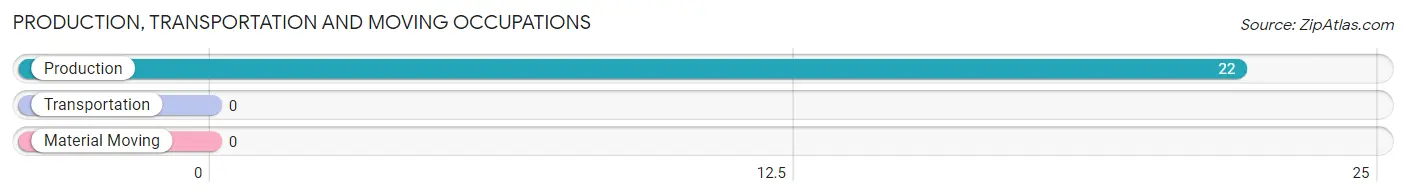
Production, Transportation and Moving Occupations by Sex
| Occupation | Male | Female |
| Production | 22 (100.0%) | 0 (0.0%) |
| Transportation | 0 (0.0%) | 0 (0.0%) |
| Material Moving | 0 (0.0%) | 0 (0.0%) |
| Total (Category) | 22 (100.0%) | 0 (0.0%) |
| Total (Overall) | 55 (53.4%) | 48 (46.6%) |
Employment Industries by Sex in La Minita
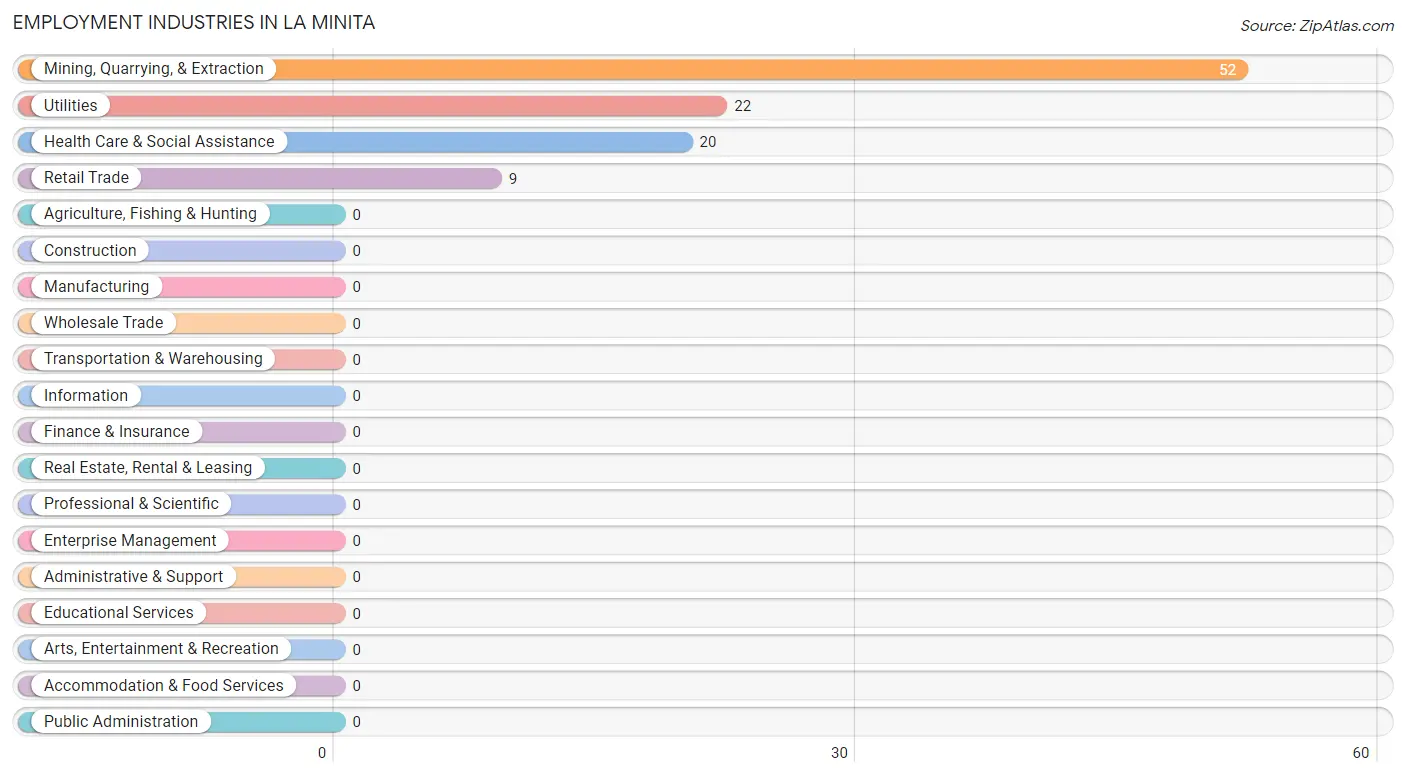
Employment Industries in La Minita
The major employment industries in La Minita include Mining, Quarrying, & Extraction (52 | 50.5%), Utilities (22 | 21.4%), Health Care & Social Assistance (20 | 19.4%), and Retail Trade (9 | 8.7%).
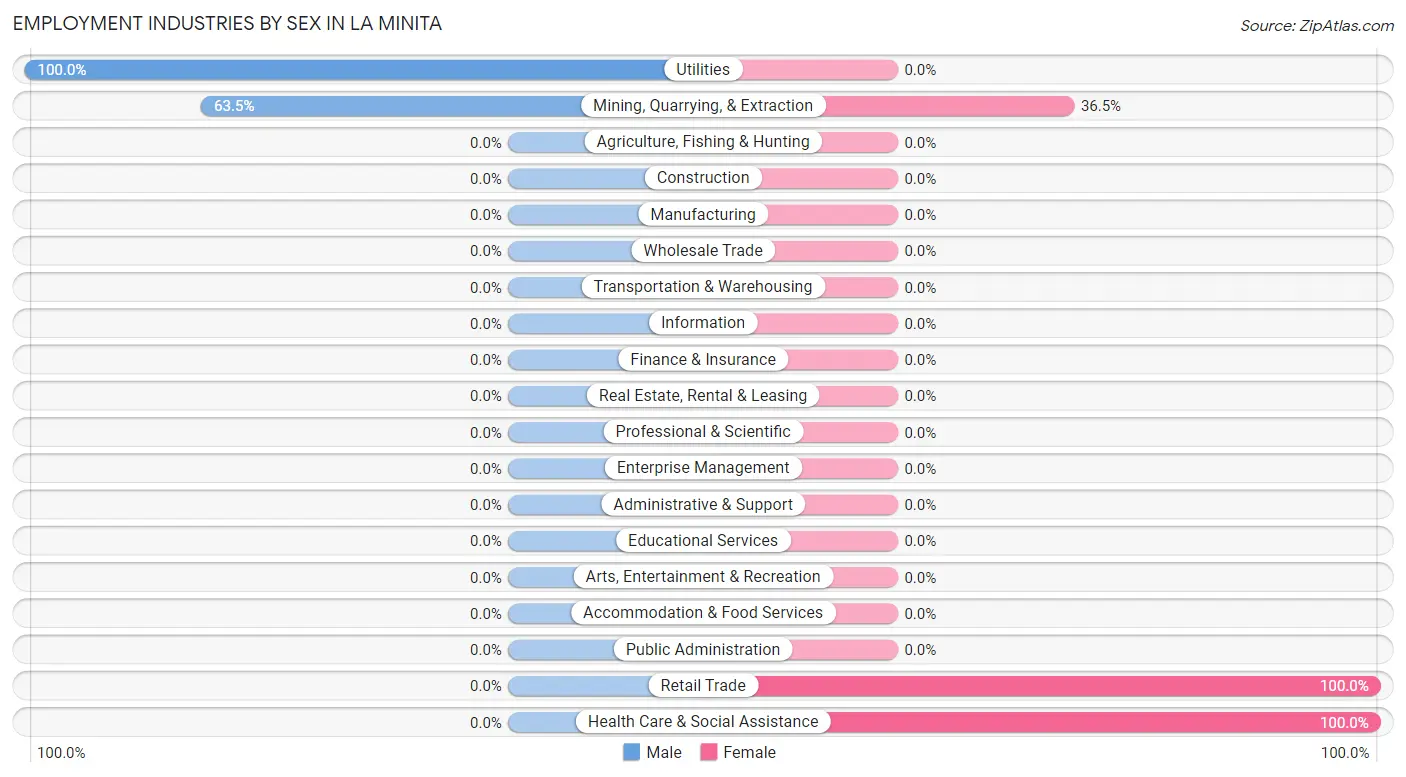
Employment Industries by Sex in La Minita
The La Minita industries that see more men than women are Utilities (100.0%), and Mining, Quarrying, & Extraction (63.5%), whereas the industries that tend to have a higher number of women are Retail Trade (100.0%), Health Care & Social Assistance (100.0%), and Mining, Quarrying, & Extraction (36.5%).
| Industry | Male | Female |
| Agriculture, Fishing & Hunting | 0 (0.0%) | 0 (0.0%) |
| Mining, Quarrying, & Extraction | 33 (63.5%) | 19 (36.5%) |
| Construction | 0 (0.0%) | 0 (0.0%) |
| Manufacturing | 0 (0.0%) | 0 (0.0%) |
| Wholesale Trade | 0 (0.0%) | 0 (0.0%) |
| Retail Trade | 0 (0.0%) | 9 (100.0%) |
| Transportation & Warehousing | 0 (0.0%) | 0 (0.0%) |
| Utilities | 22 (100.0%) | 0 (0.0%) |
| Information | 0 (0.0%) | 0 (0.0%) |
| Finance & Insurance | 0 (0.0%) | 0 (0.0%) |
| Real Estate, Rental & Leasing | 0 (0.0%) | 0 (0.0%) |
| Professional & Scientific | 0 (0.0%) | 0 (0.0%) |
| Enterprise Management | 0 (0.0%) | 0 (0.0%) |
| Administrative & Support | 0 (0.0%) | 0 (0.0%) |
| Educational Services | 0 (0.0%) | 0 (0.0%) |
| Health Care & Social Assistance | 0 (0.0%) | 20 (100.0%) |
| Arts, Entertainment & Recreation | 0 (0.0%) | 0 (0.0%) |
| Accommodation & Food Services | 0 (0.0%) | 0 (0.0%) |
| Public Administration | 0 (0.0%) | 0 (0.0%) |
| Total | 55 (53.4%) | 48 (46.6%) |
Education in La Minita
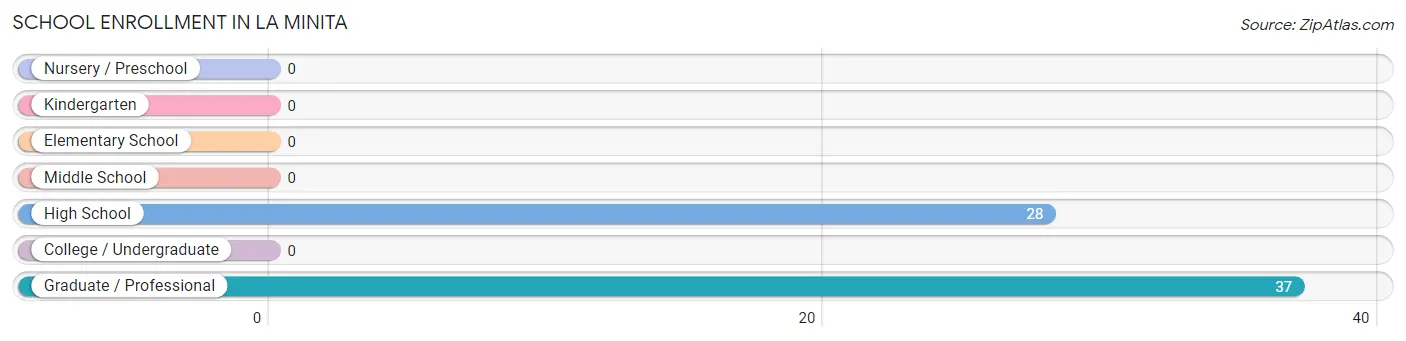
School Enrollment in La Minita
The most common levels of schooling among the 65 students in La Minita are graduate / professional (37 | 56.9%), and high school (28 | 43.1%).
| School Level | # Students | % Students |
| Nursery / Preschool | 0 | 0.0% |
| Kindergarten | 0 | 0.0% |
| Elementary School | 0 | 0.0% |
| Middle School | 0 | 0.0% |
| High School | 28 | 43.1% |
| College / Undergraduate | 0 | 0.0% |
| Graduate / Professional | 37 | 56.9% |
| Total | 65 | 100.0% |
School Enrollment by Age by Funding Source in La Minita
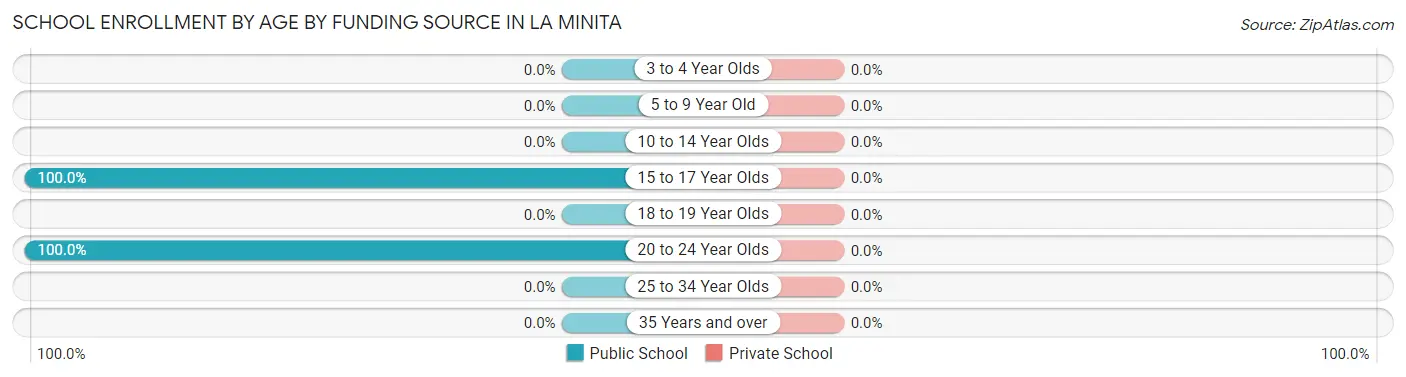
| Age Bracket | Public School | Private School |
| 3 to 4 Year Olds | 0 (0.0%) | 0 (0.0%) |
| 5 to 9 Year Old | 0 (0.0%) | 0 (0.0%) |
| 10 to 14 Year Olds | 0 (0.0%) | 0 (0.0%) |
| 15 to 17 Year Olds | 28 (100.0%) | 0 (0.0%) |
| 18 to 19 Year Olds | 0 (0.0%) | 0 (0.0%) |
| 20 to 24 Year Olds | 37 (100.0%) | 0 (0.0%) |
| 25 to 34 Year Olds | 0 (0.0%) | 0 (0.0%) |
| 35 Years and over | 0 (0.0%) | 0 (0.0%) |
| Total | 65 (100.0%) | 0 (0.0%) |
Educational Attainment by Field of Study in La Minita
, and science & technology (20 | 100.0%) are the most common fields of study among 20 individuals in La Minita who have obtained a bachelor's degree or higher.
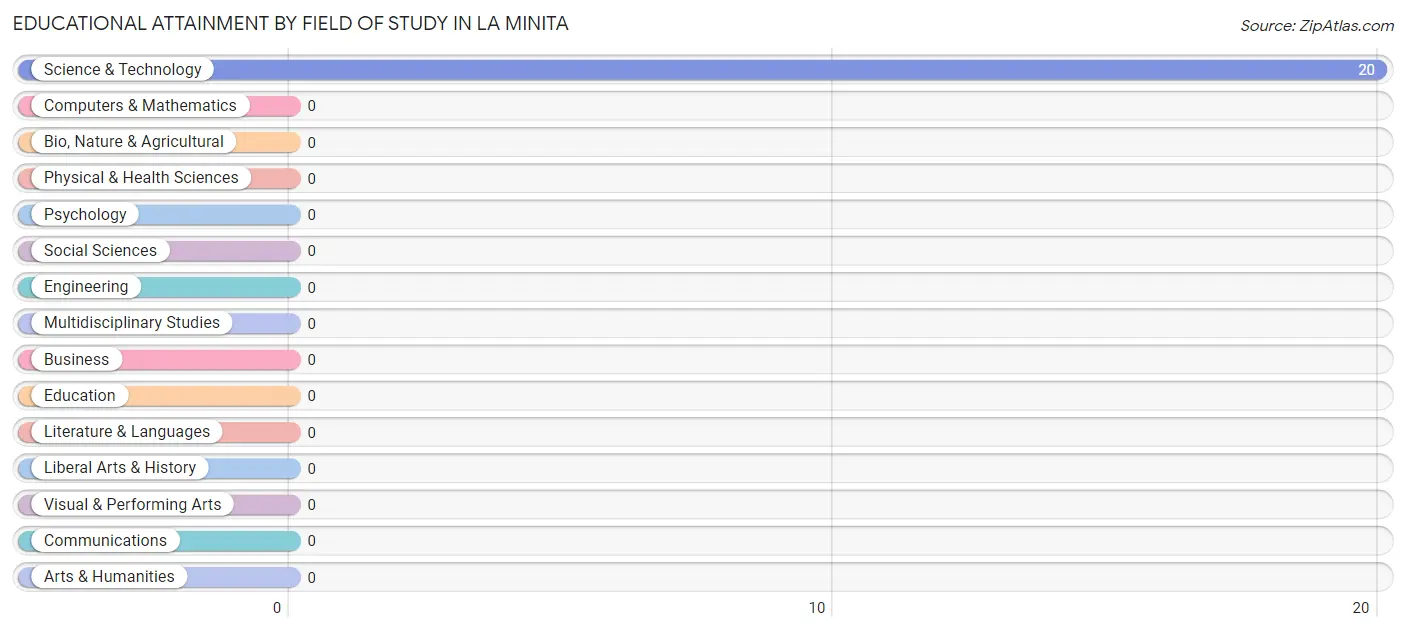
| Field of Study | # Graduates | % Graduates |
| Computers & Mathematics | 0 | 0.0% |
| Bio, Nature & Agricultural | 0 | 0.0% |
| Physical & Health Sciences | 0 | 0.0% |
| Psychology | 0 | 0.0% |
| Social Sciences | 0 | 0.0% |
| Engineering | 0 | 0.0% |
| Multidisciplinary Studies | 0 | 0.0% |
| Science & Technology | 20 | 100.0% |
| Business | 0 | 0.0% |
| Education | 0 | 0.0% |
| Literature & Languages | 0 | 0.0% |
| Liberal Arts & History | 0 | 0.0% |
| Visual & Performing Arts | 0 | 0.0% |
| Communications | 0 | 0.0% |
| Arts & Humanities | 0 | 0.0% |
| Total | 20 | 100.0% |
Transportation & Commute in La Minita
Vehicle Availability by Sex in La Minita
The most prevalent vehicle ownership categories in La Minita are males with 3 vehicles (33, accounting for 60.0%) and females with 3 vehicles (19, making up 68.8%).
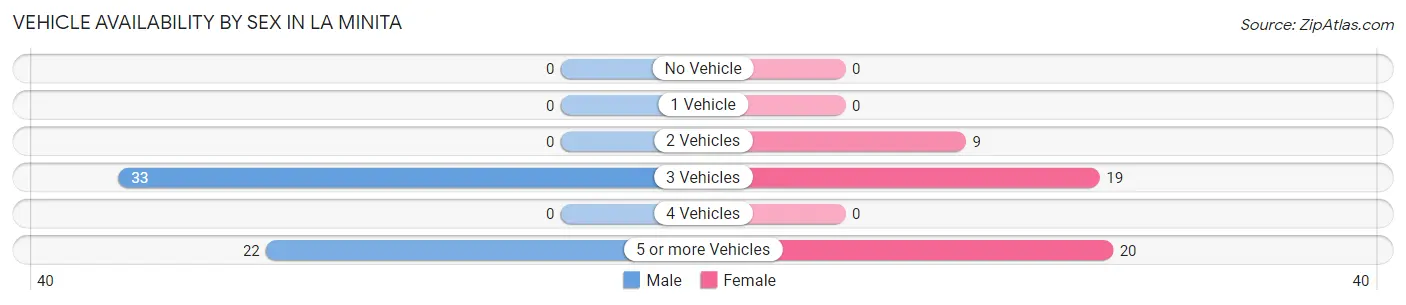
| Vehicles Available | Male | Female |
| No Vehicle | 0 (0.0%) | 0 (0.0%) |
| 1 Vehicle | 0 (0.0%) | 0 (0.0%) |
| 2 Vehicles | 0 (0.0%) | 9 (18.8%) |
| 3 Vehicles | 33 (60.0%) | 19 (39.6%) |
| 4 Vehicles | 0 (0.0%) | 0 (0.0%) |
| 5 or more Vehicles | 22 (40.0%) | 20 (41.7%) |
| Total | 55 (100.0%) | 48 (100.0%) |
Commute Time in La Minita
The most frequently occuring commute durations in La Minita are 90 or more minutes (33 commuters, 44.0%), 5 to 9 minutes (22 commuters, 29.3%), and 15 to 19 minutes (20 commuters, 26.7%).
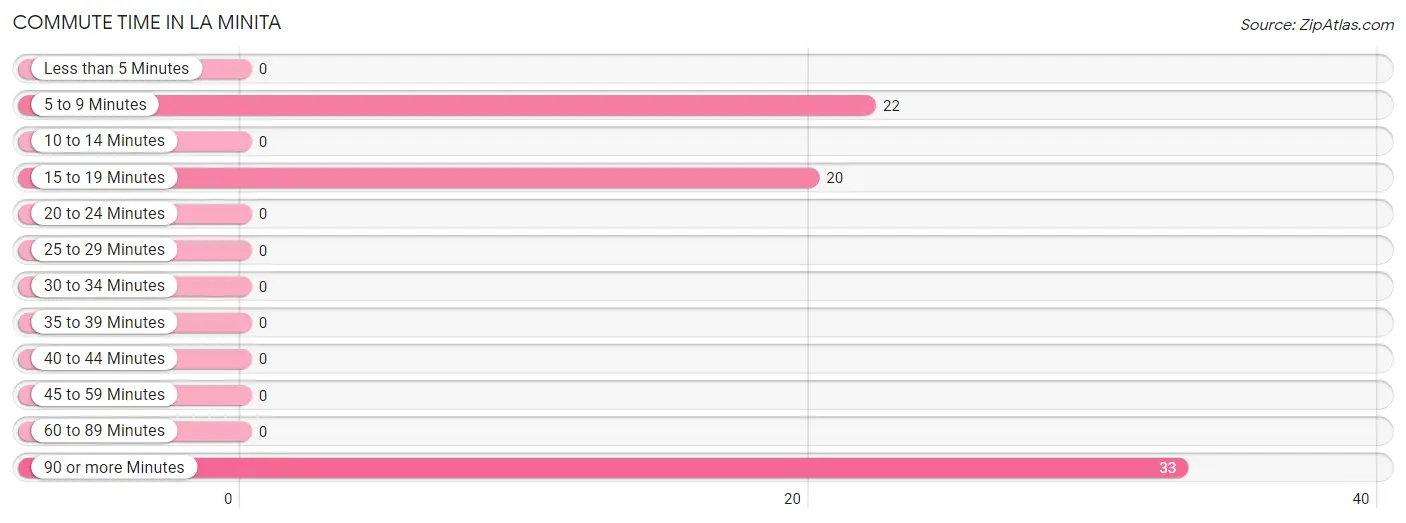
| Commute Time | # Commuters | % Commuters |
| Less than 5 Minutes | 0 | 0.0% |
| 5 to 9 Minutes | 22 | 29.3% |
| 10 to 14 Minutes | 0 | 0.0% |
| 15 to 19 Minutes | 20 | 26.7% |
| 20 to 24 Minutes | 0 | 0.0% |
| 25 to 29 Minutes | 0 | 0.0% |
| 30 to 34 Minutes | 0 | 0.0% |
| 35 to 39 Minutes | 0 | 0.0% |
| 40 to 44 Minutes | 0 | 0.0% |
| 45 to 59 Minutes | 0 | 0.0% |
| 60 to 89 Minutes | 0 | 0.0% |
| 90 or more Minutes | 33 | 44.0% |
Commute Time by Sex in La Minita
The most common commute times in La Minita are 90 or more minutes (33 commuters, 60.0%) for males and 15 to 19 minutes (20 commuters, 100.0%) for females.
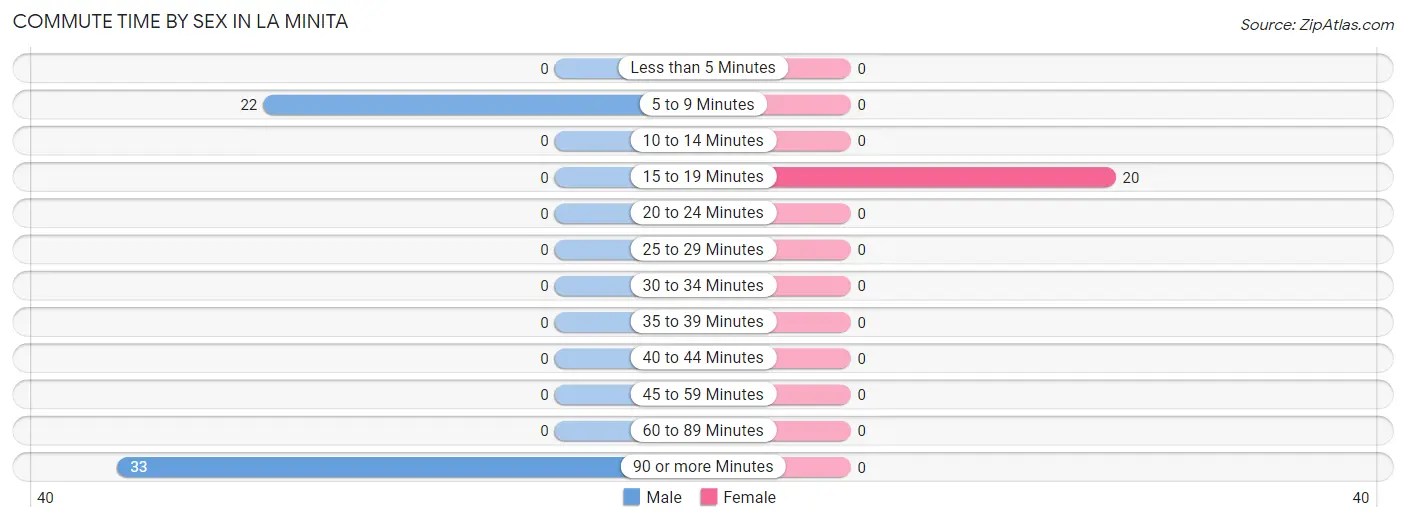
| Commute Time | Male | Female |
| Less than 5 Minutes | 0 (0.0%) | 0 (0.0%) |
| 5 to 9 Minutes | 22 (40.0%) | 0 (0.0%) |
| 10 to 14 Minutes | 0 (0.0%) | 0 (0.0%) |
| 15 to 19 Minutes | 0 (0.0%) | 20 (100.0%) |
| 20 to 24 Minutes | 0 (0.0%) | 0 (0.0%) |
| 25 to 29 Minutes | 0 (0.0%) | 0 (0.0%) |
| 30 to 34 Minutes | 0 (0.0%) | 0 (0.0%) |
| 35 to 39 Minutes | 0 (0.0%) | 0 (0.0%) |
| 40 to 44 Minutes | 0 (0.0%) | 0 (0.0%) |
| 45 to 59 Minutes | 0 (0.0%) | 0 (0.0%) |
| 60 to 89 Minutes | 0 (0.0%) | 0 (0.0%) |
| 90 or more Minutes | 33 (60.0%) | 0 (0.0%) |
Time of Departure to Work by Sex in La Minita
The most frequent times of departure to work in La Minita are 5:30 AM to 5:59 AM (33, 60.0%) for males and 7:30 AM to 7:59 AM (20, 100.0%) for females.
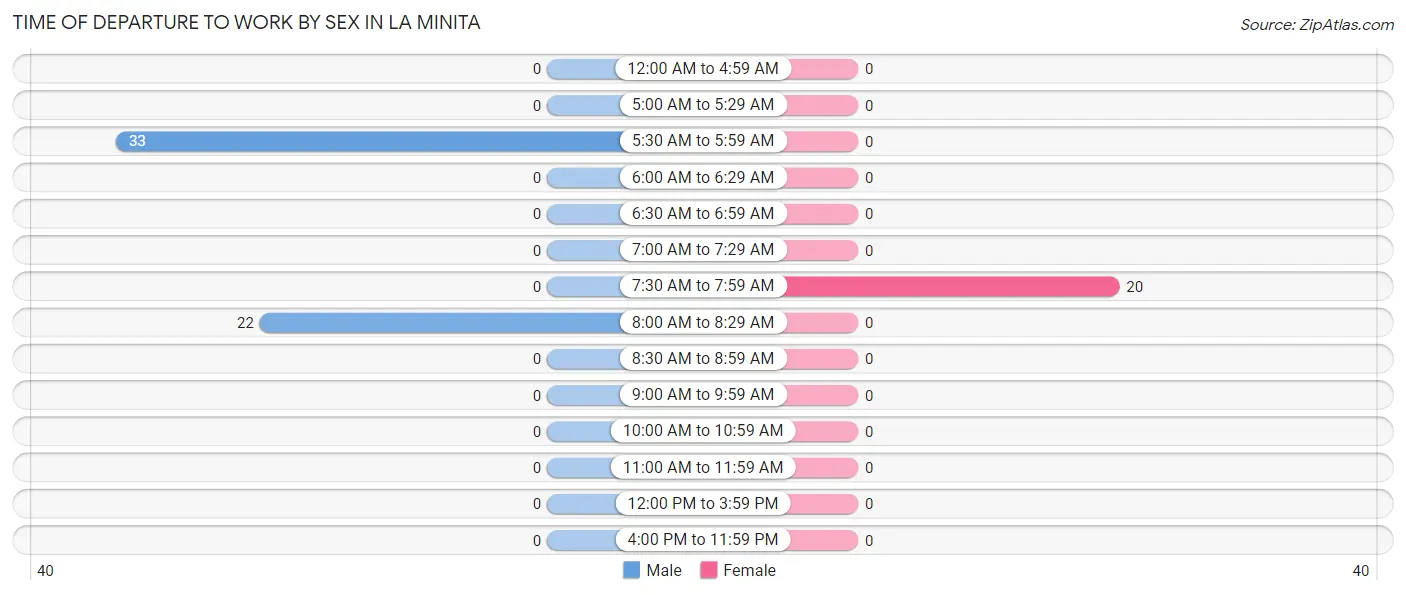
| Time of Departure | Male | Female |
| 12:00 AM to 4:59 AM | 0 (0.0%) | 0 (0.0%) |
| 5:00 AM to 5:29 AM | 0 (0.0%) | 0 (0.0%) |
| 5:30 AM to 5:59 AM | 33 (60.0%) | 0 (0.0%) |
| 6:00 AM to 6:29 AM | 0 (0.0%) | 0 (0.0%) |
| 6:30 AM to 6:59 AM | 0 (0.0%) | 0 (0.0%) |
| 7:00 AM to 7:29 AM | 0 (0.0%) | 0 (0.0%) |
| 7:30 AM to 7:59 AM | 0 (0.0%) | 20 (100.0%) |
| 8:00 AM to 8:29 AM | 22 (40.0%) | 0 (0.0%) |
| 8:30 AM to 8:59 AM | 0 (0.0%) | 0 (0.0%) |
| 9:00 AM to 9:59 AM | 0 (0.0%) | 0 (0.0%) |
| 10:00 AM to 10:59 AM | 0 (0.0%) | 0 (0.0%) |
| 11:00 AM to 11:59 AM | 0 (0.0%) | 0 (0.0%) |
| 12:00 PM to 3:59 PM | 0 (0.0%) | 0 (0.0%) |
| 4:00 PM to 11:59 PM | 0 (0.0%) | 0 (0.0%) |
| Total | 55 (100.0%) | 20 (100.0%) |
Housing Occupancy in La Minita
Occupancy by Ownership in La Minita
Of the total 61 dwellings in La Minita, owner-occupied units account for 61 (100.0%), while renter-occupied units make up 0 (0.0%).
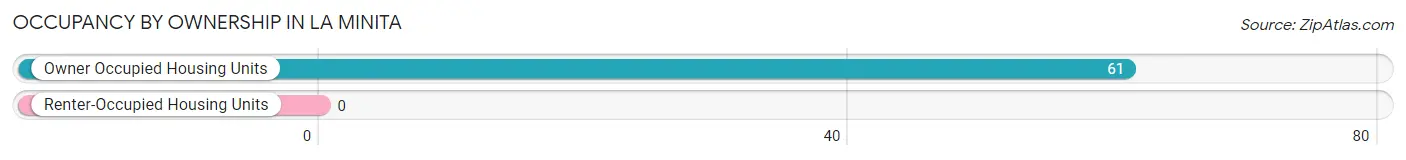
| Occupancy | # Housing Units | % Housing Units |
| Owner Occupied Housing Units | 61 | 100.0% |
| Renter-Occupied Housing Units | 0 | 0.0% |
| Total Occupied Housing Units | 61 | 100.0% |
Occupancy by Household Size in La Minita
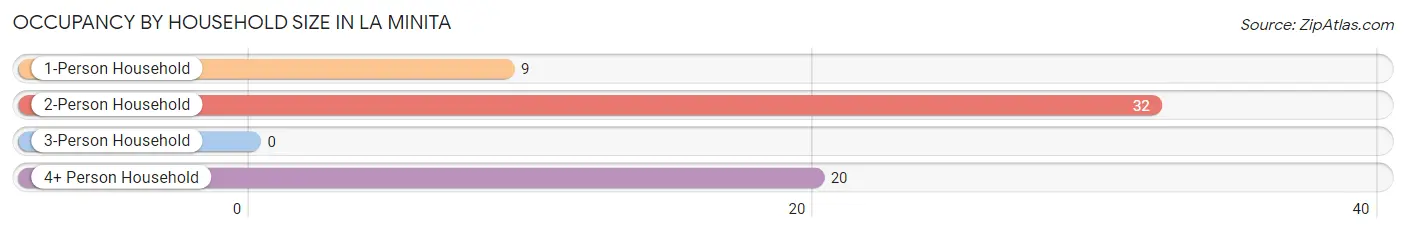
| Household Size | # Housing Units | % Housing Units |
| 1-Person Household | 9 | 14.7% |
| 2-Person Household | 32 | 52.5% |
| 3-Person Household | 0 | 0.0% |
| 4+ Person Household | 20 | 32.8% |
| Total Housing Units | 61 | 100.0% |
Occupancy by Ownership by Household Size in La Minita
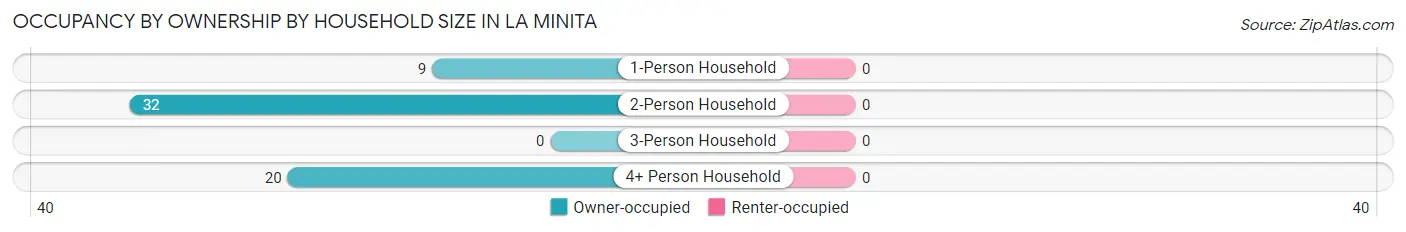
| Household Size | Owner-occupied | Renter-occupied |
| 1-Person Household | 9 (100.0%) | 0 (0.0%) |
| 2-Person Household | 32 (100.0%) | 0 (0.0%) |
| 3-Person Household | 0 (0.0%) | 0 (0.0%) |
| 4+ Person Household | 20 (100.0%) | 0 (0.0%) |
| Total Housing Units | 61 (100.0%) | 0 (0.0%) |
Occupancy by Educational Attainment in La Minita
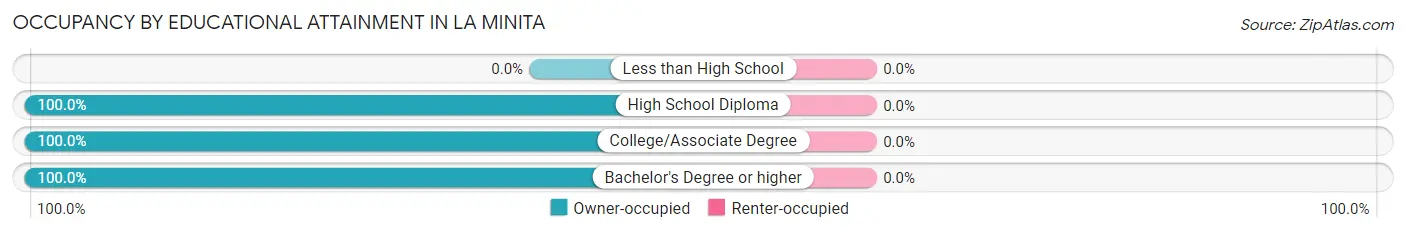
| Household Size | Owner-occupied | Renter-occupied |
| Less than High School | 0 (0.0%) | 0 (0.0%) |
| High School Diploma | 32 (100.0%) | 0 (0.0%) |
| College/Associate Degree | 9 (100.0%) | 0 (0.0%) |
| Bachelor's Degree or higher | 20 (100.0%) | 0 (0.0%) |
Occupancy by Age of Householder in La Minita
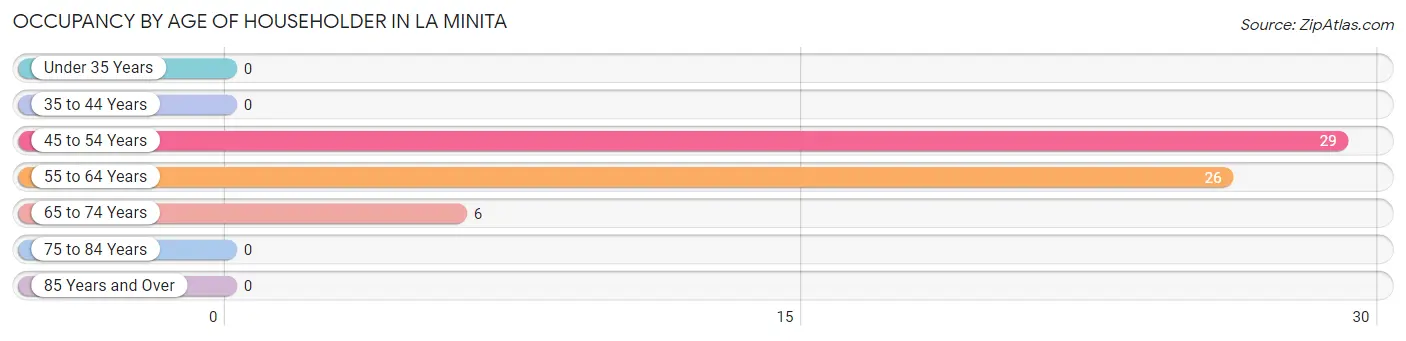
| Age Bracket | # Households | % Households |
| Under 35 Years | 0 | 0.0% |
| 35 to 44 Years | 0 | 0.0% |
| 45 to 54 Years | 29 | 47.5% |
| 55 to 64 Years | 26 | 42.6% |
| 65 to 74 Years | 6 | 9.8% |
| 75 to 84 Years | 0 | 0.0% |
| 85 Years and Over | 0 | 0.0% |
| Total | 61 | 100.0% |
Housing Finances in La Minita
Median Income by Occupancy in La Minita
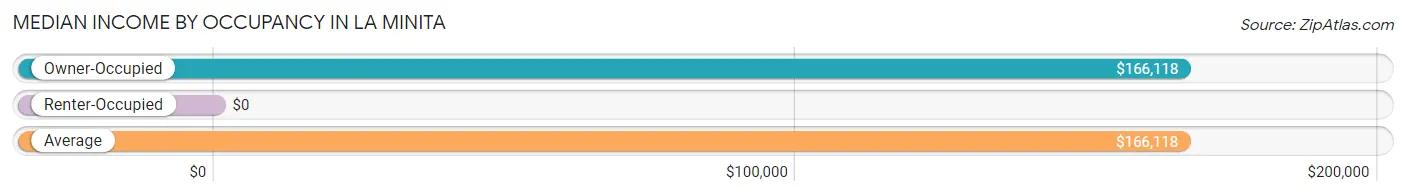
| Occupancy Type | # Households | Median Income |
| Owner-Occupied | 61 (100.0%) | $166,118 |
| Renter-Occupied | 0 (0.0%) | $0 |
| Average | 61 (100.0%) | $166,118 |
Occupancy by Householder Income Bracket in La Minita
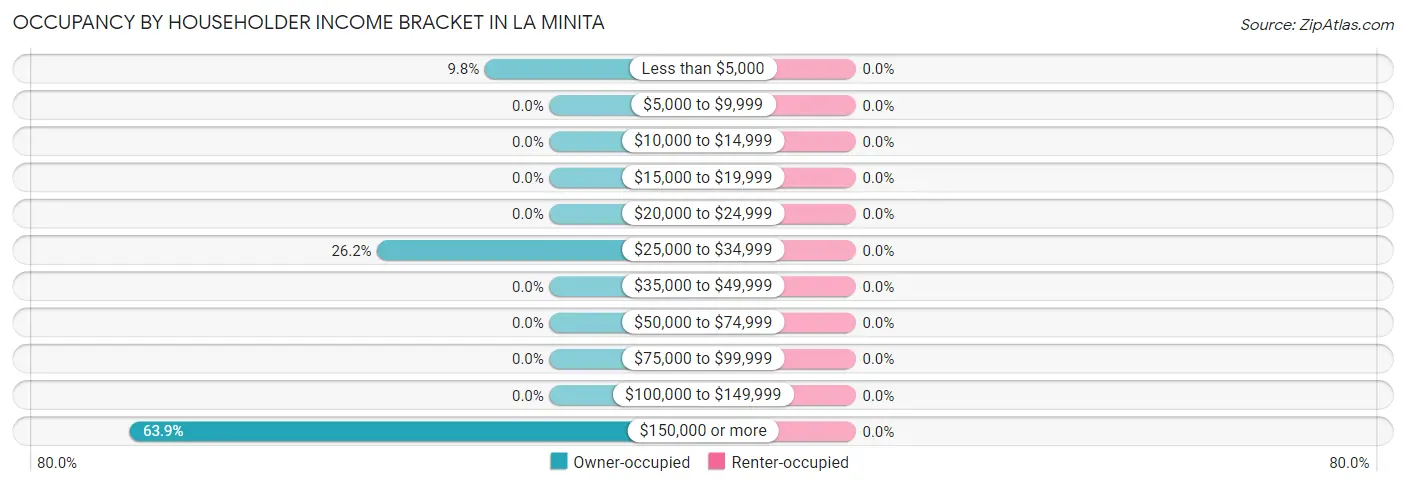
| Income Bracket | Owner-occupied | Renter-occupied |
| Less than $5,000 | 6 (9.8%) | 0 (0.0%) |
| $5,000 to $9,999 | 0 (0.0%) | 0 (0.0%) |
| $10,000 to $14,999 | 0 (0.0%) | 0 (0.0%) |
| $15,000 to $19,999 | 0 (0.0%) | 0 (0.0%) |
| $20,000 to $24,999 | 0 (0.0%) | 0 (0.0%) |
| $25,000 to $34,999 | 16 (26.2%) | 0 (0.0%) |
| $35,000 to $49,999 | 0 (0.0%) | 0 (0.0%) |
| $50,000 to $74,999 | 0 (0.0%) | 0 (0.0%) |
| $75,000 to $99,999 | 0 (0.0%) | 0 (0.0%) |
| $100,000 to $149,999 | 0 (0.0%) | 0 (0.0%) |
| $150,000 or more | 39 (63.9%) | 0 (0.0%) |
| Total | 61 (100.0%) | 0 (0.0%) |
Monthly Housing Cost Tiers in La Minita
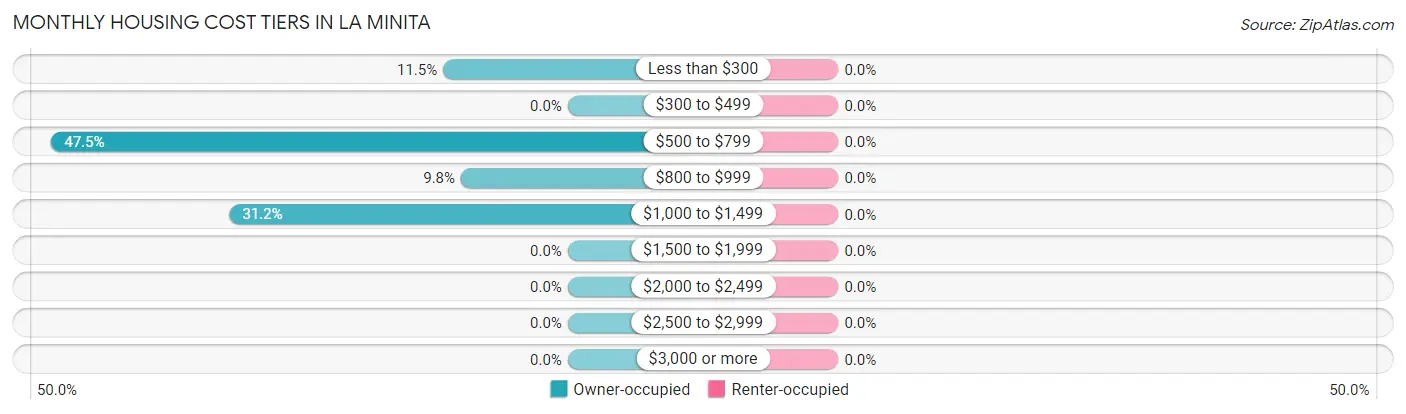
| Monthly Cost | Owner-occupied | Renter-occupied |
| Less than $300 | 7 (11.5%) | 0 (0.0%) |
| $300 to $499 | 0 (0.0%) | 0 (0.0%) |
| $500 to $799 | 29 (47.5%) | 0 (0.0%) |
| $800 to $999 | 6 (9.8%) | 0 (0.0%) |
| $1,000 to $1,499 | 19 (31.1%) | 0 (0.0%) |
| $1,500 to $1,999 | 0 (0.0%) | 0 (0.0%) |
| $2,000 to $2,499 | 0 (0.0%) | 0 (0.0%) |
| $2,500 to $2,999 | 0 (0.0%) | 0 (0.0%) |
| $3,000 or more | 0 (0.0%) | 0 (0.0%) |
| Total | 61 (100.0%) | 0 (0.0%) |
Physical Housing Characteristics in La Minita
Housing Structures in La Minita
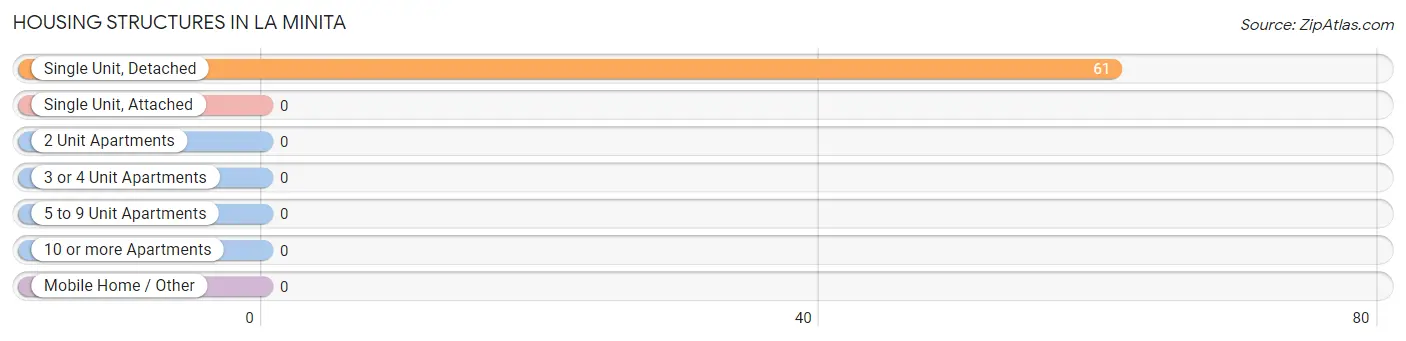
| Structure Type | # Housing Units | % Housing Units |
| Single Unit, Detached | 61 | 100.0% |
| Single Unit, Attached | 0 | 0.0% |
| 2 Unit Apartments | 0 | 0.0% |
| 3 or 4 Unit Apartments | 0 | 0.0% |
| 5 to 9 Unit Apartments | 0 | 0.0% |
| 10 or more Apartments | 0 | 0.0% |
| Mobile Home / Other | 0 | 0.0% |
| Total | 61 | 100.0% |
Housing Structures by Occupancy in La Minita
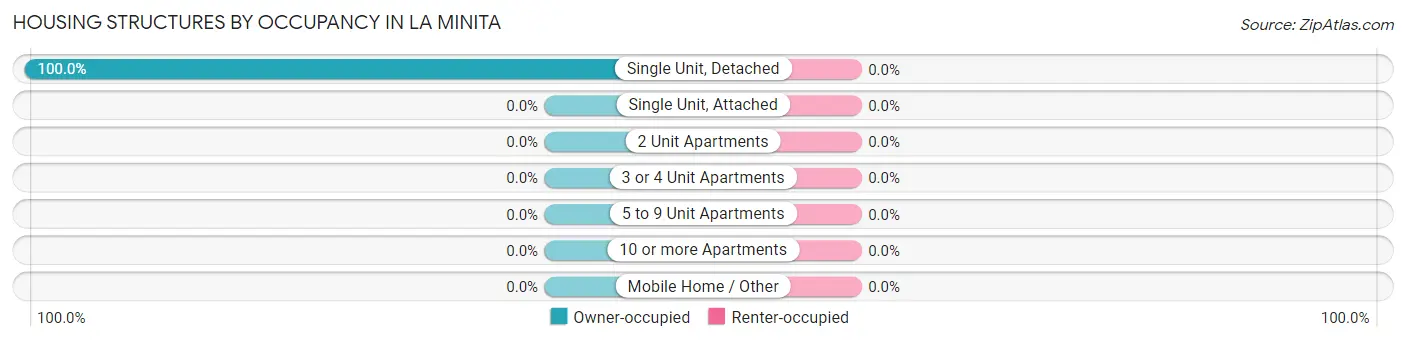
| Structure Type | Owner-occupied | Renter-occupied |
| Single Unit, Detached | 61 (100.0%) | 0 (0.0%) |
| Single Unit, Attached | 0 (0.0%) | 0 (0.0%) |
| 2 Unit Apartments | 0 (0.0%) | 0 (0.0%) |
| 3 or 4 Unit Apartments | 0 (0.0%) | 0 (0.0%) |
| 5 to 9 Unit Apartments | 0 (0.0%) | 0 (0.0%) |
| 10 or more Apartments | 0 (0.0%) | 0 (0.0%) |
| Mobile Home / Other | 0 (0.0%) | 0 (0.0%) |
| Total | 61 (100.0%) | 0 (0.0%) |
Housing Structures by Number of Rooms in La Minita
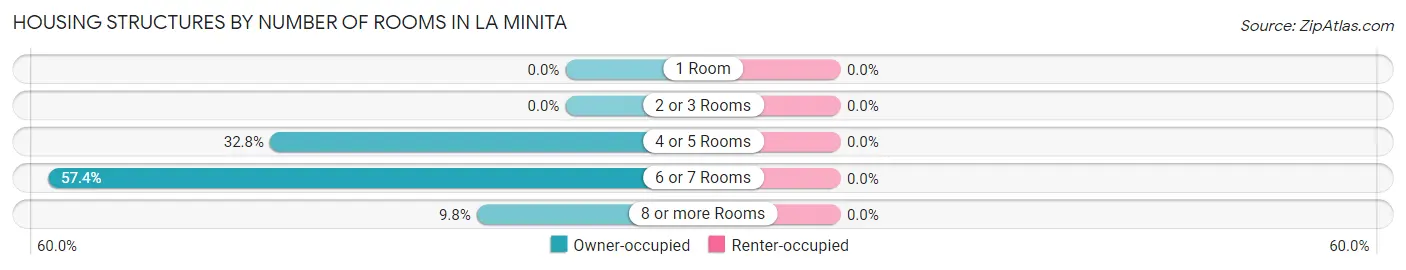
| Number of Rooms | Owner-occupied | Renter-occupied |
| 1 Room | 0 (0.0%) | 0 (0.0%) |
| 2 or 3 Rooms | 0 (0.0%) | 0 (0.0%) |
| 4 or 5 Rooms | 20 (32.8%) | 0 (0.0%) |
| 6 or 7 Rooms | 35 (57.4%) | 0 (0.0%) |
| 8 or more Rooms | 6 (9.8%) | 0 (0.0%) |
| Total | 61 (100.0%) | 0 (0.0%) |
Housing Structure by Heating Type in La Minita
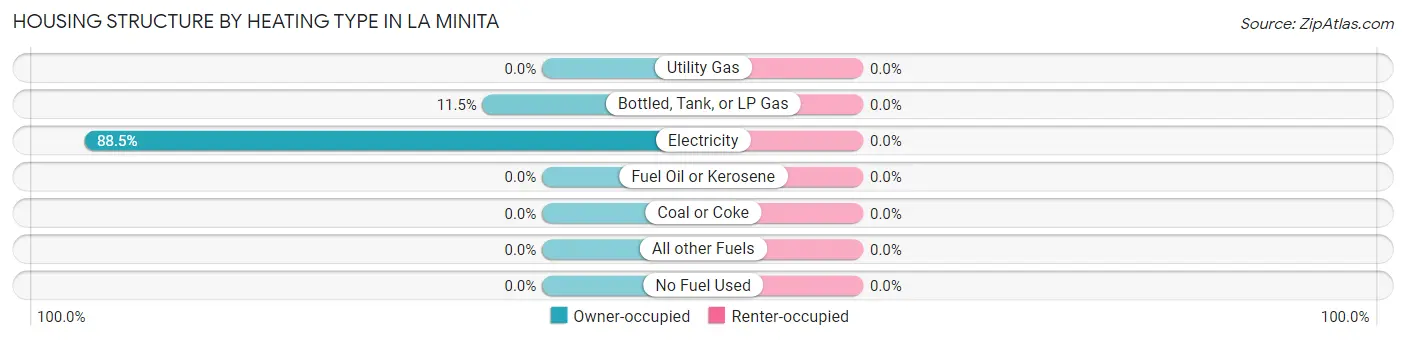
| Heating Type | Owner-occupied | Renter-occupied |
| Utility Gas | 0 (0.0%) | 0 (0.0%) |
| Bottled, Tank, or LP Gas | 7 (11.5%) | 0 (0.0%) |
| Electricity | 54 (88.5%) | 0 (0.0%) |
| Fuel Oil or Kerosene | 0 (0.0%) | 0 (0.0%) |
| Coal or Coke | 0 (0.0%) | 0 (0.0%) |
| All other Fuels | 0 (0.0%) | 0 (0.0%) |
| No Fuel Used | 0 (0.0%) | 0 (0.0%) |
| Total | 61 (100.0%) | 0 (0.0%) |
Household Vehicle Usage in La Minita
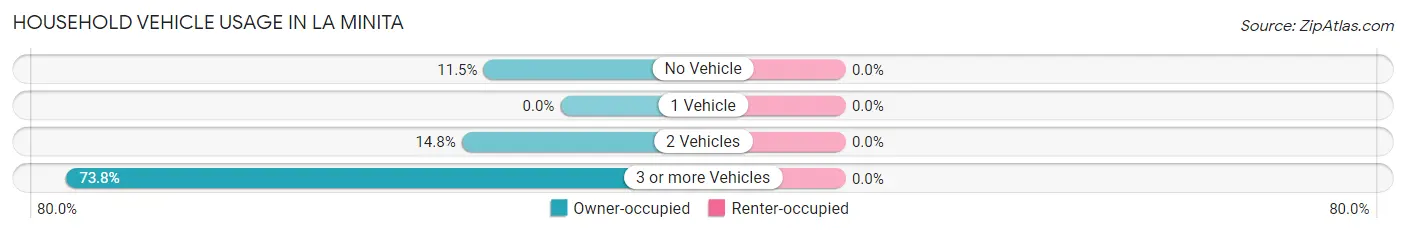
| Vehicles per Household | Owner-occupied | Renter-occupied |
| No Vehicle | 7 (11.5%) | 0 (0.0%) |
| 1 Vehicle | 0 (0.0%) | 0 (0.0%) |
| 2 Vehicles | 9 (14.7%) | 0 (0.0%) |
| 3 or more Vehicles | 45 (73.8%) | 0 (0.0%) |
| Total | 61 (100.0%) | 0 (0.0%) |
Real Estate & Mortgages in La Minita
Real Estate and Mortgage Overview in La Minita
| Characteristic | Without Mortgage | With Mortgage |
| Housing Units | 55 | 6 |
| Median Property Value | - | - |
| Median Household Income | $166,513 | $0 |
| Monthly Housing Costs | - | - |
| Real Estate Taxes | - | - |
Property Value by Mortgage Status in La Minita
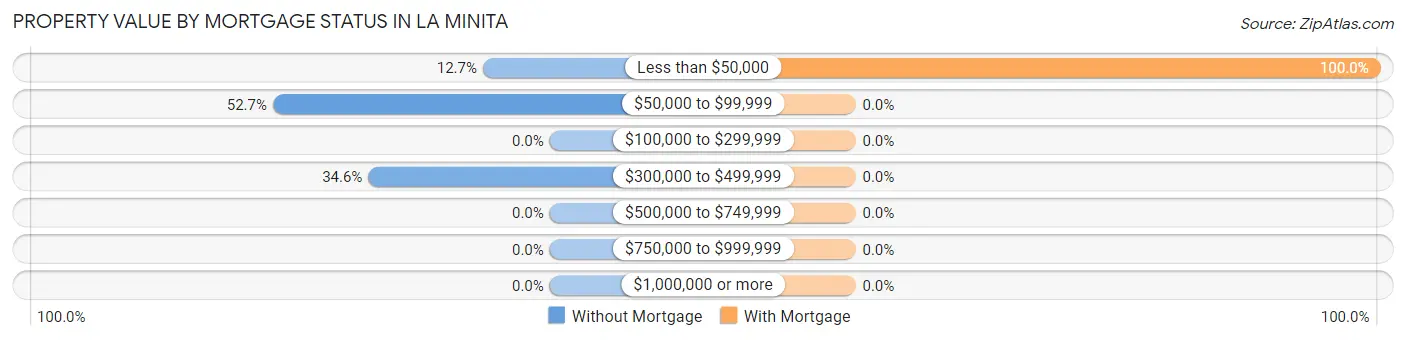
| Property Value | Without Mortgage | With Mortgage |
| Less than $50,000 | 7 (12.7%) | 6 (100.0%) |
| $50,000 to $99,999 | 29 (52.7%) | 0 (0.0%) |
| $100,000 to $299,999 | 0 (0.0%) | 0 (0.0%) |
| $300,000 to $499,999 | 19 (34.5%) | 0 (0.0%) |
| $500,000 to $749,999 | 0 (0.0%) | 0 (0.0%) |
| $750,000 to $999,999 | 0 (0.0%) | 0 (0.0%) |
| $1,000,000 or more | 0 (0.0%) | 0 (0.0%) |
| Total | 55 (100.0%) | 6 (100.0%) |
Household Income by Mortgage Status in La Minita
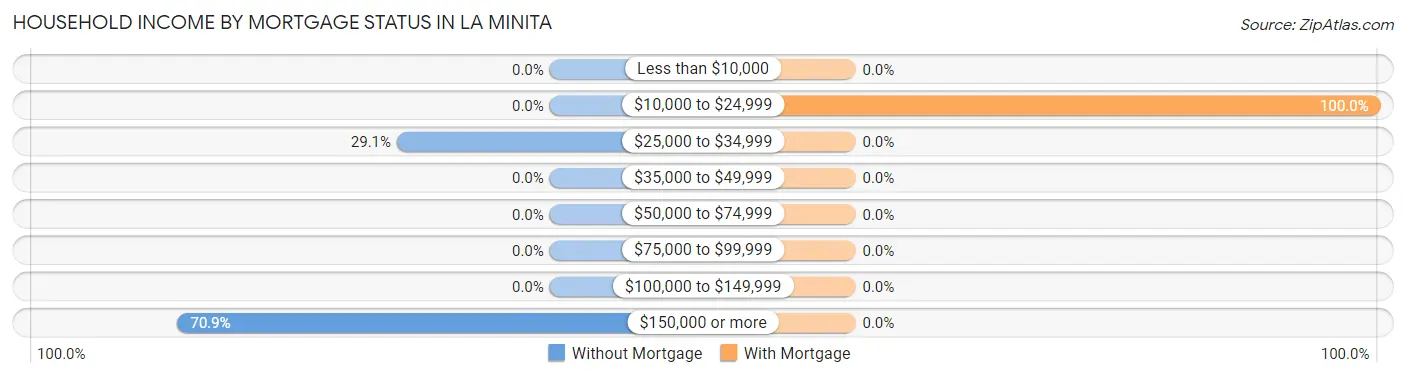
| Household Income | Without Mortgage | With Mortgage |
| Less than $10,000 | 0 (0.0%) | 0 (0.0%) |
| $10,000 to $24,999 | 0 (0.0%) | 6 (100.0%) |
| $25,000 to $34,999 | 16 (29.1%) | 0 (0.0%) |
| $35,000 to $49,999 | 0 (0.0%) | 0 (0.0%) |
| $50,000 to $74,999 | 0 (0.0%) | 0 (0.0%) |
| $75,000 to $99,999 | 0 (0.0%) | 0 (0.0%) |
| $100,000 to $149,999 | 0 (0.0%) | 0 (0.0%) |
| $150,000 or more | 39 (70.9%) | 0 (0.0%) |
| Total | 55 (100.0%) | 6 (100.0%) |
Property Value to Household Income Ratio in La Minita
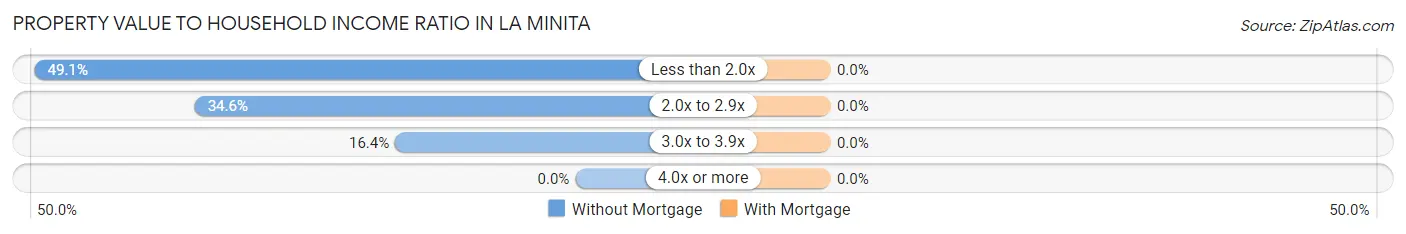
| Value-to-Income Ratio | Without Mortgage | With Mortgage |
| Less than 2.0x | 27 (49.1%) | 0 (0.0%) |
| 2.0x to 2.9x | 19 (34.5%) | 0 (0.0%) |
| 3.0x to 3.9x | 9 (16.4%) | 0 (0.0%) |
| 4.0x or more | 0 (0.0%) | 0 (0.0%) |
| Total | 55 (100.0%) | 6 (100.0%) |
Real Estate Taxes by Mortgage Status in La Minita
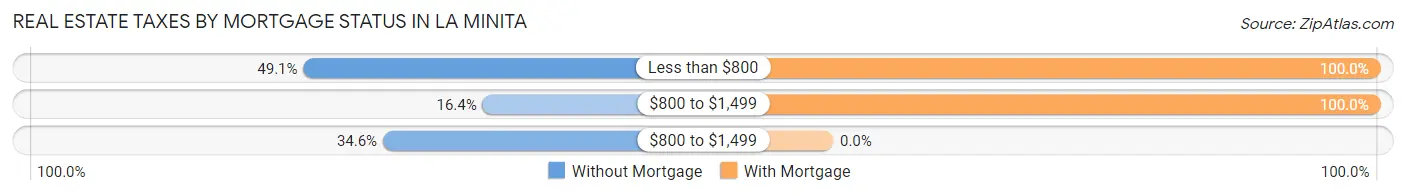
| Property Taxes | Without Mortgage | With Mortgage |
| Less than $800 | 27 (49.1%) | 6 (100.0%) |
| $800 to $1,499 | 9 (16.4%) | 6 (100.0%) |
| $800 to $1,499 | 19 (34.5%) | 0 (0.0%) |
| Total | 55 (100.0%) | 6 (100.0%) |
Health & Disability in La Minita
Health Insurance Coverage by Age in La Minita
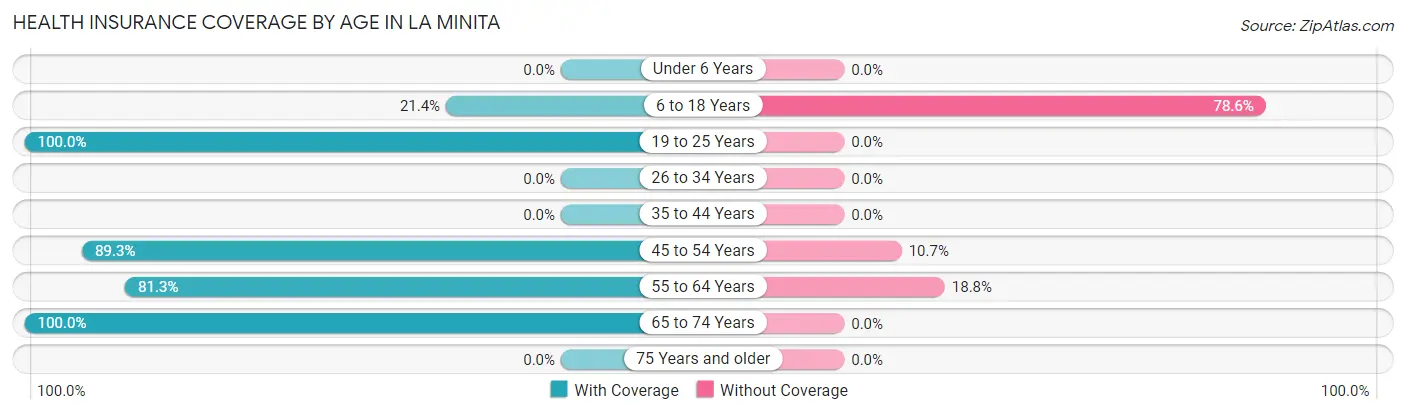
| Age Bracket | With Coverage | Without Coverage |
| Under 6 Years | 0 (0.0%) | 0 (0.0%) |
| 6 to 18 Years | 6 (21.4%) | 22 (78.6%) |
| 19 to 25 Years | 37 (100.0%) | 0 (0.0%) |
| 26 to 34 Years | 0 (0.0%) | 0 (0.0%) |
| 35 to 44 Years | 0 (0.0%) | 0 (0.0%) |
| 45 to 54 Years | 75 (89.3%) | 9 (10.7%) |
| 55 to 64 Years | 26 (81.2%) | 6 (18.8%) |
| 65 to 74 Years | 6 (100.0%) | 0 (0.0%) |
| 75 Years and older | 0 (0.0%) | 0 (0.0%) |
| Total | 150 (80.2%) | 37 (19.8%) |
Health Insurance Coverage by Citizenship Status in La Minita
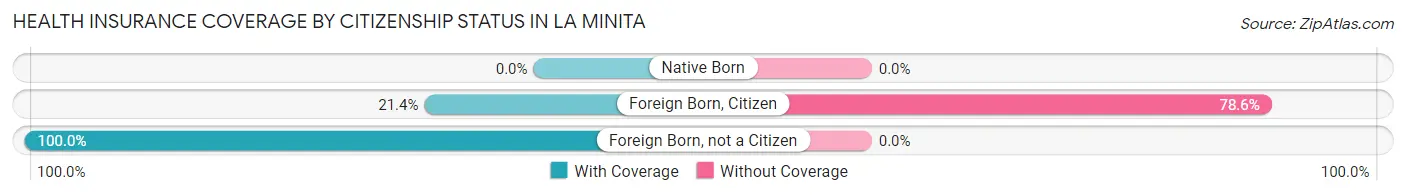
| Citizenship Status | With Coverage | Without Coverage |
| Native Born | 0 (0.0%) | 0 (0.0%) |
| Foreign Born, Citizen | 6 (21.4%) | 22 (78.6%) |
| Foreign Born, not a Citizen | 37 (100.0%) | 0 (0.0%) |
Health Insurance Coverage by Household Income in La Minita
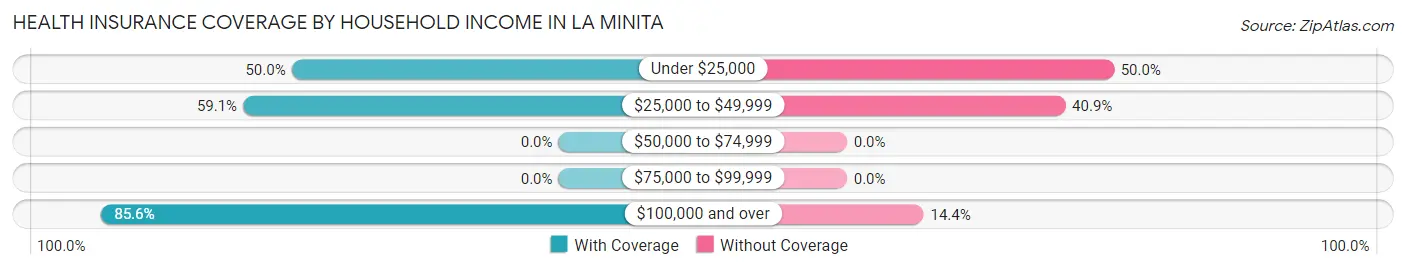
| Household Income | With Coverage | Without Coverage |
| Under $25,000 | 6 (50.0%) | 6 (50.0%) |
| $25,000 to $49,999 | 13 (59.1%) | 9 (40.9%) |
| $50,000 to $74,999 | 0 (0.0%) | 0 (0.0%) |
| $75,000 to $99,999 | 0 (0.0%) | 0 (0.0%) |
| $100,000 and over | 131 (85.6%) | 22 (14.4%) |
Public vs Private Health Insurance Coverage by Age in La Minita
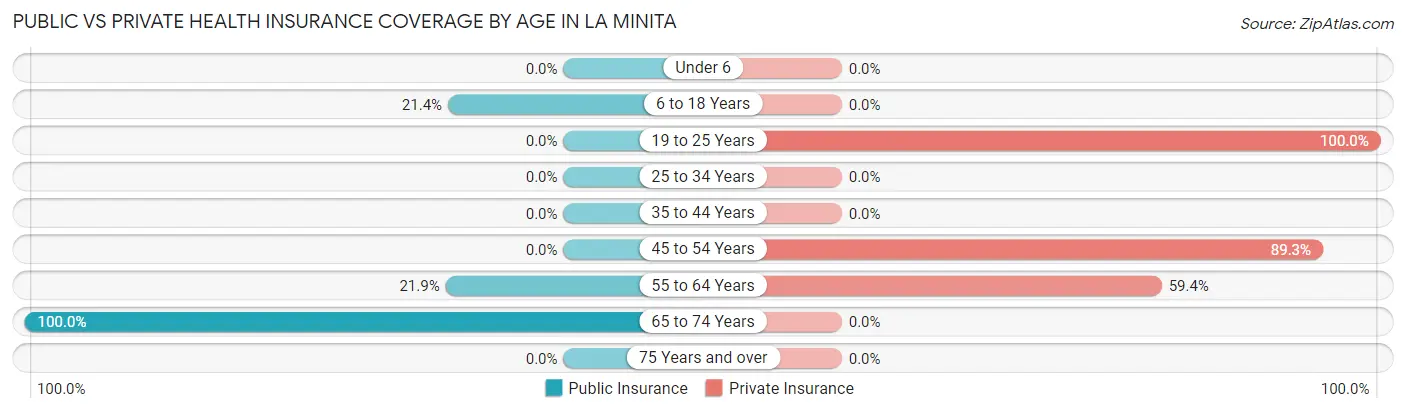
| Age Bracket | Public Insurance | Private Insurance |
| Under 6 | 0 (0.0%) | 0 (0.0%) |
| 6 to 18 Years | 6 (21.4%) | 0 (0.0%) |
| 19 to 25 Years | 0 (0.0%) | 37 (100.0%) |
| 25 to 34 Years | 0 (0.0%) | 0 (0.0%) |
| 35 to 44 Years | 0 (0.0%) | 0 (0.0%) |
| 45 to 54 Years | 0 (0.0%) | 75 (89.3%) |
| 55 to 64 Years | 7 (21.9%) | 19 (59.4%) |
| 65 to 74 Years | 6 (100.0%) | 0 (0.0%) |
| 75 Years and over | 0 (0.0%) | 0 (0.0%) |
| Total | 19 (10.2%) | 131 (70.1%) |
Disability Status by Sex by Age in La Minita
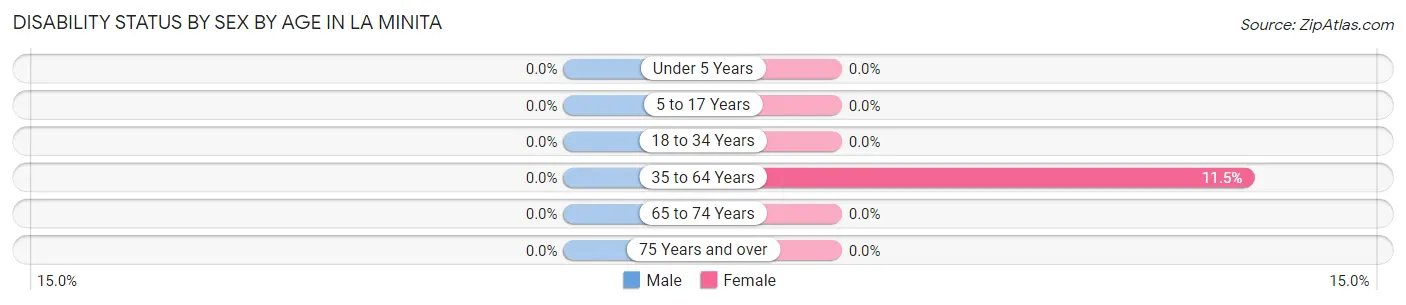
| Age Bracket | Male | Female |
| Under 5 Years | 0 (0.0%) | 0 (0.0%) |
| 5 to 17 Years | 0 (0.0%) | 0 (0.0%) |
| 18 to 34 Years | 0 (0.0%) | 0 (0.0%) |
| 35 to 64 Years | 0 (0.0%) | 7 (11.5%) |
| 65 to 74 Years | 0 (0.0%) | 0 (0.0%) |
| 75 Years and over | 0 (0.0%) | 0 (0.0%) |
Disability Class by Sex by Age in La Minita
Disability Class: Hearing Difficulty
| Age Bracket | Male | Female |
| Under 5 Years | 0 (0.0%) | 0 (0.0%) |
| 5 to 17 Years | 0 (0.0%) | 0 (0.0%) |
| 18 to 34 Years | 0 (0.0%) | 0 (0.0%) |
| 35 to 64 Years | 0 (0.0%) | 0 (0.0%) |
| 65 to 74 Years | 0 (0.0%) | 0 (0.0%) |
| 75 Years and over | 0 (0.0%) | 0 (0.0%) |
Disability Class: Vision Difficulty
| Age Bracket | Male | Female |
| Under 5 Years | 0 (0.0%) | 0 (0.0%) |
| 5 to 17 Years | 0 (0.0%) | 0 (0.0%) |
| 18 to 34 Years | 0 (0.0%) | 0 (0.0%) |
| 35 to 64 Years | 0 (0.0%) | 0 (0.0%) |
| 65 to 74 Years | 0 (0.0%) | 0 (0.0%) |
| 75 Years and over | 0 (0.0%) | 0 (0.0%) |
Disability Class: Cognitive Difficulty
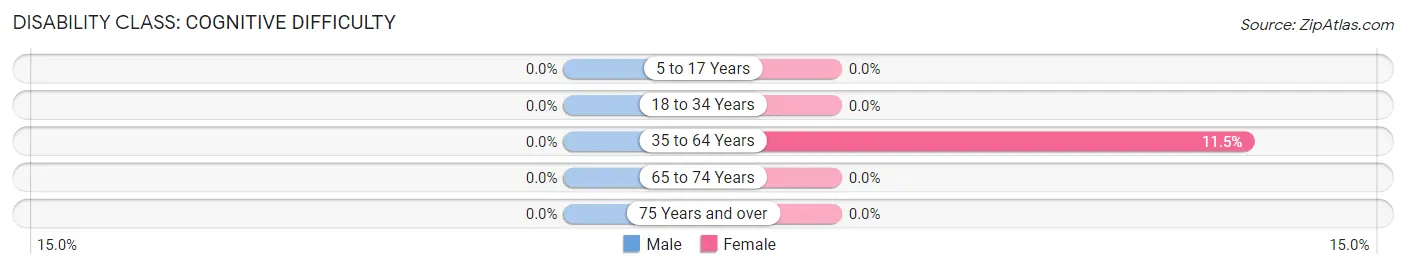
| Age Bracket | Male | Female |
| 5 to 17 Years | 0 (0.0%) | 0 (0.0%) |
| 18 to 34 Years | 0 (0.0%) | 0 (0.0%) |
| 35 to 64 Years | 0 (0.0%) | 7 (11.5%) |
| 65 to 74 Years | 0 (0.0%) | 0 (0.0%) |
| 75 Years and over | 0 (0.0%) | 0 (0.0%) |
Disability Class: Ambulatory Difficulty
| Age Bracket | Male | Female |
| 5 to 17 Years | 0 (0.0%) | 0 (0.0%) |
| 18 to 34 Years | 0 (0.0%) | 0 (0.0%) |
| 35 to 64 Years | 0 (0.0%) | 0 (0.0%) |
| 65 to 74 Years | 0 (0.0%) | 0 (0.0%) |
| 75 Years and over | 0 (0.0%) | 0 (0.0%) |
Disability Class: Self-Care Difficulty
| Age Bracket | Male | Female |
| 5 to 17 Years | 0 (0.0%) | 0 (0.0%) |
| 18 to 34 Years | 0 (0.0%) | 0 (0.0%) |
| 35 to 64 Years | 0 (0.0%) | 0 (0.0%) |
| 65 to 74 Years | 0 (0.0%) | 0 (0.0%) |
| 75 Years and over | 0 (0.0%) | 0 (0.0%) |
Technology Access in La Minita
Computing Device Access in La Minita
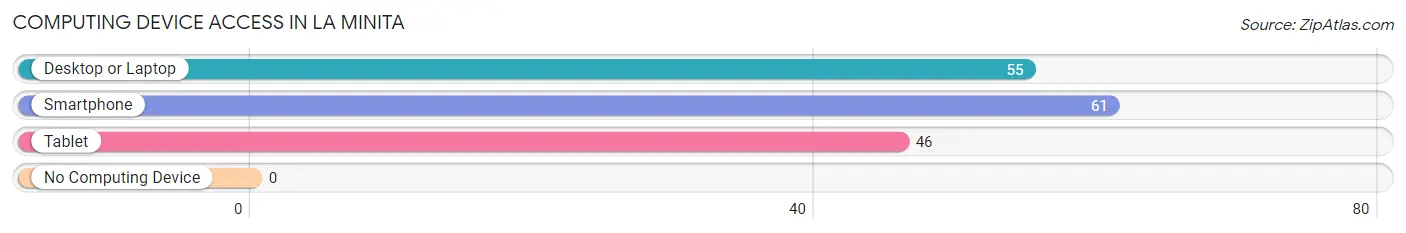
| Device Type | # Households | % Households |
| Desktop or Laptop | 55 | 90.2% |
| Smartphone | 61 | 100.0% |
| Tablet | 46 | 75.4% |
| No Computing Device | 0 | 0.0% |
| Total | 61 | 100.0% |
Internet Access in La Minita
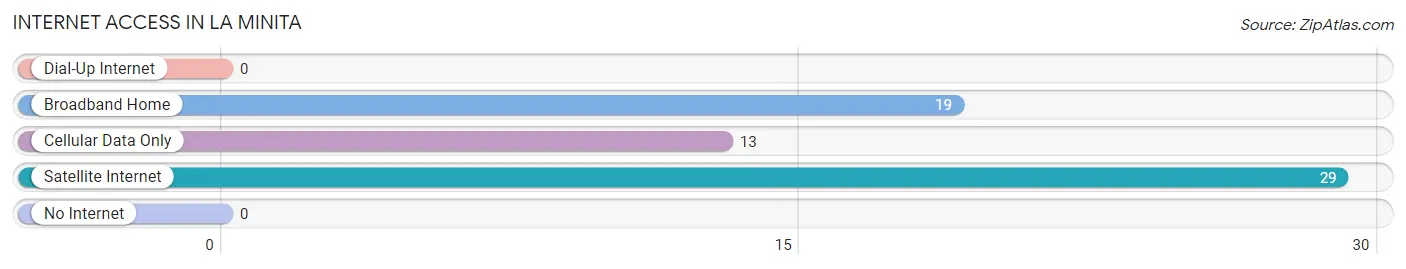
| Internet Type | # Households | % Households |
| Dial-Up Internet | 0 | 0.0% |
| Broadband Home | 19 | 31.1% |
| Cellular Data Only | 13 | 21.3% |
| Satellite Internet | 29 | 47.5% |
| No Internet | 0 | 0.0% |
| Total | 61 | 100.0% |
La Minita Summary
Minita, Texas is a small unincorporated community located in the southeastern corner of Hidalgo County, Texas. It is situated on the banks of the Rio Grande, just south of the city of McAllen. The population of Minita is estimated to be around 500 people.
History
Minita was founded in the late 19th century by a group of Mexican immigrants who were looking for a place to settle and start a new life. The town was originally called “La Minita”, which translates to “the little one” in Spanish. The name was chosen to reflect the small size of the town.
The first settlers of Minita were mostly farmers and ranchers who were looking to make a living off the land. They grew crops such as corn, beans, and squash, and raised cattle and horses. The town also had a small store and a post office.
In the early 20th century, Minita began to grow and develop. The town was connected to the rest of the state by a railroad line, and the population began to increase. By the mid-20th century, Minita had become a thriving community with a population of over 1,000 people.
Geography
Minita is located in the southeastern corner of Hidalgo County, Texas. It is situated on the banks of the Rio Grande, just south of the city of McAllen. The town is surrounded by farmland and is located in a semi-arid climate. The average temperature in Minita is around 80 degrees Fahrenheit in the summer and around 60 degrees Fahrenheit in the winter.
The terrain in Minita is mostly flat, with some rolling hills. The town is located in an area of the Rio Grande Valley known as the “Lower Valley”, which is characterized by its flat terrain and sandy soil.
Economy
The economy of Minita is largely based on agriculture. The town is surrounded by farmland, and many of the residents are involved in farming and ranching. The town also has a small store and a post office.
The town is also home to a number of small businesses, including a restaurant, a barber shop, and a mechanic shop. The town also has a few small manufacturing businesses, such as a furniture factory and a metal fabrication shop.
Demographics
The population of Minita is estimated to be around 500 people. The town is predominantly Hispanic, with a large majority of the population being of Mexican descent. The town also has a small population of African Americans and Native Americans.
The median household income in Minita is around $25,000, which is lower than the national average. The poverty rate in Minita is also higher than the national average, with around 25% of the population living below the poverty line.
Conclusion
Minita, Texas is a small unincorporated community located in the southeastern corner of Hidalgo County, Texas. It is situated on the banks of the Rio Grande, just south of the city of McAllen. The population of Minita is estimated to be around 500 people. The town is predominantly Hispanic, with a large majority of the population being of Mexican descent. The economy of Minita is largely based on agriculture, and the town is also home to a number of small businesses. The median household income in Minita is around $25,000, and the poverty rate is higher than the national average.
Common Questions
What is Per Capita Income in La Minita?
Per Capita income in La Minita is $45,156.
What is the Median Family Income in La Minita?
Median Family Income in La Minita is $166,711.
What is the Median Household income in La Minita?
Median Household Income in La Minita is $166,118.
What is Inequality or Gini Index in La Minita?
Inequality or Gini Index in La Minita is 0.33.
What is the Total Population of La Minita?
Total Population of La Minita is 187.
What is the Total Male Population of La Minita?
Total Male Population of La Minita is 89.
What is the Total Female Population of La Minita?
Total Female Population of La Minita is 98.
What is the Ratio of Males per 100 Females in La Minita?
There are 90.82 Males per 100 Females in La Minita.
What is the Ratio of Females per 100 Males in La Minita?
There are 110.11 Females per 100 Males in La Minita.
What is the Median Population Age in La Minita?
Median Population Age in La Minita is 52.7 Years.
What is the Average Family Size in La Minita
Average Family Size in La Minita is 3.4 People.
What is the Average Household Size in La Minita
Average Household Size in La Minita is 3.1 People.
How Large is the Labor Force in La Minita?
There are 103 People in the Labor Forcein in La Minita.
What is the Percentage of People in the Labor Force in La Minita?
56.9% of People are in the Labor Force in La Minita.