Virgie, KY Map & Demographics
Virgie Map
Virgie Overview
$19,798
PER CAPITA INCOME
$42,813
AVG FAMILY INCOME
$36,333
AVG HOUSEHOLD INCOME
0.43
INEQUALITY / GINI INDEX
522
TOTAL POPULATION
276
MALE POPULATION
246
FEMALE POPULATION
112.20
MALES / 100 FEMALES
89.13
FEMALES / 100 MALES
32.5
MEDIAN AGE
3.9
AVG FAMILY SIZE
3.6
AVG HOUSEHOLD SIZE
216
LABOR FORCE [ PEOPLE ]
53.3%
PERCENT IN LABOR FORCE
11.1%
UNEMPLOYMENT RATE
Virgie Zip Codes
Virgie Area Codes
Income in Virgie
Income Overview in Virgie
Per Capita Income in Virgie is $19,798, while median incomes of families and households are $42,813 and $36,333 respectively.
| Characteristic | Number | Measure |
| Per Capita Income | 522 | $19,798 |
| Median Family Income | 129 | $42,813 |
| Mean Family Income | 129 | $64,034 |
| Median Household Income | 146 | $36,333 |
| Mean Household Income | 146 | $59,083 |
| Income Deficit | 129 | $0 |
| Wage / Income Gap (%) | 522 | 0.00% |
| Wage / Income Gap ($) | 522 | 100.00¢ per $1 |
| Gini / Inequality Index | 522 | 0.43 |
Earnings by Sex in Virgie
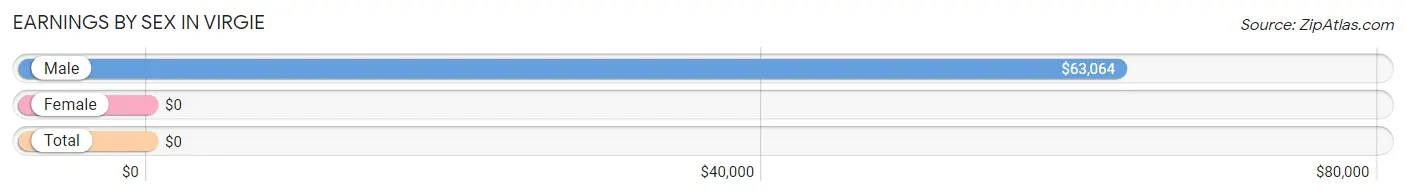
| Sex | Number | Average Earnings |
| Male | 79 (41.1%) | $63,064 |
| Female | 113 (58.9%) | $0 |
| Total | 192 (100.0%) | $0 |
Earnings by Sex by Income Bracket in Virgie
The most common earnings brackets in Virgie are $55,000 to $64,999 for men (51 | 64.6%) and $75,000 to $99,999 for women (34 | 30.1%).
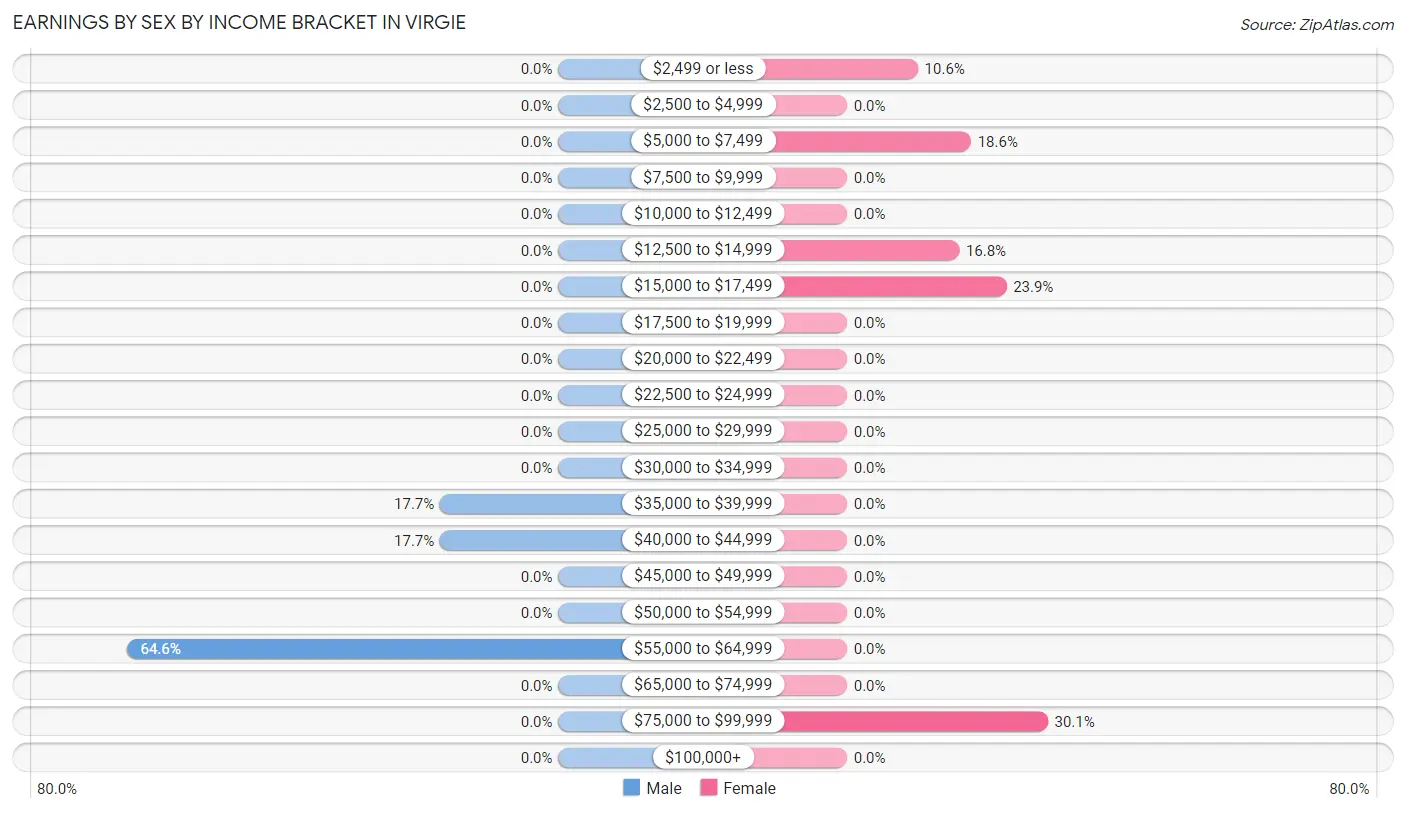
| Income | Male | Female |
| $2,499 or less | 0 (0.0%) | 12 (10.6%) |
| $2,500 to $4,999 | 0 (0.0%) | 0 (0.0%) |
| $5,000 to $7,499 | 0 (0.0%) | 21 (18.6%) |
| $7,500 to $9,999 | 0 (0.0%) | 0 (0.0%) |
| $10,000 to $12,499 | 0 (0.0%) | 0 (0.0%) |
| $12,500 to $14,999 | 0 (0.0%) | 19 (16.8%) |
| $15,000 to $17,499 | 0 (0.0%) | 27 (23.9%) |
| $17,500 to $19,999 | 0 (0.0%) | 0 (0.0%) |
| $20,000 to $22,499 | 0 (0.0%) | 0 (0.0%) |
| $22,500 to $24,999 | 0 (0.0%) | 0 (0.0%) |
| $25,000 to $29,999 | 0 (0.0%) | 0 (0.0%) |
| $30,000 to $34,999 | 0 (0.0%) | 0 (0.0%) |
| $35,000 to $39,999 | 14 (17.7%) | 0 (0.0%) |
| $40,000 to $44,999 | 14 (17.7%) | 0 (0.0%) |
| $45,000 to $49,999 | 0 (0.0%) | 0 (0.0%) |
| $50,000 to $54,999 | 0 (0.0%) | 0 (0.0%) |
| $55,000 to $64,999 | 51 (64.6%) | 0 (0.0%) |
| $65,000 to $74,999 | 0 (0.0%) | 0 (0.0%) |
| $75,000 to $99,999 | 0 (0.0%) | 34 (30.1%) |
| $100,000+ | 0 (0.0%) | 0 (0.0%) |
| Total | 79 (100.0%) | 113 (100.0%) |
Earnings by Sex by Educational Attainment in Virgie
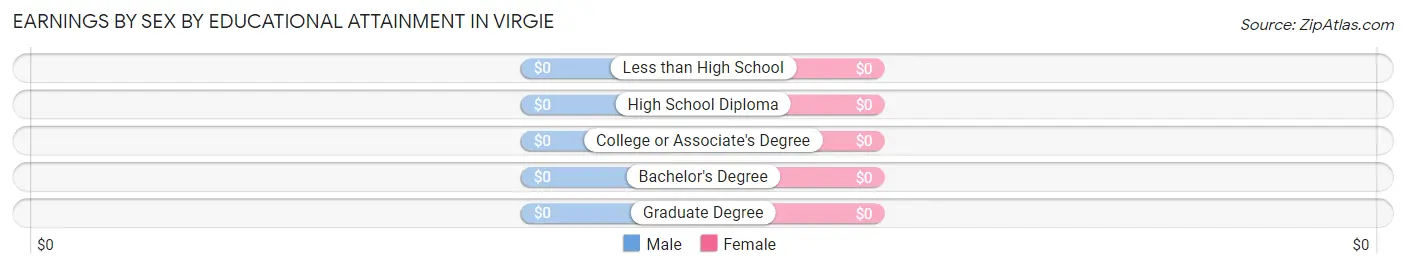
| Educational Attainment | Male Income | Female Income |
| Less than High School | - | - |
| High School Diploma | - | - |
| College or Associate's Degree | - | - |
| Bachelor's Degree | - | - |
| Graduate Degree | - | - |
| Total | $63,064 | $0 |
Family Income in Virgie
Family Income Brackets in Virgie
According to the Virgie family income data, there are 34 families falling into the $100,000 to $149,999 income range, which is the most common income bracket and makes up 26.4% of all families.
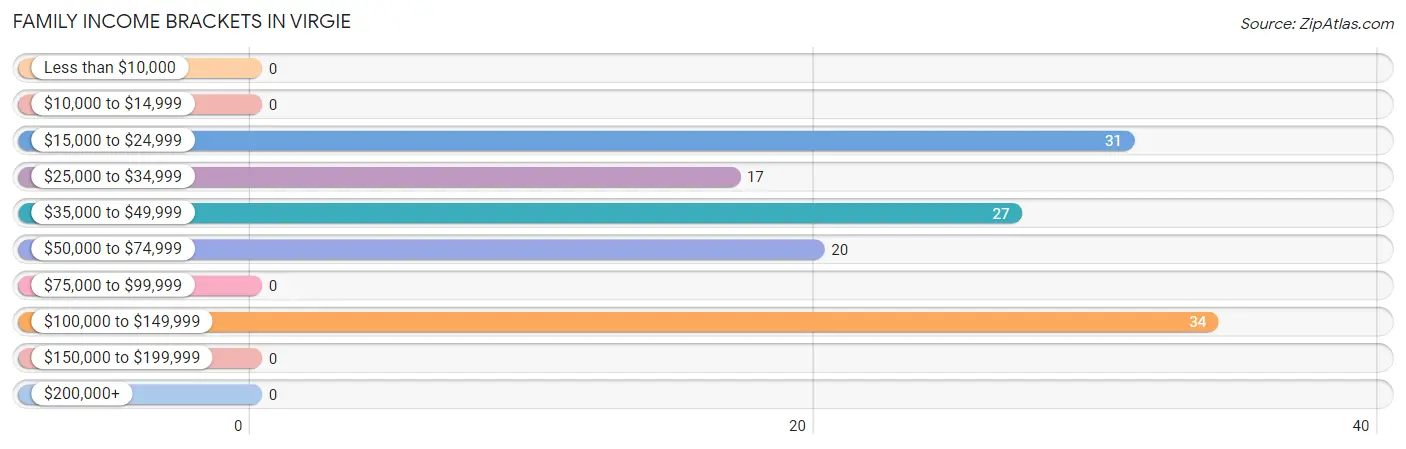
| Income Bracket | # Families | % Families |
| Less than $10,000 | 0 | 0.0% |
| $10,000 to $14,999 | 0 | 0.0% |
| $15,000 to $24,999 | 31 | 24.0% |
| $25,000 to $34,999 | 17 | 13.2% |
| $35,000 to $49,999 | 27 | 20.9% |
| $50,000 to $74,999 | 20 | 15.5% |
| $75,000 to $99,999 | 0 | 0.0% |
| $100,000 to $149,999 | 34 | 26.4% |
| $150,000 to $199,999 | 0 | 0.0% |
| $200,000+ | 0 | 0.0% |
Family Income by Famaliy Size in Virgie
| Income Bracket | # Families | Median Income |
| 2-Person Families | 17 (13.2%) | $0 |
| 3-Person Families | 92 (71.3%) | $0 |
| 4-Person Families | 0 (0.0%) | $0 |
| 5-Person Families | 20 (15.5%) | $0 |
| 6-Person Families | 0 (0.0%) | $0 |
| 7+ Person Families | 0 (0.0%) | $0 |
| Total | 129 (100.0%) | $42,813 |
Family Income by Number of Earners in Virgie
| Number of Earners | # Families | Median Income |
| No Earners | 31 (24.0%) | $0 |
| 1 Earner | 32 (24.8%) | $0 |
| 2 Earners | 66 (51.2%) | $0 |
| 3+ Earners | 0 (0.0%) | $0 |
| Total | 129 (100.0%) | $42,813 |
Household Income in Virgie
Household Income Brackets in Virgie
With 48 households falling in the category, the $15,000 to $24,999 income range is the most frequent in Virgie, accounting for 32.9% of all households.
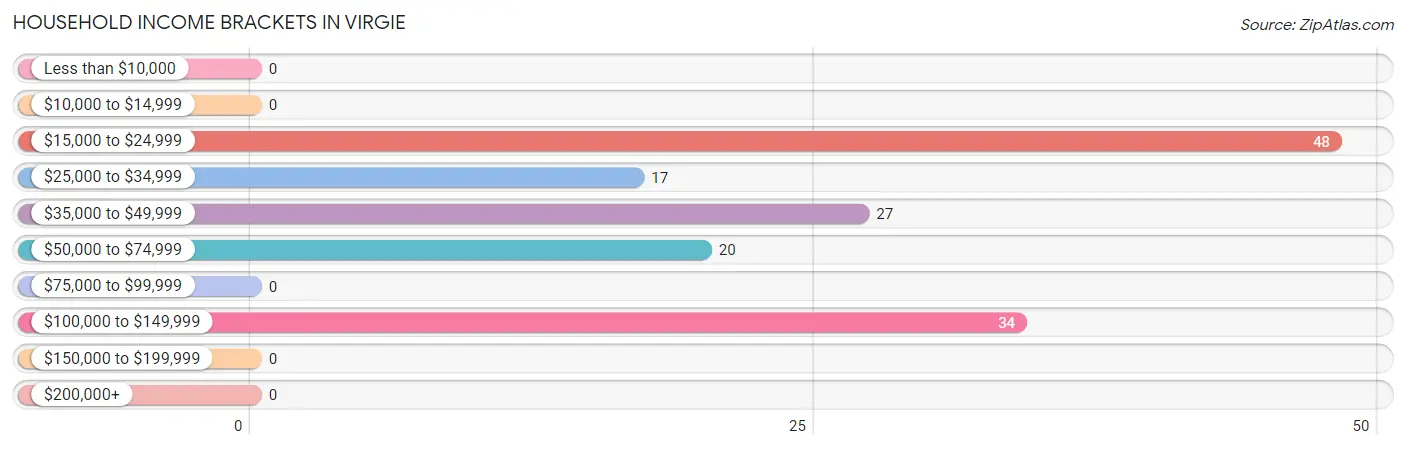
| Income Bracket | # Households | % Households |
| Less than $10,000 | 0 | 0.0% |
| $10,000 to $14,999 | 0 | 0.0% |
| $15,000 to $24,999 | 48 | 32.9% |
| $25,000 to $34,999 | 17 | 11.6% |
| $35,000 to $49,999 | 27 | 18.5% |
| $50,000 to $74,999 | 20 | 13.7% |
| $75,000 to $99,999 | 0 | 0.0% |
| $100,000 to $149,999 | 34 | 23.3% |
| $150,000 to $199,999 | 0 | 0.0% |
| $200,000+ | 0 | 0.0% |
Household Income by Householder Age in Virgie
| Income Bracket | # Households | Median Income |
| 15 to 24 Years | 12 (8.2%) | $0 |
| 25 to 44 Years | 49 (33.6%) | $0 |
| 45 to 64 Years | 54 (37.0%) | $0 |
| 65+ Years | 31 (21.2%) | $0 |
| Total | 146 (100.0%) | $36,333 |
Poverty in Virgie
Income Below Poverty by Sex and Age in Virgie
With 30.8% poverty level for males and 28.5% for females among the residents of Virgie, 15 year old males and 55 to 64 year old females are the most vulnerable to poverty, with 54 males (100.0%) and 70 females (80.5%) in their respective age groups living below the poverty level.
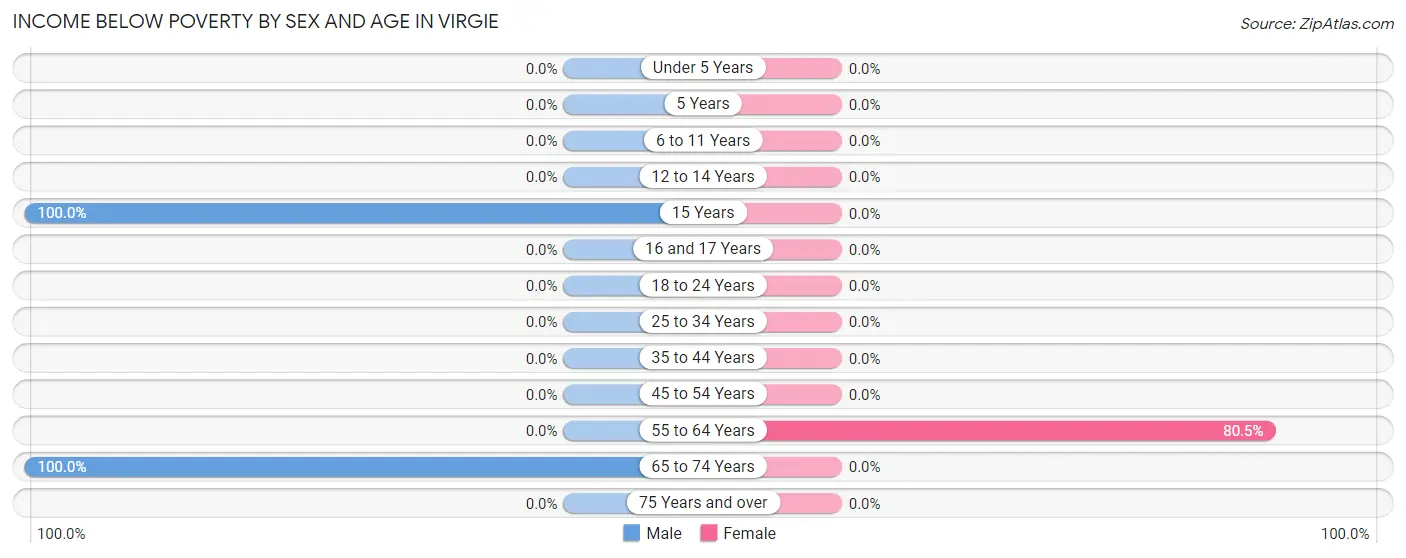
| Age Bracket | Male | Female |
| Under 5 Years | 0 (0.0%) | 0 (0.0%) |
| 5 Years | 0 (0.0%) | 0 (0.0%) |
| 6 to 11 Years | 0 (0.0%) | 0 (0.0%) |
| 12 to 14 Years | 0 (0.0%) | 0 (0.0%) |
| 15 Years | 54 (100.0%) | 0 (0.0%) |
| 16 and 17 Years | 0 (0.0%) | 0 (0.0%) |
| 18 to 24 Years | 0 (0.0%) | 0 (0.0%) |
| 25 to 34 Years | 0 (0.0%) | 0 (0.0%) |
| 35 to 44 Years | 0 (0.0%) | 0 (0.0%) |
| 45 to 54 Years | 0 (0.0%) | 0 (0.0%) |
| 55 to 64 Years | 0 (0.0%) | 70 (80.5%) |
| 65 to 74 Years | 31 (100.0%) | 0 (0.0%) |
| 75 Years and over | 0 (0.0%) | 0 (0.0%) |
| Total | 85 (30.8%) | 70 (28.5%) |
Income Above Poverty by Sex and Age in Virgie
According to the poverty statistics in Virgie, males aged under 5 years and females aged under 5 years are the age groups that are most secure financially, with 100.0% of males and 100.0% of females in these age groups living above the poverty line.
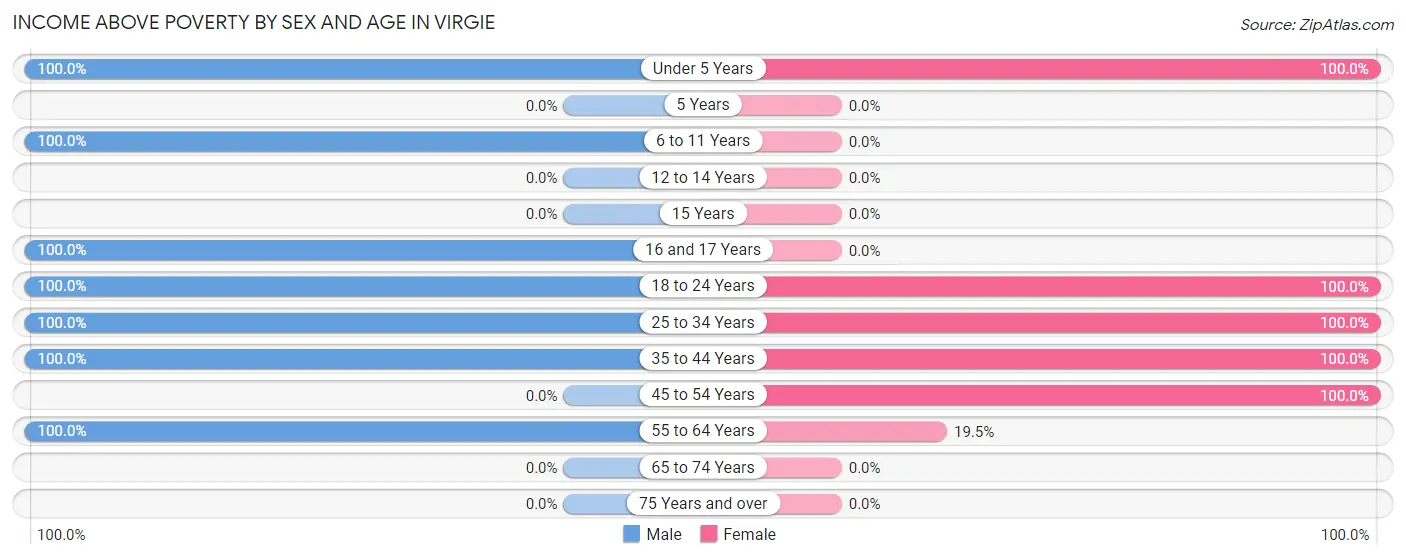
| Age Bracket | Male | Female |
| Under 5 Years | 32 (100.0%) | 14 (100.0%) |
| 5 Years | 0 (0.0%) | 0 (0.0%) |
| 6 to 11 Years | 17 (100.0%) | 0 (0.0%) |
| 12 to 14 Years | 0 (0.0%) | 0 (0.0%) |
| 15 Years | 0 (0.0%) | 0 (0.0%) |
| 16 and 17 Years | 19 (100.0%) | 0 (0.0%) |
| 18 to 24 Years | 24 (100.0%) | 33 (100.0%) |
| 25 to 34 Years | 65 (100.0%) | 61 (100.0%) |
| 35 to 44 Years | 14 (100.0%) | 15 (100.0%) |
| 45 to 54 Years | 0 (0.0%) | 36 (100.0%) |
| 55 to 64 Years | 20 (100.0%) | 17 (19.5%) |
| 65 to 74 Years | 0 (0.0%) | 0 (0.0%) |
| 75 Years and over | 0 (0.0%) | 0 (0.0%) |
| Total | 191 (69.2%) | 176 (71.5%) |
Income Below Poverty Among Married-Couple Families in Virgie
The poverty statistics for married-couple families in Virgie show that 27.7% or 31 of the total 112 families live below the poverty line. Families with 1 or 2 children have the highest poverty rate of 27.7%, comprising of 31 families. On the other hand, families with 1 or 2 children have the lowest poverty rate of 27.7%, which includes 31 families.
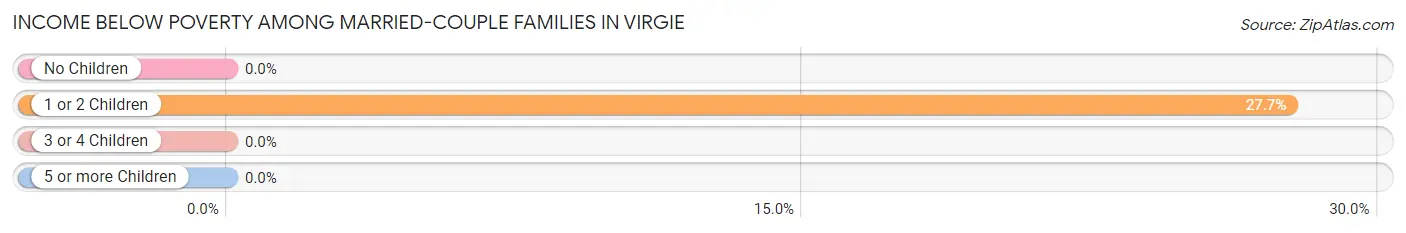
| Children | Above Poverty | Below Poverty |
| No Children | 0 (0.0%) | 0 (0.0%) |
| 1 or 2 Children | 81 (72.3%) | 31 (27.7%) |
| 3 or 4 Children | 0 (0.0%) | 0 (0.0%) |
| 5 or more Children | 0 (0.0%) | 0 (0.0%) |
| Total | 81 (72.3%) | 31 (27.7%) |
Income Below Poverty Among Single-Parent Households in Virgie
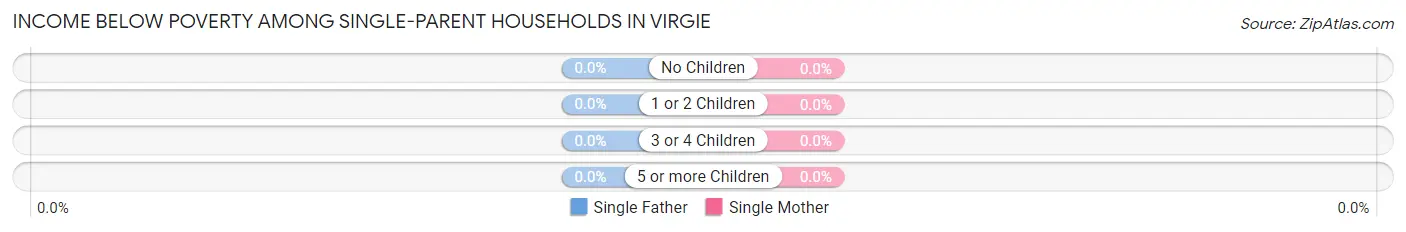
| Children | Single Father | Single Mother |
| No Children | 0 (0.0%) | 0 (0.0%) |
| 1 or 2 Children | 0 (0.0%) | 0 (0.0%) |
| 3 or 4 Children | 0 (0.0%) | 0 (0.0%) |
| 5 or more Children | 0 (0.0%) | 0 (0.0%) |
| Total | 0 (0.0%) | 0 (0.0%) |
Income Below Poverty Among Married-Couple vs Single-Parent Households in Virgie
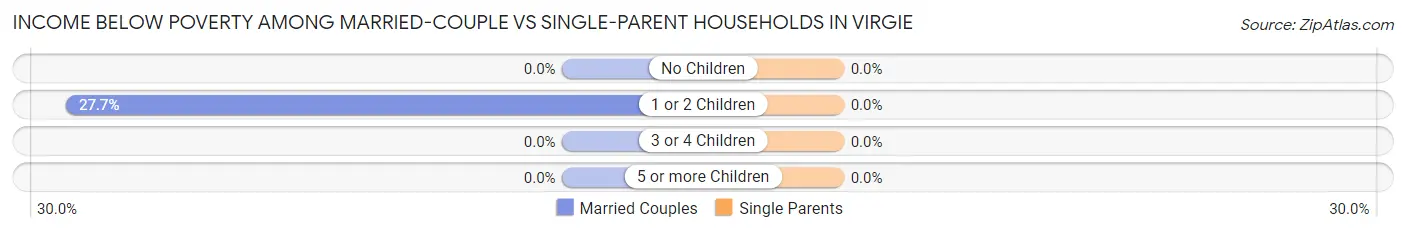
| Children | Married-Couple Families | Single-Parent Households |
| No Children | 0 (0.0%) | 0 (0.0%) |
| 1 or 2 Children | 31 (27.7%) | 0 (0.0%) |
| 3 or 4 Children | 0 (0.0%) | 0 (0.0%) |
| 5 or more Children | 0 (0.0%) | 0 (0.0%) |
| Total | 31 (27.7%) | 0 (0.0%) |
Race in Virgie
The most populous races in Virgie are , and White / Caucasian (522 | 100.0%).
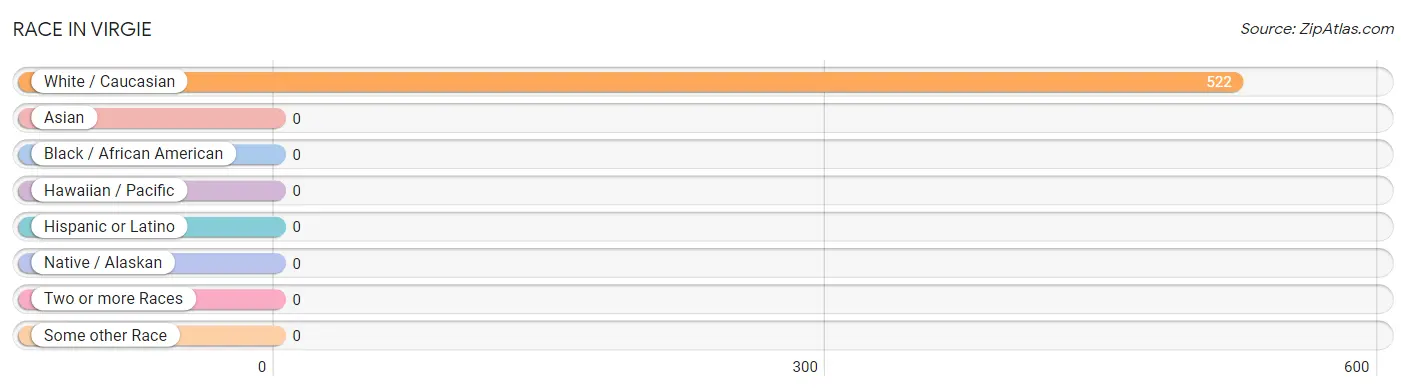
| Race | # Population | % Population |
| Asian | 0 | 0.0% |
| Black / African American | 0 | 0.0% |
| Hawaiian / Pacific | 0 | 0.0% |
| Hispanic or Latino | 0 | 0.0% |
| Native / Alaskan | 0 | 0.0% |
| White / Caucasian | 522 | 100.0% |
| Two or more Races | 0 | 0.0% |
| Some other Race | 0 | 0.0% |
| Total | 522 | 100.0% |
Ancestry in Virgie
The most populous ancestries reported in Virgie are American (285 | 54.6%), and Scottish (83 | 15.9%), together accounting for 70.5% of all Virgie residents.
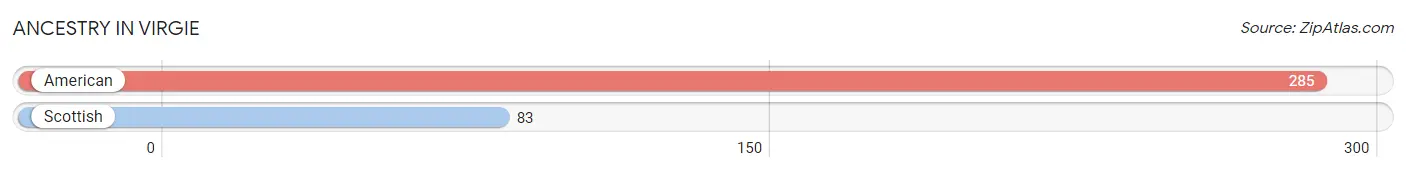
| Ancestry | # Population | % Population |
| American | 285 | 54.6% |
| Scottish | 83 | 15.9% | View All 2 Rows |
Immigrants in Virgie

| Immigration Origin | # Population | % Population | View All 0 Rows |
Sex and Age in Virgie
Sex and Age in Virgie
The most populous age groups in Virgie are 15 to 19 Years (73 | 26.5%) for men and 60 to 64 Years (70 | 28.5%) for women.
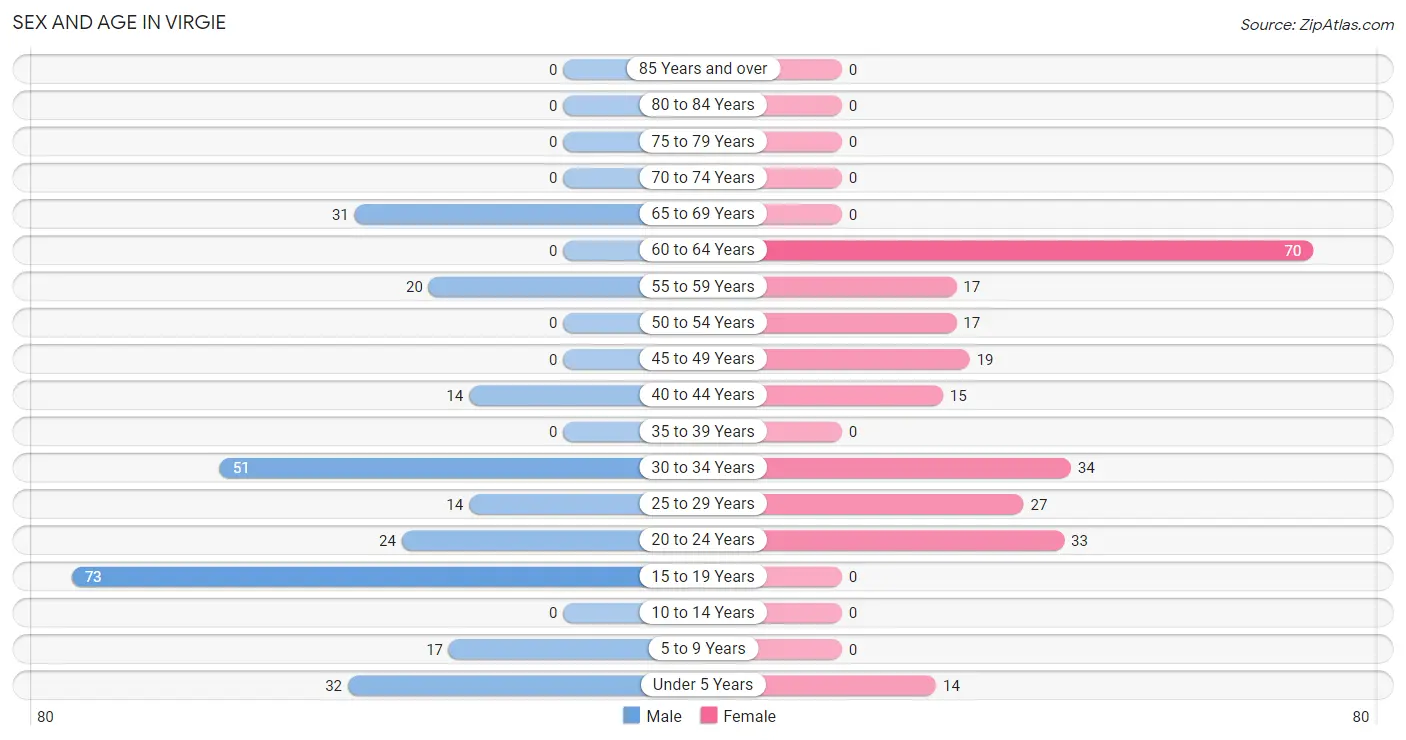
| Age Bracket | Male | Female |
| Under 5 Years | 32 (11.6%) | 14 (5.7%) |
| 5 to 9 Years | 17 (6.2%) | 0 (0.0%) |
| 10 to 14 Years | 0 (0.0%) | 0 (0.0%) |
| 15 to 19 Years | 73 (26.5%) | 0 (0.0%) |
| 20 to 24 Years | 24 (8.7%) | 33 (13.4%) |
| 25 to 29 Years | 14 (5.1%) | 27 (11.0%) |
| 30 to 34 Years | 51 (18.5%) | 34 (13.8%) |
| 35 to 39 Years | 0 (0.0%) | 0 (0.0%) |
| 40 to 44 Years | 14 (5.1%) | 15 (6.1%) |
| 45 to 49 Years | 0 (0.0%) | 19 (7.7%) |
| 50 to 54 Years | 0 (0.0%) | 17 (6.9%) |
| 55 to 59 Years | 20 (7.2%) | 17 (6.9%) |
| 60 to 64 Years | 0 (0.0%) | 70 (28.5%) |
| 65 to 69 Years | 31 (11.2%) | 0 (0.0%) |
| 70 to 74 Years | 0 (0.0%) | 0 (0.0%) |
| 75 to 79 Years | 0 (0.0%) | 0 (0.0%) |
| 80 to 84 Years | 0 (0.0%) | 0 (0.0%) |
| 85 Years and over | 0 (0.0%) | 0 (0.0%) |
| Total | 276 (100.0%) | 246 (100.0%) |
Families and Households in Virgie
Median Family Size in Virgie
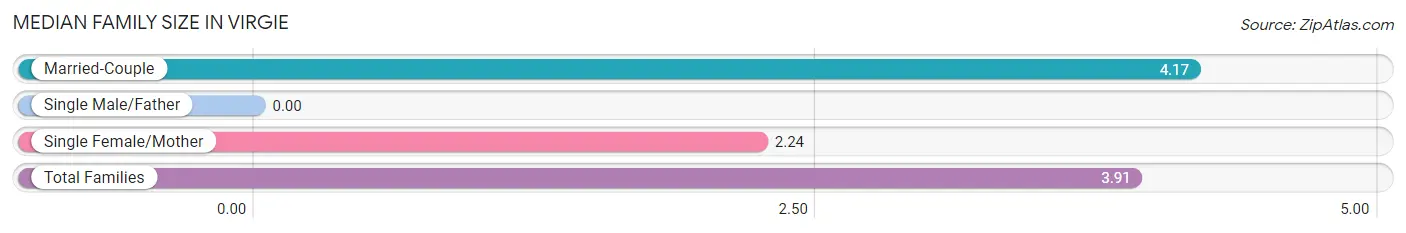
| Family Type | # Families | Family Size |
| Married-Couple | 112 (86.8%) | 4.17 |
| Single Male/Father | 0 (0.0%) | - |
| Single Female/Mother | 17 (13.2%) | 2.24 |
| Total Families | 129 (100.0%) | 3.91 |
Median Household Size in Virgie
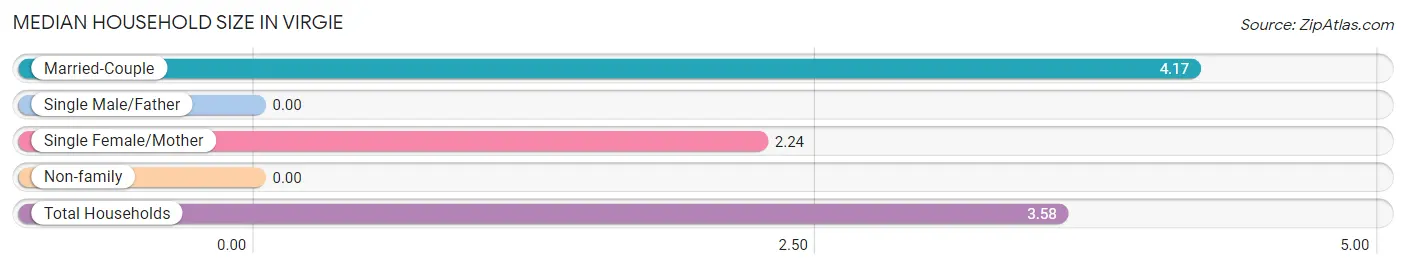
| Household Type | # Households | Household Size |
| Married-Couple | 112 (76.7%) | 4.17 |
| Single Male/Father | 0 (0.0%) | - |
| Single Female/Mother | 17 (11.6%) | 2.24 |
| Non-family | 17 (11.6%) | - |
| Total Households | 146 (100.0%) | 3.58 |
Household Size by Marriage Status in Virgie
Out of a total of 146 households in Virgie, 129 (88.4%) are family households, while 17 (11.6%) are nonfamily households. The most numerous type of family households are 3-person households, comprising 92, and the most common type of nonfamily households are 1-person households, comprising 17.
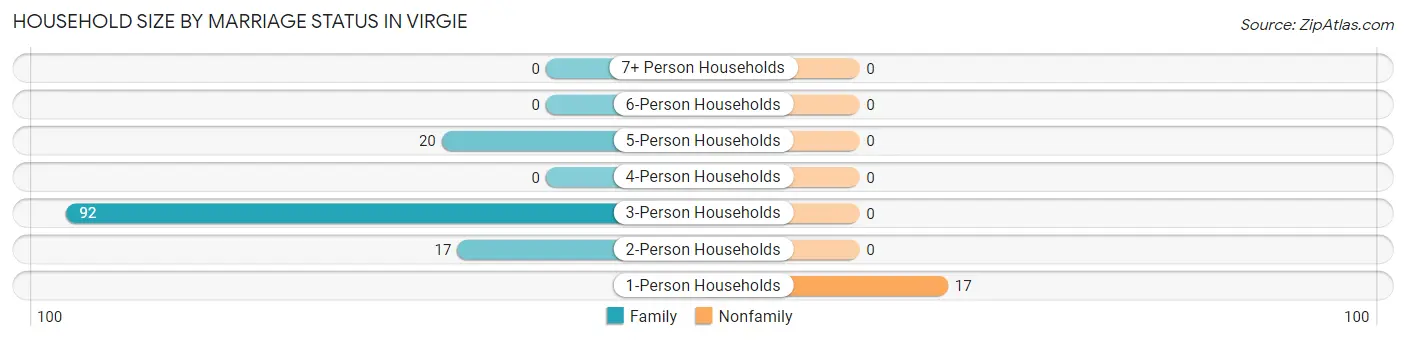
| Household Size | Family Households | Nonfamily Households |
| 1-Person Households | - | 17 (11.6%) |
| 2-Person Households | 17 (11.6%) | 0 (0.0%) |
| 3-Person Households | 92 (63.0%) | 0 (0.0%) |
| 4-Person Households | 0 (0.0%) | 0 (0.0%) |
| 5-Person Households | 20 (13.7%) | 0 (0.0%) |
| 6-Person Households | 0 (0.0%) | 0 (0.0%) |
| 7+ Person Households | 0 (0.0%) | 0 (0.0%) |
| Total | 129 (88.4%) | 17 (11.6%) |
Female Fertility in Virgie
Fertility by Age in Virgie
| Age Bracket | Women with Births | Births / 1,000 Women |
| 15 to 19 years | 0 (0.0%) | 0.0 |
| 20 to 34 years | 0 (0.0%) | 0.0 |
| 35 to 50 years | 0 (0.0%) | 0.0 |
| Total | 0 (0.0%) | 0.0 |
Fertility by Age by Marriage Status in Virgie
| Age Bracket | Married | Unmarried |
| 15 to 19 years | 0 (0.0%) | 0 (0.0%) |
| 20 to 34 years | 0 (0.0%) | 0 (0.0%) |
| 35 to 50 years | 0 (0.0%) | 0 (0.0%) |
| Total | 0 (0.0%) | 0 (0.0%) |
Fertility by Education in Virgie
| Educational Attainment | Women with Births | Births / 1,000 Women |
| Less than High School | 0 (0.0%) | 0.0 |
| High School Diploma | 0 (0.0%) | 0.0 |
| College or Associate's Degree | 0 (0.0%) | 0.0 |
| Bachelor's Degree | 0 (0.0%) | 0.0 |
| Graduate Degree | 0 (0.0%) | 0.0 |
| Total | 0 (0.0%) | 0.0 |
Fertility by Education by Marriage Status in Virgie
| Educational Attainment | Married | Unmarried |
| Less than High School | 0 (0.0%) | 0 (0.0%) |
| High School Diploma | 0 (0.0%) | 0 (0.0%) |
| College or Associate's Degree | 0 (0.0%) | 0 (0.0%) |
| Bachelor's Degree | 0 (0.0%) | 0 (0.0%) |
| Graduate Degree | 0 (0.0%) | 0 (0.0%) |
| Total | 0 (0.0%) | 0 (0.0%) |
Employment Characteristics in Virgie
Employment by Class of Employer in Virgie
Among the 173 employed individuals in Virgie, private company employees (127 | 73.4%), not-for-profit organizations (34 | 19.7%), and local government employees (12 | 6.9%) make up the most common classes of employment.
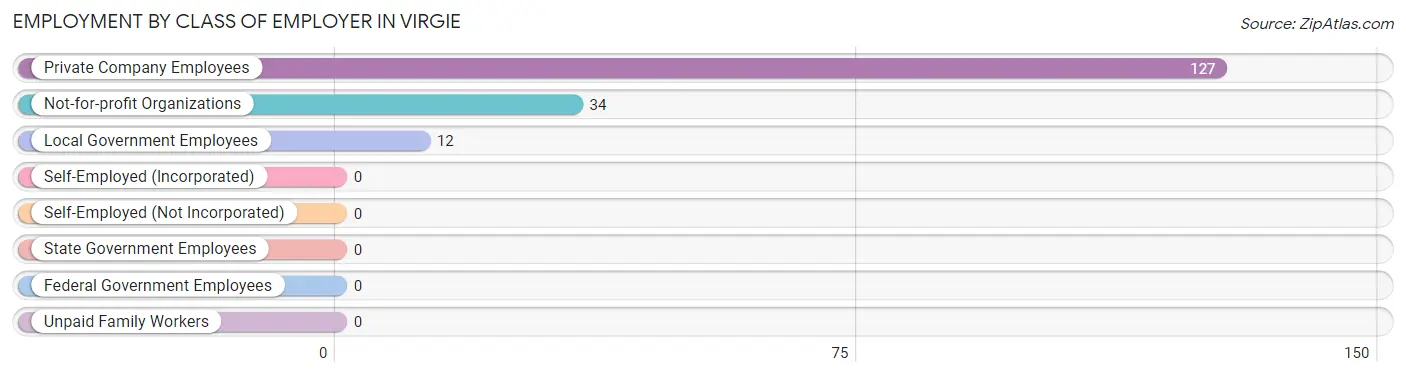
| Employer Class | # Employees | % Employees |
| Private Company Employees | 127 | 73.4% |
| Self-Employed (Incorporated) | 0 | 0.0% |
| Self-Employed (Not Incorporated) | 0 | 0.0% |
| Not-for-profit Organizations | 34 | 19.7% |
| Local Government Employees | 12 | 6.9% |
| State Government Employees | 0 | 0.0% |
| Federal Government Employees | 0 | 0.0% |
| Unpaid Family Workers | 0 | 0.0% |
| Total | 173 | 100.0% |
Employment Status by Age in Virgie
According to the labor force statistics for Virgie, out of the total population over 16 years of age (405), 53.3% or 216 individuals are in the labor force, with 11.1% or 24 of them unemployed. The age group with the highest labor force participation rate is 20 to 24 years, with 100.0% or 57 individuals in the labor force. Within the labor force, the 20 to 24 years age range has the highest percentage of unemployed individuals, with 42.1% or 24 of them being unemployed.
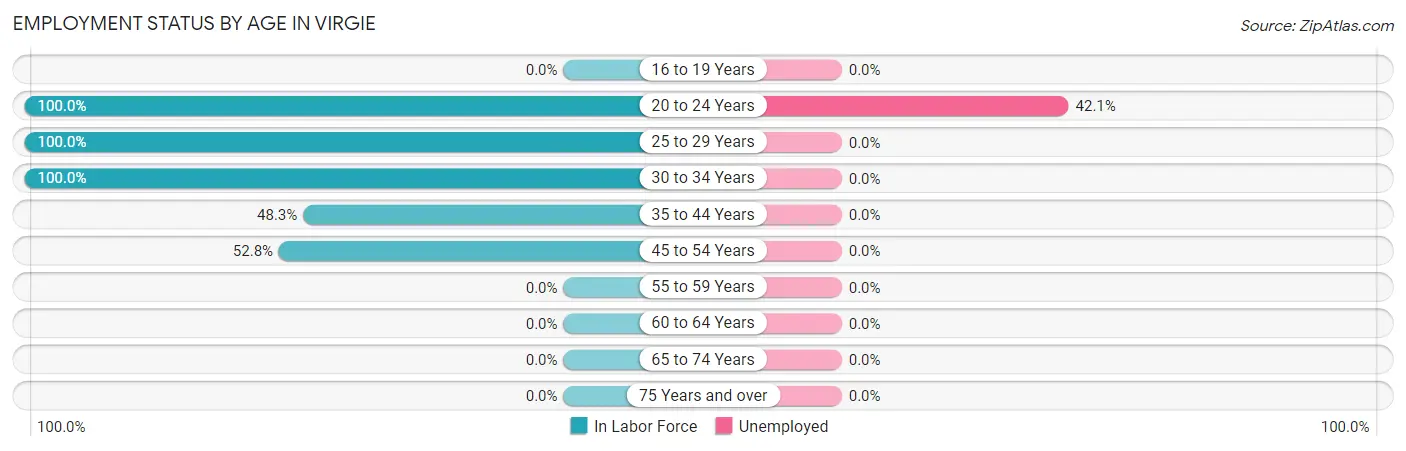
| Age Bracket | In Labor Force | Unemployed |
| 16 to 19 Years | 0 (0.0%) | 0 (0.0%) |
| 20 to 24 Years | 57 (100.0%) | 24 (42.1%) |
| 25 to 29 Years | 41 (100.0%) | 0 (0.0%) |
| 30 to 34 Years | 85 (100.0%) | 0 (0.0%) |
| 35 to 44 Years | 14 (48.3%) | 0 (0.0%) |
| 45 to 54 Years | 19 (52.8%) | 0 (0.0%) |
| 55 to 59 Years | 0 (0.0%) | 0 (0.0%) |
| 60 to 64 Years | 0 (0.0%) | 0 (0.0%) |
| 65 to 74 Years | 0 (0.0%) | 0 (0.0%) |
| 75 Years and over | 0 (0.0%) | 0 (0.0%) |
| Total | 216 (53.3%) | 24 (11.1%) |
Employment Status by Educational Attainment in Virgie
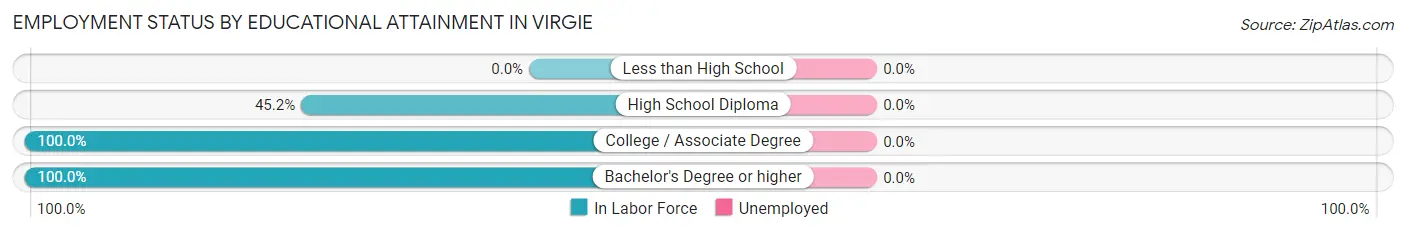
| Educational Attainment | In Labor Force | Unemployed |
| Less than High School | 0 (0.0%) | 0 (0.0%) |
| High School Diploma | 28 (45.2%) | 0 (0.0%) |
| College / Associate Degree | 97 (100.0%) | 0 (0.0%) |
| Bachelor's Degree or higher | 34 (100.0%) | 0 (0.0%) |
| Total | 159 (53.4%) | 0 (0.0%) |
Employment Occupations by Sex in Virgie
Management, Business, Science and Arts Occupations
The most common Management, Business, Science and Arts occupations in Virgie are Health Diagnosing & Treating (34 | 17.7%), Health Technologists (34 | 17.7%), Computers, Engineering & Science (19 | 9.9%), and Computers & Mathematics (19 | 9.9%).
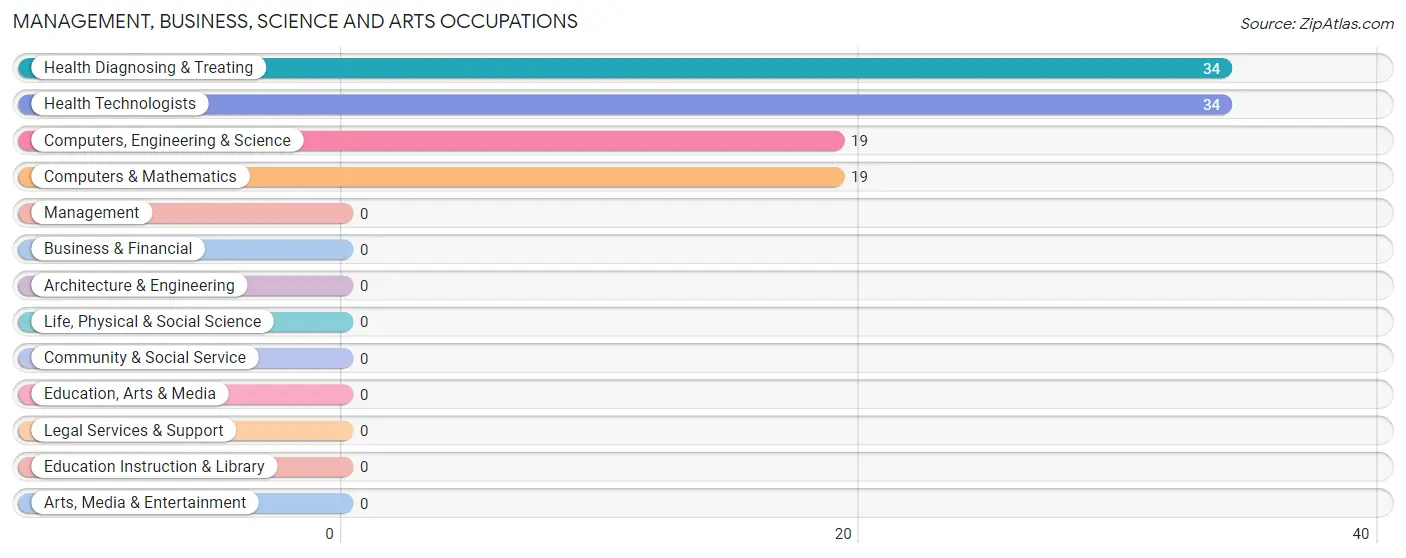
Management, Business, Science and Arts Occupations by Sex
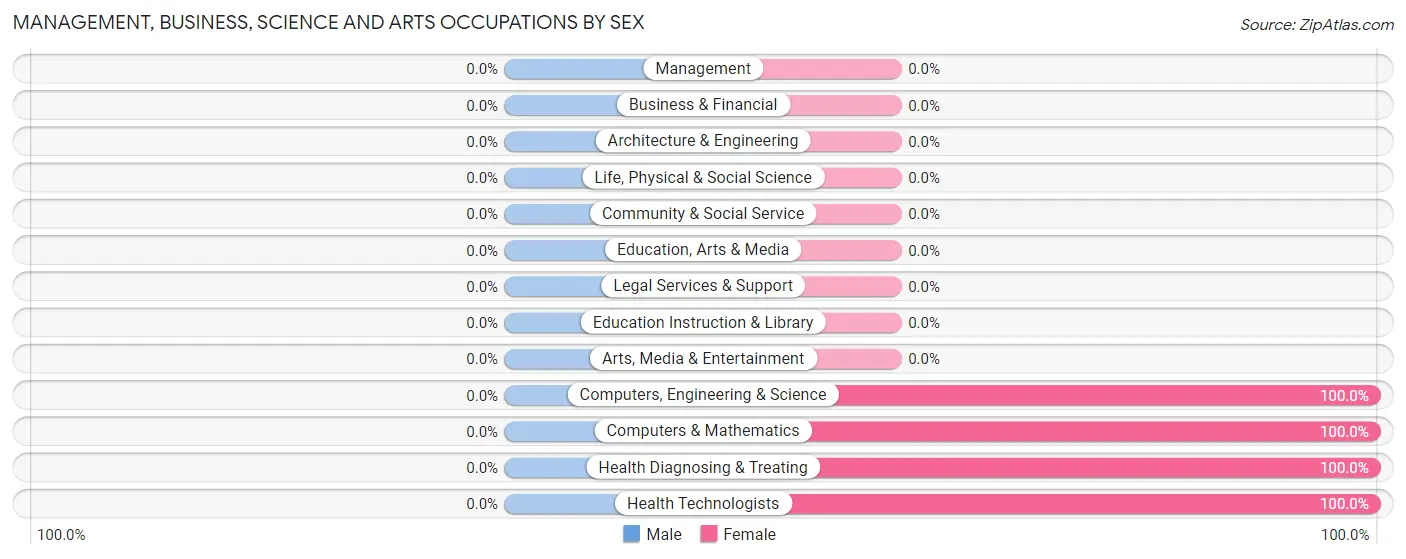
| Occupation | Male | Female |
| Management | 0 (0.0%) | 0 (0.0%) |
| Business & Financial | 0 (0.0%) | 0 (0.0%) |
| Computers, Engineering & Science | 0 (0.0%) | 19 (100.0%) |
| Computers & Mathematics | 0 (0.0%) | 19 (100.0%) |
| Architecture & Engineering | 0 (0.0%) | 0 (0.0%) |
| Life, Physical & Social Science | 0 (0.0%) | 0 (0.0%) |
| Community & Social Service | 0 (0.0%) | 0 (0.0%) |
| Education, Arts & Media | 0 (0.0%) | 0 (0.0%) |
| Legal Services & Support | 0 (0.0%) | 0 (0.0%) |
| Education Instruction & Library | 0 (0.0%) | 0 (0.0%) |
| Arts, Media & Entertainment | 0 (0.0%) | 0 (0.0%) |
| Health Diagnosing & Treating | 0 (0.0%) | 34 (100.0%) |
| Health Technologists | 0 (0.0%) | 34 (100.0%) |
| Total (Category) | 0 (0.0%) | 53 (100.0%) |
| Total (Overall) | 79 (41.1%) | 113 (58.9%) |
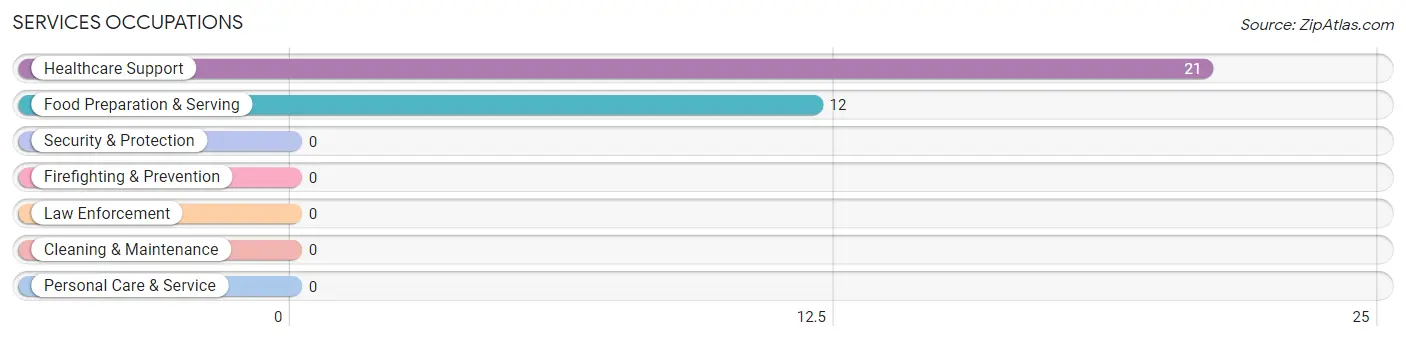
Services Occupations
The most common Services occupations in Virgie are Healthcare Support (21 | 10.9%), and Food Preparation & Serving (12 | 6.2%).
Services Occupations by Sex
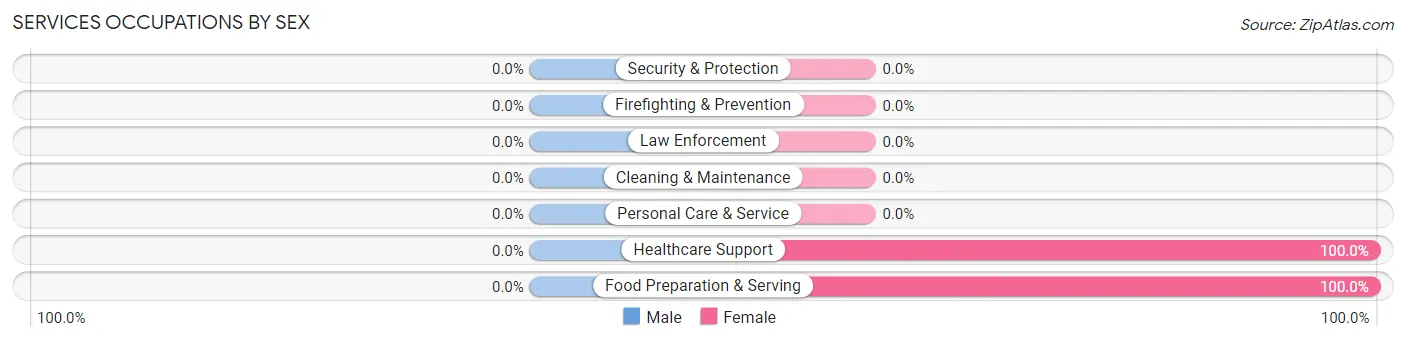
| Occupation | Male | Female |
| Healthcare Support | 0 (0.0%) | 21 (100.0%) |
| Security & Protection | 0 (0.0%) | 0 (0.0%) |
| Firefighting & Prevention | 0 (0.0%) | 0 (0.0%) |
| Law Enforcement | 0 (0.0%) | 0 (0.0%) |
| Food Preparation & Serving | 0 (0.0%) | 12 (100.0%) |
| Cleaning & Maintenance | 0 (0.0%) | 0 (0.0%) |
| Personal Care & Service | 0 (0.0%) | 0 (0.0%) |
| Total (Category) | 0 (0.0%) | 33 (100.0%) |
| Total (Overall) | 79 (41.1%) | 113 (58.9%) |
Sales and Office Occupations
The most common Sales and Office occupations in Virgie are , and Sales & Related (78 | 40.6%).
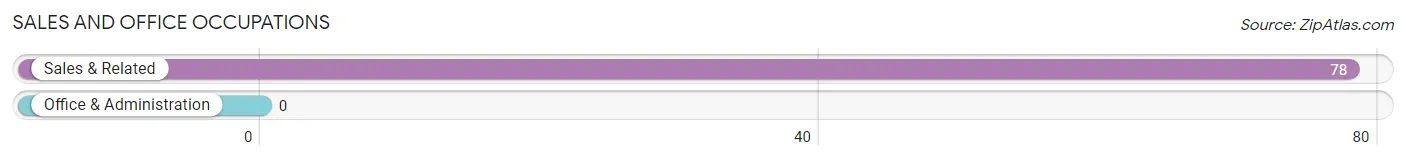
Sales and Office Occupations by Sex
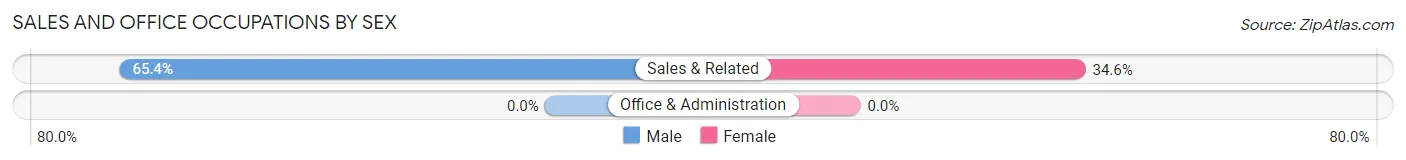
| Occupation | Male | Female |
| Sales & Related | 51 (65.4%) | 27 (34.6%) |
| Office & Administration | 0 (0.0%) | 0 (0.0%) |
| Total (Category) | 51 (65.4%) | 27 (34.6%) |
| Total (Overall) | 79 (41.1%) | 113 (58.9%) |
Natural Resources, Construction and Maintenance Occupations
The most common Natural Resources, Construction and Maintenance occupations in Virgie are , and Installation, Maintenance & Repair (28 | 14.6%).
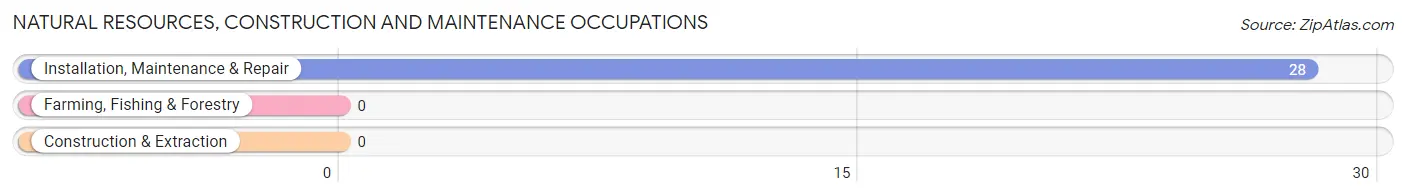
Natural Resources, Construction and Maintenance Occupations by Sex

| Occupation | Male | Female |
| Farming, Fishing & Forestry | 0 (0.0%) | 0 (0.0%) |
| Construction & Extraction | 0 (0.0%) | 0 (0.0%) |
| Installation, Maintenance & Repair | 28 (100.0%) | 0 (0.0%) |
| Total (Category) | 28 (100.0%) | 0 (0.0%) |
| Total (Overall) | 79 (41.1%) | 113 (58.9%) |
Production, Transportation and Moving Occupations
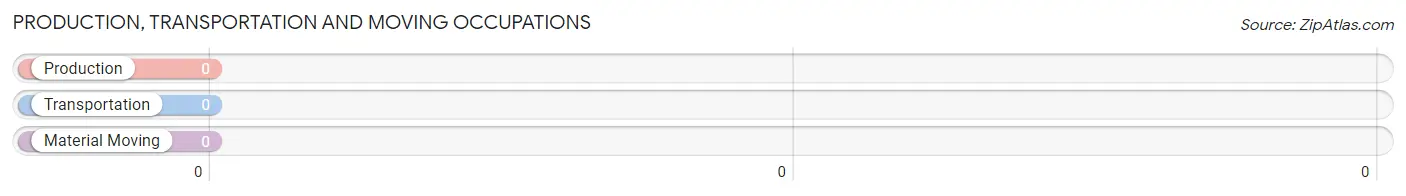
Production, Transportation and Moving Occupations by Sex
| Occupation | Male | Female |
| Production | 0 (0.0%) | 0 (0.0%) |
| Transportation | 0 (0.0%) | 0 (0.0%) |
| Material Moving | 0 (0.0%) | 0 (0.0%) |
| Total (Category) | 0 (0.0%) | 0 (0.0%) |
| Total (Overall) | 79 (41.1%) | 113 (58.9%) |
Employment Industries by Sex in Virgie
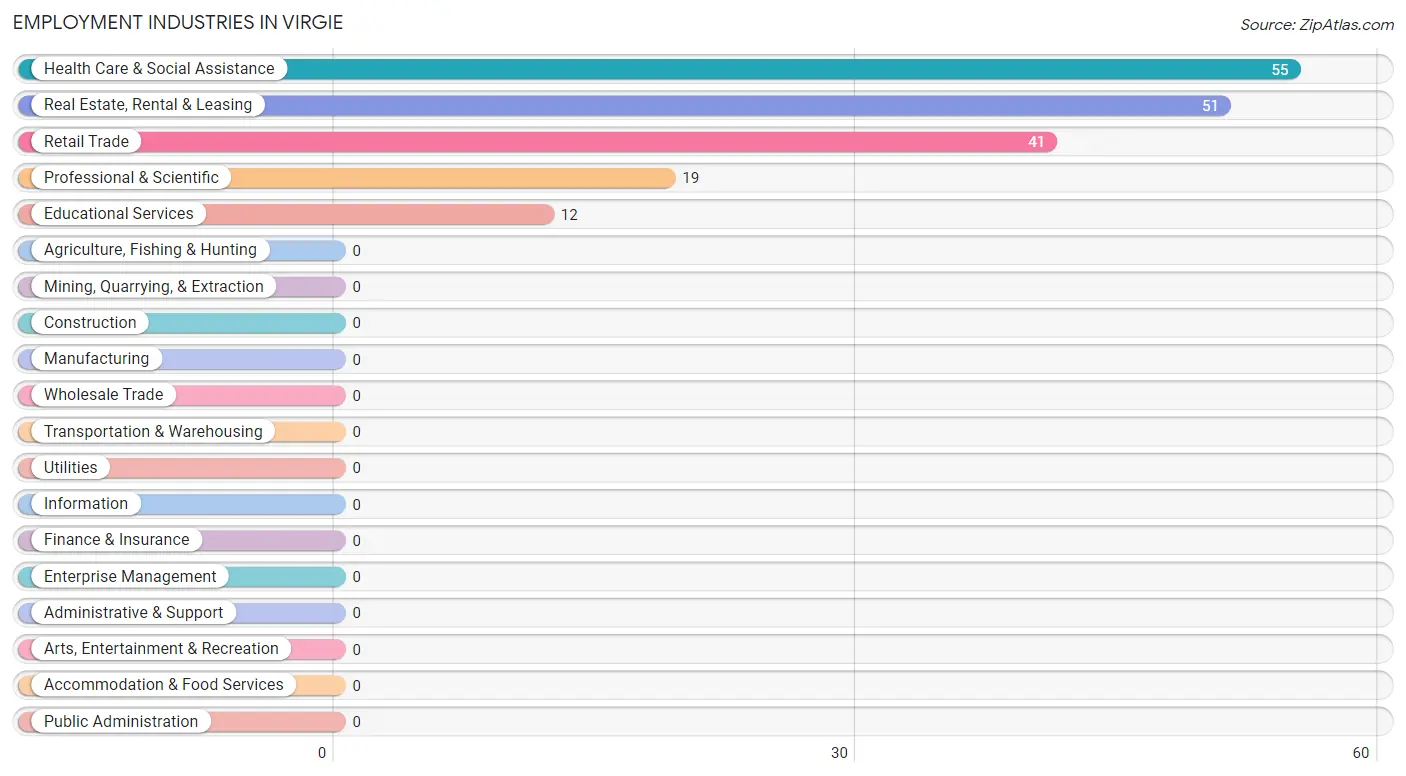
Employment Industries in Virgie
The major employment industries in Virgie include Health Care & Social Assistance (55 | 28.6%), Real Estate, Rental & Leasing (51 | 26.6%), Retail Trade (41 | 21.3%), Professional & Scientific (19 | 9.9%), and Educational Services (12 | 6.2%).
Employment Industries by Sex in Virgie
The Virgie industries that see more men than women are Real Estate, Rental & Leasing (100.0%), and Retail Trade (34.2%), whereas the industries that tend to have a higher number of women are Professional & Scientific (100.0%), Educational Services (100.0%), and Health Care & Social Assistance (100.0%).
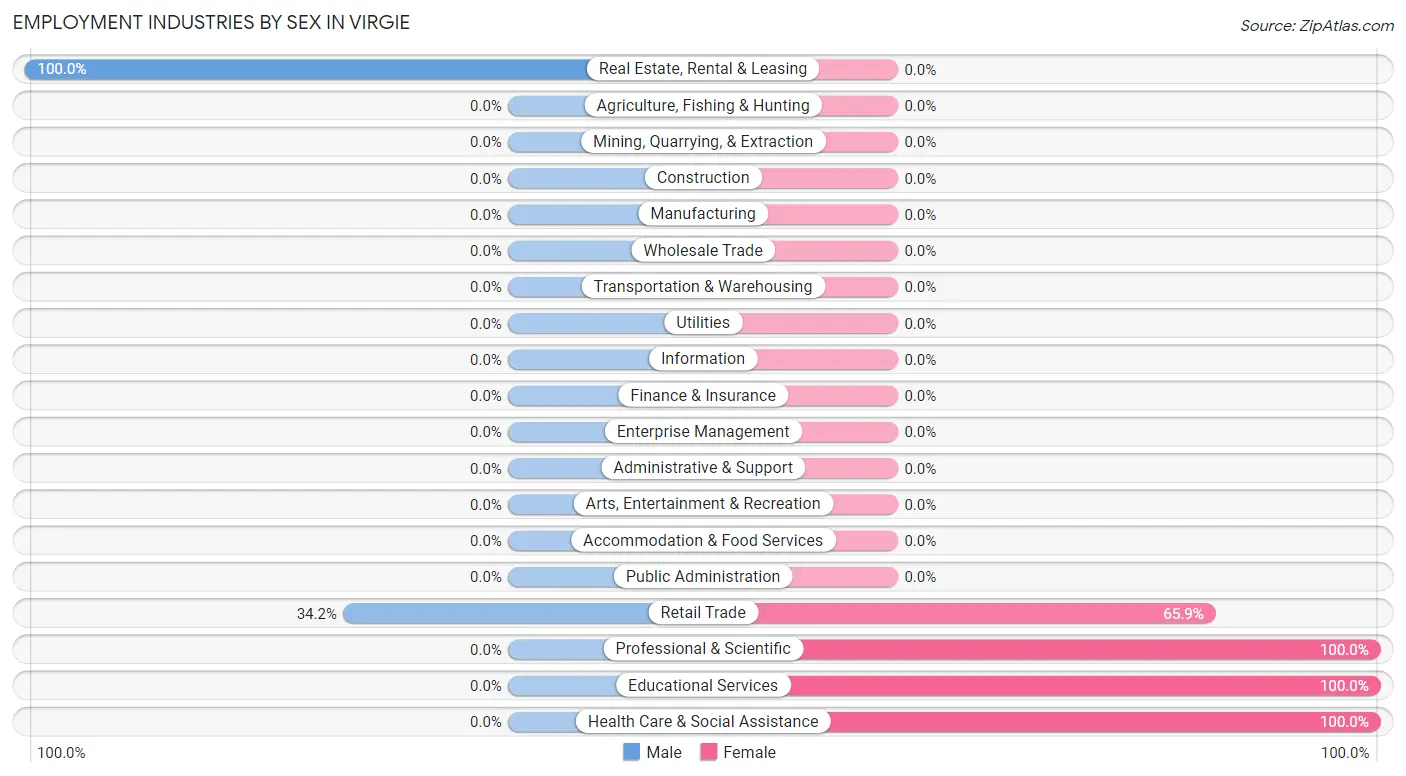
| Industry | Male | Female |
| Agriculture, Fishing & Hunting | 0 (0.0%) | 0 (0.0%) |
| Mining, Quarrying, & Extraction | 0 (0.0%) | 0 (0.0%) |
| Construction | 0 (0.0%) | 0 (0.0%) |
| Manufacturing | 0 (0.0%) | 0 (0.0%) |
| Wholesale Trade | 0 (0.0%) | 0 (0.0%) |
| Retail Trade | 14 (34.2%) | 27 (65.8%) |
| Transportation & Warehousing | 0 (0.0%) | 0 (0.0%) |
| Utilities | 0 (0.0%) | 0 (0.0%) |
| Information | 0 (0.0%) | 0 (0.0%) |
| Finance & Insurance | 0 (0.0%) | 0 (0.0%) |
| Real Estate, Rental & Leasing | 51 (100.0%) | 0 (0.0%) |
| Professional & Scientific | 0 (0.0%) | 19 (100.0%) |
| Enterprise Management | 0 (0.0%) | 0 (0.0%) |
| Administrative & Support | 0 (0.0%) | 0 (0.0%) |
| Educational Services | 0 (0.0%) | 12 (100.0%) |
| Health Care & Social Assistance | 0 (0.0%) | 55 (100.0%) |
| Arts, Entertainment & Recreation | 0 (0.0%) | 0 (0.0%) |
| Accommodation & Food Services | 0 (0.0%) | 0 (0.0%) |
| Public Administration | 0 (0.0%) | 0 (0.0%) |
| Total | 79 (41.1%) | 113 (58.9%) |
Education in Virgie
School Enrollment in Virgie
The most common levels of schooling among the 145 students in Virgie are high school (73 | 50.3%), graduate / professional (55 | 37.9%), and elementary school (17 | 11.7%).
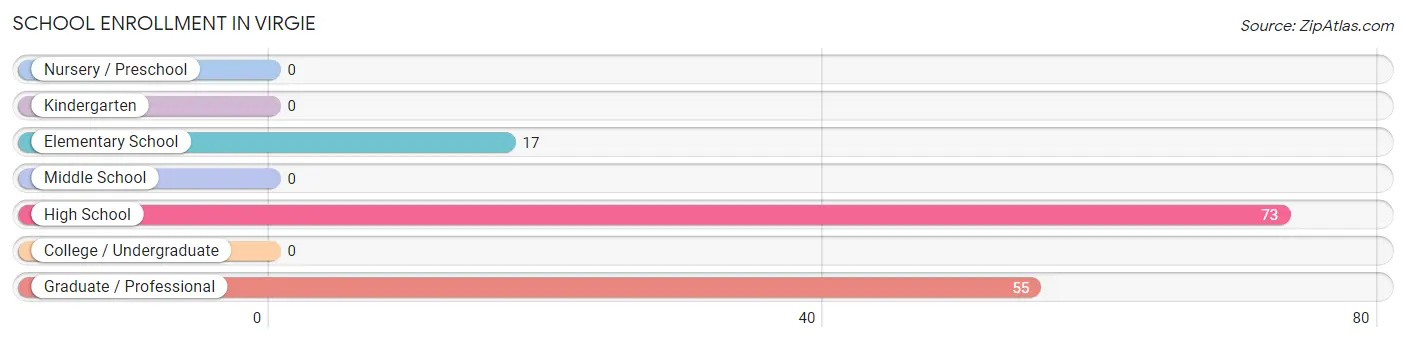
| School Level | # Students | % Students |
| Nursery / Preschool | 0 | 0.0% |
| Kindergarten | 0 | 0.0% |
| Elementary School | 17 | 11.7% |
| Middle School | 0 | 0.0% |
| High School | 73 | 50.3% |
| College / Undergraduate | 0 | 0.0% |
| Graduate / Professional | 55 | 37.9% |
| Total | 145 | 100.0% |
School Enrollment by Age by Funding Source in Virgie
Out of a total of 145 students who are enrolled in schools in Virgie, 53 (36.6%) attend a private institution, while the remaining 92 (63.4%) are enrolled in public schools. The age group of 25 to 34 year olds has the highest likelihood of being enrolled in private schools, with 34 (100.0% in the age bracket) enrolled. Conversely, the age group of 5 to 9 year old has the lowest likelihood of being enrolled in a private school, with 17 (100.0% in the age bracket) attending a public institution.
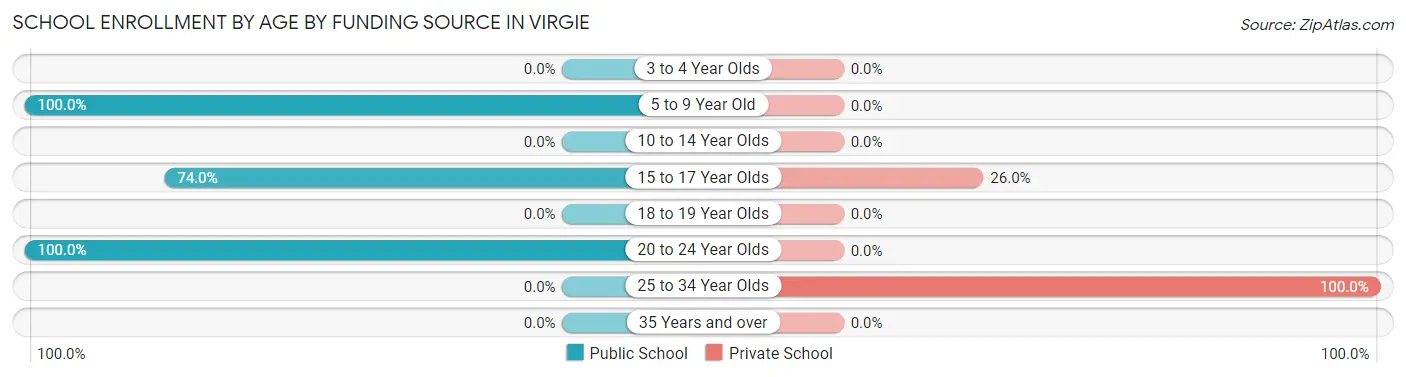
| Age Bracket | Public School | Private School |
| 3 to 4 Year Olds | 0 (0.0%) | 0 (0.0%) |
| 5 to 9 Year Old | 17 (100.0%) | 0 (0.0%) |
| 10 to 14 Year Olds | 0 (0.0%) | 0 (0.0%) |
| 15 to 17 Year Olds | 54 (74.0%) | 19 (26.0%) |
| 18 to 19 Year Olds | 0 (0.0%) | 0 (0.0%) |
| 20 to 24 Year Olds | 21 (100.0%) | 0 (0.0%) |
| 25 to 34 Year Olds | 0 (0.0%) | 34 (100.0%) |
| 35 Years and over | 0 (0.0%) | 0 (0.0%) |
| Total | 92 (63.4%) | 53 (36.6%) |
Educational Attainment by Field of Study in Virgie
, and science & technology (34 | 100.0%) are the most common fields of study among 34 individuals in Virgie who have obtained a bachelor's degree or higher.
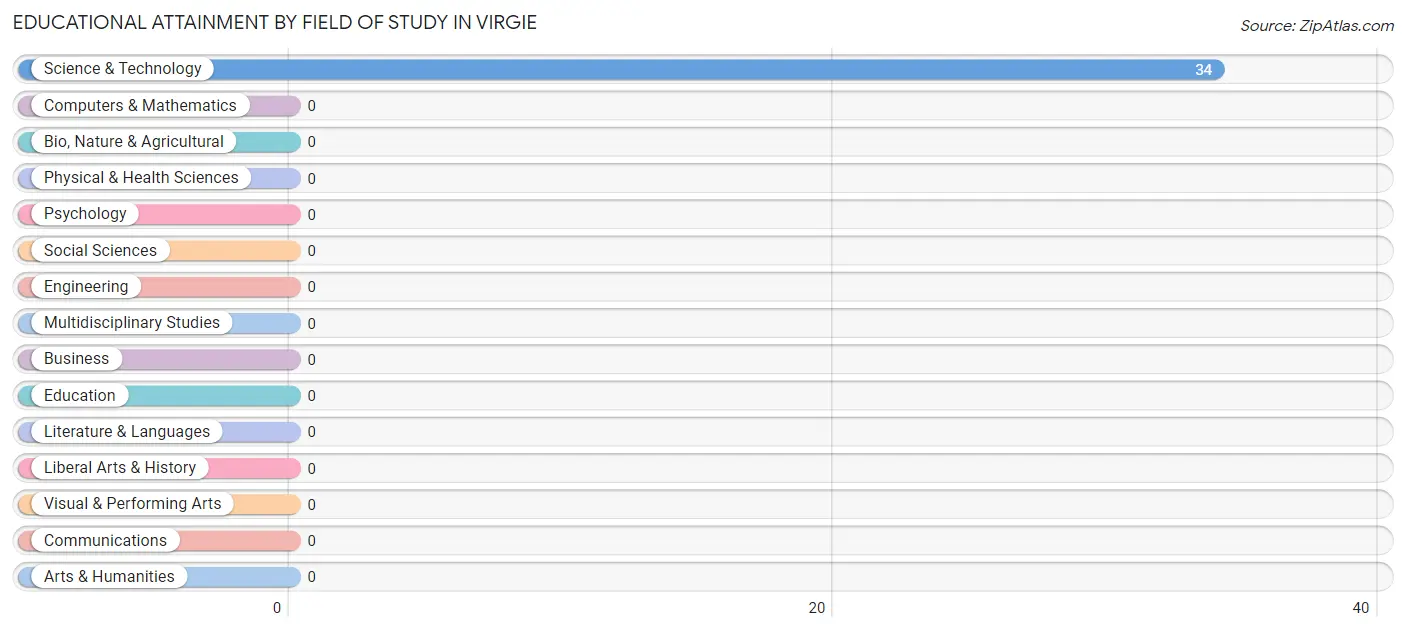
| Field of Study | # Graduates | % Graduates |
| Computers & Mathematics | 0 | 0.0% |
| Bio, Nature & Agricultural | 0 | 0.0% |
| Physical & Health Sciences | 0 | 0.0% |
| Psychology | 0 | 0.0% |
| Social Sciences | 0 | 0.0% |
| Engineering | 0 | 0.0% |
| Multidisciplinary Studies | 0 | 0.0% |
| Science & Technology | 34 | 100.0% |
| Business | 0 | 0.0% |
| Education | 0 | 0.0% |
| Literature & Languages | 0 | 0.0% |
| Liberal Arts & History | 0 | 0.0% |
| Visual & Performing Arts | 0 | 0.0% |
| Communications | 0 | 0.0% |
| Arts & Humanities | 0 | 0.0% |
| Total | 34 | 100.0% |
Transportation & Commute in Virgie
Vehicle Availability by Sex in Virgie
The most prevalent vehicle ownership categories in Virgie are males with 2 vehicles (65, accounting for 82.3%) and females with 2 vehicles (55, making up 69.2%).
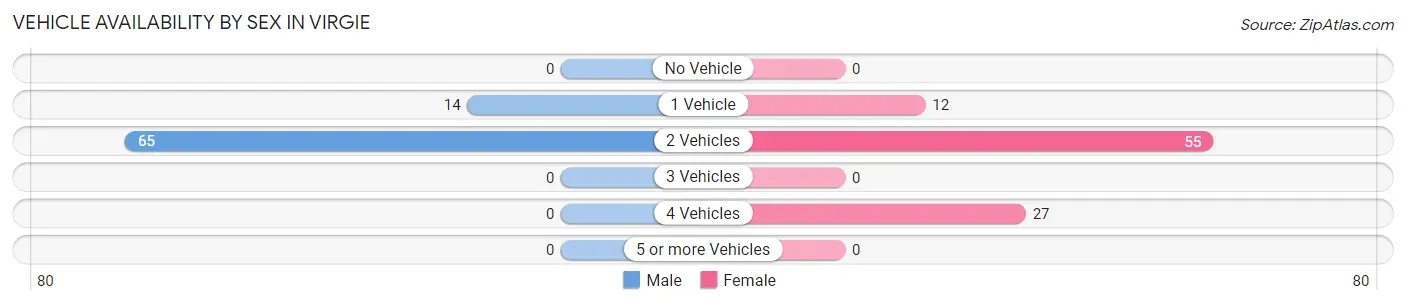
| Vehicles Available | Male | Female |
| No Vehicle | 0 (0.0%) | 0 (0.0%) |
| 1 Vehicle | 14 (17.7%) | 12 (12.8%) |
| 2 Vehicles | 65 (82.3%) | 55 (58.5%) |
| 3 Vehicles | 0 (0.0%) | 0 (0.0%) |
| 4 Vehicles | 0 (0.0%) | 27 (28.7%) |
| 5 or more Vehicles | 0 (0.0%) | 0 (0.0%) |
| Total | 79 (100.0%) | 94 (100.0%) |
Commute Time in Virgie
The most frequently occuring commute durations in Virgie are 20 to 24 minutes (85 commuters, 49.1%), 30 to 34 minutes (41 commuters, 23.7%), and 35 to 39 minutes (21 commuters, 12.1%).
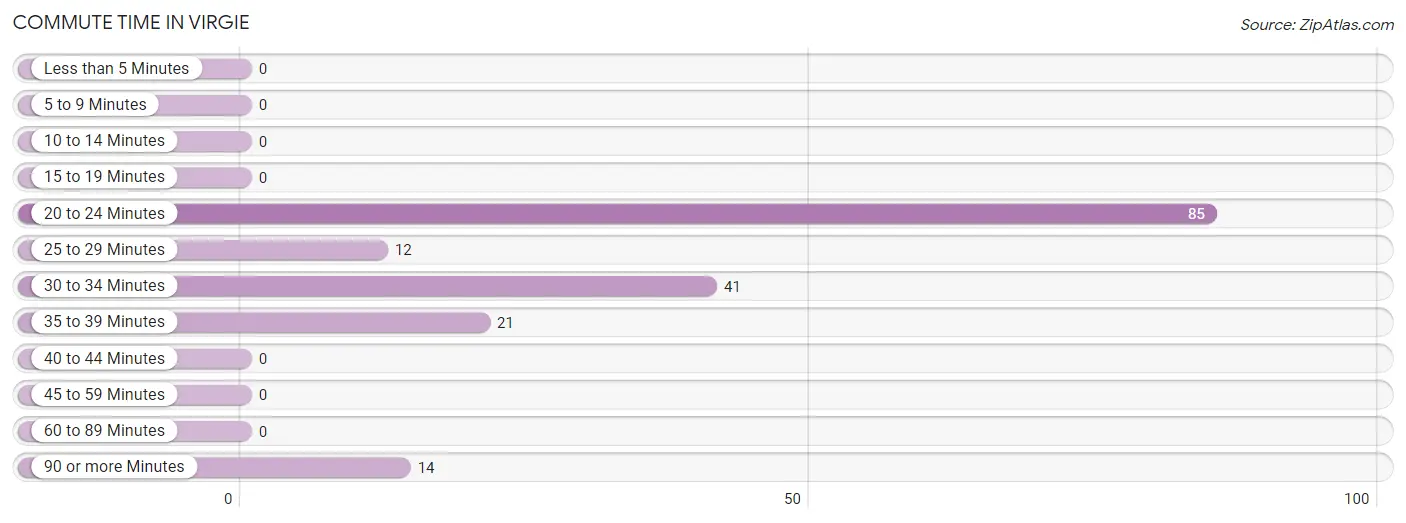
| Commute Time | # Commuters | % Commuters |
| Less than 5 Minutes | 0 | 0.0% |
| 5 to 9 Minutes | 0 | 0.0% |
| 10 to 14 Minutes | 0 | 0.0% |
| 15 to 19 Minutes | 0 | 0.0% |
| 20 to 24 Minutes | 85 | 49.1% |
| 25 to 29 Minutes | 12 | 6.9% |
| 30 to 34 Minutes | 41 | 23.7% |
| 35 to 39 Minutes | 21 | 12.1% |
| 40 to 44 Minutes | 0 | 0.0% |
| 45 to 59 Minutes | 0 | 0.0% |
| 60 to 89 Minutes | 0 | 0.0% |
| 90 or more Minutes | 14 | 8.1% |
Commute Time by Sex in Virgie
The most common commute times in Virgie are 20 to 24 minutes (51 commuters, 64.6%) for males and 20 to 24 minutes (34 commuters, 36.2%) for females.
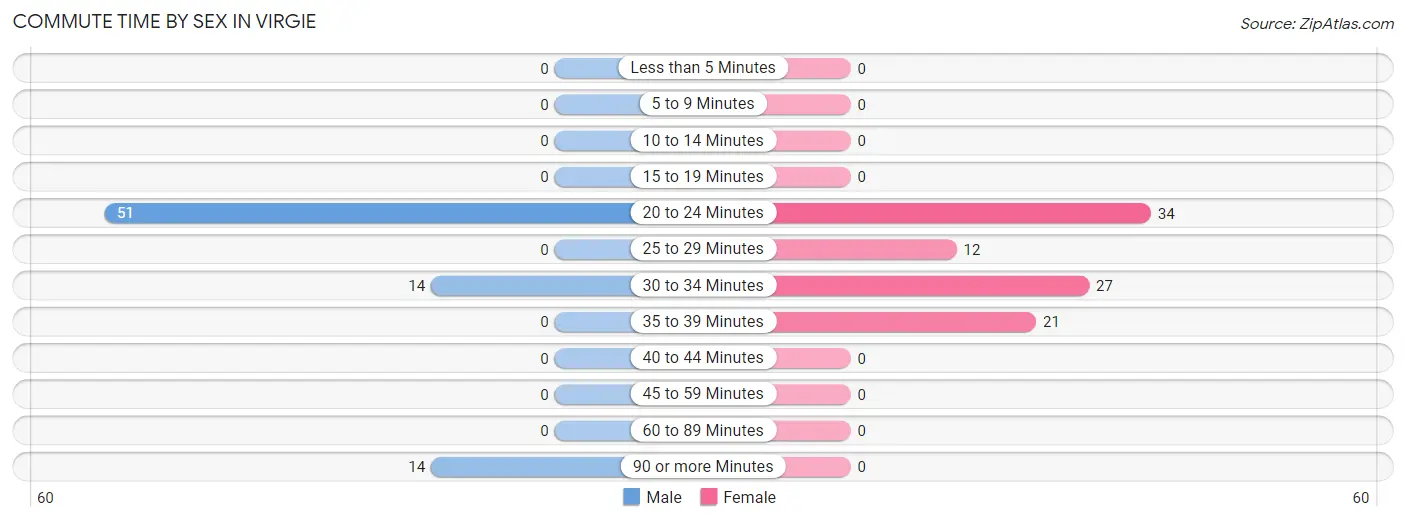
| Commute Time | Male | Female |
| Less than 5 Minutes | 0 (0.0%) | 0 (0.0%) |
| 5 to 9 Minutes | 0 (0.0%) | 0 (0.0%) |
| 10 to 14 Minutes | 0 (0.0%) | 0 (0.0%) |
| 15 to 19 Minutes | 0 (0.0%) | 0 (0.0%) |
| 20 to 24 Minutes | 51 (64.6%) | 34 (36.2%) |
| 25 to 29 Minutes | 0 (0.0%) | 12 (12.8%) |
| 30 to 34 Minutes | 14 (17.7%) | 27 (28.7%) |
| 35 to 39 Minutes | 0 (0.0%) | 21 (22.3%) |
| 40 to 44 Minutes | 0 (0.0%) | 0 (0.0%) |
| 45 to 59 Minutes | 0 (0.0%) | 0 (0.0%) |
| 60 to 89 Minutes | 0 (0.0%) | 0 (0.0%) |
| 90 or more Minutes | 14 (17.7%) | 0 (0.0%) |
Time of Departure to Work by Sex in Virgie
The most frequent times of departure to work in Virgie are 7:30 AM to 7:59 AM (51, 64.6%) for males and 7:00 AM to 7:29 AM (48, 51.1%) for females.
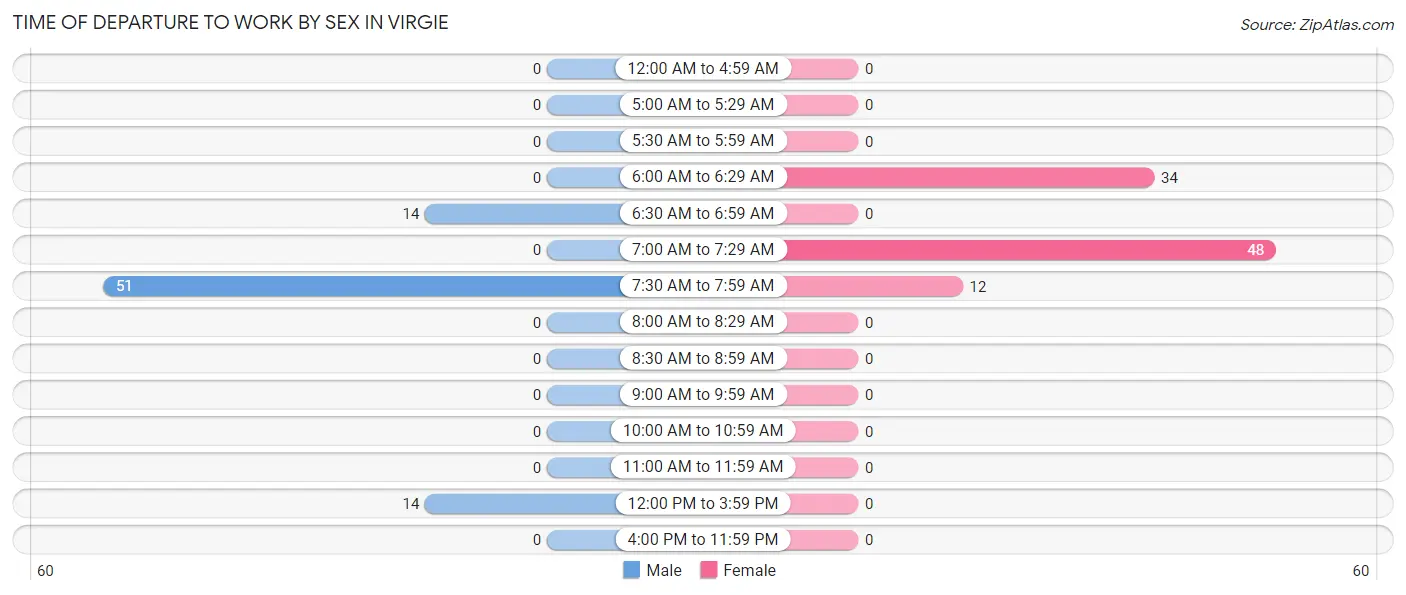
| Time of Departure | Male | Female |
| 12:00 AM to 4:59 AM | 0 (0.0%) | 0 (0.0%) |
| 5:00 AM to 5:29 AM | 0 (0.0%) | 0 (0.0%) |
| 5:30 AM to 5:59 AM | 0 (0.0%) | 0 (0.0%) |
| 6:00 AM to 6:29 AM | 0 (0.0%) | 34 (36.2%) |
| 6:30 AM to 6:59 AM | 14 (17.7%) | 0 (0.0%) |
| 7:00 AM to 7:29 AM | 0 (0.0%) | 48 (51.1%) |
| 7:30 AM to 7:59 AM | 51 (64.6%) | 12 (12.8%) |
| 8:00 AM to 8:29 AM | 0 (0.0%) | 0 (0.0%) |
| 8:30 AM to 8:59 AM | 0 (0.0%) | 0 (0.0%) |
| 9:00 AM to 9:59 AM | 0 (0.0%) | 0 (0.0%) |
| 10:00 AM to 10:59 AM | 0 (0.0%) | 0 (0.0%) |
| 11:00 AM to 11:59 AM | 0 (0.0%) | 0 (0.0%) |
| 12:00 PM to 3:59 PM | 14 (17.7%) | 0 (0.0%) |
| 4:00 PM to 11:59 PM | 0 (0.0%) | 0 (0.0%) |
| Total | 79 (100.0%) | 94 (100.0%) |
Housing Occupancy in Virgie
Occupancy by Ownership in Virgie
Of the total 146 dwellings in Virgie, owner-occupied units account for 146 (100.0%), while renter-occupied units make up 0 (0.0%).
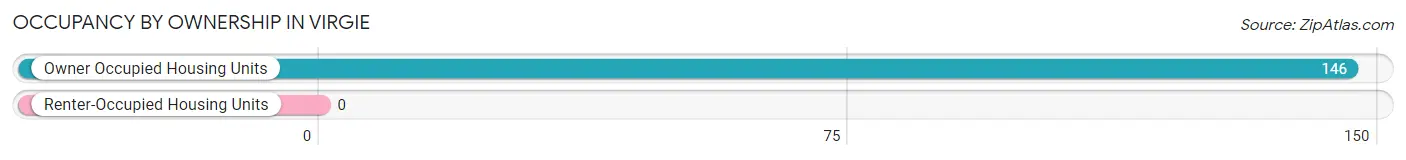
| Occupancy | # Housing Units | % Housing Units |
| Owner Occupied Housing Units | 146 | 100.0% |
| Renter-Occupied Housing Units | 0 | 0.0% |
| Total Occupied Housing Units | 146 | 100.0% |
Occupancy by Household Size in Virgie
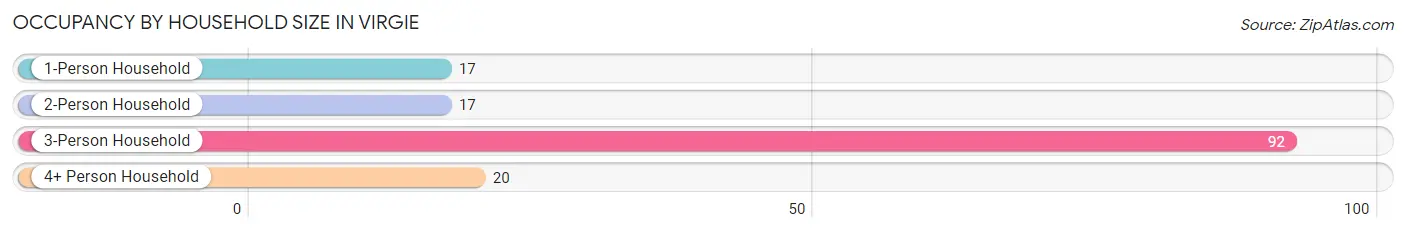
| Household Size | # Housing Units | % Housing Units |
| 1-Person Household | 17 | 11.6% |
| 2-Person Household | 17 | 11.6% |
| 3-Person Household | 92 | 63.0% |
| 4+ Person Household | 20 | 13.7% |
| Total Housing Units | 146 | 100.0% |
Occupancy by Ownership by Household Size in Virgie
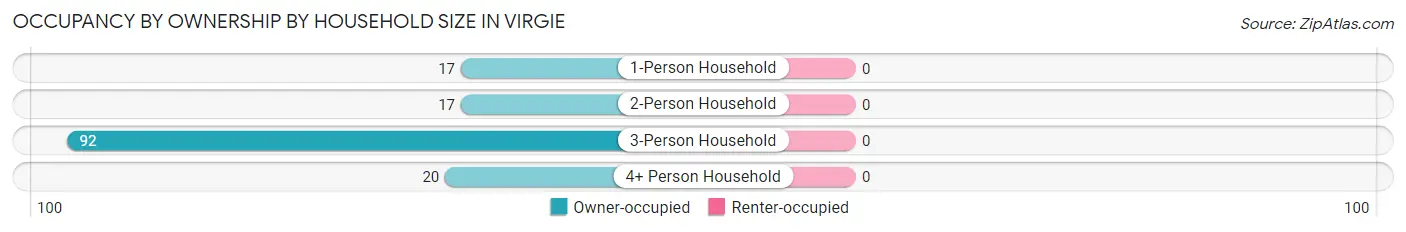
| Household Size | Owner-occupied | Renter-occupied |
| 1-Person Household | 17 (100.0%) | 0 (0.0%) |
| 2-Person Household | 17 (100.0%) | 0 (0.0%) |
| 3-Person Household | 92 (100.0%) | 0 (0.0%) |
| 4+ Person Household | 20 (100.0%) | 0 (0.0%) |
| Total Housing Units | 146 (100.0%) | 0 (0.0%) |
Occupancy by Educational Attainment in Virgie
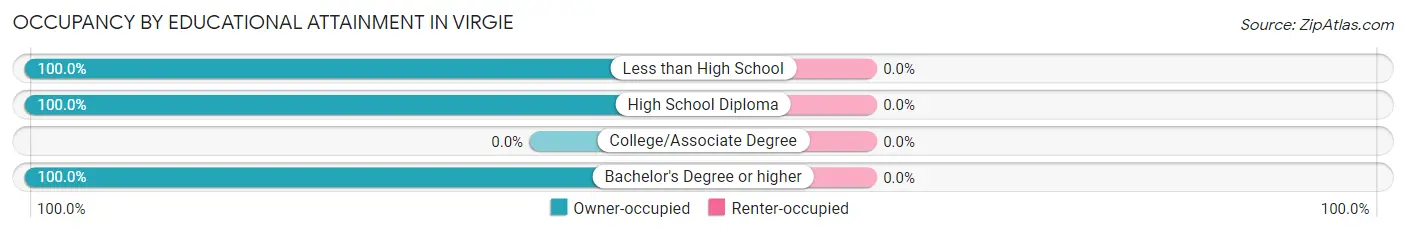
| Household Size | Owner-occupied | Renter-occupied |
| Less than High School | 66 (100.0%) | 0 (0.0%) |
| High School Diploma | 46 (100.0%) | 0 (0.0%) |
| College/Associate Degree | 0 (0.0%) | 0 (0.0%) |
| Bachelor's Degree or higher | 34 (100.0%) | 0 (0.0%) |
Occupancy by Age of Householder in Virgie
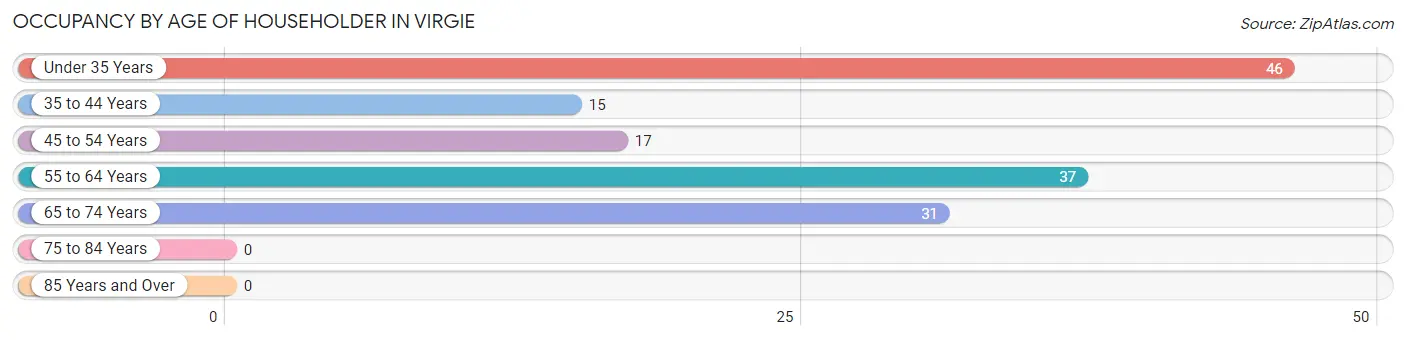
| Age Bracket | # Households | % Households |
| Under 35 Years | 46 | 31.5% |
| 35 to 44 Years | 15 | 10.3% |
| 45 to 54 Years | 17 | 11.6% |
| 55 to 64 Years | 37 | 25.3% |
| 65 to 74 Years | 31 | 21.2% |
| 75 to 84 Years | 0 | 0.0% |
| 85 Years and Over | 0 | 0.0% |
| Total | 146 | 100.0% |
Housing Finances in Virgie
Median Income by Occupancy in Virgie
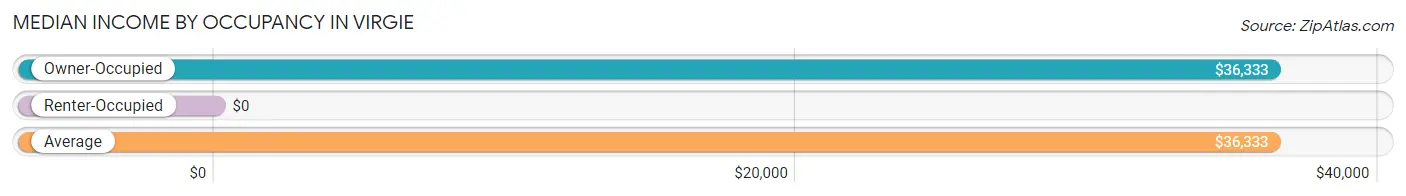
| Occupancy Type | # Households | Median Income |
| Owner-Occupied | 146 (100.0%) | $36,333 |
| Renter-Occupied | 0 (0.0%) | $0 |
| Average | 146 (100.0%) | $36,333 |
Occupancy by Householder Income Bracket in Virgie
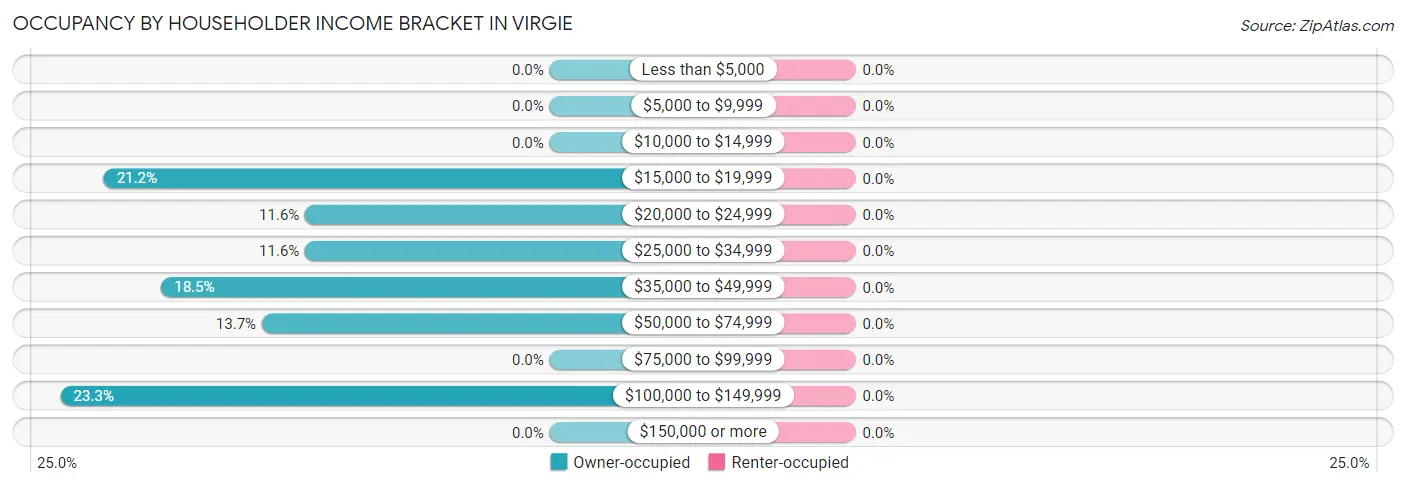
| Income Bracket | Owner-occupied | Renter-occupied |
| Less than $5,000 | 0 (0.0%) | 0 (0.0%) |
| $5,000 to $9,999 | 0 (0.0%) | 0 (0.0%) |
| $10,000 to $14,999 | 0 (0.0%) | 0 (0.0%) |
| $15,000 to $19,999 | 31 (21.2%) | 0 (0.0%) |
| $20,000 to $24,999 | 17 (11.6%) | 0 (0.0%) |
| $25,000 to $34,999 | 17 (11.6%) | 0 (0.0%) |
| $35,000 to $49,999 | 27 (18.5%) | 0 (0.0%) |
| $50,000 to $74,999 | 20 (13.7%) | 0 (0.0%) |
| $75,000 to $99,999 | 0 (0.0%) | 0 (0.0%) |
| $100,000 to $149,999 | 34 (23.3%) | 0 (0.0%) |
| $150,000 or more | 0 (0.0%) | 0 (0.0%) |
| Total | 146 (100.0%) | 0 (0.0%) |
Monthly Housing Cost Tiers in Virgie
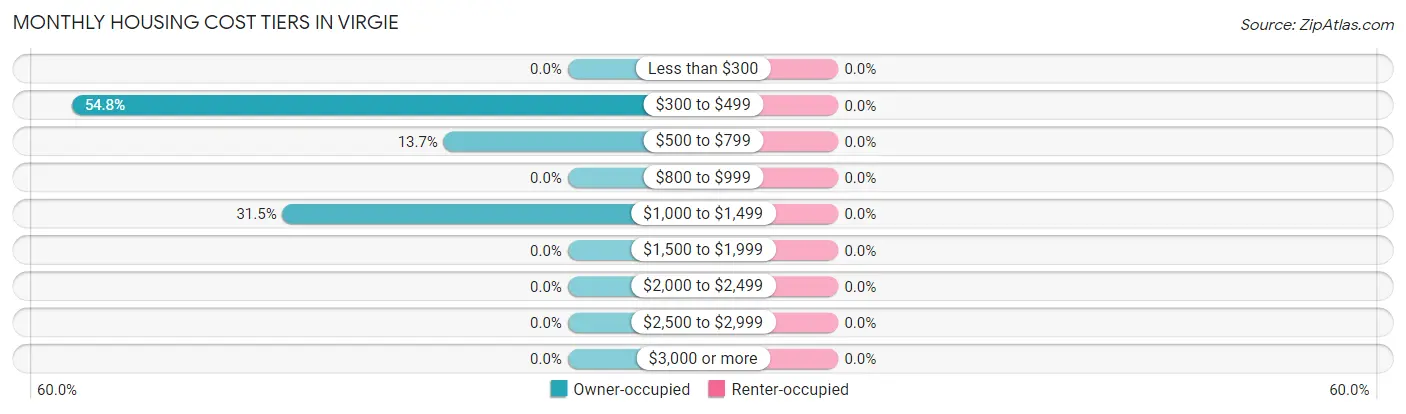
| Monthly Cost | Owner-occupied | Renter-occupied |
| Less than $300 | 0 (0.0%) | 0 (0.0%) |
| $300 to $499 | 80 (54.8%) | 0 (0.0%) |
| $500 to $799 | 20 (13.7%) | 0 (0.0%) |
| $800 to $999 | 0 (0.0%) | 0 (0.0%) |
| $1,000 to $1,499 | 46 (31.5%) | 0 (0.0%) |
| $1,500 to $1,999 | 0 (0.0%) | 0 (0.0%) |
| $2,000 to $2,499 | 0 (0.0%) | 0 (0.0%) |
| $2,500 to $2,999 | 0 (0.0%) | 0 (0.0%) |
| $3,000 or more | 0 (0.0%) | 0 (0.0%) |
| Total | 146 (100.0%) | 0 (0.0%) |
Physical Housing Characteristics in Virgie
Housing Structures in Virgie
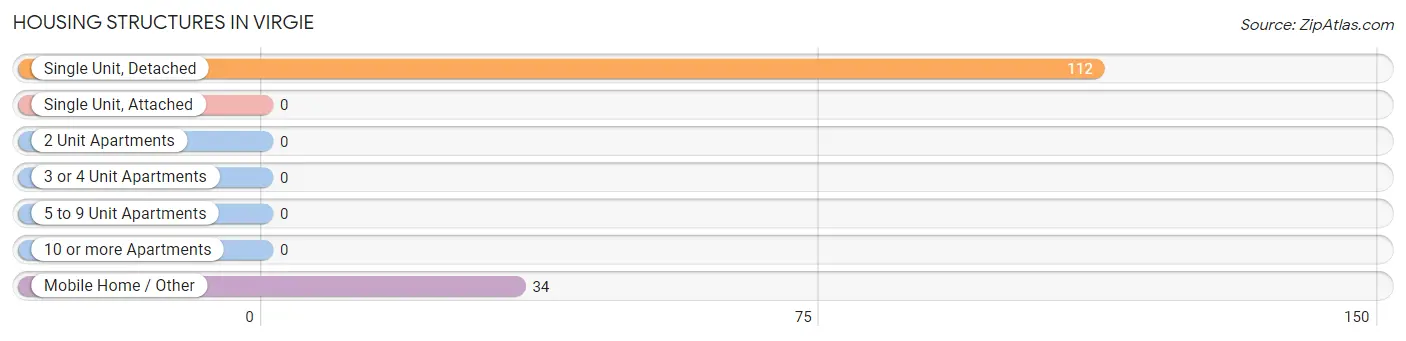
| Structure Type | # Housing Units | % Housing Units |
| Single Unit, Detached | 112 | 76.7% |
| Single Unit, Attached | 0 | 0.0% |
| 2 Unit Apartments | 0 | 0.0% |
| 3 or 4 Unit Apartments | 0 | 0.0% |
| 5 to 9 Unit Apartments | 0 | 0.0% |
| 10 or more Apartments | 0 | 0.0% |
| Mobile Home / Other | 34 | 23.3% |
| Total | 146 | 100.0% |
Housing Structures by Occupancy in Virgie
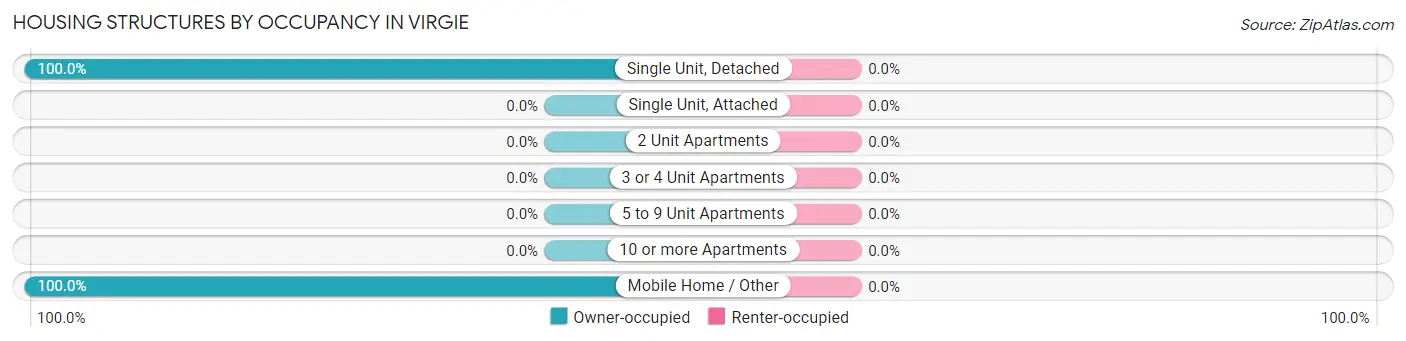
| Structure Type | Owner-occupied | Renter-occupied |
| Single Unit, Detached | 112 (100.0%) | 0 (0.0%) |
| Single Unit, Attached | 0 (0.0%) | 0 (0.0%) |
| 2 Unit Apartments | 0 (0.0%) | 0 (0.0%) |
| 3 or 4 Unit Apartments | 0 (0.0%) | 0 (0.0%) |
| 5 to 9 Unit Apartments | 0 (0.0%) | 0 (0.0%) |
| 10 or more Apartments | 0 (0.0%) | 0 (0.0%) |
| Mobile Home / Other | 34 (100.0%) | 0 (0.0%) |
| Total | 146 (100.0%) | 0 (0.0%) |
Housing Structures by Number of Rooms in Virgie
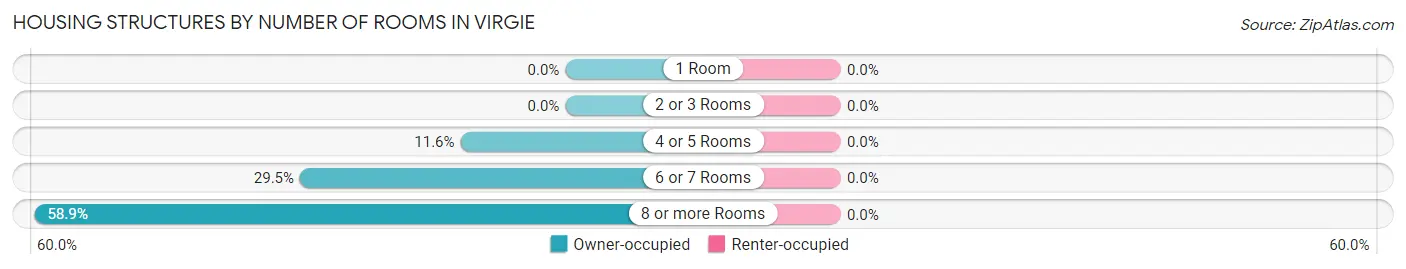
| Number of Rooms | Owner-occupied | Renter-occupied |
| 1 Room | 0 (0.0%) | 0 (0.0%) |
| 2 or 3 Rooms | 0 (0.0%) | 0 (0.0%) |
| 4 or 5 Rooms | 17 (11.6%) | 0 (0.0%) |
| 6 or 7 Rooms | 43 (29.4%) | 0 (0.0%) |
| 8 or more Rooms | 86 (58.9%) | 0 (0.0%) |
| Total | 146 (100.0%) | 0 (0.0%) |
Housing Structure by Heating Type in Virgie
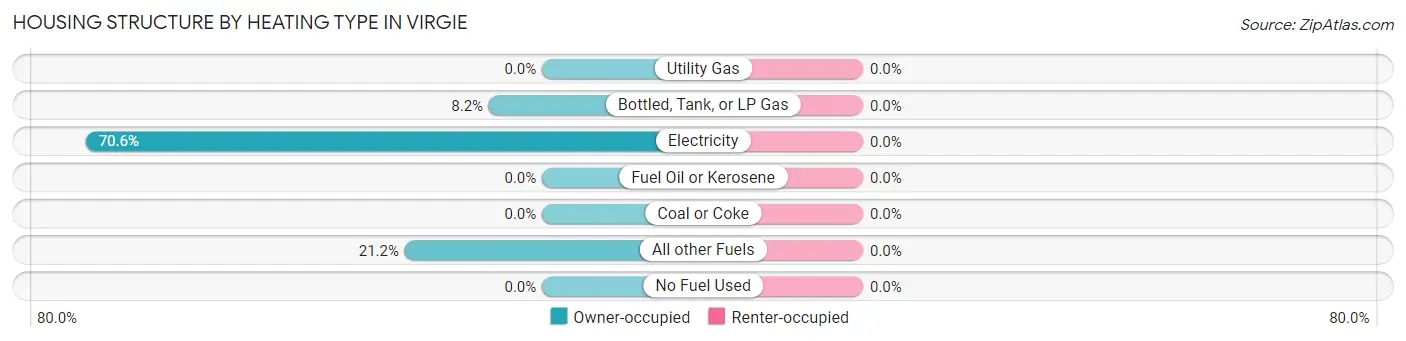
| Heating Type | Owner-occupied | Renter-occupied |
| Utility Gas | 0 (0.0%) | 0 (0.0%) |
| Bottled, Tank, or LP Gas | 12 (8.2%) | 0 (0.0%) |
| Electricity | 103 (70.6%) | 0 (0.0%) |
| Fuel Oil or Kerosene | 0 (0.0%) | 0 (0.0%) |
| Coal or Coke | 0 (0.0%) | 0 (0.0%) |
| All other Fuels | 31 (21.2%) | 0 (0.0%) |
| No Fuel Used | 0 (0.0%) | 0 (0.0%) |
| Total | 146 (100.0%) | 0 (0.0%) |
Household Vehicle Usage in Virgie
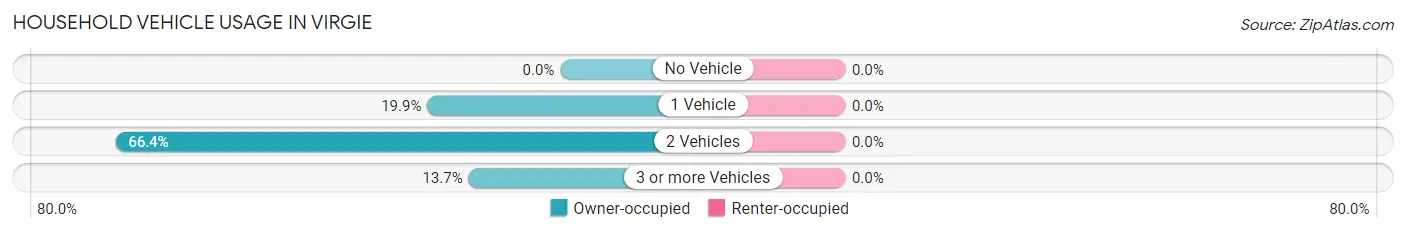
| Vehicles per Household | Owner-occupied | Renter-occupied |
| No Vehicle | 0 (0.0%) | 0 (0.0%) |
| 1 Vehicle | 29 (19.9%) | 0 (0.0%) |
| 2 Vehicles | 97 (66.4%) | 0 (0.0%) |
| 3 or more Vehicles | 20 (13.7%) | 0 (0.0%) |
| Total | 146 (100.0%) | 0 (0.0%) |
Real Estate & Mortgages in Virgie
Real Estate and Mortgage Overview in Virgie
| Characteristic | Without Mortgage | With Mortgage |
| Housing Units | 100 | 46 |
| Median Property Value | $74,200 | $0 |
| Median Household Income | $27,794 | $0 |
| Monthly Housing Costs | $406 | $0 |
| Real Estate Taxes | $671 | $0 |
Property Value by Mortgage Status in Virgie
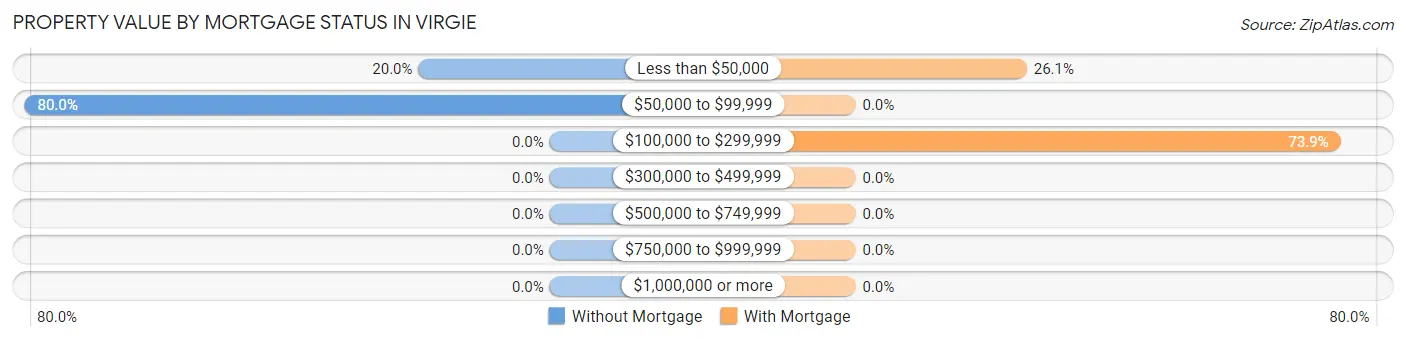
| Property Value | Without Mortgage | With Mortgage |
| Less than $50,000 | 20 (20.0%) | 12 (26.1%) |
| $50,000 to $99,999 | 80 (80.0%) | 0 (0.0%) |
| $100,000 to $299,999 | 0 (0.0%) | 34 (73.9%) |
| $300,000 to $499,999 | 0 (0.0%) | 0 (0.0%) |
| $500,000 to $749,999 | 0 (0.0%) | 0 (0.0%) |
| $750,000 to $999,999 | 0 (0.0%) | 0 (0.0%) |
| $1,000,000 or more | 0 (0.0%) | 0 (0.0%) |
| Total | 100 (100.0%) | 46 (100.0%) |
Household Income by Mortgage Status in Virgie
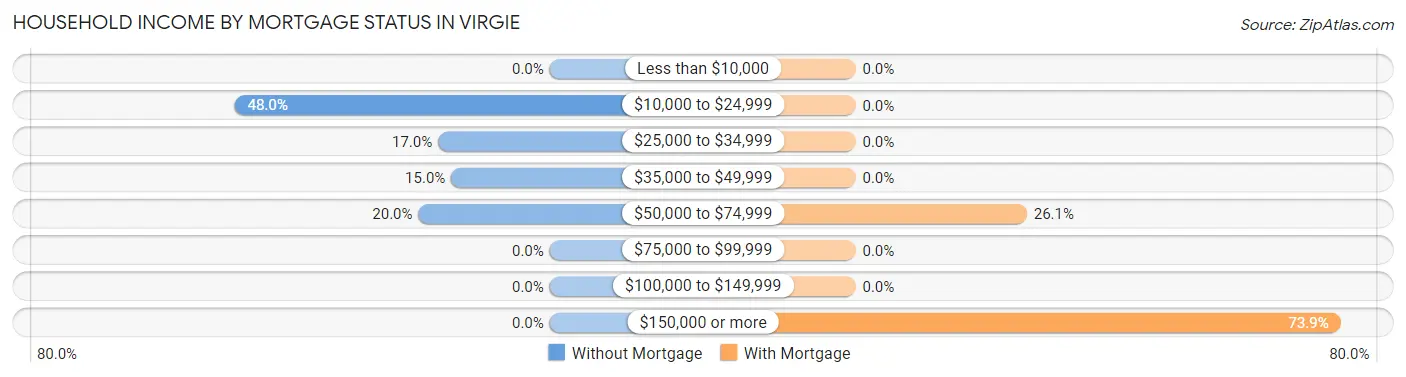
| Household Income | Without Mortgage | With Mortgage |
| Less than $10,000 | 0 (0.0%) | 0 (0.0%) |
| $10,000 to $24,999 | 48 (48.0%) | 0 (0.0%) |
| $25,000 to $34,999 | 17 (17.0%) | 0 (0.0%) |
| $35,000 to $49,999 | 15 (15.0%) | 0 (0.0%) |
| $50,000 to $74,999 | 20 (20.0%) | 12 (26.1%) |
| $75,000 to $99,999 | 0 (0.0%) | 0 (0.0%) |
| $100,000 to $149,999 | 0 (0.0%) | 0 (0.0%) |
| $150,000 or more | 0 (0.0%) | 34 (73.9%) |
| Total | 100 (100.0%) | 46 (100.0%) |
Property Value to Household Income Ratio in Virgie
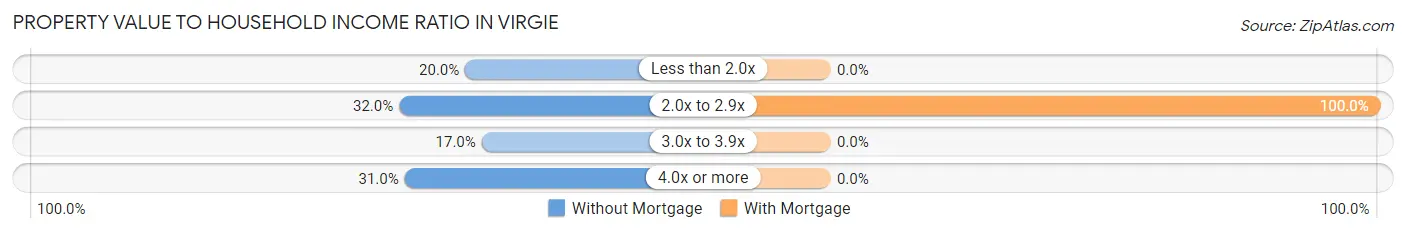
| Value-to-Income Ratio | Without Mortgage | With Mortgage |
| Less than 2.0x | 20 (20.0%) | 0 (0.0%) |
| 2.0x to 2.9x | 32 (32.0%) | 46 (100.0%) |
| 3.0x to 3.9x | 17 (17.0%) | 0 (0.0%) |
| 4.0x or more | 31 (31.0%) | 0 (0.0%) |
| Total | 100 (100.0%) | 46 (100.0%) |
Real Estate Taxes by Mortgage Status in Virgie
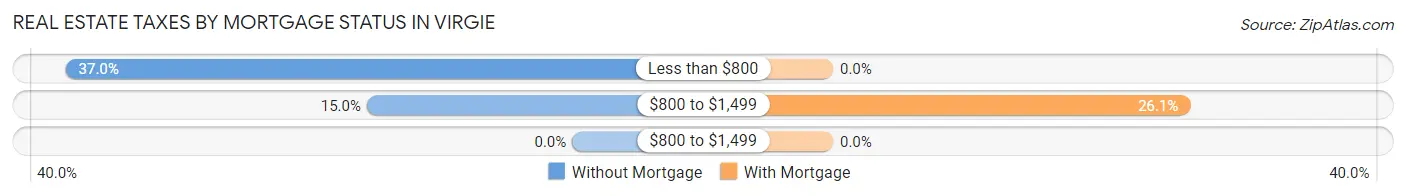
| Property Taxes | Without Mortgage | With Mortgage |
| Less than $800 | 37 (37.0%) | 0 (0.0%) |
| $800 to $1,499 | 15 (15.0%) | 12 (26.1%) |
| $800 to $1,499 | 0 (0.0%) | 0 (0.0%) |
| Total | 100 (100.0%) | 46 (100.0%) |
Health & Disability in Virgie
Health Insurance Coverage by Age in Virgie
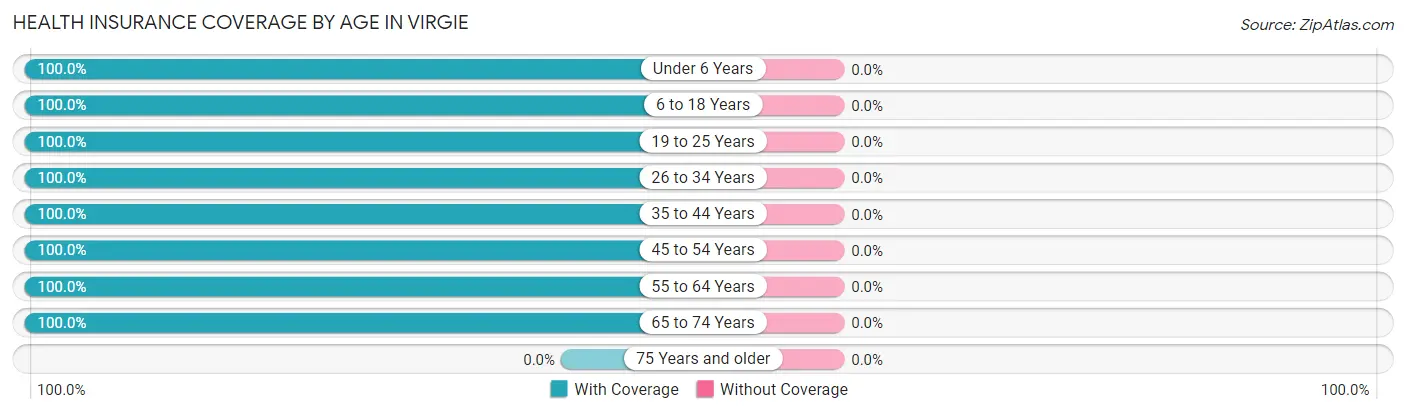
| Age Bracket | With Coverage | Without Coverage |
| Under 6 Years | 46 (100.0%) | 0 (0.0%) |
| 6 to 18 Years | 90 (100.0%) | 0 (0.0%) |
| 19 to 25 Years | 57 (100.0%) | 0 (0.0%) |
| 26 to 34 Years | 126 (100.0%) | 0 (0.0%) |
| 35 to 44 Years | 29 (100.0%) | 0 (0.0%) |
| 45 to 54 Years | 36 (100.0%) | 0 (0.0%) |
| 55 to 64 Years | 107 (100.0%) | 0 (0.0%) |
| 65 to 74 Years | 31 (100.0%) | 0 (0.0%) |
| 75 Years and older | 0 (0.0%) | 0 (0.0%) |
| Total | 522 (100.0%) | 0 (0.0%) |
Health Insurance Coverage by Citizenship Status in Virgie
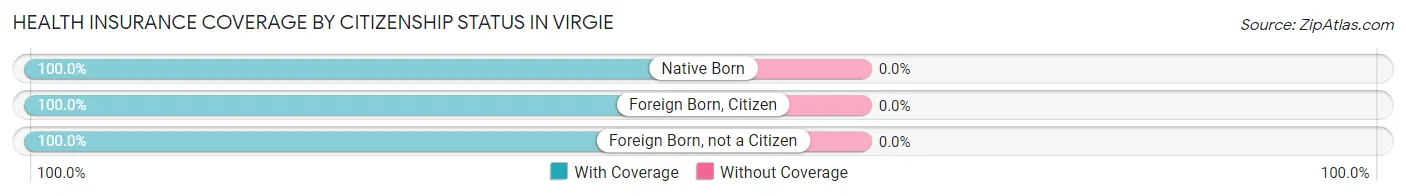
| Citizenship Status | With Coverage | Without Coverage |
| Native Born | 46 (100.0%) | 0 (0.0%) |
| Foreign Born, Citizen | 90 (100.0%) | 0 (0.0%) |
| Foreign Born, not a Citizen | 57 (100.0%) | 0 (0.0%) |
Health Insurance Coverage by Household Income in Virgie
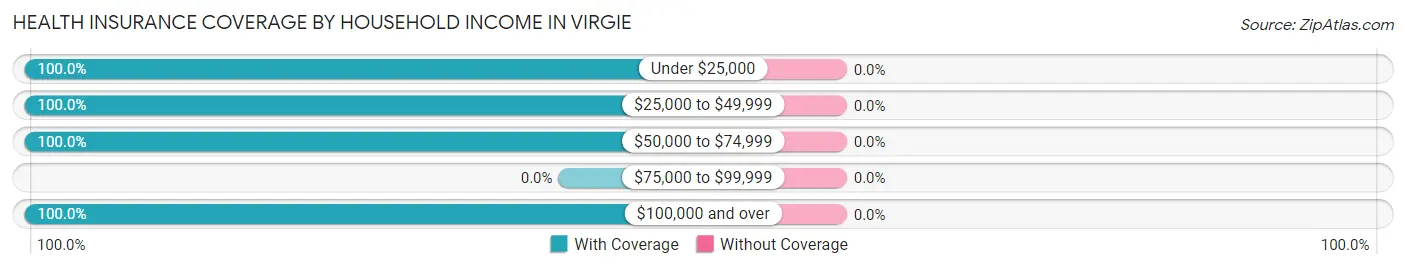
| Household Income | With Coverage | Without Coverage |
| Under $25,000 | 172 (100.0%) | 0 (0.0%) |
| $25,000 to $49,999 | 124 (100.0%) | 0 (0.0%) |
| $50,000 to $74,999 | 109 (100.0%) | 0 (0.0%) |
| $75,000 to $99,999 | 0 (0.0%) | 0 (0.0%) |
| $100,000 and over | 117 (100.0%) | 0 (0.0%) |
Public vs Private Health Insurance Coverage by Age in Virgie
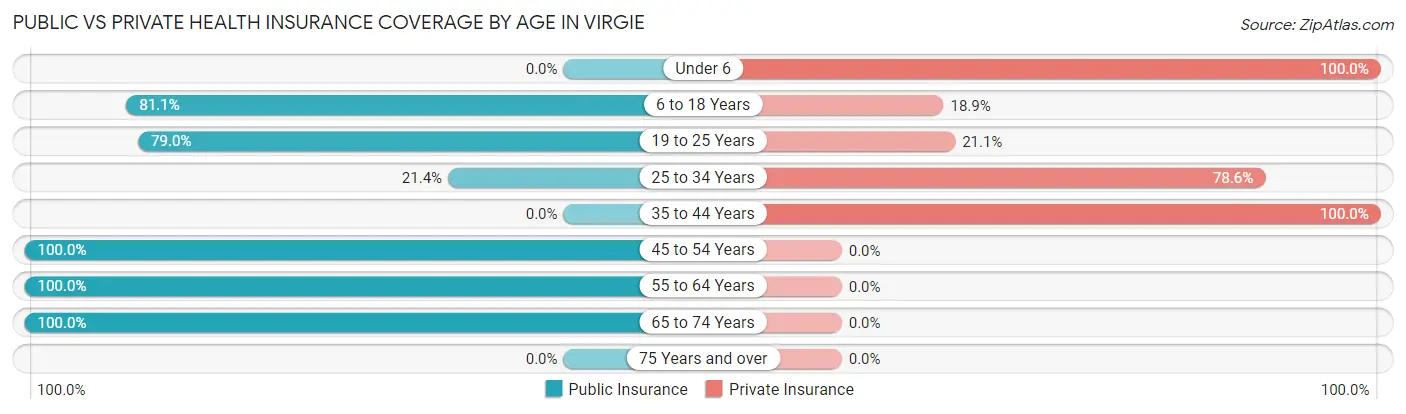
| Age Bracket | Public Insurance | Private Insurance |
| Under 6 | 0 (0.0%) | 46 (100.0%) |
| 6 to 18 Years | 73 (81.1%) | 17 (18.9%) |
| 19 to 25 Years | 45 (78.9%) | 12 (21.0%) |
| 25 to 34 Years | 27 (21.4%) | 99 (78.6%) |
| 35 to 44 Years | 0 (0.0%) | 29 (100.0%) |
| 45 to 54 Years | 36 (100.0%) | 0 (0.0%) |
| 55 to 64 Years | 107 (100.0%) | 0 (0.0%) |
| 65 to 74 Years | 31 (100.0%) | 0 (0.0%) |
| 75 Years and over | 0 (0.0%) | 0 (0.0%) |
| Total | 319 (61.1%) | 203 (38.9%) |
Disability Status by Sex by Age in Virgie
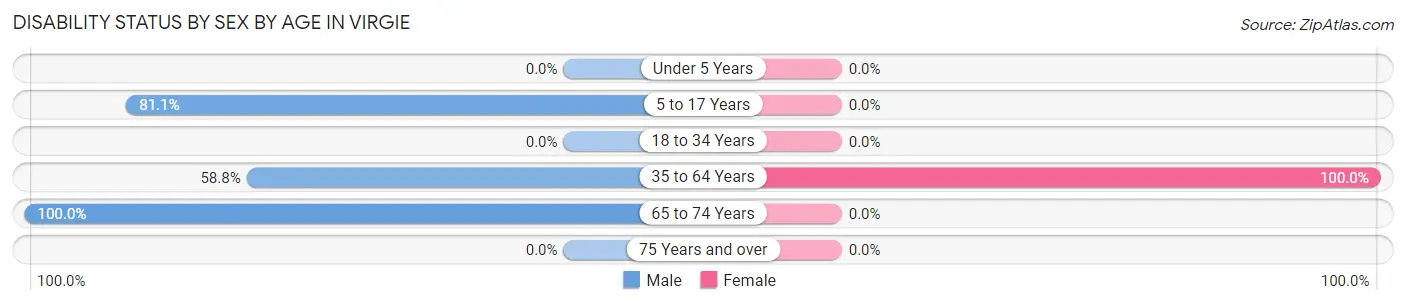
| Age Bracket | Male | Female |
| Under 5 Years | 0 (0.0%) | 0 (0.0%) |
| 5 to 17 Years | 73 (81.1%) | 0 (0.0%) |
| 18 to 34 Years | 0 (0.0%) | 0 (0.0%) |
| 35 to 64 Years | 20 (58.8%) | 138 (100.0%) |
| 65 to 74 Years | 31 (100.0%) | 0 (0.0%) |
| 75 Years and over | 0 (0.0%) | 0 (0.0%) |
Disability Class by Sex by Age in Virgie
Disability Class: Hearing Difficulty
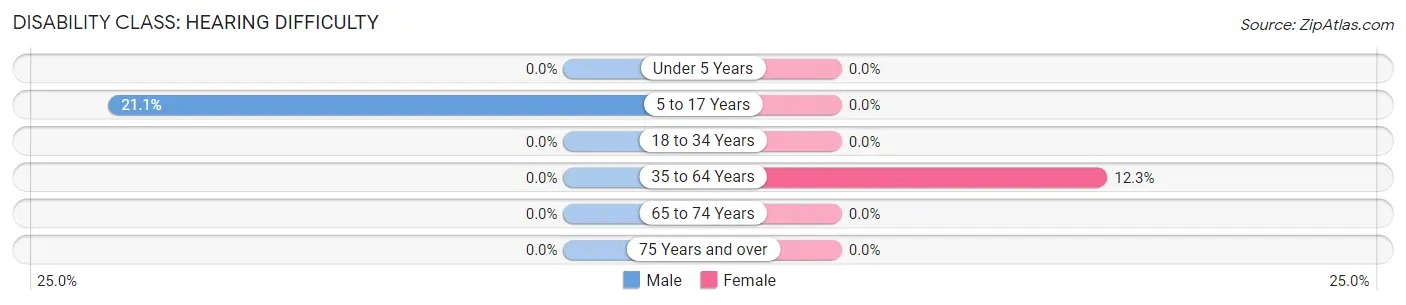
| Age Bracket | Male | Female |
| Under 5 Years | 0 (0.0%) | 0 (0.0%) |
| 5 to 17 Years | 19 (21.1%) | 0 (0.0%) |
| 18 to 34 Years | 0 (0.0%) | 0 (0.0%) |
| 35 to 64 Years | 0 (0.0%) | 17 (12.3%) |
| 65 to 74 Years | 0 (0.0%) | 0 (0.0%) |
| 75 Years and over | 0 (0.0%) | 0 (0.0%) |
Disability Class: Vision Difficulty
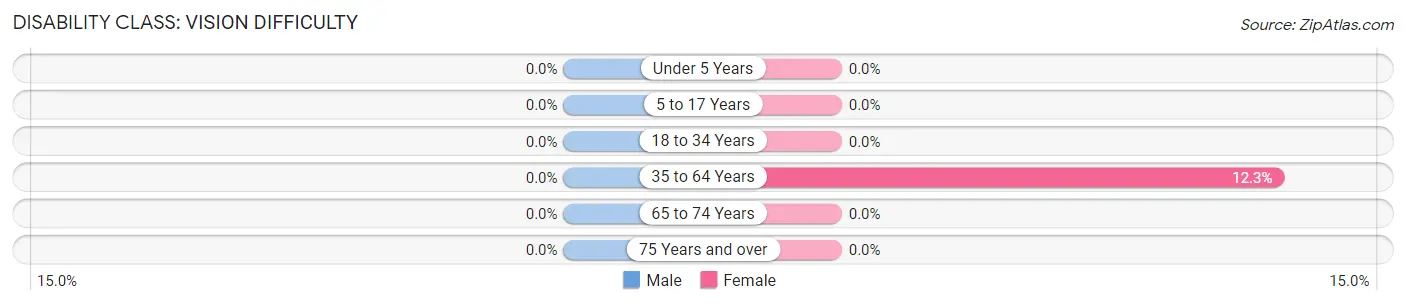
| Age Bracket | Male | Female |
| Under 5 Years | 0 (0.0%) | 0 (0.0%) |
| 5 to 17 Years | 0 (0.0%) | 0 (0.0%) |
| 18 to 34 Years | 0 (0.0%) | 0 (0.0%) |
| 35 to 64 Years | 0 (0.0%) | 17 (12.3%) |
| 65 to 74 Years | 0 (0.0%) | 0 (0.0%) |
| 75 Years and over | 0 (0.0%) | 0 (0.0%) |
Disability Class: Cognitive Difficulty
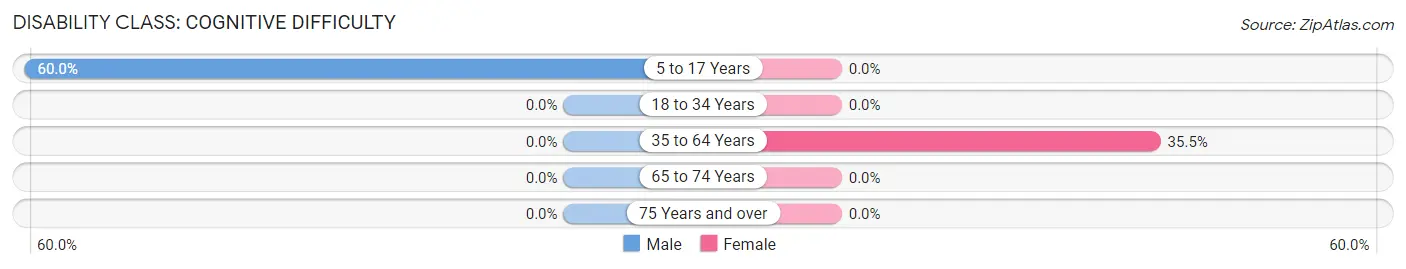
| Age Bracket | Male | Female |
| 5 to 17 Years | 54 (60.0%) | 0 (0.0%) |
| 18 to 34 Years | 0 (0.0%) | 0 (0.0%) |
| 35 to 64 Years | 0 (0.0%) | 49 (35.5%) |
| 65 to 74 Years | 0 (0.0%) | 0 (0.0%) |
| 75 Years and over | 0 (0.0%) | 0 (0.0%) |
Disability Class: Ambulatory Difficulty
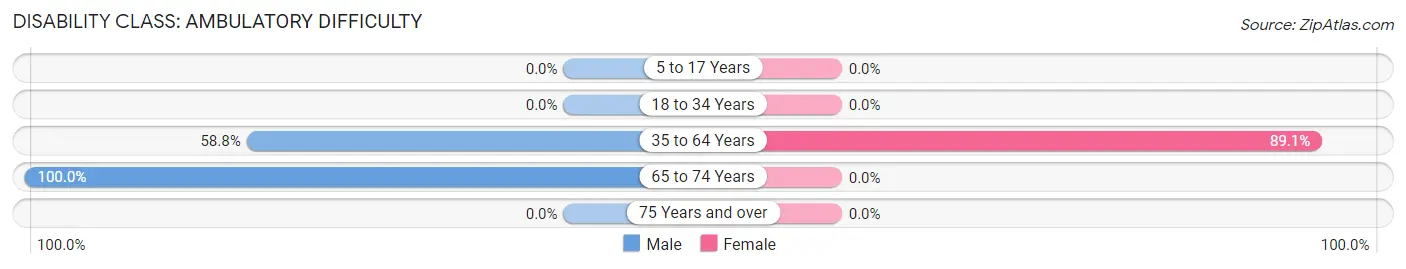
| Age Bracket | Male | Female |
| 5 to 17 Years | 0 (0.0%) | 0 (0.0%) |
| 18 to 34 Years | 0 (0.0%) | 0 (0.0%) |
| 35 to 64 Years | 20 (58.8%) | 123 (89.1%) |
| 65 to 74 Years | 31 (100.0%) | 0 (0.0%) |
| 75 Years and over | 0 (0.0%) | 0 (0.0%) |
Disability Class: Self-Care Difficulty
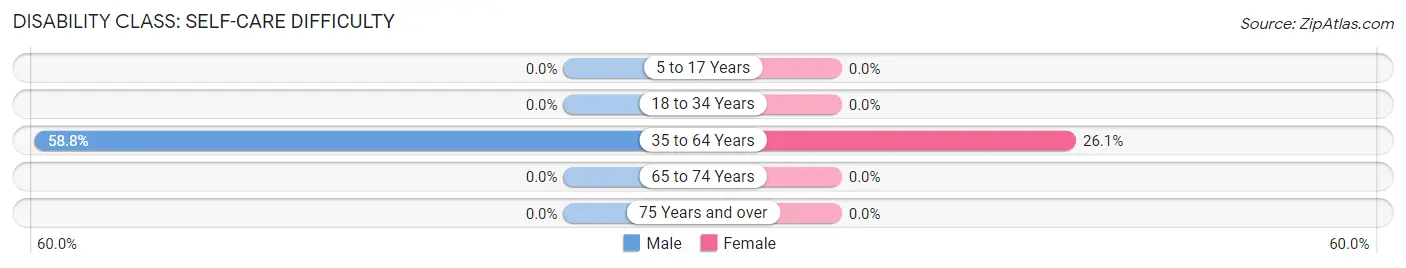
| Age Bracket | Male | Female |
| 5 to 17 Years | 0 (0.0%) | 0 (0.0%) |
| 18 to 34 Years | 0 (0.0%) | 0 (0.0%) |
| 35 to 64 Years | 20 (58.8%) | 36 (26.1%) |
| 65 to 74 Years | 0 (0.0%) | 0 (0.0%) |
| 75 Years and over | 0 (0.0%) | 0 (0.0%) |
Technology Access in Virgie
Computing Device Access in Virgie
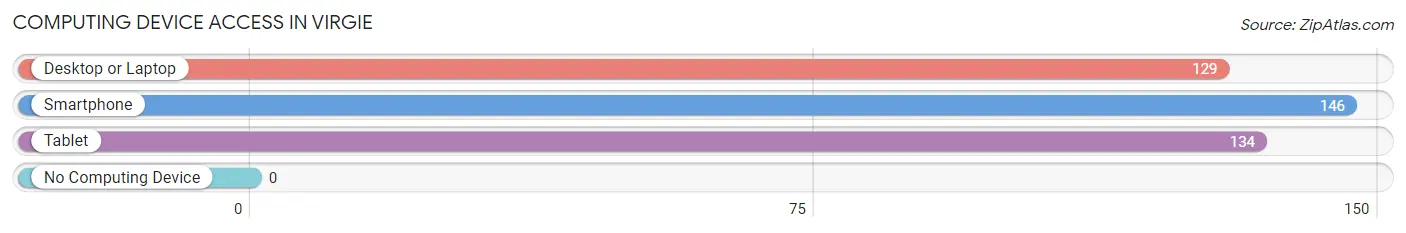
| Device Type | # Households | % Households |
| Desktop or Laptop | 129 | 88.4% |
| Smartphone | 146 | 100.0% |
| Tablet | 134 | 91.8% |
| No Computing Device | 0 | 0.0% |
| Total | 146 | 100.0% |
Internet Access in Virgie
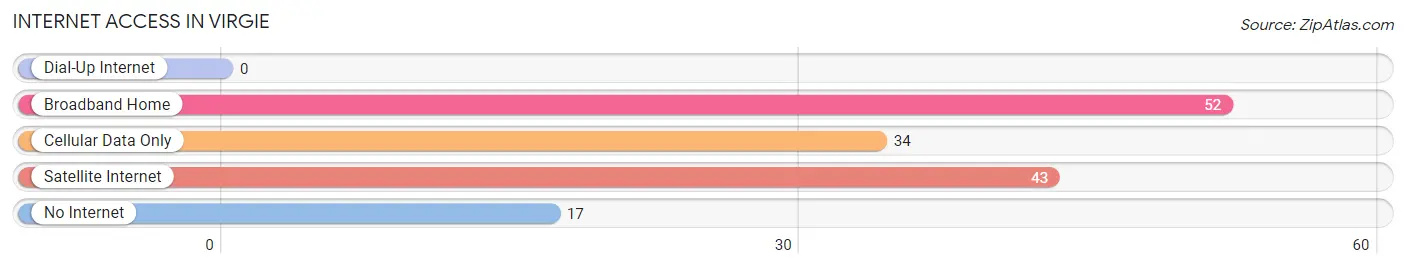
| Internet Type | # Households | % Households |
| Dial-Up Internet | 0 | 0.0% |
| Broadband Home | 52 | 35.6% |
| Cellular Data Only | 34 | 23.3% |
| Satellite Internet | 43 | 29.4% |
| No Internet | 17 | 11.6% |
| Total | 146 | 100.0% |
Virgie Summary
Virgie is a small unincorporated community located in Pike County, Kentucky. It is situated in the Appalachian Mountains, and is part of the Appalachian Regional Commission. The population of Virgie was estimated to be around 1,000 in 2000.
History
Virgie was founded in the late 19th century by a group of settlers from Virginia. The town was named after Virgie, the daughter of one of the settlers. The town was originally a coal mining town, and the coal industry was the main source of income for the town. The coal industry declined in the mid-20th century, and the town has since become a small rural community.
Geography
Virgie is located in the Appalachian Mountains, and is part of the Appalachian Regional Commission. The town is situated in the Big Sandy River Valley, and is surrounded by the Daniel Boone National Forest. The town is located at an elevation of 1,000 feet above sea level. The climate in Virgie is humid subtropical, with hot summers and mild winters.
Economy
The economy of Virgie is largely based on agriculture and tourism. The town is home to several small farms, and the surrounding area is known for its production of tobacco, corn, and hay. Tourism is also an important part of the local economy, as the town is located near several popular attractions, such as the Big South Fork National River and Recreation Area and the Breaks Interstate Park.
Demographics
As of the 2000 census, the population of Virgie was estimated to be around 1,000. The racial makeup of the town was 97.2% White, 0.7% African American, 0.3% Native American, 0.2% Asian, and 1.6% from other races. The median household income was $25,000, and the median family income was $30,000. The per capita income was $14,000. The town had a poverty rate of 28.3%.
Conclusion
Virgie is a small unincorporated community located in Pike County, Kentucky. It is situated in the Appalachian Mountains, and is part of the Appalachian Regional Commission. The town was originally a coal mining town, but the industry has since declined. The economy of Virgie is largely based on agriculture and tourism. The population of Virgie was estimated to be around 1,000 in 2000, and the town had a poverty rate of 28.3%. Virgie is a small rural community that is surrounded by natural beauty and offers a unique way of life.
Common Questions
What is Per Capita Income in Virgie?
Per Capita income in Virgie is $19,798.
What is the Median Family Income in Virgie?
Median Family Income in Virgie is $42,813.
What is the Median Household income in Virgie?
Median Household Income in Virgie is $36,333.
What is Inequality or Gini Index in Virgie?
Inequality or Gini Index in Virgie is 0.43.
What is the Total Population of Virgie?
Total Population of Virgie is 522.
What is the Total Male Population of Virgie?
Total Male Population of Virgie is 276.
What is the Total Female Population of Virgie?
Total Female Population of Virgie is 246.
What is the Ratio of Males per 100 Females in Virgie?
There are 112.20 Males per 100 Females in Virgie.
What is the Ratio of Females per 100 Males in Virgie?
There are 89.13 Females per 100 Males in Virgie.
What is the Median Population Age in Virgie?
Median Population Age in Virgie is 32.5 Years.
What is the Average Family Size in Virgie
Average Family Size in Virgie is 3.9 People.
What is the Average Household Size in Virgie
Average Household Size in Virgie is 3.6 People.
How Large is the Labor Force in Virgie?
There are 216 People in the Labor Forcein in Virgie.
What is the Percentage of People in the Labor Force in Virgie?
53.3% of People are in the Labor Force in Virgie.
What is the Unemployment Rate in Virgie?
Unemployment Rate in Virgie is 11.1%.