Glenview, KY Map & Demographics
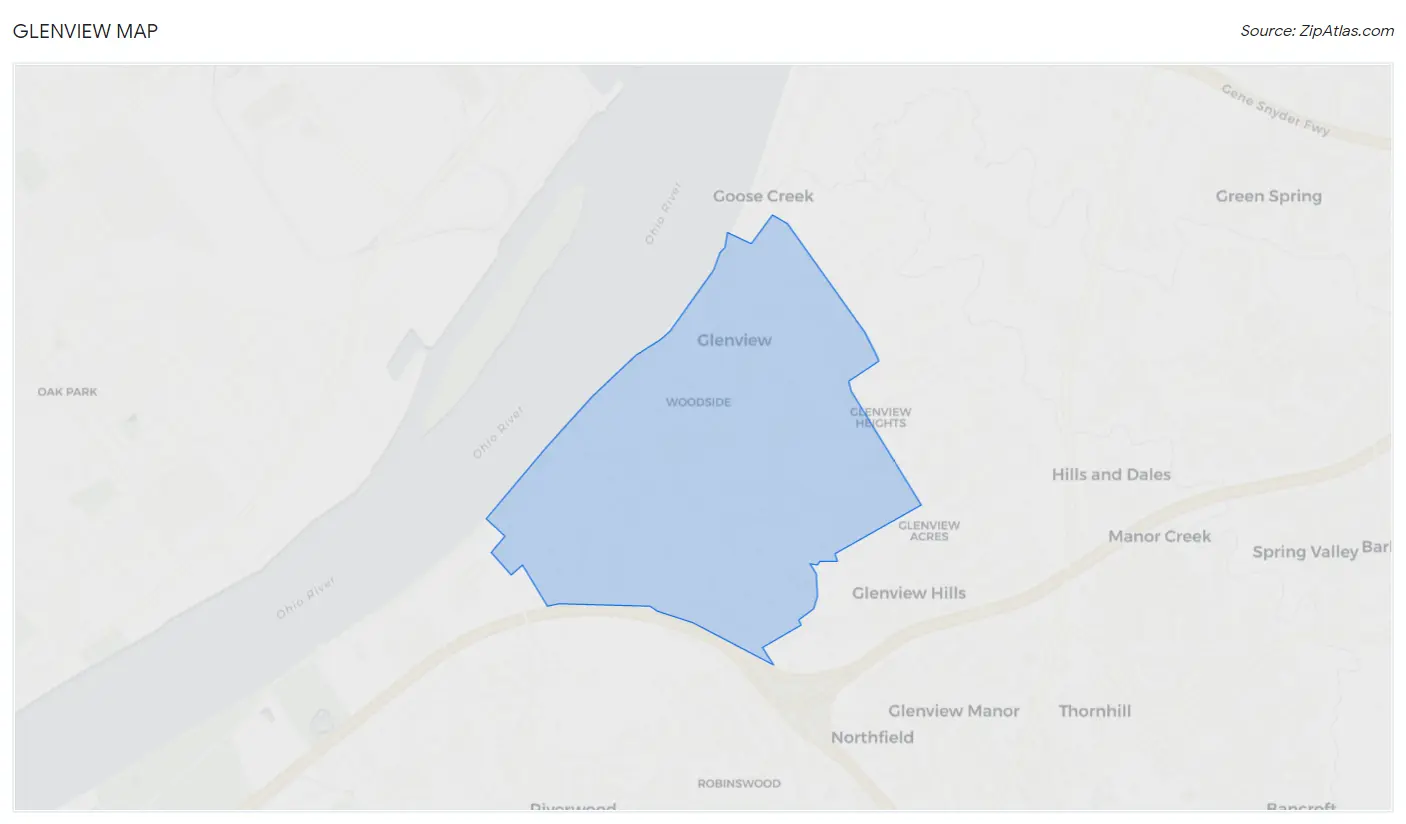
Glenview Map
Glenview Overview
$216,503
PER CAPITA INCOME
$250,001
AVG FAMILY INCOME
$250,001
AVG HOUSEHOLD INCOME
58.2%
WAGE / INCOME GAP [ % ]
41.8¢/ $1
WAGE / INCOME GAP [ $ ]
0.47
INEQUALITY / GINI INDEX
574
TOTAL POPULATION
305
MALE POPULATION
269
FEMALE POPULATION
113.38
MALES / 100 FEMALES
88.20
FEMALES / 100 MALES
56.2
MEDIAN AGE
2.7
AVG FAMILY SIZE
2.4
AVG HOUSEHOLD SIZE
290
LABOR FORCE [ PEOPLE ]
60.7%
PERCENT IN LABOR FORCE
1.0%
UNEMPLOYMENT RATE
Glenview Zip Codes
Glenview Area Codes
Income in Glenview
Income Overview in Glenview
Per Capita Income in Glenview is $216,503, while median incomes of families and households are $250,001 and $250,001 respectively.
| Characteristic | Number | Measure |
| Per Capita Income | 574 | $216,503 |
| Median Family Income | 186 | $250,001 |
| Mean Family Income | 186 | $600,801 |
| Median Household Income | 239 | $250,001 |
| Mean Household Income | 239 | $508,303 |
| Income Deficit | 186 | $0 |
| Wage / Income Gap (%) | 574 | 58.25% |
| Wage / Income Gap ($) | 574 | 41.75¢ per $1 |
| Gini / Inequality Index | 574 | 0.47 |
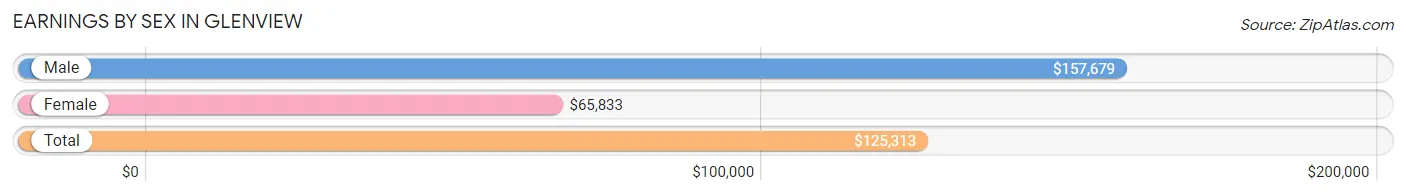
Earnings by Sex in Glenview
Average Earnings in Glenview are $125,313, $157,679 for men and $65,833 for women, a difference of 58.3%.
| Sex | Number | Average Earnings |
| Male | 223 (72.6%) | $157,679 |
| Female | 84 (27.4%) | $65,833 |
| Total | 307 (100.0%) | $125,313 |
Earnings by Sex by Income Bracket in Glenview
The most common earnings brackets in Glenview are $100,000+ for men (132 | 59.2%) and $100,000+ for women (34 | 40.5%).
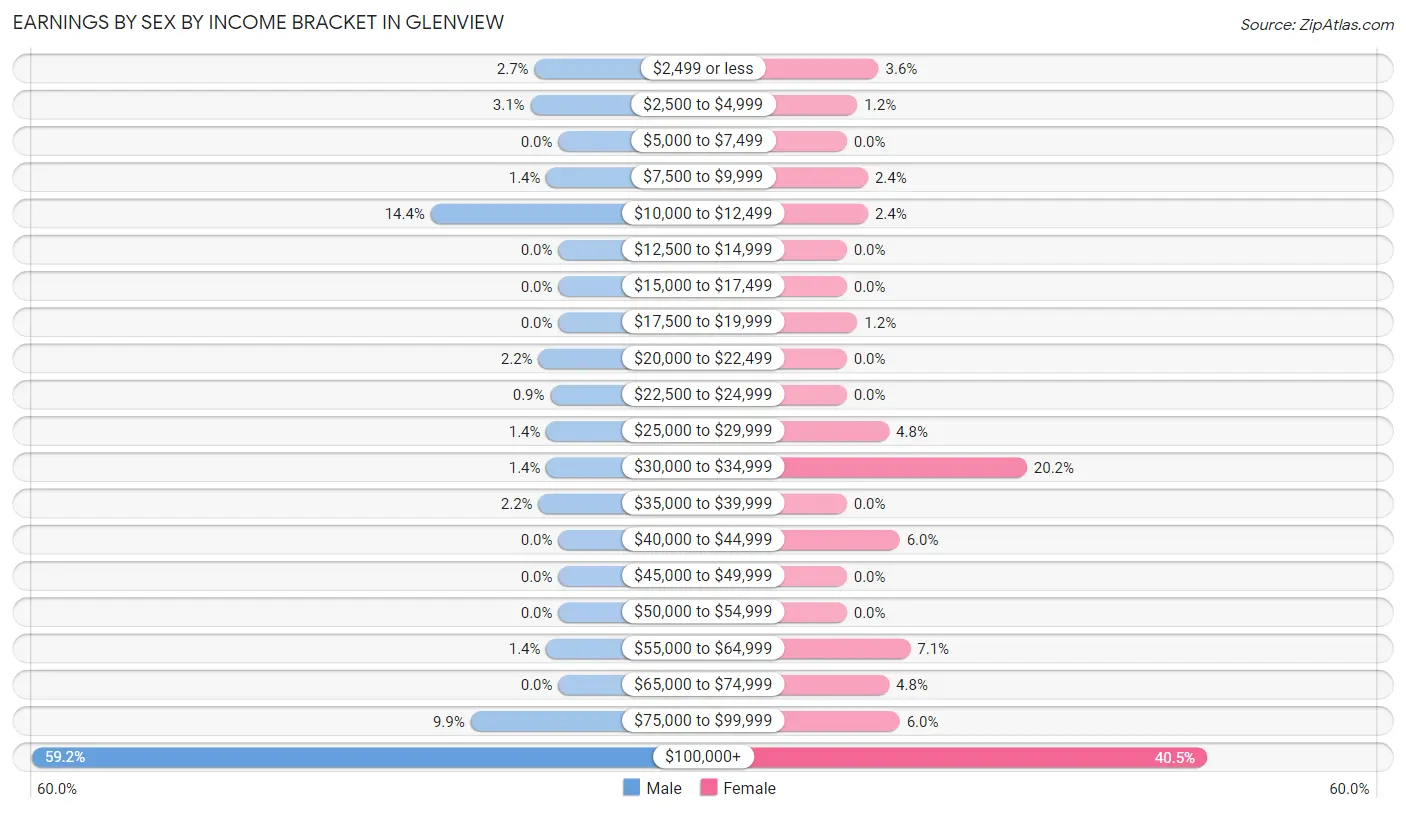
| Income | Male | Female |
| $2,499 or less | 6 (2.7%) | 3 (3.6%) |
| $2,500 to $4,999 | 7 (3.1%) | 1 (1.2%) |
| $5,000 to $7,499 | 0 (0.0%) | 0 (0.0%) |
| $7,500 to $9,999 | 3 (1.3%) | 2 (2.4%) |
| $10,000 to $12,499 | 32 (14.3%) | 2 (2.4%) |
| $12,500 to $14,999 | 0 (0.0%) | 0 (0.0%) |
| $15,000 to $17,499 | 0 (0.0%) | 0 (0.0%) |
| $17,500 to $19,999 | 0 (0.0%) | 1 (1.2%) |
| $20,000 to $22,499 | 5 (2.2%) | 0 (0.0%) |
| $22,500 to $24,999 | 2 (0.9%) | 0 (0.0%) |
| $25,000 to $29,999 | 3 (1.3%) | 4 (4.8%) |
| $30,000 to $34,999 | 3 (1.3%) | 17 (20.2%) |
| $35,000 to $39,999 | 5 (2.2%) | 0 (0.0%) |
| $40,000 to $44,999 | 0 (0.0%) | 5 (5.9%) |
| $45,000 to $49,999 | 0 (0.0%) | 0 (0.0%) |
| $50,000 to $54,999 | 0 (0.0%) | 0 (0.0%) |
| $55,000 to $64,999 | 3 (1.3%) | 6 (7.1%) |
| $65,000 to $74,999 | 0 (0.0%) | 4 (4.8%) |
| $75,000 to $99,999 | 22 (9.9%) | 5 (5.9%) |
| $100,000+ | 132 (59.2%) | 34 (40.5%) |
| Total | 223 (100.0%) | 84 (100.0%) |
Earnings by Sex by Educational Attainment in Glenview
Average earnings in Glenview are $158,750 for men and $66,250 for women, a difference of 58.3%. Men with an educational attainment of bachelor's degree enjoy the highest average annual earnings of $219,375, while those with college or associate's degree education earn the least with $96,250. Women with an educational attainment of graduate degree earn the most with the average annual earnings of $126,875, while those with bachelor's degree education have the smallest earnings of $38,750.
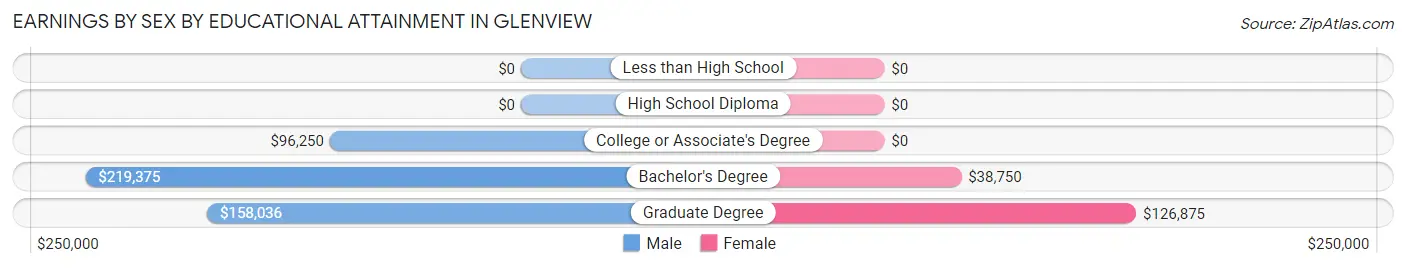
| Educational Attainment | Male Income | Female Income |
| Less than High School | - | - |
| High School Diploma | - | - |
| College or Associate's Degree | $96,250 | $0 |
| Bachelor's Degree | $219,375 | $38,750 |
| Graduate Degree | $158,036 | $126,875 |
| Total | $158,750 | $66,250 |
Family Income in Glenview
Family Income Brackets in Glenview
According to the Glenview family income data, there are 160 families falling into the $200,000+ income range, which is the most common income bracket and makes up 86.0% of all families.
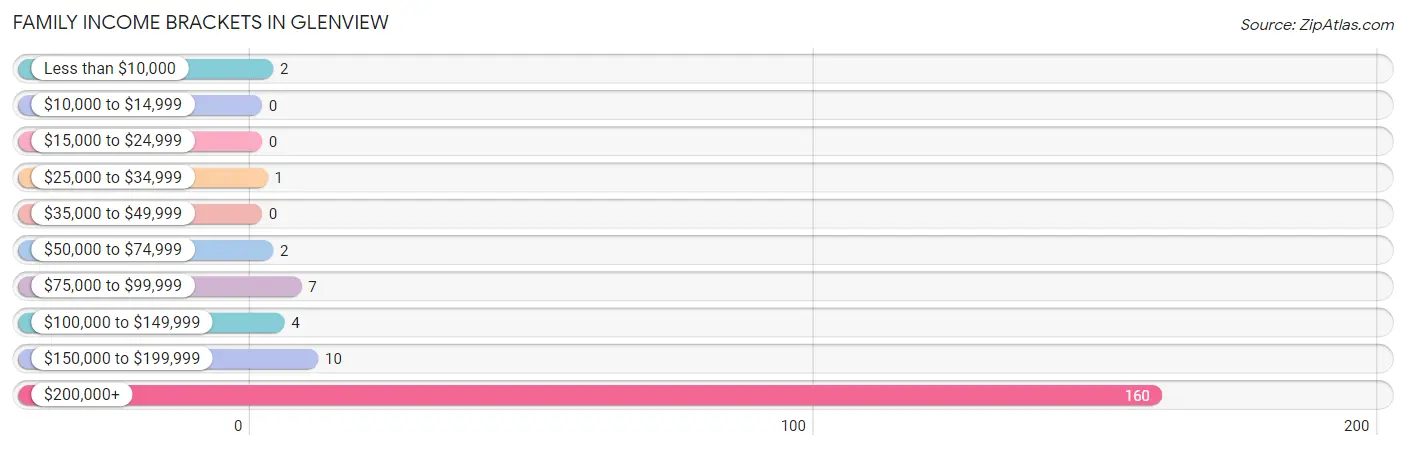
| Income Bracket | # Families | % Families |
| Less than $10,000 | 2 | 1.1% |
| $10,000 to $14,999 | 0 | 0.0% |
| $15,000 to $24,999 | 0 | 0.0% |
| $25,000 to $34,999 | 1 | 0.5% |
| $35,000 to $49,999 | 0 | 0.0% |
| $50,000 to $74,999 | 2 | 1.1% |
| $75,000 to $99,999 | 7 | 3.8% |
| $100,000 to $149,999 | 4 | 2.2% |
| $150,000 to $199,999 | 10 | 5.4% |
| $200,000+ | 160 | 86.0% |
Family Income by Famaliy Size in Glenview
2-person families (120 | 64.5%) account for the highest median family income in Glenview with $250,001 per family, while 2-person families (120 | 64.5%) have the highest median income of $125,000 per family member.
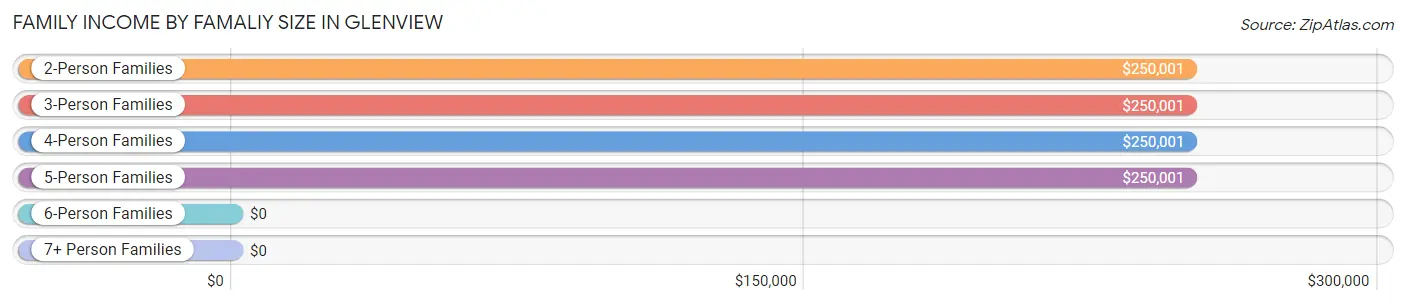
| Income Bracket | # Families | Median Income |
| 2-Person Families | 120 (64.5%) | $250,001 |
| 3-Person Families | 28 (15.0%) | $250,001 |
| 4-Person Families | 19 (10.2%) | $250,001 |
| 5-Person Families | 18 (9.7%) | $250,001 |
| 6-Person Families | 1 (0.5%) | $0 |
| 7+ Person Families | 0 (0.0%) | $0 |
| Total | 186 (100.0%) | $250,001 |
Family Income by Number of Earners in Glenview
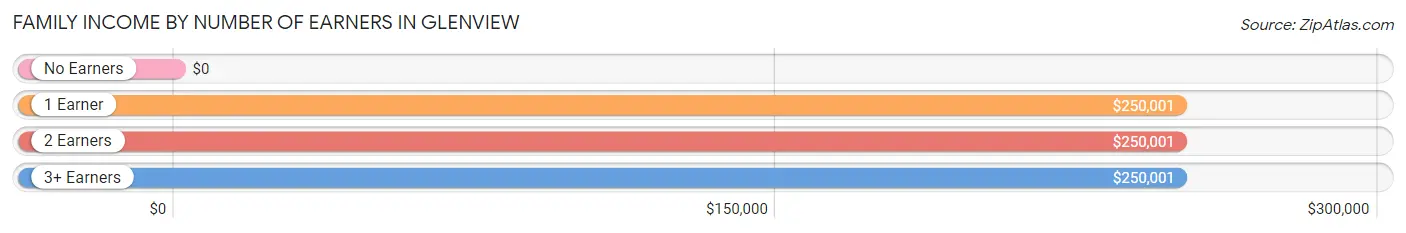
| Number of Earners | # Families | Median Income |
| No Earners | 12 (6.5%) | $0 |
| 1 Earner | 98 (52.7%) | $250,001 |
| 2 Earners | 70 (37.6%) | $250,001 |
| 3+ Earners | 6 (3.2%) | $250,001 |
| Total | 186 (100.0%) | $250,001 |
Household Income in Glenview
Household Income Brackets in Glenview
With 171 households falling in the category, the $200,000+ income range is the most frequent in Glenview, accounting for 71.6% of all households.
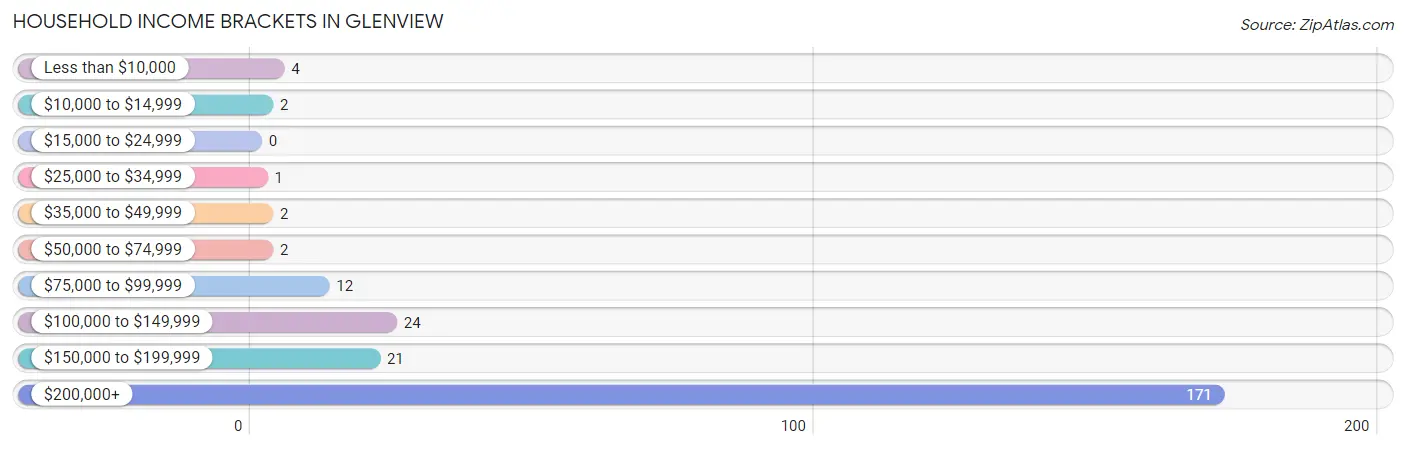
| Income Bracket | # Households | % Households |
| Less than $10,000 | 4 | 1.7% |
| $10,000 to $14,999 | 2 | 0.8% |
| $15,000 to $24,999 | 0 | 0.0% |
| $25,000 to $34,999 | 1 | 0.4% |
| $35,000 to $49,999 | 2 | 0.8% |
| $50,000 to $74,999 | 2 | 0.8% |
| $75,000 to $99,999 | 12 | 5.0% |
| $100,000 to $149,999 | 24 | 10.0% |
| $150,000 to $199,999 | 21 | 8.8% |
| $200,000+ | 171 | 71.5% |
Household Income by Householder Age in Glenview
The median household income in Glenview is $250,001, with the highest median household income of $250,001 found in the 25 to 44 years age bracket for the primary householder. A total of 21 households (8.8%) fall into this category.
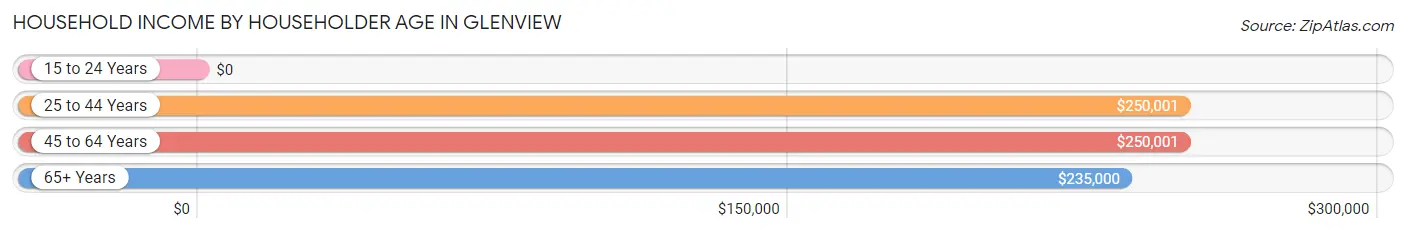
| Income Bracket | # Households | Median Income |
| 15 to 24 Years | 0 (0.0%) | $0 |
| 25 to 44 Years | 21 (8.8%) | $250,001 |
| 45 to 64 Years | 132 (55.2%) | $250,001 |
| 65+ Years | 86 (36.0%) | $235,000 |
| Total | 239 (100.0%) | $250,001 |
Poverty in Glenview
Income Below Poverty by Sex and Age in Glenview
With 1.3% poverty level for males and 1.5% for females among the residents of Glenview, 65 to 74 year old males and 65 to 74 year old females are the most vulnerable to poverty, with 2 males (3.5%) and 2 females (5.4%) in their respective age groups living below the poverty level.
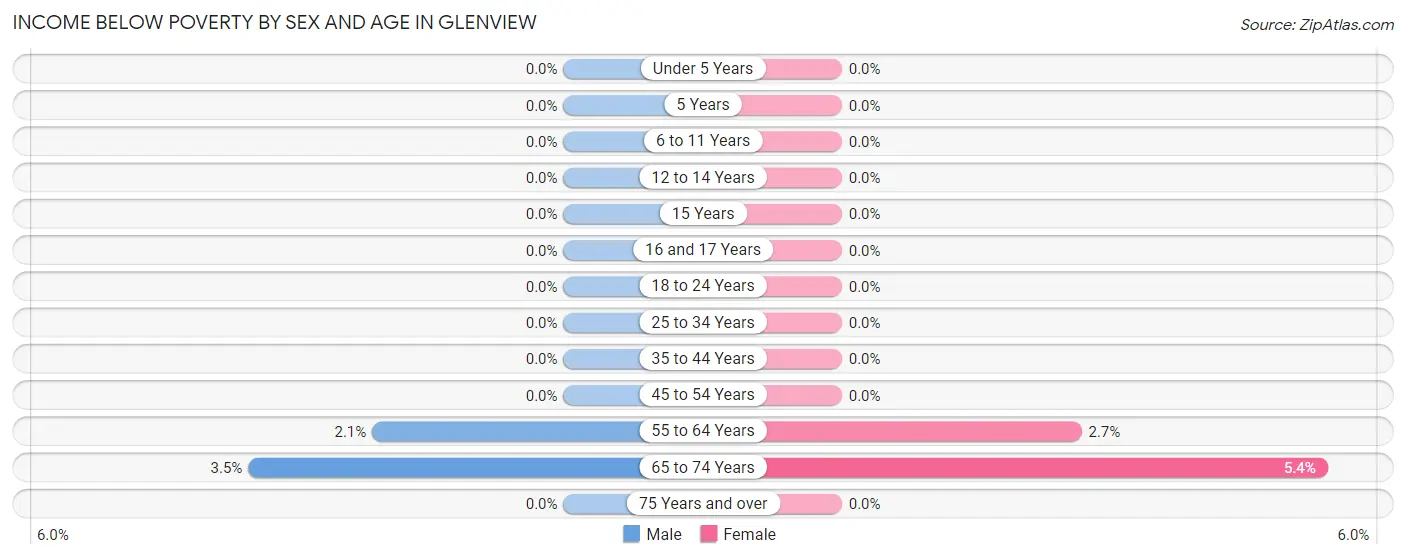
| Age Bracket | Male | Female |
| Under 5 Years | 0 (0.0%) | 0 (0.0%) |
| 5 Years | 0 (0.0%) | 0 (0.0%) |
| 6 to 11 Years | 0 (0.0%) | 0 (0.0%) |
| 12 to 14 Years | 0 (0.0%) | 0 (0.0%) |
| 15 Years | 0 (0.0%) | 0 (0.0%) |
| 16 and 17 Years | 0 (0.0%) | 0 (0.0%) |
| 18 to 24 Years | 0 (0.0%) | 0 (0.0%) |
| 25 to 34 Years | 0 (0.0%) | 0 (0.0%) |
| 35 to 44 Years | 0 (0.0%) | 0 (0.0%) |
| 45 to 54 Years | 0 (0.0%) | 0 (0.0%) |
| 55 to 64 Years | 2 (2.1%) | 2 (2.7%) |
| 65 to 74 Years | 2 (3.5%) | 2 (5.4%) |
| 75 Years and over | 0 (0.0%) | 0 (0.0%) |
| Total | 4 (1.3%) | 4 (1.5%) |
Income Above Poverty by Sex and Age in Glenview
According to the poverty statistics in Glenview, males aged under 5 years and females aged under 5 years are the age groups that are most secure financially, with 100.0% of males and 100.0% of females in these age groups living above the poverty line.
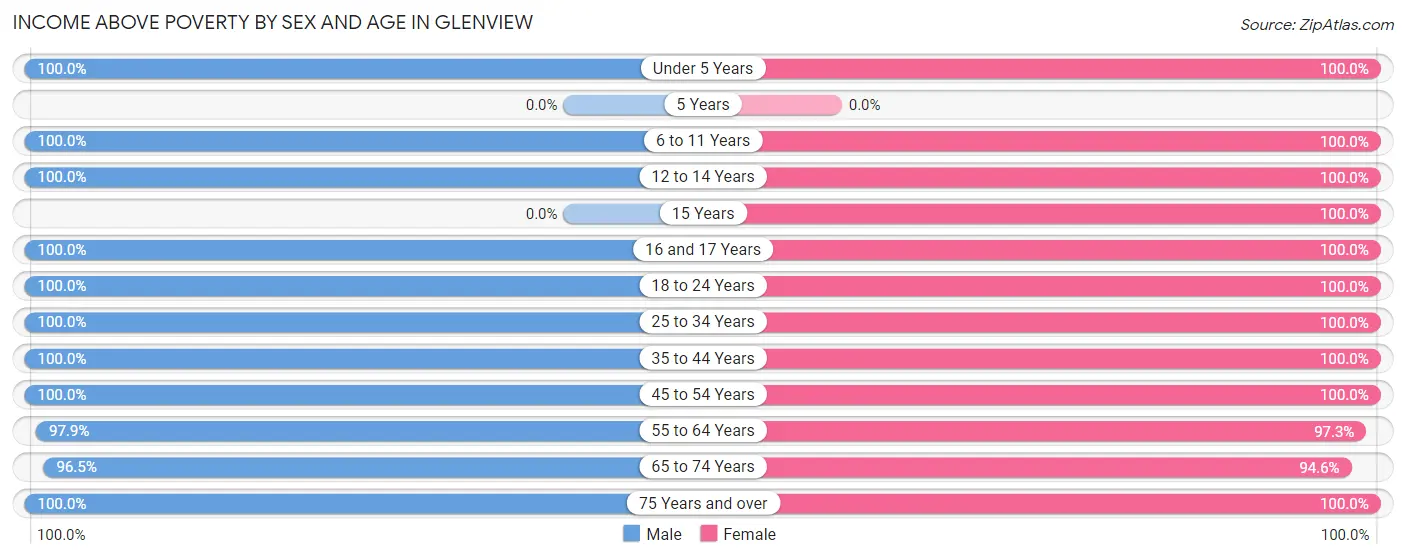
| Age Bracket | Male | Female |
| Under 5 Years | 11 (100.0%) | 10 (100.0%) |
| 5 Years | 0 (0.0%) | 0 (0.0%) |
| 6 to 11 Years | 18 (100.0%) | 19 (100.0%) |
| 12 to 14 Years | 6 (100.0%) | 25 (100.0%) |
| 15 Years | 0 (0.0%) | 7 (100.0%) |
| 16 and 17 Years | 8 (100.0%) | 7 (100.0%) |
| 18 to 24 Years | 9 (100.0%) | 1 (100.0%) |
| 25 to 34 Years | 3 (100.0%) | 2 (100.0%) |
| 35 to 44 Years | 21 (100.0%) | 33 (100.0%) |
| 45 to 54 Years | 55 (100.0%) | 33 (100.0%) |
| 55 to 64 Years | 92 (97.9%) | 73 (97.3%) |
| 65 to 74 Years | 55 (96.5%) | 35 (94.6%) |
| 75 Years and over | 23 (100.0%) | 20 (100.0%) |
| Total | 301 (98.7%) | 265 (98.5%) |
Income Below Poverty Among Married-Couple Families in Glenview
The poverty statistics for married-couple families in Glenview show that 1.1% or 2 of the total 180 families live below the poverty line. Families with no children have the highest poverty rate of 1.6%, comprising of 2 families. On the other hand, families with 1 or 2 children have the lowest poverty rate of 0.0%, which includes 0 families.
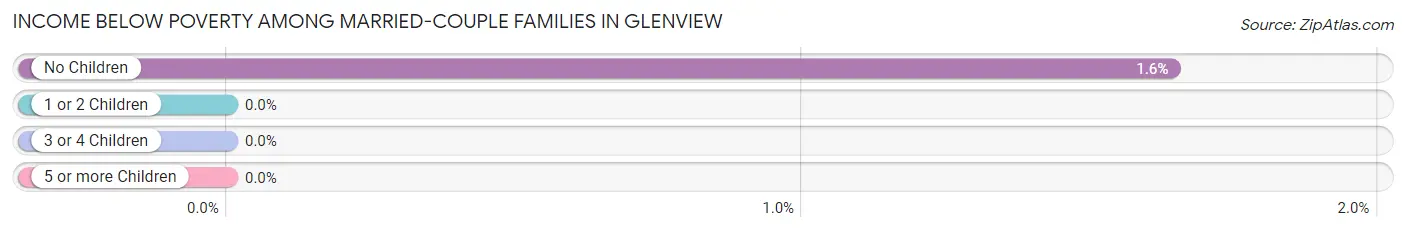
| Children | Above Poverty | Below Poverty |
| No Children | 120 (98.4%) | 2 (1.6%) |
| 1 or 2 Children | 42 (100.0%) | 0 (0.0%) |
| 3 or 4 Children | 16 (100.0%) | 0 (0.0%) |
| 5 or more Children | 0 (0.0%) | 0 (0.0%) |
| Total | 178 (98.9%) | 2 (1.1%) |
Income Below Poverty Among Single-Parent Households in Glenview
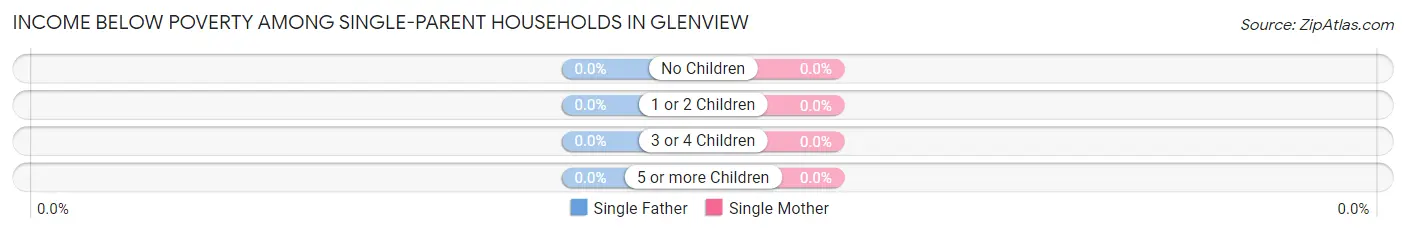
| Children | Single Father | Single Mother |
| No Children | 0 (0.0%) | 0 (0.0%) |
| 1 or 2 Children | 0 (0.0%) | 0 (0.0%) |
| 3 or 4 Children | 0 (0.0%) | 0 (0.0%) |
| 5 or more Children | 0 (0.0%) | 0 (0.0%) |
| Total | 0 (0.0%) | 0 (0.0%) |
Income Below Poverty Among Married-Couple vs Single-Parent Households in Glenview
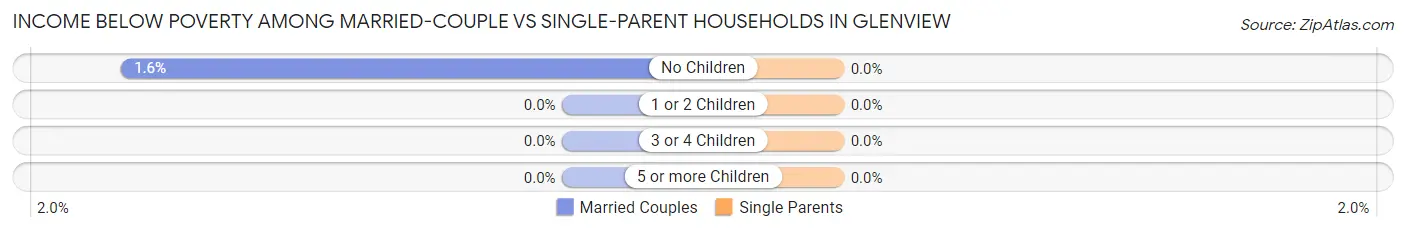
| Children | Married-Couple Families | Single-Parent Households |
| No Children | 2 (1.6%) | 0 (0.0%) |
| 1 or 2 Children | 0 (0.0%) | 0 (0.0%) |
| 3 or 4 Children | 0 (0.0%) | 0 (0.0%) |
| 5 or more Children | 0 (0.0%) | 0 (0.0%) |
| Total | 2 (1.1%) | 0 (0.0%) |
Race in Glenview
The most populous races in Glenview are White / Caucasian (514 | 89.5%), Two or more Races (33 | 5.8%), and Asian (27 | 4.7%).
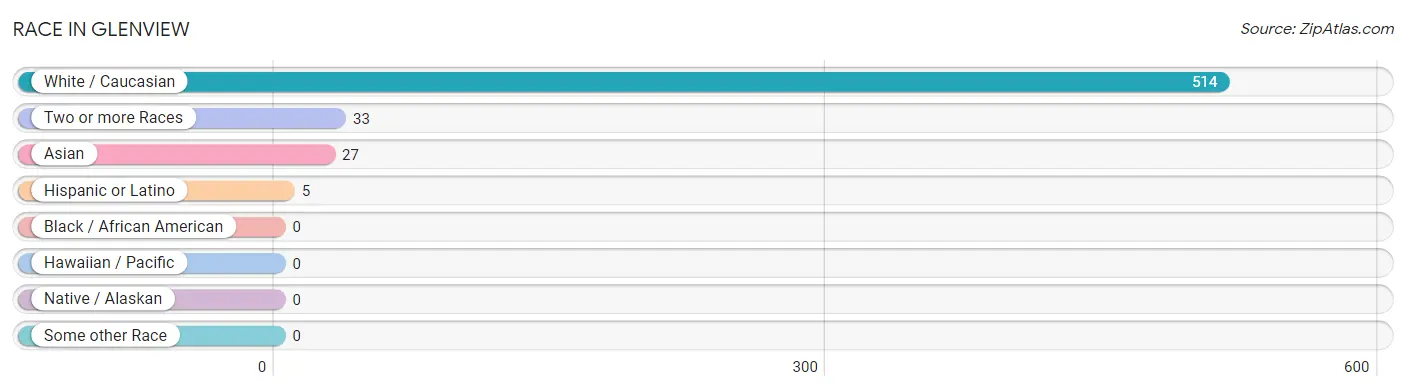
| Race | # Population | % Population |
| Asian | 27 | 4.7% |
| Black / African American | 0 | 0.0% |
| Hawaiian / Pacific | 0 | 0.0% |
| Hispanic or Latino | 5 | 0.9% |
| Native / Alaskan | 0 | 0.0% |
| White / Caucasian | 514 | 89.5% |
| Two or more Races | 33 | 5.8% |
| Some other Race | 0 | 0.0% |
| Total | 574 | 100.0% |
Ancestry in Glenview
The most populous ancestries reported in Glenview are Irish (113 | 19.7%), English (103 | 17.9%), American (98 | 17.1%), German (78 | 13.6%), and Italian (62 | 10.8%), together accounting for 79.1% of all Glenview residents.
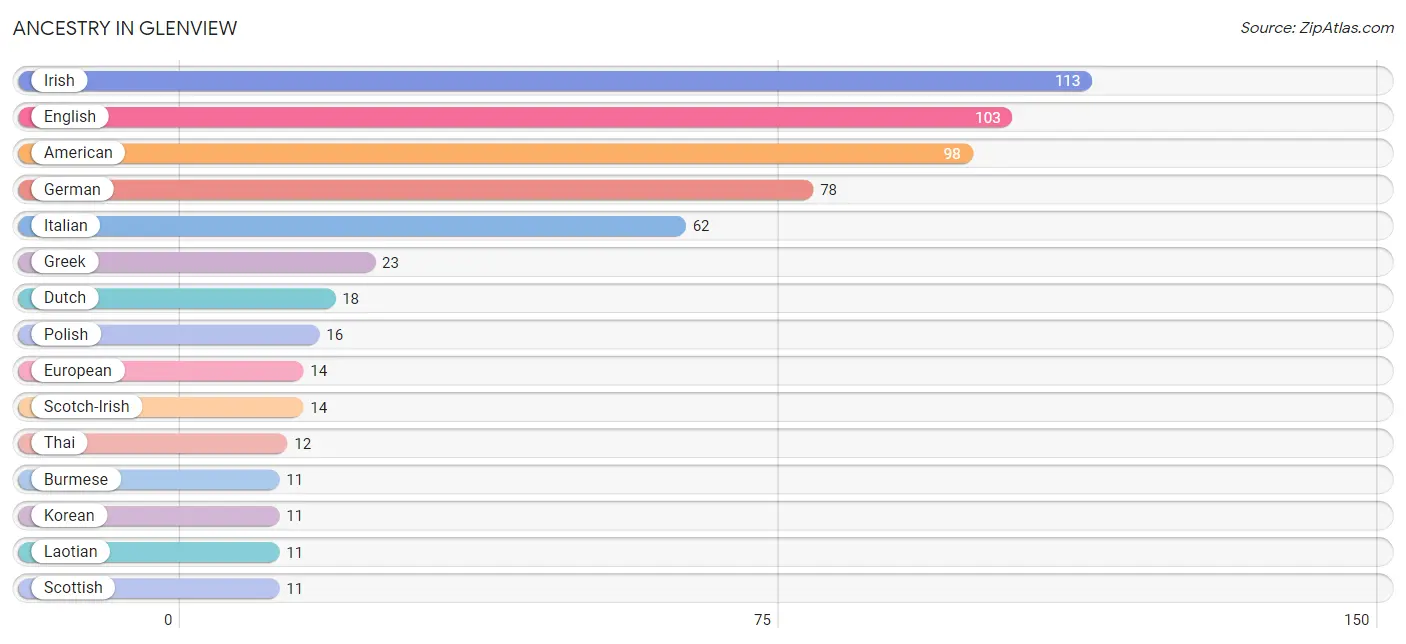
| Ancestry | # Population | % Population |
| American | 98 | 17.1% |
| Arab | 5 | 0.9% |
| British | 4 | 0.7% |
| Burmese | 11 | 1.9% |
| Canadian | 2 | 0.4% |
| Cuban | 4 | 0.7% |
| Dutch | 18 | 3.1% |
| Eastern European | 3 | 0.5% |
| English | 103 | 17.9% |
| European | 14 | 2.4% |
| French | 6 | 1.1% |
| German | 78 | 13.6% |
| Greek | 23 | 4.0% |
| Indian (Asian) | 3 | 0.5% |
| Iranian | 4 | 0.7% |
| Irish | 113 | 19.7% |
| Italian | 62 | 10.8% |
| Korean | 11 | 1.9% |
| Laotian | 11 | 1.9% |
| Lebanese | 3 | 0.5% |
| Norwegian | 2 | 0.4% |
| Palestinian | 2 | 0.4% |
| Polish | 16 | 2.8% |
| Russian | 5 | 0.9% |
| Scotch-Irish | 14 | 2.4% |
| Scottish | 11 | 1.9% |
| Spanish | 1 | 0.2% |
| Swedish | 2 | 0.4% |
| Swiss | 2 | 0.4% |
| Thai | 12 | 2.1% |
| Welsh | 2 | 0.4% | View All 31 Rows |
Immigrants in Glenview
The most numerous immigrant groups reported in Glenview came from Asia (24 | 4.2%), Eastern Asia (11 | 1.9%), South Central Asia (11 | 1.9%), Korea (8 | 1.4%), and India (7 | 1.2%), together accounting for 10.6% of all Glenview residents.
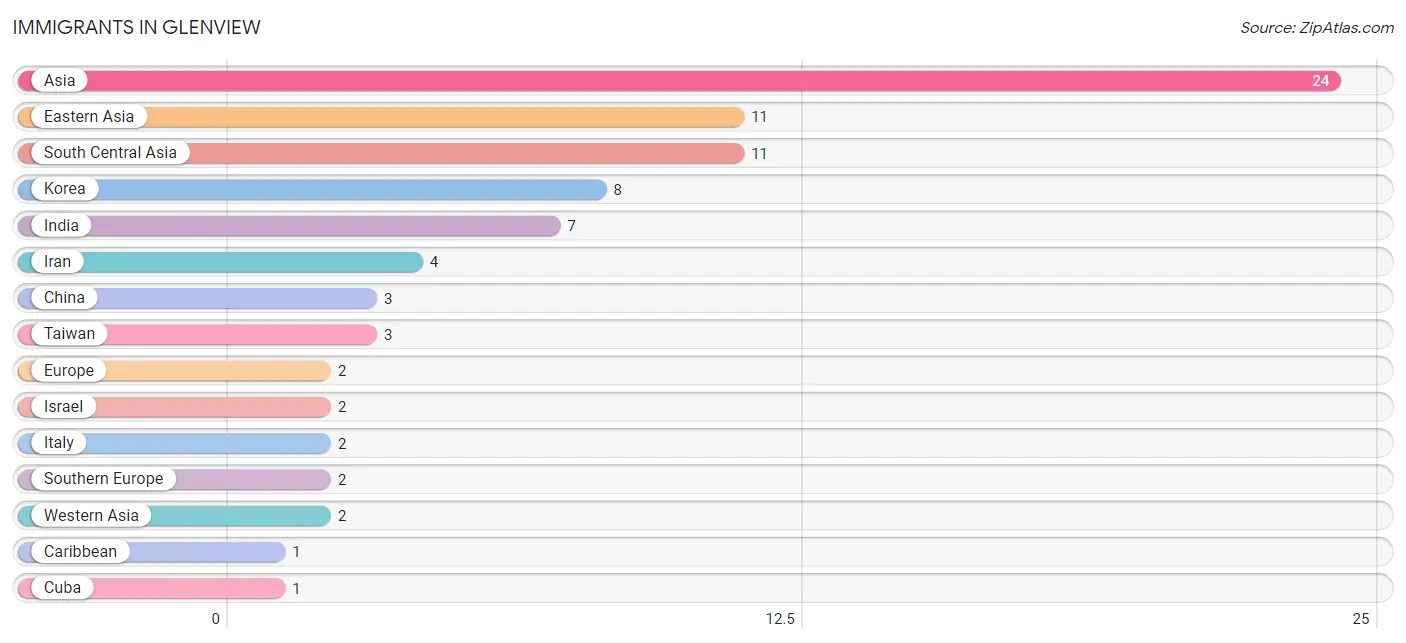
| Immigration Origin | # Population | % Population |
| Asia | 24 | 4.2% |
| Caribbean | 1 | 0.2% |
| China | 3 | 0.5% |
| Cuba | 1 | 0.2% |
| Eastern Asia | 11 | 1.9% |
| Europe | 2 | 0.4% |
| India | 7 | 1.2% |
| Iran | 4 | 0.7% |
| Israel | 2 | 0.4% |
| Italy | 2 | 0.4% |
| Korea | 8 | 1.4% |
| Latin America | 1 | 0.2% |
| South Central Asia | 11 | 1.9% |
| Southern Europe | 2 | 0.4% |
| Taiwan | 3 | 0.5% |
| Western Asia | 2 | 0.4% | View All 16 Rows |
Sex and Age in Glenview
Sex and Age in Glenview
The most populous age groups in Glenview are 55 to 59 Years (50 | 16.4%) for men and 60 to 64 Years (42 | 15.6%) for women.
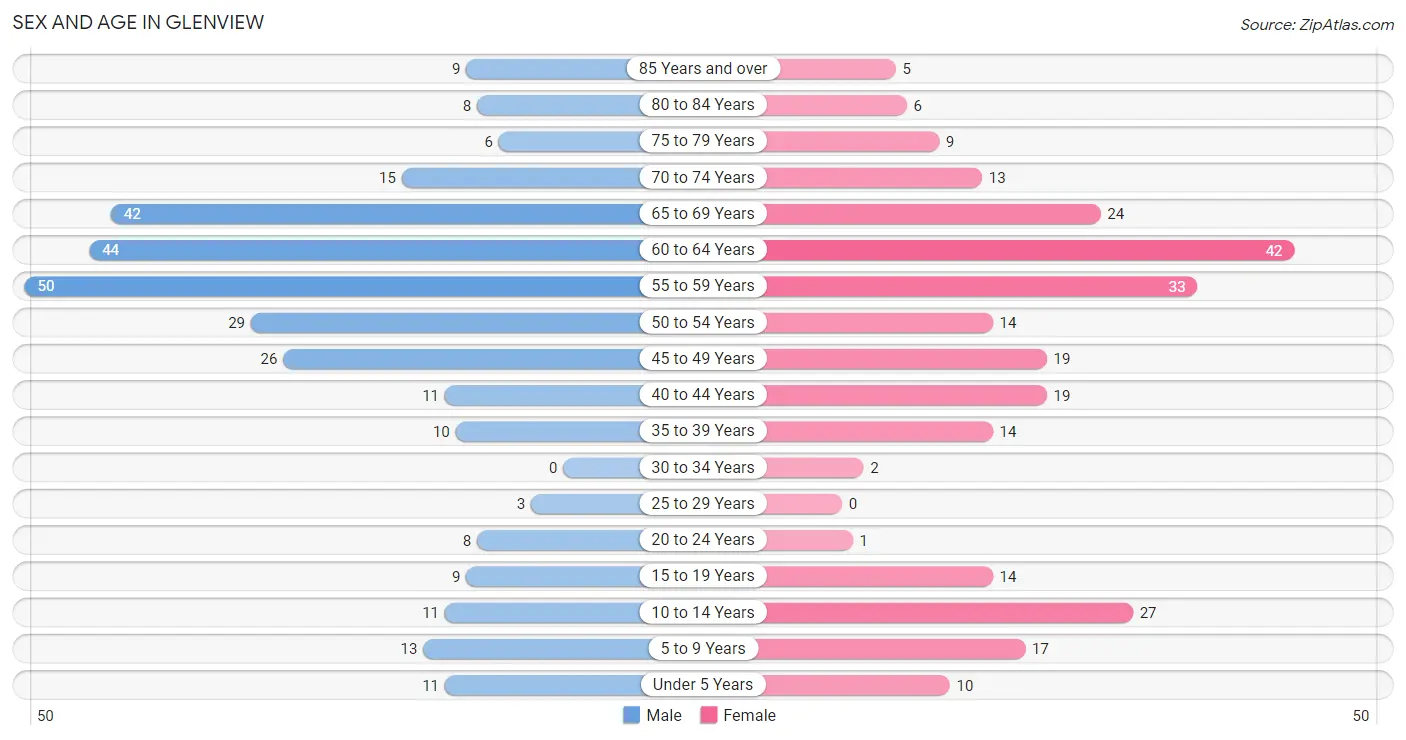
| Age Bracket | Male | Female |
| Under 5 Years | 11 (3.6%) | 10 (3.7%) |
| 5 to 9 Years | 13 (4.3%) | 17 (6.3%) |
| 10 to 14 Years | 11 (3.6%) | 27 (10.0%) |
| 15 to 19 Years | 9 (2.9%) | 14 (5.2%) |
| 20 to 24 Years | 8 (2.6%) | 1 (0.4%) |
| 25 to 29 Years | 3 (1.0%) | 0 (0.0%) |
| 30 to 34 Years | 0 (0.0%) | 2 (0.7%) |
| 35 to 39 Years | 10 (3.3%) | 14 (5.2%) |
| 40 to 44 Years | 11 (3.6%) | 19 (7.1%) |
| 45 to 49 Years | 26 (8.5%) | 19 (7.1%) |
| 50 to 54 Years | 29 (9.5%) | 14 (5.2%) |
| 55 to 59 Years | 50 (16.4%) | 33 (12.3%) |
| 60 to 64 Years | 44 (14.4%) | 42 (15.6%) |
| 65 to 69 Years | 42 (13.8%) | 24 (8.9%) |
| 70 to 74 Years | 15 (4.9%) | 13 (4.8%) |
| 75 to 79 Years | 6 (2.0%) | 9 (3.4%) |
| 80 to 84 Years | 8 (2.6%) | 6 (2.2%) |
| 85 Years and over | 9 (2.9%) | 5 (1.9%) |
| Total | 305 (100.0%) | 269 (100.0%) |
Families and Households in Glenview
Median Family Size in Glenview
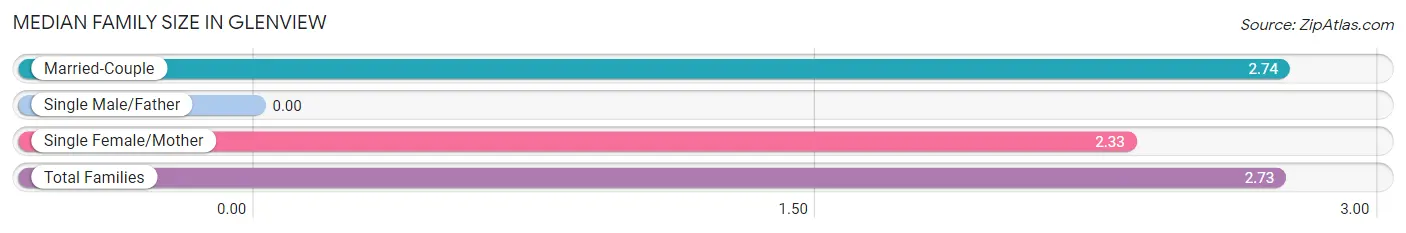
| Family Type | # Families | Family Size |
| Married-Couple | 180 (96.8%) | 2.74 |
| Single Male/Father | 0 (0.0%) | - |
| Single Female/Mother | 6 (3.2%) | 2.33 |
| Total Families | 186 (100.0%) | 2.73 |
Median Household Size in Glenview
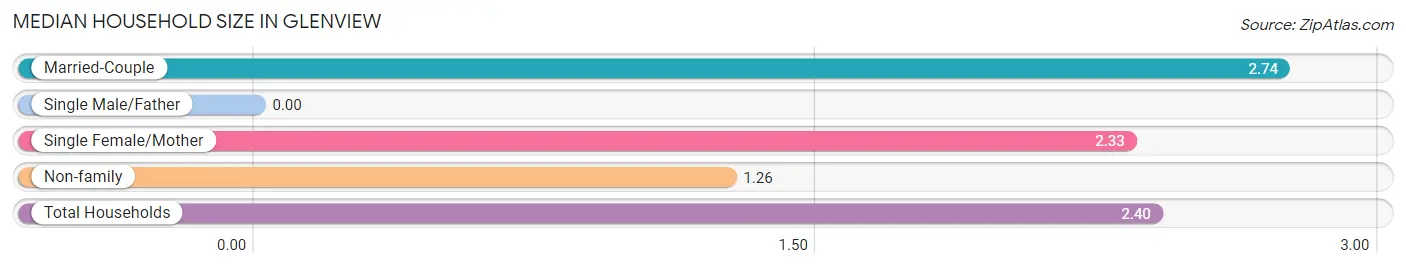
| Household Type | # Households | Household Size |
| Married-Couple | 180 (75.3%) | 2.74 |
| Single Male/Father | 0 (0.0%) | - |
| Single Female/Mother | 6 (2.5%) | 2.33 |
| Non-family | 53 (22.2%) | 1.26 |
| Total Households | 239 (100.0%) | 2.40 |
Household Size by Marriage Status in Glenview
Out of a total of 239 households in Glenview, 186 (77.8%) are family households, while 53 (22.2%) are nonfamily households. The most numerous type of family households are 2-person households, comprising 120, and the most common type of nonfamily households are 1-person households, comprising 40.
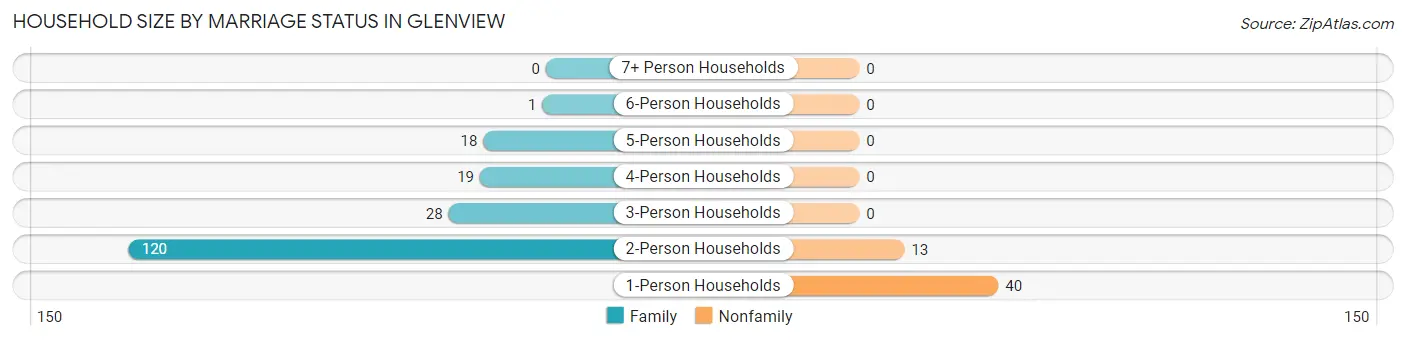
| Household Size | Family Households | Nonfamily Households |
| 1-Person Households | - | 40 (16.7%) |
| 2-Person Households | 120 (50.2%) | 13 (5.4%) |
| 3-Person Households | 28 (11.7%) | 0 (0.0%) |
| 4-Person Households | 19 (8.0%) | 0 (0.0%) |
| 5-Person Households | 18 (7.5%) | 0 (0.0%) |
| 6-Person Households | 1 (0.4%) | 0 (0.0%) |
| 7+ Person Households | 0 (0.0%) | 0 (0.0%) |
| Total | 186 (77.8%) | 53 (22.2%) |
Female Fertility in Glenview
Fertility by Age in Glenview
Average fertility rate in Glenview is 29.0 births per 1,000 women. Women in the age bracket of 35 to 50 years have the highest fertility rate with 38.0 births per 1,000 women. Women in the age bracket of 35 to 50 years acount for 100.0% of all women with births.
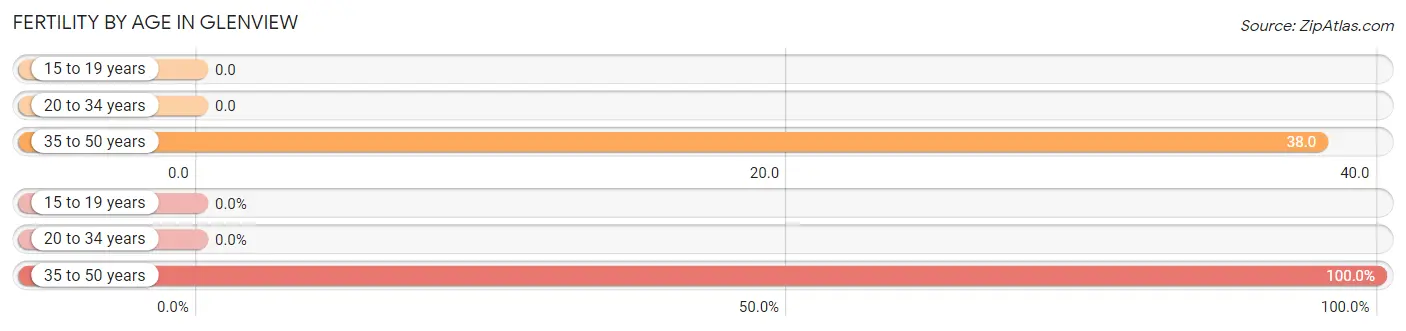
| Age Bracket | Women with Births | Births / 1,000 Women |
| 15 to 19 years | 0 (0.0%) | 0.0 |
| 20 to 34 years | 0 (0.0%) | 0.0 |
| 35 to 50 years | 2 (100.0%) | 38.0 |
| Total | 2 (100.0%) | 29.0 |
Fertility by Age by Marriage Status in Glenview

| Age Bracket | Married | Unmarried |
| 15 to 19 years | 0 (0.0%) | 0 (0.0%) |
| 20 to 34 years | 0 (0.0%) | 0 (0.0%) |
| 35 to 50 years | 2 (100.0%) | 0 (0.0%) |
| Total | 2 (100.0%) | 0 (0.0%) |
Fertility by Education in Glenview
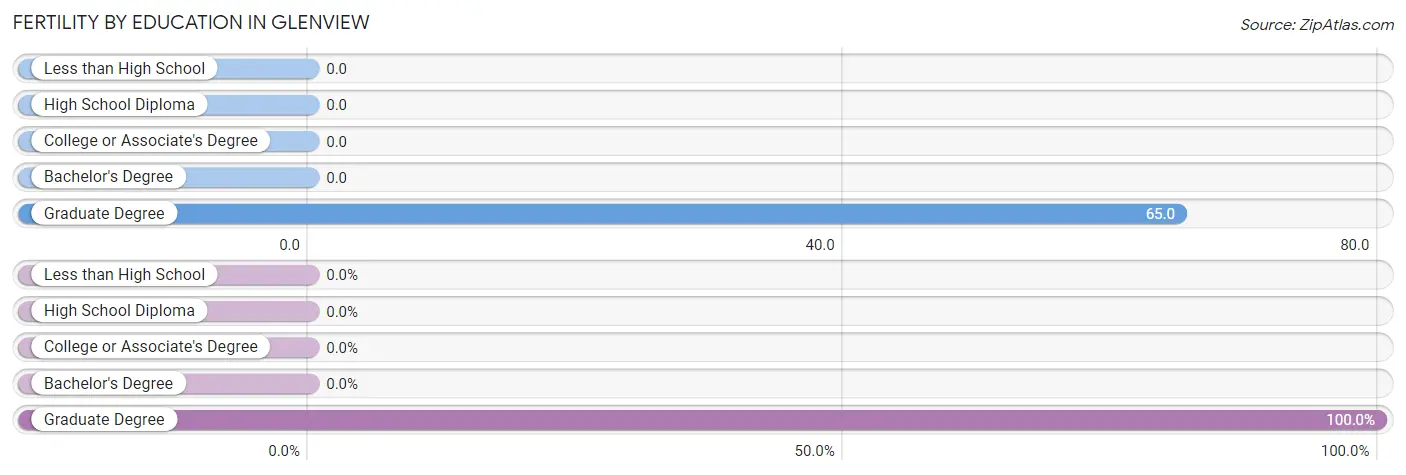
| Educational Attainment | Women with Births | Births / 1,000 Women |
| Less than High School | 0 (0.0%) | 0.0 |
| High School Diploma | 0 (0.0%) | 0.0 |
| College or Associate's Degree | 0 (0.0%) | 0.0 |
| Bachelor's Degree | 0 (0.0%) | 0.0 |
| Graduate Degree | 2 (100.0%) | 65.0 |
| Total | 2 (100.0%) | 29.0 |
Fertility by Education by Marriage Status in Glenview
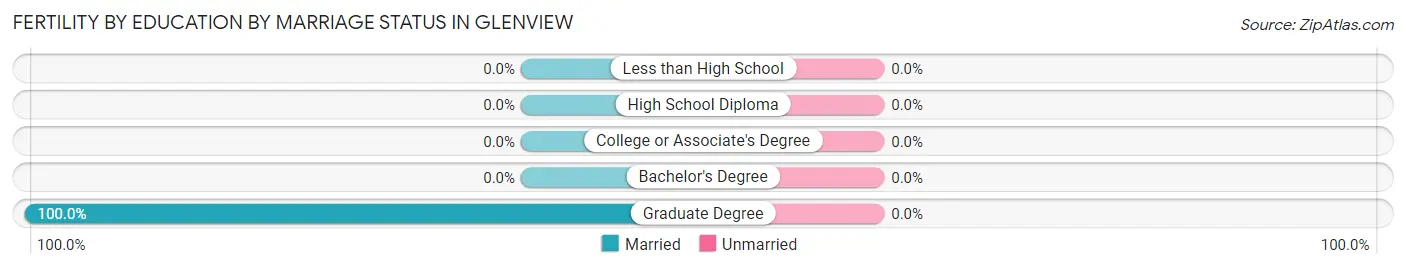
| Educational Attainment | Married | Unmarried |
| Less than High School | 0 (0.0%) | 0 (0.0%) |
| High School Diploma | 0 (0.0%) | 0 (0.0%) |
| College or Associate's Degree | 0 (0.0%) | 0 (0.0%) |
| Bachelor's Degree | 0 (0.0%) | 0 (0.0%) |
| Graduate Degree | 2 (100.0%) | 0 (0.0%) |
| Total | 2 (100.0%) | 0 (0.0%) |
Employment Characteristics in Glenview
Employment by Class of Employer in Glenview
Among the 285 employed individuals in Glenview, private company employees (153 | 53.7%), self-employed (incorporated) (67 | 23.5%), and self-employed (not incorporated) (32 | 11.2%) make up the most common classes of employment.
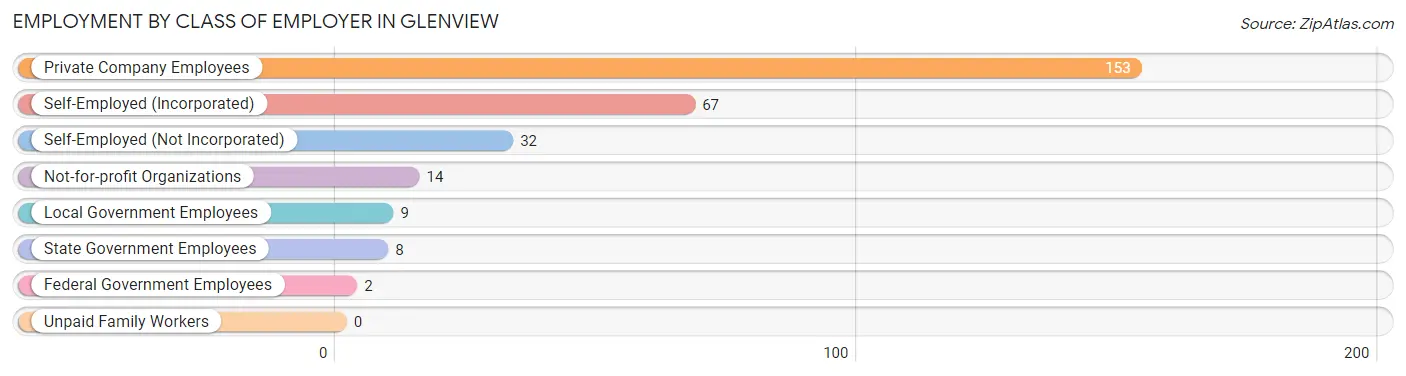
| Employer Class | # Employees | % Employees |
| Private Company Employees | 153 | 53.7% |
| Self-Employed (Incorporated) | 67 | 23.5% |
| Self-Employed (Not Incorporated) | 32 | 11.2% |
| Not-for-profit Organizations | 14 | 4.9% |
| Local Government Employees | 9 | 3.2% |
| State Government Employees | 8 | 2.8% |
| Federal Government Employees | 2 | 0.7% |
| Unpaid Family Workers | 0 | 0.0% |
| Total | 285 | 100.0% |
Employment Status by Age in Glenview
According to the labor force statistics for Glenview, out of the total population over 16 years of age (478), 60.7% or 290 individuals are in the labor force, with 1.0% or 3 of them unemployed. The age group with the highest labor force participation rate is 25 to 29 years, with 100.0% or 3 individuals in the labor force. Within the labor force, the 65 to 74 years age range has the highest percentage of unemployed individuals, with 3.9% or 2 of them being unemployed.
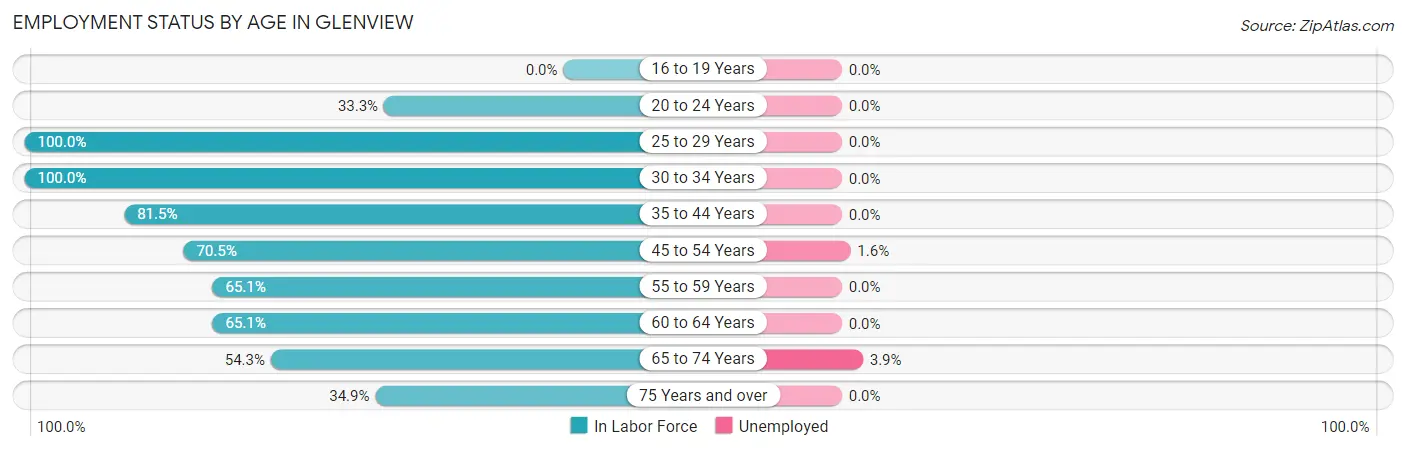
| Age Bracket | In Labor Force | Unemployed |
| 16 to 19 Years | 0 (0.0%) | 0 (0.0%) |
| 20 to 24 Years | 3 (33.3%) | 0 (0.0%) |
| 25 to 29 Years | 3 (100.0%) | 0 (0.0%) |
| 30 to 34 Years | 2 (100.0%) | 0 (0.0%) |
| 35 to 44 Years | 44 (81.5%) | 0 (0.0%) |
| 45 to 54 Years | 62 (70.5%) | 1 (1.6%) |
| 55 to 59 Years | 54 (65.1%) | 0 (0.0%) |
| 60 to 64 Years | 56 (65.1%) | 0 (0.0%) |
| 65 to 74 Years | 51 (54.3%) | 2 (3.9%) |
| 75 Years and over | 15 (34.9%) | 0 (0.0%) |
| Total | 290 (60.7%) | 3 (1.0%) |
Employment Status by Educational Attainment in Glenview
According to labor force statistics for Glenview, 69.9% of individuals (221) out of the total population between 25 and 64 years of age (316) are in the labor force, with 0.5% or 1 of them being unemployed. The group with the highest labor force participation rate are those with the educational attainment of bachelor's degree or higher, with 73.5% or 208 individuals in the labor force. Within the labor force, individuals with college / associate degree education have the highest percentage of unemployment, with 7.7% or 1 of them being unemployed.
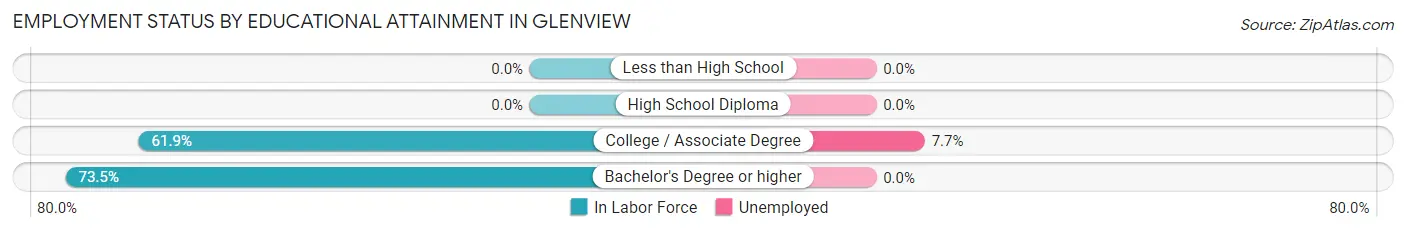
| Educational Attainment | In Labor Force | Unemployed |
| Less than High School | 0 (0.0%) | 0 (0.0%) |
| High School Diploma | 0 (0.0%) | 0 (0.0%) |
| College / Associate Degree | 13 (61.9%) | 2 (7.7%) |
| Bachelor's Degree or higher | 208 (73.5%) | 0 (0.0%) |
| Total | 221 (69.9%) | 2 (0.5%) |
Employment Occupations by Sex in Glenview
Management, Business, Science and Arts Occupations
The most common Management, Business, Science and Arts occupations in Glenview are Management (81 | 28.2%), Health Diagnosing & Treating (71 | 24.7%), Health Technologists (70 | 24.4%), Community & Social Service (55 | 19.2%), and Legal Services & Support (32 | 11.2%).
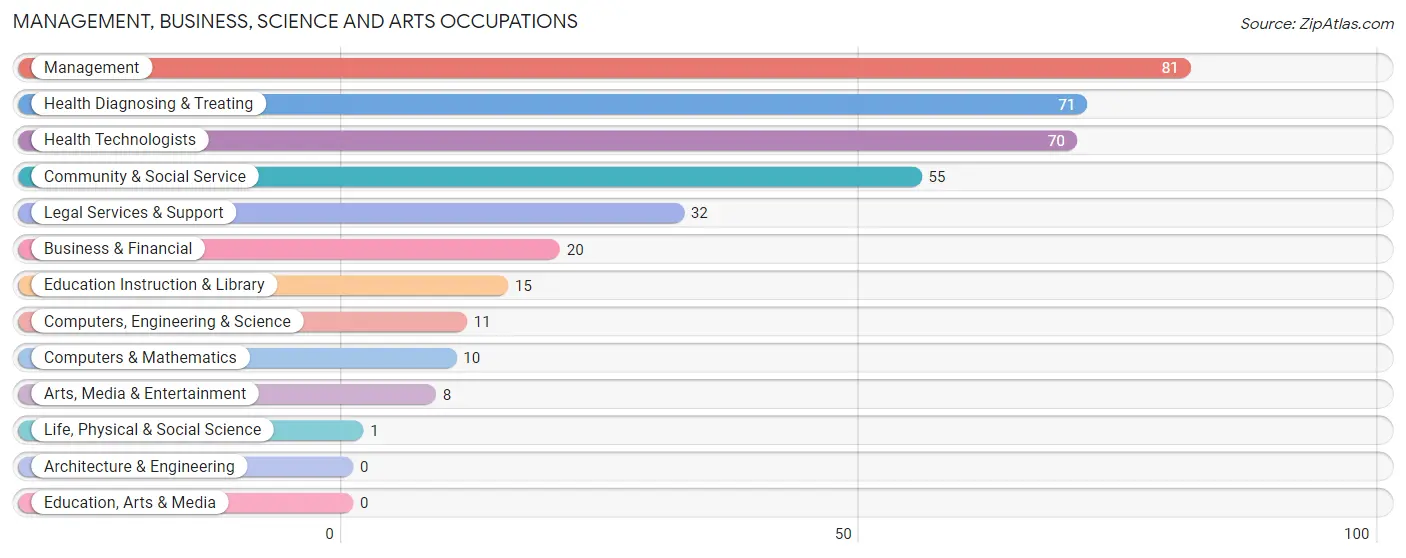
Management, Business, Science and Arts Occupations by Sex
Within the Management, Business, Science and Arts occupations in Glenview, the most male-oriented occupations are Legal Services & Support (90.6%), Management (90.1%), and Business & Financial (80.0%), while the most female-oriented occupations are Life, Physical & Social Science (100.0%), Computers, Engineering & Science (81.8%), and Computers & Mathematics (80.0%).
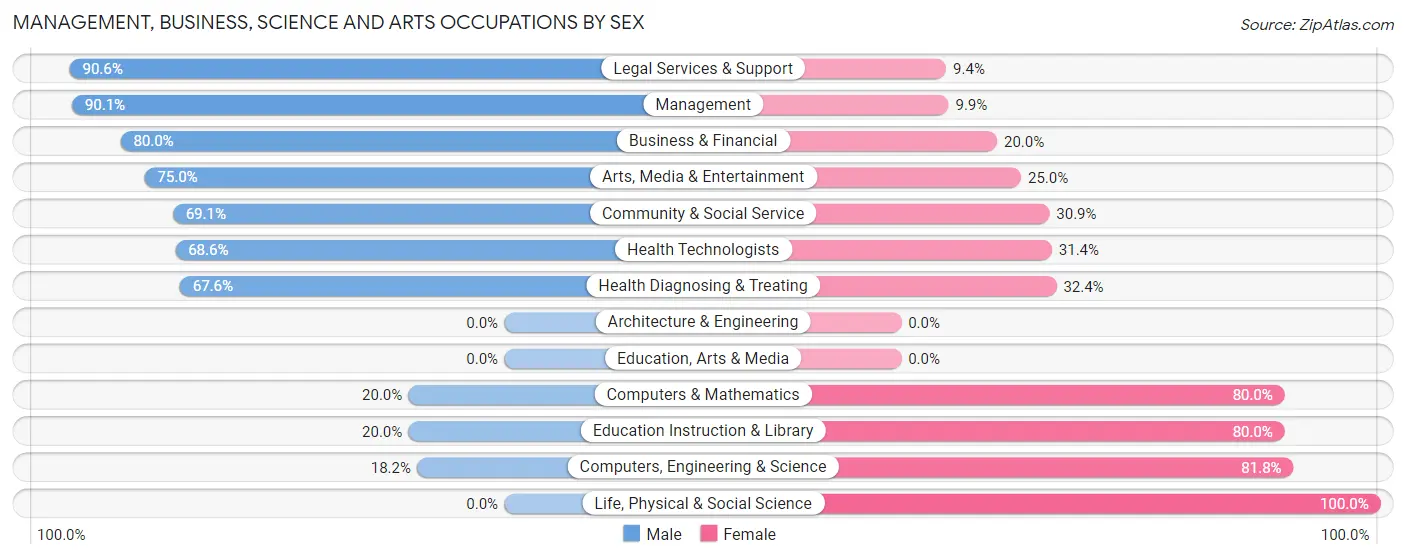
| Occupation | Male | Female |
| Management | 73 (90.1%) | 8 (9.9%) |
| Business & Financial | 16 (80.0%) | 4 (20.0%) |
| Computers, Engineering & Science | 2 (18.2%) | 9 (81.8%) |
| Computers & Mathematics | 2 (20.0%) | 8 (80.0%) |
| Architecture & Engineering | 0 (0.0%) | 0 (0.0%) |
| Life, Physical & Social Science | 0 (0.0%) | 1 (100.0%) |
| Community & Social Service | 38 (69.1%) | 17 (30.9%) |
| Education, Arts & Media | 0 (0.0%) | 0 (0.0%) |
| Legal Services & Support | 29 (90.6%) | 3 (9.4%) |
| Education Instruction & Library | 3 (20.0%) | 12 (80.0%) |
| Arts, Media & Entertainment | 6 (75.0%) | 2 (25.0%) |
| Health Diagnosing & Treating | 48 (67.6%) | 23 (32.4%) |
| Health Technologists | 48 (68.6%) | 22 (31.4%) |
| Total (Category) | 177 (74.4%) | 61 (25.6%) |
| Total (Overall) | 208 (72.5%) | 79 (27.5%) |
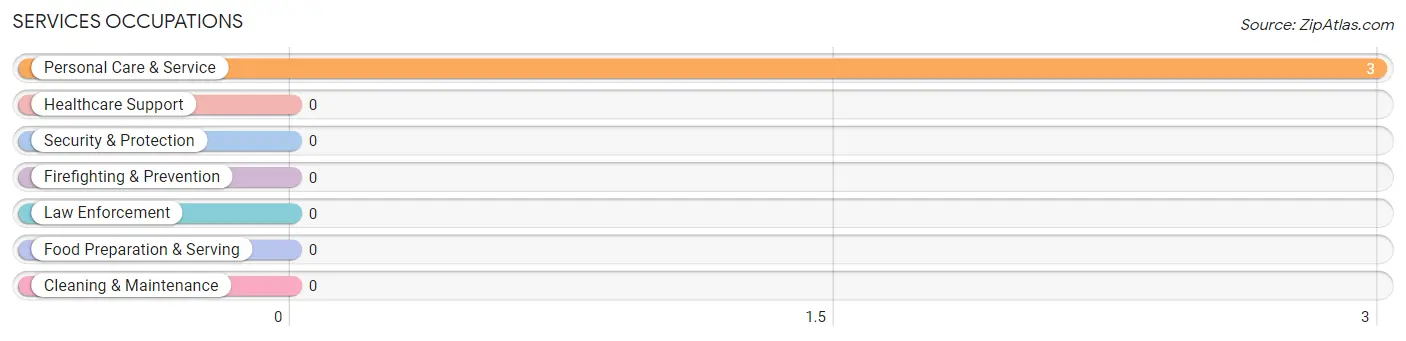
Services Occupations
The most common Services occupations in Glenview are , and Personal Care & Service (3 | 1.1%).
Services Occupations by Sex
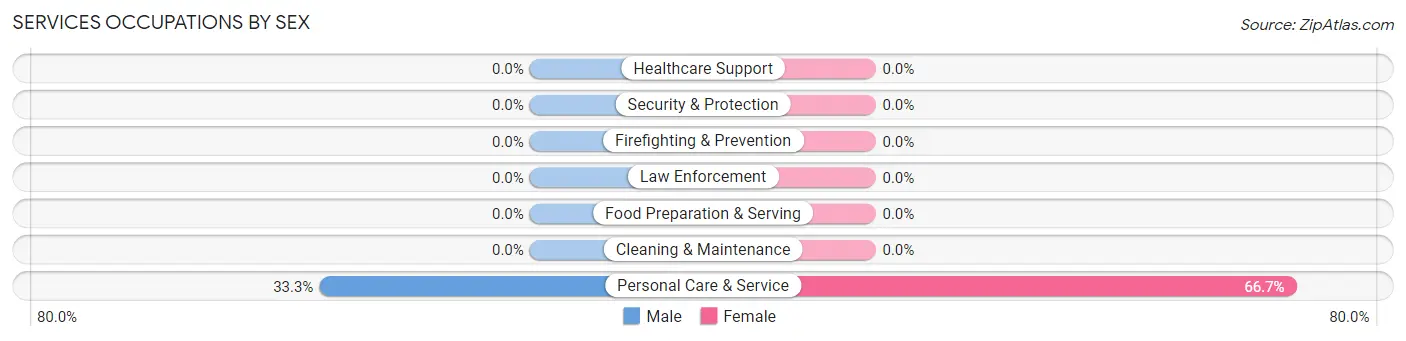
| Occupation | Male | Female |
| Healthcare Support | 0 (0.0%) | 0 (0.0%) |
| Security & Protection | 0 (0.0%) | 0 (0.0%) |
| Firefighting & Prevention | 0 (0.0%) | 0 (0.0%) |
| Law Enforcement | 0 (0.0%) | 0 (0.0%) |
| Food Preparation & Serving | 0 (0.0%) | 0 (0.0%) |
| Cleaning & Maintenance | 0 (0.0%) | 0 (0.0%) |
| Personal Care & Service | 1 (33.3%) | 2 (66.7%) |
| Total (Category) | 1 (33.3%) | 2 (66.7%) |
| Total (Overall) | 208 (72.5%) | 79 (27.5%) |
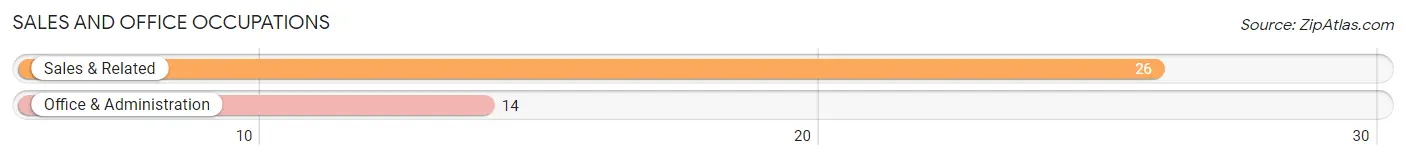
Sales and Office Occupations
The most common Sales and Office occupations in Glenview are Sales & Related (26 | 9.1%), and Office & Administration (14 | 4.9%).
Sales and Office Occupations by Sex
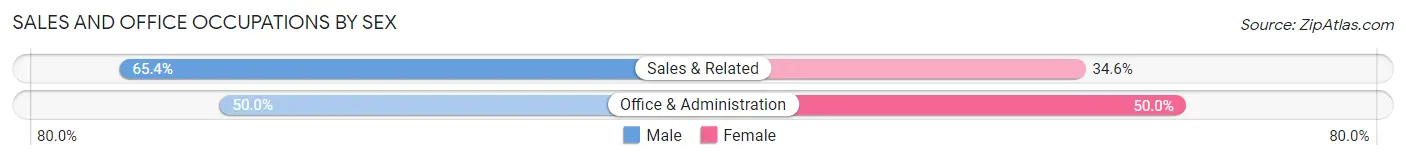
| Occupation | Male | Female |
| Sales & Related | 17 (65.4%) | 9 (34.6%) |
| Office & Administration | 7 (50.0%) | 7 (50.0%) |
| Total (Category) | 24 (60.0%) | 16 (40.0%) |
| Total (Overall) | 208 (72.5%) | 79 (27.5%) |
Natural Resources, Construction and Maintenance Occupations
The most common Natural Resources, Construction and Maintenance occupations in Glenview are , and Construction & Extraction (3 | 1.1%).
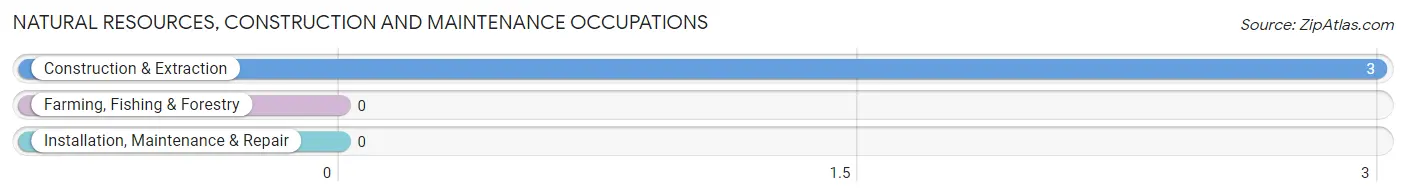
Natural Resources, Construction and Maintenance Occupations by Sex
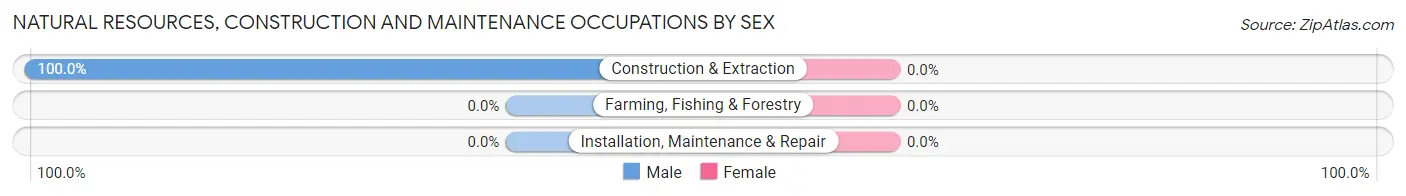
| Occupation | Male | Female |
| Farming, Fishing & Forestry | 0 (0.0%) | 0 (0.0%) |
| Construction & Extraction | 3 (100.0%) | 0 (0.0%) |
| Installation, Maintenance & Repair | 0 (0.0%) | 0 (0.0%) |
| Total (Category) | 3 (100.0%) | 0 (0.0%) |
| Total (Overall) | 208 (72.5%) | 79 (27.5%) |
Production, Transportation and Moving Occupations
The most common Production, Transportation and Moving occupations in Glenview are , and Material Moving (3 | 1.1%).
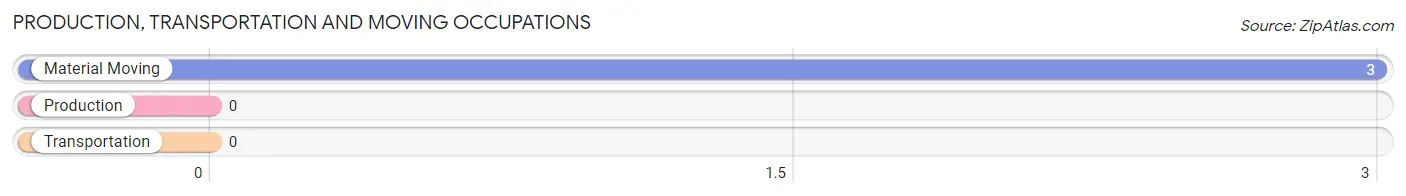
Production, Transportation and Moving Occupations by Sex
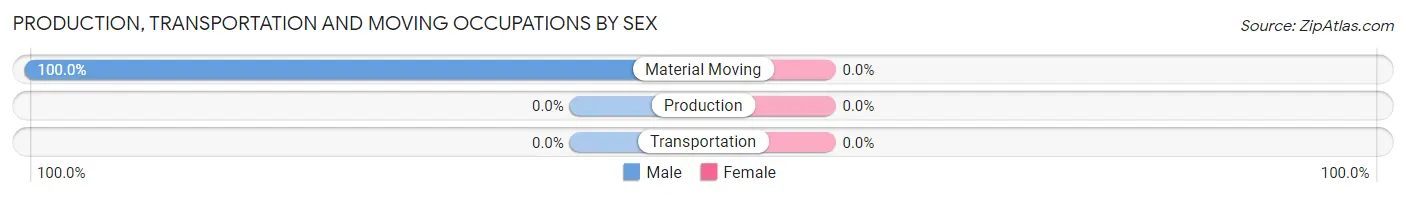
| Occupation | Male | Female |
| Production | 0 (0.0%) | 0 (0.0%) |
| Transportation | 0 (0.0%) | 0 (0.0%) |
| Material Moving | 3 (100.0%) | 0 (0.0%) |
| Total (Category) | 3 (100.0%) | 0 (0.0%) |
| Total (Overall) | 208 (72.5%) | 79 (27.5%) |
Employment Industries by Sex in Glenview
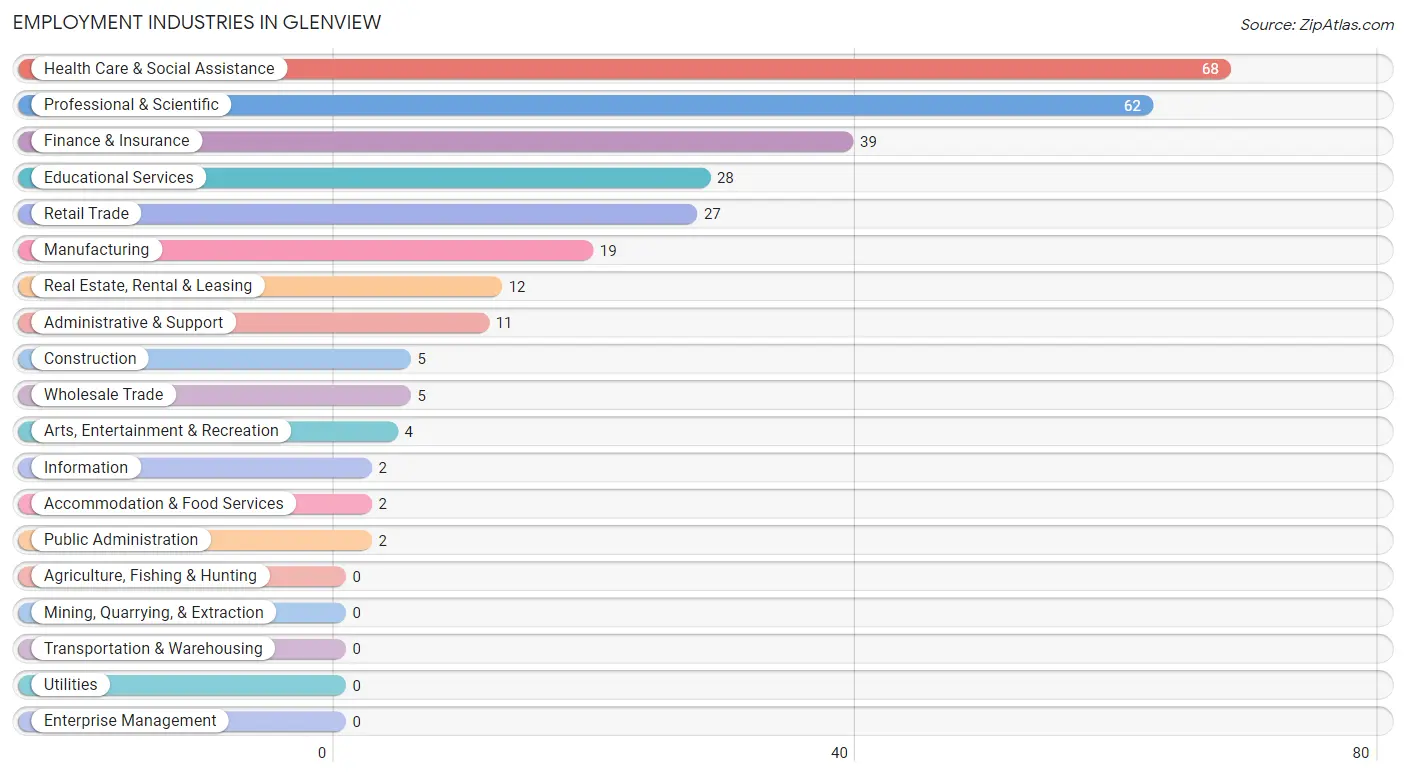
Employment Industries in Glenview
The major employment industries in Glenview include Health Care & Social Assistance (68 | 23.7%), Professional & Scientific (62 | 21.6%), Finance & Insurance (39 | 13.6%), Educational Services (28 | 9.8%), and Retail Trade (27 | 9.4%).
Employment Industries by Sex in Glenview
The Glenview industries that see more men than women are Construction (100.0%), Wholesale Trade (100.0%), and Information (100.0%), whereas the industries that tend to have a higher number of women are Arts, Entertainment & Recreation (100.0%), Educational Services (67.9%), and Manufacturing (42.1%).
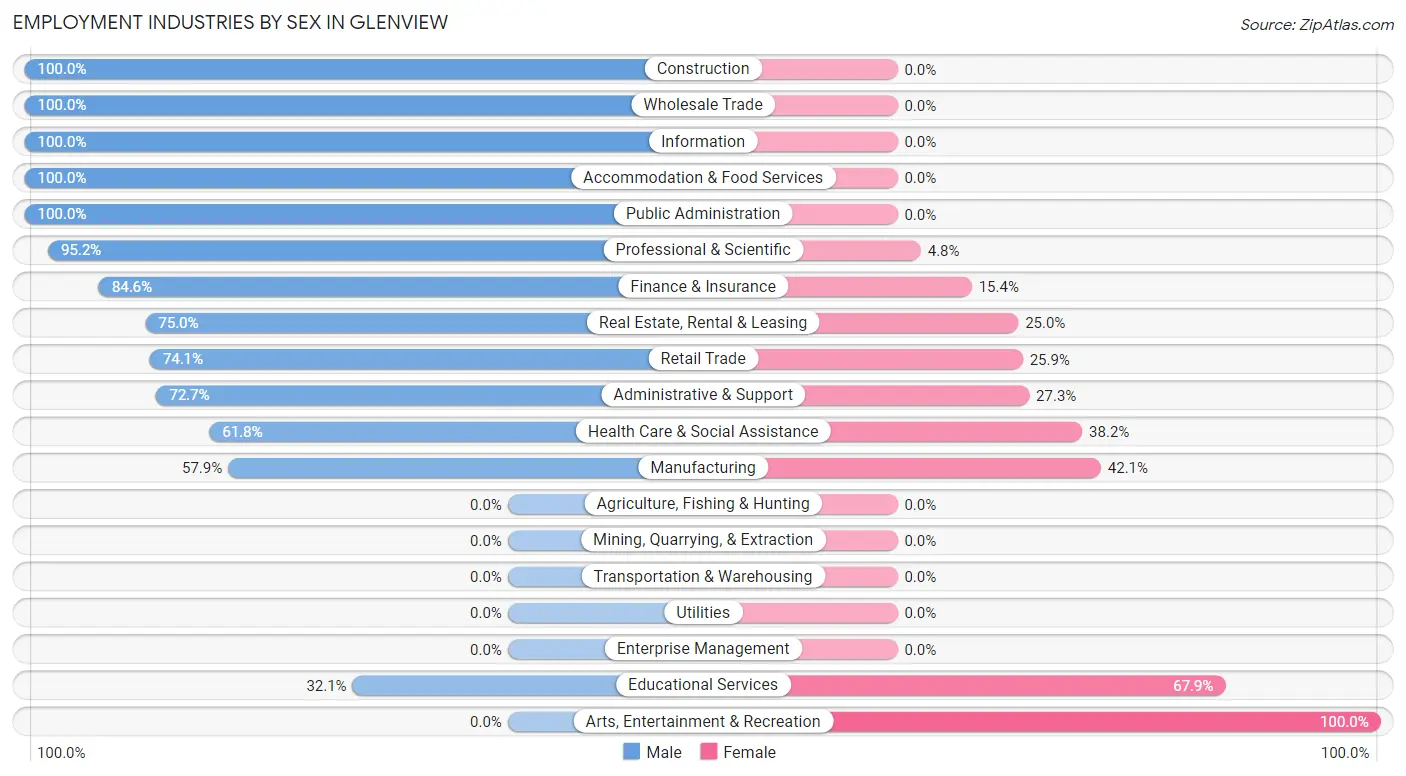
| Industry | Male | Female |
| Agriculture, Fishing & Hunting | 0 (0.0%) | 0 (0.0%) |
| Mining, Quarrying, & Extraction | 0 (0.0%) | 0 (0.0%) |
| Construction | 5 (100.0%) | 0 (0.0%) |
| Manufacturing | 11 (57.9%) | 8 (42.1%) |
| Wholesale Trade | 5 (100.0%) | 0 (0.0%) |
| Retail Trade | 20 (74.1%) | 7 (25.9%) |
| Transportation & Warehousing | 0 (0.0%) | 0 (0.0%) |
| Utilities | 0 (0.0%) | 0 (0.0%) |
| Information | 2 (100.0%) | 0 (0.0%) |
| Finance & Insurance | 33 (84.6%) | 6 (15.4%) |
| Real Estate, Rental & Leasing | 9 (75.0%) | 3 (25.0%) |
| Professional & Scientific | 59 (95.2%) | 3 (4.8%) |
| Enterprise Management | 0 (0.0%) | 0 (0.0%) |
| Administrative & Support | 8 (72.7%) | 3 (27.3%) |
| Educational Services | 9 (32.1%) | 19 (67.9%) |
| Health Care & Social Assistance | 42 (61.8%) | 26 (38.2%) |
| Arts, Entertainment & Recreation | 0 (0.0%) | 4 (100.0%) |
| Accommodation & Food Services | 2 (100.0%) | 0 (0.0%) |
| Public Administration | 2 (100.0%) | 0 (0.0%) |
| Total | 208 (72.5%) | 79 (27.5%) |
Education in Glenview
School Enrollment in Glenview
The most common levels of schooling among the 101 students in Glenview are elementary school (37 | 36.6%), high school (29 | 28.7%), and middle school (19 | 18.8%).
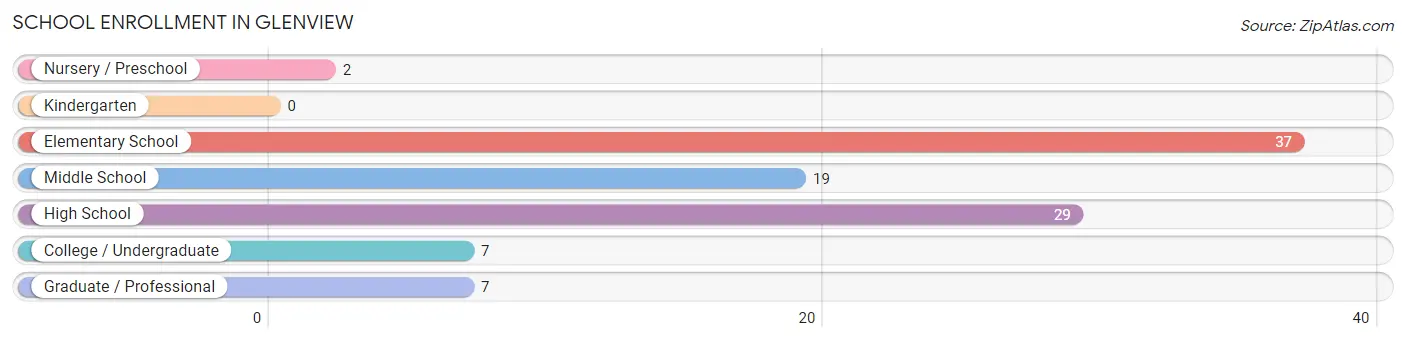
| School Level | # Students | % Students |
| Nursery / Preschool | 2 | 2.0% |
| Kindergarten | 0 | 0.0% |
| Elementary School | 37 | 36.6% |
| Middle School | 19 | 18.8% |
| High School | 29 | 28.7% |
| College / Undergraduate | 7 | 6.9% |
| Graduate / Professional | 7 | 6.9% |
| Total | 101 | 100.0% |
School Enrollment by Age by Funding Source in Glenview
Out of a total of 101 students who are enrolled in schools in Glenview, 76 (75.2%) attend a private institution, while the remaining 25 (24.8%) are enrolled in public schools. The age group of 3 to 4 year olds has the highest likelihood of being enrolled in private schools, with 2 (100.0% in the age bracket) enrolled. Conversely, the age group of 25 to 34 year olds has the lowest likelihood of being enrolled in a private school, with 3 (100.0% in the age bracket) attending a public institution.
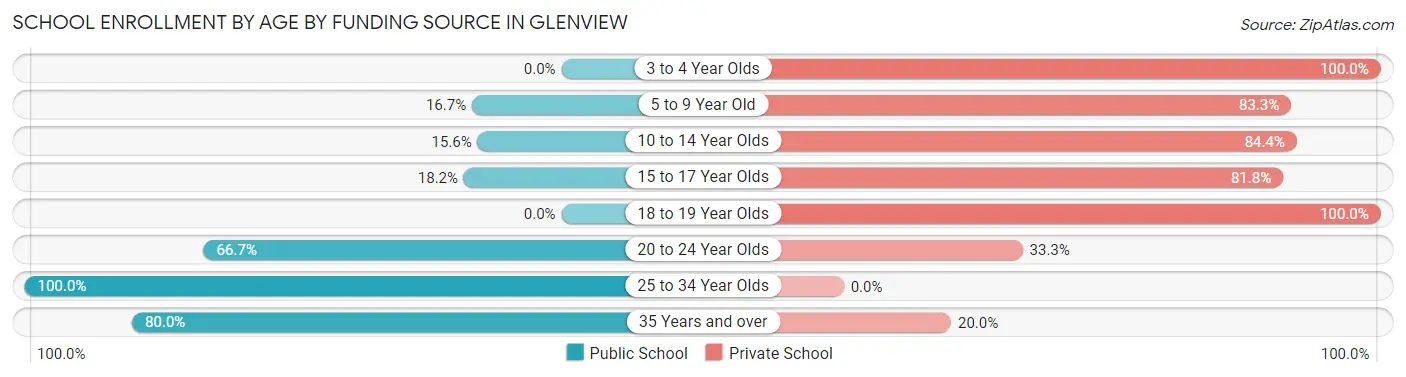
| Age Bracket | Public School | Private School |
| 3 to 4 Year Olds | 0 (0.0%) | 2 (100.0%) |
| 5 to 9 Year Old | 5 (16.7%) | 25 (83.3%) |
| 10 to 14 Year Olds | 5 (15.6%) | 27 (84.4%) |
| 15 to 17 Year Olds | 4 (18.2%) | 18 (81.8%) |
| 18 to 19 Year Olds | 0 (0.0%) | 1 (100.0%) |
| 20 to 24 Year Olds | 4 (66.7%) | 2 (33.3%) |
| 25 to 34 Year Olds | 3 (100.0%) | 0 (0.0%) |
| 35 Years and over | 4 (80.0%) | 1 (20.0%) |
| Total | 25 (24.8%) | 76 (75.2%) |
Educational Attainment by Field of Study in Glenview
Business (70 | 16.6%), bio, nature & agricultural (59 | 14.0%), liberal arts & history (53 | 12.6%), engineering (35 | 8.3%), and literature & languages (31 | 7.4%) are the most common fields of study among 421 individuals in Glenview who have obtained a bachelor's degree or higher.
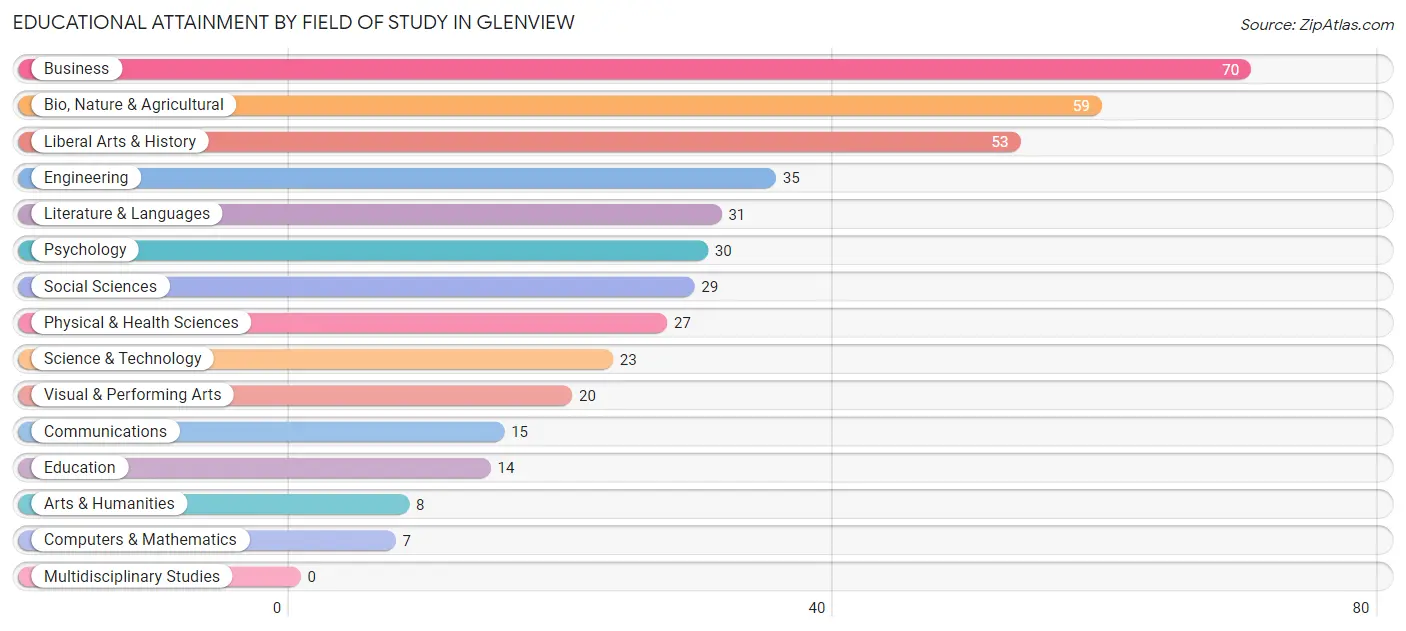
| Field of Study | # Graduates | % Graduates |
| Computers & Mathematics | 7 | 1.7% |
| Bio, Nature & Agricultural | 59 | 14.0% |
| Physical & Health Sciences | 27 | 6.4% |
| Psychology | 30 | 7.1% |
| Social Sciences | 29 | 6.9% |
| Engineering | 35 | 8.3% |
| Multidisciplinary Studies | 0 | 0.0% |
| Science & Technology | 23 | 5.5% |
| Business | 70 | 16.6% |
| Education | 14 | 3.3% |
| Literature & Languages | 31 | 7.4% |
| Liberal Arts & History | 53 | 12.6% |
| Visual & Performing Arts | 20 | 4.8% |
| Communications | 15 | 3.6% |
| Arts & Humanities | 8 | 1.9% |
| Total | 421 | 100.0% |
Transportation & Commute in Glenview
Vehicle Availability by Sex in Glenview
The most prevalent vehicle ownership categories in Glenview are males with 2 vehicles (92, accounting for 44.7%) and females with 2 vehicles (45, making up 116.5%).
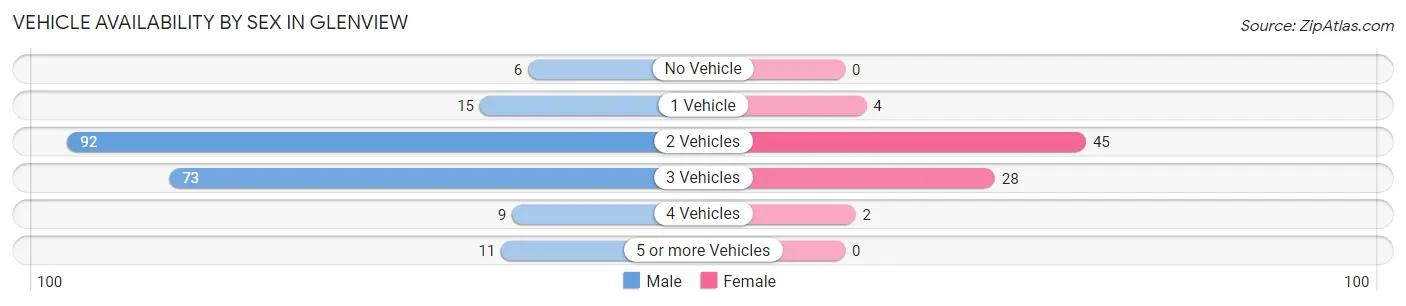
| Vehicles Available | Male | Female |
| No Vehicle | 6 (2.9%) | 0 (0.0%) |
| 1 Vehicle | 15 (7.3%) | 4 (5.1%) |
| 2 Vehicles | 92 (44.7%) | 45 (57.0%) |
| 3 Vehicles | 73 (35.4%) | 28 (35.4%) |
| 4 Vehicles | 9 (4.4%) | 2 (2.5%) |
| 5 or more Vehicles | 11 (5.3%) | 0 (0.0%) |
| Total | 206 (100.0%) | 79 (100.0%) |
Commute Time in Glenview
The most frequently occuring commute durations in Glenview are 15 to 19 minutes (92 commuters, 42.8%), 20 to 24 minutes (62 commuters, 28.8%), and 30 to 34 minutes (20 commuters, 9.3%).
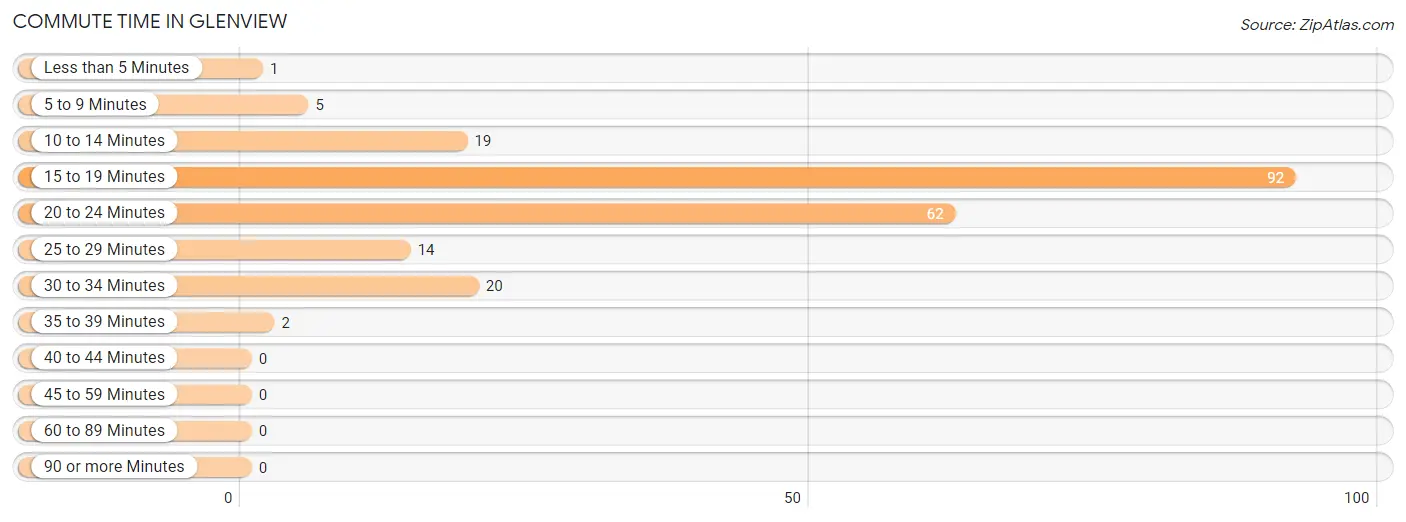
| Commute Time | # Commuters | % Commuters |
| Less than 5 Minutes | 1 | 0.5% |
| 5 to 9 Minutes | 5 | 2.3% |
| 10 to 14 Minutes | 19 | 8.8% |
| 15 to 19 Minutes | 92 | 42.8% |
| 20 to 24 Minutes | 62 | 28.8% |
| 25 to 29 Minutes | 14 | 6.5% |
| 30 to 34 Minutes | 20 | 9.3% |
| 35 to 39 Minutes | 2 | 0.9% |
| 40 to 44 Minutes | 0 | 0.0% |
| 45 to 59 Minutes | 0 | 0.0% |
| 60 to 89 Minutes | 0 | 0.0% |
| 90 or more Minutes | 0 | 0.0% |
Commute Time by Sex in Glenview
The most common commute times in Glenview are 15 to 19 minutes (70 commuters, 47.3%) for males and 15 to 19 minutes (22 commuters, 32.8%) for females.
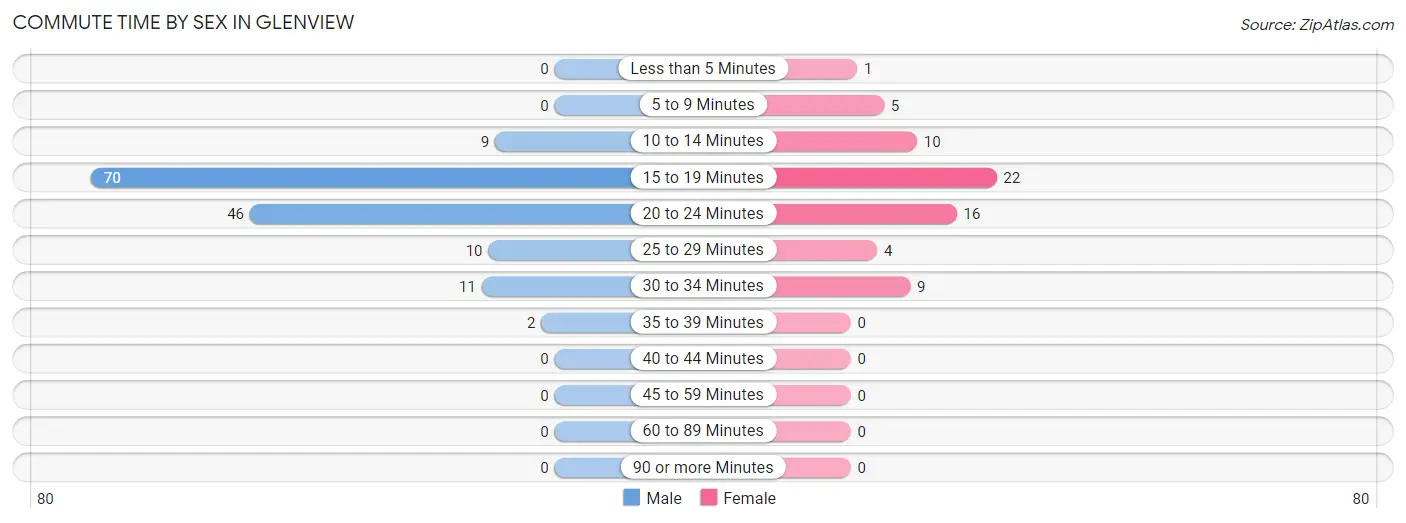
| Commute Time | Male | Female |
| Less than 5 Minutes | 0 (0.0%) | 1 (1.5%) |
| 5 to 9 Minutes | 0 (0.0%) | 5 (7.5%) |
| 10 to 14 Minutes | 9 (6.1%) | 10 (14.9%) |
| 15 to 19 Minutes | 70 (47.3%) | 22 (32.8%) |
| 20 to 24 Minutes | 46 (31.1%) | 16 (23.9%) |
| 25 to 29 Minutes | 10 (6.8%) | 4 (6.0%) |
| 30 to 34 Minutes | 11 (7.4%) | 9 (13.4%) |
| 35 to 39 Minutes | 2 (1.3%) | 0 (0.0%) |
| 40 to 44 Minutes | 0 (0.0%) | 0 (0.0%) |
| 45 to 59 Minutes | 0 (0.0%) | 0 (0.0%) |
| 60 to 89 Minutes | 0 (0.0%) | 0 (0.0%) |
| 90 or more Minutes | 0 (0.0%) | 0 (0.0%) |
Time of Departure to Work by Sex in Glenview
The most frequent times of departure to work in Glenview are 7:00 AM to 7:29 AM (28, 18.9%) for males and 8:00 AM to 8:29 AM (18, 26.9%) for females.
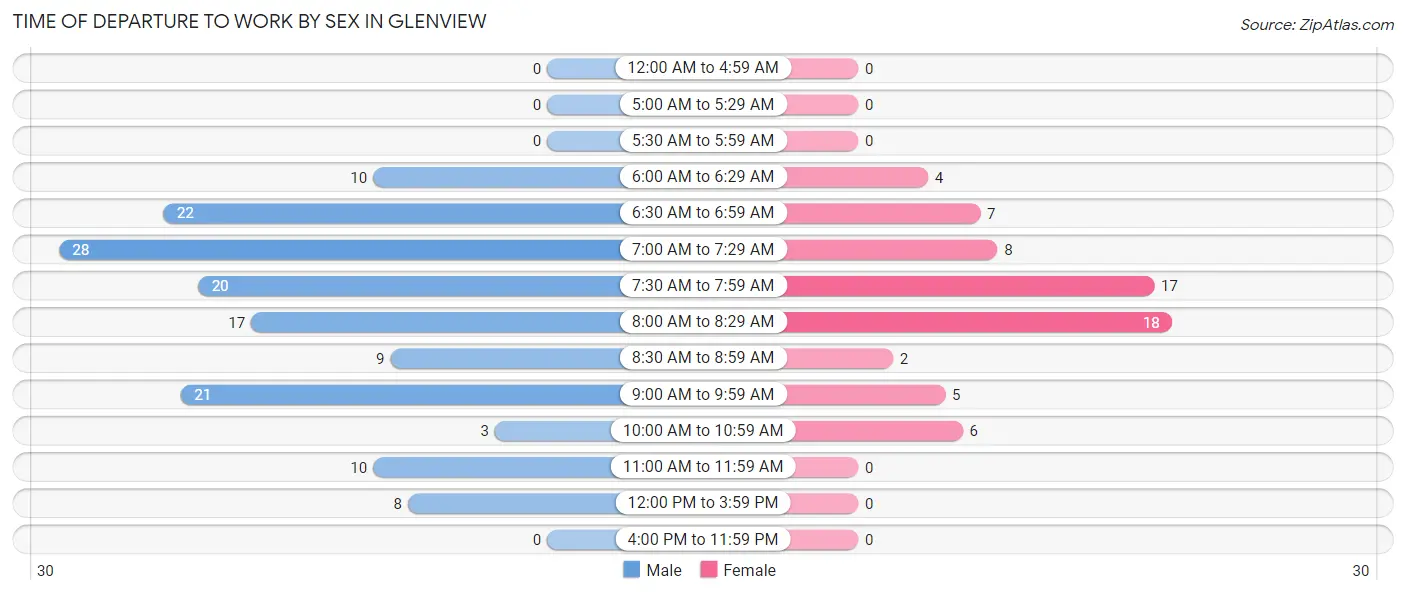
| Time of Departure | Male | Female |
| 12:00 AM to 4:59 AM | 0 (0.0%) | 0 (0.0%) |
| 5:00 AM to 5:29 AM | 0 (0.0%) | 0 (0.0%) |
| 5:30 AM to 5:59 AM | 0 (0.0%) | 0 (0.0%) |
| 6:00 AM to 6:29 AM | 10 (6.8%) | 4 (6.0%) |
| 6:30 AM to 6:59 AM | 22 (14.9%) | 7 (10.4%) |
| 7:00 AM to 7:29 AM | 28 (18.9%) | 8 (11.9%) |
| 7:30 AM to 7:59 AM | 20 (13.5%) | 17 (25.4%) |
| 8:00 AM to 8:29 AM | 17 (11.5%) | 18 (26.9%) |
| 8:30 AM to 8:59 AM | 9 (6.1%) | 2 (3.0%) |
| 9:00 AM to 9:59 AM | 21 (14.2%) | 5 (7.5%) |
| 10:00 AM to 10:59 AM | 3 (2.0%) | 6 (9.0%) |
| 11:00 AM to 11:59 AM | 10 (6.8%) | 0 (0.0%) |
| 12:00 PM to 3:59 PM | 8 (5.4%) | 0 (0.0%) |
| 4:00 PM to 11:59 PM | 0 (0.0%) | 0 (0.0%) |
| Total | 148 (100.0%) | 67 (100.0%) |
Housing Occupancy in Glenview
Occupancy by Ownership in Glenview
Of the total 239 dwellings in Glenview, owner-occupied units account for 227 (95.0%), while renter-occupied units make up 12 (5.0%).
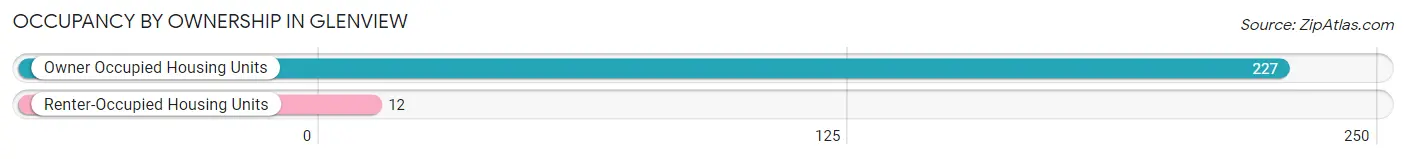
| Occupancy | # Housing Units | % Housing Units |
| Owner Occupied Housing Units | 227 | 95.0% |
| Renter-Occupied Housing Units | 12 | 5.0% |
| Total Occupied Housing Units | 239 | 100.0% |
Occupancy by Household Size in Glenview
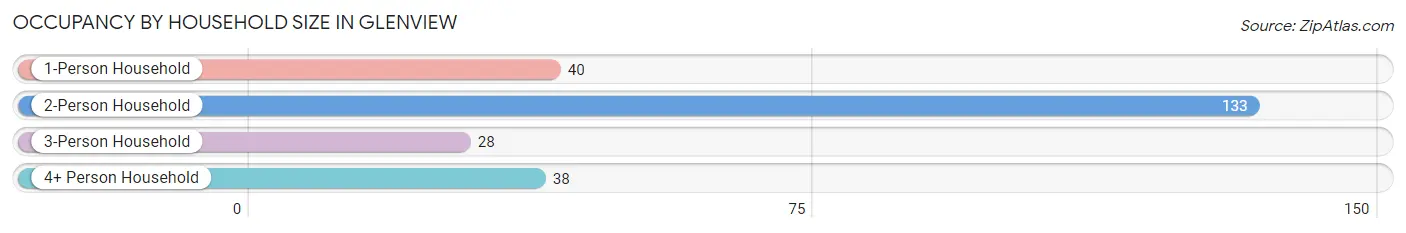
| Household Size | # Housing Units | % Housing Units |
| 1-Person Household | 40 | 16.7% |
| 2-Person Household | 133 | 55.6% |
| 3-Person Household | 28 | 11.7% |
| 4+ Person Household | 38 | 15.9% |
| Total Housing Units | 239 | 100.0% |
Occupancy by Ownership by Household Size in Glenview
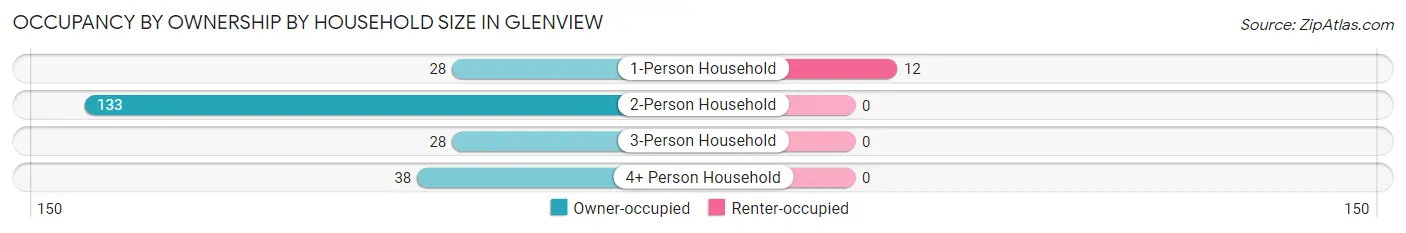
| Household Size | Owner-occupied | Renter-occupied |
| 1-Person Household | 28 (70.0%) | 12 (30.0%) |
| 2-Person Household | 133 (100.0%) | 0 (0.0%) |
| 3-Person Household | 28 (100.0%) | 0 (0.0%) |
| 4+ Person Household | 38 (100.0%) | 0 (0.0%) |
| Total Housing Units | 227 (95.0%) | 12 (5.0%) |
Occupancy by Educational Attainment in Glenview
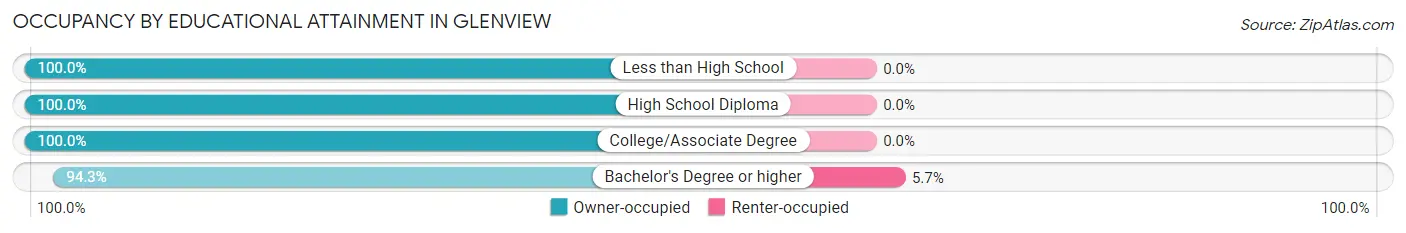
| Household Size | Owner-occupied | Renter-occupied |
| Less than High School | 2 (100.0%) | 0 (0.0%) |
| High School Diploma | 7 (100.0%) | 0 (0.0%) |
| College/Associate Degree | 20 (100.0%) | 0 (0.0%) |
| Bachelor's Degree or higher | 198 (94.3%) | 12 (5.7%) |
Occupancy by Age of Householder in Glenview
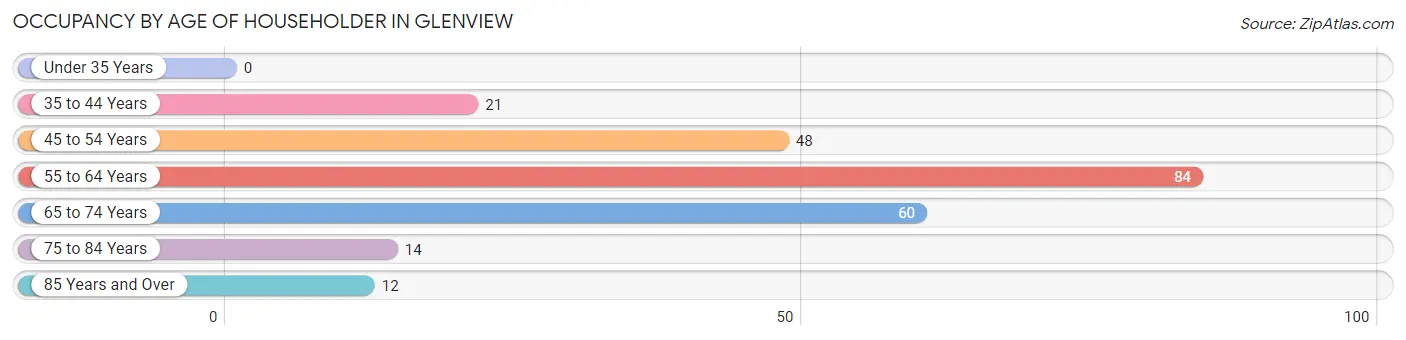
| Age Bracket | # Households | % Households |
| Under 35 Years | 0 | 0.0% |
| 35 to 44 Years | 21 | 8.8% |
| 45 to 54 Years | 48 | 20.1% |
| 55 to 64 Years | 84 | 35.1% |
| 65 to 74 Years | 60 | 25.1% |
| 75 to 84 Years | 14 | 5.9% |
| 85 Years and Over | 12 | 5.0% |
| Total | 239 | 100.0% |
Housing Finances in Glenview
Median Income by Occupancy in Glenview
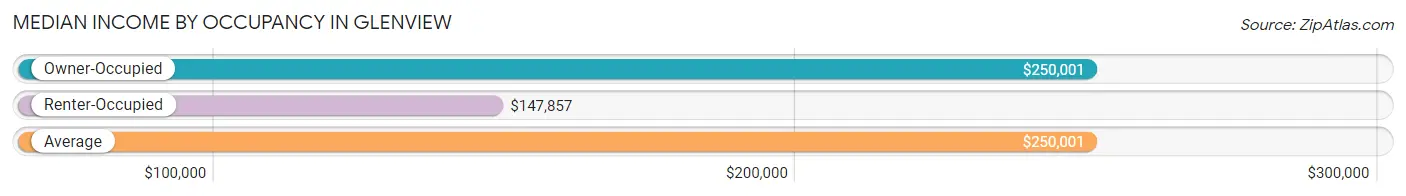
| Occupancy Type | # Households | Median Income |
| Owner-Occupied | 227 (95.0%) | $250,001 |
| Renter-Occupied | 12 (5.0%) | $147,857 |
| Average | 239 (100.0%) | $250,001 |
Occupancy by Householder Income Bracket in Glenview
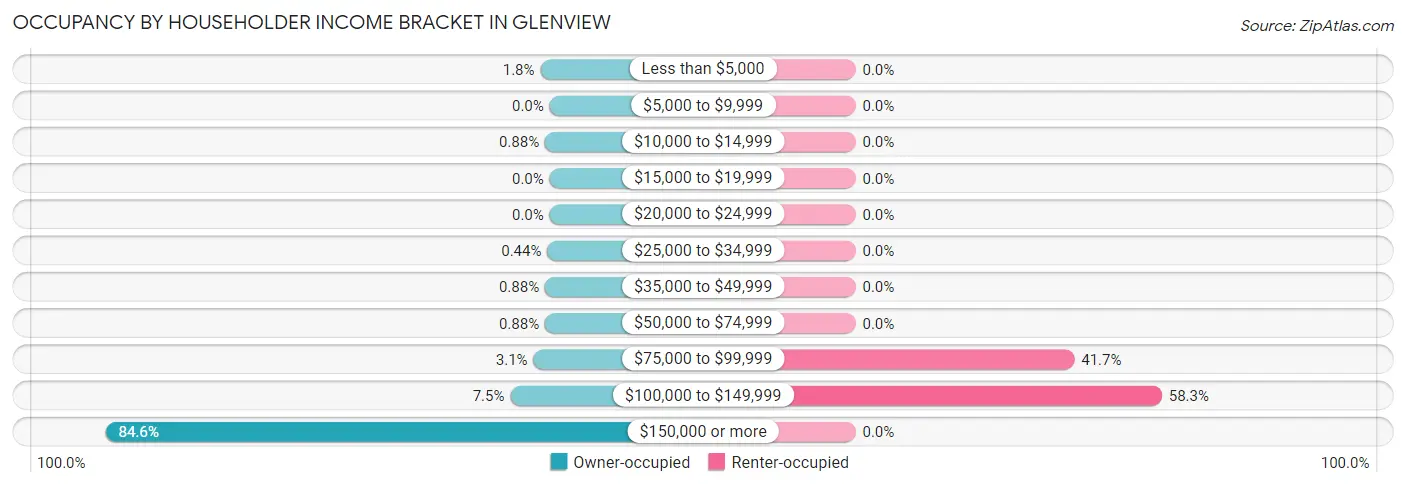
| Income Bracket | Owner-occupied | Renter-occupied |
| Less than $5,000 | 4 (1.8%) | 0 (0.0%) |
| $5,000 to $9,999 | 0 (0.0%) | 0 (0.0%) |
| $10,000 to $14,999 | 2 (0.9%) | 0 (0.0%) |
| $15,000 to $19,999 | 0 (0.0%) | 0 (0.0%) |
| $20,000 to $24,999 | 0 (0.0%) | 0 (0.0%) |
| $25,000 to $34,999 | 1 (0.4%) | 0 (0.0%) |
| $35,000 to $49,999 | 2 (0.9%) | 0 (0.0%) |
| $50,000 to $74,999 | 2 (0.9%) | 0 (0.0%) |
| $75,000 to $99,999 | 7 (3.1%) | 5 (41.7%) |
| $100,000 to $149,999 | 17 (7.5%) | 7 (58.3%) |
| $150,000 or more | 192 (84.6%) | 0 (0.0%) |
| Total | 227 (100.0%) | 12 (100.0%) |
Monthly Housing Cost Tiers in Glenview
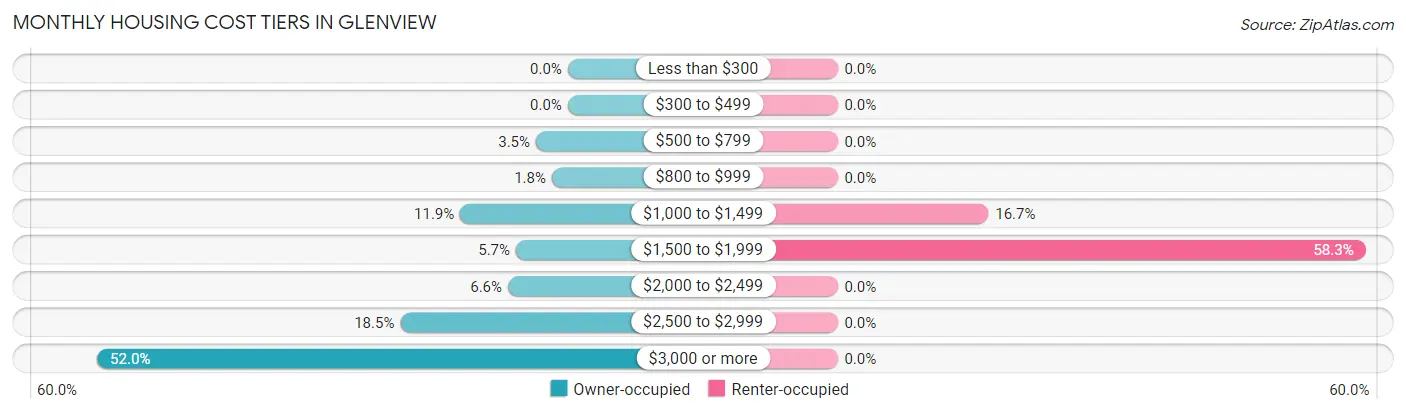
| Monthly Cost | Owner-occupied | Renter-occupied |
| Less than $300 | 0 (0.0%) | 0 (0.0%) |
| $300 to $499 | 0 (0.0%) | 0 (0.0%) |
| $500 to $799 | 8 (3.5%) | 0 (0.0%) |
| $800 to $999 | 4 (1.8%) | 0 (0.0%) |
| $1,000 to $1,499 | 27 (11.9%) | 2 (16.7%) |
| $1,500 to $1,999 | 13 (5.7%) | 7 (58.3%) |
| $2,000 to $2,499 | 15 (6.6%) | 0 (0.0%) |
| $2,500 to $2,999 | 42 (18.5%) | 0 (0.0%) |
| $3,000 or more | 118 (52.0%) | 0 (0.0%) |
| Total | 227 (100.0%) | 12 (100.0%) |
Physical Housing Characteristics in Glenview
Housing Structures in Glenview
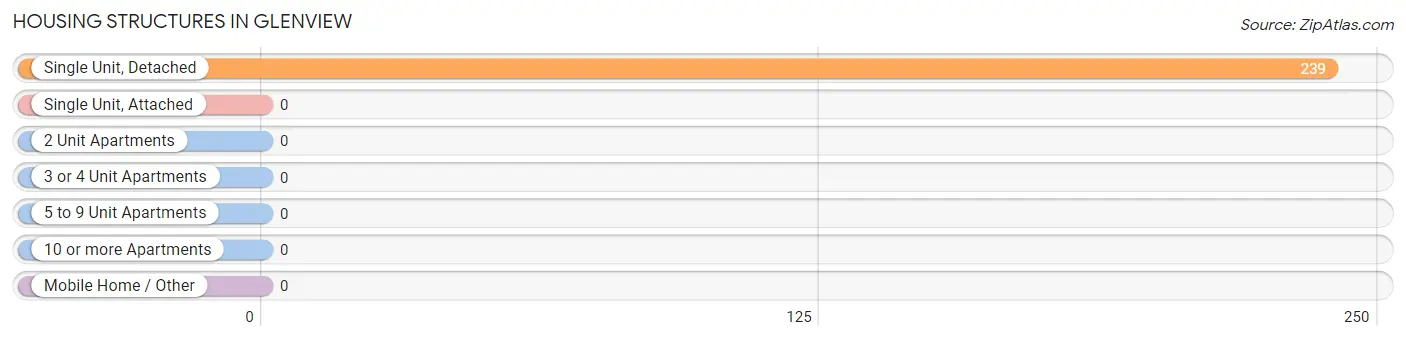
| Structure Type | # Housing Units | % Housing Units |
| Single Unit, Detached | 239 | 100.0% |
| Single Unit, Attached | 0 | 0.0% |
| 2 Unit Apartments | 0 | 0.0% |
| 3 or 4 Unit Apartments | 0 | 0.0% |
| 5 to 9 Unit Apartments | 0 | 0.0% |
| 10 or more Apartments | 0 | 0.0% |
| Mobile Home / Other | 0 | 0.0% |
| Total | 239 | 100.0% |
Housing Structures by Occupancy in Glenview
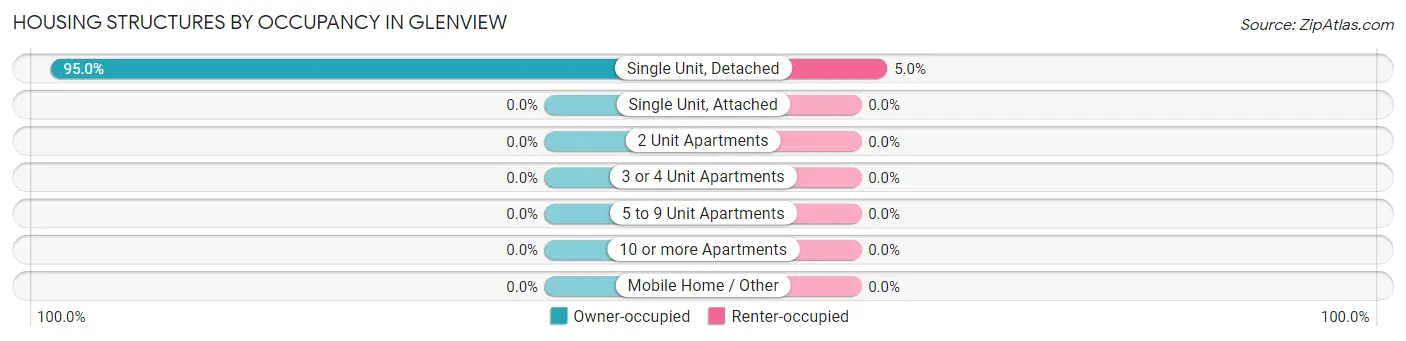
| Structure Type | Owner-occupied | Renter-occupied |
| Single Unit, Detached | 227 (95.0%) | 12 (5.0%) |
| Single Unit, Attached | 0 (0.0%) | 0 (0.0%) |
| 2 Unit Apartments | 0 (0.0%) | 0 (0.0%) |
| 3 or 4 Unit Apartments | 0 (0.0%) | 0 (0.0%) |
| 5 to 9 Unit Apartments | 0 (0.0%) | 0 (0.0%) |
| 10 or more Apartments | 0 (0.0%) | 0 (0.0%) |
| Mobile Home / Other | 0 (0.0%) | 0 (0.0%) |
| Total | 227 (95.0%) | 12 (5.0%) |
Housing Structures by Number of Rooms in Glenview
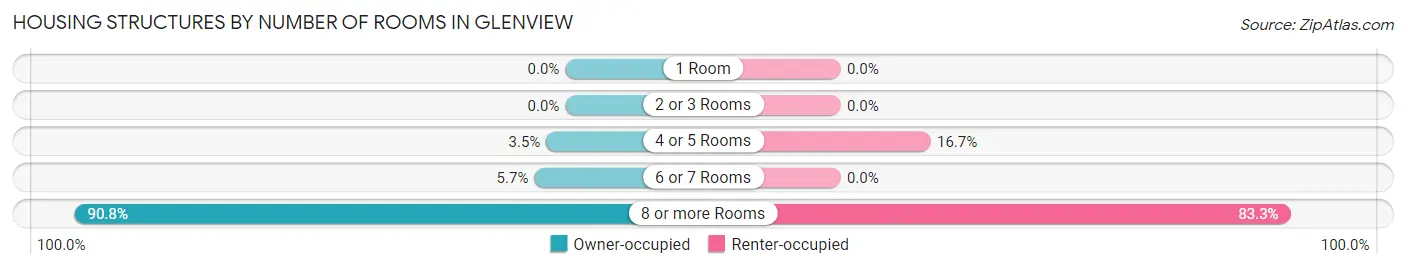
| Number of Rooms | Owner-occupied | Renter-occupied |
| 1 Room | 0 (0.0%) | 0 (0.0%) |
| 2 or 3 Rooms | 0 (0.0%) | 0 (0.0%) |
| 4 or 5 Rooms | 8 (3.5%) | 2 (16.7%) |
| 6 or 7 Rooms | 13 (5.7%) | 0 (0.0%) |
| 8 or more Rooms | 206 (90.7%) | 10 (83.3%) |
| Total | 227 (100.0%) | 12 (100.0%) |
Housing Structure by Heating Type in Glenview
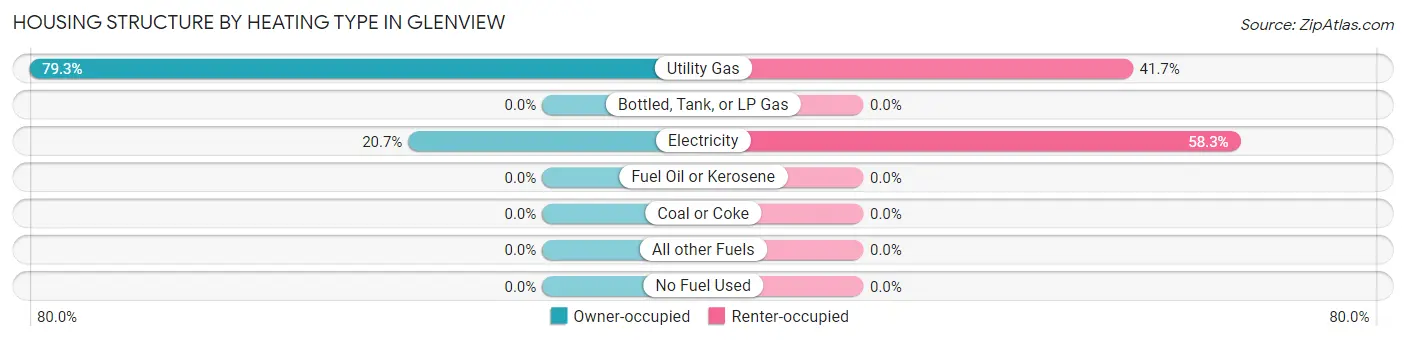
| Heating Type | Owner-occupied | Renter-occupied |
| Utility Gas | 180 (79.3%) | 5 (41.7%) |
| Bottled, Tank, or LP Gas | 0 (0.0%) | 0 (0.0%) |
| Electricity | 47 (20.7%) | 7 (58.3%) |
| Fuel Oil or Kerosene | 0 (0.0%) | 0 (0.0%) |
| Coal or Coke | 0 (0.0%) | 0 (0.0%) |
| All other Fuels | 0 (0.0%) | 0 (0.0%) |
| No Fuel Used | 0 (0.0%) | 0 (0.0%) |
| Total | 227 (100.0%) | 12 (100.0%) |
Household Vehicle Usage in Glenview
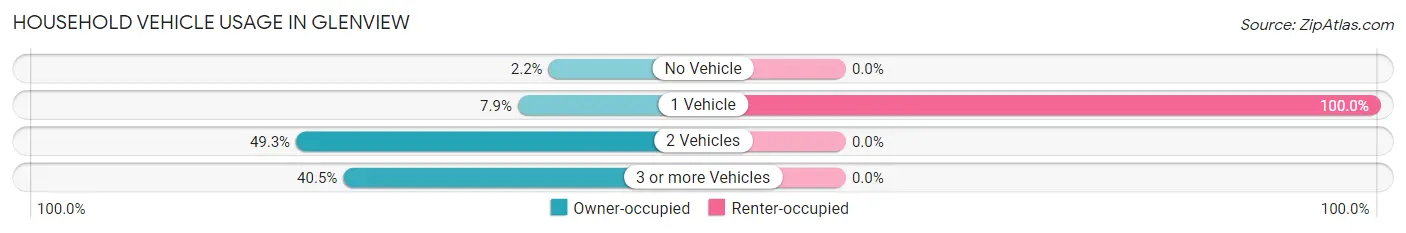
| Vehicles per Household | Owner-occupied | Renter-occupied |
| No Vehicle | 5 (2.2%) | 0 (0.0%) |
| 1 Vehicle | 18 (7.9%) | 12 (100.0%) |
| 2 Vehicles | 112 (49.3%) | 0 (0.0%) |
| 3 or more Vehicles | 92 (40.5%) | 0 (0.0%) |
| Total | 227 (100.0%) | 12 (100.0%) |
Real Estate & Mortgages in Glenview
Real Estate and Mortgage Overview in Glenview
| Characteristic | Without Mortgage | With Mortgage |
| Housing Units | 116 | 111 |
| Median Property Value | $1,058,800 | $941,400 |
| Median Household Income | $250,001 | $97 |
| Monthly Housing Costs | $1,501 | $83 |
| Real Estate Taxes | $10,001 | $2 |
Property Value by Mortgage Status in Glenview
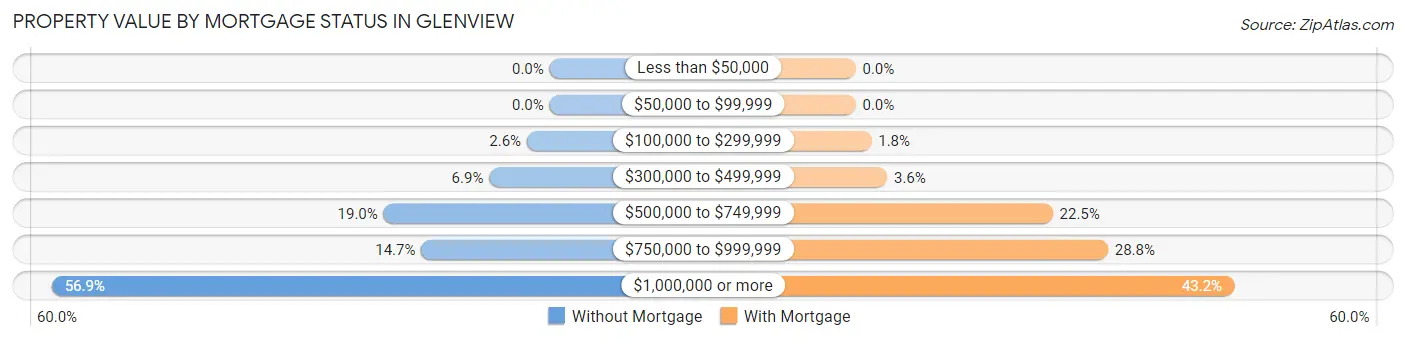
| Property Value | Without Mortgage | With Mortgage |
| Less than $50,000 | 0 (0.0%) | 0 (0.0%) |
| $50,000 to $99,999 | 0 (0.0%) | 0 (0.0%) |
| $100,000 to $299,999 | 3 (2.6%) | 2 (1.8%) |
| $300,000 to $499,999 | 8 (6.9%) | 4 (3.6%) |
| $500,000 to $749,999 | 22 (19.0%) | 25 (22.5%) |
| $750,000 to $999,999 | 17 (14.7%) | 32 (28.8%) |
| $1,000,000 or more | 66 (56.9%) | 48 (43.2%) |
| Total | 116 (100.0%) | 111 (100.0%) |
Household Income by Mortgage Status in Glenview
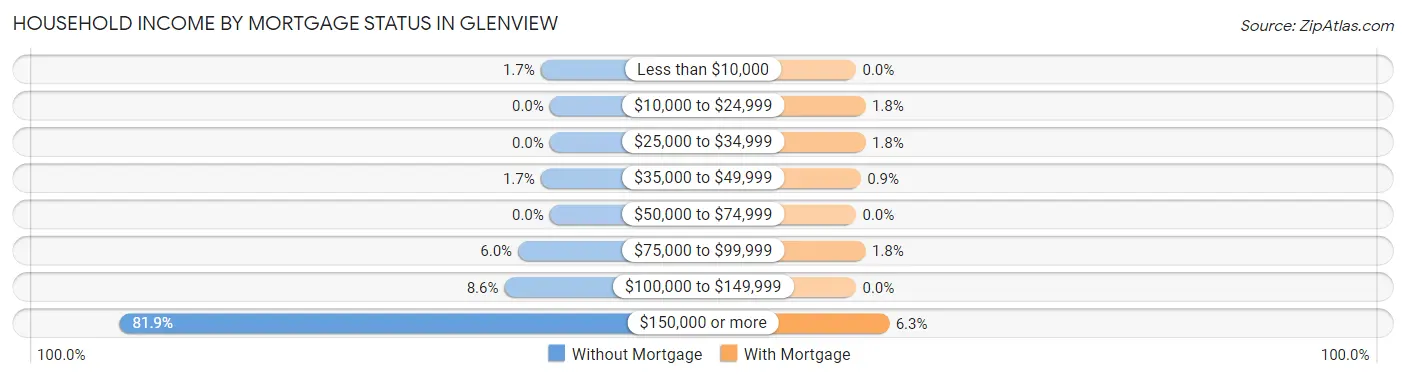
| Household Income | Without Mortgage | With Mortgage |
| Less than $10,000 | 2 (1.7%) | 0 (0.0%) |
| $10,000 to $24,999 | 0 (0.0%) | 2 (1.8%) |
| $25,000 to $34,999 | 0 (0.0%) | 2 (1.8%) |
| $35,000 to $49,999 | 2 (1.7%) | 1 (0.9%) |
| $50,000 to $74,999 | 0 (0.0%) | 0 (0.0%) |
| $75,000 to $99,999 | 7 (6.0%) | 2 (1.8%) |
| $100,000 to $149,999 | 10 (8.6%) | 0 (0.0%) |
| $150,000 or more | 95 (81.9%) | 7 (6.3%) |
| Total | 116 (100.0%) | 111 (100.0%) |
Property Value to Household Income Ratio in Glenview
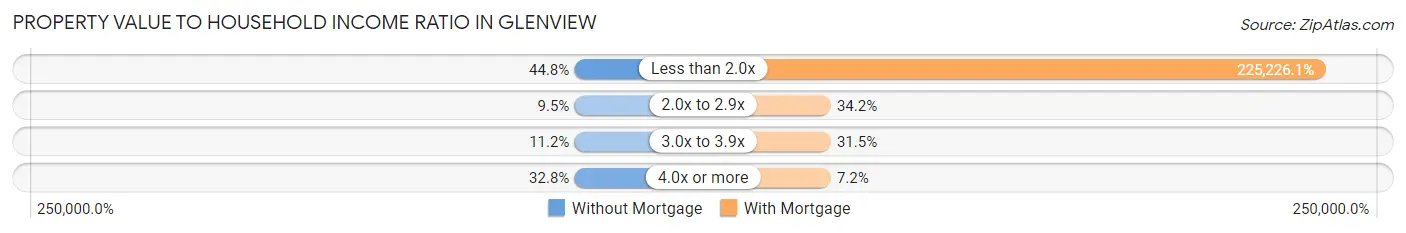
| Value-to-Income Ratio | Without Mortgage | With Mortgage |
| Less than 2.0x | 52 (44.8%) | 250,001 (225,226.1%) |
| 2.0x to 2.9x | 11 (9.5%) | 38 (34.2%) |
| 3.0x to 3.9x | 13 (11.2%) | 35 (31.5%) |
| 4.0x or more | 38 (32.8%) | 8 (7.2%) |
| Total | 116 (100.0%) | 111 (100.0%) |
Real Estate Taxes by Mortgage Status in Glenview
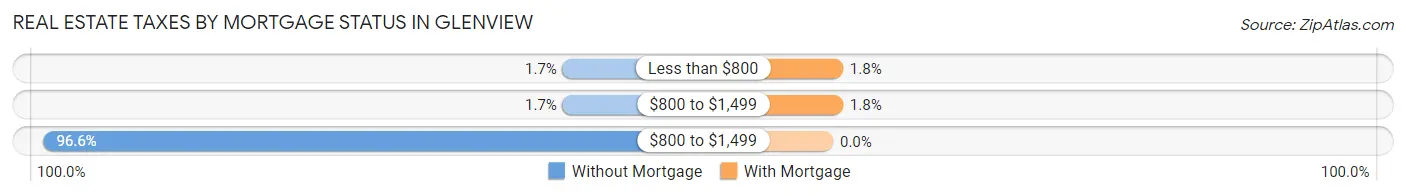
| Property Taxes | Without Mortgage | With Mortgage |
| Less than $800 | 2 (1.7%) | 2 (1.8%) |
| $800 to $1,499 | 2 (1.7%) | 2 (1.8%) |
| $800 to $1,499 | 112 (96.6%) | 0 (0.0%) |
| Total | 116 (100.0%) | 111 (100.0%) |
Health & Disability in Glenview
Health Insurance Coverage by Age in Glenview
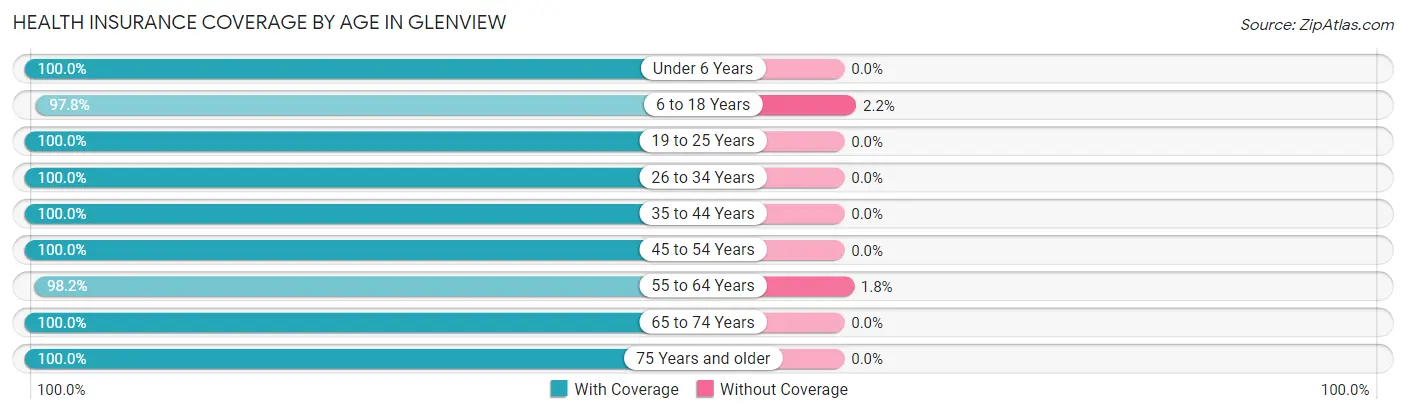
| Age Bracket | With Coverage | Without Coverage |
| Under 6 Years | 21 (100.0%) | 0 (0.0%) |
| 6 to 18 Years | 89 (97.8%) | 2 (2.2%) |
| 19 to 25 Years | 9 (100.0%) | 0 (0.0%) |
| 26 to 34 Years | 5 (100.0%) | 0 (0.0%) |
| 35 to 44 Years | 54 (100.0%) | 0 (0.0%) |
| 45 to 54 Years | 88 (100.0%) | 0 (0.0%) |
| 55 to 64 Years | 166 (98.2%) | 3 (1.8%) |
| 65 to 74 Years | 94 (100.0%) | 0 (0.0%) |
| 75 Years and older | 43 (100.0%) | 0 (0.0%) |
| Total | 569 (99.1%) | 5 (0.9%) |
Health Insurance Coverage by Citizenship Status in Glenview
| Citizenship Status | With Coverage | Without Coverage |
| Native Born | 21 (100.0%) | 0 (0.0%) |
| Foreign Born, Citizen | 89 (97.8%) | 2 (2.2%) |
| Foreign Born, not a Citizen | 9 (100.0%) | 0 (0.0%) |
Health Insurance Coverage by Household Income in Glenview
| Household Income | With Coverage | Without Coverage |
| Under $25,000 | 8 (100.0%) | 0 (0.0%) |
| $25,000 to $49,999 | 5 (100.0%) | 0 (0.0%) |
| $50,000 to $74,999 | 5 (100.0%) | 0 (0.0%) |
| $75,000 to $99,999 | 16 (84.2%) | 3 (15.8%) |
| $100,000 and over | 535 (99.6%) | 2 (0.4%) |
Public vs Private Health Insurance Coverage by Age in Glenview
| Age Bracket | Public Insurance | Private Insurance |
| Under 6 | 0 (0.0%) | 21 (100.0%) |
| 6 to 18 Years | 0 (0.0%) | 89 (97.8%) |
| 19 to 25 Years | 0 (0.0%) | 9 (100.0%) |
| 25 to 34 Years | 0 (0.0%) | 5 (100.0%) |
| 35 to 44 Years | 0 (0.0%) | 54 (100.0%) |
| 45 to 54 Years | 0 (0.0%) | 88 (100.0%) |
| 55 to 64 Years | 7 (4.1%) | 159 (94.1%) |
| 65 to 74 Years | 83 (88.3%) | 59 (62.8%) |
| 75 Years and over | 43 (100.0%) | 33 (76.7%) |
| Total | 133 (23.2%) | 517 (90.1%) |
Disability Status by Sex by Age in Glenview
| Age Bracket | Male | Female |
| Under 5 Years | 0 (0.0%) | 0 (0.0%) |
| 5 to 17 Years | 0 (0.0%) | 0 (0.0%) |
| 18 to 34 Years | 0 (0.0%) | 0 (0.0%) |
| 35 to 64 Years | 8 (4.7%) | 0 (0.0%) |
| 65 to 74 Years | 7 (12.3%) | 8 (21.6%) |
| 75 Years and over | 7 (30.4%) | 7 (35.0%) |
Disability Class by Sex by Age in Glenview
Disability Class: Hearing Difficulty
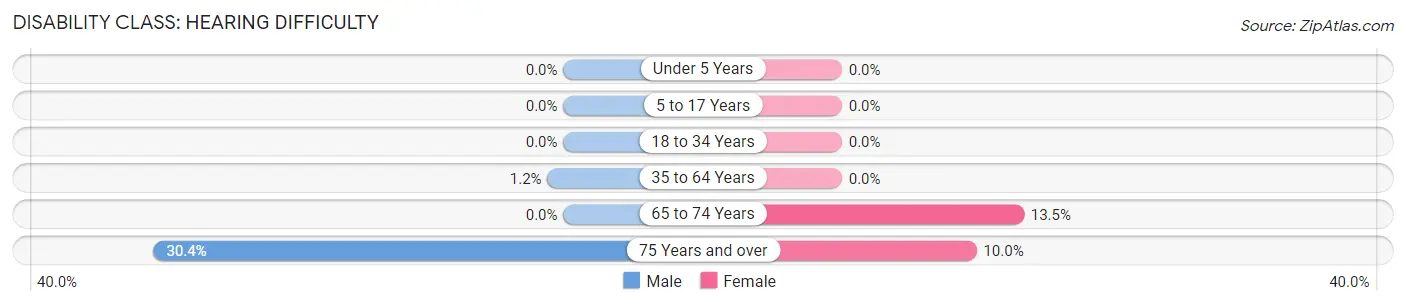
| Age Bracket | Male | Female |
| Under 5 Years | 0 (0.0%) | 0 (0.0%) |
| 5 to 17 Years | 0 (0.0%) | 0 (0.0%) |
| 18 to 34 Years | 0 (0.0%) | 0 (0.0%) |
| 35 to 64 Years | 2 (1.2%) | 0 (0.0%) |
| 65 to 74 Years | 0 (0.0%) | 5 (13.5%) |
| 75 Years and over | 7 (30.4%) | 2 (10.0%) |
Disability Class: Vision Difficulty
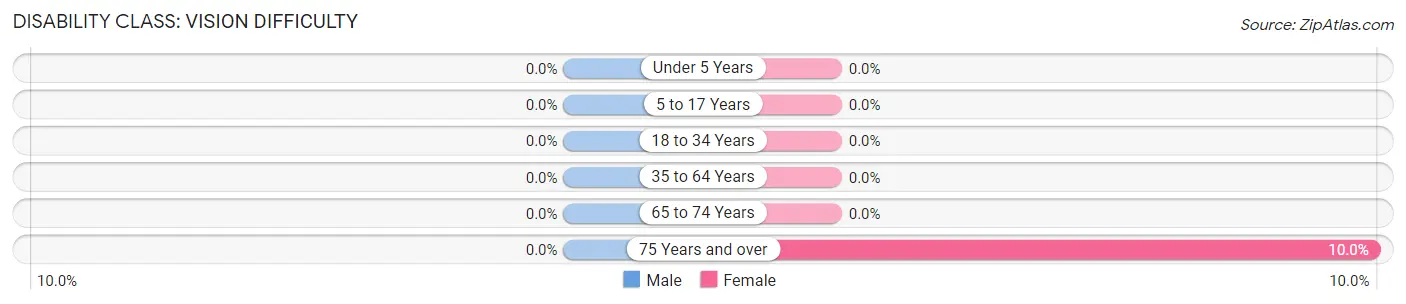
| Age Bracket | Male | Female |
| Under 5 Years | 0 (0.0%) | 0 (0.0%) |
| 5 to 17 Years | 0 (0.0%) | 0 (0.0%) |
| 18 to 34 Years | 0 (0.0%) | 0 (0.0%) |
| 35 to 64 Years | 0 (0.0%) | 0 (0.0%) |
| 65 to 74 Years | 0 (0.0%) | 0 (0.0%) |
| 75 Years and over | 0 (0.0%) | 2 (10.0%) |
Disability Class: Cognitive Difficulty
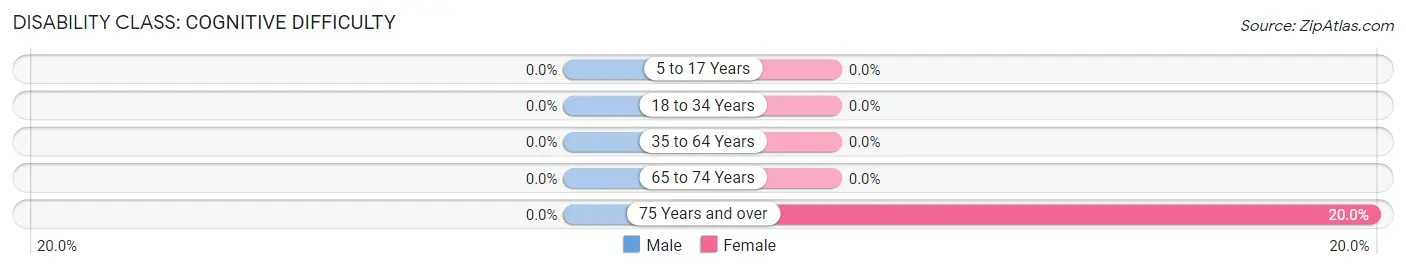
| Age Bracket | Male | Female |
| 5 to 17 Years | 0 (0.0%) | 0 (0.0%) |
| 18 to 34 Years | 0 (0.0%) | 0 (0.0%) |
| 35 to 64 Years | 0 (0.0%) | 0 (0.0%) |
| 65 to 74 Years | 0 (0.0%) | 0 (0.0%) |
| 75 Years and over | 0 (0.0%) | 4 (20.0%) |
Disability Class: Ambulatory Difficulty
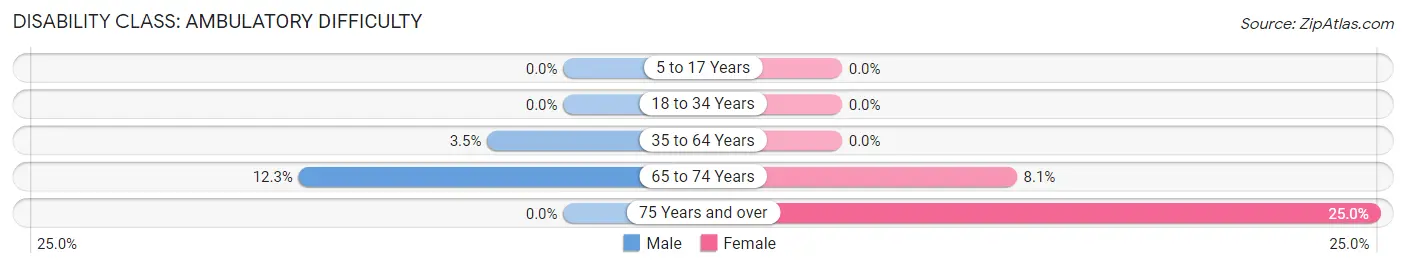
| Age Bracket | Male | Female |
| 5 to 17 Years | 0 (0.0%) | 0 (0.0%) |
| 18 to 34 Years | 0 (0.0%) | 0 (0.0%) |
| 35 to 64 Years | 6 (3.5%) | 0 (0.0%) |
| 65 to 74 Years | 7 (12.3%) | 3 (8.1%) |
| 75 Years and over | 0 (0.0%) | 5 (25.0%) |
Disability Class: Self-Care Difficulty
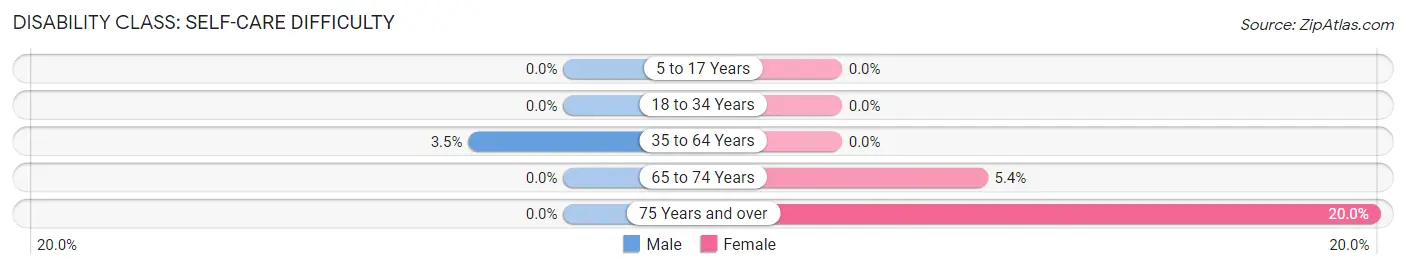
| Age Bracket | Male | Female |
| 5 to 17 Years | 0 (0.0%) | 0 (0.0%) |
| 18 to 34 Years | 0 (0.0%) | 0 (0.0%) |
| 35 to 64 Years | 6 (3.5%) | 0 (0.0%) |
| 65 to 74 Years | 0 (0.0%) | 2 (5.4%) |
| 75 Years and over | 0 (0.0%) | 4 (20.0%) |
Technology Access in Glenview
Computing Device Access in Glenview
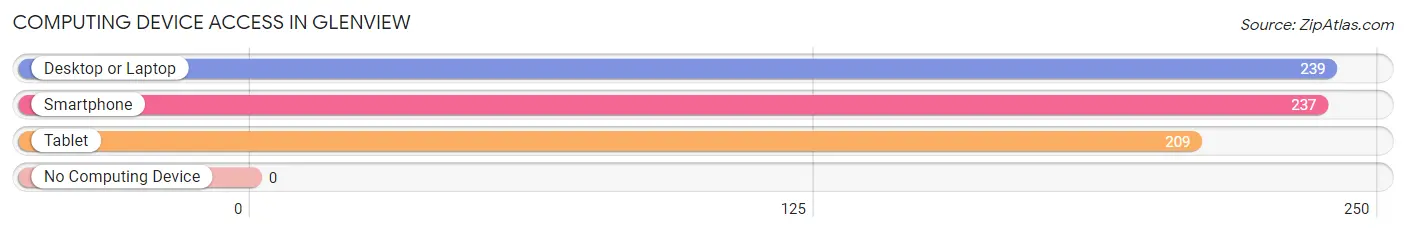
| Device Type | # Households | % Households |
| Desktop or Laptop | 239 | 100.0% |
| Smartphone | 237 | 99.2% |
| Tablet | 209 | 87.5% |
| No Computing Device | 0 | 0.0% |
| Total | 239 | 100.0% |
Internet Access in Glenview
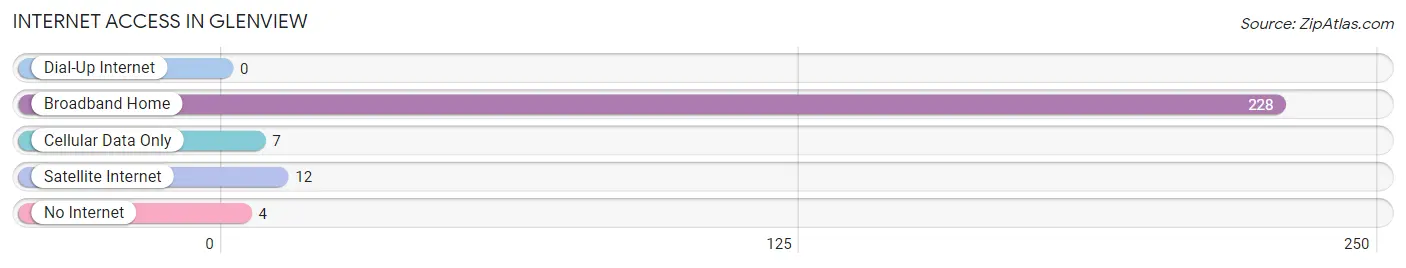
| Internet Type | # Households | % Households |
| Dial-Up Internet | 0 | 0.0% |
| Broadband Home | 228 | 95.4% |
| Cellular Data Only | 7 | 2.9% |
| Satellite Internet | 12 | 5.0% |
| No Internet | 4 | 1.7% |
| Total | 239 | 100.0% |
Glenview Summary
Glenview is a small unincorporated community located in the northern part of Jefferson County, Kentucky. It is situated on the banks of the Ohio River, just south of the city of Louisville. The community is part of the Louisville Metro area and is home to approximately 1,000 people.
History
Glenview was first settled in the early 1800s by a group of German immigrants. The community was originally known as “Glenview Station” and was a stop on the Louisville and Nashville Railroad. The name was changed to Glenview in 1883.
The community was primarily an agricultural area until the 1950s when the area began to experience rapid growth due to the expansion of Louisville. The population of Glenview increased from just over 500 in 1950 to nearly 1,000 by 2000.
Geography
Glenview is located in the northern part of Jefferson County, Kentucky. It is situated on the banks of the Ohio River, just south of the city of Louisville. The community is part of the Louisville Metro area and is home to approximately 1,000 people.
The terrain of Glenview is mostly flat with some rolling hills. The area is mostly wooded with some open fields. The climate is humid subtropical with hot summers and mild winters.
Economy
The economy of Glenview is primarily based on agriculture and light industry. The area is home to several small businesses, including a grocery store, a hardware store, and a few restaurants.
The community is also home to a number of small manufacturing companies, including a plastics manufacturer and a metal fabrication shop. The area is also home to a number of small farms, which produce a variety of crops, including corn, soybeans, and wheat.
Demographics
As of the 2010 census, the population of Glenview was 1,072. The racial makeup of the community was 94.3% White, 2.7% African American, 0.3% Native American, 0.7% Asian, and 1.9% from other races. Hispanic or Latino of any race were 2.2% of the population.
The median household income in Glenview was $45,938, and the median family income was $51,250. The per capita income was $20,945. About 8.3% of families and 10.2% of the population were below the poverty line, including 14.3% of those under age 18 and 6.2% of those age 65 or over.
The population of Glenview is primarily composed of families. The median age of the population is 38.7 years, and the majority of the population is married. The majority of the population is employed in either the manufacturing or agricultural industries.
Conclusion
Glenview is a small unincorporated community located in the northern part of Jefferson County, Kentucky. It is situated on the banks of the Ohio River, just south of the city of Louisville. The community is part of the Louisville Metro area and is home to approximately 1,000 people. The economy of Glenview is primarily based on agriculture and light industry, and the population is primarily composed of families. The median age of the population is 38.7 years, and the majority of the population is employed in either the manufacturing or agricultural industries.
Common Questions
What is Per Capita Income in Glenview?
Per Capita income in Glenview is $216,503.
What is the Median Family Income in Glenview?
Median Family Income in Glenview is $250,001.
What is the Median Household income in Glenview?
Median Household Income in Glenview is $250,001.
What is Income or Wage Gap in Glenview?
Income or Wage Gap in Glenview is 58.2%.
Women in Glenview earn 41.8 cents for every dollar earned by a man.
What is Inequality or Gini Index in Glenview?
Inequality or Gini Index in Glenview is 0.47.
What is the Total Population of Glenview?
Total Population of Glenview is 574.
What is the Total Male Population of Glenview?
Total Male Population of Glenview is 305.
What is the Total Female Population of Glenview?
Total Female Population of Glenview is 269.
What is the Ratio of Males per 100 Females in Glenview?
There are 113.38 Males per 100 Females in Glenview.
What is the Ratio of Females per 100 Males in Glenview?
There are 88.20 Females per 100 Males in Glenview.
What is the Median Population Age in Glenview?
Median Population Age in Glenview is 56.2 Years.
What is the Average Family Size in Glenview
Average Family Size in Glenview is 2.7 People.
What is the Average Household Size in Glenview
Average Household Size in Glenview is 2.4 People.
How Large is the Labor Force in Glenview?
There are 290 People in the Labor Forcein in Glenview.
What is the Percentage of People in the Labor Force in Glenview?
60.7% of People are in the Labor Force in Glenview.
What is the Unemployment Rate in Glenview?
Unemployment Rate in Glenview is 1.0%.