Rancho Viejo, TX Map & Demographics
Rancho Viejo Map
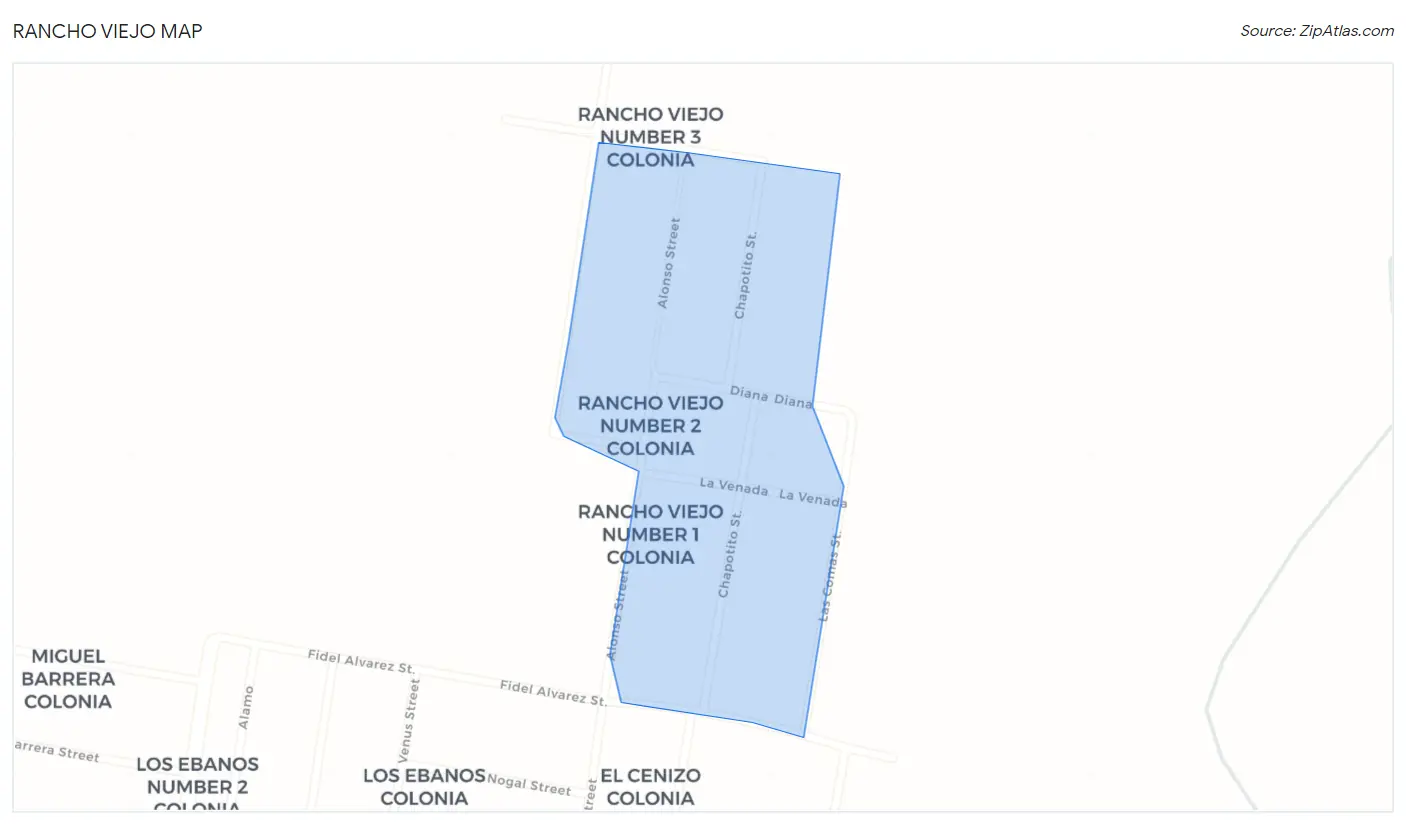
Rancho Viejo Overview
$41,919
PER CAPITA INCOME
0.10
INEQUALITY / GINI INDEX
148
TOTAL POPULATION
117
MALE POPULATION
31
FEMALE POPULATION
377.42
MALES / 100 FEMALES
26.50
FEMALES / 100 MALES
24.7
MEDIAN AGE
4.8
AVG FAMILY SIZE
4.8
AVG HOUSEHOLD SIZE
70
LABOR FORCE [ PEOPLE ]
83.3%
PERCENT IN LABOR FORCE
21.4%
UNEMPLOYMENT RATE
Rancho Viejo Area Codes
Income in Rancho Viejo
Income Overview in Rancho Viejo
| Characteristic | Number | Measure |
| Per Capita Income | 148 | $41,919 |
| Median Family Income | 31 | $0 |
| Mean Family Income | 31 | $0 |
| Median Household Income | 31 | $0 |
| Mean Household Income | 31 | $0 |
| Income Deficit | 31 | $0 |
| Wage / Income Gap (%) | 148 | 0.00% |
| Wage / Income Gap ($) | 148 | 100.00¢ per $1 |
| Gini / Inequality Index | 148 | 0.10 |
Earnings by Sex in Rancho Viejo
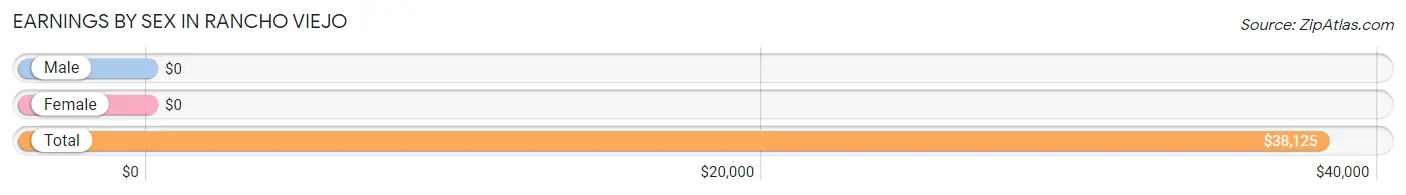
| Sex | Number | Average Earnings |
| Male | 38 (55.1%) | $0 |
| Female | 31 (44.9%) | $0 |
| Total | 69 (100.0%) | $38,125 |
Earnings by Sex by Income Bracket in Rancho Viejo
The most common earnings brackets in Rancho Viejo are $100,000+ for men (24 | 63.2%) and $25,000 to $29,999 for women (24 | 77.4%).
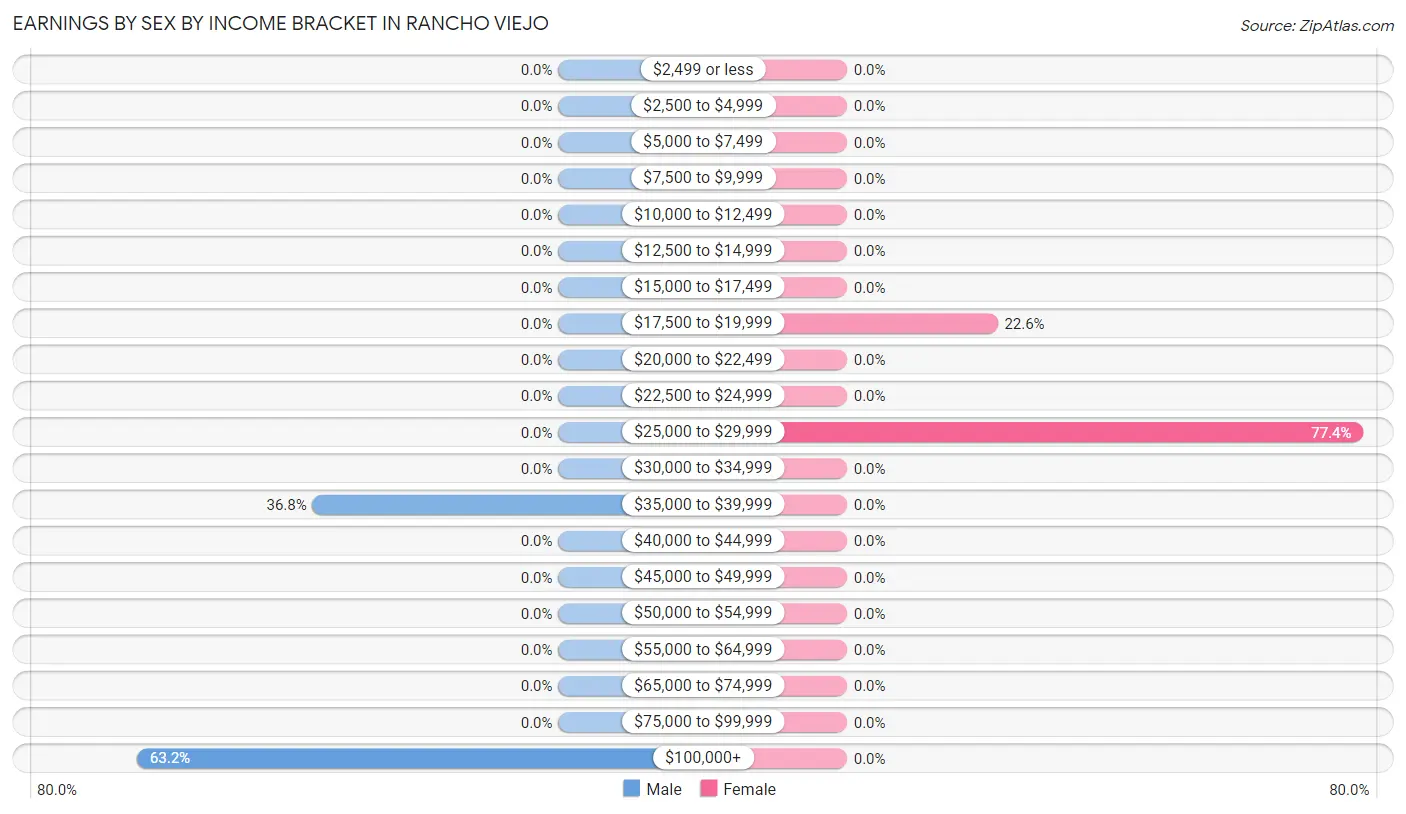
| Income | Male | Female |
| $2,499 or less | 0 (0.0%) | 0 (0.0%) |
| $2,500 to $4,999 | 0 (0.0%) | 0 (0.0%) |
| $5,000 to $7,499 | 0 (0.0%) | 0 (0.0%) |
| $7,500 to $9,999 | 0 (0.0%) | 0 (0.0%) |
| $10,000 to $12,499 | 0 (0.0%) | 0 (0.0%) |
| $12,500 to $14,999 | 0 (0.0%) | 0 (0.0%) |
| $15,000 to $17,499 | 0 (0.0%) | 0 (0.0%) |
| $17,500 to $19,999 | 0 (0.0%) | 7 (22.6%) |
| $20,000 to $22,499 | 0 (0.0%) | 0 (0.0%) |
| $22,500 to $24,999 | 0 (0.0%) | 0 (0.0%) |
| $25,000 to $29,999 | 0 (0.0%) | 24 (77.4%) |
| $30,000 to $34,999 | 0 (0.0%) | 0 (0.0%) |
| $35,000 to $39,999 | 14 (36.8%) | 0 (0.0%) |
| $40,000 to $44,999 | 0 (0.0%) | 0 (0.0%) |
| $45,000 to $49,999 | 0 (0.0%) | 0 (0.0%) |
| $50,000 to $54,999 | 0 (0.0%) | 0 (0.0%) |
| $55,000 to $64,999 | 0 (0.0%) | 0 (0.0%) |
| $65,000 to $74,999 | 0 (0.0%) | 0 (0.0%) |
| $75,000 to $99,999 | 0 (0.0%) | 0 (0.0%) |
| $100,000+ | 24 (63.2%) | 0 (0.0%) |
| Total | 38 (100.0%) | 31 (100.0%) |
Earnings by Sex by Educational Attainment in Rancho Viejo
| Educational Attainment | Male Income | Female Income |
| Less than High School | - | - |
| High School Diploma | - | - |
| College or Associate's Degree | - | - |
| Bachelor's Degree | - | - |
| Graduate Degree | - | - |
| Total | - | - |
Family Income in Rancho Viejo
Family Income Brackets in Rancho Viejo
According to the Rancho Viejo family income data, there are 24 families falling into the $200,000+ income range, which is the most common income bracket and makes up 77.4% of all families.
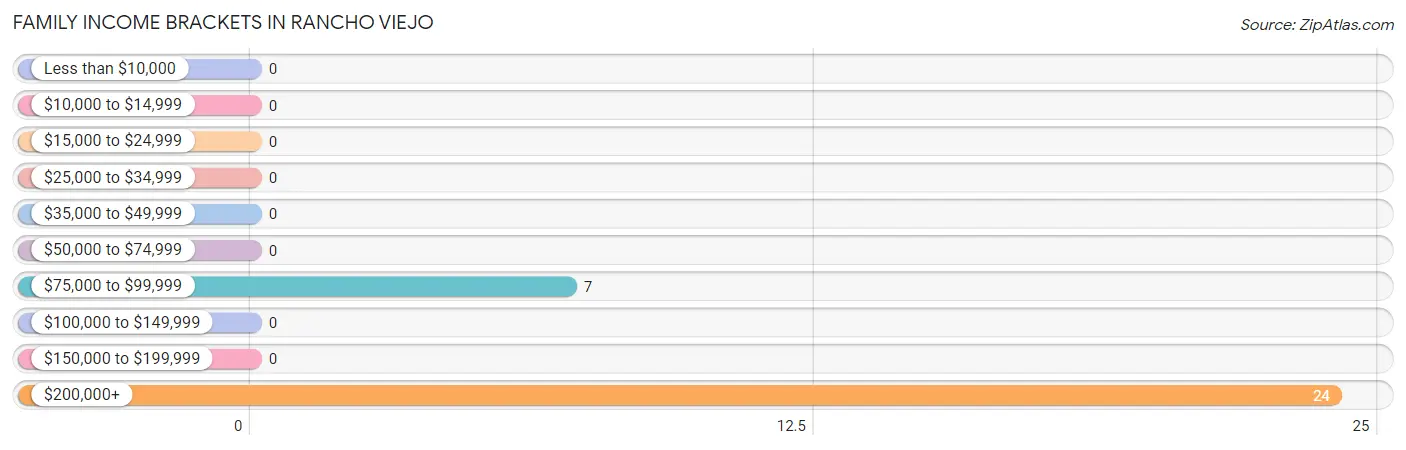
| Income Bracket | # Families | % Families |
| Less than $10,000 | 0 | 0.0% |
| $10,000 to $14,999 | 0 | 0.0% |
| $15,000 to $24,999 | 0 | 0.0% |
| $25,000 to $34,999 | 0 | 0.0% |
| $35,000 to $49,999 | 0 | 0.0% |
| $50,000 to $74,999 | 0 | 0.0% |
| $75,000 to $99,999 | 7 | 22.6% |
| $100,000 to $149,999 | 0 | 0.0% |
| $150,000 to $199,999 | 0 | 0.0% |
| $200,000+ | 24 | 77.4% |
Family Income by Famaliy Size in Rancho Viejo
| Income Bracket | # Families | Median Income |
| 2-Person Families | 0 (0.0%) | $0 |
| 3-Person Families | 7 (22.6%) | $0 |
| 4-Person Families | 24 (77.4%) | $0 |
| 5-Person Families | 0 (0.0%) | $0 |
| 6-Person Families | 0 (0.0%) | $0 |
| 7+ Person Families | 0 (0.0%) | $0 |
| Total | 31 (100.0%) | $0 |
Family Income by Number of Earners in Rancho Viejo
| Number of Earners | # Families | Median Income |
| No Earners | 0 (0.0%) | $0 |
| 1 Earner | 0 (0.0%) | $0 |
| 2 Earners | 31 (100.0%) | $0 |
| 3+ Earners | 0 (0.0%) | $0 |
| Total | 31 (100.0%) | $0 |
Household Income in Rancho Viejo
Household Income Brackets in Rancho Viejo
With 24 households falling in the category, the $200,000+ income range is the most frequent in Rancho Viejo, accounting for 77.4% of all households.
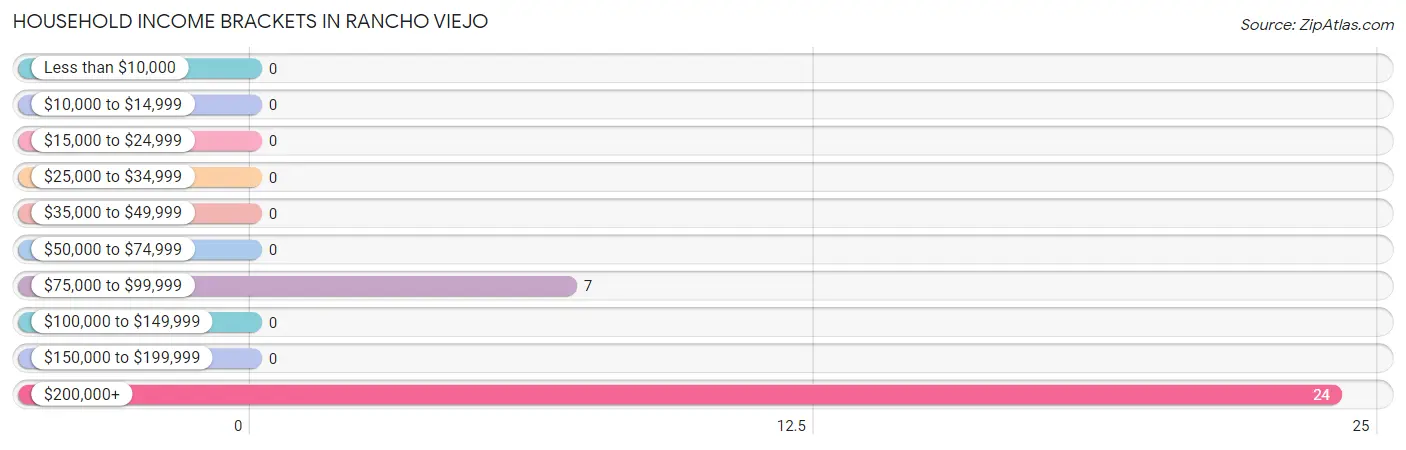
| Income Bracket | # Households | % Households |
| Less than $10,000 | 0 | 0.0% |
| $10,000 to $14,999 | 0 | 0.0% |
| $15,000 to $24,999 | 0 | 0.0% |
| $25,000 to $34,999 | 0 | 0.0% |
| $35,000 to $49,999 | 0 | 0.0% |
| $50,000 to $74,999 | 0 | 0.0% |
| $75,000 to $99,999 | 7 | 22.6% |
| $100,000 to $149,999 | 0 | 0.0% |
| $150,000 to $199,999 | 0 | 0.0% |
| $200,000+ | 24 | 77.4% |
Household Income by Householder Age in Rancho Viejo
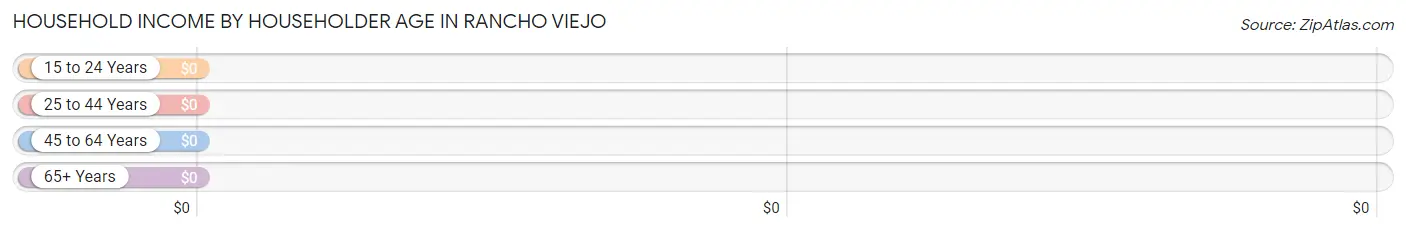
| Income Bracket | # Households | Median Income |
| 15 to 24 Years | 0 (0.0%) | $0 |
| 25 to 44 Years | 24 (77.4%) | $0 |
| 45 to 64 Years | 7 (22.6%) | $0 |
| 65+ Years | 0 (0.0%) | $0 |
| Total | 31 (100.0%) | $0 |
Poverty in Rancho Viejo
Income Below Poverty by Sex and Age in Rancho Viejo
| Age Bracket | Male | Female |
| Under 5 Years | 0 (0.0%) | 0 (0.0%) |
| 5 Years | 0 (0.0%) | 0 (0.0%) |
| 6 to 11 Years | 0 (0.0%) | 0 (0.0%) |
| 12 to 14 Years | 0 (0.0%) | 0 (0.0%) |
| 15 Years | 0 (0.0%) | 0 (0.0%) |
| 16 and 17 Years | 0 (0.0%) | 0 (0.0%) |
| 18 to 24 Years | 0 (0.0%) | 0 (0.0%) |
| 25 to 34 Years | 0 (0.0%) | 0 (0.0%) |
| 35 to 44 Years | 0 (0.0%) | 0 (0.0%) |
| 45 to 54 Years | 0 (0.0%) | 0 (0.0%) |
| 55 to 64 Years | 0 (0.0%) | 0 (0.0%) |
| 65 to 74 Years | 0 (0.0%) | 0 (0.0%) |
| 75 Years and over | 0 (0.0%) | 0 (0.0%) |
| Total | 0 (0.0%) | 0 (0.0%) |
Income Above Poverty by Sex and Age in Rancho Viejo
According to the poverty statistics in Rancho Viejo, males aged 6 to 11 years and females aged 25 to 34 years are the age groups that are most secure financially, with 100.0% of males and 100.0% of females in these age groups living above the poverty line.
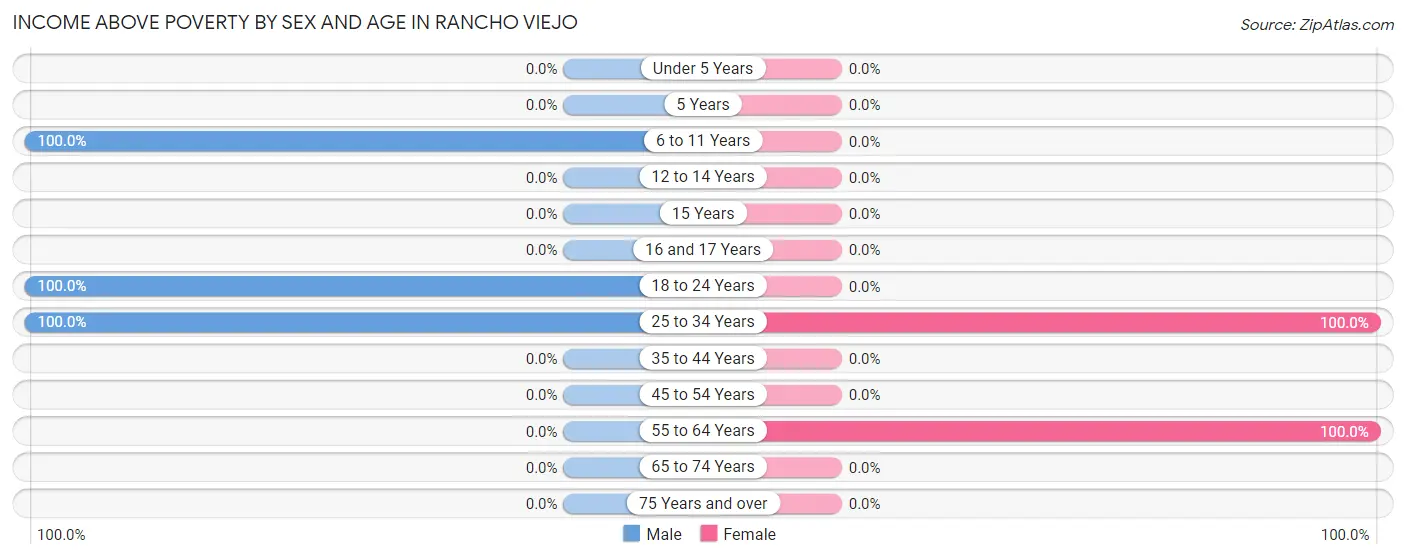
| Age Bracket | Male | Female |
| Under 5 Years | 0 (0.0%) | 0 (0.0%) |
| 5 Years | 0 (0.0%) | 0 (0.0%) |
| 6 to 11 Years | 64 (100.0%) | 0 (0.0%) |
| 12 to 14 Years | 0 (0.0%) | 0 (0.0%) |
| 15 Years | 0 (0.0%) | 0 (0.0%) |
| 16 and 17 Years | 0 (0.0%) | 0 (0.0%) |
| 18 to 24 Years | 14 (100.0%) | 0 (0.0%) |
| 25 to 34 Years | 39 (100.0%) | 24 (100.0%) |
| 35 to 44 Years | 0 (0.0%) | 0 (0.0%) |
| 45 to 54 Years | 0 (0.0%) | 0 (0.0%) |
| 55 to 64 Years | 0 (0.0%) | 7 (100.0%) |
| 65 to 74 Years | 0 (0.0%) | 0 (0.0%) |
| 75 Years and over | 0 (0.0%) | 0 (0.0%) |
| Total | 117 (100.0%) | 31 (100.0%) |
Income Below Poverty Among Married-Couple Families in Rancho Viejo
| Children | Above Poverty | Below Poverty |
| No Children | 0 (0.0%) | 0 (0.0%) |
| 1 or 2 Children | 24 (100.0%) | 0 (0.0%) |
| 3 or 4 Children | 0 (0.0%) | 0 (0.0%) |
| 5 or more Children | 0 (0.0%) | 0 (0.0%) |
| Total | 24 (100.0%) | 0 (0.0%) |
Income Below Poverty Among Single-Parent Households in Rancho Viejo
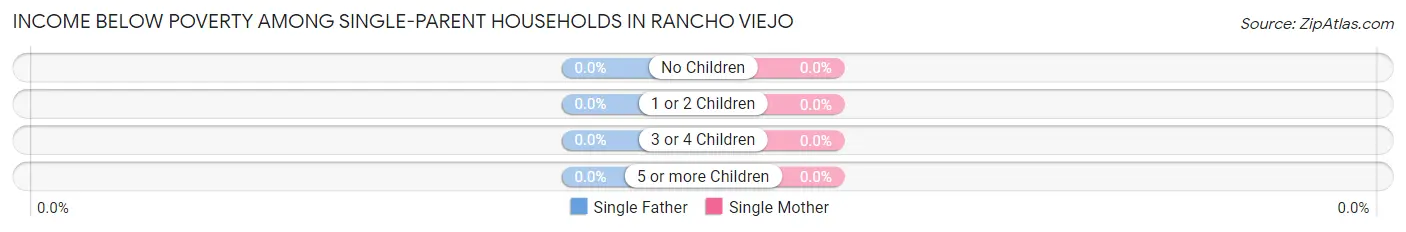
| Children | Single Father | Single Mother |
| No Children | 0 (0.0%) | 0 (0.0%) |
| 1 or 2 Children | 0 (0.0%) | 0 (0.0%) |
| 3 or 4 Children | 0 (0.0%) | 0 (0.0%) |
| 5 or more Children | 0 (0.0%) | 0 (0.0%) |
| Total | 0 (0.0%) | 0 (0.0%) |
Income Below Poverty Among Married-Couple vs Single-Parent Households in Rancho Viejo
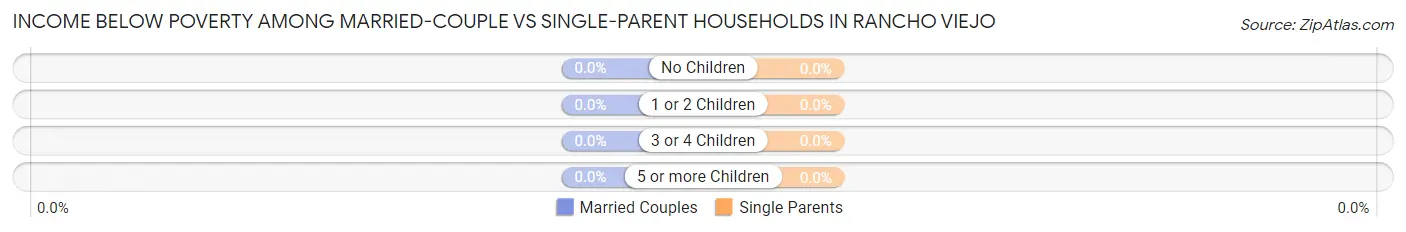
| Children | Married-Couple Families | Single-Parent Households |
| No Children | 0 (0.0%) | 0 (0.0%) |
| 1 or 2 Children | 0 (0.0%) | 0 (0.0%) |
| 3 or 4 Children | 0 (0.0%) | 0 (0.0%) |
| 5 or more Children | 0 (0.0%) | 0 (0.0%) |
| Total | 0 (0.0%) | 0 (0.0%) |
Race in Rancho Viejo
The most populous races in Rancho Viejo are Hispanic or Latino (148 | 100.0%), White / Caucasian (112 | 75.7%), and Two or more Races (36 | 24.3%).
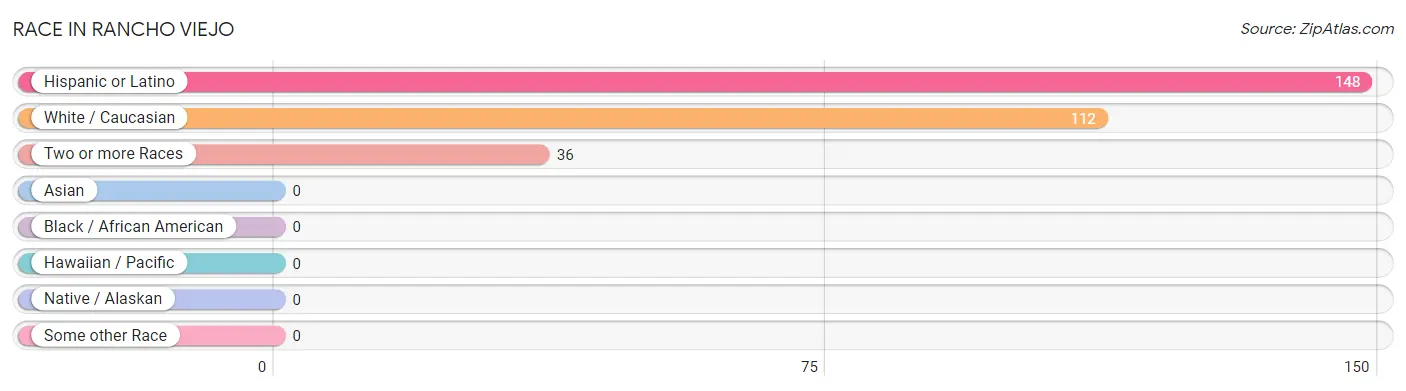
| Race | # Population | % Population |
| Asian | 0 | 0.0% |
| Black / African American | 0 | 0.0% |
| Hawaiian / Pacific | 0 | 0.0% |
| Hispanic or Latino | 148 | 100.0% |
| Native / Alaskan | 0 | 0.0% |
| White / Caucasian | 112 | 75.7% |
| Two or more Races | 36 | 24.3% |
| Some other Race | 0 | 0.0% |
| Total | 148 | 100.0% |
Ancestry in Rancho Viejo
The most populous ancestries reported in Rancho Viejo are , and Mexican (148 | 100.0%), together accounting for 100.0% of all Rancho Viejo residents.

| Ancestry | # Population | % Population |
| Mexican | 148 | 100.0% | View All 1 Rows |
Immigrants in Rancho Viejo

| Immigration Origin | # Population | % Population | View All 0 Rows |
Sex and Age in Rancho Viejo
Sex and Age in Rancho Viejo
The most populous age groups in Rancho Viejo are 5 to 9 Years (64 | 54.7%) for men and 25 to 29 Years (24 | 77.4%) for women.
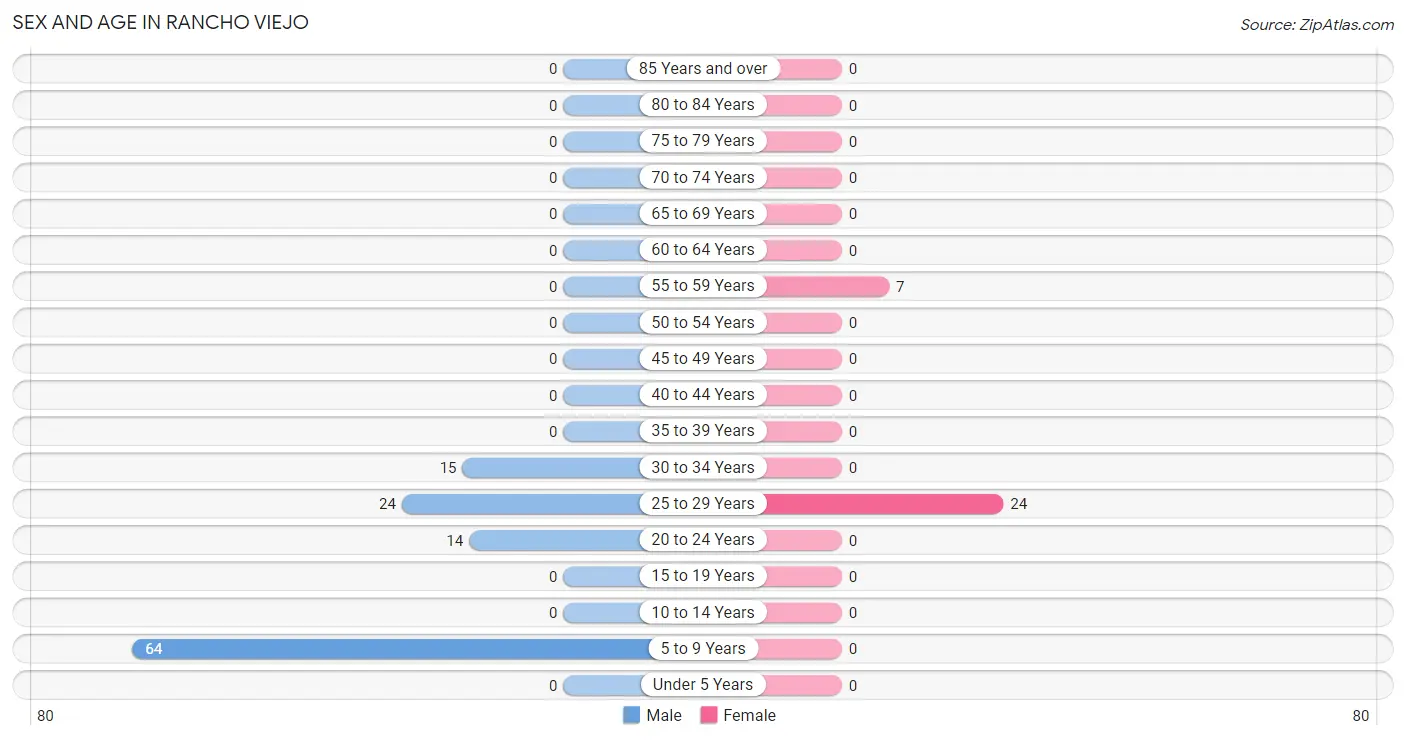
| Age Bracket | Male | Female |
| Under 5 Years | 0 (0.0%) | 0 (0.0%) |
| 5 to 9 Years | 64 (54.7%) | 0 (0.0%) |
| 10 to 14 Years | 0 (0.0%) | 0 (0.0%) |
| 15 to 19 Years | 0 (0.0%) | 0 (0.0%) |
| 20 to 24 Years | 14 (12.0%) | 0 (0.0%) |
| 25 to 29 Years | 24 (20.5%) | 24 (77.4%) |
| 30 to 34 Years | 15 (12.8%) | 0 (0.0%) |
| 35 to 39 Years | 0 (0.0%) | 0 (0.0%) |
| 40 to 44 Years | 0 (0.0%) | 0 (0.0%) |
| 45 to 49 Years | 0 (0.0%) | 0 (0.0%) |
| 50 to 54 Years | 0 (0.0%) | 0 (0.0%) |
| 55 to 59 Years | 0 (0.0%) | 7 (22.6%) |
| 60 to 64 Years | 0 (0.0%) | 0 (0.0%) |
| 65 to 69 Years | 0 (0.0%) | 0 (0.0%) |
| 70 to 74 Years | 0 (0.0%) | 0 (0.0%) |
| 75 to 79 Years | 0 (0.0%) | 0 (0.0%) |
| 80 to 84 Years | 0 (0.0%) | 0 (0.0%) |
| 85 Years and over | 0 (0.0%) | 0 (0.0%) |
| Total | 117 (100.0%) | 31 (100.0%) |
Families and Households in Rancho Viejo
Median Family Size in Rancho Viejo
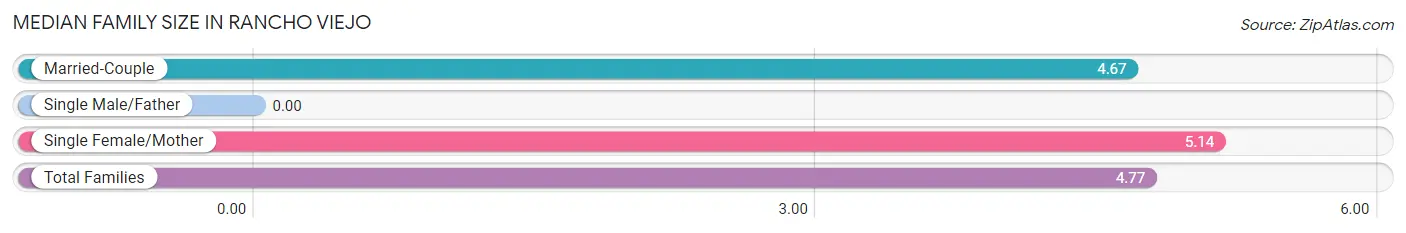
| Family Type | # Families | Family Size |
| Married-Couple | 24 (77.4%) | 4.67 |
| Single Male/Father | 0 (0.0%) | - |
| Single Female/Mother | 7 (22.6%) | 5.14 |
| Total Families | 31 (100.0%) | 4.77 |
Median Household Size in Rancho Viejo
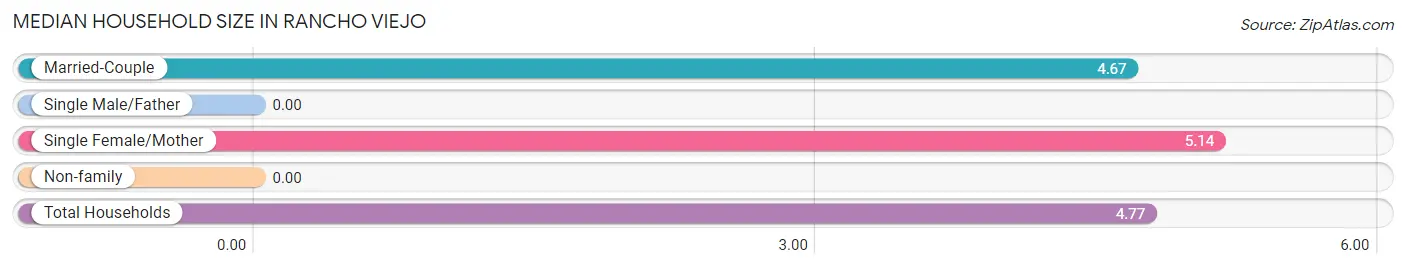
| Household Type | # Households | Household Size |
| Married-Couple | 24 (77.4%) | 4.67 |
| Single Male/Father | 0 (0.0%) | - |
| Single Female/Mother | 7 (22.6%) | 5.14 |
| Non-family | 0 (0.0%) | - |
| Total Households | 31 (100.0%) | 4.77 |
Household Size by Marriage Status in Rancho Viejo
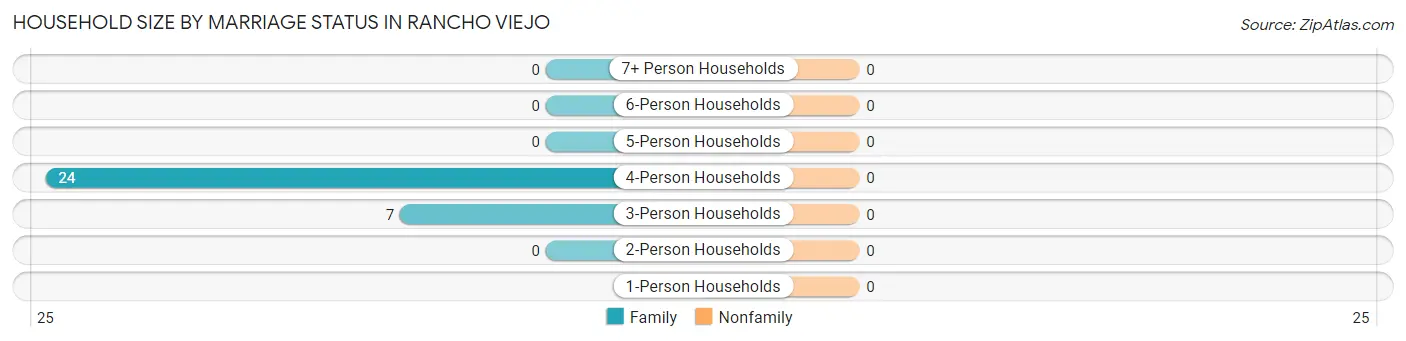
| Household Size | Family Households | Nonfamily Households |
| 1-Person Households | - | 0 (0.0%) |
| 2-Person Households | 0 (0.0%) | 0 (0.0%) |
| 3-Person Households | 7 (22.6%) | 0 (0.0%) |
| 4-Person Households | 24 (77.4%) | 0 (0.0%) |
| 5-Person Households | 0 (0.0%) | 0 (0.0%) |
| 6-Person Households | 0 (0.0%) | 0 (0.0%) |
| 7+ Person Households | 0 (0.0%) | 0 (0.0%) |
| Total | 31 (100.0%) | 0 (0.0%) |
Female Fertility in Rancho Viejo
Fertility by Age in Rancho Viejo
| Age Bracket | Women with Births | Births / 1,000 Women |
| 15 to 19 years | 0 (0.0%) | 0.0 |
| 20 to 34 years | 0 (0.0%) | 0.0 |
| 35 to 50 years | 0 (0.0%) | 0.0 |
| Total | 0 (0.0%) | 0.0 |
Fertility by Age by Marriage Status in Rancho Viejo
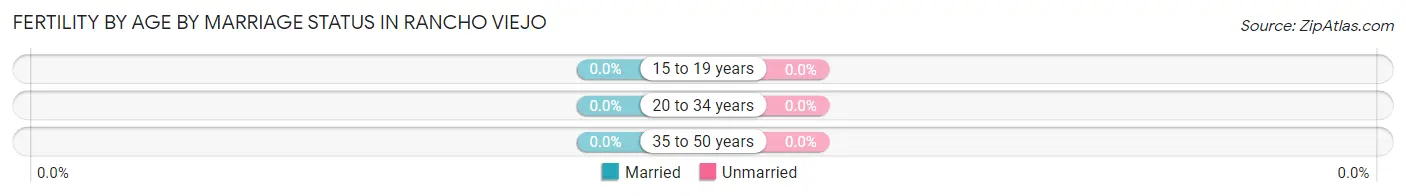
| Age Bracket | Married | Unmarried |
| 15 to 19 years | 0 (0.0%) | 0 (0.0%) |
| 20 to 34 years | 0 (0.0%) | 0 (0.0%) |
| 35 to 50 years | 0 (0.0%) | 0 (0.0%) |
| Total | 0 (0.0%) | 0 (0.0%) |
Fertility by Education in Rancho Viejo
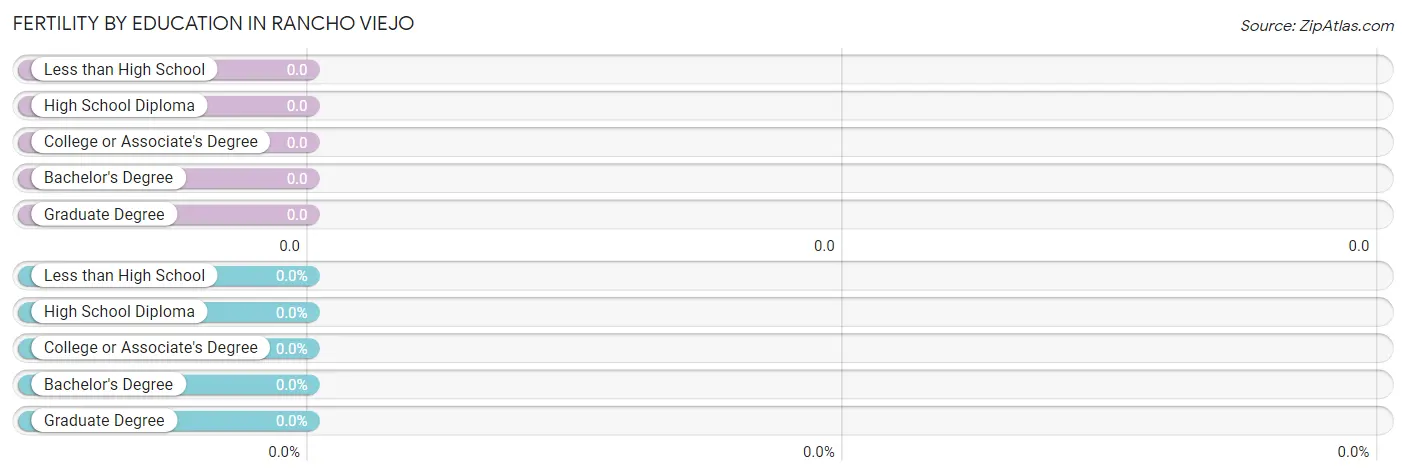
| Educational Attainment | Women with Births | Births / 1,000 Women |
| Less than High School | 0 (0.0%) | 0.0 |
| High School Diploma | 0 (0.0%) | 0.0 |
| College or Associate's Degree | 0 (0.0%) | 0.0 |
| Bachelor's Degree | 0 (0.0%) | 0.0 |
| Graduate Degree | 0 (0.0%) | 0.0 |
| Total | 0 (0.0%) | 0.0 |
Fertility by Education by Marriage Status in Rancho Viejo
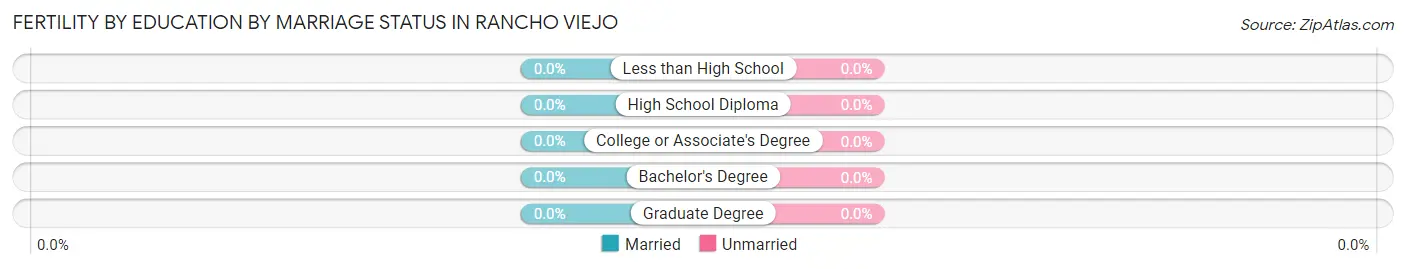
| Educational Attainment | Married | Unmarried |
| Less than High School | 0 (0.0%) | 0 (0.0%) |
| High School Diploma | 0 (0.0%) | 0 (0.0%) |
| College or Associate's Degree | 0 (0.0%) | 0 (0.0%) |
| Bachelor's Degree | 0 (0.0%) | 0 (0.0%) |
| Graduate Degree | 0 (0.0%) | 0 (0.0%) |
| Total | 0 (0.0%) | 0 (0.0%) |
Employment Characteristics in Rancho Viejo
Employment by Class of Employer in Rancho Viejo
Among the 55 employed individuals in Rancho Viejo, state government employees (31 | 56.4%), and private company employees (24 | 43.6%) make up the most common classes of employment.
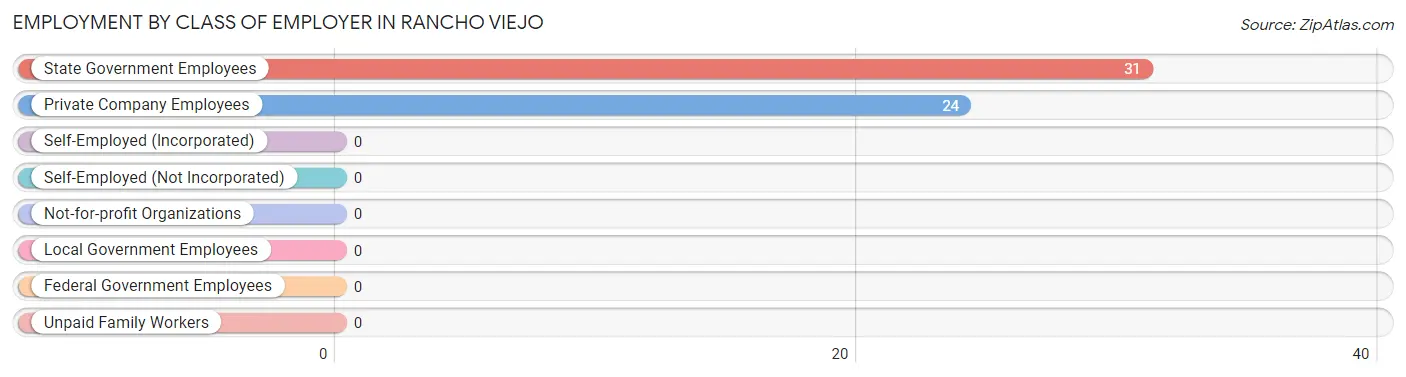
| Employer Class | # Employees | % Employees |
| Private Company Employees | 24 | 43.6% |
| Self-Employed (Incorporated) | 0 | 0.0% |
| Self-Employed (Not Incorporated) | 0 | 0.0% |
| Not-for-profit Organizations | 0 | 0.0% |
| Local Government Employees | 0 | 0.0% |
| State Government Employees | 31 | 56.4% |
| Federal Government Employees | 0 | 0.0% |
| Unpaid Family Workers | 0 | 0.0% |
| Total | 55 | 100.0% |
Employment Status by Age in Rancho Viejo
According to the labor force statistics for Rancho Viejo, out of the total population over 16 years of age (84), 83.3% or 70 individuals are in the labor force, with 21.4% or 15 of them unemployed. The age group with the highest labor force participation rate is 25 to 29 years, with 100.0% or 48 individuals in the labor force. Within the labor force, the 30 to 34 years age range has the highest percentage of unemployed individuals, with 100.0% or 15 of them being unemployed.
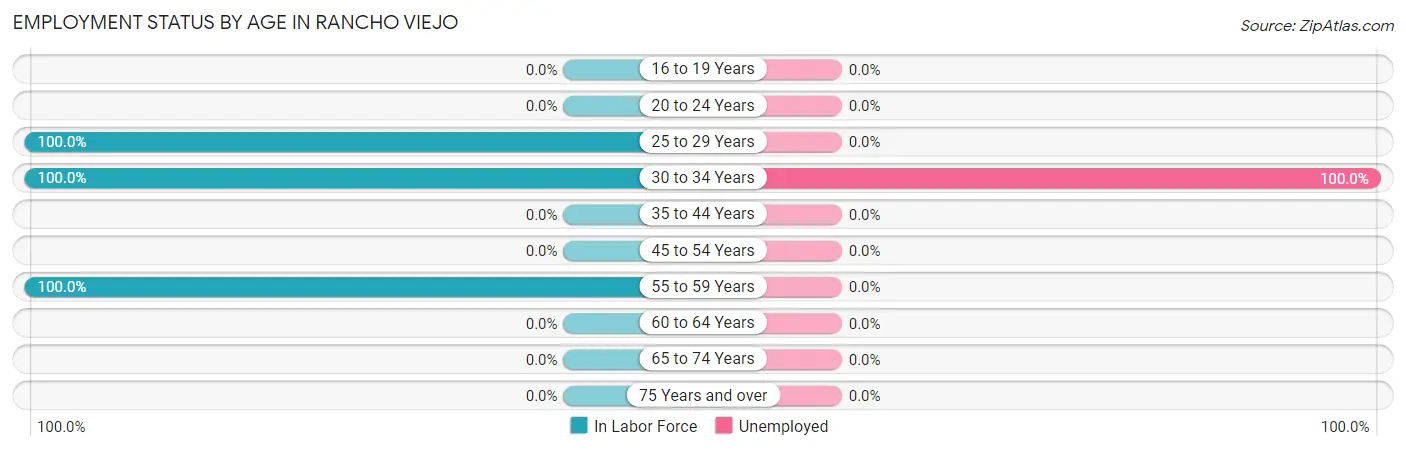
| Age Bracket | In Labor Force | Unemployed |
| 16 to 19 Years | 0 (0.0%) | 0 (0.0%) |
| 20 to 24 Years | 0 (0.0%) | 0 (0.0%) |
| 25 to 29 Years | 48 (100.0%) | 0 (0.0%) |
| 30 to 34 Years | 15 (100.0%) | 15 (100.0%) |
| 35 to 44 Years | 0 (0.0%) | 0 (0.0%) |
| 45 to 54 Years | 0 (0.0%) | 0 (0.0%) |
| 55 to 59 Years | 7 (100.0%) | 0 (0.0%) |
| 60 to 64 Years | 0 (0.0%) | 0 (0.0%) |
| 65 to 74 Years | 0 (0.0%) | 0 (0.0%) |
| 75 Years and over | 0 (0.0%) | 0 (0.0%) |
| Total | 70 (83.3%) | 15 (21.4%) |
Employment Status by Educational Attainment in Rancho Viejo
According to labor force statistics for Rancho Viejo, 100.0% of individuals (70) out of the total population between 25 and 64 years of age (70) are in the labor force, with 21.4% or 15 of them being unemployed. The group with the highest labor force participation rate are those with the educational attainment of high school diploma, with 100.0% or 31 individuals in the labor force. Within the labor force, individuals with bachelor's degree or higher education have the highest percentage of unemployment, with 100.0% or 15 of them being unemployed.
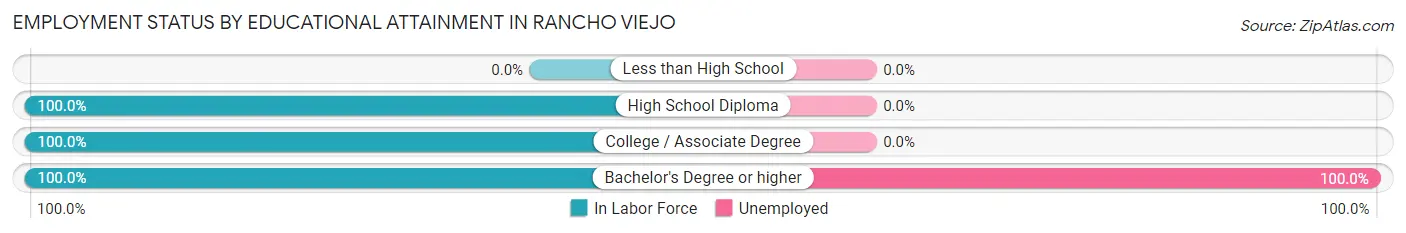
| Educational Attainment | In Labor Force | Unemployed |
| Less than High School | 0 (0.0%) | 0 (0.0%) |
| High School Diploma | 31 (100.0%) | 0 (0.0%) |
| College / Associate Degree | 24 (100.0%) | 0 (0.0%) |
| Bachelor's Degree or higher | 15 (100.0%) | 15 (100.0%) |
| Total | 70 (100.0%) | 15 (21.4%) |
Employment Occupations by Sex in Rancho Viejo
Management, Business, Science and Arts Occupations
The most common Management, Business, Science and Arts occupations in Rancho Viejo are Community & Social Service (31 | 56.4%), and Education Instruction & Library (31 | 56.4%).
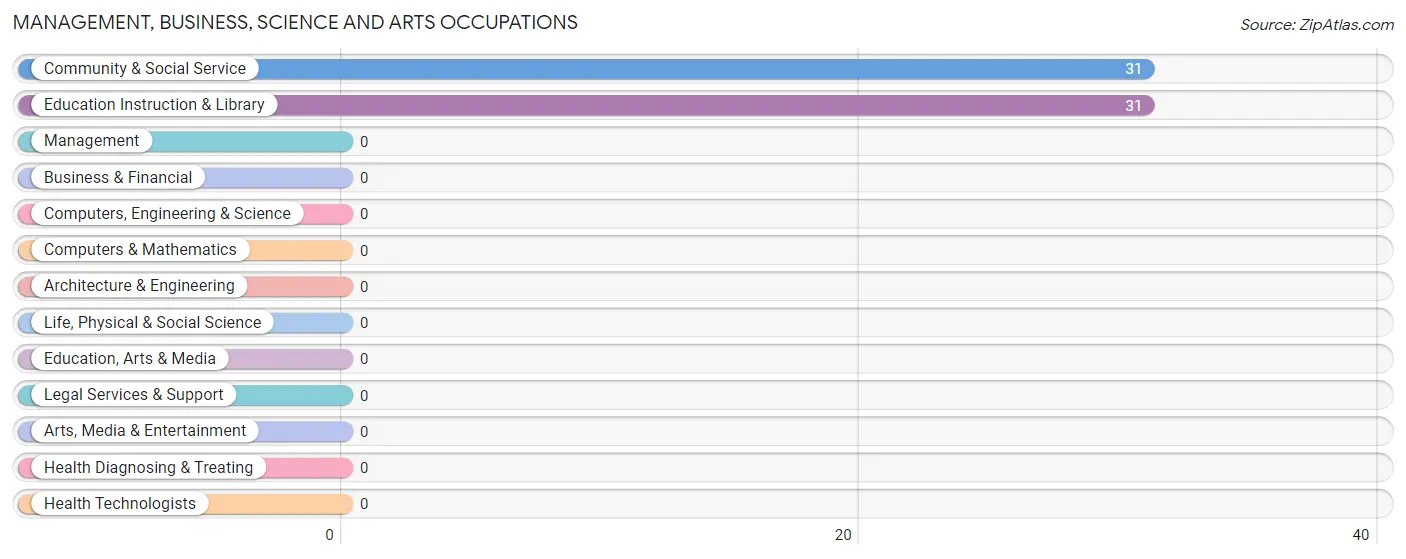
Management, Business, Science and Arts Occupations by Sex
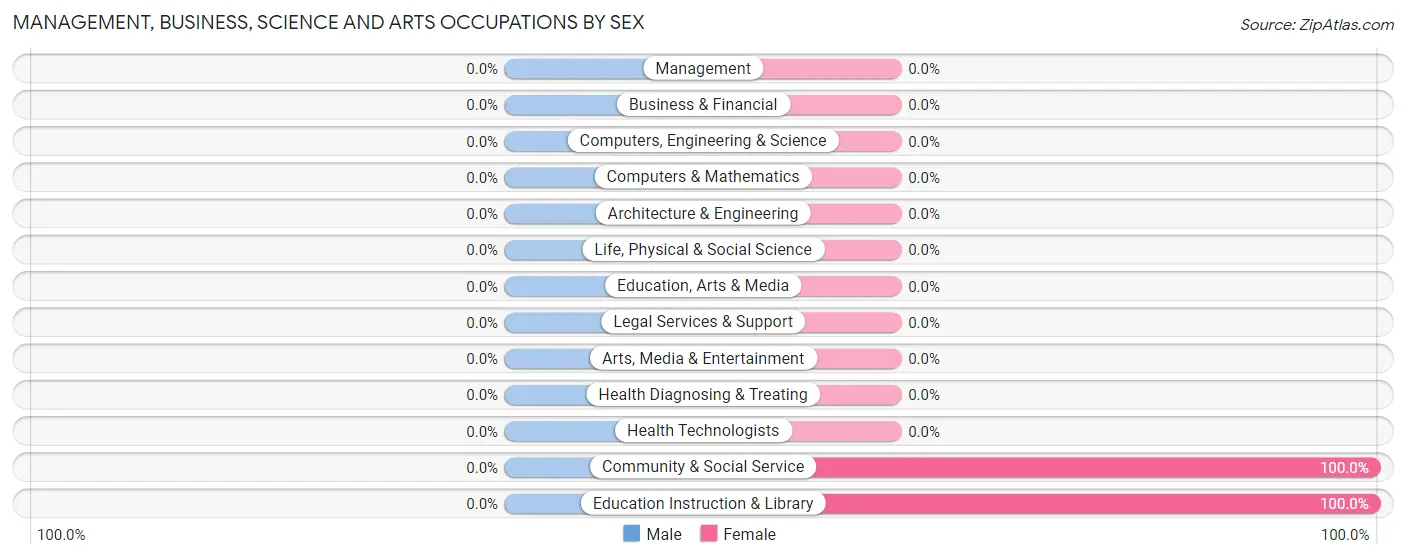
| Occupation | Male | Female |
| Management | 0 (0.0%) | 0 (0.0%) |
| Business & Financial | 0 (0.0%) | 0 (0.0%) |
| Computers, Engineering & Science | 0 (0.0%) | 0 (0.0%) |
| Computers & Mathematics | 0 (0.0%) | 0 (0.0%) |
| Architecture & Engineering | 0 (0.0%) | 0 (0.0%) |
| Life, Physical & Social Science | 0 (0.0%) | 0 (0.0%) |
| Community & Social Service | 0 (0.0%) | 31 (100.0%) |
| Education, Arts & Media | 0 (0.0%) | 0 (0.0%) |
| Legal Services & Support | 0 (0.0%) | 0 (0.0%) |
| Education Instruction & Library | 0 (0.0%) | 31 (100.0%) |
| Arts, Media & Entertainment | 0 (0.0%) | 0 (0.0%) |
| Health Diagnosing & Treating | 0 (0.0%) | 0 (0.0%) |
| Health Technologists | 0 (0.0%) | 0 (0.0%) |
| Total (Category) | 0 (0.0%) | 31 (100.0%) |
| Total (Overall) | 24 (43.6%) | 31 (56.4%) |
Services Occupations
Services Occupations by Sex
| Occupation | Male | Female |
| Healthcare Support | 0 (0.0%) | 0 (0.0%) |
| Security & Protection | 0 (0.0%) | 0 (0.0%) |
| Firefighting & Prevention | 0 (0.0%) | 0 (0.0%) |
| Law Enforcement | 0 (0.0%) | 0 (0.0%) |
| Food Preparation & Serving | 0 (0.0%) | 0 (0.0%) |
| Cleaning & Maintenance | 0 (0.0%) | 0 (0.0%) |
| Personal Care & Service | 0 (0.0%) | 0 (0.0%) |
| Total (Category) | 0 (0.0%) | 0 (0.0%) |
| Total (Overall) | 24 (43.6%) | 31 (56.4%) |
Sales and Office Occupations
Sales and Office Occupations by Sex
| Occupation | Male | Female |
| Sales & Related | 0 (0.0%) | 0 (0.0%) |
| Office & Administration | 0 (0.0%) | 0 (0.0%) |
| Total (Category) | 0 (0.0%) | 0 (0.0%) |
| Total (Overall) | 24 (43.6%) | 31 (56.4%) |
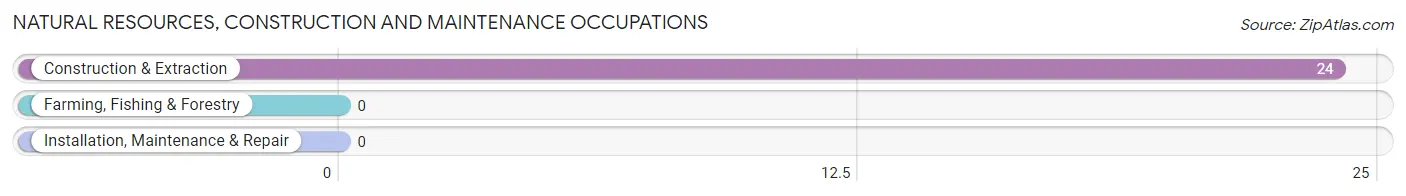
Natural Resources, Construction and Maintenance Occupations
The most common Natural Resources, Construction and Maintenance occupations in Rancho Viejo are , and Construction & Extraction (24 | 43.6%).
Natural Resources, Construction and Maintenance Occupations by Sex
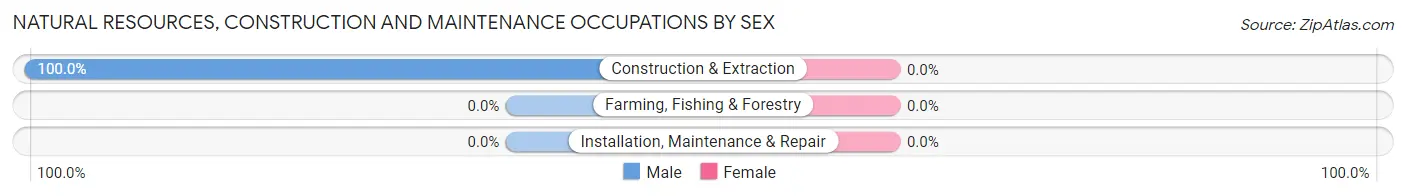
| Occupation | Male | Female |
| Farming, Fishing & Forestry | 0 (0.0%) | 0 (0.0%) |
| Construction & Extraction | 24 (100.0%) | 0 (0.0%) |
| Installation, Maintenance & Repair | 0 (0.0%) | 0 (0.0%) |
| Total (Category) | 24 (100.0%) | 0 (0.0%) |
| Total (Overall) | 24 (43.6%) | 31 (56.4%) |
Production, Transportation and Moving Occupations
Production, Transportation and Moving Occupations by Sex
| Occupation | Male | Female |
| Production | 0 (0.0%) | 0 (0.0%) |
| Transportation | 0 (0.0%) | 0 (0.0%) |
| Material Moving | 0 (0.0%) | 0 (0.0%) |
| Total (Category) | 0 (0.0%) | 0 (0.0%) |
| Total (Overall) | 24 (43.6%) | 31 (56.4%) |
Employment Industries by Sex in Rancho Viejo
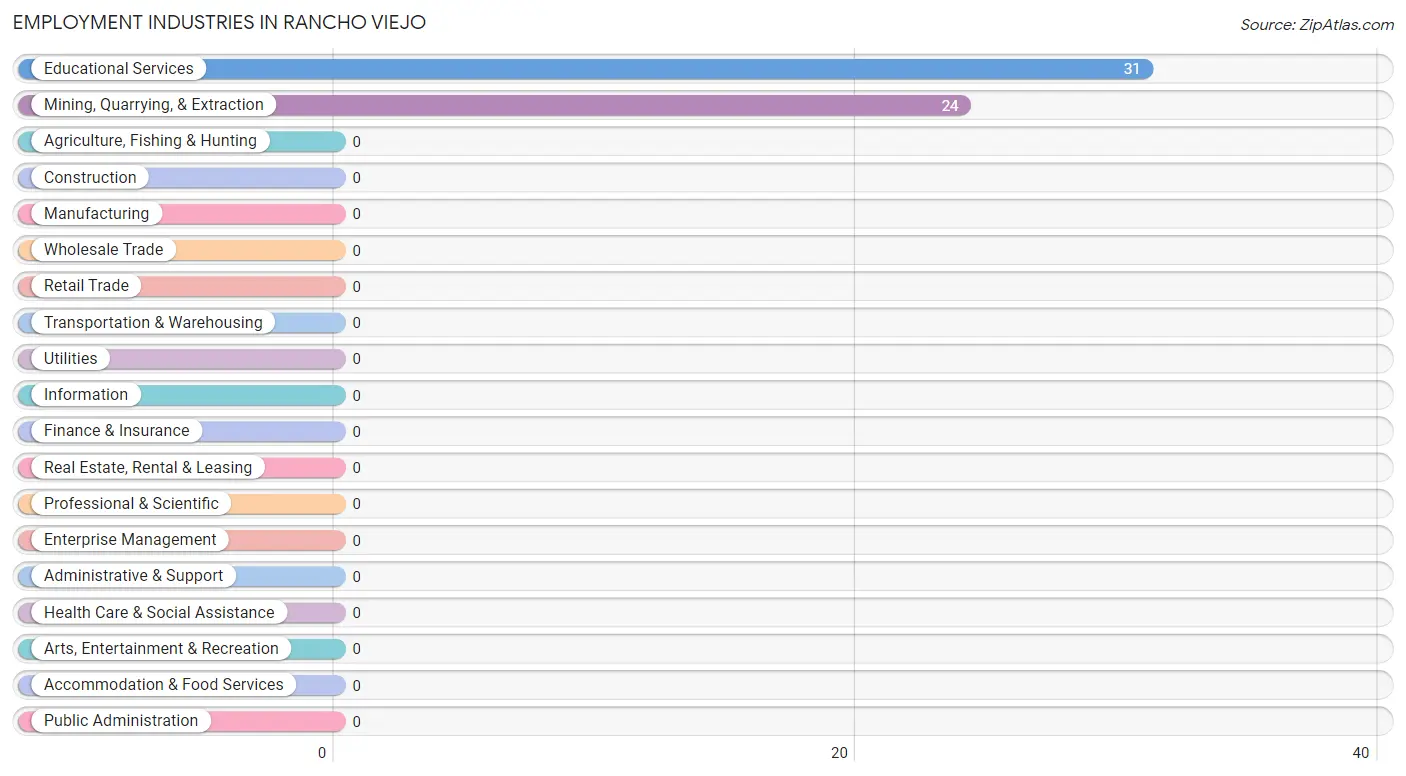
Employment Industries in Rancho Viejo
The major employment industries in Rancho Viejo include Educational Services (31 | 56.4%), and Mining, Quarrying, & Extraction (24 | 43.6%).
Employment Industries by Sex in Rancho Viejo
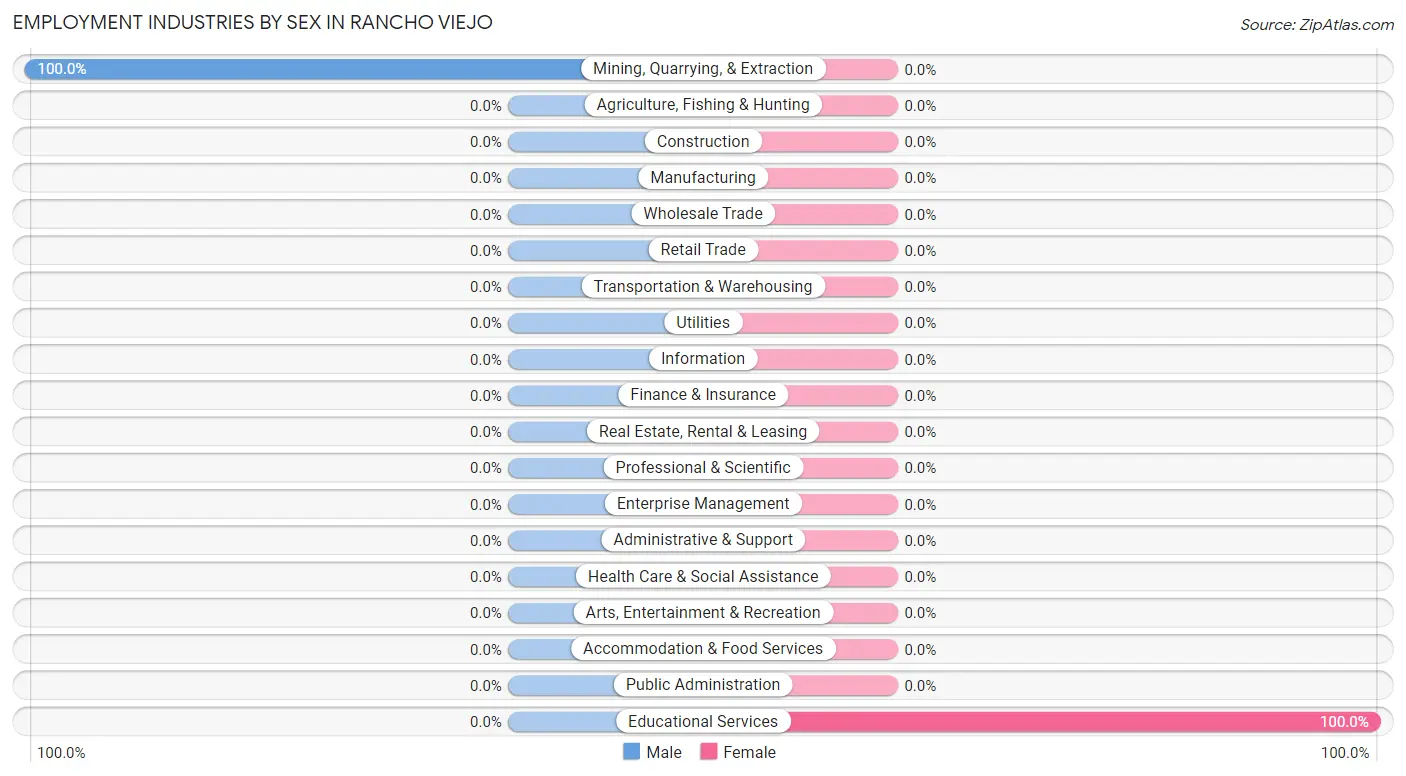
| Industry | Male | Female |
| Agriculture, Fishing & Hunting | 0 (0.0%) | 0 (0.0%) |
| Mining, Quarrying, & Extraction | 24 (100.0%) | 0 (0.0%) |
| Construction | 0 (0.0%) | 0 (0.0%) |
| Manufacturing | 0 (0.0%) | 0 (0.0%) |
| Wholesale Trade | 0 (0.0%) | 0 (0.0%) |
| Retail Trade | 0 (0.0%) | 0 (0.0%) |
| Transportation & Warehousing | 0 (0.0%) | 0 (0.0%) |
| Utilities | 0 (0.0%) | 0 (0.0%) |
| Information | 0 (0.0%) | 0 (0.0%) |
| Finance & Insurance | 0 (0.0%) | 0 (0.0%) |
| Real Estate, Rental & Leasing | 0 (0.0%) | 0 (0.0%) |
| Professional & Scientific | 0 (0.0%) | 0 (0.0%) |
| Enterprise Management | 0 (0.0%) | 0 (0.0%) |
| Administrative & Support | 0 (0.0%) | 0 (0.0%) |
| Educational Services | 0 (0.0%) | 31 (100.0%) |
| Health Care & Social Assistance | 0 (0.0%) | 0 (0.0%) |
| Arts, Entertainment & Recreation | 0 (0.0%) | 0 (0.0%) |
| Accommodation & Food Services | 0 (0.0%) | 0 (0.0%) |
| Public Administration | 0 (0.0%) | 0 (0.0%) |
| Total | 24 (43.6%) | 31 (56.4%) |
Education in Rancho Viejo
School Enrollment in Rancho Viejo
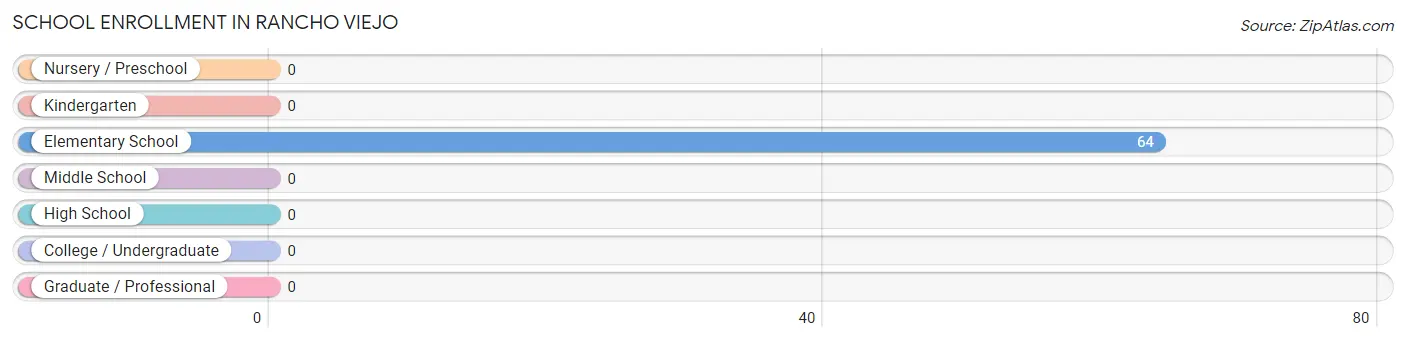
| School Level | # Students | % Students |
| Nursery / Preschool | 0 | 0.0% |
| Kindergarten | 0 | 0.0% |
| Elementary School | 64 | 100.0% |
| Middle School | 0 | 0.0% |
| High School | 0 | 0.0% |
| College / Undergraduate | 0 | 0.0% |
| Graduate / Professional | 0 | 0.0% |
| Total | 64 | 100.0% |
School Enrollment by Age by Funding Source in Rancho Viejo
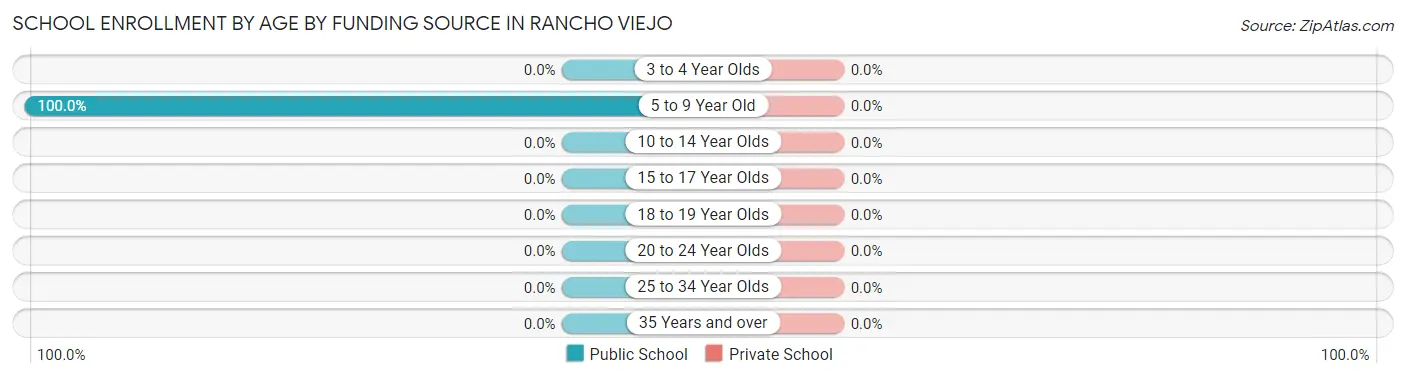
| Age Bracket | Public School | Private School |
| 3 to 4 Year Olds | 0 (0.0%) | 0 (0.0%) |
| 5 to 9 Year Old | 64 (100.0%) | 0 (0.0%) |
| 10 to 14 Year Olds | 0 (0.0%) | 0 (0.0%) |
| 15 to 17 Year Olds | 0 (0.0%) | 0 (0.0%) |
| 18 to 19 Year Olds | 0 (0.0%) | 0 (0.0%) |
| 20 to 24 Year Olds | 0 (0.0%) | 0 (0.0%) |
| 25 to 34 Year Olds | 0 (0.0%) | 0 (0.0%) |
| 35 Years and over | 0 (0.0%) | 0 (0.0%) |
| Total | 64 (100.0%) | 0 (0.0%) |
Educational Attainment by Field of Study in Rancho Viejo
, and arts & humanities (15 | 100.0%) are the most common fields of study among 15 individuals in Rancho Viejo who have obtained a bachelor's degree or higher.
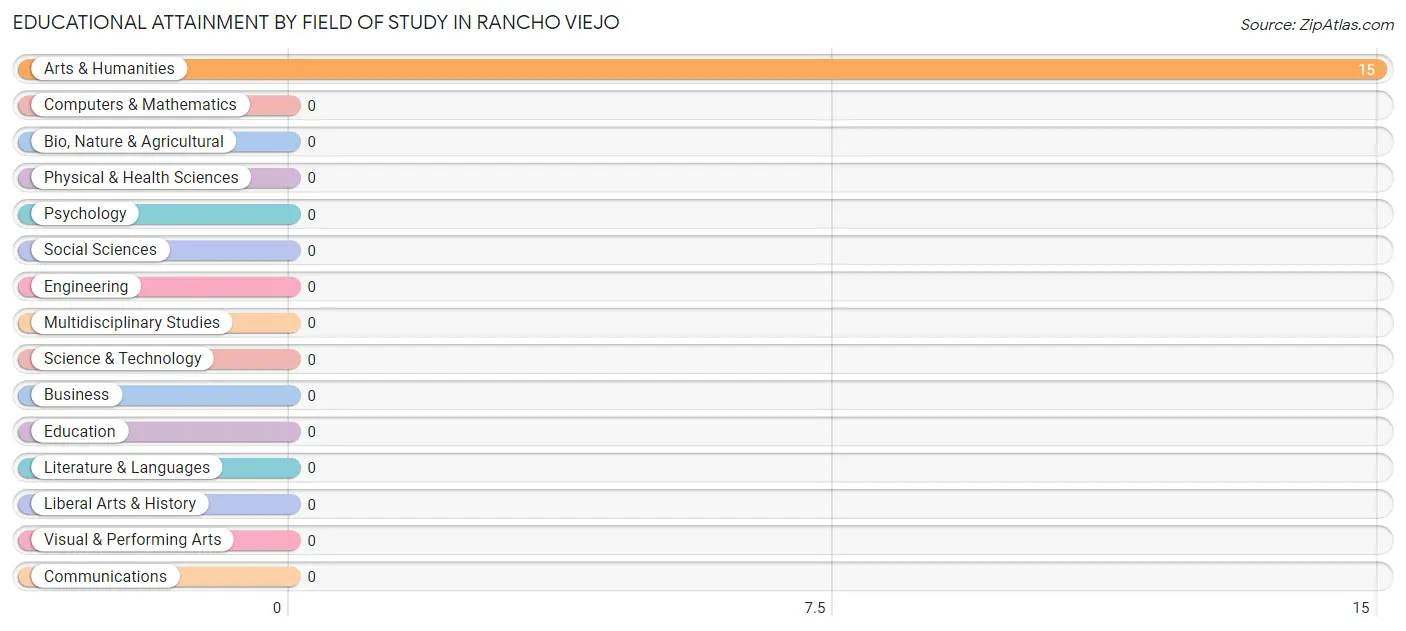
| Field of Study | # Graduates | % Graduates |
| Computers & Mathematics | 0 | 0.0% |
| Bio, Nature & Agricultural | 0 | 0.0% |
| Physical & Health Sciences | 0 | 0.0% |
| Psychology | 0 | 0.0% |
| Social Sciences | 0 | 0.0% |
| Engineering | 0 | 0.0% |
| Multidisciplinary Studies | 0 | 0.0% |
| Science & Technology | 0 | 0.0% |
| Business | 0 | 0.0% |
| Education | 0 | 0.0% |
| Literature & Languages | 0 | 0.0% |
| Liberal Arts & History | 0 | 0.0% |
| Visual & Performing Arts | 0 | 0.0% |
| Communications | 0 | 0.0% |
| Arts & Humanities | 15 | 100.0% |
| Total | 15 | 100.0% |
Transportation & Commute in Rancho Viejo
Vehicle Availability by Sex in Rancho Viejo
The most prevalent vehicle ownership categories in Rancho Viejo are males with 2 vehicles (24, accounting for 100.0%) and females with 2 vehicles (24, making up 77.4%).
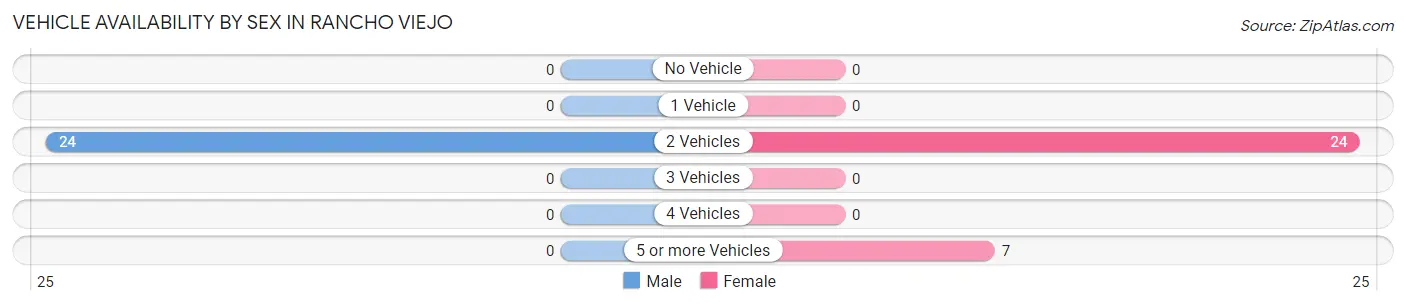
| Vehicles Available | Male | Female |
| No Vehicle | 0 (0.0%) | 0 (0.0%) |
| 1 Vehicle | 0 (0.0%) | 0 (0.0%) |
| 2 Vehicles | 24 (100.0%) | 24 (77.4%) |
| 3 Vehicles | 0 (0.0%) | 0 (0.0%) |
| 4 Vehicles | 0 (0.0%) | 0 (0.0%) |
| 5 or more Vehicles | 0 (0.0%) | 7 (22.6%) |
| Total | 24 (100.0%) | 31 (100.0%) |
Commute Time in Rancho Viejo
The most frequently occuring commute durations in Rancho Viejo are 20 to 24 minutes (48 commuters, 87.3%), 5 to 9 minutes (7 commuters, 12.7%), and less than 5 minutes (0 commuters, 0.0%).
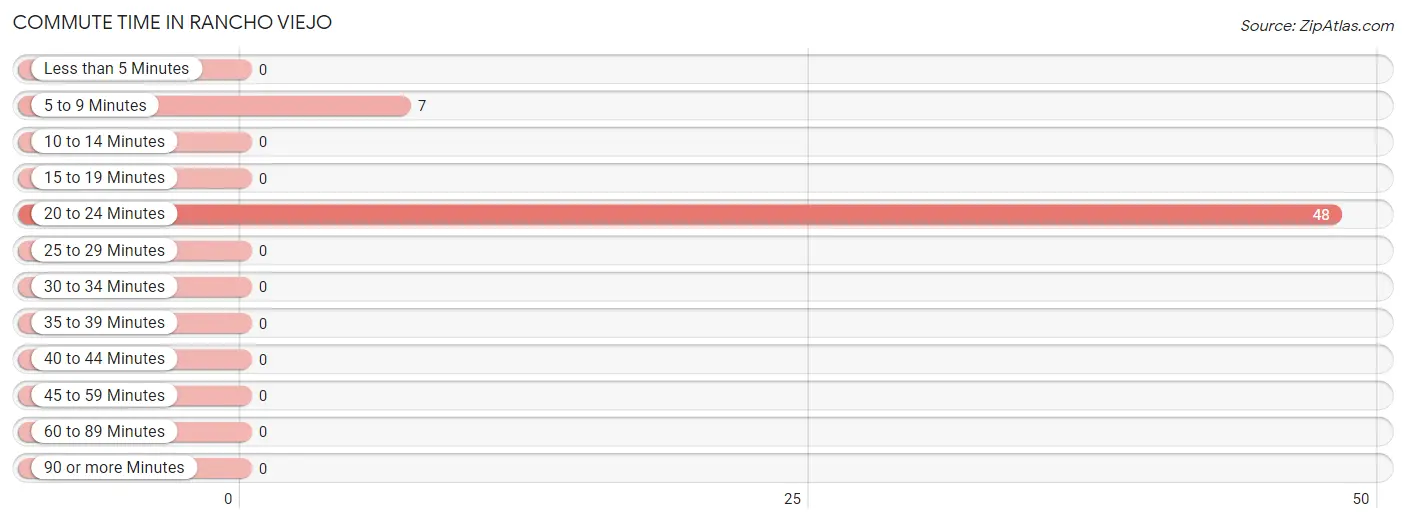
| Commute Time | # Commuters | % Commuters |
| Less than 5 Minutes | 0 | 0.0% |
| 5 to 9 Minutes | 7 | 12.7% |
| 10 to 14 Minutes | 0 | 0.0% |
| 15 to 19 Minutes | 0 | 0.0% |
| 20 to 24 Minutes | 48 | 87.3% |
| 25 to 29 Minutes | 0 | 0.0% |
| 30 to 34 Minutes | 0 | 0.0% |
| 35 to 39 Minutes | 0 | 0.0% |
| 40 to 44 Minutes | 0 | 0.0% |
| 45 to 59 Minutes | 0 | 0.0% |
| 60 to 89 Minutes | 0 | 0.0% |
| 90 or more Minutes | 0 | 0.0% |
Commute Time by Sex in Rancho Viejo
The most common commute times in Rancho Viejo are 20 to 24 minutes (24 commuters, 100.0%) for males and 20 to 24 minutes (24 commuters, 77.4%) for females.
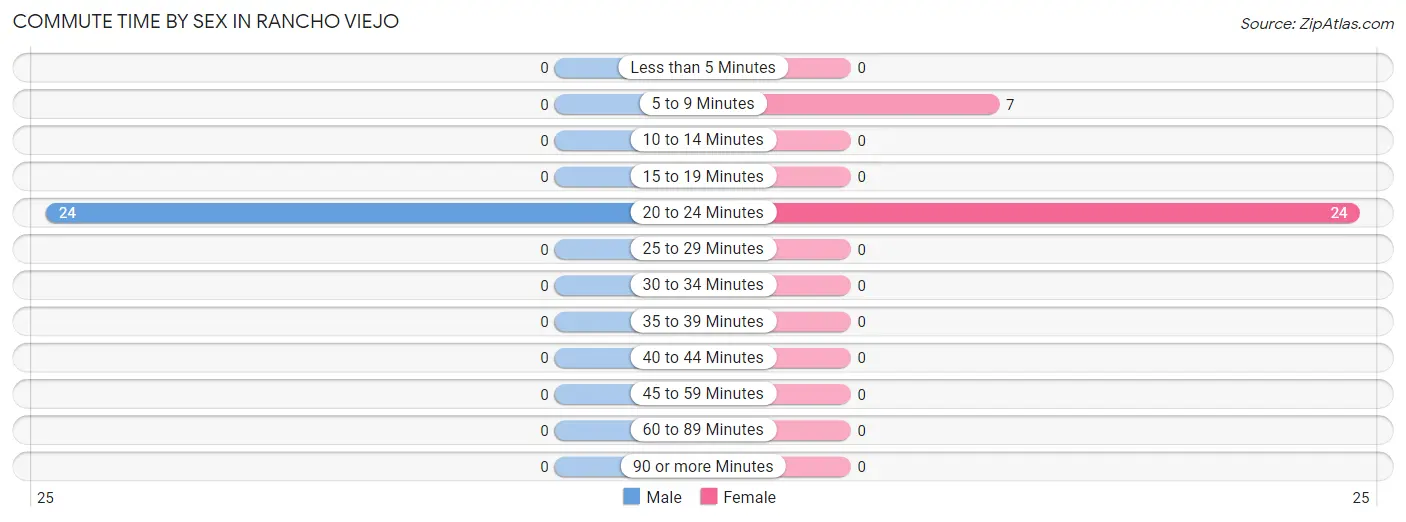
| Commute Time | Male | Female |
| Less than 5 Minutes | 0 (0.0%) | 0 (0.0%) |
| 5 to 9 Minutes | 0 (0.0%) | 7 (22.6%) |
| 10 to 14 Minutes | 0 (0.0%) | 0 (0.0%) |
| 15 to 19 Minutes | 0 (0.0%) | 0 (0.0%) |
| 20 to 24 Minutes | 24 (100.0%) | 24 (77.4%) |
| 25 to 29 Minutes | 0 (0.0%) | 0 (0.0%) |
| 30 to 34 Minutes | 0 (0.0%) | 0 (0.0%) |
| 35 to 39 Minutes | 0 (0.0%) | 0 (0.0%) |
| 40 to 44 Minutes | 0 (0.0%) | 0 (0.0%) |
| 45 to 59 Minutes | 0 (0.0%) | 0 (0.0%) |
| 60 to 89 Minutes | 0 (0.0%) | 0 (0.0%) |
| 90 or more Minutes | 0 (0.0%) | 0 (0.0%) |
Time of Departure to Work by Sex in Rancho Viejo
The most frequent times of departure to work in Rancho Viejo are 5:00 AM to 5:29 AM (24, 100.0%) for males and 7:00 AM to 7:29 AM (24, 77.4%) for females.
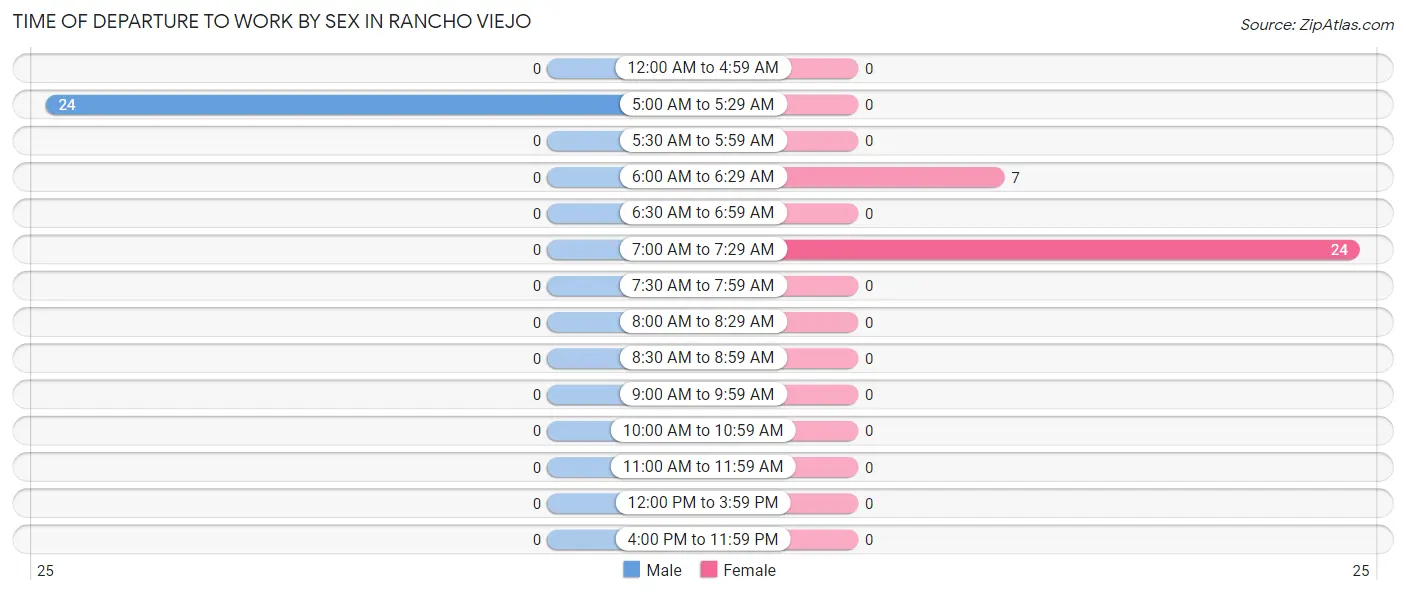
| Time of Departure | Male | Female |
| 12:00 AM to 4:59 AM | 0 (0.0%) | 0 (0.0%) |
| 5:00 AM to 5:29 AM | 24 (100.0%) | 0 (0.0%) |
| 5:30 AM to 5:59 AM | 0 (0.0%) | 0 (0.0%) |
| 6:00 AM to 6:29 AM | 0 (0.0%) | 7 (22.6%) |
| 6:30 AM to 6:59 AM | 0 (0.0%) | 0 (0.0%) |
| 7:00 AM to 7:29 AM | 0 (0.0%) | 24 (77.4%) |
| 7:30 AM to 7:59 AM | 0 (0.0%) | 0 (0.0%) |
| 8:00 AM to 8:29 AM | 0 (0.0%) | 0 (0.0%) |
| 8:30 AM to 8:59 AM | 0 (0.0%) | 0 (0.0%) |
| 9:00 AM to 9:59 AM | 0 (0.0%) | 0 (0.0%) |
| 10:00 AM to 10:59 AM | 0 (0.0%) | 0 (0.0%) |
| 11:00 AM to 11:59 AM | 0 (0.0%) | 0 (0.0%) |
| 12:00 PM to 3:59 PM | 0 (0.0%) | 0 (0.0%) |
| 4:00 PM to 11:59 PM | 0 (0.0%) | 0 (0.0%) |
| Total | 24 (100.0%) | 31 (100.0%) |
Housing Occupancy in Rancho Viejo
Occupancy by Ownership in Rancho Viejo
Of the total 1,029 dwellings in Rancho Viejo, owner-occupied units account for 746 (72.5%), while renter-occupied units make up 283 (27.5%).
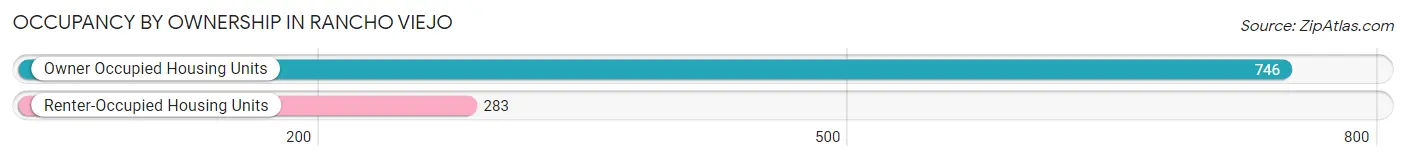
| Occupancy | # Housing Units | % Housing Units |
| Owner Occupied Housing Units | 746 | 72.5% |
| Renter-Occupied Housing Units | 283 | 27.5% |
| Total Occupied Housing Units | 1,029 | 100.0% |
Occupancy by Household Size in Rancho Viejo
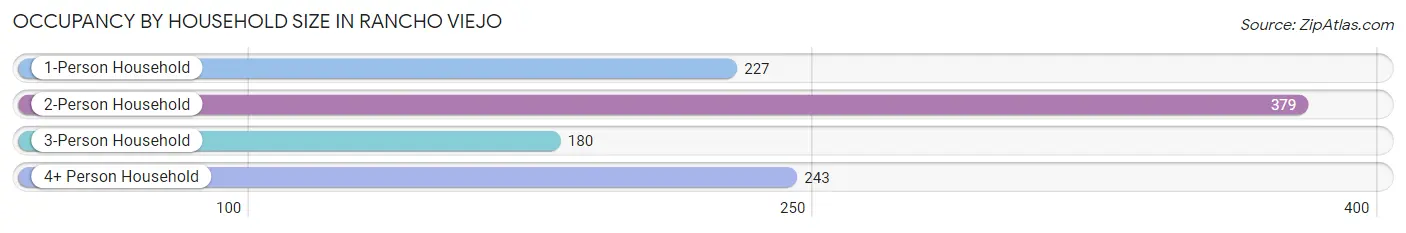
| Household Size | # Housing Units | % Housing Units |
| 1-Person Household | 227 | 22.1% |
| 2-Person Household | 379 | 36.8% |
| 3-Person Household | 180 | 17.5% |
| 4+ Person Household | 243 | 23.6% |
| Total Housing Units | 1,029 | 100.0% |
Occupancy by Ownership by Household Size in Rancho Viejo
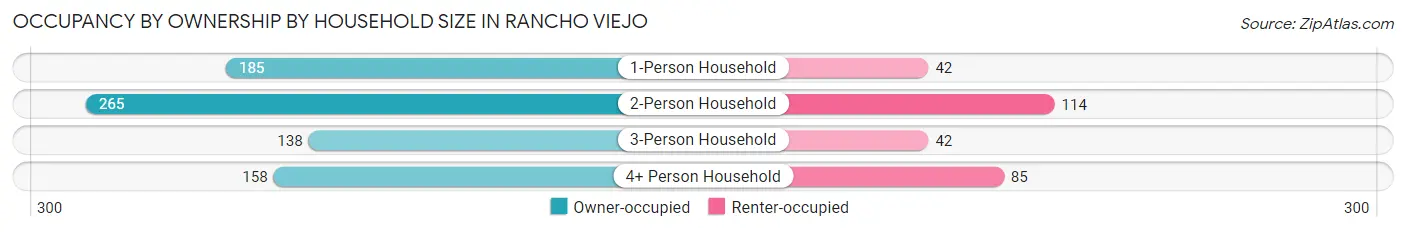
| Household Size | Owner-occupied | Renter-occupied |
| 1-Person Household | 185 (81.5%) | 42 (18.5%) |
| 2-Person Household | 265 (69.9%) | 114 (30.1%) |
| 3-Person Household | 138 (76.7%) | 42 (23.3%) |
| 4+ Person Household | 158 (65.0%) | 85 (35.0%) |
| Total Housing Units | 746 (72.5%) | 283 (27.5%) |
Occupancy by Educational Attainment in Rancho Viejo
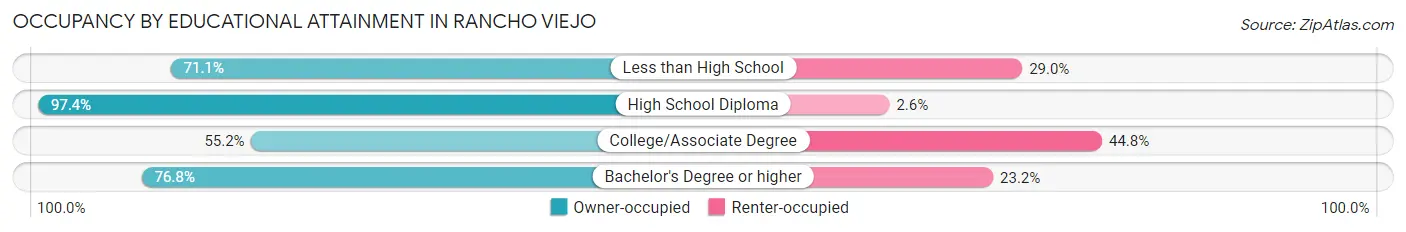
| Household Size | Owner-occupied | Renter-occupied |
| Less than High School | 27 (71.1%) | 11 (28.9%) |
| High School Diploma | 74 (97.4%) | 2 (2.6%) |
| College/Associate Degree | 148 (55.2%) | 120 (44.8%) |
| Bachelor's Degree or higher | 497 (76.8%) | 150 (23.2%) |
Occupancy by Age of Householder in Rancho Viejo
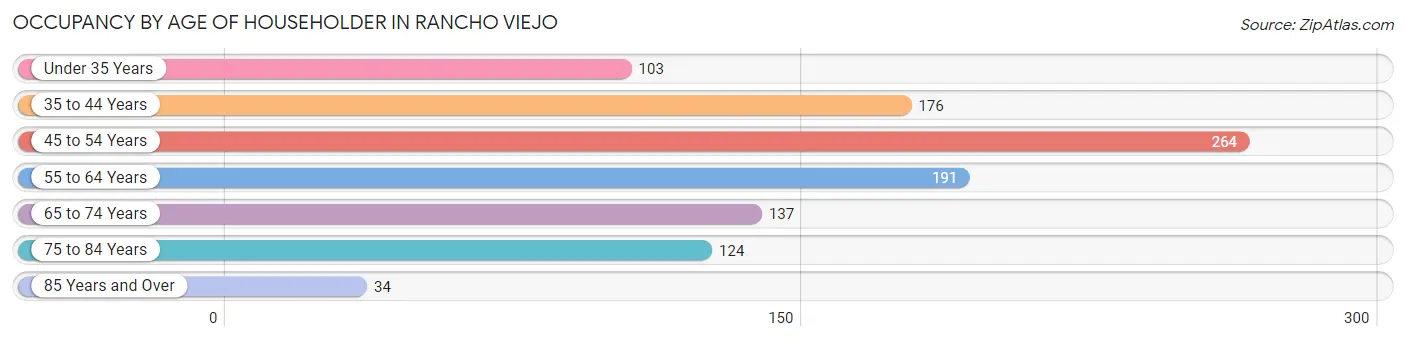
| Age Bracket | # Households | % Households |
| Under 35 Years | 103 | 10.0% |
| 35 to 44 Years | 176 | 17.1% |
| 45 to 54 Years | 264 | 25.7% |
| 55 to 64 Years | 191 | 18.6% |
| 65 to 74 Years | 137 | 13.3% |
| 75 to 84 Years | 124 | 12.0% |
| 85 Years and Over | 34 | 3.3% |
| Total | 1,029 | 100.0% |
Housing Finances in Rancho Viejo
Median Income by Occupancy in Rancho Viejo
| Occupancy Type | # Households | Median Income |
| Owner-Occupied | 24 (77.4%) | $0 |
| Renter-Occupied | 7 (22.6%) | $0 |
| Average | 31 (100.0%) | $0 |
Occupancy by Householder Income Bracket in Rancho Viejo
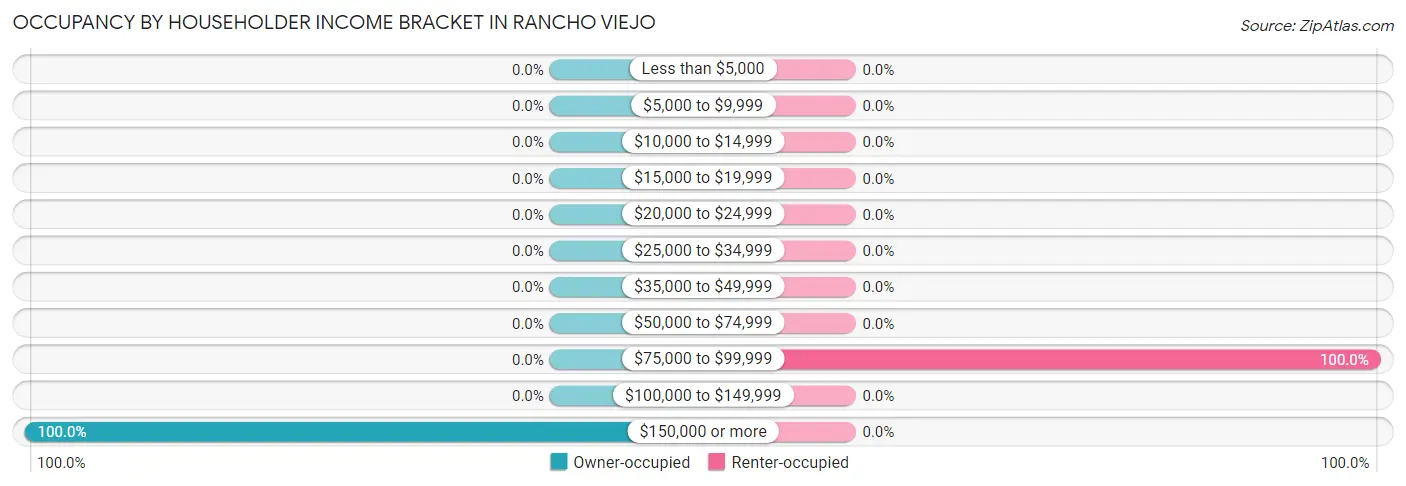
| Income Bracket | Owner-occupied | Renter-occupied |
| Less than $5,000 | 0 (0.0%) | 0 (0.0%) |
| $5,000 to $9,999 | 0 (0.0%) | 0 (0.0%) |
| $10,000 to $14,999 | 0 (0.0%) | 0 (0.0%) |
| $15,000 to $19,999 | 0 (0.0%) | 0 (0.0%) |
| $20,000 to $24,999 | 0 (0.0%) | 0 (0.0%) |
| $25,000 to $34,999 | 0 (0.0%) | 0 (0.0%) |
| $35,000 to $49,999 | 0 (0.0%) | 0 (0.0%) |
| $50,000 to $74,999 | 0 (0.0%) | 0 (0.0%) |
| $75,000 to $99,999 | 0 (0.0%) | 7 (100.0%) |
| $100,000 to $149,999 | 0 (0.0%) | 0 (0.0%) |
| $150,000 or more | 24 (100.0%) | 0 (0.0%) |
| Total | 24 (100.0%) | 7 (100.0%) |
Monthly Housing Cost Tiers in Rancho Viejo
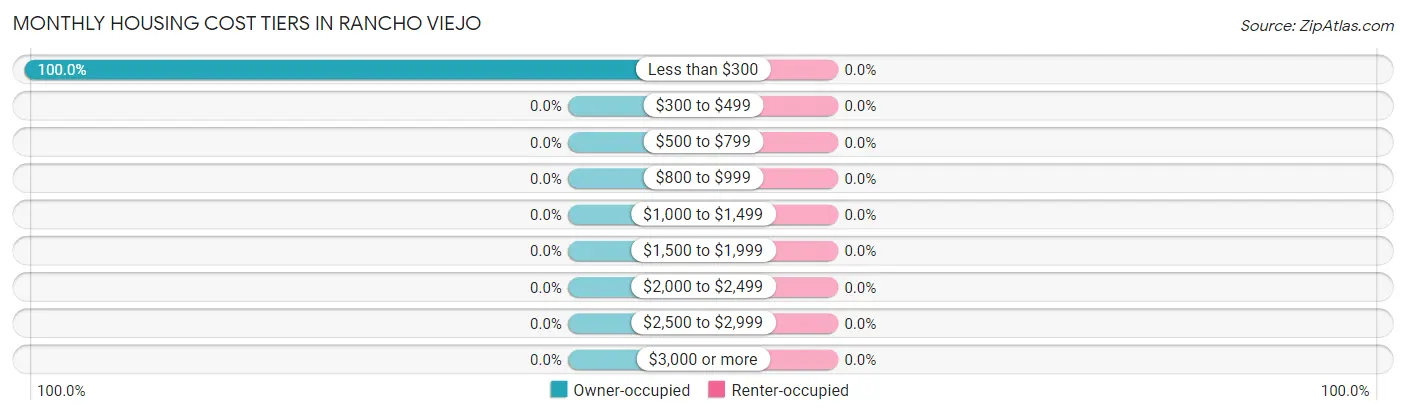
| Monthly Cost | Owner-occupied | Renter-occupied |
| Less than $300 | 24 (100.0%) | 0 (0.0%) |
| $300 to $499 | 0 (0.0%) | 0 (0.0%) |
| $500 to $799 | 0 (0.0%) | 0 (0.0%) |
| $800 to $999 | 0 (0.0%) | 0 (0.0%) |
| $1,000 to $1,499 | 0 (0.0%) | 0 (0.0%) |
| $1,500 to $1,999 | 0 (0.0%) | 0 (0.0%) |
| $2,000 to $2,499 | 0 (0.0%) | 0 (0.0%) |
| $2,500 to $2,999 | 0 (0.0%) | 0 (0.0%) |
| $3,000 or more | 0 (0.0%) | 0 (0.0%) |
| Total | 24 (100.0%) | 7 (100.0%) |
Physical Housing Characteristics in Rancho Viejo
Housing Structures in Rancho Viejo
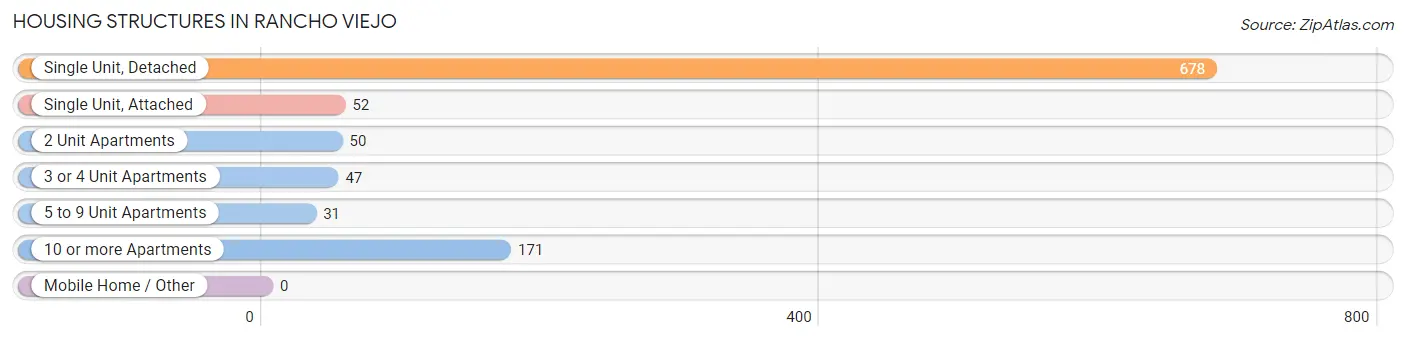
| Structure Type | # Housing Units | % Housing Units |
| Single Unit, Detached | 678 | 65.9% |
| Single Unit, Attached | 52 | 5.1% |
| 2 Unit Apartments | 50 | 4.9% |
| 3 or 4 Unit Apartments | 47 | 4.6% |
| 5 to 9 Unit Apartments | 31 | 3.0% |
| 10 or more Apartments | 171 | 16.6% |
| Mobile Home / Other | 0 | 0.0% |
| Total | 1,029 | 100.0% |
Housing Structures by Occupancy in Rancho Viejo
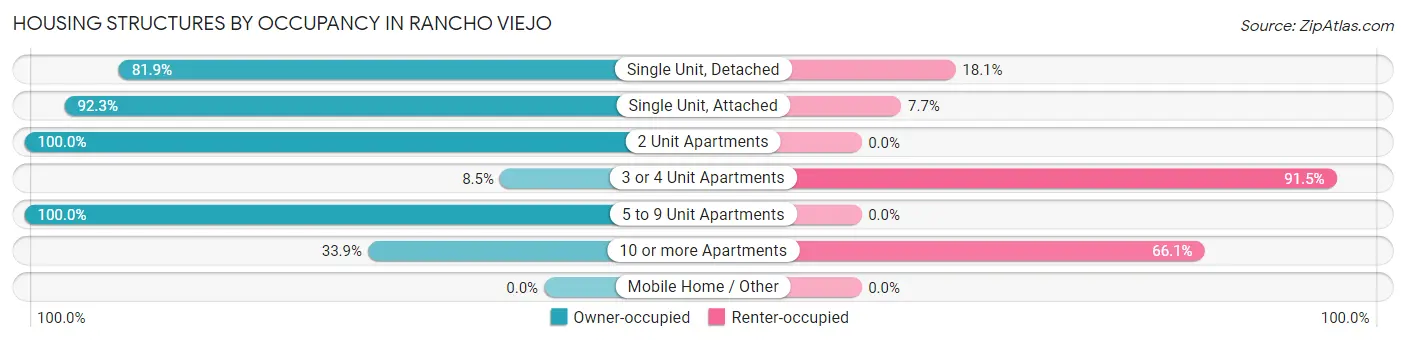
| Structure Type | Owner-occupied | Renter-occupied |
| Single Unit, Detached | 555 (81.9%) | 123 (18.1%) |
| Single Unit, Attached | 48 (92.3%) | 4 (7.7%) |
| 2 Unit Apartments | 50 (100.0%) | 0 (0.0%) |
| 3 or 4 Unit Apartments | 4 (8.5%) | 43 (91.5%) |
| 5 to 9 Unit Apartments | 31 (100.0%) | 0 (0.0%) |
| 10 or more Apartments | 58 (33.9%) | 113 (66.1%) |
| Mobile Home / Other | 0 (0.0%) | 0 (0.0%) |
| Total | 746 (72.5%) | 283 (27.5%) |
Housing Structures by Number of Rooms in Rancho Viejo
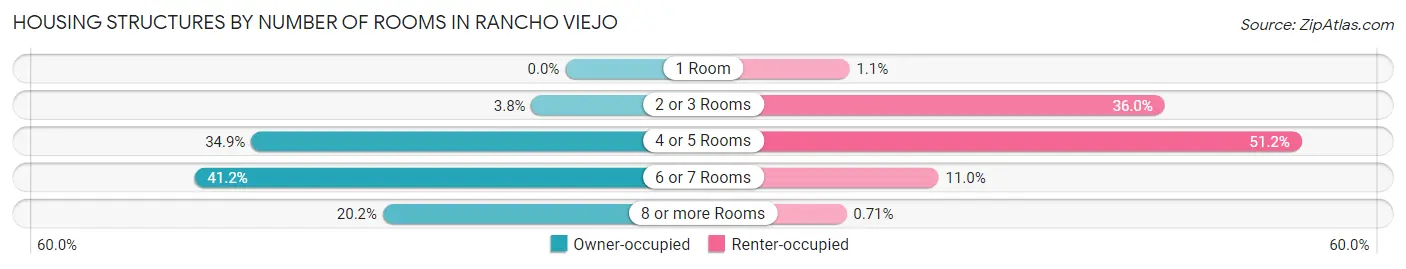
| Number of Rooms | Owner-occupied | Renter-occupied |
| 1 Room | 0 (0.0%) | 3 (1.1%) |
| 2 or 3 Rooms | 28 (3.7%) | 102 (36.0%) |
| 4 or 5 Rooms | 260 (34.8%) | 145 (51.2%) |
| 6 or 7 Rooms | 307 (41.1%) | 31 (11.0%) |
| 8 or more Rooms | 151 (20.2%) | 2 (0.7%) |
| Total | 746 (100.0%) | 283 (100.0%) |
Housing Structure by Heating Type in Rancho Viejo
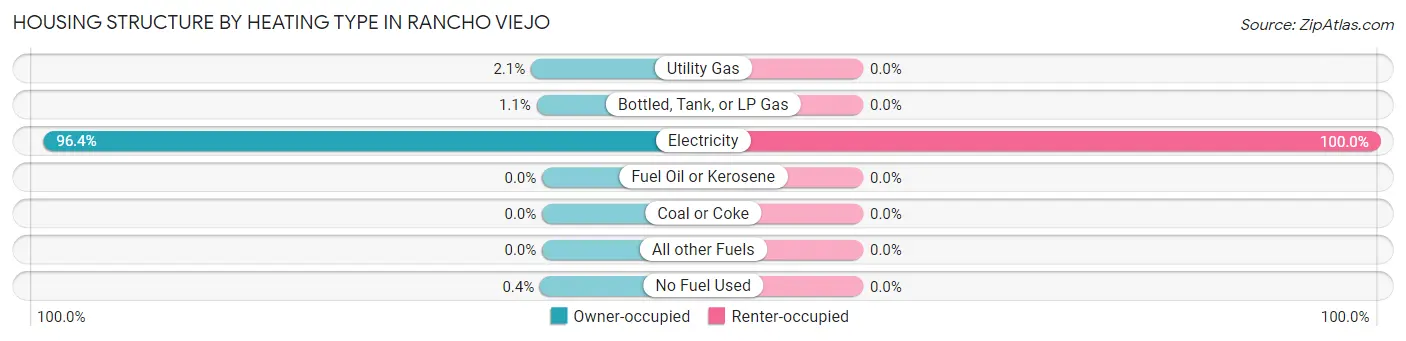
| Heating Type | Owner-occupied | Renter-occupied |
| Utility Gas | 16 (2.1%) | 0 (0.0%) |
| Bottled, Tank, or LP Gas | 8 (1.1%) | 0 (0.0%) |
| Electricity | 719 (96.4%) | 283 (100.0%) |
| Fuel Oil or Kerosene | 0 (0.0%) | 0 (0.0%) |
| Coal or Coke | 0 (0.0%) | 0 (0.0%) |
| All other Fuels | 0 (0.0%) | 0 (0.0%) |
| No Fuel Used | 3 (0.4%) | 0 (0.0%) |
| Total | 746 (100.0%) | 283 (100.0%) |
Household Vehicle Usage in Rancho Viejo
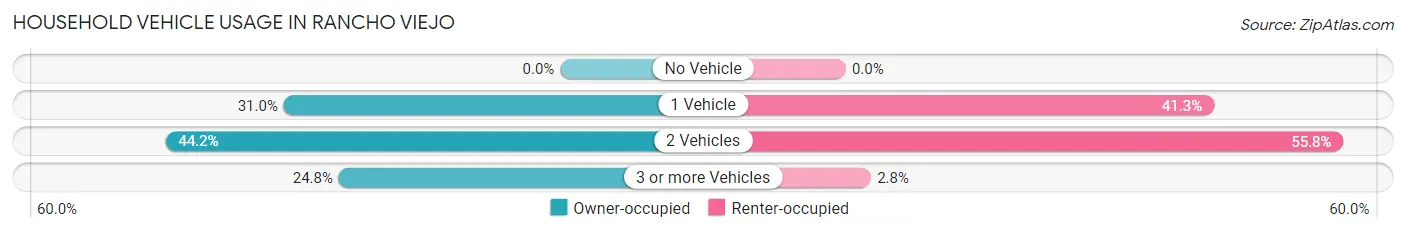
| Vehicles per Household | Owner-occupied | Renter-occupied |
| No Vehicle | 0 (0.0%) | 0 (0.0%) |
| 1 Vehicle | 231 (31.0%) | 117 (41.3%) |
| 2 Vehicles | 330 (44.2%) | 158 (55.8%) |
| 3 or more Vehicles | 185 (24.8%) | 8 (2.8%) |
| Total | 746 (100.0%) | 283 (100.0%) |
Real Estate & Mortgages in Rancho Viejo
Real Estate and Mortgage Overview in Rancho Viejo
| Characteristic | Without Mortgage | With Mortgage |
| Housing Units | 465 | 0 |
| Median Property Value | $207,800 | $0 |
| Median Household Income | $69,531 | $0 |
| Monthly Housing Costs | $701 | $0 |
| Real Estate Taxes | $3,167 | $0 |
Property Value by Mortgage Status in Rancho Viejo
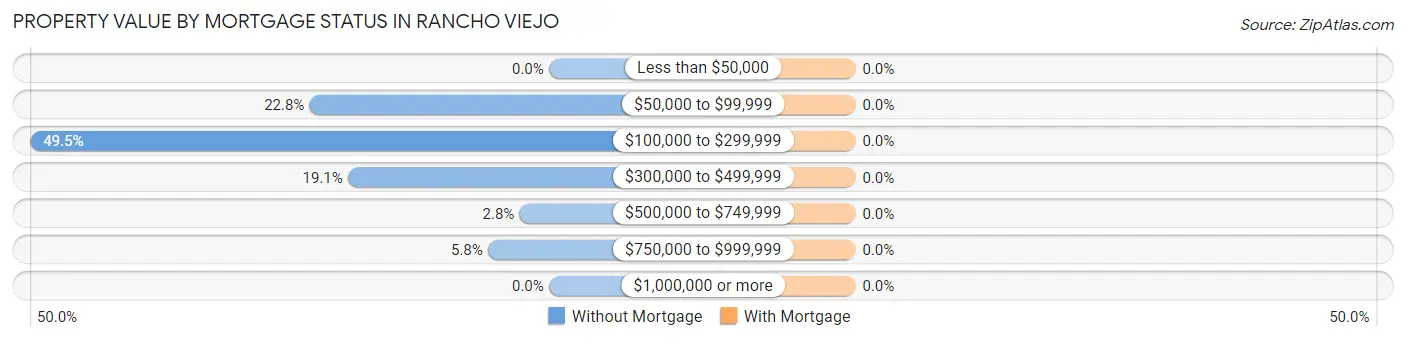
| Property Value | Without Mortgage | With Mortgage |
| Less than $50,000 | 0 (0.0%) | 0 (0.0%) |
| $50,000 to $99,999 | 106 (22.8%) | 0 (0.0%) |
| $100,000 to $299,999 | 230 (49.5%) | 0 (0.0%) |
| $300,000 to $499,999 | 89 (19.1%) | 0 (0.0%) |
| $500,000 to $749,999 | 13 (2.8%) | 0 (0.0%) |
| $750,000 to $999,999 | 27 (5.8%) | 0 (0.0%) |
| $1,000,000 or more | 0 (0.0%) | 0 (0.0%) |
| Total | 465 (100.0%) | 0 (0.0%) |
Household Income by Mortgage Status in Rancho Viejo
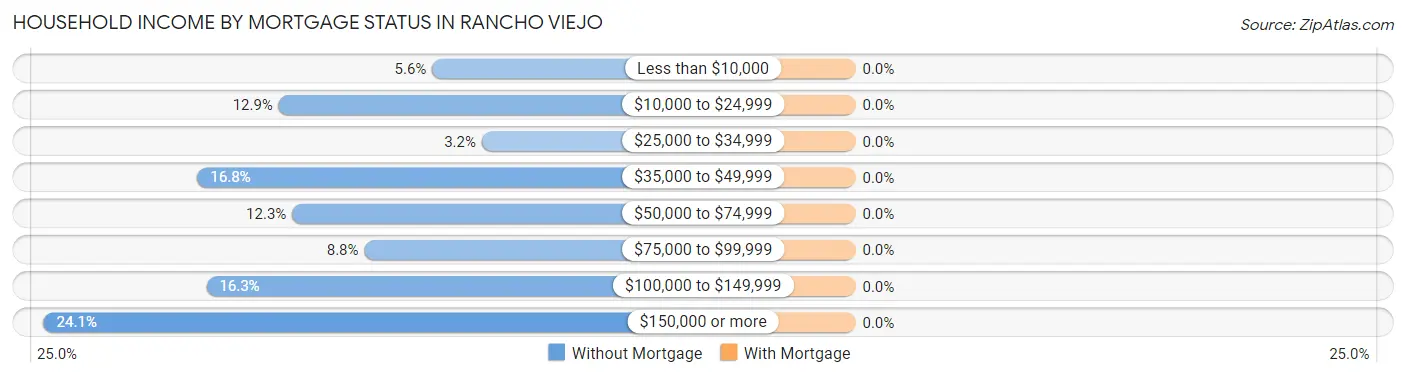
| Household Income | Without Mortgage | With Mortgage |
| Less than $10,000 | 26 (5.6%) | 0 (0.0%) |
| $10,000 to $24,999 | 60 (12.9%) | 0 (0.0%) |
| $25,000 to $34,999 | 15 (3.2%) | 0 (0.0%) |
| $35,000 to $49,999 | 78 (16.8%) | 0 (0.0%) |
| $50,000 to $74,999 | 57 (12.3%) | 0 (0.0%) |
| $75,000 to $99,999 | 41 (8.8%) | 0 (0.0%) |
| $100,000 to $149,999 | 76 (16.3%) | 0 (0.0%) |
| $150,000 or more | 112 (24.1%) | 0 (0.0%) |
| Total | 465 (100.0%) | 0 (0.0%) |
Property Value to Household Income Ratio in Rancho Viejo
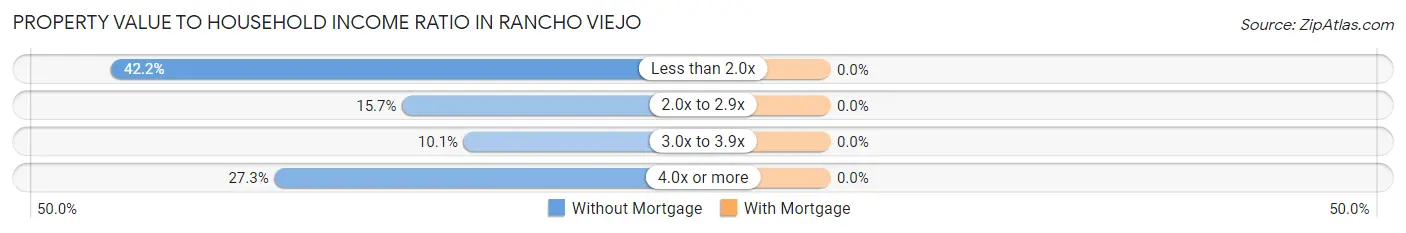
| Value-to-Income Ratio | Without Mortgage | With Mortgage |
| Less than 2.0x | 196 (42.1%) | 0 (0.0%) |
| 2.0x to 2.9x | 73 (15.7%) | 0 (0.0%) |
| 3.0x to 3.9x | 47 (10.1%) | 0 (0.0%) |
| 4.0x or more | 127 (27.3%) | 0 (0.0%) |
| Total | 465 (100.0%) | 0 (0.0%) |
Real Estate Taxes by Mortgage Status in Rancho Viejo
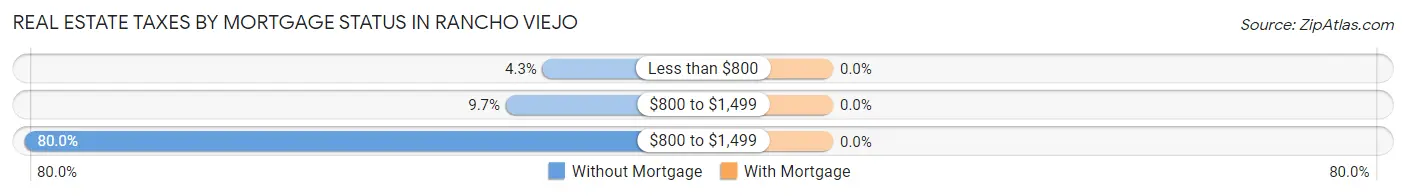
| Property Taxes | Without Mortgage | With Mortgage |
| Less than $800 | 20 (4.3%) | 0 (0.0%) |
| $800 to $1,499 | 45 (9.7%) | 0 (0.0%) |
| $800 to $1,499 | 372 (80.0%) | 0 (0.0%) |
| Total | 465 (100.0%) | 0 (0.0%) |
Health & Disability in Rancho Viejo
Health Insurance Coverage by Age in Rancho Viejo
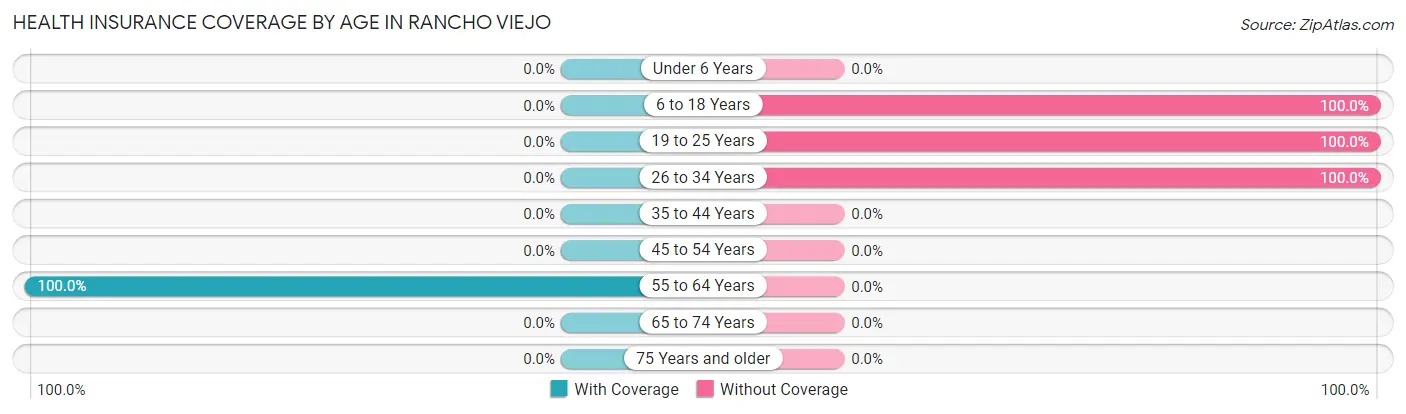
| Age Bracket | With Coverage | Without Coverage |
| Under 6 Years | 0 (0.0%) | 0 (0.0%) |
| 6 to 18 Years | 0 (0.0%) | 64 (100.0%) |
| 19 to 25 Years | 0 (0.0%) | 14 (100.0%) |
| 26 to 34 Years | 0 (0.0%) | 63 (100.0%) |
| 35 to 44 Years | 0 (0.0%) | 0 (0.0%) |
| 45 to 54 Years | 0 (0.0%) | 0 (0.0%) |
| 55 to 64 Years | 7 (100.0%) | 0 (0.0%) |
| 65 to 74 Years | 0 (0.0%) | 0 (0.0%) |
| 75 Years and older | 0 (0.0%) | 0 (0.0%) |
| Total | 7 (4.7%) | 141 (95.3%) |
Health Insurance Coverage by Citizenship Status in Rancho Viejo
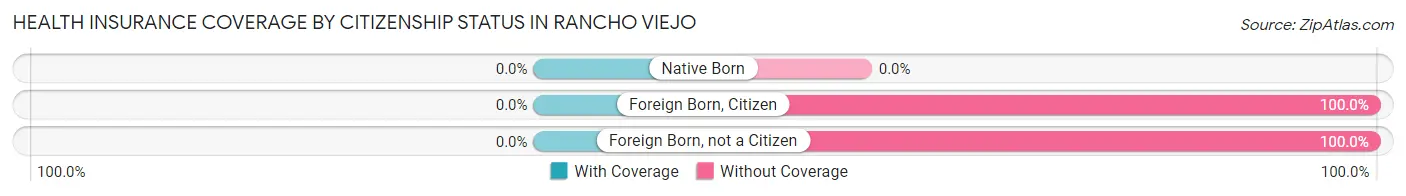
| Citizenship Status | With Coverage | Without Coverage |
| Native Born | 0 (0.0%) | 0 (0.0%) |
| Foreign Born, Citizen | 0 (0.0%) | 64 (100.0%) |
| Foreign Born, not a Citizen | 0 (0.0%) | 14 (100.0%) |
Health Insurance Coverage by Household Income in Rancho Viejo
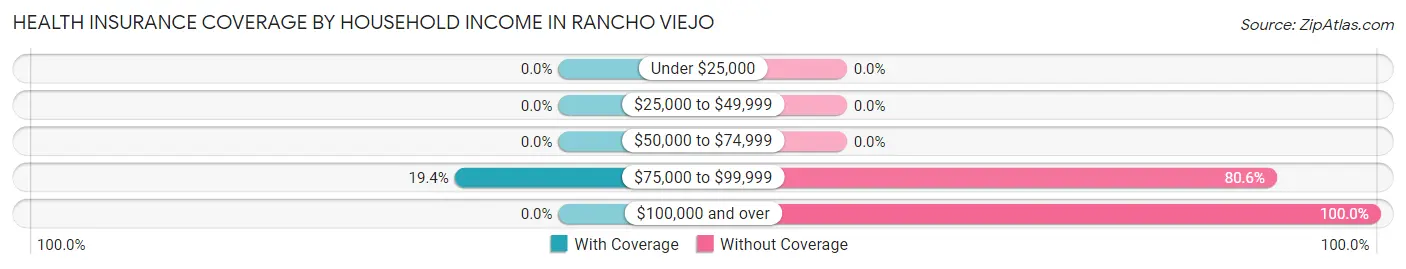
| Household Income | With Coverage | Without Coverage |
| Under $25,000 | 0 (0.0%) | 0 (0.0%) |
| $25,000 to $49,999 | 0 (0.0%) | 0 (0.0%) |
| $50,000 to $74,999 | 0 (0.0%) | 0 (0.0%) |
| $75,000 to $99,999 | 7 (19.4%) | 29 (80.6%) |
| $100,000 and over | 0 (0.0%) | 112 (100.0%) |
Public vs Private Health Insurance Coverage by Age in Rancho Viejo
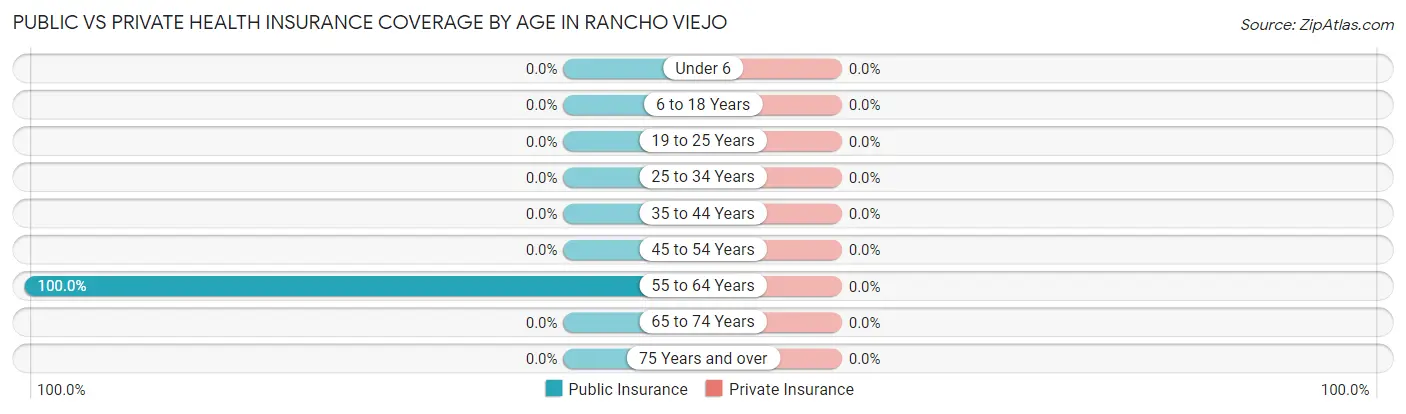
| Age Bracket | Public Insurance | Private Insurance |
| Under 6 | 0 (0.0%) | 0 (0.0%) |
| 6 to 18 Years | 0 (0.0%) | 0 (0.0%) |
| 19 to 25 Years | 0 (0.0%) | 0 (0.0%) |
| 25 to 34 Years | 0 (0.0%) | 0 (0.0%) |
| 35 to 44 Years | 0 (0.0%) | 0 (0.0%) |
| 45 to 54 Years | 0 (0.0%) | 0 (0.0%) |
| 55 to 64 Years | 7 (100.0%) | 0 (0.0%) |
| 65 to 74 Years | 0 (0.0%) | 0 (0.0%) |
| 75 Years and over | 0 (0.0%) | 0 (0.0%) |
| Total | 7 (4.7%) | 0 (0.0%) |
Disability Status by Sex by Age in Rancho Viejo
| Age Bracket | Male | Female |
| Under 5 Years | 0 (0.0%) | 0 (0.0%) |
| 5 to 17 Years | 0 (0.0%) | 0 (0.0%) |
| 18 to 34 Years | 0 (0.0%) | 0 (0.0%) |
| 35 to 64 Years | 0 (0.0%) | 0 (0.0%) |
| 65 to 74 Years | 0 (0.0%) | 0 (0.0%) |
| 75 Years and over | 0 (0.0%) | 0 (0.0%) |
Disability Class by Sex by Age in Rancho Viejo
Disability Class: Hearing Difficulty
| Age Bracket | Male | Female |
| Under 5 Years | 0 (0.0%) | 0 (0.0%) |
| 5 to 17 Years | 0 (0.0%) | 0 (0.0%) |
| 18 to 34 Years | 0 (0.0%) | 0 (0.0%) |
| 35 to 64 Years | 0 (0.0%) | 0 (0.0%) |
| 65 to 74 Years | 0 (0.0%) | 0 (0.0%) |
| 75 Years and over | 0 (0.0%) | 0 (0.0%) |
Disability Class: Vision Difficulty
| Age Bracket | Male | Female |
| Under 5 Years | 0 (0.0%) | 0 (0.0%) |
| 5 to 17 Years | 0 (0.0%) | 0 (0.0%) |
| 18 to 34 Years | 0 (0.0%) | 0 (0.0%) |
| 35 to 64 Years | 0 (0.0%) | 0 (0.0%) |
| 65 to 74 Years | 0 (0.0%) | 0 (0.0%) |
| 75 Years and over | 0 (0.0%) | 0 (0.0%) |
Disability Class: Cognitive Difficulty
| Age Bracket | Male | Female |
| 5 to 17 Years | 0 (0.0%) | 0 (0.0%) |
| 18 to 34 Years | 0 (0.0%) | 0 (0.0%) |
| 35 to 64 Years | 0 (0.0%) | 0 (0.0%) |
| 65 to 74 Years | 0 (0.0%) | 0 (0.0%) |
| 75 Years and over | 0 (0.0%) | 0 (0.0%) |
Disability Class: Ambulatory Difficulty
| Age Bracket | Male | Female |
| 5 to 17 Years | 0 (0.0%) | 0 (0.0%) |
| 18 to 34 Years | 0 (0.0%) | 0 (0.0%) |
| 35 to 64 Years | 0 (0.0%) | 0 (0.0%) |
| 65 to 74 Years | 0 (0.0%) | 0 (0.0%) |
| 75 Years and over | 0 (0.0%) | 0 (0.0%) |
Disability Class: Self-Care Difficulty
| Age Bracket | Male | Female |
| 5 to 17 Years | 0 (0.0%) | 0 (0.0%) |
| 18 to 34 Years | 0 (0.0%) | 0 (0.0%) |
| 35 to 64 Years | 0 (0.0%) | 0 (0.0%) |
| 65 to 74 Years | 0 (0.0%) | 0 (0.0%) |
| 75 Years and over | 0 (0.0%) | 0 (0.0%) |
Technology Access in Rancho Viejo
Computing Device Access in Rancho Viejo
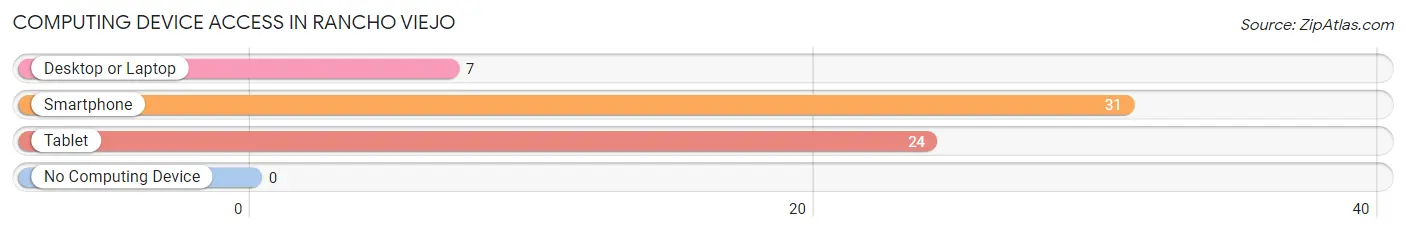
| Device Type | # Households | % Households |
| Desktop or Laptop | 7 | 22.6% |
| Smartphone | 31 | 100.0% |
| Tablet | 24 | 77.4% |
| No Computing Device | 0 | 0.0% |
| Total | 31 | 100.0% |
Internet Access in Rancho Viejo
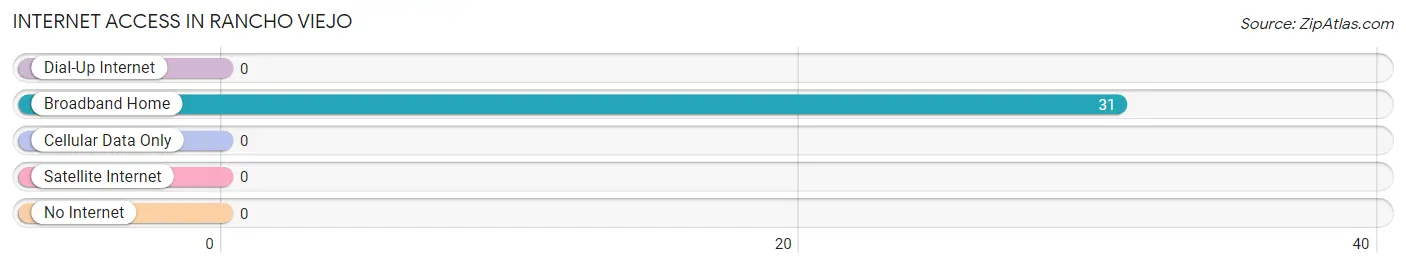
| Internet Type | # Households | % Households |
| Dial-Up Internet | 0 | 0.0% |
| Broadband Home | 31 | 100.0% |
| Cellular Data Only | 0 | 0.0% |
| Satellite Internet | 0 | 0.0% |
| No Internet | 0 | 0.0% |
| Total | 31 | 100.0% |
Rancho Viejo Summary
Rancho Viejo is a census-designated place (CDP) located in Cameron County, Texas, United States. The population was 1,845 at the 2010 census. It is part of the Brownsville–Harlingen Metropolitan Statistical Area.
History
Rancho Viejo was founded in the late 19th century by a group of Mexican settlers who were looking for a place to settle and raise their families. The area was originally known as El Rancho Viejo, which translates to “The Old Ranch” in English. The settlers were attracted to the area due to its fertile soil and abundant water sources. The settlers built homes, churches, and businesses, and the area quickly grew into a thriving community.
In the early 20th century, the area was annexed by the city of Brownsville, and the name was changed to Rancho Viejo. The area continued to grow and develop, and by the 1950s, it had become a popular destination for tourists and vacationers.
Geography
Rancho Viejo is located at 26°10'25" North, 97°25'45" West (26.173611, -97.429167). It is situated on the northern edge of the Rio Grande Valley, approximately 10 miles (16 km) south of Brownsville and 10 miles (16 km) north of Harlingen.
The CDP has a total area of 2 2 square miles 5 7 km2 all of which is land
Economy
Rancho Viejo is primarily a residential community, but it does have a few businesses. The most notable of these is the Rancho Viejo Resort and Country Club, which is a popular destination for golfers and vacationers. The resort features a championship golf course, a spa, and a variety of other amenities.
The area also has a few small businesses, including restaurants, convenience stores, and gas stations.
Demographics
As of the 2010 census, there were 1,845 people, 645 households, and 486 families residing in the CDP. The population density was 837.2 people per square mile (323.7/km2). There were 717 housing units at an average density of 326.2/sq mi (125.7/km2). The racial makeup of the CDP was 79.2% White, 0.7% African American, 0.2% Native American, 0.2% Asian, 17.3% from other races, and 2.6% from two or more races. Hispanic or Latino of any race were 97.2% of the population.
There were 645 households, out of which 37.2% had children under the age of 18 living with them, 54.2% were married couples living together, 14.2% had a female householder with no husband present, and 24.2% were non-families. 19.7% of all households were made up of individuals, and 8.2% had someone living alone who was 65 years of age or older. The average household size was 2.86 and the average family size was 3.30.
In the CDP, the population was spread out, with 28.2% under the age of 18, 9.2% from 18 to 24, 27.2% from 25 to 44, 22.7% from 45 to 64, and 12.7% who were 65 years of age or older. The median age was 34 years. For every 100 females, there were 94.2 males. For every 100 females age 18 and over, there were 91.2 males.
The median income for a household in the CDP was $25,938, and the median income for a family was $27,917. Males had a median income of $21,250 versus $17,500 for females. The per capita income for the CDP was $10,945. About 24.2% of families and 28.2% of the population were below the poverty line, including 37.2% of those under age 18 and 16.7% of those age 65 or over.
Common Questions
What is Per Capita Income in Rancho Viejo?
Per Capita income in Rancho Viejo is $41,919.
What is Inequality or Gini Index in Rancho Viejo?
Inequality or Gini Index in Rancho Viejo is 0.10.
What is the Total Population of Rancho Viejo?
Total Population of Rancho Viejo is 148.
What is the Total Male Population of Rancho Viejo?
Total Male Population of Rancho Viejo is 117.
What is the Total Female Population of Rancho Viejo?
Total Female Population of Rancho Viejo is 31.
What is the Ratio of Males per 100 Females in Rancho Viejo?
There are 377.42 Males per 100 Females in Rancho Viejo.
What is the Ratio of Females per 100 Males in Rancho Viejo?
There are 26.50 Females per 100 Males in Rancho Viejo.
What is the Median Population Age in Rancho Viejo?
Median Population Age in Rancho Viejo is 24.7 Years.
What is the Average Family Size in Rancho Viejo
Average Family Size in Rancho Viejo is 4.8 People.
What is the Average Household Size in Rancho Viejo
Average Household Size in Rancho Viejo is 4.8 People.
How Large is the Labor Force in Rancho Viejo?
There are 70 People in the Labor Forcein in Rancho Viejo.
What is the Percentage of People in the Labor Force in Rancho Viejo?
83.3% of People are in the Labor Force in Rancho Viejo.
What is the Unemployment Rate in Rancho Viejo?
Unemployment Rate in Rancho Viejo is 21.4%.