Hunters Creek Village, TX Map & Demographics
Hunters Creek Village Map
Hunters Creek Village Overview
$178,130
PER CAPITA INCOME
$250,001
AVG FAMILY INCOME
$250,001
AVG HOUSEHOLD INCOME
45.0%
WAGE / INCOME GAP [ % ]
55.0¢/ $1
WAGE / INCOME GAP [ $ ]
0.44
INEQUALITY / GINI INDEX
4,383
TOTAL POPULATION
2,240
MALE POPULATION
2,143
FEMALE POPULATION
104.53
MALES / 100 FEMALES
95.67
FEMALES / 100 MALES
47.3
MEDIAN AGE
3.1
AVG FAMILY SIZE
2.9
AVG HOUSEHOLD SIZE
1,936
LABOR FORCE [ PEOPLE ]
56.4%
PERCENT IN LABOR FORCE
8.9%
UNEMPLOYMENT RATE
Income in Hunters Creek Village
Income Overview in Hunters Creek Village
Per Capita Income in Hunters Creek Village is $178,130, while median incomes of families and households are $250,001 and $250,001 respectively.
| Characteristic | Number | Measure |
| Per Capita Income | 4,383 | $178,130 |
| Median Family Income | 1,322 | $250,001 |
| Mean Family Income | 1,322 | $552,173 |
| Median Household Income | 1,524 | $250,001 |
| Mean Household Income | 1,524 | $507,821 |
| Income Deficit | 1,322 | $0 |
| Wage / Income Gap (%) | 4,383 | 45.00% |
| Wage / Income Gap ($) | 4,383 | 55.00¢ per $1 |
| Gini / Inequality Index | 4,383 | 0.44 |
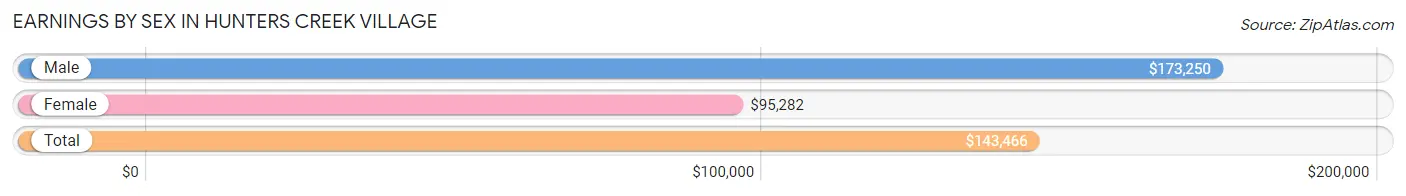
Earnings by Sex in Hunters Creek Village
Average Earnings in Hunters Creek Village are $143,466, $173,250 for men and $95,282 for women, a difference of 45.0%.
| Sex | Number | Average Earnings |
| Male | 1,304 (60.6%) | $173,250 |
| Female | 847 (39.4%) | $95,282 |
| Total | 2,151 (100.0%) | $143,466 |
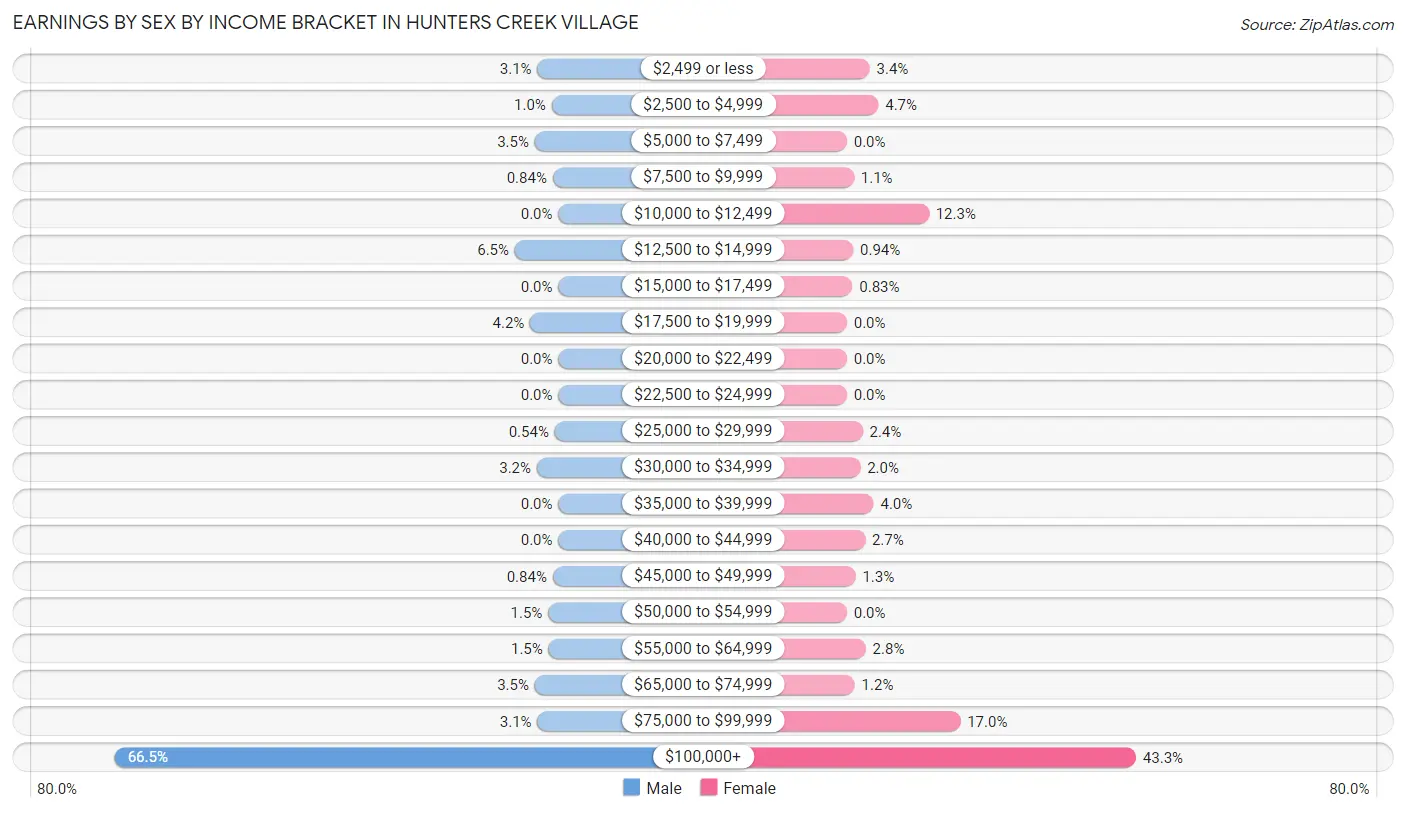
Earnings by Sex by Income Bracket in Hunters Creek Village
The most common earnings brackets in Hunters Creek Village are $100,000+ for men (867 | 66.5%) and $100,000+ for women (367 | 43.3%).
| Income | Male | Female |
| $2,499 or less | 41 (3.1%) | 29 (3.4%) |
| $2,500 to $4,999 | 13 (1.0%) | 40 (4.7%) |
| $5,000 to $7,499 | 46 (3.5%) | 0 (0.0%) |
| $7,500 to $9,999 | 11 (0.8%) | 9 (1.1%) |
| $10,000 to $12,499 | 0 (0.0%) | 104 (12.3%) |
| $12,500 to $14,999 | 85 (6.5%) | 8 (0.9%) |
| $15,000 to $17,499 | 0 (0.0%) | 7 (0.8%) |
| $17,500 to $19,999 | 55 (4.2%) | 0 (0.0%) |
| $20,000 to $22,499 | 0 (0.0%) | 0 (0.0%) |
| $22,500 to $24,999 | 0 (0.0%) | 0 (0.0%) |
| $25,000 to $29,999 | 7 (0.5%) | 20 (2.4%) |
| $30,000 to $34,999 | 42 (3.2%) | 17 (2.0%) |
| $35,000 to $39,999 | 0 (0.0%) | 34 (4.0%) |
| $40,000 to $44,999 | 0 (0.0%) | 23 (2.7%) |
| $45,000 to $49,999 | 11 (0.8%) | 11 (1.3%) |
| $50,000 to $54,999 | 20 (1.5%) | 0 (0.0%) |
| $55,000 to $64,999 | 19 (1.5%) | 24 (2.8%) |
| $65,000 to $74,999 | 46 (3.5%) | 10 (1.2%) |
| $75,000 to $99,999 | 41 (3.1%) | 144 (17.0%) |
| $100,000+ | 867 (66.5%) | 367 (43.3%) |
| Total | 1,304 (100.0%) | 847 (100.0%) |
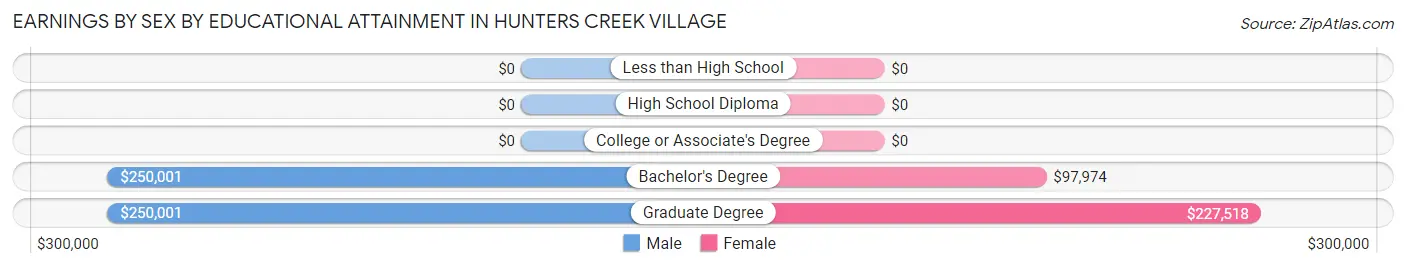
Earnings by Sex by Educational Attainment in Hunters Creek Village
Average earnings in Hunters Creek Village are $250,001 for men and $113,182 for women, a difference of 54.7%. Men with an educational attainment of bachelor's degree enjoy the highest average annual earnings of $250,001, while those with bachelor's degree education earn the least with $250,001. Women with an educational attainment of graduate degree earn the most with the average annual earnings of $227,518, while those with bachelor's degree education have the smallest earnings of $97,974.
| Educational Attainment | Male Income | Female Income |
| Less than High School | - | - |
| High School Diploma | - | - |
| College or Associate's Degree | - | - |
| Bachelor's Degree | $250,001 | $97,974 |
| Graduate Degree | $250,001 | $227,518 |
| Total | $250,001 | $113,182 |
Family Income in Hunters Creek Village
Family Income Brackets in Hunters Creek Village
According to the Hunters Creek Village family income data, there are 1,025 families falling into the $200,000+ income range, which is the most common income bracket and makes up 77.5% of all families.
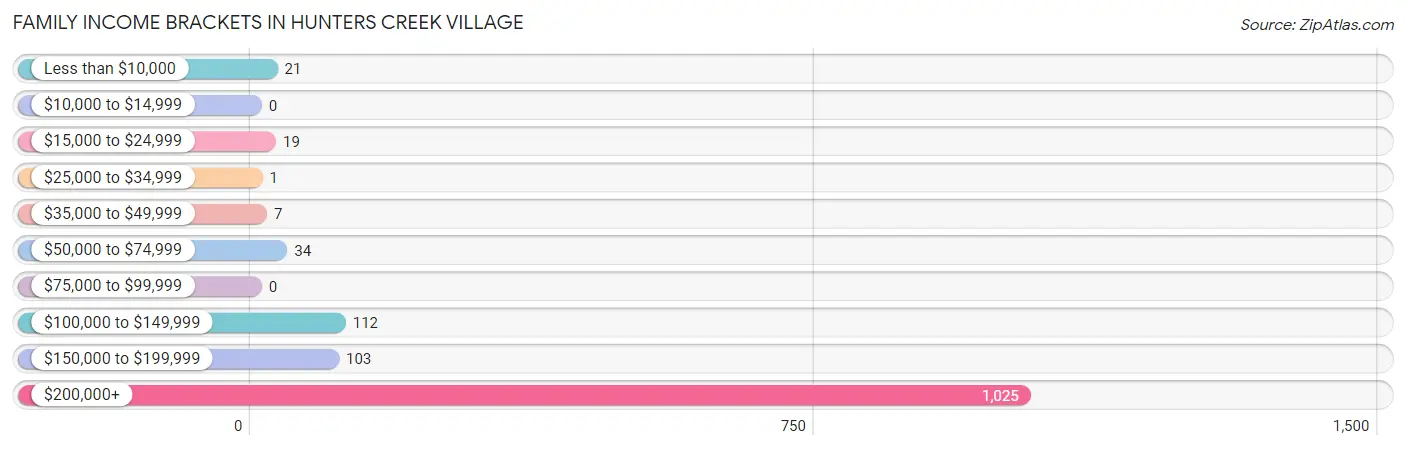
| Income Bracket | # Families | % Families |
| Less than $10,000 | 21 | 1.6% |
| $10,000 to $14,999 | 0 | 0.0% |
| $15,000 to $24,999 | 19 | 1.4% |
| $25,000 to $34,999 | 1 | 0.1% |
| $35,000 to $49,999 | 7 | 0.5% |
| $50,000 to $74,999 | 34 | 2.6% |
| $75,000 to $99,999 | 0 | 0.0% |
| $100,000 to $149,999 | 112 | 8.5% |
| $150,000 to $199,999 | 103 | 7.8% |
| $200,000+ | 1,025 | 77.5% |
Family Income by Famaliy Size in Hunters Creek Village
2-person families (538 | 40.7%) account for the highest median family income in Hunters Creek Village with $250,001 per family, while 2-person families (538 | 40.7%) have the highest median income of $125,000 per family member.
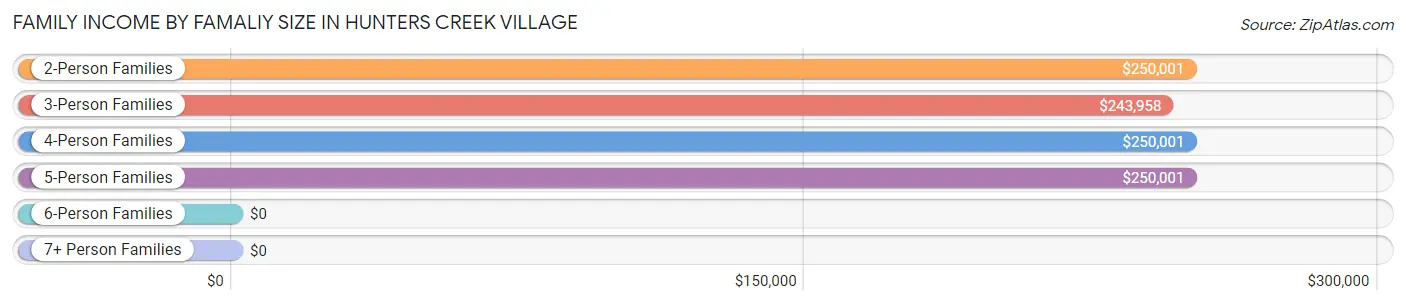
| Income Bracket | # Families | Median Income |
| 2-Person Families | 538 (40.7%) | $250,001 |
| 3-Person Families | 290 (21.9%) | $243,958 |
| 4-Person Families | 326 (24.7%) | $250,001 |
| 5-Person Families | 147 (11.1%) | $250,001 |
| 6-Person Families | 21 (1.6%) | $0 |
| 7+ Person Families | 0 (0.0%) | $0 |
| Total | 1,322 (100.0%) | $250,001 |
Family Income by Number of Earners in Hunters Creek Village
The median family income in Hunters Creek Village is $250,001, with families comprising 1 earner (393) having the highest median family income of $250,001, while families with no earners (210) have the lowest median family income of $209,688, accounting for 29.7% and 15.9% of families, respectively.
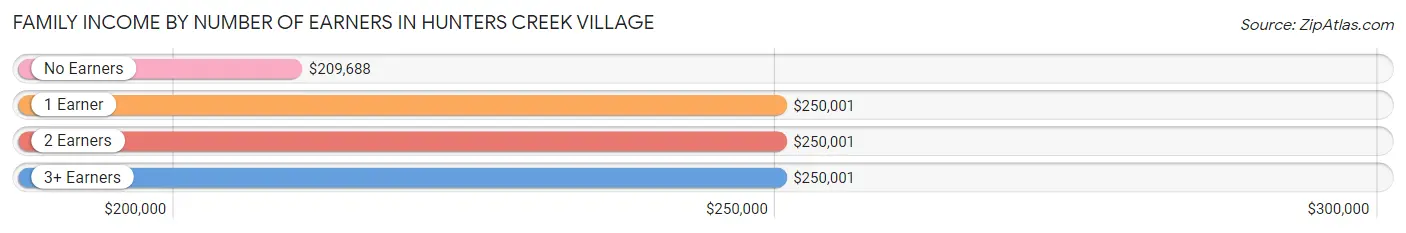
| Number of Earners | # Families | Median Income |
| No Earners | 210 (15.9%) | $209,688 |
| 1 Earner | 393 (29.7%) | $250,001 |
| 2 Earners | 568 (43.0%) | $250,001 |
| 3+ Earners | 151 (11.4%) | $250,001 |
| Total | 1,322 (100.0%) | $250,001 |
Household Income in Hunters Creek Village
Household Income Brackets in Hunters Creek Village
With 1,143 households falling in the category, the $200,000+ income range is the most frequent in Hunters Creek Village, accounting for 75.0% of all households.
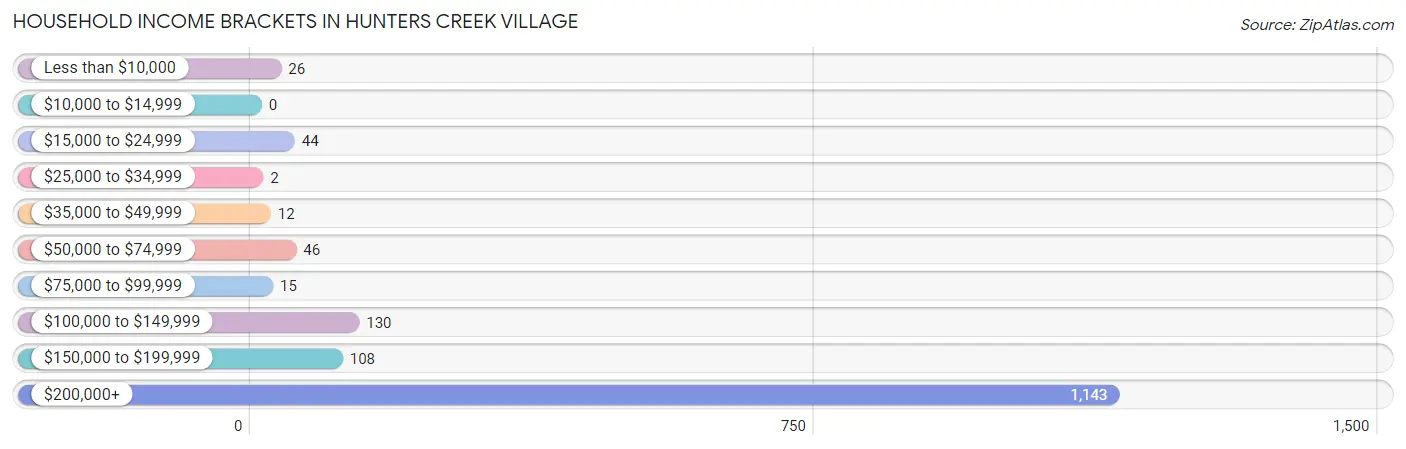
| Income Bracket | # Households | % Households |
| Less than $10,000 | 26 | 1.7% |
| $10,000 to $14,999 | 0 | 0.0% |
| $15,000 to $24,999 | 44 | 2.9% |
| $25,000 to $34,999 | 2 | 0.1% |
| $35,000 to $49,999 | 12 | 0.8% |
| $50,000 to $74,999 | 46 | 3.0% |
| $75,000 to $99,999 | 15 | 1.0% |
| $100,000 to $149,999 | 130 | 8.5% |
| $150,000 to $199,999 | 108 | 7.1% |
| $200,000+ | 1,143 | 75.0% |
Household Income by Householder Age in Hunters Creek Village
The median household income in Hunters Creek Village is $250,001, with the highest median household income of $250,001 found in the 25 to 44 years age bracket for the primary householder. A total of 227 households (14.9%) fall into this category.
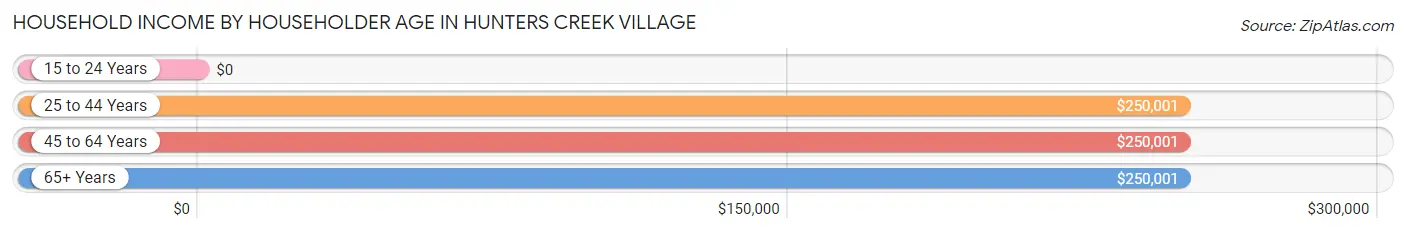
| Income Bracket | # Households | Median Income |
| 15 to 24 Years | 0 (0.0%) | $0 |
| 25 to 44 Years | 227 (14.9%) | $250,001 |
| 45 to 64 Years | 835 (54.8%) | $250,001 |
| 65+ Years | 462 (30.3%) | $250,001 |
| Total | 1,524 (100.0%) | $250,001 |
Poverty in Hunters Creek Village
Income Below Poverty by Sex and Age in Hunters Creek Village
With 2.5% poverty level for males and 3.7% for females among the residents of Hunters Creek Village, 12 to 14 year old males and 12 to 14 year old females are the most vulnerable to poverty, with 23 males (17.2%) and 22 females (18.0%) in their respective age groups living below the poverty level.
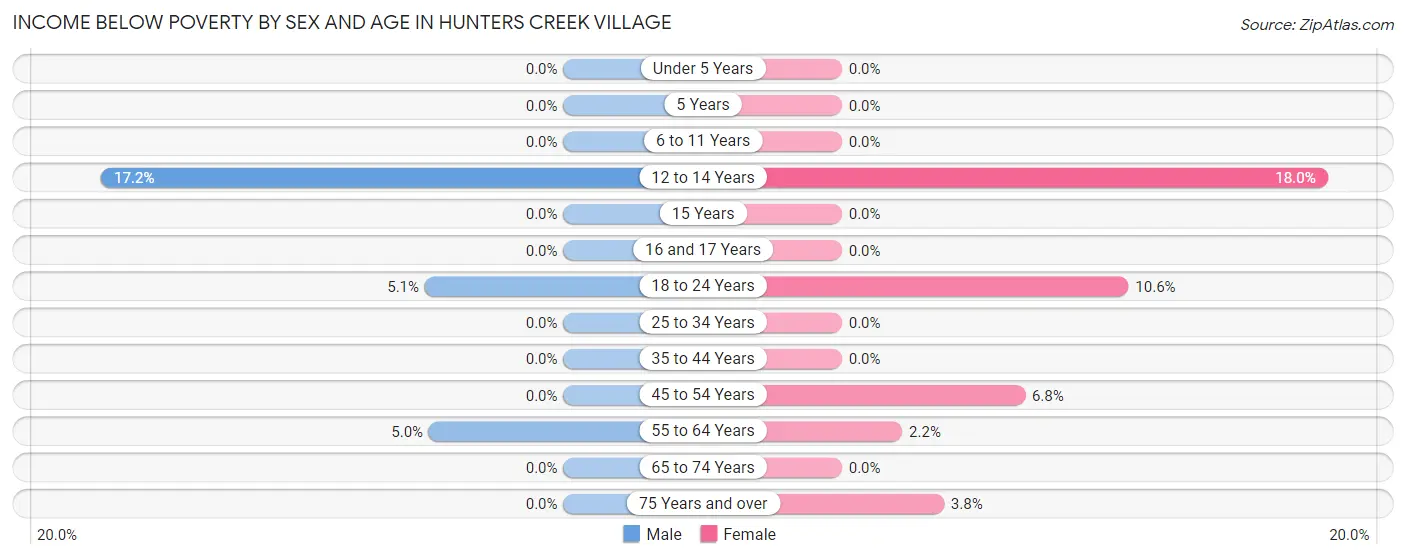
| Age Bracket | Male | Female |
| Under 5 Years | 0 (0.0%) | 0 (0.0%) |
| 5 Years | 0 (0.0%) | 0 (0.0%) |
| 6 to 11 Years | 0 (0.0%) | 0 (0.0%) |
| 12 to 14 Years | 23 (17.2%) | 22 (18.0%) |
| 15 Years | 0 (0.0%) | 0 (0.0%) |
| 16 and 17 Years | 0 (0.0%) | 0 (0.0%) |
| 18 to 24 Years | 11 (5.1%) | 15 (10.6%) |
| 25 to 34 Years | 0 (0.0%) | 0 (0.0%) |
| 35 to 44 Years | 0 (0.0%) | 0 (0.0%) |
| 45 to 54 Years | 0 (0.0%) | 31 (6.8%) |
| 55 to 64 Years | 21 (5.0%) | 7 (2.2%) |
| 65 to 74 Years | 0 (0.0%) | 0 (0.0%) |
| 75 Years and over | 0 (0.0%) | 5 (3.8%) |
| Total | 55 (2.5%) | 80 (3.7%) |
Income Above Poverty by Sex and Age in Hunters Creek Village
According to the poverty statistics in Hunters Creek Village, males aged under 5 years and females aged under 5 years are the age groups that are most secure financially, with 100.0% of males and 100.0% of females in these age groups living above the poverty line.
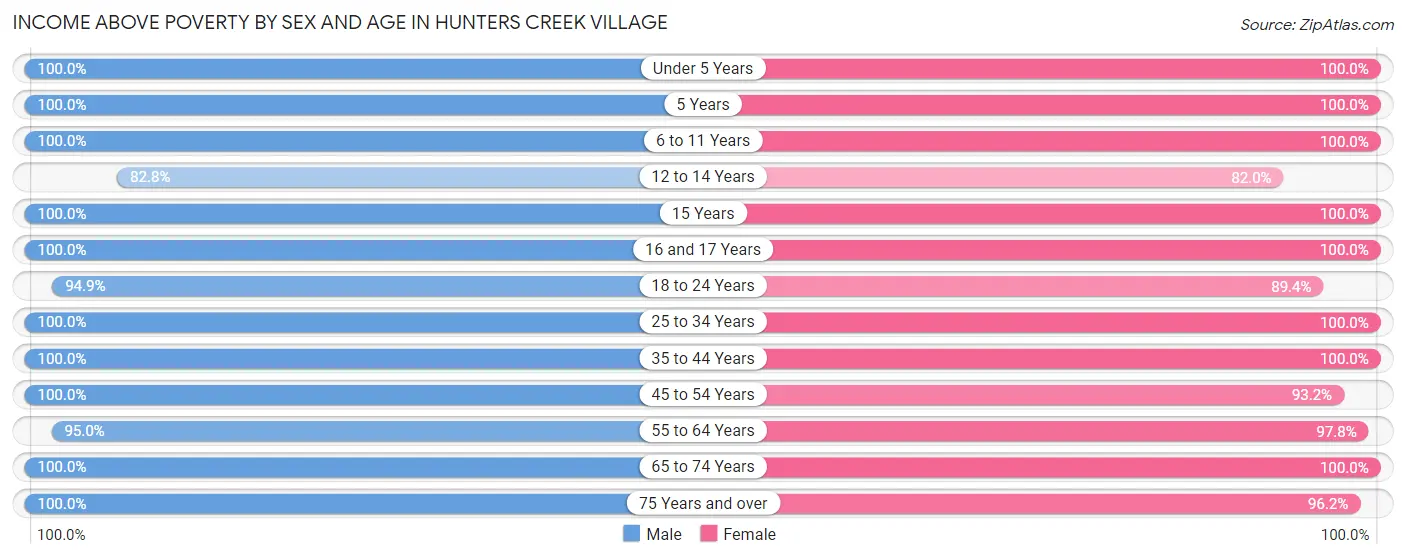
| Age Bracket | Male | Female |
| Under 5 Years | 86 (100.0%) | 90 (100.0%) |
| 5 Years | 39 (100.0%) | 80 (100.0%) |
| 6 to 11 Years | 192 (100.0%) | 151 (100.0%) |
| 12 to 14 Years | 111 (82.8%) | 100 (82.0%) |
| 15 Years | 49 (100.0%) | 8 (100.0%) |
| 16 and 17 Years | 80 (100.0%) | 120 (100.0%) |
| 18 to 24 Years | 203 (94.9%) | 126 (89.4%) |
| 25 to 34 Years | 107 (100.0%) | 152 (100.0%) |
| 35 to 44 Years | 158 (100.0%) | 150 (100.0%) |
| 45 to 54 Years | 442 (100.0%) | 425 (93.2%) |
| 55 to 64 Years | 400 (95.0%) | 306 (97.8%) |
| 65 to 74 Years | 199 (100.0%) | 228 (100.0%) |
| 75 Years and over | 119 (100.0%) | 127 (96.2%) |
| Total | 2,185 (97.5%) | 2,063 (96.3%) |
Income Below Poverty Among Married-Couple Families in Hunters Creek Village
The poverty statistics for married-couple families in Hunters Creek Village show that 1.8% or 21 of the total 1,168 families live below the poverty line. Families with 1 or 2 children have the highest poverty rate of 5.7%, comprising of 21 families. On the other hand, families with no children have the lowest poverty rate of 0.0%, which includes 0 families.
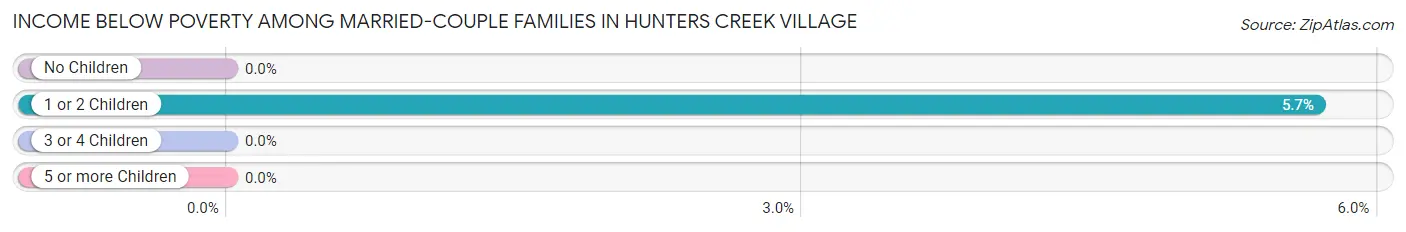
| Children | Above Poverty | Below Poverty |
| No Children | 638 (100.0%) | 0 (0.0%) |
| 1 or 2 Children | 349 (94.3%) | 21 (5.7%) |
| 3 or 4 Children | 160 (100.0%) | 0 (0.0%) |
| 5 or more Children | 0 (0.0%) | 0 (0.0%) |
| Total | 1,147 (98.2%) | 21 (1.8%) |
Income Below Poverty Among Single-Parent Households in Hunters Creek Village
| Children | Single Father | Single Mother |
| No Children | 0 (0.0%) | 0 (0.0%) |
| 1 or 2 Children | 0 (0.0%) | 0 (0.0%) |
| 3 or 4 Children | 0 (0.0%) | 0 (0.0%) |
| 5 or more Children | 0 (0.0%) | 0 (0.0%) |
| Total | 0 (0.0%) | 0 (0.0%) |
Income Below Poverty Among Married-Couple vs Single-Parent Households in Hunters Creek Village
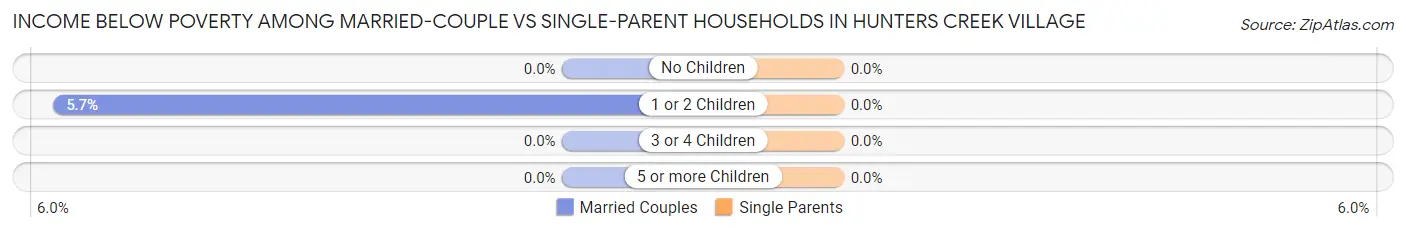
| Children | Married-Couple Families | Single-Parent Households |
| No Children | 0 (0.0%) | 0 (0.0%) |
| 1 or 2 Children | 21 (5.7%) | 0 (0.0%) |
| 3 or 4 Children | 0 (0.0%) | 0 (0.0%) |
| 5 or more Children | 0 (0.0%) | 0 (0.0%) |
| Total | 21 (1.8%) | 0 (0.0%) |
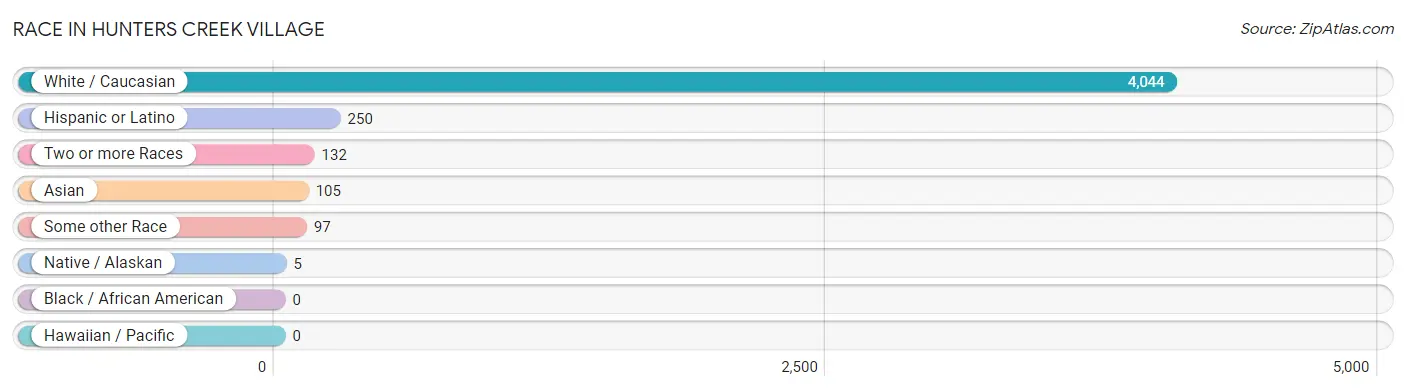
Race in Hunters Creek Village
The most populous races in Hunters Creek Village are White / Caucasian (4,044 | 92.3%), Hispanic or Latino (250 | 5.7%), and Two or more Races (132 | 3.0%).
| Race | # Population | % Population |
| Asian | 105 | 2.4% |
| Black / African American | 0 | 0.0% |
| Hawaiian / Pacific | 0 | 0.0% |
| Hispanic or Latino | 250 | 5.7% |
| Native / Alaskan | 5 | 0.1% |
| White / Caucasian | 4,044 | 92.3% |
| Two or more Races | 132 | 3.0% |
| Some other Race | 97 | 2.2% |
| Total | 4,383 | 100.0% |
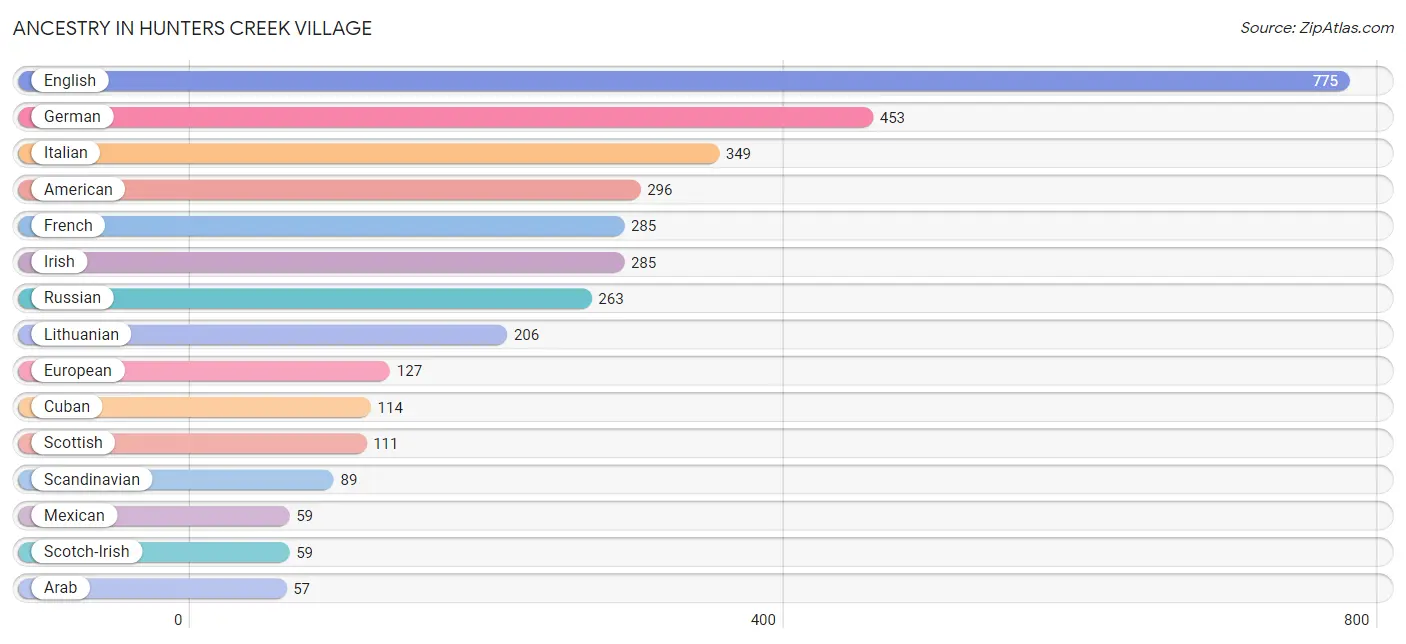
Ancestry in Hunters Creek Village
The most populous ancestries reported in Hunters Creek Village are English (775 | 17.7%), German (453 | 10.3%), Italian (349 | 8.0%), American (296 | 6.8%), and French (285 | 6.5%), together accounting for 49.2% of all Hunters Creek Village residents.
| Ancestry | # Population | % Population |
| American | 296 | 6.8% |
| Arab | 57 | 1.3% |
| Austrian | 11 | 0.3% |
| Belgian | 6 | 0.1% |
| Brazilian | 23 | 0.5% |
| Burmese | 7 | 0.2% |
| Canadian | 49 | 1.1% |
| Central American | 47 | 1.1% |
| Colombian | 24 | 0.5% |
| Creek | 14 | 0.3% |
| Cuban | 114 | 2.6% |
| Czech | 44 | 1.0% |
| Eastern European | 3 | 0.1% |
| Egyptian | 18 | 0.4% |
| English | 775 | 17.7% |
| European | 127 | 2.9% |
| Filipino | 11 | 0.3% |
| French | 285 | 6.5% |
| German | 453 | 10.3% |
| Greek | 42 | 1.0% |
| Guatemalan | 14 | 0.3% |
| Honduran | 33 | 0.7% |
| Hungarian | 30 | 0.7% |
| Indian (Asian) | 23 | 0.5% |
| Iranian | 11 | 0.3% |
| Irish | 285 | 6.5% |
| Italian | 349 | 8.0% |
| Lebanese | 39 | 0.9% |
| Lithuanian | 206 | 4.7% |
| Mexican | 59 | 1.3% |
| Northern European | 12 | 0.3% |
| Norwegian | 8 | 0.2% |
| Polish | 54 | 1.2% |
| Puerto Rican | 6 | 0.1% |
| Russian | 263 | 6.0% |
| Scandinavian | 89 | 2.0% |
| Scotch-Irish | 59 | 1.3% |
| Scottish | 111 | 2.5% |
| South American | 24 | 0.5% |
| Sri Lankan | 43 | 1.0% |
| Swedish | 6 | 0.1% |
| Swiss | 18 | 0.4% |
| Thai | 29 | 0.7% |
| Welsh | 42 | 1.0% | View All 44 Rows |
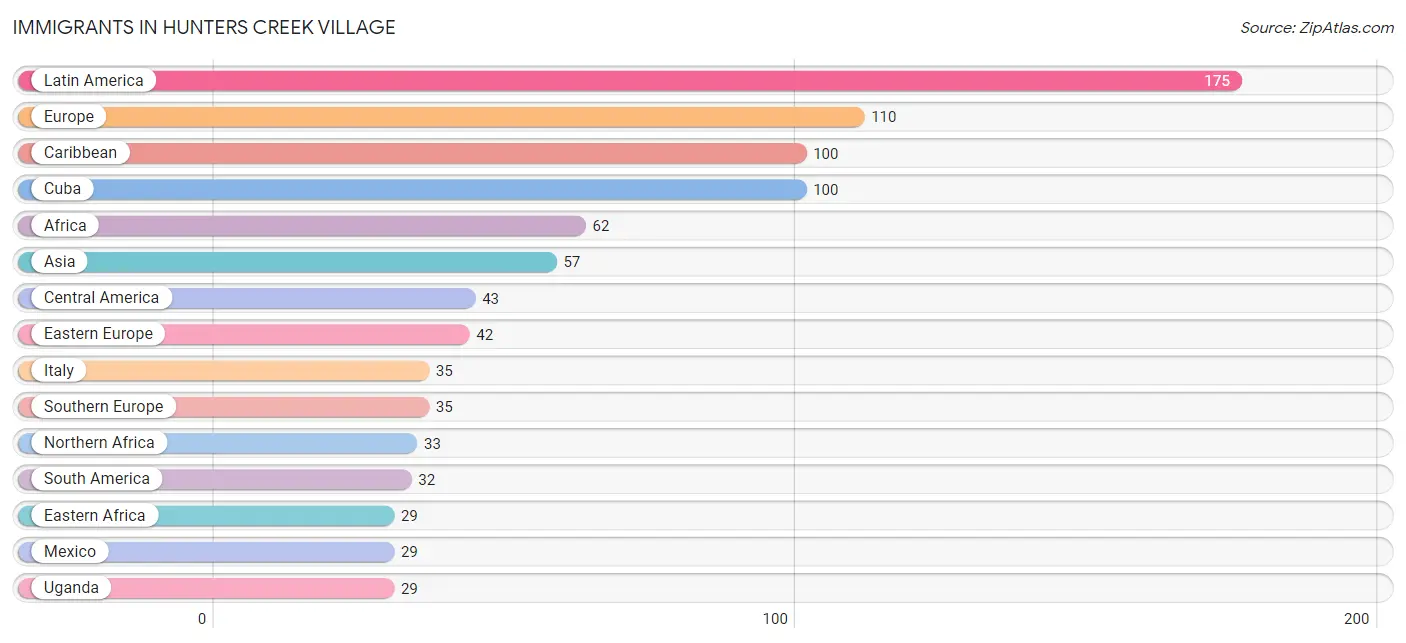
Immigrants in Hunters Creek Village
The most numerous immigrant groups reported in Hunters Creek Village came from Latin America (175 | 4.0%), Europe (110 | 2.5%), Caribbean (100 | 2.3%), Cuba (100 | 2.3%), and Africa (62 | 1.4%), together accounting for 12.5% of all Hunters Creek Village residents.
| Immigration Origin | # Population | % Population |
| Africa | 62 | 1.4% |
| Asia | 57 | 1.3% |
| Australia | 16 | 0.4% |
| Brazil | 21 | 0.5% |
| Canada | 26 | 0.6% |
| Caribbean | 100 | 2.3% |
| Central America | 43 | 1.0% |
| China | 11 | 0.3% |
| Colombia | 11 | 0.3% |
| Cuba | 100 | 2.3% |
| Eastern Africa | 29 | 0.7% |
| Eastern Asia | 11 | 0.3% |
| Eastern Europe | 42 | 1.0% |
| Egypt | 26 | 0.6% |
| Europe | 110 | 2.5% |
| France | 8 | 0.2% |
| Guatemala | 14 | 0.3% |
| Hungary | 15 | 0.3% |
| Iran | 11 | 0.3% |
| Israel | 9 | 0.2% |
| Italy | 35 | 0.8% |
| Latin America | 175 | 4.0% |
| Mexico | 29 | 0.7% |
| Netherlands | 2 | 0.1% |
| Northern Africa | 33 | 0.7% |
| Northern Europe | 9 | 0.2% |
| Oceania | 16 | 0.4% |
| Russia | 27 | 0.6% |
| South America | 32 | 0.7% |
| South Central Asia | 11 | 0.3% |
| South Eastern Asia | 26 | 0.6% |
| Southern Europe | 35 | 0.8% |
| Switzerland | 14 | 0.3% |
| Taiwan | 11 | 0.3% |
| Uganda | 29 | 0.7% |
| Vietnam | 26 | 0.6% |
| Western Asia | 9 | 0.2% |
| Western Europe | 24 | 0.5% | View All 38 Rows |
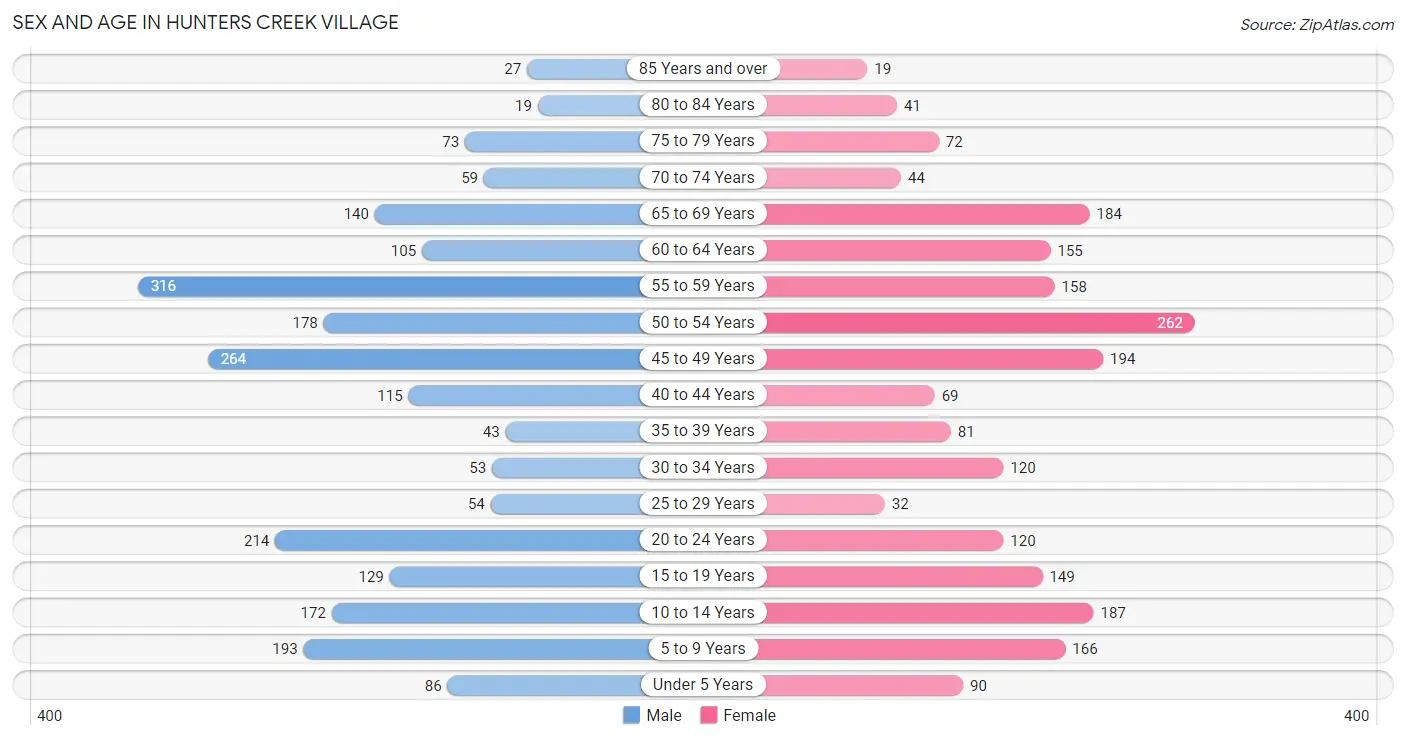
Sex and Age in Hunters Creek Village
Sex and Age in Hunters Creek Village
The most populous age groups in Hunters Creek Village are 55 to 59 Years (316 | 14.1%) for men and 50 to 54 Years (262 | 12.2%) for women.
| Age Bracket | Male | Female |
| Under 5 Years | 86 (3.8%) | 90 (4.2%) |
| 5 to 9 Years | 193 (8.6%) | 166 (7.7%) |
| 10 to 14 Years | 172 (7.7%) | 187 (8.7%) |
| 15 to 19 Years | 129 (5.8%) | 149 (7.0%) |
| 20 to 24 Years | 214 (9.6%) | 120 (5.6%) |
| 25 to 29 Years | 54 (2.4%) | 32 (1.5%) |
| 30 to 34 Years | 53 (2.4%) | 120 (5.6%) |
| 35 to 39 Years | 43 (1.9%) | 81 (3.8%) |
| 40 to 44 Years | 115 (5.1%) | 69 (3.2%) |
| 45 to 49 Years | 264 (11.8%) | 194 (9.0%) |
| 50 to 54 Years | 178 (8.0%) | 262 (12.2%) |
| 55 to 59 Years | 316 (14.1%) | 158 (7.4%) |
| 60 to 64 Years | 105 (4.7%) | 155 (7.2%) |
| 65 to 69 Years | 140 (6.2%) | 184 (8.6%) |
| 70 to 74 Years | 59 (2.6%) | 44 (2.1%) |
| 75 to 79 Years | 73 (3.3%) | 72 (3.4%) |
| 80 to 84 Years | 19 (0.9%) | 41 (1.9%) |
| 85 Years and over | 27 (1.2%) | 19 (0.9%) |
| Total | 2,240 (100.0%) | 2,143 (100.0%) |
Families and Households in Hunters Creek Village
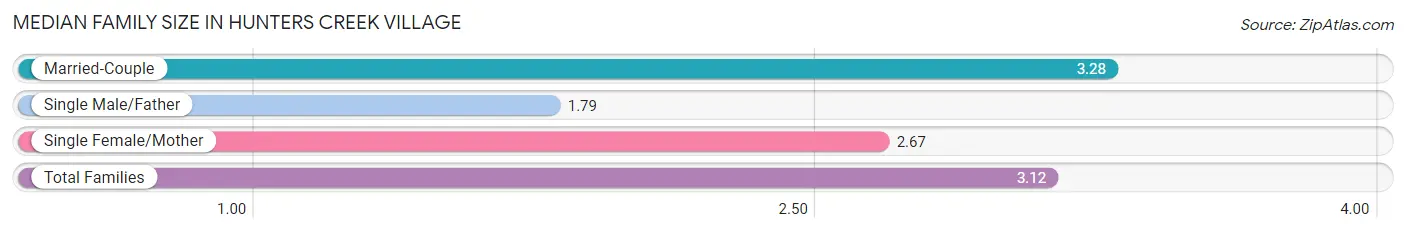
Median Family Size in Hunters Creek Village
The median family size in Hunters Creek Village is 3.12 persons per family, with married-couple families (1,168 | 88.3%) accounting for the largest median family size of 3.28 persons per family. On the other hand, single male/father families (130 | 9.8%) represent the smallest median family size with 1.79 persons per family.
| Family Type | # Families | Family Size |
| Married-Couple | 1,168 (88.3%) | 3.28 |
| Single Male/Father | 130 (9.8%) | 1.79 |
| Single Female/Mother | 24 (1.8%) | 2.67 |
| Total Families | 1,322 (100.0%) | 3.12 |
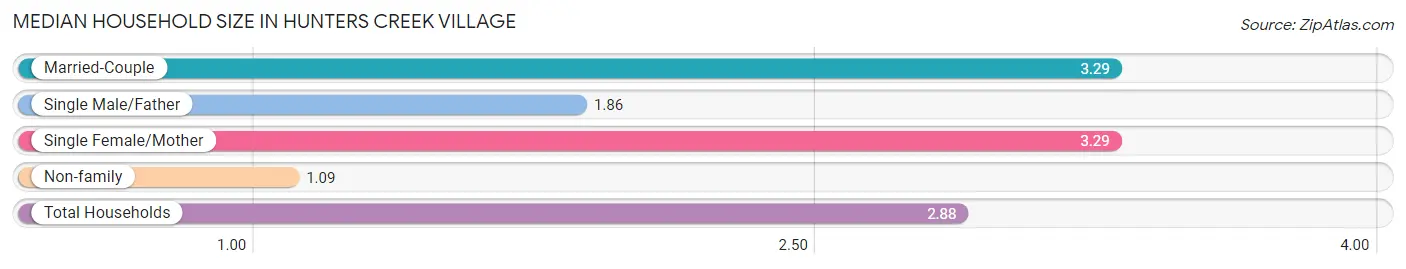
Median Household Size in Hunters Creek Village
The median household size in Hunters Creek Village is 2.88 persons per household, with married-couple households (1,168 | 76.6%) accounting for the largest median household size of 3.29 persons per household. non-family households (202 | 13.3%) represent the smallest median household size with 1.09 persons per household.
| Household Type | # Households | Household Size |
| Married-Couple | 1,168 (76.6%) | 3.29 |
| Single Male/Father | 130 (8.5%) | 1.86 |
| Single Female/Mother | 24 (1.6%) | 3.29 |
| Non-family | 202 (13.3%) | 1.09 |
| Total Households | 1,524 (100.0%) | 2.88 |
Household Size by Marriage Status in Hunters Creek Village
Out of a total of 1,524 households in Hunters Creek Village, 1,322 (86.8%) are family households, while 202 (13.3%) are nonfamily households. The most numerous type of family households are 2-person households, comprising 526, and the most common type of nonfamily households are 1-person households, comprising 193.
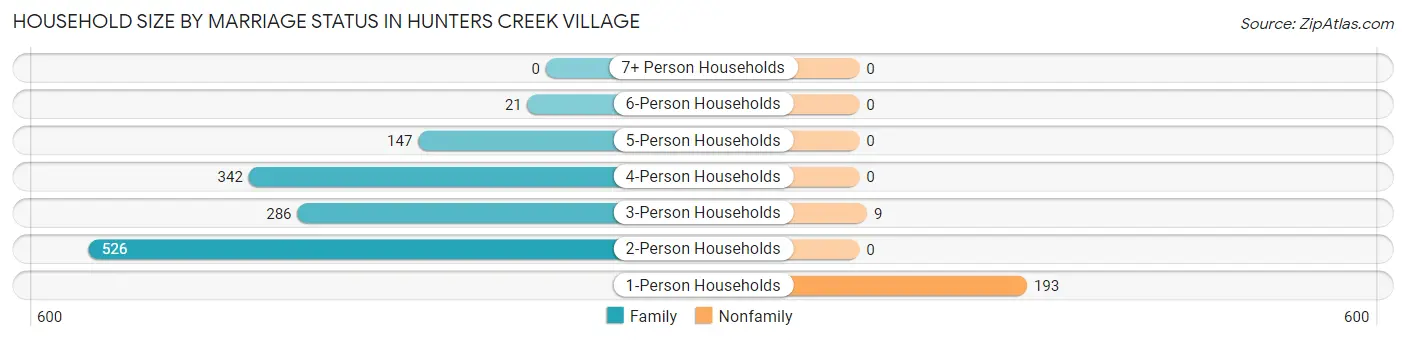
| Household Size | Family Households | Nonfamily Households |
| 1-Person Households | - | 193 (12.7%) |
| 2-Person Households | 526 (34.5%) | 0 (0.0%) |
| 3-Person Households | 286 (18.8%) | 9 (0.6%) |
| 4-Person Households | 342 (22.4%) | 0 (0.0%) |
| 5-Person Households | 147 (9.7%) | 0 (0.0%) |
| 6-Person Households | 21 (1.4%) | 0 (0.0%) |
| 7+ Person Households | 0 (0.0%) | 0 (0.0%) |
| Total | 1,322 (86.8%) | 202 (13.3%) |
Female Fertility in Hunters Creek Village
Fertility by Age in Hunters Creek Village
Average fertility rate in Hunters Creek Village is 87.0 births per 1,000 women. Women in the age bracket of 20 to 34 years have the highest fertility rate with 110.0 births per 1,000 women. Women in the age bracket of 35 to 50 years acount for 59.5% of all women with births.
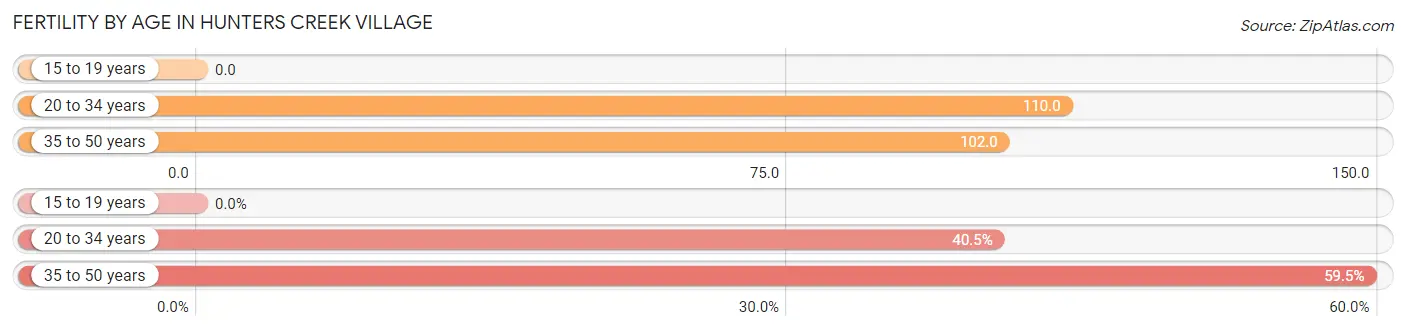
| Age Bracket | Women with Births | Births / 1,000 Women |
| 15 to 19 years | 0 (0.0%) | 0.0 |
| 20 to 34 years | 30 (40.5%) | 110.0 |
| 35 to 50 years | 44 (59.5%) | 102.0 |
| Total | 74 (100.0%) | 87.0 |
Fertility by Age by Marriage Status in Hunters Creek Village
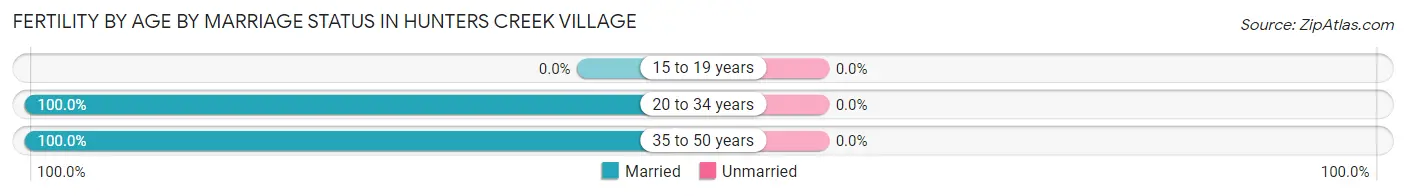
| Age Bracket | Married | Unmarried |
| 15 to 19 years | 0 (0.0%) | 0 (0.0%) |
| 20 to 34 years | 30 (100.0%) | 0 (0.0%) |
| 35 to 50 years | 44 (100.0%) | 0 (0.0%) |
| Total | 74 (100.0%) | 0 (0.0%) |
Fertility by Education in Hunters Creek Village
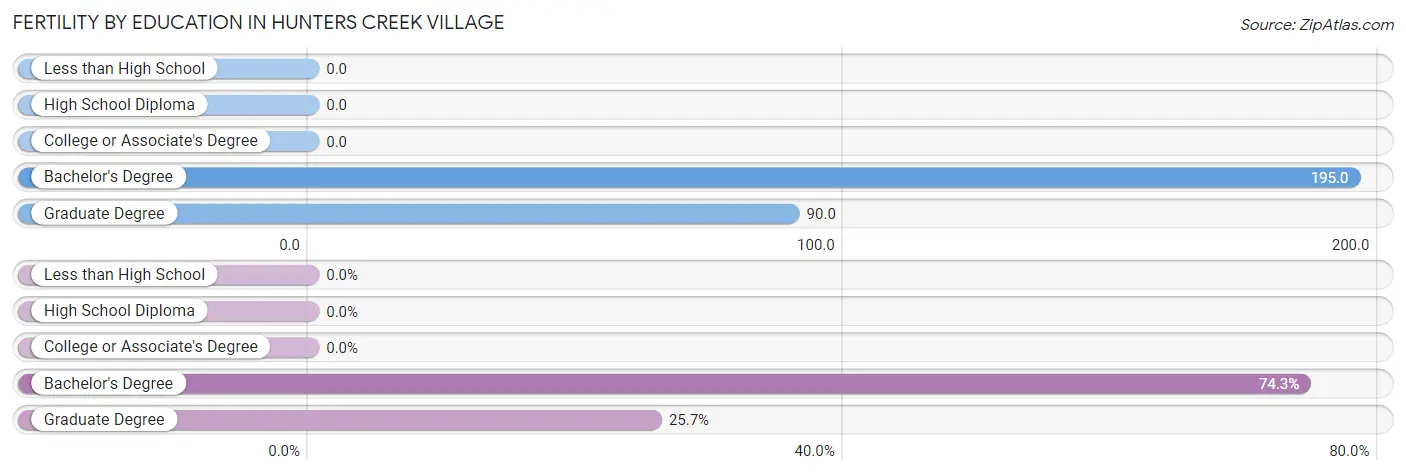
| Educational Attainment | Women with Births | Births / 1,000 Women |
| Less than High School | 0 (0.0%) | 0.0 |
| High School Diploma | 0 (0.0%) | 0.0 |
| College or Associate's Degree | 0 (0.0%) | 0.0 |
| Bachelor's Degree | 55 (74.3%) | 195.0 |
| Graduate Degree | 19 (25.7%) | 90.0 |
| Total | 74 (100.0%) | 87.0 |
Fertility by Education by Marriage Status in Hunters Creek Village
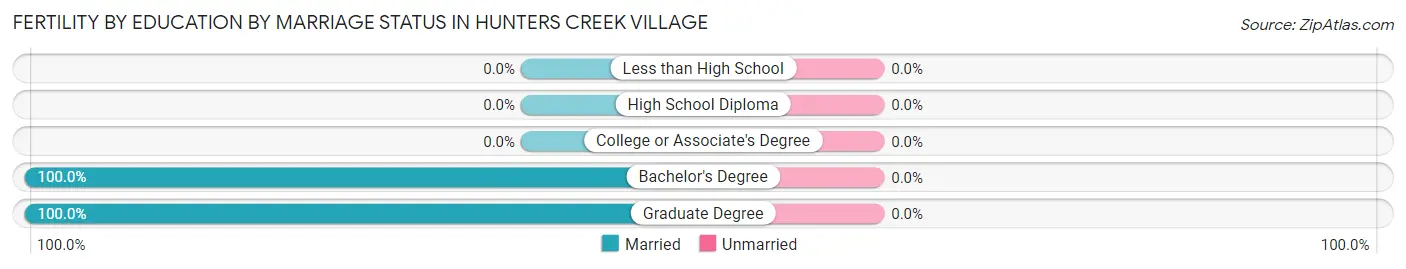
| Educational Attainment | Married | Unmarried |
| Less than High School | 0 (0.0%) | 0 (0.0%) |
| High School Diploma | 0 (0.0%) | 0 (0.0%) |
| College or Associate's Degree | 0 (0.0%) | 0 (0.0%) |
| Bachelor's Degree | 55 (100.0%) | 0 (0.0%) |
| Graduate Degree | 19 (100.0%) | 0 (0.0%) |
| Total | 74 (100.0%) | 0 (0.0%) |
Employment Characteristics in Hunters Creek Village
Employment by Class of Employer in Hunters Creek Village
Among the 1,766 employed individuals in Hunters Creek Village, private company employees (1,121 | 63.5%), self-employed (incorporated) (305 | 17.3%), and self-employed (not incorporated) (146 | 8.3%) make up the most common classes of employment.
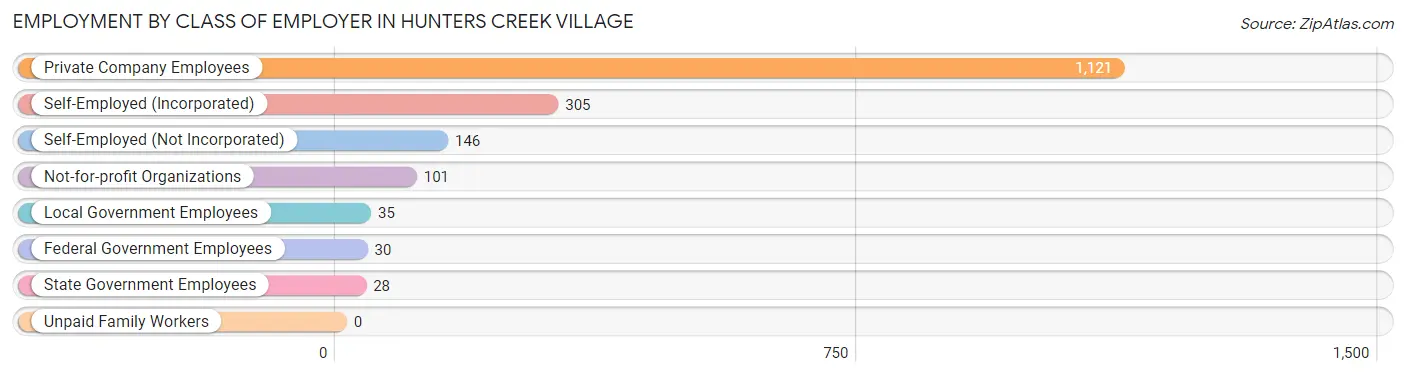
| Employer Class | # Employees | % Employees |
| Private Company Employees | 1,121 | 63.5% |
| Self-Employed (Incorporated) | 305 | 17.3% |
| Self-Employed (Not Incorporated) | 146 | 8.3% |
| Not-for-profit Organizations | 101 | 5.7% |
| Local Government Employees | 35 | 2.0% |
| State Government Employees | 28 | 1.6% |
| Federal Government Employees | 30 | 1.7% |
| Unpaid Family Workers | 0 | 0.0% |
| Total | 1,766 | 100.0% |
Employment Status by Age in Hunters Creek Village
According to the labor force statistics for Hunters Creek Village, out of the total population over 16 years of age (3,432), 56.4% or 1,936 individuals are in the labor force, with 8.9% or 172 of them unemployed. The age group with the highest labor force participation rate is 55 to 59 years, with 78.5% or 372 individuals in the labor force. Within the labor force, the 20 to 24 years age range has the highest percentage of unemployed individuals, with 58.1% or 125 of them being unemployed.
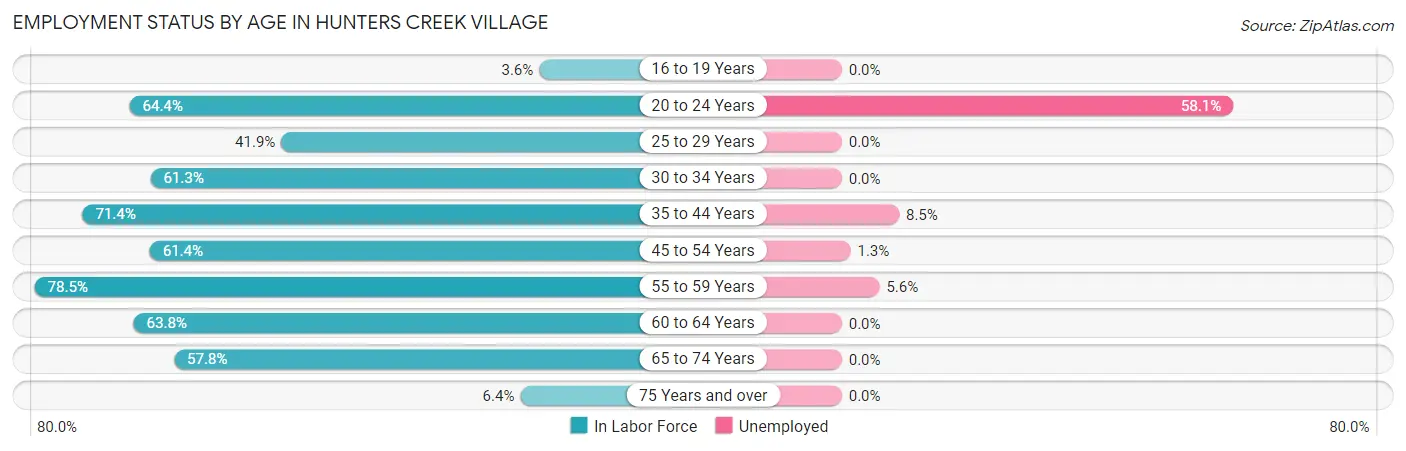
| Age Bracket | In Labor Force | Unemployed |
| 16 to 19 Years | 8 (3.6%) | 0 (0.0%) |
| 20 to 24 Years | 215 (64.4%) | 125 (58.1%) |
| 25 to 29 Years | 36 (41.9%) | 0 (0.0%) |
| 30 to 34 Years | 106 (61.3%) | 0 (0.0%) |
| 35 to 44 Years | 220 (71.4%) | 19 (8.5%) |
| 45 to 54 Years | 551 (61.4%) | 7 (1.3%) |
| 55 to 59 Years | 372 (78.5%) | 21 (5.6%) |
| 60 to 64 Years | 166 (63.8%) | 0 (0.0%) |
| 65 to 74 Years | 247 (57.8%) | 0 (0.0%) |
| 75 Years and over | 16 (6.4%) | 0 (0.0%) |
| Total | 1,936 (56.4%) | 172 (8.9%) |
Employment Status by Educational Attainment in Hunters Creek Village
According to labor force statistics for Hunters Creek Village, 66.0% of individuals (1,451) out of the total population between 25 and 64 years of age (2,199) are in the labor force, with 3.2% or 46 of them being unemployed. The group with the highest labor force participation rate are those with the educational attainment of bachelor's degree or higher, with 71.0% or 1,349 individuals in the labor force. Within the labor force, individuals with bachelor's degree or higher education have the highest percentage of unemployment, with 3.4% or 46 of them being unemployed.
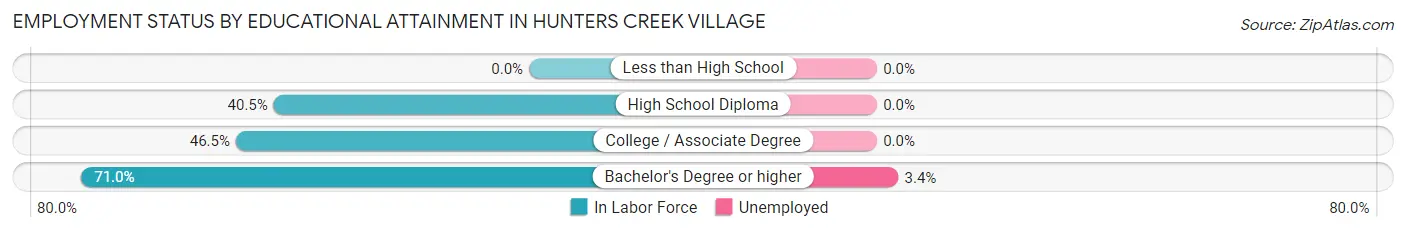
| Educational Attainment | In Labor Force | Unemployed |
| Less than High School | 0 (0.0%) | 0 (0.0%) |
| High School Diploma | 15 (40.5%) | 0 (0.0%) |
| College / Associate Degree | 87 (46.5%) | 0 (0.0%) |
| Bachelor's Degree or higher | 1,349 (71.0%) | 65 (3.4%) |
| Total | 1,451 (66.0%) | 70 (3.2%) |
Employment Occupations by Sex in Hunters Creek Village
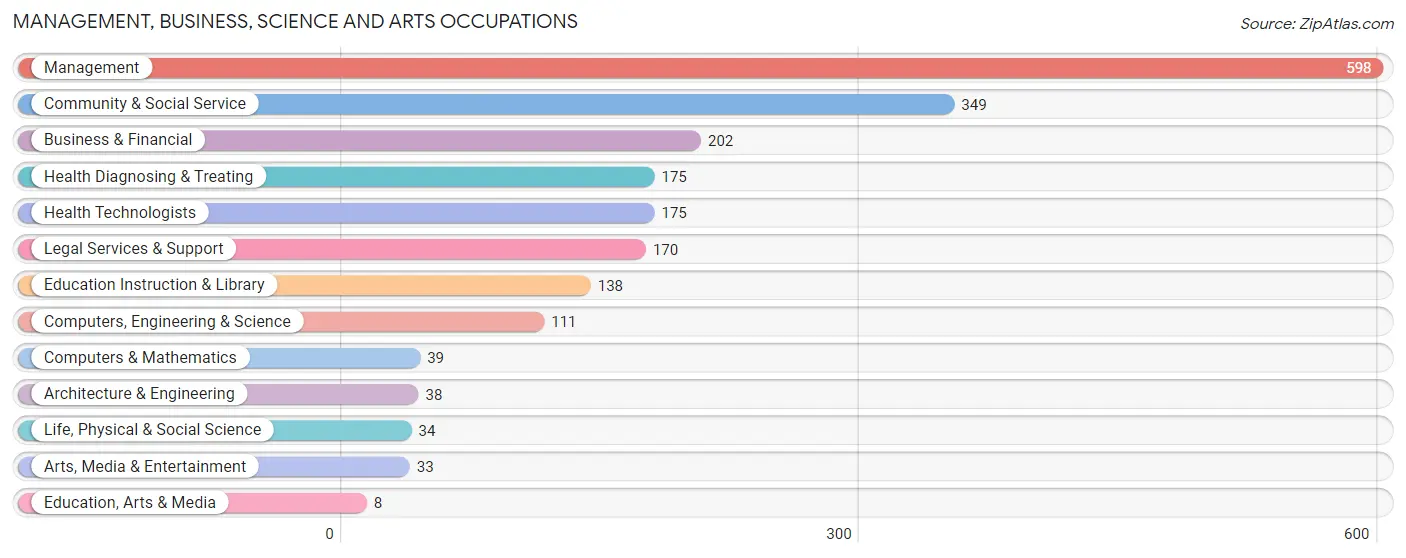
Management, Business, Science and Arts Occupations
The most common Management, Business, Science and Arts occupations in Hunters Creek Village are Management (598 | 34.0%), Community & Social Service (349 | 19.9%), Business & Financial (202 | 11.5%), Health Diagnosing & Treating (175 | 10.0%), and Health Technologists (175 | 10.0%).
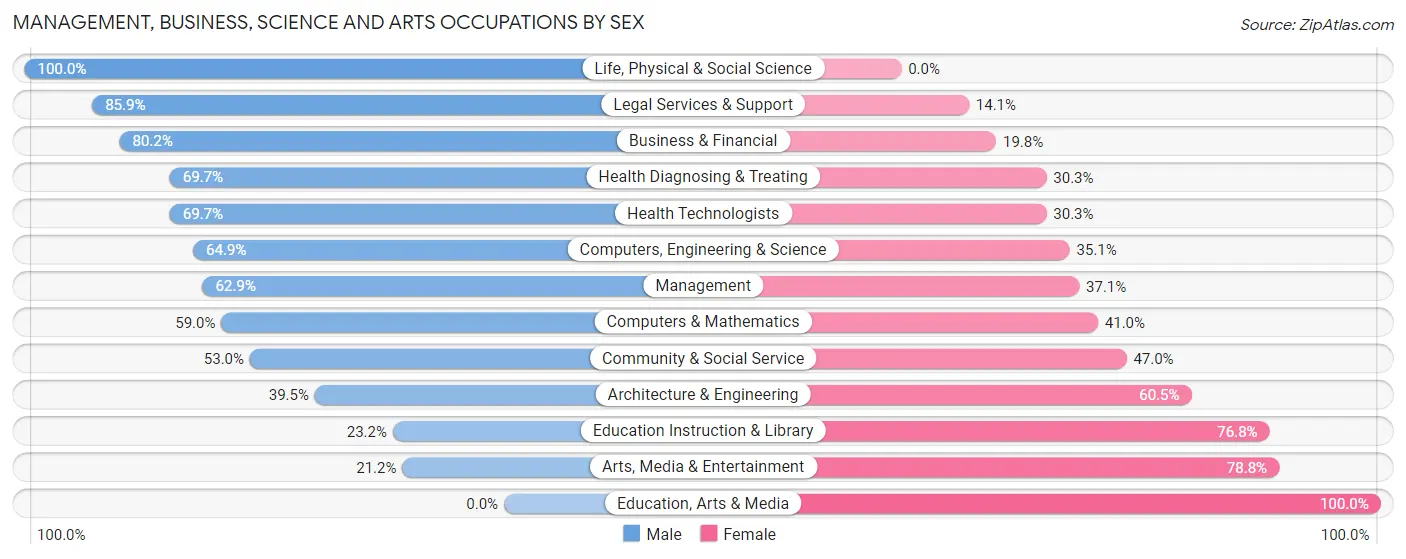
Management, Business, Science and Arts Occupations by Sex
Within the Management, Business, Science and Arts occupations in Hunters Creek Village, the most male-oriented occupations are Life, Physical & Social Science (100.0%), Legal Services & Support (85.9%), and Business & Financial (80.2%), while the most female-oriented occupations are Education, Arts & Media (100.0%), Arts, Media & Entertainment (78.8%), and Education Instruction & Library (76.8%).
| Occupation | Male | Female |
| Management | 376 (62.9%) | 222 (37.1%) |
| Business & Financial | 162 (80.2%) | 40 (19.8%) |
| Computers, Engineering & Science | 72 (64.9%) | 39 (35.1%) |
| Computers & Mathematics | 23 (59.0%) | 16 (41.0%) |
| Architecture & Engineering | 15 (39.5%) | 23 (60.5%) |
| Life, Physical & Social Science | 34 (100.0%) | 0 (0.0%) |
| Community & Social Service | 185 (53.0%) | 164 (47.0%) |
| Education, Arts & Media | 0 (0.0%) | 8 (100.0%) |
| Legal Services & Support | 146 (85.9%) | 24 (14.1%) |
| Education Instruction & Library | 32 (23.2%) | 106 (76.8%) |
| Arts, Media & Entertainment | 7 (21.2%) | 26 (78.8%) |
| Health Diagnosing & Treating | 122 (69.7%) | 53 (30.3%) |
| Health Technologists | 122 (69.7%) | 53 (30.3%) |
| Total (Category) | 917 (63.9%) | 518 (36.1%) |
| Total (Overall) | 1,112 (63.3%) | 645 (36.7%) |
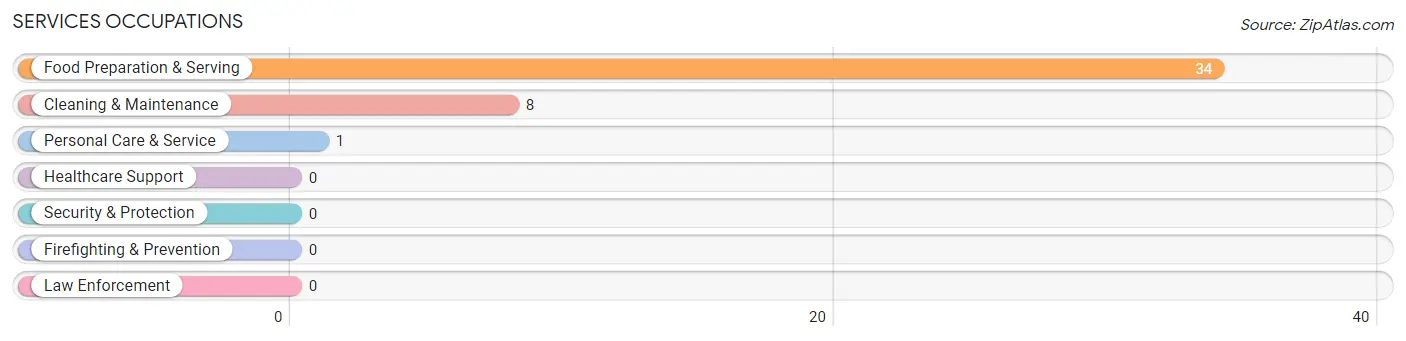
Services Occupations
The most common Services occupations in Hunters Creek Village are Food Preparation & Serving (34 | 1.9%), Cleaning & Maintenance (8 | 0.5%), and Personal Care & Service (1 | 0.1%).
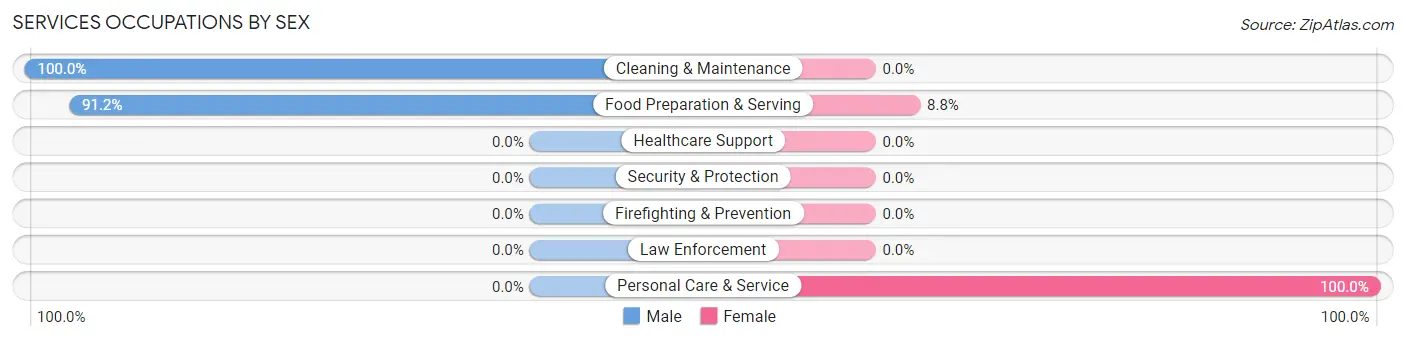
Services Occupations by Sex
Within the Services occupations in Hunters Creek Village, the most male-oriented occupations are Cleaning & Maintenance (100.0%), and Food Preparation & Serving (91.2%), while the most female-oriented occupations are Personal Care & Service (100.0%), and Food Preparation & Serving (8.8%).
| Occupation | Male | Female |
| Healthcare Support | 0 (0.0%) | 0 (0.0%) |
| Security & Protection | 0 (0.0%) | 0 (0.0%) |
| Firefighting & Prevention | 0 (0.0%) | 0 (0.0%) |
| Law Enforcement | 0 (0.0%) | 0 (0.0%) |
| Food Preparation & Serving | 31 (91.2%) | 3 (8.8%) |
| Cleaning & Maintenance | 8 (100.0%) | 0 (0.0%) |
| Personal Care & Service | 0 (0.0%) | 1 (100.0%) |
| Total (Category) | 39 (90.7%) | 4 (9.3%) |
| Total (Overall) | 1,112 (63.3%) | 645 (36.7%) |
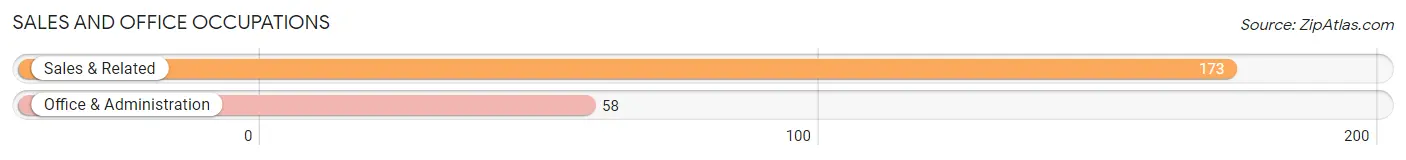
Sales and Office Occupations
The most common Sales and Office occupations in Hunters Creek Village are Sales & Related (173 | 9.9%), and Office & Administration (58 | 3.3%).
Sales and Office Occupations by Sex
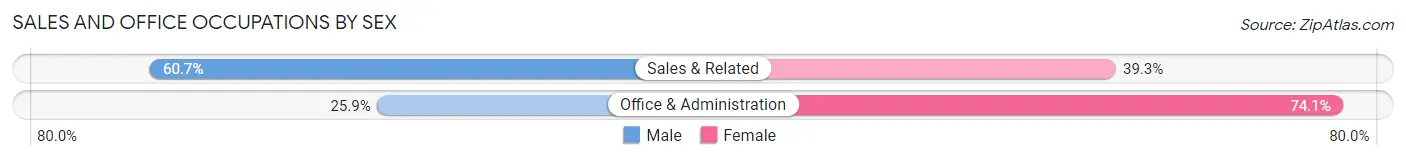
| Occupation | Male | Female |
| Sales & Related | 105 (60.7%) | 68 (39.3%) |
| Office & Administration | 15 (25.9%) | 43 (74.1%) |
| Total (Category) | 120 (51.9%) | 111 (48.0%) |
| Total (Overall) | 1,112 (63.3%) | 645 (36.7%) |
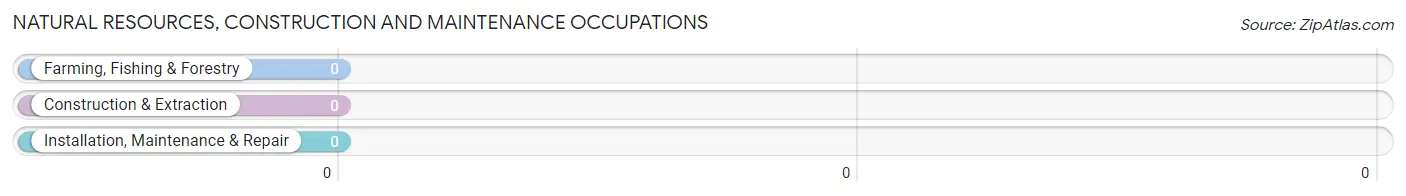
Natural Resources, Construction and Maintenance Occupations
Natural Resources, Construction and Maintenance Occupations by Sex
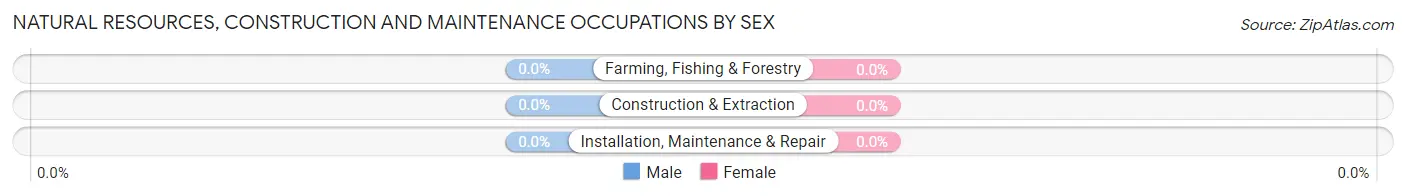
| Occupation | Male | Female |
| Farming, Fishing & Forestry | 0 (0.0%) | 0 (0.0%) |
| Construction & Extraction | 0 (0.0%) | 0 (0.0%) |
| Installation, Maintenance & Repair | 0 (0.0%) | 0 (0.0%) |
| Total (Category) | 0 (0.0%) | 0 (0.0%) |
| Total (Overall) | 1,112 (63.3%) | 645 (36.7%) |
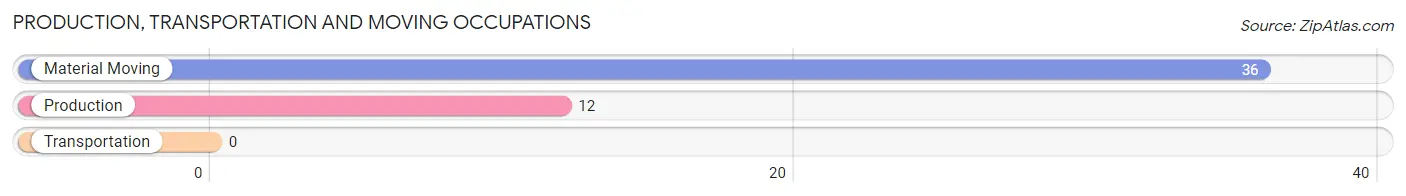
Production, Transportation and Moving Occupations
The most common Production, Transportation and Moving occupations in Hunters Creek Village are Material Moving (36 | 2.1%), and Production (12 | 0.7%).
Production, Transportation and Moving Occupations by Sex
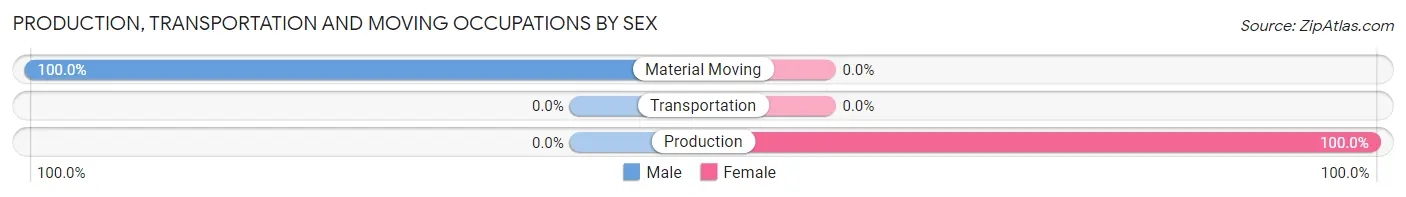
| Occupation | Male | Female |
| Production | 0 (0.0%) | 12 (100.0%) |
| Transportation | 0 (0.0%) | 0 (0.0%) |
| Material Moving | 36 (100.0%) | 0 (0.0%) |
| Total (Category) | 36 (75.0%) | 12 (25.0%) |
| Total (Overall) | 1,112 (63.3%) | 645 (36.7%) |
Employment Industries by Sex in Hunters Creek Village
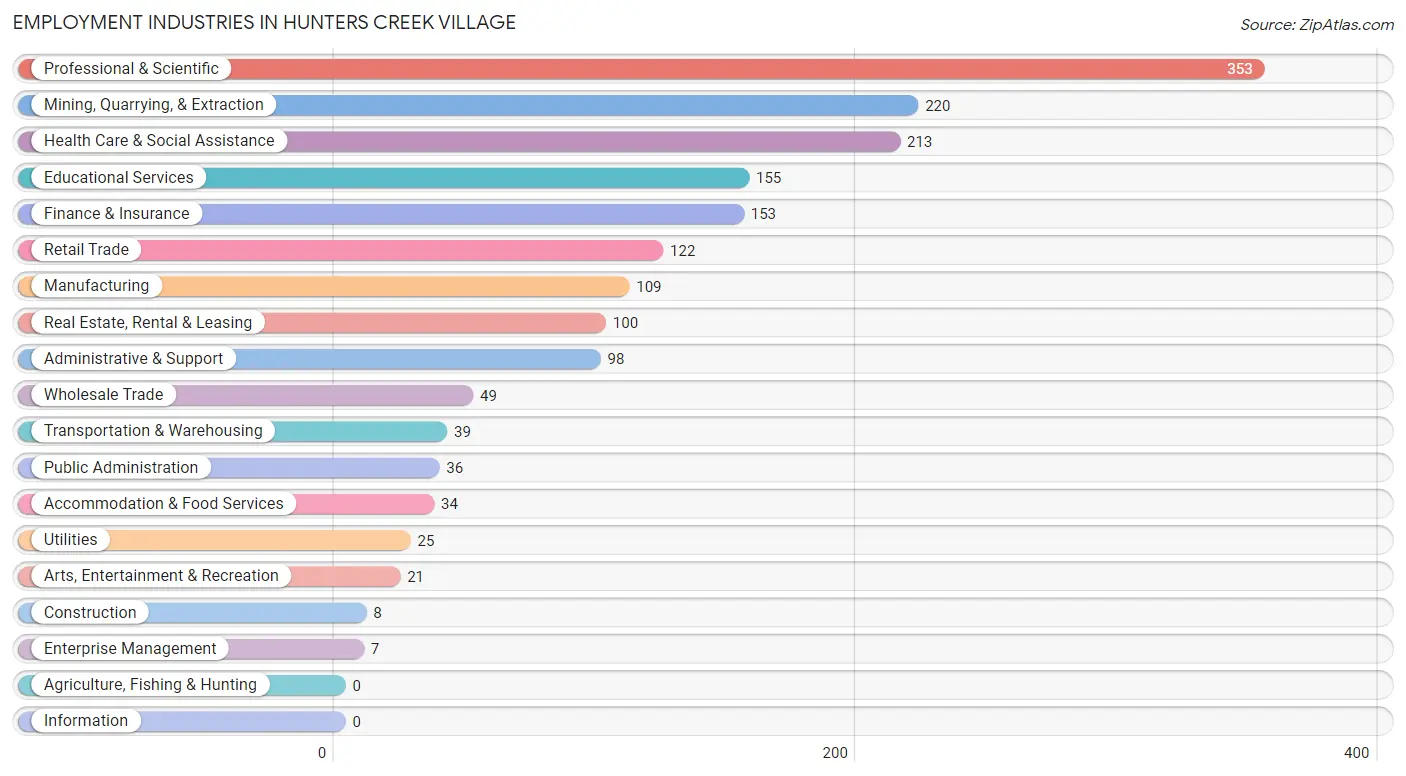
Employment Industries in Hunters Creek Village
The major employment industries in Hunters Creek Village include Professional & Scientific (353 | 20.1%), Mining, Quarrying, & Extraction (220 | 12.5%), Health Care & Social Assistance (213 | 12.1%), Educational Services (155 | 8.8%), and Finance & Insurance (153 | 8.7%).
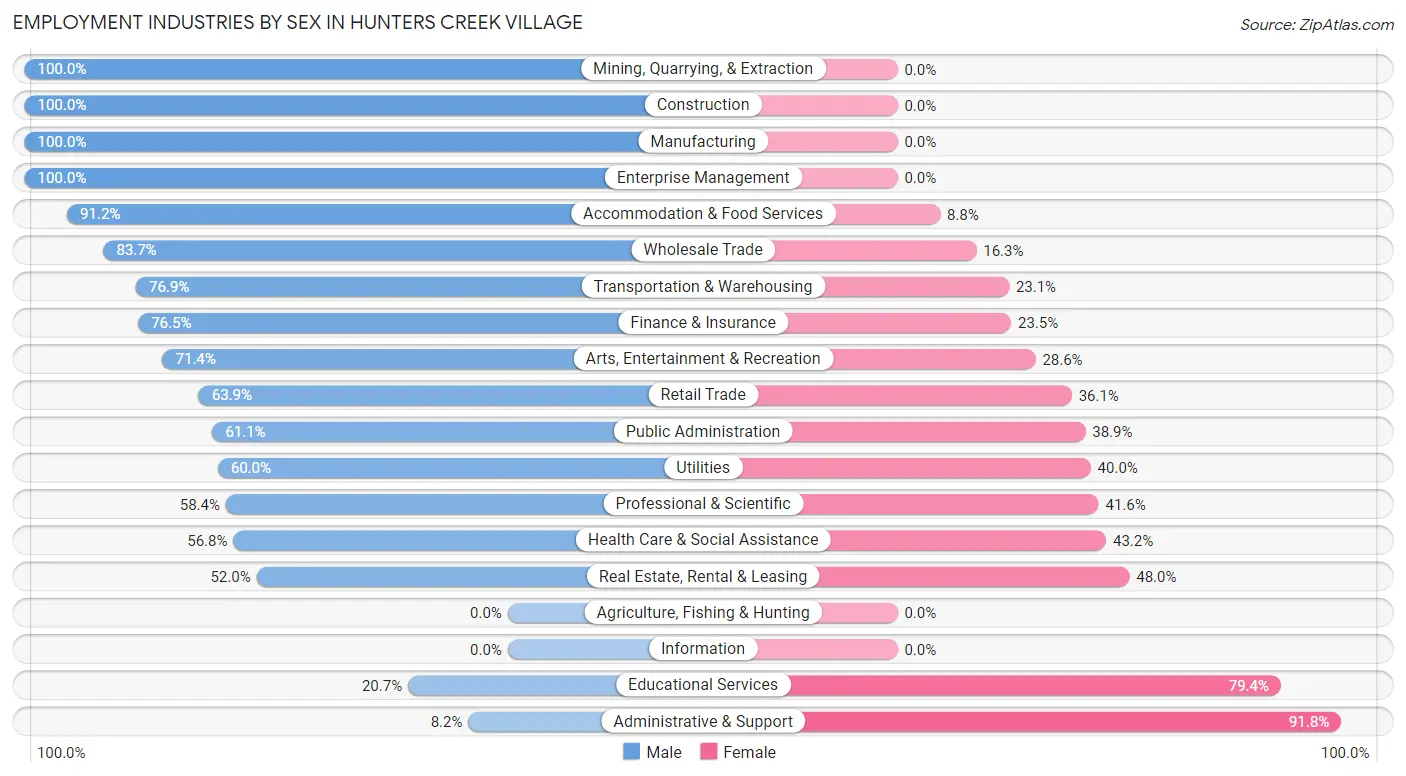
Employment Industries by Sex in Hunters Creek Village
The Hunters Creek Village industries that see more men than women are Mining, Quarrying, & Extraction (100.0%), Construction (100.0%), and Manufacturing (100.0%), whereas the industries that tend to have a higher number of women are Administrative & Support (91.8%), Educational Services (79.3%), and Real Estate, Rental & Leasing (48.0%).
| Industry | Male | Female |
| Agriculture, Fishing & Hunting | 0 (0.0%) | 0 (0.0%) |
| Mining, Quarrying, & Extraction | 220 (100.0%) | 0 (0.0%) |
| Construction | 8 (100.0%) | 0 (0.0%) |
| Manufacturing | 109 (100.0%) | 0 (0.0%) |
| Wholesale Trade | 41 (83.7%) | 8 (16.3%) |
| Retail Trade | 78 (63.9%) | 44 (36.1%) |
| Transportation & Warehousing | 30 (76.9%) | 9 (23.1%) |
| Utilities | 15 (60.0%) | 10 (40.0%) |
| Information | 0 (0.0%) | 0 (0.0%) |
| Finance & Insurance | 117 (76.5%) | 36 (23.5%) |
| Real Estate, Rental & Leasing | 52 (52.0%) | 48 (48.0%) |
| Professional & Scientific | 206 (58.4%) | 147 (41.6%) |
| Enterprise Management | 7 (100.0%) | 0 (0.0%) |
| Administrative & Support | 8 (8.2%) | 90 (91.8%) |
| Educational Services | 32 (20.6%) | 123 (79.3%) |
| Health Care & Social Assistance | 121 (56.8%) | 92 (43.2%) |
| Arts, Entertainment & Recreation | 15 (71.4%) | 6 (28.6%) |
| Accommodation & Food Services | 31 (91.2%) | 3 (8.8%) |
| Public Administration | 22 (61.1%) | 14 (38.9%) |
| Total | 1,112 (63.3%) | 645 (36.7%) |
Education in Hunters Creek Village
School Enrollment in Hunters Creek Village
The most common levels of schooling among the 1,408 students in Hunters Creek Village are middle school (460 | 32.7%), high school (281 | 20.0%), and college / undergraduate (224 | 15.9%).
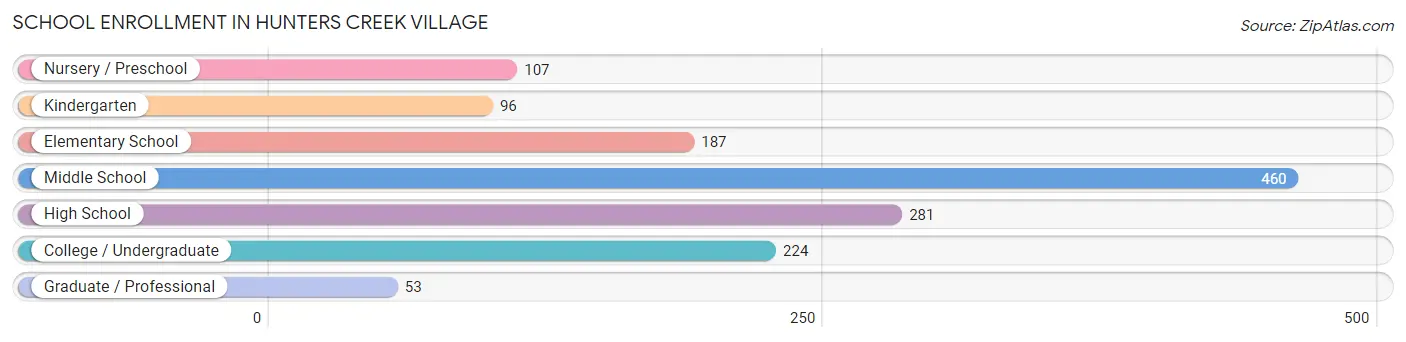
| School Level | # Students | % Students |
| Nursery / Preschool | 107 | 7.6% |
| Kindergarten | 96 | 6.8% |
| Elementary School | 187 | 13.3% |
| Middle School | 460 | 32.7% |
| High School | 281 | 20.0% |
| College / Undergraduate | 224 | 15.9% |
| Graduate / Professional | 53 | 3.8% |
| Total | 1,408 | 100.0% |
School Enrollment by Age by Funding Source in Hunters Creek Village
Out of a total of 1,408 students who are enrolled in schools in Hunters Creek Village, 872 (61.9%) attend a private institution, while the remaining 536 (38.1%) are enrolled in public schools. The age group of 10 to 14 year olds has the highest likelihood of being enrolled in private schools, with 285 (79.4% in the age bracket) enrolled. Conversely, the age group of 18 to 19 year olds has the lowest likelihood of being enrolled in a private school, with 21 (100.0% in the age bracket) attending a public institution.
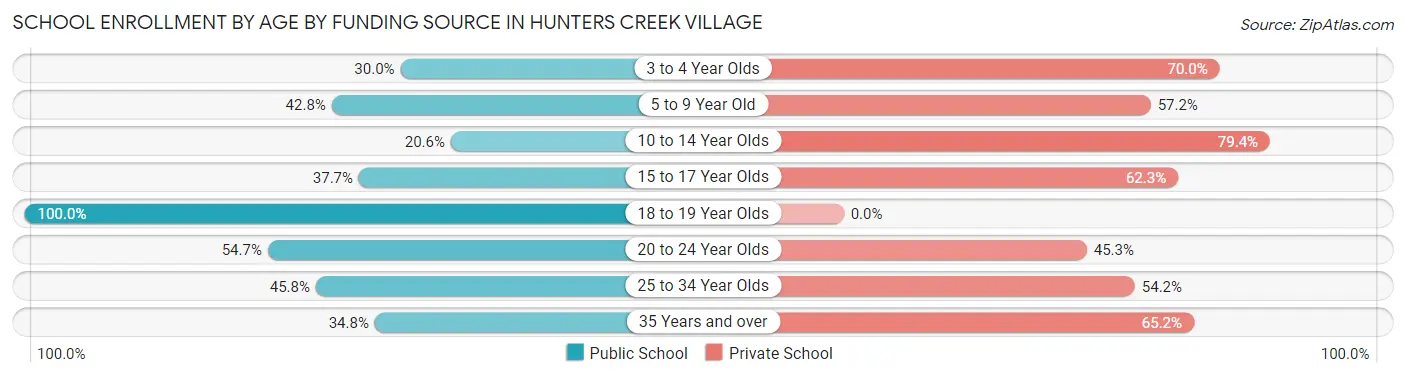
| Age Bracket | Public School | Private School |
| 3 to 4 Year Olds | 12 (30.0%) | 28 (70.0%) |
| 5 to 9 Year Old | 143 (42.8%) | 191 (57.2%) |
| 10 to 14 Year Olds | 74 (20.6%) | 285 (79.4%) |
| 15 to 17 Year Olds | 97 (37.7%) | 160 (62.3%) |
| 18 to 19 Year Olds | 21 (100.0%) | 0 (0.0%) |
| 20 to 24 Year Olds | 122 (54.7%) | 101 (45.3%) |
| 25 to 34 Year Olds | 27 (45.8%) | 32 (54.2%) |
| 35 Years and over | 40 (34.8%) | 75 (65.2%) |
| Total | 536 (38.1%) | 872 (61.9%) |
Educational Attainment by Field of Study in Hunters Creek Village
Business (783 | 30.8%), engineering (291 | 11.4%), liberal arts & history (231 | 9.1%), social sciences (179 | 7.0%), and communications (160 | 6.3%) are the most common fields of study among 2,545 individuals in Hunters Creek Village who have obtained a bachelor's degree or higher.
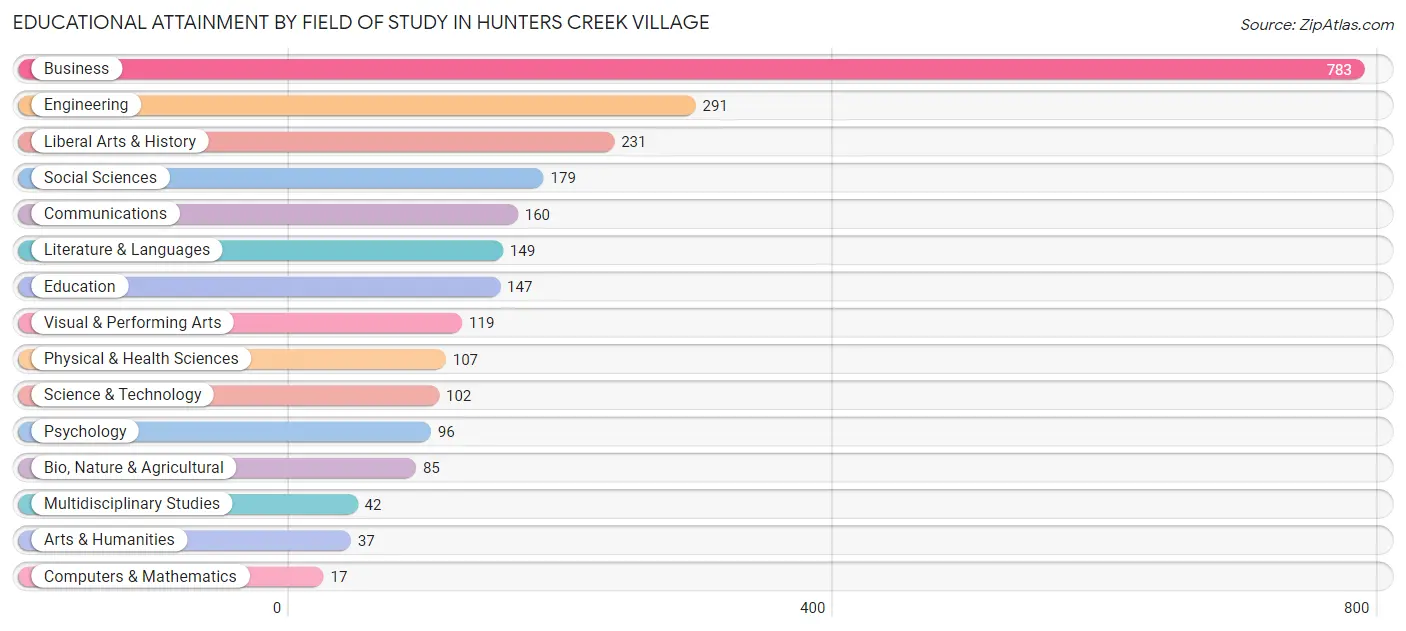
| Field of Study | # Graduates | % Graduates |
| Computers & Mathematics | 17 | 0.7% |
| Bio, Nature & Agricultural | 85 | 3.3% |
| Physical & Health Sciences | 107 | 4.2% |
| Psychology | 96 | 3.8% |
| Social Sciences | 179 | 7.0% |
| Engineering | 291 | 11.4% |
| Multidisciplinary Studies | 42 | 1.7% |
| Science & Technology | 102 | 4.0% |
| Business | 783 | 30.8% |
| Education | 147 | 5.8% |
| Literature & Languages | 149 | 5.9% |
| Liberal Arts & History | 231 | 9.1% |
| Visual & Performing Arts | 119 | 4.7% |
| Communications | 160 | 6.3% |
| Arts & Humanities | 37 | 1.5% |
| Total | 2,545 | 100.0% |
Transportation & Commute in Hunters Creek Village
Vehicle Availability by Sex in Hunters Creek Village
The most prevalent vehicle ownership categories in Hunters Creek Village are males with 2 vehicles (537, accounting for 48.3%) and females with 2 vehicles (301, making up 82.1%).
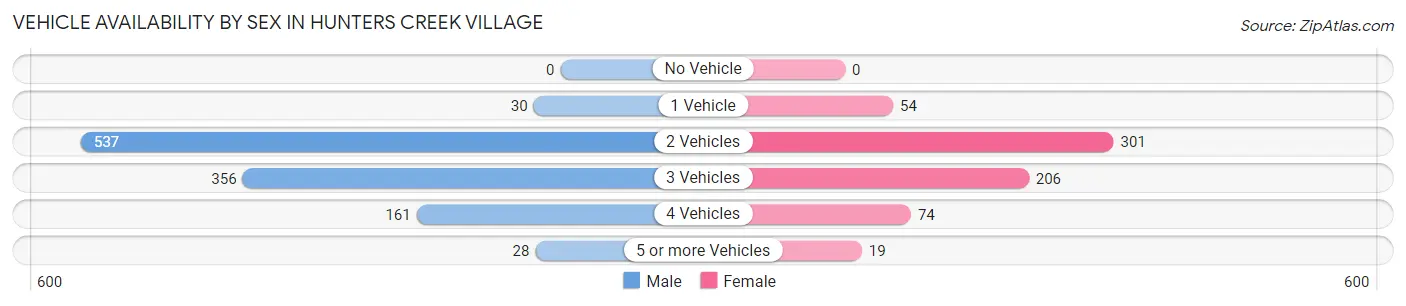
| Vehicles Available | Male | Female |
| No Vehicle | 0 (0.0%) | 0 (0.0%) |
| 1 Vehicle | 30 (2.7%) | 54 (8.3%) |
| 2 Vehicles | 537 (48.3%) | 301 (46.0%) |
| 3 Vehicles | 356 (32.0%) | 206 (31.5%) |
| 4 Vehicles | 161 (14.5%) | 74 (11.3%) |
| 5 or more Vehicles | 28 (2.5%) | 19 (2.9%) |
| Total | 1,112 (100.0%) | 654 (100.0%) |
Commute Time in Hunters Creek Village
The most frequently occuring commute durations in Hunters Creek Village are 30 to 34 minutes (388 commuters, 25.5%), 20 to 24 minutes (329 commuters, 21.6%), and 15 to 19 minutes (227 commuters, 14.9%).
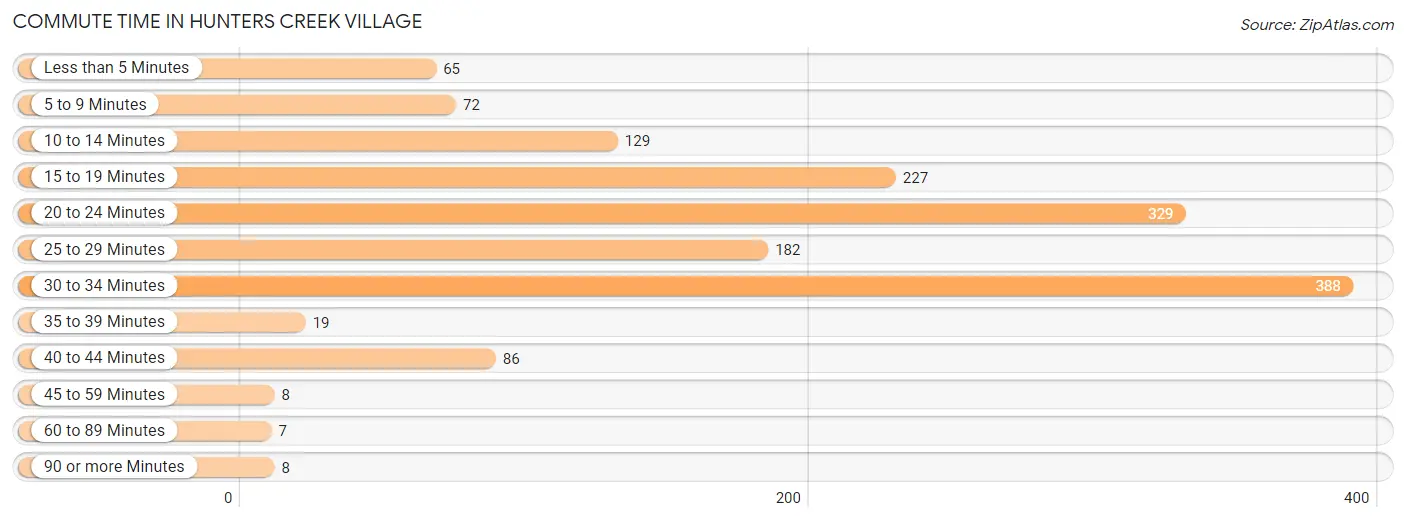
| Commute Time | # Commuters | % Commuters |
| Less than 5 Minutes | 65 | 4.3% |
| 5 to 9 Minutes | 72 | 4.7% |
| 10 to 14 Minutes | 129 | 8.5% |
| 15 to 19 Minutes | 227 | 14.9% |
| 20 to 24 Minutes | 329 | 21.6% |
| 25 to 29 Minutes | 182 | 12.0% |
| 30 to 34 Minutes | 388 | 25.5% |
| 35 to 39 Minutes | 19 | 1.3% |
| 40 to 44 Minutes | 86 | 5.7% |
| 45 to 59 Minutes | 8 | 0.5% |
| 60 to 89 Minutes | 7 | 0.5% |
| 90 or more Minutes | 8 | 0.5% |
Commute Time by Sex in Hunters Creek Village
The most common commute times in Hunters Creek Village are 30 to 34 minutes (289 commuters, 28.9%) for males and 20 to 24 minutes (160 commuters, 30.8%) for females.
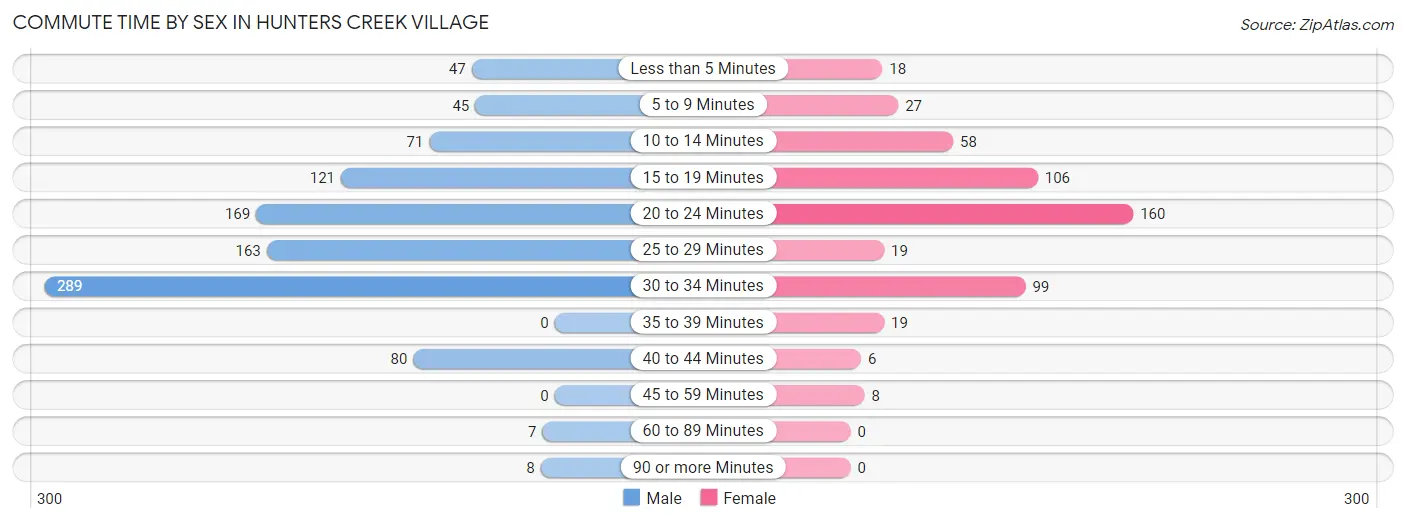
| Commute Time | Male | Female |
| Less than 5 Minutes | 47 (4.7%) | 18 (3.5%) |
| 5 to 9 Minutes | 45 (4.5%) | 27 (5.2%) |
| 10 to 14 Minutes | 71 (7.1%) | 58 (11.2%) |
| 15 to 19 Minutes | 121 (12.1%) | 106 (20.4%) |
| 20 to 24 Minutes | 169 (16.9%) | 160 (30.8%) |
| 25 to 29 Minutes | 163 (16.3%) | 19 (3.6%) |
| 30 to 34 Minutes | 289 (28.9%) | 99 (19.0%) |
| 35 to 39 Minutes | 0 (0.0%) | 19 (3.6%) |
| 40 to 44 Minutes | 80 (8.0%) | 6 (1.1%) |
| 45 to 59 Minutes | 0 (0.0%) | 8 (1.5%) |
| 60 to 89 Minutes | 7 (0.7%) | 0 (0.0%) |
| 90 or more Minutes | 8 (0.8%) | 0 (0.0%) |
Time of Departure to Work by Sex in Hunters Creek Village
The most frequent times of departure to work in Hunters Creek Village are 8:00 AM to 8:29 AM (246, 24.6%) for males and 8:00 AM to 8:29 AM (208, 40.0%) for females.
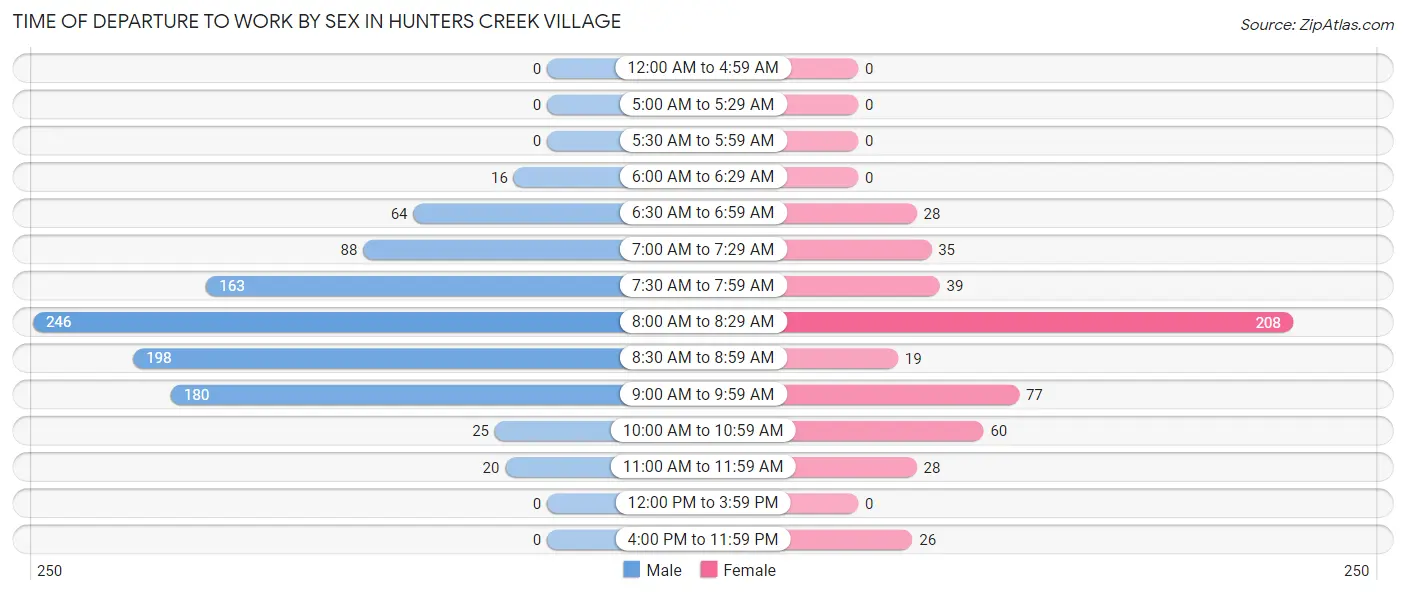
| Time of Departure | Male | Female |
| 12:00 AM to 4:59 AM | 0 (0.0%) | 0 (0.0%) |
| 5:00 AM to 5:29 AM | 0 (0.0%) | 0 (0.0%) |
| 5:30 AM to 5:59 AM | 0 (0.0%) | 0 (0.0%) |
| 6:00 AM to 6:29 AM | 16 (1.6%) | 0 (0.0%) |
| 6:30 AM to 6:59 AM | 64 (6.4%) | 28 (5.4%) |
| 7:00 AM to 7:29 AM | 88 (8.8%) | 35 (6.7%) |
| 7:30 AM to 7:59 AM | 163 (16.3%) | 39 (7.5%) |
| 8:00 AM to 8:29 AM | 246 (24.6%) | 208 (40.0%) |
| 8:30 AM to 8:59 AM | 198 (19.8%) | 19 (3.6%) |
| 9:00 AM to 9:59 AM | 180 (18.0%) | 77 (14.8%) |
| 10:00 AM to 10:59 AM | 25 (2.5%) | 60 (11.5%) |
| 11:00 AM to 11:59 AM | 20 (2.0%) | 28 (5.4%) |
| 12:00 PM to 3:59 PM | 0 (0.0%) | 0 (0.0%) |
| 4:00 PM to 11:59 PM | 0 (0.0%) | 26 (5.0%) |
| Total | 1,000 (100.0%) | 520 (100.0%) |
Housing Occupancy in Hunters Creek Village
Occupancy by Ownership in Hunters Creek Village
Of the total 1,524 dwellings in Hunters Creek Village, owner-occupied units account for 1,502 (98.6%), while renter-occupied units make up 22 (1.4%).
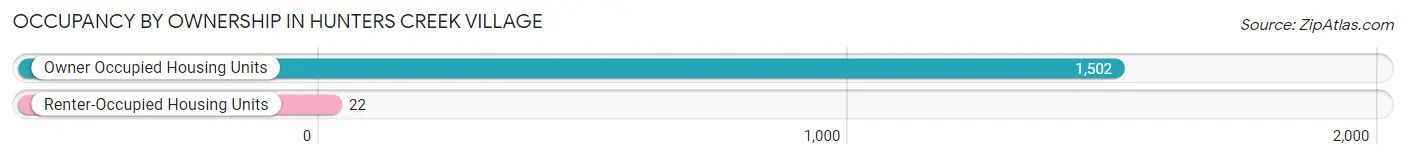
| Occupancy | # Housing Units | % Housing Units |
| Owner Occupied Housing Units | 1,502 | 98.6% |
| Renter-Occupied Housing Units | 22 | 1.4% |
| Total Occupied Housing Units | 1,524 | 100.0% |
Occupancy by Household Size in Hunters Creek Village
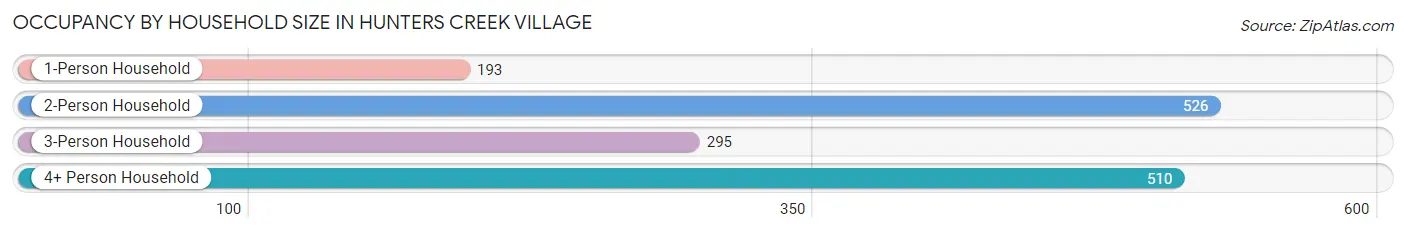
| Household Size | # Housing Units | % Housing Units |
| 1-Person Household | 193 | 12.7% |
| 2-Person Household | 526 | 34.5% |
| 3-Person Household | 295 | 19.4% |
| 4+ Person Household | 510 | 33.5% |
| Total Housing Units | 1,524 | 100.0% |
Occupancy by Ownership by Household Size in Hunters Creek Village
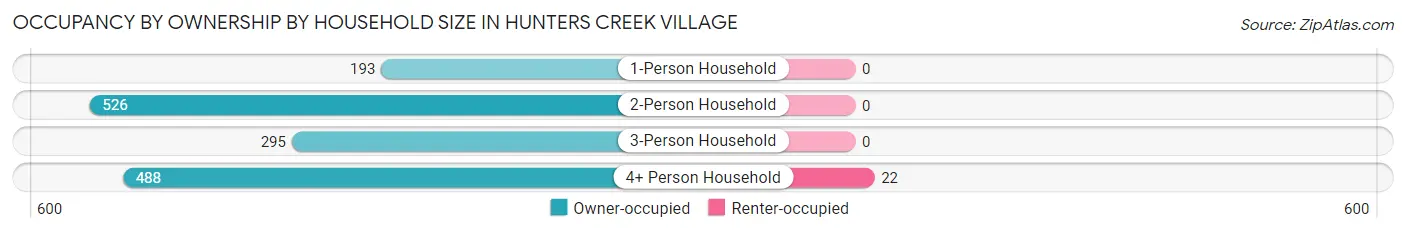
| Household Size | Owner-occupied | Renter-occupied |
| 1-Person Household | 193 (100.0%) | 0 (0.0%) |
| 2-Person Household | 526 (100.0%) | 0 (0.0%) |
| 3-Person Household | 295 (100.0%) | 0 (0.0%) |
| 4+ Person Household | 488 (95.7%) | 22 (4.3%) |
| Total Housing Units | 1,502 (98.6%) | 22 (1.4%) |
Occupancy by Educational Attainment in Hunters Creek Village
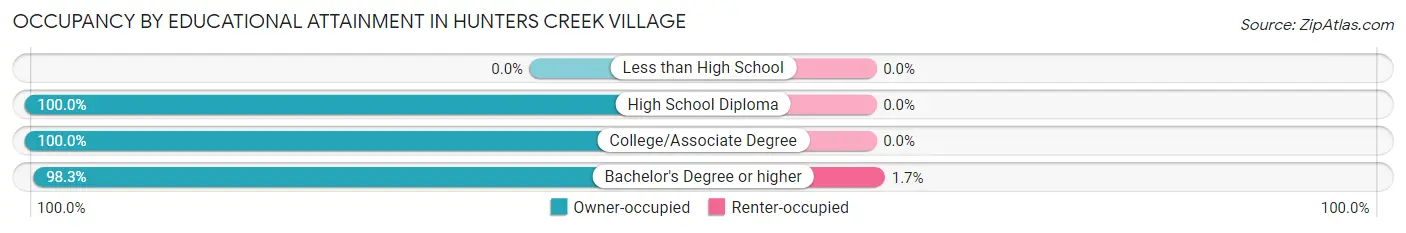
| Household Size | Owner-occupied | Renter-occupied |
| Less than High School | 0 (0.0%) | 0 (0.0%) |
| High School Diploma | 9 (100.0%) | 0 (0.0%) |
| College/Associate Degree | 228 (100.0%) | 0 (0.0%) |
| Bachelor's Degree or higher | 1,265 (98.3%) | 22 (1.7%) |
Occupancy by Age of Householder in Hunters Creek Village
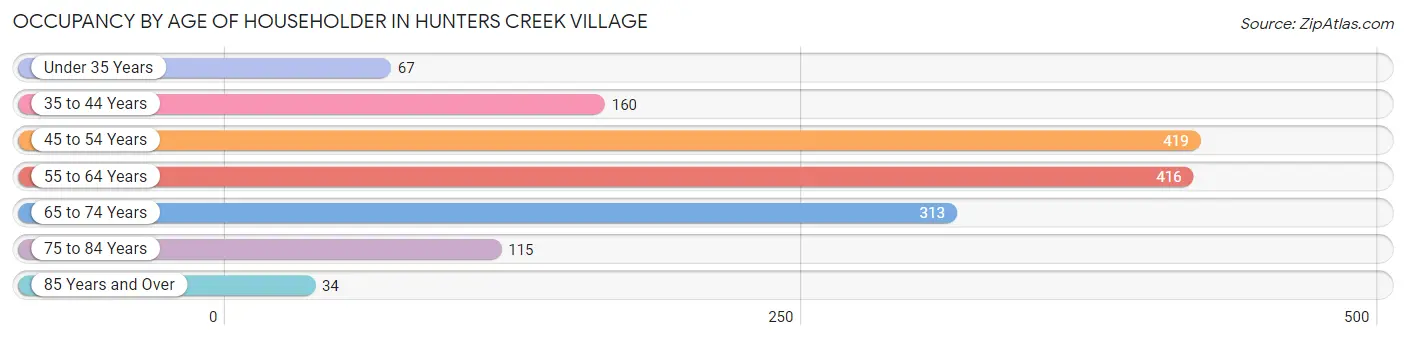
| Age Bracket | # Households | % Households |
| Under 35 Years | 67 | 4.4% |
| 35 to 44 Years | 160 | 10.5% |
| 45 to 54 Years | 419 | 27.5% |
| 55 to 64 Years | 416 | 27.3% |
| 65 to 74 Years | 313 | 20.5% |
| 75 to 84 Years | 115 | 7.5% |
| 85 Years and Over | 34 | 2.2% |
| Total | 1,524 | 100.0% |
Housing Finances in Hunters Creek Village
Median Income by Occupancy in Hunters Creek Village
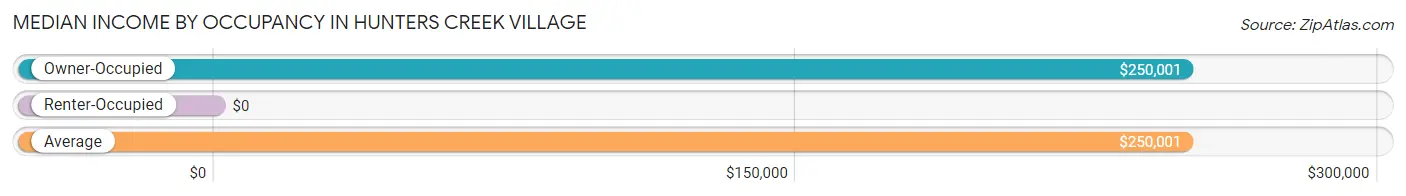
| Occupancy Type | # Households | Median Income |
| Owner-Occupied | 1,502 (98.6%) | $250,001 |
| Renter-Occupied | 22 (1.4%) | $0 |
| Average | 1,524 (100.0%) | $250,001 |
Occupancy by Householder Income Bracket in Hunters Creek Village
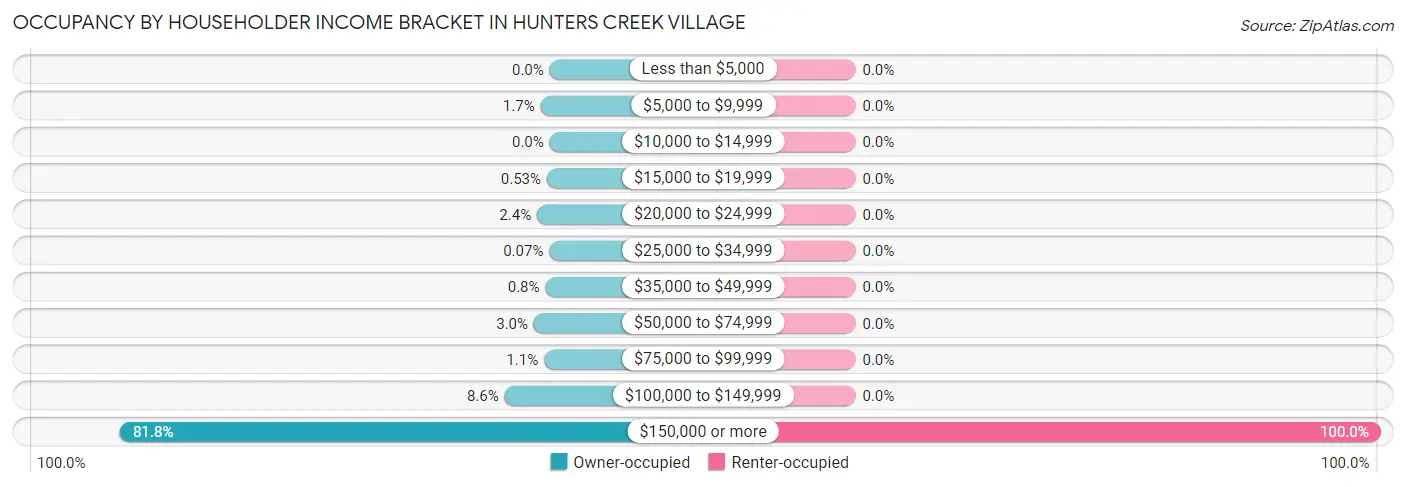
| Income Bracket | Owner-occupied | Renter-occupied |
| Less than $5,000 | 0 (0.0%) | 0 (0.0%) |
| $5,000 to $9,999 | 26 (1.7%) | 0 (0.0%) |
| $10,000 to $14,999 | 0 (0.0%) | 0 (0.0%) |
| $15,000 to $19,999 | 8 (0.5%) | 0 (0.0%) |
| $20,000 to $24,999 | 36 (2.4%) | 0 (0.0%) |
| $25,000 to $34,999 | 1 (0.1%) | 0 (0.0%) |
| $35,000 to $49,999 | 12 (0.8%) | 0 (0.0%) |
| $50,000 to $74,999 | 45 (3.0%) | 0 (0.0%) |
| $75,000 to $99,999 | 16 (1.1%) | 0 (0.0%) |
| $100,000 to $149,999 | 129 (8.6%) | 0 (0.0%) |
| $150,000 or more | 1,229 (81.8%) | 22 (100.0%) |
| Total | 1,502 (100.0%) | 22 (100.0%) |
Monthly Housing Cost Tiers in Hunters Creek Village
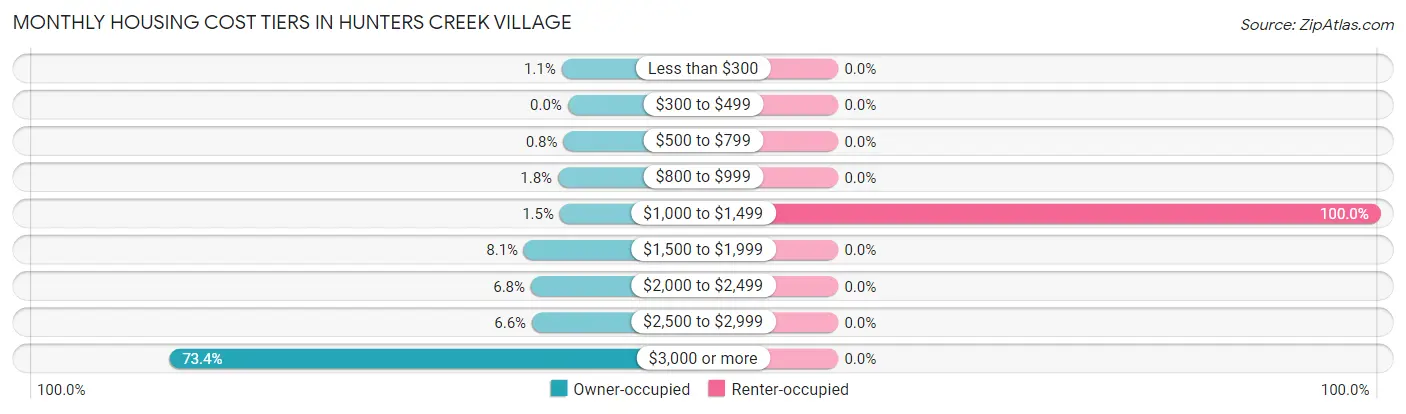
| Monthly Cost | Owner-occupied | Renter-occupied |
| Less than $300 | 17 (1.1%) | 0 (0.0%) |
| $300 to $499 | 0 (0.0%) | 0 (0.0%) |
| $500 to $799 | 12 (0.8%) | 0 (0.0%) |
| $800 to $999 | 27 (1.8%) | 0 (0.0%) |
| $1,000 to $1,499 | 22 (1.5%) | 22 (100.0%) |
| $1,500 to $1,999 | 121 (8.1%) | 0 (0.0%) |
| $2,000 to $2,499 | 102 (6.8%) | 0 (0.0%) |
| $2,500 to $2,999 | 99 (6.6%) | 0 (0.0%) |
| $3,000 or more | 1,102 (73.4%) | 0 (0.0%) |
| Total | 1,502 (100.0%) | 22 (100.0%) |
Physical Housing Characteristics in Hunters Creek Village
Housing Structures in Hunters Creek Village
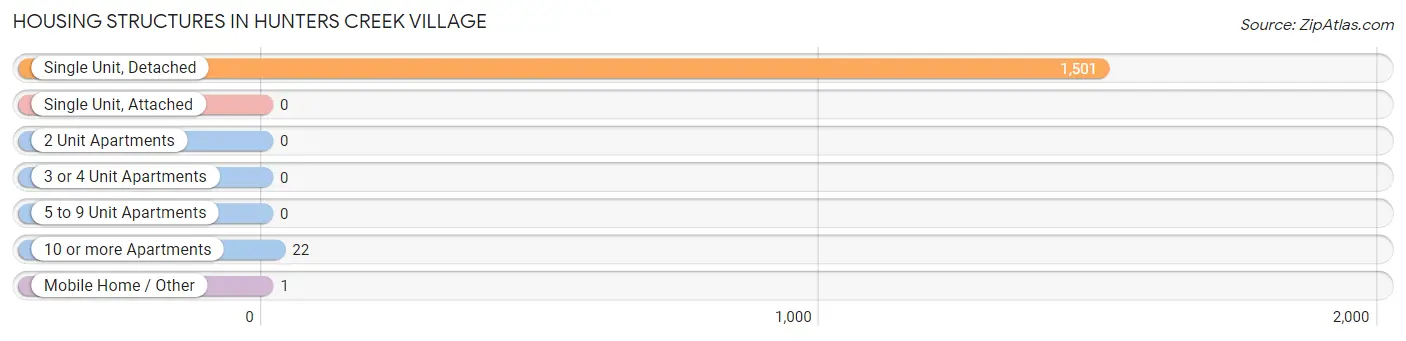
| Structure Type | # Housing Units | % Housing Units |
| Single Unit, Detached | 1,501 | 98.5% |
| Single Unit, Attached | 0 | 0.0% |
| 2 Unit Apartments | 0 | 0.0% |
| 3 or 4 Unit Apartments | 0 | 0.0% |
| 5 to 9 Unit Apartments | 0 | 0.0% |
| 10 or more Apartments | 22 | 1.4% |
| Mobile Home / Other | 1 | 0.1% |
| Total | 1,524 | 100.0% |
Housing Structures by Occupancy in Hunters Creek Village
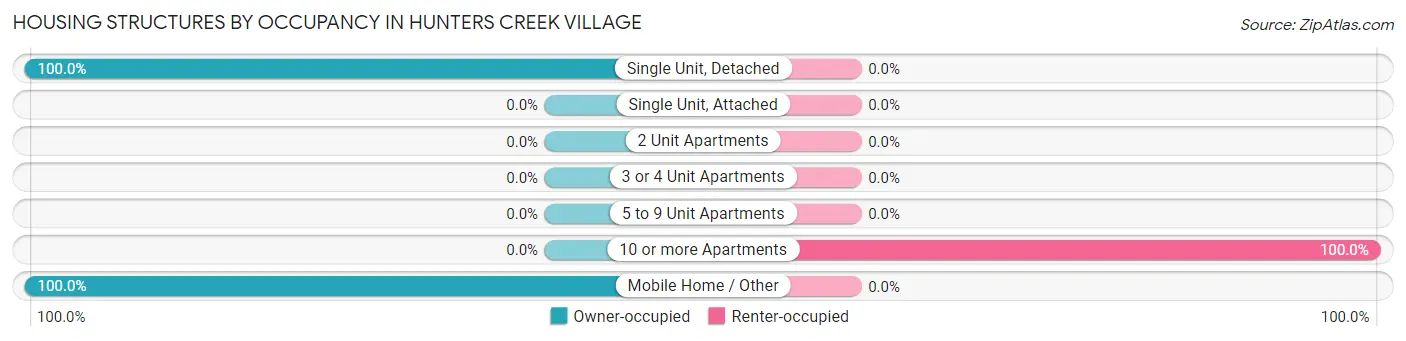
| Structure Type | Owner-occupied | Renter-occupied |
| Single Unit, Detached | 1,501 (100.0%) | 0 (0.0%) |
| Single Unit, Attached | 0 (0.0%) | 0 (0.0%) |
| 2 Unit Apartments | 0 (0.0%) | 0 (0.0%) |
| 3 or 4 Unit Apartments | 0 (0.0%) | 0 (0.0%) |
| 5 to 9 Unit Apartments | 0 (0.0%) | 0 (0.0%) |
| 10 or more Apartments | 0 (0.0%) | 22 (100.0%) |
| Mobile Home / Other | 1 (100.0%) | 0 (0.0%) |
| Total | 1,502 (98.6%) | 22 (1.4%) |
Housing Structures by Number of Rooms in Hunters Creek Village
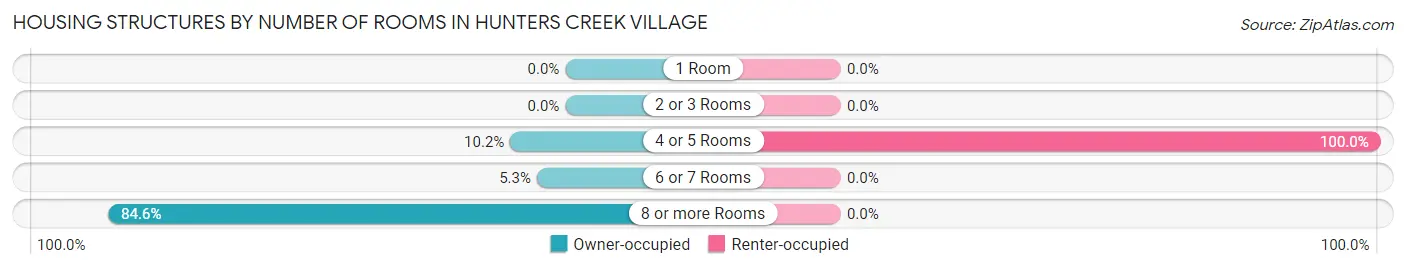
| Number of Rooms | Owner-occupied | Renter-occupied |
| 1 Room | 0 (0.0%) | 0 (0.0%) |
| 2 or 3 Rooms | 0 (0.0%) | 0 (0.0%) |
| 4 or 5 Rooms | 153 (10.2%) | 22 (100.0%) |
| 6 or 7 Rooms | 79 (5.3%) | 0 (0.0%) |
| 8 or more Rooms | 1,270 (84.6%) | 0 (0.0%) |
| Total | 1,502 (100.0%) | 22 (100.0%) |
Housing Structure by Heating Type in Hunters Creek Village
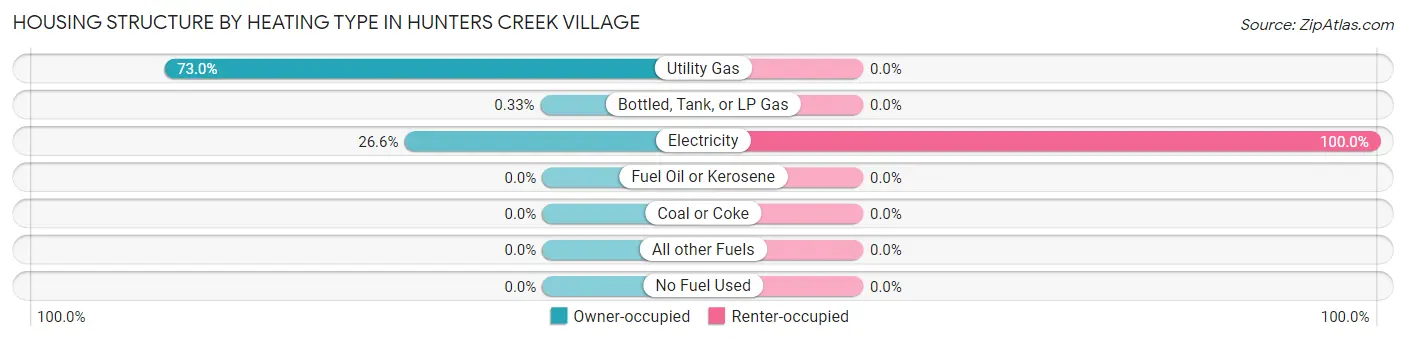
| Heating Type | Owner-occupied | Renter-occupied |
| Utility Gas | 1,097 (73.0%) | 0 (0.0%) |
| Bottled, Tank, or LP Gas | 5 (0.3%) | 0 (0.0%) |
| Electricity | 400 (26.6%) | 22 (100.0%) |
| Fuel Oil or Kerosene | 0 (0.0%) | 0 (0.0%) |
| Coal or Coke | 0 (0.0%) | 0 (0.0%) |
| All other Fuels | 0 (0.0%) | 0 (0.0%) |
| No Fuel Used | 0 (0.0%) | 0 (0.0%) |
| Total | 1,502 (100.0%) | 22 (100.0%) |
Household Vehicle Usage in Hunters Creek Village
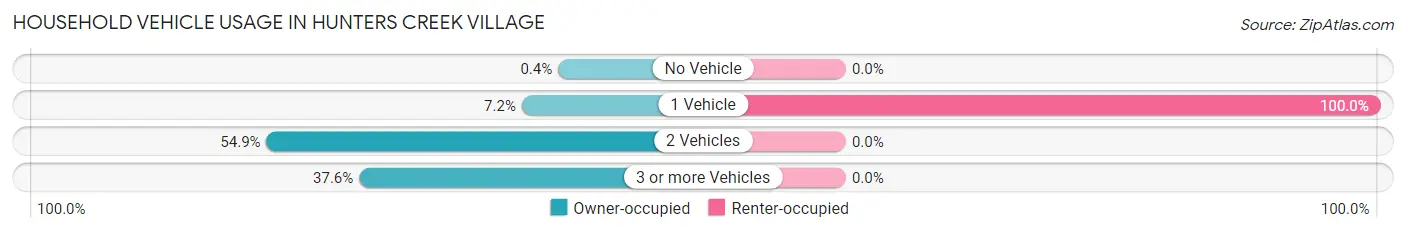
| Vehicles per Household | Owner-occupied | Renter-occupied |
| No Vehicle | 6 (0.4%) | 0 (0.0%) |
| 1 Vehicle | 108 (7.2%) | 22 (100.0%) |
| 2 Vehicles | 824 (54.9%) | 0 (0.0%) |
| 3 or more Vehicles | 564 (37.6%) | 0 (0.0%) |
| Total | 1,502 (100.0%) | 22 (100.0%) |
Real Estate & Mortgages in Hunters Creek Village
Real Estate and Mortgage Overview in Hunters Creek Village
| Characteristic | Without Mortgage | With Mortgage |
| Housing Units | 788 | 714 |
| Median Property Value | $1,757,400 | $2,000,001 |
| Median Household Income | $250,001 | $616 |
| Monthly Housing Costs | $1,501 | $686 |
| Real Estate Taxes | $10,001 | $0 |
Property Value by Mortgage Status in Hunters Creek Village
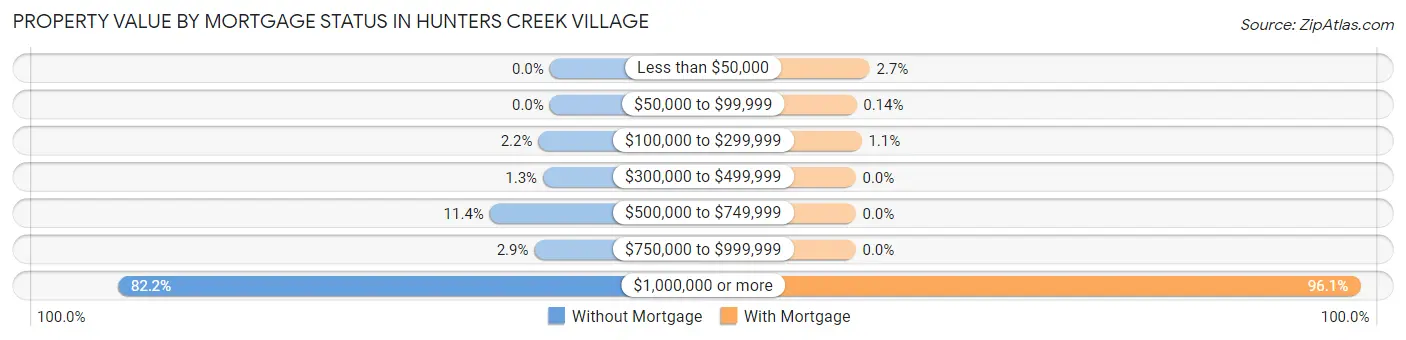
| Property Value | Without Mortgage | With Mortgage |
| Less than $50,000 | 0 (0.0%) | 19 (2.7%) |
| $50,000 to $99,999 | 0 (0.0%) | 1 (0.1%) |
| $100,000 to $299,999 | 17 (2.2%) | 8 (1.1%) |
| $300,000 to $499,999 | 10 (1.3%) | 0 (0.0%) |
| $500,000 to $749,999 | 90 (11.4%) | 0 (0.0%) |
| $750,000 to $999,999 | 23 (2.9%) | 0 (0.0%) |
| $1,000,000 or more | 648 (82.2%) | 686 (96.1%) |
| Total | 788 (100.0%) | 714 (100.0%) |
Household Income by Mortgage Status in Hunters Creek Village
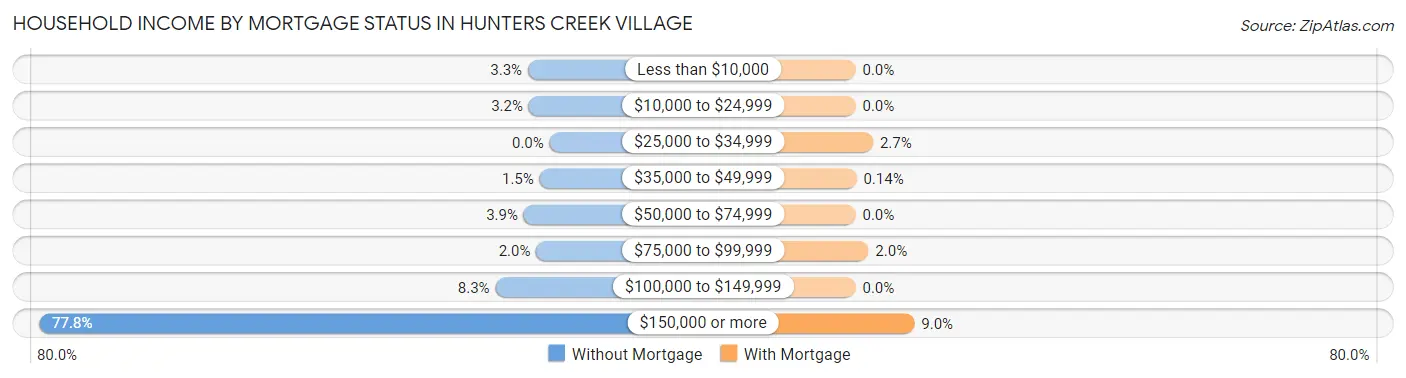
| Household Income | Without Mortgage | With Mortgage |
| Less than $10,000 | 26 (3.3%) | 0 (0.0%) |
| $10,000 to $24,999 | 25 (3.2%) | 0 (0.0%) |
| $25,000 to $34,999 | 0 (0.0%) | 19 (2.7%) |
| $35,000 to $49,999 | 12 (1.5%) | 1 (0.1%) |
| $50,000 to $74,999 | 31 (3.9%) | 0 (0.0%) |
| $75,000 to $99,999 | 16 (2.0%) | 14 (2.0%) |
| $100,000 to $149,999 | 65 (8.3%) | 0 (0.0%) |
| $150,000 or more | 613 (77.8%) | 64 (9.0%) |
| Total | 788 (100.0%) | 714 (100.0%) |
Property Value to Household Income Ratio in Hunters Creek Village
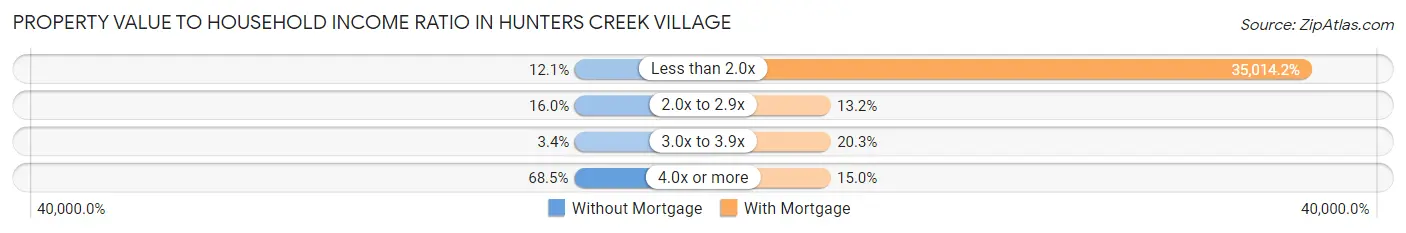
| Value-to-Income Ratio | Without Mortgage | With Mortgage |
| Less than 2.0x | 95 (12.1%) | 250,001 (35,014.2%) |
| 2.0x to 2.9x | 126 (16.0%) | 94 (13.2%) |
| 3.0x to 3.9x | 27 (3.4%) | 145 (20.3%) |
| 4.0x or more | 540 (68.5%) | 107 (15.0%) |
| Total | 788 (100.0%) | 714 (100.0%) |
Real Estate Taxes by Mortgage Status in Hunters Creek Village
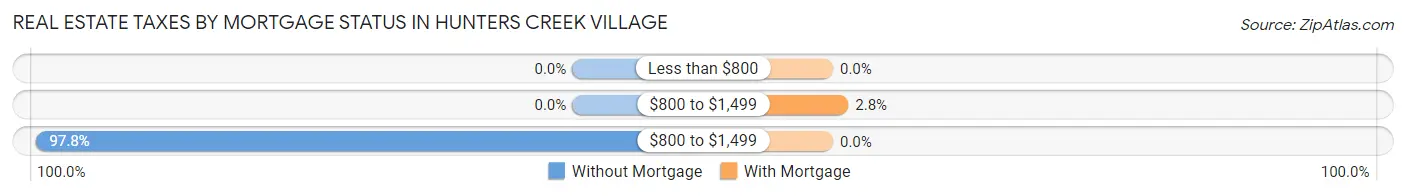
| Property Taxes | Without Mortgage | With Mortgage |
| Less than $800 | 0 (0.0%) | 0 (0.0%) |
| $800 to $1,499 | 0 (0.0%) | 20 (2.8%) |
| $800 to $1,499 | 771 (97.8%) | 0 (0.0%) |
| Total | 788 (100.0%) | 714 (100.0%) |
Health & Disability in Hunters Creek Village
Health Insurance Coverage by Age in Hunters Creek Village
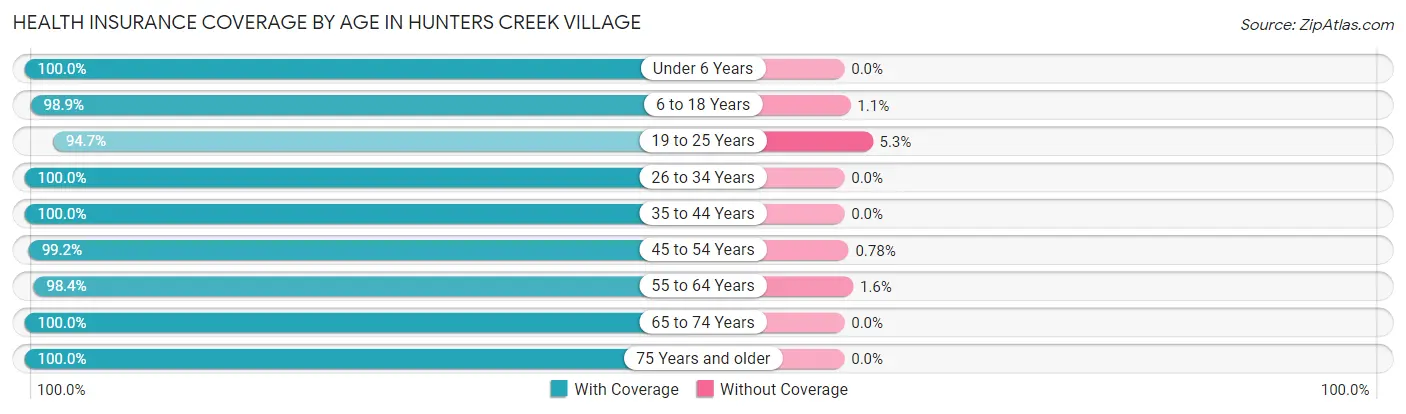
| Age Bracket | With Coverage | Without Coverage |
| Under 6 Years | 295 (100.0%) | 0 (0.0%) |
| 6 to 18 Years | 867 (98.9%) | 10 (1.1%) |
| 19 to 25 Years | 342 (94.7%) | 19 (5.3%) |
| 26 to 34 Years | 232 (100.0%) | 0 (0.0%) |
| 35 to 44 Years | 299 (100.0%) | 0 (0.0%) |
| 45 to 54 Years | 891 (99.2%) | 7 (0.8%) |
| 55 to 64 Years | 722 (98.4%) | 12 (1.6%) |
| 65 to 74 Years | 427 (100.0%) | 0 (0.0%) |
| 75 Years and older | 251 (100.0%) | 0 (0.0%) |
| Total | 4,326 (98.9%) | 48 (1.1%) |
Health Insurance Coverage by Citizenship Status in Hunters Creek Village
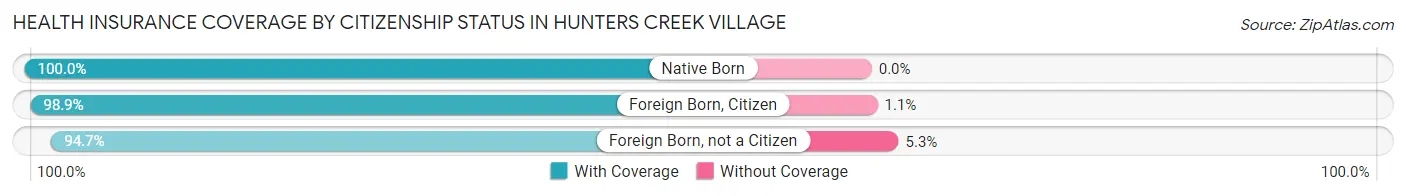
| Citizenship Status | With Coverage | Without Coverage |
| Native Born | 295 (100.0%) | 0 (0.0%) |
| Foreign Born, Citizen | 867 (98.9%) | 10 (1.1%) |
| Foreign Born, not a Citizen | 342 (94.7%) | 19 (5.3%) |
Health Insurance Coverage by Household Income in Hunters Creek Village
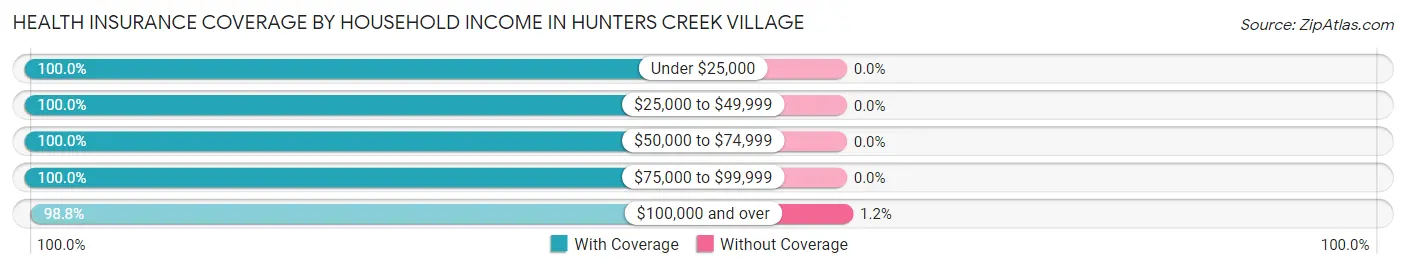
| Household Income | With Coverage | Without Coverage |
| Under $25,000 | 156 (100.0%) | 0 (0.0%) |
| $25,000 to $49,999 | 21 (100.0%) | 0 (0.0%) |
| $50,000 to $74,999 | 129 (100.0%) | 0 (0.0%) |
| $75,000 to $99,999 | 16 (100.0%) | 0 (0.0%) |
| $100,000 and over | 4,004 (98.8%) | 48 (1.2%) |
Public vs Private Health Insurance Coverage by Age in Hunters Creek Village
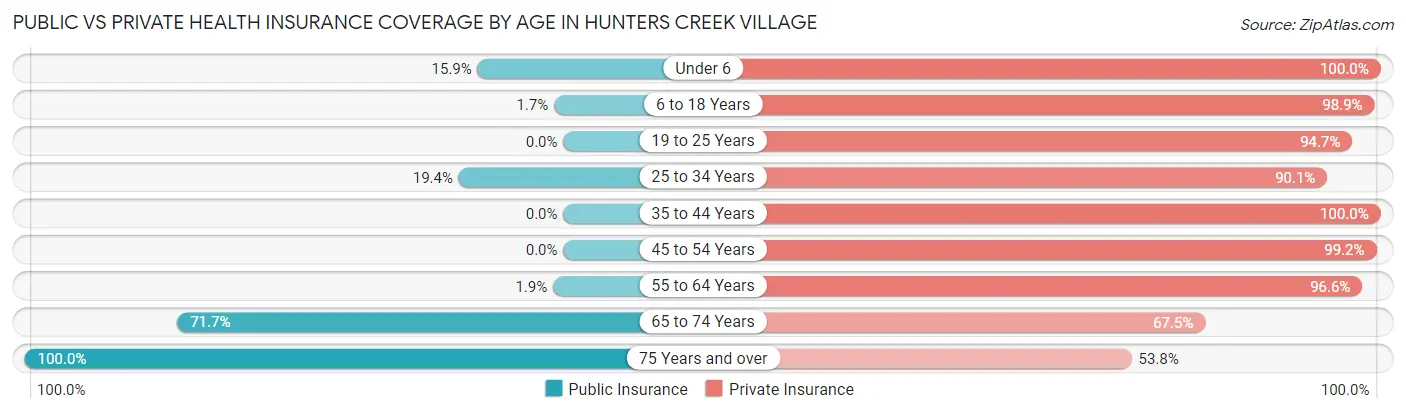
| Age Bracket | Public Insurance | Private Insurance |
| Under 6 | 47 (15.9%) | 295 (100.0%) |
| 6 to 18 Years | 15 (1.7%) | 867 (98.9%) |
| 19 to 25 Years | 0 (0.0%) | 342 (94.7%) |
| 25 to 34 Years | 45 (19.4%) | 209 (90.1%) |
| 35 to 44 Years | 0 (0.0%) | 299 (100.0%) |
| 45 to 54 Years | 0 (0.0%) | 891 (99.2%) |
| 55 to 64 Years | 14 (1.9%) | 709 (96.6%) |
| 65 to 74 Years | 306 (71.7%) | 288 (67.4%) |
| 75 Years and over | 251 (100.0%) | 135 (53.8%) |
| Total | 678 (15.5%) | 4,035 (92.2%) |
Disability Status by Sex by Age in Hunters Creek Village
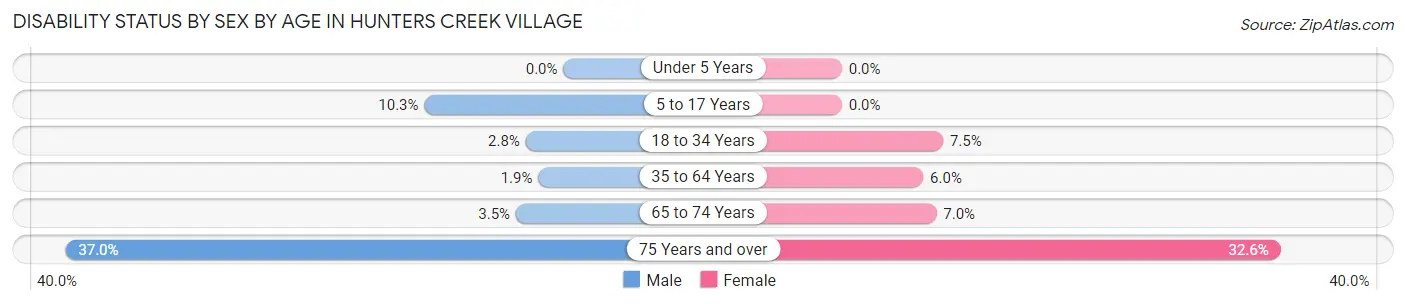
| Age Bracket | Male | Female |
| Under 5 Years | 0 (0.0%) | 0 (0.0%) |
| 5 to 17 Years | 51 (10.3%) | 0 (0.0%) |
| 18 to 34 Years | 9 (2.8%) | 22 (7.5%) |
| 35 to 64 Years | 19 (1.9%) | 55 (6.0%) |
| 65 to 74 Years | 7 (3.5%) | 16 (7.0%) |
| 75 Years and over | 44 (37.0%) | 43 (32.6%) |
Disability Class by Sex by Age in Hunters Creek Village
Disability Class: Hearing Difficulty
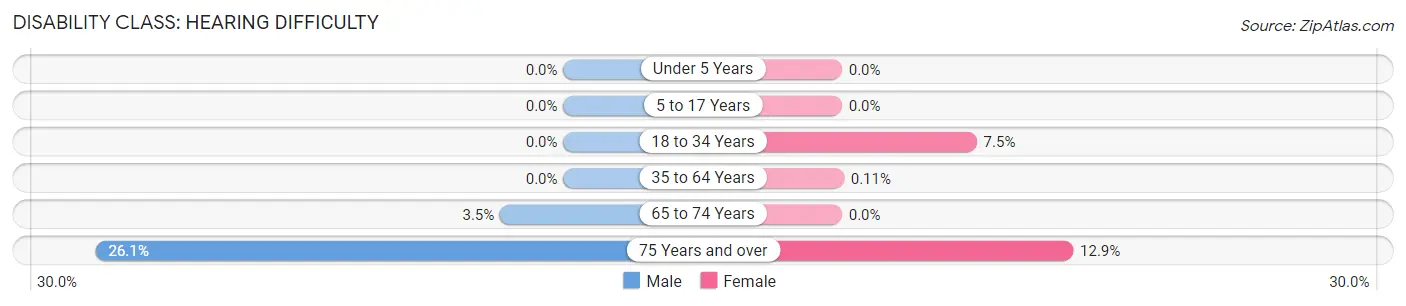
| Age Bracket | Male | Female |
| Under 5 Years | 0 (0.0%) | 0 (0.0%) |
| 5 to 17 Years | 0 (0.0%) | 0 (0.0%) |
| 18 to 34 Years | 0 (0.0%) | 22 (7.5%) |
| 35 to 64 Years | 0 (0.0%) | 1 (0.1%) |
| 65 to 74 Years | 7 (3.5%) | 0 (0.0%) |
| 75 Years and over | 31 (26.1%) | 17 (12.9%) |
Disability Class: Vision Difficulty
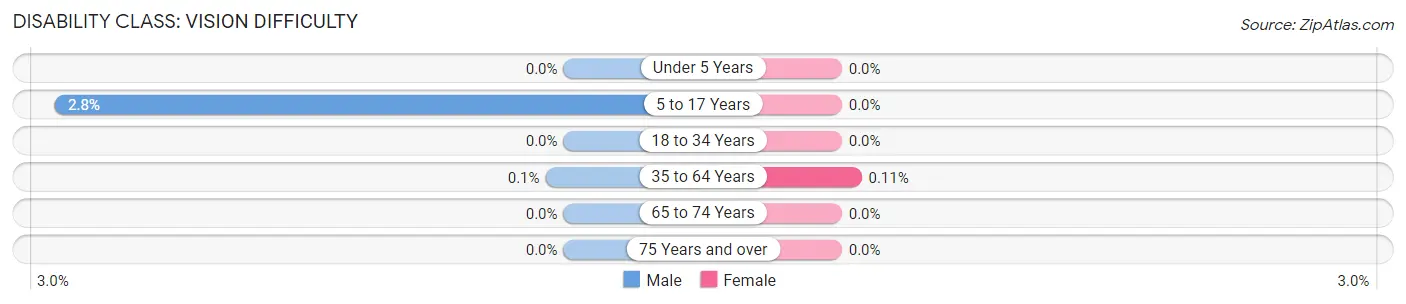
| Age Bracket | Male | Female |
| Under 5 Years | 0 (0.0%) | 0 (0.0%) |
| 5 to 17 Years | 14 (2.8%) | 0 (0.0%) |
| 18 to 34 Years | 0 (0.0%) | 0 (0.0%) |
| 35 to 64 Years | 1 (0.1%) | 1 (0.1%) |
| 65 to 74 Years | 0 (0.0%) | 0 (0.0%) |
| 75 Years and over | 0 (0.0%) | 0 (0.0%) |
Disability Class: Cognitive Difficulty
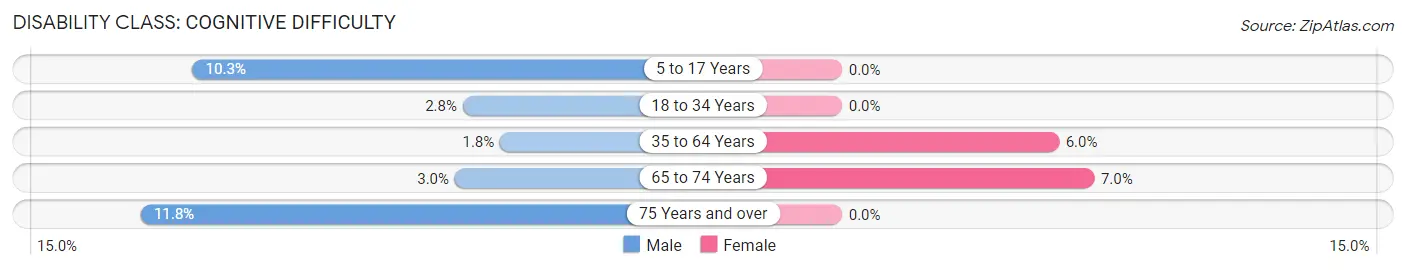
| Age Bracket | Male | Female |
| 5 to 17 Years | 51 (10.3%) | 0 (0.0%) |
| 18 to 34 Years | 9 (2.8%) | 0 (0.0%) |
| 35 to 64 Years | 18 (1.8%) | 55 (6.0%) |
| 65 to 74 Years | 6 (3.0%) | 16 (7.0%) |
| 75 Years and over | 14 (11.8%) | 0 (0.0%) |
Disability Class: Ambulatory Difficulty
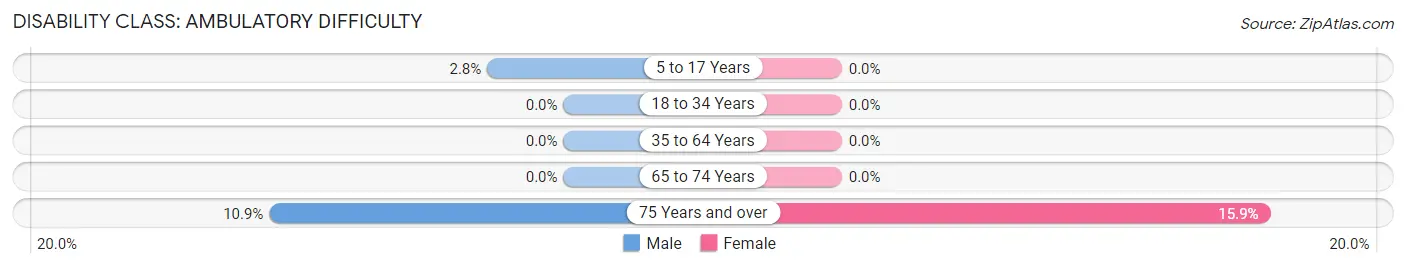
| Age Bracket | Male | Female |
| 5 to 17 Years | 14 (2.8%) | 0 (0.0%) |
| 18 to 34 Years | 0 (0.0%) | 0 (0.0%) |
| 35 to 64 Years | 0 (0.0%) | 0 (0.0%) |
| 65 to 74 Years | 0 (0.0%) | 0 (0.0%) |
| 75 Years and over | 13 (10.9%) | 21 (15.9%) |
Disability Class: Self-Care Difficulty
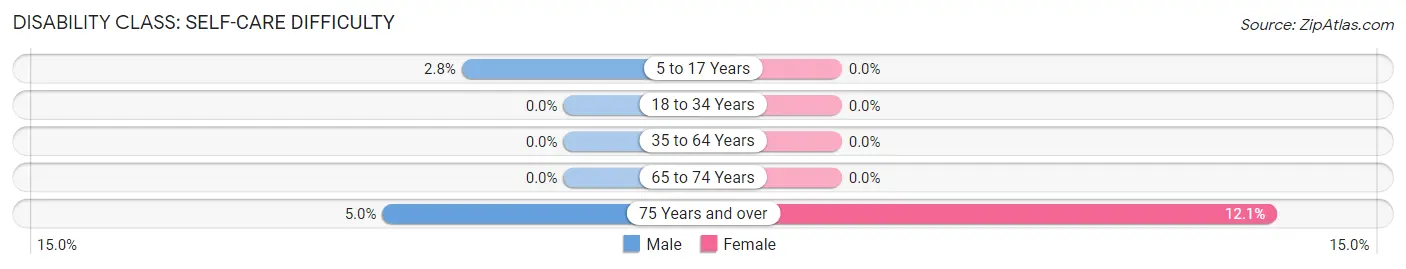
| Age Bracket | Male | Female |
| 5 to 17 Years | 14 (2.8%) | 0 (0.0%) |
| 18 to 34 Years | 0 (0.0%) | 0 (0.0%) |
| 35 to 64 Years | 0 (0.0%) | 0 (0.0%) |
| 65 to 74 Years | 0 (0.0%) | 0 (0.0%) |
| 75 Years and over | 6 (5.0%) | 16 (12.1%) |
Technology Access in Hunters Creek Village
Computing Device Access in Hunters Creek Village
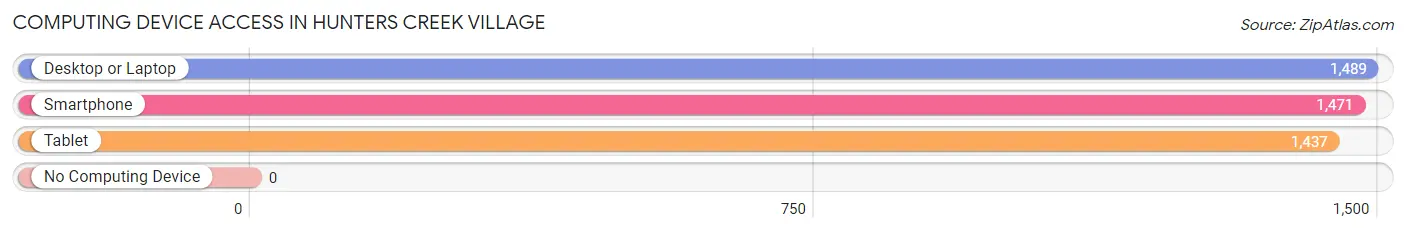
| Device Type | # Households | % Households |
| Desktop or Laptop | 1,489 | 97.7% |
| Smartphone | 1,471 | 96.5% |
| Tablet | 1,437 | 94.3% |
| No Computing Device | 0 | 0.0% |
| Total | 1,524 | 100.0% |
Internet Access in Hunters Creek Village
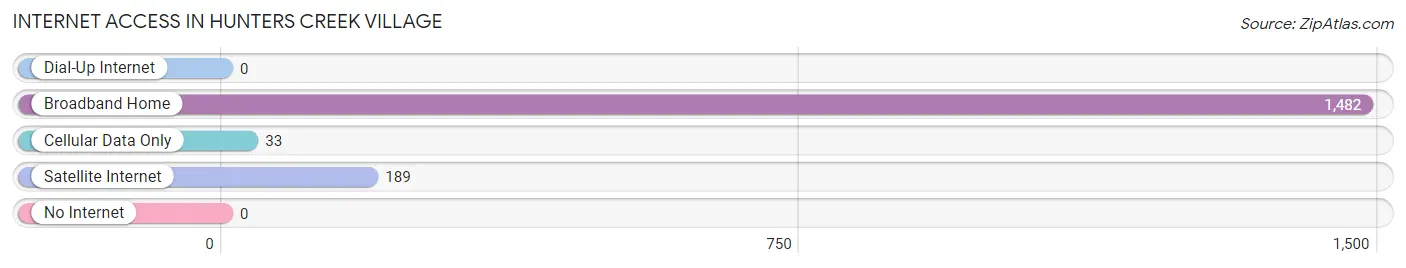
| Internet Type | # Households | % Households |
| Dial-Up Internet | 0 | 0.0% |
| Broadband Home | 1,482 | 97.2% |
| Cellular Data Only | 33 | 2.2% |
| Satellite Internet | 189 | 12.4% |
| No Internet | 0 | 0.0% |
| Total | 1,524 | 100.0% |
Hunters Creek Village Summary
Hunters Creek Village is a small city located in Harris County, Texas, United States. It is part of the Houston–The Woodlands–Sugar Land metropolitan area. The population was 3,738 at the 2010 census.
History
Hunters Creek Village was founded in 1954 by a group of Houston businessmen who wanted to create a residential community in the area. The city was named after the nearby Hunters Creek, which was named after the family of early settler William Hunter. The city was incorporated in 1954 and has since grown to become one of the most affluent communities in the Houston area.
Geography
Hunters Creek Village is located in Harris County, Texas, United States. It is part of the Houston–The Woodlands–Sugar Land metropolitan area. The city is located in the Memorial Villages, a group of six independent cities located within the extraterritorial jurisdiction of Houston. The city is bordered by Piney Point Village to the north, Bunker Hill Village to the east, Hedwig Village to the south, and Spring Valley Village to the west.
The city has a total area of 2.2 square miles, all of which is land. The terrain is mostly flat, with some rolling hills. The city is located in the Houston-Galveston coastal plain, and is part of the Gulf Coastal Plain.
Economy
Hunters Creek Village is a wealthy, affluent community. The median household income in the city is $179,000, and the median home value is $1.2 million. The city is home to many corporate executives and professionals, and is known for its high quality of life.
The city is home to several corporate headquarters, including the headquarters of the Houston-based oil and gas company, Apache Corporation. The city is also home to several medical centers, including Memorial Hermann Memorial City Medical Center and Houston Methodist West Hospital.
Demographics
As of the 2010 census, there were 3,738 people, 1,541 households, and 1,093 families residing in the city. The population density was 1,717.2 people per square mile. The racial makeup of the city was 92.2% White, 1.2% African American, 0.2% Native American, 4.2% Asian, 0.1% Pacific Islander, 0.7% from other races, and 1.6% from two or more races. Hispanic or Latino of any race were 4.2% of the population.
The median age in the city was 45.2 years. The gender makeup of the city was 48.7% male and 51.3% female.
Conclusion
Hunters Creek Village is a small city located in Harris County, Texas, United States. It is part of the Houston–The Woodlands–Sugar Land metropolitan area. The city was founded in 1954 and has since grown to become one of the most affluent communities in the Houston area. The city has a total area of 2.2 square miles, all of which is land. The city is home to many corporate executives and professionals, and is known for its high quality of life. As of the 2010 census, there were 3,738 people, 1,541 households, and 1,093 families residing in the city. The median household income in the city is $179,000, and the median home value is $1.2 million. The city is a wealthy, affluent community with a diverse population.
Common Questions
What is Per Capita Income in Hunters Creek Village?
Per Capita income in Hunters Creek Village is $178,130.
What is the Median Family Income in Hunters Creek Village?
Median Family Income in Hunters Creek Village is $250,001.
What is the Median Household income in Hunters Creek Village?
Median Household Income in Hunters Creek Village is $250,001.
What is Income or Wage Gap in Hunters Creek Village?
Income or Wage Gap in Hunters Creek Village is 45.0%.
Women in Hunters Creek Village earn 55.0 cents for every dollar earned by a man.
What is Inequality or Gini Index in Hunters Creek Village?
Inequality or Gini Index in Hunters Creek Village is 0.44.
What is the Total Population of Hunters Creek Village?
Total Population of Hunters Creek Village is 4,383.
What is the Total Male Population of Hunters Creek Village?
Total Male Population of Hunters Creek Village is 2,240.
What is the Total Female Population of Hunters Creek Village?
Total Female Population of Hunters Creek Village is 2,143.
What is the Ratio of Males per 100 Females in Hunters Creek Village?
There are 104.53 Males per 100 Females in Hunters Creek Village.
What is the Ratio of Females per 100 Males in Hunters Creek Village?
There are 95.67 Females per 100 Males in Hunters Creek Village.
What is the Median Population Age in Hunters Creek Village?
Median Population Age in Hunters Creek Village is 47.3 Years.
What is the Average Family Size in Hunters Creek Village
Average Family Size in Hunters Creek Village is 3.1 People.
What is the Average Household Size in Hunters Creek Village
Average Household Size in Hunters Creek Village is 2.9 People.
How Large is the Labor Force in Hunters Creek Village?
There are 1,936 People in the Labor Forcein in Hunters Creek Village.
What is the Percentage of People in the Labor Force in Hunters Creek Village?
56.4% of People are in the Labor Force in Hunters Creek Village.
What is the Unemployment Rate in Hunters Creek Village?
Unemployment Rate in Hunters Creek Village is 8.9%.