Fisher Island, FL Map & Demographics
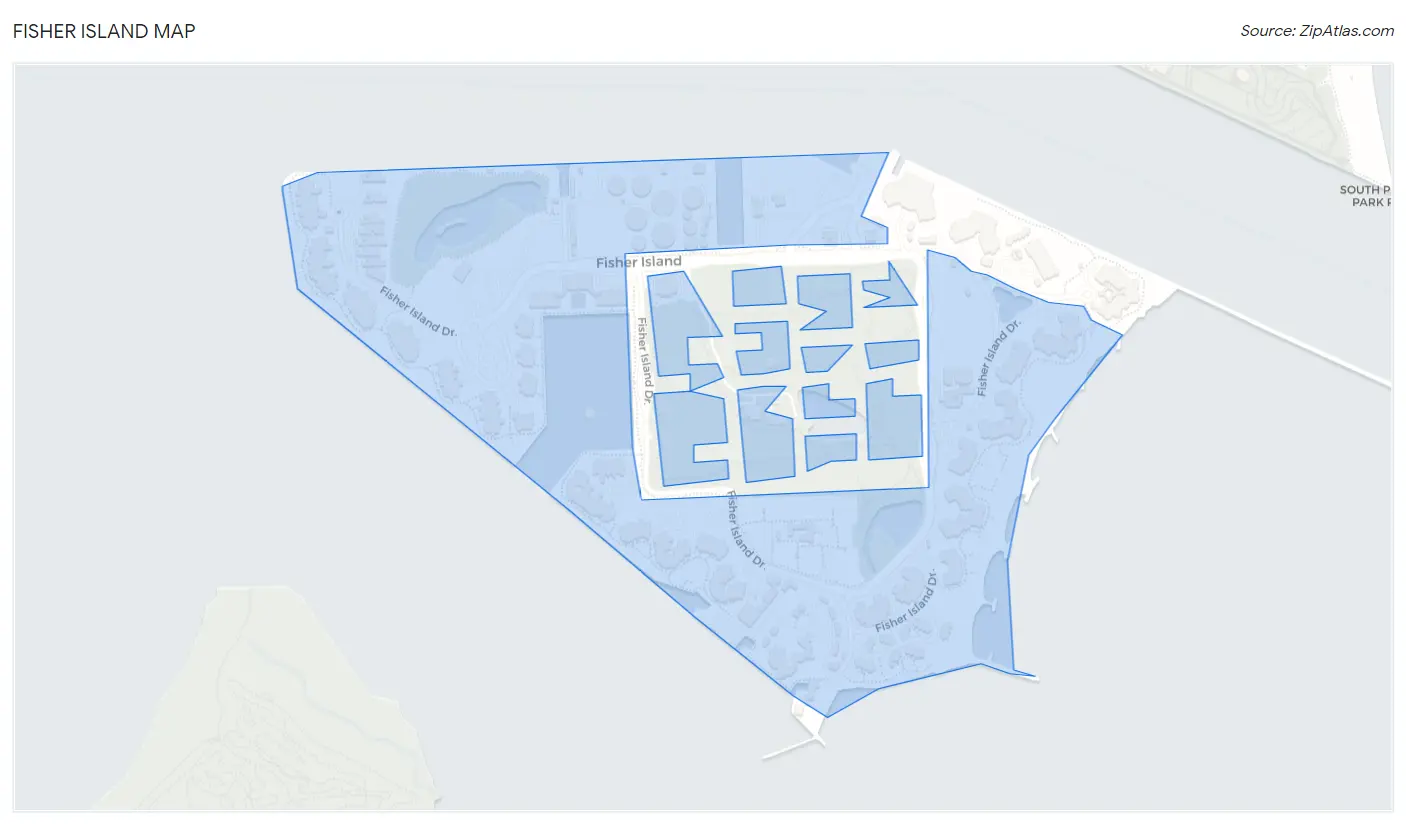
Fisher Island Map
Fisher Island Overview
$418,363
PER CAPITA INCOME
$250,001
AVG FAMILY INCOME
$250,001
AVG HOUSEHOLD INCOME
0.39
INEQUALITY / GINI INDEX
681
TOTAL POPULATION
358
MALE POPULATION
323
FEMALE POPULATION
110.84
MALES / 100 FEMALES
90.22
FEMALES / 100 MALES
57.0
MEDIAN AGE
2.6
AVG FAMILY SIZE
2.4
AVG HOUSEHOLD SIZE
282
LABOR FORCE [ PEOPLE ]
48.3%
PERCENT IN LABOR FORCE
Income in Fisher Island
Income Overview in Fisher Island
Per Capita Income in Fisher Island is $418,363, while median incomes of families and households are $250,001 and $250,001 respectively.
| Characteristic | Number | Measure |
| Per Capita Income | 681 | $418,363 |
| Median Family Income | 210 | $250,001 |
| Mean Family Income | 210 | $1,022,210 |
| Median Household Income | 283 | $250,001 |
| Mean Household Income | 283 | $1,004,349 |
| Income Deficit | 210 | $0 |
| Wage / Income Gap (%) | 681 | 0.00% |
| Wage / Income Gap ($) | 681 | 100.00¢ per $1 |
| Gini / Inequality Index | 681 | 0.39 |
Earnings by Sex in Fisher Island
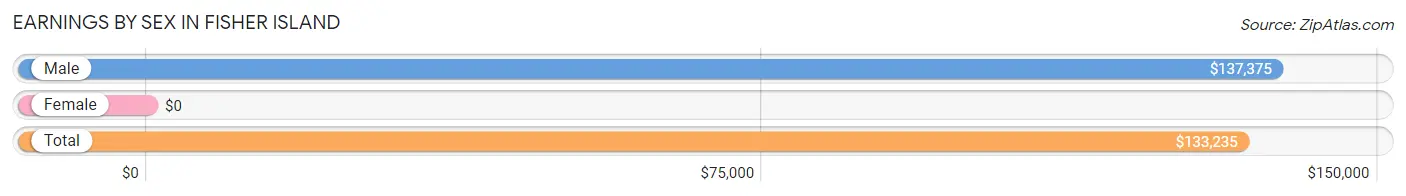
| Sex | Number | Average Earnings |
| Male | 226 (60.8%) | $137,375 |
| Female | 146 (39.3%) | $0 |
| Total | 372 (100.0%) | $133,235 |
Earnings by Sex by Income Bracket in Fisher Island
The most common earnings brackets in Fisher Island are $100,000+ for men (132 | 58.4%) and $100,000+ for women (59 | 40.4%).
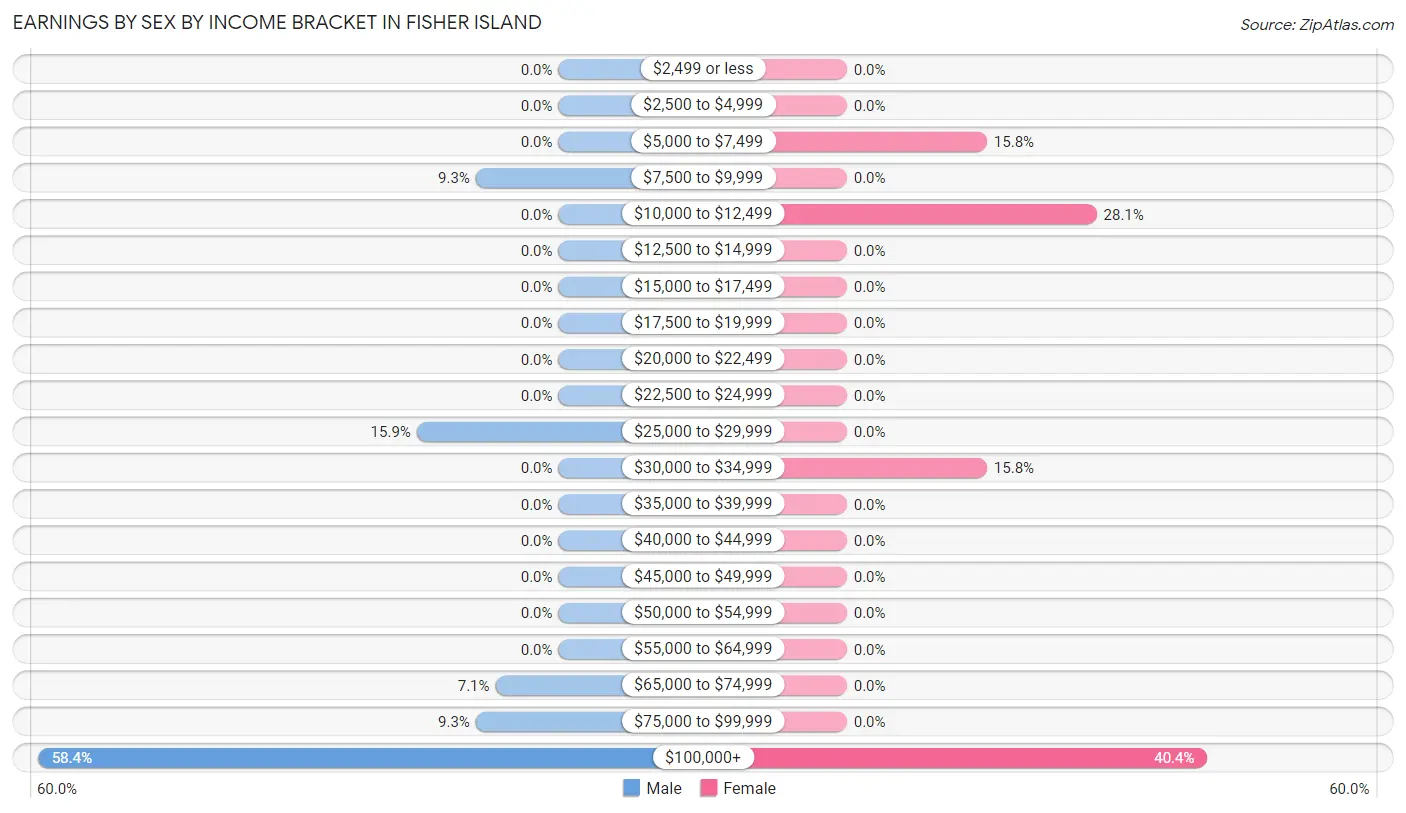
| Income | Male | Female |
| $2,499 or less | 0 (0.0%) | 0 (0.0%) |
| $2,500 to $4,999 | 0 (0.0%) | 0 (0.0%) |
| $5,000 to $7,499 | 0 (0.0%) | 23 (15.8%) |
| $7,500 to $9,999 | 21 (9.3%) | 0 (0.0%) |
| $10,000 to $12,499 | 0 (0.0%) | 41 (28.1%) |
| $12,500 to $14,999 | 0 (0.0%) | 0 (0.0%) |
| $15,000 to $17,499 | 0 (0.0%) | 0 (0.0%) |
| $17,500 to $19,999 | 0 (0.0%) | 0 (0.0%) |
| $20,000 to $22,499 | 0 (0.0%) | 0 (0.0%) |
| $22,500 to $24,999 | 0 (0.0%) | 0 (0.0%) |
| $25,000 to $29,999 | 36 (15.9%) | 0 (0.0%) |
| $30,000 to $34,999 | 0 (0.0%) | 23 (15.8%) |
| $35,000 to $39,999 | 0 (0.0%) | 0 (0.0%) |
| $40,000 to $44,999 | 0 (0.0%) | 0 (0.0%) |
| $45,000 to $49,999 | 0 (0.0%) | 0 (0.0%) |
| $50,000 to $54,999 | 0 (0.0%) | 0 (0.0%) |
| $55,000 to $64,999 | 0 (0.0%) | 0 (0.0%) |
| $65,000 to $74,999 | 16 (7.1%) | 0 (0.0%) |
| $75,000 to $99,999 | 21 (9.3%) | 0 (0.0%) |
| $100,000+ | 132 (58.4%) | 59 (40.4%) |
| Total | 226 (100.0%) | 146 (100.0%) |
Earnings by Sex by Educational Attainment in Fisher Island
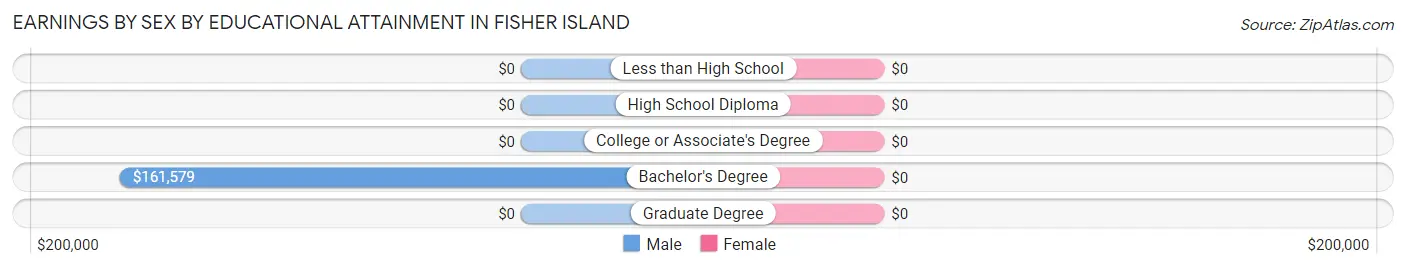
| Educational Attainment | Male Income | Female Income |
| Less than High School | - | - |
| High School Diploma | - | - |
| College or Associate's Degree | - | - |
| Bachelor's Degree | $161,579 | $0 |
| Graduate Degree | - | - |
| Total | $137,375 | $0 |
Family Income in Fisher Island
Family Income Brackets in Fisher Island
According to the Fisher Island family income data, there are 180 families falling into the $200,000+ income range, which is the most common income bracket and makes up 85.7% of all families.
| Income Bracket | # Families | % Families |
| Less than $10,000 | 0 | 0.0% |
| $10,000 to $14,999 | 0 | 0.0% |
| $15,000 to $24,999 | 11 | 5.2% |
| $25,000 to $34,999 | 0 | 0.0% |
| $35,000 to $49,999 | 0 | 0.0% |
| $50,000 to $74,999 | 19 | 9.0% |
| $75,000 to $99,999 | 0 | 0.0% |
| $100,000 to $149,999 | 0 | 0.0% |
| $150,000 to $199,999 | 0 | 0.0% |
| $200,000+ | 180 | 85.7% |
Family Income by Famaliy Size in Fisher Island
2-person families (150 | 71.4%) account for the highest median family income in Fisher Island with $250,001 per family, while 2-person families (150 | 71.4%) have the highest median income of $125,000 per family member.
| Income Bracket | # Families | Median Income |
| 2-Person Families | 150 (71.4%) | $250,001 |
| 3-Person Families | 40 (19.1%) | $0 |
| 4-Person Families | 20 (9.5%) | $0 |
| 5-Person Families | 0 (0.0%) | $0 |
| 6-Person Families | 0 (0.0%) | $0 |
| 7+ Person Families | 0 (0.0%) | $0 |
| Total | 210 (100.0%) | $250,001 |
Family Income by Number of Earners in Fisher Island
| Number of Earners | # Families | Median Income |
| No Earners | 41 (19.5%) | $250,001 |
| 1 Earner | 110 (52.4%) | $250,001 |
| 2 Earners | 59 (28.1%) | $0 |
| 3+ Earners | 0 (0.0%) | $0 |
| Total | 210 (100.0%) | $250,001 |
Household Income in Fisher Island
Household Income Brackets in Fisher Island
With 253 households falling in the category, the $200,000+ income range is the most frequent in Fisher Island, accounting for 89.4% of all households.
| Income Bracket | # Households | % Households |
| Less than $10,000 | 0 | 0.0% |
| $10,000 to $14,999 | 0 | 0.0% |
| $15,000 to $24,999 | 11 | 3.9% |
| $25,000 to $34,999 | 0 | 0.0% |
| $35,000 to $49,999 | 0 | 0.0% |
| $50,000 to $74,999 | 0 | 0.0% |
| $75,000 to $99,999 | 19 | 6.7% |
| $100,000 to $149,999 | 0 | 0.0% |
| $150,000 to $199,999 | 0 | 0.0% |
| $200,000+ | 253 | 89.4% |
Household Income by Householder Age in Fisher Island
The median household income in Fisher Island is $250,001, with the highest median household income of $250,001 found in the 45 to 64 years age bracket for the primary householder. A total of 79 households (27.9%) fall into this category.
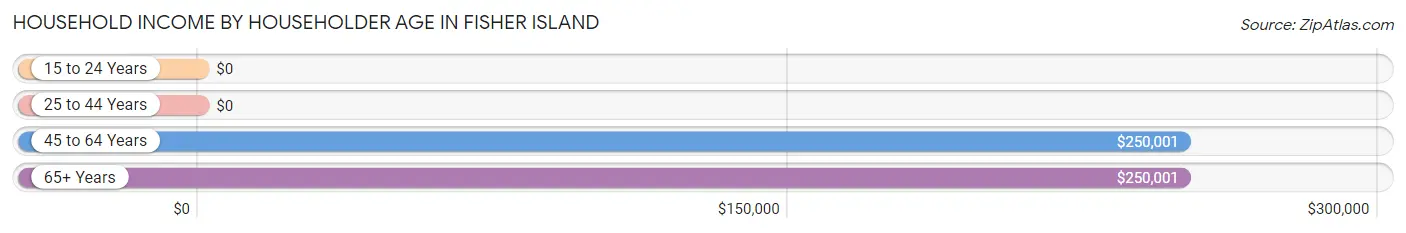
| Income Bracket | # Households | Median Income |
| 15 to 24 Years | 0 (0.0%) | $0 |
| 25 to 44 Years | 41 (14.5%) | $0 |
| 45 to 64 Years | 79 (27.9%) | $250,001 |
| 65+ Years | 163 (57.6%) | $250,001 |
| Total | 283 (100.0%) | $250,001 |
Poverty in Fisher Island
Income Below Poverty by Sex and Age in Fisher Island
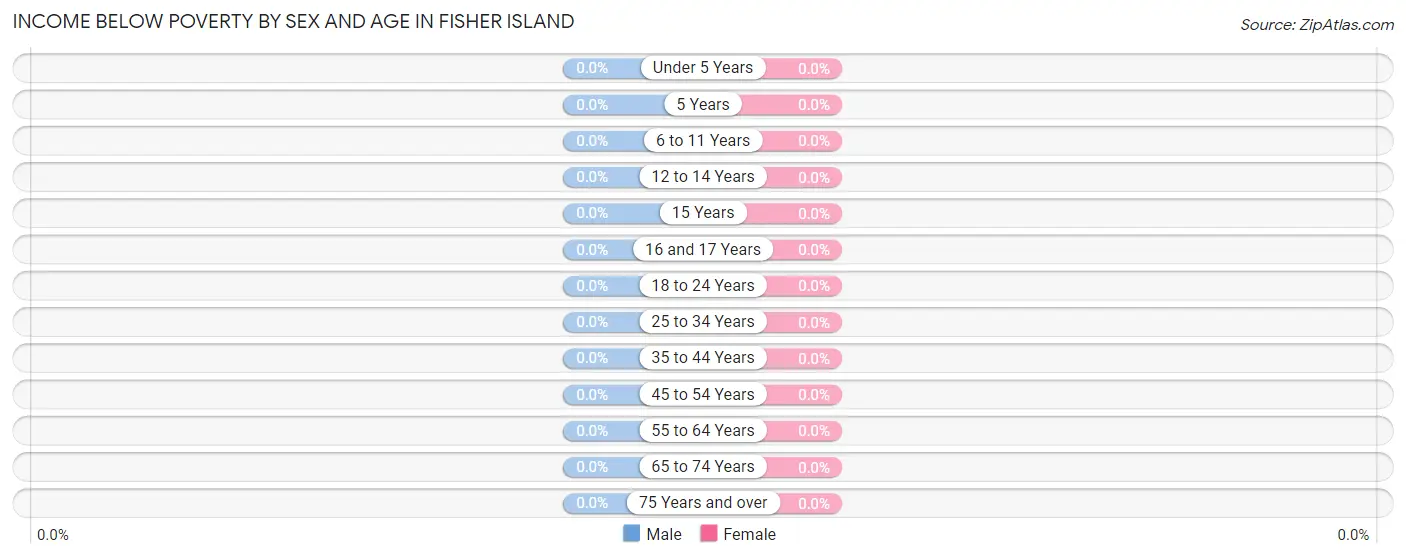
| Age Bracket | Male | Female |
| Under 5 Years | 0 (0.0%) | 0 (0.0%) |
| 5 Years | 0 (0.0%) | 0 (0.0%) |
| 6 to 11 Years | 0 (0.0%) | 0 (0.0%) |
| 12 to 14 Years | 0 (0.0%) | 0 (0.0%) |
| 15 Years | 0 (0.0%) | 0 (0.0%) |
| 16 and 17 Years | 0 (0.0%) | 0 (0.0%) |
| 18 to 24 Years | 0 (0.0%) | 0 (0.0%) |
| 25 to 34 Years | 0 (0.0%) | 0 (0.0%) |
| 35 to 44 Years | 0 (0.0%) | 0 (0.0%) |
| 45 to 54 Years | 0 (0.0%) | 0 (0.0%) |
| 55 to 64 Years | 0 (0.0%) | 0 (0.0%) |
| 65 to 74 Years | 0 (0.0%) | 0 (0.0%) |
| 75 Years and over | 0 (0.0%) | 0 (0.0%) |
| Total | 0 (0.0%) | 0 (0.0%) |
Income Above Poverty by Sex and Age in Fisher Island
According to the poverty statistics in Fisher Island, males aged under 5 years and females aged under 5 years are the age groups that are most secure financially, with 100.0% of males and 100.0% of females in these age groups living above the poverty line.
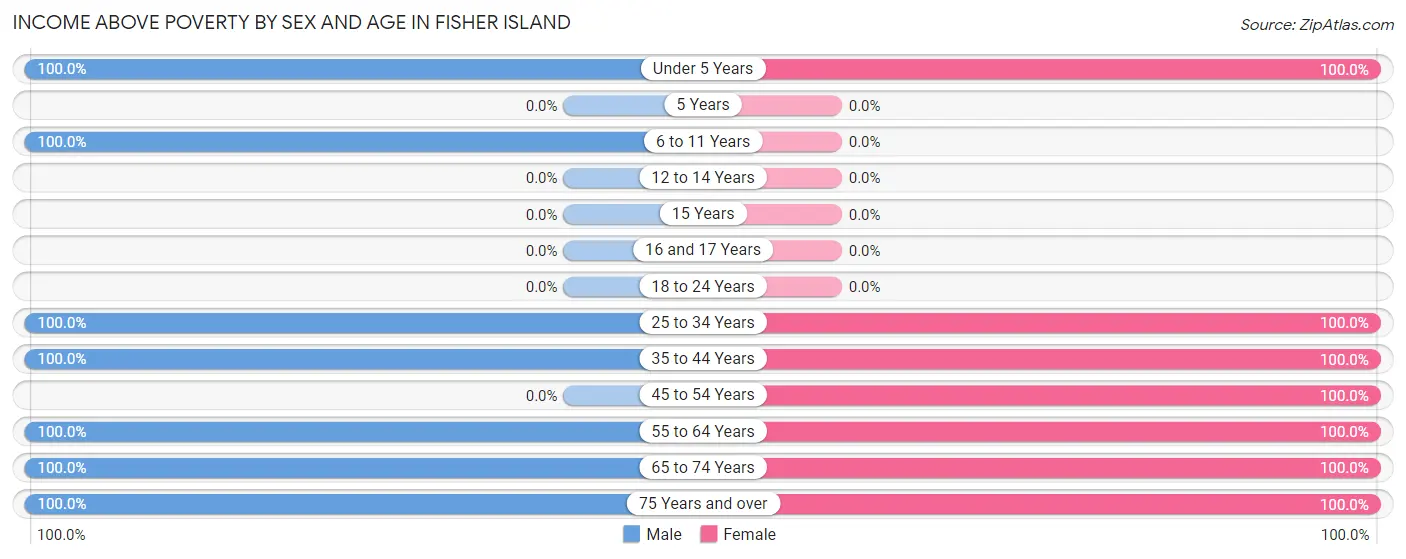
| Age Bracket | Male | Female |
| Under 5 Years | 33 (100.0%) | 34 (100.0%) |
| 5 Years | 0 (0.0%) | 0 (0.0%) |
| 6 to 11 Years | 30 (100.0%) | 0 (0.0%) |
| 12 to 14 Years | 0 (0.0%) | 0 (0.0%) |
| 15 Years | 0 (0.0%) | 0 (0.0%) |
| 16 and 17 Years | 0 (0.0%) | 0 (0.0%) |
| 18 to 24 Years | 0 (0.0%) | 0 (0.0%) |
| 25 to 34 Years | 20 (100.0%) | 46 (100.0%) |
| 35 to 44 Years | 42 (100.0%) | 19 (100.0%) |
| 45 to 54 Years | 0 (0.0%) | 104 (100.0%) |
| 55 to 64 Years | 61 (100.0%) | 12 (100.0%) |
| 65 to 74 Years | 98 (100.0%) | 78 (100.0%) |
| 75 Years and over | 74 (100.0%) | 30 (100.0%) |
| Total | 358 (100.0%) | 323 (100.0%) |
Income Below Poverty Among Married-Couple Families in Fisher Island
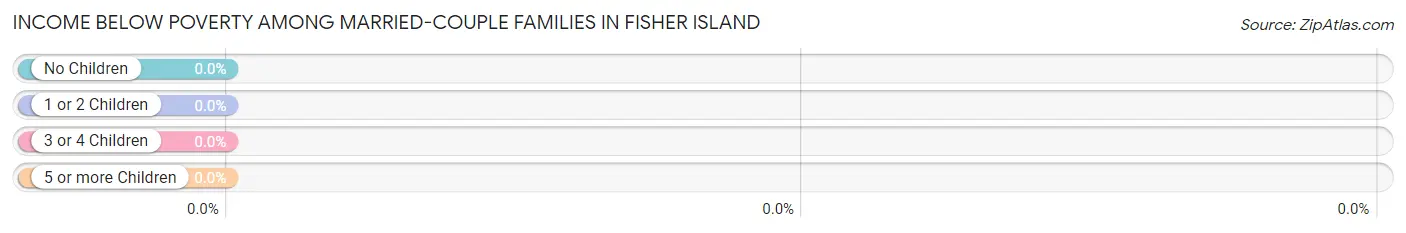
| Children | Above Poverty | Below Poverty |
| No Children | 169 (100.0%) | 0 (0.0%) |
| 1 or 2 Children | 41 (100.0%) | 0 (0.0%) |
| 3 or 4 Children | 0 (0.0%) | 0 (0.0%) |
| 5 or more Children | 0 (0.0%) | 0 (0.0%) |
| Total | 210 (100.0%) | 0 (0.0%) |
Income Below Poverty Among Single-Parent Households in Fisher Island
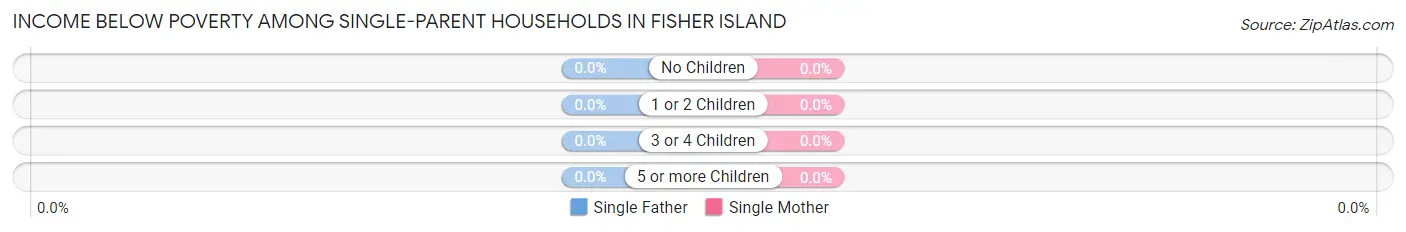
| Children | Single Father | Single Mother |
| No Children | 0 (0.0%) | 0 (0.0%) |
| 1 or 2 Children | 0 (0.0%) | 0 (0.0%) |
| 3 or 4 Children | 0 (0.0%) | 0 (0.0%) |
| 5 or more Children | 0 (0.0%) | 0 (0.0%) |
| Total | 0 (0.0%) | 0 (0.0%) |
Income Below Poverty Among Married-Couple vs Single-Parent Households in Fisher Island
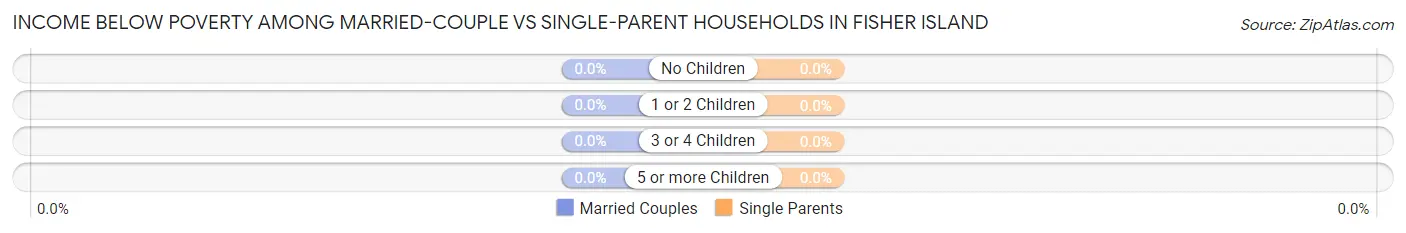
| Children | Married-Couple Families | Single-Parent Households |
| No Children | 0 (0.0%) | 0 (0.0%) |
| 1 or 2 Children | 0 (0.0%) | 0 (0.0%) |
| 3 or 4 Children | 0 (0.0%) | 0 (0.0%) |
| 5 or more Children | 0 (0.0%) | 0 (0.0%) |
| Total | 0 (0.0%) | 0 (0.0%) |
Race in Fisher Island
The most populous races in Fisher Island are White / Caucasian (657 | 96.5%), Asian (24 | 3.5%), and Hispanic or Latino (17 | 2.5%).
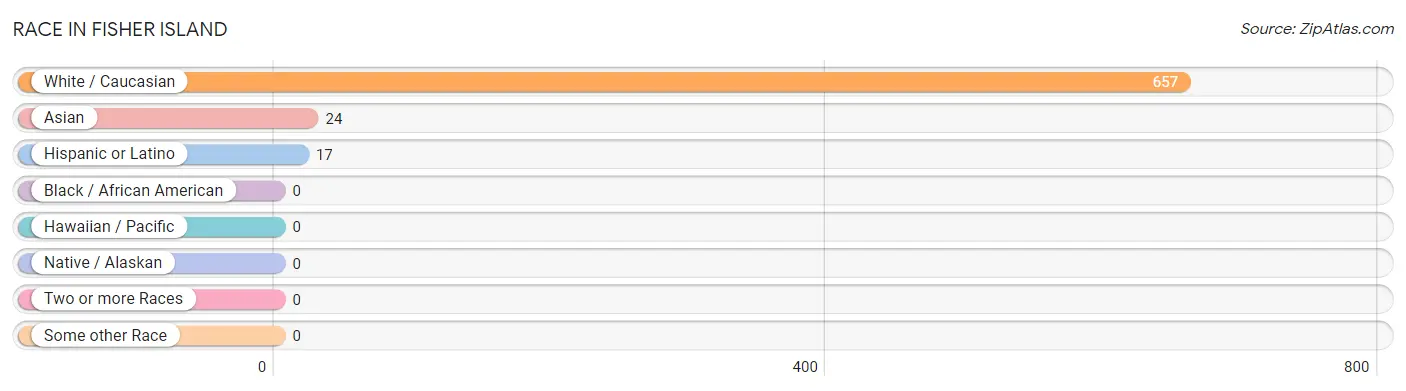
| Race | # Population | % Population |
| Asian | 24 | 3.5% |
| Black / African American | 0 | 0.0% |
| Hawaiian / Pacific | 0 | 0.0% |
| Hispanic or Latino | 17 | 2.5% |
| Native / Alaskan | 0 | 0.0% |
| White / Caucasian | 657 | 96.5% |
| Two or more Races | 0 | 0.0% |
| Some other Race | 0 | 0.0% |
| Total | 681 | 100.0% |
Ancestry in Fisher Island
The most populous ancestries reported in Fisher Island are Russian (212 | 31.1%), Irish (87 | 12.8%), English (82 | 12.0%), European (42 | 6.2%), and Hungarian (29 | 4.3%), together accounting for 66.4% of all Fisher Island residents.
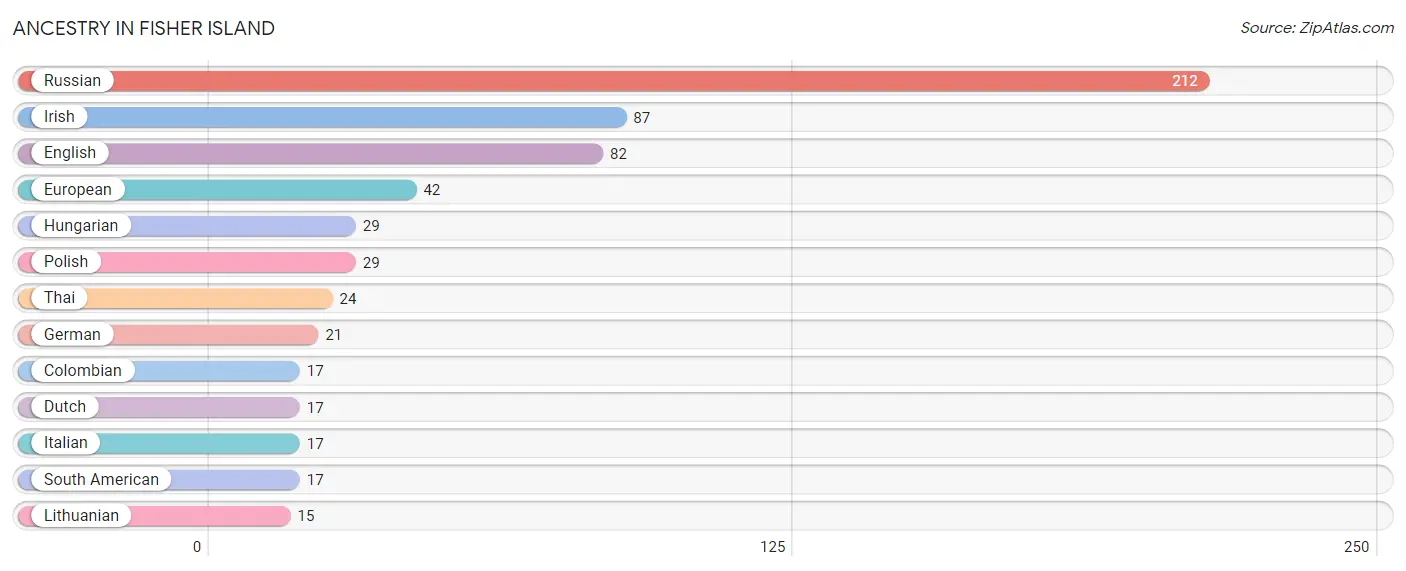
| Ancestry | # Population | % Population |
| Colombian | 17 | 2.5% |
| Dutch | 17 | 2.5% |
| English | 82 | 12.0% |
| European | 42 | 6.2% |
| German | 21 | 3.1% |
| Hungarian | 29 | 4.3% |
| Irish | 87 | 12.8% |
| Italian | 17 | 2.5% |
| Lithuanian | 15 | 2.2% |
| Polish | 29 | 4.3% |
| Russian | 212 | 31.1% |
| South American | 17 | 2.5% |
| Thai | 24 | 3.5% | View All 13 Rows |
Immigrants in Fisher Island
The most numerous immigrant groups reported in Fisher Island came from Europe (65 | 9.5%), Asia (58 | 8.5%), South Central Asia (47 | 6.9%), Northern Europe (45 | 6.6%), and India (24 | 3.5%), together accounting for 35.1% of all Fisher Island residents.
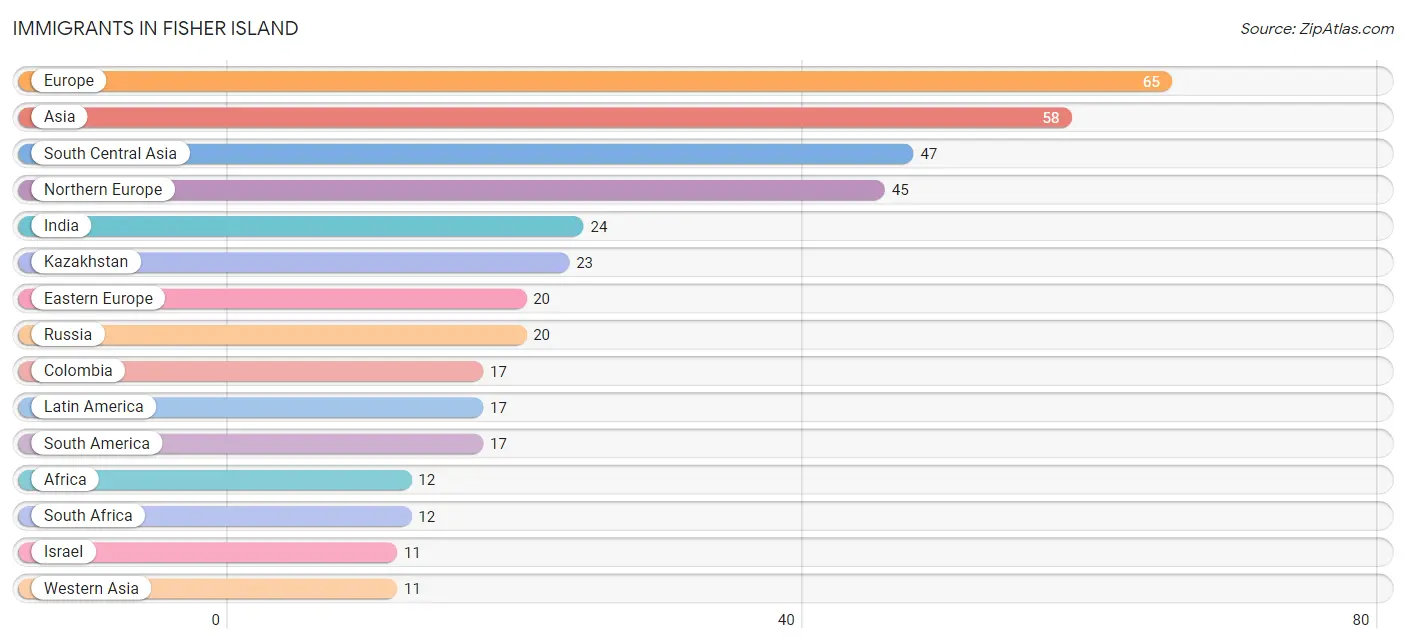
| Immigration Origin | # Population | % Population |
| Africa | 12 | 1.8% |
| Asia | 58 | 8.5% |
| Colombia | 17 | 2.5% |
| Eastern Europe | 20 | 2.9% |
| Europe | 65 | 9.5% |
| India | 24 | 3.5% |
| Israel | 11 | 1.6% |
| Kazakhstan | 23 | 3.4% |
| Latin America | 17 | 2.5% |
| Northern Europe | 45 | 6.6% |
| Russia | 20 | 2.9% |
| South Africa | 12 | 1.8% |
| South America | 17 | 2.5% |
| South Central Asia | 47 | 6.9% |
| Western Asia | 11 | 1.6% | View All 15 Rows |
Sex and Age in Fisher Island
Sex and Age in Fisher Island
The most populous age groups in Fisher Island are 70 to 74 Years (87 | 24.3%) for men and 50 to 54 Years (104 | 32.2%) for women.
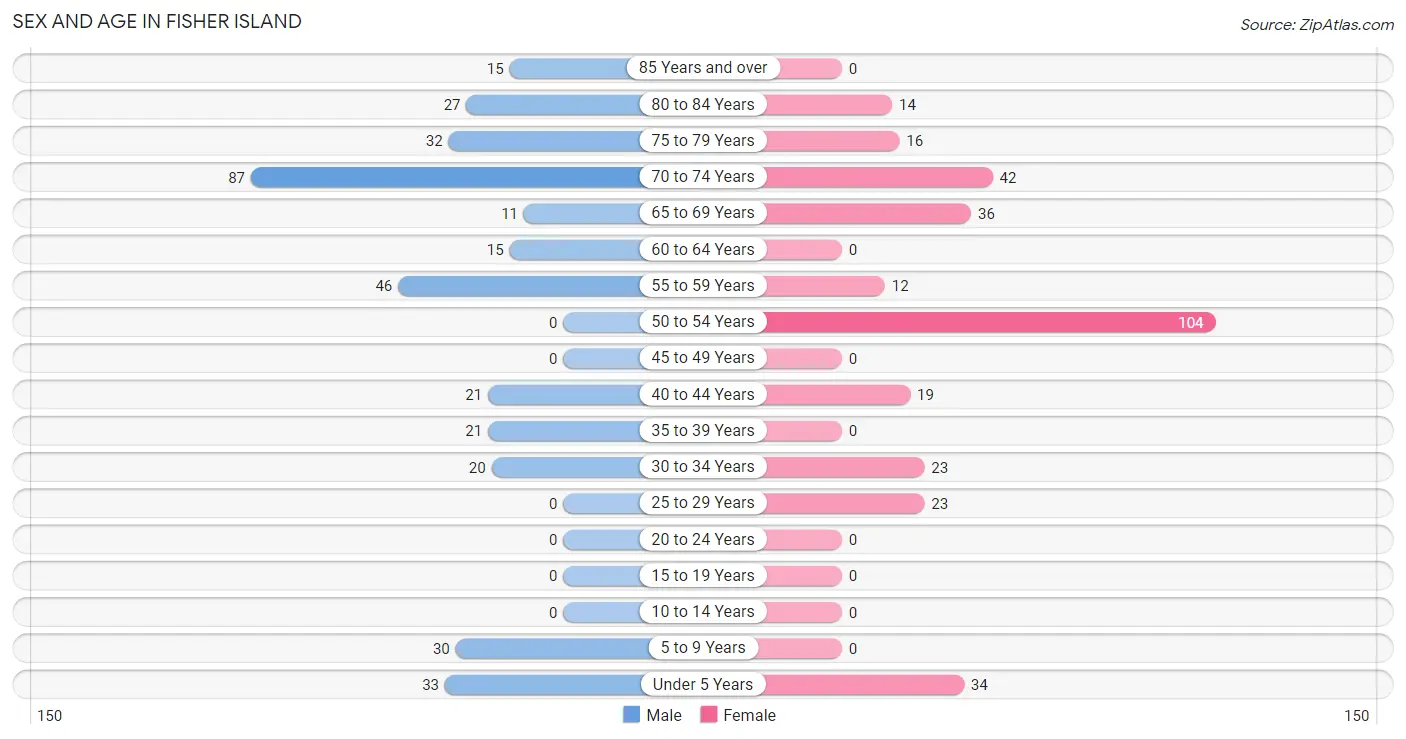
| Age Bracket | Male | Female |
| Under 5 Years | 33 (9.2%) | 34 (10.5%) |
| 5 to 9 Years | 30 (8.4%) | 0 (0.0%) |
| 10 to 14 Years | 0 (0.0%) | 0 (0.0%) |
| 15 to 19 Years | 0 (0.0%) | 0 (0.0%) |
| 20 to 24 Years | 0 (0.0%) | 0 (0.0%) |
| 25 to 29 Years | 0 (0.0%) | 23 (7.1%) |
| 30 to 34 Years | 20 (5.6%) | 23 (7.1%) |
| 35 to 39 Years | 21 (5.9%) | 0 (0.0%) |
| 40 to 44 Years | 21 (5.9%) | 19 (5.9%) |
| 45 to 49 Years | 0 (0.0%) | 0 (0.0%) |
| 50 to 54 Years | 0 (0.0%) | 104 (32.2%) |
| 55 to 59 Years | 46 (12.9%) | 12 (3.7%) |
| 60 to 64 Years | 15 (4.2%) | 0 (0.0%) |
| 65 to 69 Years | 11 (3.1%) | 36 (11.2%) |
| 70 to 74 Years | 87 (24.3%) | 42 (13.0%) |
| 75 to 79 Years | 32 (8.9%) | 16 (5.0%) |
| 80 to 84 Years | 27 (7.5%) | 14 (4.3%) |
| 85 Years and over | 15 (4.2%) | 0 (0.0%) |
| Total | 358 (100.0%) | 323 (100.0%) |
Families and Households in Fisher Island
Median Family Size in Fisher Island
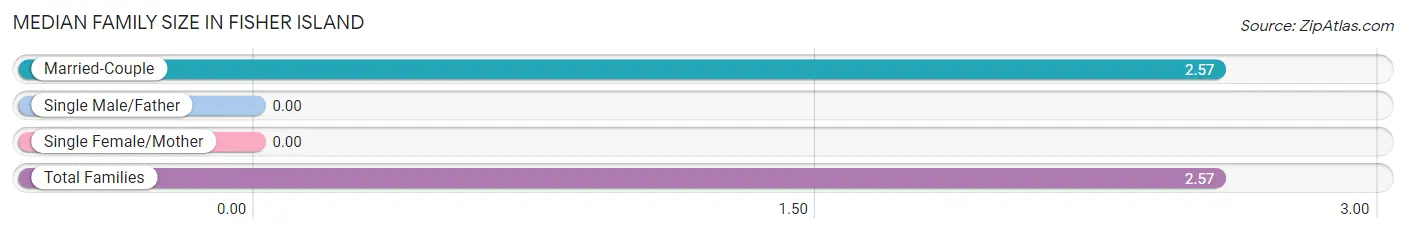
| Family Type | # Families | Family Size |
| Married-Couple | 210 (100.0%) | 2.57 |
| Single Male/Father | 0 (0.0%) | - |
| Single Female/Mother | 0 (0.0%) | - |
| Total Families | 210 (100.0%) | 2.57 |
Median Household Size in Fisher Island
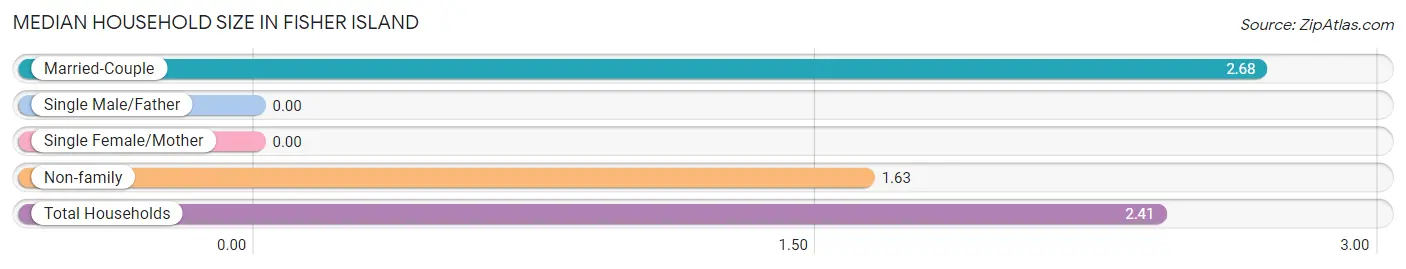
| Household Type | # Households | Household Size |
| Married-Couple | 210 (74.2%) | 2.68 |
| Single Male/Father | 0 (0.0%) | - |
| Single Female/Mother | 0 (0.0%) | - |
| Non-family | 73 (25.8%) | 1.63 |
| Total Households | 283 (100.0%) | 2.41 |
Household Size by Marriage Status in Fisher Island
Out of a total of 283 households in Fisher Island, 210 (74.2%) are family households, while 73 (25.8%) are nonfamily households. The most numerous type of family households are 2-person households, comprising 150, and the most common type of nonfamily households are 2-person households, comprising 45.
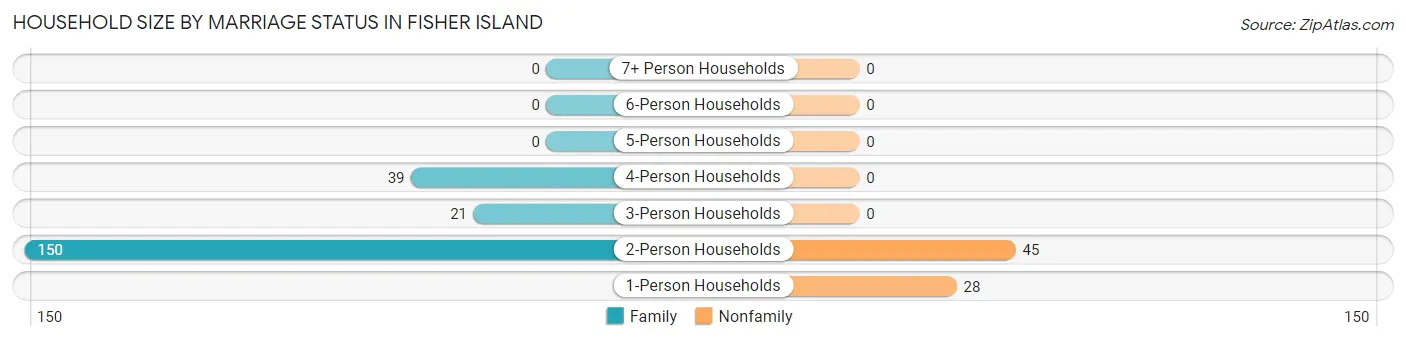
| Household Size | Family Households | Nonfamily Households |
| 1-Person Households | - | 28 (9.9%) |
| 2-Person Households | 150 (53.0%) | 45 (15.9%) |
| 3-Person Households | 21 (7.4%) | 0 (0.0%) |
| 4-Person Households | 39 (13.8%) | 0 (0.0%) |
| 5-Person Households | 0 (0.0%) | 0 (0.0%) |
| 6-Person Households | 0 (0.0%) | 0 (0.0%) |
| 7+ Person Households | 0 (0.0%) | 0 (0.0%) |
| Total | 210 (74.2%) | 73 (25.8%) |
Female Fertility in Fisher Island
Fertility by Age in Fisher Island
| Age Bracket | Women with Births | Births / 1,000 Women |
| 15 to 19 years | 0 (0.0%) | 0.0 |
| 20 to 34 years | 0 (0.0%) | 0.0 |
| 35 to 50 years | 0 (0.0%) | 0.0 |
| Total | 0 (0.0%) | 0.0 |
Fertility by Age by Marriage Status in Fisher Island
| Age Bracket | Married | Unmarried |
| 15 to 19 years | 0 (0.0%) | 0 (0.0%) |
| 20 to 34 years | 0 (0.0%) | 0 (0.0%) |
| 35 to 50 years | 0 (0.0%) | 0 (0.0%) |
| Total | 0 (0.0%) | 0 (0.0%) |
Fertility by Education in Fisher Island
| Educational Attainment | Women with Births | Births / 1,000 Women |
| Less than High School | 0 (0.0%) | 0.0 |
| High School Diploma | 0 (0.0%) | 0.0 |
| College or Associate's Degree | 0 (0.0%) | 0.0 |
| Bachelor's Degree | 0 (0.0%) | 0.0 |
| Graduate Degree | 0 (0.0%) | 0.0 |
| Total | 0 (0.0%) | 0.0 |
Fertility by Education by Marriage Status in Fisher Island
| Educational Attainment | Married | Unmarried |
| Less than High School | 0 (0.0%) | 0 (0.0%) |
| High School Diploma | 0 (0.0%) | 0 (0.0%) |
| College or Associate's Degree | 0 (0.0%) | 0 (0.0%) |
| Bachelor's Degree | 0 (0.0%) | 0 (0.0%) |
| Graduate Degree | 0 (0.0%) | 0 (0.0%) |
| Total | 0 (0.0%) | 0 (0.0%) |
Employment Characteristics in Fisher Island
Employment by Class of Employer in Fisher Island
Among the 265 employed individuals in Fisher Island, self-employed (incorporated) (112 | 42.3%), private company employees (90 | 34.0%), and not-for-profit organizations (42 | 15.9%) make up the most common classes of employment.
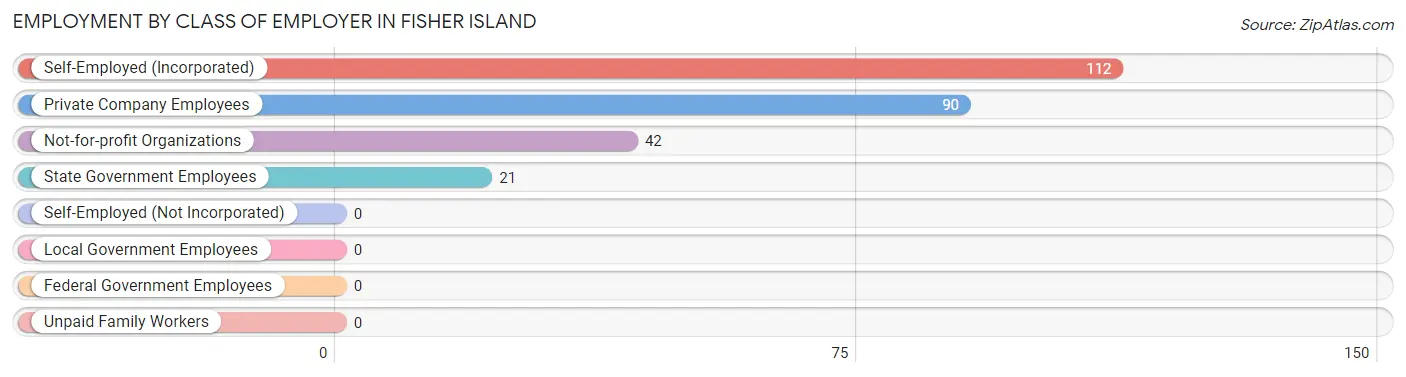
| Employer Class | # Employees | % Employees |
| Private Company Employees | 90 | 34.0% |
| Self-Employed (Incorporated) | 112 | 42.3% |
| Self-Employed (Not Incorporated) | 0 | 0.0% |
| Not-for-profit Organizations | 42 | 15.9% |
| Local Government Employees | 0 | 0.0% |
| State Government Employees | 21 | 7.9% |
| Federal Government Employees | 0 | 0.0% |
| Unpaid Family Workers | 0 | 0.0% |
| Total | 265 | 100.0% |
Employment Status by Age in Fisher Island
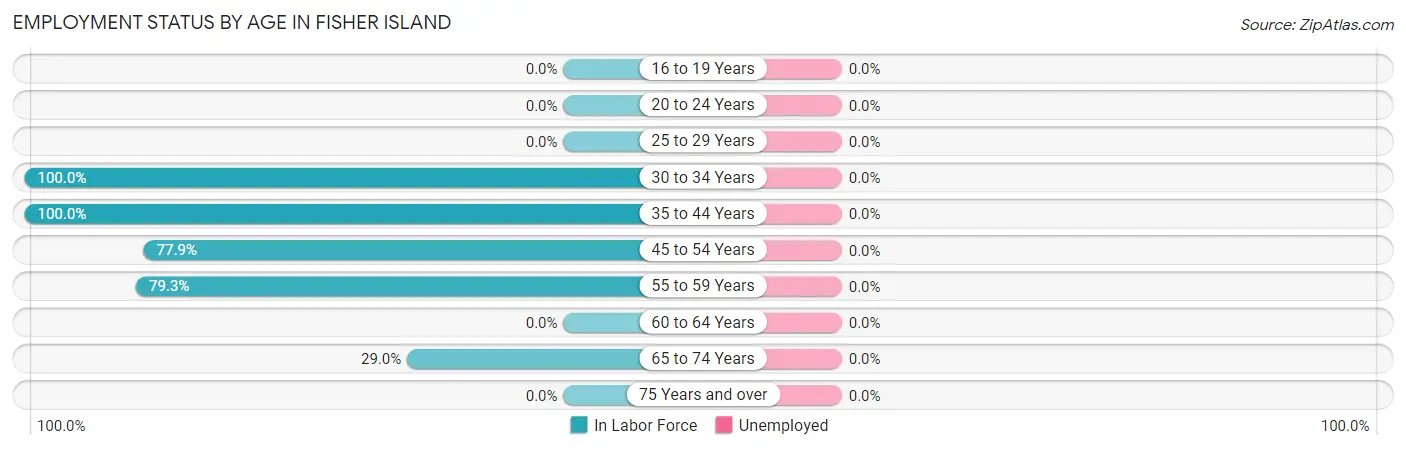
| Age Bracket | In Labor Force | Unemployed |
| 16 to 19 Years | 0 (0.0%) | 0 (0.0%) |
| 20 to 24 Years | 0 (0.0%) | 0 (0.0%) |
| 25 to 29 Years | 0 (0.0%) | 0 (0.0%) |
| 30 to 34 Years | 43 (100.0%) | 0 (0.0%) |
| 35 to 44 Years | 61 (100.0%) | 0 (0.0%) |
| 45 to 54 Years | 81 (77.9%) | 0 (0.0%) |
| 55 to 59 Years | 46 (79.3%) | 0 (0.0%) |
| 60 to 64 Years | 0 (0.0%) | 0 (0.0%) |
| 65 to 74 Years | 51 (29.0%) | 0 (0.0%) |
| 75 Years and over | 0 (0.0%) | 0 (0.0%) |
| Total | 282 (48.3%) | 0 (0.0%) |
Employment Status by Educational Attainment in Fisher Island
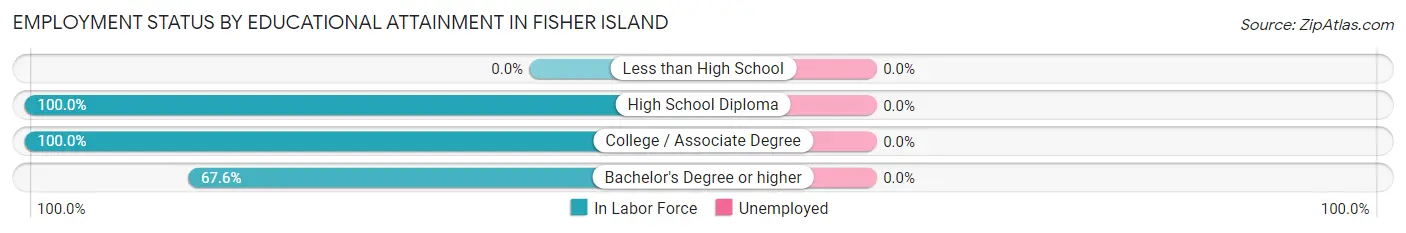
| Educational Attainment | In Labor Force | Unemployed |
| Less than High School | 0 (0.0%) | 0 (0.0%) |
| High School Diploma | 62 (100.0%) | 0 (0.0%) |
| College / Associate Degree | 17 (100.0%) | 0 (0.0%) |
| Bachelor's Degree or higher | 152 (67.6%) | 0 (0.0%) |
| Total | 231 (76.0%) | 0 (0.0%) |
Employment Occupations by Sex in Fisher Island
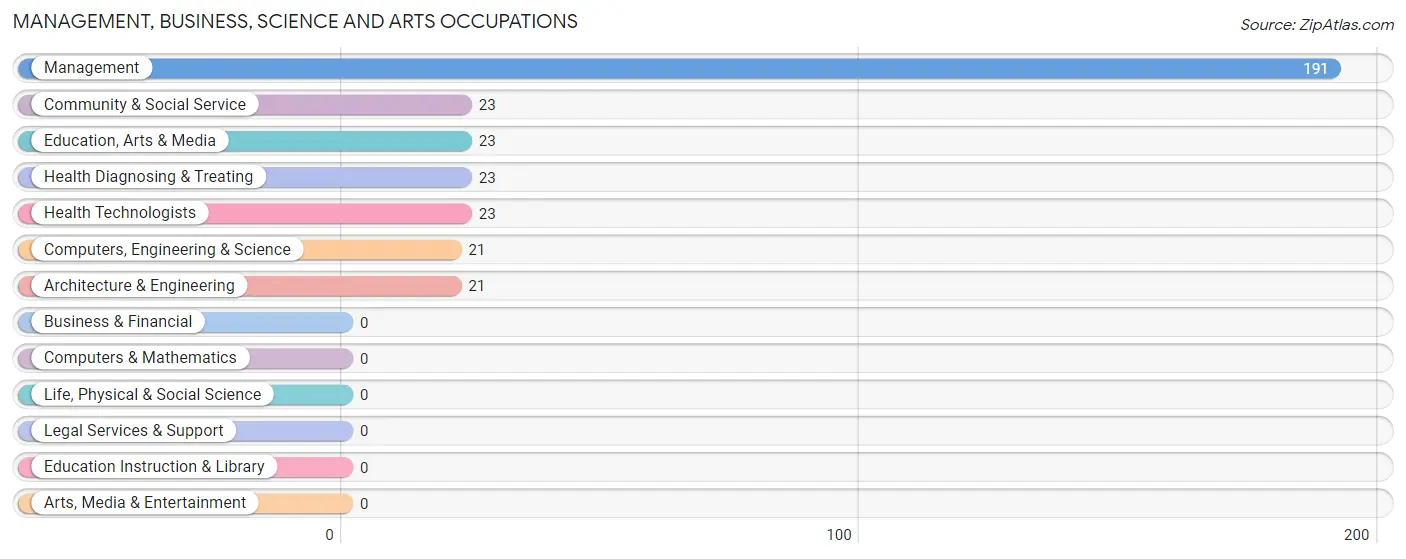
Management, Business, Science and Arts Occupations
The most common Management, Business, Science and Arts occupations in Fisher Island are Management (191 | 67.7%), Community & Social Service (23 | 8.2%), Education, Arts & Media (23 | 8.2%), Health Diagnosing & Treating (23 | 8.2%), and Health Technologists (23 | 8.2%).
Management, Business, Science and Arts Occupations by Sex
Within the Management, Business, Science and Arts occupations in Fisher Island, the most male-oriented occupations are Computers, Engineering & Science (100.0%), Architecture & Engineering (100.0%), and Management (47.6%), while the most female-oriented occupations are Community & Social Service (100.0%), Education, Arts & Media (100.0%), and Health Diagnosing & Treating (100.0%).
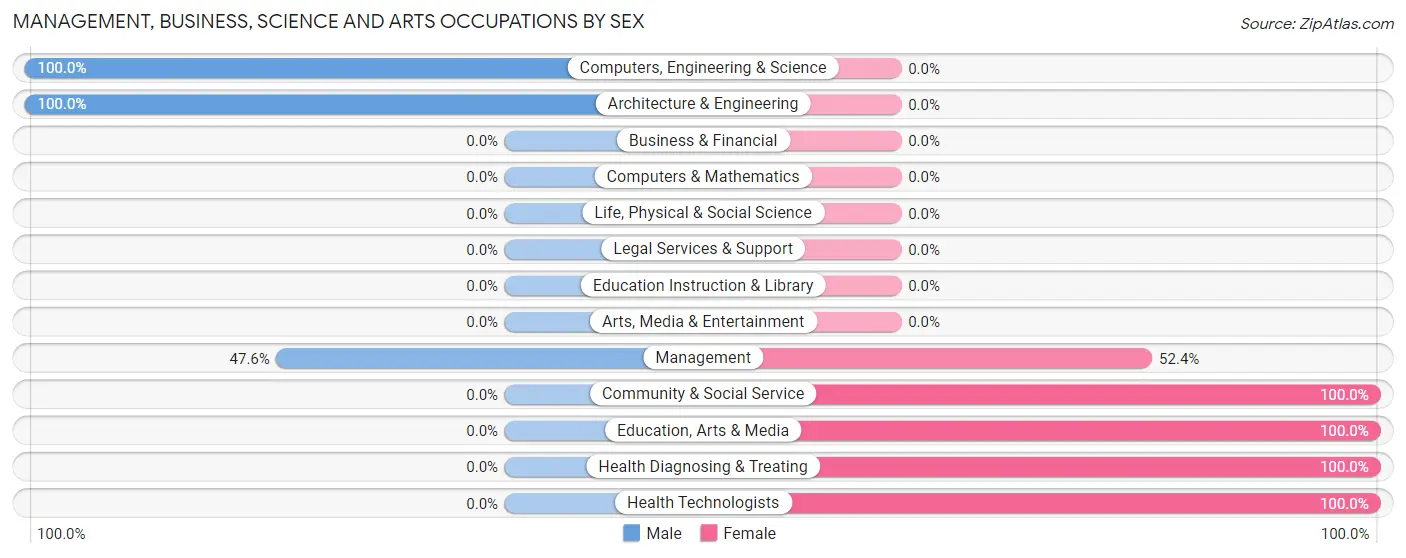
| Occupation | Male | Female |
| Management | 91 (47.6%) | 100 (52.4%) |
| Business & Financial | 0 (0.0%) | 0 (0.0%) |
| Computers, Engineering & Science | 21 (100.0%) | 0 (0.0%) |
| Computers & Mathematics | 0 (0.0%) | 0 (0.0%) |
| Architecture & Engineering | 21 (100.0%) | 0 (0.0%) |
| Life, Physical & Social Science | 0 (0.0%) | 0 (0.0%) |
| Community & Social Service | 0 (0.0%) | 23 (100.0%) |
| Education, Arts & Media | 0 (0.0%) | 23 (100.0%) |
| Legal Services & Support | 0 (0.0%) | 0 (0.0%) |
| Education Instruction & Library | 0 (0.0%) | 0 (0.0%) |
| Arts, Media & Entertainment | 0 (0.0%) | 0 (0.0%) |
| Health Diagnosing & Treating | 0 (0.0%) | 23 (100.0%) |
| Health Technologists | 0 (0.0%) | 23 (100.0%) |
| Total (Category) | 112 (43.4%) | 146 (56.6%) |
| Total (Overall) | 136 (48.2%) | 146 (51.8%) |
Services Occupations
Services Occupations by Sex
| Occupation | Male | Female |
| Healthcare Support | 0 (0.0%) | 0 (0.0%) |
| Security & Protection | 0 (0.0%) | 0 (0.0%) |
| Firefighting & Prevention | 0 (0.0%) | 0 (0.0%) |
| Law Enforcement | 0 (0.0%) | 0 (0.0%) |
| Food Preparation & Serving | 0 (0.0%) | 0 (0.0%) |
| Cleaning & Maintenance | 0 (0.0%) | 0 (0.0%) |
| Personal Care & Service | 0 (0.0%) | 0 (0.0%) |
| Total (Category) | 0 (0.0%) | 0 (0.0%) |
| Total (Overall) | 136 (48.2%) | 146 (51.8%) |
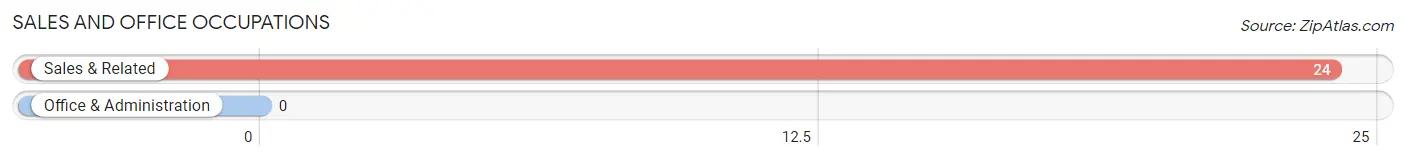
Sales and Office Occupations
The most common Sales and Office occupations in Fisher Island are , and Sales & Related (24 | 8.5%).
Sales and Office Occupations by Sex

| Occupation | Male | Female |
| Sales & Related | 24 (100.0%) | 0 (0.0%) |
| Office & Administration | 0 (0.0%) | 0 (0.0%) |
| Total (Category) | 24 (100.0%) | 0 (0.0%) |
| Total (Overall) | 136 (48.2%) | 146 (51.8%) |
Natural Resources, Construction and Maintenance Occupations
Natural Resources, Construction and Maintenance Occupations by Sex
| Occupation | Male | Female |
| Farming, Fishing & Forestry | 0 (0.0%) | 0 (0.0%) |
| Construction & Extraction | 0 (0.0%) | 0 (0.0%) |
| Installation, Maintenance & Repair | 0 (0.0%) | 0 (0.0%) |
| Total (Category) | 0 (0.0%) | 0 (0.0%) |
| Total (Overall) | 136 (48.2%) | 146 (51.8%) |
Production, Transportation and Moving Occupations
Production, Transportation and Moving Occupations by Sex
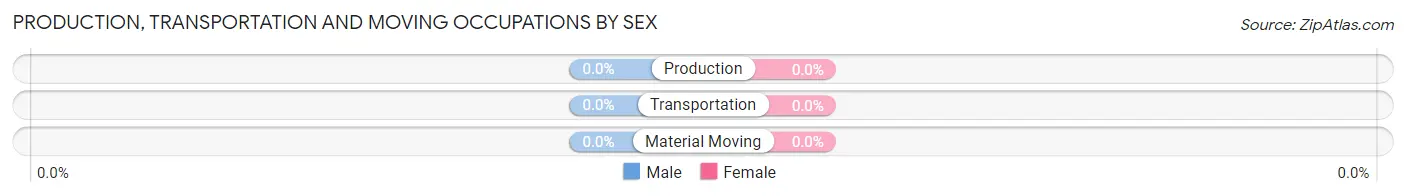
| Occupation | Male | Female |
| Production | 0 (0.0%) | 0 (0.0%) |
| Transportation | 0 (0.0%) | 0 (0.0%) |
| Material Moving | 0 (0.0%) | 0 (0.0%) |
| Total (Category) | 0 (0.0%) | 0 (0.0%) |
| Total (Overall) | 136 (48.2%) | 146 (51.8%) |
Employment Industries by Sex in Fisher Island
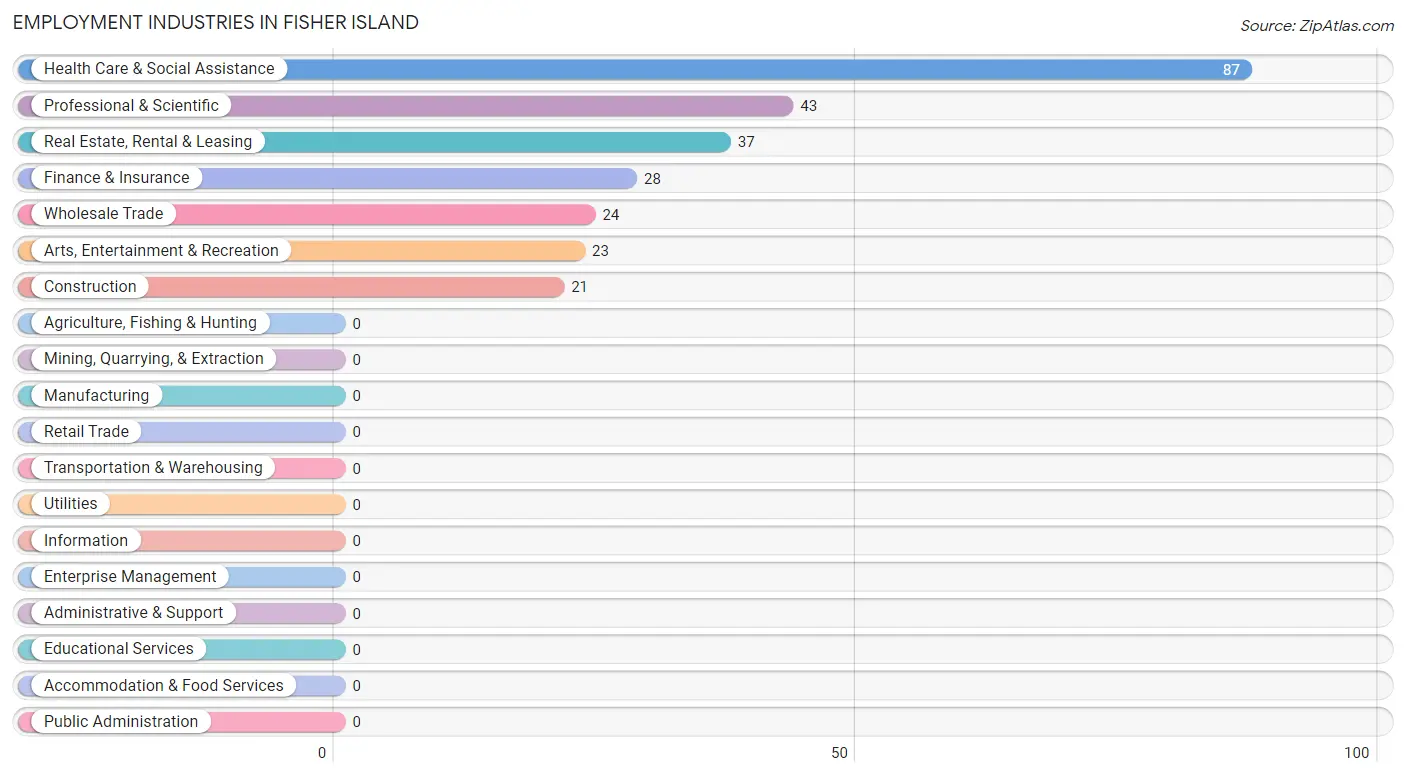
Employment Industries in Fisher Island
The major employment industries in Fisher Island include Health Care & Social Assistance (87 | 30.8%), Professional & Scientific (43 | 15.2%), Real Estate, Rental & Leasing (37 | 13.1%), Finance & Insurance (28 | 9.9%), and Wholesale Trade (24 | 8.5%).
Employment Industries by Sex in Fisher Island
The Fisher Island industries that see more men than women are Construction (100.0%), Wholesale Trade (100.0%), and Finance & Insurance (100.0%), whereas the industries that tend to have a higher number of women are Health Care & Social Assistance (100.0%), Arts, Entertainment & Recreation (100.0%), and Real Estate, Rental & Leasing (46.0%).
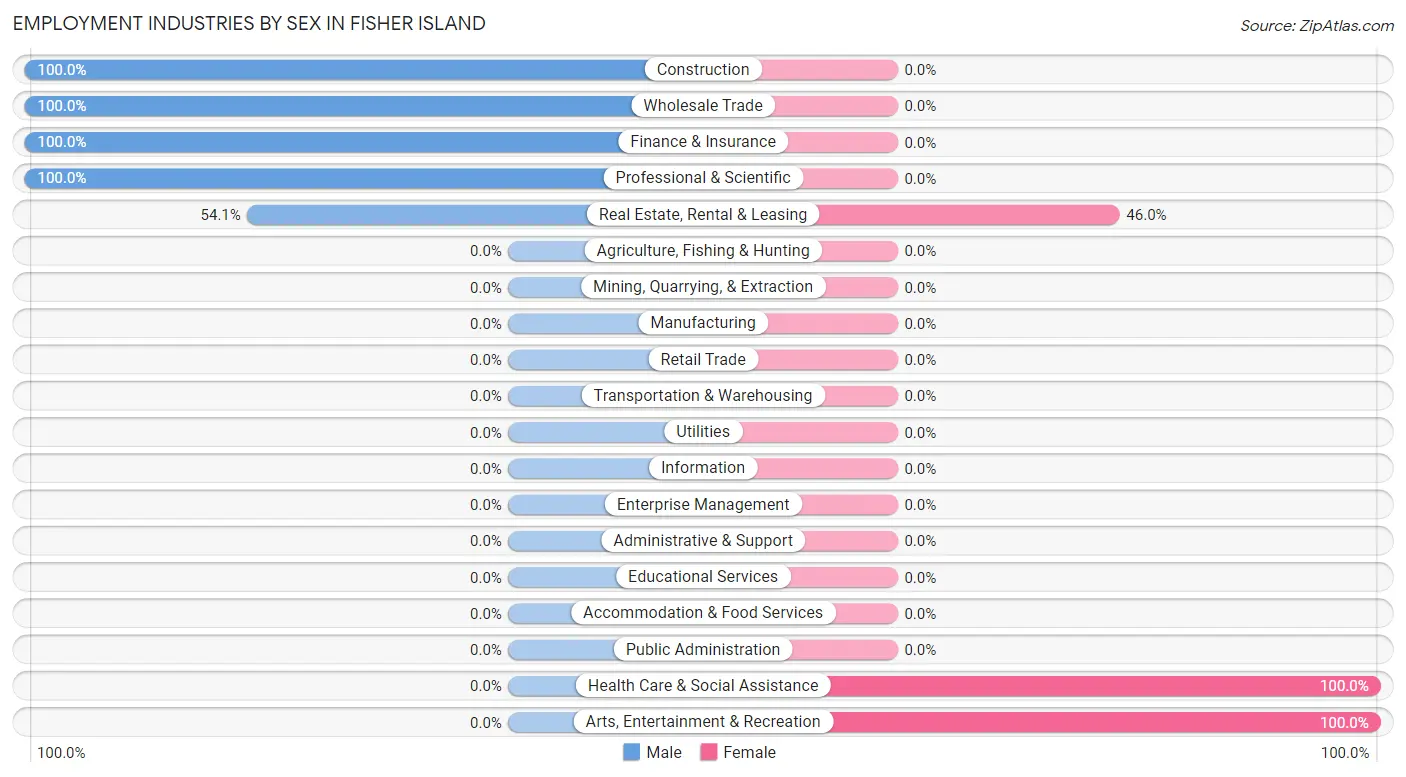
| Industry | Male | Female |
| Agriculture, Fishing & Hunting | 0 (0.0%) | 0 (0.0%) |
| Mining, Quarrying, & Extraction | 0 (0.0%) | 0 (0.0%) |
| Construction | 21 (100.0%) | 0 (0.0%) |
| Manufacturing | 0 (0.0%) | 0 (0.0%) |
| Wholesale Trade | 24 (100.0%) | 0 (0.0%) |
| Retail Trade | 0 (0.0%) | 0 (0.0%) |
| Transportation & Warehousing | 0 (0.0%) | 0 (0.0%) |
| Utilities | 0 (0.0%) | 0 (0.0%) |
| Information | 0 (0.0%) | 0 (0.0%) |
| Finance & Insurance | 28 (100.0%) | 0 (0.0%) |
| Real Estate, Rental & Leasing | 20 (54.0%) | 17 (46.0%) |
| Professional & Scientific | 43 (100.0%) | 0 (0.0%) |
| Enterprise Management | 0 (0.0%) | 0 (0.0%) |
| Administrative & Support | 0 (0.0%) | 0 (0.0%) |
| Educational Services | 0 (0.0%) | 0 (0.0%) |
| Health Care & Social Assistance | 0 (0.0%) | 87 (100.0%) |
| Arts, Entertainment & Recreation | 0 (0.0%) | 23 (100.0%) |
| Accommodation & Food Services | 0 (0.0%) | 0 (0.0%) |
| Public Administration | 0 (0.0%) | 0 (0.0%) |
| Total | 136 (48.2%) | 146 (51.8%) |
Education in Fisher Island
School Enrollment in Fisher Island
The most common levels of schooling among the 80 students in Fisher Island are nursery / preschool (33 | 41.2%), kindergarten (30 | 37.5%), and college / undergraduate (17 | 21.2%).
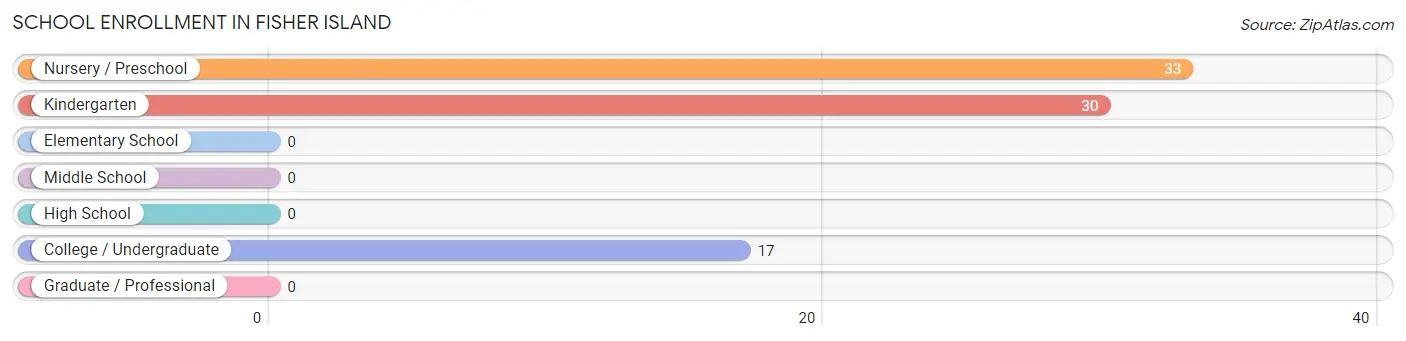
| School Level | # Students | % Students |
| Nursery / Preschool | 33 | 41.2% |
| Kindergarten | 30 | 37.5% |
| Elementary School | 0 | 0.0% |
| Middle School | 0 | 0.0% |
| High School | 0 | 0.0% |
| College / Undergraduate | 17 | 21.2% |
| Graduate / Professional | 0 | 0.0% |
| Total | 80 | 100.0% |
School Enrollment by Age by Funding Source in Fisher Island
Out of a total of 80 students who are enrolled in schools in Fisher Island, 33 (41.3%) attend a private institution, while the remaining 47 (58.7%) are enrolled in public schools. The age group of 3 to 4 year olds has the highest likelihood of being enrolled in private schools, with 33 (100.0% in the age bracket) enrolled. Conversely, the age group of 5 to 9 year old has the lowest likelihood of being enrolled in a private school, with 30 (100.0% in the age bracket) attending a public institution.
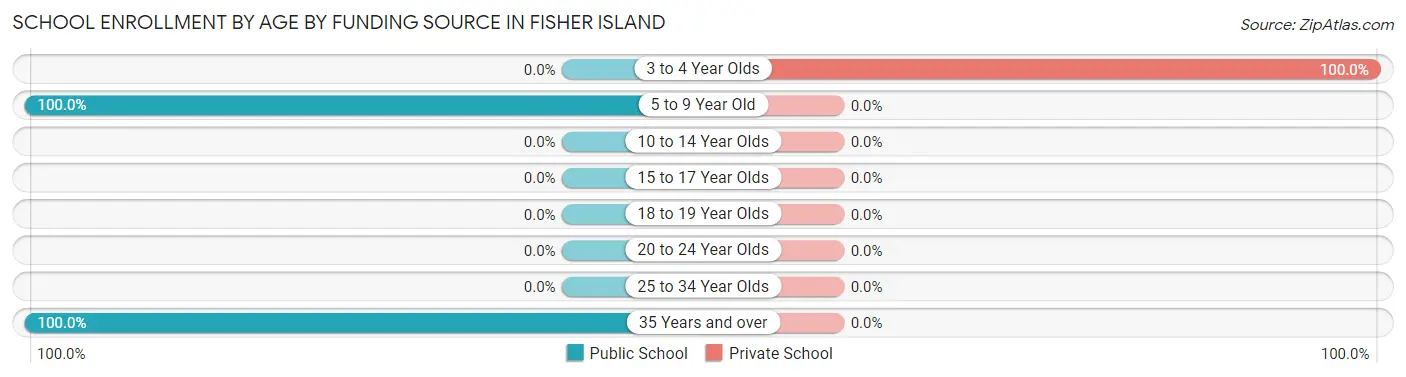
| Age Bracket | Public School | Private School |
| 3 to 4 Year Olds | 0 (0.0%) | 33 (100.0%) |
| 5 to 9 Year Old | 30 (100.0%) | 0 (0.0%) |
| 10 to 14 Year Olds | 0 (0.0%) | 0 (0.0%) |
| 15 to 17 Year Olds | 0 (0.0%) | 0 (0.0%) |
| 18 to 19 Year Olds | 0 (0.0%) | 0 (0.0%) |
| 20 to 24 Year Olds | 0 (0.0%) | 0 (0.0%) |
| 25 to 34 Year Olds | 0 (0.0%) | 0 (0.0%) |
| 35 Years and over | 17 (100.0%) | 0 (0.0%) |
| Total | 47 (58.8%) | 33 (41.3%) |
Educational Attainment by Field of Study in Fisher Island
Business (163 | 33.3%), social sciences (79 | 16.2%), communications (69 | 14.1%), visual & performing arts (50 | 10.2%), and engineering (46 | 9.4%) are the most common fields of study among 489 individuals in Fisher Island who have obtained a bachelor's degree or higher.
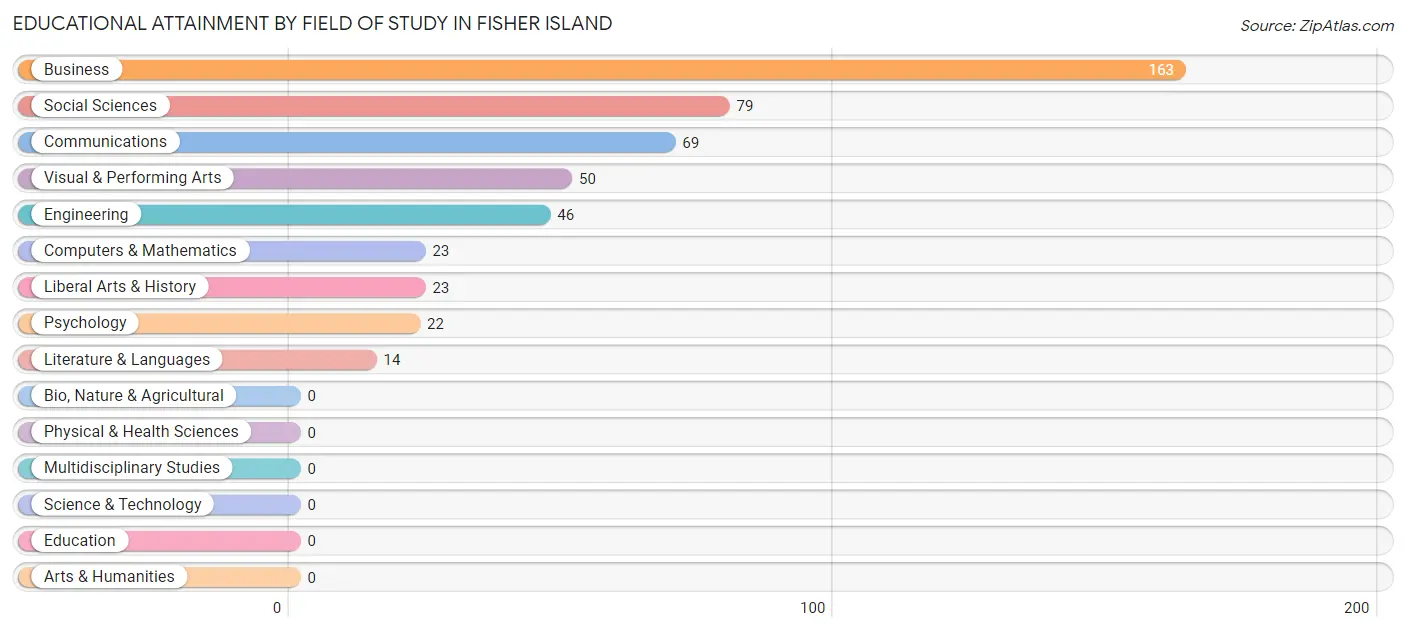
| Field of Study | # Graduates | % Graduates |
| Computers & Mathematics | 23 | 4.7% |
| Bio, Nature & Agricultural | 0 | 0.0% |
| Physical & Health Sciences | 0 | 0.0% |
| Psychology | 22 | 4.5% |
| Social Sciences | 79 | 16.2% |
| Engineering | 46 | 9.4% |
| Multidisciplinary Studies | 0 | 0.0% |
| Science & Technology | 0 | 0.0% |
| Business | 163 | 33.3% |
| Education | 0 | 0.0% |
| Literature & Languages | 14 | 2.9% |
| Liberal Arts & History | 23 | 4.7% |
| Visual & Performing Arts | 50 | 10.2% |
| Communications | 69 | 14.1% |
| Arts & Humanities | 0 | 0.0% |
| Total | 489 | 100.0% |
Transportation & Commute in Fisher Island
Vehicle Availability by Sex in Fisher Island
The most prevalent vehicle ownership categories in Fisher Island are males with 2 vehicles (69, accounting for 50.7%) and females with 2 vehicles (60, making up 53.5%).
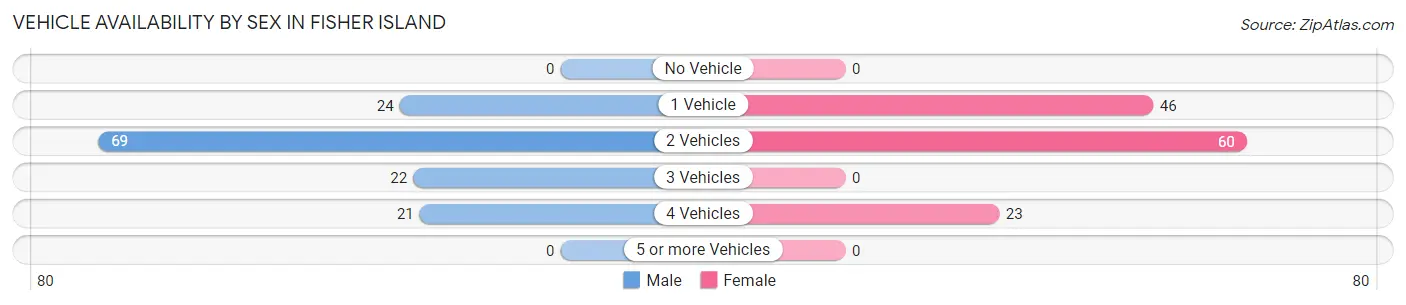
| Vehicles Available | Male | Female |
| No Vehicle | 0 (0.0%) | 0 (0.0%) |
| 1 Vehicle | 24 (17.6%) | 46 (35.7%) |
| 2 Vehicles | 69 (50.7%) | 60 (46.5%) |
| 3 Vehicles | 22 (16.2%) | 0 (0.0%) |
| 4 Vehicles | 21 (15.4%) | 23 (17.8%) |
| 5 or more Vehicles | 0 (0.0%) | 0 (0.0%) |
| Total | 136 (100.0%) | 129 (100.0%) |
Commute Time in Fisher Island
The most frequently occuring commute durations in Fisher Island are 40 to 44 minutes (42 commuters, 40.0%), 45 to 59 minutes (40 commuters, 38.1%), and less than 5 minutes (23 commuters, 21.9%).
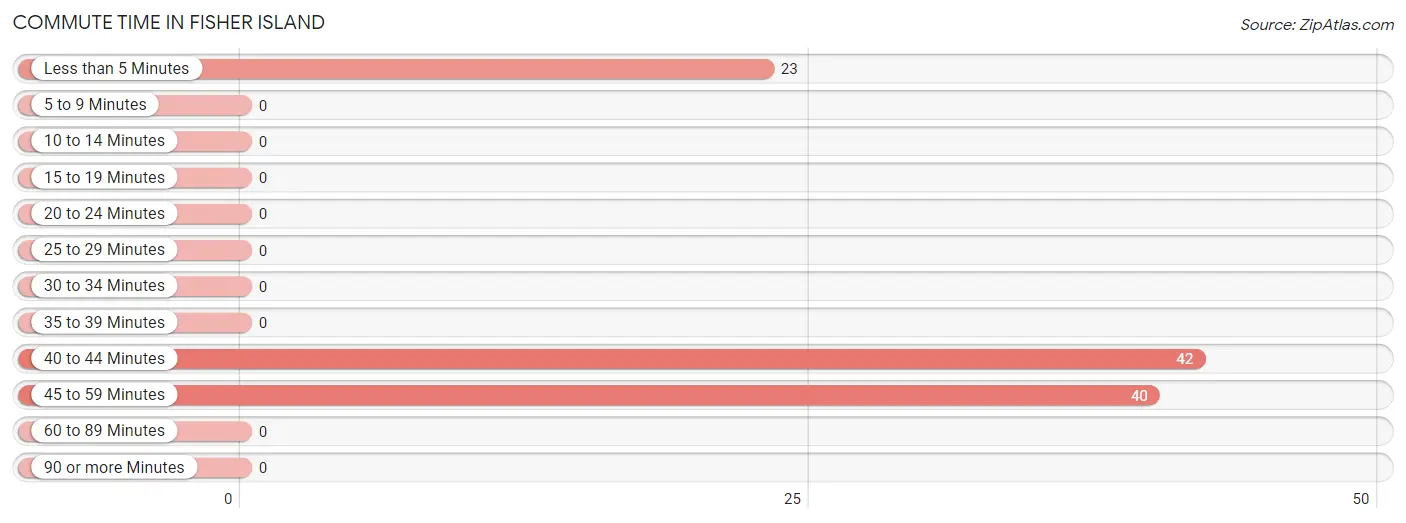
| Commute Time | # Commuters | % Commuters |
| Less than 5 Minutes | 23 | 21.9% |
| 5 to 9 Minutes | 0 | 0.0% |
| 10 to 14 Minutes | 0 | 0.0% |
| 15 to 19 Minutes | 0 | 0.0% |
| 20 to 24 Minutes | 0 | 0.0% |
| 25 to 29 Minutes | 0 | 0.0% |
| 30 to 34 Minutes | 0 | 0.0% |
| 35 to 39 Minutes | 0 | 0.0% |
| 40 to 44 Minutes | 42 | 40.0% |
| 45 to 59 Minutes | 40 | 38.1% |
| 60 to 89 Minutes | 0 | 0.0% |
| 90 or more Minutes | 0 | 0.0% |
Commute Time by Sex in Fisher Island
The most common commute times in Fisher Island are 40 to 44 minutes (42 commuters, 66.7%) for males and less than 5 minutes (23 commuters, 54.8%) for females.
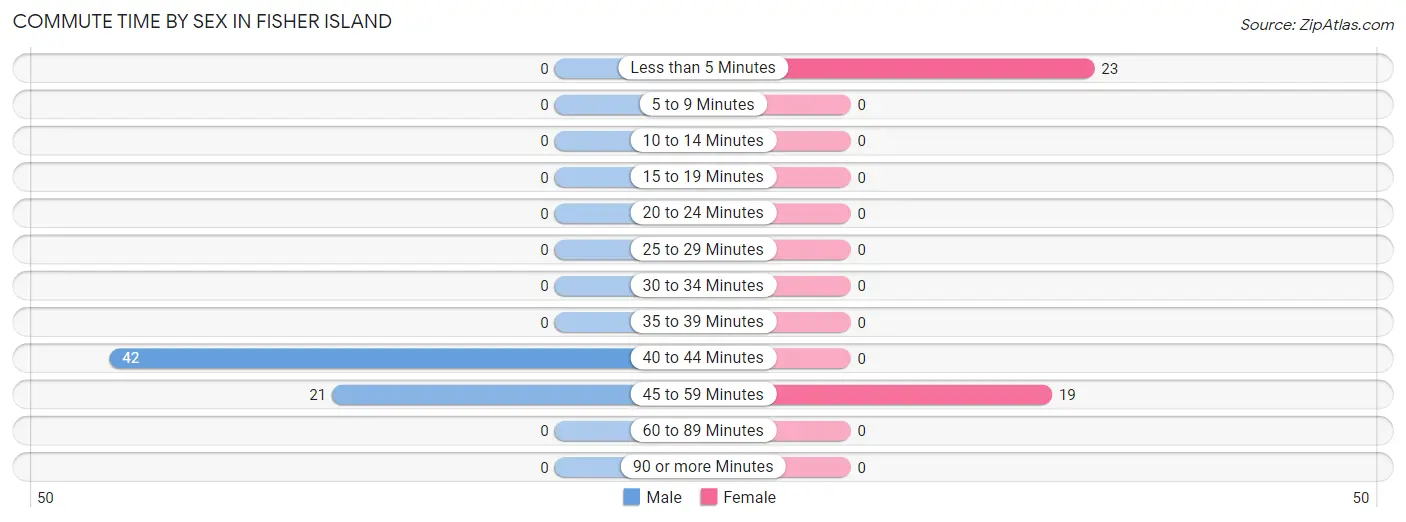
| Commute Time | Male | Female |
| Less than 5 Minutes | 0 (0.0%) | 23 (54.8%) |
| 5 to 9 Minutes | 0 (0.0%) | 0 (0.0%) |
| 10 to 14 Minutes | 0 (0.0%) | 0 (0.0%) |
| 15 to 19 Minutes | 0 (0.0%) | 0 (0.0%) |
| 20 to 24 Minutes | 0 (0.0%) | 0 (0.0%) |
| 25 to 29 Minutes | 0 (0.0%) | 0 (0.0%) |
| 30 to 34 Minutes | 0 (0.0%) | 0 (0.0%) |
| 35 to 39 Minutes | 0 (0.0%) | 0 (0.0%) |
| 40 to 44 Minutes | 42 (66.7%) | 0 (0.0%) |
| 45 to 59 Minutes | 21 (33.3%) | 19 (45.2%) |
| 60 to 89 Minutes | 0 (0.0%) | 0 (0.0%) |
| 90 or more Minutes | 0 (0.0%) | 0 (0.0%) |
Time of Departure to Work by Sex in Fisher Island
The most frequent times of departure to work in Fisher Island are 7:00 AM to 7:29 AM (22, 34.9%) for males and 9:00 AM to 9:59 AM (23, 54.8%) for females.
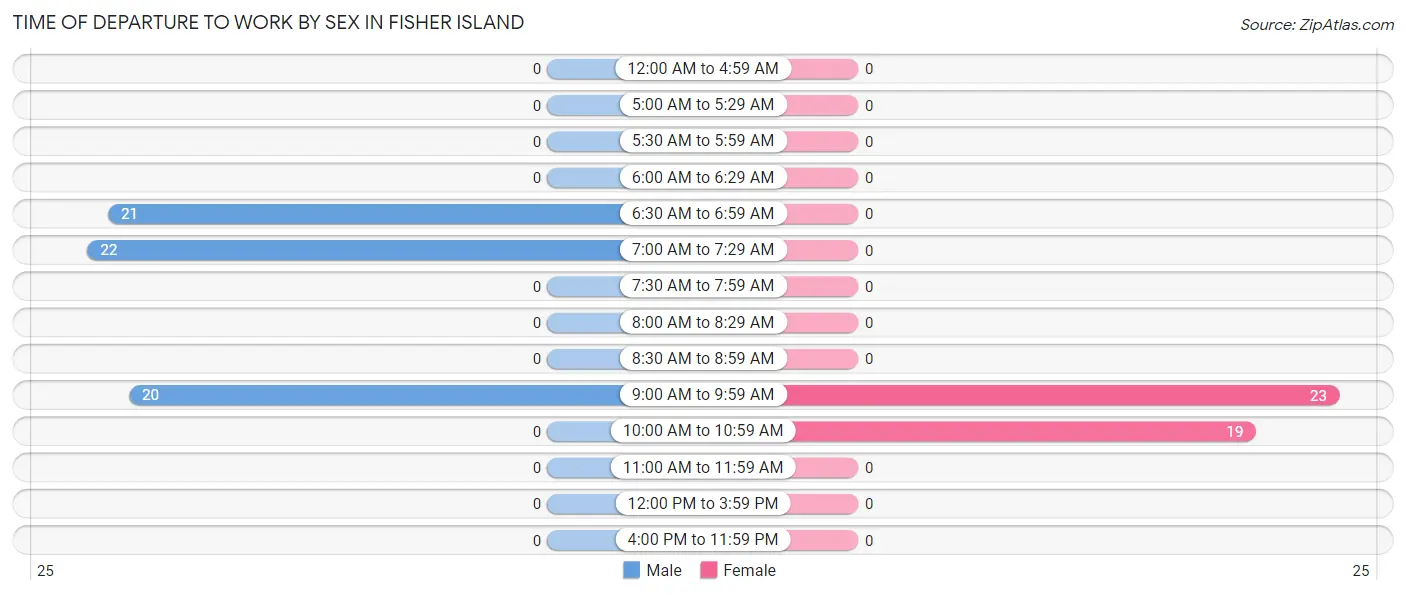
| Time of Departure | Male | Female |
| 12:00 AM to 4:59 AM | 0 (0.0%) | 0 (0.0%) |
| 5:00 AM to 5:29 AM | 0 (0.0%) | 0 (0.0%) |
| 5:30 AM to 5:59 AM | 0 (0.0%) | 0 (0.0%) |
| 6:00 AM to 6:29 AM | 0 (0.0%) | 0 (0.0%) |
| 6:30 AM to 6:59 AM | 21 (33.3%) | 0 (0.0%) |
| 7:00 AM to 7:29 AM | 22 (34.9%) | 0 (0.0%) |
| 7:30 AM to 7:59 AM | 0 (0.0%) | 0 (0.0%) |
| 8:00 AM to 8:29 AM | 0 (0.0%) | 0 (0.0%) |
| 8:30 AM to 8:59 AM | 0 (0.0%) | 0 (0.0%) |
| 9:00 AM to 9:59 AM | 20 (31.8%) | 23 (54.8%) |
| 10:00 AM to 10:59 AM | 0 (0.0%) | 19 (45.2%) |
| 11:00 AM to 11:59 AM | 0 (0.0%) | 0 (0.0%) |
| 12:00 PM to 3:59 PM | 0 (0.0%) | 0 (0.0%) |
| 4:00 PM to 11:59 PM | 0 (0.0%) | 0 (0.0%) |
| Total | 63 (100.0%) | 42 (100.0%) |
Housing Occupancy in Fisher Island
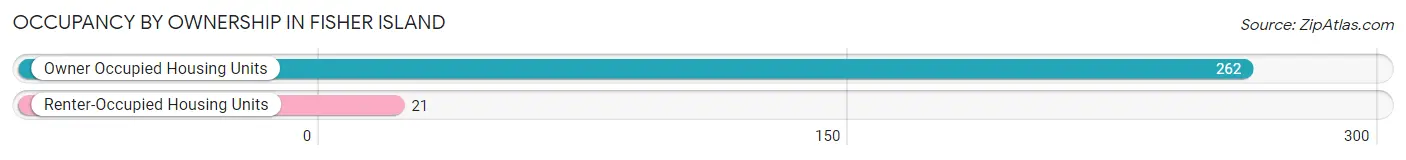
Occupancy by Ownership in Fisher Island
Of the total 283 dwellings in Fisher Island, owner-occupied units account for 262 (92.6%), while renter-occupied units make up 21 (7.4%).
| Occupancy | # Housing Units | % Housing Units |
| Owner Occupied Housing Units | 262 | 92.6% |
| Renter-Occupied Housing Units | 21 | 7.4% |
| Total Occupied Housing Units | 283 | 100.0% |
Occupancy by Household Size in Fisher Island
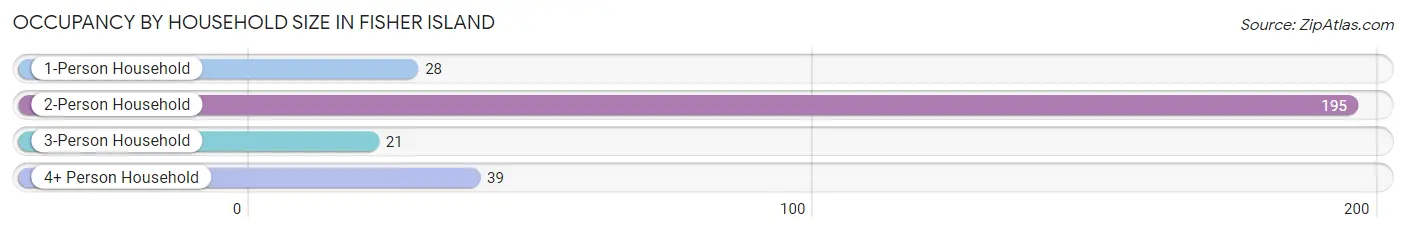
| Household Size | # Housing Units | % Housing Units |
| 1-Person Household | 28 | 9.9% |
| 2-Person Household | 195 | 68.9% |
| 3-Person Household | 21 | 7.4% |
| 4+ Person Household | 39 | 13.8% |
| Total Housing Units | 283 | 100.0% |
Occupancy by Ownership by Household Size in Fisher Island
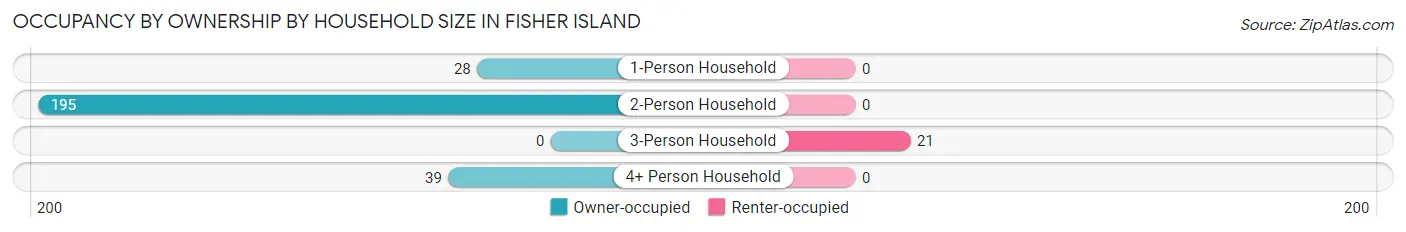
| Household Size | Owner-occupied | Renter-occupied |
| 1-Person Household | 28 (100.0%) | 0 (0.0%) |
| 2-Person Household | 195 (100.0%) | 0 (0.0%) |
| 3-Person Household | 0 (0.0%) | 21 (100.0%) |
| 4+ Person Household | 39 (100.0%) | 0 (0.0%) |
| Total Housing Units | 262 (92.6%) | 21 (7.4%) |
Occupancy by Educational Attainment in Fisher Island
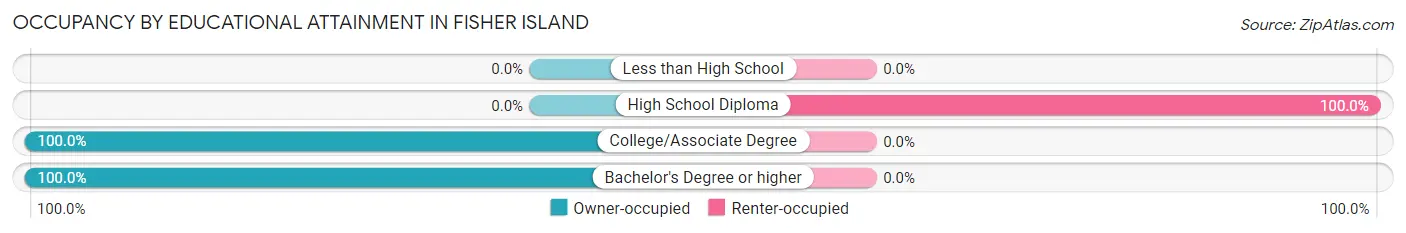
| Household Size | Owner-occupied | Renter-occupied |
| Less than High School | 0 (0.0%) | 0 (0.0%) |
| High School Diploma | 0 (0.0%) | 21 (100.0%) |
| College/Associate Degree | 36 (100.0%) | 0 (0.0%) |
| Bachelor's Degree or higher | 226 (100.0%) | 0 (0.0%) |
Occupancy by Age of Householder in Fisher Island
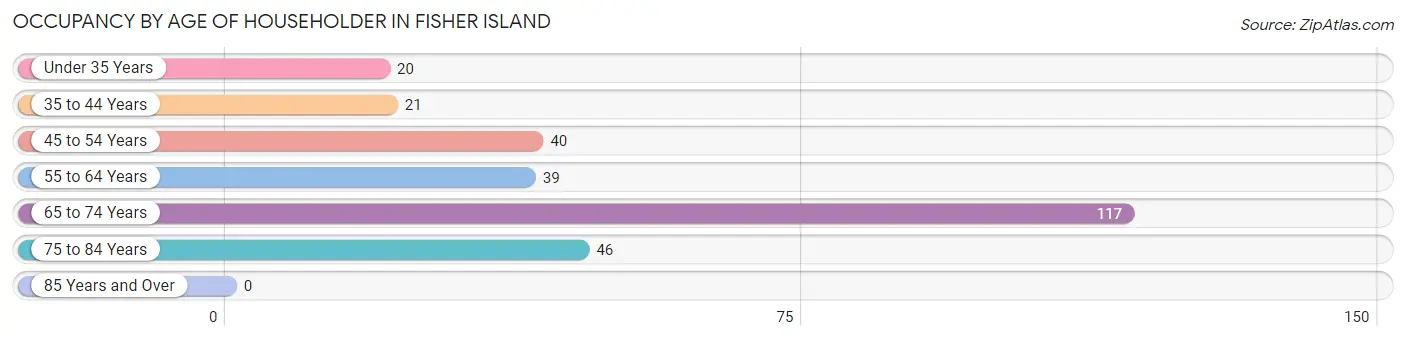
| Age Bracket | # Households | % Households |
| Under 35 Years | 20 | 7.1% |
| 35 to 44 Years | 21 | 7.4% |
| 45 to 54 Years | 40 | 14.1% |
| 55 to 64 Years | 39 | 13.8% |
| 65 to 74 Years | 117 | 41.3% |
| 75 to 84 Years | 46 | 16.3% |
| 85 Years and Over | 0 | 0.0% |
| Total | 283 | 100.0% |
Housing Finances in Fisher Island
Median Income by Occupancy in Fisher Island
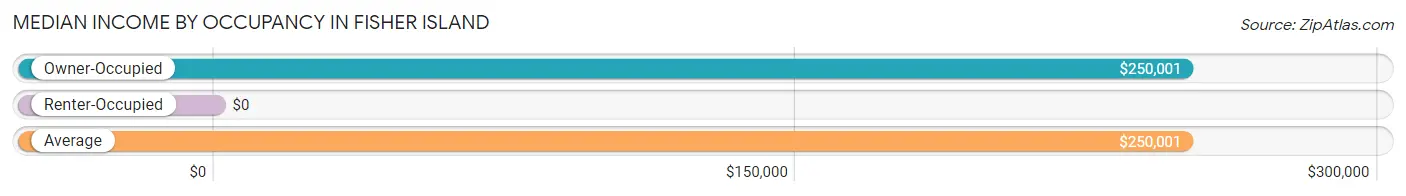
| Occupancy Type | # Households | Median Income |
| Owner-Occupied | 262 (92.6%) | $250,001 |
| Renter-Occupied | 21 (7.4%) | $0 |
| Average | 283 (100.0%) | $250,001 |
Occupancy by Householder Income Bracket in Fisher Island
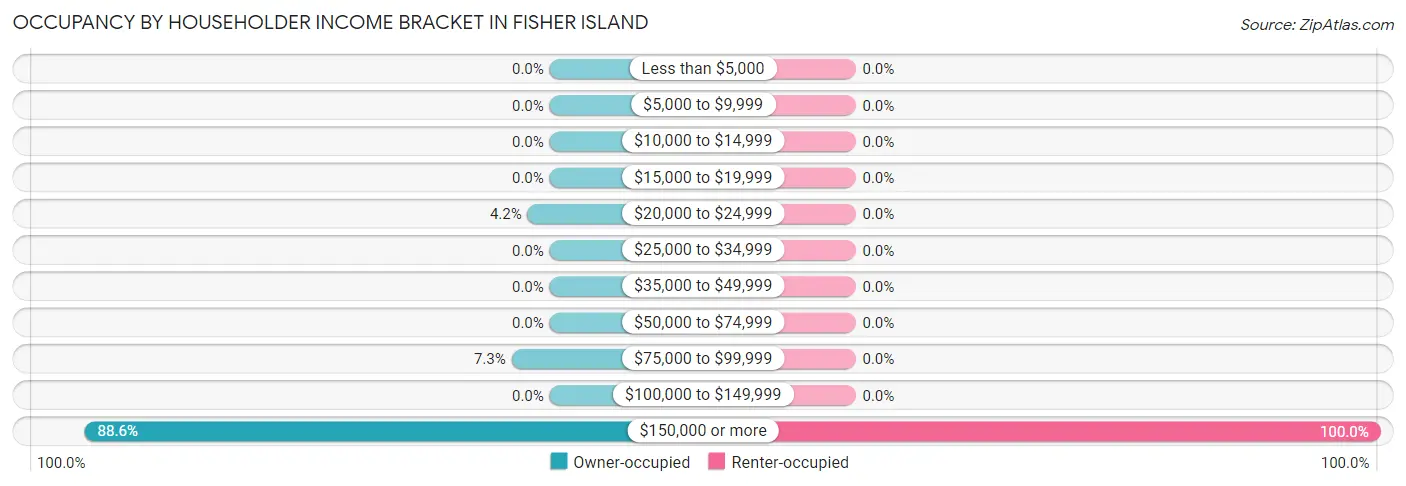
| Income Bracket | Owner-occupied | Renter-occupied |
| Less than $5,000 | 0 (0.0%) | 0 (0.0%) |
| $5,000 to $9,999 | 0 (0.0%) | 0 (0.0%) |
| $10,000 to $14,999 | 0 (0.0%) | 0 (0.0%) |
| $15,000 to $19,999 | 0 (0.0%) | 0 (0.0%) |
| $20,000 to $24,999 | 11 (4.2%) | 0 (0.0%) |
| $25,000 to $34,999 | 0 (0.0%) | 0 (0.0%) |
| $35,000 to $49,999 | 0 (0.0%) | 0 (0.0%) |
| $50,000 to $74,999 | 0 (0.0%) | 0 (0.0%) |
| $75,000 to $99,999 | 19 (7.2%) | 0 (0.0%) |
| $100,000 to $149,999 | 0 (0.0%) | 0 (0.0%) |
| $150,000 or more | 232 (88.5%) | 21 (100.0%) |
| Total | 262 (100.0%) | 21 (100.0%) |
Monthly Housing Cost Tiers in Fisher Island
| Monthly Cost | Owner-occupied | Renter-occupied |
| Less than $300 | 0 (0.0%) | 0 (0.0%) |
| $300 to $499 | 0 (0.0%) | 0 (0.0%) |
| $500 to $799 | 0 (0.0%) | 0 (0.0%) |
| $800 to $999 | 0 (0.0%) | 0 (0.0%) |
| $1,000 to $1,499 | 0 (0.0%) | 0 (0.0%) |
| $1,500 to $1,999 | 0 (0.0%) | 21 (100.0%) |
| $2,000 to $2,499 | 0 (0.0%) | 0 (0.0%) |
| $2,500 to $2,999 | 0 (0.0%) | 0 (0.0%) |
| $3,000 or more | 262 (100.0%) | 0 (0.0%) |
| Total | 262 (100.0%) | 21 (100.0%) |
Physical Housing Characteristics in Fisher Island
Housing Structures in Fisher Island
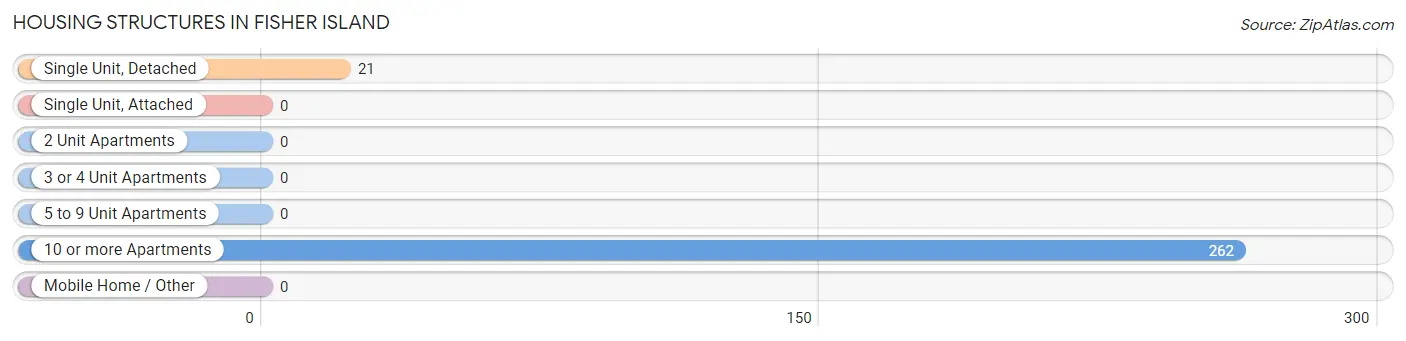
| Structure Type | # Housing Units | % Housing Units |
| Single Unit, Detached | 21 | 7.4% |
| Single Unit, Attached | 0 | 0.0% |
| 2 Unit Apartments | 0 | 0.0% |
| 3 or 4 Unit Apartments | 0 | 0.0% |
| 5 to 9 Unit Apartments | 0 | 0.0% |
| 10 or more Apartments | 262 | 92.6% |
| Mobile Home / Other | 0 | 0.0% |
| Total | 283 | 100.0% |
Housing Structures by Occupancy in Fisher Island
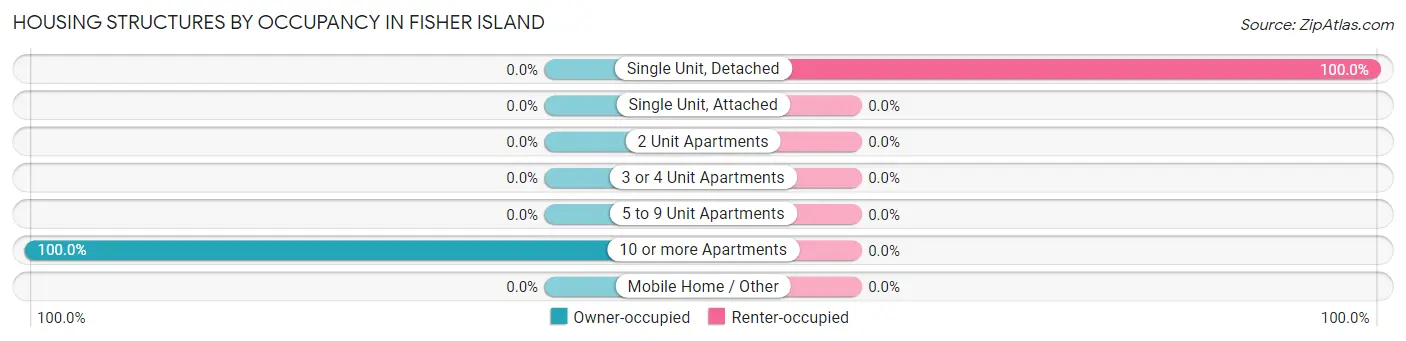
| Structure Type | Owner-occupied | Renter-occupied |
| Single Unit, Detached | 0 (0.0%) | 21 (100.0%) |
| Single Unit, Attached | 0 (0.0%) | 0 (0.0%) |
| 2 Unit Apartments | 0 (0.0%) | 0 (0.0%) |
| 3 or 4 Unit Apartments | 0 (0.0%) | 0 (0.0%) |
| 5 to 9 Unit Apartments | 0 (0.0%) | 0 (0.0%) |
| 10 or more Apartments | 262 (100.0%) | 0 (0.0%) |
| Mobile Home / Other | 0 (0.0%) | 0 (0.0%) |
| Total | 262 (92.6%) | 21 (7.4%) |
Housing Structures by Number of Rooms in Fisher Island
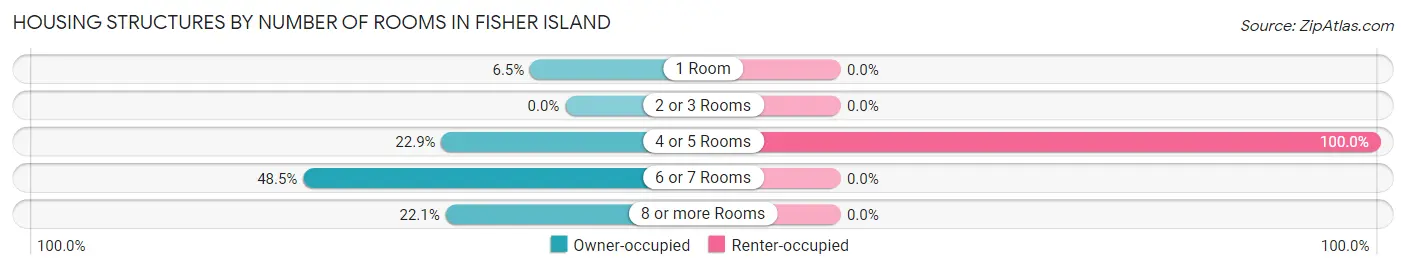
| Number of Rooms | Owner-occupied | Renter-occupied |
| 1 Room | 17 (6.5%) | 0 (0.0%) |
| 2 or 3 Rooms | 0 (0.0%) | 0 (0.0%) |
| 4 or 5 Rooms | 60 (22.9%) | 21 (100.0%) |
| 6 or 7 Rooms | 127 (48.5%) | 0 (0.0%) |
| 8 or more Rooms | 58 (22.1%) | 0 (0.0%) |
| Total | 262 (100.0%) | 21 (100.0%) |
Housing Structure by Heating Type in Fisher Island
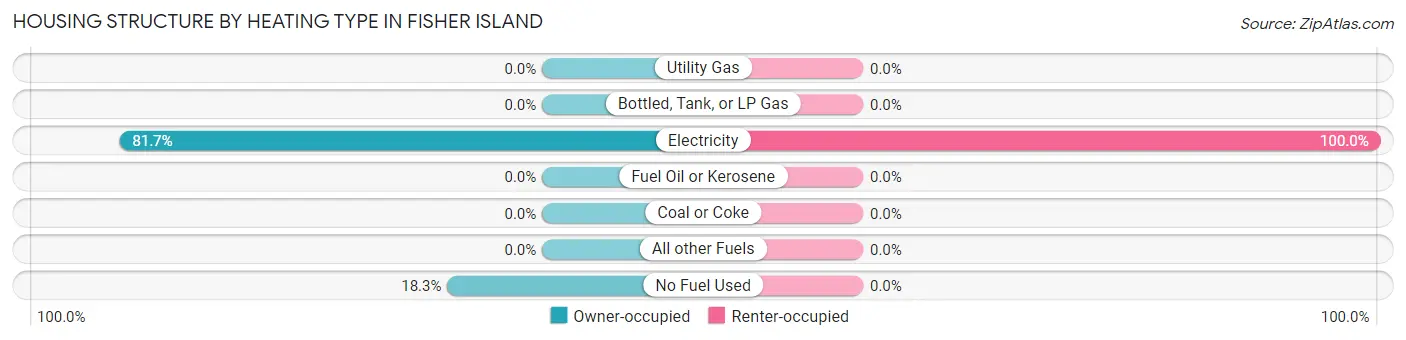
| Heating Type | Owner-occupied | Renter-occupied |
| Utility Gas | 0 (0.0%) | 0 (0.0%) |
| Bottled, Tank, or LP Gas | 0 (0.0%) | 0 (0.0%) |
| Electricity | 214 (81.7%) | 21 (100.0%) |
| Fuel Oil or Kerosene | 0 (0.0%) | 0 (0.0%) |
| Coal or Coke | 0 (0.0%) | 0 (0.0%) |
| All other Fuels | 0 (0.0%) | 0 (0.0%) |
| No Fuel Used | 48 (18.3%) | 0 (0.0%) |
| Total | 262 (100.0%) | 21 (100.0%) |
Household Vehicle Usage in Fisher Island
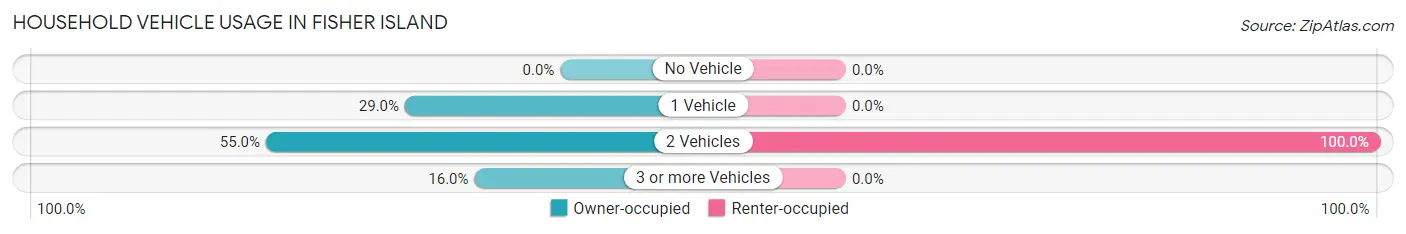
| Vehicles per Household | Owner-occupied | Renter-occupied |
| No Vehicle | 0 (0.0%) | 0 (0.0%) |
| 1 Vehicle | 76 (29.0%) | 0 (0.0%) |
| 2 Vehicles | 144 (55.0%) | 21 (100.0%) |
| 3 or more Vehicles | 42 (16.0%) | 0 (0.0%) |
| Total | 262 (100.0%) | 21 (100.0%) |
Real Estate & Mortgages in Fisher Island
Real Estate and Mortgage Overview in Fisher Island
| Characteristic | Without Mortgage | With Mortgage |
| Housing Units | 217 | 45 |
| Median Property Value | $2,000,001 | $0 |
| Median Household Income | $250,001 | $45 |
| Monthly Housing Costs | $1,501 | $45 |
| Real Estate Taxes | $10,001 | $0 |
Property Value by Mortgage Status in Fisher Island
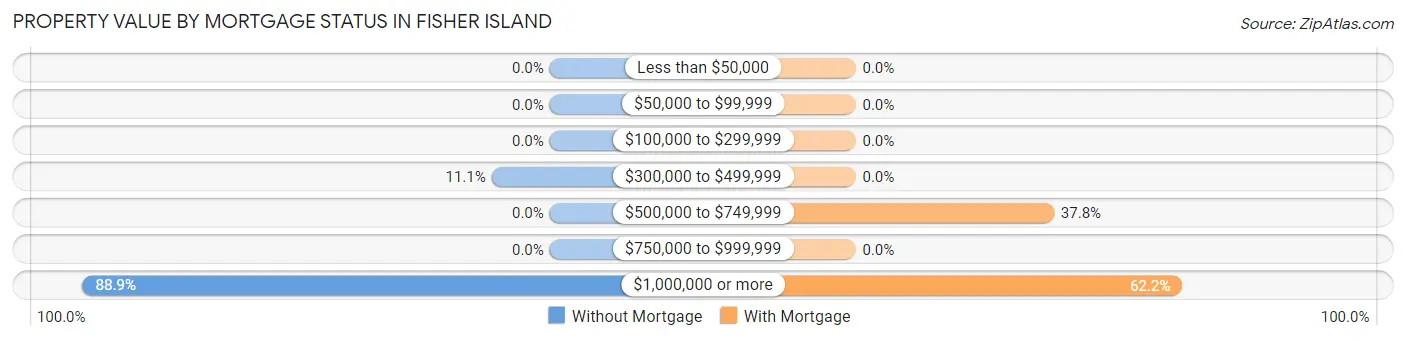
| Property Value | Without Mortgage | With Mortgage |
| Less than $50,000 | 0 (0.0%) | 0 (0.0%) |
| $50,000 to $99,999 | 0 (0.0%) | 0 (0.0%) |
| $100,000 to $299,999 | 0 (0.0%) | 0 (0.0%) |
| $300,000 to $499,999 | 24 (11.1%) | 0 (0.0%) |
| $500,000 to $749,999 | 0 (0.0%) | 17 (37.8%) |
| $750,000 to $999,999 | 0 (0.0%) | 0 (0.0%) |
| $1,000,000 or more | 193 (88.9%) | 28 (62.2%) |
| Total | 217 (100.0%) | 45 (100.0%) |
Household Income by Mortgage Status in Fisher Island
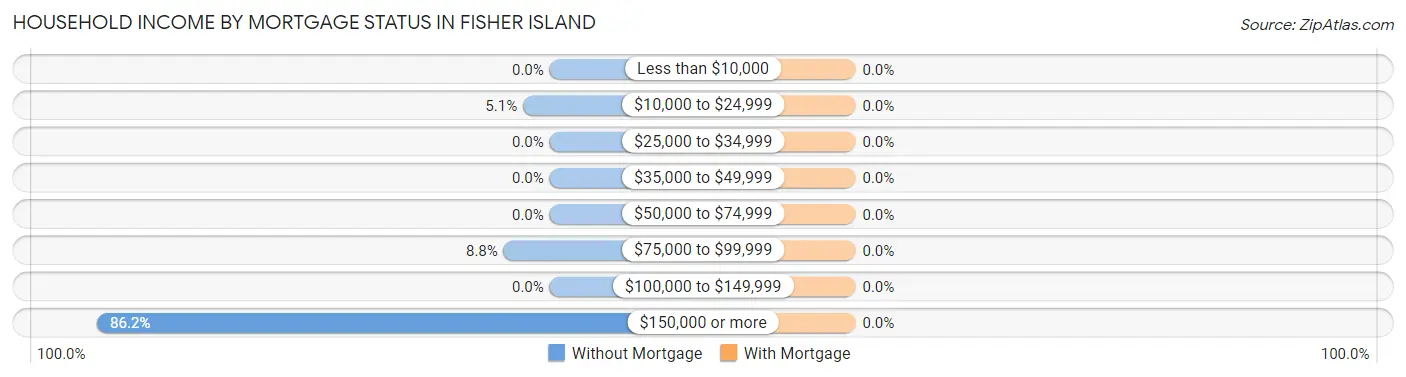
| Household Income | Without Mortgage | With Mortgage |
| Less than $10,000 | 0 (0.0%) | 0 (0.0%) |
| $10,000 to $24,999 | 11 (5.1%) | 0 (0.0%) |
| $25,000 to $34,999 | 0 (0.0%) | 0 (0.0%) |
| $35,000 to $49,999 | 0 (0.0%) | 0 (0.0%) |
| $50,000 to $74,999 | 0 (0.0%) | 0 (0.0%) |
| $75,000 to $99,999 | 19 (8.8%) | 0 (0.0%) |
| $100,000 to $149,999 | 0 (0.0%) | 0 (0.0%) |
| $150,000 or more | 187 (86.2%) | 0 (0.0%) |
| Total | 217 (100.0%) | 45 (100.0%) |
Property Value to Household Income Ratio in Fisher Island
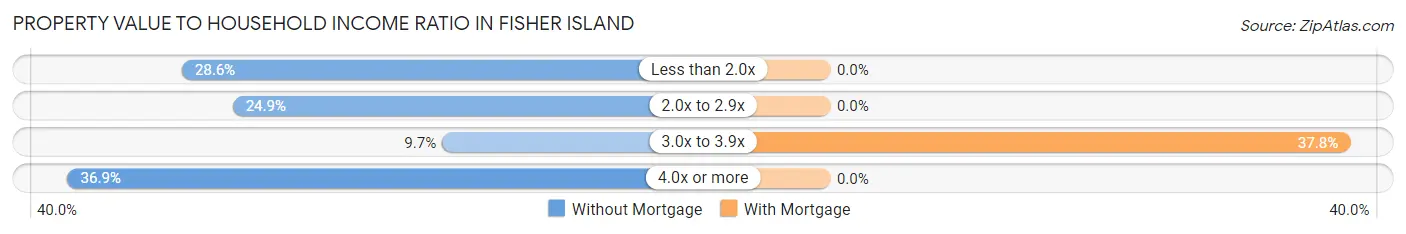
| Value-to-Income Ratio | Without Mortgage | With Mortgage |
| Less than 2.0x | 62 (28.6%) | 0 (0.0%) |
| 2.0x to 2.9x | 54 (24.9%) | 0 (0.0%) |
| 3.0x to 3.9x | 21 (9.7%) | 17 (37.8%) |
| 4.0x or more | 80 (36.9%) | 0 (0.0%) |
| Total | 217 (100.0%) | 45 (100.0%) |
Real Estate Taxes by Mortgage Status in Fisher Island
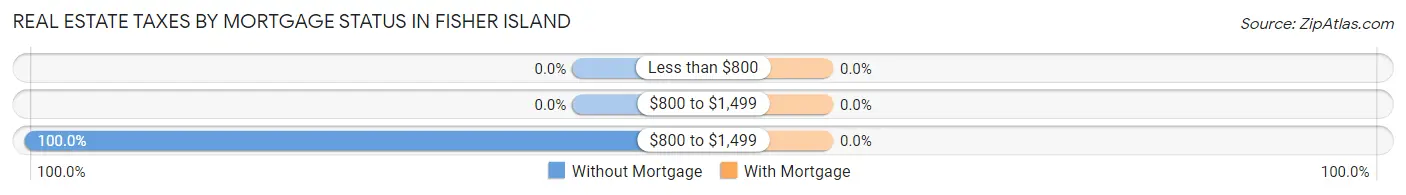
| Property Taxes | Without Mortgage | With Mortgage |
| Less than $800 | 0 (0.0%) | 0 (0.0%) |
| $800 to $1,499 | 0 (0.0%) | 0 (0.0%) |
| $800 to $1,499 | 217 (100.0%) | 0 (0.0%) |
| Total | 217 (100.0%) | 45 (100.0%) |
Health & Disability in Fisher Island
Health Insurance Coverage by Age in Fisher Island
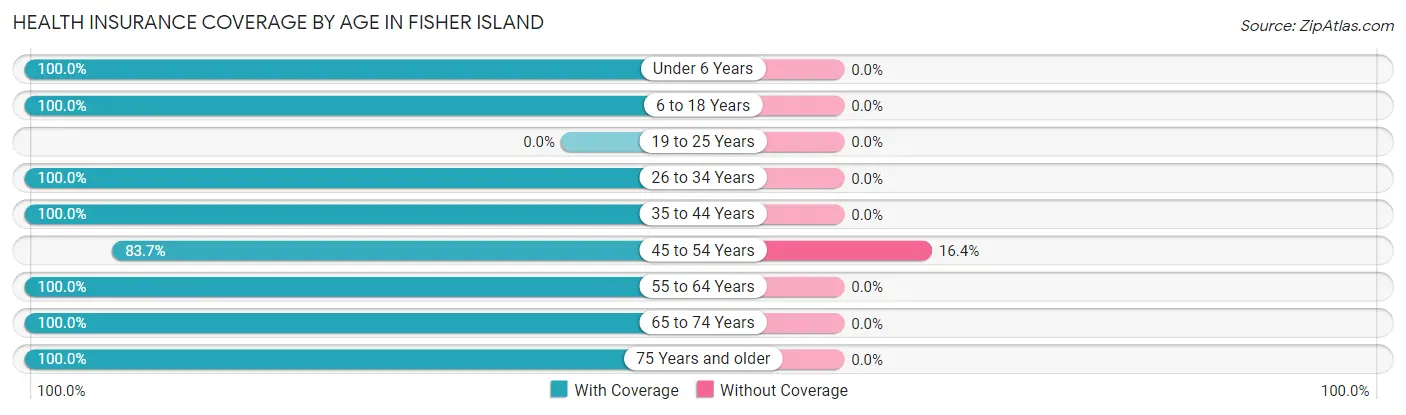
| Age Bracket | With Coverage | Without Coverage |
| Under 6 Years | 67 (100.0%) | 0 (0.0%) |
| 6 to 18 Years | 30 (100.0%) | 0 (0.0%) |
| 19 to 25 Years | 0 (0.0%) | 0 (0.0%) |
| 26 to 34 Years | 66 (100.0%) | 0 (0.0%) |
| 35 to 44 Years | 61 (100.0%) | 0 (0.0%) |
| 45 to 54 Years | 87 (83.7%) | 17 (16.4%) |
| 55 to 64 Years | 73 (100.0%) | 0 (0.0%) |
| 65 to 74 Years | 176 (100.0%) | 0 (0.0%) |
| 75 Years and older | 104 (100.0%) | 0 (0.0%) |
| Total | 664 (97.5%) | 17 (2.5%) |
Health Insurance Coverage by Citizenship Status in Fisher Island
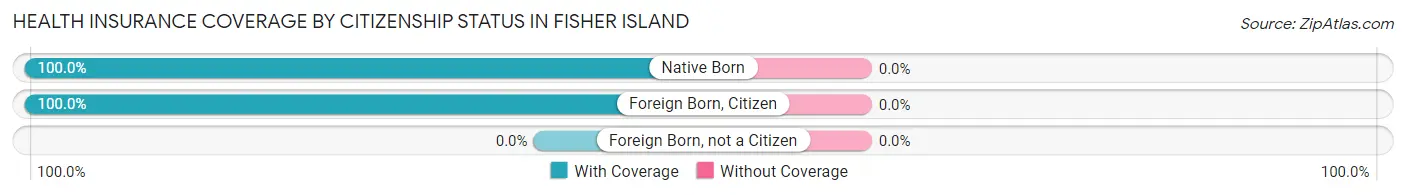
| Citizenship Status | With Coverage | Without Coverage |
| Native Born | 67 (100.0%) | 0 (0.0%) |
| Foreign Born, Citizen | 30 (100.0%) | 0 (0.0%) |
| Foreign Born, not a Citizen | 0 (0.0%) | 0 (0.0%) |
Health Insurance Coverage by Household Income in Fisher Island
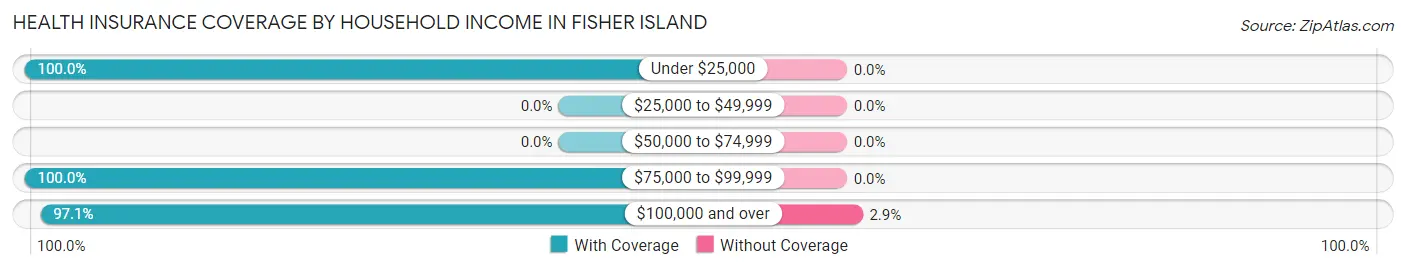
| Household Income | With Coverage | Without Coverage |
| Under $25,000 | 23 (100.0%) | 0 (0.0%) |
| $25,000 to $49,999 | 0 (0.0%) | 0 (0.0%) |
| $50,000 to $74,999 | 0 (0.0%) | 0 (0.0%) |
| $75,000 to $99,999 | 78 (100.0%) | 0 (0.0%) |
| $100,000 and over | 563 (97.1%) | 17 (2.9%) |
Public vs Private Health Insurance Coverage by Age in Fisher Island
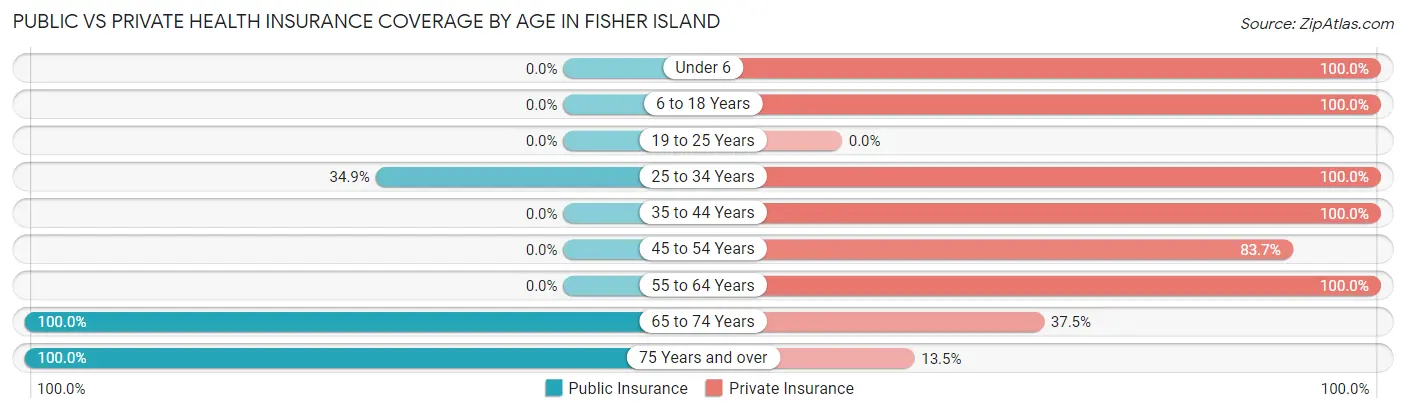
| Age Bracket | Public Insurance | Private Insurance |
| Under 6 | 0 (0.0%) | 67 (100.0%) |
| 6 to 18 Years | 0 (0.0%) | 30 (100.0%) |
| 19 to 25 Years | 0 (0.0%) | 0 (0.0%) |
| 25 to 34 Years | 23 (34.8%) | 66 (100.0%) |
| 35 to 44 Years | 0 (0.0%) | 61 (100.0%) |
| 45 to 54 Years | 0 (0.0%) | 87 (83.7%) |
| 55 to 64 Years | 0 (0.0%) | 73 (100.0%) |
| 65 to 74 Years | 176 (100.0%) | 66 (37.5%) |
| 75 Years and over | 104 (100.0%) | 14 (13.5%) |
| Total | 303 (44.5%) | 464 (68.1%) |
Disability Status by Sex by Age in Fisher Island
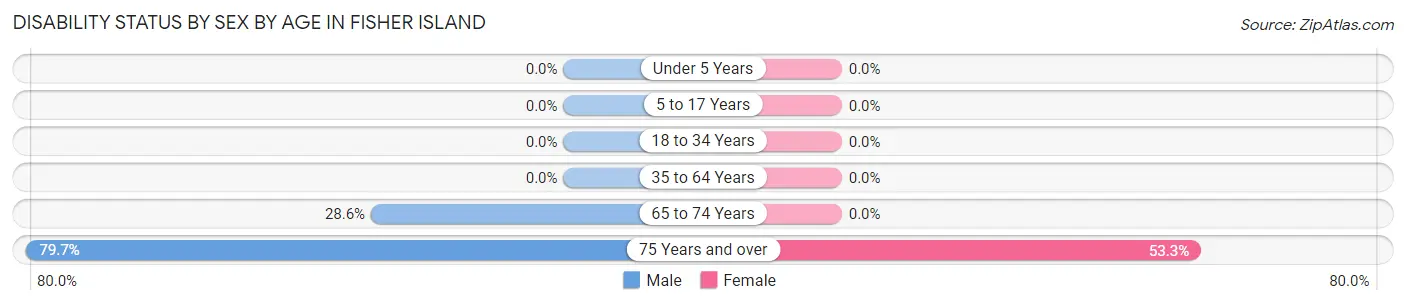
| Age Bracket | Male | Female |
| Under 5 Years | 0 (0.0%) | 0 (0.0%) |
| 5 to 17 Years | 0 (0.0%) | 0 (0.0%) |
| 18 to 34 Years | 0 (0.0%) | 0 (0.0%) |
| 35 to 64 Years | 0 (0.0%) | 0 (0.0%) |
| 65 to 74 Years | 28 (28.6%) | 0 (0.0%) |
| 75 Years and over | 59 (79.7%) | 16 (53.3%) |
Disability Class by Sex by Age in Fisher Island
Disability Class: Hearing Difficulty
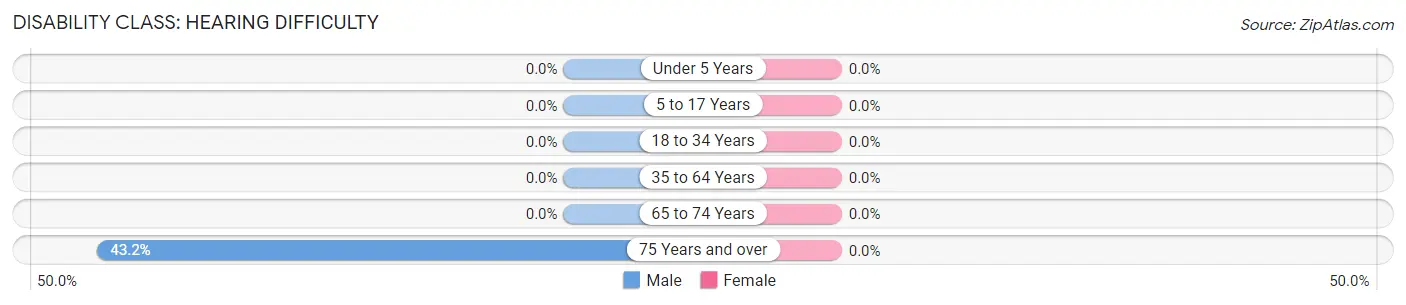
| Age Bracket | Male | Female |
| Under 5 Years | 0 (0.0%) | 0 (0.0%) |
| 5 to 17 Years | 0 (0.0%) | 0 (0.0%) |
| 18 to 34 Years | 0 (0.0%) | 0 (0.0%) |
| 35 to 64 Years | 0 (0.0%) | 0 (0.0%) |
| 65 to 74 Years | 0 (0.0%) | 0 (0.0%) |
| 75 Years and over | 32 (43.2%) | 0 (0.0%) |
Disability Class: Vision Difficulty
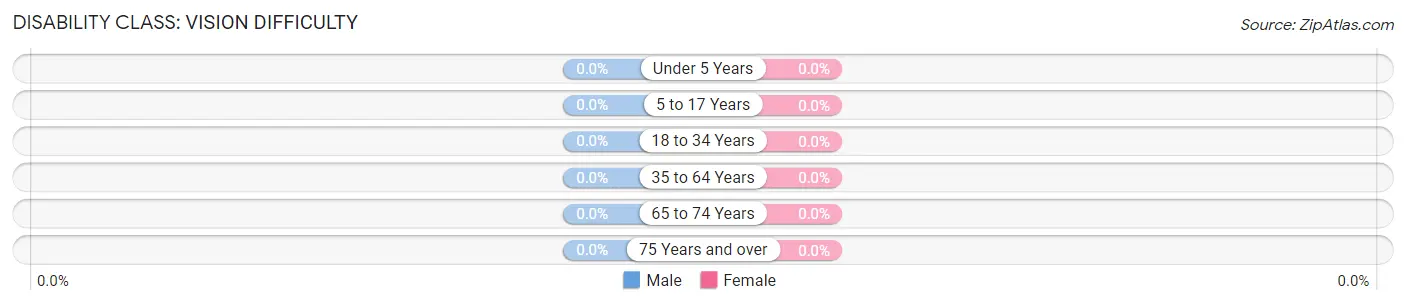
| Age Bracket | Male | Female |
| Under 5 Years | 0 (0.0%) | 0 (0.0%) |
| 5 to 17 Years | 0 (0.0%) | 0 (0.0%) |
| 18 to 34 Years | 0 (0.0%) | 0 (0.0%) |
| 35 to 64 Years | 0 (0.0%) | 0 (0.0%) |
| 65 to 74 Years | 0 (0.0%) | 0 (0.0%) |
| 75 Years and over | 0 (0.0%) | 0 (0.0%) |
Disability Class: Cognitive Difficulty
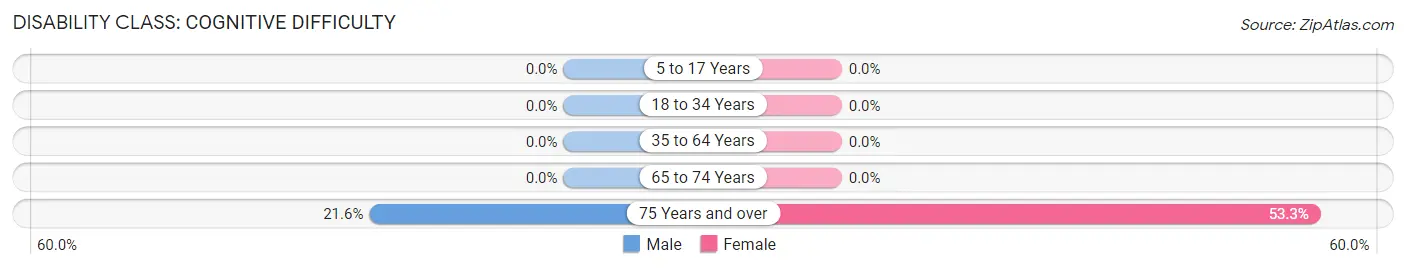
| Age Bracket | Male | Female |
| 5 to 17 Years | 0 (0.0%) | 0 (0.0%) |
| 18 to 34 Years | 0 (0.0%) | 0 (0.0%) |
| 35 to 64 Years | 0 (0.0%) | 0 (0.0%) |
| 65 to 74 Years | 0 (0.0%) | 0 (0.0%) |
| 75 Years and over | 16 (21.6%) | 16 (53.3%) |
Disability Class: Ambulatory Difficulty
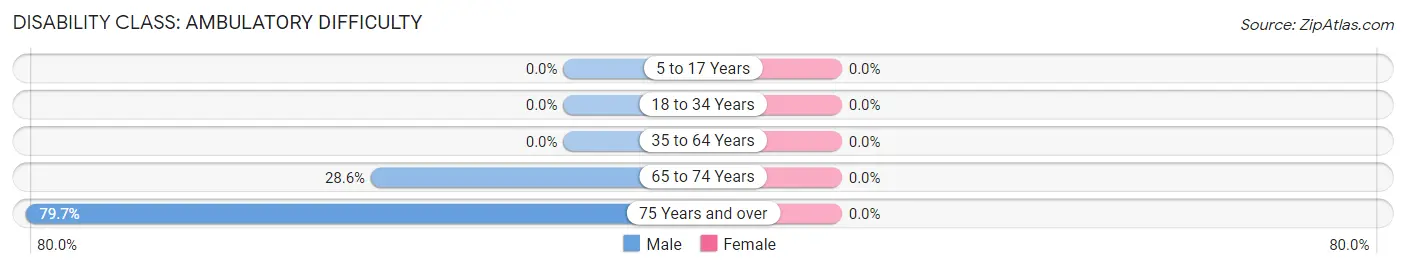
| Age Bracket | Male | Female |
| 5 to 17 Years | 0 (0.0%) | 0 (0.0%) |
| 18 to 34 Years | 0 (0.0%) | 0 (0.0%) |
| 35 to 64 Years | 0 (0.0%) | 0 (0.0%) |
| 65 to 74 Years | 28 (28.6%) | 0 (0.0%) |
| 75 Years and over | 59 (79.7%) | 0 (0.0%) |
Disability Class: Self-Care Difficulty
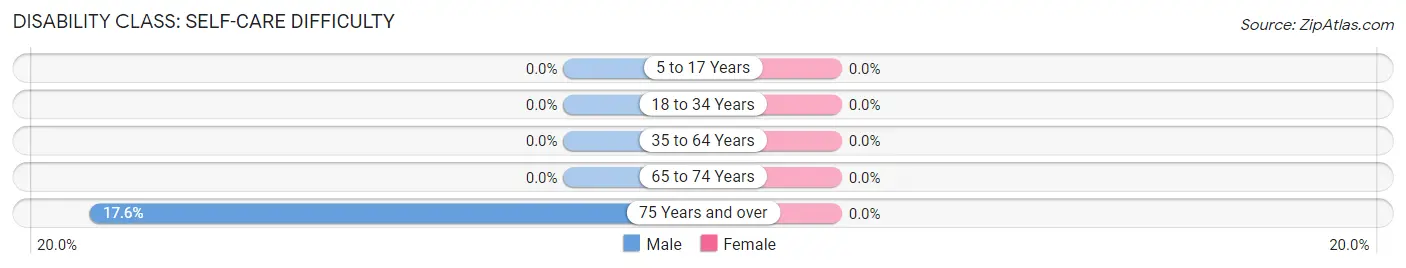
| Age Bracket | Male | Female |
| 5 to 17 Years | 0 (0.0%) | 0 (0.0%) |
| 18 to 34 Years | 0 (0.0%) | 0 (0.0%) |
| 35 to 64 Years | 0 (0.0%) | 0 (0.0%) |
| 65 to 74 Years | 0 (0.0%) | 0 (0.0%) |
| 75 Years and over | 13 (17.6%) | 0 (0.0%) |
Technology Access in Fisher Island
Computing Device Access in Fisher Island
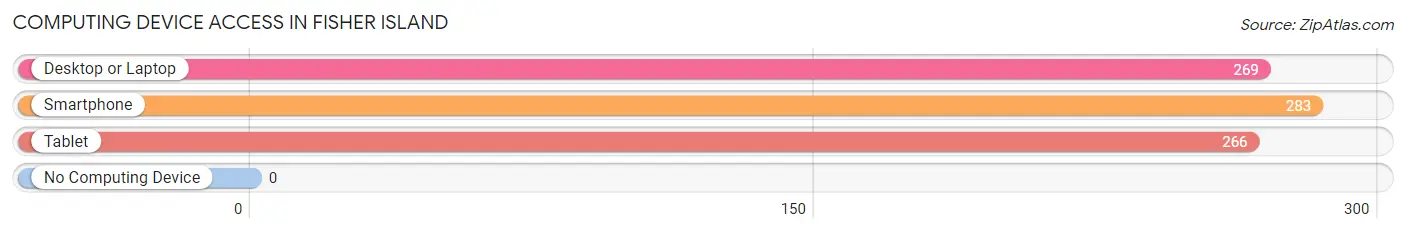
| Device Type | # Households | % Households |
| Desktop or Laptop | 269 | 95.1% |
| Smartphone | 283 | 100.0% |
| Tablet | 266 | 94.0% |
| No Computing Device | 0 | 0.0% |
| Total | 283 | 100.0% |
Internet Access in Fisher Island
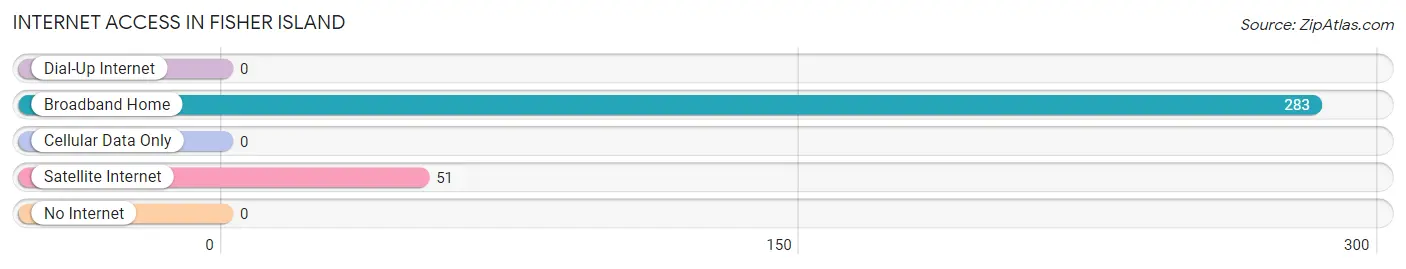
| Internet Type | # Households | % Households |
| Dial-Up Internet | 0 | 0.0% |
| Broadband Home | 283 | 100.0% |
| Cellular Data Only | 0 | 0.0% |
| Satellite Internet | 51 | 18.0% |
| No Internet | 0 | 0.0% |
| Total | 283 | 100.0% |
Fisher Island Summary
Fisher Island is a small, exclusive island located off the coast of Miami Beach, Florida. It is accessible only by boat or ferry and is home to some of the wealthiest people in the United States. The island is known for its luxurious lifestyle, with its private beaches, golf courses, and marinas. It is also home to a variety of wildlife, including manatees, dolphins, and sea turtles.
History
Fisher Island was originally inhabited by the Tequesta Indians, who lived on the island for centuries before the arrival of Europeans. The island was named after the Fisher family, who purchased it in 1905. The Fishers developed the island into a resort, and it quickly became a popular destination for wealthy vacationers. In the 1920s, the island was sold to William K. Vanderbilt II, who built a luxurious hotel and casino on the island. The hotel was destroyed by a hurricane in 1926, and the island was sold to the U.S. government in 1942. The government used the island as a naval base during World War II, and it was later used as a training facility for the U.S. Coast Guard.
In the 1960s, the island was sold to a private developer, who built a marina and a golf course. The island was then sold to a group of investors in 1985, who developed it into a private residential community. Today, Fisher Island is home to some of the wealthiest people in the United States, and it is one of the most exclusive and expensive places to live in the country.
Geography
Fisher Island is located off the coast of Miami Beach, Florida, in the Atlantic Ocean. It is accessible only by boat or ferry, and it is located approximately two miles from the mainland. The island is approximately 216 acres in size, and it is surrounded by a variety of wildlife, including manatees, dolphins, and sea turtles. The island is also home to a variety of plant life, including palm trees, mangroves, and sea grasses.
Economy
Fisher Island is home to some of the wealthiest people in the United States, and it is one of the most exclusive and expensive places to live in the country. The island is home to a variety of luxury amenities, including private beaches, golf courses, and marinas. The island also has a variety of restaurants, shops, and other businesses. The island is also home to a variety of real estate developments, including condominiums, townhouses, and single-family homes.
Demographics
As of the 2010 census, Fisher Island had a population of 467 people. The population is predominantly white, with a small percentage of African Americans and Hispanics. The median household income is $250,000, and the median home value is $2.5 million. The island is home to a variety of wealthy professionals, including business executives, lawyers, and doctors. The island is also home to a variety of celebrities, including Oprah Winfrey, Bill Gates, and Madonna.
Common Questions
What is Per Capita Income in Fisher Island?
Per Capita income in Fisher Island is $418,363.
What is the Median Family Income in Fisher Island?
Median Family Income in Fisher Island is $250,001.
What is the Median Household income in Fisher Island?
Median Household Income in Fisher Island is $250,001.
What is Inequality or Gini Index in Fisher Island?
Inequality or Gini Index in Fisher Island is 0.39.
What is the Total Population of Fisher Island?
Total Population of Fisher Island is 681.
What is the Total Male Population of Fisher Island?
Total Male Population of Fisher Island is 358.
What is the Total Female Population of Fisher Island?
Total Female Population of Fisher Island is 323.
What is the Ratio of Males per 100 Females in Fisher Island?
There are 110.84 Males per 100 Females in Fisher Island.
What is the Ratio of Females per 100 Males in Fisher Island?
There are 90.22 Females per 100 Males in Fisher Island.
What is the Median Population Age in Fisher Island?
Median Population Age in Fisher Island is 57.0 Years.
What is the Average Family Size in Fisher Island
Average Family Size in Fisher Island is 2.6 People.
What is the Average Household Size in Fisher Island
Average Household Size in Fisher Island is 2.4 People.
How Large is the Labor Force in Fisher Island?
There are 282 People in the Labor Forcein in Fisher Island.
What is the Percentage of People in the Labor Force in Fisher Island?
48.3% of People are in the Labor Force in Fisher Island.