Mockingbird Valley, KY Map & Demographics
Mockingbird Valley Map
Mockingbird Valley Overview
$172,916
PER CAPITA INCOME
$250,001
AVG FAMILY INCOME
$250,001
AVG HOUSEHOLD INCOME
69.4%
WAGE / INCOME GAP [ % ]
30.6¢/ $1
WAGE / INCOME GAP [ $ ]
0.44
INEQUALITY / GINI INDEX
161
TOTAL POPULATION
80
MALE POPULATION
81
FEMALE POPULATION
98.77
MALES / 100 FEMALES
101.25
FEMALES / 100 MALES
52.6
MEDIAN AGE
2.9
AVG FAMILY SIZE
2.4
AVG HOUSEHOLD SIZE
59
LABOR FORCE [ PEOPLE ]
46.5%
PERCENT IN LABOR FORCE
1.7%
UNEMPLOYMENT RATE
Mockingbird Valley Area Codes
Income in Mockingbird Valley
Income Overview in Mockingbird Valley
Per Capita Income in Mockingbird Valley is $172,916, while median incomes of families and households are $250,001 and $250,001 respectively.
| Characteristic | Number | Measure |
| Per Capita Income | 161 | $172,916 |
| Median Family Income | 49 | $250,001 |
| Mean Family Income | 49 | $435,043 |
| Median Household Income | 67 | $250,001 |
| Mean Household Income | 67 | $418,899 |
| Income Deficit | 49 | $0 |
| Wage / Income Gap (%) | 161 | 69.41% |
| Wage / Income Gap ($) | 161 | 30.59¢ per $1 |
| Gini / Inequality Index | 161 | 0.44 |
Earnings by Sex in Mockingbird Valley
Average Earnings in Mockingbird Valley are $138,750, $201,250 for men and $61,563 for women, a difference of 69.4%.
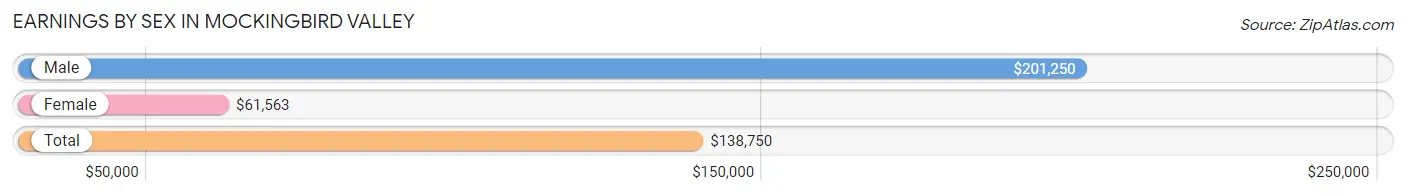
| Sex | Number | Average Earnings |
| Male | 44 (65.7%) | $201,250 |
| Female | 23 (34.3%) | $61,563 |
| Total | 67 (100.0%) | $138,750 |
Earnings by Sex by Income Bracket in Mockingbird Valley
The most common earnings brackets in Mockingbird Valley are $100,000+ for men (33 | 75.0%) and $100,000+ for women (8 | 34.8%).
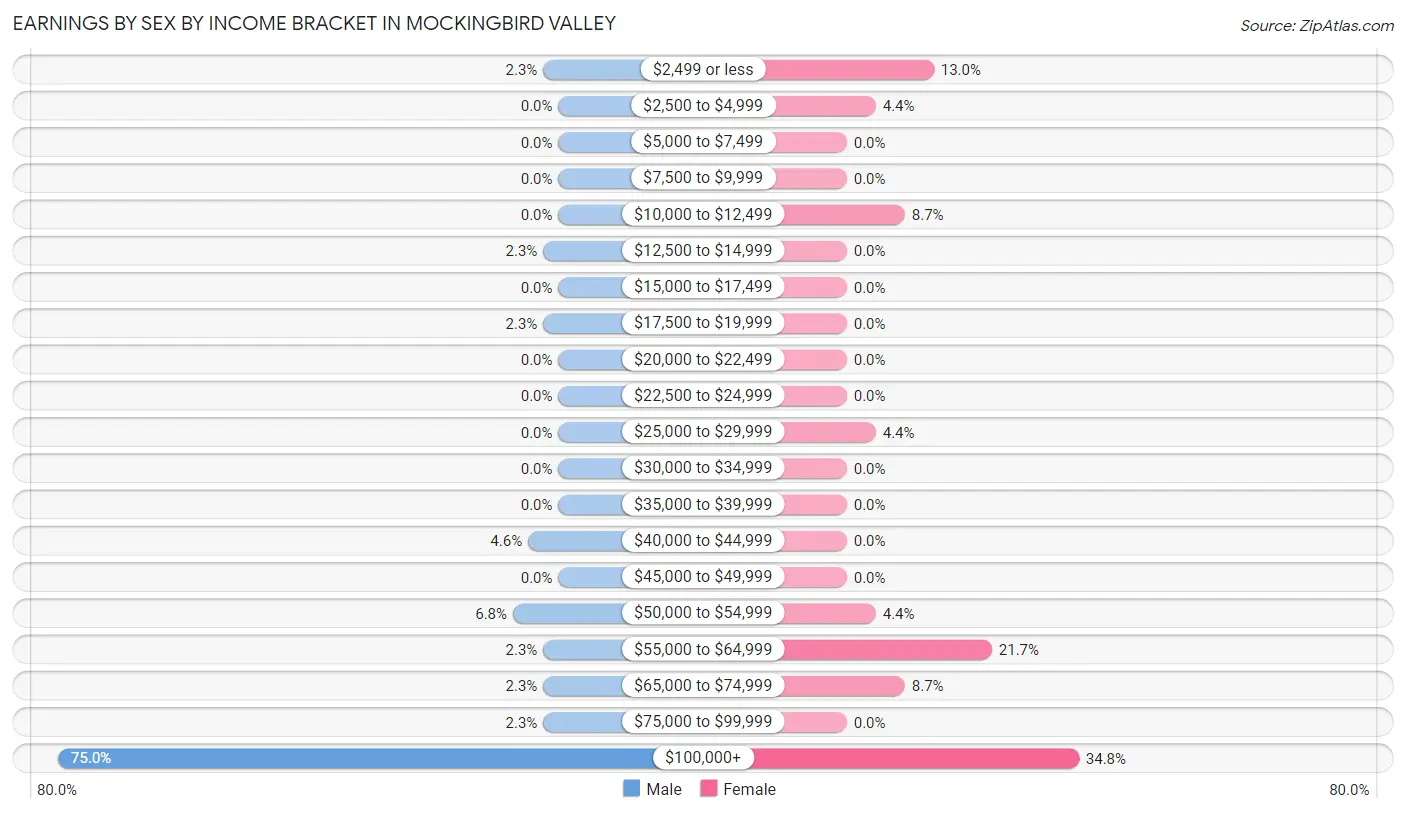
| Income | Male | Female |
| $2,499 or less | 1 (2.3%) | 3 (13.0%) |
| $2,500 to $4,999 | 0 (0.0%) | 1 (4.3%) |
| $5,000 to $7,499 | 0 (0.0%) | 0 (0.0%) |
| $7,500 to $9,999 | 0 (0.0%) | 0 (0.0%) |
| $10,000 to $12,499 | 0 (0.0%) | 2 (8.7%) |
| $12,500 to $14,999 | 1 (2.3%) | 0 (0.0%) |
| $15,000 to $17,499 | 0 (0.0%) | 0 (0.0%) |
| $17,500 to $19,999 | 1 (2.3%) | 0 (0.0%) |
| $20,000 to $22,499 | 0 (0.0%) | 0 (0.0%) |
| $22,500 to $24,999 | 0 (0.0%) | 0 (0.0%) |
| $25,000 to $29,999 | 0 (0.0%) | 1 (4.3%) |
| $30,000 to $34,999 | 0 (0.0%) | 0 (0.0%) |
| $35,000 to $39,999 | 0 (0.0%) | 0 (0.0%) |
| $40,000 to $44,999 | 2 (4.5%) | 0 (0.0%) |
| $45,000 to $49,999 | 0 (0.0%) | 0 (0.0%) |
| $50,000 to $54,999 | 3 (6.8%) | 1 (4.3%) |
| $55,000 to $64,999 | 1 (2.3%) | 5 (21.7%) |
| $65,000 to $74,999 | 1 (2.3%) | 2 (8.7%) |
| $75,000 to $99,999 | 1 (2.3%) | 0 (0.0%) |
| $100,000+ | 33 (75.0%) | 8 (34.8%) |
| Total | 44 (100.0%) | 23 (100.0%) |
Earnings by Sex by Educational Attainment in Mockingbird Valley
Average earnings in Mockingbird Valley are $201,563 for men and $68,750 for women, a difference of 65.9%. Men with an educational attainment of graduate degree enjoy the highest average annual earnings of $233,750, while those with bachelor's degree education earn the least with $195,000. Women with an educational attainment of bachelor's degree earn the most with the average annual earnings of $58,750, while those with bachelor's degree education have the smallest earnings of $58,750.
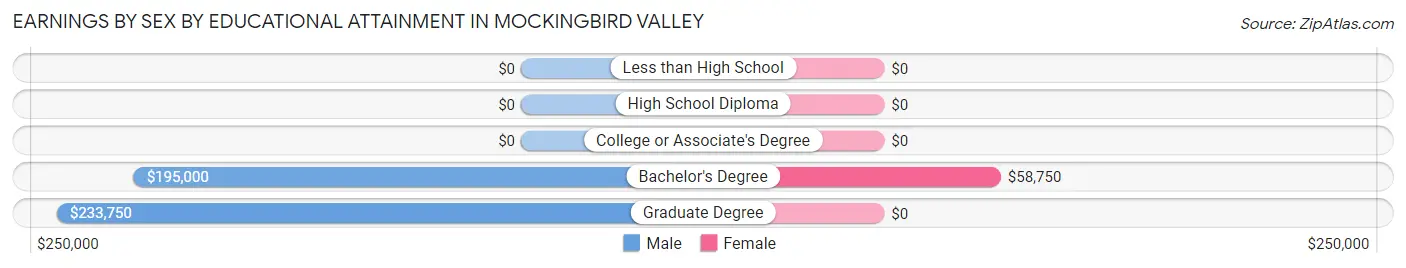
| Educational Attainment | Male Income | Female Income |
| Less than High School | - | - |
| High School Diploma | - | - |
| College or Associate's Degree | - | - |
| Bachelor's Degree | $195,000 | $58,750 |
| Graduate Degree | $233,750 | $0 |
| Total | $201,563 | $68,750 |
Family Income in Mockingbird Valley
Family Income Brackets in Mockingbird Valley
According to the Mockingbird Valley family income data, there are 42 families falling into the $200,000+ income range, which is the most common income bracket and makes up 85.7% of all families.
| Income Bracket | # Families | % Families |
| Less than $10,000 | 0 | 0.0% |
| $10,000 to $14,999 | 0 | 0.0% |
| $15,000 to $24,999 | 0 | 0.0% |
| $25,000 to $34,999 | 0 | 0.0% |
| $35,000 to $49,999 | 0 | 0.0% |
| $50,000 to $74,999 | 0 | 0.0% |
| $75,000 to $99,999 | 1 | 2.0% |
| $100,000 to $149,999 | 6 | 12.2% |
| $150,000 to $199,999 | 0 | 0.0% |
| $200,000+ | 42 | 85.7% |
Family Income by Famaliy Size in Mockingbird Valley
2-person families (26 | 53.1%) account for the highest median family income in Mockingbird Valley with $250,001 per family, while 2-person families (26 | 53.1%) have the highest median income of $125,000 per family member.
| Income Bracket | # Families | Median Income |
| 2-Person Families | 26 (53.1%) | $250,001 |
| 3-Person Families | 7 (14.3%) | $250,001 |
| 4-Person Families | 12 (24.5%) | $250,001 |
| 5-Person Families | 3 (6.1%) | $0 |
| 6-Person Families | 1 (2.0%) | $0 |
| 7+ Person Families | 0 (0.0%) | $0 |
| Total | 49 (100.0%) | $250,001 |
Family Income by Number of Earners in Mockingbird Valley
The median family income in Mockingbird Valley is $250,001, with families comprising 1 earner (15) having the highest median family income of $250,001, while families with no earners (12) have the lowest median family income of $221,500, accounting for 30.6% and 24.5% of families, respectively.
| Number of Earners | # Families | Median Income |
| No Earners | 12 (24.5%) | $221,500 |
| 1 Earner | 15 (30.6%) | $250,001 |
| 2 Earners | 17 (34.7%) | $250,001 |
| 3+ Earners | 5 (10.2%) | $250,001 |
| Total | 49 (100.0%) | $250,001 |
Household Income in Mockingbird Valley
Household Income Brackets in Mockingbird Valley
With 48 households falling in the category, the $200,000+ income range is the most frequent in Mockingbird Valley, accounting for 71.6% of all households.
| Income Bracket | # Households | % Households |
| Less than $10,000 | 0 | 0.0% |
| $10,000 to $14,999 | 0 | 0.0% |
| $15,000 to $24,999 | 1 | 1.5% |
| $25,000 to $34,999 | 1 | 1.5% |
| $35,000 to $49,999 | 0 | 0.0% |
| $50,000 to $74,999 | 1 | 1.5% |
| $75,000 to $99,999 | 5 | 7.5% |
| $100,000 to $149,999 | 11 | 16.4% |
| $150,000 to $199,999 | 0 | 0.0% |
| $200,000+ | 48 | 71.6% |
Household Income by Householder Age in Mockingbird Valley
The median household income in Mockingbird Valley is $250,001, with the highest median household income of $250,001 found in the 45 to 64 years age bracket for the primary householder. A total of 38 households (56.7%) fall into this category.
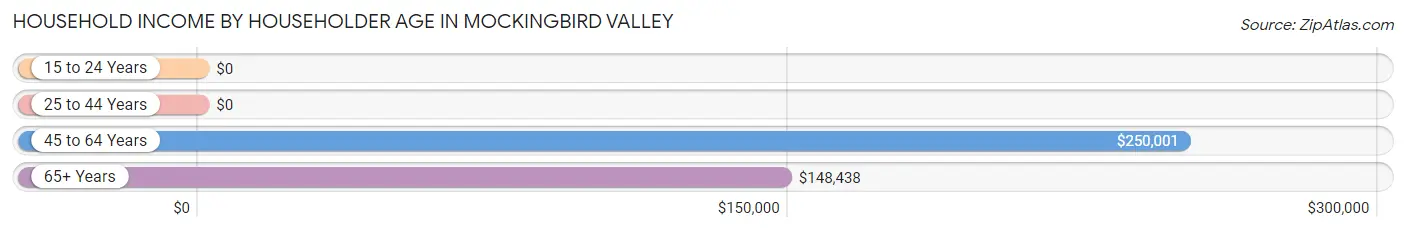
| Income Bracket | # Households | Median Income |
| 15 to 24 Years | 0 (0.0%) | $0 |
| 25 to 44 Years | 2 (3.0%) | $0 |
| 45 to 64 Years | 38 (56.7%) | $250,001 |
| 65+ Years | 27 (40.3%) | $148,438 |
| Total | 67 (100.0%) | $250,001 |
Poverty in Mockingbird Valley
Income Below Poverty by Sex and Age in Mockingbird Valley
| Age Bracket | Male | Female |
| Under 5 Years | 0 (0.0%) | 0 (0.0%) |
| 5 Years | 0 (0.0%) | 0 (0.0%) |
| 6 to 11 Years | 0 (0.0%) | 0 (0.0%) |
| 12 to 14 Years | 0 (0.0%) | 0 (0.0%) |
| 15 Years | 0 (0.0%) | 0 (0.0%) |
| 16 and 17 Years | 0 (0.0%) | 0 (0.0%) |
| 18 to 24 Years | 0 (0.0%) | 0 (0.0%) |
| 25 to 34 Years | 0 (0.0%) | 0 (0.0%) |
| 35 to 44 Years | 0 (0.0%) | 0 (0.0%) |
| 45 to 54 Years | 0 (0.0%) | 0 (0.0%) |
| 55 to 64 Years | 0 (0.0%) | 0 (0.0%) |
| 65 to 74 Years | 0 (0.0%) | 0 (0.0%) |
| 75 Years and over | 0 (0.0%) | 0 (0.0%) |
| Total | 0 (0.0%) | 0 (0.0%) |
Income Above Poverty by Sex and Age in Mockingbird Valley
According to the poverty statistics in Mockingbird Valley, males aged 5 years and females aged 6 to 11 years are the age groups that are most secure financially, with 100.0% of males and 100.0% of females in these age groups living above the poverty line.
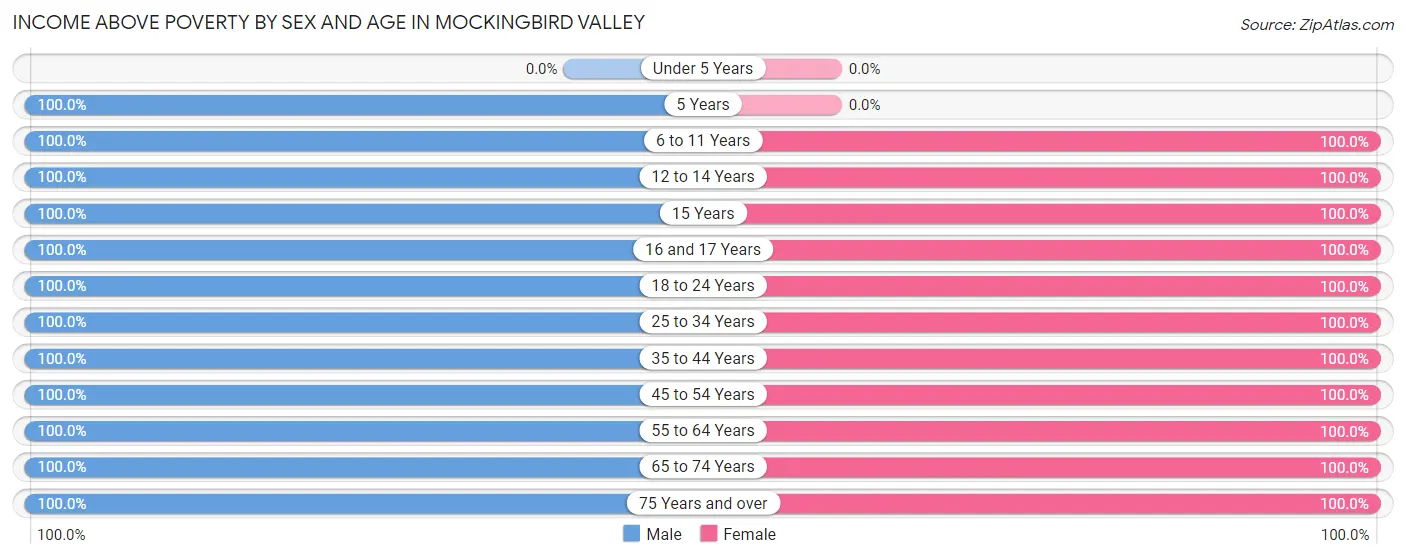
| Age Bracket | Male | Female |
| Under 5 Years | 0 (0.0%) | 0 (0.0%) |
| 5 Years | 1 (100.0%) | 0 (0.0%) |
| 6 to 11 Years | 14 (100.0%) | 2 (100.0%) |
| 12 to 14 Years | 1 (100.0%) | 12 (100.0%) |
| 15 Years | 2 (100.0%) | 2 (100.0%) |
| 16 and 17 Years | 5 (100.0%) | 3 (100.0%) |
| 18 to 24 Years | 3 (100.0%) | 2 (100.0%) |
| 25 to 34 Years | 2 (100.0%) | 1 (100.0%) |
| 35 to 44 Years | 3 (100.0%) | 7 (100.0%) |
| 45 to 54 Years | 20 (100.0%) | 10 (100.0%) |
| 55 to 64 Years | 13 (100.0%) | 18 (100.0%) |
| 65 to 74 Years | 8 (100.0%) | 17 (100.0%) |
| 75 Years and over | 8 (100.0%) | 7 (100.0%) |
| Total | 80 (100.0%) | 81 (100.0%) |
Income Below Poverty Among Married-Couple Families in Mockingbird Valley
| Children | Above Poverty | Below Poverty |
| No Children | 31 (100.0%) | 0 (0.0%) |
| 1 or 2 Children | 12 (100.0%) | 0 (0.0%) |
| 3 or 4 Children | 2 (100.0%) | 0 (0.0%) |
| 5 or more Children | 0 (0.0%) | 0 (0.0%) |
| Total | 45 (100.0%) | 0 (0.0%) |
Income Below Poverty Among Single-Parent Households in Mockingbird Valley
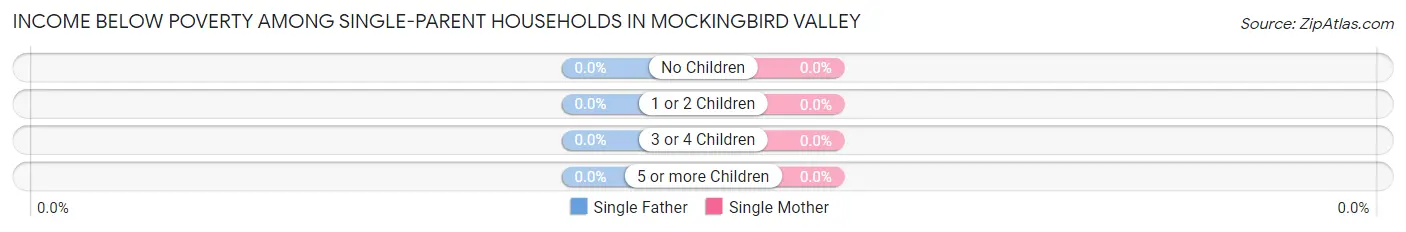
| Children | Single Father | Single Mother |
| No Children | 0 (0.0%) | 0 (0.0%) |
| 1 or 2 Children | 0 (0.0%) | 0 (0.0%) |
| 3 or 4 Children | 0 (0.0%) | 0 (0.0%) |
| 5 or more Children | 0 (0.0%) | 0 (0.0%) |
| Total | 0 (0.0%) | 0 (0.0%) |
Income Below Poverty Among Married-Couple vs Single-Parent Households in Mockingbird Valley
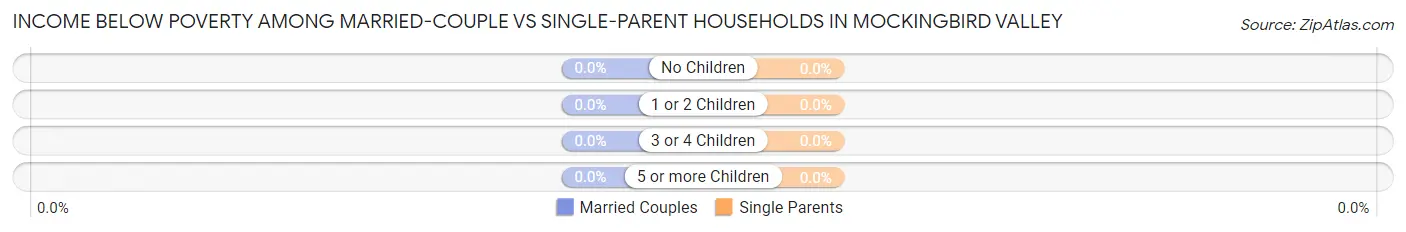
| Children | Married-Couple Families | Single-Parent Households |
| No Children | 0 (0.0%) | 0 (0.0%) |
| 1 or 2 Children | 0 (0.0%) | 0 (0.0%) |
| 3 or 4 Children | 0 (0.0%) | 0 (0.0%) |
| 5 or more Children | 0 (0.0%) | 0 (0.0%) |
| Total | 0 (0.0%) | 0 (0.0%) |
Race in Mockingbird Valley
The most populous races in Mockingbird Valley are White / Caucasian (154 | 95.7%), Hispanic or Latino (5 | 3.1%), and Two or more Races (5 | 3.1%).
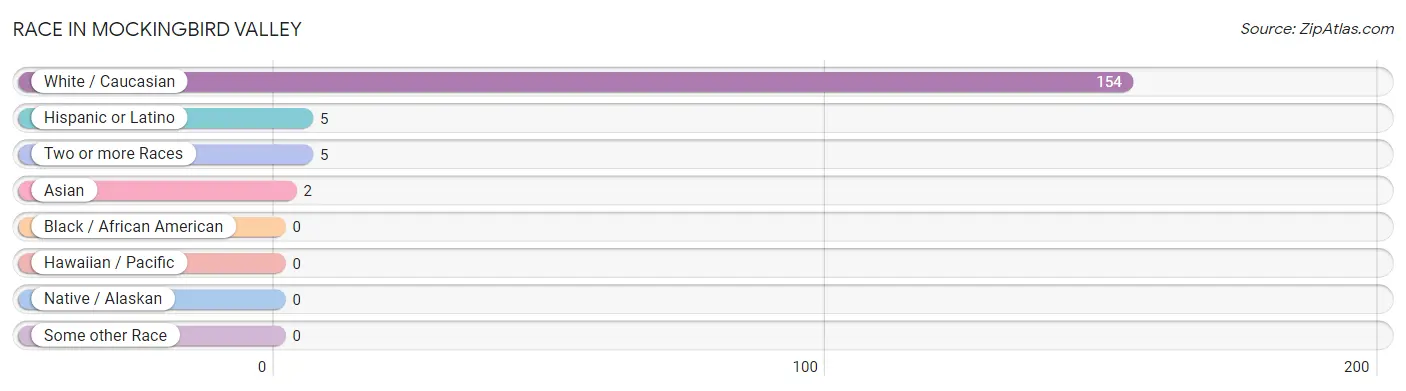
| Race | # Population | % Population |
| Asian | 2 | 1.2% |
| Black / African American | 0 | 0.0% |
| Hawaiian / Pacific | 0 | 0.0% |
| Hispanic or Latino | 5 | 3.1% |
| Native / Alaskan | 0 | 0.0% |
| White / Caucasian | 154 | 95.7% |
| Two or more Races | 5 | 3.1% |
| Some other Race | 0 | 0.0% |
| Total | 161 | 100.0% |
Ancestry in Mockingbird Valley
The most populous ancestries reported in Mockingbird Valley are English (24 | 14.9%), Irish (23 | 14.3%), American (22 | 13.7%), German (18 | 11.2%), and European (11 | 6.8%), together accounting for 60.9% of all Mockingbird Valley residents.
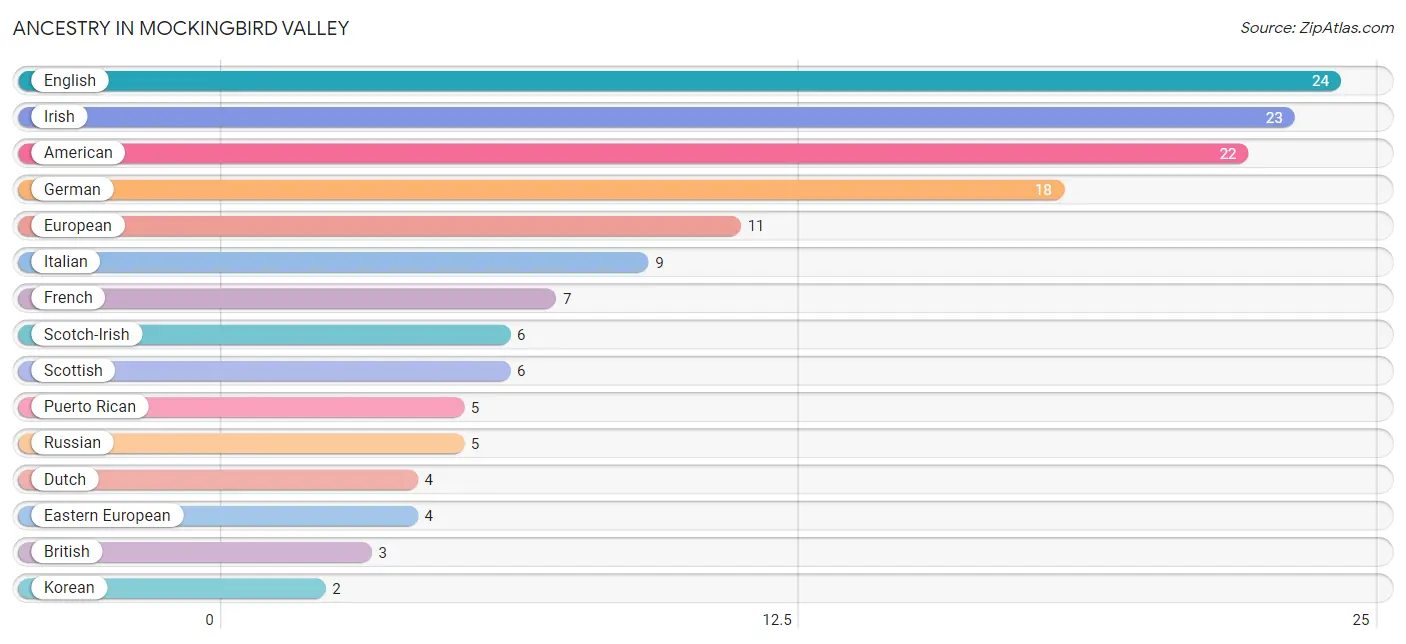
| Ancestry | # Population | % Population |
| American | 22 | 13.7% |
| British | 3 | 1.9% |
| Dutch | 4 | 2.5% |
| Eastern European | 4 | 2.5% |
| English | 24 | 14.9% |
| European | 11 | 6.8% |
| French | 7 | 4.3% |
| German | 18 | 11.2% |
| Irish | 23 | 14.3% |
| Italian | 9 | 5.6% |
| Korean | 2 | 1.2% |
| Polish | 1 | 0.6% |
| Puerto Rican | 5 | 3.1% |
| Romanian | 1 | 0.6% |
| Russian | 5 | 3.1% |
| Scandinavian | 1 | 0.6% |
| Scotch-Irish | 6 | 3.7% |
| Scottish | 6 | 3.7% | View All 18 Rows |
Immigrants in Mockingbird Valley
The most numerous immigrant groups reported in Mockingbird Valley came from Asia (1 | 0.6%), Philippines (1 | 0.6%), and South Eastern Asia (1 | 0.6%), together accounting for 1.9% of all Mockingbird Valley residents.
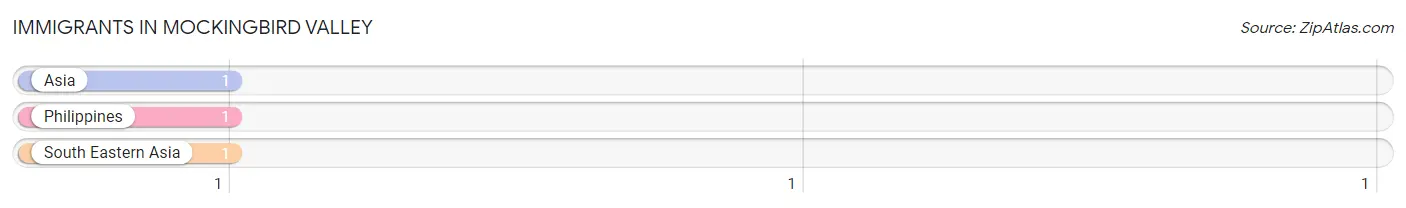
| Immigration Origin | # Population | % Population |
| Asia | 1 | 0.6% |
| Philippines | 1 | 0.6% |
| South Eastern Asia | 1 | 0.6% | View All 3 Rows |
Sex and Age in Mockingbird Valley
Sex and Age in Mockingbird Valley
The most populous age groups in Mockingbird Valley are 45 to 49 Years (11 | 13.8%) for men and 70 to 74 Years (14 | 17.3%) for women.
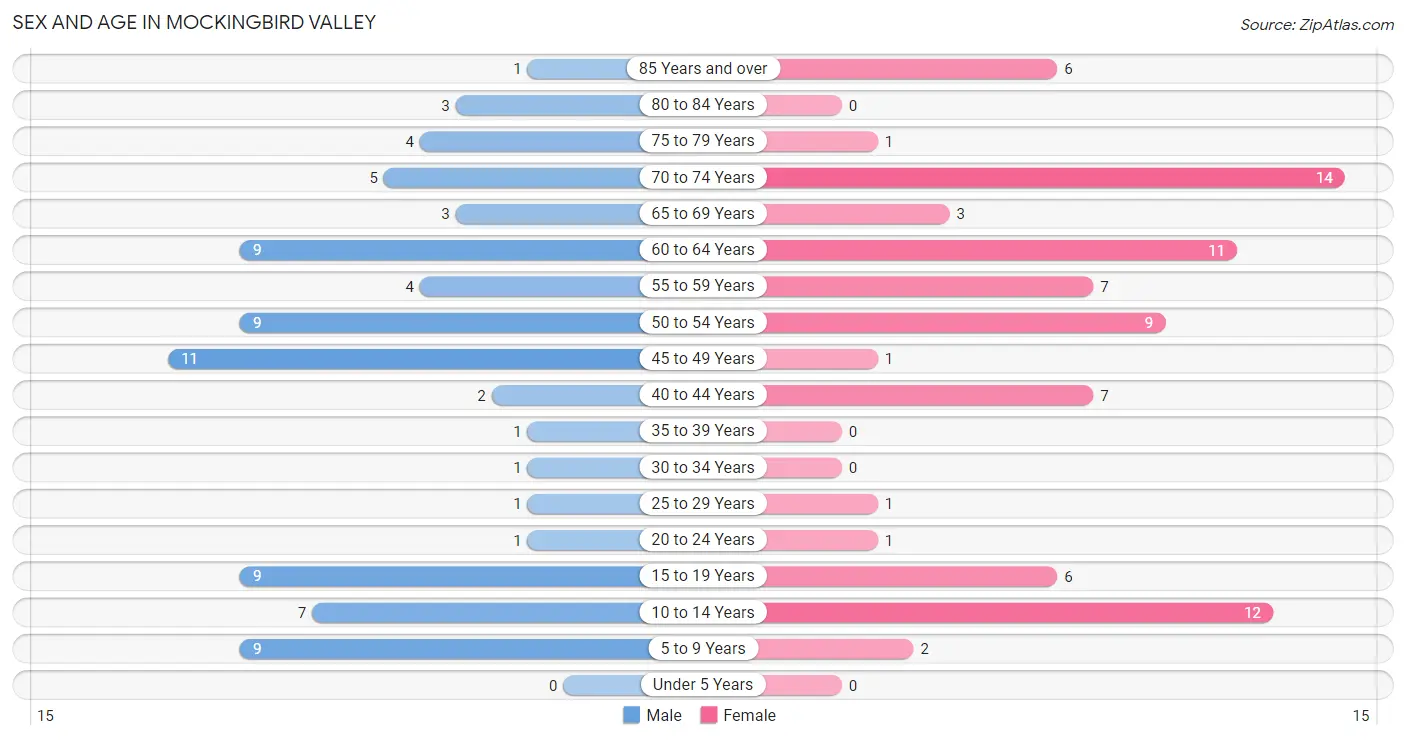
| Age Bracket | Male | Female |
| Under 5 Years | 0 (0.0%) | 0 (0.0%) |
| 5 to 9 Years | 9 (11.3%) | 2 (2.5%) |
| 10 to 14 Years | 7 (8.7%) | 12 (14.8%) |
| 15 to 19 Years | 9 (11.3%) | 6 (7.4%) |
| 20 to 24 Years | 1 (1.3%) | 1 (1.2%) |
| 25 to 29 Years | 1 (1.3%) | 1 (1.2%) |
| 30 to 34 Years | 1 (1.3%) | 0 (0.0%) |
| 35 to 39 Years | 1 (1.3%) | 0 (0.0%) |
| 40 to 44 Years | 2 (2.5%) | 7 (8.6%) |
| 45 to 49 Years | 11 (13.8%) | 1 (1.2%) |
| 50 to 54 Years | 9 (11.3%) | 9 (11.1%) |
| 55 to 59 Years | 4 (5.0%) | 7 (8.6%) |
| 60 to 64 Years | 9 (11.3%) | 11 (13.6%) |
| 65 to 69 Years | 3 (3.7%) | 3 (3.7%) |
| 70 to 74 Years | 5 (6.2%) | 14 (17.3%) |
| 75 to 79 Years | 4 (5.0%) | 1 (1.2%) |
| 80 to 84 Years | 3 (3.7%) | 0 (0.0%) |
| 85 Years and over | 1 (1.3%) | 6 (7.4%) |
| Total | 80 (100.0%) | 81 (100.0%) |
Families and Households in Mockingbird Valley
Median Family Size in Mockingbird Valley
The median family size in Mockingbird Valley is 2.92 persons per family, with single male/father families (3 | 6.1%) accounting for the largest median family size of 3.33 persons per family. On the other hand, married-couple families (45 | 91.8%) represent the smallest median family size with 2.89 persons per family.
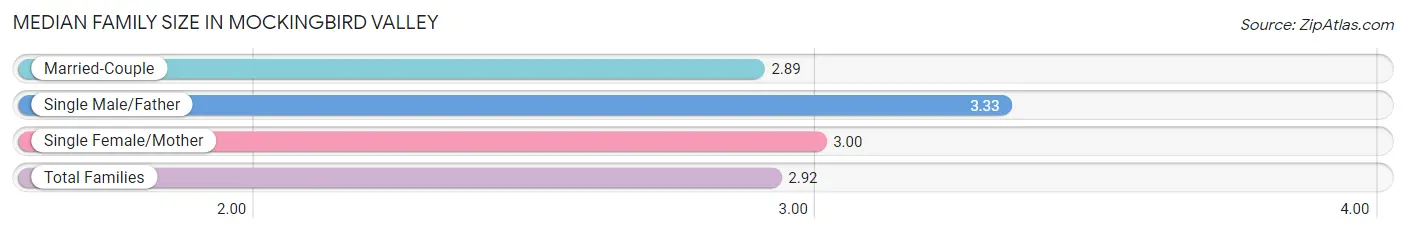
| Family Type | # Families | Family Size |
| Married-Couple | 45 (91.8%) | 2.89 |
| Single Male/Father | 3 (6.1%) | 3.33 |
| Single Female/Mother | 1 (2.0%) | 3.00 |
| Total Families | 49 (100.0%) | 2.92 |
Median Household Size in Mockingbird Valley
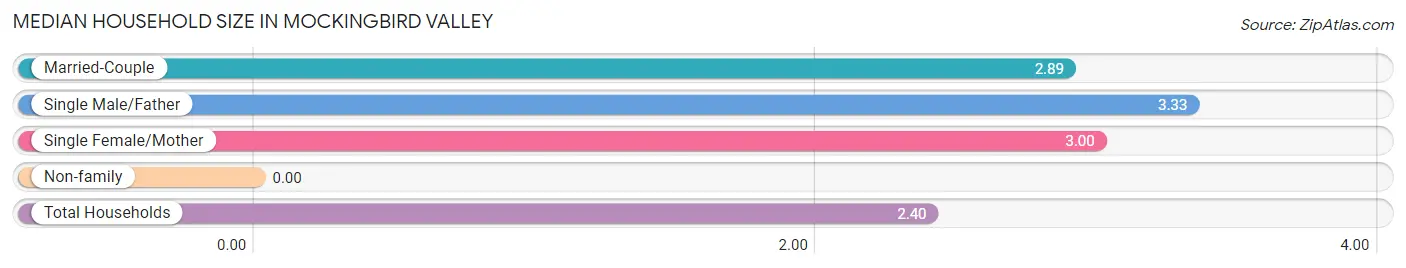
| Household Type | # Households | Household Size |
| Married-Couple | 45 (67.2%) | 2.89 |
| Single Male/Father | 3 (4.5%) | 3.33 |
| Single Female/Mother | 1 (1.5%) | 3.00 |
| Non-family | 18 (26.9%) | - |
| Total Households | 67 (100.0%) | 2.40 |
Household Size by Marriage Status in Mockingbird Valley
Out of a total of 67 households in Mockingbird Valley, 49 (73.1%) are family households, while 18 (26.9%) are nonfamily households. The most numerous type of family households are 2-person households, comprising 26, and the most common type of nonfamily households are 1-person households, comprising 18.
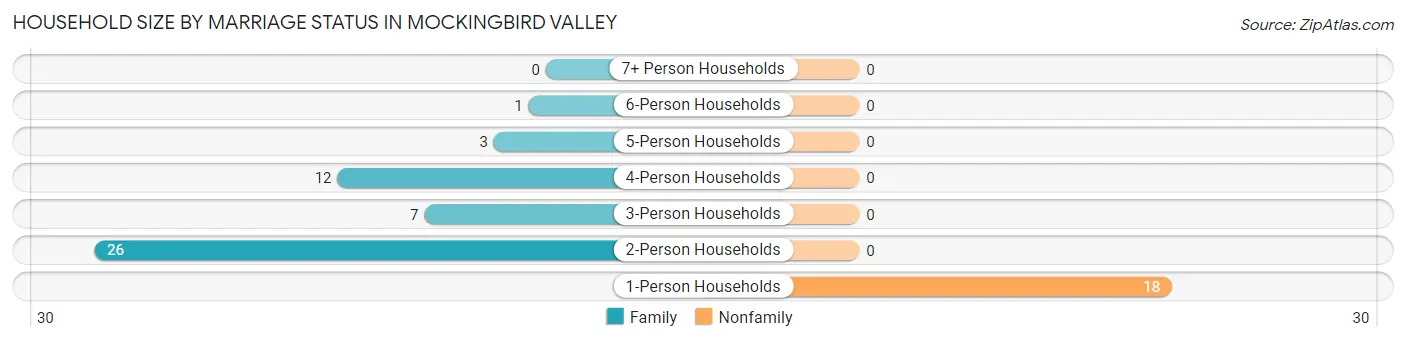
| Household Size | Family Households | Nonfamily Households |
| 1-Person Households | - | 18 (26.9%) |
| 2-Person Households | 26 (38.8%) | 0 (0.0%) |
| 3-Person Households | 7 (10.4%) | 0 (0.0%) |
| 4-Person Households | 12 (17.9%) | 0 (0.0%) |
| 5-Person Households | 3 (4.5%) | 0 (0.0%) |
| 6-Person Households | 1 (1.5%) | 0 (0.0%) |
| 7+ Person Households | 0 (0.0%) | 0 (0.0%) |
| Total | 49 (73.1%) | 18 (26.9%) |
Female Fertility in Mockingbird Valley
Fertility by Age in Mockingbird Valley
| Age Bracket | Women with Births | Births / 1,000 Women |
| 15 to 19 years | 0 (0.0%) | 0.0 |
| 20 to 34 years | 0 (0.0%) | 0.0 |
| 35 to 50 years | 0 (0.0%) | 0.0 |
| Total | 0 (0.0%) | 0.0 |
Fertility by Age by Marriage Status in Mockingbird Valley
| Age Bracket | Married | Unmarried |
| 15 to 19 years | 0 (0.0%) | 0 (0.0%) |
| 20 to 34 years | 0 (0.0%) | 0 (0.0%) |
| 35 to 50 years | 0 (0.0%) | 0 (0.0%) |
| Total | 0 (0.0%) | 0 (0.0%) |
Fertility by Education in Mockingbird Valley
| Educational Attainment | Women with Births | Births / 1,000 Women |
| Less than High School | 0 (0.0%) | 0.0 |
| High School Diploma | 0 (0.0%) | 0.0 |
| College or Associate's Degree | 0 (0.0%) | 0.0 |
| Bachelor's Degree | 0 (0.0%) | 0.0 |
| Graduate Degree | 0 (0.0%) | 0.0 |
| Total | 0 (0.0%) | 0.0 |
Fertility by Education by Marriage Status in Mockingbird Valley
| Educational Attainment | Married | Unmarried |
| Less than High School | 0 (0.0%) | 0 (0.0%) |
| High School Diploma | 0 (0.0%) | 0 (0.0%) |
| College or Associate's Degree | 0 (0.0%) | 0 (0.0%) |
| Bachelor's Degree | 0 (0.0%) | 0 (0.0%) |
| Graduate Degree | 0 (0.0%) | 0 (0.0%) |
| Total | 0 (0.0%) | 0 (0.0%) |
Employment Characteristics in Mockingbird Valley
Employment by Class of Employer in Mockingbird Valley
Among the 58 employed individuals in Mockingbird Valley, private company employees (35 | 60.3%), self-employed (not incorporated) (13 | 22.4%), and self-employed (incorporated) (6 | 10.3%) make up the most common classes of employment.
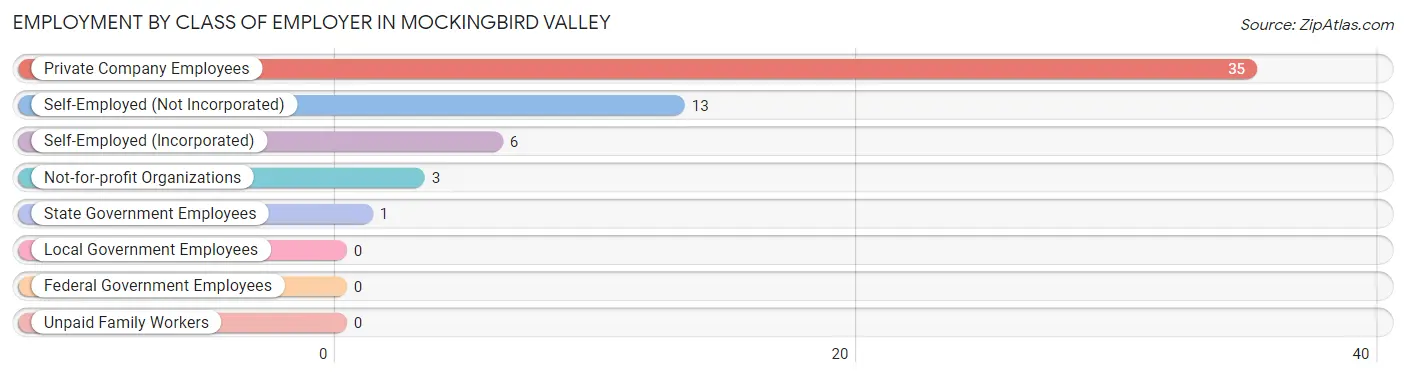
| Employer Class | # Employees | % Employees |
| Private Company Employees | 35 | 60.3% |
| Self-Employed (Incorporated) | 6 | 10.3% |
| Self-Employed (Not Incorporated) | 13 | 22.4% |
| Not-for-profit Organizations | 3 | 5.2% |
| Local Government Employees | 0 | 0.0% |
| State Government Employees | 1 | 1.7% |
| Federal Government Employees | 0 | 0.0% |
| Unpaid Family Workers | 0 | 0.0% |
| Total | 58 | 100.0% |
Employment Status by Age in Mockingbird Valley
According to the labor force statistics for Mockingbird Valley, out of the total population over 16 years of age (127), 46.5% or 59 individuals are in the labor force, with 1.7% or 1 of them unemployed. The age group with the highest labor force participation rate is 25 to 29 years, with 100.0% or 2 individuals in the labor force. Within the labor force, the 20 to 24 years age range has the highest percentage of unemployed individuals, with 100.0% or 1 of them being unemployed.
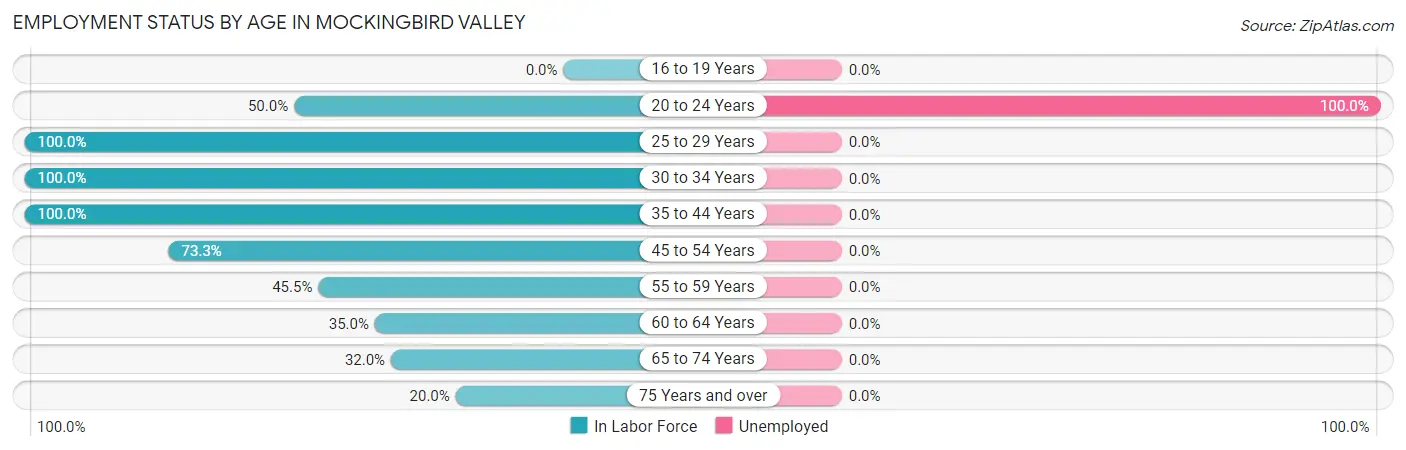
| Age Bracket | In Labor Force | Unemployed |
| 16 to 19 Years | 0 (0.0%) | 0 (0.0%) |
| 20 to 24 Years | 1 (50.0%) | 1 (100.0%) |
| 25 to 29 Years | 2 (100.0%) | 0 (0.0%) |
| 30 to 34 Years | 1 (100.0%) | 0 (0.0%) |
| 35 to 44 Years | 10 (100.0%) | 0 (0.0%) |
| 45 to 54 Years | 22 (73.3%) | 0 (0.0%) |
| 55 to 59 Years | 5 (45.5%) | 0 (0.0%) |
| 60 to 64 Years | 7 (35.0%) | 0 (0.0%) |
| 65 to 74 Years | 8 (32.0%) | 0 (0.0%) |
| 75 Years and over | 3 (20.0%) | 0 (0.0%) |
| Total | 59 (46.5%) | 1 (1.7%) |
Employment Status by Educational Attainment in Mockingbird Valley
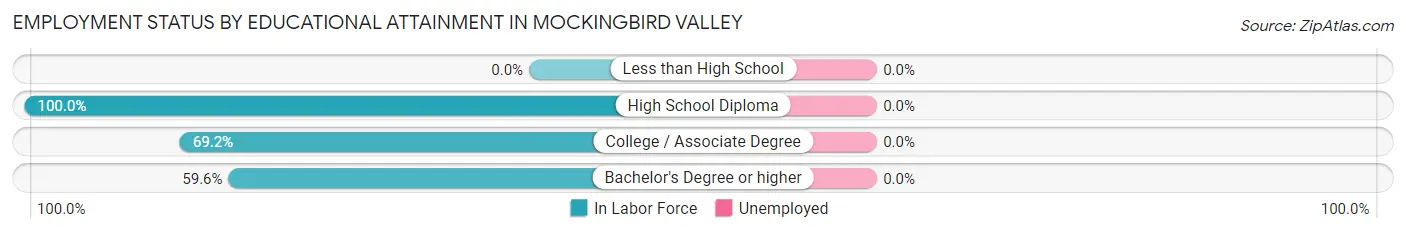
| Educational Attainment | In Labor Force | Unemployed |
| Less than High School | 0 (0.0%) | 0 (0.0%) |
| High School Diploma | 4 (100.0%) | 0 (0.0%) |
| College / Associate Degree | 9 (69.2%) | 0 (0.0%) |
| Bachelor's Degree or higher | 34 (59.6%) | 0 (0.0%) |
| Total | 47 (63.5%) | 0 (0.0%) |
Employment Occupations by Sex in Mockingbird Valley
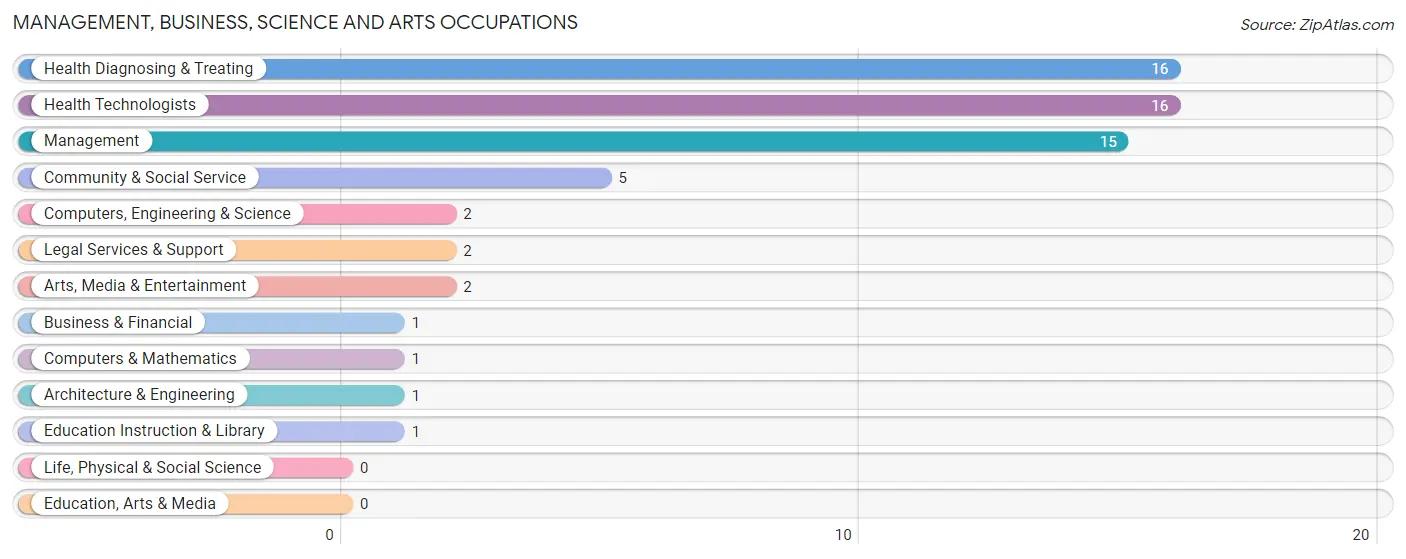
Management, Business, Science and Arts Occupations
The most common Management, Business, Science and Arts occupations in Mockingbird Valley are Health Diagnosing & Treating (16 | 27.6%), Health Technologists (16 | 27.6%), Management (15 | 25.9%), Community & Social Service (5 | 8.6%), and Computers, Engineering & Science (2 | 3.5%).
Management, Business, Science and Arts Occupations by Sex
Within the Management, Business, Science and Arts occupations in Mockingbird Valley, the most male-oriented occupations are Business & Financial (100.0%), Computers, Engineering & Science (100.0%), and Computers & Mathematics (100.0%), while the most female-oriented occupations are Education Instruction & Library (100.0%), Arts, Media & Entertainment (100.0%), and Community & Social Service (80.0%).
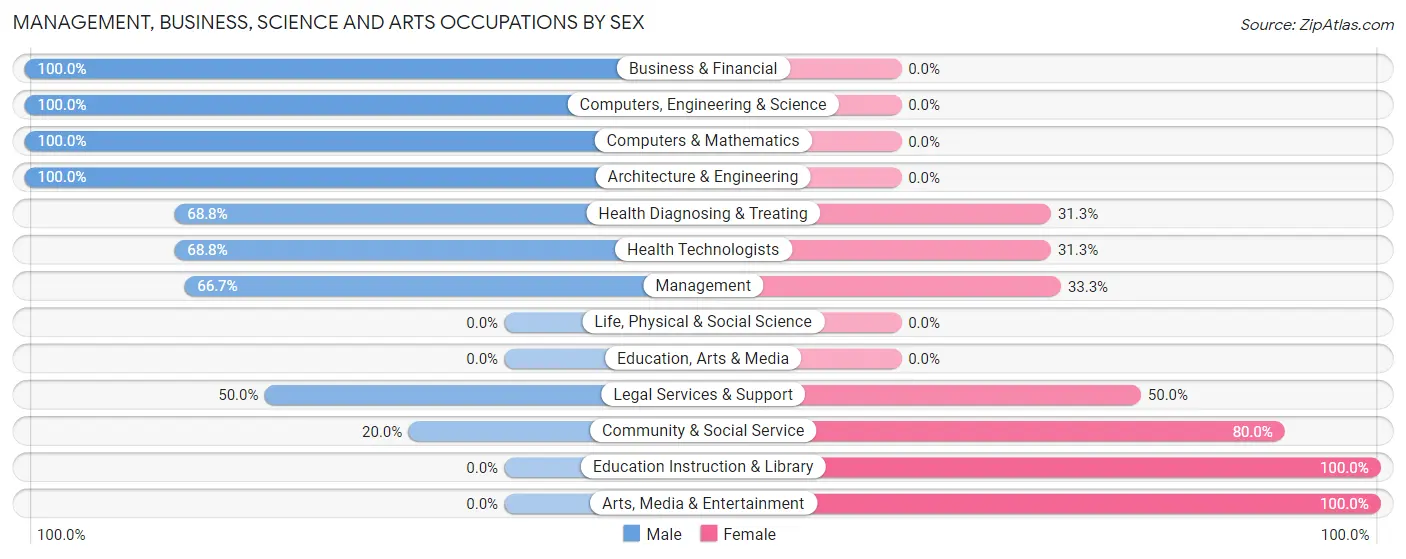
| Occupation | Male | Female |
| Management | 10 (66.7%) | 5 (33.3%) |
| Business & Financial | 1 (100.0%) | 0 (0.0%) |
| Computers, Engineering & Science | 2 (100.0%) | 0 (0.0%) |
| Computers & Mathematics | 1 (100.0%) | 0 (0.0%) |
| Architecture & Engineering | 1 (100.0%) | 0 (0.0%) |
| Life, Physical & Social Science | 0 (0.0%) | 0 (0.0%) |
| Community & Social Service | 1 (20.0%) | 4 (80.0%) |
| Education, Arts & Media | 0 (0.0%) | 0 (0.0%) |
| Legal Services & Support | 1 (50.0%) | 1 (50.0%) |
| Education Instruction & Library | 0 (0.0%) | 1 (100.0%) |
| Arts, Media & Entertainment | 0 (0.0%) | 2 (100.0%) |
| Health Diagnosing & Treating | 11 (68.8%) | 5 (31.2%) |
| Health Technologists | 11 (68.8%) | 5 (31.2%) |
| Total (Category) | 25 (64.1%) | 14 (35.9%) |
| Total (Overall) | 39 (67.2%) | 19 (32.8%) |
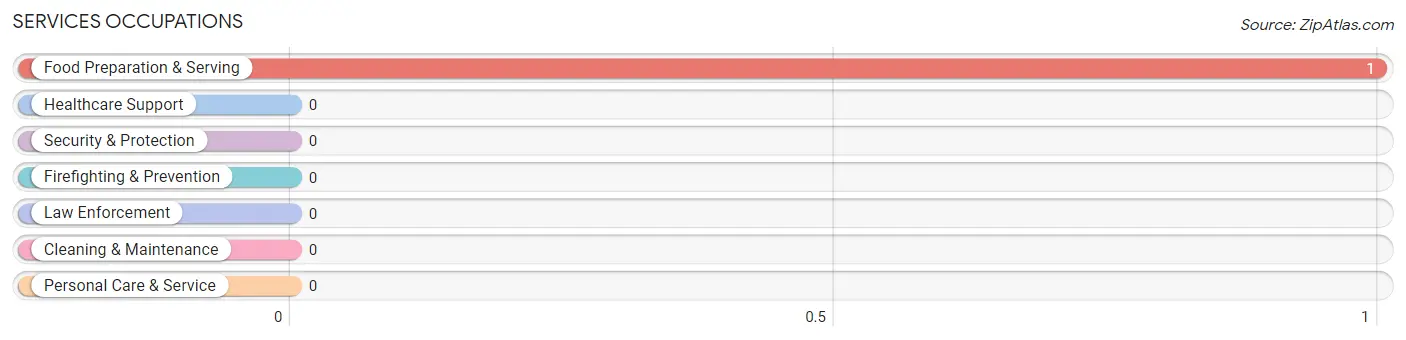
Services Occupations
The most common Services occupations in Mockingbird Valley are , and Food Preparation & Serving (1 | 1.7%).
Services Occupations by Sex
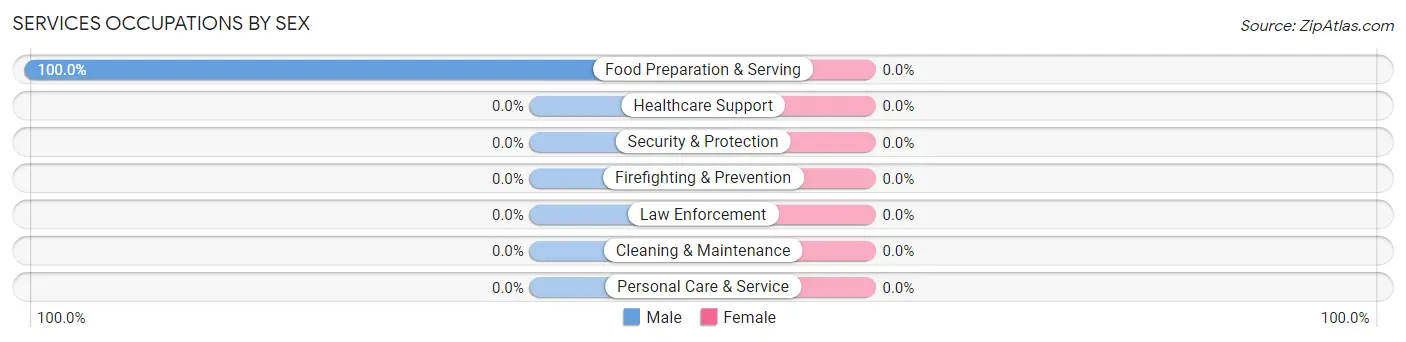
| Occupation | Male | Female |
| Healthcare Support | 0 (0.0%) | 0 (0.0%) |
| Security & Protection | 0 (0.0%) | 0 (0.0%) |
| Firefighting & Prevention | 0 (0.0%) | 0 (0.0%) |
| Law Enforcement | 0 (0.0%) | 0 (0.0%) |
| Food Preparation & Serving | 1 (100.0%) | 0 (0.0%) |
| Cleaning & Maintenance | 0 (0.0%) | 0 (0.0%) |
| Personal Care & Service | 0 (0.0%) | 0 (0.0%) |
| Total (Category) | 1 (100.0%) | 0 (0.0%) |
| Total (Overall) | 39 (67.2%) | 19 (32.8%) |
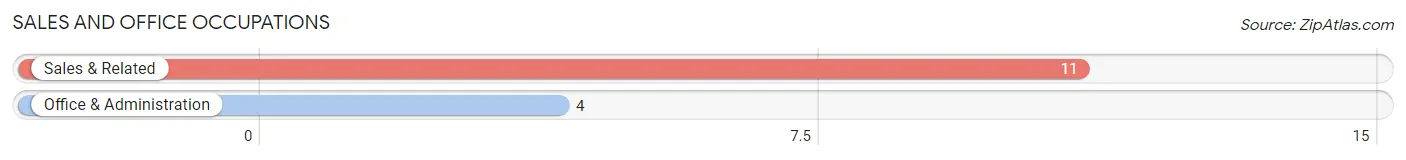
Sales and Office Occupations
The most common Sales and Office occupations in Mockingbird Valley are Sales & Related (11 | 19.0%), and Office & Administration (4 | 6.9%).
Sales and Office Occupations by Sex
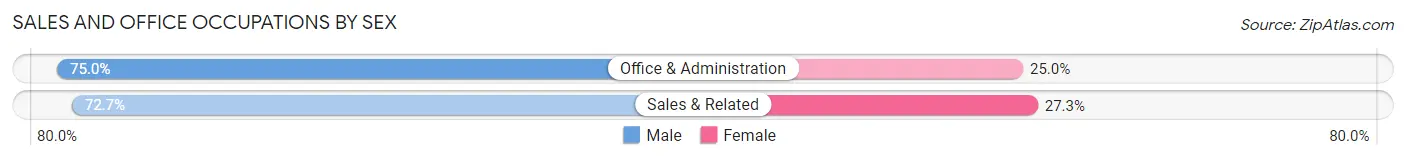
| Occupation | Male | Female |
| Sales & Related | 8 (72.7%) | 3 (27.3%) |
| Office & Administration | 3 (75.0%) | 1 (25.0%) |
| Total (Category) | 11 (73.3%) | 4 (26.7%) |
| Total (Overall) | 39 (67.2%) | 19 (32.8%) |
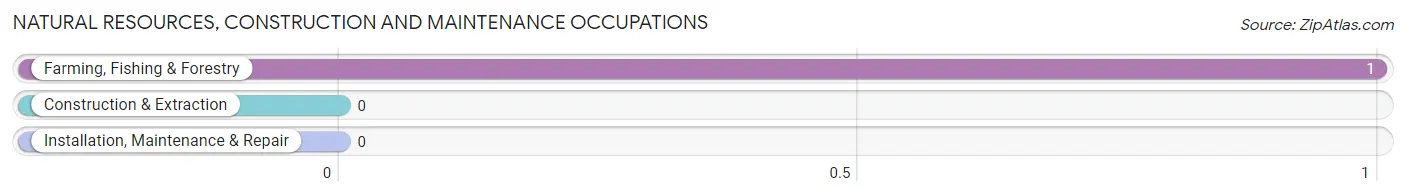
Natural Resources, Construction and Maintenance Occupations
The most common Natural Resources, Construction and Maintenance occupations in Mockingbird Valley are , and Farming, Fishing & Forestry (1 | 1.7%).
Natural Resources, Construction and Maintenance Occupations by Sex
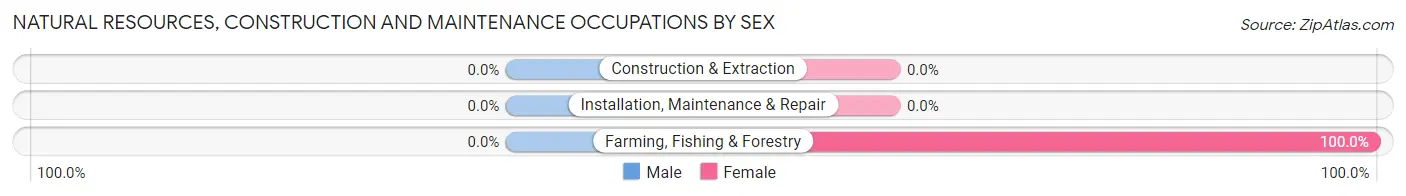
| Occupation | Male | Female |
| Farming, Fishing & Forestry | 0 (0.0%) | 1 (100.0%) |
| Construction & Extraction | 0 (0.0%) | 0 (0.0%) |
| Installation, Maintenance & Repair | 0 (0.0%) | 0 (0.0%) |
| Total (Category) | 0 (0.0%) | 1 (100.0%) |
| Total (Overall) | 39 (67.2%) | 19 (32.8%) |
Production, Transportation and Moving Occupations
The most common Production, Transportation and Moving occupations in Mockingbird Valley are , and Production (2 | 3.5%).
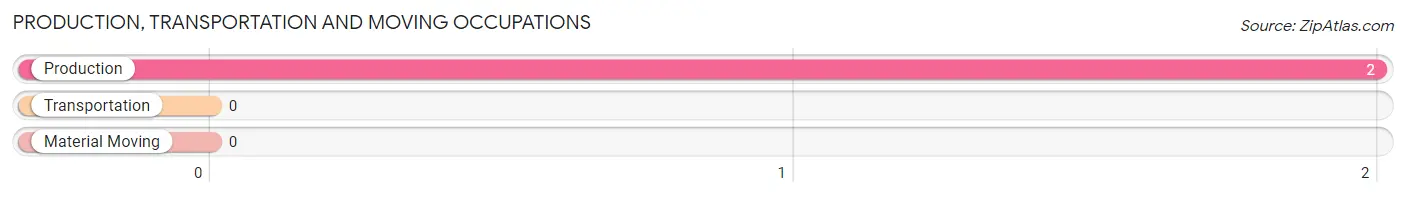
Production, Transportation and Moving Occupations by Sex
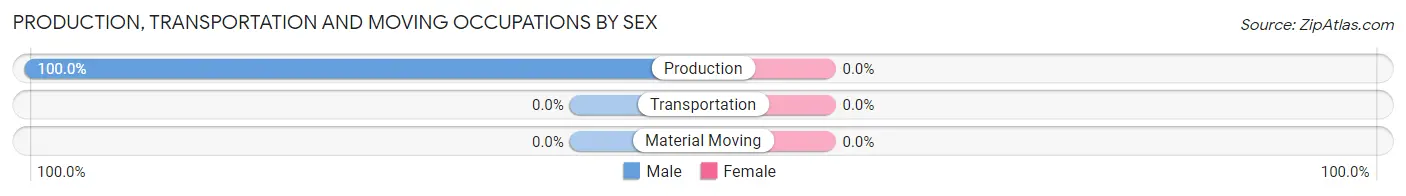
| Occupation | Male | Female |
| Production | 2 (100.0%) | 0 (0.0%) |
| Transportation | 0 (0.0%) | 0 (0.0%) |
| Material Moving | 0 (0.0%) | 0 (0.0%) |
| Total (Category) | 2 (100.0%) | 0 (0.0%) |
| Total (Overall) | 39 (67.2%) | 19 (32.8%) |
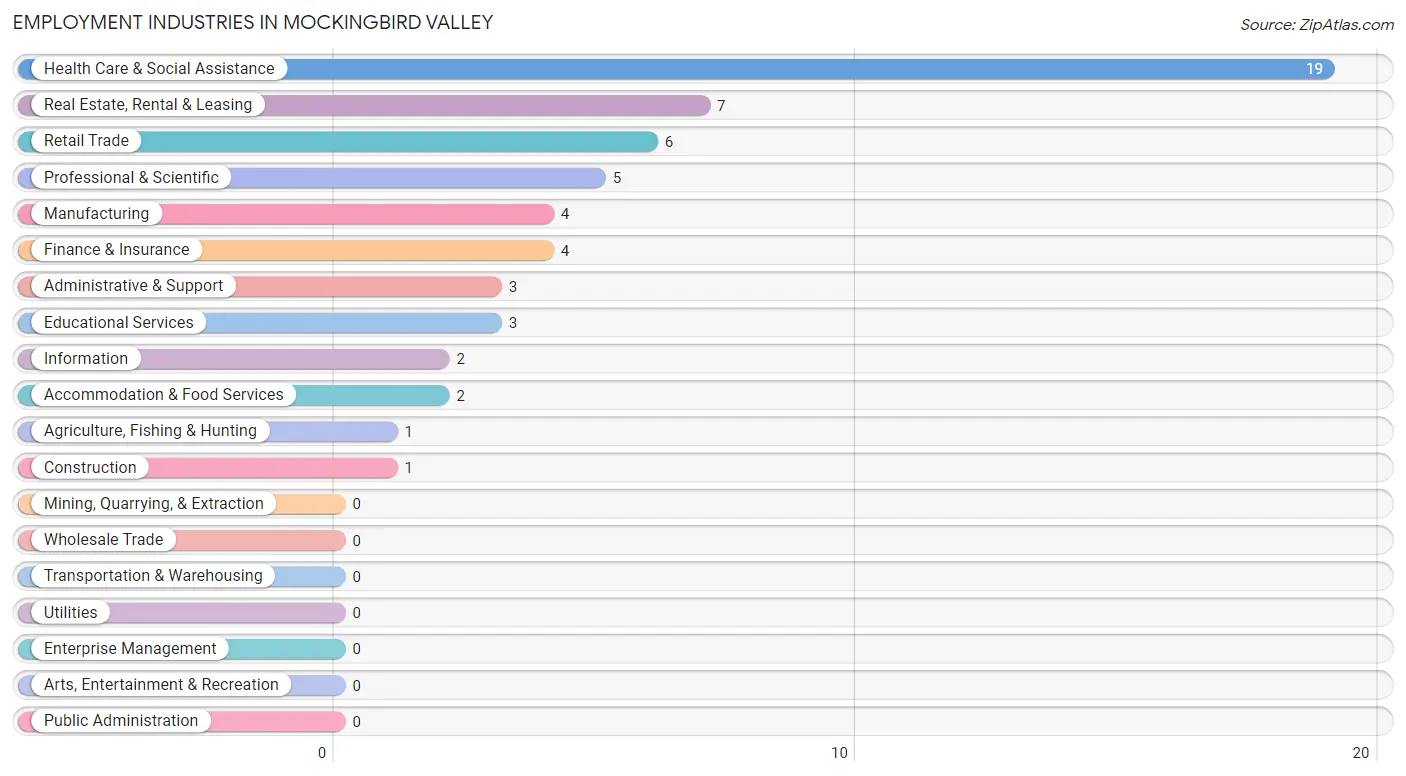
Employment Industries by Sex in Mockingbird Valley
Employment Industries in Mockingbird Valley
The major employment industries in Mockingbird Valley include Health Care & Social Assistance (19 | 32.8%), Real Estate, Rental & Leasing (7 | 12.1%), Retail Trade (6 | 10.3%), Professional & Scientific (5 | 8.6%), and Manufacturing (4 | 6.9%).
Employment Industries by Sex in Mockingbird Valley
The Mockingbird Valley industries that see more men than women are Construction (100.0%), Manufacturing (100.0%), and Information (100.0%), whereas the industries that tend to have a higher number of women are Agriculture, Fishing & Hunting (100.0%), Educational Services (100.0%), and Accommodation & Food Services (50.0%).
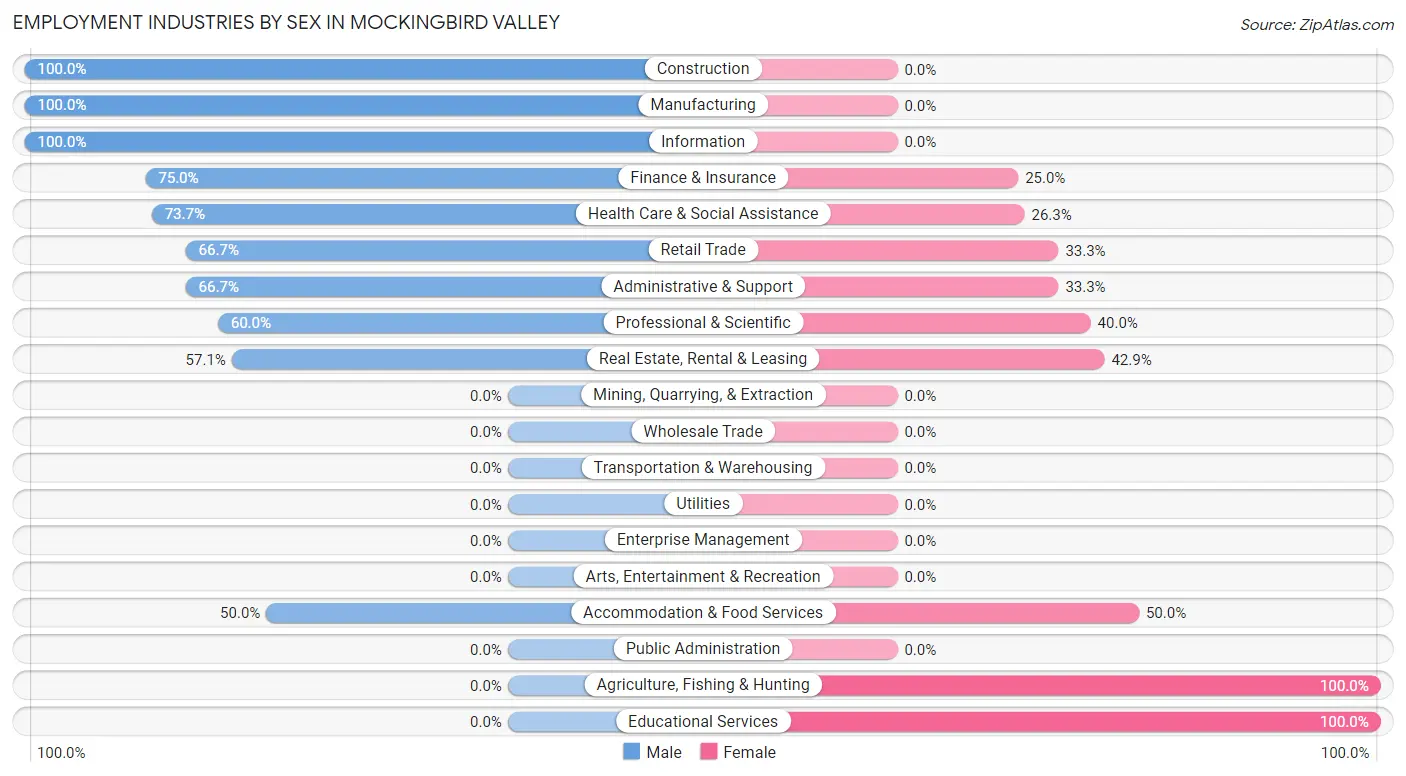
| Industry | Male | Female |
| Agriculture, Fishing & Hunting | 0 (0.0%) | 1 (100.0%) |
| Mining, Quarrying, & Extraction | 0 (0.0%) | 0 (0.0%) |
| Construction | 1 (100.0%) | 0 (0.0%) |
| Manufacturing | 4 (100.0%) | 0 (0.0%) |
| Wholesale Trade | 0 (0.0%) | 0 (0.0%) |
| Retail Trade | 4 (66.7%) | 2 (33.3%) |
| Transportation & Warehousing | 0 (0.0%) | 0 (0.0%) |
| Utilities | 0 (0.0%) | 0 (0.0%) |
| Information | 2 (100.0%) | 0 (0.0%) |
| Finance & Insurance | 3 (75.0%) | 1 (25.0%) |
| Real Estate, Rental & Leasing | 4 (57.1%) | 3 (42.9%) |
| Professional & Scientific | 3 (60.0%) | 2 (40.0%) |
| Enterprise Management | 0 (0.0%) | 0 (0.0%) |
| Administrative & Support | 2 (66.7%) | 1 (33.3%) |
| Educational Services | 0 (0.0%) | 3 (100.0%) |
| Health Care & Social Assistance | 14 (73.7%) | 5 (26.3%) |
| Arts, Entertainment & Recreation | 0 (0.0%) | 0 (0.0%) |
| Accommodation & Food Services | 1 (50.0%) | 1 (50.0%) |
| Public Administration | 0 (0.0%) | 0 (0.0%) |
| Total | 39 (67.2%) | 19 (32.8%) |
Education in Mockingbird Valley
School Enrollment in Mockingbird Valley
The most common levels of schooling among the 44 students in Mockingbird Valley are middle school (18 | 40.9%), high school (13 | 29.5%), and elementary school (10 | 22.7%).
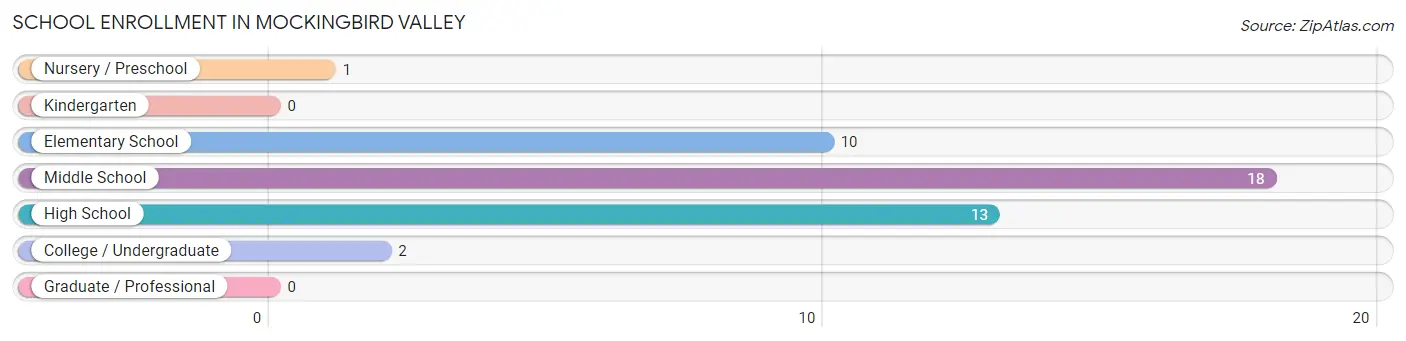
| School Level | # Students | % Students |
| Nursery / Preschool | 1 | 2.3% |
| Kindergarten | 0 | 0.0% |
| Elementary School | 10 | 22.7% |
| Middle School | 18 | 40.9% |
| High School | 13 | 29.5% |
| College / Undergraduate | 2 | 4.5% |
| Graduate / Professional | 0 | 0.0% |
| Total | 44 | 100.0% |
School Enrollment by Age by Funding Source in Mockingbird Valley
Out of a total of 44 students who are enrolled in schools in Mockingbird Valley, 31 (70.5%) attend a private institution, while the remaining 13 (29.5%) are enrolled in public schools. The age group of 10 to 14 year olds has the highest likelihood of being enrolled in private schools, with 17 (89.5% in the age bracket) enrolled. Conversely, the age group of 18 to 19 year olds has the lowest likelihood of being enrolled in a private school, with 1 (100.0% in the age bracket) attending a public institution.
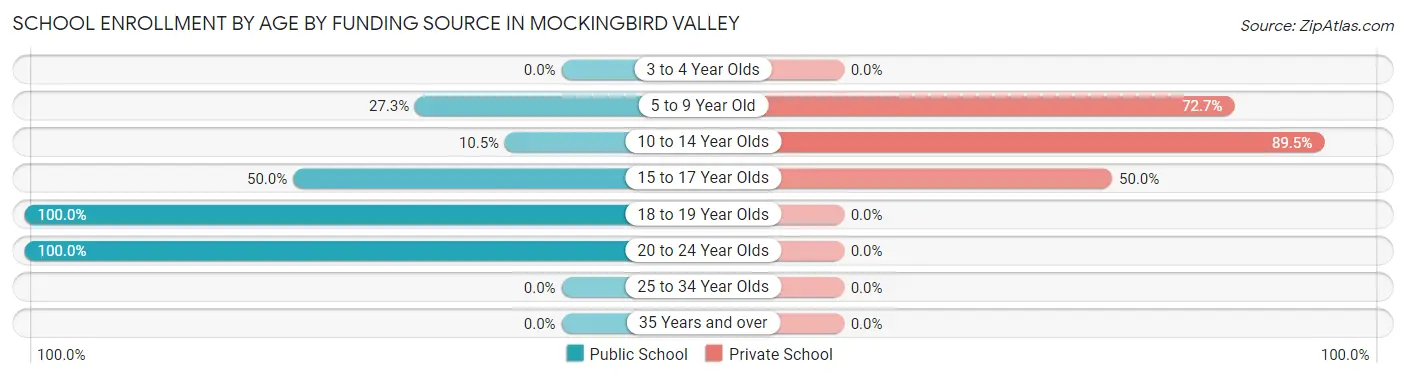
| Age Bracket | Public School | Private School |
| 3 to 4 Year Olds | 0 (0.0%) | 0 (0.0%) |
| 5 to 9 Year Old | 3 (27.3%) | 8 (72.7%) |
| 10 to 14 Year Olds | 2 (10.5%) | 17 (89.5%) |
| 15 to 17 Year Olds | 6 (50.0%) | 6 (50.0%) |
| 18 to 19 Year Olds | 1 (100.0%) | 0 (0.0%) |
| 20 to 24 Year Olds | 1 (100.0%) | 0 (0.0%) |
| 25 to 34 Year Olds | 0 (0.0%) | 0 (0.0%) |
| 35 Years and over | 0 (0.0%) | 0 (0.0%) |
| Total | 13 (29.5%) | 31 (70.5%) |
Educational Attainment by Field of Study in Mockingbird Valley
Business (19 | 19.8%), social sciences (10 | 10.4%), bio, nature & agricultural (9 | 9.4%), psychology (8 | 8.3%), and computers & mathematics (7 | 7.3%) are the most common fields of study among 96 individuals in Mockingbird Valley who have obtained a bachelor's degree or higher.
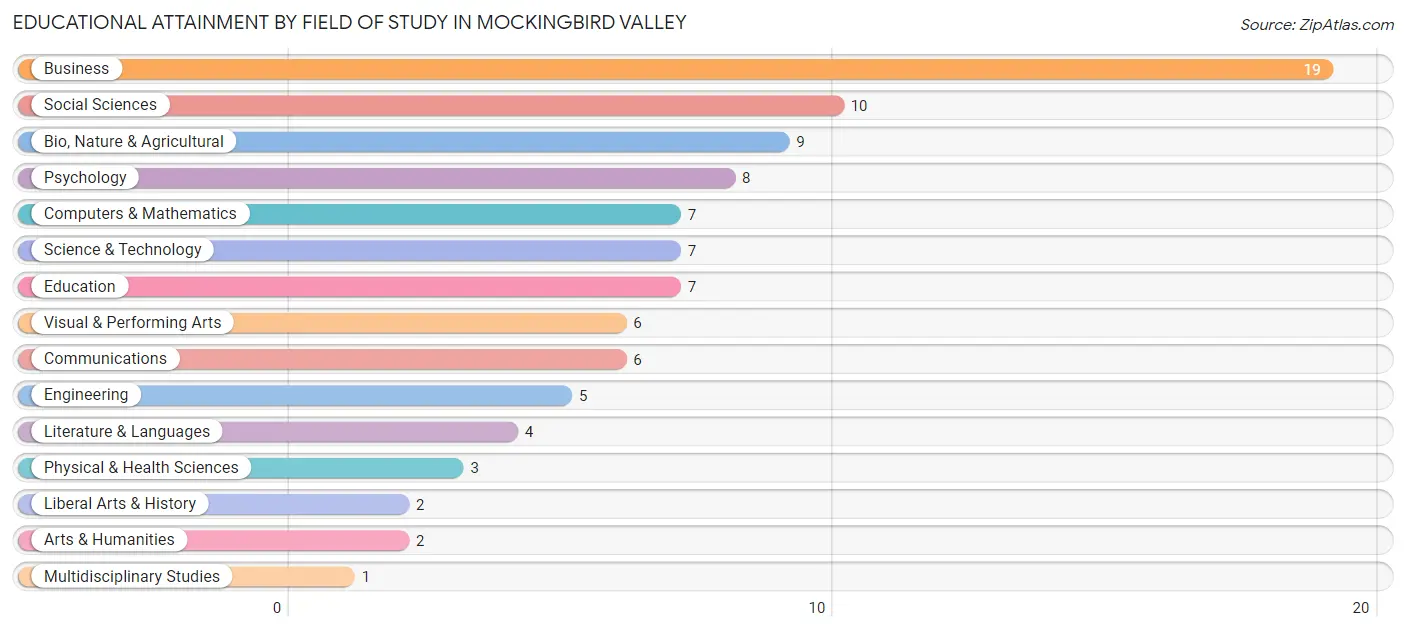
| Field of Study | # Graduates | % Graduates |
| Computers & Mathematics | 7 | 7.3% |
| Bio, Nature & Agricultural | 9 | 9.4% |
| Physical & Health Sciences | 3 | 3.1% |
| Psychology | 8 | 8.3% |
| Social Sciences | 10 | 10.4% |
| Engineering | 5 | 5.2% |
| Multidisciplinary Studies | 1 | 1.0% |
| Science & Technology | 7 | 7.3% |
| Business | 19 | 19.8% |
| Education | 7 | 7.3% |
| Literature & Languages | 4 | 4.2% |
| Liberal Arts & History | 2 | 2.1% |
| Visual & Performing Arts | 6 | 6.2% |
| Communications | 6 | 6.2% |
| Arts & Humanities | 2 | 2.1% |
| Total | 96 | 100.0% |
Transportation & Commute in Mockingbird Valley
Vehicle Availability by Sex in Mockingbird Valley
The most prevalent vehicle ownership categories in Mockingbird Valley are males with 2 vehicles (19, accounting for 48.7%) and females with 2 vehicles (3, making up 100.0%).
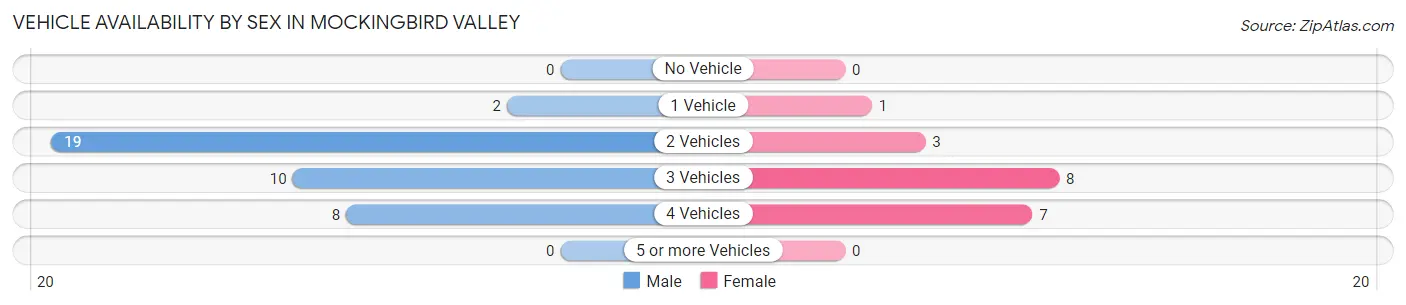
| Vehicles Available | Male | Female |
| No Vehicle | 0 (0.0%) | 0 (0.0%) |
| 1 Vehicle | 2 (5.1%) | 1 (5.3%) |
| 2 Vehicles | 19 (48.7%) | 3 (15.8%) |
| 3 Vehicles | 10 (25.6%) | 8 (42.1%) |
| 4 Vehicles | 8 (20.5%) | 7 (36.8%) |
| 5 or more Vehicles | 0 (0.0%) | 0 (0.0%) |
| Total | 39 (100.0%) | 19 (100.0%) |
Commute Time in Mockingbird Valley
The most frequently occuring commute durations in Mockingbird Valley are 15 to 19 minutes (17 commuters, 31.5%), 20 to 24 minutes (14 commuters, 25.9%), and 10 to 14 minutes (7 commuters, 13.0%).
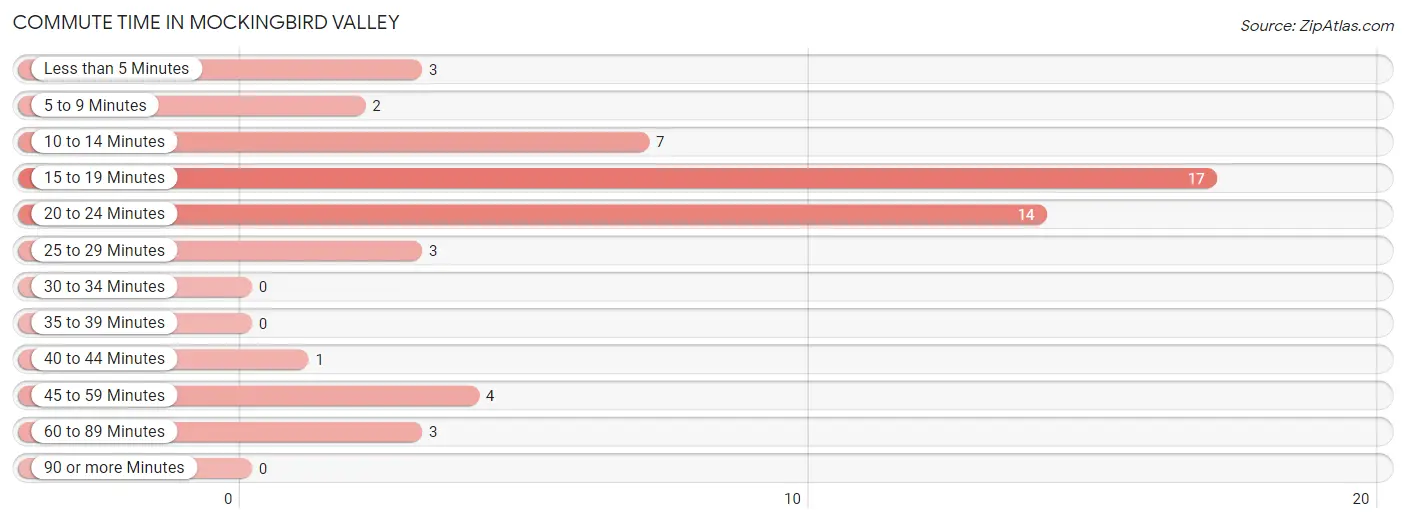
| Commute Time | # Commuters | % Commuters |
| Less than 5 Minutes | 3 | 5.6% |
| 5 to 9 Minutes | 2 | 3.7% |
| 10 to 14 Minutes | 7 | 13.0% |
| 15 to 19 Minutes | 17 | 31.5% |
| 20 to 24 Minutes | 14 | 25.9% |
| 25 to 29 Minutes | 3 | 5.6% |
| 30 to 34 Minutes | 0 | 0.0% |
| 35 to 39 Minutes | 0 | 0.0% |
| 40 to 44 Minutes | 1 | 1.8% |
| 45 to 59 Minutes | 4 | 7.4% |
| 60 to 89 Minutes | 3 | 5.6% |
| 90 or more Minutes | 0 | 0.0% |
Commute Time by Sex in Mockingbird Valley
The most common commute times in Mockingbird Valley are 15 to 19 minutes (15 commuters, 39.5%) for males and 20 to 24 minutes (6 commuters, 37.5%) for females.
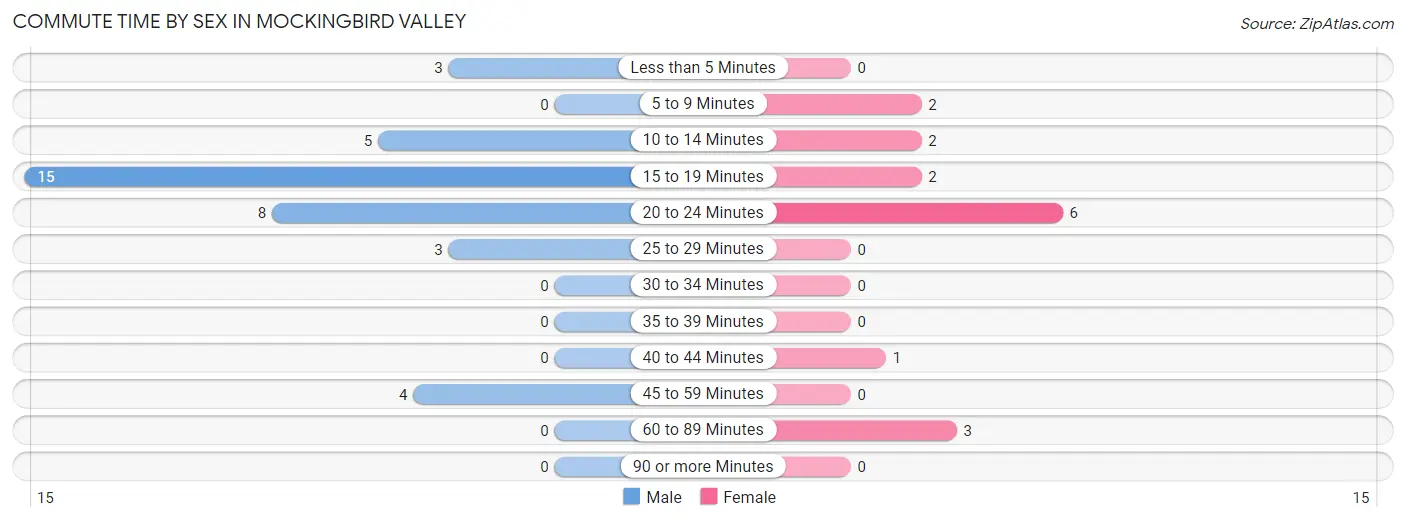
| Commute Time | Male | Female |
| Less than 5 Minutes | 3 (7.9%) | 0 (0.0%) |
| 5 to 9 Minutes | 0 (0.0%) | 2 (12.5%) |
| 10 to 14 Minutes | 5 (13.2%) | 2 (12.5%) |
| 15 to 19 Minutes | 15 (39.5%) | 2 (12.5%) |
| 20 to 24 Minutes | 8 (21.0%) | 6 (37.5%) |
| 25 to 29 Minutes | 3 (7.9%) | 0 (0.0%) |
| 30 to 34 Minutes | 0 (0.0%) | 0 (0.0%) |
| 35 to 39 Minutes | 0 (0.0%) | 0 (0.0%) |
| 40 to 44 Minutes | 0 (0.0%) | 1 (6.2%) |
| 45 to 59 Minutes | 4 (10.5%) | 0 (0.0%) |
| 60 to 89 Minutes | 0 (0.0%) | 3 (18.8%) |
| 90 or more Minutes | 0 (0.0%) | 0 (0.0%) |
Time of Departure to Work by Sex in Mockingbird Valley
The most frequent times of departure to work in Mockingbird Valley are 7:00 AM to 7:29 AM (12, 31.6%) for males and 7:30 AM to 7:59 AM (5, 31.2%) for females.
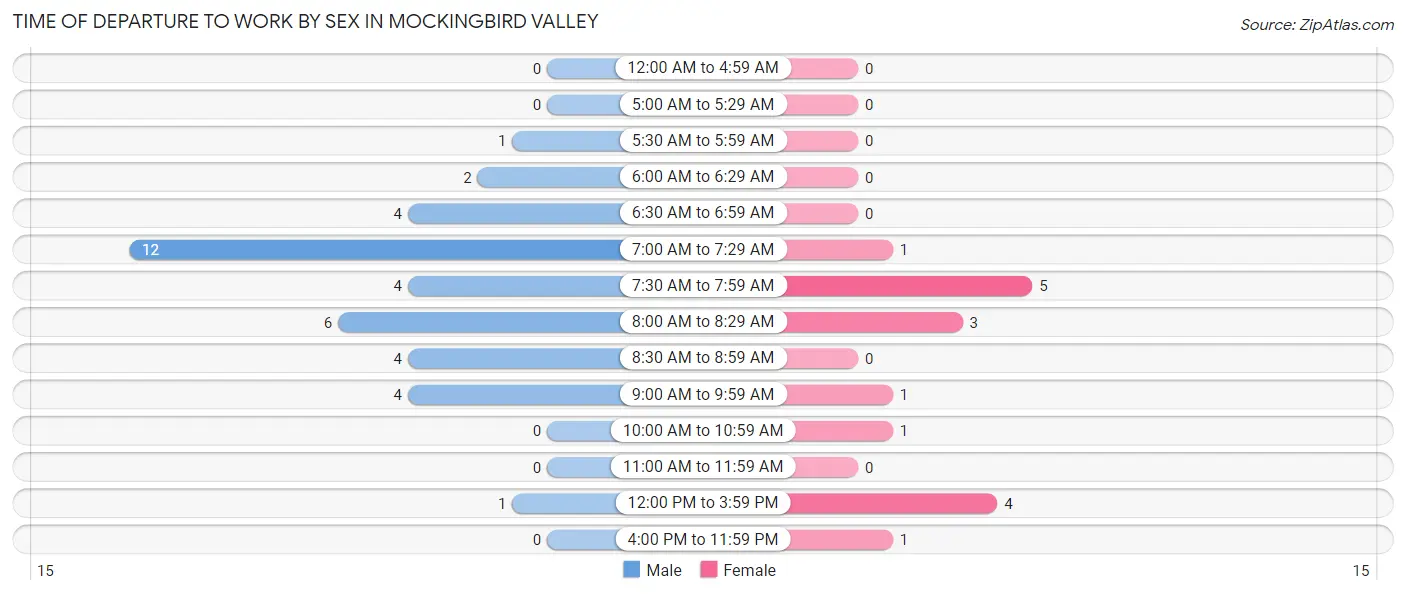
| Time of Departure | Male | Female |
| 12:00 AM to 4:59 AM | 0 (0.0%) | 0 (0.0%) |
| 5:00 AM to 5:29 AM | 0 (0.0%) | 0 (0.0%) |
| 5:30 AM to 5:59 AM | 1 (2.6%) | 0 (0.0%) |
| 6:00 AM to 6:29 AM | 2 (5.3%) | 0 (0.0%) |
| 6:30 AM to 6:59 AM | 4 (10.5%) | 0 (0.0%) |
| 7:00 AM to 7:29 AM | 12 (31.6%) | 1 (6.2%) |
| 7:30 AM to 7:59 AM | 4 (10.5%) | 5 (31.2%) |
| 8:00 AM to 8:29 AM | 6 (15.8%) | 3 (18.8%) |
| 8:30 AM to 8:59 AM | 4 (10.5%) | 0 (0.0%) |
| 9:00 AM to 9:59 AM | 4 (10.5%) | 1 (6.2%) |
| 10:00 AM to 10:59 AM | 0 (0.0%) | 1 (6.2%) |
| 11:00 AM to 11:59 AM | 0 (0.0%) | 0 (0.0%) |
| 12:00 PM to 3:59 PM | 1 (2.6%) | 4 (25.0%) |
| 4:00 PM to 11:59 PM | 0 (0.0%) | 1 (6.2%) |
| Total | 38 (100.0%) | 16 (100.0%) |
Housing Occupancy in Mockingbird Valley
Occupancy by Ownership in Mockingbird Valley
Of the total 67 dwellings in Mockingbird Valley, owner-occupied units account for 67 (100.0%), while renter-occupied units make up 0 (0.0%).
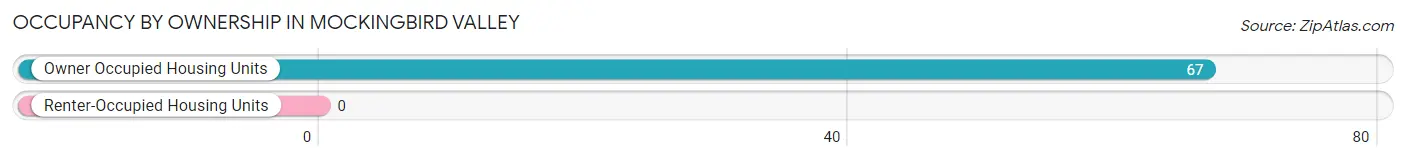
| Occupancy | # Housing Units | % Housing Units |
| Owner Occupied Housing Units | 67 | 100.0% |
| Renter-Occupied Housing Units | 0 | 0.0% |
| Total Occupied Housing Units | 67 | 100.0% |
Occupancy by Household Size in Mockingbird Valley
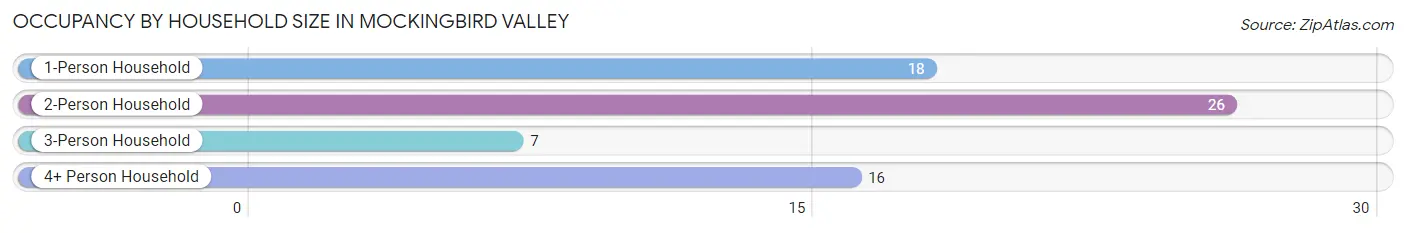
| Household Size | # Housing Units | % Housing Units |
| 1-Person Household | 18 | 26.9% |
| 2-Person Household | 26 | 38.8% |
| 3-Person Household | 7 | 10.4% |
| 4+ Person Household | 16 | 23.9% |
| Total Housing Units | 67 | 100.0% |
Occupancy by Ownership by Household Size in Mockingbird Valley
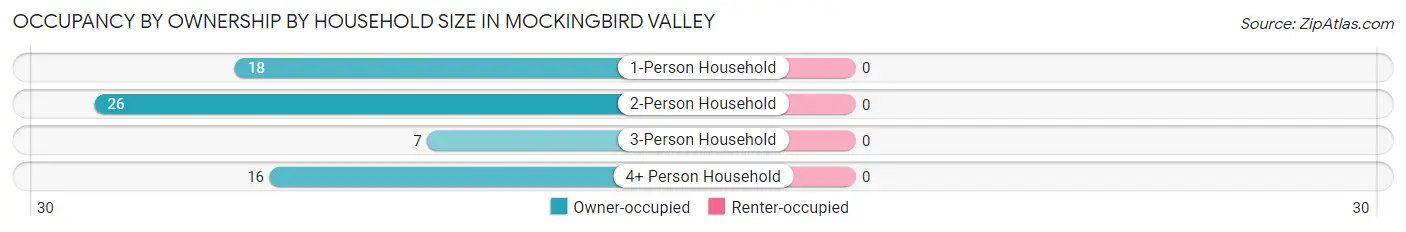
| Household Size | Owner-occupied | Renter-occupied |
| 1-Person Household | 18 (100.0%) | 0 (0.0%) |
| 2-Person Household | 26 (100.0%) | 0 (0.0%) |
| 3-Person Household | 7 (100.0%) | 0 (0.0%) |
| 4+ Person Household | 16 (100.0%) | 0 (0.0%) |
| Total Housing Units | 67 (100.0%) | 0 (0.0%) |
Occupancy by Educational Attainment in Mockingbird Valley
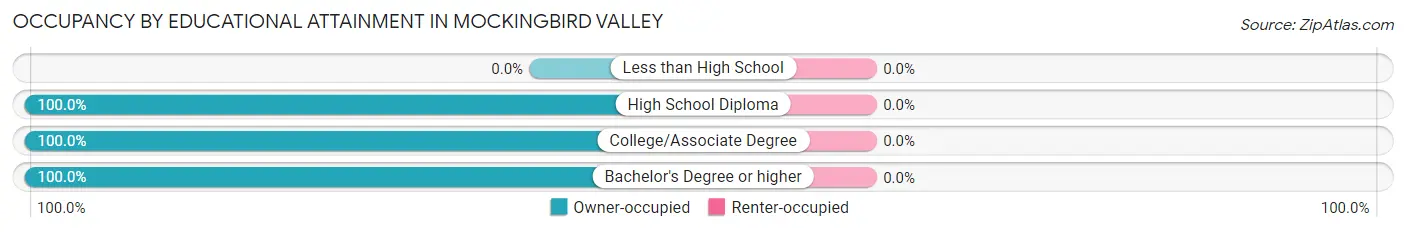
| Household Size | Owner-occupied | Renter-occupied |
| Less than High School | 0 (0.0%) | 0 (0.0%) |
| High School Diploma | 2 (100.0%) | 0 (0.0%) |
| College/Associate Degree | 12 (100.0%) | 0 (0.0%) |
| Bachelor's Degree or higher | 53 (100.0%) | 0 (0.0%) |
Occupancy by Age of Householder in Mockingbird Valley
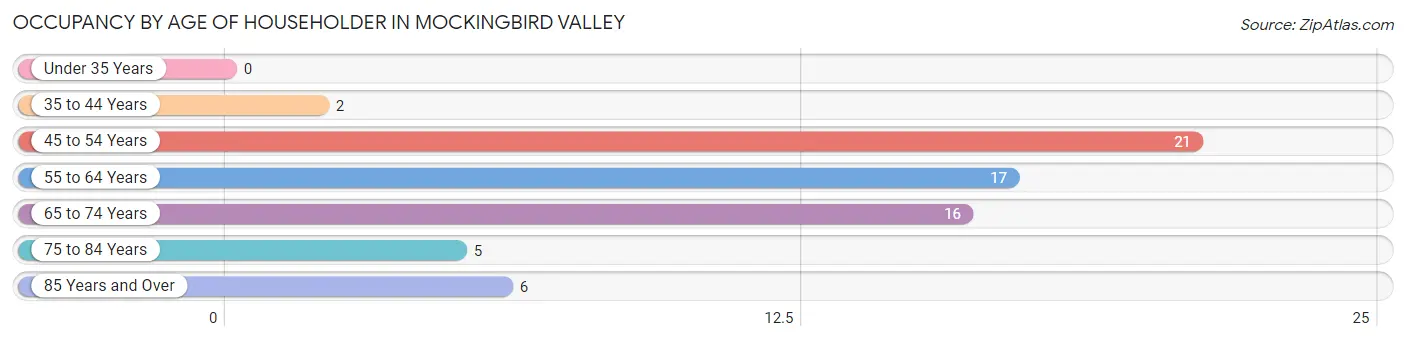
| Age Bracket | # Households | % Households |
| Under 35 Years | 0 | 0.0% |
| 35 to 44 Years | 2 | 3.0% |
| 45 to 54 Years | 21 | 31.3% |
| 55 to 64 Years | 17 | 25.4% |
| 65 to 74 Years | 16 | 23.9% |
| 75 to 84 Years | 5 | 7.5% |
| 85 Years and Over | 6 | 9.0% |
| Total | 67 | 100.0% |
Housing Finances in Mockingbird Valley
Median Income by Occupancy in Mockingbird Valley
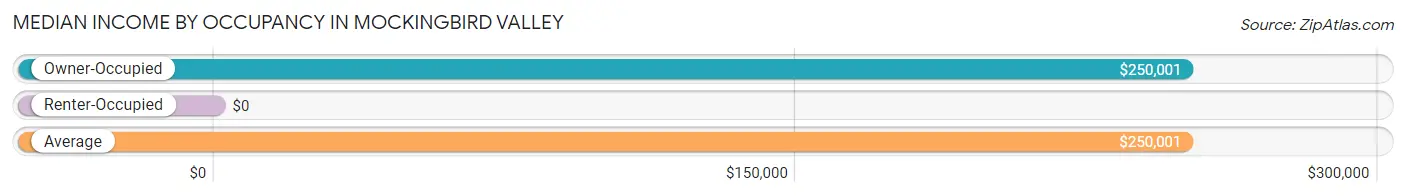
| Occupancy Type | # Households | Median Income |
| Owner-Occupied | 67 (100.0%) | $250,001 |
| Renter-Occupied | 0 (0.0%) | $0 |
| Average | 67 (100.0%) | $250,001 |
Occupancy by Householder Income Bracket in Mockingbird Valley
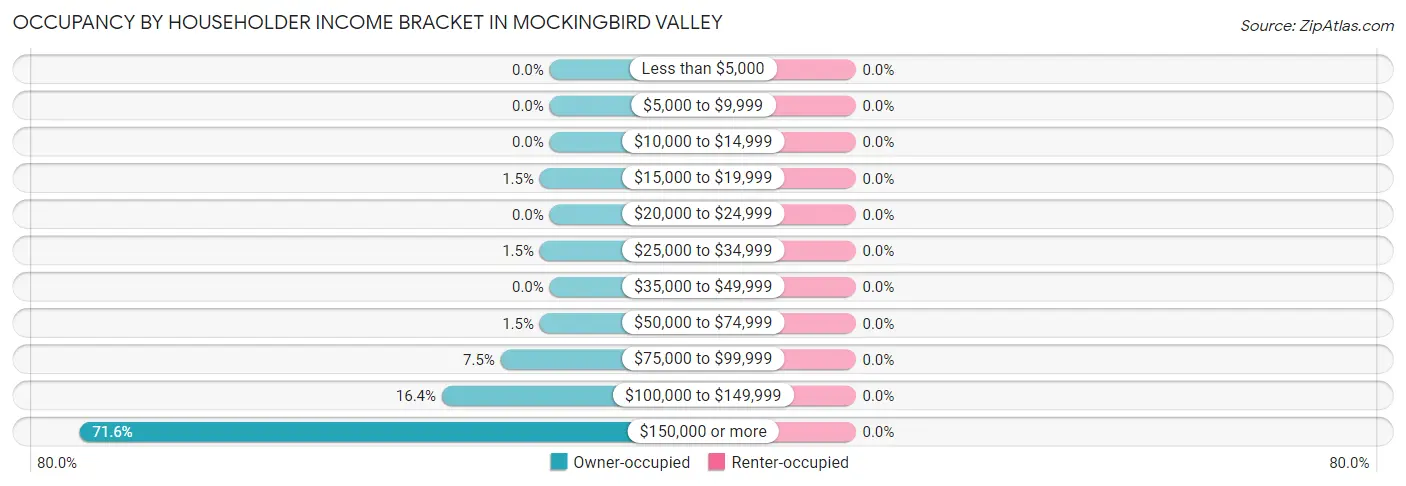
| Income Bracket | Owner-occupied | Renter-occupied |
| Less than $5,000 | 0 (0.0%) | 0 (0.0%) |
| $5,000 to $9,999 | 0 (0.0%) | 0 (0.0%) |
| $10,000 to $14,999 | 0 (0.0%) | 0 (0.0%) |
| $15,000 to $19,999 | 1 (1.5%) | 0 (0.0%) |
| $20,000 to $24,999 | 0 (0.0%) | 0 (0.0%) |
| $25,000 to $34,999 | 1 (1.5%) | 0 (0.0%) |
| $35,000 to $49,999 | 0 (0.0%) | 0 (0.0%) |
| $50,000 to $74,999 | 1 (1.5%) | 0 (0.0%) |
| $75,000 to $99,999 | 5 (7.5%) | 0 (0.0%) |
| $100,000 to $149,999 | 11 (16.4%) | 0 (0.0%) |
| $150,000 or more | 48 (71.6%) | 0 (0.0%) |
| Total | 67 (100.0%) | 0 (0.0%) |
Monthly Housing Cost Tiers in Mockingbird Valley
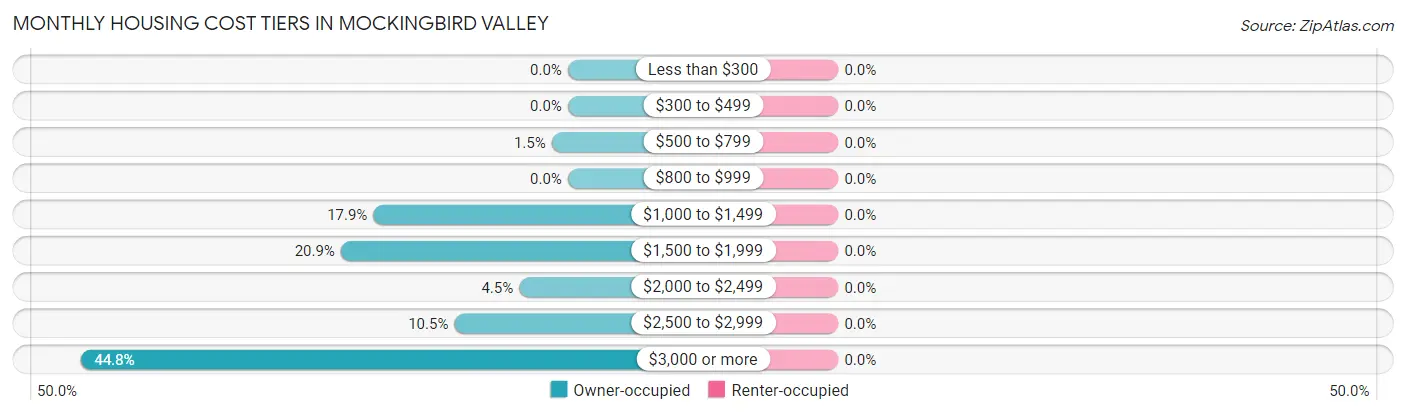
| Monthly Cost | Owner-occupied | Renter-occupied |
| Less than $300 | 0 (0.0%) | 0 (0.0%) |
| $300 to $499 | 0 (0.0%) | 0 (0.0%) |
| $500 to $799 | 1 (1.5%) | 0 (0.0%) |
| $800 to $999 | 0 (0.0%) | 0 (0.0%) |
| $1,000 to $1,499 | 12 (17.9%) | 0 (0.0%) |
| $1,500 to $1,999 | 14 (20.9%) | 0 (0.0%) |
| $2,000 to $2,499 | 3 (4.5%) | 0 (0.0%) |
| $2,500 to $2,999 | 7 (10.4%) | 0 (0.0%) |
| $3,000 or more | 30 (44.8%) | 0 (0.0%) |
| Total | 67 (100.0%) | 0 (0.0%) |
Physical Housing Characteristics in Mockingbird Valley
Housing Structures in Mockingbird Valley
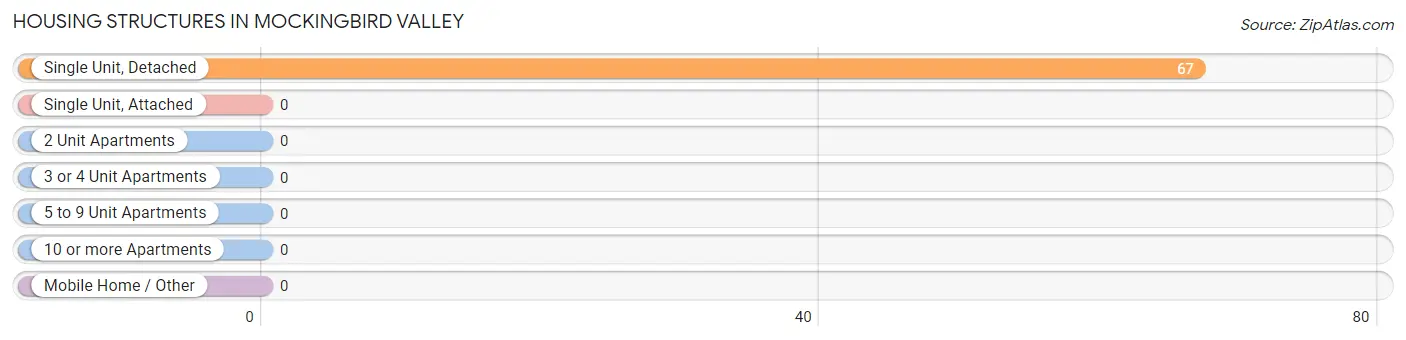
| Structure Type | # Housing Units | % Housing Units |
| Single Unit, Detached | 67 | 100.0% |
| Single Unit, Attached | 0 | 0.0% |
| 2 Unit Apartments | 0 | 0.0% |
| 3 or 4 Unit Apartments | 0 | 0.0% |
| 5 to 9 Unit Apartments | 0 | 0.0% |
| 10 or more Apartments | 0 | 0.0% |
| Mobile Home / Other | 0 | 0.0% |
| Total | 67 | 100.0% |
Housing Structures by Occupancy in Mockingbird Valley
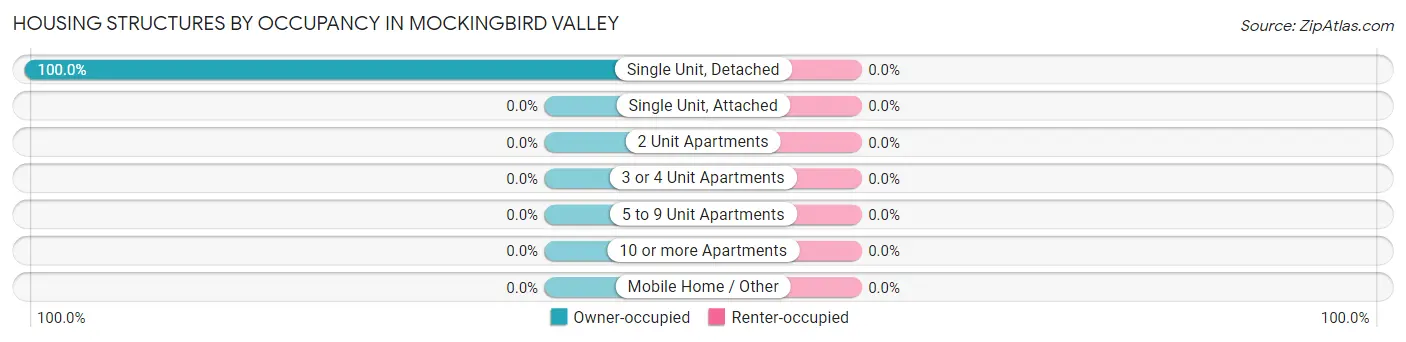
| Structure Type | Owner-occupied | Renter-occupied |
| Single Unit, Detached | 67 (100.0%) | 0 (0.0%) |
| Single Unit, Attached | 0 (0.0%) | 0 (0.0%) |
| 2 Unit Apartments | 0 (0.0%) | 0 (0.0%) |
| 3 or 4 Unit Apartments | 0 (0.0%) | 0 (0.0%) |
| 5 to 9 Unit Apartments | 0 (0.0%) | 0 (0.0%) |
| 10 or more Apartments | 0 (0.0%) | 0 (0.0%) |
| Mobile Home / Other | 0 (0.0%) | 0 (0.0%) |
| Total | 67 (100.0%) | 0 (0.0%) |
Housing Structures by Number of Rooms in Mockingbird Valley
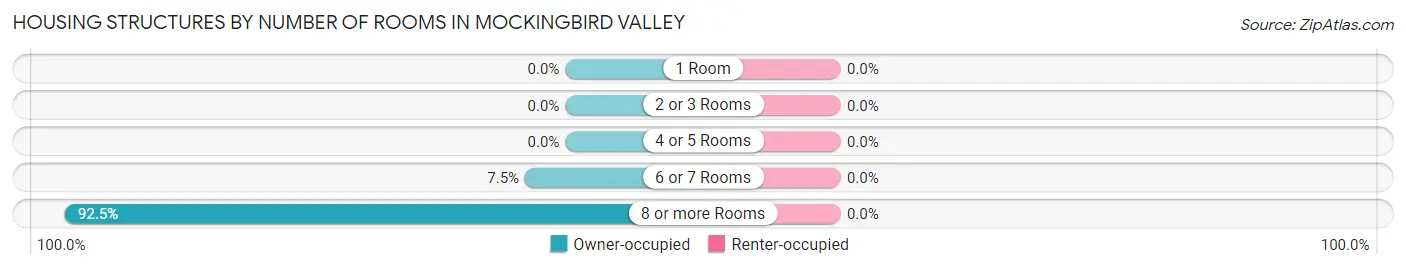
| Number of Rooms | Owner-occupied | Renter-occupied |
| 1 Room | 0 (0.0%) | 0 (0.0%) |
| 2 or 3 Rooms | 0 (0.0%) | 0 (0.0%) |
| 4 or 5 Rooms | 0 (0.0%) | 0 (0.0%) |
| 6 or 7 Rooms | 5 (7.5%) | 0 (0.0%) |
| 8 or more Rooms | 62 (92.5%) | 0 (0.0%) |
| Total | 67 (100.0%) | 0 (0.0%) |
Housing Structure by Heating Type in Mockingbird Valley
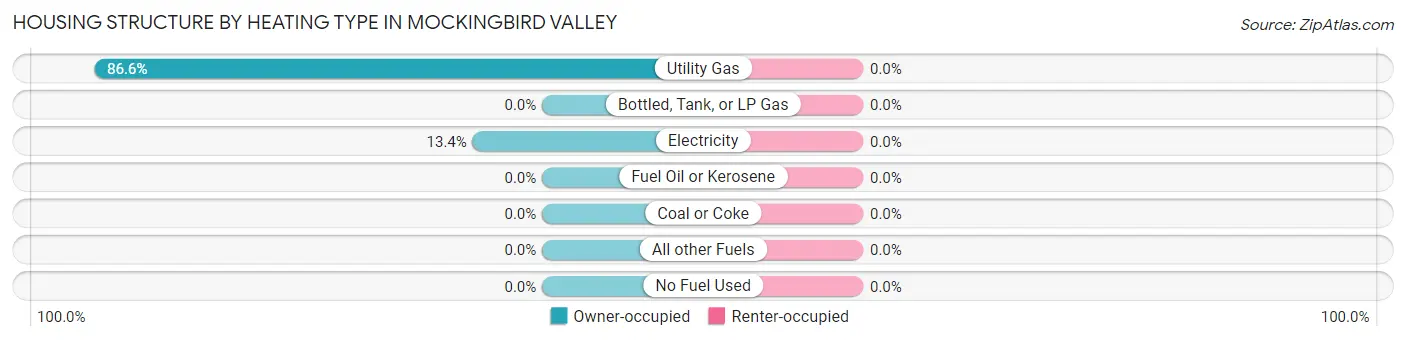
| Heating Type | Owner-occupied | Renter-occupied |
| Utility Gas | 58 (86.6%) | 0 (0.0%) |
| Bottled, Tank, or LP Gas | 0 (0.0%) | 0 (0.0%) |
| Electricity | 9 (13.4%) | 0 (0.0%) |
| Fuel Oil or Kerosene | 0 (0.0%) | 0 (0.0%) |
| Coal or Coke | 0 (0.0%) | 0 (0.0%) |
| All other Fuels | 0 (0.0%) | 0 (0.0%) |
| No Fuel Used | 0 (0.0%) | 0 (0.0%) |
| Total | 67 (100.0%) | 0 (0.0%) |
Household Vehicle Usage in Mockingbird Valley
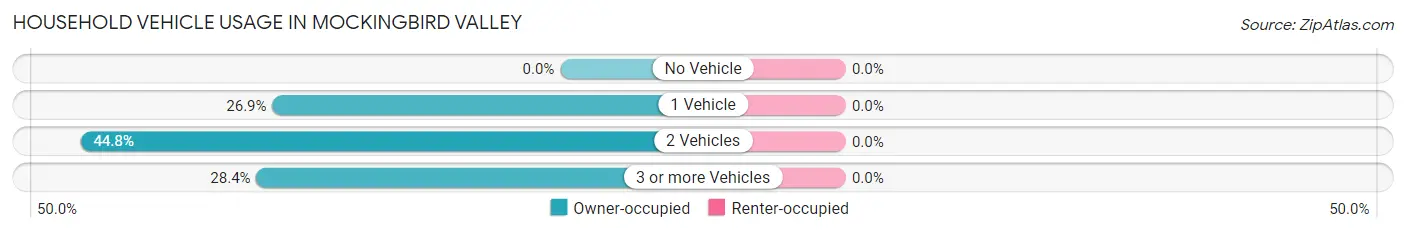
| Vehicles per Household | Owner-occupied | Renter-occupied |
| No Vehicle | 0 (0.0%) | 0 (0.0%) |
| 1 Vehicle | 18 (26.9%) | 0 (0.0%) |
| 2 Vehicles | 30 (44.8%) | 0 (0.0%) |
| 3 or more Vehicles | 19 (28.4%) | 0 (0.0%) |
| Total | 67 (100.0%) | 0 (0.0%) |
Real Estate & Mortgages in Mockingbird Valley
Real Estate and Mortgage Overview in Mockingbird Valley
| Characteristic | Without Mortgage | With Mortgage |
| Housing Units | 37 | 30 |
| Median Property Value | $1,196,400 | $875,000 |
| Median Household Income | $222,083 | $27 |
| Monthly Housing Costs | $1,501 | $19 |
| Real Estate Taxes | $10,001 | $0 |
Property Value by Mortgage Status in Mockingbird Valley
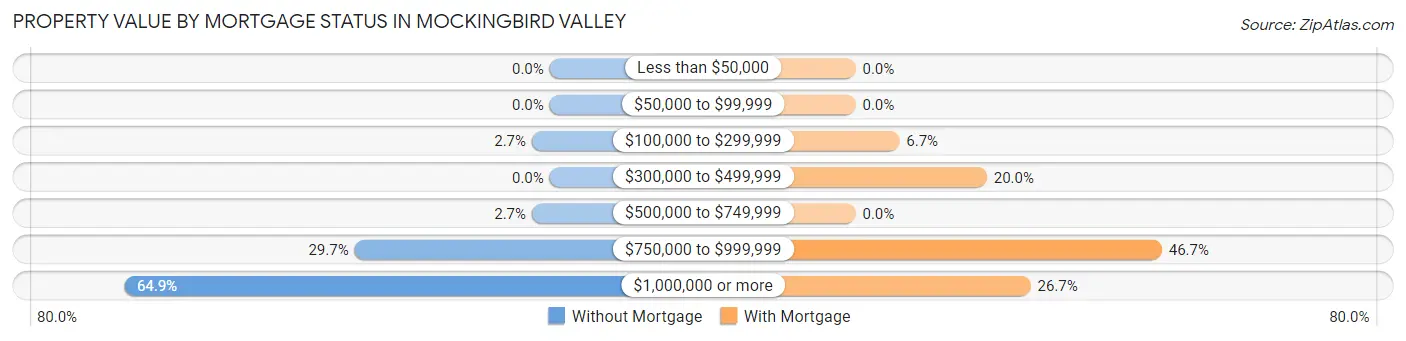
| Property Value | Without Mortgage | With Mortgage |
| Less than $50,000 | 0 (0.0%) | 0 (0.0%) |
| $50,000 to $99,999 | 0 (0.0%) | 0 (0.0%) |
| $100,000 to $299,999 | 1 (2.7%) | 2 (6.7%) |
| $300,000 to $499,999 | 0 (0.0%) | 6 (20.0%) |
| $500,000 to $749,999 | 1 (2.7%) | 0 (0.0%) |
| $750,000 to $999,999 | 11 (29.7%) | 14 (46.7%) |
| $1,000,000 or more | 24 (64.9%) | 8 (26.7%) |
| Total | 37 (100.0%) | 30 (100.0%) |
Household Income by Mortgage Status in Mockingbird Valley
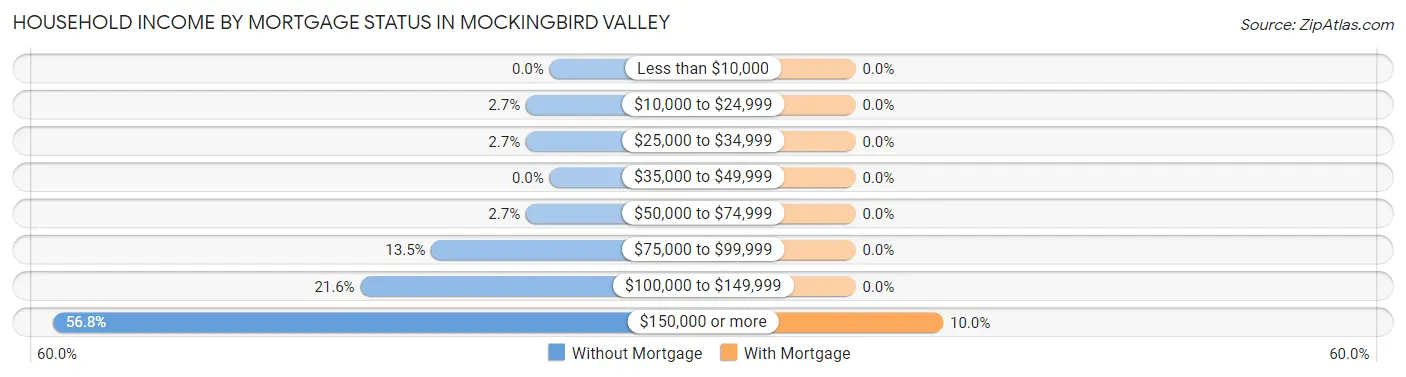
| Household Income | Without Mortgage | With Mortgage |
| Less than $10,000 | 0 (0.0%) | 0 (0.0%) |
| $10,000 to $24,999 | 1 (2.7%) | 0 (0.0%) |
| $25,000 to $34,999 | 1 (2.7%) | 0 (0.0%) |
| $35,000 to $49,999 | 0 (0.0%) | 0 (0.0%) |
| $50,000 to $74,999 | 1 (2.7%) | 0 (0.0%) |
| $75,000 to $99,999 | 5 (13.5%) | 0 (0.0%) |
| $100,000 to $149,999 | 8 (21.6%) | 0 (0.0%) |
| $150,000 or more | 21 (56.8%) | 3 (10.0%) |
| Total | 37 (100.0%) | 30 (100.0%) |
Property Value to Household Income Ratio in Mockingbird Valley
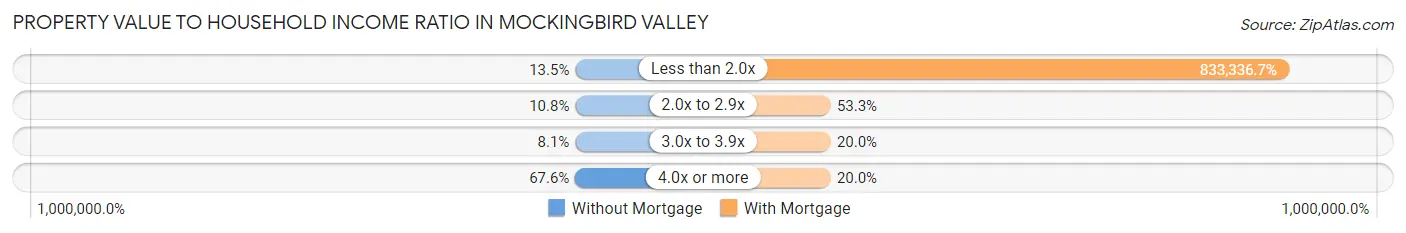
| Value-to-Income Ratio | Without Mortgage | With Mortgage |
| Less than 2.0x | 5 (13.5%) | 250,001 (833,336.7%) |
| 2.0x to 2.9x | 4 (10.8%) | 16 (53.3%) |
| 3.0x to 3.9x | 3 (8.1%) | 6 (20.0%) |
| 4.0x or more | 25 (67.6%) | 6 (20.0%) |
| Total | 37 (100.0%) | 30 (100.0%) |
Real Estate Taxes by Mortgage Status in Mockingbird Valley
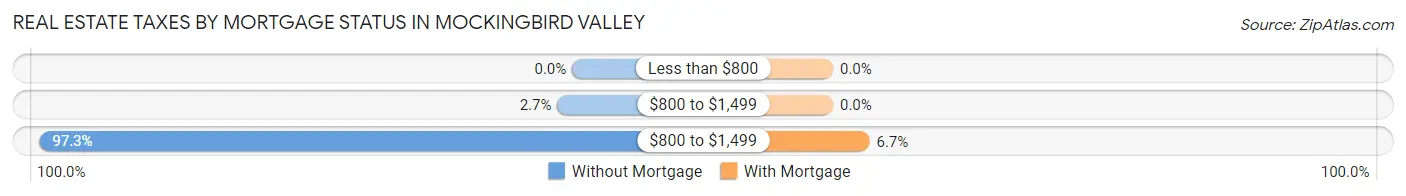
| Property Taxes | Without Mortgage | With Mortgage |
| Less than $800 | 0 (0.0%) | 0 (0.0%) |
| $800 to $1,499 | 1 (2.7%) | 0 (0.0%) |
| $800 to $1,499 | 36 (97.3%) | 2 (6.7%) |
| Total | 37 (100.0%) | 30 (100.0%) |
Health & Disability in Mockingbird Valley
Health Insurance Coverage by Age in Mockingbird Valley
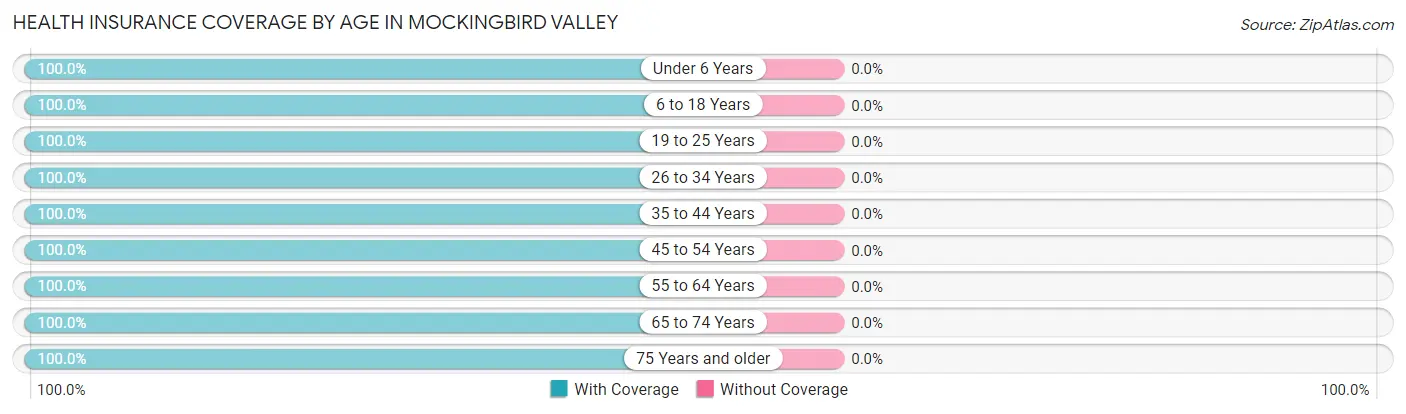
| Age Bracket | With Coverage | Without Coverage |
| Under 6 Years | 1 (100.0%) | 0 (0.0%) |
| 6 to 18 Years | 41 (100.0%) | 0 (0.0%) |
| 19 to 25 Years | 6 (100.0%) | 0 (0.0%) |
| 26 to 34 Years | 2 (100.0%) | 0 (0.0%) |
| 35 to 44 Years | 10 (100.0%) | 0 (0.0%) |
| 45 to 54 Years | 30 (100.0%) | 0 (0.0%) |
| 55 to 64 Years | 31 (100.0%) | 0 (0.0%) |
| 65 to 74 Years | 25 (100.0%) | 0 (0.0%) |
| 75 Years and older | 15 (100.0%) | 0 (0.0%) |
| Total | 161 (100.0%) | 0 (0.0%) |
Health Insurance Coverage by Citizenship Status in Mockingbird Valley
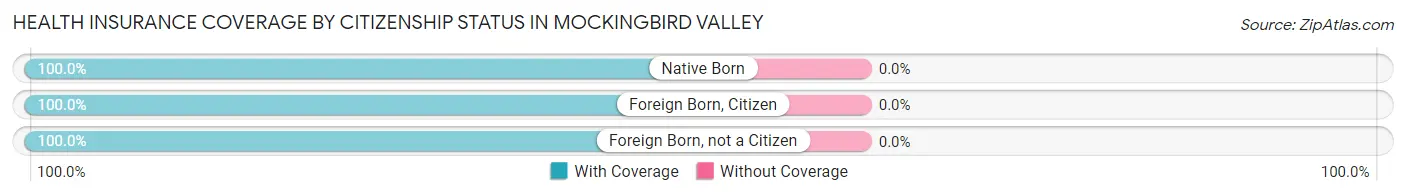
| Citizenship Status | With Coverage | Without Coverage |
| Native Born | 1 (100.0%) | 0 (0.0%) |
| Foreign Born, Citizen | 41 (100.0%) | 0 (0.0%) |
| Foreign Born, not a Citizen | 6 (100.0%) | 0 (0.0%) |
Health Insurance Coverage by Household Income in Mockingbird Valley
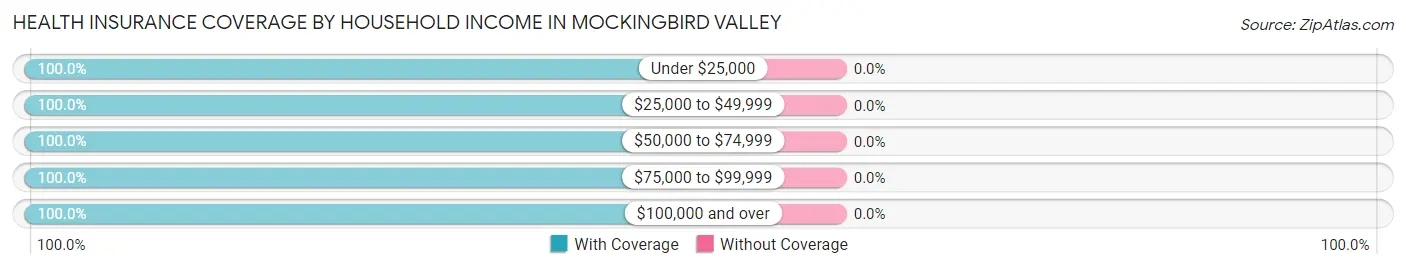
| Household Income | With Coverage | Without Coverage |
| Under $25,000 | 1 (100.0%) | 0 (0.0%) |
| $25,000 to $49,999 | 1 (100.0%) | 0 (0.0%) |
| $50,000 to $74,999 | 1 (100.0%) | 0 (0.0%) |
| $75,000 to $99,999 | 7 (100.0%) | 0 (0.0%) |
| $100,000 and over | 151 (100.0%) | 0 (0.0%) |
Public vs Private Health Insurance Coverage by Age in Mockingbird Valley
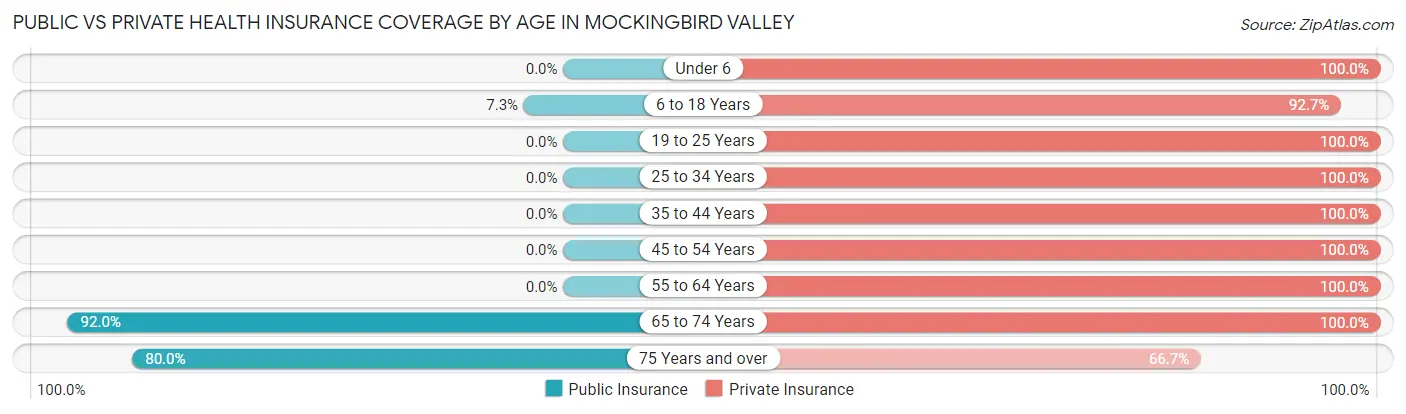
| Age Bracket | Public Insurance | Private Insurance |
| Under 6 | 0 (0.0%) | 1 (100.0%) |
| 6 to 18 Years | 3 (7.3%) | 38 (92.7%) |
| 19 to 25 Years | 0 (0.0%) | 6 (100.0%) |
| 25 to 34 Years | 0 (0.0%) | 2 (100.0%) |
| 35 to 44 Years | 0 (0.0%) | 10 (100.0%) |
| 45 to 54 Years | 0 (0.0%) | 30 (100.0%) |
| 55 to 64 Years | 0 (0.0%) | 31 (100.0%) |
| 65 to 74 Years | 23 (92.0%) | 25 (100.0%) |
| 75 Years and over | 12 (80.0%) | 10 (66.7%) |
| Total | 38 (23.6%) | 153 (95.0%) |
Disability Status by Sex by Age in Mockingbird Valley
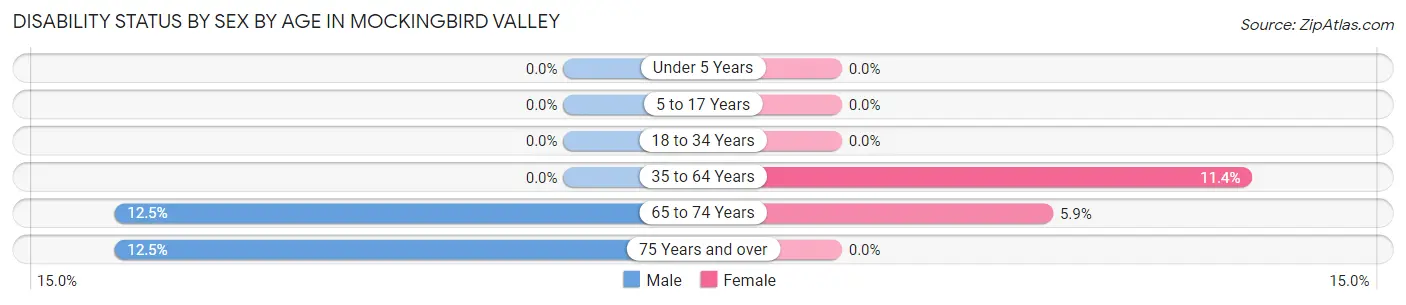
| Age Bracket | Male | Female |
| Under 5 Years | 0 (0.0%) | 0 (0.0%) |
| 5 to 17 Years | 0 (0.0%) | 0 (0.0%) |
| 18 to 34 Years | 0 (0.0%) | 0 (0.0%) |
| 35 to 64 Years | 0 (0.0%) | 4 (11.4%) |
| 65 to 74 Years | 1 (12.5%) | 1 (5.9%) |
| 75 Years and over | 1 (12.5%) | 0 (0.0%) |
Disability Class by Sex by Age in Mockingbird Valley
Disability Class: Hearing Difficulty
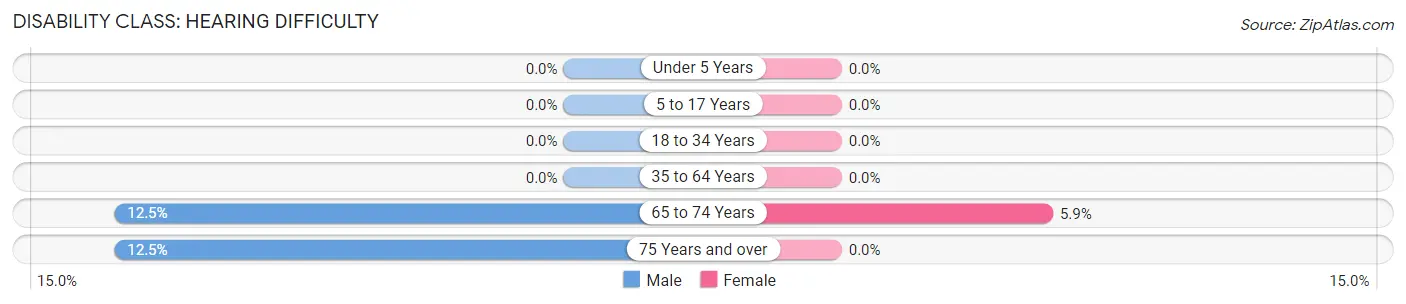
| Age Bracket | Male | Female |
| Under 5 Years | 0 (0.0%) | 0 (0.0%) |
| 5 to 17 Years | 0 (0.0%) | 0 (0.0%) |
| 18 to 34 Years | 0 (0.0%) | 0 (0.0%) |
| 35 to 64 Years | 0 (0.0%) | 0 (0.0%) |
| 65 to 74 Years | 1 (12.5%) | 1 (5.9%) |
| 75 Years and over | 1 (12.5%) | 0 (0.0%) |
Disability Class: Vision Difficulty
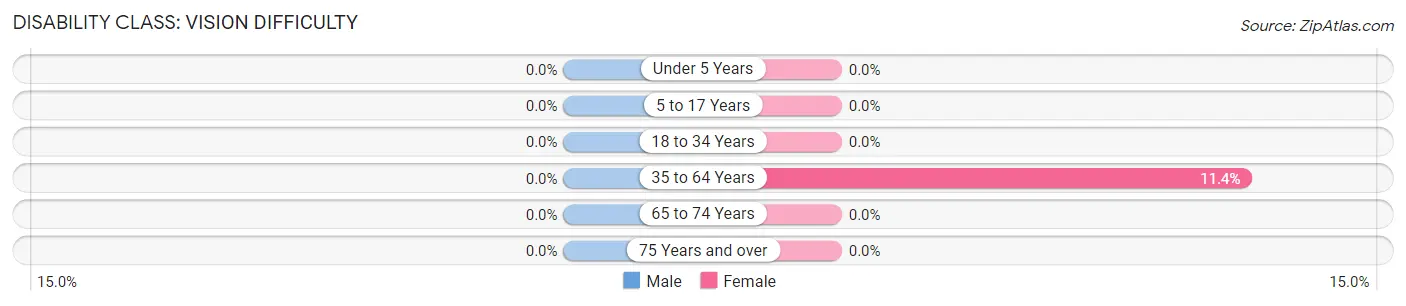
| Age Bracket | Male | Female |
| Under 5 Years | 0 (0.0%) | 0 (0.0%) |
| 5 to 17 Years | 0 (0.0%) | 0 (0.0%) |
| 18 to 34 Years | 0 (0.0%) | 0 (0.0%) |
| 35 to 64 Years | 0 (0.0%) | 4 (11.4%) |
| 65 to 74 Years | 0 (0.0%) | 0 (0.0%) |
| 75 Years and over | 0 (0.0%) | 0 (0.0%) |
Disability Class: Cognitive Difficulty
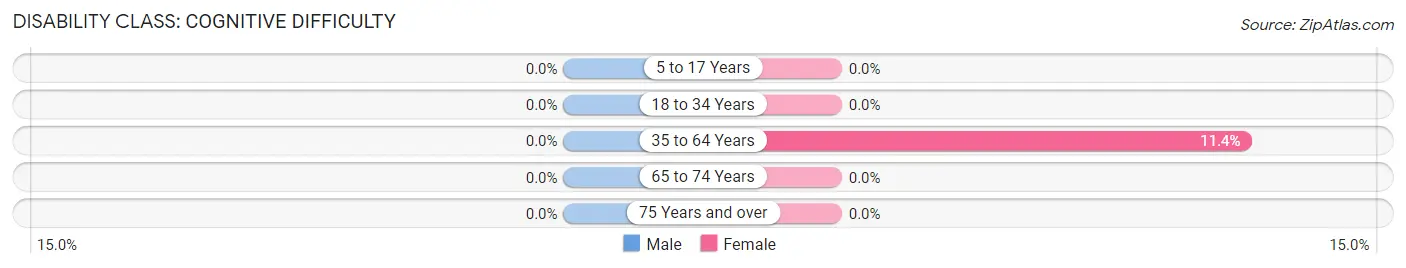
| Age Bracket | Male | Female |
| 5 to 17 Years | 0 (0.0%) | 0 (0.0%) |
| 18 to 34 Years | 0 (0.0%) | 0 (0.0%) |
| 35 to 64 Years | 0 (0.0%) | 4 (11.4%) |
| 65 to 74 Years | 0 (0.0%) | 0 (0.0%) |
| 75 Years and over | 0 (0.0%) | 0 (0.0%) |
Disability Class: Ambulatory Difficulty
| Age Bracket | Male | Female |
| 5 to 17 Years | 0 (0.0%) | 0 (0.0%) |
| 18 to 34 Years | 0 (0.0%) | 0 (0.0%) |
| 35 to 64 Years | 0 (0.0%) | 0 (0.0%) |
| 65 to 74 Years | 0 (0.0%) | 0 (0.0%) |
| 75 Years and over | 1 (12.5%) | 0 (0.0%) |
Disability Class: Self-Care Difficulty
| Age Bracket | Male | Female |
| 5 to 17 Years | 0 (0.0%) | 0 (0.0%) |
| 18 to 34 Years | 0 (0.0%) | 0 (0.0%) |
| 35 to 64 Years | 0 (0.0%) | 0 (0.0%) |
| 65 to 74 Years | 0 (0.0%) | 0 (0.0%) |
| 75 Years and over | 0 (0.0%) | 0 (0.0%) |
Technology Access in Mockingbird Valley
Computing Device Access in Mockingbird Valley
| Device Type | # Households | % Households |
| Desktop or Laptop | 60 | 89.5% |
| Smartphone | 66 | 98.5% |
| Tablet | 61 | 91.0% |
| No Computing Device | 1 | 1.5% |
| Total | 67 | 100.0% |
Internet Access in Mockingbird Valley
| Internet Type | # Households | % Households |
| Dial-Up Internet | 0 | 0.0% |
| Broadband Home | 59 | 88.1% |
| Cellular Data Only | 5 | 7.5% |
| Satellite Internet | 1 | 1.5% |
| No Internet | 0 | 0.0% |
| Total | 67 | 100.0% |
Mockingbird Valley Summary
Mockingbird Valley is a small, unincorporated community located in Jefferson County, Kentucky. It is situated in the northeastern part of the county, just south of the city of Louisville. The area is known for its rolling hills, lush forests, and picturesque views of the Ohio River.
History
Mockingbird Valley was first settled in the early 1800s by a group of German immigrants. The area was originally known as “Mockingbird Valley” due to the abundance of mockingbirds in the area. The settlers built a small church and a few homes, and the area slowly grew in population.
In the late 1800s, the area was home to a number of small farms and businesses. The area was also home to a number of coal mines, which provided employment for many of the residents.
In the early 1900s, the area began to experience a population boom as more people moved to the area. This growth was largely due to the development of the Louisville and Nashville Railroad, which ran through the area. The railroad provided easy access to Louisville and other cities in the region.
Geography
Mockingbird Valley is located in the northeastern part of Jefferson County, Kentucky. It is situated in the rolling hills of the Ohio River Valley. The area is known for its lush forests and picturesque views of the Ohio River.
The area is home to a number of small creeks and streams, as well as several small lakes. The area is also home to a number of parks and recreational areas, including the Mockingbird Valley Nature Preserve.
Economy
Mockingbird Valley is primarily a residential area, with most of the residents employed in the nearby cities of Louisville and Lexington. The area is also home to a number of small businesses, including restaurants, retail stores, and professional services.
The area is also home to a number of farms, which produce a variety of crops, including corn, soybeans, and wheat. The area is also home to a number of wineries, which produce a variety of wines.
Demographics
As of the 2010 census, the population of Mockingbird Valley was 1,845. The population is primarily white (94.3%), with a small percentage of African Americans (2.3%) and Hispanics (1.7%). The median household income in the area is $50,000, and the median home value is $150,000.
Conclusion
Mockingbird Valley is a small, unincorporated community located in Jefferson County, Kentucky. It is situated in the northeastern part of the county, just south of the city of Louisville. The area is known for its rolling hills, lush forests, and picturesque views of the Ohio River. The area is primarily a residential area, with most of the residents employed in the nearby cities of Louisville and Lexington. The area is also home to a number of small businesses, farms, and wineries. As of the 2010 census, the population of Mockingbird Valley was 1,845. The population is primarily white, with a small percentage of African Americans and Hispanics. The median household income in the area is $50,000, and the median home value is $150,000.
Common Questions
What is Per Capita Income in Mockingbird Valley?
Per Capita income in Mockingbird Valley is $172,916.
What is the Median Family Income in Mockingbird Valley?
Median Family Income in Mockingbird Valley is $250,001.
What is the Median Household income in Mockingbird Valley?
Median Household Income in Mockingbird Valley is $250,001.
What is Income or Wage Gap in Mockingbird Valley?
Income or Wage Gap in Mockingbird Valley is 69.4%.
Women in Mockingbird Valley earn 30.6 cents for every dollar earned by a man.
What is Inequality or Gini Index in Mockingbird Valley?
Inequality or Gini Index in Mockingbird Valley is 0.44.
What is the Total Population of Mockingbird Valley?
Total Population of Mockingbird Valley is 161.
What is the Total Male Population of Mockingbird Valley?
Total Male Population of Mockingbird Valley is 80.
What is the Total Female Population of Mockingbird Valley?
Total Female Population of Mockingbird Valley is 81.
What is the Ratio of Males per 100 Females in Mockingbird Valley?
There are 98.77 Males per 100 Females in Mockingbird Valley.
What is the Ratio of Females per 100 Males in Mockingbird Valley?
There are 101.25 Females per 100 Males in Mockingbird Valley.
What is the Median Population Age in Mockingbird Valley?
Median Population Age in Mockingbird Valley is 52.6 Years.
What is the Average Family Size in Mockingbird Valley
Average Family Size in Mockingbird Valley is 2.9 People.
What is the Average Household Size in Mockingbird Valley
Average Household Size in Mockingbird Valley is 2.4 People.
How Large is the Labor Force in Mockingbird Valley?
There are 59 People in the Labor Forcein in Mockingbird Valley.
What is the Percentage of People in the Labor Force in Mockingbird Valley?
46.5% of People are in the Labor Force in Mockingbird Valley.
What is the Unemployment Rate in Mockingbird Valley?
Unemployment Rate in Mockingbird Valley is 1.7%.