Hanksville, UT Map & Demographics
Hanksville Map
Hanksville Overview
$19,168
PER CAPITA INCOME
$45,625
AVG FAMILY INCOME
$45,714
AVG HOUSEHOLD INCOME
6.9%
WAGE / INCOME GAP [ % ]
93.1¢/ $1
WAGE / INCOME GAP [ $ ]
0.31
INEQUALITY / GINI INDEX
217
TOTAL POPULATION
115
MALE POPULATION
102
FEMALE POPULATION
112.75
MALES / 100 FEMALES
88.70
FEMALES / 100 MALES
27.5
MEDIAN AGE
3.5
AVG FAMILY SIZE
2.3
AVG HOUSEHOLD SIZE
95
LABOR FORCE [ PEOPLE ]
59.0%
PERCENT IN LABOR FORCE
Hanksville Zip Codes
Income in Hanksville
Income Overview in Hanksville
Per Capita Income in Hanksville is $19,168, while median incomes of families and households are $45,625 and $45,714 respectively.
| Characteristic | Number | Measure |
| Per Capita Income | 217 | $19,168 |
| Median Family Income | 45 | $45,625 |
| Mean Family Income | 45 | $51,838 |
| Median Household Income | 92 | $45,714 |
| Mean Household Income | 92 | $47,528 |
| Income Deficit | 45 | $0 |
| Wage / Income Gap (%) | 217 | 6.87% |
| Wage / Income Gap ($) | 217 | 93.13¢ per $1 |
| Gini / Inequality Index | 217 | 0.31 |
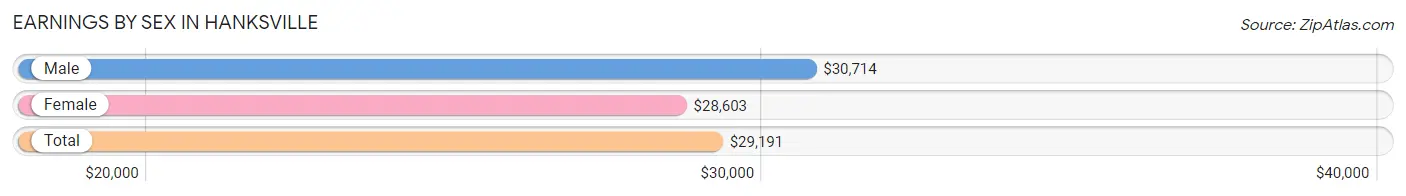
Earnings by Sex in Hanksville
Average Earnings in Hanksville are $29,191, $30,714 for men and $28,603 for women, a difference of 6.9%.
| Sex | Number | Average Earnings |
| Male | 64 (62.1%) | $30,714 |
| Female | 39 (37.9%) | $28,603 |
| Total | 103 (100.0%) | $29,191 |
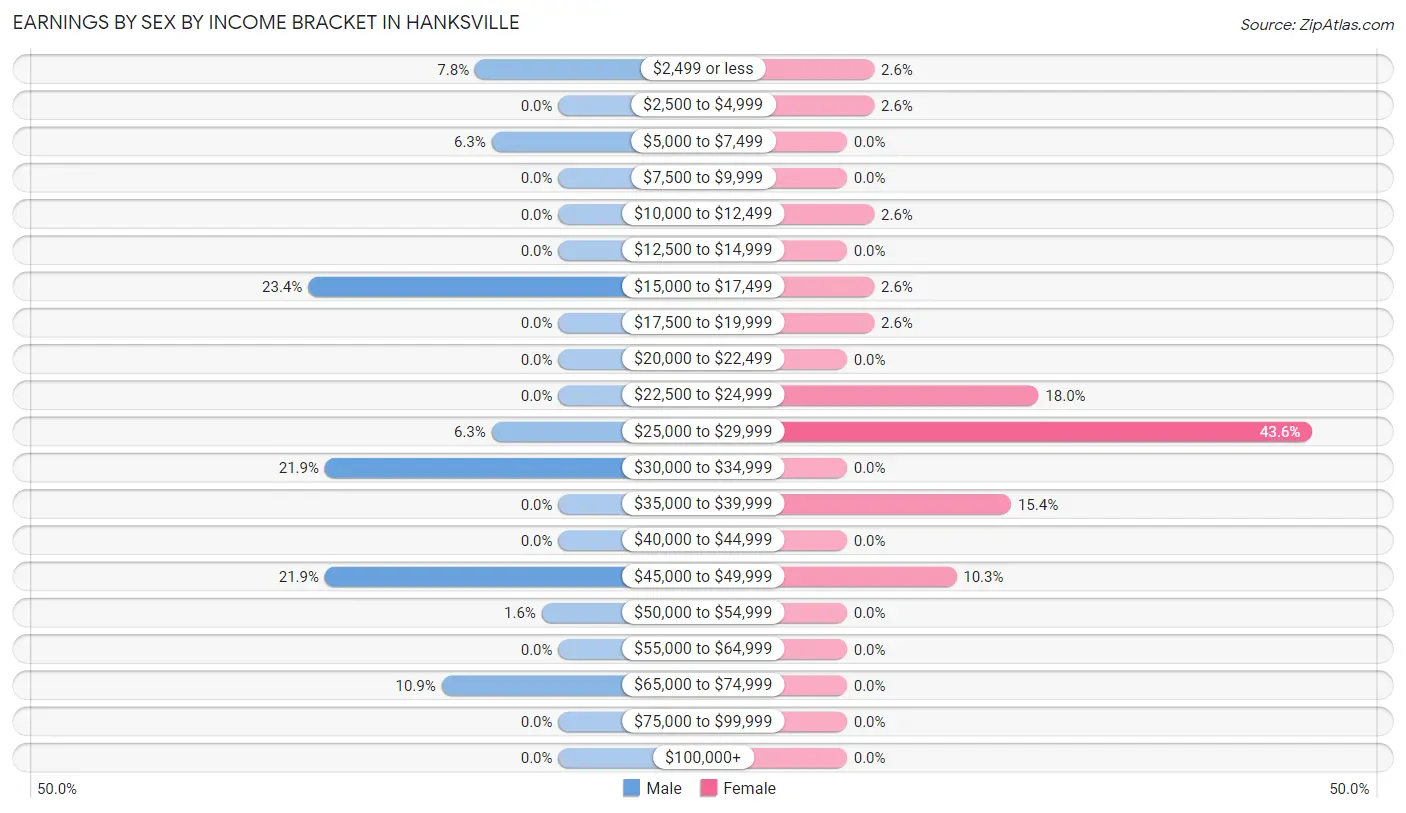
Earnings by Sex by Income Bracket in Hanksville
The most common earnings brackets in Hanksville are $15,000 to $17,499 for men (15 | 23.4%) and $25,000 to $29,999 for women (17 | 43.6%).
| Income | Male | Female |
| $2,499 or less | 5 (7.8%) | 1 (2.6%) |
| $2,500 to $4,999 | 0 (0.0%) | 1 (2.6%) |
| $5,000 to $7,499 | 4 (6.2%) | 0 (0.0%) |
| $7,500 to $9,999 | 0 (0.0%) | 0 (0.0%) |
| $10,000 to $12,499 | 0 (0.0%) | 1 (2.6%) |
| $12,500 to $14,999 | 0 (0.0%) | 0 (0.0%) |
| $15,000 to $17,499 | 15 (23.4%) | 1 (2.6%) |
| $17,500 to $19,999 | 0 (0.0%) | 1 (2.6%) |
| $20,000 to $22,499 | 0 (0.0%) | 0 (0.0%) |
| $22,500 to $24,999 | 0 (0.0%) | 7 (17.9%) |
| $25,000 to $29,999 | 4 (6.2%) | 17 (43.6%) |
| $30,000 to $34,999 | 14 (21.9%) | 0 (0.0%) |
| $35,000 to $39,999 | 0 (0.0%) | 6 (15.4%) |
| $40,000 to $44,999 | 0 (0.0%) | 0 (0.0%) |
| $45,000 to $49,999 | 14 (21.9%) | 4 (10.3%) |
| $50,000 to $54,999 | 1 (1.6%) | 0 (0.0%) |
| $55,000 to $64,999 | 0 (0.0%) | 0 (0.0%) |
| $65,000 to $74,999 | 7 (10.9%) | 0 (0.0%) |
| $75,000 to $99,999 | 0 (0.0%) | 0 (0.0%) |
| $100,000+ | 0 (0.0%) | 0 (0.0%) |
| Total | 64 (100.0%) | 39 (100.0%) |
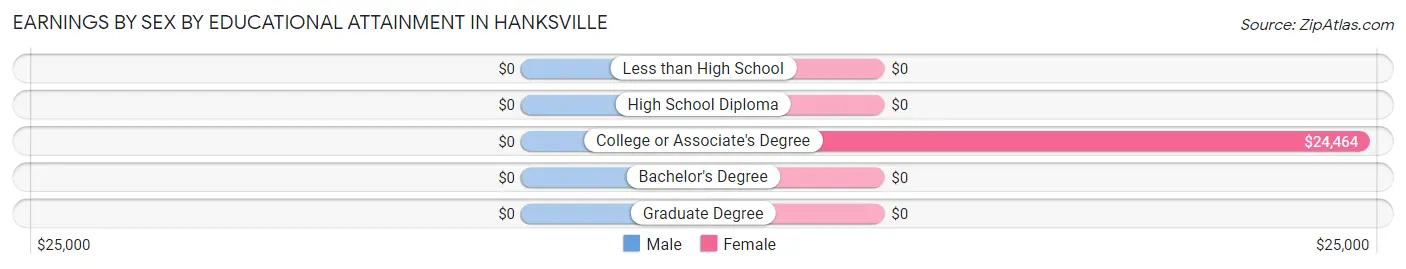
Earnings by Sex by Educational Attainment in Hanksville
| Educational Attainment | Male Income | Female Income |
| Less than High School | - | - |
| High School Diploma | - | - |
| College or Associate's Degree | - | - |
| Bachelor's Degree | - | - |
| Graduate Degree | - | - |
| Total | $45,893 | $28,603 |
Family Income in Hanksville
Family Income Brackets in Hanksville
According to the Hanksville family income data, there are 17 families falling into the $35,000 to $49,999 income range, which is the most common income bracket and makes up 37.8% of all families.
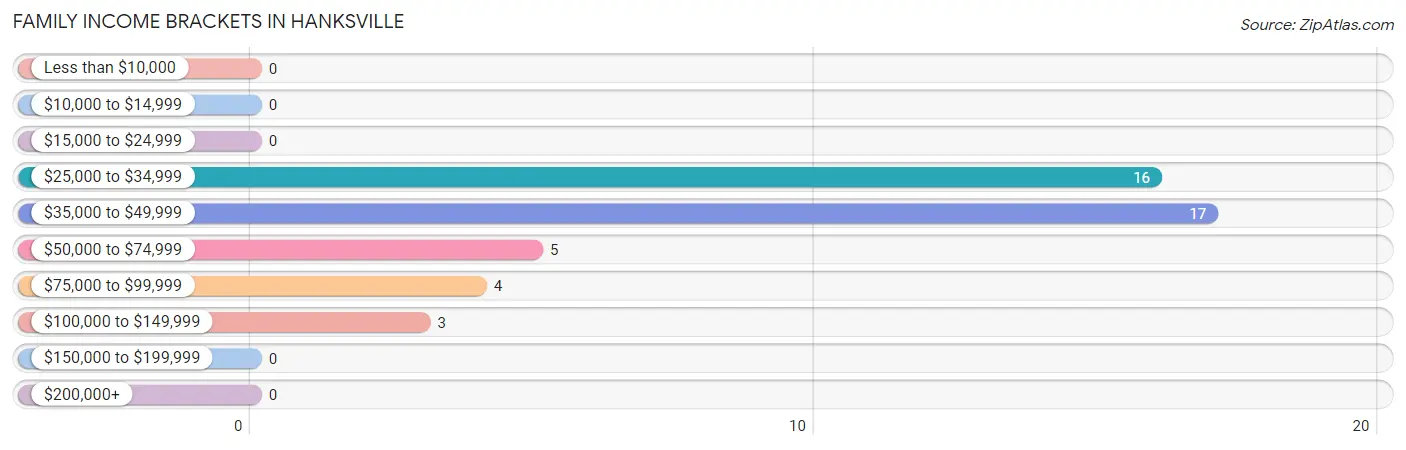
| Income Bracket | # Families | % Families |
| Less than $10,000 | 0 | 0.0% |
| $10,000 to $14,999 | 0 | 0.0% |
| $15,000 to $24,999 | 0 | 0.0% |
| $25,000 to $34,999 | 16 | 35.6% |
| $35,000 to $49,999 | 17 | 37.8% |
| $50,000 to $74,999 | 5 | 11.1% |
| $75,000 to $99,999 | 4 | 8.9% |
| $100,000 to $149,999 | 3 | 6.7% |
| $150,000 to $199,999 | 0 | 0.0% |
| $200,000+ | 0 | 0.0% |
Family Income by Famaliy Size in Hanksville
| Income Bracket | # Families | Median Income |
| 2-Person Families | 4 (8.9%) | $0 |
| 3-Person Families | 17 (37.8%) | $0 |
| 4-Person Families | 1 (2.2%) | $0 |
| 5-Person Families | 5 (11.1%) | $0 |
| 6-Person Families | 16 (35.6%) | $0 |
| 7+ Person Families | 2 (4.4%) | $0 |
| Total | 45 (100.0%) | $45,625 |
Family Income by Number of Earners in Hanksville
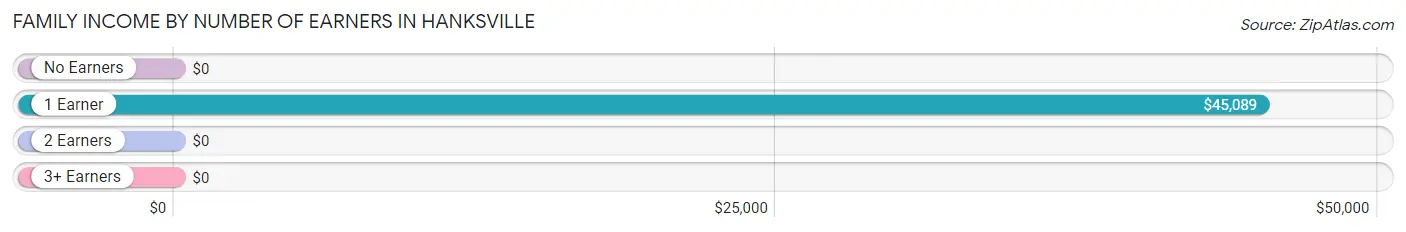
| Number of Earners | # Families | Median Income |
| No Earners | 2 (4.4%) | $0 |
| 1 Earner | 35 (77.8%) | $45,089 |
| 2 Earners | 3 (6.7%) | $0 |
| 3+ Earners | 5 (11.1%) | $0 |
| Total | 45 (100.0%) | $45,625 |
Household Income in Hanksville
Household Income Brackets in Hanksville
With 26 households falling in the category, the $50,000 to $74,999 income range is the most frequent in Hanksville, accounting for 28.3% of all households.
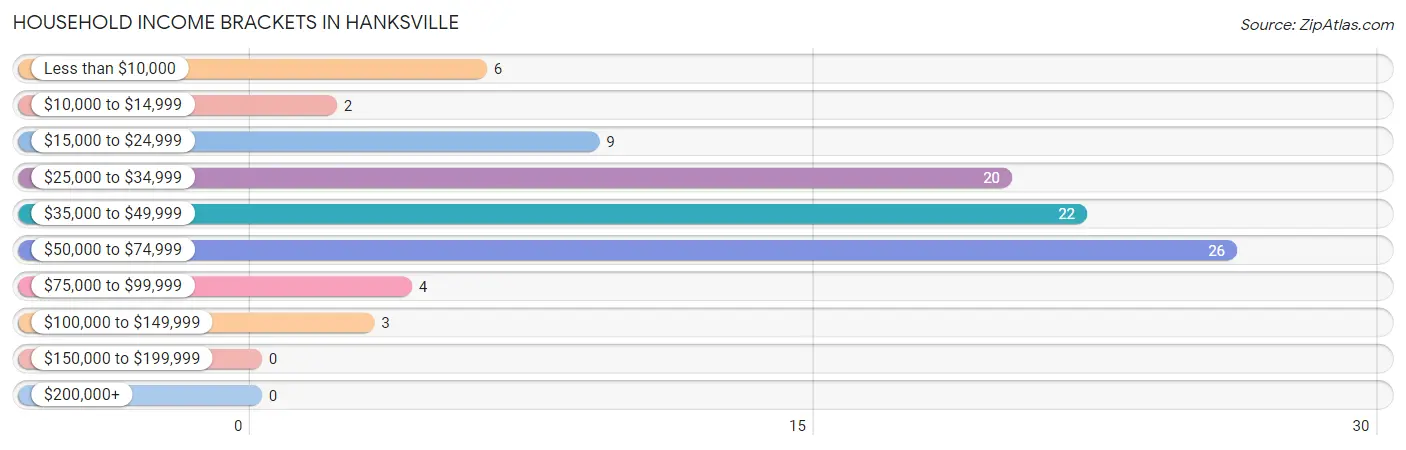
| Income Bracket | # Households | % Households |
| Less than $10,000 | 6 | 6.5% |
| $10,000 to $14,999 | 2 | 2.2% |
| $15,000 to $24,999 | 9 | 9.8% |
| $25,000 to $34,999 | 20 | 21.7% |
| $35,000 to $49,999 | 22 | 23.9% |
| $50,000 to $74,999 | 26 | 28.3% |
| $75,000 to $99,999 | 4 | 4.3% |
| $100,000 to $149,999 | 3 | 3.3% |
| $150,000 to $199,999 | 0 | 0.0% |
| $200,000+ | 0 | 0.0% |
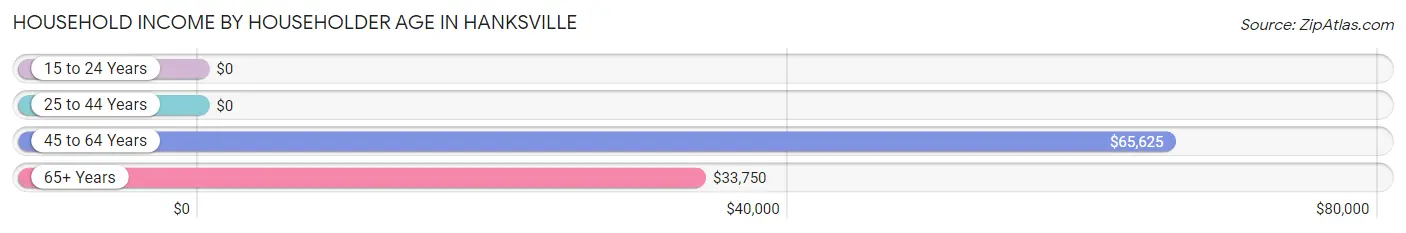
Household Income by Householder Age in Hanksville
The median household income in Hanksville is $45,714, with the highest median household income of $65,625 found in the 45 to 64 years age bracket for the primary householder. A total of 22 households (23.9%) fall into this category. Meanwhile, the 15 to 24 years age bracket for the primary householder has the lowest median household income of $0, with 14 households (15.2%) in this group.
| Income Bracket | # Households | Median Income |
| 15 to 24 Years | 14 (15.2%) | $0 |
| 25 to 44 Years | 31 (33.7%) | $0 |
| 45 to 64 Years | 22 (23.9%) | $65,625 |
| 65+ Years | 25 (27.2%) | $33,750 |
| Total | 92 (100.0%) | $45,714 |
Poverty in Hanksville
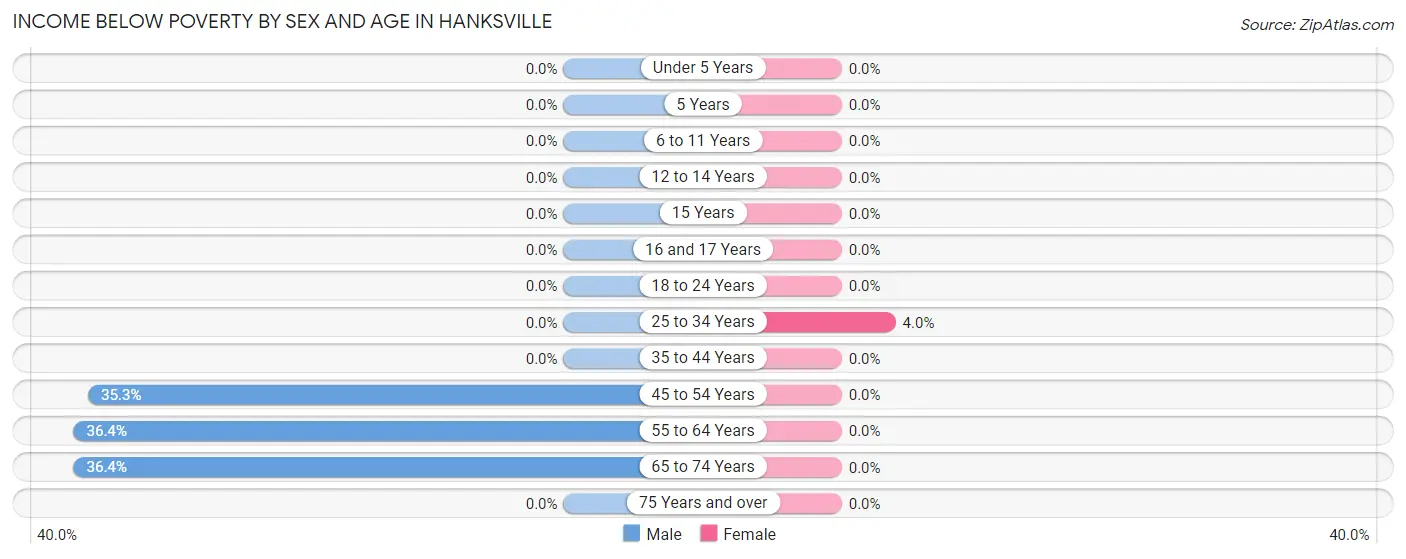
Income Below Poverty by Sex and Age in Hanksville
With 12.2% poverty level for males and 1.0% for females among the residents of Hanksville, 55 to 64 year old males and 25 to 34 year old females are the most vulnerable to poverty, with 4 males (36.4%) and 1 females (4.0%) in their respective age groups living below the poverty level.
| Age Bracket | Male | Female |
| Under 5 Years | 0 (0.0%) | 0 (0.0%) |
| 5 Years | 0 (0.0%) | 0 (0.0%) |
| 6 to 11 Years | 0 (0.0%) | 0 (0.0%) |
| 12 to 14 Years | 0 (0.0%) | 0 (0.0%) |
| 15 Years | 0 (0.0%) | 0 (0.0%) |
| 16 and 17 Years | 0 (0.0%) | 0 (0.0%) |
| 18 to 24 Years | 0 (0.0%) | 0 (0.0%) |
| 25 to 34 Years | 0 (0.0%) | 1 (4.0%) |
| 35 to 44 Years | 0 (0.0%) | 0 (0.0%) |
| 45 to 54 Years | 6 (35.3%) | 0 (0.0%) |
| 55 to 64 Years | 4 (36.4%) | 0 (0.0%) |
| 65 to 74 Years | 4 (36.4%) | 0 (0.0%) |
| 75 Years and over | 0 (0.0%) | 0 (0.0%) |
| Total | 14 (12.2%) | 1 (1.0%) |
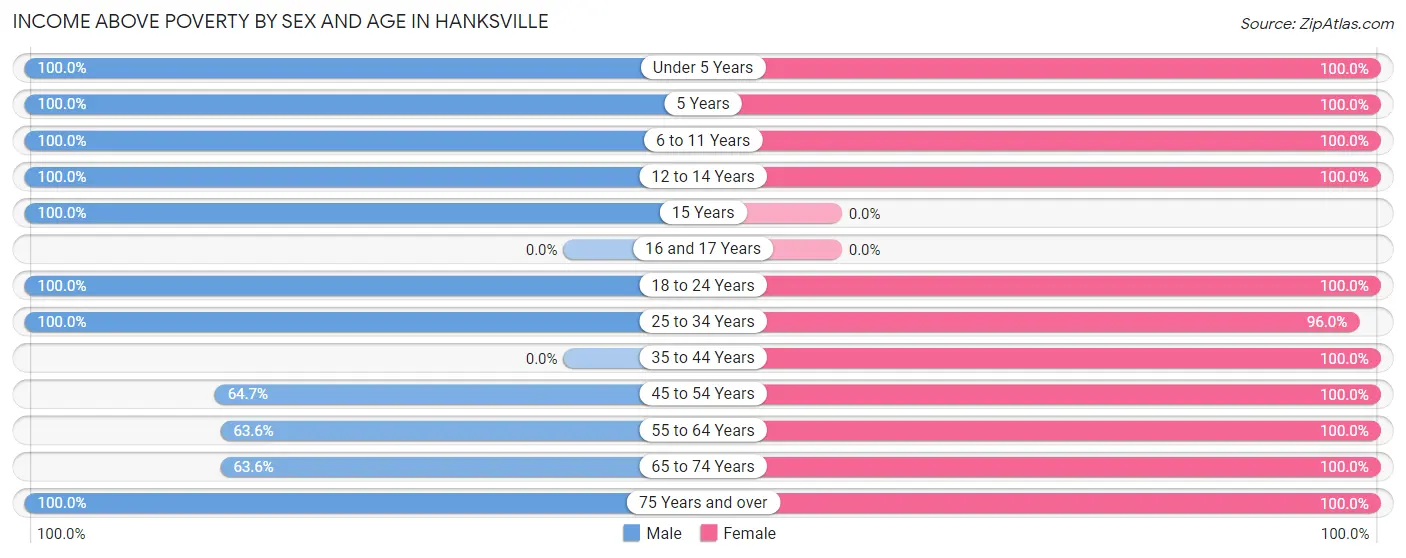
Income Above Poverty by Sex and Age in Hanksville
According to the poverty statistics in Hanksville, males aged under 5 years and females aged under 5 years are the age groups that are most secure financially, with 100.0% of males and 100.0% of females in these age groups living above the poverty line.
| Age Bracket | Male | Female |
| Under 5 Years | 8 (100.0%) | 11 (100.0%) |
| 5 Years | 7 (100.0%) | 4 (100.0%) |
| 6 to 11 Years | 4 (100.0%) | 8 (100.0%) |
| 12 to 14 Years | 2 (100.0%) | 7 (100.0%) |
| 15 Years | 5 (100.0%) | 0 (0.0%) |
| 16 and 17 Years | 0 (0.0%) | 0 (0.0%) |
| 18 to 24 Years | 30 (100.0%) | 12 (100.0%) |
| 25 to 34 Years | 18 (100.0%) | 24 (96.0%) |
| 35 to 44 Years | 0 (0.0%) | 1 (100.0%) |
| 45 to 54 Years | 11 (64.7%) | 3 (100.0%) |
| 55 to 64 Years | 7 (63.6%) | 10 (100.0%) |
| 65 to 74 Years | 7 (63.6%) | 14 (100.0%) |
| 75 Years and over | 2 (100.0%) | 7 (100.0%) |
| Total | 101 (87.8%) | 101 (99.0%) |
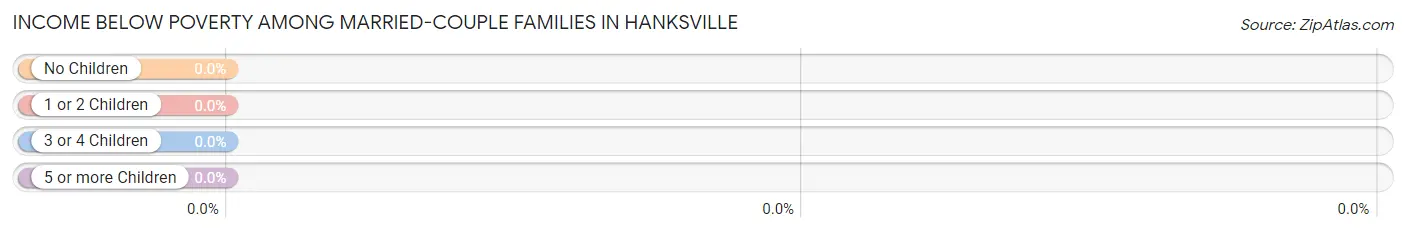
Income Below Poverty Among Married-Couple Families in Hanksville
| Children | Above Poverty | Below Poverty |
| No Children | 7 (100.0%) | 0 (0.0%) |
| 1 or 2 Children | 10 (100.0%) | 0 (0.0%) |
| 3 or 4 Children | 14 (100.0%) | 0 (0.0%) |
| 5 or more Children | 0 (0.0%) | 0 (0.0%) |
| Total | 31 (100.0%) | 0 (0.0%) |
Income Below Poverty Among Single-Parent Households in Hanksville
| Children | Single Father | Single Mother |
| No Children | 0 (0.0%) | 0 (0.0%) |
| 1 or 2 Children | 0 (0.0%) | 0 (0.0%) |
| 3 or 4 Children | 0 (0.0%) | 0 (0.0%) |
| 5 or more Children | 0 (0.0%) | 0 (0.0%) |
| Total | 0 (0.0%) | 0 (0.0%) |
Income Below Poverty Among Married-Couple vs Single-Parent Households in Hanksville
| Children | Married-Couple Families | Single-Parent Households |
| No Children | 0 (0.0%) | 0 (0.0%) |
| 1 or 2 Children | 0 (0.0%) | 0 (0.0%) |
| 3 or 4 Children | 0 (0.0%) | 0 (0.0%) |
| 5 or more Children | 0 (0.0%) | 0 (0.0%) |
| Total | 0 (0.0%) | 0 (0.0%) |
Race in Hanksville
The most populous races in Hanksville are White / Caucasian (207 | 95.4%), Two or more Races (10 | 4.6%), and Hispanic or Latino (3 | 1.4%).
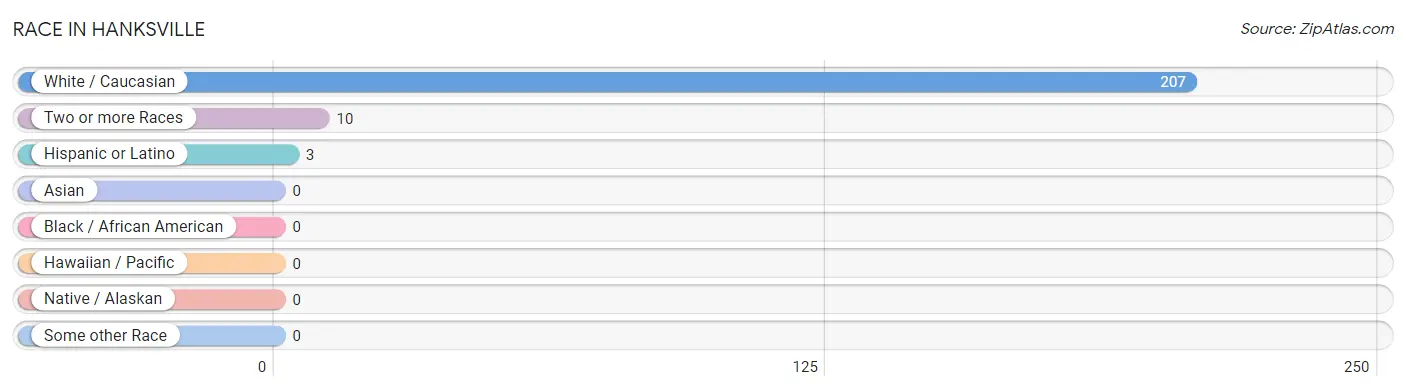
| Race | # Population | % Population |
| Asian | 0 | 0.0% |
| Black / African American | 0 | 0.0% |
| Hawaiian / Pacific | 0 | 0.0% |
| Hispanic or Latino | 3 | 1.4% |
| Native / Alaskan | 0 | 0.0% |
| White / Caucasian | 207 | 95.4% |
| Two or more Races | 10 | 4.6% |
| Some other Race | 0 | 0.0% |
| Total | 217 | 100.0% |
Ancestry in Hanksville
The most populous ancestries reported in Hanksville are English (77 | 35.5%), American (45 | 20.7%), Irish (42 | 19.4%), Italian (34 | 15.7%), and German (21 | 9.7%), together accounting for 100.9% of all Hanksville residents.
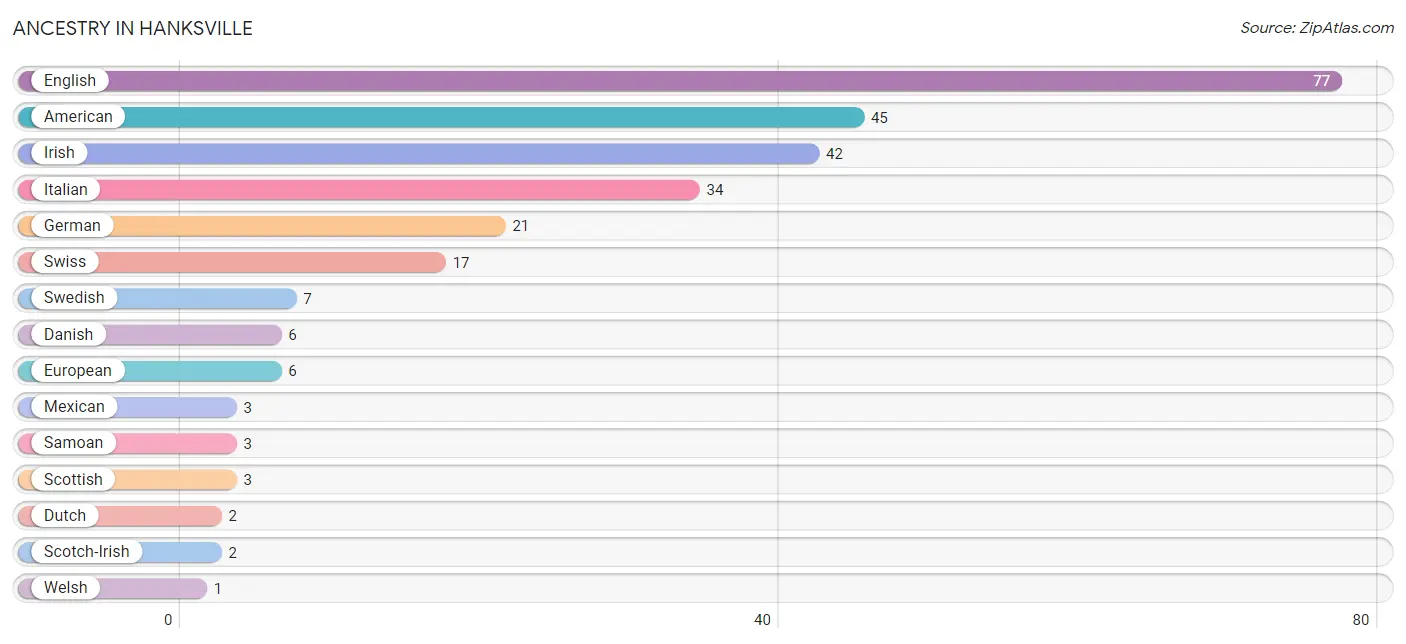
| Ancestry | # Population | % Population |
| American | 45 | 20.7% |
| Danish | 6 | 2.8% |
| Dutch | 2 | 0.9% |
| English | 77 | 35.5% |
| European | 6 | 2.8% |
| German | 21 | 9.7% |
| Irish | 42 | 19.4% |
| Italian | 34 | 15.7% |
| Mexican | 3 | 1.4% |
| Samoan | 3 | 1.4% |
| Scotch-Irish | 2 | 0.9% |
| Scottish | 3 | 1.4% |
| Swedish | 7 | 3.2% |
| Swiss | 17 | 7.8% |
| Welsh | 1 | 0.5% | View All 15 Rows |
Immigrants in Hanksville

| Immigration Origin | # Population | % Population | View All 0 Rows |
Sex and Age in Hanksville
Sex and Age in Hanksville
The most populous age groups in Hanksville are 15 to 19 Years (21 | 18.3%) for men and 25 to 29 Years (24 | 23.5%) for women.
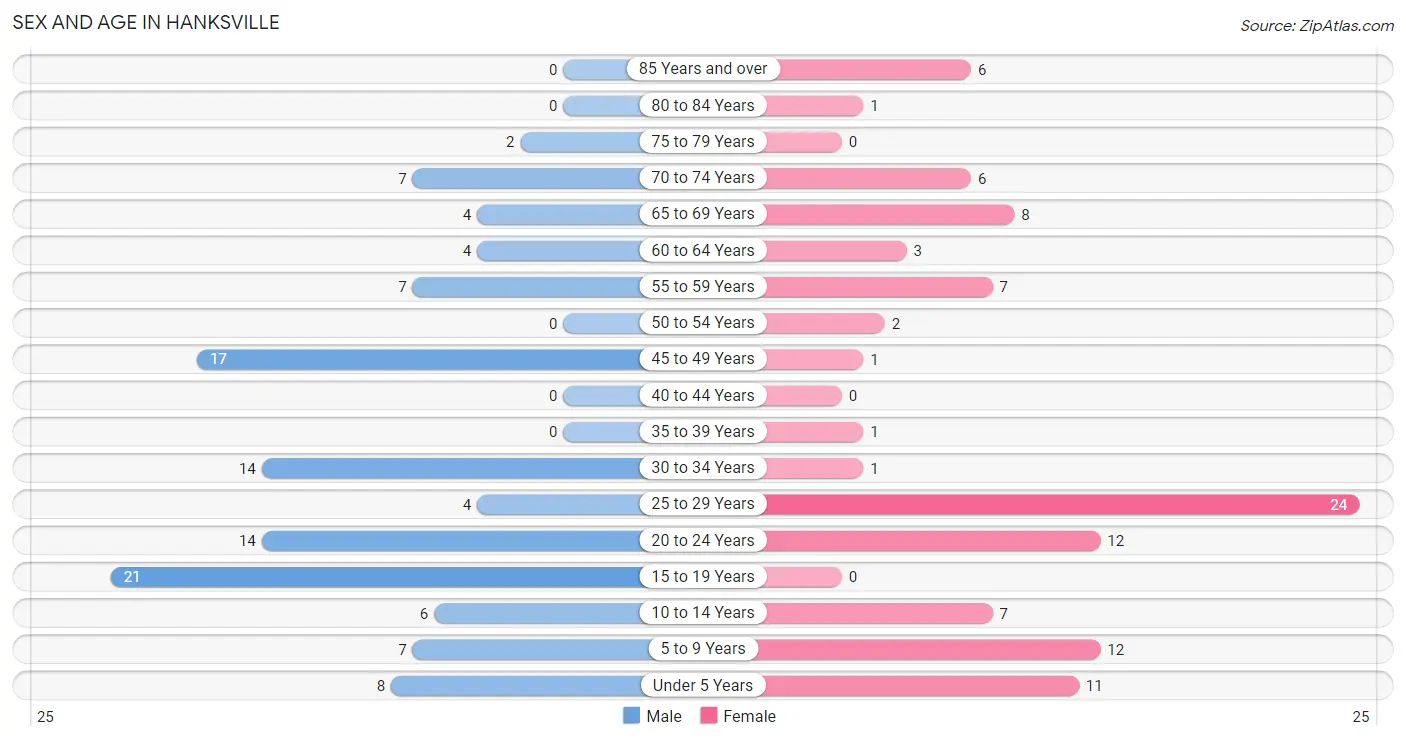
| Age Bracket | Male | Female |
| Under 5 Years | 8 (7.0%) | 11 (10.8%) |
| 5 to 9 Years | 7 (6.1%) | 12 (11.8%) |
| 10 to 14 Years | 6 (5.2%) | 7 (6.9%) |
| 15 to 19 Years | 21 (18.3%) | 0 (0.0%) |
| 20 to 24 Years | 14 (12.2%) | 12 (11.8%) |
| 25 to 29 Years | 4 (3.5%) | 24 (23.5%) |
| 30 to 34 Years | 14 (12.2%) | 1 (1.0%) |
| 35 to 39 Years | 0 (0.0%) | 1 (1.0%) |
| 40 to 44 Years | 0 (0.0%) | 0 (0.0%) |
| 45 to 49 Years | 17 (14.8%) | 1 (1.0%) |
| 50 to 54 Years | 0 (0.0%) | 2 (2.0%) |
| 55 to 59 Years | 7 (6.1%) | 7 (6.9%) |
| 60 to 64 Years | 4 (3.5%) | 3 (2.9%) |
| 65 to 69 Years | 4 (3.5%) | 8 (7.8%) |
| 70 to 74 Years | 7 (6.1%) | 6 (5.9%) |
| 75 to 79 Years | 2 (1.7%) | 0 (0.0%) |
| 80 to 84 Years | 0 (0.0%) | 1 (1.0%) |
| 85 Years and over | 0 (0.0%) | 6 (5.9%) |
| Total | 115 (100.0%) | 102 (100.0%) |
Families and Households in Hanksville
Median Family Size in Hanksville
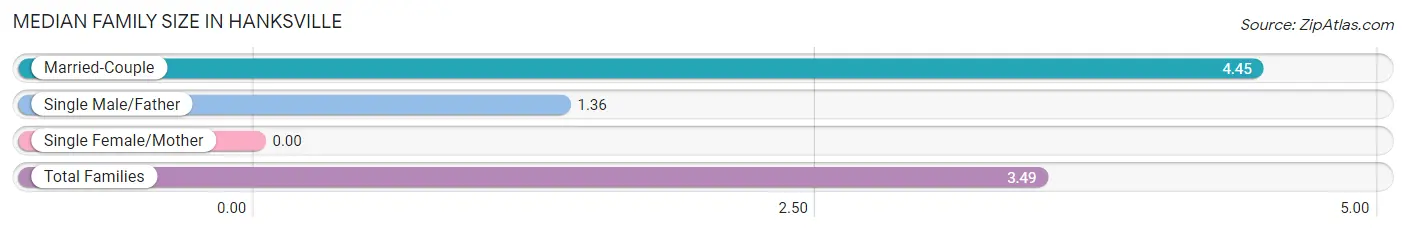
| Family Type | # Families | Family Size |
| Married-Couple | 31 (68.9%) | 4.45 |
| Single Male/Father | 14 (31.1%) | 1.36 |
| Single Female/Mother | 0 (0.0%) | - |
| Total Families | 45 (100.0%) | 3.49 |
Median Household Size in Hanksville
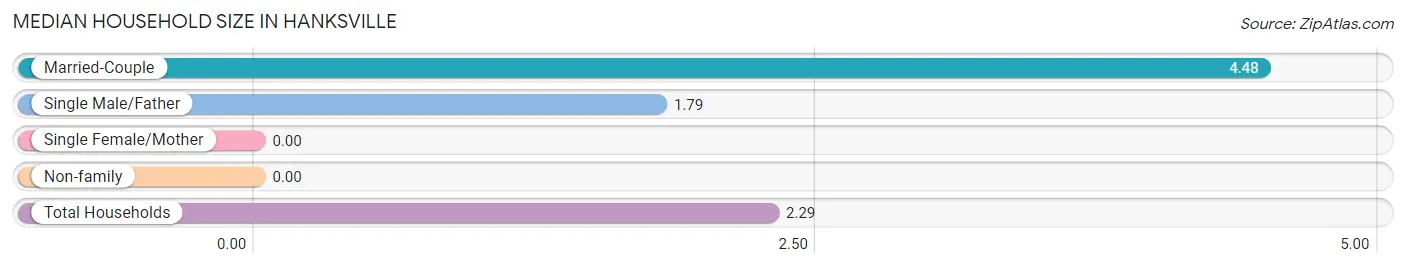
| Household Type | # Households | Household Size |
| Married-Couple | 31 (33.7%) | 4.48 |
| Single Male/Father | 14 (15.2%) | 1.79 |
| Single Female/Mother | 0 (0.0%) | - |
| Non-family | 47 (51.1%) | - |
| Total Households | 92 (100.0%) | 2.29 |
Household Size by Marriage Status in Hanksville
Out of a total of 92 households in Hanksville, 45 (48.9%) are family households, while 47 (51.1%) are nonfamily households. The most numerous type of family households are 6-person households, comprising 17, and the most common type of nonfamily households are 1-person households, comprising 47.
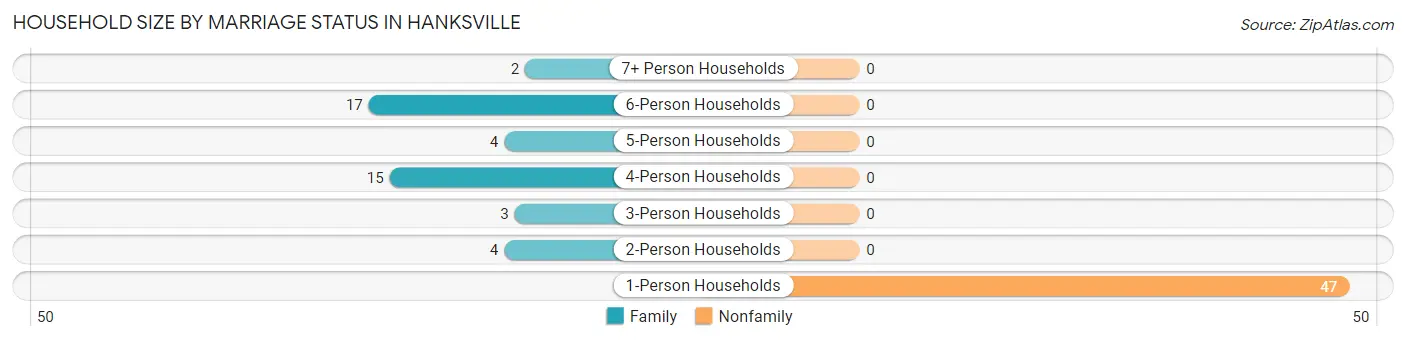
| Household Size | Family Households | Nonfamily Households |
| 1-Person Households | - | 47 (51.1%) |
| 2-Person Households | 4 (4.3%) | 0 (0.0%) |
| 3-Person Households | 3 (3.3%) | 0 (0.0%) |
| 4-Person Households | 15 (16.3%) | 0 (0.0%) |
| 5-Person Households | 4 (4.3%) | 0 (0.0%) |
| 6-Person Households | 17 (18.5%) | 0 (0.0%) |
| 7+ Person Households | 2 (2.2%) | 0 (0.0%) |
| Total | 45 (48.9%) | 47 (51.1%) |
Female Fertility in Hanksville
Fertility by Age in Hanksville
Average fertility rate in Hanksville is 308.0 births per 1,000 women. Women in the age bracket of 20 to 34 years have the highest fertility rate with 324.0 births per 1,000 women. Women in the age bracket of 20 to 34 years acount for 100.0% of all women with births.
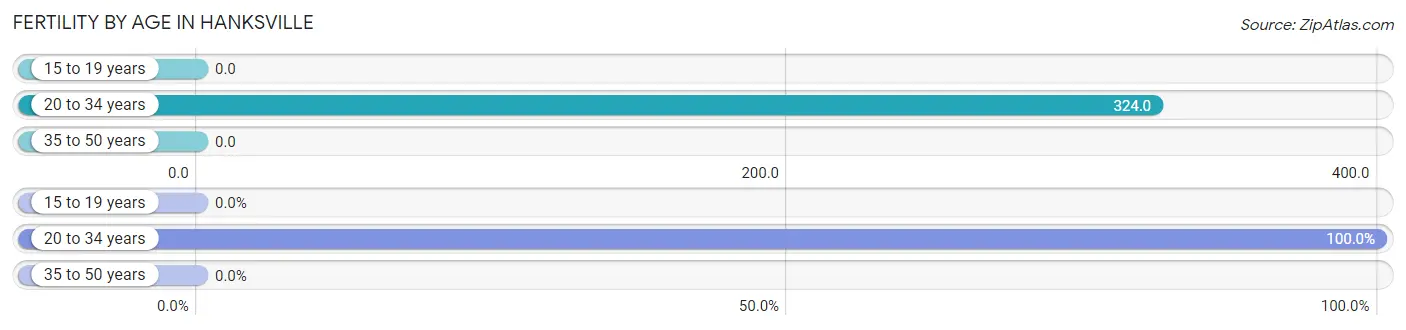
| Age Bracket | Women with Births | Births / 1,000 Women |
| 15 to 19 years | 0 (0.0%) | 0.0 |
| 20 to 34 years | 12 (100.0%) | 324.0 |
| 35 to 50 years | 0 (0.0%) | 0.0 |
| Total | 12 (100.0%) | 308.0 |
Fertility by Age by Marriage Status in Hanksville

| Age Bracket | Married | Unmarried |
| 15 to 19 years | 0 (0.0%) | 0 (0.0%) |
| 20 to 34 years | 12 (100.0%) | 0 (0.0%) |
| 35 to 50 years | 0 (0.0%) | 0 (0.0%) |
| Total | 12 (100.0%) | 0 (0.0%) |
Fertility by Education in Hanksville
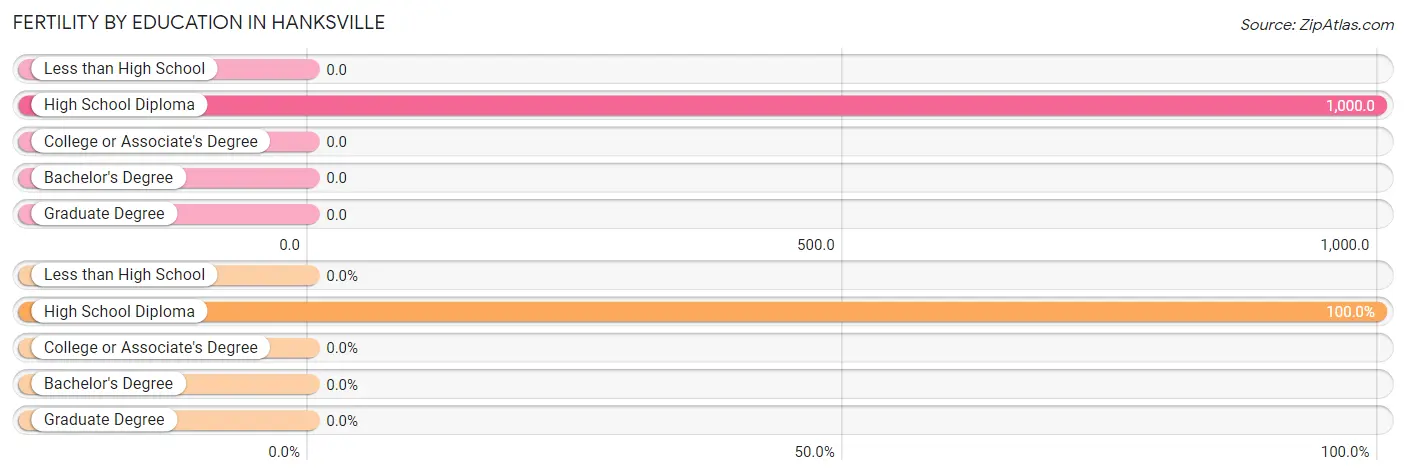
| Educational Attainment | Women with Births | Births / 1,000 Women |
| Less than High School | 0 (0.0%) | 0.0 |
| High School Diploma | 12 (100.0%) | 1,000.0 |
| College or Associate's Degree | 0 (0.0%) | 0.0 |
| Bachelor's Degree | 0 (0.0%) | 0.0 |
| Graduate Degree | 0 (0.0%) | 0.0 |
| Total | 12 (100.0%) | 308.0 |
Fertility by Education by Marriage Status in Hanksville
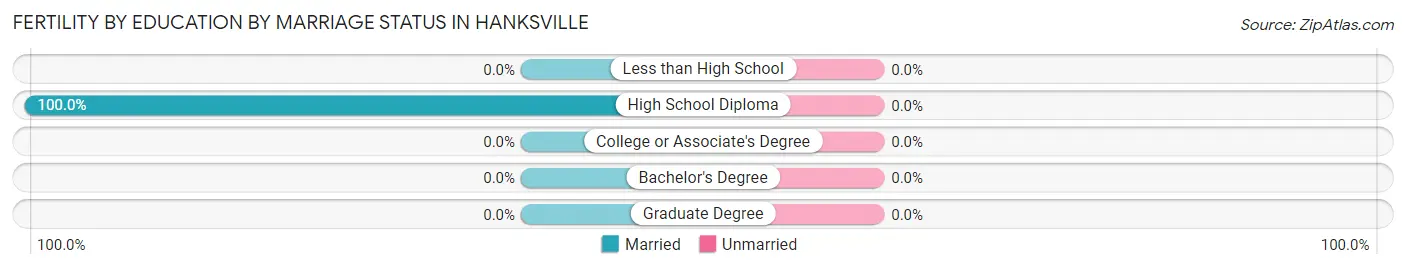
| Educational Attainment | Married | Unmarried |
| Less than High School | 0 (0.0%) | 0 (0.0%) |
| High School Diploma | 12 (100.0%) | 0 (0.0%) |
| College or Associate's Degree | 0 (0.0%) | 0 (0.0%) |
| Bachelor's Degree | 0 (0.0%) | 0 (0.0%) |
| Graduate Degree | 0 (0.0%) | 0 (0.0%) |
| Total | 12 (100.0%) | 0 (0.0%) |
Employment Characteristics in Hanksville
Employment by Class of Employer in Hanksville
Among the 94 employed individuals in Hanksville, federal government employees (54 | 57.5%), private company employees (15 | 16.0%), and state government employees (14 | 14.9%) make up the most common classes of employment.
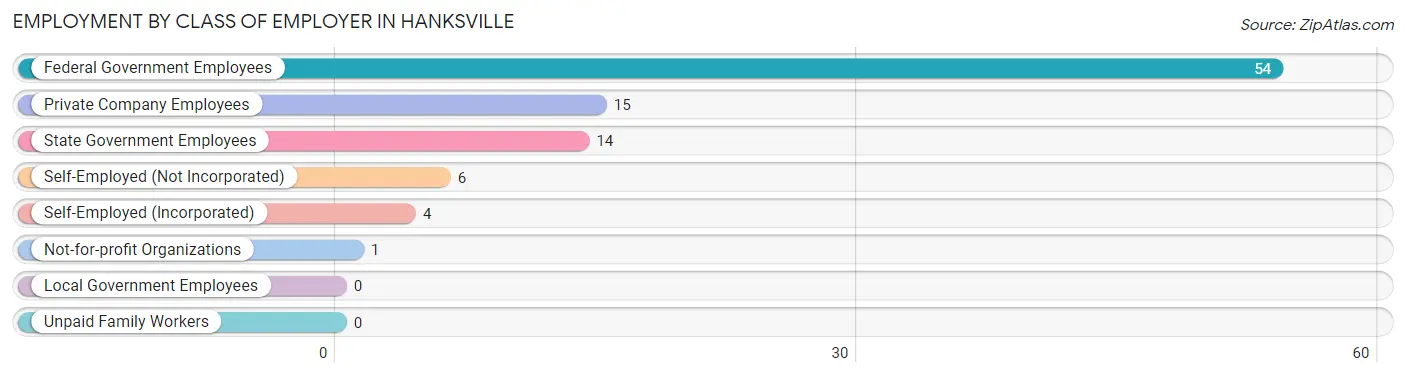
| Employer Class | # Employees | % Employees |
| Private Company Employees | 15 | 16.0% |
| Self-Employed (Incorporated) | 4 | 4.3% |
| Self-Employed (Not Incorporated) | 6 | 6.4% |
| Not-for-profit Organizations | 1 | 1.1% |
| Local Government Employees | 0 | 0.0% |
| State Government Employees | 14 | 14.9% |
| Federal Government Employees | 54 | 57.5% |
| Unpaid Family Workers | 0 | 0.0% |
| Total | 94 | 100.0% |
Employment Status by Age in Hanksville
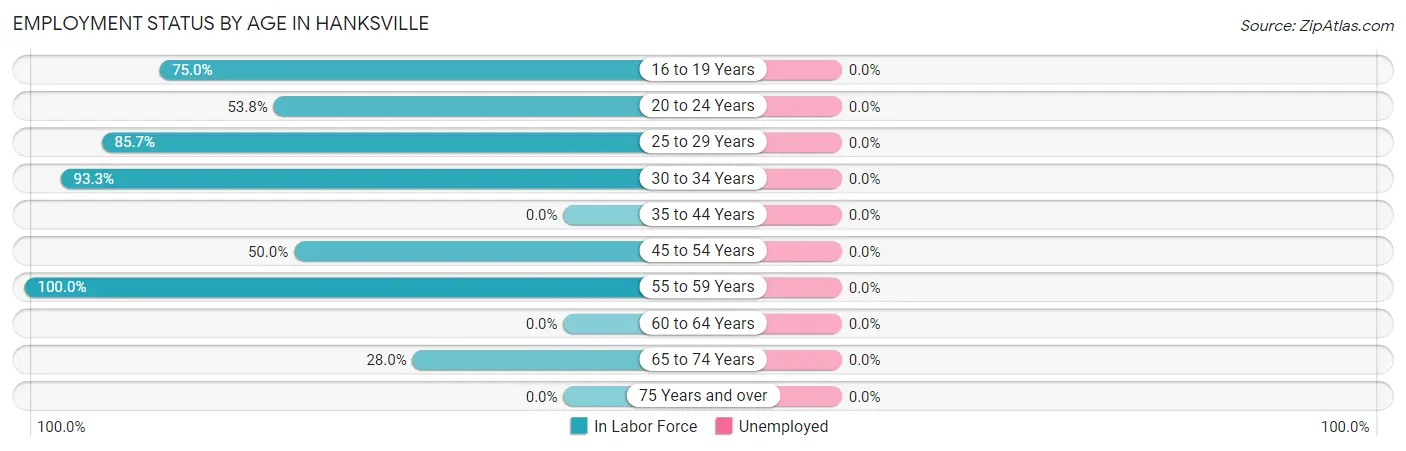
| Age Bracket | In Labor Force | Unemployed |
| 16 to 19 Years | 12 (75.0%) | 0 (0.0%) |
| 20 to 24 Years | 14 (53.8%) | 0 (0.0%) |
| 25 to 29 Years | 24 (85.7%) | 0 (0.0%) |
| 30 to 34 Years | 14 (93.3%) | 0 (0.0%) |
| 35 to 44 Years | 0 (0.0%) | 0 (0.0%) |
| 45 to 54 Years | 10 (50.0%) | 0 (0.0%) |
| 55 to 59 Years | 14 (100.0%) | 0 (0.0%) |
| 60 to 64 Years | 0 (0.0%) | 0 (0.0%) |
| 65 to 74 Years | 7 (28.0%) | 0 (0.0%) |
| 75 Years and over | 0 (0.0%) | 0 (0.0%) |
| Total | 95 (59.0%) | 0 (0.0%) |
Employment Status by Educational Attainment in Hanksville
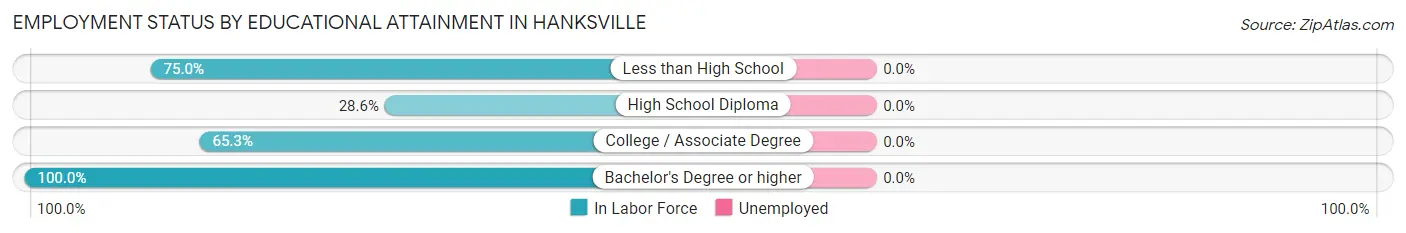
| Educational Attainment | In Labor Force | Unemployed |
| Less than High School | 3 (75.0%) | 0 (0.0%) |
| High School Diploma | 2 (28.6%) | 0 (0.0%) |
| College / Associate Degree | 32 (65.3%) | 0 (0.0%) |
| Bachelor's Degree or higher | 25 (100.0%) | 0 (0.0%) |
| Total | 62 (72.9%) | 0 (0.0%) |
Employment Occupations by Sex in Hanksville
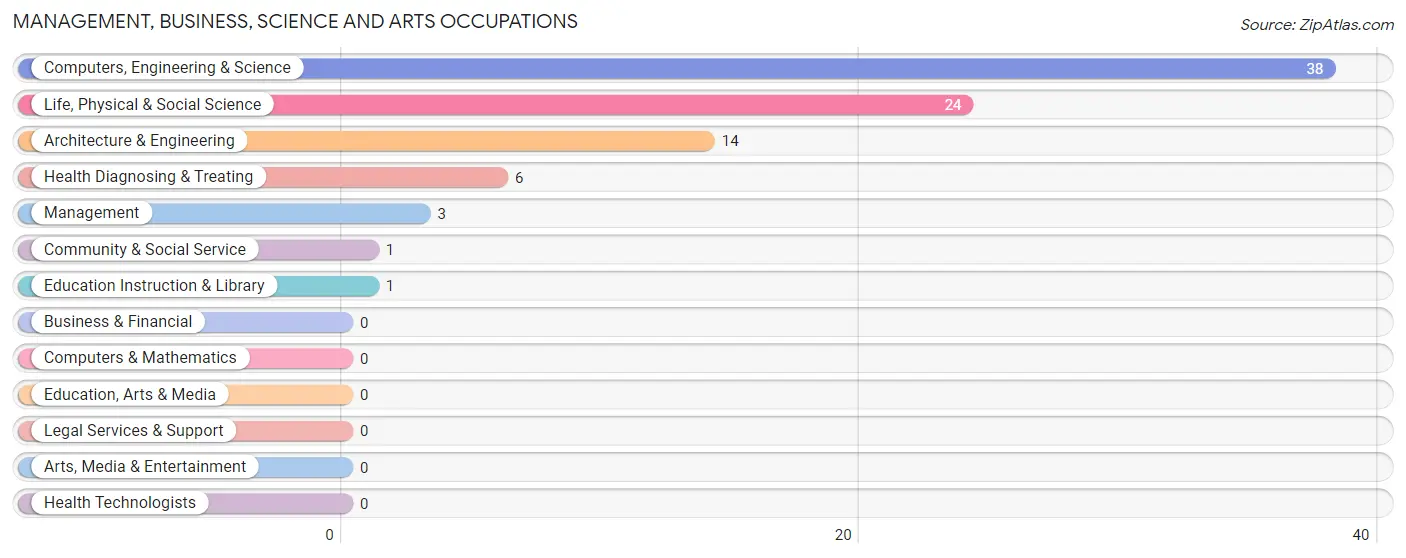
Management, Business, Science and Arts Occupations
The most common Management, Business, Science and Arts occupations in Hanksville are Computers, Engineering & Science (38 | 40.0%), Life, Physical & Social Science (24 | 25.3%), Architecture & Engineering (14 | 14.7%), Health Diagnosing & Treating (6 | 6.3%), and Management (3 | 3.2%).
Management, Business, Science and Arts Occupations by Sex
Within the Management, Business, Science and Arts occupations in Hanksville, the most male-oriented occupations are Management (100.0%), Architecture & Engineering (100.0%), and Computers, Engineering & Science (55.3%), while the most female-oriented occupations are Community & Social Service (100.0%), Education Instruction & Library (100.0%), and Health Diagnosing & Treating (100.0%).
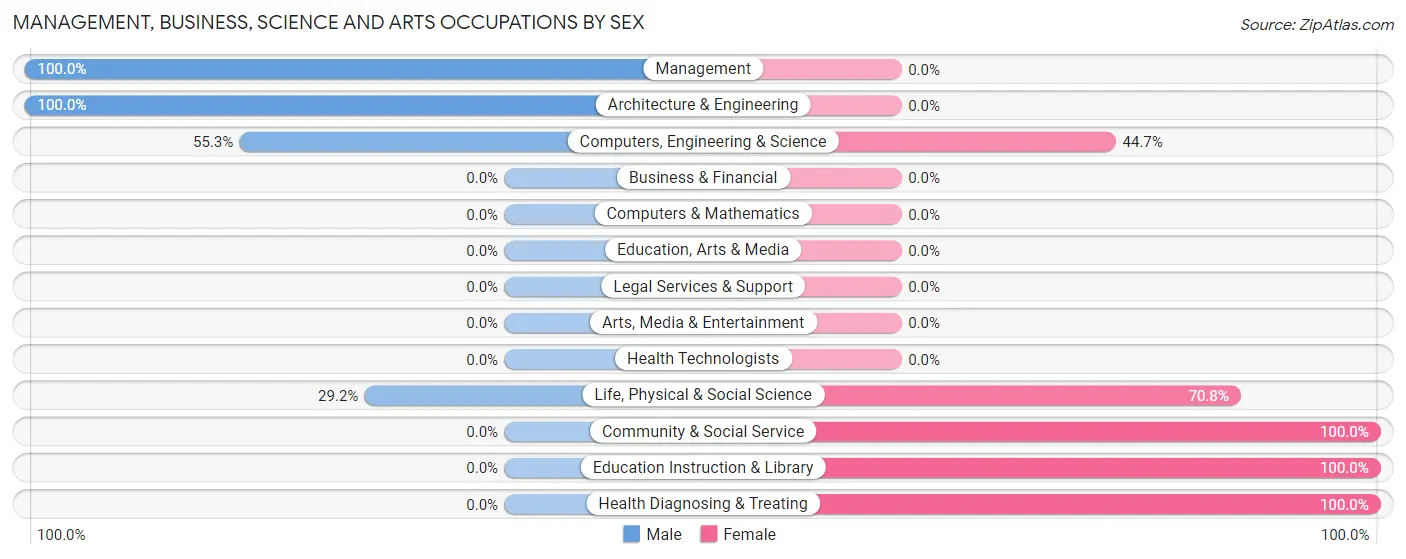
| Occupation | Male | Female |
| Management | 3 (100.0%) | 0 (0.0%) |
| Business & Financial | 0 (0.0%) | 0 (0.0%) |
| Computers, Engineering & Science | 21 (55.3%) | 17 (44.7%) |
| Computers & Mathematics | 0 (0.0%) | 0 (0.0%) |
| Architecture & Engineering | 14 (100.0%) | 0 (0.0%) |
| Life, Physical & Social Science | 7 (29.2%) | 17 (70.8%) |
| Community & Social Service | 0 (0.0%) | 1 (100.0%) |
| Education, Arts & Media | 0 (0.0%) | 0 (0.0%) |
| Legal Services & Support | 0 (0.0%) | 0 (0.0%) |
| Education Instruction & Library | 0 (0.0%) | 1 (100.0%) |
| Arts, Media & Entertainment | 0 (0.0%) | 0 (0.0%) |
| Health Diagnosing & Treating | 0 (0.0%) | 6 (100.0%) |
| Health Technologists | 0 (0.0%) | 0 (0.0%) |
| Total (Category) | 24 (50.0%) | 24 (50.0%) |
| Total (Overall) | 57 (60.0%) | 38 (40.0%) |
Services Occupations
The most common Services occupations in Hanksville are Healthcare Support (3 | 3.2%), Cleaning & Maintenance (3 | 3.2%), and Personal Care & Service (1 | 1.1%).
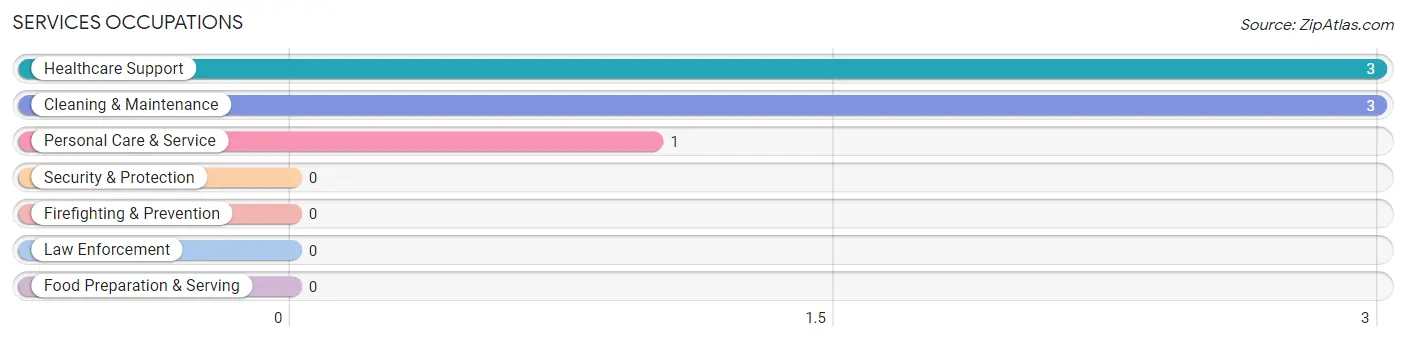
Services Occupations by Sex
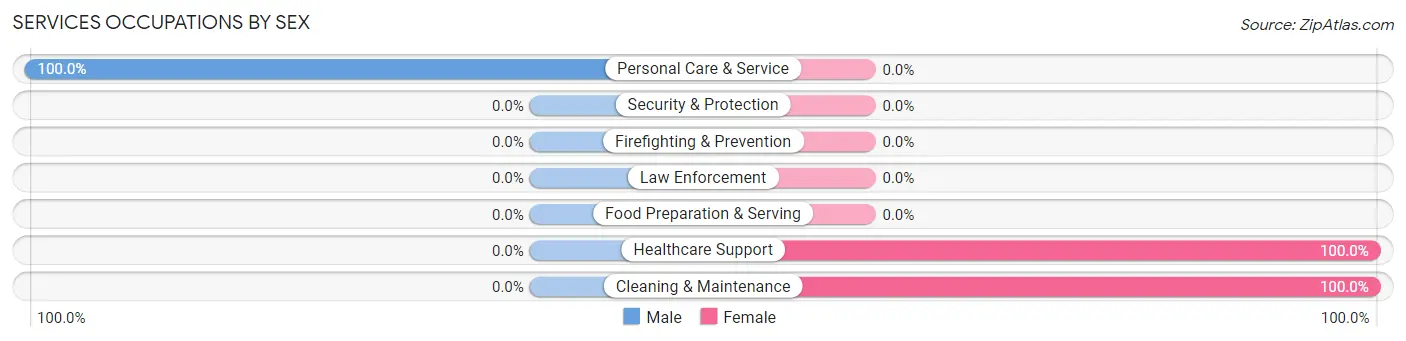
| Occupation | Male | Female |
| Healthcare Support | 0 (0.0%) | 3 (100.0%) |
| Security & Protection | 0 (0.0%) | 0 (0.0%) |
| Firefighting & Prevention | 0 (0.0%) | 0 (0.0%) |
| Law Enforcement | 0 (0.0%) | 0 (0.0%) |
| Food Preparation & Serving | 0 (0.0%) | 0 (0.0%) |
| Cleaning & Maintenance | 0 (0.0%) | 3 (100.0%) |
| Personal Care & Service | 1 (100.0%) | 0 (0.0%) |
| Total (Category) | 1 (14.3%) | 6 (85.7%) |
| Total (Overall) | 57 (60.0%) | 38 (40.0%) |
Sales and Office Occupations
The most common Sales and Office occupations in Hanksville are Office & Administration (7 | 7.4%), and Sales & Related (5 | 5.3%).

Sales and Office Occupations by Sex

| Occupation | Male | Female |
| Sales & Related | 4 (80.0%) | 1 (20.0%) |
| Office & Administration | 0 (0.0%) | 7 (100.0%) |
| Total (Category) | 4 (33.3%) | 8 (66.7%) |
| Total (Overall) | 57 (60.0%) | 38 (40.0%) |
Natural Resources, Construction and Maintenance Occupations
The most common Natural Resources, Construction and Maintenance occupations in Hanksville are , and Construction & Extraction (2 | 2.1%).
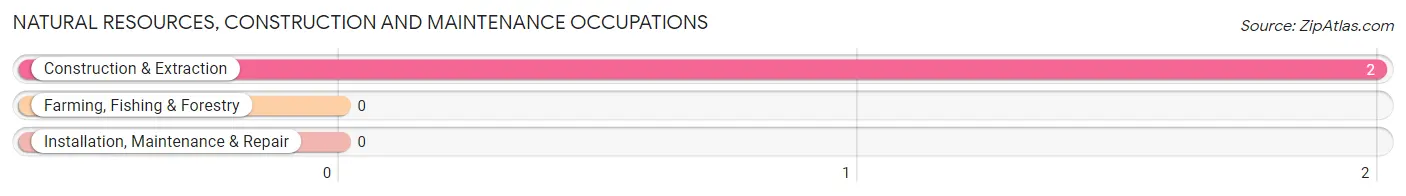
Natural Resources, Construction and Maintenance Occupations by Sex

| Occupation | Male | Female |
| Farming, Fishing & Forestry | 0 (0.0%) | 0 (0.0%) |
| Construction & Extraction | 2 (100.0%) | 0 (0.0%) |
| Installation, Maintenance & Repair | 0 (0.0%) | 0 (0.0%) |
| Total (Category) | 2 (100.0%) | 0 (0.0%) |
| Total (Overall) | 57 (60.0%) | 38 (40.0%) |
Production, Transportation and Moving Occupations
The most common Production, Transportation and Moving occupations in Hanksville are Transportation (14 | 14.7%), and Material Moving (12 | 12.6%).
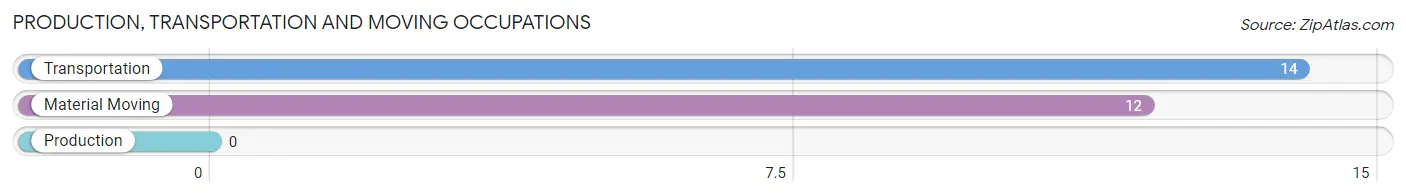
Production, Transportation and Moving Occupations by Sex
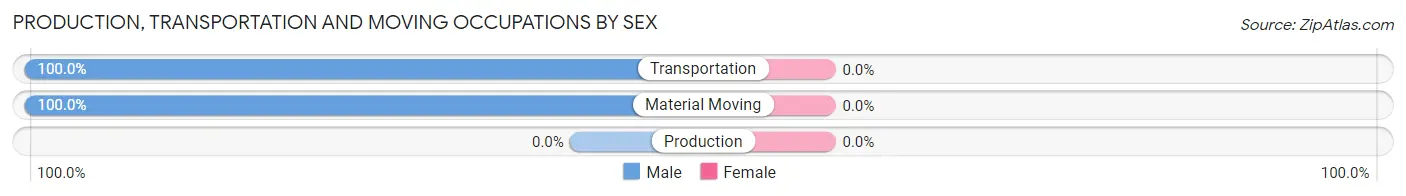
| Occupation | Male | Female |
| Production | 0 (0.0%) | 0 (0.0%) |
| Transportation | 14 (100.0%) | 0 (0.0%) |
| Material Moving | 12 (100.0%) | 0 (0.0%) |
| Total (Category) | 26 (100.0%) | 0 (0.0%) |
| Total (Overall) | 57 (60.0%) | 38 (40.0%) |
Employment Industries by Sex in Hanksville
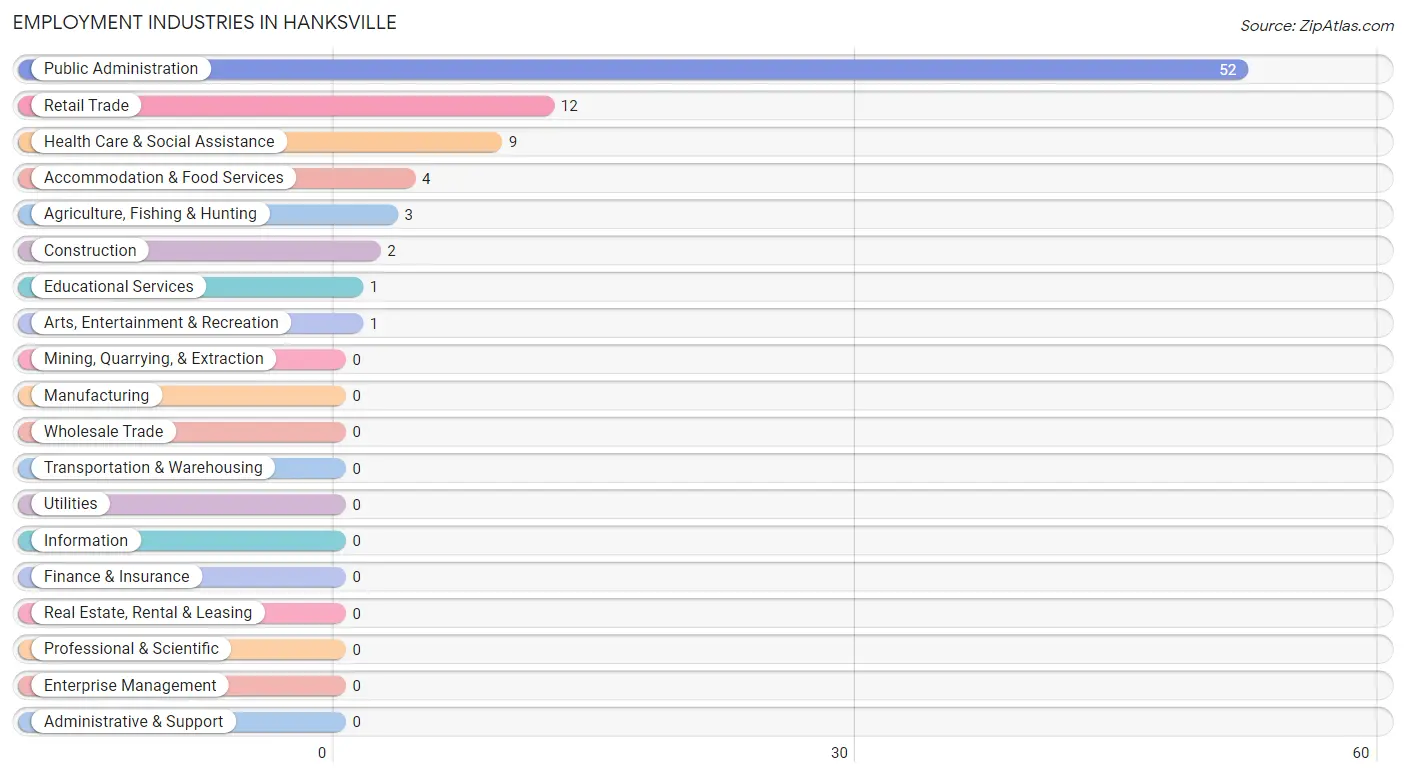
Employment Industries in Hanksville
The major employment industries in Hanksville include Public Administration (52 | 54.7%), Retail Trade (12 | 12.6%), Health Care & Social Assistance (9 | 9.5%), Accommodation & Food Services (4 | 4.2%), and Agriculture, Fishing & Hunting (3 | 3.2%).
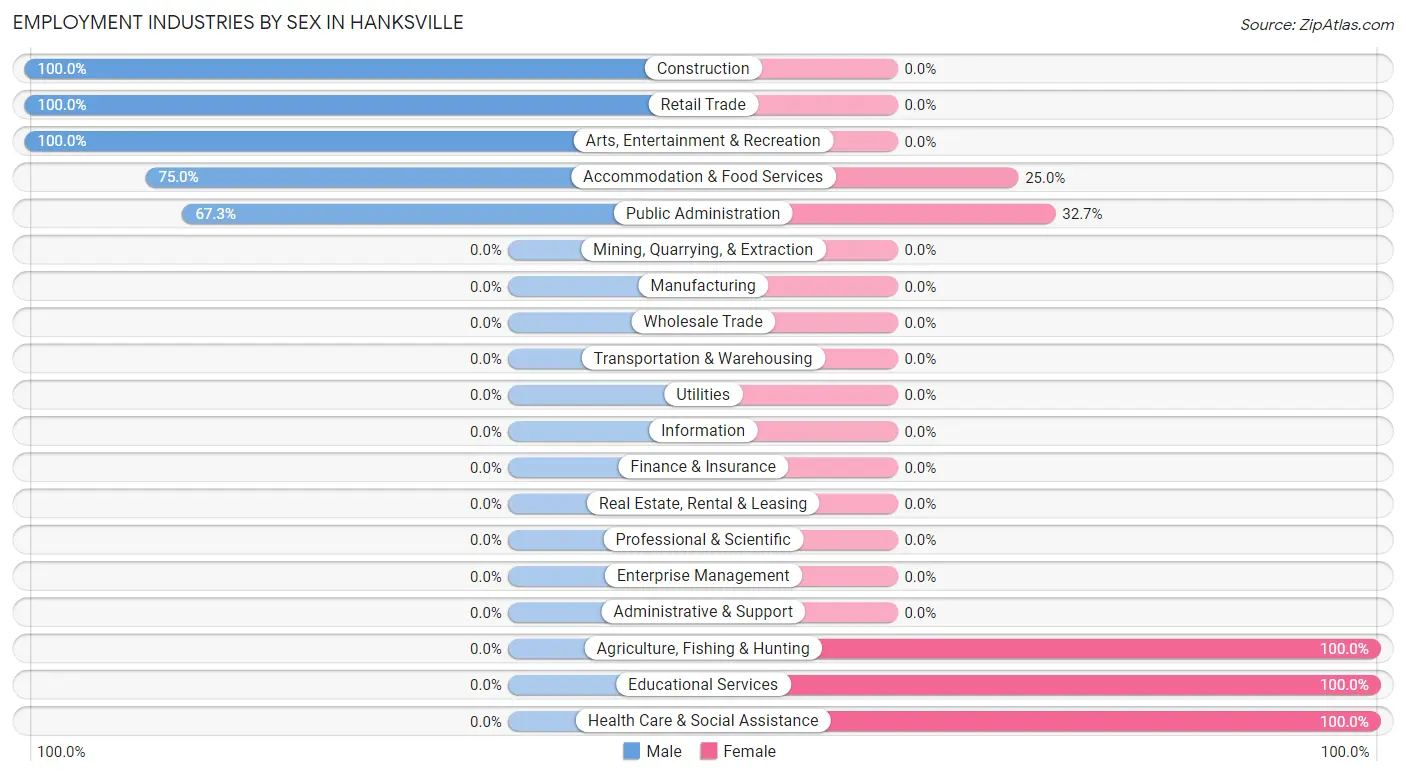
Employment Industries by Sex in Hanksville
The Hanksville industries that see more men than women are Construction (100.0%), Retail Trade (100.0%), and Arts, Entertainment & Recreation (100.0%), whereas the industries that tend to have a higher number of women are Agriculture, Fishing & Hunting (100.0%), Educational Services (100.0%), and Health Care & Social Assistance (100.0%).
| Industry | Male | Female |
| Agriculture, Fishing & Hunting | 0 (0.0%) | 3 (100.0%) |
| Mining, Quarrying, & Extraction | 0 (0.0%) | 0 (0.0%) |
| Construction | 2 (100.0%) | 0 (0.0%) |
| Manufacturing | 0 (0.0%) | 0 (0.0%) |
| Wholesale Trade | 0 (0.0%) | 0 (0.0%) |
| Retail Trade | 12 (100.0%) | 0 (0.0%) |
| Transportation & Warehousing | 0 (0.0%) | 0 (0.0%) |
| Utilities | 0 (0.0%) | 0 (0.0%) |
| Information | 0 (0.0%) | 0 (0.0%) |
| Finance & Insurance | 0 (0.0%) | 0 (0.0%) |
| Real Estate, Rental & Leasing | 0 (0.0%) | 0 (0.0%) |
| Professional & Scientific | 0 (0.0%) | 0 (0.0%) |
| Enterprise Management | 0 (0.0%) | 0 (0.0%) |
| Administrative & Support | 0 (0.0%) | 0 (0.0%) |
| Educational Services | 0 (0.0%) | 1 (100.0%) |
| Health Care & Social Assistance | 0 (0.0%) | 9 (100.0%) |
| Arts, Entertainment & Recreation | 1 (100.0%) | 0 (0.0%) |
| Accommodation & Food Services | 3 (75.0%) | 1 (25.0%) |
| Public Administration | 35 (67.3%) | 17 (32.7%) |
| Total | 57 (60.0%) | 38 (40.0%) |
Education in Hanksville
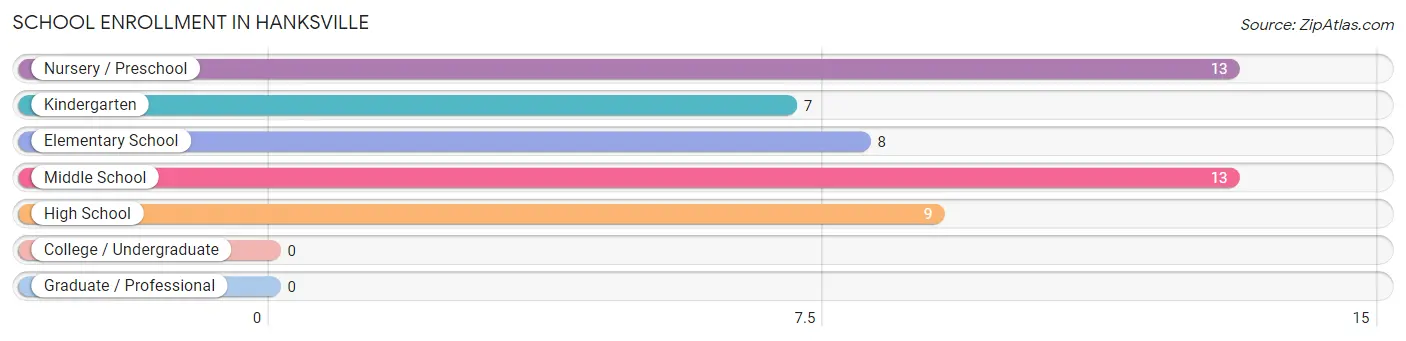
School Enrollment in Hanksville
The most common levels of schooling among the 50 students in Hanksville are nursery / preschool (13 | 26.0%), middle school (13 | 26.0%), and high school (9 | 18.0%).
| School Level | # Students | % Students |
| Nursery / Preschool | 13 | 26.0% |
| Kindergarten | 7 | 14.0% |
| Elementary School | 8 | 16.0% |
| Middle School | 13 | 26.0% |
| High School | 9 | 18.0% |
| College / Undergraduate | 0 | 0.0% |
| Graduate / Professional | 0 | 0.0% |
| Total | 50 | 100.0% |
School Enrollment by Age by Funding Source in Hanksville
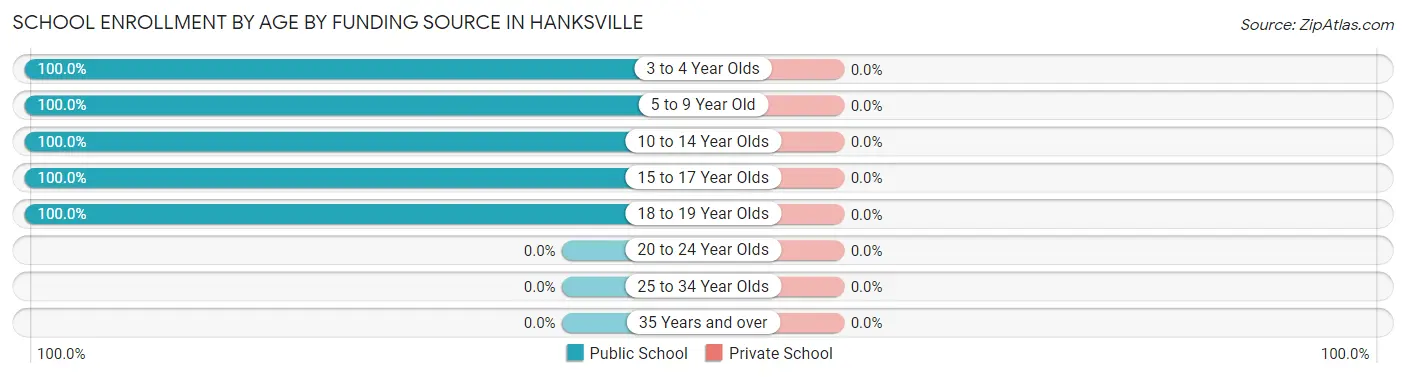
| Age Bracket | Public School | Private School |
| 3 to 4 Year Olds | 9 (100.0%) | 0 (0.0%) |
| 5 to 9 Year Old | 19 (100.0%) | 0 (0.0%) |
| 10 to 14 Year Olds | 13 (100.0%) | 0 (0.0%) |
| 15 to 17 Year Olds | 5 (100.0%) | 0 (0.0%) |
| 18 to 19 Year Olds | 4 (100.0%) | 0 (0.0%) |
| 20 to 24 Year Olds | 0 (0.0%) | 0 (0.0%) |
| 25 to 34 Year Olds | 0 (0.0%) | 0 (0.0%) |
| 35 Years and over | 0 (0.0%) | 0 (0.0%) |
| Total | 50 (100.0%) | 0 (0.0%) |
Educational Attainment by Field of Study in Hanksville
Bio, nature & agricultural (24 | 92.3%), business (1 | 3.8%), and education (1 | 3.8%) are the most common fields of study among 26 individuals in Hanksville who have obtained a bachelor's degree or higher.
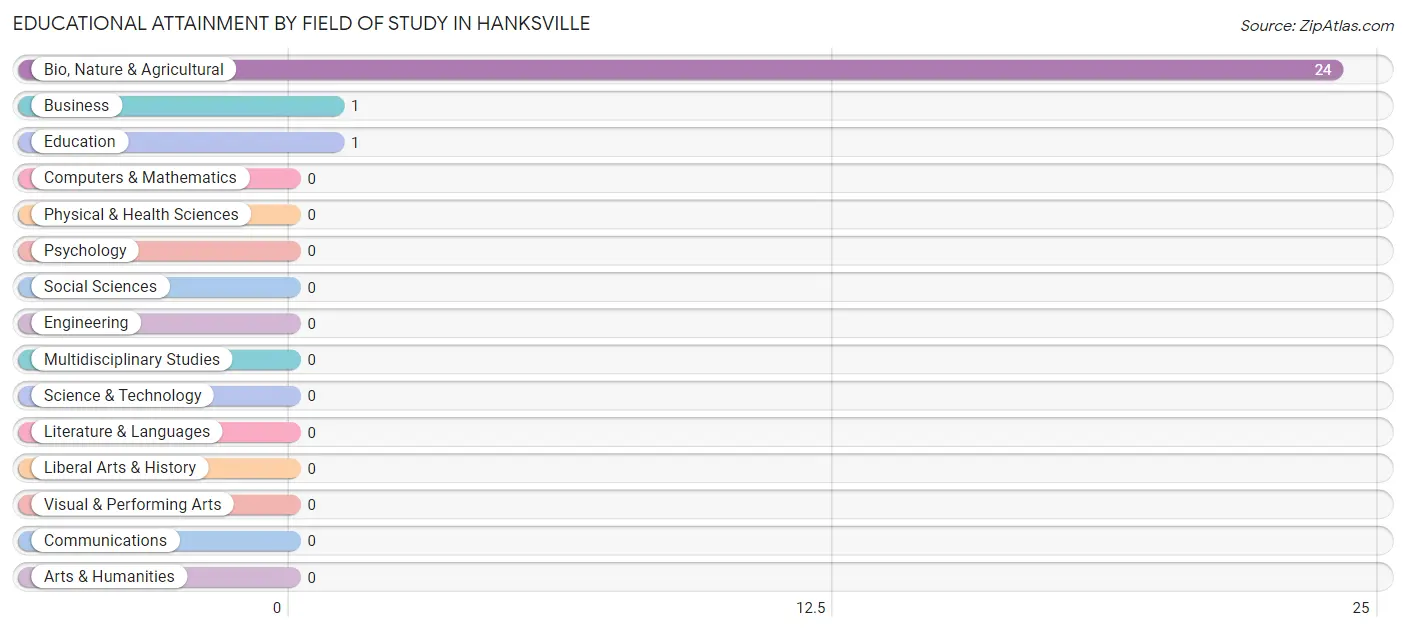
| Field of Study | # Graduates | % Graduates |
| Computers & Mathematics | 0 | 0.0% |
| Bio, Nature & Agricultural | 24 | 92.3% |
| Physical & Health Sciences | 0 | 0.0% |
| Psychology | 0 | 0.0% |
| Social Sciences | 0 | 0.0% |
| Engineering | 0 | 0.0% |
| Multidisciplinary Studies | 0 | 0.0% |
| Science & Technology | 0 | 0.0% |
| Business | 1 | 3.8% |
| Education | 1 | 3.8% |
| Literature & Languages | 0 | 0.0% |
| Liberal Arts & History | 0 | 0.0% |
| Visual & Performing Arts | 0 | 0.0% |
| Communications | 0 | 0.0% |
| Arts & Humanities | 0 | 0.0% |
| Total | 26 | 100.0% |
Transportation & Commute in Hanksville
Vehicle Availability by Sex in Hanksville
The most prevalent vehicle ownership categories in Hanksville are males with 2 vehicles (28, accounting for 49.1%) and females with 2 vehicles (10, making up 75.7%).
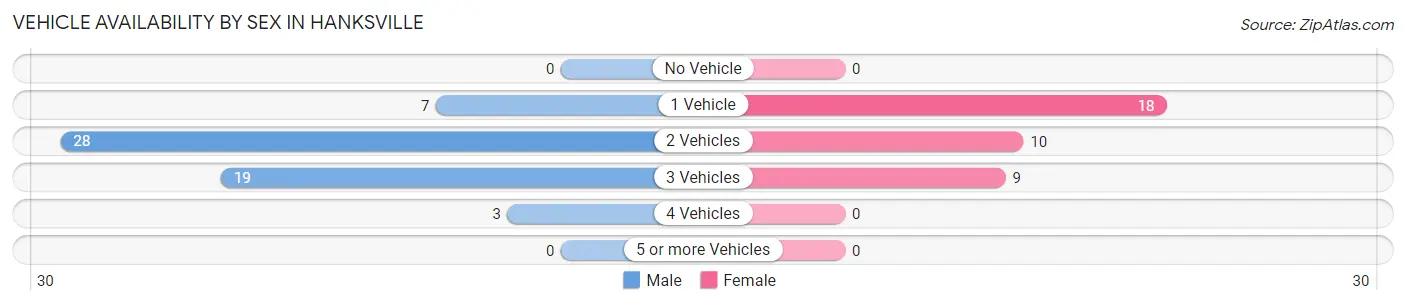
| Vehicles Available | Male | Female |
| No Vehicle | 0 (0.0%) | 0 (0.0%) |
| 1 Vehicle | 7 (12.3%) | 18 (48.6%) |
| 2 Vehicles | 28 (49.1%) | 10 (27.0%) |
| 3 Vehicles | 19 (33.3%) | 9 (24.3%) |
| 4 Vehicles | 3 (5.3%) | 0 (0.0%) |
| 5 or more Vehicles | 0 (0.0%) | 0 (0.0%) |
| Total | 57 (100.0%) | 37 (100.0%) |
Commute Time in Hanksville
The most frequently occuring commute durations in Hanksville are less than 5 minutes (38 commuters, 43.2%), 60 to 89 minutes (25 commuters, 28.4%), and 45 to 59 minutes (14 commuters, 15.9%).
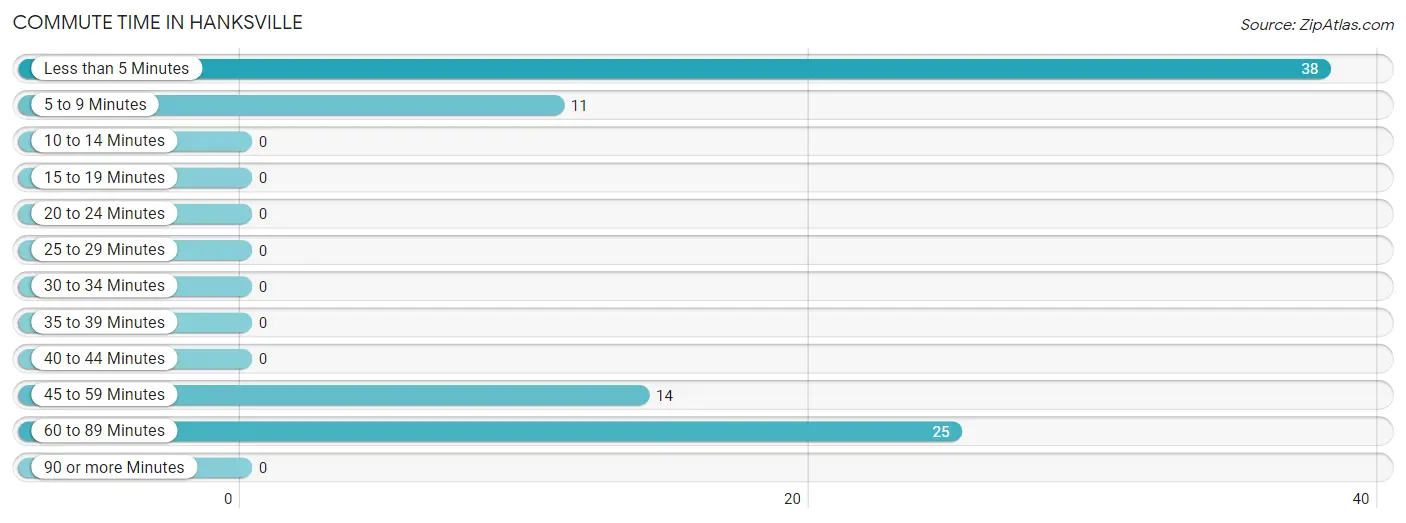
| Commute Time | # Commuters | % Commuters |
| Less than 5 Minutes | 38 | 43.2% |
| 5 to 9 Minutes | 11 | 12.5% |
| 10 to 14 Minutes | 0 | 0.0% |
| 15 to 19 Minutes | 0 | 0.0% |
| 20 to 24 Minutes | 0 | 0.0% |
| 25 to 29 Minutes | 0 | 0.0% |
| 30 to 34 Minutes | 0 | 0.0% |
| 35 to 39 Minutes | 0 | 0.0% |
| 40 to 44 Minutes | 0 | 0.0% |
| 45 to 59 Minutes | 14 | 15.9% |
| 60 to 89 Minutes | 25 | 28.4% |
| 90 or more Minutes | 0 | 0.0% |
Commute Time by Sex in Hanksville
The most common commute times in Hanksville are less than 5 minutes (21 commuters, 38.9%) for males and less than 5 minutes (17 commuters, 50.0%) for females.
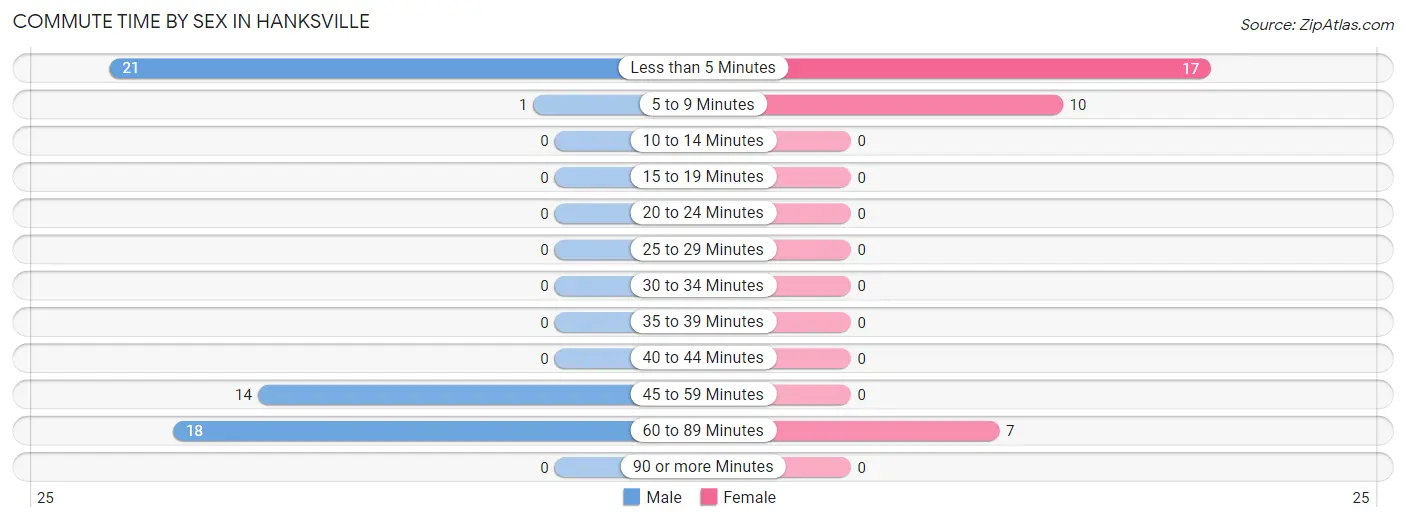
| Commute Time | Male | Female |
| Less than 5 Minutes | 21 (38.9%) | 17 (50.0%) |
| 5 to 9 Minutes | 1 (1.8%) | 10 (29.4%) |
| 10 to 14 Minutes | 0 (0.0%) | 0 (0.0%) |
| 15 to 19 Minutes | 0 (0.0%) | 0 (0.0%) |
| 20 to 24 Minutes | 0 (0.0%) | 0 (0.0%) |
| 25 to 29 Minutes | 0 (0.0%) | 0 (0.0%) |
| 30 to 34 Minutes | 0 (0.0%) | 0 (0.0%) |
| 35 to 39 Minutes | 0 (0.0%) | 0 (0.0%) |
| 40 to 44 Minutes | 0 (0.0%) | 0 (0.0%) |
| 45 to 59 Minutes | 14 (25.9%) | 0 (0.0%) |
| 60 to 89 Minutes | 18 (33.3%) | 7 (20.6%) |
| 90 or more Minutes | 0 (0.0%) | 0 (0.0%) |
Time of Departure to Work by Sex in Hanksville
The most frequent times of departure to work in Hanksville are 6:00 AM to 6:29 AM (21, 38.9%) for males and 7:00 AM to 7:29 AM (24, 70.6%) for females.
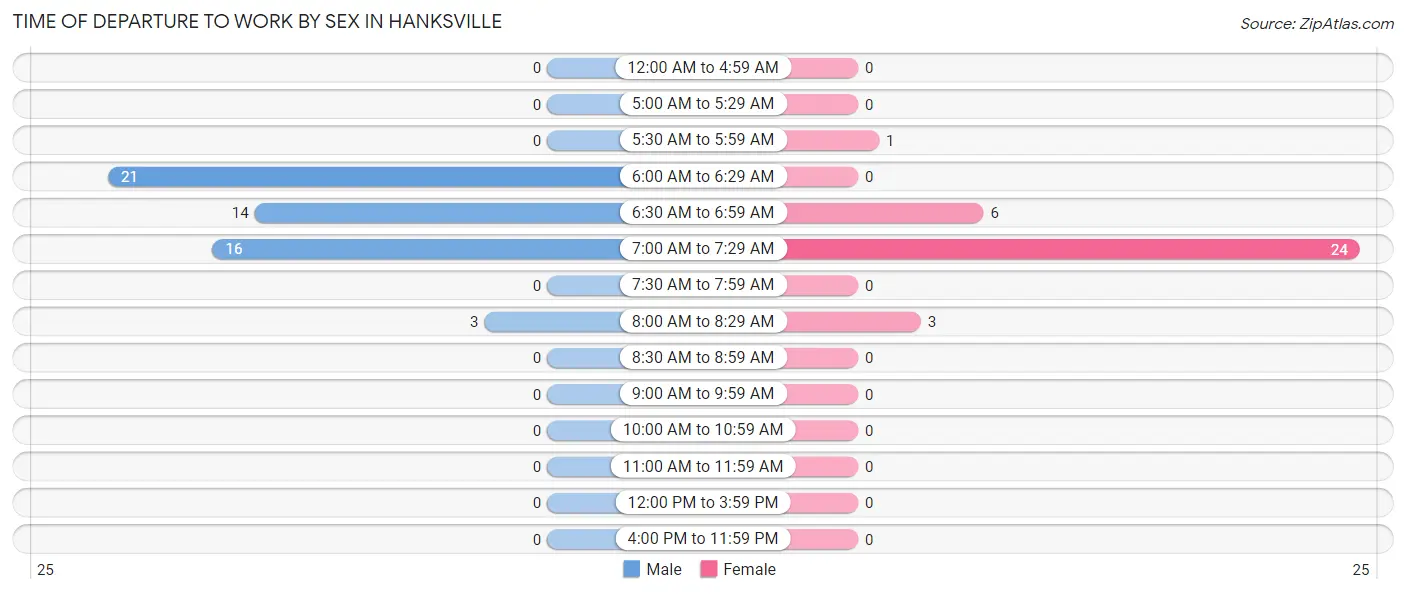
| Time of Departure | Male | Female |
| 12:00 AM to 4:59 AM | 0 (0.0%) | 0 (0.0%) |
| 5:00 AM to 5:29 AM | 0 (0.0%) | 0 (0.0%) |
| 5:30 AM to 5:59 AM | 0 (0.0%) | 1 (2.9%) |
| 6:00 AM to 6:29 AM | 21 (38.9%) | 0 (0.0%) |
| 6:30 AM to 6:59 AM | 14 (25.9%) | 6 (17.6%) |
| 7:00 AM to 7:29 AM | 16 (29.6%) | 24 (70.6%) |
| 7:30 AM to 7:59 AM | 0 (0.0%) | 0 (0.0%) |
| 8:00 AM to 8:29 AM | 3 (5.6%) | 3 (8.8%) |
| 8:30 AM to 8:59 AM | 0 (0.0%) | 0 (0.0%) |
| 9:00 AM to 9:59 AM | 0 (0.0%) | 0 (0.0%) |
| 10:00 AM to 10:59 AM | 0 (0.0%) | 0 (0.0%) |
| 11:00 AM to 11:59 AM | 0 (0.0%) | 0 (0.0%) |
| 12:00 PM to 3:59 PM | 0 (0.0%) | 0 (0.0%) |
| 4:00 PM to 11:59 PM | 0 (0.0%) | 0 (0.0%) |
| Total | 54 (100.0%) | 34 (100.0%) |
Housing Occupancy in Hanksville
Occupancy by Ownership in Hanksville
Of the total 92 dwellings in Hanksville, owner-occupied units account for 34 (37.0%), while renter-occupied units make up 58 (63.0%).
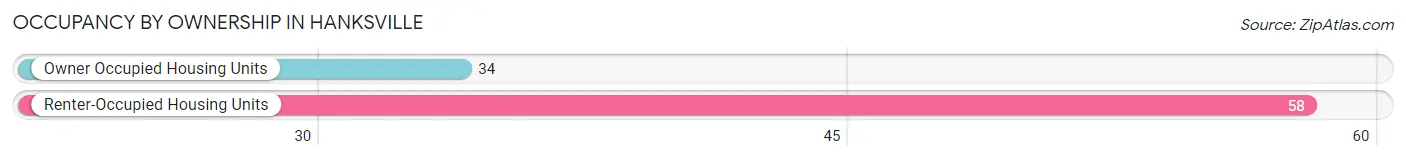
| Occupancy | # Housing Units | % Housing Units |
| Owner Occupied Housing Units | 34 | 37.0% |
| Renter-Occupied Housing Units | 58 | 63.0% |
| Total Occupied Housing Units | 92 | 100.0% |
Occupancy by Household Size in Hanksville
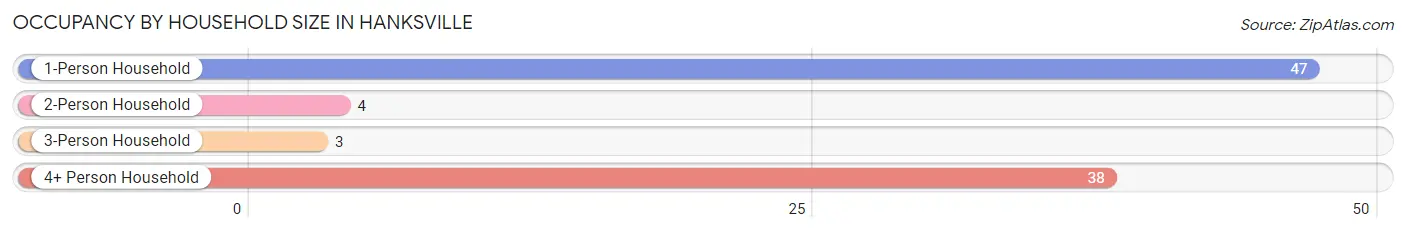
| Household Size | # Housing Units | % Housing Units |
| 1-Person Household | 47 | 51.1% |
| 2-Person Household | 4 | 4.3% |
| 3-Person Household | 3 | 3.3% |
| 4+ Person Household | 38 | 41.3% |
| Total Housing Units | 92 | 100.0% |
Occupancy by Ownership by Household Size in Hanksville
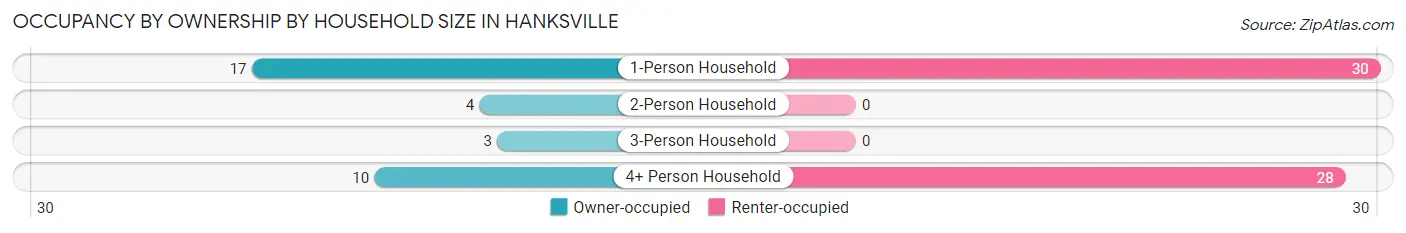
| Household Size | Owner-occupied | Renter-occupied |
| 1-Person Household | 17 (36.2%) | 30 (63.8%) |
| 2-Person Household | 4 (100.0%) | 0 (0.0%) |
| 3-Person Household | 3 (100.0%) | 0 (0.0%) |
| 4+ Person Household | 10 (26.3%) | 28 (73.7%) |
| Total Housing Units | 34 (37.0%) | 58 (63.0%) |
Occupancy by Educational Attainment in Hanksville
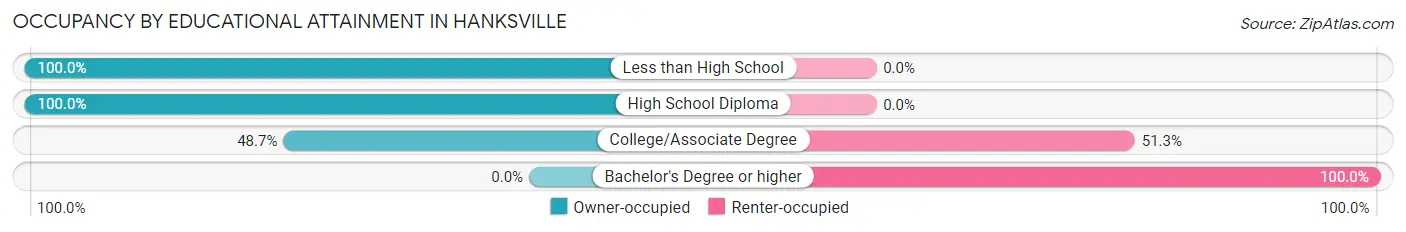
| Household Size | Owner-occupied | Renter-occupied |
| Less than High School | 3 (100.0%) | 0 (0.0%) |
| High School Diploma | 12 (100.0%) | 0 (0.0%) |
| College/Associate Degree | 19 (48.7%) | 20 (51.3%) |
| Bachelor's Degree or higher | 0 (0.0%) | 38 (100.0%) |
Occupancy by Age of Householder in Hanksville
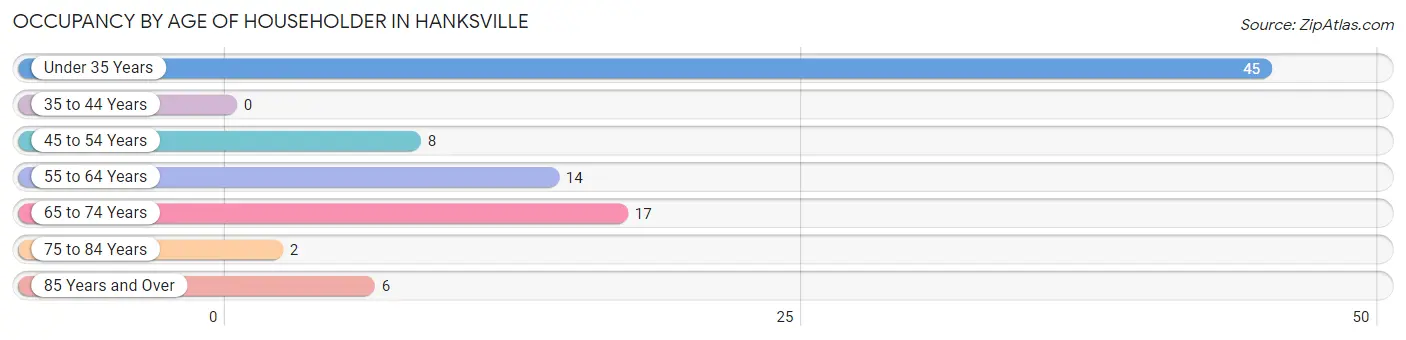
| Age Bracket | # Households | % Households |
| Under 35 Years | 45 | 48.9% |
| 35 to 44 Years | 0 | 0.0% |
| 45 to 54 Years | 8 | 8.7% |
| 55 to 64 Years | 14 | 15.2% |
| 65 to 74 Years | 17 | 18.5% |
| 75 to 84 Years | 2 | 2.2% |
| 85 Years and Over | 6 | 6.5% |
| Total | 92 | 100.0% |
Housing Finances in Hanksville
Median Income by Occupancy in Hanksville
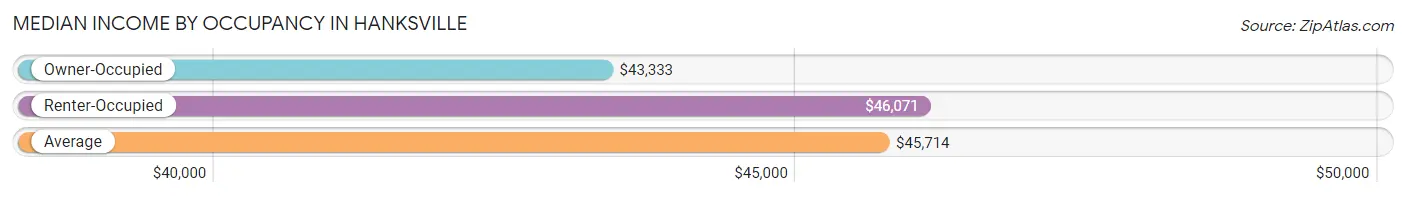
| Occupancy Type | # Households | Median Income |
| Owner-Occupied | 34 (37.0%) | $43,333 |
| Renter-Occupied | 58 (63.0%) | $46,071 |
| Average | 92 (100.0%) | $45,714 |
Occupancy by Householder Income Bracket in Hanksville
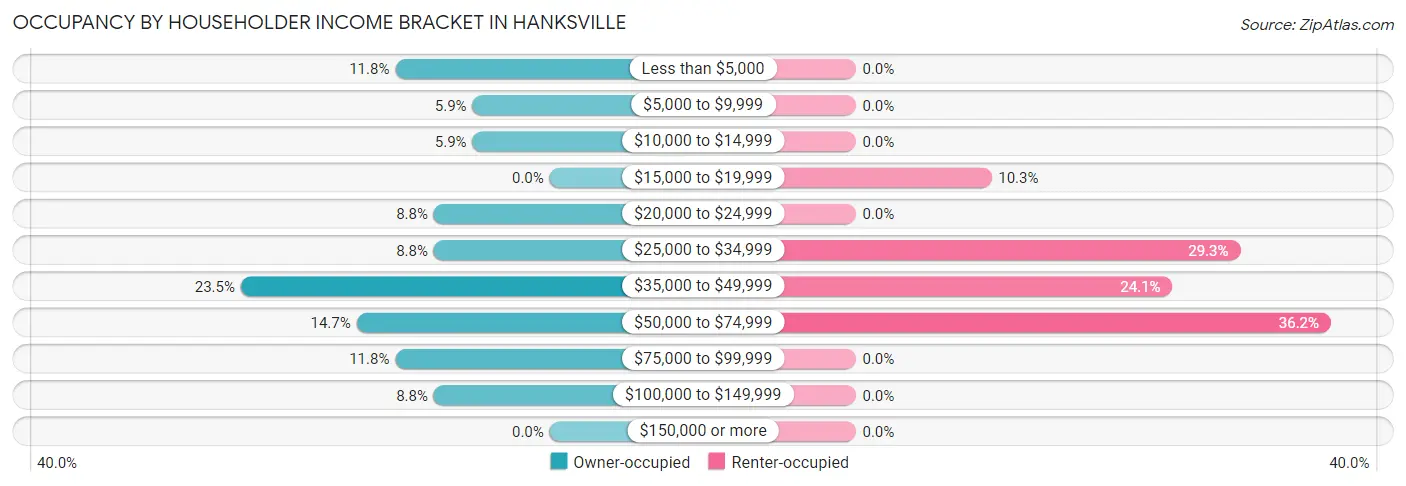
| Income Bracket | Owner-occupied | Renter-occupied |
| Less than $5,000 | 4 (11.8%) | 0 (0.0%) |
| $5,000 to $9,999 | 2 (5.9%) | 0 (0.0%) |
| $10,000 to $14,999 | 2 (5.9%) | 0 (0.0%) |
| $15,000 to $19,999 | 0 (0.0%) | 6 (10.3%) |
| $20,000 to $24,999 | 3 (8.8%) | 0 (0.0%) |
| $25,000 to $34,999 | 3 (8.8%) | 17 (29.3%) |
| $35,000 to $49,999 | 8 (23.5%) | 14 (24.1%) |
| $50,000 to $74,999 | 5 (14.7%) | 21 (36.2%) |
| $75,000 to $99,999 | 4 (11.8%) | 0 (0.0%) |
| $100,000 to $149,999 | 3 (8.8%) | 0 (0.0%) |
| $150,000 or more | 0 (0.0%) | 0 (0.0%) |
| Total | 34 (100.0%) | 58 (100.0%) |
Monthly Housing Cost Tiers in Hanksville
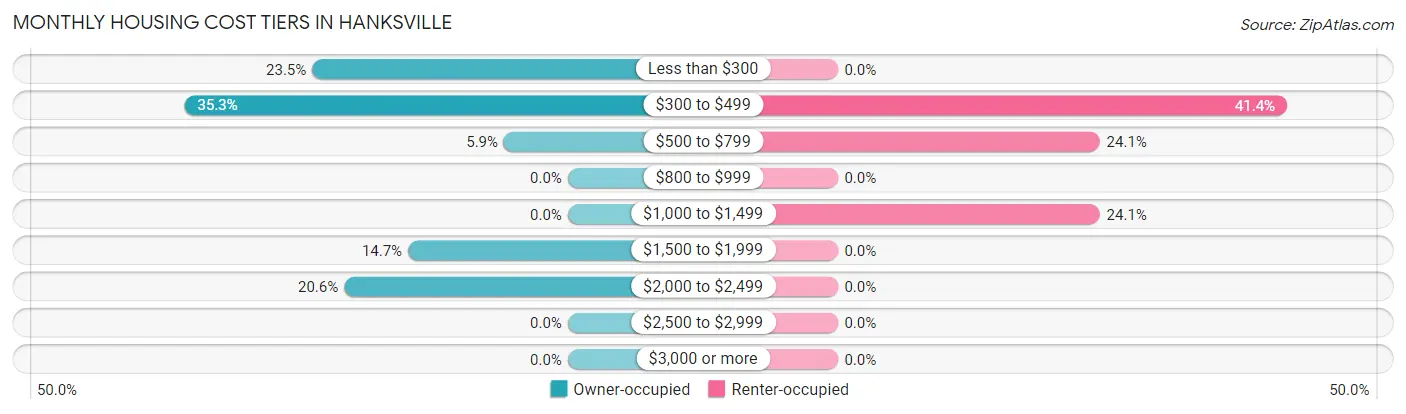
| Monthly Cost | Owner-occupied | Renter-occupied |
| Less than $300 | 8 (23.5%) | 0 (0.0%) |
| $300 to $499 | 12 (35.3%) | 24 (41.4%) |
| $500 to $799 | 2 (5.9%) | 14 (24.1%) |
| $800 to $999 | 0 (0.0%) | 0 (0.0%) |
| $1,000 to $1,499 | 0 (0.0%) | 14 (24.1%) |
| $1,500 to $1,999 | 5 (14.7%) | 0 (0.0%) |
| $2,000 to $2,499 | 7 (20.6%) | 0 (0.0%) |
| $2,500 to $2,999 | 0 (0.0%) | 0 (0.0%) |
| $3,000 or more | 0 (0.0%) | 0 (0.0%) |
| Total | 34 (100.0%) | 58 (100.0%) |
Physical Housing Characteristics in Hanksville
Housing Structures in Hanksville
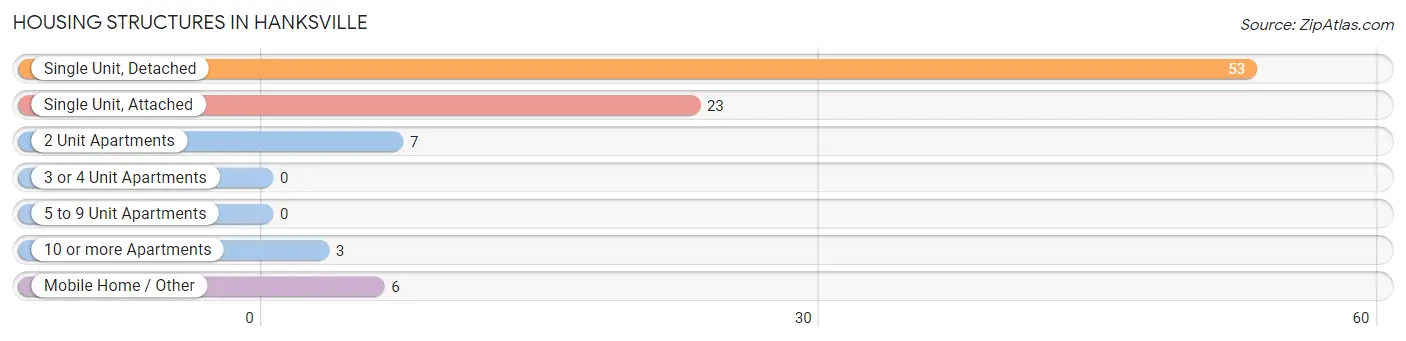
| Structure Type | # Housing Units | % Housing Units |
| Single Unit, Detached | 53 | 57.6% |
| Single Unit, Attached | 23 | 25.0% |
| 2 Unit Apartments | 7 | 7.6% |
| 3 or 4 Unit Apartments | 0 | 0.0% |
| 5 to 9 Unit Apartments | 0 | 0.0% |
| 10 or more Apartments | 3 | 3.3% |
| Mobile Home / Other | 6 | 6.5% |
| Total | 92 | 100.0% |
Housing Structures by Occupancy in Hanksville
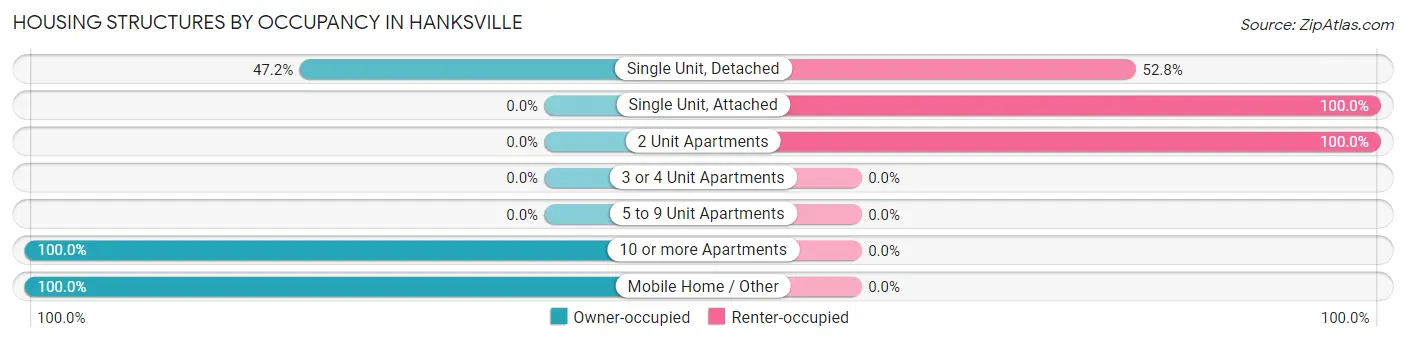
| Structure Type | Owner-occupied | Renter-occupied |
| Single Unit, Detached | 25 (47.2%) | 28 (52.8%) |
| Single Unit, Attached | 0 (0.0%) | 23 (100.0%) |
| 2 Unit Apartments | 0 (0.0%) | 7 (100.0%) |
| 3 or 4 Unit Apartments | 0 (0.0%) | 0 (0.0%) |
| 5 to 9 Unit Apartments | 0 (0.0%) | 0 (0.0%) |
| 10 or more Apartments | 3 (100.0%) | 0 (0.0%) |
| Mobile Home / Other | 6 (100.0%) | 0 (0.0%) |
| Total | 34 (37.0%) | 58 (63.0%) |
Housing Structures by Number of Rooms in Hanksville
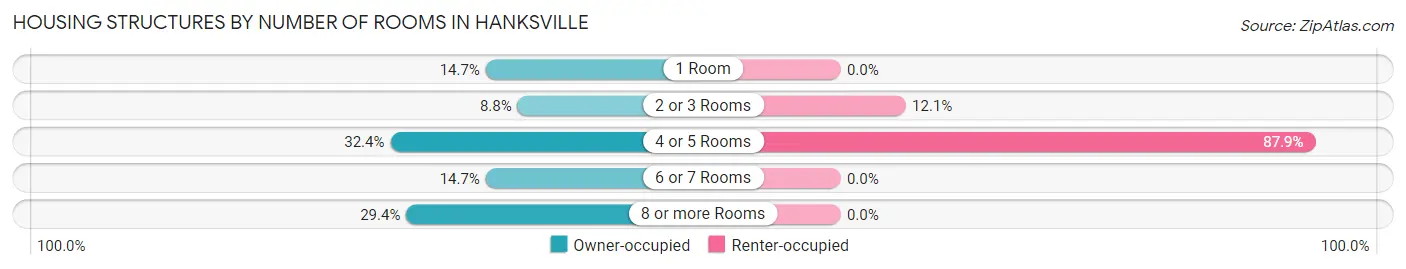
| Number of Rooms | Owner-occupied | Renter-occupied |
| 1 Room | 5 (14.7%) | 0 (0.0%) |
| 2 or 3 Rooms | 3 (8.8%) | 7 (12.1%) |
| 4 or 5 Rooms | 11 (32.4%) | 51 (87.9%) |
| 6 or 7 Rooms | 5 (14.7%) | 0 (0.0%) |
| 8 or more Rooms | 10 (29.4%) | 0 (0.0%) |
| Total | 34 (100.0%) | 58 (100.0%) |
Housing Structure by Heating Type in Hanksville
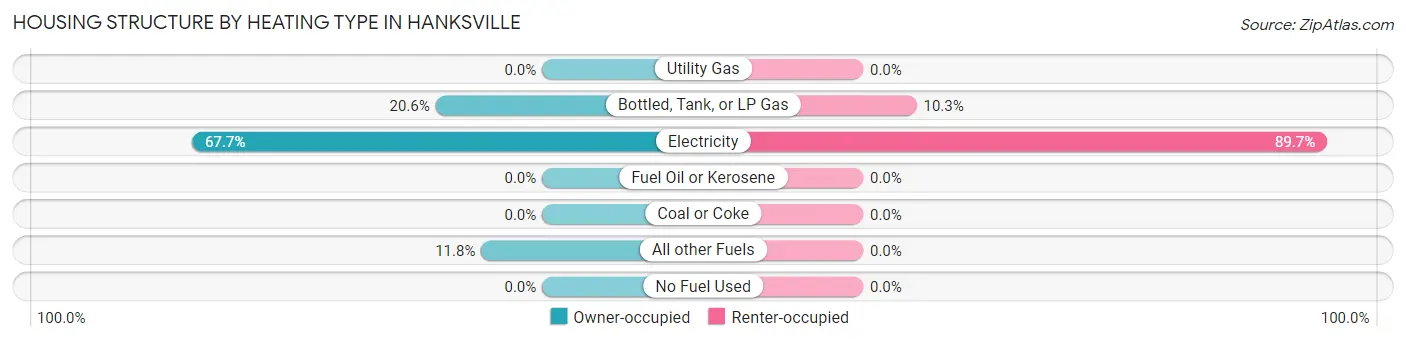
| Heating Type | Owner-occupied | Renter-occupied |
| Utility Gas | 0 (0.0%) | 0 (0.0%) |
| Bottled, Tank, or LP Gas | 7 (20.6%) | 6 (10.3%) |
| Electricity | 23 (67.6%) | 52 (89.7%) |
| Fuel Oil or Kerosene | 0 (0.0%) | 0 (0.0%) |
| Coal or Coke | 0 (0.0%) | 0 (0.0%) |
| All other Fuels | 4 (11.8%) | 0 (0.0%) |
| No Fuel Used | 0 (0.0%) | 0 (0.0%) |
| Total | 34 (100.0%) | 58 (100.0%) |
Household Vehicle Usage in Hanksville
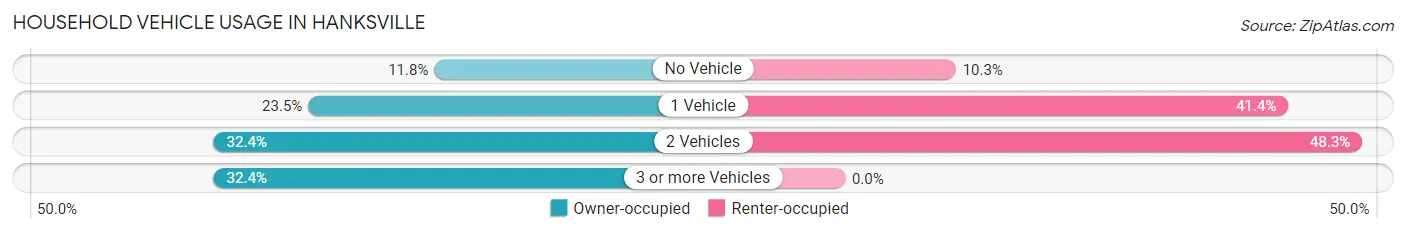
| Vehicles per Household | Owner-occupied | Renter-occupied |
| No Vehicle | 4 (11.8%) | 6 (10.3%) |
| 1 Vehicle | 8 (23.5%) | 24 (41.4%) |
| 2 Vehicles | 11 (32.4%) | 28 (48.3%) |
| 3 or more Vehicles | 11 (32.4%) | 0 (0.0%) |
| Total | 34 (100.0%) | 58 (100.0%) |
Real Estate & Mortgages in Hanksville
Real Estate and Mortgage Overview in Hanksville
| Characteristic | Without Mortgage | With Mortgage |
| Housing Units | 21 | 13 |
| Median Property Value | $103,100 | $412,500 |
| Median Household Income | $22,083 | $0 |
| Monthly Housing Costs | $359 | $0 |
| Real Estate Taxes | $573 | $0 |
Property Value by Mortgage Status in Hanksville
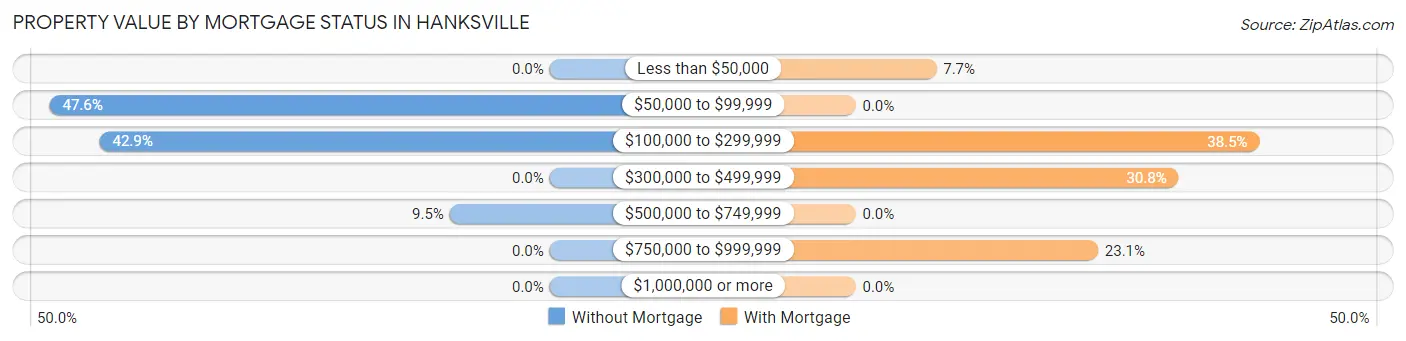
| Property Value | Without Mortgage | With Mortgage |
| Less than $50,000 | 0 (0.0%) | 1 (7.7%) |
| $50,000 to $99,999 | 10 (47.6%) | 0 (0.0%) |
| $100,000 to $299,999 | 9 (42.9%) | 5 (38.5%) |
| $300,000 to $499,999 | 0 (0.0%) | 4 (30.8%) |
| $500,000 to $749,999 | 2 (9.5%) | 0 (0.0%) |
| $750,000 to $999,999 | 0 (0.0%) | 3 (23.1%) |
| $1,000,000 or more | 0 (0.0%) | 0 (0.0%) |
| Total | 21 (100.0%) | 13 (100.0%) |
Household Income by Mortgage Status in Hanksville
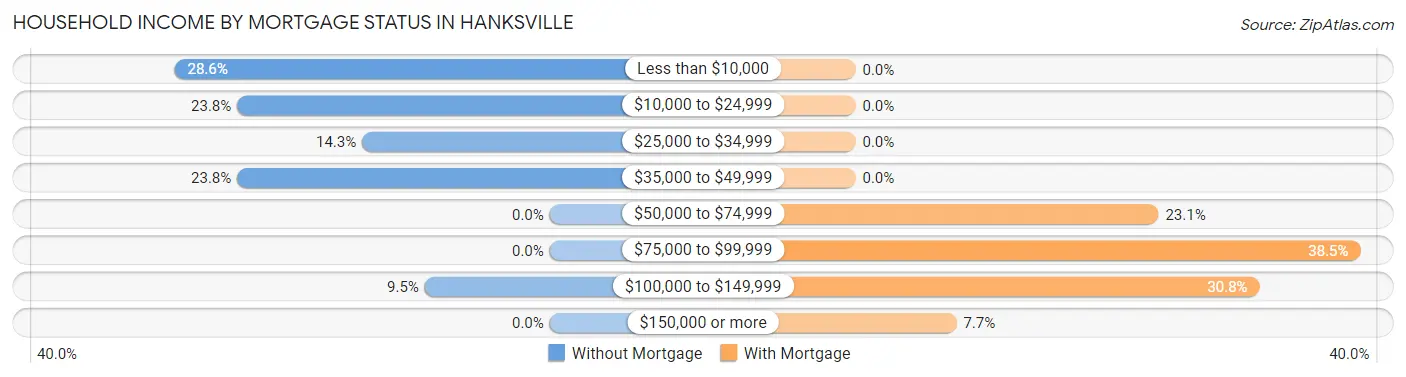
| Household Income | Without Mortgage | With Mortgage |
| Less than $10,000 | 6 (28.6%) | 0 (0.0%) |
| $10,000 to $24,999 | 5 (23.8%) | 0 (0.0%) |
| $25,000 to $34,999 | 3 (14.3%) | 0 (0.0%) |
| $35,000 to $49,999 | 5 (23.8%) | 0 (0.0%) |
| $50,000 to $74,999 | 0 (0.0%) | 3 (23.1%) |
| $75,000 to $99,999 | 0 (0.0%) | 5 (38.5%) |
| $100,000 to $149,999 | 2 (9.5%) | 4 (30.8%) |
| $150,000 or more | 0 (0.0%) | 1 (7.7%) |
| Total | 21 (100.0%) | 13 (100.0%) |
Property Value to Household Income Ratio in Hanksville
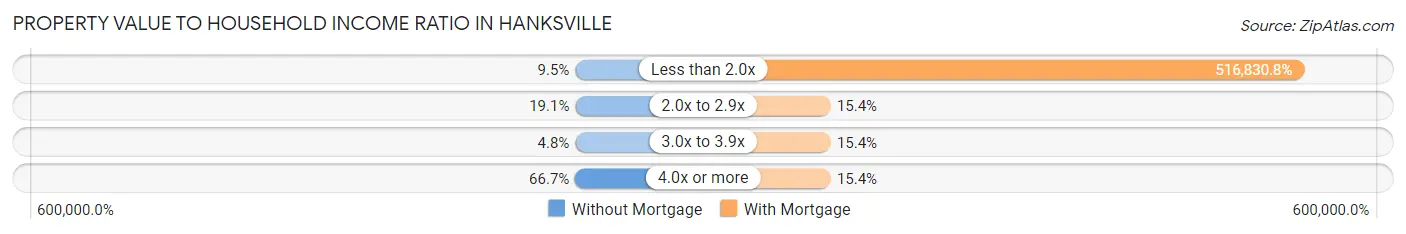
| Value-to-Income Ratio | Without Mortgage | With Mortgage |
| Less than 2.0x | 2 (9.5%) | 67,188 (516,830.8%) |
| 2.0x to 2.9x | 4 (19.1%) | 2 (15.4%) |
| 3.0x to 3.9x | 1 (4.8%) | 2 (15.4%) |
| 4.0x or more | 14 (66.7%) | 2 (15.4%) |
| Total | 21 (100.0%) | 13 (100.0%) |
Real Estate Taxes by Mortgage Status in Hanksville
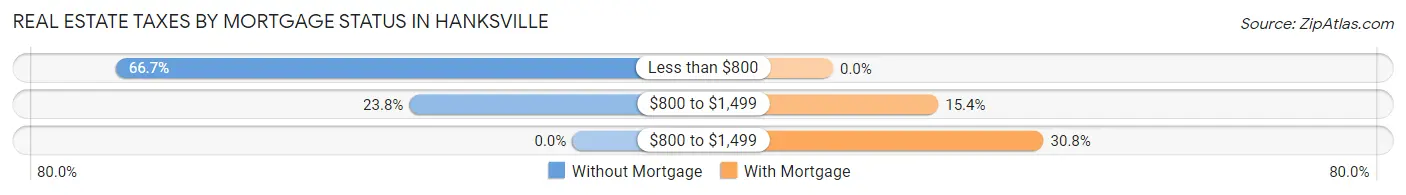
| Property Taxes | Without Mortgage | With Mortgage |
| Less than $800 | 14 (66.7%) | 0 (0.0%) |
| $800 to $1,499 | 5 (23.8%) | 2 (15.4%) |
| $800 to $1,499 | 0 (0.0%) | 4 (30.8%) |
| Total | 21 (100.0%) | 13 (100.0%) |
Health & Disability in Hanksville
Health Insurance Coverage by Age in Hanksville
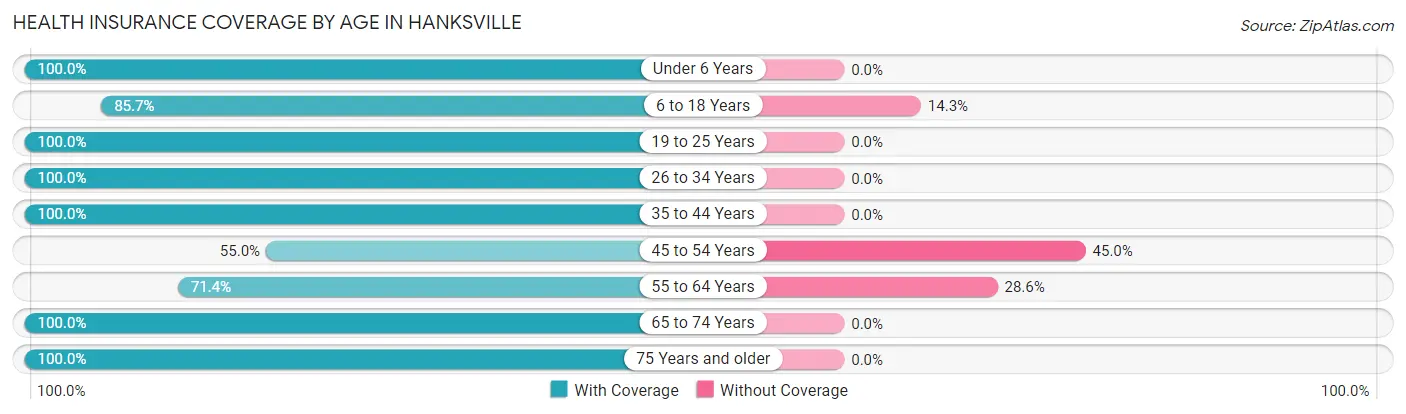
| Age Bracket | With Coverage | Without Coverage |
| Under 6 Years | 30 (100.0%) | 0 (0.0%) |
| 6 to 18 Years | 36 (85.7%) | 6 (14.3%) |
| 19 to 25 Years | 33 (100.0%) | 0 (0.0%) |
| 26 to 34 Years | 36 (100.0%) | 0 (0.0%) |
| 35 to 44 Years | 1 (100.0%) | 0 (0.0%) |
| 45 to 54 Years | 11 (55.0%) | 9 (45.0%) |
| 55 to 64 Years | 15 (71.4%) | 6 (28.6%) |
| 65 to 74 Years | 25 (100.0%) | 0 (0.0%) |
| 75 Years and older | 9 (100.0%) | 0 (0.0%) |
| Total | 196 (90.3%) | 21 (9.7%) |
Health Insurance Coverage by Citizenship Status in Hanksville
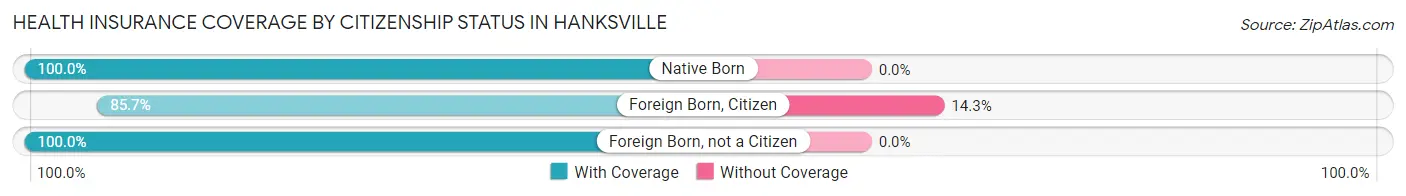
| Citizenship Status | With Coverage | Without Coverage |
| Native Born | 30 (100.0%) | 0 (0.0%) |
| Foreign Born, Citizen | 36 (85.7%) | 6 (14.3%) |
| Foreign Born, not a Citizen | 33 (100.0%) | 0 (0.0%) |
Health Insurance Coverage by Household Income in Hanksville
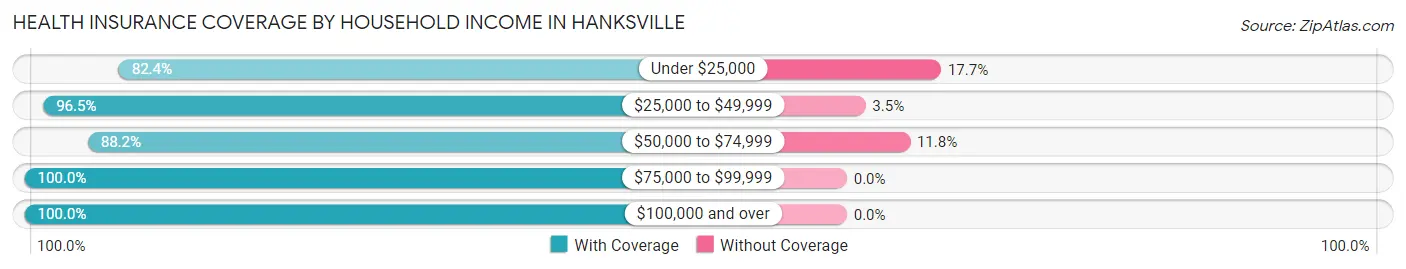
| Household Income | With Coverage | Without Coverage |
| Under $25,000 | 14 (82.4%) | 3 (17.6%) |
| $25,000 to $49,999 | 83 (96.5%) | 3 (3.5%) |
| $50,000 to $74,999 | 67 (88.2%) | 9 (11.8%) |
| $75,000 to $99,999 | 23 (100.0%) | 0 (0.0%) |
| $100,000 and over | 9 (100.0%) | 0 (0.0%) |
Public vs Private Health Insurance Coverage by Age in Hanksville
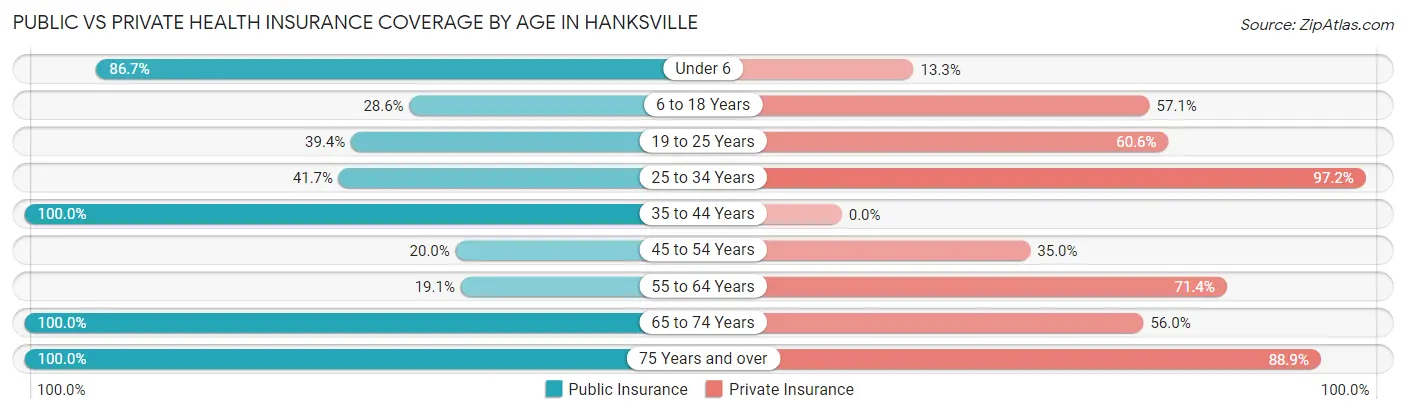
| Age Bracket | Public Insurance | Private Insurance |
| Under 6 | 26 (86.7%) | 4 (13.3%) |
| 6 to 18 Years | 12 (28.6%) | 24 (57.1%) |
| 19 to 25 Years | 13 (39.4%) | 20 (60.6%) |
| 25 to 34 Years | 15 (41.7%) | 35 (97.2%) |
| 35 to 44 Years | 1 (100.0%) | 0 (0.0%) |
| 45 to 54 Years | 4 (20.0%) | 7 (35.0%) |
| 55 to 64 Years | 4 (19.1%) | 15 (71.4%) |
| 65 to 74 Years | 25 (100.0%) | 14 (56.0%) |
| 75 Years and over | 9 (100.0%) | 8 (88.9%) |
| Total | 109 (50.2%) | 127 (58.5%) |
Disability Status by Sex by Age in Hanksville
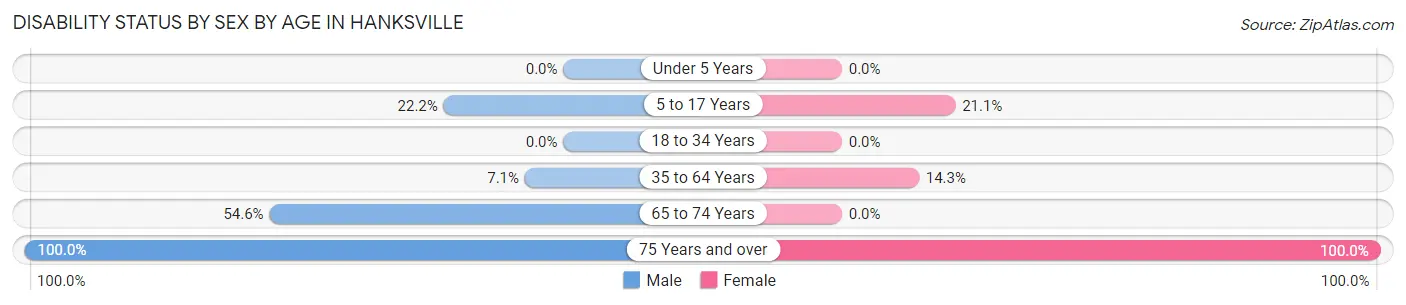
| Age Bracket | Male | Female |
| Under 5 Years | 0 (0.0%) | 0 (0.0%) |
| 5 to 17 Years | 4 (22.2%) | 4 (21.0%) |
| 18 to 34 Years | 0 (0.0%) | 0 (0.0%) |
| 35 to 64 Years | 2 (7.1%) | 2 (14.3%) |
| 65 to 74 Years | 6 (54.5%) | 0 (0.0%) |
| 75 Years and over | 2 (100.0%) | 7 (100.0%) |
Disability Class by Sex by Age in Hanksville
Disability Class: Hearing Difficulty
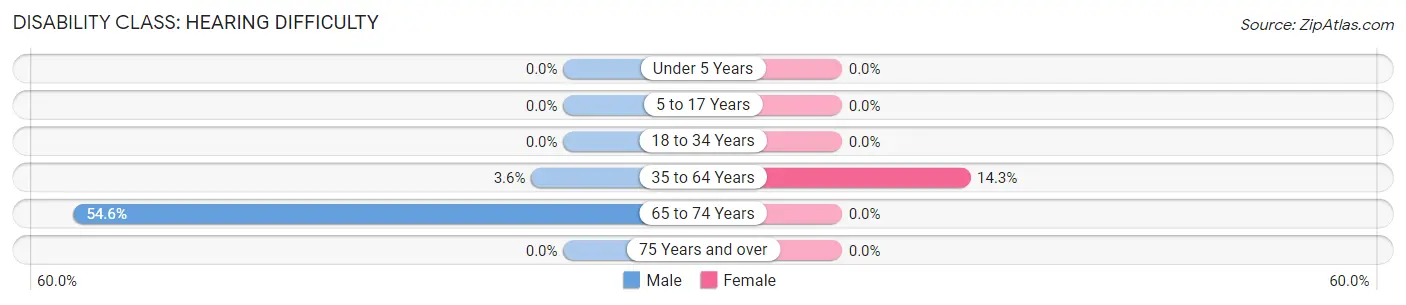
| Age Bracket | Male | Female |
| Under 5 Years | 0 (0.0%) | 0 (0.0%) |
| 5 to 17 Years | 0 (0.0%) | 0 (0.0%) |
| 18 to 34 Years | 0 (0.0%) | 0 (0.0%) |
| 35 to 64 Years | 1 (3.6%) | 2 (14.3%) |
| 65 to 74 Years | 6 (54.5%) | 0 (0.0%) |
| 75 Years and over | 0 (0.0%) | 0 (0.0%) |
Disability Class: Vision Difficulty
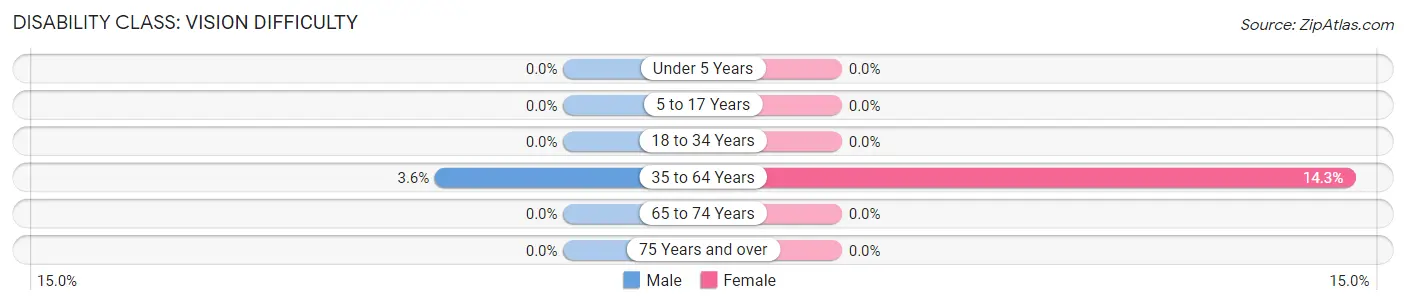
| Age Bracket | Male | Female |
| Under 5 Years | 0 (0.0%) | 0 (0.0%) |
| 5 to 17 Years | 0 (0.0%) | 0 (0.0%) |
| 18 to 34 Years | 0 (0.0%) | 0 (0.0%) |
| 35 to 64 Years | 1 (3.6%) | 2 (14.3%) |
| 65 to 74 Years | 0 (0.0%) | 0 (0.0%) |
| 75 Years and over | 0 (0.0%) | 0 (0.0%) |
Disability Class: Cognitive Difficulty
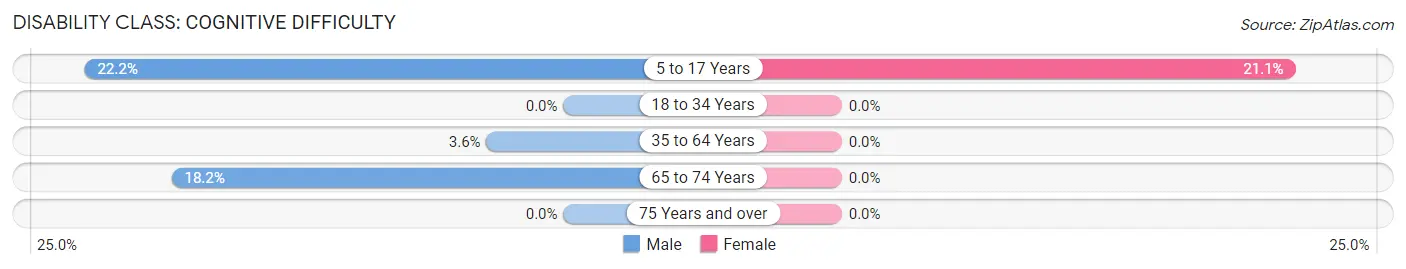
| Age Bracket | Male | Female |
| 5 to 17 Years | 4 (22.2%) | 4 (21.0%) |
| 18 to 34 Years | 0 (0.0%) | 0 (0.0%) |
| 35 to 64 Years | 1 (3.6%) | 0 (0.0%) |
| 65 to 74 Years | 2 (18.2%) | 0 (0.0%) |
| 75 Years and over | 0 (0.0%) | 0 (0.0%) |
Disability Class: Ambulatory Difficulty
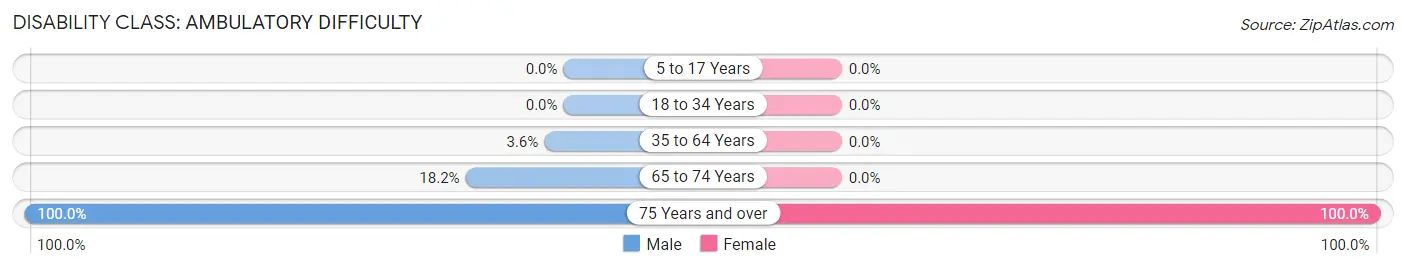
| Age Bracket | Male | Female |
| 5 to 17 Years | 0 (0.0%) | 0 (0.0%) |
| 18 to 34 Years | 0 (0.0%) | 0 (0.0%) |
| 35 to 64 Years | 1 (3.6%) | 0 (0.0%) |
| 65 to 74 Years | 2 (18.2%) | 0 (0.0%) |
| 75 Years and over | 2 (100.0%) | 7 (100.0%) |
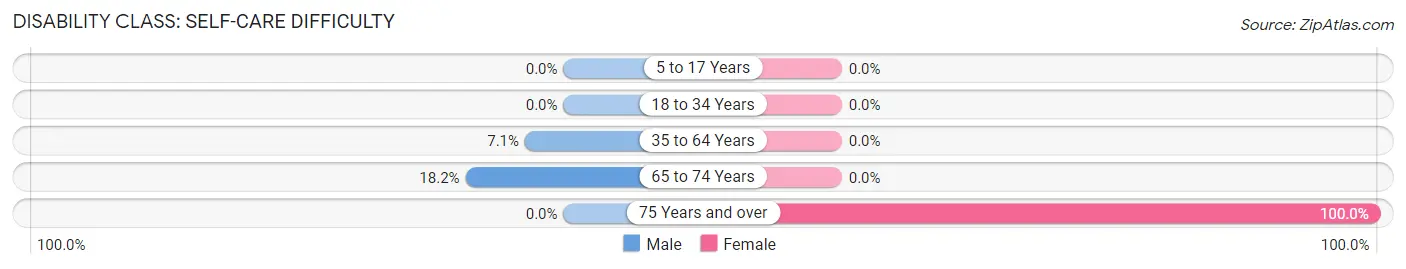
Disability Class: Self-Care Difficulty
| Age Bracket | Male | Female |
| 5 to 17 Years | 0 (0.0%) | 0 (0.0%) |
| 18 to 34 Years | 0 (0.0%) | 0 (0.0%) |
| 35 to 64 Years | 2 (7.1%) | 0 (0.0%) |
| 65 to 74 Years | 2 (18.2%) | 0 (0.0%) |
| 75 Years and over | 0 (0.0%) | 7 (100.0%) |
Technology Access in Hanksville
Computing Device Access in Hanksville
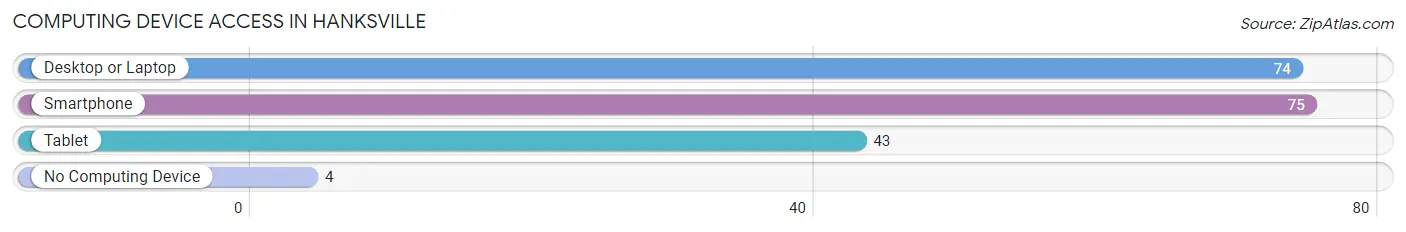
| Device Type | # Households | % Households |
| Desktop or Laptop | 74 | 80.4% |
| Smartphone | 75 | 81.5% |
| Tablet | 43 | 46.7% |
| No Computing Device | 4 | 4.3% |
| Total | 92 | 100.0% |
Internet Access in Hanksville
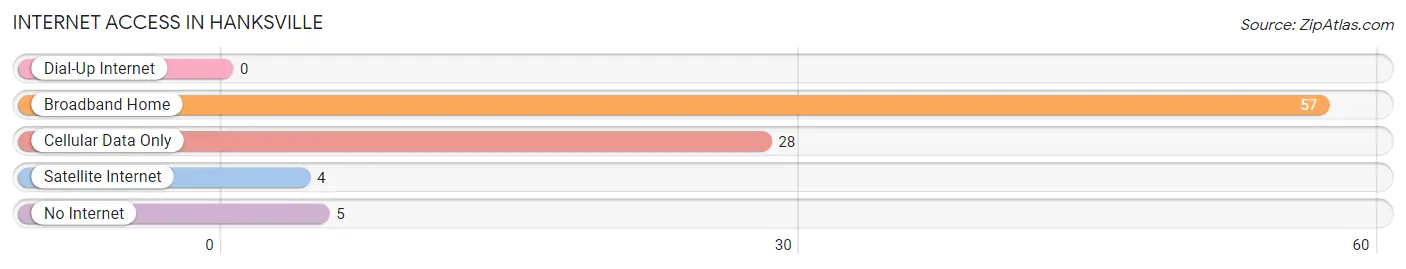
| Internet Type | # Households | % Households |
| Dial-Up Internet | 0 | 0.0% |
| Broadband Home | 57 | 62.0% |
| Cellular Data Only | 28 | 30.4% |
| Satellite Internet | 4 | 4.3% |
| No Internet | 5 | 5.4% |
| Total | 92 | 100.0% |
Hanksville Summary
Hanksville is a small town located in Wayne County, Utah, United States. It is situated in the south-central part of the state, approximately 150 miles south of Salt Lake City. The town is located in a remote area of the state, surrounded by the San Rafael Swell, a large geological formation that is part of the Colorado Plateau. The population of Hanksville was estimated to be around 200 people in 2020.
History
Hanksville was founded in 1883 by William Hanks, a Mormon pioneer who had been sent to the area to establish a settlement. The town was named after him and was initially a farming community. In the early 1900s, the town began to grow as a trading post for the surrounding area. The town was also a stop on the Denver and Rio Grande Western Railroad.
In the 1950s, the town began to decline as the railroad stopped running and the population began to dwindle. In the 1970s, the town was revitalized when the nearby Hite Marina was built, bringing in tourists and providing jobs for the locals.
Geography
Hanksville is located in the south-central part of Utah, approximately 150 miles south of Salt Lake City. The town is situated in a remote area of the state, surrounded by the San Rafael Swell, a large geological formation that is part of the Colorado Plateau. The town is located at an elevation of 5,000 feet and has a semi-arid climate with hot summers and cold winters.
Economy
The economy of Hanksville is largely based on tourism. The nearby Hite Marina is a popular destination for boaters, fishermen, and other outdoor enthusiasts. The town also has a few restaurants, a gas station, and a few other small businesses.
Demographics
As of the 2020 census, the population of Hanksville was estimated to be around 200 people. The town is predominantly white, with a small Hispanic population. The median household income is around $30,000, and the median age is around 40 years old. The town has a low unemployment rate and a high rate of homeownership.
Common Questions
What is Per Capita Income in Hanksville?
Per Capita income in Hanksville is $19,168.
What is the Median Family Income in Hanksville?
Median Family Income in Hanksville is $45,625.
What is the Median Household income in Hanksville?
Median Household Income in Hanksville is $45,714.
What is Income or Wage Gap in Hanksville?
Income or Wage Gap in Hanksville is 6.9%.
Women in Hanksville earn 93.1 cents for every dollar earned by a man.
What is Inequality or Gini Index in Hanksville?
Inequality or Gini Index in Hanksville is 0.31.
What is the Total Population of Hanksville?
Total Population of Hanksville is 217.
What is the Total Male Population of Hanksville?
Total Male Population of Hanksville is 115.
What is the Total Female Population of Hanksville?
Total Female Population of Hanksville is 102.
What is the Ratio of Males per 100 Females in Hanksville?
There are 112.75 Males per 100 Females in Hanksville.
What is the Ratio of Females per 100 Males in Hanksville?
There are 88.70 Females per 100 Males in Hanksville.
What is the Median Population Age in Hanksville?
Median Population Age in Hanksville is 27.5 Years.
What is the Average Family Size in Hanksville
Average Family Size in Hanksville is 3.5 People.
What is the Average Household Size in Hanksville
Average Household Size in Hanksville is 2.3 People.
How Large is the Labor Force in Hanksville?
There are 95 People in the Labor Forcein in Hanksville.
What is the Percentage of People in the Labor Force in Hanksville?
59.0% of People are in the Labor Force in Hanksville.