Chelsea, SD Map & Demographics
Chelsea Map
Chelsea Overview
$62,509
PER CAPITA INCOME
$151,042
AVG FAMILY INCOME
$150,625
AVG HOUSEHOLD INCOME
66.7%
WAGE / INCOME GAP [ % ]
33.3¢/ $1
WAGE / INCOME GAP [ $ ]
0.43
INEQUALITY / GINI INDEX
56
TOTAL POPULATION
42
MALE POPULATION
14
FEMALE POPULATION
300.00
MALES / 100 FEMALES
33.33
FEMALES / 100 MALES
36.5
MEDIAN AGE
4.2
AVG FAMILY SIZE
3.7
AVG HOUSEHOLD SIZE
37
LABOR FORCE [ PEOPLE ]
66.1%
PERCENT IN LABOR FORCE
Chelsea Area Codes
Income in Chelsea
Income Overview in Chelsea
Per Capita Income in Chelsea is $62,509, while median incomes of families and households are $151,042 and $150,625 respectively.
| Characteristic | Number | Measure |
| Per Capita Income | 56 | $62,509 |
| Median Family Income | 13 | $151,042 |
| Mean Family Income | 13 | $210,892 |
| Median Household Income | 15 | $150,625 |
| Mean Household Income | 15 | $186,507 |
| Income Deficit | 13 | $0 |
| Wage / Income Gap (%) | 56 | 66.71% |
| Wage / Income Gap ($) | 56 | 33.29¢ per $1 |
| Gini / Inequality Index | 56 | 0.43 |
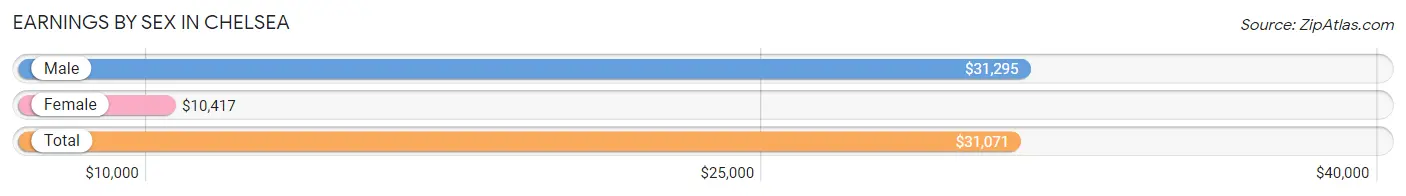
Earnings by Sex in Chelsea
Average Earnings in Chelsea are $31,071, $31,295 for men and $10,417 for women, a difference of 66.7%.
| Sex | Number | Average Earnings |
| Male | 33 (82.5%) | $31,295 |
| Female | 7 (17.5%) | $10,417 |
| Total | 40 (100.0%) | $31,071 |
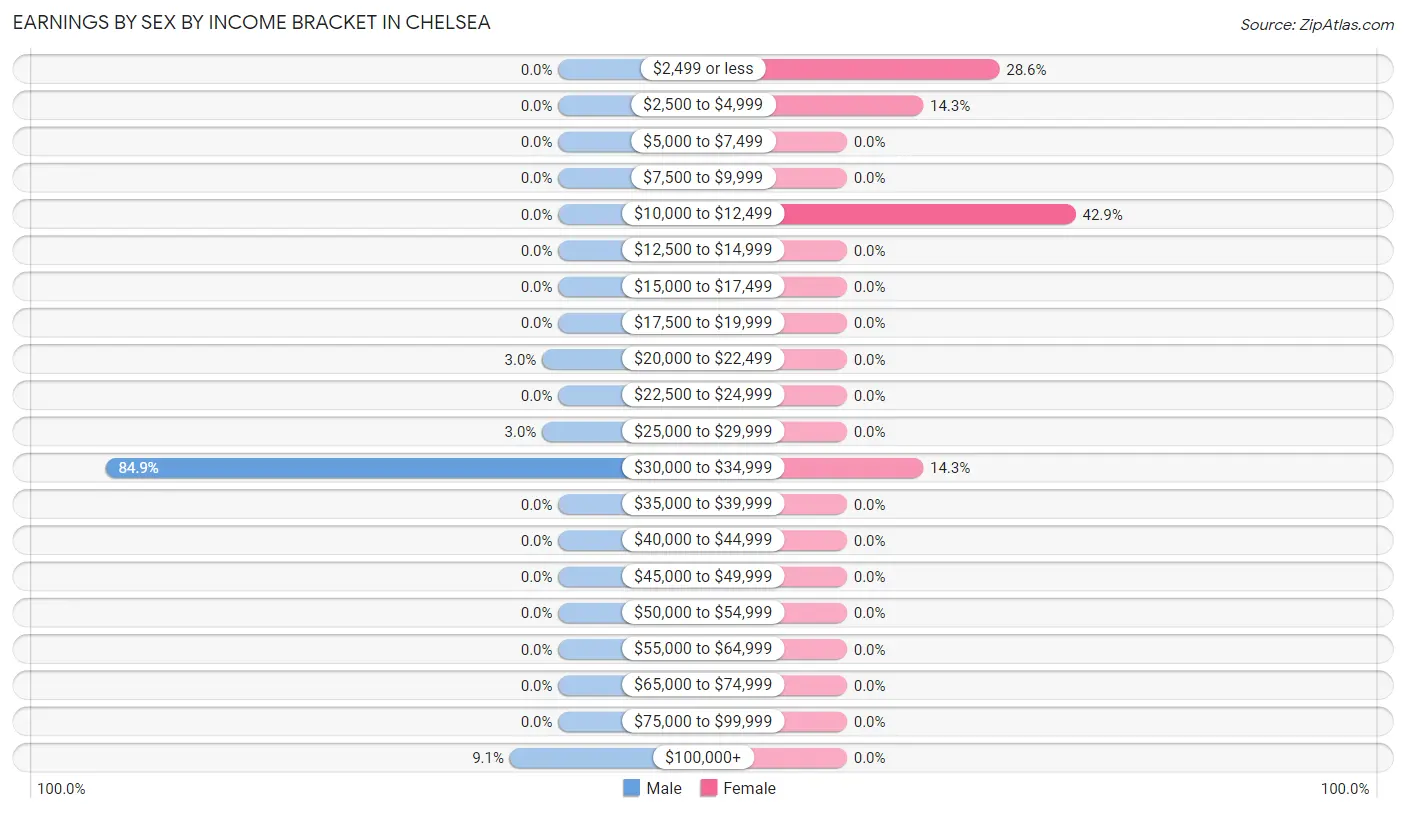
Earnings by Sex by Income Bracket in Chelsea
The most common earnings brackets in Chelsea are $30,000 to $34,999 for men (28 | 84.9%) and $10,000 to $12,499 for women (3 | 42.9%).
| Income | Male | Female |
| $2,499 or less | 0 (0.0%) | 2 (28.6%) |
| $2,500 to $4,999 | 0 (0.0%) | 1 (14.3%) |
| $5,000 to $7,499 | 0 (0.0%) | 0 (0.0%) |
| $7,500 to $9,999 | 0 (0.0%) | 0 (0.0%) |
| $10,000 to $12,499 | 0 (0.0%) | 3 (42.9%) |
| $12,500 to $14,999 | 0 (0.0%) | 0 (0.0%) |
| $15,000 to $17,499 | 0 (0.0%) | 0 (0.0%) |
| $17,500 to $19,999 | 0 (0.0%) | 0 (0.0%) |
| $20,000 to $22,499 | 1 (3.0%) | 0 (0.0%) |
| $22,500 to $24,999 | 0 (0.0%) | 0 (0.0%) |
| $25,000 to $29,999 | 1 (3.0%) | 0 (0.0%) |
| $30,000 to $34,999 | 28 (84.9%) | 1 (14.3%) |
| $35,000 to $39,999 | 0 (0.0%) | 0 (0.0%) |
| $40,000 to $44,999 | 0 (0.0%) | 0 (0.0%) |
| $45,000 to $49,999 | 0 (0.0%) | 0 (0.0%) |
| $50,000 to $54,999 | 0 (0.0%) | 0 (0.0%) |
| $55,000 to $64,999 | 0 (0.0%) | 0 (0.0%) |
| $65,000 to $74,999 | 0 (0.0%) | 0 (0.0%) |
| $75,000 to $99,999 | 0 (0.0%) | 0 (0.0%) |
| $100,000+ | 3 (9.1%) | 0 (0.0%) |
| Total | 33 (100.0%) | 7 (100.0%) |
Earnings by Sex by Educational Attainment in Chelsea
| Educational Attainment | Male Income | Female Income |
| Less than High School | - | - |
| High School Diploma | - | - |
| College or Associate's Degree | - | - |
| Bachelor's Degree | - | - |
| Graduate Degree | - | - |
| Total | $250,001 | $10,417 |
Family Income in Chelsea
Family Income Brackets in Chelsea
According to the Chelsea family income data, there are 6 families falling into the $150,000 to $199,999 income range, which is the most common income bracket and makes up 46.2% of all families.
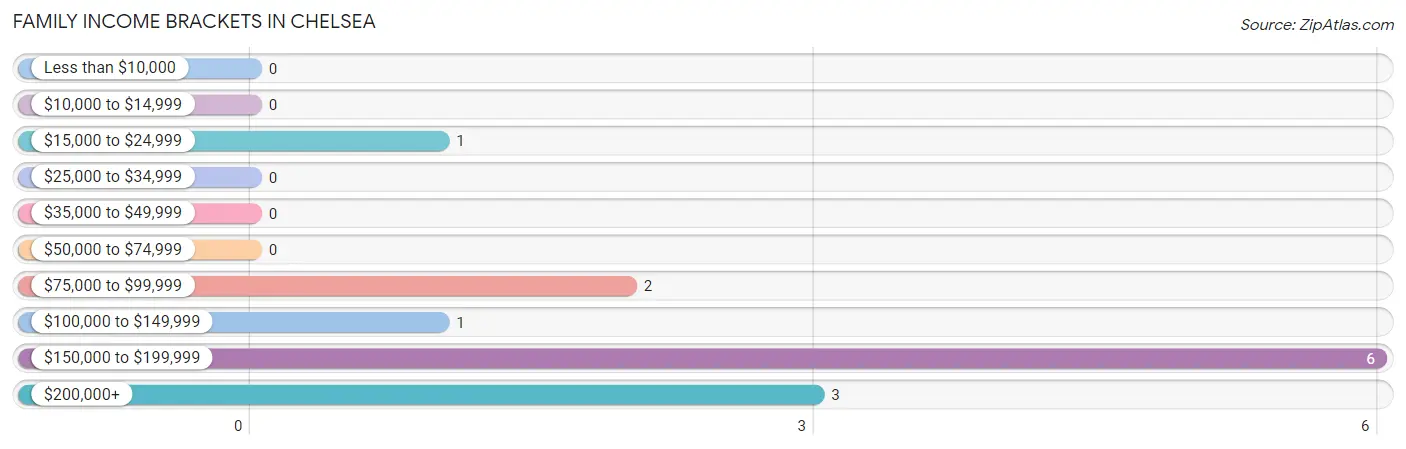
| Income Bracket | # Families | % Families |
| Less than $10,000 | 0 | 0.0% |
| $10,000 to $14,999 | 0 | 0.0% |
| $15,000 to $24,999 | 1 | 7.7% |
| $25,000 to $34,999 | 0 | 0.0% |
| $35,000 to $49,999 | 0 | 0.0% |
| $50,000 to $74,999 | 0 | 0.0% |
| $75,000 to $99,999 | 2 | 15.4% |
| $100,000 to $149,999 | 1 | 7.7% |
| $150,000 to $199,999 | 6 | 46.2% |
| $200,000+ | 3 | 23.1% |
Family Income by Famaliy Size in Chelsea
| Income Bracket | # Families | Median Income |
| 2-Person Families | 7 (53.8%) | $0 |
| 3-Person Families | 6 (46.2%) | $0 |
| 4-Person Families | 0 (0.0%) | $0 |
| 5-Person Families | 0 (0.0%) | $0 |
| 6-Person Families | 0 (0.0%) | $0 |
| 7+ Person Families | 0 (0.0%) | $0 |
| Total | 13 (100.0%) | $151,042 |
Family Income by Number of Earners in Chelsea
| Number of Earners | # Families | Median Income |
| No Earners | 1 (7.7%) | $0 |
| 1 Earner | 8 (61.5%) | $0 |
| 2 Earners | 4 (30.8%) | $0 |
| 3+ Earners | 0 (0.0%) | $0 |
| Total | 13 (100.0%) | $151,042 |
Household Income in Chelsea
Household Income Brackets in Chelsea
With 6 households falling in the category, the $150,000 to $199,999 income range is the most frequent in Chelsea, accounting for 40.0% of all households.
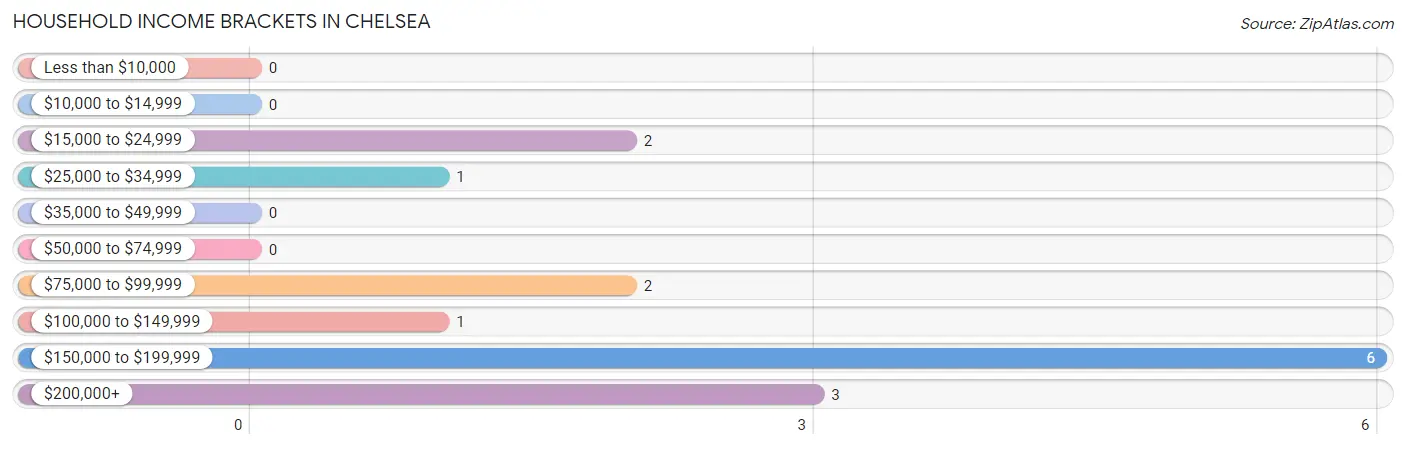
| Income Bracket | # Households | % Households |
| Less than $10,000 | 0 | 0.0% |
| $10,000 to $14,999 | 0 | 0.0% |
| $15,000 to $24,999 | 2 | 13.3% |
| $25,000 to $34,999 | 1 | 6.7% |
| $35,000 to $49,999 | 0 | 0.0% |
| $50,000 to $74,999 | 0 | 0.0% |
| $75,000 to $99,999 | 2 | 13.3% |
| $100,000 to $149,999 | 1 | 6.7% |
| $150,000 to $199,999 | 6 | 40.0% |
| $200,000+ | 3 | 20.0% |
Household Income by Householder Age in Chelsea
The median household income in Chelsea is $150,625, with the highest median household income of $250,001 found in the 45 to 64 years age bracket for the primary householder. A total of 5 households (33.3%) fall into this category.
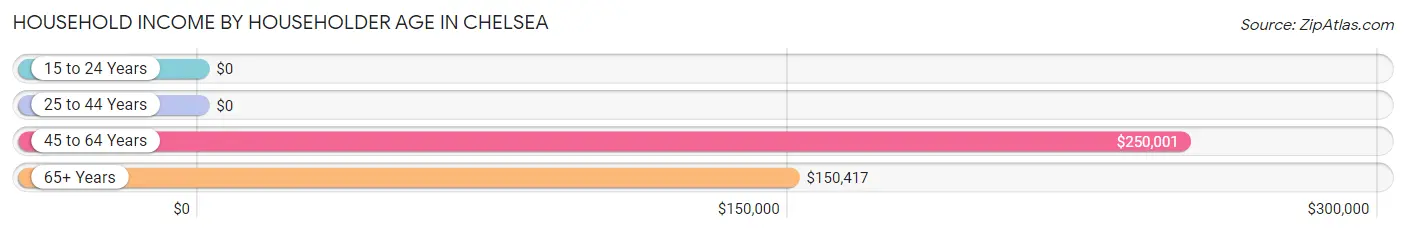
| Income Bracket | # Households | Median Income |
| 15 to 24 Years | 0 (0.0%) | $0 |
| 25 to 44 Years | 0 (0.0%) | $0 |
| 45 to 64 Years | 5 (33.3%) | $250,001 |
| 65+ Years | 10 (66.7%) | $150,417 |
| Total | 15 (100.0%) | $150,625 |
Poverty in Chelsea
Income Below Poverty by Sex and Age in Chelsea
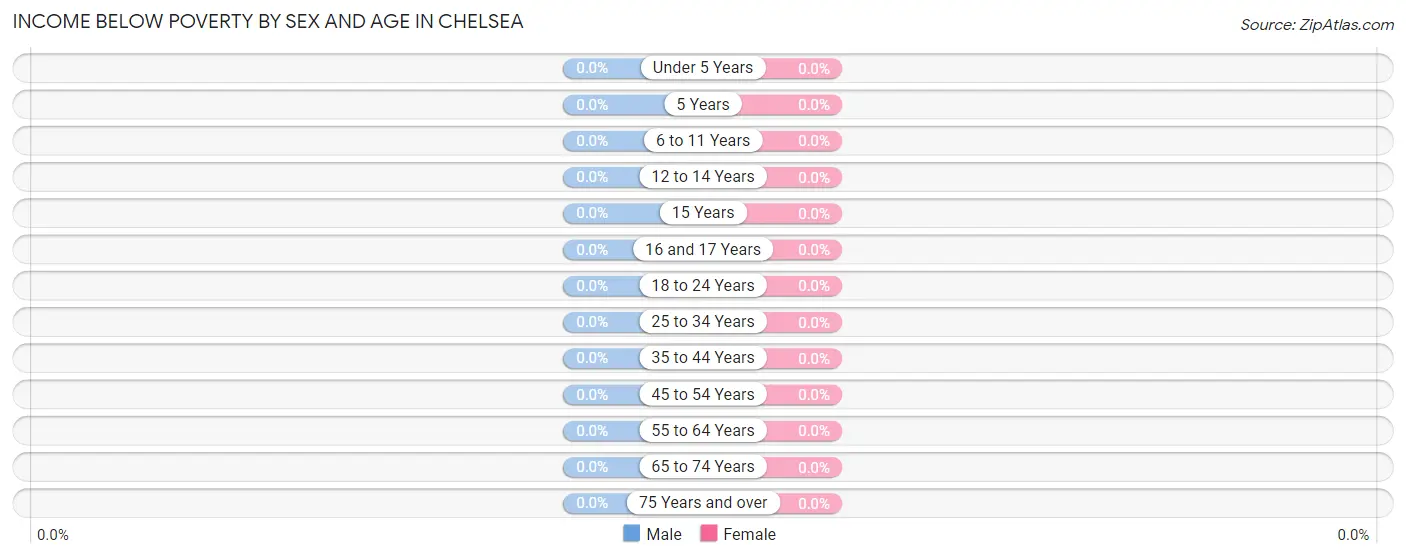
| Age Bracket | Male | Female |
| Under 5 Years | 0 (0.0%) | 0 (0.0%) |
| 5 Years | 0 (0.0%) | 0 (0.0%) |
| 6 to 11 Years | 0 (0.0%) | 0 (0.0%) |
| 12 to 14 Years | 0 (0.0%) | 0 (0.0%) |
| 15 Years | 0 (0.0%) | 0 (0.0%) |
| 16 and 17 Years | 0 (0.0%) | 0 (0.0%) |
| 18 to 24 Years | 0 (0.0%) | 0 (0.0%) |
| 25 to 34 Years | 0 (0.0%) | 0 (0.0%) |
| 35 to 44 Years | 0 (0.0%) | 0 (0.0%) |
| 45 to 54 Years | 0 (0.0%) | 0 (0.0%) |
| 55 to 64 Years | 0 (0.0%) | 0 (0.0%) |
| 65 to 74 Years | 0 (0.0%) | 0 (0.0%) |
| 75 Years and over | 0 (0.0%) | 0 (0.0%) |
| Total | 0 (0.0%) | 0 (0.0%) |
Income Above Poverty by Sex and Age in Chelsea
According to the poverty statistics in Chelsea, males aged 18 to 24 years and females aged 45 to 54 years are the age groups that are most secure financially, with 100.0% of males and 100.0% of females in these age groups living above the poverty line.
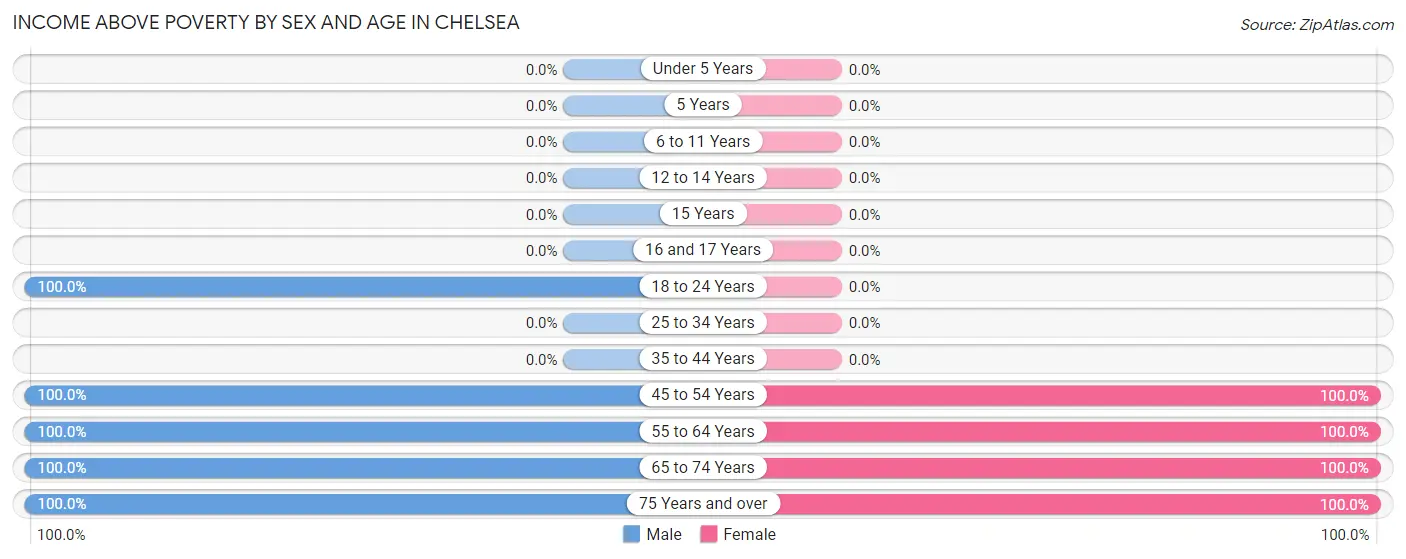
| Age Bracket | Male | Female |
| Under 5 Years | 0 (0.0%) | 0 (0.0%) |
| 5 Years | 0 (0.0%) | 0 (0.0%) |
| 6 to 11 Years | 0 (0.0%) | 0 (0.0%) |
| 12 to 14 Years | 0 (0.0%) | 0 (0.0%) |
| 15 Years | 0 (0.0%) | 0 (0.0%) |
| 16 and 17 Years | 0 (0.0%) | 0 (0.0%) |
| 18 to 24 Years | 28 (100.0%) | 0 (0.0%) |
| 25 to 34 Years | 0 (0.0%) | 0 (0.0%) |
| 35 to 44 Years | 0 (0.0%) | 0 (0.0%) |
| 45 to 54 Years | 3 (100.0%) | 3 (100.0%) |
| 55 to 64 Years | 1 (100.0%) | 7 (100.0%) |
| 65 to 74 Years | 7 (100.0%) | 1 (100.0%) |
| 75 Years and over | 3 (100.0%) | 3 (100.0%) |
| Total | 42 (100.0%) | 14 (100.0%) |
Income Below Poverty Among Married-Couple Families in Chelsea
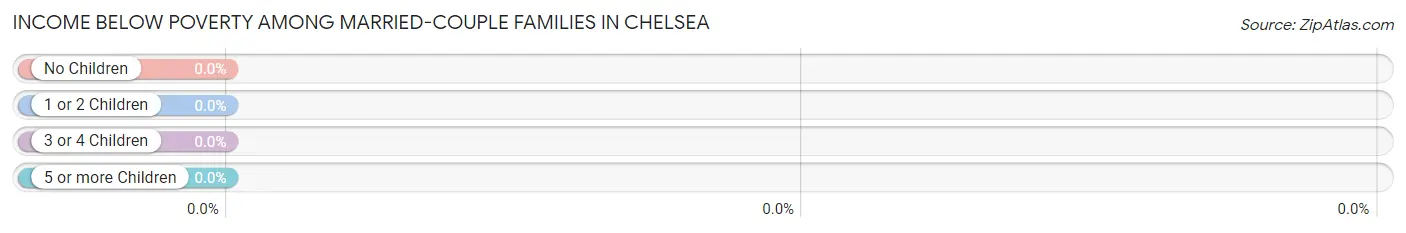
| Children | Above Poverty | Below Poverty |
| No Children | 13 (100.0%) | 0 (0.0%) |
| 1 or 2 Children | 0 (0.0%) | 0 (0.0%) |
| 3 or 4 Children | 0 (0.0%) | 0 (0.0%) |
| 5 or more Children | 0 (0.0%) | 0 (0.0%) |
| Total | 13 (100.0%) | 0 (0.0%) |
Income Below Poverty Among Single-Parent Households in Chelsea
| Children | Single Father | Single Mother |
| No Children | 0 (0.0%) | 0 (0.0%) |
| 1 or 2 Children | 0 (0.0%) | 0 (0.0%) |
| 3 or 4 Children | 0 (0.0%) | 0 (0.0%) |
| 5 or more Children | 0 (0.0%) | 0 (0.0%) |
| Total | 0 (0.0%) | 0 (0.0%) |
Income Below Poverty Among Married-Couple vs Single-Parent Households in Chelsea
| Children | Married-Couple Families | Single-Parent Households |
| No Children | 0 (0.0%) | 0 (0.0%) |
| 1 or 2 Children | 0 (0.0%) | 0 (0.0%) |
| 3 or 4 Children | 0 (0.0%) | 0 (0.0%) |
| 5 or more Children | 0 (0.0%) | 0 (0.0%) |
| Total | 0 (0.0%) | 0 (0.0%) |
Race in Chelsea
The most populous races in Chelsea are , and White / Caucasian (56 | 100.0%).
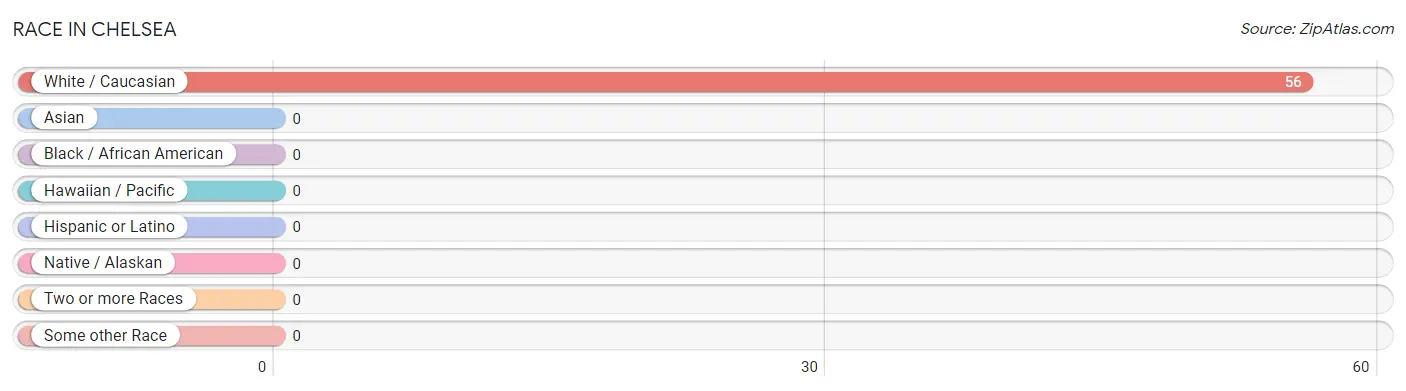
| Race | # Population | % Population |
| Asian | 0 | 0.0% |
| Black / African American | 0 | 0.0% |
| Hawaiian / Pacific | 0 | 0.0% |
| Hispanic or Latino | 0 | 0.0% |
| Native / Alaskan | 0 | 0.0% |
| White / Caucasian | 56 | 100.0% |
| Two or more Races | 0 | 0.0% |
| Some other Race | 0 | 0.0% |
| Total | 56 | 100.0% |
Ancestry in Chelsea
The most populous ancestries reported in Chelsea are German (41 | 73.2%), Czech (34 | 60.7%), and Irish (10 | 17.9%), together accounting for 151.8% of all Chelsea residents.
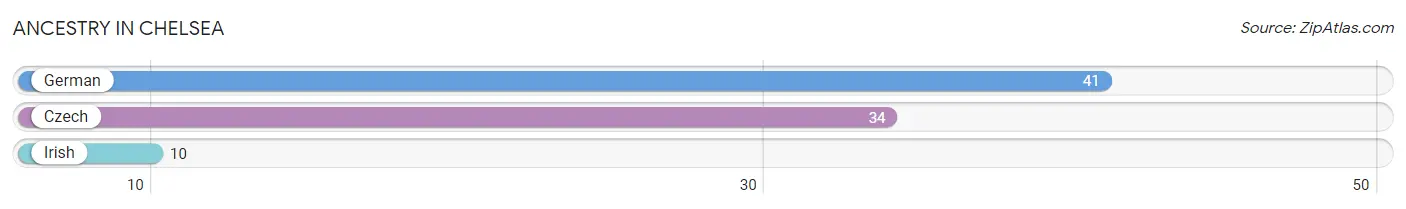
| Ancestry | # Population | % Population |
| Czech | 34 | 60.7% |
| German | 41 | 73.2% |
| Irish | 10 | 17.9% | View All 3 Rows |
Immigrants in Chelsea

| Immigration Origin | # Population | % Population | View All 0 Rows |
Sex and Age in Chelsea
Sex and Age in Chelsea
The most populous age groups in Chelsea are 20 to 24 Years (28 | 66.7%) for men and 60 to 64 Years (7 | 50.0%) for women.
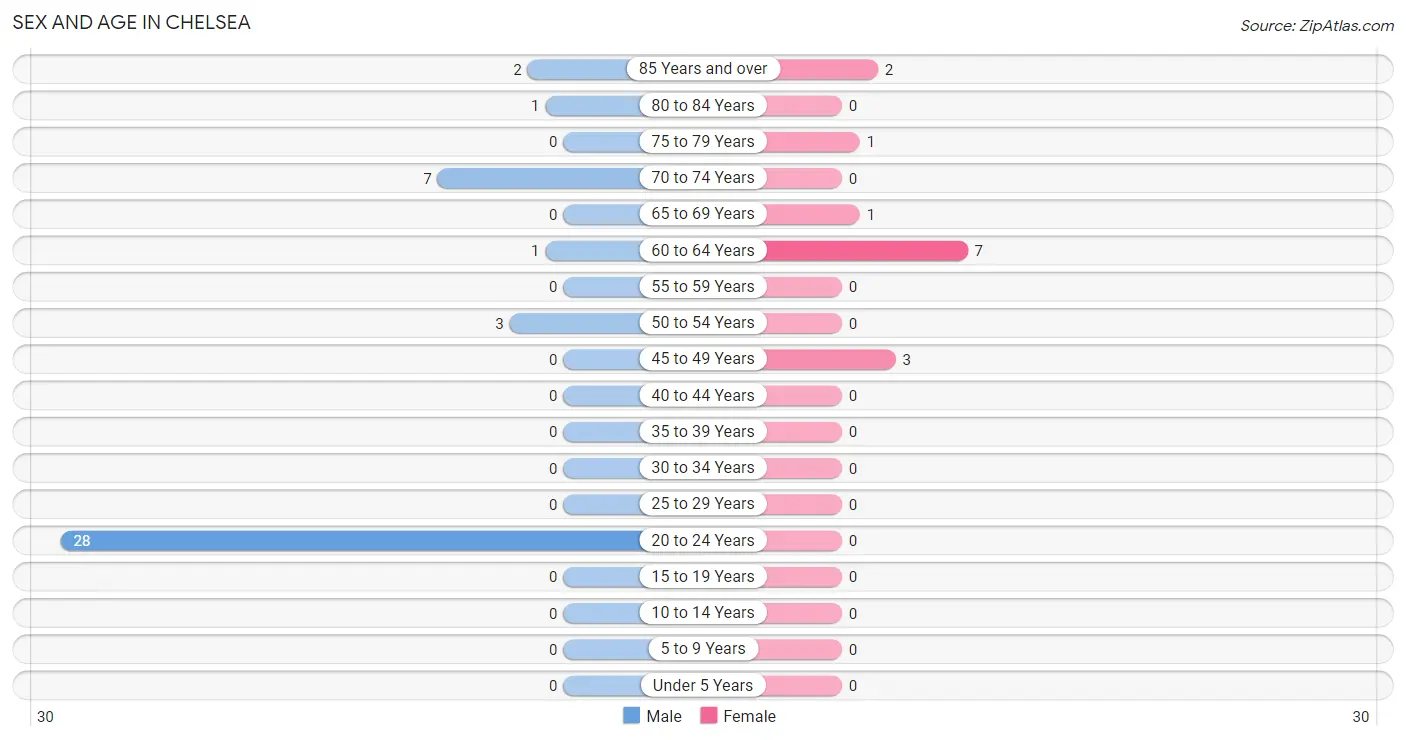
| Age Bracket | Male | Female |
| Under 5 Years | 0 (0.0%) | 0 (0.0%) |
| 5 to 9 Years | 0 (0.0%) | 0 (0.0%) |
| 10 to 14 Years | 0 (0.0%) | 0 (0.0%) |
| 15 to 19 Years | 0 (0.0%) | 0 (0.0%) |
| 20 to 24 Years | 28 (66.7%) | 0 (0.0%) |
| 25 to 29 Years | 0 (0.0%) | 0 (0.0%) |
| 30 to 34 Years | 0 (0.0%) | 0 (0.0%) |
| 35 to 39 Years | 0 (0.0%) | 0 (0.0%) |
| 40 to 44 Years | 0 (0.0%) | 0 (0.0%) |
| 45 to 49 Years | 0 (0.0%) | 3 (21.4%) |
| 50 to 54 Years | 3 (7.1%) | 0 (0.0%) |
| 55 to 59 Years | 0 (0.0%) | 0 (0.0%) |
| 60 to 64 Years | 1 (2.4%) | 7 (50.0%) |
| 65 to 69 Years | 0 (0.0%) | 1 (7.1%) |
| 70 to 74 Years | 7 (16.7%) | 0 (0.0%) |
| 75 to 79 Years | 0 (0.0%) | 1 (7.1%) |
| 80 to 84 Years | 1 (2.4%) | 0 (0.0%) |
| 85 Years and over | 2 (4.8%) | 2 (14.3%) |
| Total | 42 (100.0%) | 14 (100.0%) |
Families and Households in Chelsea
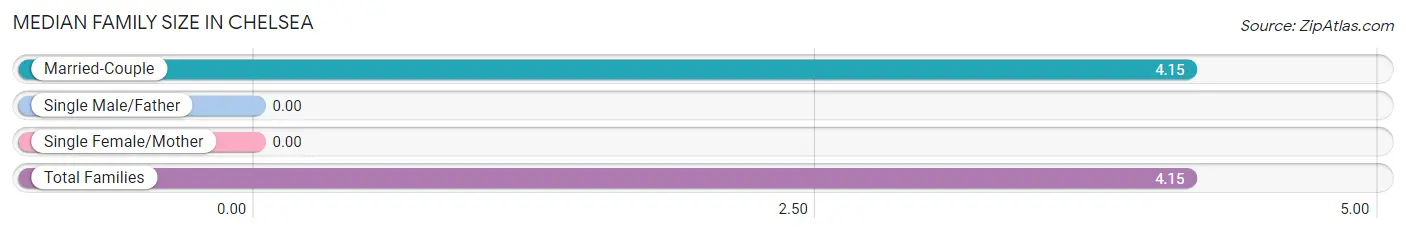
Median Family Size in Chelsea
| Family Type | # Families | Family Size |
| Married-Couple | 13 (100.0%) | 4.15 |
| Single Male/Father | 0 (0.0%) | - |
| Single Female/Mother | 0 (0.0%) | - |
| Total Families | 13 (100.0%) | 4.15 |
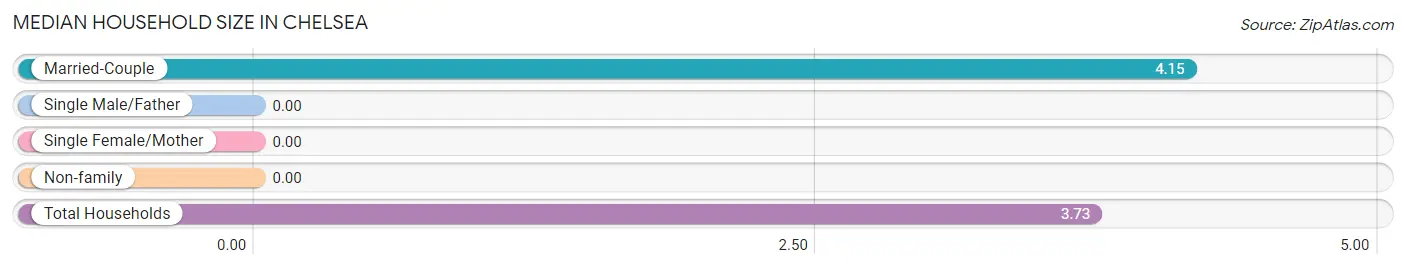
Median Household Size in Chelsea
| Household Type | # Households | Household Size |
| Married-Couple | 13 (86.7%) | 4.15 |
| Single Male/Father | 0 (0.0%) | - |
| Single Female/Mother | 0 (0.0%) | - |
| Non-family | 2 (13.3%) | - |
| Total Households | 15 (100.0%) | 3.73 |
Household Size by Marriage Status in Chelsea
Out of a total of 15 households in Chelsea, 13 (86.7%) are family households, while 2 (13.3%) are nonfamily households. The most numerous type of family households are 2-person households, comprising 7, and the most common type of nonfamily households are 1-person households, comprising 2.
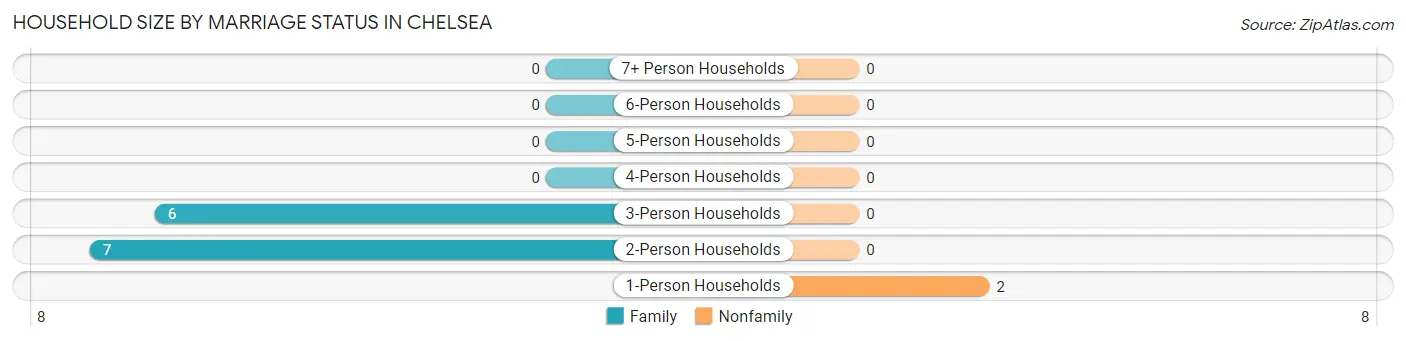
| Household Size | Family Households | Nonfamily Households |
| 1-Person Households | - | 2 (13.3%) |
| 2-Person Households | 7 (46.7%) | 0 (0.0%) |
| 3-Person Households | 6 (40.0%) | 0 (0.0%) |
| 4-Person Households | 0 (0.0%) | 0 (0.0%) |
| 5-Person Households | 0 (0.0%) | 0 (0.0%) |
| 6-Person Households | 0 (0.0%) | 0 (0.0%) |
| 7+ Person Households | 0 (0.0%) | 0 (0.0%) |
| Total | 13 (86.7%) | 2 (13.3%) |
Female Fertility in Chelsea
Fertility by Age in Chelsea
| Age Bracket | Women with Births | Births / 1,000 Women |
| 15 to 19 years | 0 (0.0%) | 0.0 |
| 20 to 34 years | 0 (0.0%) | 0.0 |
| 35 to 50 years | 0 (0.0%) | 0.0 |
| Total | 0 (0.0%) | 0.0 |
Fertility by Age by Marriage Status in Chelsea
| Age Bracket | Married | Unmarried |
| 15 to 19 years | 0 (0.0%) | 0 (0.0%) |
| 20 to 34 years | 0 (0.0%) | 0 (0.0%) |
| 35 to 50 years | 0 (0.0%) | 0 (0.0%) |
| Total | 0 (0.0%) | 0 (0.0%) |
Fertility by Education in Chelsea
| Educational Attainment | Women with Births | Births / 1,000 Women |
| Less than High School | 0 (0.0%) | 0.0 |
| High School Diploma | 0 (0.0%) | 0.0 |
| College or Associate's Degree | 0 (0.0%) | 0.0 |
| Bachelor's Degree | 0 (0.0%) | 0.0 |
| Graduate Degree | 0 (0.0%) | 0.0 |
| Total | 0 (0.0%) | 0.0 |
Fertility by Education by Marriage Status in Chelsea
| Educational Attainment | Married | Unmarried |
| Less than High School | 0 (0.0%) | 0 (0.0%) |
| High School Diploma | 0 (0.0%) | 0 (0.0%) |
| College or Associate's Degree | 0 (0.0%) | 0 (0.0%) |
| Bachelor's Degree | 0 (0.0%) | 0 (0.0%) |
| Graduate Degree | 0 (0.0%) | 0 (0.0%) |
| Total | 0 (0.0%) | 0 (0.0%) |
Employment Characteristics in Chelsea
Employment by Class of Employer in Chelsea
Among the 37 employed individuals in Chelsea, private company employees (34 | 91.9%), local government employees (2 | 5.4%), and self-employed (not incorporated) (1 | 2.7%) make up the most common classes of employment.
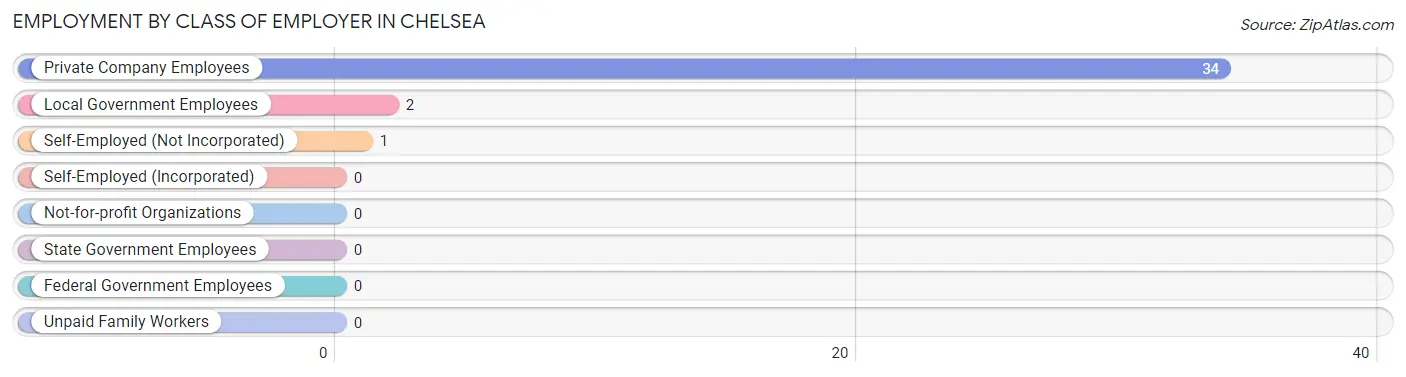
| Employer Class | # Employees | % Employees |
| Private Company Employees | 34 | 91.9% |
| Self-Employed (Incorporated) | 0 | 0.0% |
| Self-Employed (Not Incorporated) | 1 | 2.7% |
| Not-for-profit Organizations | 0 | 0.0% |
| Local Government Employees | 2 | 5.4% |
| State Government Employees | 0 | 0.0% |
| Federal Government Employees | 0 | 0.0% |
| Unpaid Family Workers | 0 | 0.0% |
| Total | 37 | 100.0% |
Employment Status by Age in Chelsea
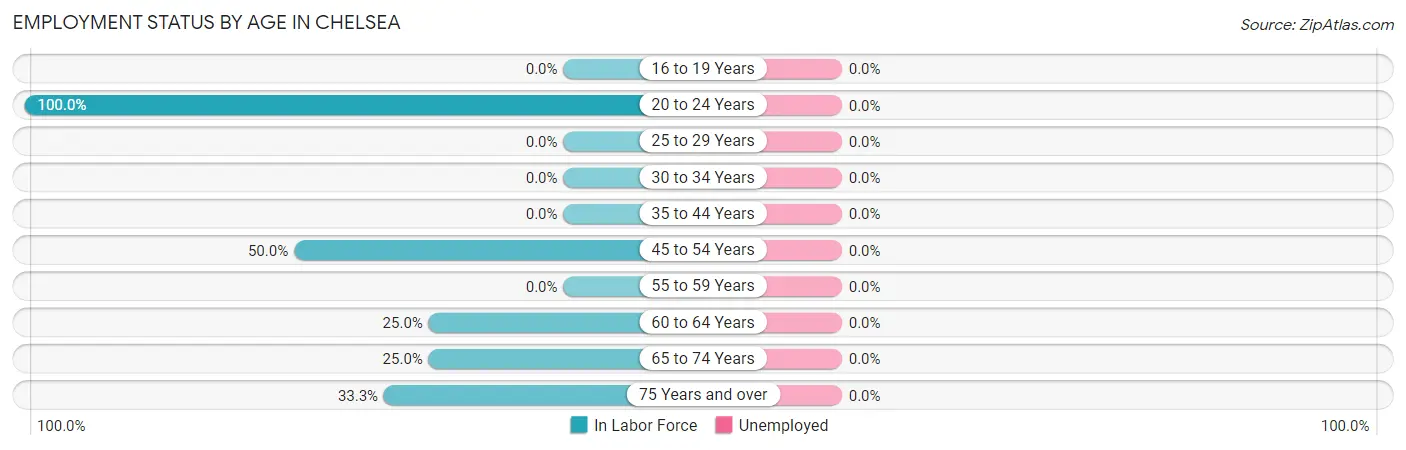
| Age Bracket | In Labor Force | Unemployed |
| 16 to 19 Years | 0 (0.0%) | 0 (0.0%) |
| 20 to 24 Years | 28 (100.0%) | 0 (0.0%) |
| 25 to 29 Years | 0 (0.0%) | 0 (0.0%) |
| 30 to 34 Years | 0 (0.0%) | 0 (0.0%) |
| 35 to 44 Years | 0 (0.0%) | 0 (0.0%) |
| 45 to 54 Years | 3 (50.0%) | 0 (0.0%) |
| 55 to 59 Years | 0 (0.0%) | 0 (0.0%) |
| 60 to 64 Years | 2 (25.0%) | 0 (0.0%) |
| 65 to 74 Years | 2 (25.0%) | 0 (0.0%) |
| 75 Years and over | 2 (33.3%) | 0 (0.0%) |
| Total | 37 (66.1%) | 0 (0.0%) |
Employment Status by Educational Attainment in Chelsea
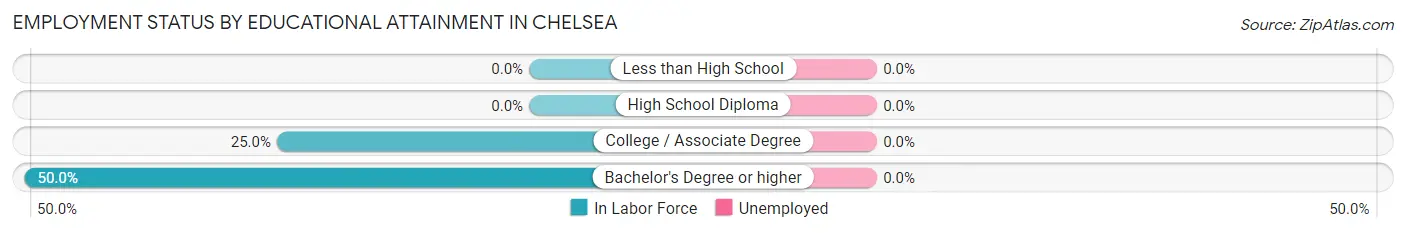
| Educational Attainment | In Labor Force | Unemployed |
| Less than High School | 0 (0.0%) | 0 (0.0%) |
| High School Diploma | 0 (0.0%) | 0 (0.0%) |
| College / Associate Degree | 2 (25.0%) | 0 (0.0%) |
| Bachelor's Degree or higher | 3 (50.0%) | 0 (0.0%) |
| Total | 5 (35.7%) | 0 (0.0%) |
Employment Occupations by Sex in Chelsea
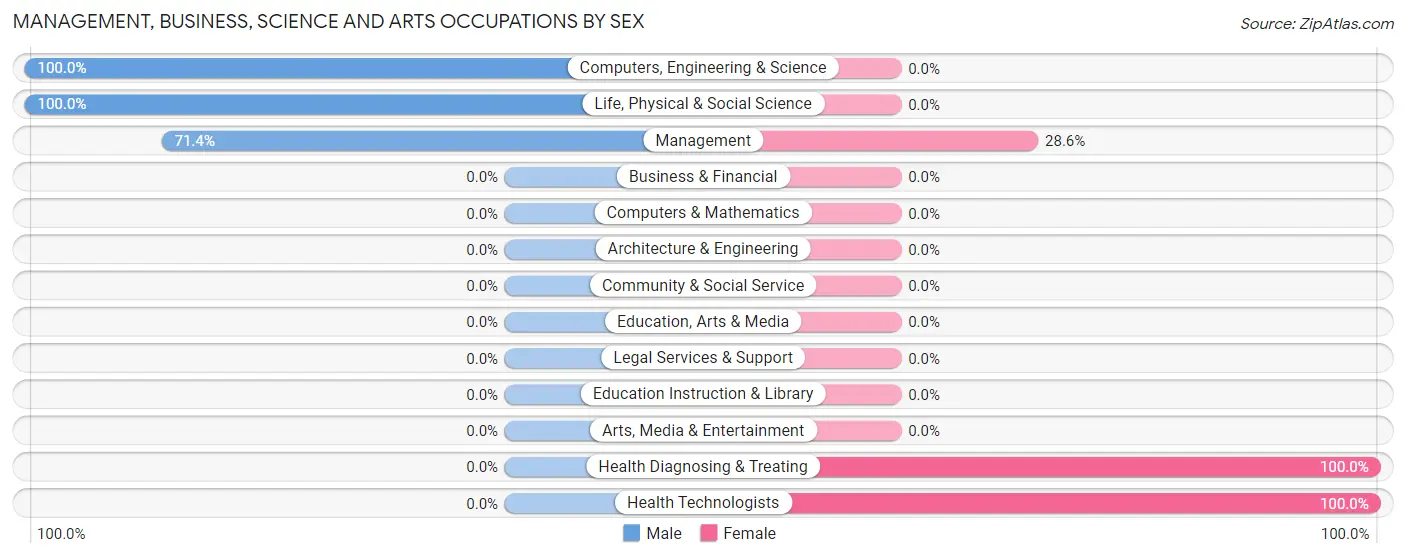
Management, Business, Science and Arts Occupations
The most common Management, Business, Science and Arts occupations in Chelsea are Computers, Engineering & Science (28 | 75.7%), Life, Physical & Social Science (28 | 75.7%), Management (7 | 18.9%), Health Diagnosing & Treating (1 | 2.7%), and Health Technologists (1 | 2.7%).
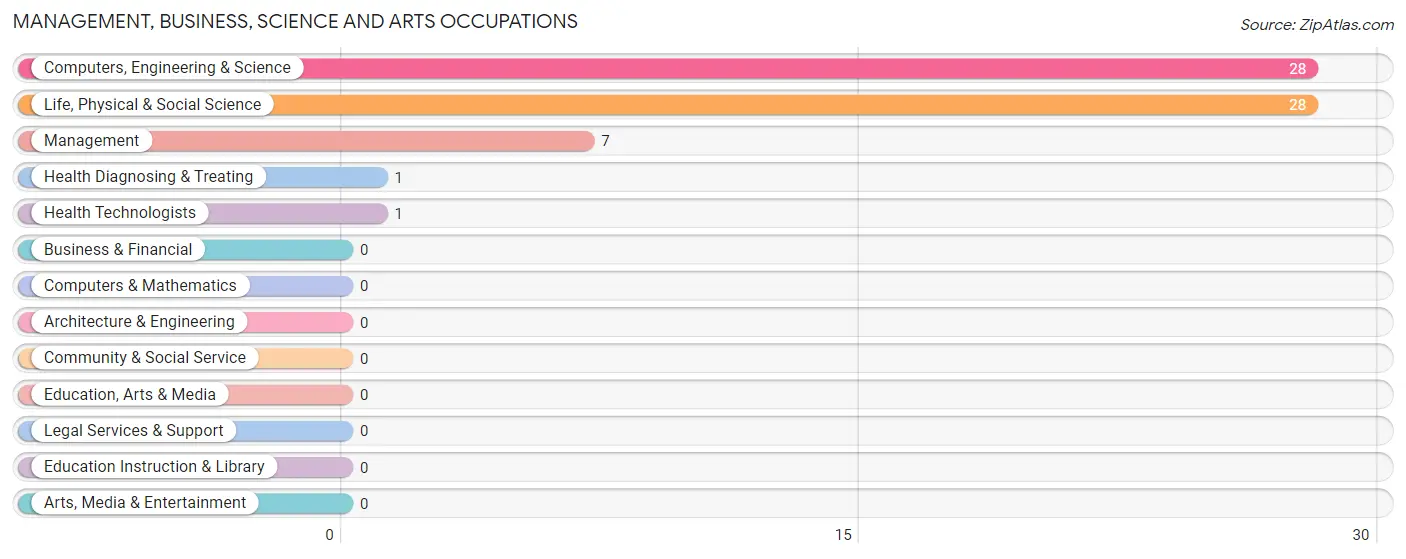
Management, Business, Science and Arts Occupations by Sex
Within the Management, Business, Science and Arts occupations in Chelsea, the most male-oriented occupations are Computers, Engineering & Science (100.0%), Life, Physical & Social Science (100.0%), and Management (71.4%), while the most female-oriented occupations are Health Diagnosing & Treating (100.0%), Health Technologists (100.0%), and Management (28.6%).
| Occupation | Male | Female |
| Management | 5 (71.4%) | 2 (28.6%) |
| Business & Financial | 0 (0.0%) | 0 (0.0%) |
| Computers, Engineering & Science | 28 (100.0%) | 0 (0.0%) |
| Computers & Mathematics | 0 (0.0%) | 0 (0.0%) |
| Architecture & Engineering | 0 (0.0%) | 0 (0.0%) |
| Life, Physical & Social Science | 28 (100.0%) | 0 (0.0%) |
| Community & Social Service | 0 (0.0%) | 0 (0.0%) |
| Education, Arts & Media | 0 (0.0%) | 0 (0.0%) |
| Legal Services & Support | 0 (0.0%) | 0 (0.0%) |
| Education Instruction & Library | 0 (0.0%) | 0 (0.0%) |
| Arts, Media & Entertainment | 0 (0.0%) | 0 (0.0%) |
| Health Diagnosing & Treating | 0 (0.0%) | 1 (100.0%) |
| Health Technologists | 0 (0.0%) | 1 (100.0%) |
| Total (Category) | 33 (91.7%) | 3 (8.3%) |
| Total (Overall) | 33 (89.2%) | 4 (10.8%) |
Services Occupations
Services Occupations by Sex
| Occupation | Male | Female |
| Healthcare Support | 0 (0.0%) | 0 (0.0%) |
| Security & Protection | 0 (0.0%) | 0 (0.0%) |
| Firefighting & Prevention | 0 (0.0%) | 0 (0.0%) |
| Law Enforcement | 0 (0.0%) | 0 (0.0%) |
| Food Preparation & Serving | 0 (0.0%) | 0 (0.0%) |
| Cleaning & Maintenance | 0 (0.0%) | 0 (0.0%) |
| Personal Care & Service | 0 (0.0%) | 0 (0.0%) |
| Total (Category) | 0 (0.0%) | 0 (0.0%) |
| Total (Overall) | 33 (89.2%) | 4 (10.8%) |
Sales and Office Occupations
The most common Sales and Office occupations in Chelsea are , and Office & Administration (1 | 2.7%).
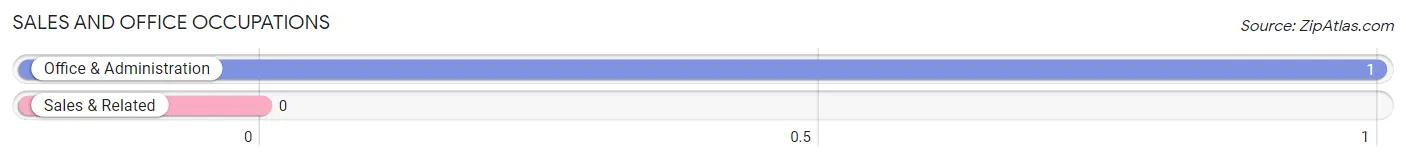
Sales and Office Occupations by Sex
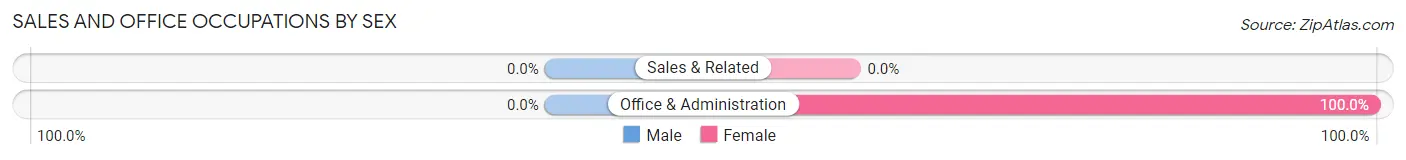
| Occupation | Male | Female |
| Sales & Related | 0 (0.0%) | 0 (0.0%) |
| Office & Administration | 0 (0.0%) | 1 (100.0%) |
| Total (Category) | 0 (0.0%) | 1 (100.0%) |
| Total (Overall) | 33 (89.2%) | 4 (10.8%) |
Natural Resources, Construction and Maintenance Occupations
Natural Resources, Construction and Maintenance Occupations by Sex
| Occupation | Male | Female |
| Farming, Fishing & Forestry | 0 (0.0%) | 0 (0.0%) |
| Construction & Extraction | 0 (0.0%) | 0 (0.0%) |
| Installation, Maintenance & Repair | 0 (0.0%) | 0 (0.0%) |
| Total (Category) | 0 (0.0%) | 0 (0.0%) |
| Total (Overall) | 33 (89.2%) | 4 (10.8%) |
Production, Transportation and Moving Occupations
Production, Transportation and Moving Occupations by Sex
| Occupation | Male | Female |
| Production | 0 (0.0%) | 0 (0.0%) |
| Transportation | 0 (0.0%) | 0 (0.0%) |
| Material Moving | 0 (0.0%) | 0 (0.0%) |
| Total (Category) | 0 (0.0%) | 0 (0.0%) |
| Total (Overall) | 33 (89.2%) | 4 (10.8%) |
Employment Industries by Sex in Chelsea
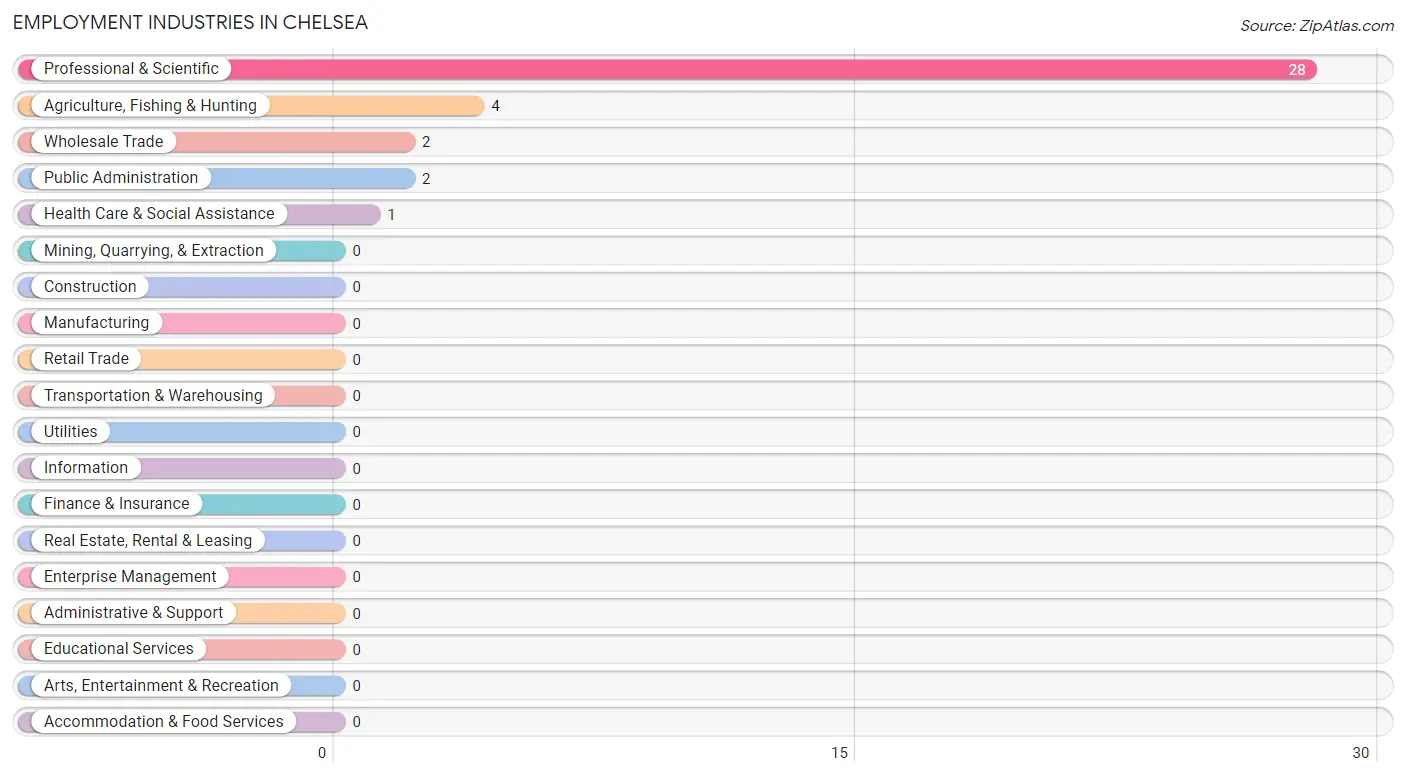
Employment Industries in Chelsea
The major employment industries in Chelsea include Professional & Scientific (28 | 75.7%), Agriculture, Fishing & Hunting (4 | 10.8%), Wholesale Trade (2 | 5.4%), Public Administration (2 | 5.4%), and Health Care & Social Assistance (1 | 2.7%).
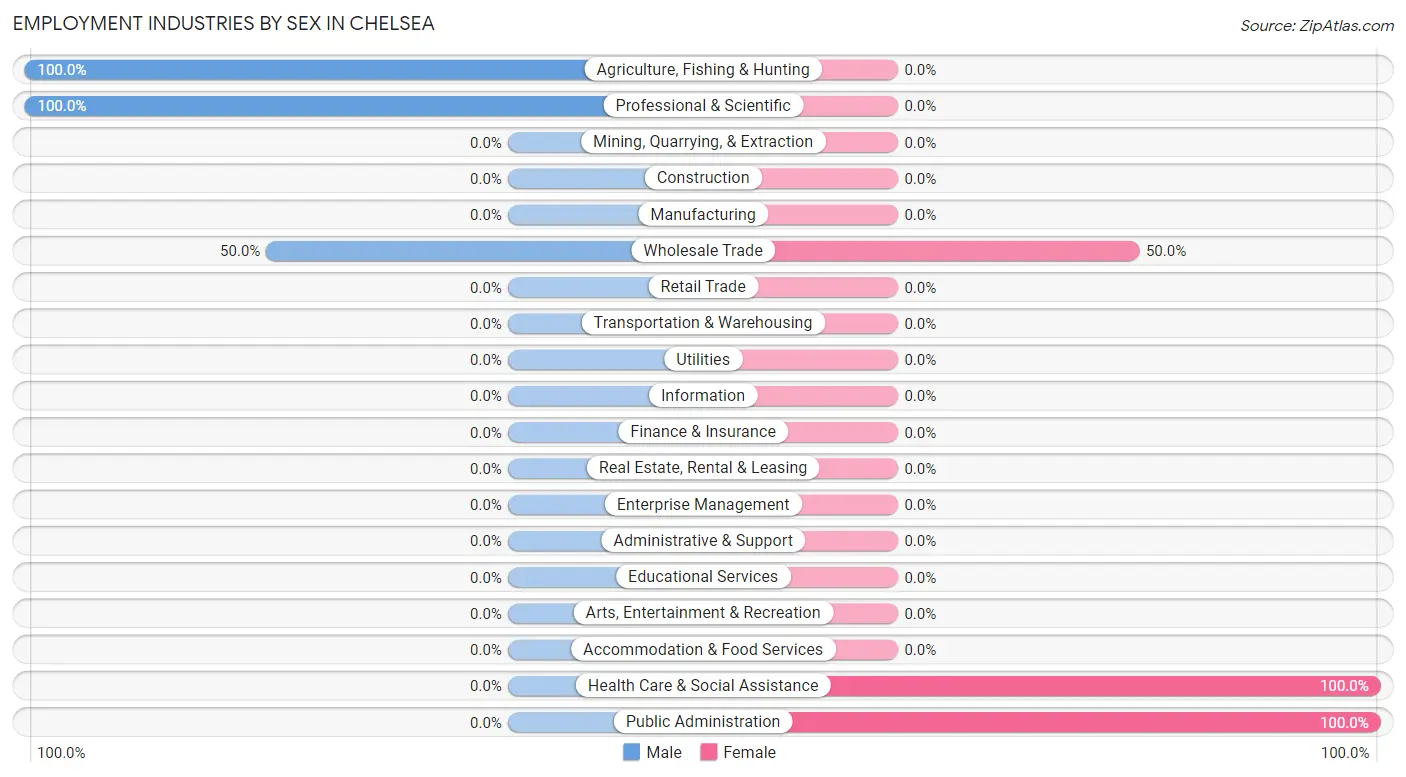
Employment Industries by Sex in Chelsea
The Chelsea industries that see more men than women are Agriculture, Fishing & Hunting (100.0%), Professional & Scientific (100.0%), and Wholesale Trade (50.0%), whereas the industries that tend to have a higher number of women are Health Care & Social Assistance (100.0%), Public Administration (100.0%), and Wholesale Trade (50.0%).
| Industry | Male | Female |
| Agriculture, Fishing & Hunting | 4 (100.0%) | 0 (0.0%) |
| Mining, Quarrying, & Extraction | 0 (0.0%) | 0 (0.0%) |
| Construction | 0 (0.0%) | 0 (0.0%) |
| Manufacturing | 0 (0.0%) | 0 (0.0%) |
| Wholesale Trade | 1 (50.0%) | 1 (50.0%) |
| Retail Trade | 0 (0.0%) | 0 (0.0%) |
| Transportation & Warehousing | 0 (0.0%) | 0 (0.0%) |
| Utilities | 0 (0.0%) | 0 (0.0%) |
| Information | 0 (0.0%) | 0 (0.0%) |
| Finance & Insurance | 0 (0.0%) | 0 (0.0%) |
| Real Estate, Rental & Leasing | 0 (0.0%) | 0 (0.0%) |
| Professional & Scientific | 28 (100.0%) | 0 (0.0%) |
| Enterprise Management | 0 (0.0%) | 0 (0.0%) |
| Administrative & Support | 0 (0.0%) | 0 (0.0%) |
| Educational Services | 0 (0.0%) | 0 (0.0%) |
| Health Care & Social Assistance | 0 (0.0%) | 1 (100.0%) |
| Arts, Entertainment & Recreation | 0 (0.0%) | 0 (0.0%) |
| Accommodation & Food Services | 0 (0.0%) | 0 (0.0%) |
| Public Administration | 0 (0.0%) | 2 (100.0%) |
| Total | 33 (89.2%) | 4 (10.8%) |
Education in Chelsea
School Enrollment in Chelsea
| School Level | # Students | % Students |
| Nursery / Preschool | 0 | 0.0% |
| Kindergarten | 0 | 0.0% |
| Elementary School | 0 | 0.0% |
| Middle School | 0 | 0.0% |
| High School | 0 | 0.0% |
| College / Undergraduate | 0 | 0.0% |
| Graduate / Professional | 0 | 0.0% |
| Total | 0 | 0.0% |
School Enrollment by Age by Funding Source in Chelsea
| Age Bracket | Public School | Private School |
| 3 to 4 Year Olds | 0 (0.0%) | 0 (0.0%) |
| 5 to 9 Year Old | 0 (0.0%) | 0 (0.0%) |
| 10 to 14 Year Olds | 0 (0.0%) | 0 (0.0%) |
| 15 to 17 Year Olds | 0 (0.0%) | 0 (0.0%) |
| 18 to 19 Year Olds | 0 (0.0%) | 0 (0.0%) |
| 20 to 24 Year Olds | 0 (0.0%) | 0 (0.0%) |
| 25 to 34 Year Olds | 0 (0.0%) | 0 (0.0%) |
| 35 Years and over | 0 (0.0%) | 0 (0.0%) |
| Total | 0 (0.0%) | 0 (0.0%) |
Educational Attainment by Field of Study in Chelsea
Business (3 | 50.0%), and education (3 | 50.0%) are the most common fields of study among 6 individuals in Chelsea who have obtained a bachelor's degree or higher.
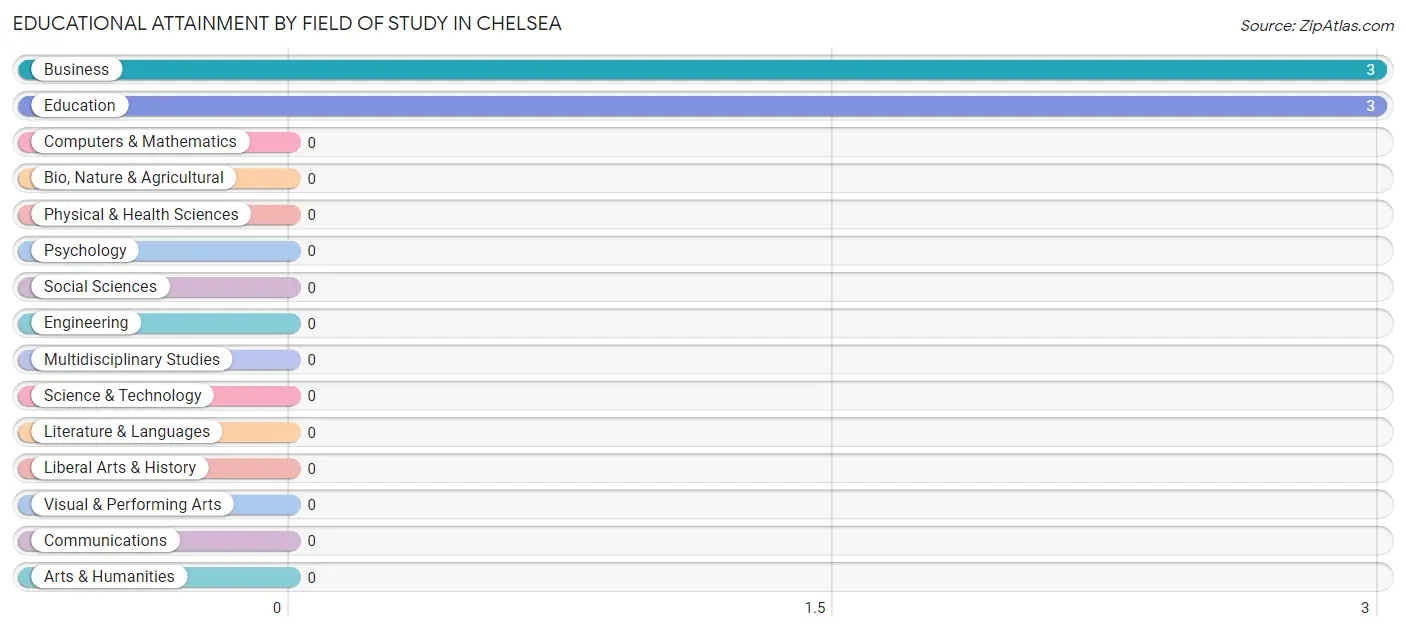
| Field of Study | # Graduates | % Graduates |
| Computers & Mathematics | 0 | 0.0% |
| Bio, Nature & Agricultural | 0 | 0.0% |
| Physical & Health Sciences | 0 | 0.0% |
| Psychology | 0 | 0.0% |
| Social Sciences | 0 | 0.0% |
| Engineering | 0 | 0.0% |
| Multidisciplinary Studies | 0 | 0.0% |
| Science & Technology | 0 | 0.0% |
| Business | 3 | 50.0% |
| Education | 3 | 50.0% |
| Literature & Languages | 0 | 0.0% |
| Liberal Arts & History | 0 | 0.0% |
| Visual & Performing Arts | 0 | 0.0% |
| Communications | 0 | 0.0% |
| Arts & Humanities | 0 | 0.0% |
| Total | 6 | 100.0% |
Transportation & Commute in Chelsea
Vehicle Availability by Sex in Chelsea
The most prevalent vehicle ownership categories in Chelsea are males with 5 or more vehicles (28, accounting for 84.9%) and females with 5 or more vehicles (0, making up 700.0%).
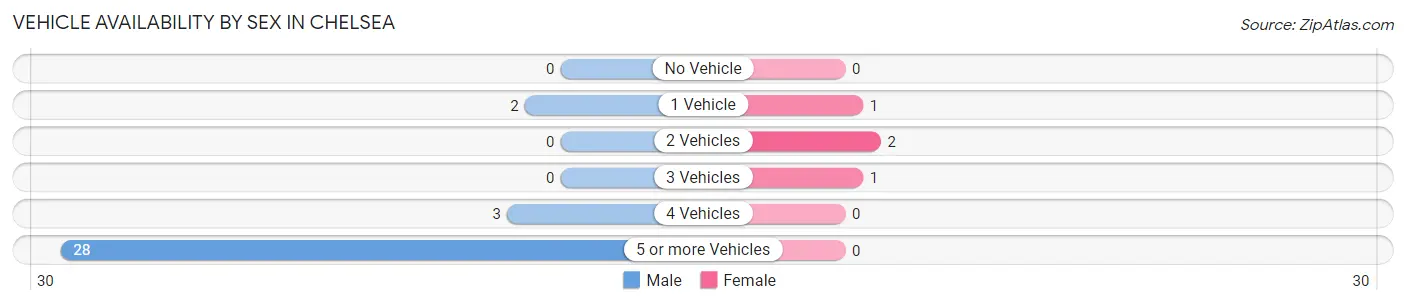
| Vehicles Available | Male | Female |
| No Vehicle | 0 (0.0%) | 0 (0.0%) |
| 1 Vehicle | 2 (6.1%) | 1 (25.0%) |
| 2 Vehicles | 0 (0.0%) | 2 (50.0%) |
| 3 Vehicles | 0 (0.0%) | 1 (25.0%) |
| 4 Vehicles | 3 (9.1%) | 0 (0.0%) |
| 5 or more Vehicles | 28 (84.9%) | 0 (0.0%) |
| Total | 33 (100.0%) | 4 (100.0%) |
Commute Time in Chelsea
The most frequently occuring commute durations in Chelsea are 30 to 34 minutes (28 commuters, 75.7%), 10 to 14 minutes (3 commuters, 8.1%), and less than 5 minutes (2 commuters, 5.4%).
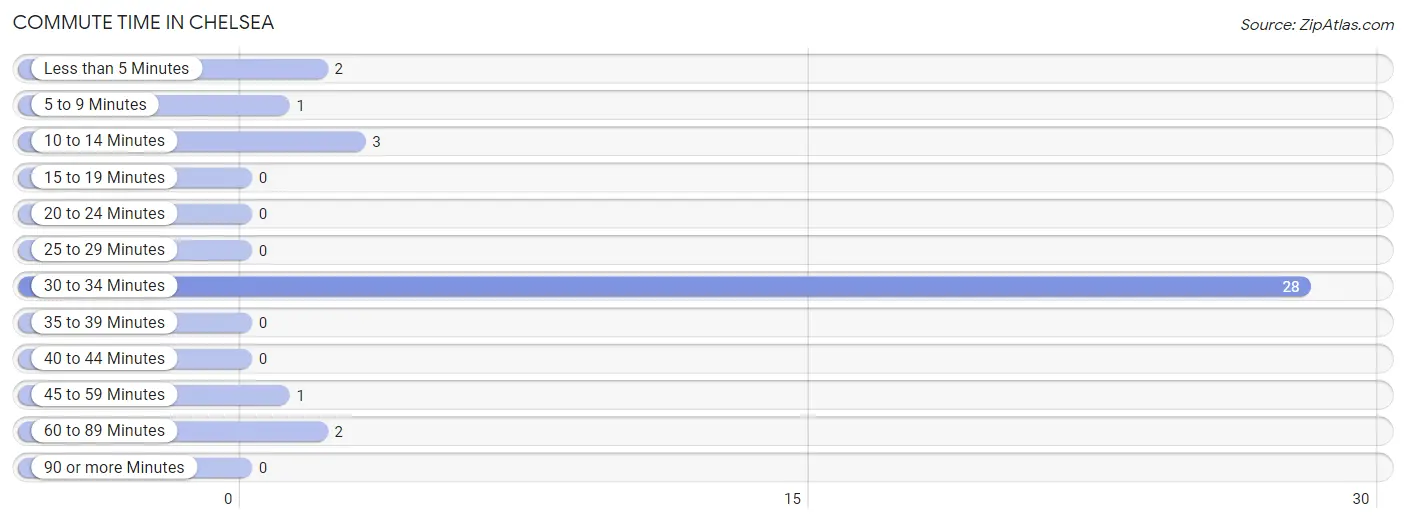
| Commute Time | # Commuters | % Commuters |
| Less than 5 Minutes | 2 | 5.4% |
| 5 to 9 Minutes | 1 | 2.7% |
| 10 to 14 Minutes | 3 | 8.1% |
| 15 to 19 Minutes | 0 | 0.0% |
| 20 to 24 Minutes | 0 | 0.0% |
| 25 to 29 Minutes | 0 | 0.0% |
| 30 to 34 Minutes | 28 | 75.7% |
| 35 to 39 Minutes | 0 | 0.0% |
| 40 to 44 Minutes | 0 | 0.0% |
| 45 to 59 Minutes | 1 | 2.7% |
| 60 to 89 Minutes | 2 | 5.4% |
| 90 or more Minutes | 0 | 0.0% |
Commute Time by Sex in Chelsea
The most common commute times in Chelsea are 30 to 34 minutes (28 commuters, 84.9%) for males and 60 to 89 minutes (2 commuters, 50.0%) for females.
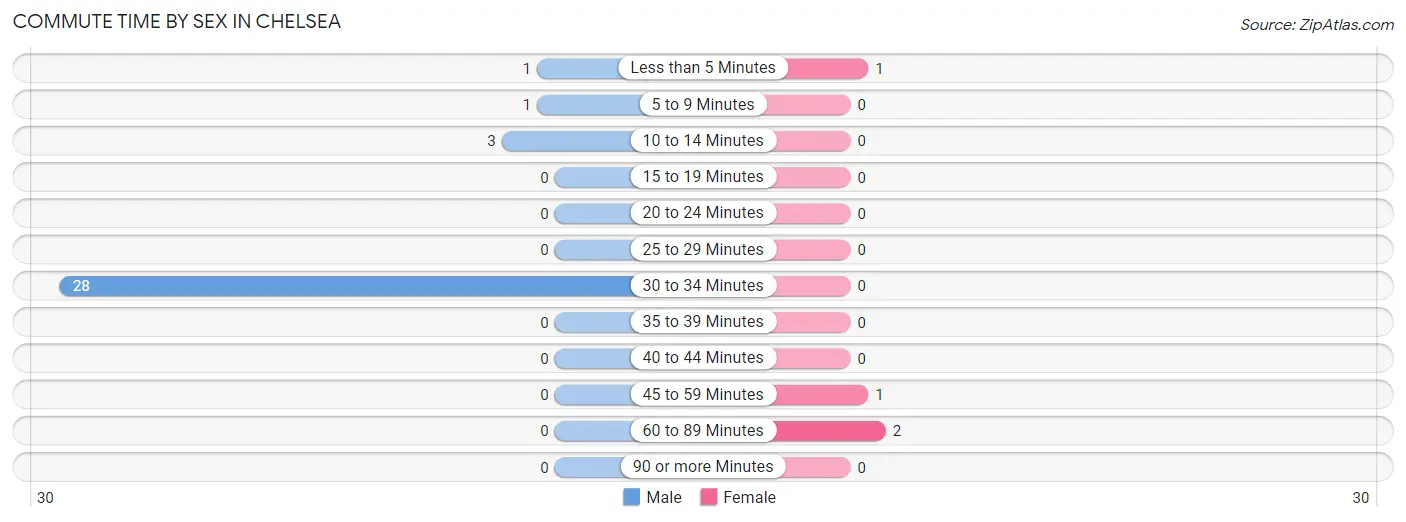
| Commute Time | Male | Female |
| Less than 5 Minutes | 1 (3.0%) | 1 (25.0%) |
| 5 to 9 Minutes | 1 (3.0%) | 0 (0.0%) |
| 10 to 14 Minutes | 3 (9.1%) | 0 (0.0%) |
| 15 to 19 Minutes | 0 (0.0%) | 0 (0.0%) |
| 20 to 24 Minutes | 0 (0.0%) | 0 (0.0%) |
| 25 to 29 Minutes | 0 (0.0%) | 0 (0.0%) |
| 30 to 34 Minutes | 28 (84.9%) | 0 (0.0%) |
| 35 to 39 Minutes | 0 (0.0%) | 0 (0.0%) |
| 40 to 44 Minutes | 0 (0.0%) | 0 (0.0%) |
| 45 to 59 Minutes | 0 (0.0%) | 1 (25.0%) |
| 60 to 89 Minutes | 0 (0.0%) | 2 (50.0%) |
| 90 or more Minutes | 0 (0.0%) | 0 (0.0%) |
Time of Departure to Work by Sex in Chelsea
The most frequent times of departure to work in Chelsea are 7:30 AM to 7:59 AM (28, 84.9%) for males and 7:00 AM to 7:29 AM (2, 50.0%) for females.
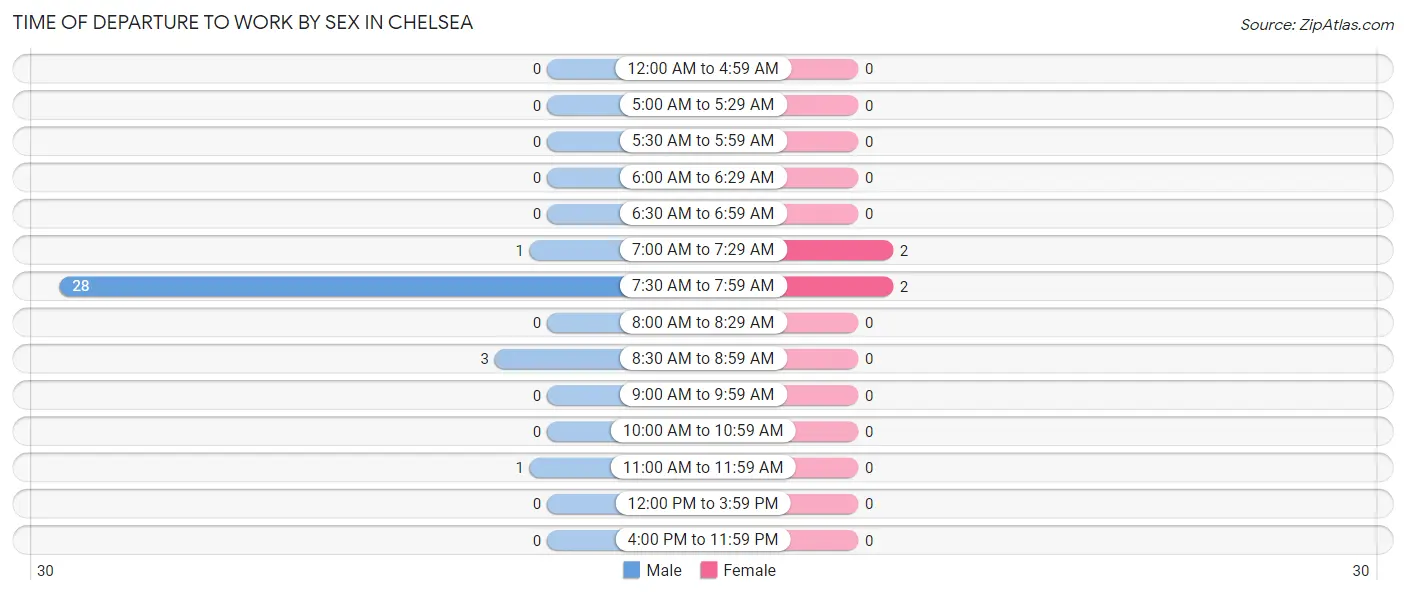
| Time of Departure | Male | Female |
| 12:00 AM to 4:59 AM | 0 (0.0%) | 0 (0.0%) |
| 5:00 AM to 5:29 AM | 0 (0.0%) | 0 (0.0%) |
| 5:30 AM to 5:59 AM | 0 (0.0%) | 0 (0.0%) |
| 6:00 AM to 6:29 AM | 0 (0.0%) | 0 (0.0%) |
| 6:30 AM to 6:59 AM | 0 (0.0%) | 0 (0.0%) |
| 7:00 AM to 7:29 AM | 1 (3.0%) | 2 (50.0%) |
| 7:30 AM to 7:59 AM | 28 (84.9%) | 2 (50.0%) |
| 8:00 AM to 8:29 AM | 0 (0.0%) | 0 (0.0%) |
| 8:30 AM to 8:59 AM | 3 (9.1%) | 0 (0.0%) |
| 9:00 AM to 9:59 AM | 0 (0.0%) | 0 (0.0%) |
| 10:00 AM to 10:59 AM | 0 (0.0%) | 0 (0.0%) |
| 11:00 AM to 11:59 AM | 1 (3.0%) | 0 (0.0%) |
| 12:00 PM to 3:59 PM | 0 (0.0%) | 0 (0.0%) |
| 4:00 PM to 11:59 PM | 0 (0.0%) | 0 (0.0%) |
| Total | 33 (100.0%) | 4 (100.0%) |
Housing Occupancy in Chelsea
Occupancy by Ownership in Chelsea
Of the total 15 dwellings in Chelsea, owner-occupied units account for 14 (93.3%), while renter-occupied units make up 1 (6.7%).
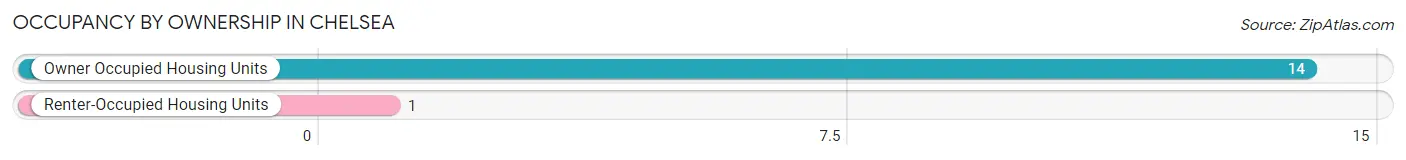
| Occupancy | # Housing Units | % Housing Units |
| Owner Occupied Housing Units | 14 | 93.3% |
| Renter-Occupied Housing Units | 1 | 6.7% |
| Total Occupied Housing Units | 15 | 100.0% |
Occupancy by Household Size in Chelsea
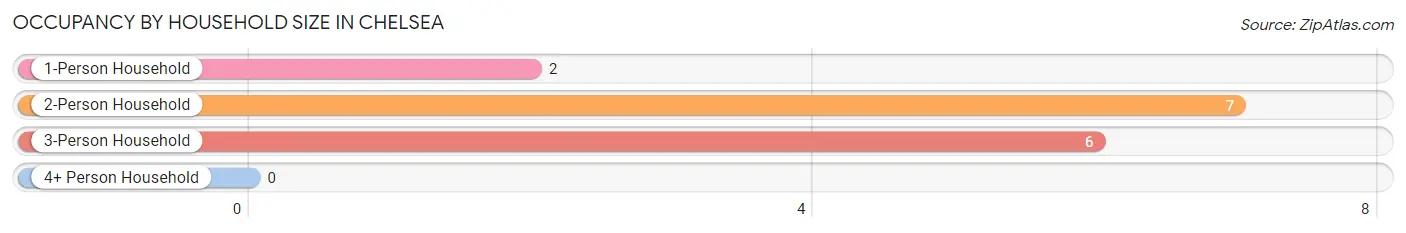
| Household Size | # Housing Units | % Housing Units |
| 1-Person Household | 2 | 13.3% |
| 2-Person Household | 7 | 46.7% |
| 3-Person Household | 6 | 40.0% |
| 4+ Person Household | 0 | 0.0% |
| Total Housing Units | 15 | 100.0% |
Occupancy by Ownership by Household Size in Chelsea
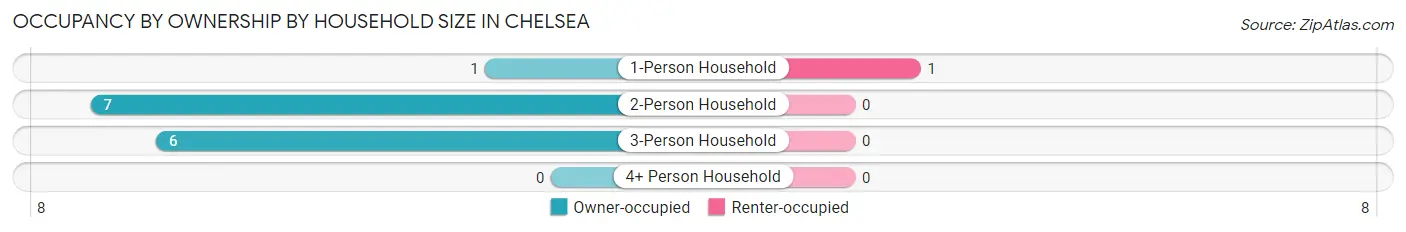
| Household Size | Owner-occupied | Renter-occupied |
| 1-Person Household | 1 (50.0%) | 1 (50.0%) |
| 2-Person Household | 7 (100.0%) | 0 (0.0%) |
| 3-Person Household | 6 (100.0%) | 0 (0.0%) |
| 4+ Person Household | 0 (0.0%) | 0 (0.0%) |
| Total Housing Units | 14 (93.3%) | 1 (6.7%) |
Occupancy by Educational Attainment in Chelsea
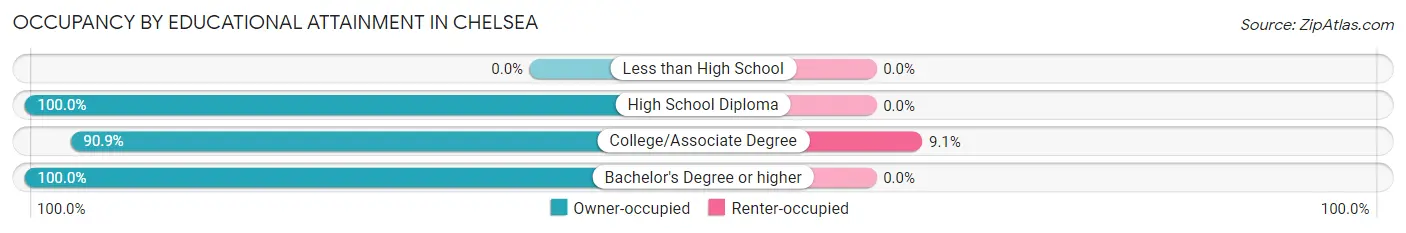
| Household Size | Owner-occupied | Renter-occupied |
| Less than High School | 0 (0.0%) | 0 (0.0%) |
| High School Diploma | 1 (100.0%) | 0 (0.0%) |
| College/Associate Degree | 10 (90.9%) | 1 (9.1%) |
| Bachelor's Degree or higher | 3 (100.0%) | 0 (0.0%) |
Occupancy by Age of Householder in Chelsea
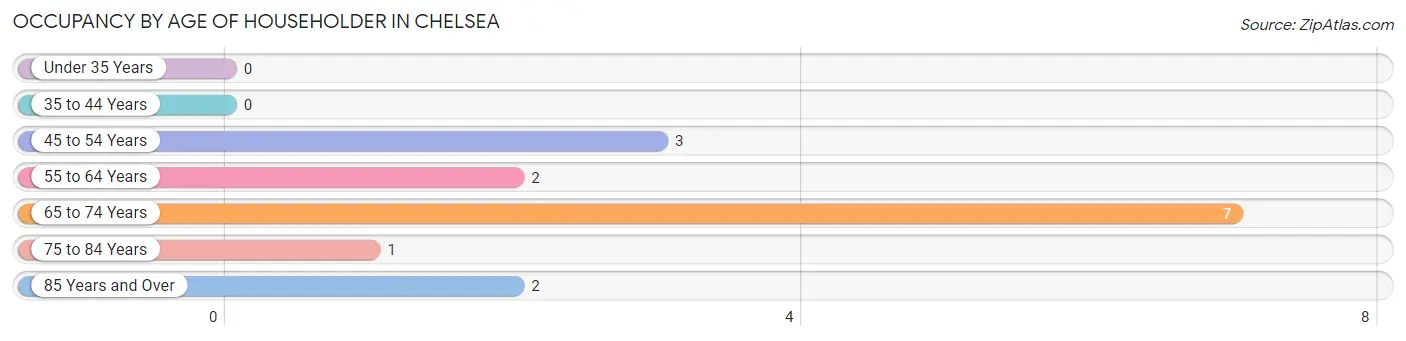
| Age Bracket | # Households | % Households |
| Under 35 Years | 0 | 0.0% |
| 35 to 44 Years | 0 | 0.0% |
| 45 to 54 Years | 3 | 20.0% |
| 55 to 64 Years | 2 | 13.3% |
| 65 to 74 Years | 7 | 46.7% |
| 75 to 84 Years | 1 | 6.7% |
| 85 Years and Over | 2 | 13.3% |
| Total | 15 | 100.0% |
Housing Finances in Chelsea
Median Income by Occupancy in Chelsea
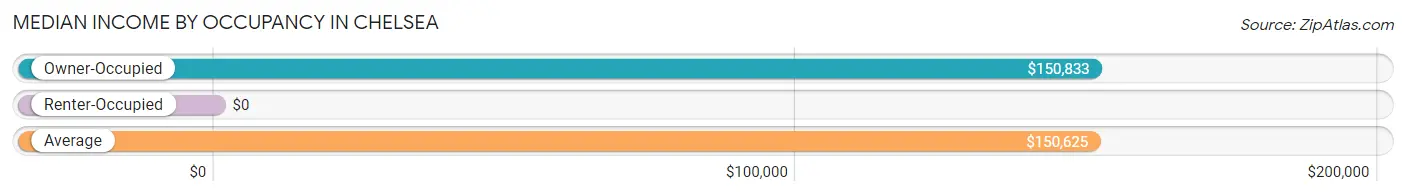
| Occupancy Type | # Households | Median Income |
| Owner-Occupied | 14 (93.3%) | $150,833 |
| Renter-Occupied | 1 (6.7%) | $0 |
| Average | 15 (100.0%) | $150,625 |
Occupancy by Householder Income Bracket in Chelsea
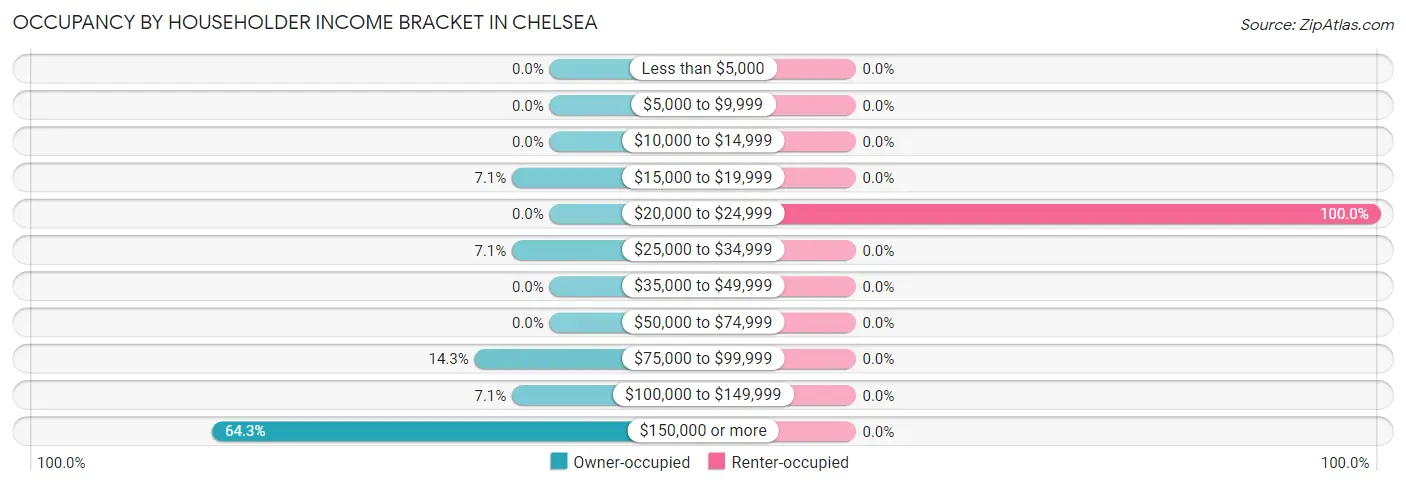
| Income Bracket | Owner-occupied | Renter-occupied |
| Less than $5,000 | 0 (0.0%) | 0 (0.0%) |
| $5,000 to $9,999 | 0 (0.0%) | 0 (0.0%) |
| $10,000 to $14,999 | 0 (0.0%) | 0 (0.0%) |
| $15,000 to $19,999 | 1 (7.1%) | 0 (0.0%) |
| $20,000 to $24,999 | 0 (0.0%) | 1 (100.0%) |
| $25,000 to $34,999 | 1 (7.1%) | 0 (0.0%) |
| $35,000 to $49,999 | 0 (0.0%) | 0 (0.0%) |
| $50,000 to $74,999 | 0 (0.0%) | 0 (0.0%) |
| $75,000 to $99,999 | 2 (14.3%) | 0 (0.0%) |
| $100,000 to $149,999 | 1 (7.1%) | 0 (0.0%) |
| $150,000 or more | 9 (64.3%) | 0 (0.0%) |
| Total | 14 (100.0%) | 1 (100.0%) |
Monthly Housing Cost Tiers in Chelsea
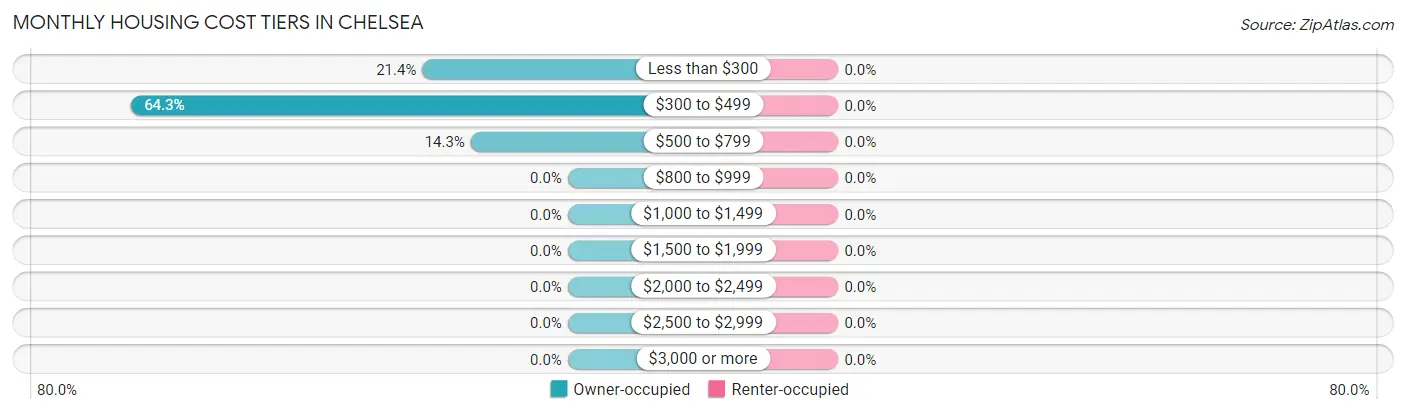
| Monthly Cost | Owner-occupied | Renter-occupied |
| Less than $300 | 3 (21.4%) | 0 (0.0%) |
| $300 to $499 | 9 (64.3%) | 0 (0.0%) |
| $500 to $799 | 2 (14.3%) | 0 (0.0%) |
| $800 to $999 | 0 (0.0%) | 0 (0.0%) |
| $1,000 to $1,499 | 0 (0.0%) | 0 (0.0%) |
| $1,500 to $1,999 | 0 (0.0%) | 0 (0.0%) |
| $2,000 to $2,499 | 0 (0.0%) | 0 (0.0%) |
| $2,500 to $2,999 | 0 (0.0%) | 0 (0.0%) |
| $3,000 or more | 0 (0.0%) | 0 (0.0%) |
| Total | 14 (100.0%) | 1 (100.0%) |
Physical Housing Characteristics in Chelsea
Housing Structures in Chelsea
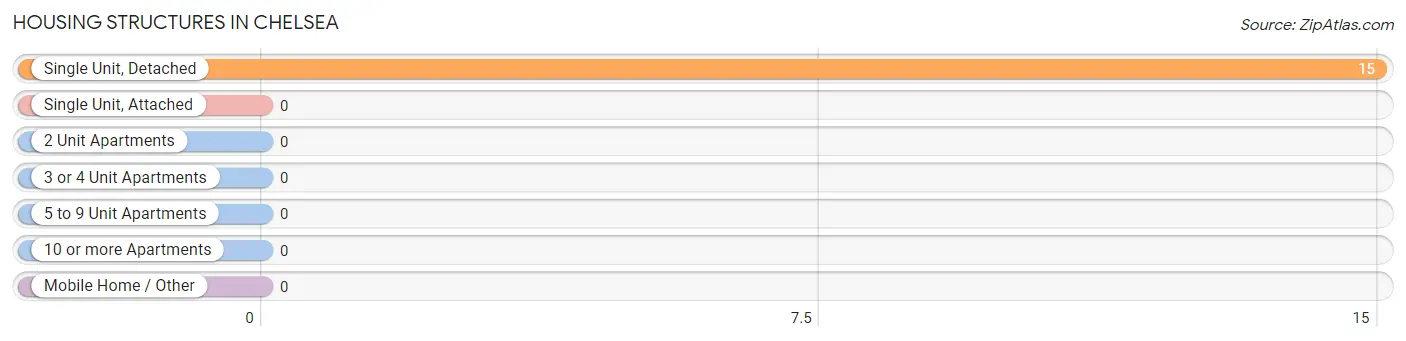
| Structure Type | # Housing Units | % Housing Units |
| Single Unit, Detached | 15 | 100.0% |
| Single Unit, Attached | 0 | 0.0% |
| 2 Unit Apartments | 0 | 0.0% |
| 3 or 4 Unit Apartments | 0 | 0.0% |
| 5 to 9 Unit Apartments | 0 | 0.0% |
| 10 or more Apartments | 0 | 0.0% |
| Mobile Home / Other | 0 | 0.0% |
| Total | 15 | 100.0% |
Housing Structures by Occupancy in Chelsea
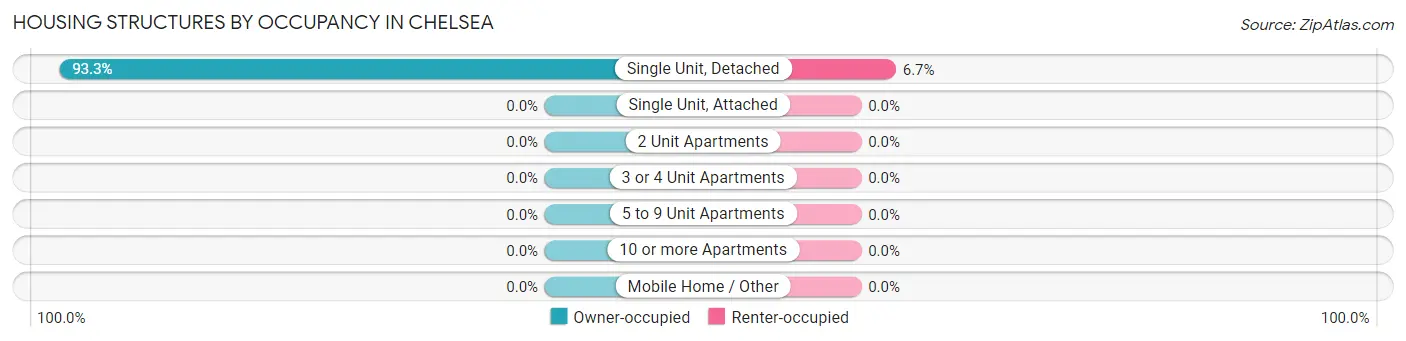
| Structure Type | Owner-occupied | Renter-occupied |
| Single Unit, Detached | 14 (93.3%) | 1 (6.7%) |
| Single Unit, Attached | 0 (0.0%) | 0 (0.0%) |
| 2 Unit Apartments | 0 (0.0%) | 0 (0.0%) |
| 3 or 4 Unit Apartments | 0 (0.0%) | 0 (0.0%) |
| 5 to 9 Unit Apartments | 0 (0.0%) | 0 (0.0%) |
| 10 or more Apartments | 0 (0.0%) | 0 (0.0%) |
| Mobile Home / Other | 0 (0.0%) | 0 (0.0%) |
| Total | 14 (93.3%) | 1 (6.7%) |
Housing Structures by Number of Rooms in Chelsea
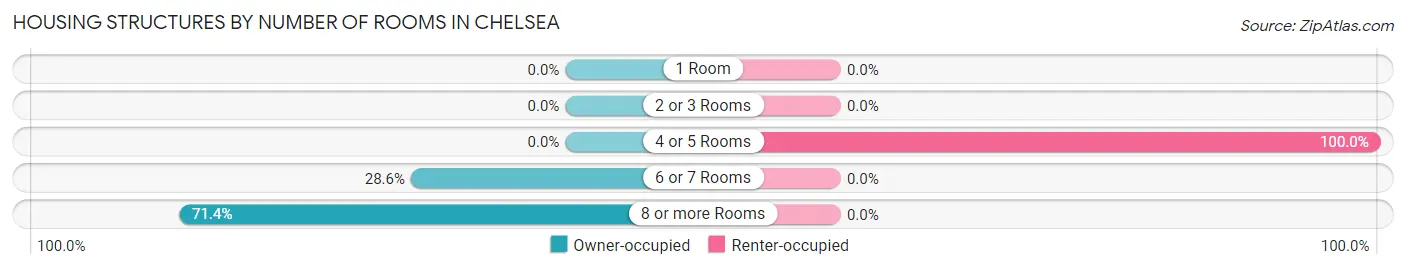
| Number of Rooms | Owner-occupied | Renter-occupied |
| 1 Room | 0 (0.0%) | 0 (0.0%) |
| 2 or 3 Rooms | 0 (0.0%) | 0 (0.0%) |
| 4 or 5 Rooms | 0 (0.0%) | 1 (100.0%) |
| 6 or 7 Rooms | 4 (28.6%) | 0 (0.0%) |
| 8 or more Rooms | 10 (71.4%) | 0 (0.0%) |
| Total | 14 (100.0%) | 1 (100.0%) |
Housing Structure by Heating Type in Chelsea
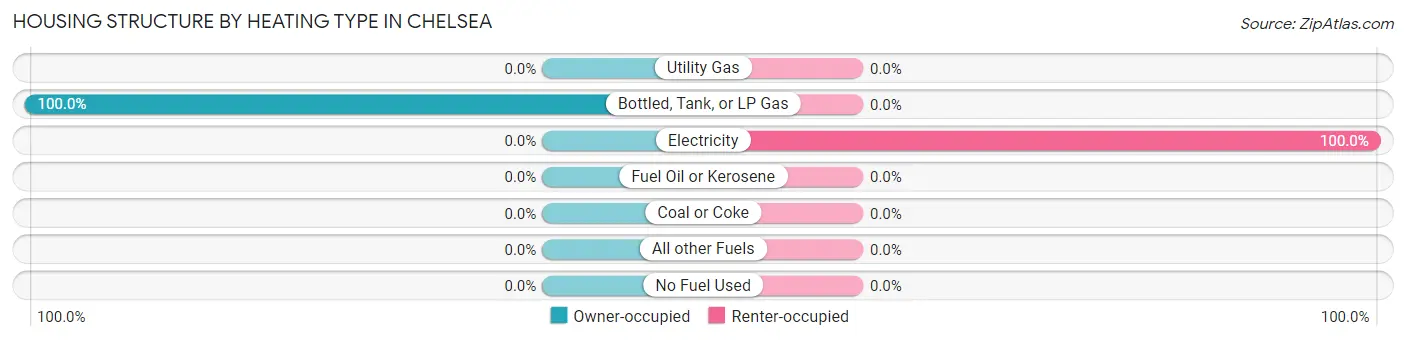
| Heating Type | Owner-occupied | Renter-occupied |
| Utility Gas | 0 (0.0%) | 0 (0.0%) |
| Bottled, Tank, or LP Gas | 14 (100.0%) | 0 (0.0%) |
| Electricity | 0 (0.0%) | 1 (100.0%) |
| Fuel Oil or Kerosene | 0 (0.0%) | 0 (0.0%) |
| Coal or Coke | 0 (0.0%) | 0 (0.0%) |
| All other Fuels | 0 (0.0%) | 0 (0.0%) |
| No Fuel Used | 0 (0.0%) | 0 (0.0%) |
| Total | 14 (100.0%) | 1 (100.0%) |
Household Vehicle Usage in Chelsea
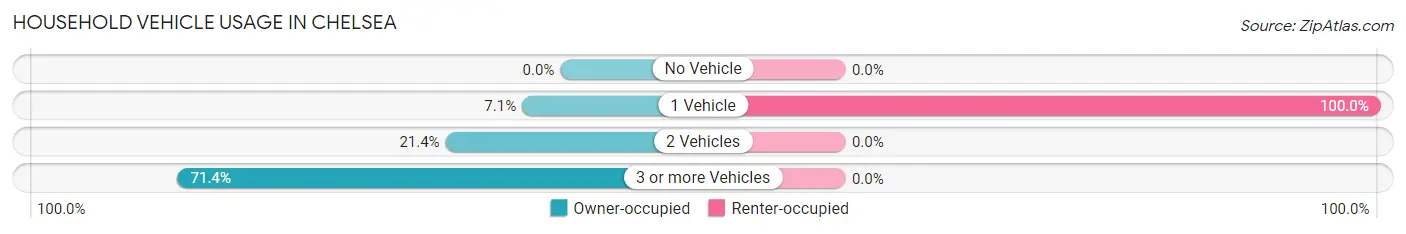
| Vehicles per Household | Owner-occupied | Renter-occupied |
| No Vehicle | 0 (0.0%) | 0 (0.0%) |
| 1 Vehicle | 1 (7.1%) | 1 (100.0%) |
| 2 Vehicles | 3 (21.4%) | 0 (0.0%) |
| 3 or more Vehicles | 10 (71.4%) | 0 (0.0%) |
| Total | 14 (100.0%) | 1 (100.0%) |
Real Estate & Mortgages in Chelsea
Real Estate and Mortgage Overview in Chelsea
| Characteristic | Without Mortgage | With Mortgage |
| Housing Units | 14 | 0 |
| Median Property Value | $45,000 | $0 |
| Median Household Income | $150,833 | $0 |
| Monthly Housing Costs | $429 | $0 |
| Real Estate Taxes | $300 | $0 |
Property Value by Mortgage Status in Chelsea
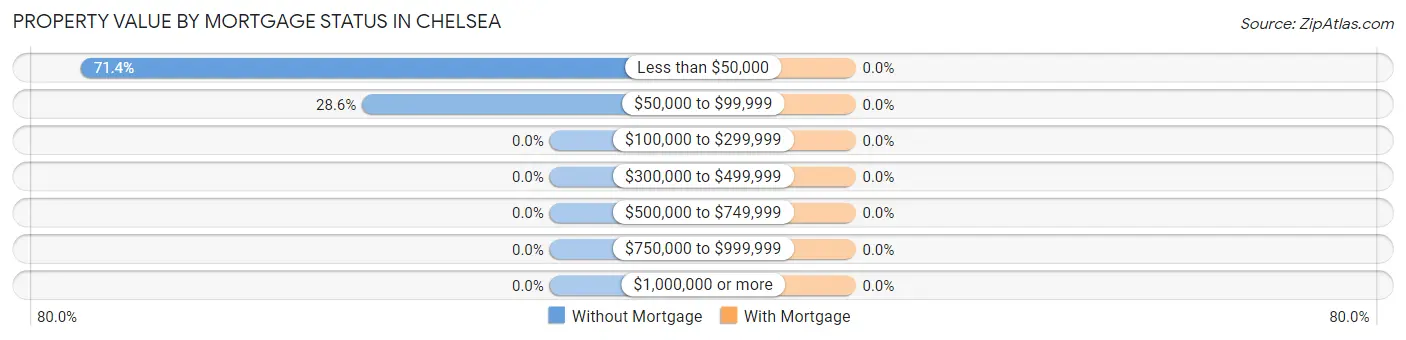
| Property Value | Without Mortgage | With Mortgage |
| Less than $50,000 | 10 (71.4%) | 0 (0.0%) |
| $50,000 to $99,999 | 4 (28.6%) | 0 (0.0%) |
| $100,000 to $299,999 | 0 (0.0%) | 0 (0.0%) |
| $300,000 to $499,999 | 0 (0.0%) | 0 (0.0%) |
| $500,000 to $749,999 | 0 (0.0%) | 0 (0.0%) |
| $750,000 to $999,999 | 0 (0.0%) | 0 (0.0%) |
| $1,000,000 or more | 0 (0.0%) | 0 (0.0%) |
| Total | 14 (100.0%) | 0 (0.0%) |
Household Income by Mortgage Status in Chelsea
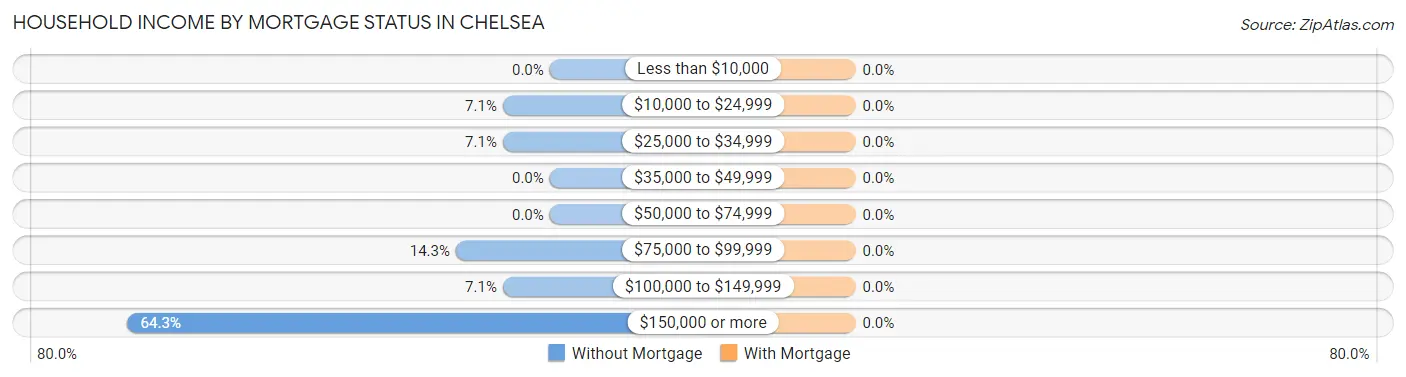
| Household Income | Without Mortgage | With Mortgage |
| Less than $10,000 | 0 (0.0%) | 0 (0.0%) |
| $10,000 to $24,999 | 1 (7.1%) | 0 (0.0%) |
| $25,000 to $34,999 | 1 (7.1%) | 0 (0.0%) |
| $35,000 to $49,999 | 0 (0.0%) | 0 (0.0%) |
| $50,000 to $74,999 | 0 (0.0%) | 0 (0.0%) |
| $75,000 to $99,999 | 2 (14.3%) | 0 (0.0%) |
| $100,000 to $149,999 | 1 (7.1%) | 0 (0.0%) |
| $150,000 or more | 9 (64.3%) | 0 (0.0%) |
| Total | 14 (100.0%) | 0 (0.0%) |
Property Value to Household Income Ratio in Chelsea
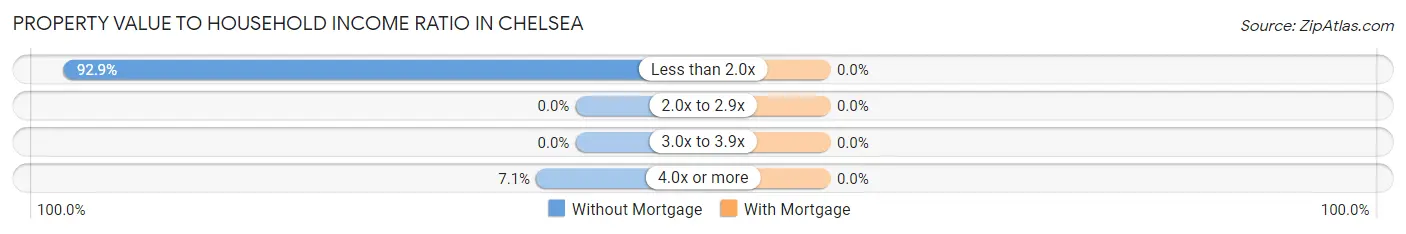
| Value-to-Income Ratio | Without Mortgage | With Mortgage |
| Less than 2.0x | 13 (92.9%) | 0 (0.0%) |
| 2.0x to 2.9x | 0 (0.0%) | 0 (0.0%) |
| 3.0x to 3.9x | 0 (0.0%) | 0 (0.0%) |
| 4.0x or more | 1 (7.1%) | 0 (0.0%) |
| Total | 14 (100.0%) | 0 (0.0%) |
Real Estate Taxes by Mortgage Status in Chelsea
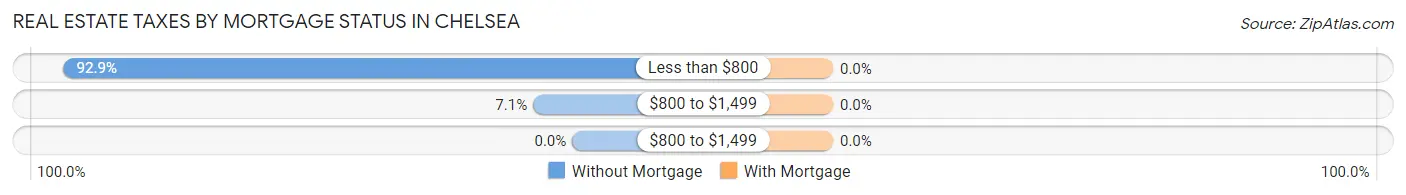
| Property Taxes | Without Mortgage | With Mortgage |
| Less than $800 | 13 (92.9%) | 0 (0.0%) |
| $800 to $1,499 | 1 (7.1%) | 0 (0.0%) |
| $800 to $1,499 | 0 (0.0%) | 0 (0.0%) |
| Total | 14 (100.0%) | 0 (0.0%) |
Health & Disability in Chelsea
Health Insurance Coverage by Age in Chelsea
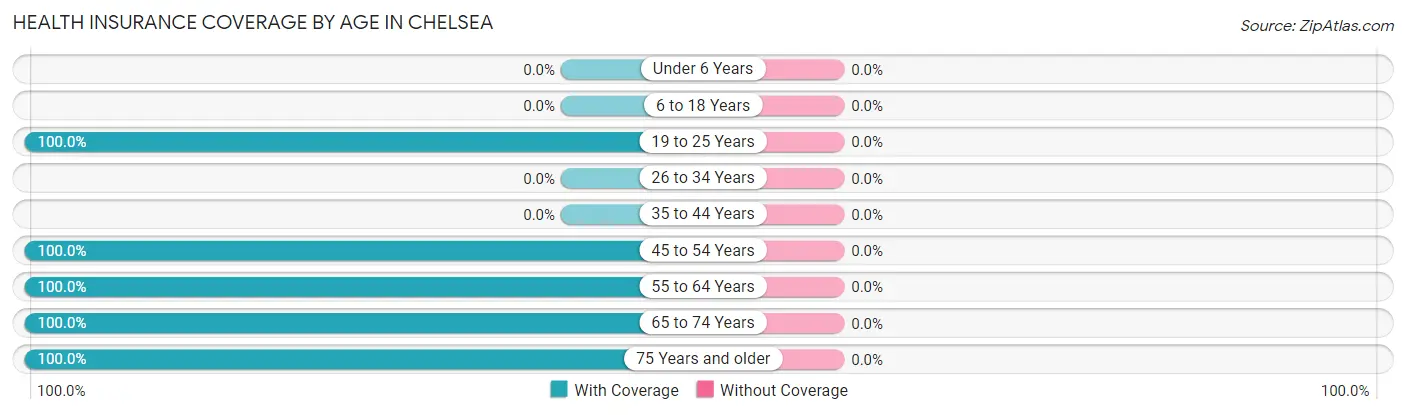
| Age Bracket | With Coverage | Without Coverage |
| Under 6 Years | 0 (0.0%) | 0 (0.0%) |
| 6 to 18 Years | 0 (0.0%) | 0 (0.0%) |
| 19 to 25 Years | 28 (100.0%) | 0 (0.0%) |
| 26 to 34 Years | 0 (0.0%) | 0 (0.0%) |
| 35 to 44 Years | 0 (0.0%) | 0 (0.0%) |
| 45 to 54 Years | 6 (100.0%) | 0 (0.0%) |
| 55 to 64 Years | 8 (100.0%) | 0 (0.0%) |
| 65 to 74 Years | 8 (100.0%) | 0 (0.0%) |
| 75 Years and older | 6 (100.0%) | 0 (0.0%) |
| Total | 56 (100.0%) | 0 (0.0%) |
Health Insurance Coverage by Citizenship Status in Chelsea
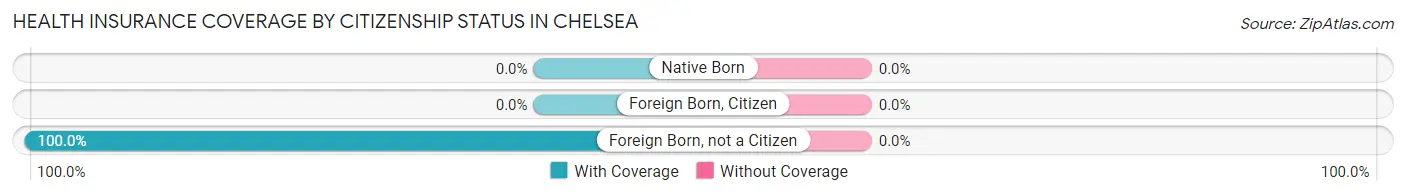
| Citizenship Status | With Coverage | Without Coverage |
| Native Born | 0 (0.0%) | 0 (0.0%) |
| Foreign Born, Citizen | 0 (0.0%) | 0 (0.0%) |
| Foreign Born, not a Citizen | 28 (100.0%) | 0 (0.0%) |
Health Insurance Coverage by Household Income in Chelsea
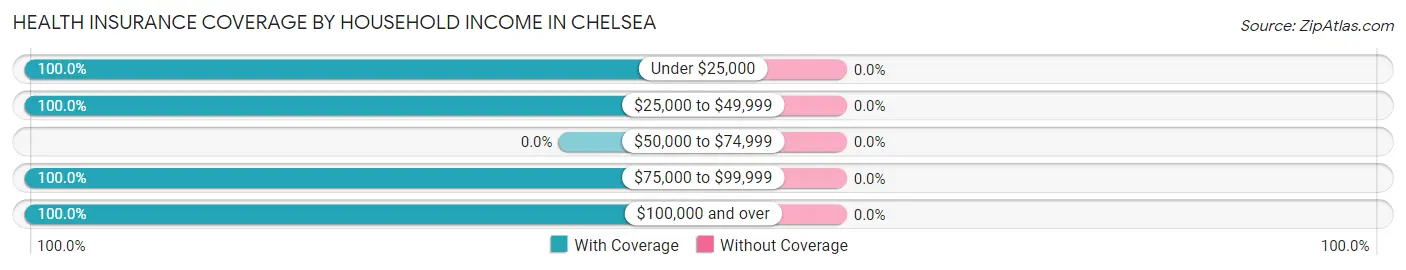
| Household Income | With Coverage | Without Coverage |
| Under $25,000 | 3 (100.0%) | 0 (0.0%) |
| $25,000 to $49,999 | 1 (100.0%) | 0 (0.0%) |
| $50,000 to $74,999 | 0 (0.0%) | 0 (0.0%) |
| $75,000 to $99,999 | 4 (100.0%) | 0 (0.0%) |
| $100,000 and over | 48 (100.0%) | 0 (0.0%) |
Public vs Private Health Insurance Coverage by Age in Chelsea
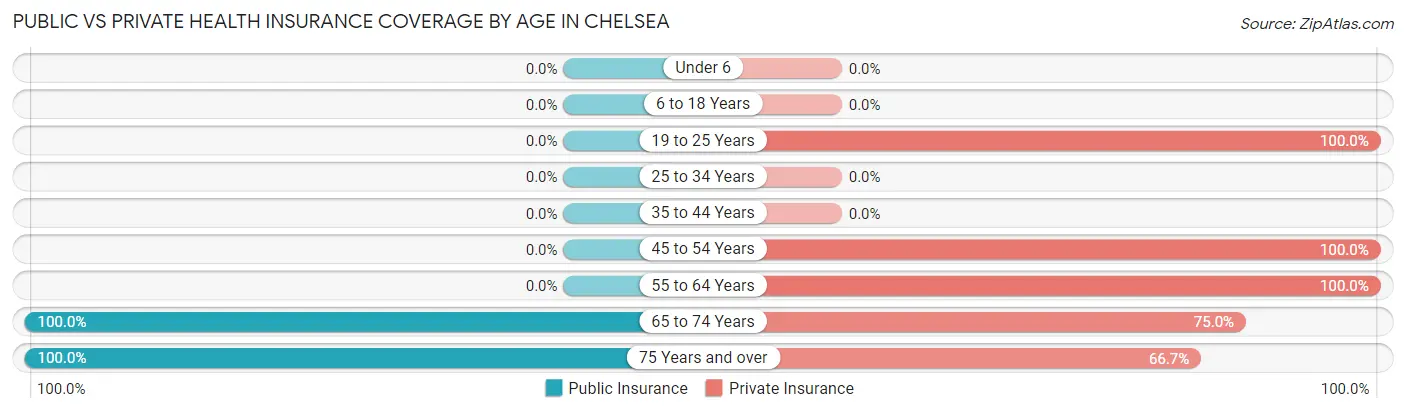
| Age Bracket | Public Insurance | Private Insurance |
| Under 6 | 0 (0.0%) | 0 (0.0%) |
| 6 to 18 Years | 0 (0.0%) | 0 (0.0%) |
| 19 to 25 Years | 0 (0.0%) | 28 (100.0%) |
| 25 to 34 Years | 0 (0.0%) | 0 (0.0%) |
| 35 to 44 Years | 0 (0.0%) | 0 (0.0%) |
| 45 to 54 Years | 0 (0.0%) | 6 (100.0%) |
| 55 to 64 Years | 0 (0.0%) | 8 (100.0%) |
| 65 to 74 Years | 8 (100.0%) | 6 (75.0%) |
| 75 Years and over | 6 (100.0%) | 4 (66.7%) |
| Total | 14 (25.0%) | 52 (92.9%) |
Disability Status by Sex by Age in Chelsea
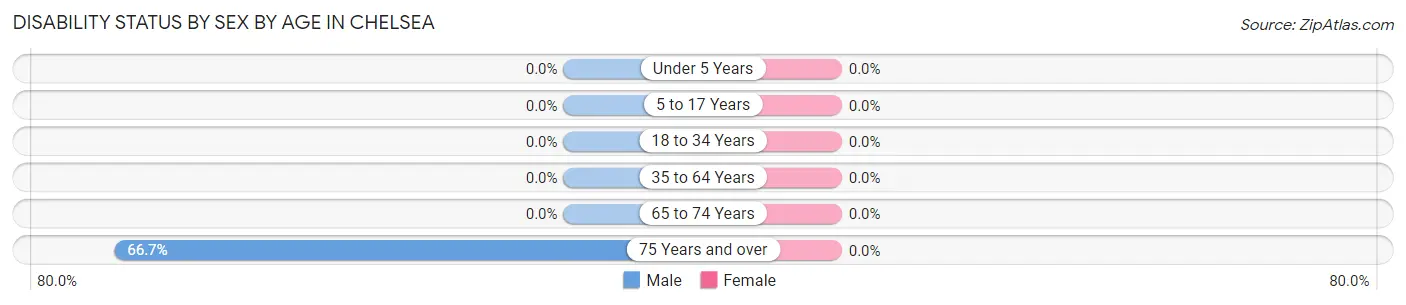
| Age Bracket | Male | Female |
| Under 5 Years | 0 (0.0%) | 0 (0.0%) |
| 5 to 17 Years | 0 (0.0%) | 0 (0.0%) |
| 18 to 34 Years | 0 (0.0%) | 0 (0.0%) |
| 35 to 64 Years | 0 (0.0%) | 0 (0.0%) |
| 65 to 74 Years | 0 (0.0%) | 0 (0.0%) |
| 75 Years and over | 2 (66.7%) | 0 (0.0%) |
Disability Class by Sex by Age in Chelsea
Disability Class: Hearing Difficulty

| Age Bracket | Male | Female |
| Under 5 Years | 0 (0.0%) | 0 (0.0%) |
| 5 to 17 Years | 0 (0.0%) | 0 (0.0%) |
| 18 to 34 Years | 0 (0.0%) | 0 (0.0%) |
| 35 to 64 Years | 0 (0.0%) | 0 (0.0%) |
| 65 to 74 Years | 0 (0.0%) | 0 (0.0%) |
| 75 Years and over | 2 (66.7%) | 0 (0.0%) |
Disability Class: Vision Difficulty
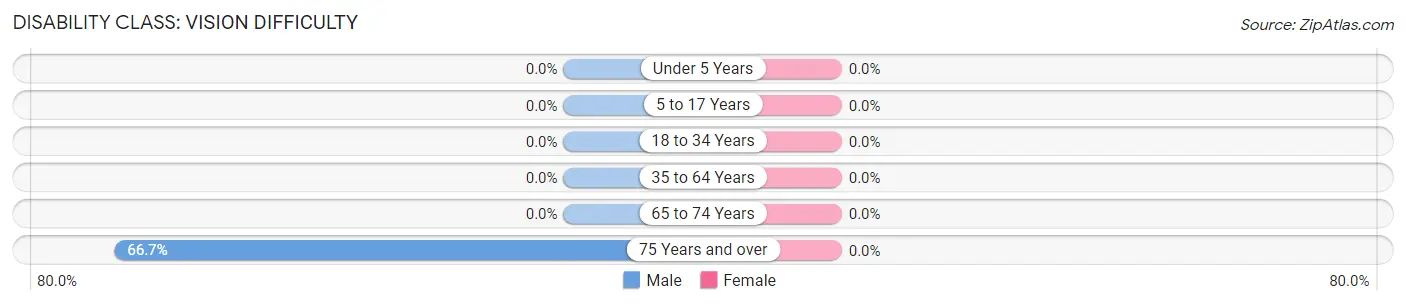
| Age Bracket | Male | Female |
| Under 5 Years | 0 (0.0%) | 0 (0.0%) |
| 5 to 17 Years | 0 (0.0%) | 0 (0.0%) |
| 18 to 34 Years | 0 (0.0%) | 0 (0.0%) |
| 35 to 64 Years | 0 (0.0%) | 0 (0.0%) |
| 65 to 74 Years | 0 (0.0%) | 0 (0.0%) |
| 75 Years and over | 2 (66.7%) | 0 (0.0%) |
Disability Class: Cognitive Difficulty
| Age Bracket | Male | Female |
| 5 to 17 Years | 0 (0.0%) | 0 (0.0%) |
| 18 to 34 Years | 0 (0.0%) | 0 (0.0%) |
| 35 to 64 Years | 0 (0.0%) | 0 (0.0%) |
| 65 to 74 Years | 0 (0.0%) | 0 (0.0%) |
| 75 Years and over | 0 (0.0%) | 0 (0.0%) |
Disability Class: Ambulatory Difficulty
| Age Bracket | Male | Female |
| 5 to 17 Years | 0 (0.0%) | 0 (0.0%) |
| 18 to 34 Years | 0 (0.0%) | 0 (0.0%) |
| 35 to 64 Years | 0 (0.0%) | 0 (0.0%) |
| 65 to 74 Years | 0 (0.0%) | 0 (0.0%) |
| 75 Years and over | 0 (0.0%) | 0 (0.0%) |
Disability Class: Self-Care Difficulty
| Age Bracket | Male | Female |
| 5 to 17 Years | 0 (0.0%) | 0 (0.0%) |
| 18 to 34 Years | 0 (0.0%) | 0 (0.0%) |
| 35 to 64 Years | 0 (0.0%) | 0 (0.0%) |
| 65 to 74 Years | 0 (0.0%) | 0 (0.0%) |
| 75 Years and over | 0 (0.0%) | 0 (0.0%) |
Technology Access in Chelsea
Computing Device Access in Chelsea
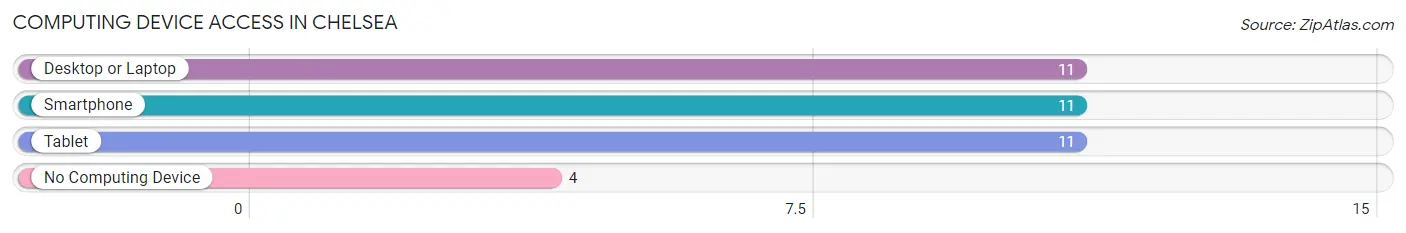
| Device Type | # Households | % Households |
| Desktop or Laptop | 11 | 73.3% |
| Smartphone | 11 | 73.3% |
| Tablet | 11 | 73.3% |
| No Computing Device | 4 | 26.7% |
| Total | 15 | 100.0% |
Internet Access in Chelsea
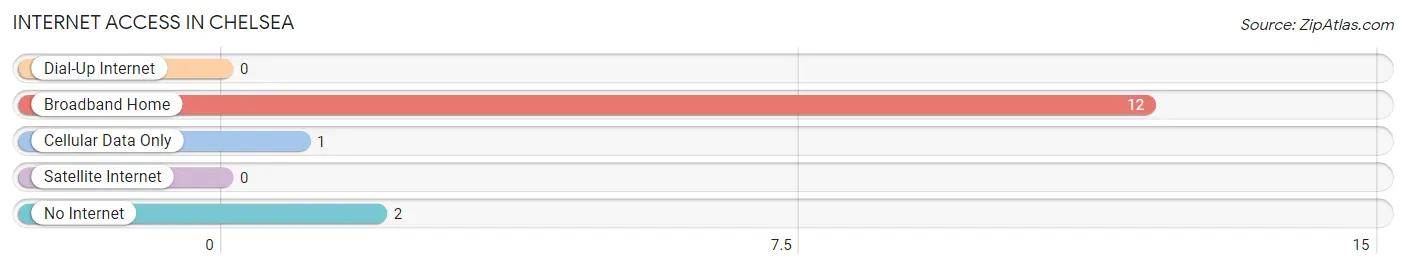
| Internet Type | # Households | % Households |
| Dial-Up Internet | 0 | 0.0% |
| Broadband Home | 12 | 80.0% |
| Cellular Data Only | 1 | 6.7% |
| Satellite Internet | 0 | 0.0% |
| No Internet | 2 | 13.3% |
| Total | 15 | 100.0% |
Chelsea Summary
Chelsea is a small town located in the southeastern corner of South Dakota, in the United States. It is situated in the southeastern corner of the state, near the border with Iowa and Minnesota. The town is located in the heart of the Great Plains, and is surrounded by rolling hills and prairies. The town is home to a population of approximately 500 people, and is part of the Sioux Falls metropolitan area.
History
The town of Chelsea was founded in 1881 by a group of settlers from the nearby town of Sioux Falls. The settlers were looking for a place to settle and farm, and chose the area due to its fertile soil and abundant water supply. The town was named after the daughter of one of the settlers, and was incorporated in 1883.
The town grew slowly over the years, and by the early 1900s had a population of around 500 people. The town was primarily an agricultural community, with most of the population engaged in farming and ranching. The town also had a few small businesses, including a general store, a blacksmith shop, and a hotel.
In the early 1900s, the town began to experience a period of growth and prosperity. The town was connected to the rest of the state by a railroad line, and the population began to grow. The town also began to attract new businesses, including a bank, a newspaper, and a movie theater.
Geography
Chelsea is located in the southeastern corner of South Dakota, near the border with Iowa and Minnesota. The town is situated in the heart of the Great Plains, and is surrounded by rolling hills and prairies. The town is located in the Sioux Falls metropolitan area, and is approximately 25 miles from the city of Sioux Falls.
The town is located in the Missouri River Valley, and is situated on the banks of the Big Sioux River. The town is located at an elevation of 1,400 feet, and has a total area of 0.6 square miles. The town is located in the Central Time Zone, and has a humid continental climate.
Economy
The economy of Chelsea is primarily based on agriculture and tourism. The town is home to several farms and ranches, and the surrounding area is used for growing crops such as corn, soybeans, and wheat. The town is also home to several small businesses, including a general store, a bank, and a newspaper.
The town is also a popular tourist destination, and is home to several attractions, including the Chelsea State Park, the Chelsea Historical Museum, and the Chelsea Country Club. The town is also home to several events, including the Chelsea Days Festival, the Chelsea Rodeo, and the Chelsea County Fair.
Demographics
As of the 2010 census, the town of Chelsea had a population of 498 people. The population is primarily white, with a small percentage of African Americans, Native Americans, and Hispanics. The median household income is $41,250, and the median home value is $117,000. The town has a high school graduation rate of 87%, and a poverty rate of 11%.
Common Questions
What is Per Capita Income in Chelsea?
Per Capita income in Chelsea is $62,509.
What is the Median Family Income in Chelsea?
Median Family Income in Chelsea is $151,042.
What is the Median Household income in Chelsea?
Median Household Income in Chelsea is $150,625.
What is Income or Wage Gap in Chelsea?
Income or Wage Gap in Chelsea is 66.7%.
Women in Chelsea earn 33.3 cents for every dollar earned by a man.
What is Inequality or Gini Index in Chelsea?
Inequality or Gini Index in Chelsea is 0.43.
What is the Total Population of Chelsea?
Total Population of Chelsea is 56.
What is the Total Male Population of Chelsea?
Total Male Population of Chelsea is 42.
What is the Total Female Population of Chelsea?
Total Female Population of Chelsea is 14.
What is the Ratio of Males per 100 Females in Chelsea?
There are 300.00 Males per 100 Females in Chelsea.
What is the Ratio of Females per 100 Males in Chelsea?
There are 33.33 Females per 100 Males in Chelsea.
What is the Median Population Age in Chelsea?
Median Population Age in Chelsea is 36.5 Years.
What is the Average Family Size in Chelsea
Average Family Size in Chelsea is 4.2 People.
What is the Average Household Size in Chelsea
Average Household Size in Chelsea is 3.7 People.
How Large is the Labor Force in Chelsea?
There are 37 People in the Labor Forcein in Chelsea.
What is the Percentage of People in the Labor Force in Chelsea?
66.1% of People are in the Labor Force in Chelsea.