Greensboro, AL Map & Demographics
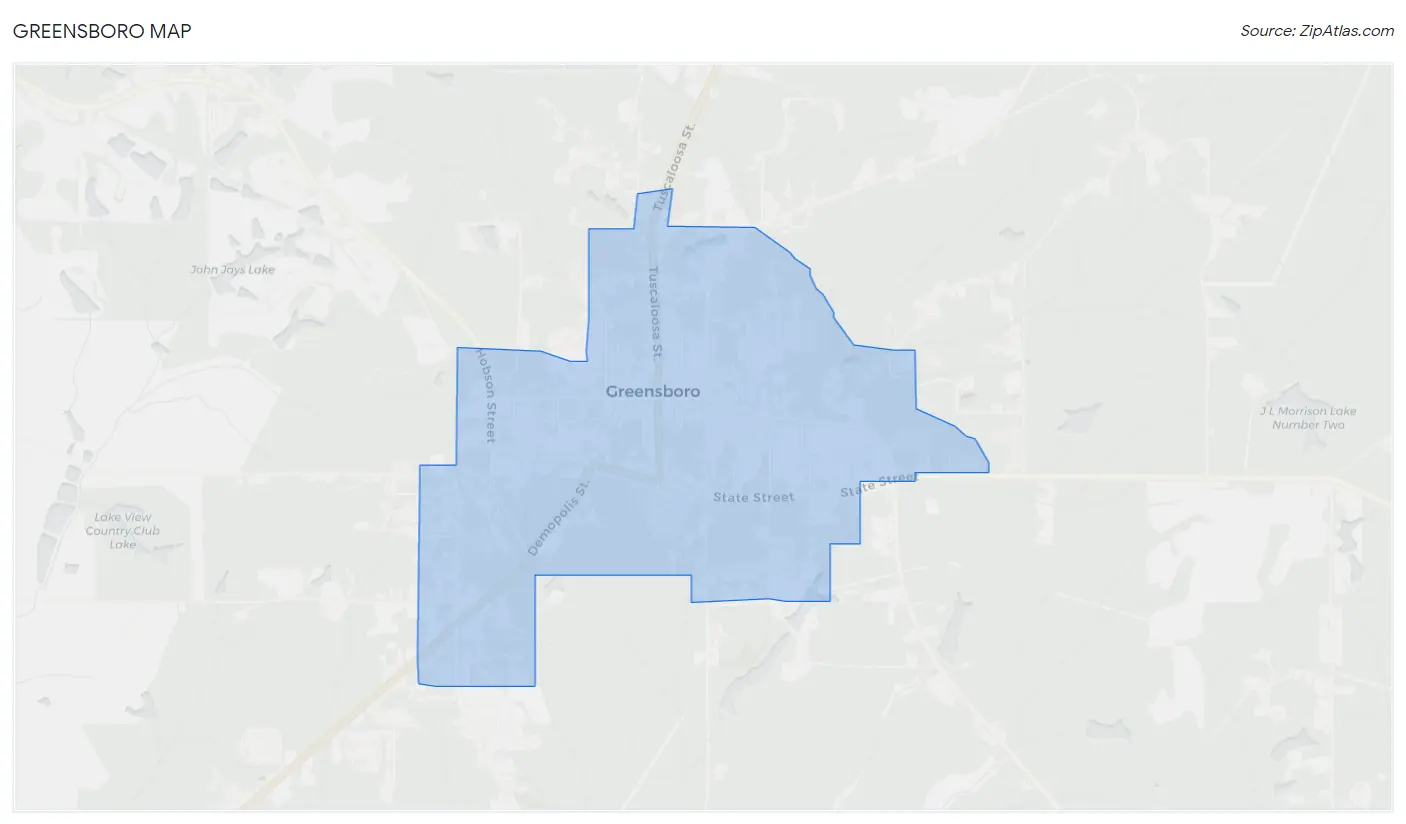
Greensboro Map
Greensboro Overview
$16,852
PER CAPITA INCOME
$41,159
AVG FAMILY INCOME
$24,820
AVG HOUSEHOLD INCOME
0.41
INEQUALITY / GINI INDEX
2,417
TOTAL POPULATION
1,084
MALE POPULATION
1,333
FEMALE POPULATION
81.32
MALES / 100 FEMALES
122.97
FEMALES / 100 MALES
36.9
MEDIAN AGE
3.8
AVG FAMILY SIZE
2.4
AVG HOUSEHOLD SIZE
970
LABOR FORCE [ PEOPLE ]
49.1%
PERCENT IN LABOR FORCE
9.7%
UNEMPLOYMENT RATE
Greensboro Zip Codes
Greensboro Area Codes
Income in Greensboro
Income Overview in Greensboro
Per Capita Income in Greensboro is $16,852, while median incomes of families and households are $41,159 and $24,820 respectively.
| Characteristic | Number | Measure |
| Per Capita Income | 2,417 | $16,852 |
| Median Family Income | 436 | $41,159 |
| Mean Family Income | 436 | $51,433 |
| Median Household Income | 961 | $24,820 |
| Mean Household Income | 961 | $36,066 |
| Income Deficit | 436 | $0 |
| Wage / Income Gap (%) | 2,417 | 0.00% |
| Wage / Income Gap ($) | 2,417 | 100.00¢ per $1 |
| Gini / Inequality Index | 2,417 | 0.41 |
Earnings by Sex in Greensboro
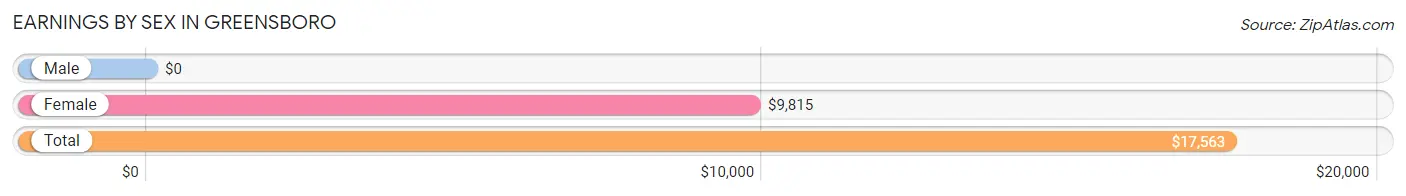
| Sex | Number | Average Earnings |
| Male | 474 (46.4%) | $0 |
| Female | 547 (53.6%) | $9,815 |
| Total | 1,021 (100.0%) | $17,563 |
Earnings by Sex by Income Bracket in Greensboro
The most common earnings brackets in Greensboro are $35,000 to $39,999 for men (109 | 23.0%) and $7,500 to $9,999 for women (236 | 43.1%).
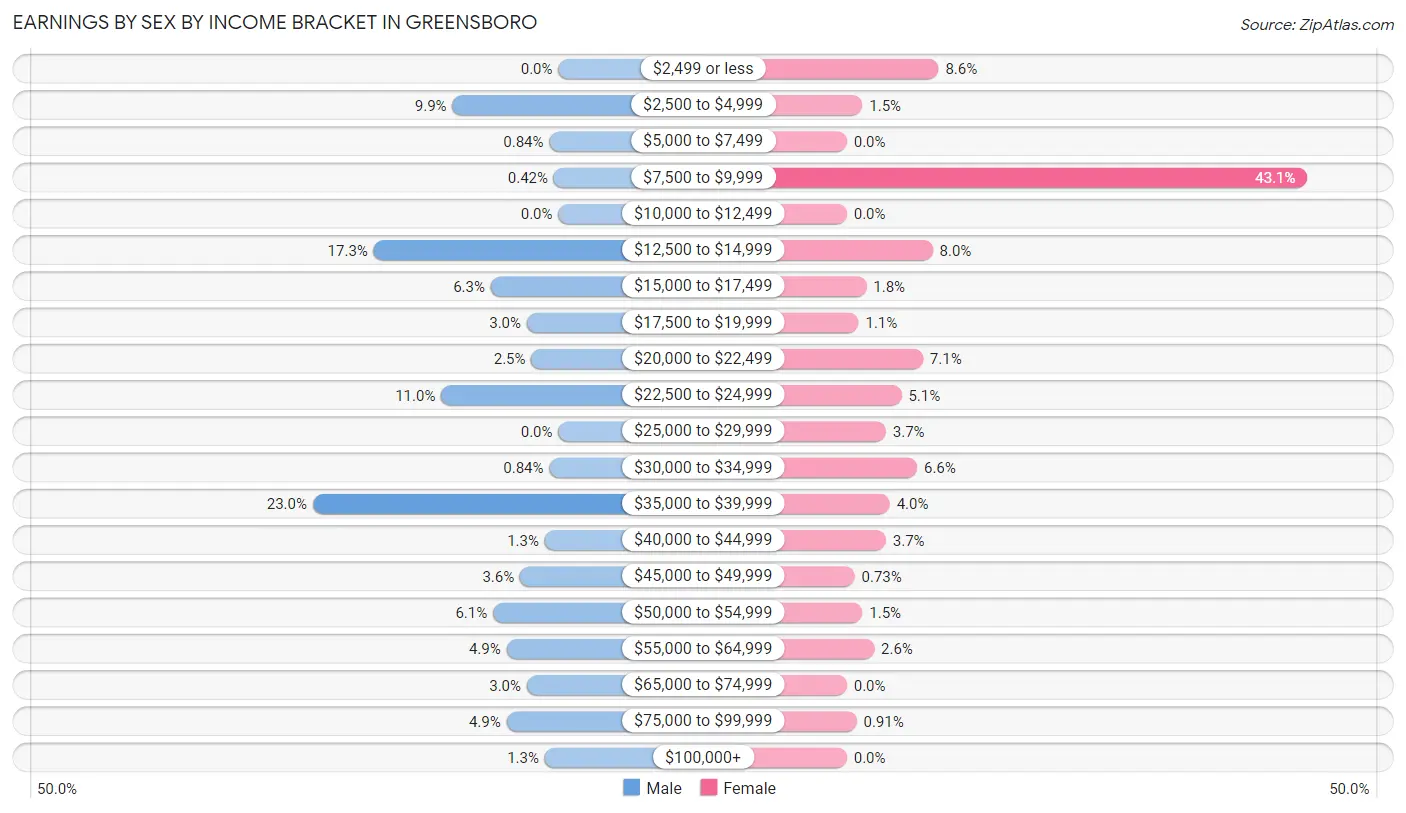
| Income | Male | Female |
| $2,499 or less | 0 (0.0%) | 47 (8.6%) |
| $2,500 to $4,999 | 47 (9.9%) | 8 (1.5%) |
| $5,000 to $7,499 | 4 (0.8%) | 0 (0.0%) |
| $7,500 to $9,999 | 2 (0.4%) | 236 (43.1%) |
| $10,000 to $12,499 | 0 (0.0%) | 0 (0.0%) |
| $12,500 to $14,999 | 82 (17.3%) | 44 (8.0%) |
| $15,000 to $17,499 | 30 (6.3%) | 10 (1.8%) |
| $17,500 to $19,999 | 14 (2.9%) | 6 (1.1%) |
| $20,000 to $22,499 | 12 (2.5%) | 39 (7.1%) |
| $22,500 to $24,999 | 52 (11.0%) | 28 (5.1%) |
| $25,000 to $29,999 | 0 (0.0%) | 20 (3.7%) |
| $30,000 to $34,999 | 4 (0.8%) | 36 (6.6%) |
| $35,000 to $39,999 | 109 (23.0%) | 22 (4.0%) |
| $40,000 to $44,999 | 6 (1.3%) | 20 (3.7%) |
| $45,000 to $49,999 | 17 (3.6%) | 4 (0.7%) |
| $50,000 to $54,999 | 29 (6.1%) | 8 (1.5%) |
| $55,000 to $64,999 | 23 (4.9%) | 14 (2.6%) |
| $65,000 to $74,999 | 14 (2.9%) | 0 (0.0%) |
| $75,000 to $99,999 | 23 (4.9%) | 5 (0.9%) |
| $100,000+ | 6 (1.3%) | 0 (0.0%) |
| Total | 474 (100.0%) | 547 (100.0%) |
Earnings by Sex by Educational Attainment in Greensboro
Average earnings in Greensboro are $37,901 for men and $13,778 for women, a difference of 63.6%. Men with an educational attainment of graduate degree enjoy the highest average annual earnings of $71,875, while those with less than high school education earn the least with $14,101. Women with an educational attainment of bachelor's degree earn the most with the average annual earnings of $39,167, while those with less than high school education have the smallest earnings of $8,858.
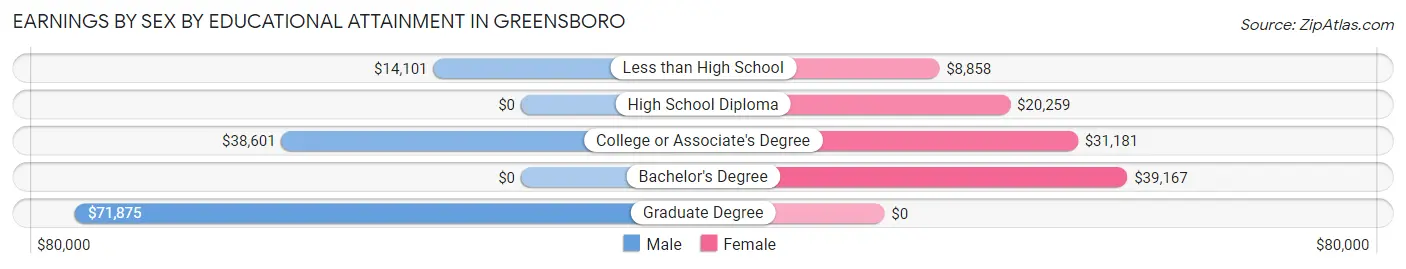
| Educational Attainment | Male Income | Female Income |
| Less than High School | $14,101 | $8,858 |
| High School Diploma | - | - |
| College or Associate's Degree | $38,601 | $31,181 |
| Bachelor's Degree | - | - |
| Graduate Degree | $71,875 | $0 |
| Total | $37,901 | $13,778 |
Family Income in Greensboro
Family Income Brackets in Greensboro
According to the Greensboro family income data, there are 109 families falling into the $25,000 to $34,999 income range, which is the most common income bracket and makes up 25.0% of all families.
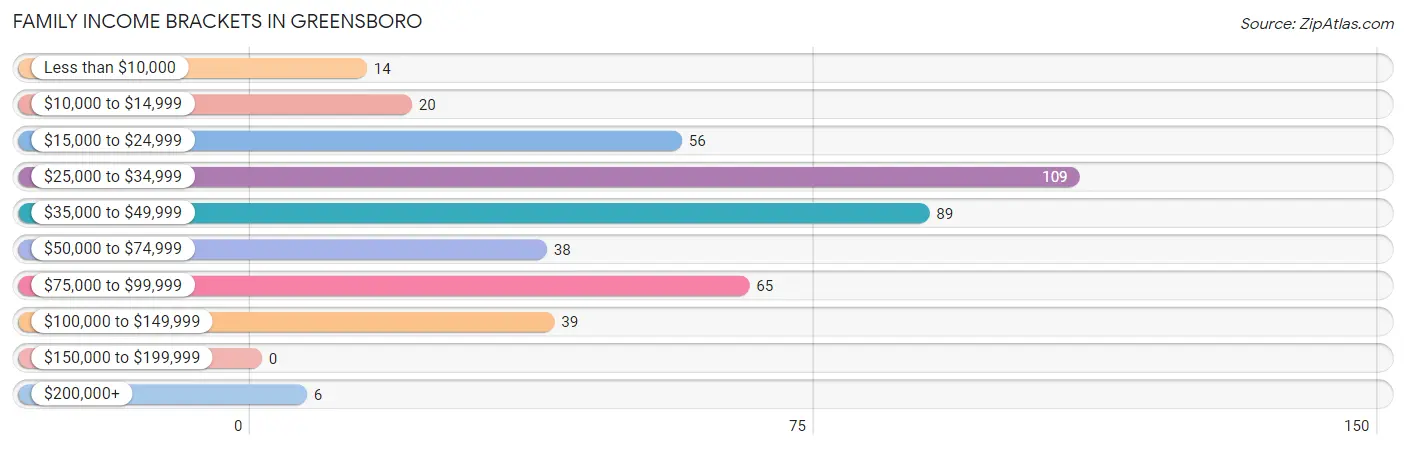
| Income Bracket | # Families | % Families |
| Less than $10,000 | 14 | 3.2% |
| $10,000 to $14,999 | 20 | 4.6% |
| $15,000 to $24,999 | 56 | 12.8% |
| $25,000 to $34,999 | 109 | 25.0% |
| $35,000 to $49,999 | 89 | 20.4% |
| $50,000 to $74,999 | 38 | 8.7% |
| $75,000 to $99,999 | 65 | 14.9% |
| $100,000 to $149,999 | 39 | 8.9% |
| $150,000 to $199,999 | 0 | 0.0% |
| $200,000+ | 6 | 1.4% |
Family Income by Famaliy Size in Greensboro
2-person families (290 | 66.5%) account for the highest median family income in Greensboro with $41,667 per family, while 2-person families (290 | 66.5%) have the highest median income of $20,834 per family member.
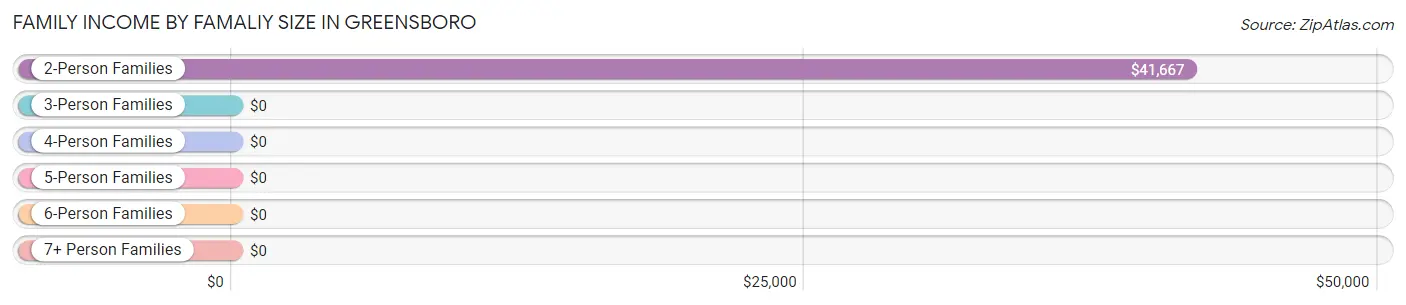
| Income Bracket | # Families | Median Income |
| 2-Person Families | 290 (66.5%) | $41,667 |
| 3-Person Families | 36 (8.3%) | $0 |
| 4-Person Families | 63 (14.4%) | $0 |
| 5-Person Families | 13 (3.0%) | $0 |
| 6-Person Families | 34 (7.8%) | $0 |
| 7+ Person Families | 0 (0.0%) | $0 |
| Total | 436 (100.0%) | $41,159 |
Family Income by Number of Earners in Greensboro
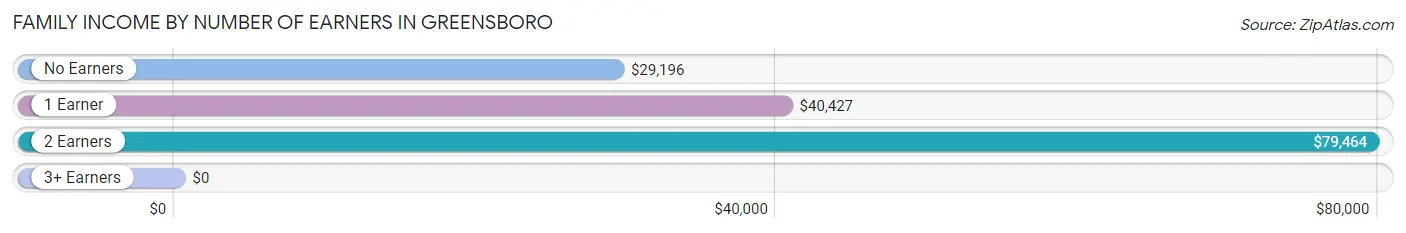
| Number of Earners | # Families | Median Income |
| No Earners | 142 (32.6%) | $29,196 |
| 1 Earner | 164 (37.6%) | $40,427 |
| 2 Earners | 87 (20.0%) | $79,464 |
| 3+ Earners | 43 (9.9%) | $0 |
| Total | 436 (100.0%) | $41,159 |
Household Income in Greensboro
Household Income Brackets in Greensboro
With 284 households falling in the category, the $15,000 to $24,999 income range is the most frequent in Greensboro, accounting for 29.5% of all households.
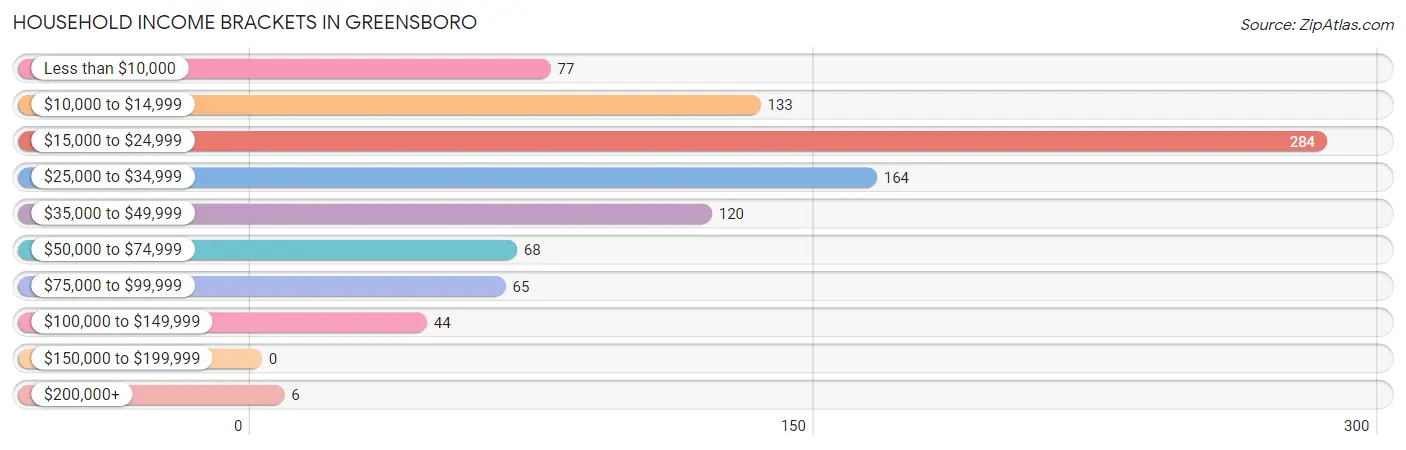
| Income Bracket | # Households | % Households |
| Less than $10,000 | 77 | 8.0% |
| $10,000 to $14,999 | 133 | 13.8% |
| $15,000 to $24,999 | 284 | 29.6% |
| $25,000 to $34,999 | 164 | 17.1% |
| $35,000 to $49,999 | 120 | 12.5% |
| $50,000 to $74,999 | 68 | 7.1% |
| $75,000 to $99,999 | 65 | 6.8% |
| $100,000 to $149,999 | 44 | 4.6% |
| $150,000 to $199,999 | 0 | 0.0% |
| $200,000+ | 6 | 0.6% |
Household Income by Householder Age in Greensboro
The median household income in Greensboro is $24,820, with the highest median household income of $41,019 found in the 45 to 64 years age bracket for the primary householder. A total of 268 households (27.9%) fall into this category. Meanwhile, the 15 to 24 years age bracket for the primary householder has the lowest median household income of $0, with 4 households (0.4%) in this group.
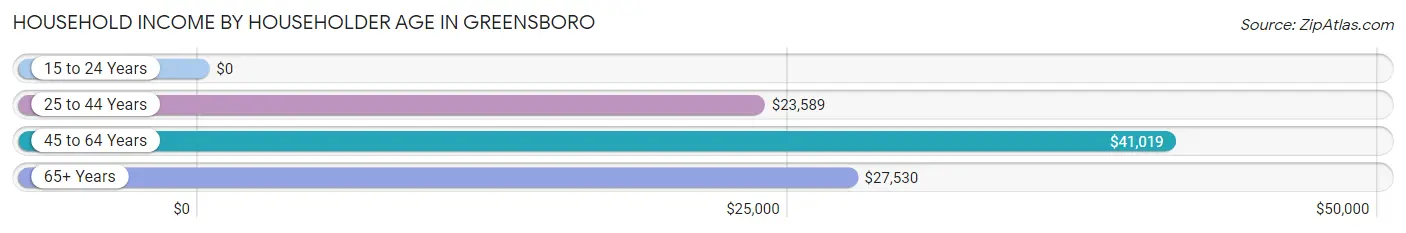
| Income Bracket | # Households | Median Income |
| 15 to 24 Years | 4 (0.4%) | $0 |
| 25 to 44 Years | 306 (31.8%) | $23,589 |
| 45 to 64 Years | 268 (27.9%) | $41,019 |
| 65+ Years | 383 (39.9%) | $27,530 |
| Total | 961 (100.0%) | $24,820 |
Poverty in Greensboro
Income Below Poverty by Sex and Age in Greensboro
With 31.0% poverty level for males and 34.5% for females among the residents of Greensboro, 16 and 17 year old males and 5 year old females are the most vulnerable to poverty, with 34 males (100.0%) and 40 females (100.0%) in their respective age groups living below the poverty level.
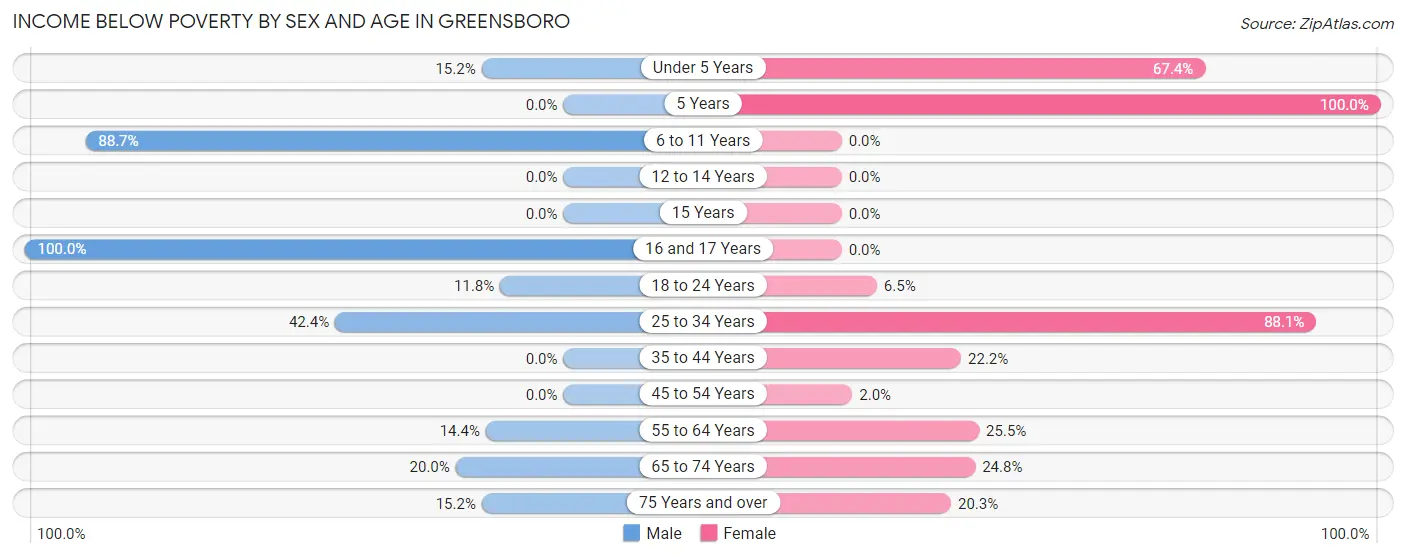
| Age Bracket | Male | Female |
| Under 5 Years | 12 (15.2%) | 29 (67.4%) |
| 5 Years | 0 (0.0%) | 40 (100.0%) |
| 6 to 11 Years | 118 (88.7%) | 0 (0.0%) |
| 12 to 14 Years | 0 (0.0%) | 0 (0.0%) |
| 15 Years | 0 (0.0%) | 0 (0.0%) |
| 16 and 17 Years | 34 (100.0%) | 0 (0.0%) |
| 18 to 24 Years | 10 (11.8%) | 6 (6.5%) |
| 25 to 34 Years | 103 (42.4%) | 199 (88.0%) |
| 35 to 44 Years | 0 (0.0%) | 33 (22.2%) |
| 45 to 54 Years | 0 (0.0%) | 2 (2.0%) |
| 55 to 64 Years | 17 (14.4%) | 51 (25.5%) |
| 65 to 74 Years | 23 (20.0%) | 53 (24.8%) |
| 75 Years and over | 5 (15.1%) | 29 (20.3%) |
| Total | 322 (31.0%) | 442 (34.5%) |
Income Above Poverty by Sex and Age in Greensboro
According to the poverty statistics in Greensboro, males aged 12 to 14 years and females aged 6 to 11 years are the age groups that are most secure financially, with 100.0% of males and 100.0% of females in these age groups living above the poverty line.
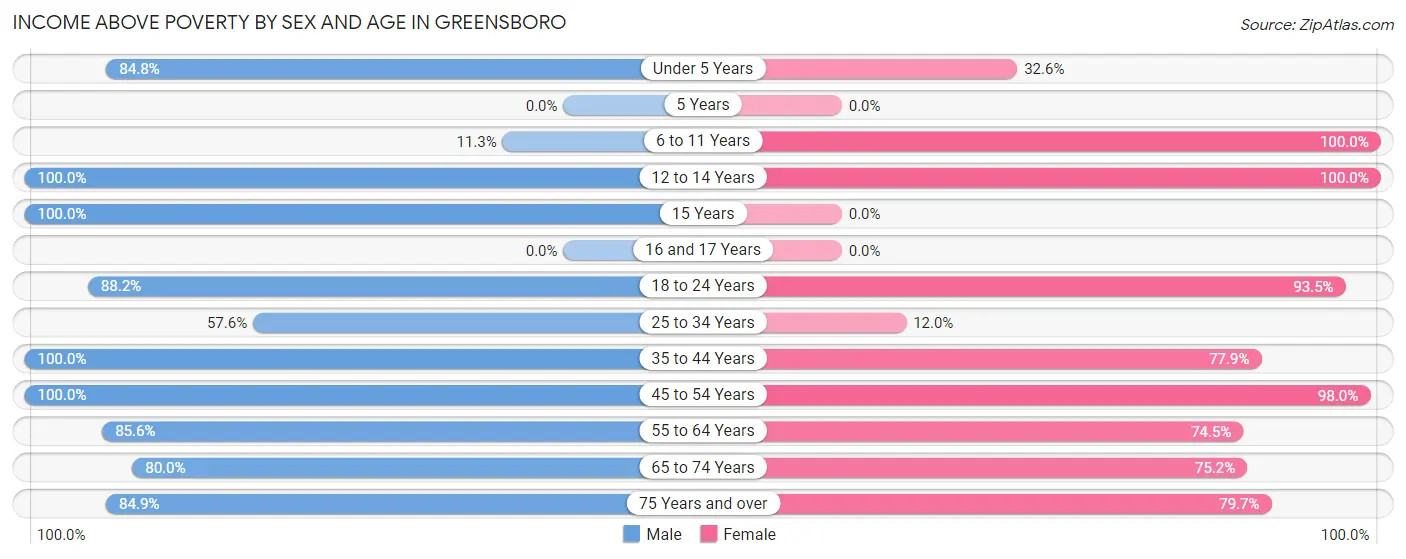
| Age Bracket | Male | Female |
| Under 5 Years | 67 (84.8%) | 14 (32.6%) |
| 5 Years | 0 (0.0%) | 0 (0.0%) |
| 6 to 11 Years | 15 (11.3%) | 35 (100.0%) |
| 12 to 14 Years | 36 (100.0%) | 36 (100.0%) |
| 15 Years | 40 (100.0%) | 0 (0.0%) |
| 16 and 17 Years | 0 (0.0%) | 0 (0.0%) |
| 18 to 24 Years | 75 (88.2%) | 86 (93.5%) |
| 25 to 34 Years | 140 (57.6%) | 27 (11.9%) |
| 35 to 44 Years | 102 (100.0%) | 116 (77.8%) |
| 45 to 54 Years | 19 (100.0%) | 100 (98.0%) |
| 55 to 64 Years | 101 (85.6%) | 149 (74.5%) |
| 65 to 74 Years | 92 (80.0%) | 161 (75.2%) |
| 75 Years and over | 28 (84.9%) | 114 (79.7%) |
| Total | 715 (69.0%) | 838 (65.5%) |
Income Below Poverty Among Married-Couple Families in Greensboro
The poverty statistics for married-couple families in Greensboro show that 7.5% or 14 of the total 187 families live below the poverty line. Families with no children have the highest poverty rate of 9.0%, comprising of 14 families. On the other hand, families with 1 or 2 children have the lowest poverty rate of 0.0%, which includes 0 families.
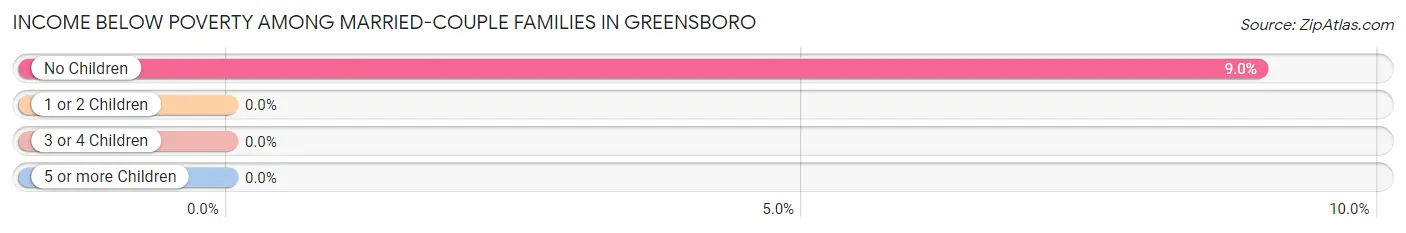
| Children | Above Poverty | Below Poverty |
| No Children | 142 (91.0%) | 14 (9.0%) |
| 1 or 2 Children | 18 (100.0%) | 0 (0.0%) |
| 3 or 4 Children | 13 (100.0%) | 0 (0.0%) |
| 5 or more Children | 0 (0.0%) | 0 (0.0%) |
| Total | 173 (92.5%) | 14 (7.5%) |
Income Below Poverty Among Single-Parent Households in Greensboro
According to the poverty data in Greensboro, 25.0% or 9 single-father households and 15.5% or 33 single-mother households are living below the poverty line. Among single-father households, those with 1 or 2 children have the highest poverty rate, with 9 households (100.0%) experiencing poverty. Likewise, among single-mother households, those with 3 or 4 children have the highest poverty rate, with 33 households (70.2%) falling below the poverty line.
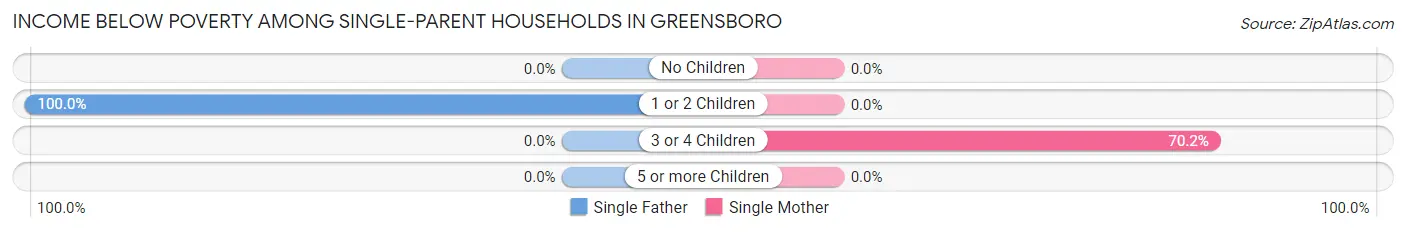
| Children | Single Father | Single Mother |
| No Children | 0 (0.0%) | 0 (0.0%) |
| 1 or 2 Children | 9 (100.0%) | 0 (0.0%) |
| 3 or 4 Children | 0 (0.0%) | 33 (70.2%) |
| 5 or more Children | 0 (0.0%) | 0 (0.0%) |
| Total | 9 (25.0%) | 33 (15.5%) |
Income Below Poverty Among Married-Couple vs Single-Parent Households in Greensboro
The poverty data for Greensboro shows that 14 of the married-couple family households (7.5%) and 42 of the single-parent households (16.9%) are living below the poverty level. Within the married-couple family households, those with no children have the highest poverty rate, with 14 households (9.0%) falling below the poverty line. Among the single-parent households, those with 3 or 4 children have the highest poverty rate, with 33 household (70.2%) living below poverty.
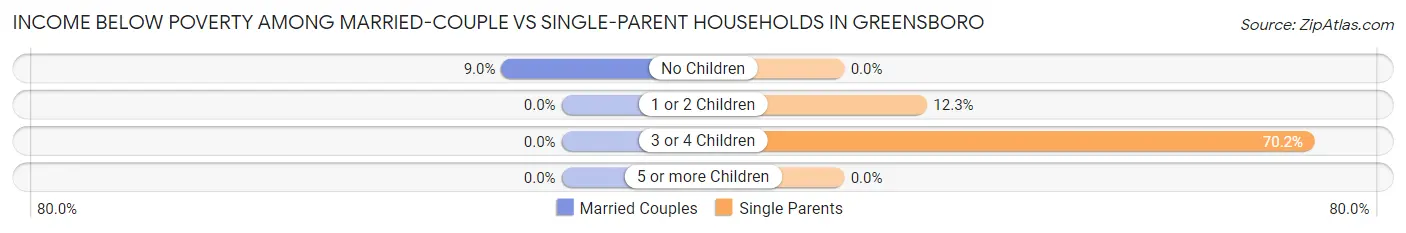
| Children | Married-Couple Families | Single-Parent Households |
| No Children | 14 (9.0%) | 0 (0.0%) |
| 1 or 2 Children | 0 (0.0%) | 9 (12.3%) |
| 3 or 4 Children | 0 (0.0%) | 33 (70.2%) |
| 5 or more Children | 0 (0.0%) | 0 (0.0%) |
| Total | 14 (7.5%) | 42 (16.9%) |
Race in Greensboro
The most populous races in Greensboro are Black / African American (1,702 | 70.4%), White / Caucasian (541 | 22.4%), and Two or more Races (123 | 5.1%).
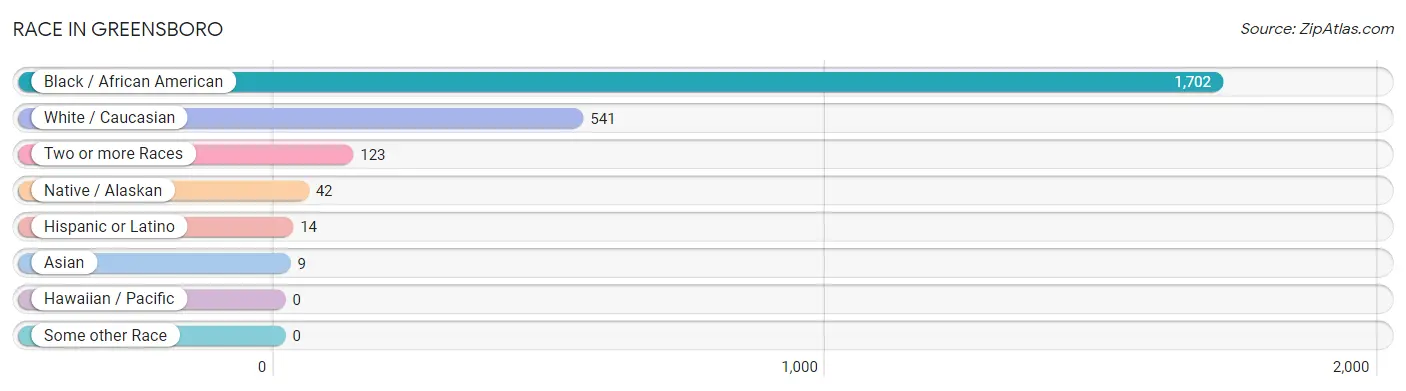
| Race | # Population | % Population |
| Asian | 9 | 0.4% |
| Black / African American | 1,702 | 70.4% |
| Hawaiian / Pacific | 0 | 0.0% |
| Hispanic or Latino | 14 | 0.6% |
| Native / Alaskan | 42 | 1.7% |
| White / Caucasian | 541 | 22.4% |
| Two or more Races | 123 | 5.1% |
| Some other Race | 0 | 0.0% |
| Total | 2,417 | 100.0% |
Ancestry in Greensboro
The most populous ancestries reported in Greensboro are English (83 | 3.4%), American (79 | 3.3%), German (58 | 2.4%), Irish (55 | 2.3%), and Apache (42 | 1.7%), together accounting for 13.1% of all Greensboro residents.
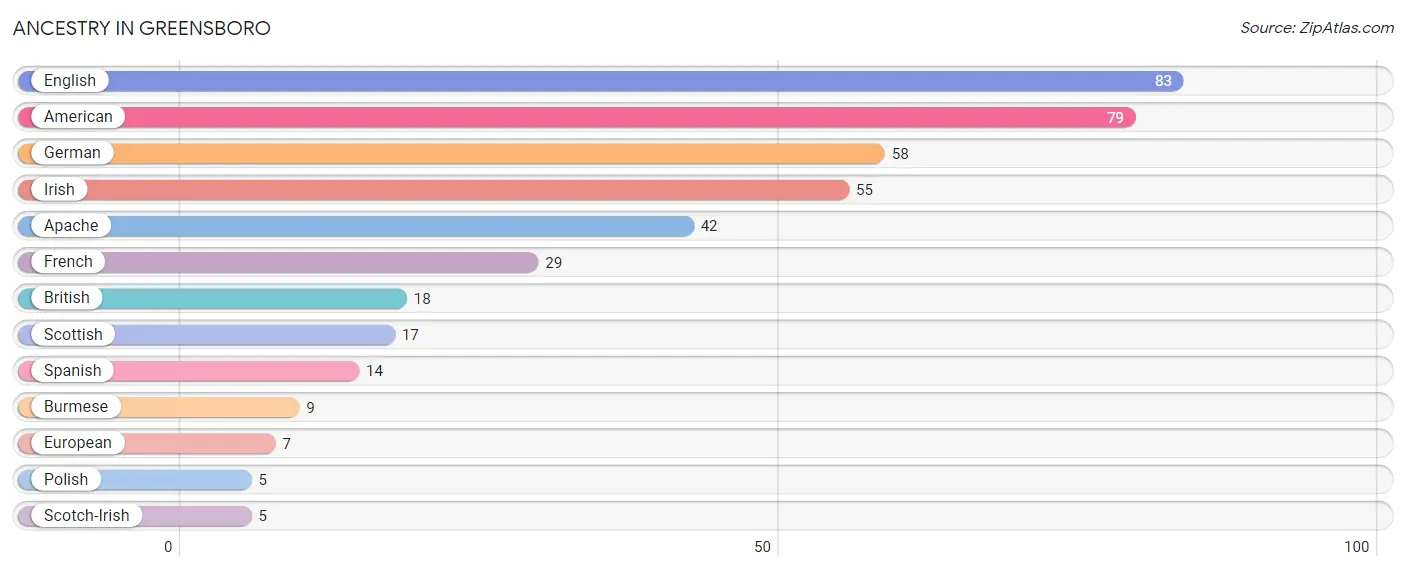
| Ancestry | # Population | % Population |
| American | 79 | 3.3% |
| Apache | 42 | 1.7% |
| British | 18 | 0.7% |
| Burmese | 9 | 0.4% |
| English | 83 | 3.4% |
| European | 7 | 0.3% |
| French | 29 | 1.2% |
| German | 58 | 2.4% |
| Irish | 55 | 2.3% |
| Polish | 5 | 0.2% |
| Scotch-Irish | 5 | 0.2% |
| Scottish | 17 | 0.7% |
| Spanish | 14 | 0.6% | View All 13 Rows |
Immigrants in Greensboro
The most numerous immigrant groups reported in Greensboro came from Asia (9 | 0.4%), Eastern Asia (9 | 0.4%), Korea (9 | 0.4%), Europe (7 | 0.3%), and Northern Europe (7 | 0.3%), together accounting for 1.7% of all Greensboro residents.
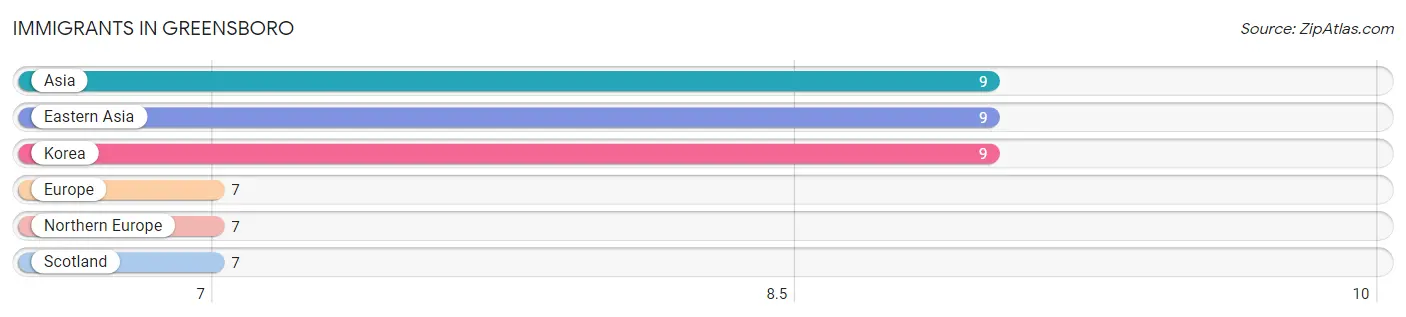
| Immigration Origin | # Population | % Population |
| Asia | 9 | 0.4% |
| Eastern Asia | 9 | 0.4% |
| Europe | 7 | 0.3% |
| Korea | 9 | 0.4% |
| Northern Europe | 7 | 0.3% |
| Scotland | 7 | 0.3% | View All 6 Rows |
Sex and Age in Greensboro
Sex and Age in Greensboro
The most populous age groups in Greensboro are 25 to 29 Years (125 | 11.5%) for men and 30 to 34 Years (183 | 13.7%) for women.
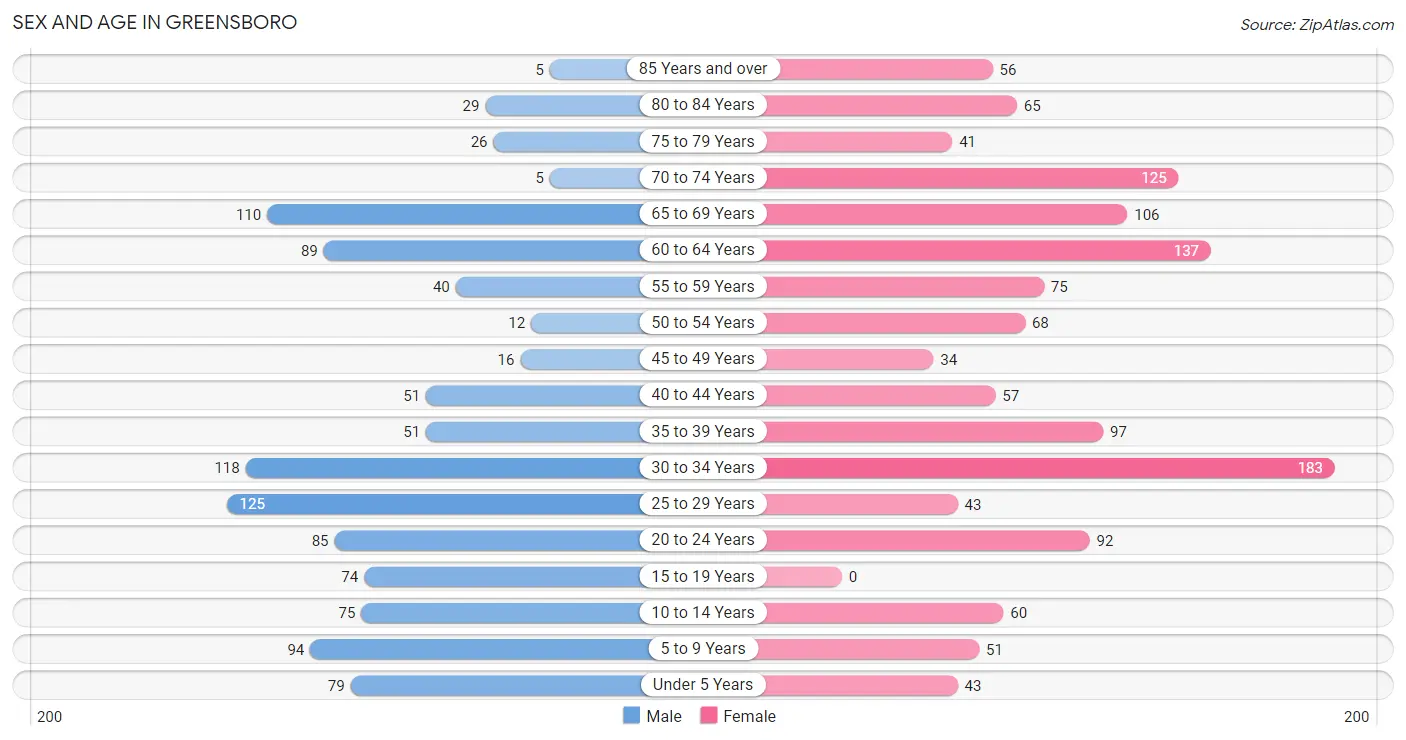
| Age Bracket | Male | Female |
| Under 5 Years | 79 (7.3%) | 43 (3.2%) |
| 5 to 9 Years | 94 (8.7%) | 51 (3.8%) |
| 10 to 14 Years | 75 (6.9%) | 60 (4.5%) |
| 15 to 19 Years | 74 (6.8%) | 0 (0.0%) |
| 20 to 24 Years | 85 (7.8%) | 92 (6.9%) |
| 25 to 29 Years | 125 (11.5%) | 43 (3.2%) |
| 30 to 34 Years | 118 (10.9%) | 183 (13.7%) |
| 35 to 39 Years | 51 (4.7%) | 97 (7.3%) |
| 40 to 44 Years | 51 (4.7%) | 57 (4.3%) |
| 45 to 49 Years | 16 (1.5%) | 34 (2.5%) |
| 50 to 54 Years | 12 (1.1%) | 68 (5.1%) |
| 55 to 59 Years | 40 (3.7%) | 75 (5.6%) |
| 60 to 64 Years | 89 (8.2%) | 137 (10.3%) |
| 65 to 69 Years | 110 (10.2%) | 106 (8.0%) |
| 70 to 74 Years | 5 (0.5%) | 125 (9.4%) |
| 75 to 79 Years | 26 (2.4%) | 41 (3.1%) |
| 80 to 84 Years | 29 (2.7%) | 65 (4.9%) |
| 85 Years and over | 5 (0.5%) | 56 (4.2%) |
| Total | 1,084 (100.0%) | 1,333 (100.0%) |
Families and Households in Greensboro
Median Family Size in Greensboro
The median family size in Greensboro is 3.83 persons per family, with single female/mother families (213 | 48.8%) accounting for the largest median family size of 5.09 persons per family. On the other hand, single male/father families (36 | 8.3%) represent the smallest median family size with 2.58 persons per family.
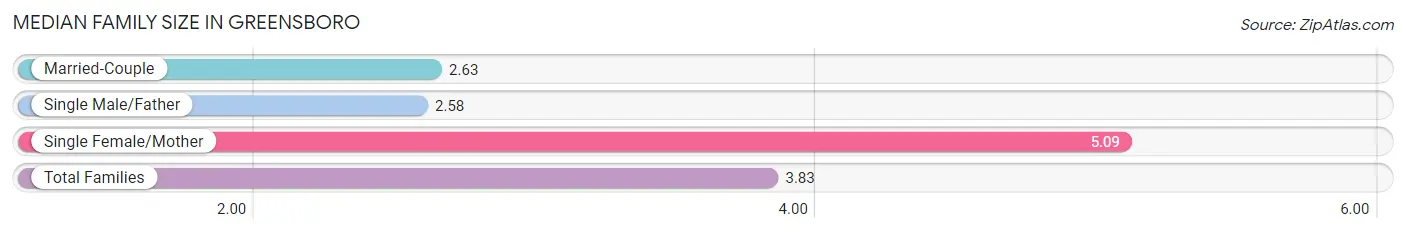
| Family Type | # Families | Family Size |
| Married-Couple | 187 (42.9%) | 2.63 |
| Single Male/Father | 36 (8.3%) | 2.58 |
| Single Female/Mother | 213 (48.8%) | 5.09 |
| Total Families | 436 (100.0%) | 3.83 |
Median Household Size in Greensboro
The median household size in Greensboro is 2.41 persons per household, with single female/mother households (213 | 22.2%) accounting for the largest median household size of 5.09 persons per household. non-family households (525 | 54.6%) represent the smallest median household size with 1.22 persons per household.
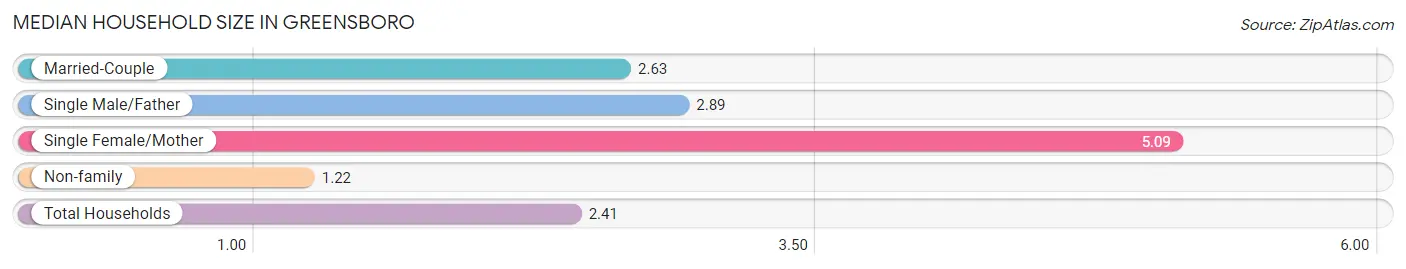
| Household Type | # Households | Household Size |
| Married-Couple | 187 (19.5%) | 2.63 |
| Single Male/Father | 36 (3.7%) | 2.89 |
| Single Female/Mother | 213 (22.2%) | 5.09 |
| Non-family | 525 (54.6%) | 1.22 |
| Total Households | 961 (100.0%) | 2.41 |
Household Size by Marriage Status in Greensboro
Out of a total of 961 households in Greensboro, 436 (45.4%) are family households, while 525 (54.6%) are nonfamily households. The most numerous type of family households are 2-person households, comprising 281, and the most common type of nonfamily households are 1-person households, comprising 338.
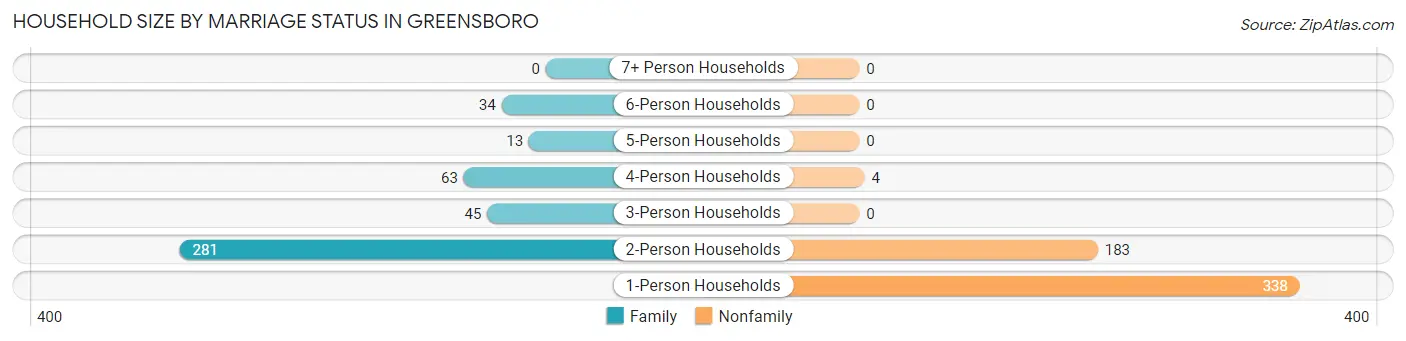
| Household Size | Family Households | Nonfamily Households |
| 1-Person Households | - | 338 (35.2%) |
| 2-Person Households | 281 (29.2%) | 183 (19.0%) |
| 3-Person Households | 45 (4.7%) | 0 (0.0%) |
| 4-Person Households | 63 (6.6%) | 4 (0.4%) |
| 5-Person Households | 13 (1.3%) | 0 (0.0%) |
| 6-Person Households | 34 (3.5%) | 0 (0.0%) |
| 7+ Person Households | 0 (0.0%) | 0 (0.0%) |
| Total | 436 (45.4%) | 525 (54.6%) |
Female Fertility in Greensboro
Fertility by Age in Greensboro
| Age Bracket | Women with Births | Births / 1,000 Women |
| 15 to 19 years | 0 (0.0%) | 0.0 |
| 20 to 34 years | 0 (0.0%) | 0.0 |
| 35 to 50 years | 0 (0.0%) | 0.0 |
| Total | 0 (0.0%) | 0.0 |
Fertility by Age by Marriage Status in Greensboro
| Age Bracket | Married | Unmarried |
| 15 to 19 years | 0 (0.0%) | 0 (0.0%) |
| 20 to 34 years | 0 (0.0%) | 0 (0.0%) |
| 35 to 50 years | 0 (0.0%) | 0 (0.0%) |
| Total | 0 (0.0%) | 0 (0.0%) |
Fertility by Education in Greensboro
| Educational Attainment | Women with Births | Births / 1,000 Women |
| Less than High School | 0 (0.0%) | 0.0 |
| High School Diploma | 0 (0.0%) | 0.0 |
| College or Associate's Degree | 0 (0.0%) | 0.0 |
| Bachelor's Degree | 0 (0.0%) | 0.0 |
| Graduate Degree | 0 (0.0%) | 0.0 |
| Total | 0 (0.0%) | 0.0 |
Fertility by Education by Marriage Status in Greensboro
| Educational Attainment | Married | Unmarried |
| Less than High School | 0 (0.0%) | 0 (0.0%) |
| High School Diploma | 0 (0.0%) | 0 (0.0%) |
| College or Associate's Degree | 0 (0.0%) | 0 (0.0%) |
| Bachelor's Degree | 0 (0.0%) | 0 (0.0%) |
| Graduate Degree | 0 (0.0%) | 0 (0.0%) |
| Total | 0 (0.0%) | 0 (0.0%) |
Employment Characteristics in Greensboro
Employment by Class of Employer in Greensboro
Among the 858 employed individuals in Greensboro, private company employees (436 | 50.8%), state government employees (272 | 31.7%), and self-employed (incorporated) (111 | 12.9%) make up the most common classes of employment.
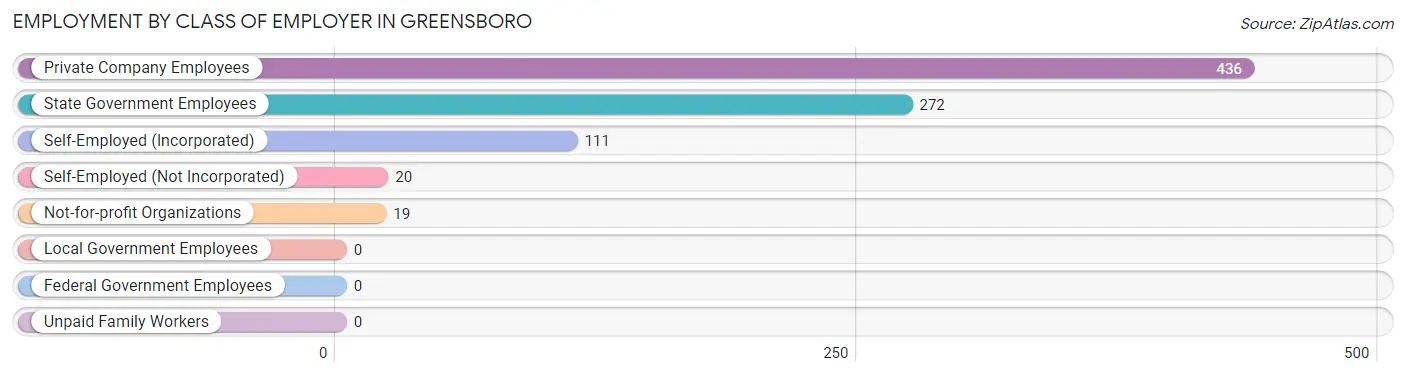
| Employer Class | # Employees | % Employees |
| Private Company Employees | 436 | 50.8% |
| Self-Employed (Incorporated) | 111 | 12.9% |
| Self-Employed (Not Incorporated) | 20 | 2.3% |
| Not-for-profit Organizations | 19 | 2.2% |
| Local Government Employees | 0 | 0.0% |
| State Government Employees | 272 | 31.7% |
| Federal Government Employees | 0 | 0.0% |
| Unpaid Family Workers | 0 | 0.0% |
| Total | 858 | 100.0% |
Employment Status by Age in Greensboro
According to the labor force statistics for Greensboro, out of the total population over 16 years of age (1,975), 49.1% or 970 individuals are in the labor force, with 9.7% or 94 of them unemployed. The age group with the highest labor force participation rate is 25 to 29 years, with 100.0% or 168 individuals in the labor force. Within the labor force, the 20 to 24 years age range has the highest percentage of unemployed individuals, with 57.0% or 61 of them being unemployed.
| Age Bracket | In Labor Force | Unemployed |
| 16 to 19 Years | 0 (0.0%) | 0 (0.0%) |
| 20 to 24 Years | 107 (60.5%) | 61 (57.0%) |
| 25 to 29 Years | 168 (100.0%) | 26 (15.5%) |
| 30 to 34 Years | 280 (93.0%) | 0 (0.0%) |
| 35 to 44 Years | 160 (62.5%) | 7 (4.4%) |
| 45 to 54 Years | 86 (66.2%) | 0 (0.0%) |
| 55 to 59 Years | 69 (60.0%) | 0 (0.0%) |
| 60 to 64 Years | 61 (27.0%) | 0 (0.0%) |
| 65 to 74 Years | 24 (6.9%) | 0 (0.0%) |
| 75 Years and over | 14 (6.3%) | 0 (0.0%) |
| Total | 970 (49.1%) | 94 (9.7%) |
Employment Status by Educational Attainment in Greensboro
According to labor force statistics for Greensboro, 68.9% of individuals (824) out of the total population between 25 and 64 years of age (1,196) are in the labor force, with 4.0% or 33 of them being unemployed. The group with the highest labor force participation rate are those with the educational attainment of college / associate degree, with 91.8% or 259 individuals in the labor force. Within the labor force, individuals with college / associate degree education have the highest percentage of unemployment, with 10.0% or 26 of them being unemployed.
| Educational Attainment | In Labor Force | Unemployed |
| Less than High School | 292 (67.0%) | 0 (0.0%) |
| High School Diploma | 181 (50.8%) | 0 (0.0%) |
| College / Associate Degree | 259 (91.8%) | 28 (10.0%) |
| Bachelor's Degree or higher | 92 (75.4%) | 9 (7.6%) |
| Total | 824 (68.9%) | 48 (4.0%) |
Employment Occupations by Sex in Greensboro
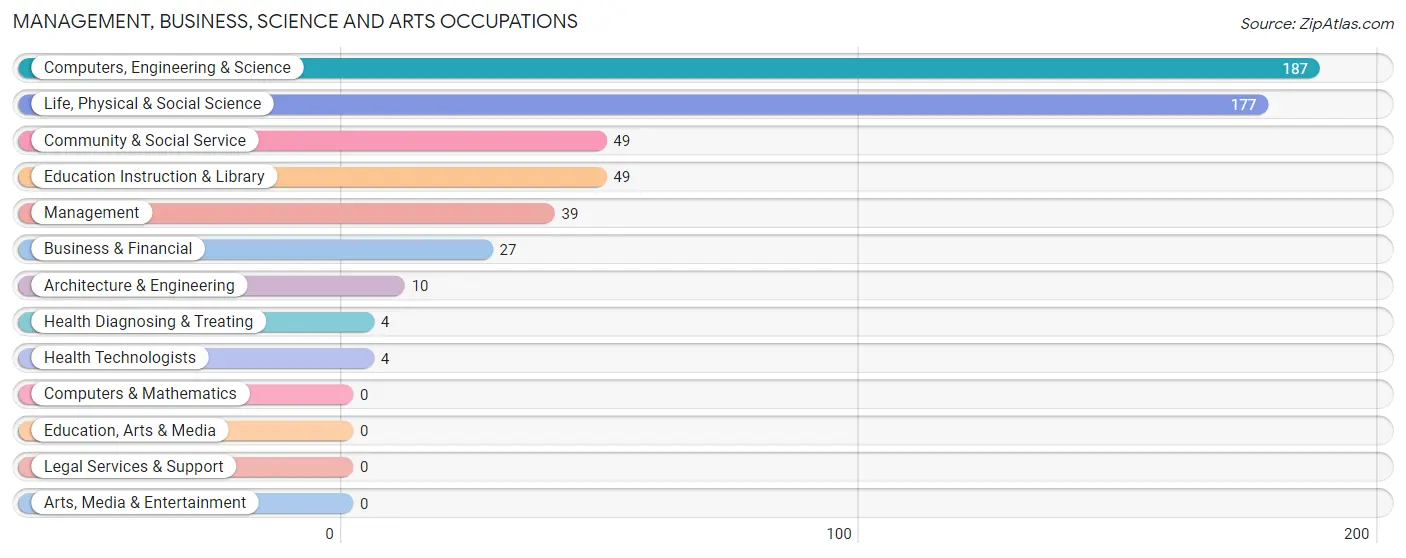
Management, Business, Science and Arts Occupations
The most common Management, Business, Science and Arts occupations in Greensboro are Computers, Engineering & Science (187 | 21.4%), Life, Physical & Social Science (177 | 20.2%), Community & Social Service (49 | 5.6%), Education Instruction & Library (49 | 5.6%), and Management (39 | 4.5%).
Management, Business, Science and Arts Occupations by Sex
Within the Management, Business, Science and Arts occupations in Greensboro, the most male-oriented occupations are Architecture & Engineering (100.0%), Management (33.3%), and Community & Social Service (12.2%), while the most female-oriented occupations are Business & Financial (100.0%), Health Diagnosing & Treating (100.0%), and Health Technologists (100.0%).
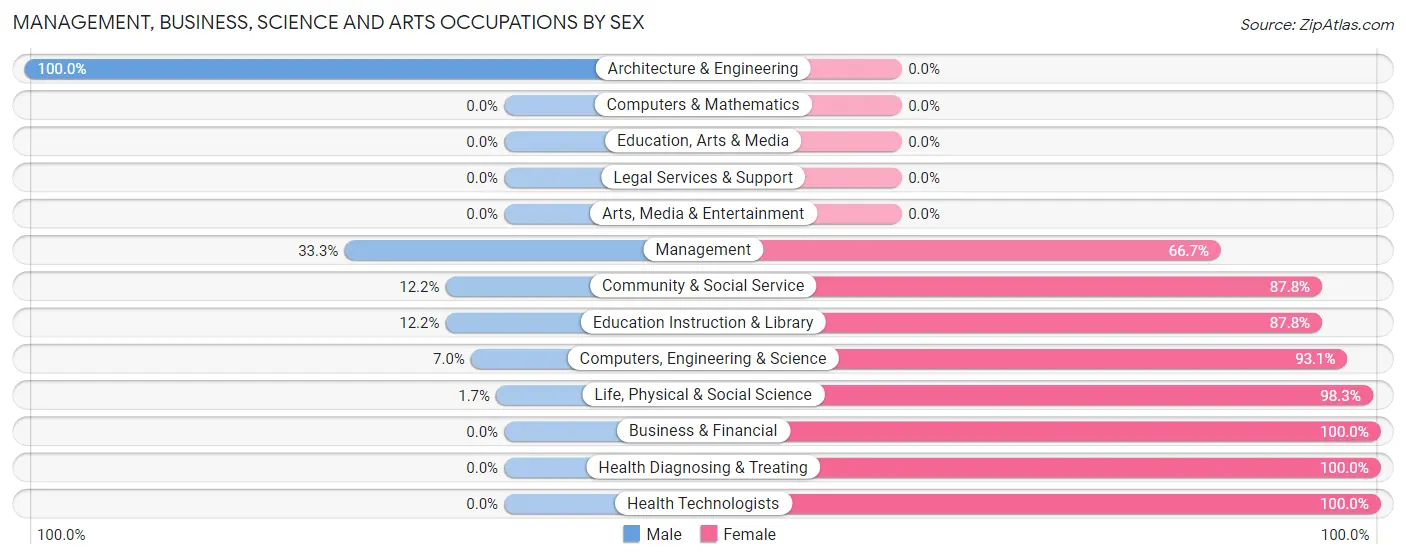
| Occupation | Male | Female |
| Management | 13 (33.3%) | 26 (66.7%) |
| Business & Financial | 0 (0.0%) | 27 (100.0%) |
| Computers, Engineering & Science | 13 (7.0%) | 174 (93.0%) |
| Computers & Mathematics | 0 (0.0%) | 0 (0.0%) |
| Architecture & Engineering | 10 (100.0%) | 0 (0.0%) |
| Life, Physical & Social Science | 3 (1.7%) | 174 (98.3%) |
| Community & Social Service | 6 (12.2%) | 43 (87.8%) |
| Education, Arts & Media | 0 (0.0%) | 0 (0.0%) |
| Legal Services & Support | 0 (0.0%) | 0 (0.0%) |
| Education Instruction & Library | 6 (12.2%) | 43 (87.8%) |
| Arts, Media & Entertainment | 0 (0.0%) | 0 (0.0%) |
| Health Diagnosing & Treating | 0 (0.0%) | 4 (100.0%) |
| Health Technologists | 0 (0.0%) | 4 (100.0%) |
| Total (Category) | 32 (10.5%) | 274 (89.5%) |
| Total (Overall) | 388 (44.3%) | 487 (55.7%) |
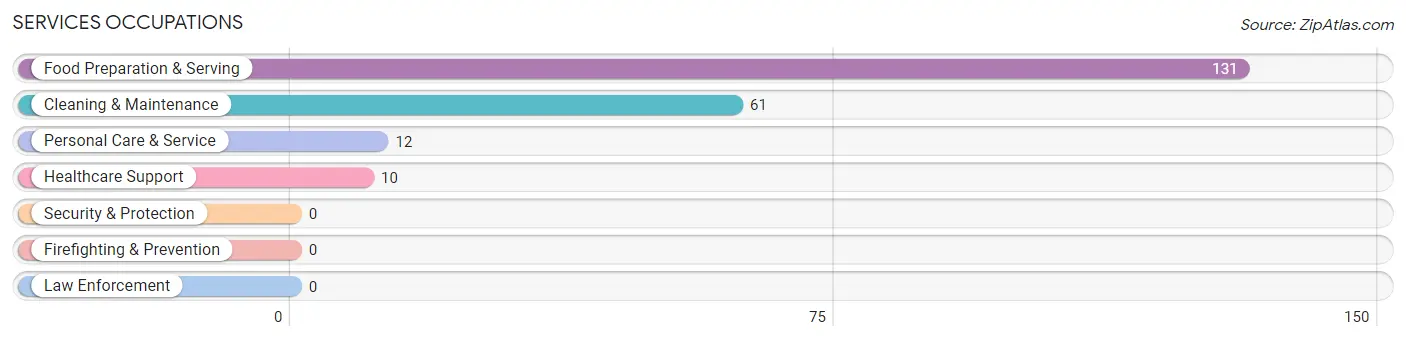
Services Occupations
The most common Services occupations in Greensboro are Food Preparation & Serving (131 | 15.0%), Cleaning & Maintenance (61 | 7.0%), Personal Care & Service (12 | 1.4%), and Healthcare Support (10 | 1.1%).
Services Occupations by Sex
Within the Services occupations in Greensboro, the most male-oriented occupations are Cleaning & Maintenance (78.7%), and Food Preparation & Serving (62.6%), while the most female-oriented occupations are Healthcare Support (100.0%), Personal Care & Service (100.0%), and Food Preparation & Serving (37.4%).
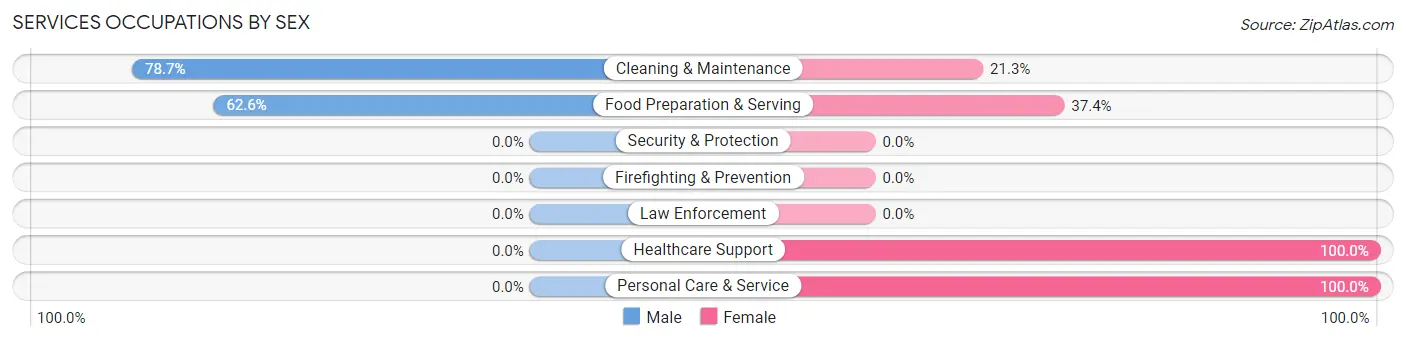
| Occupation | Male | Female |
| Healthcare Support | 0 (0.0%) | 10 (100.0%) |
| Security & Protection | 0 (0.0%) | 0 (0.0%) |
| Firefighting & Prevention | 0 (0.0%) | 0 (0.0%) |
| Law Enforcement | 0 (0.0%) | 0 (0.0%) |
| Food Preparation & Serving | 82 (62.6%) | 49 (37.4%) |
| Cleaning & Maintenance | 48 (78.7%) | 13 (21.3%) |
| Personal Care & Service | 0 (0.0%) | 12 (100.0%) |
| Total (Category) | 130 (60.8%) | 84 (39.3%) |
| Total (Overall) | 388 (44.3%) | 487 (55.7%) |
Sales and Office Occupations
The most common Sales and Office occupations in Greensboro are Sales & Related (128 | 14.6%), and Office & Administration (75 | 8.6%).
Sales and Office Occupations by Sex
| Occupation | Male | Female |
| Sales & Related | 128 (100.0%) | 0 (0.0%) |
| Office & Administration | 8 (10.7%) | 67 (89.3%) |
| Total (Category) | 136 (67.0%) | 67 (33.0%) |
| Total (Overall) | 388 (44.3%) | 487 (55.7%) |
Natural Resources, Construction and Maintenance Occupations
The most common Natural Resources, Construction and Maintenance occupations in Greensboro are Construction & Extraction (26 | 3.0%), and Installation, Maintenance & Repair (10 | 1.1%).
Natural Resources, Construction and Maintenance Occupations by Sex
| Occupation | Male | Female |
| Farming, Fishing & Forestry | 0 (0.0%) | 0 (0.0%) |
| Construction & Extraction | 26 (100.0%) | 0 (0.0%) |
| Installation, Maintenance & Repair | 10 (100.0%) | 0 (0.0%) |
| Total (Category) | 36 (100.0%) | 0 (0.0%) |
| Total (Overall) | 388 (44.3%) | 487 (55.7%) |
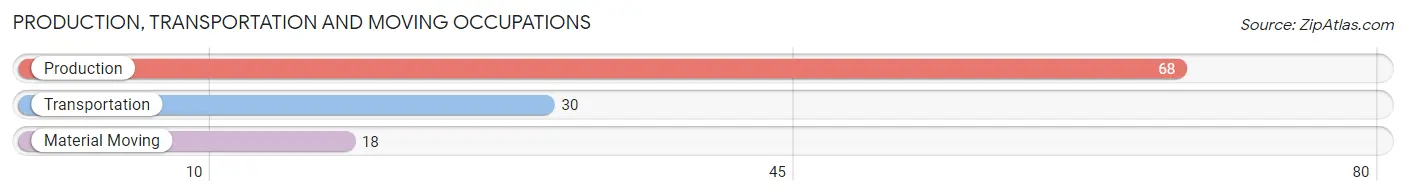
Production, Transportation and Moving Occupations
The most common Production, Transportation and Moving occupations in Greensboro are Production (68 | 7.8%), Transportation (30 | 3.4%), and Material Moving (18 | 2.1%).
Production, Transportation and Moving Occupations by Sex
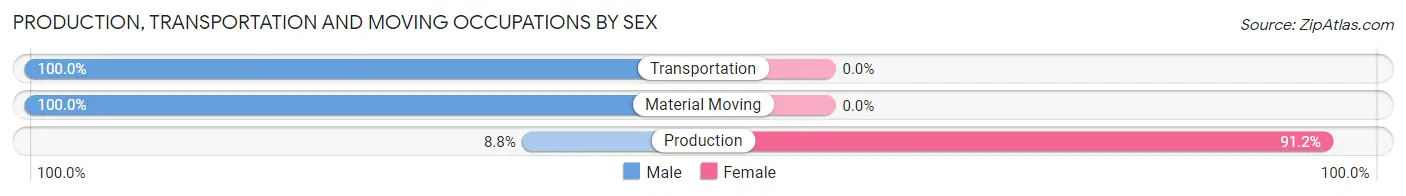
| Occupation | Male | Female |
| Production | 6 (8.8%) | 62 (91.2%) |
| Transportation | 30 (100.0%) | 0 (0.0%) |
| Material Moving | 18 (100.0%) | 0 (0.0%) |
| Total (Category) | 54 (46.6%) | 62 (53.4%) |
| Total (Overall) | 388 (44.3%) | 487 (55.7%) |
Employment Industries by Sex in Greensboro
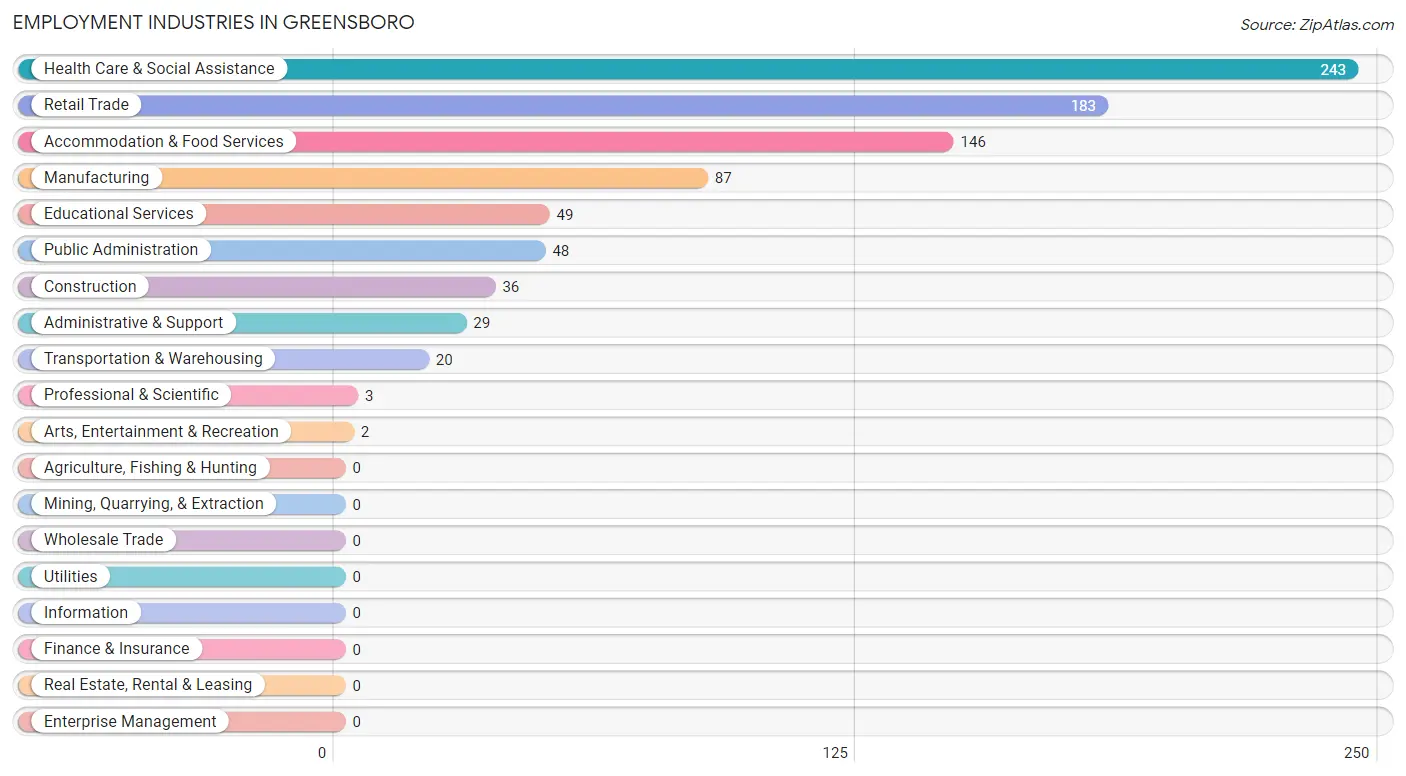
Employment Industries in Greensboro
The major employment industries in Greensboro include Health Care & Social Assistance (243 | 27.8%), Retail Trade (183 | 20.9%), Accommodation & Food Services (146 | 16.7%), Manufacturing (87 | 9.9%), and Educational Services (49 | 5.6%).
Employment Industries by Sex in Greensboro
The Greensboro industries that see more men than women are Construction (100.0%), Transportation & Warehousing (100.0%), and Professional & Scientific (100.0%), whereas the industries that tend to have a higher number of women are Health Care & Social Assistance (100.0%), Educational Services (87.8%), and Manufacturing (71.3%).
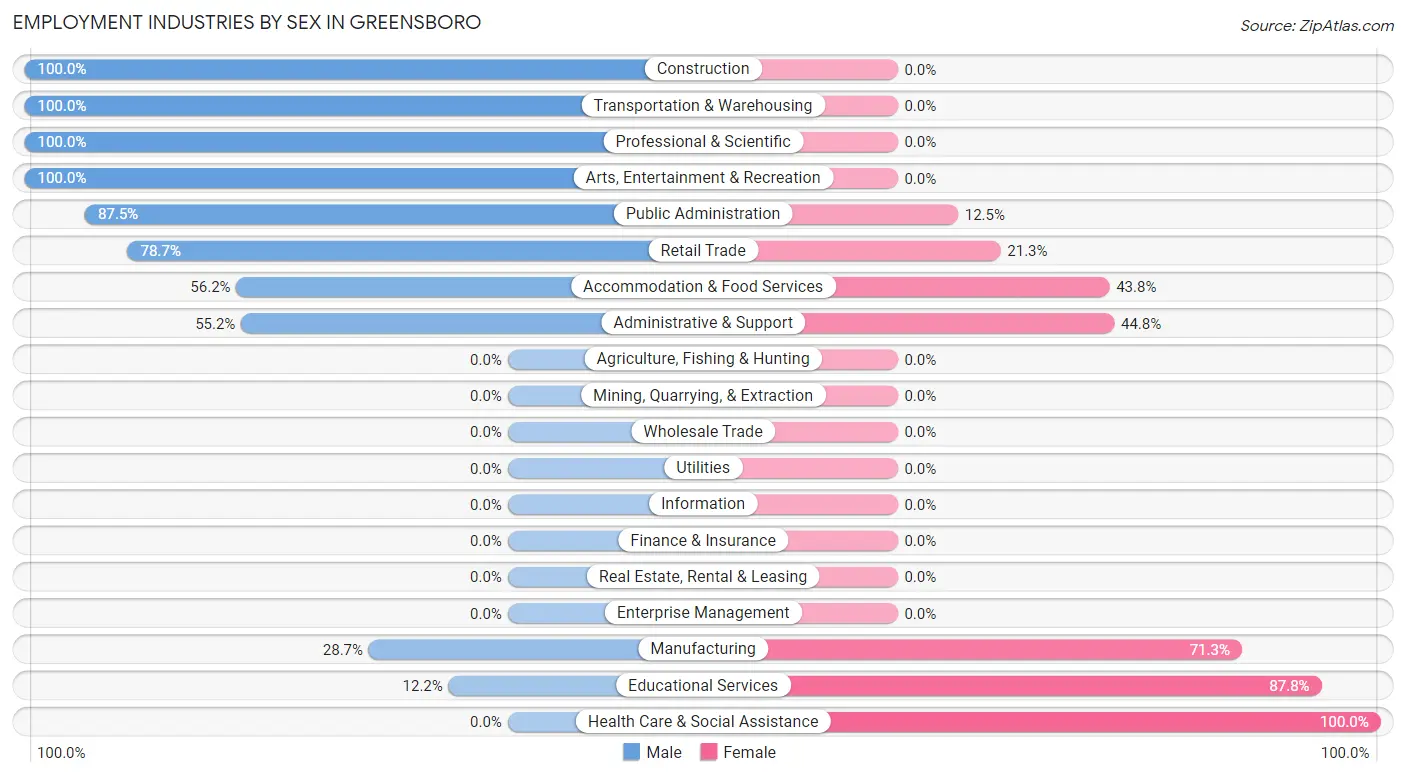
| Industry | Male | Female |
| Agriculture, Fishing & Hunting | 0 (0.0%) | 0 (0.0%) |
| Mining, Quarrying, & Extraction | 0 (0.0%) | 0 (0.0%) |
| Construction | 36 (100.0%) | 0 (0.0%) |
| Manufacturing | 25 (28.7%) | 62 (71.3%) |
| Wholesale Trade | 0 (0.0%) | 0 (0.0%) |
| Retail Trade | 144 (78.7%) | 39 (21.3%) |
| Transportation & Warehousing | 20 (100.0%) | 0 (0.0%) |
| Utilities | 0 (0.0%) | 0 (0.0%) |
| Information | 0 (0.0%) | 0 (0.0%) |
| Finance & Insurance | 0 (0.0%) | 0 (0.0%) |
| Real Estate, Rental & Leasing | 0 (0.0%) | 0 (0.0%) |
| Professional & Scientific | 3 (100.0%) | 0 (0.0%) |
| Enterprise Management | 0 (0.0%) | 0 (0.0%) |
| Administrative & Support | 16 (55.2%) | 13 (44.8%) |
| Educational Services | 6 (12.2%) | 43 (87.8%) |
| Health Care & Social Assistance | 0 (0.0%) | 243 (100.0%) |
| Arts, Entertainment & Recreation | 2 (100.0%) | 0 (0.0%) |
| Accommodation & Food Services | 82 (56.2%) | 64 (43.8%) |
| Public Administration | 42 (87.5%) | 6 (12.5%) |
| Total | 388 (44.3%) | 487 (55.7%) |
Education in Greensboro
School Enrollment in Greensboro
The most common levels of schooling among the 480 students in Greensboro are high school (148 | 30.8%), college / undergraduate (118 | 24.6%), and elementary school (73 | 15.2%).
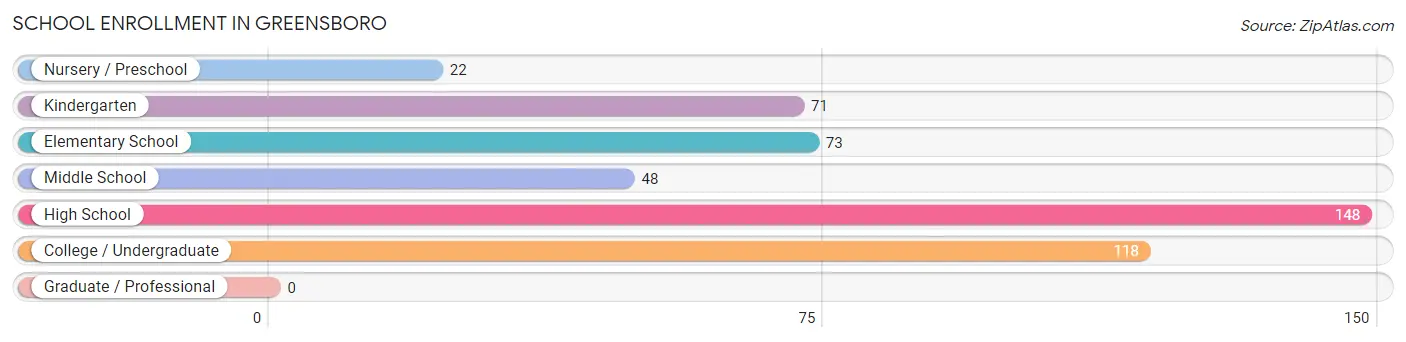
| School Level | # Students | % Students |
| Nursery / Preschool | 22 | 4.6% |
| Kindergarten | 71 | 14.8% |
| Elementary School | 73 | 15.2% |
| Middle School | 48 | 10.0% |
| High School | 148 | 30.8% |
| College / Undergraduate | 118 | 24.6% |
| Graduate / Professional | 0 | 0.0% |
| Total | 480 | 100.0% |
School Enrollment by Age by Funding Source in Greensboro
Out of a total of 480 students who are enrolled in schools in Greensboro, 43 (9.0%) attend a private institution, while the remaining 437 (91.0%) are enrolled in public schools. The age group of 5 to 9 year old has the highest likelihood of being enrolled in private schools, with 22 (21.6% in the age bracket) enrolled. Conversely, the age group of 20 to 24 year olds has the lowest likelihood of being enrolled in a private school, with 77 (100.0% in the age bracket) attending a public institution.
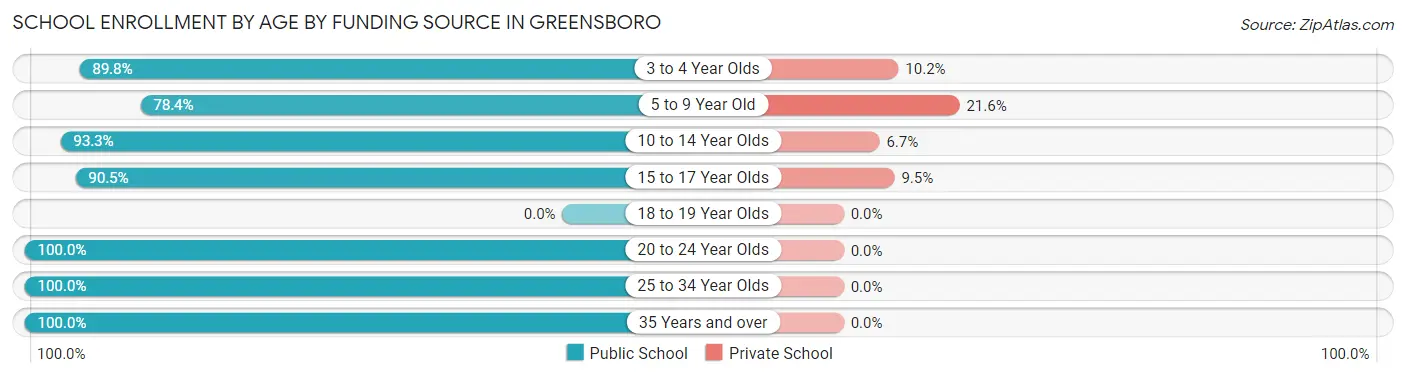
| Age Bracket | Public School | Private School |
| 3 to 4 Year Olds | 44 (89.8%) | 5 (10.2%) |
| 5 to 9 Year Old | 80 (78.4%) | 22 (21.6%) |
| 10 to 14 Year Olds | 126 (93.3%) | 9 (6.7%) |
| 15 to 17 Year Olds | 67 (90.5%) | 7 (9.5%) |
| 18 to 19 Year Olds | 0 (0.0%) | 0 (0.0%) |
| 20 to 24 Year Olds | 77 (100.0%) | 0 (0.0%) |
| 25 to 34 Year Olds | 25 (100.0%) | 0 (0.0%) |
| 35 Years and over | 18 (100.0%) | 0 (0.0%) |
| Total | 437 (91.0%) | 43 (9.0%) |
Educational Attainment by Field of Study in Greensboro
Education (48 | 23.6%), business (37 | 18.2%), social sciences (32 | 15.8%), multidisciplinary studies (24 | 11.8%), and science & technology (19 | 9.4%) are the most common fields of study among 203 individuals in Greensboro who have obtained a bachelor's degree or higher.
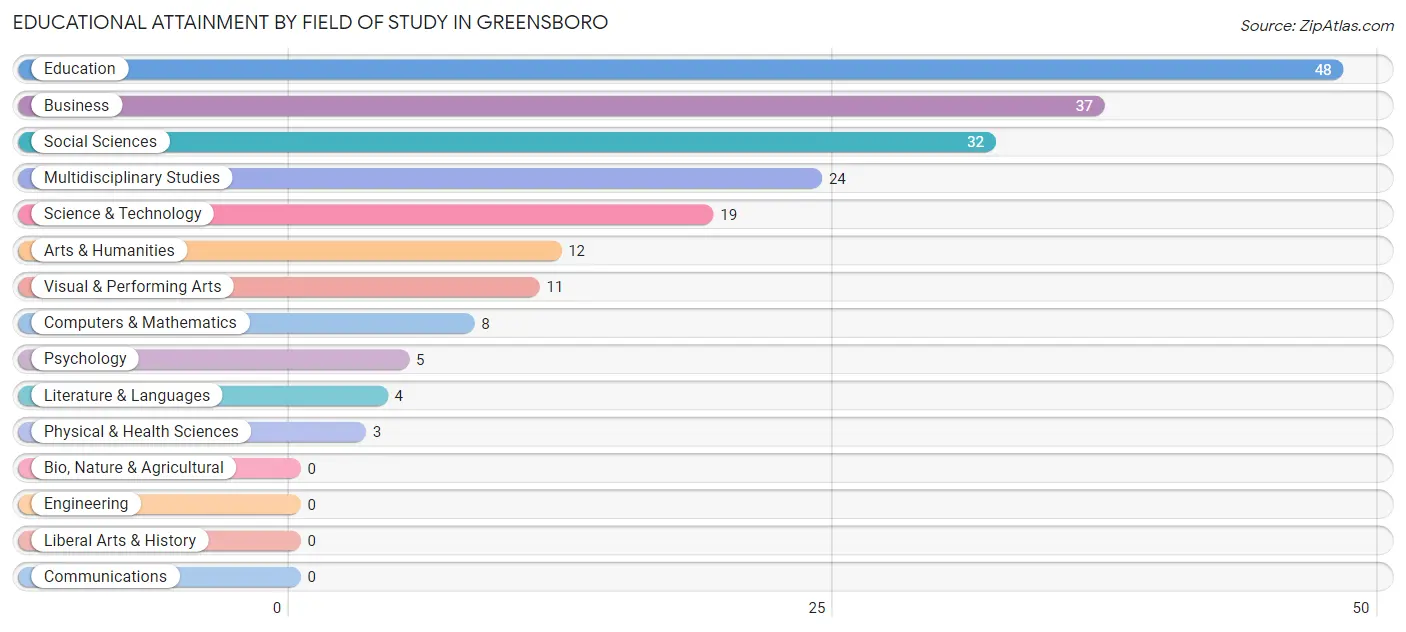
| Field of Study | # Graduates | % Graduates |
| Computers & Mathematics | 8 | 3.9% |
| Bio, Nature & Agricultural | 0 | 0.0% |
| Physical & Health Sciences | 3 | 1.5% |
| Psychology | 5 | 2.5% |
| Social Sciences | 32 | 15.8% |
| Engineering | 0 | 0.0% |
| Multidisciplinary Studies | 24 | 11.8% |
| Science & Technology | 19 | 9.4% |
| Business | 37 | 18.2% |
| Education | 48 | 23.6% |
| Literature & Languages | 4 | 2.0% |
| Liberal Arts & History | 0 | 0.0% |
| Visual & Performing Arts | 11 | 5.4% |
| Communications | 0 | 0.0% |
| Arts & Humanities | 12 | 5.9% |
| Total | 203 | 100.0% |
Transportation & Commute in Greensboro
Vehicle Availability by Sex in Greensboro
The most prevalent vehicle ownership categories in Greensboro are males with 1 vehicle (159, accounting for 41.0%) and females with 1 vehicle (238, making up 33.8%).
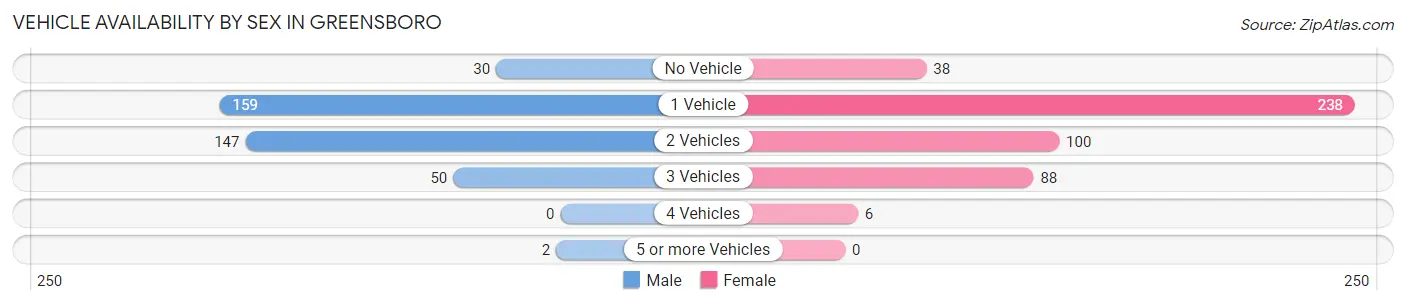
| Vehicles Available | Male | Female |
| No Vehicle | 30 (7.7%) | 38 (8.1%) |
| 1 Vehicle | 159 (41.0%) | 238 (50.6%) |
| 2 Vehicles | 147 (37.9%) | 100 (21.3%) |
| 3 Vehicles | 50 (12.9%) | 88 (18.7%) |
| 4 Vehicles | 0 (0.0%) | 6 (1.3%) |
| 5 or more Vehicles | 2 (0.5%) | 0 (0.0%) |
| Total | 388 (100.0%) | 470 (100.0%) |
Commute Time in Greensboro
The most frequently occuring commute durations in Greensboro are 10 to 14 minutes (290 commuters, 35.4%), 45 to 59 minutes (164 commuters, 20.0%), and 15 to 19 minutes (147 commuters, 17.9%).
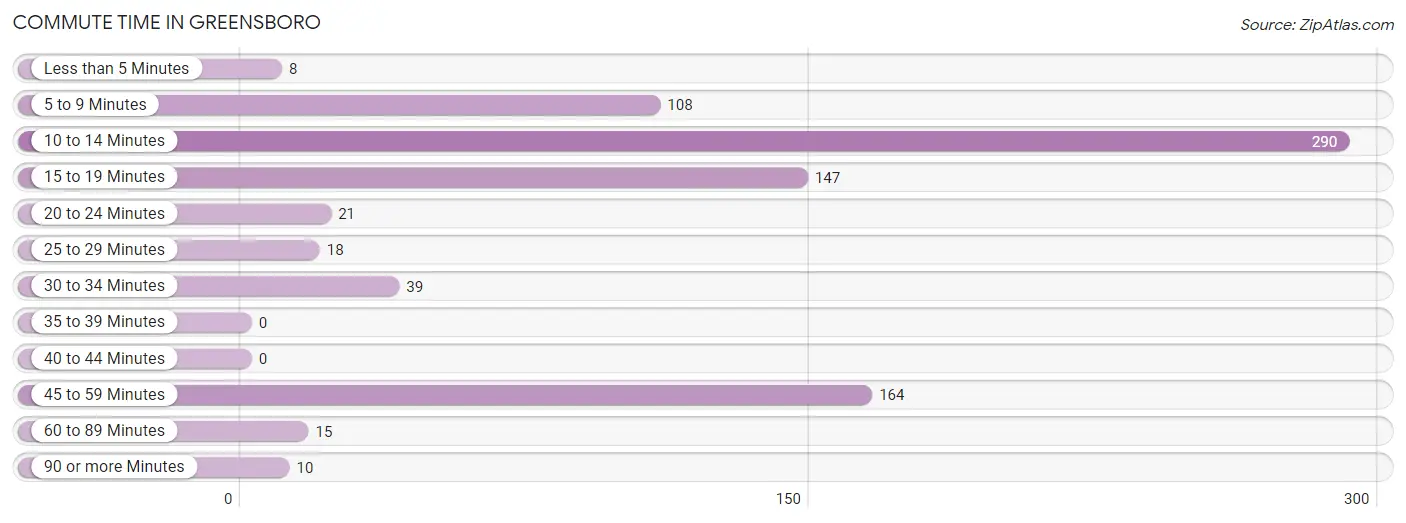
| Commute Time | # Commuters | % Commuters |
| Less than 5 Minutes | 8 | 1.0% |
| 5 to 9 Minutes | 108 | 13.2% |
| 10 to 14 Minutes | 290 | 35.4% |
| 15 to 19 Minutes | 147 | 17.9% |
| 20 to 24 Minutes | 21 | 2.6% |
| 25 to 29 Minutes | 18 | 2.2% |
| 30 to 34 Minutes | 39 | 4.8% |
| 35 to 39 Minutes | 0 | 0.0% |
| 40 to 44 Minutes | 0 | 0.0% |
| 45 to 59 Minutes | 164 | 20.0% |
| 60 to 89 Minutes | 15 | 1.8% |
| 90 or more Minutes | 10 | 1.2% |
Commute Time by Sex in Greensboro
The most common commute times in Greensboro are 15 to 19 minutes (147 commuters, 39.7%) for males and 10 to 14 minutes (254 commuters, 56.4%) for females.
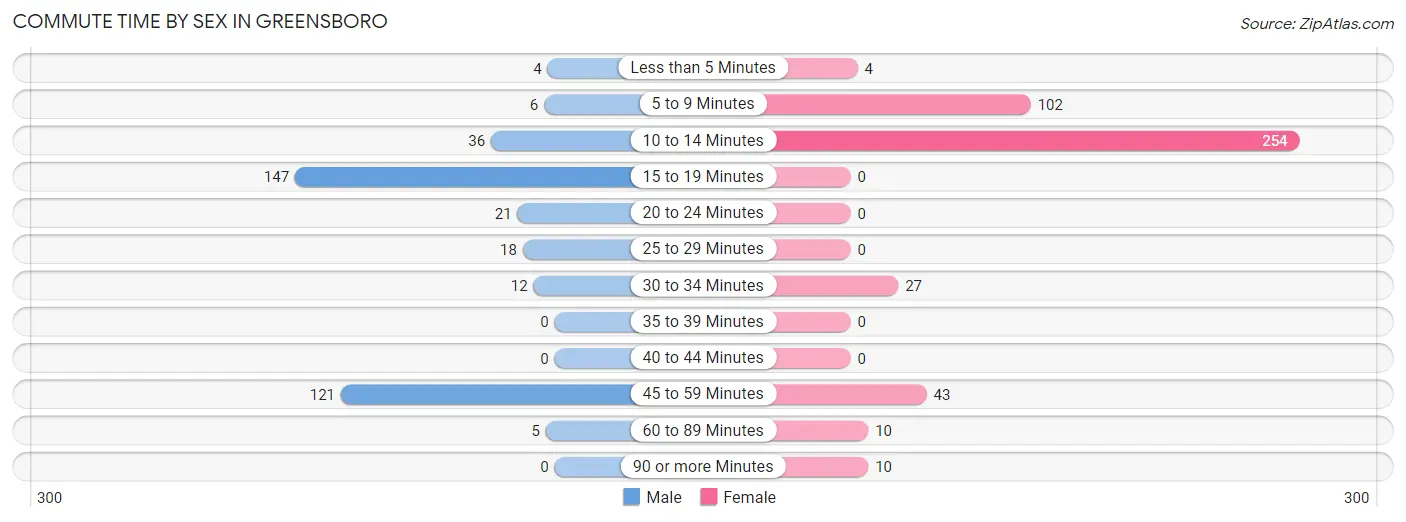
| Commute Time | Male | Female |
| Less than 5 Minutes | 4 (1.1%) | 4 (0.9%) |
| 5 to 9 Minutes | 6 (1.6%) | 102 (22.7%) |
| 10 to 14 Minutes | 36 (9.7%) | 254 (56.4%) |
| 15 to 19 Minutes | 147 (39.7%) | 0 (0.0%) |
| 20 to 24 Minutes | 21 (5.7%) | 0 (0.0%) |
| 25 to 29 Minutes | 18 (4.9%) | 0 (0.0%) |
| 30 to 34 Minutes | 12 (3.2%) | 27 (6.0%) |
| 35 to 39 Minutes | 0 (0.0%) | 0 (0.0%) |
| 40 to 44 Minutes | 0 (0.0%) | 0 (0.0%) |
| 45 to 59 Minutes | 121 (32.7%) | 43 (9.6%) |
| 60 to 89 Minutes | 5 (1.3%) | 10 (2.2%) |
| 90 or more Minutes | 0 (0.0%) | 10 (2.2%) |
Time of Departure to Work by Sex in Greensboro
The most frequent times of departure to work in Greensboro are 7:00 AM to 7:29 AM (189, 51.1%) for males and 5:30 AM to 5:59 AM (184, 40.9%) for females.
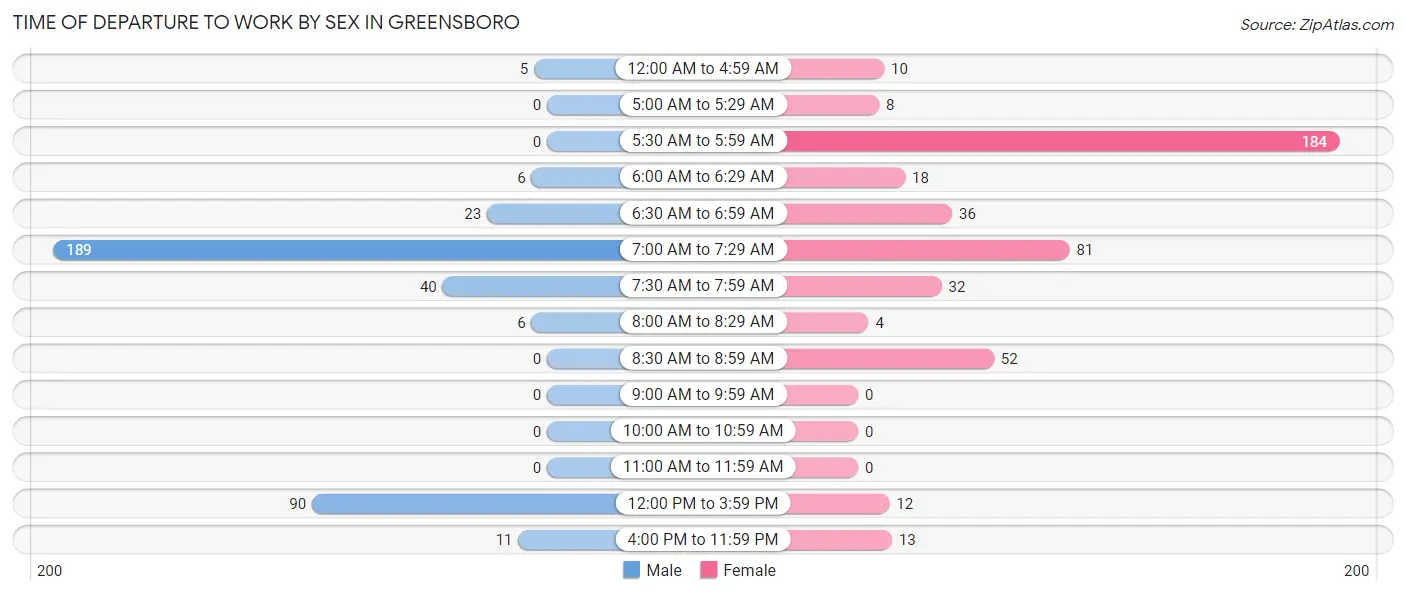
| Time of Departure | Male | Female |
| 12:00 AM to 4:59 AM | 5 (1.3%) | 10 (2.2%) |
| 5:00 AM to 5:29 AM | 0 (0.0%) | 8 (1.8%) |
| 5:30 AM to 5:59 AM | 0 (0.0%) | 184 (40.9%) |
| 6:00 AM to 6:29 AM | 6 (1.6%) | 18 (4.0%) |
| 6:30 AM to 6:59 AM | 23 (6.2%) | 36 (8.0%) |
| 7:00 AM to 7:29 AM | 189 (51.1%) | 81 (18.0%) |
| 7:30 AM to 7:59 AM | 40 (10.8%) | 32 (7.1%) |
| 8:00 AM to 8:29 AM | 6 (1.6%) | 4 (0.9%) |
| 8:30 AM to 8:59 AM | 0 (0.0%) | 52 (11.6%) |
| 9:00 AM to 9:59 AM | 0 (0.0%) | 0 (0.0%) |
| 10:00 AM to 10:59 AM | 0 (0.0%) | 0 (0.0%) |
| 11:00 AM to 11:59 AM | 0 (0.0%) | 0 (0.0%) |
| 12:00 PM to 3:59 PM | 90 (24.3%) | 12 (2.7%) |
| 4:00 PM to 11:59 PM | 11 (3.0%) | 13 (2.9%) |
| Total | 370 (100.0%) | 450 (100.0%) |
Housing Occupancy in Greensboro
Occupancy by Ownership in Greensboro
Of the total 961 dwellings in Greensboro, owner-occupied units account for 462 (48.1%), while renter-occupied units make up 499 (51.9%).
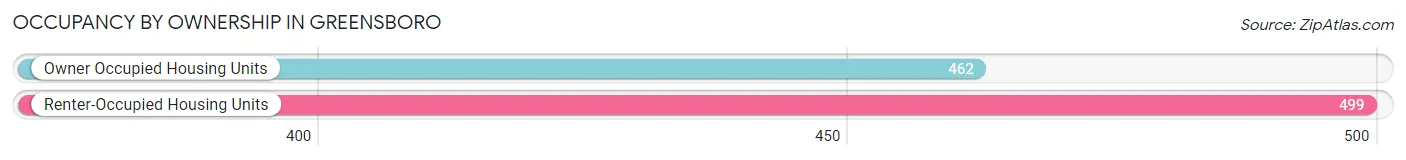
| Occupancy | # Housing Units | % Housing Units |
| Owner Occupied Housing Units | 462 | 48.1% |
| Renter-Occupied Housing Units | 499 | 51.9% |
| Total Occupied Housing Units | 961 | 100.0% |
Occupancy by Household Size in Greensboro
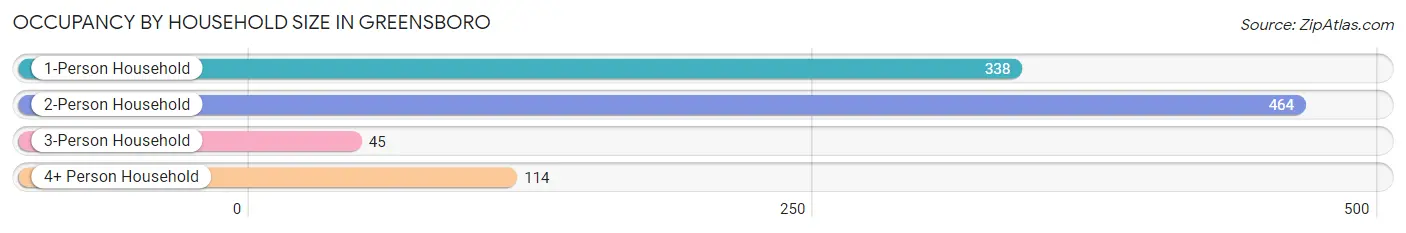
| Household Size | # Housing Units | % Housing Units |
| 1-Person Household | 338 | 35.2% |
| 2-Person Household | 464 | 48.3% |
| 3-Person Household | 45 | 4.7% |
| 4+ Person Household | 114 | 11.9% |
| Total Housing Units | 961 | 100.0% |
Occupancy by Ownership by Household Size in Greensboro
| Household Size | Owner-occupied | Renter-occupied |
| 1-Person Household | 175 (51.8%) | 163 (48.2%) |
| 2-Person Household | 191 (41.2%) | 273 (58.8%) |
| 3-Person Household | 38 (84.4%) | 7 (15.6%) |
| 4+ Person Household | 58 (50.9%) | 56 (49.1%) |
| Total Housing Units | 462 (48.1%) | 499 (51.9%) |
Occupancy by Educational Attainment in Greensboro
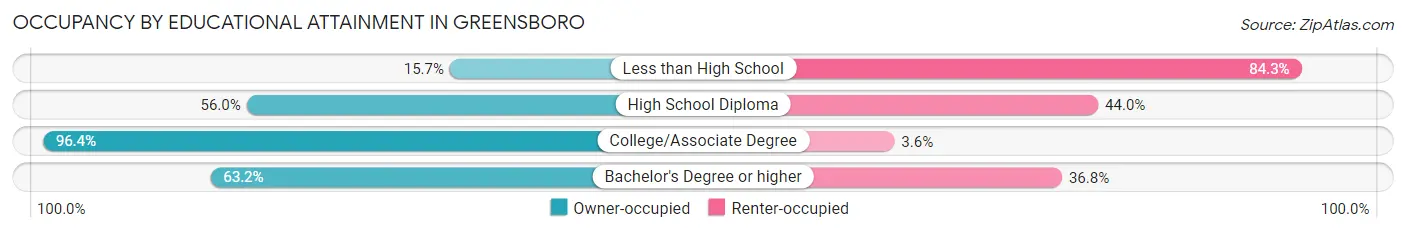
| Household Size | Owner-occupied | Renter-occupied |
| Less than High School | 54 (15.7%) | 290 (84.3%) |
| High School Diploma | 215 (56.0%) | 169 (44.0%) |
| College/Associate Degree | 133 (96.4%) | 5 (3.6%) |
| Bachelor's Degree or higher | 60 (63.2%) | 35 (36.8%) |
Occupancy by Age of Householder in Greensboro
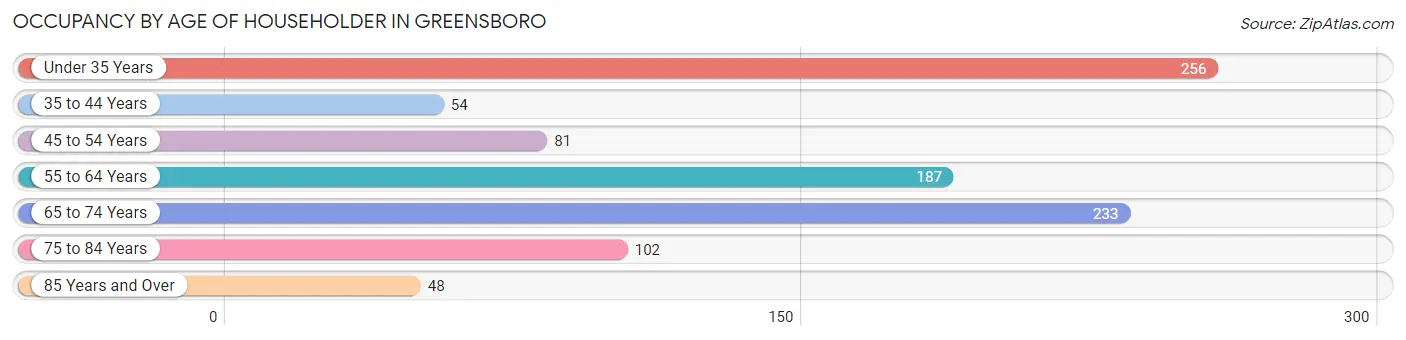
| Age Bracket | # Households | % Households |
| Under 35 Years | 256 | 26.6% |
| 35 to 44 Years | 54 | 5.6% |
| 45 to 54 Years | 81 | 8.4% |
| 55 to 64 Years | 187 | 19.5% |
| 65 to 74 Years | 233 | 24.2% |
| 75 to 84 Years | 102 | 10.6% |
| 85 Years and Over | 48 | 5.0% |
| Total | 961 | 100.0% |
Housing Finances in Greensboro
Median Income by Occupancy in Greensboro
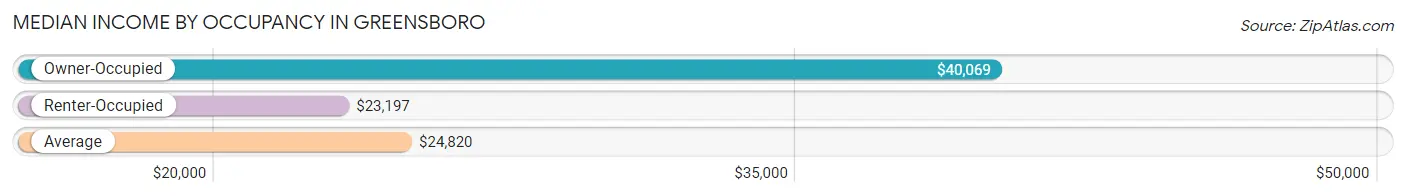
| Occupancy Type | # Households | Median Income |
| Owner-Occupied | 462 (48.1%) | $40,069 |
| Renter-Occupied | 499 (51.9%) | $23,197 |
| Average | 961 (100.0%) | $24,820 |
Occupancy by Householder Income Bracket in Greensboro
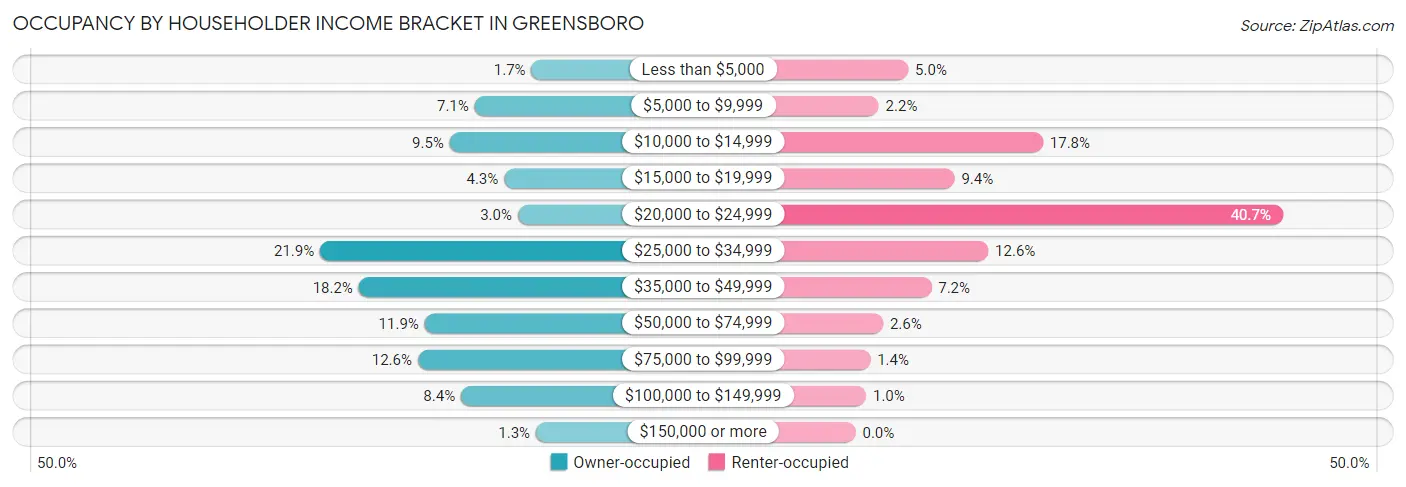
| Income Bracket | Owner-occupied | Renter-occupied |
| Less than $5,000 | 8 (1.7%) | 25 (5.0%) |
| $5,000 to $9,999 | 33 (7.1%) | 11 (2.2%) |
| $10,000 to $14,999 | 44 (9.5%) | 89 (17.8%) |
| $15,000 to $19,999 | 20 (4.3%) | 47 (9.4%) |
| $20,000 to $24,999 | 14 (3.0%) | 203 (40.7%) |
| $25,000 to $34,999 | 101 (21.9%) | 63 (12.6%) |
| $35,000 to $49,999 | 84 (18.2%) | 36 (7.2%) |
| $50,000 to $74,999 | 55 (11.9%) | 13 (2.6%) |
| $75,000 to $99,999 | 58 (12.6%) | 7 (1.4%) |
| $100,000 to $149,999 | 39 (8.4%) | 5 (1.0%) |
| $150,000 or more | 6 (1.3%) | 0 (0.0%) |
| Total | 462 (100.0%) | 499 (100.0%) |
Monthly Housing Cost Tiers in Greensboro
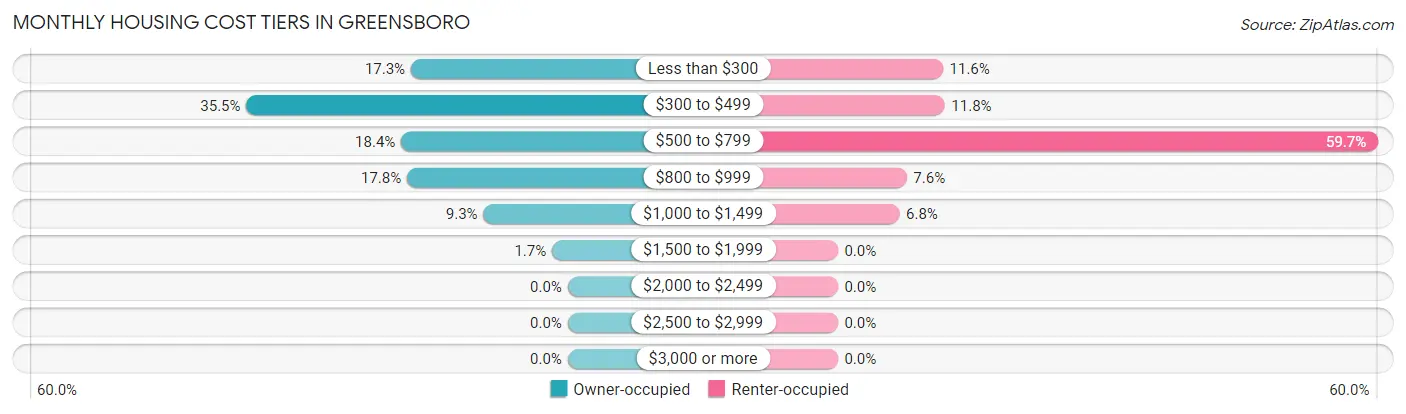
| Monthly Cost | Owner-occupied | Renter-occupied |
| Less than $300 | 80 (17.3%) | 58 (11.6%) |
| $300 to $499 | 164 (35.5%) | 59 (11.8%) |
| $500 to $799 | 85 (18.4%) | 298 (59.7%) |
| $800 to $999 | 82 (17.7%) | 38 (7.6%) |
| $1,000 to $1,499 | 43 (9.3%) | 34 (6.8%) |
| $1,500 to $1,999 | 8 (1.7%) | 0 (0.0%) |
| $2,000 to $2,499 | 0 (0.0%) | 0 (0.0%) |
| $2,500 to $2,999 | 0 (0.0%) | 0 (0.0%) |
| $3,000 or more | 0 (0.0%) | 0 (0.0%) |
| Total | 462 (100.0%) | 499 (100.0%) |
Physical Housing Characteristics in Greensboro
Housing Structures in Greensboro
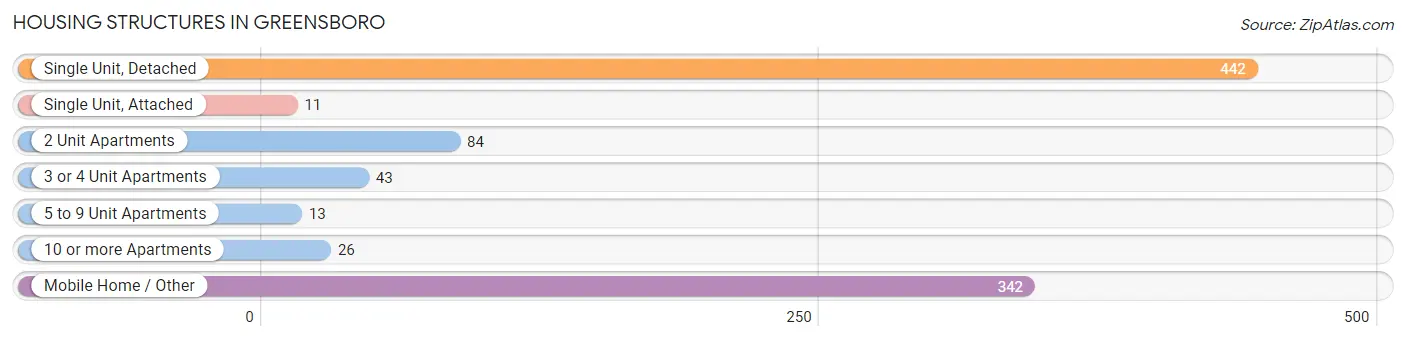
| Structure Type | # Housing Units | % Housing Units |
| Single Unit, Detached | 442 | 46.0% |
| Single Unit, Attached | 11 | 1.1% |
| 2 Unit Apartments | 84 | 8.7% |
| 3 or 4 Unit Apartments | 43 | 4.5% |
| 5 to 9 Unit Apartments | 13 | 1.3% |
| 10 or more Apartments | 26 | 2.7% |
| Mobile Home / Other | 342 | 35.6% |
| Total | 961 | 100.0% |
Housing Structures by Occupancy in Greensboro
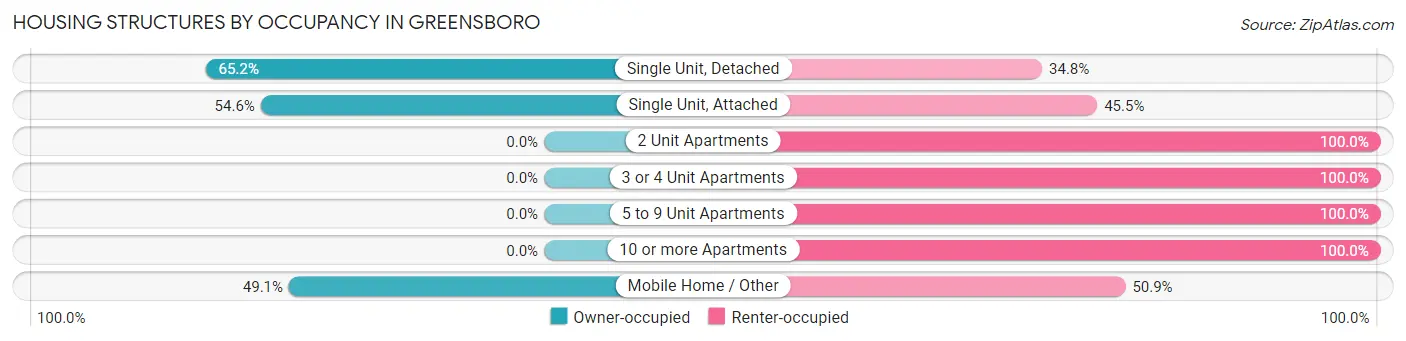
| Structure Type | Owner-occupied | Renter-occupied |
| Single Unit, Detached | 288 (65.2%) | 154 (34.8%) |
| Single Unit, Attached | 6 (54.5%) | 5 (45.5%) |
| 2 Unit Apartments | 0 (0.0%) | 84 (100.0%) |
| 3 or 4 Unit Apartments | 0 (0.0%) | 43 (100.0%) |
| 5 to 9 Unit Apartments | 0 (0.0%) | 13 (100.0%) |
| 10 or more Apartments | 0 (0.0%) | 26 (100.0%) |
| Mobile Home / Other | 168 (49.1%) | 174 (50.9%) |
| Total | 462 (48.1%) | 499 (51.9%) |
Housing Structures by Number of Rooms in Greensboro
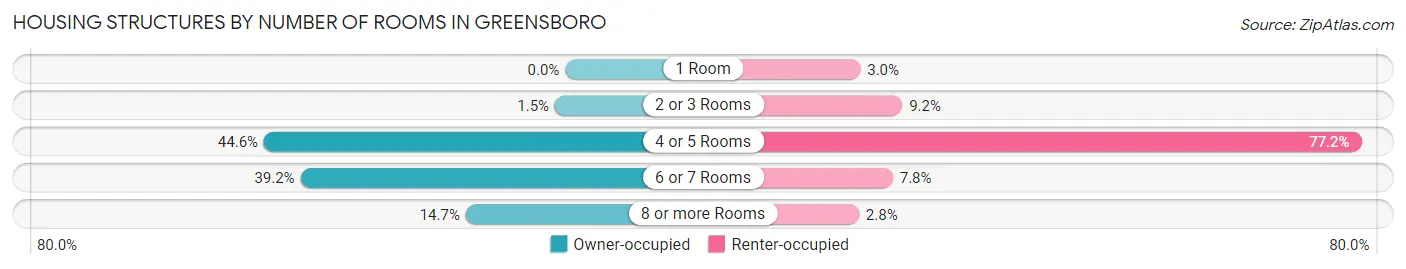
| Number of Rooms | Owner-occupied | Renter-occupied |
| 1 Room | 0 (0.0%) | 15 (3.0%) |
| 2 or 3 Rooms | 7 (1.5%) | 46 (9.2%) |
| 4 or 5 Rooms | 206 (44.6%) | 385 (77.1%) |
| 6 or 7 Rooms | 181 (39.2%) | 39 (7.8%) |
| 8 or more Rooms | 68 (14.7%) | 14 (2.8%) |
| Total | 462 (100.0%) | 499 (100.0%) |
Housing Structure by Heating Type in Greensboro
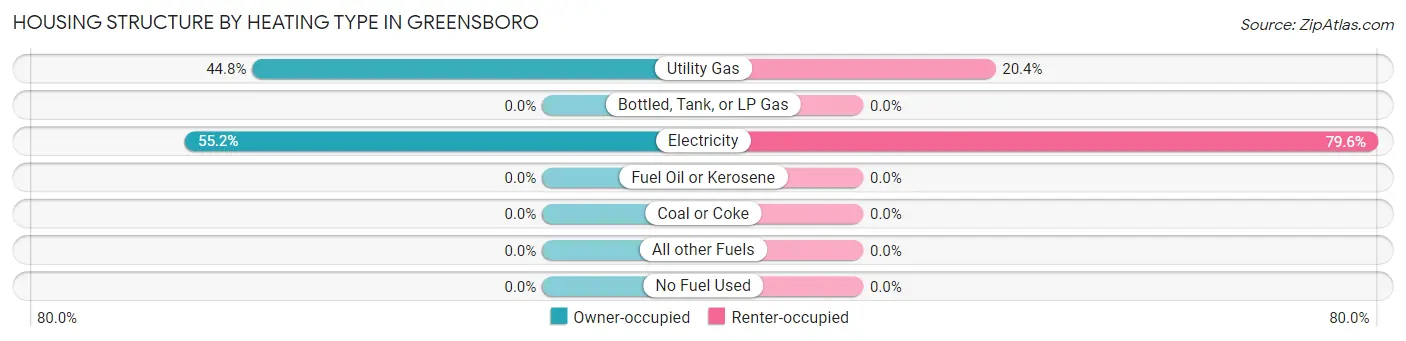
| Heating Type | Owner-occupied | Renter-occupied |
| Utility Gas | 207 (44.8%) | 102 (20.4%) |
| Bottled, Tank, or LP Gas | 0 (0.0%) | 0 (0.0%) |
| Electricity | 255 (55.2%) | 397 (79.6%) |
| Fuel Oil or Kerosene | 0 (0.0%) | 0 (0.0%) |
| Coal or Coke | 0 (0.0%) | 0 (0.0%) |
| All other Fuels | 0 (0.0%) | 0 (0.0%) |
| No Fuel Used | 0 (0.0%) | 0 (0.0%) |
| Total | 462 (100.0%) | 499 (100.0%) |
Household Vehicle Usage in Greensboro
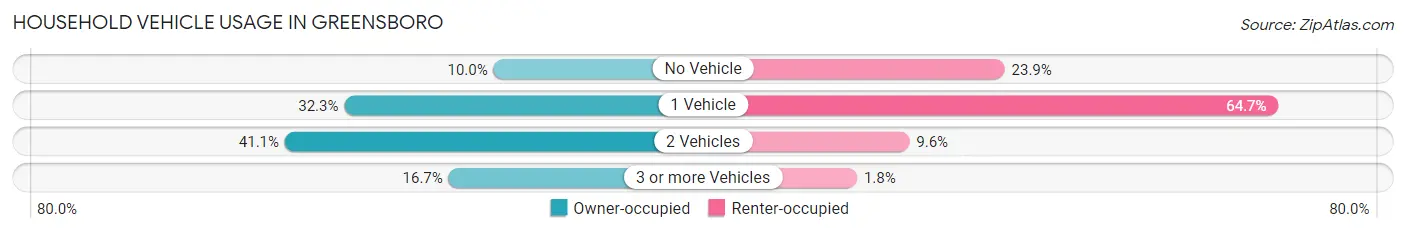
| Vehicles per Household | Owner-occupied | Renter-occupied |
| No Vehicle | 46 (10.0%) | 119 (23.8%) |
| 1 Vehicle | 149 (32.3%) | 323 (64.7%) |
| 2 Vehicles | 190 (41.1%) | 48 (9.6%) |
| 3 or more Vehicles | 77 (16.7%) | 9 (1.8%) |
| Total | 462 (100.0%) | 499 (100.0%) |
Real Estate & Mortgages in Greensboro
Real Estate and Mortgage Overview in Greensboro
| Characteristic | Without Mortgage | With Mortgage |
| Housing Units | 309 | 153 |
| Median Property Value | $95,000 | $79,500 |
| Median Household Income | $40,313 | $6 |
| Monthly Housing Costs | $380 | $0 |
| Real Estate Taxes | $432 | $51 |
Property Value by Mortgage Status in Greensboro
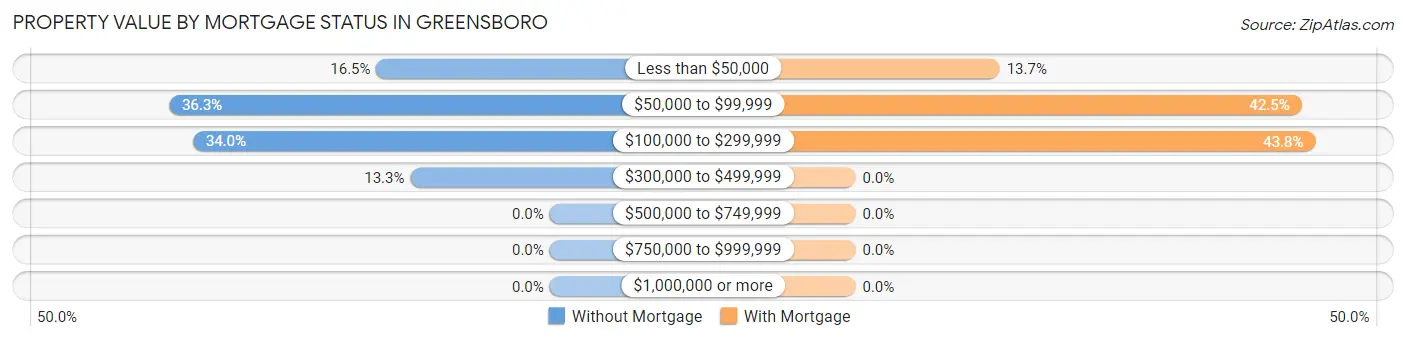
| Property Value | Without Mortgage | With Mortgage |
| Less than $50,000 | 51 (16.5%) | 21 (13.7%) |
| $50,000 to $99,999 | 112 (36.2%) | 65 (42.5%) |
| $100,000 to $299,999 | 105 (34.0%) | 67 (43.8%) |
| $300,000 to $499,999 | 41 (13.3%) | 0 (0.0%) |
| $500,000 to $749,999 | 0 (0.0%) | 0 (0.0%) |
| $750,000 to $999,999 | 0 (0.0%) | 0 (0.0%) |
| $1,000,000 or more | 0 (0.0%) | 0 (0.0%) |
| Total | 309 (100.0%) | 153 (100.0%) |
Household Income by Mortgage Status in Greensboro
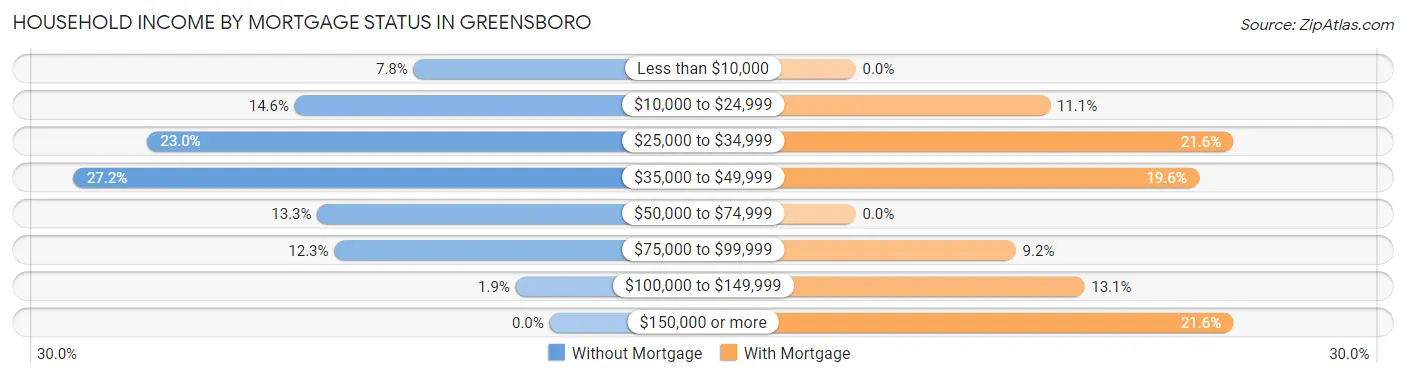
| Household Income | Without Mortgage | With Mortgage |
| Less than $10,000 | 24 (7.8%) | 0 (0.0%) |
| $10,000 to $24,999 | 45 (14.6%) | 17 (11.1%) |
| $25,000 to $34,999 | 71 (23.0%) | 33 (21.6%) |
| $35,000 to $49,999 | 84 (27.2%) | 30 (19.6%) |
| $50,000 to $74,999 | 41 (13.3%) | 0 (0.0%) |
| $75,000 to $99,999 | 38 (12.3%) | 14 (9.1%) |
| $100,000 to $149,999 | 6 (1.9%) | 20 (13.1%) |
| $150,000 or more | 0 (0.0%) | 33 (21.6%) |
| Total | 309 (100.0%) | 153 (100.0%) |
Property Value to Household Income Ratio in Greensboro
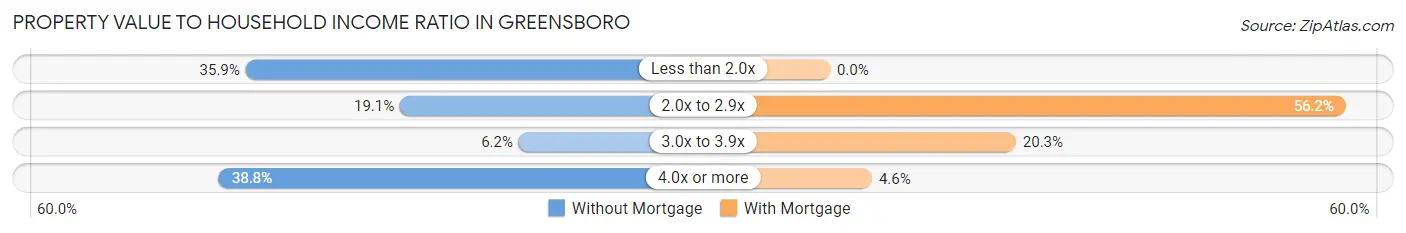
| Value-to-Income Ratio | Without Mortgage | With Mortgage |
| Less than 2.0x | 111 (35.9%) | 0 (0.0%) |
| 2.0x to 2.9x | 59 (19.1%) | 86 (56.2%) |
| 3.0x to 3.9x | 19 (6.1%) | 31 (20.3%) |
| 4.0x or more | 120 (38.8%) | 7 (4.6%) |
| Total | 309 (100.0%) | 153 (100.0%) |
Real Estate Taxes by Mortgage Status in Greensboro
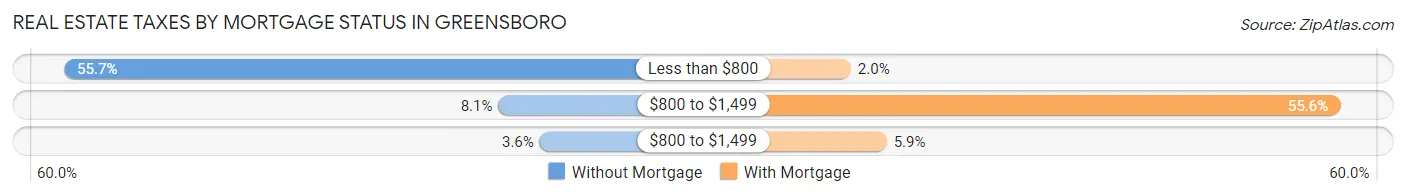
| Property Taxes | Without Mortgage | With Mortgage |
| Less than $800 | 172 (55.7%) | 3 (2.0%) |
| $800 to $1,499 | 25 (8.1%) | 85 (55.6%) |
| $800 to $1,499 | 11 (3.6%) | 9 (5.9%) |
| Total | 309 (100.0%) | 153 (100.0%) |
Health & Disability in Greensboro
Health Insurance Coverage by Age in Greensboro
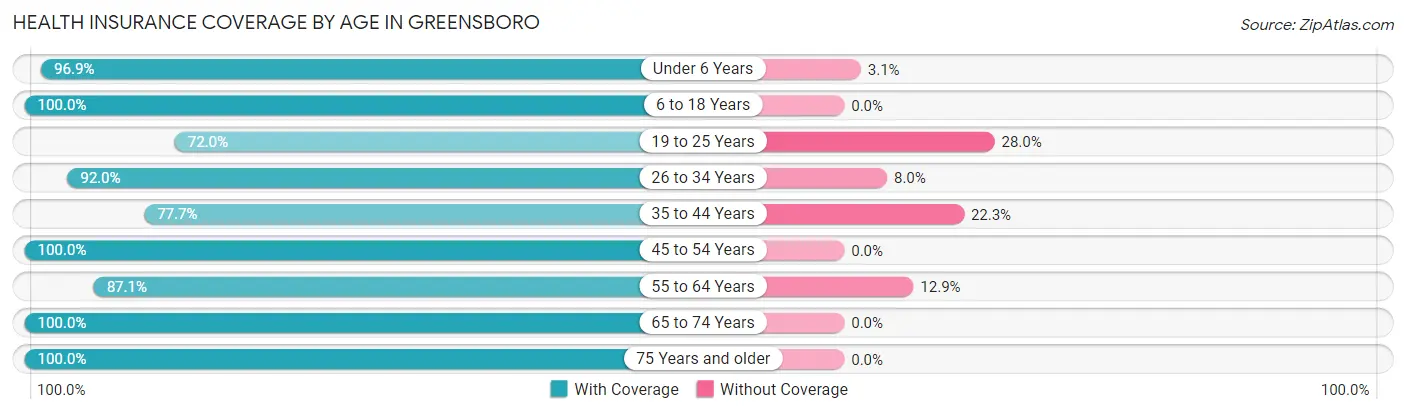
| Age Bracket | With Coverage | Without Coverage |
| Under 6 Years | 157 (96.9%) | 5 (3.1%) |
| 6 to 18 Years | 314 (100.0%) | 0 (0.0%) |
| 19 to 25 Years | 131 (72.0%) | 51 (28.0%) |
| 26 to 34 Years | 427 (92.0%) | 37 (8.0%) |
| 35 to 44 Years | 195 (77.7%) | 56 (22.3%) |
| 45 to 54 Years | 121 (100.0%) | 0 (0.0%) |
| 55 to 64 Years | 277 (87.1%) | 41 (12.9%) |
| 65 to 74 Years | 329 (100.0%) | 0 (0.0%) |
| 75 Years and older | 176 (100.0%) | 0 (0.0%) |
| Total | 2,127 (91.8%) | 190 (8.2%) |
Health Insurance Coverage by Citizenship Status in Greensboro
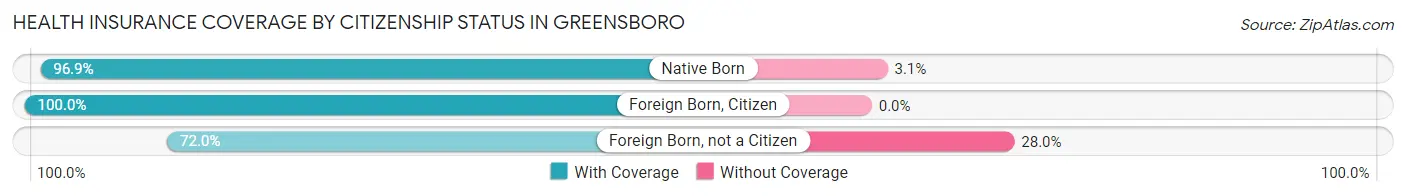
| Citizenship Status | With Coverage | Without Coverage |
| Native Born | 157 (96.9%) | 5 (3.1%) |
| Foreign Born, Citizen | 314 (100.0%) | 0 (0.0%) |
| Foreign Born, not a Citizen | 131 (72.0%) | 51 (28.0%) |
Health Insurance Coverage by Household Income in Greensboro
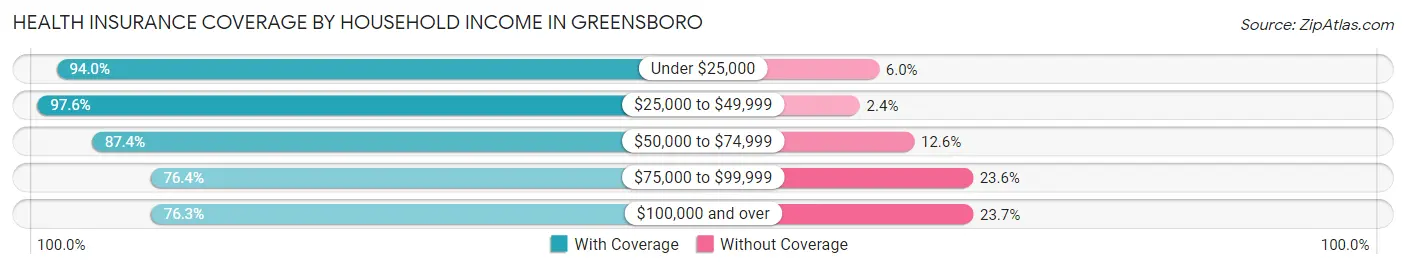
| Household Income | With Coverage | Without Coverage |
| Under $25,000 | 846 (94.0%) | 54 (6.0%) |
| $25,000 to $49,999 | 850 (97.6%) | 21 (2.4%) |
| $50,000 to $74,999 | 111 (87.4%) | 16 (12.6%) |
| $75,000 to $99,999 | 149 (76.4%) | 46 (23.6%) |
| $100,000 and over | 171 (76.3%) | 53 (23.7%) |
Public vs Private Health Insurance Coverage by Age in Greensboro
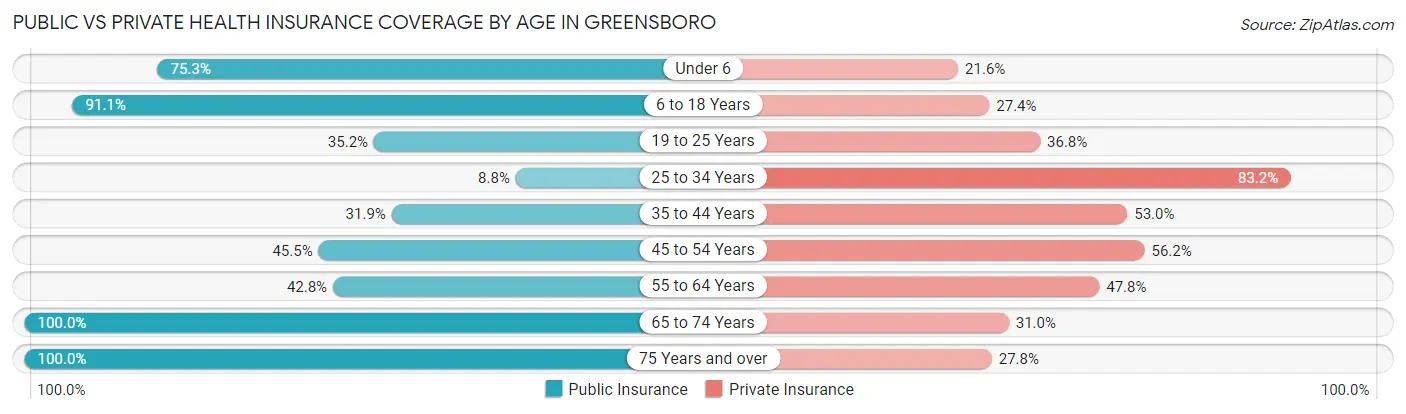
| Age Bracket | Public Insurance | Private Insurance |
| Under 6 | 122 (75.3%) | 35 (21.6%) |
| 6 to 18 Years | 286 (91.1%) | 86 (27.4%) |
| 19 to 25 Years | 64 (35.2%) | 67 (36.8%) |
| 25 to 34 Years | 41 (8.8%) | 386 (83.2%) |
| 35 to 44 Years | 80 (31.9%) | 133 (53.0%) |
| 45 to 54 Years | 55 (45.5%) | 68 (56.2%) |
| 55 to 64 Years | 136 (42.8%) | 152 (47.8%) |
| 65 to 74 Years | 329 (100.0%) | 102 (31.0%) |
| 75 Years and over | 176 (100.0%) | 49 (27.8%) |
| Total | 1,289 (55.6%) | 1,078 (46.5%) |
Disability Status by Sex by Age in Greensboro
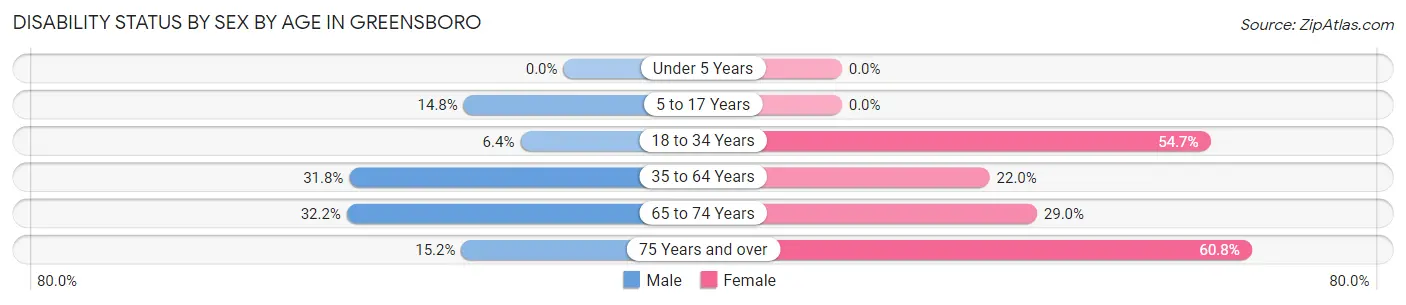
| Age Bracket | Male | Female |
| Under 5 Years | 0 (0.0%) | 0 (0.0%) |
| 5 to 17 Years | 36 (14.8%) | 0 (0.0%) |
| 18 to 34 Years | 21 (6.4%) | 174 (54.7%) |
| 35 to 64 Years | 76 (31.8%) | 99 (22.0%) |
| 65 to 74 Years | 37 (32.2%) | 62 (29.0%) |
| 75 Years and over | 5 (15.1%) | 87 (60.8%) |
Disability Class by Sex by Age in Greensboro
Disability Class: Hearing Difficulty
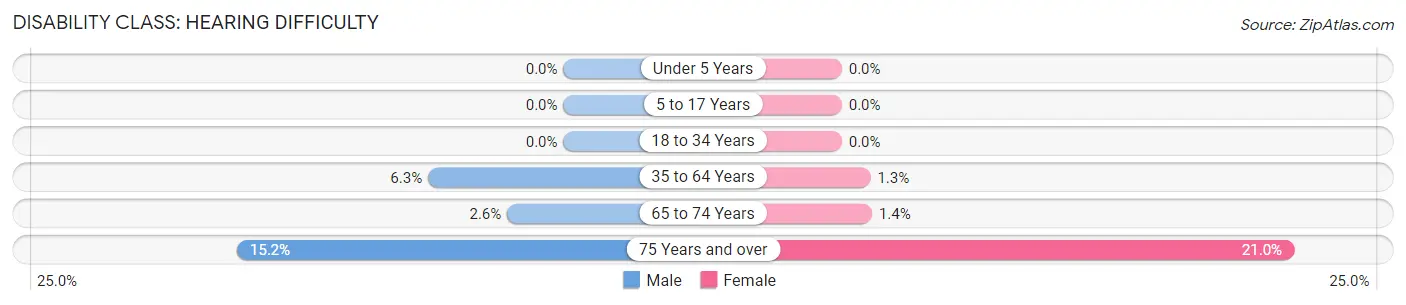
| Age Bracket | Male | Female |
| Under 5 Years | 0 (0.0%) | 0 (0.0%) |
| 5 to 17 Years | 0 (0.0%) | 0 (0.0%) |
| 18 to 34 Years | 0 (0.0%) | 0 (0.0%) |
| 35 to 64 Years | 15 (6.3%) | 6 (1.3%) |
| 65 to 74 Years | 3 (2.6%) | 3 (1.4%) |
| 75 Years and over | 5 (15.1%) | 30 (21.0%) |
Disability Class: Vision Difficulty
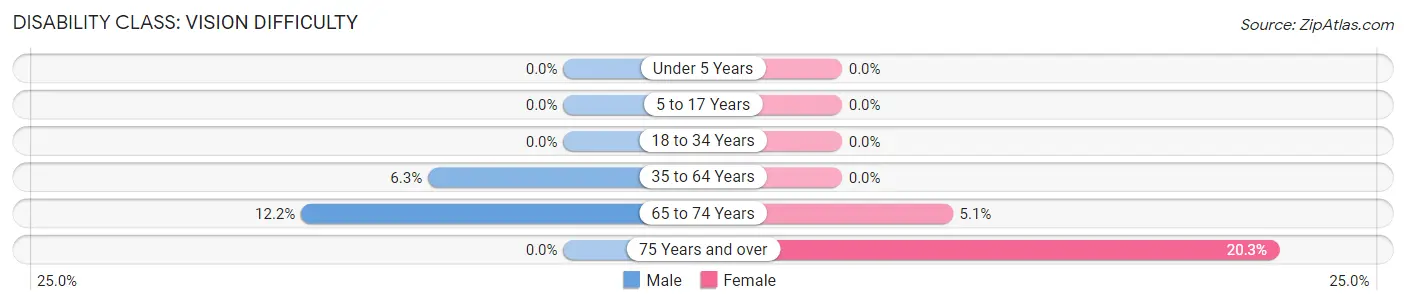
| Age Bracket | Male | Female |
| Under 5 Years | 0 (0.0%) | 0 (0.0%) |
| 5 to 17 Years | 0 (0.0%) | 0 (0.0%) |
| 18 to 34 Years | 0 (0.0%) | 0 (0.0%) |
| 35 to 64 Years | 15 (6.3%) | 0 (0.0%) |
| 65 to 74 Years | 14 (12.2%) | 11 (5.1%) |
| 75 Years and over | 0 (0.0%) | 29 (20.3%) |
Disability Class: Cognitive Difficulty
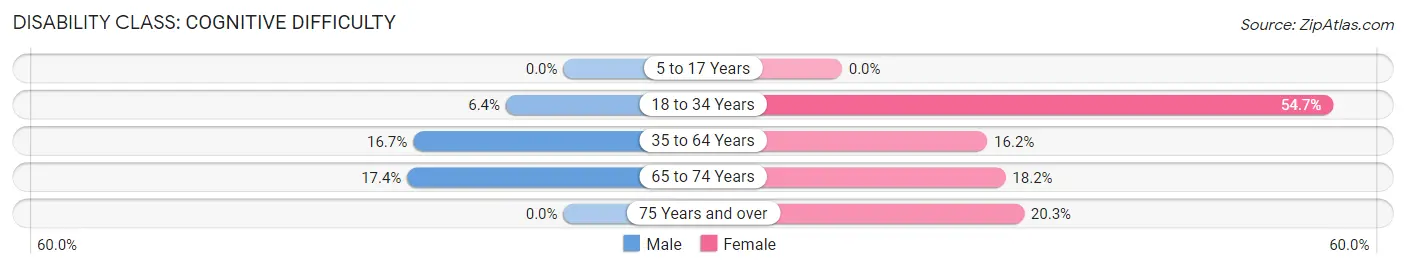
| Age Bracket | Male | Female |
| 5 to 17 Years | 0 (0.0%) | 0 (0.0%) |
| 18 to 34 Years | 21 (6.4%) | 174 (54.7%) |
| 35 to 64 Years | 40 (16.7%) | 73 (16.2%) |
| 65 to 74 Years | 20 (17.4%) | 39 (18.2%) |
| 75 Years and over | 0 (0.0%) | 29 (20.3%) |
Disability Class: Ambulatory Difficulty
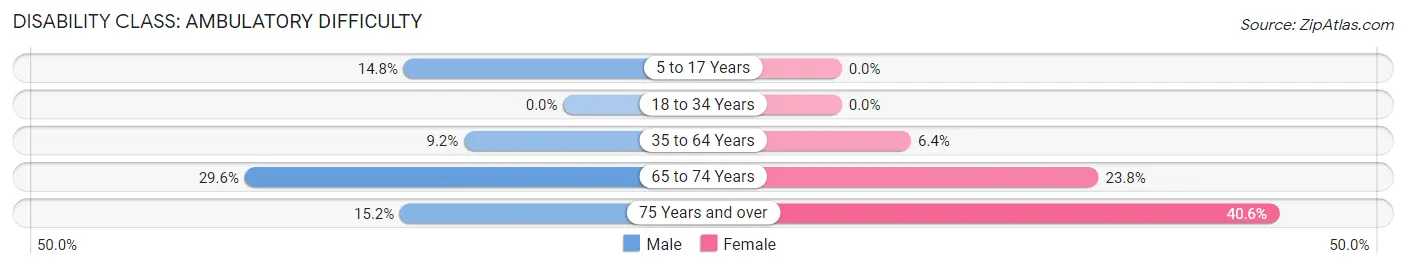
| Age Bracket | Male | Female |
| 5 to 17 Years | 36 (14.8%) | 0 (0.0%) |
| 18 to 34 Years | 0 (0.0%) | 0 (0.0%) |
| 35 to 64 Years | 22 (9.2%) | 29 (6.4%) |
| 65 to 74 Years | 34 (29.6%) | 51 (23.8%) |
| 75 Years and over | 5 (15.1%) | 58 (40.6%) |
Disability Class: Self-Care Difficulty
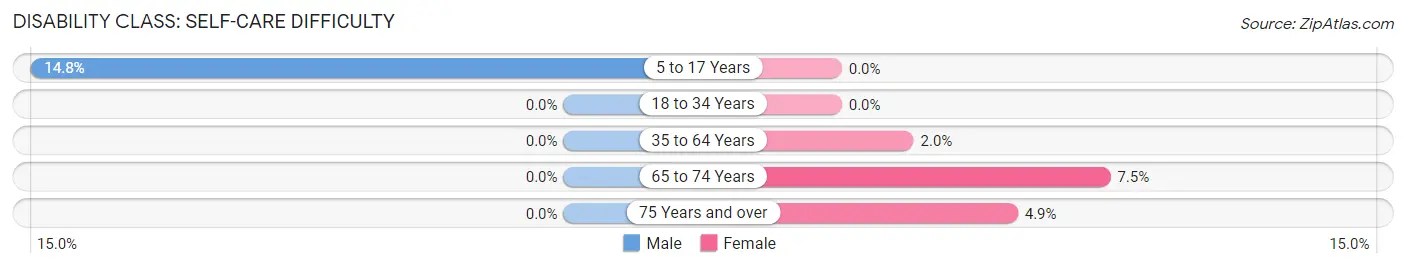
| Age Bracket | Male | Female |
| 5 to 17 Years | 36 (14.8%) | 0 (0.0%) |
| 18 to 34 Years | 0 (0.0%) | 0 (0.0%) |
| 35 to 64 Years | 0 (0.0%) | 9 (2.0%) |
| 65 to 74 Years | 0 (0.0%) | 16 (7.5%) |
| 75 Years and over | 0 (0.0%) | 7 (4.9%) |
Technology Access in Greensboro
Computing Device Access in Greensboro
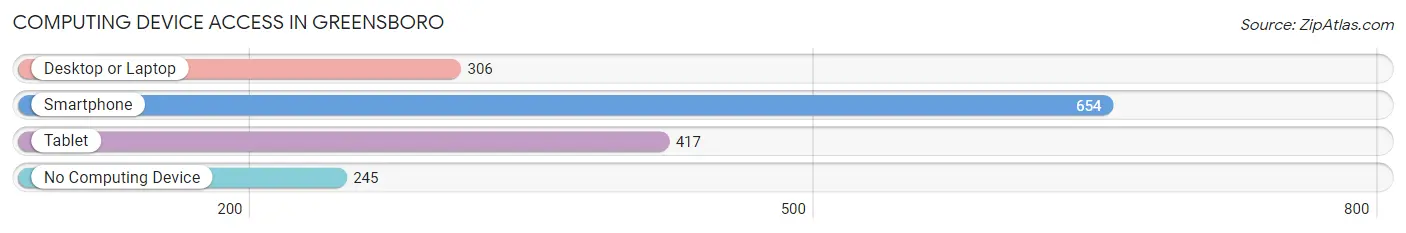
| Device Type | # Households | % Households |
| Desktop or Laptop | 306 | 31.8% |
| Smartphone | 654 | 68.0% |
| Tablet | 417 | 43.4% |
| No Computing Device | 245 | 25.5% |
| Total | 961 | 100.0% |
Internet Access in Greensboro
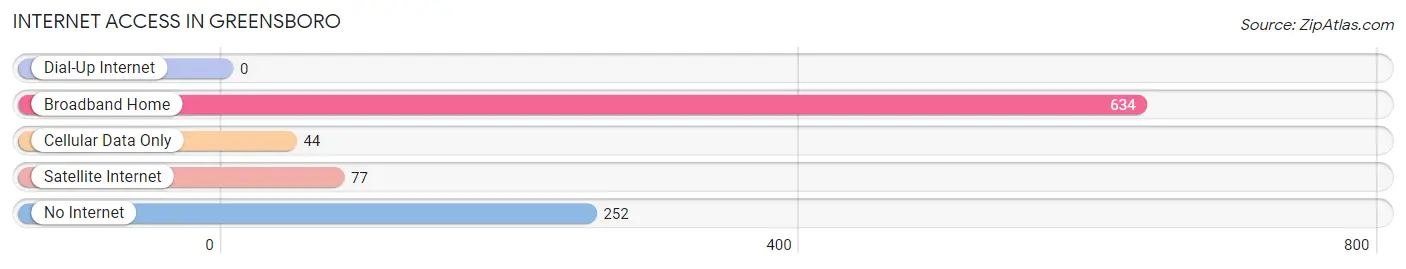
| Internet Type | # Households | % Households |
| Dial-Up Internet | 0 | 0.0% |
| Broadband Home | 634 | 66.0% |
| Cellular Data Only | 44 | 4.6% |
| Satellite Internet | 77 | 8.0% |
| No Internet | 252 | 26.2% |
| Total | 961 | 100.0% |
Greensboro Summary
Greensboro is a small town located in Hale County, Alabama. It is situated in the Black Belt region of the state, and is the county seat of Hale County. The town was founded in 1823 and is named after General Nathanael Greene, a Revolutionary War hero. The population of Greensboro was 2,731 at the 2010 census.
Geography
Greensboro is located at 32°38'45" North, 87°37'45" West (32.6459, -87.6294). It is situated in the Black Belt region of Alabama, and is the county seat of Hale County. The town is located on the banks of the Tombigbee River, and is surrounded by rolling hills and forests. The climate is humid subtropical, with hot summers and mild winters.
Economy
Greensboro's economy is largely based on agriculture. The town is home to several large farms, and the surrounding area is known for its cotton, corn, and soybean production. The town is also home to several small businesses, including a grocery store, a hardware store, and a few restaurants.
Demographics
As of the 2010 census, the population of Greensboro was 2,731. The racial makeup of the town was 57.3% White, 40.2% African American, 0.2% Native American, 0.3% Asian, 0.1% Pacific Islander, 0.7% from other races, and 1.4% from two or more races. Hispanic or Latino of any race were 1.7% of the population.
The median income for a household in Greensboro was $25,938, and the median income for a family was $31,250. Males had a median income of $27,500 versus $20,000 for females. The per capita income for the town was $13,945. About 22.2% of families and 25.2% of the population were below the poverty line, including 33.3% of those under age 18 and 20.2% of those age 65 or over.
History
Greensboro was founded in 1823 and is named after General Nathanael Greene, a Revolutionary War hero. The town was originally known as "Greene'sborough," but the name was later shortened to Greensboro. The town was incorporated in 1824, and the first courthouse was built in 1825.
Greensboro was an important center of the cotton trade in the 19th century, and the town was home to several large plantations. The town was also a major stop on the Mobile and Ohio Railroad, which connected the town to other parts of the state.
Greensboro was the site of a major battle during the Civil War. On April 3, 1865, Confederate forces under General Nathan Bedford Forrest attacked the town in an attempt to disrupt Union supply lines. The Union forces were able to repel the attack, and the town was spared from destruction.
Greensboro continued to grow in the late 19th and early 20th centuries, and the town was home to several large businesses, including a cotton mill, a lumber mill, and a brick factory. The town also had several schools, churches, and a hospital.
Greensboro has remained a small town, and the population has remained relatively stable over the past few decades. The town is home to several historic buildings, including the Hale County Courthouse, which was built in 1825. The town is also home to several churches, including the First United Methodist Church, which was founded in 1824.
Common Questions
What is Per Capita Income in Greensboro?
Per Capita income in Greensboro is $16,852.
What is the Median Family Income in Greensboro?
Median Family Income in Greensboro is $41,159.
What is the Median Household income in Greensboro?
Median Household Income in Greensboro is $24,820.
What is Inequality or Gini Index in Greensboro?
Inequality or Gini Index in Greensboro is 0.41.
What is the Total Population of Greensboro?
Total Population of Greensboro is 2,417.
What is the Total Male Population of Greensboro?
Total Male Population of Greensboro is 1,084.
What is the Total Female Population of Greensboro?
Total Female Population of Greensboro is 1,333.
What is the Ratio of Males per 100 Females in Greensboro?
There are 81.32 Males per 100 Females in Greensboro.
What is the Ratio of Females per 100 Males in Greensboro?
There are 122.97 Females per 100 Males in Greensboro.
What is the Median Population Age in Greensboro?
Median Population Age in Greensboro is 36.9 Years.
What is the Average Family Size in Greensboro
Average Family Size in Greensboro is 3.8 People.
What is the Average Household Size in Greensboro
Average Household Size in Greensboro is 2.4 People.
How Large is the Labor Force in Greensboro?
There are 970 People in the Labor Forcein in Greensboro.
What is the Percentage of People in the Labor Force in Greensboro?
49.1% of People are in the Labor Force in Greensboro.
What is the Unemployment Rate in Greensboro?
Unemployment Rate in Greensboro is 9.7%.