Sibley, ND Map & Demographics
Sibley Map
Sibley Overview
$33,400
PER CAPITA INCOME
$54,583
AVG FAMILY INCOME
$53,333
AVG HOUSEHOLD INCOME
0.30
INEQUALITY / GINI INDEX
18
TOTAL POPULATION
9
MALE POPULATION
9
FEMALE POPULATION
100.00
MALES / 100 FEMALES
100.00
FEMALES / 100 MALES
63.7
MEDIAN AGE
2.1
AVG FAMILY SIZE
1.8
AVG HOUSEHOLD SIZE
6
LABOR FORCE [ PEOPLE ]
37.5%
PERCENT IN LABOR FORCE
Sibley Area Codes
Income in Sibley
Income Overview in Sibley
Per Capita Income in Sibley is $33,400, while median incomes of families and households are $54,583 and $53,333 respectively.
| Characteristic | Number | Measure |
| Per Capita Income | 18 | $33,400 |
| Median Family Income | 7 | $54,583 |
| Mean Family Income | 7 | $80,286 |
| Median Household Income | 10 | $53,333 |
| Mean Household Income | 10 | $66,420 |
| Income Deficit | 7 | $0 |
| Wage / Income Gap (%) | 18 | 0.00% |
| Wage / Income Gap ($) | 18 | 100.00¢ per $1 |
| Gini / Inequality Index | 18 | 0.30 |
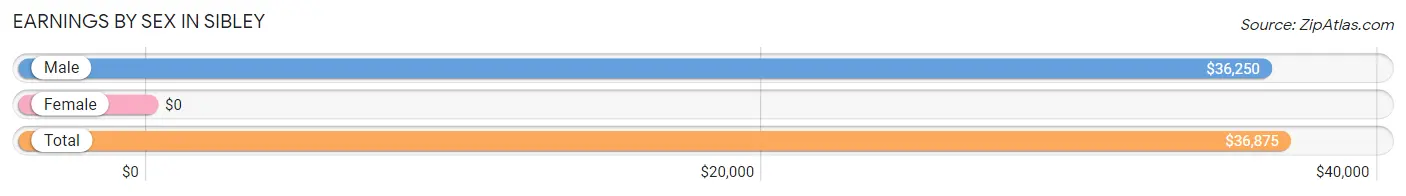
Earnings by Sex in Sibley
| Sex | Number | Average Earnings |
| Male | 4 (57.1%) | $36,250 |
| Female | 3 (42.9%) | $0 |
| Total | 7 (100.0%) | $36,875 |
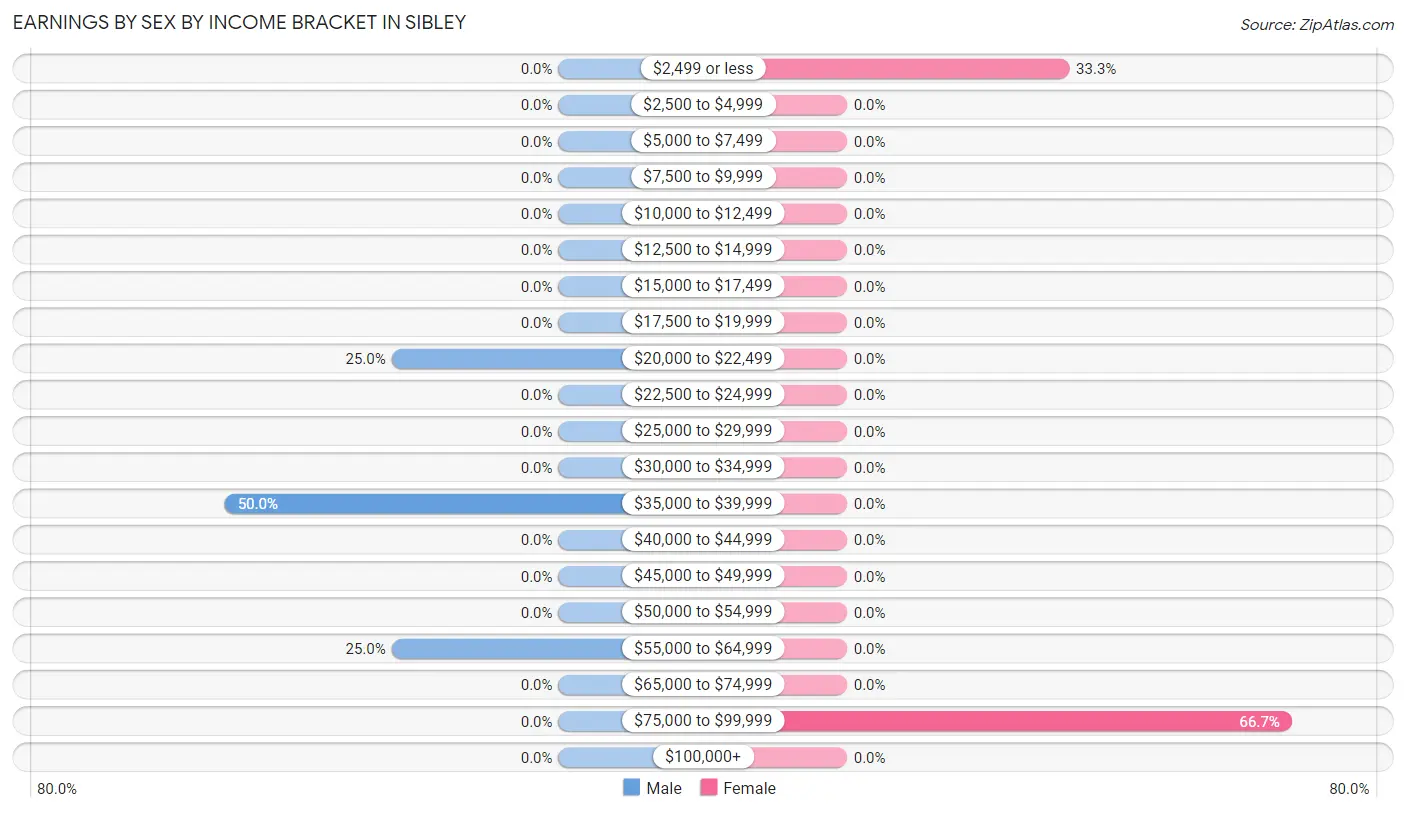
Earnings by Sex by Income Bracket in Sibley
The most common earnings brackets in Sibley are $35,000 to $39,999 for men (2 | 50.0%) and $75,000 to $99,999 for women (2 | 66.7%).
| Income | Male | Female |
| $2,499 or less | 0 (0.0%) | 1 (33.3%) |
| $2,500 to $4,999 | 0 (0.0%) | 0 (0.0%) |
| $5,000 to $7,499 | 0 (0.0%) | 0 (0.0%) |
| $7,500 to $9,999 | 0 (0.0%) | 0 (0.0%) |
| $10,000 to $12,499 | 0 (0.0%) | 0 (0.0%) |
| $12,500 to $14,999 | 0 (0.0%) | 0 (0.0%) |
| $15,000 to $17,499 | 0 (0.0%) | 0 (0.0%) |
| $17,500 to $19,999 | 0 (0.0%) | 0 (0.0%) |
| $20,000 to $22,499 | 1 (25.0%) | 0 (0.0%) |
| $22,500 to $24,999 | 0 (0.0%) | 0 (0.0%) |
| $25,000 to $29,999 | 0 (0.0%) | 0 (0.0%) |
| $30,000 to $34,999 | 0 (0.0%) | 0 (0.0%) |
| $35,000 to $39,999 | 2 (50.0%) | 0 (0.0%) |
| $40,000 to $44,999 | 0 (0.0%) | 0 (0.0%) |
| $45,000 to $49,999 | 0 (0.0%) | 0 (0.0%) |
| $50,000 to $54,999 | 0 (0.0%) | 0 (0.0%) |
| $55,000 to $64,999 | 1 (25.0%) | 0 (0.0%) |
| $65,000 to $74,999 | 0 (0.0%) | 0 (0.0%) |
| $75,000 to $99,999 | 0 (0.0%) | 2 (66.7%) |
| $100,000+ | 0 (0.0%) | 0 (0.0%) |
| Total | 4 (100.0%) | 3 (100.0%) |
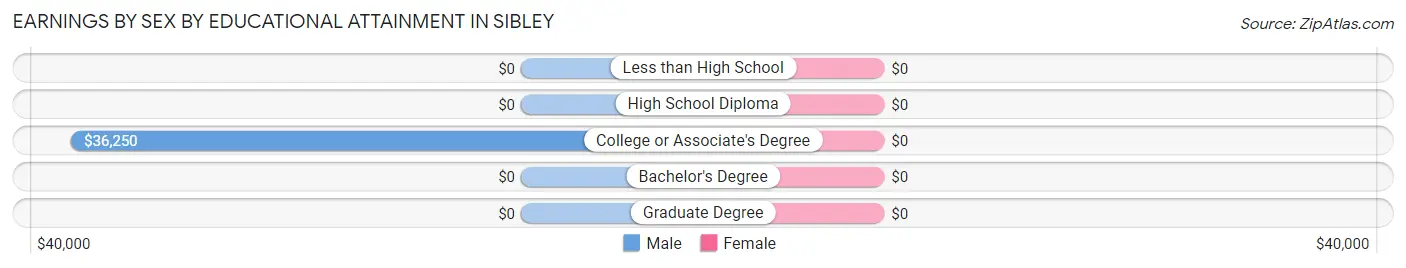
Earnings by Sex by Educational Attainment in Sibley
| Educational Attainment | Male Income | Female Income |
| Less than High School | - | - |
| High School Diploma | - | - |
| College or Associate's Degree | $36,250 | $0 |
| Bachelor's Degree | - | - |
| Graduate Degree | - | - |
| Total | $36,250 | $0 |
Family Income in Sibley
Family Income Brackets in Sibley
According to the Sibley family income data, there are 4 families falling into the $50,000 to $74,999 income range, which is the most common income bracket and makes up 57.1% of all families.
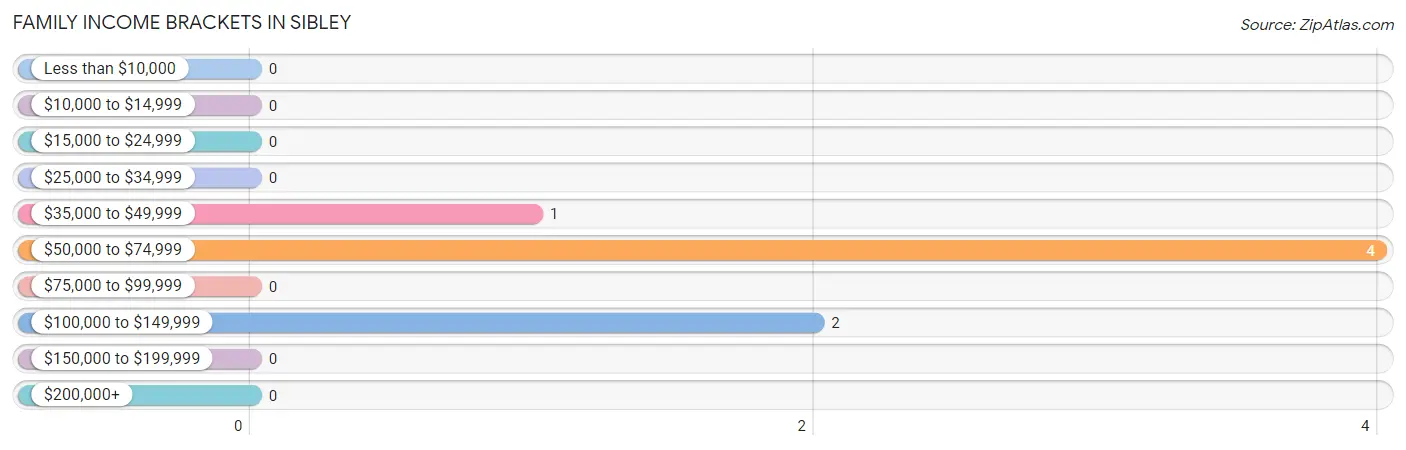
| Income Bracket | # Families | % Families |
| Less than $10,000 | 0 | 0.0% |
| $10,000 to $14,999 | 0 | 0.0% |
| $15,000 to $24,999 | 0 | 0.0% |
| $25,000 to $34,999 | 0 | 0.0% |
| $35,000 to $49,999 | 1 | 14.3% |
| $50,000 to $74,999 | 4 | 57.1% |
| $75,000 to $99,999 | 0 | 0.0% |
| $100,000 to $149,999 | 2 | 28.6% |
| $150,000 to $199,999 | 0 | 0.0% |
| $200,000+ | 0 | 0.0% |
Family Income by Famaliy Size in Sibley
| Income Bracket | # Families | Median Income |
| 2-Person Families | 6 (85.7%) | $0 |
| 3-Person Families | 1 (14.3%) | $0 |
| 4-Person Families | 0 (0.0%) | $0 |
| 5-Person Families | 0 (0.0%) | $0 |
| 6-Person Families | 0 (0.0%) | $0 |
| 7+ Person Families | 0 (0.0%) | $0 |
| Total | 7 (100.0%) | $54,583 |
Family Income by Number of Earners in Sibley
| Number of Earners | # Families | Median Income |
| No Earners | 4 (57.1%) | $0 |
| 1 Earner | 0 (0.0%) | $0 |
| 2 Earners | 3 (42.9%) | $0 |
| 3+ Earners | 0 (0.0%) | $0 |
| Total | 7 (100.0%) | $54,583 |
Household Income in Sibley
Household Income Brackets in Sibley
With 4 households falling in the category, the $50,000 to $74,999 income range is the most frequent in Sibley, accounting for 40.0% of all households.
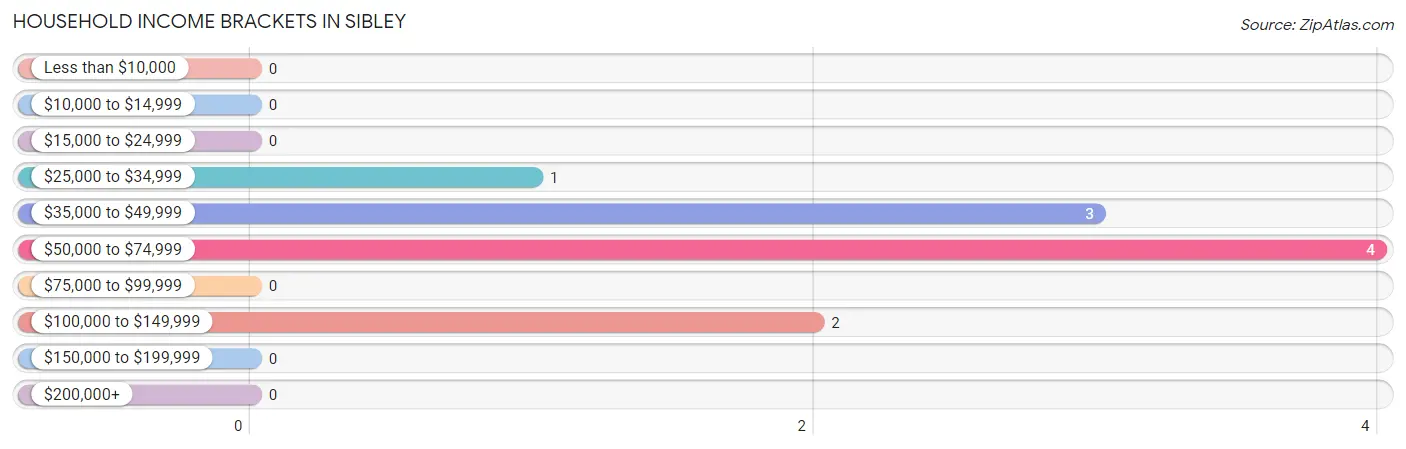
| Income Bracket | # Households | % Households |
| Less than $10,000 | 0 | 0.0% |
| $10,000 to $14,999 | 0 | 0.0% |
| $15,000 to $24,999 | 0 | 0.0% |
| $25,000 to $34,999 | 1 | 10.0% |
| $35,000 to $49,999 | 3 | 30.0% |
| $50,000 to $74,999 | 4 | 40.0% |
| $75,000 to $99,999 | 0 | 0.0% |
| $100,000 to $149,999 | 2 | 20.0% |
| $150,000 to $199,999 | 0 | 0.0% |
| $200,000+ | 0 | 0.0% |
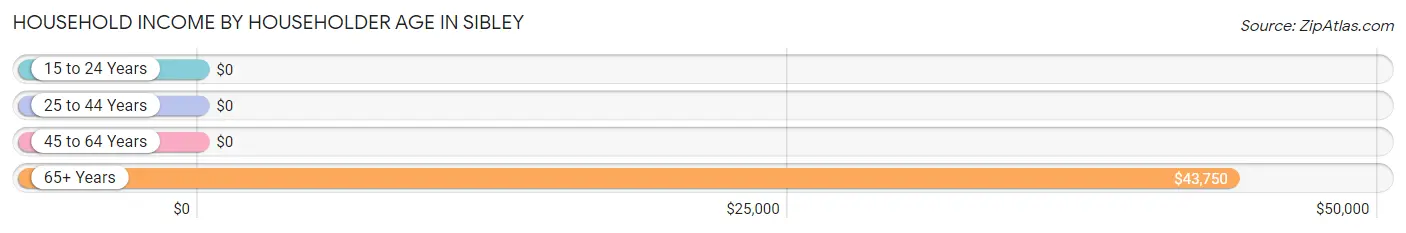
Household Income by Householder Age in Sibley
The median household income in Sibley is $53,333, with the highest median household income of $43,750 found in the 65+ years age bracket for the primary householder. A total of 3 households (30.0%) fall into this category.
| Income Bracket | # Households | Median Income |
| 15 to 24 Years | 0 (0.0%) | $0 |
| 25 to 44 Years | 2 (20.0%) | $0 |
| 45 to 64 Years | 5 (50.0%) | $0 |
| 65+ Years | 3 (30.0%) | $43,750 |
| Total | 10 (100.0%) | $53,333 |
Poverty in Sibley
Income Below Poverty by Sex and Age in Sibley
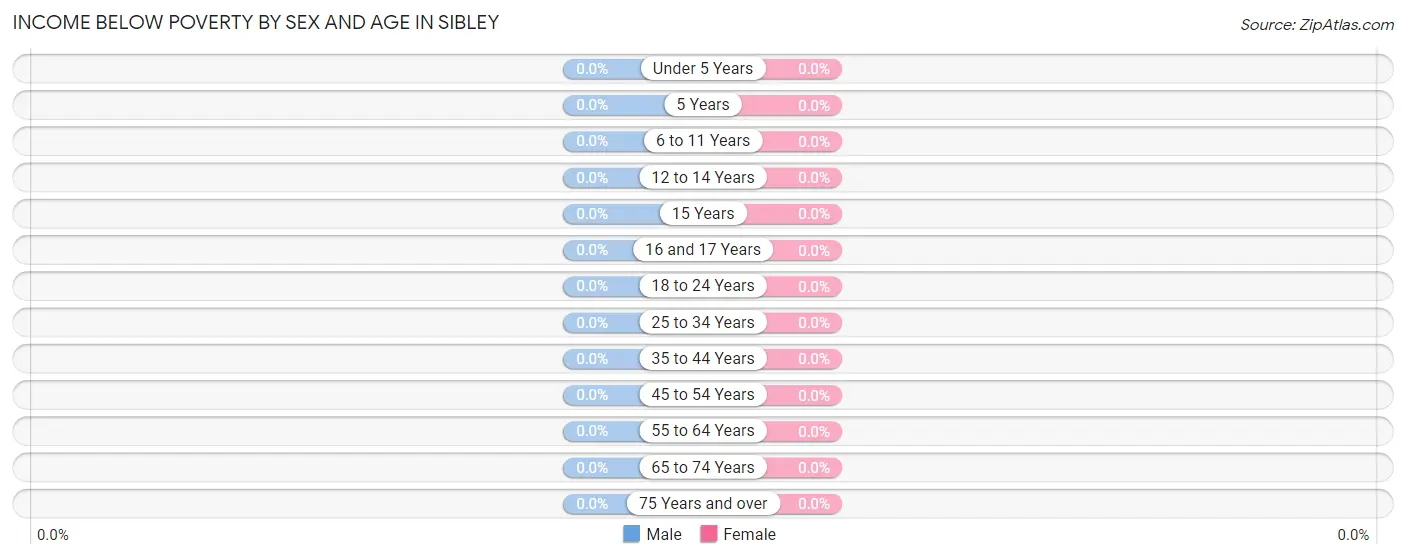
| Age Bracket | Male | Female |
| Under 5 Years | 0 (0.0%) | 0 (0.0%) |
| 5 Years | 0 (0.0%) | 0 (0.0%) |
| 6 to 11 Years | 0 (0.0%) | 0 (0.0%) |
| 12 to 14 Years | 0 (0.0%) | 0 (0.0%) |
| 15 Years | 0 (0.0%) | 0 (0.0%) |
| 16 and 17 Years | 0 (0.0%) | 0 (0.0%) |
| 18 to 24 Years | 0 (0.0%) | 0 (0.0%) |
| 25 to 34 Years | 0 (0.0%) | 0 (0.0%) |
| 35 to 44 Years | 0 (0.0%) | 0 (0.0%) |
| 45 to 54 Years | 0 (0.0%) | 0 (0.0%) |
| 55 to 64 Years | 0 (0.0%) | 0 (0.0%) |
| 65 to 74 Years | 0 (0.0%) | 0 (0.0%) |
| 75 Years and over | 0 (0.0%) | 0 (0.0%) |
| Total | 0 (0.0%) | 0 (0.0%) |
Income Above Poverty by Sex and Age in Sibley
According to the poverty statistics in Sibley, males aged 25 to 34 years and females aged 12 to 14 years are the age groups that are most secure financially, with 100.0% of males and 100.0% of females in these age groups living above the poverty line.
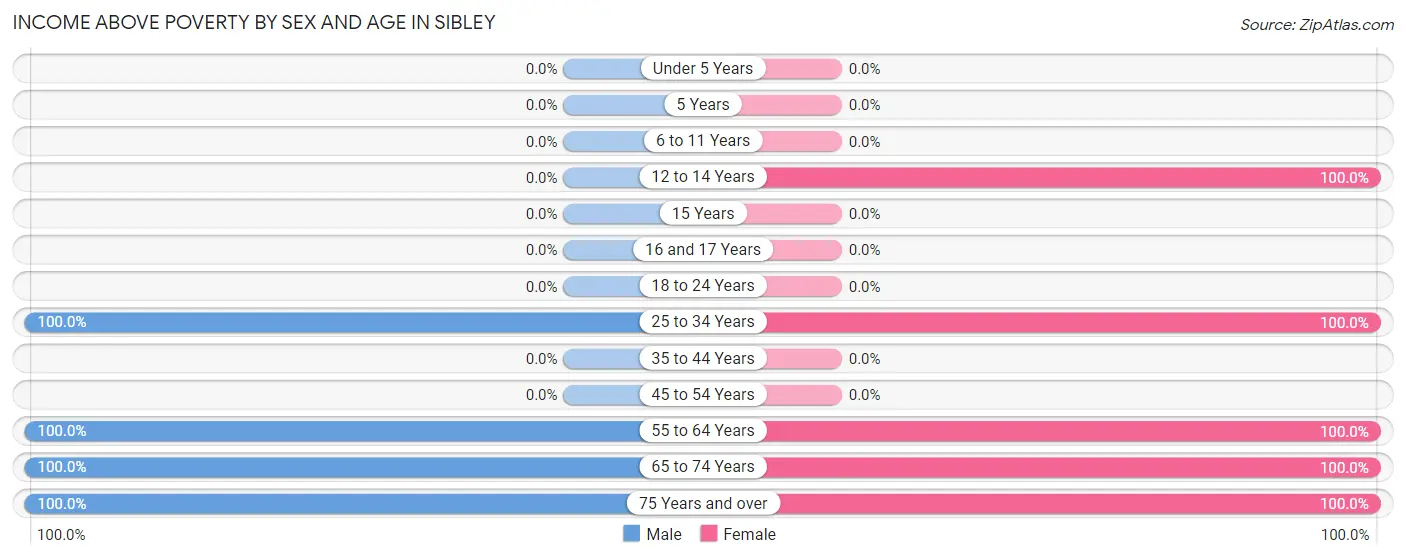
| Age Bracket | Male | Female |
| Under 5 Years | 0 (0.0%) | 0 (0.0%) |
| 5 Years | 0 (0.0%) | 0 (0.0%) |
| 6 to 11 Years | 0 (0.0%) | 0 (0.0%) |
| 12 to 14 Years | 0 (0.0%) | 2 (100.0%) |
| 15 Years | 0 (0.0%) | 0 (0.0%) |
| 16 and 17 Years | 0 (0.0%) | 0 (0.0%) |
| 18 to 24 Years | 0 (0.0%) | 0 (0.0%) |
| 25 to 34 Years | 1 (100.0%) | 2 (100.0%) |
| 35 to 44 Years | 0 (0.0%) | 0 (0.0%) |
| 45 to 54 Years | 0 (0.0%) | 0 (0.0%) |
| 55 to 64 Years | 5 (100.0%) | 3 (100.0%) |
| 65 to 74 Years | 1 (100.0%) | 1 (100.0%) |
| 75 Years and over | 2 (100.0%) | 1 (100.0%) |
| Total | 9 (100.0%) | 9 (100.0%) |
Income Below Poverty Among Married-Couple Families in Sibley
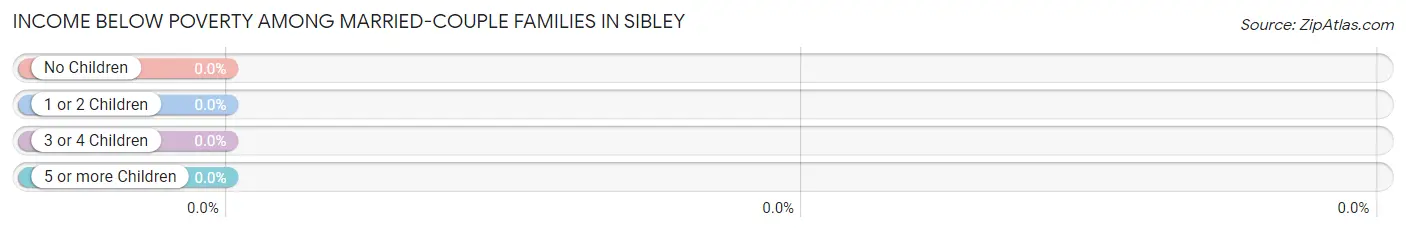
| Children | Above Poverty | Below Poverty |
| No Children | 6 (100.0%) | 0 (0.0%) |
| 1 or 2 Children | 1 (100.0%) | 0 (0.0%) |
| 3 or 4 Children | 0 (0.0%) | 0 (0.0%) |
| 5 or more Children | 0 (0.0%) | 0 (0.0%) |
| Total | 7 (100.0%) | 0 (0.0%) |
Income Below Poverty Among Single-Parent Households in Sibley
| Children | Single Father | Single Mother |
| No Children | 0 (0.0%) | 0 (0.0%) |
| 1 or 2 Children | 0 (0.0%) | 0 (0.0%) |
| 3 or 4 Children | 0 (0.0%) | 0 (0.0%) |
| 5 or more Children | 0 (0.0%) | 0 (0.0%) |
| Total | 0 (0.0%) | 0 (0.0%) |
Income Below Poverty Among Married-Couple vs Single-Parent Households in Sibley
| Children | Married-Couple Families | Single-Parent Households |
| No Children | 0 (0.0%) | 0 (0.0%) |
| 1 or 2 Children | 0 (0.0%) | 0 (0.0%) |
| 3 or 4 Children | 0 (0.0%) | 0 (0.0%) |
| 5 or more Children | 0 (0.0%) | 0 (0.0%) |
| Total | 0 (0.0%) | 0 (0.0%) |
Race in Sibley
The most populous races in Sibley are White / Caucasian (17 | 94.4%), and Native / Alaskan (1 | 5.6%).
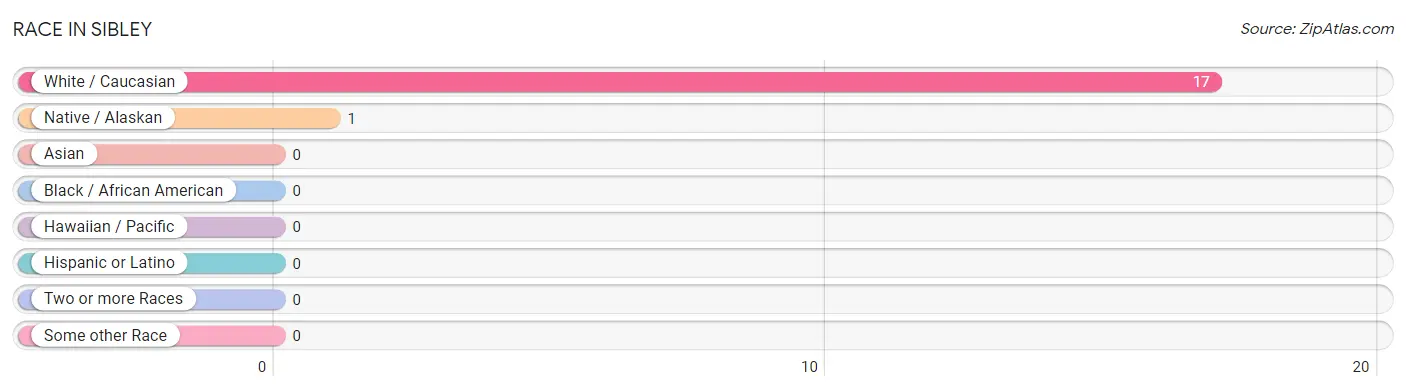
| Race | # Population | % Population |
| Asian | 0 | 0.0% |
| Black / African American | 0 | 0.0% |
| Hawaiian / Pacific | 0 | 0.0% |
| Hispanic or Latino | 0 | 0.0% |
| Native / Alaskan | 1 | 5.6% |
| White / Caucasian | 17 | 94.4% |
| Two or more Races | 0 | 0.0% |
| Some other Race | 0 | 0.0% |
| Total | 18 | 100.0% |
Ancestry in Sibley
The most populous ancestries reported in Sibley are Norwegian (9 | 50.0%), German (7 | 38.9%), French Canadian (3 | 16.7%), English (2 | 11.1%), and Chippewa (1 | 5.6%), together accounting for 122.2% of all Sibley residents.
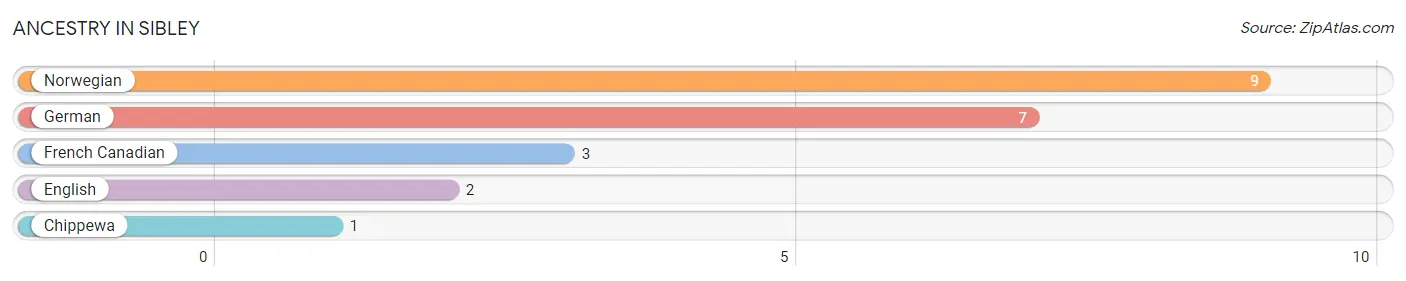
| Ancestry | # Population | % Population |
| Chippewa | 1 | 5.6% |
| English | 2 | 11.1% |
| French Canadian | 3 | 16.7% |
| German | 7 | 38.9% |
| Norwegian | 9 | 50.0% | View All 5 Rows |
Immigrants in Sibley

| Immigration Origin | # Population | % Population | View All 0 Rows |
Sex and Age in Sibley
Sex and Age in Sibley
The most populous age groups in Sibley are 60 to 64 Years (3 | 33.3%) for men and 60 to 64 Years (3 | 33.3%) for women.
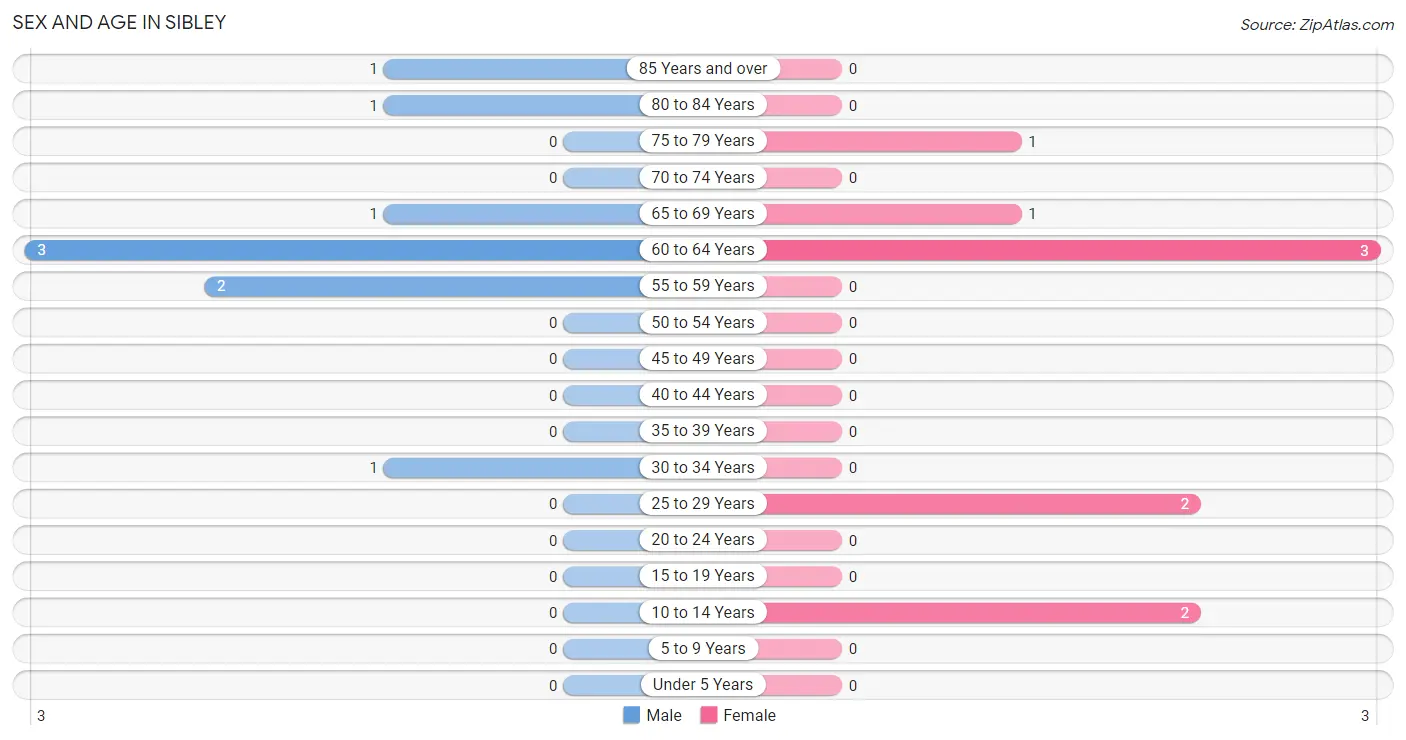
| Age Bracket | Male | Female |
| Under 5 Years | 0 (0.0%) | 0 (0.0%) |
| 5 to 9 Years | 0 (0.0%) | 0 (0.0%) |
| 10 to 14 Years | 0 (0.0%) | 2 (22.2%) |
| 15 to 19 Years | 0 (0.0%) | 0 (0.0%) |
| 20 to 24 Years | 0 (0.0%) | 0 (0.0%) |
| 25 to 29 Years | 0 (0.0%) | 2 (22.2%) |
| 30 to 34 Years | 1 (11.1%) | 0 (0.0%) |
| 35 to 39 Years | 0 (0.0%) | 0 (0.0%) |
| 40 to 44 Years | 0 (0.0%) | 0 (0.0%) |
| 45 to 49 Years | 0 (0.0%) | 0 (0.0%) |
| 50 to 54 Years | 0 (0.0%) | 0 (0.0%) |
| 55 to 59 Years | 2 (22.2%) | 0 (0.0%) |
| 60 to 64 Years | 3 (33.3%) | 3 (33.3%) |
| 65 to 69 Years | 1 (11.1%) | 1 (11.1%) |
| 70 to 74 Years | 0 (0.0%) | 0 (0.0%) |
| 75 to 79 Years | 0 (0.0%) | 1 (11.1%) |
| 80 to 84 Years | 1 (11.1%) | 0 (0.0%) |
| 85 Years and over | 1 (11.1%) | 0 (0.0%) |
| Total | 9 (100.0%) | 9 (100.0%) |
Families and Households in Sibley
Median Family Size in Sibley
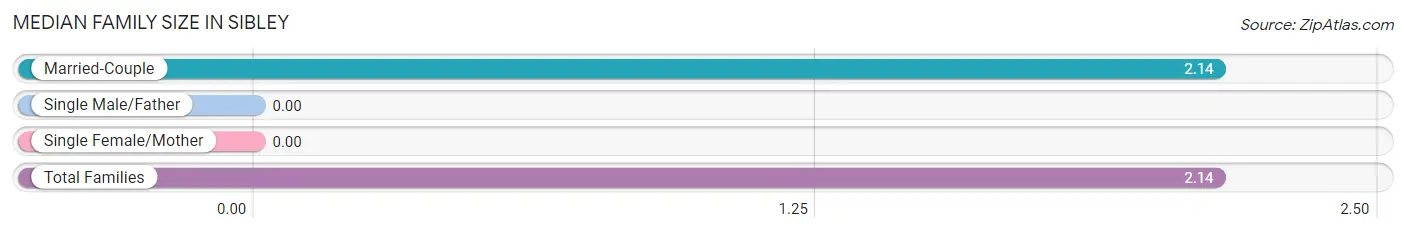
| Family Type | # Families | Family Size |
| Married-Couple | 7 (100.0%) | 2.14 |
| Single Male/Father | 0 (0.0%) | - |
| Single Female/Mother | 0 (0.0%) | - |
| Total Families | 7 (100.0%) | 2.14 |
Median Household Size in Sibley
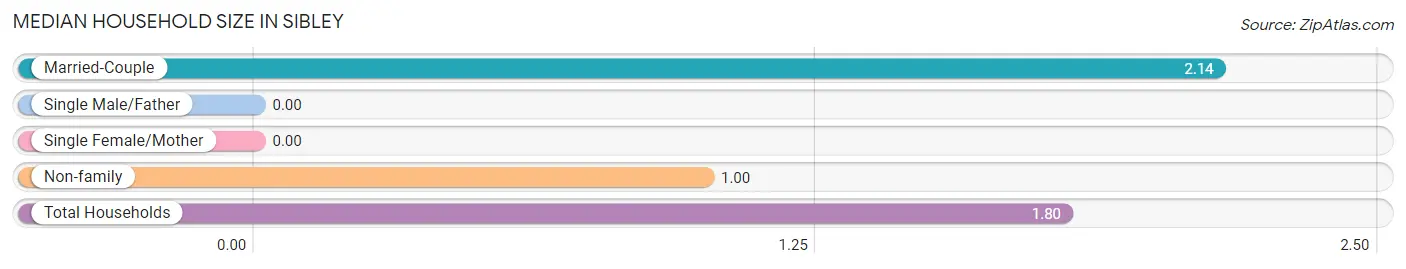
| Household Type | # Households | Household Size |
| Married-Couple | 7 (70.0%) | 2.14 |
| Single Male/Father | 0 (0.0%) | - |
| Single Female/Mother | 0 (0.0%) | - |
| Non-family | 3 (30.0%) | 1.00 |
| Total Households | 10 (100.0%) | 1.80 |
Household Size by Marriage Status in Sibley
Out of a total of 10 households in Sibley, 7 (70.0%) are family households, while 3 (30.0%) are nonfamily households. The most numerous type of family households are 2-person households, comprising 6, and the most common type of nonfamily households are 1-person households, comprising 3.
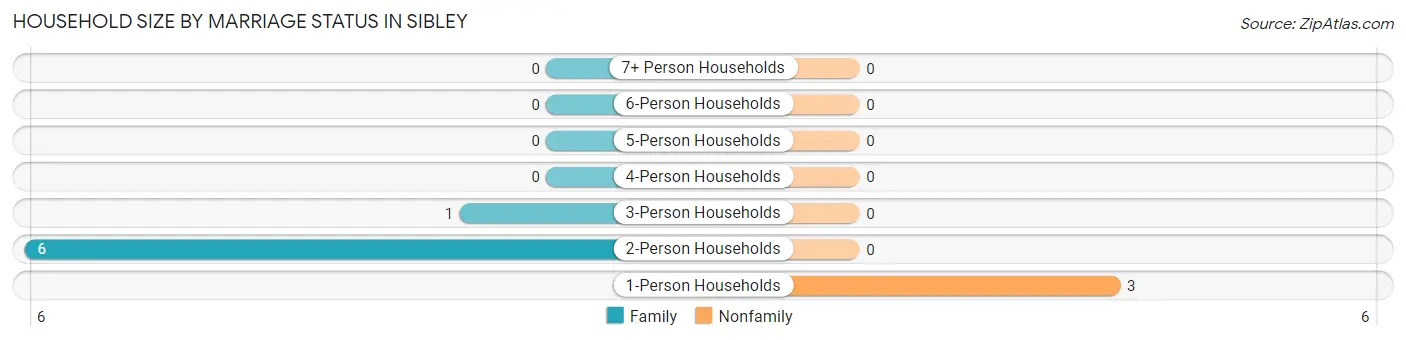
| Household Size | Family Households | Nonfamily Households |
| 1-Person Households | - | 3 (30.0%) |
| 2-Person Households | 6 (60.0%) | 0 (0.0%) |
| 3-Person Households | 1 (10.0%) | 0 (0.0%) |
| 4-Person Households | 0 (0.0%) | 0 (0.0%) |
| 5-Person Households | 0 (0.0%) | 0 (0.0%) |
| 6-Person Households | 0 (0.0%) | 0 (0.0%) |
| 7+ Person Households | 0 (0.0%) | 0 (0.0%) |
| Total | 7 (70.0%) | 3 (30.0%) |
Female Fertility in Sibley
Fertility by Age in Sibley
| Age Bracket | Women with Births | Births / 1,000 Women |
| 15 to 19 years | 0 (0.0%) | 0.0 |
| 20 to 34 years | 0 (0.0%) | 0.0 |
| 35 to 50 years | 0 (0.0%) | 0.0 |
| Total | 0 (0.0%) | 0.0 |
Fertility by Age by Marriage Status in Sibley
| Age Bracket | Married | Unmarried |
| 15 to 19 years | 0 (0.0%) | 0 (0.0%) |
| 20 to 34 years | 0 (0.0%) | 0 (0.0%) |
| 35 to 50 years | 0 (0.0%) | 0 (0.0%) |
| Total | 0 (0.0%) | 0 (0.0%) |
Fertility by Education in Sibley
| Educational Attainment | Women with Births | Births / 1,000 Women |
| Less than High School | 0 (0.0%) | 0.0 |
| High School Diploma | 0 (0.0%) | 0.0 |
| College or Associate's Degree | 0 (0.0%) | 0.0 |
| Bachelor's Degree | 0 (0.0%) | 0.0 |
| Graduate Degree | 0 (0.0%) | 0.0 |
| Total | 0 (0.0%) | 0.0 |
Fertility by Education by Marriage Status in Sibley
| Educational Attainment | Married | Unmarried |
| Less than High School | 0 (0.0%) | 0 (0.0%) |
| High School Diploma | 0 (0.0%) | 0 (0.0%) |
| College or Associate's Degree | 0 (0.0%) | 0 (0.0%) |
| Bachelor's Degree | 0 (0.0%) | 0 (0.0%) |
| Graduate Degree | 0 (0.0%) | 0 (0.0%) |
| Total | 0 (0.0%) | 0 (0.0%) |
Employment Characteristics in Sibley
Employment by Class of Employer in Sibley
Among the 4 employed individuals in Sibley, not-for-profit organizations (2 | 50.0%), private company employees (1 | 25.0%), and state government employees (1 | 25.0%) make up the most common classes of employment.
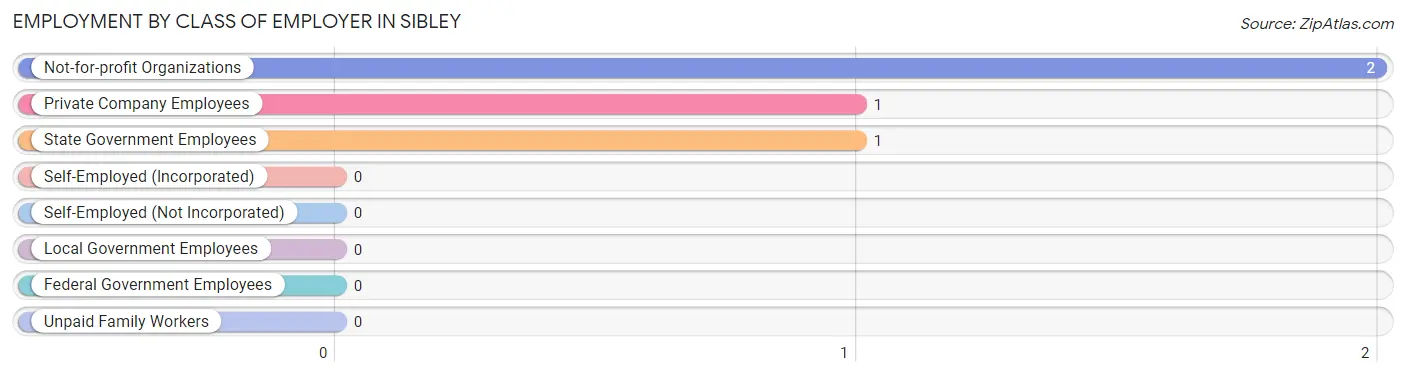
| Employer Class | # Employees | % Employees |
| Private Company Employees | 1 | 25.0% |
| Self-Employed (Incorporated) | 0 | 0.0% |
| Self-Employed (Not Incorporated) | 0 | 0.0% |
| Not-for-profit Organizations | 2 | 50.0% |
| Local Government Employees | 0 | 0.0% |
| State Government Employees | 1 | 25.0% |
| Federal Government Employees | 0 | 0.0% |
| Unpaid Family Workers | 0 | 0.0% |
| Total | 4 | 100.0% |
Employment Status by Age in Sibley
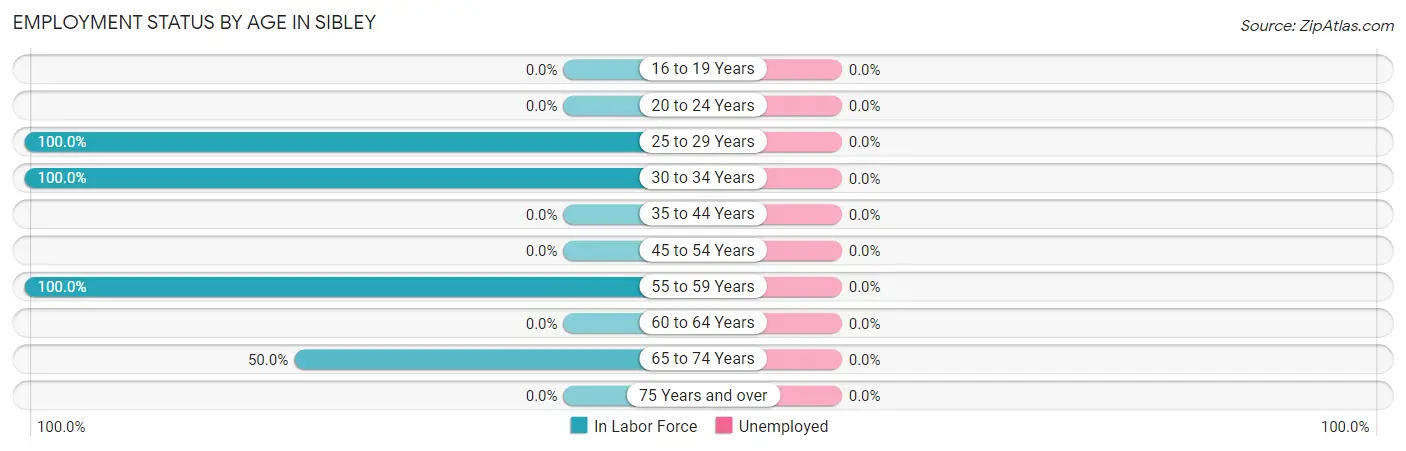
| Age Bracket | In Labor Force | Unemployed |
| 16 to 19 Years | 0 (0.0%) | 0 (0.0%) |
| 20 to 24 Years | 0 (0.0%) | 0 (0.0%) |
| 25 to 29 Years | 2 (100.0%) | 0 (0.0%) |
| 30 to 34 Years | 1 (100.0%) | 0 (0.0%) |
| 35 to 44 Years | 0 (0.0%) | 0 (0.0%) |
| 45 to 54 Years | 0 (0.0%) | 0 (0.0%) |
| 55 to 59 Years | 2 (100.0%) | 0 (0.0%) |
| 60 to 64 Years | 0 (0.0%) | 0 (0.0%) |
| 65 to 74 Years | 1 (50.0%) | 0 (0.0%) |
| 75 Years and over | 0 (0.0%) | 0 (0.0%) |
| Total | 6 (37.5%) | 0 (0.0%) |
Employment Status by Educational Attainment in Sibley
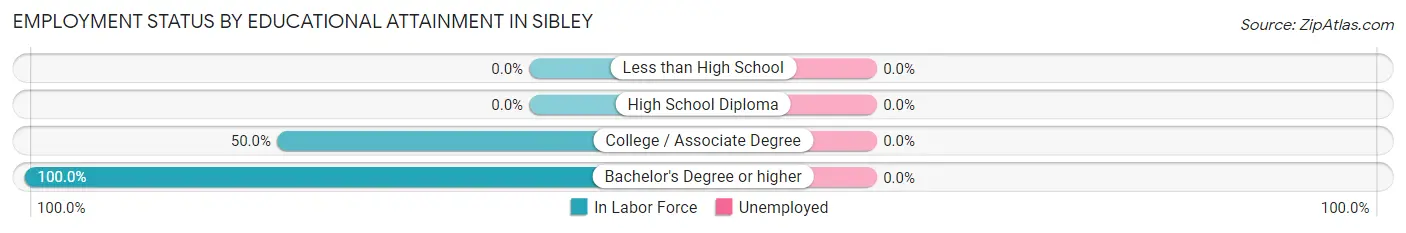
| Educational Attainment | In Labor Force | Unemployed |
| Less than High School | 0 (0.0%) | 0 (0.0%) |
| High School Diploma | 0 (0.0%) | 0 (0.0%) |
| College / Associate Degree | 3 (50.0%) | 0 (0.0%) |
| Bachelor's Degree or higher | 2 (100.0%) | 0 (0.0%) |
| Total | 5 (45.5%) | 0 (0.0%) |
Employment Occupations by Sex in Sibley
Management, Business, Science and Arts Occupations
The most common Management, Business, Science and Arts occupations in Sibley are Computers, Engineering & Science (2 | 33.3%), Life, Physical & Social Science (2 | 33.3%), Health Diagnosing & Treating (2 | 33.3%), and Health Technologists (2 | 33.3%).
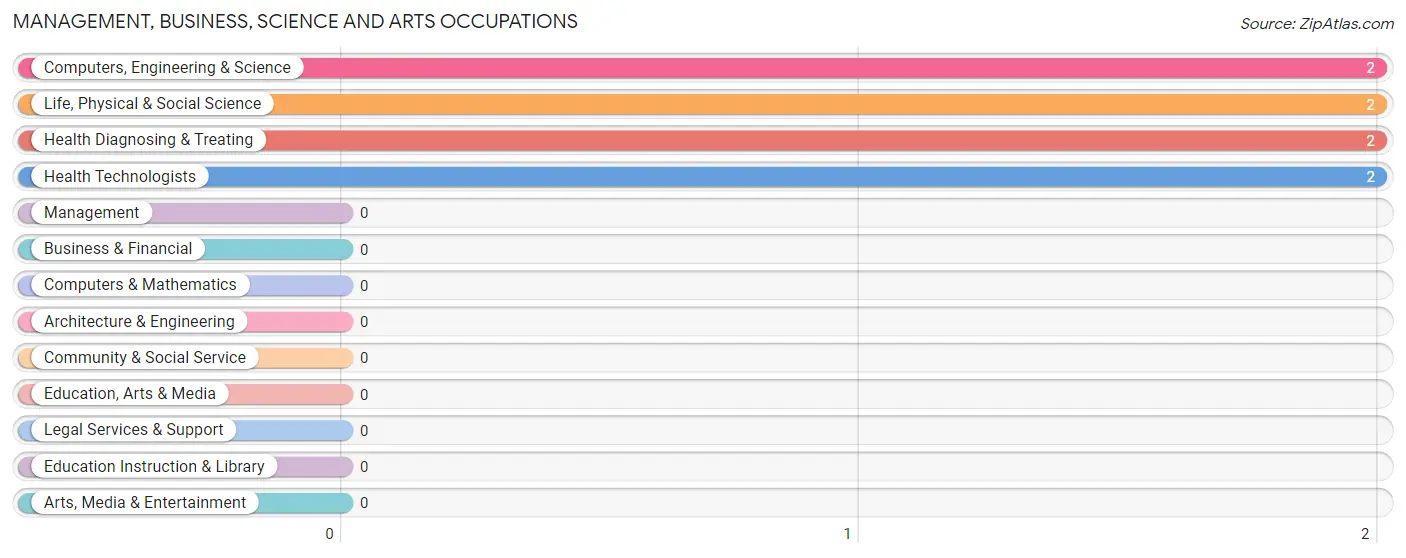
Management, Business, Science and Arts Occupations by Sex
Within the Management, Business, Science and Arts occupations in Sibley, the most male-oriented occupations are Computers, Engineering & Science (100.0%), and Life, Physical & Social Science (100.0%), while the most female-oriented occupations are Health Diagnosing & Treating (100.0%), and Health Technologists (100.0%).
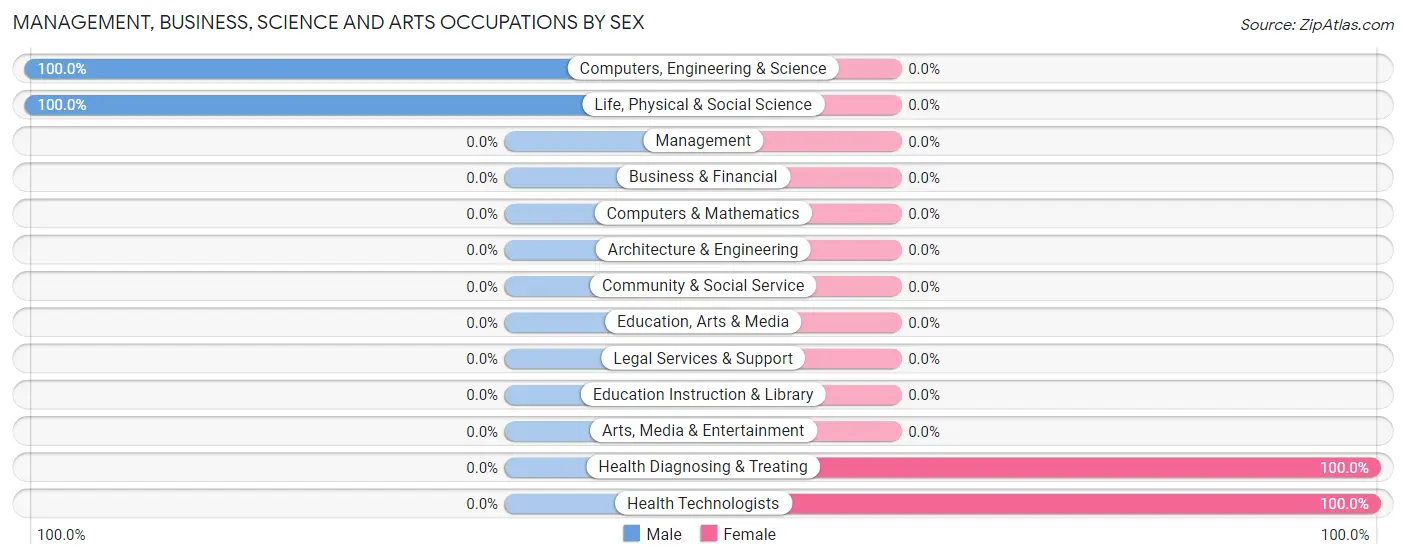
| Occupation | Male | Female |
| Management | 0 (0.0%) | 0 (0.0%) |
| Business & Financial | 0 (0.0%) | 0 (0.0%) |
| Computers, Engineering & Science | 2 (100.0%) | 0 (0.0%) |
| Computers & Mathematics | 0 (0.0%) | 0 (0.0%) |
| Architecture & Engineering | 0 (0.0%) | 0 (0.0%) |
| Life, Physical & Social Science | 2 (100.0%) | 0 (0.0%) |
| Community & Social Service | 0 (0.0%) | 0 (0.0%) |
| Education, Arts & Media | 0 (0.0%) | 0 (0.0%) |
| Legal Services & Support | 0 (0.0%) | 0 (0.0%) |
| Education Instruction & Library | 0 (0.0%) | 0 (0.0%) |
| Arts, Media & Entertainment | 0 (0.0%) | 0 (0.0%) |
| Health Diagnosing & Treating | 0 (0.0%) | 2 (100.0%) |
| Health Technologists | 0 (0.0%) | 2 (100.0%) |
| Total (Category) | 2 (50.0%) | 2 (50.0%) |
| Total (Overall) | 4 (66.7%) | 2 (33.3%) |
Services Occupations
Services Occupations by Sex
| Occupation | Male | Female |
| Healthcare Support | 0 (0.0%) | 0 (0.0%) |
| Security & Protection | 0 (0.0%) | 0 (0.0%) |
| Firefighting & Prevention | 0 (0.0%) | 0 (0.0%) |
| Law Enforcement | 0 (0.0%) | 0 (0.0%) |
| Food Preparation & Serving | 0 (0.0%) | 0 (0.0%) |
| Cleaning & Maintenance | 0 (0.0%) | 0 (0.0%) |
| Personal Care & Service | 0 (0.0%) | 0 (0.0%) |
| Total (Category) | 0 (0.0%) | 0 (0.0%) |
| Total (Overall) | 4 (66.7%) | 2 (33.3%) |
Sales and Office Occupations
Sales and Office Occupations by Sex
| Occupation | Male | Female |
| Sales & Related | 0 (0.0%) | 0 (0.0%) |
| Office & Administration | 0 (0.0%) | 0 (0.0%) |
| Total (Category) | 0 (0.0%) | 0 (0.0%) |
| Total (Overall) | 4 (66.7%) | 2 (33.3%) |
Natural Resources, Construction and Maintenance Occupations
Natural Resources, Construction and Maintenance Occupations by Sex
| Occupation | Male | Female |
| Farming, Fishing & Forestry | 0 (0.0%) | 0 (0.0%) |
| Construction & Extraction | 0 (0.0%) | 0 (0.0%) |
| Installation, Maintenance & Repair | 0 (0.0%) | 0 (0.0%) |
| Total (Category) | 0 (0.0%) | 0 (0.0%) |
| Total (Overall) | 4 (66.7%) | 2 (33.3%) |
Production, Transportation and Moving Occupations
The most common Production, Transportation and Moving occupations in Sibley are Production (1 | 16.7%), and Transportation (1 | 16.7%).
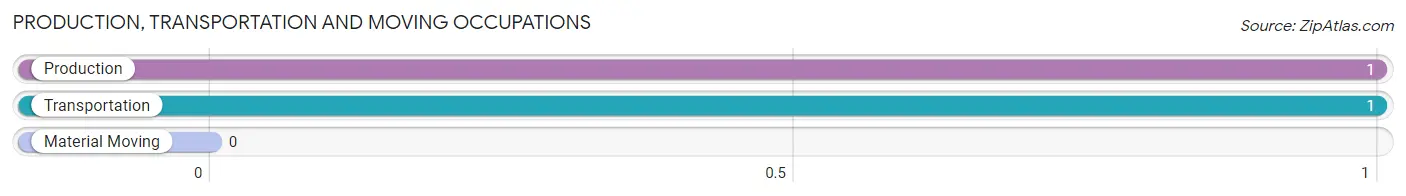
Production, Transportation and Moving Occupations by Sex
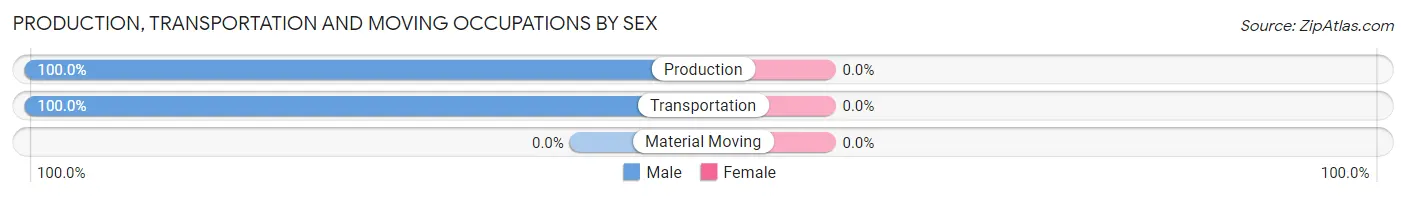
| Occupation | Male | Female |
| Production | 1 (100.0%) | 0 (0.0%) |
| Transportation | 1 (100.0%) | 0 (0.0%) |
| Material Moving | 0 (0.0%) | 0 (0.0%) |
| Total (Category) | 2 (100.0%) | 0 (0.0%) |
| Total (Overall) | 4 (66.7%) | 2 (33.3%) |
Employment Industries by Sex in Sibley
Employment Industries in Sibley
The major employment industries in Sibley include Agriculture, Fishing & Hunting (2 | 33.3%), Health Care & Social Assistance (2 | 33.3%), Manufacturing (1 | 16.7%), and Administrative & Support (1 | 16.7%).
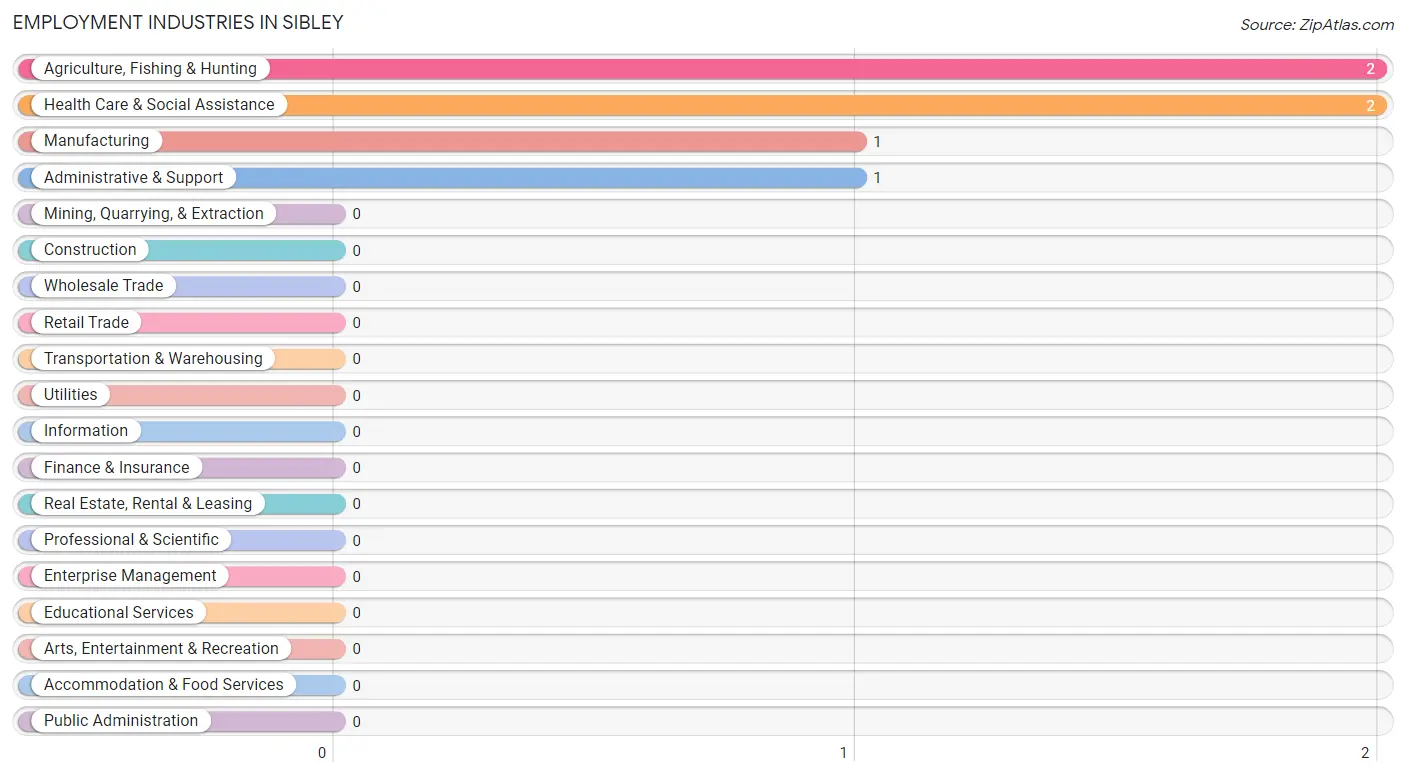
Employment Industries by Sex in Sibley
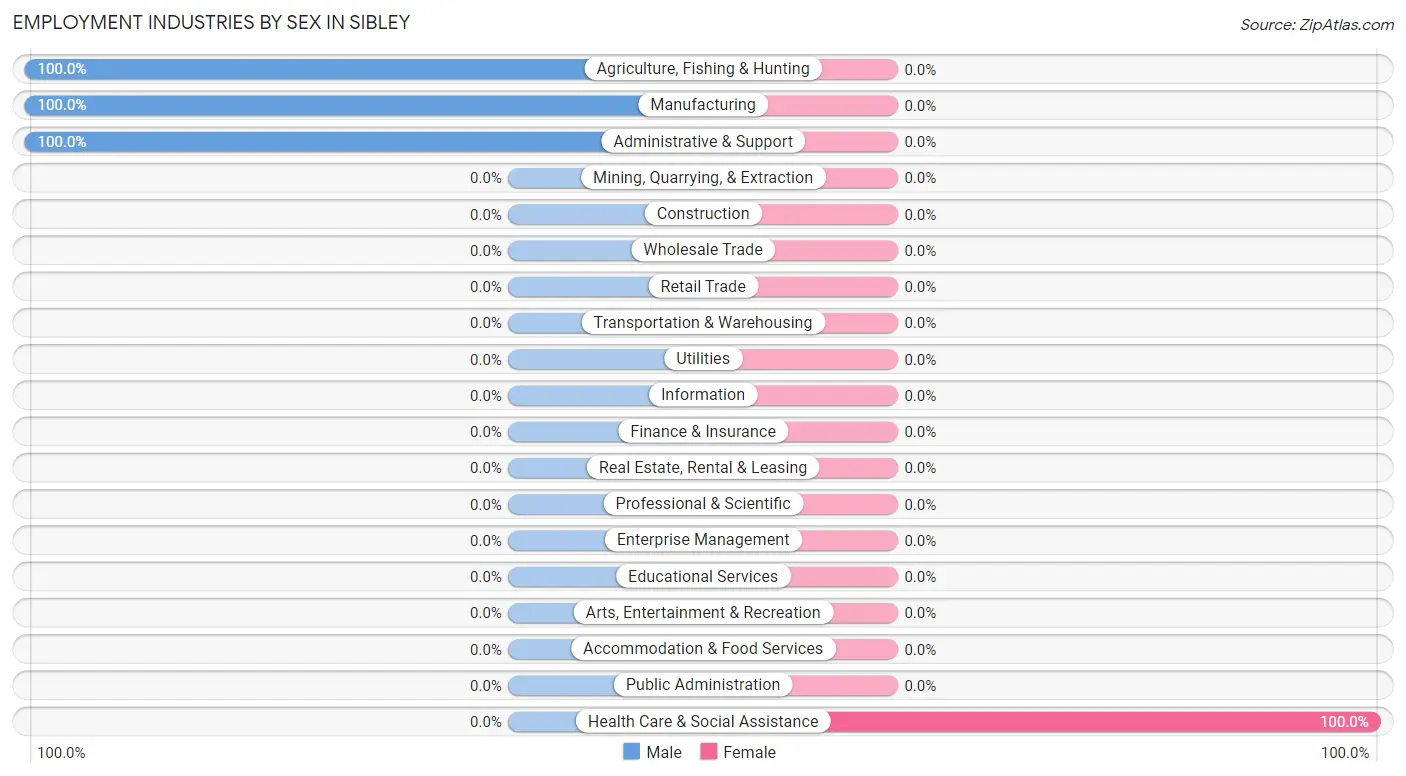
| Industry | Male | Female |
| Agriculture, Fishing & Hunting | 2 (100.0%) | 0 (0.0%) |
| Mining, Quarrying, & Extraction | 0 (0.0%) | 0 (0.0%) |
| Construction | 0 (0.0%) | 0 (0.0%) |
| Manufacturing | 1 (100.0%) | 0 (0.0%) |
| Wholesale Trade | 0 (0.0%) | 0 (0.0%) |
| Retail Trade | 0 (0.0%) | 0 (0.0%) |
| Transportation & Warehousing | 0 (0.0%) | 0 (0.0%) |
| Utilities | 0 (0.0%) | 0 (0.0%) |
| Information | 0 (0.0%) | 0 (0.0%) |
| Finance & Insurance | 0 (0.0%) | 0 (0.0%) |
| Real Estate, Rental & Leasing | 0 (0.0%) | 0 (0.0%) |
| Professional & Scientific | 0 (0.0%) | 0 (0.0%) |
| Enterprise Management | 0 (0.0%) | 0 (0.0%) |
| Administrative & Support | 1 (100.0%) | 0 (0.0%) |
| Educational Services | 0 (0.0%) | 0 (0.0%) |
| Health Care & Social Assistance | 0 (0.0%) | 2 (100.0%) |
| Arts, Entertainment & Recreation | 0 (0.0%) | 0 (0.0%) |
| Accommodation & Food Services | 0 (0.0%) | 0 (0.0%) |
| Public Administration | 0 (0.0%) | 0 (0.0%) |
| Total | 4 (66.7%) | 2 (33.3%) |
Education in Sibley
School Enrollment in Sibley
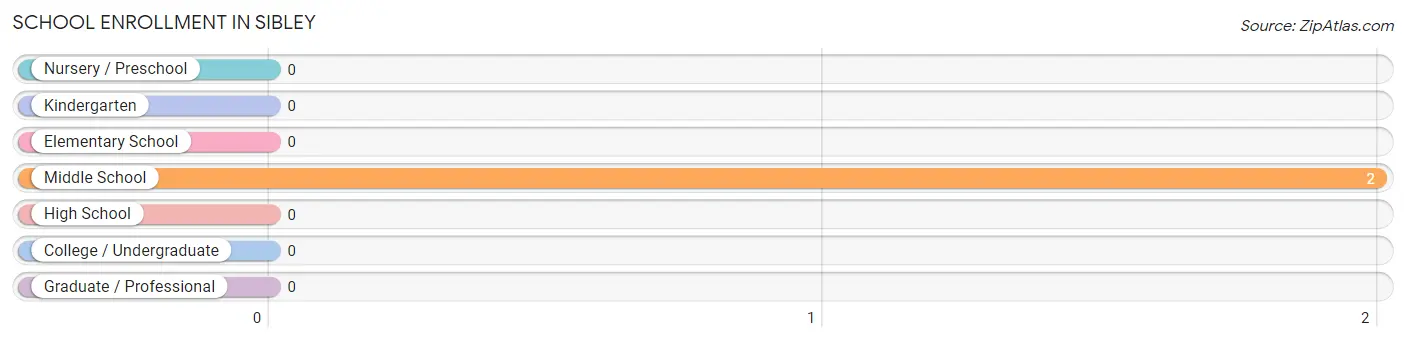
| School Level | # Students | % Students |
| Nursery / Preschool | 0 | 0.0% |
| Kindergarten | 0 | 0.0% |
| Elementary School | 0 | 0.0% |
| Middle School | 2 | 100.0% |
| High School | 0 | 0.0% |
| College / Undergraduate | 0 | 0.0% |
| Graduate / Professional | 0 | 0.0% |
| Total | 2 | 100.0% |
School Enrollment by Age by Funding Source in Sibley
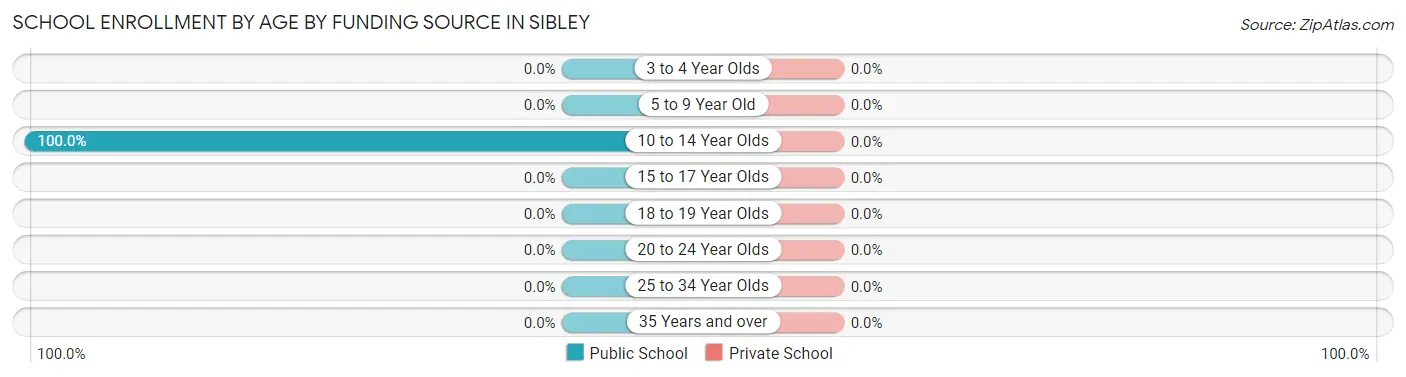
| Age Bracket | Public School | Private School |
| 3 to 4 Year Olds | 0 (0.0%) | 0 (0.0%) |
| 5 to 9 Year Old | 0 (0.0%) | 0 (0.0%) |
| 10 to 14 Year Olds | 2 (100.0%) | 0 (0.0%) |
| 15 to 17 Year Olds | 0 (0.0%) | 0 (0.0%) |
| 18 to 19 Year Olds | 0 (0.0%) | 0 (0.0%) |
| 20 to 24 Year Olds | 0 (0.0%) | 0 (0.0%) |
| 25 to 34 Year Olds | 0 (0.0%) | 0 (0.0%) |
| 35 Years and over | 0 (0.0%) | 0 (0.0%) |
| Total | 2 (100.0%) | 0 (0.0%) |
Educational Attainment by Field of Study in Sibley
, and science & technology (2 | 100.0%) are the most common fields of study among 2 individuals in Sibley who have obtained a bachelor's degree or higher.
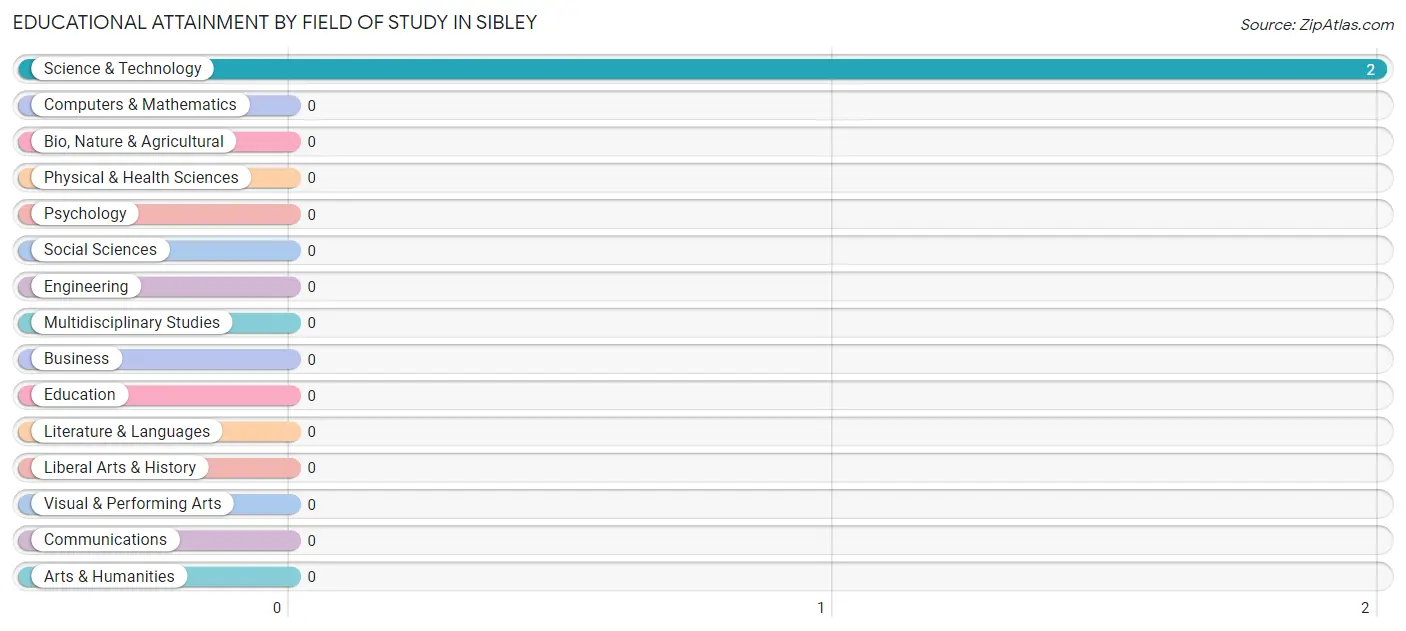
| Field of Study | # Graduates | % Graduates |
| Computers & Mathematics | 0 | 0.0% |
| Bio, Nature & Agricultural | 0 | 0.0% |
| Physical & Health Sciences | 0 | 0.0% |
| Psychology | 0 | 0.0% |
| Social Sciences | 0 | 0.0% |
| Engineering | 0 | 0.0% |
| Multidisciplinary Studies | 0 | 0.0% |
| Science & Technology | 2 | 100.0% |
| Business | 0 | 0.0% |
| Education | 0 | 0.0% |
| Literature & Languages | 0 | 0.0% |
| Liberal Arts & History | 0 | 0.0% |
| Visual & Performing Arts | 0 | 0.0% |
| Communications | 0 | 0.0% |
| Arts & Humanities | 0 | 0.0% |
| Total | 2 | 100.0% |
Transportation & Commute in Sibley
Vehicle Availability by Sex in Sibley
The most prevalent vehicle ownership categories in Sibley are males with 3 vehicles (1, accounting for 50.0%) and females with 3 vehicles (2, making up 50.0%).
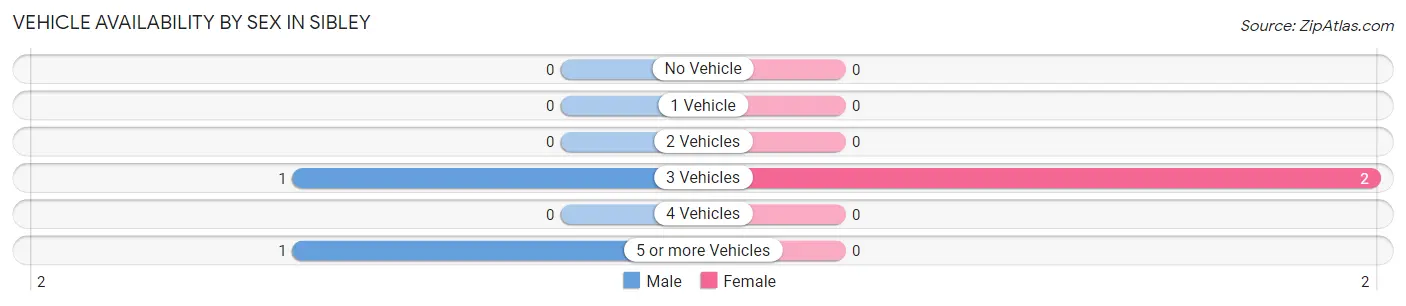
| Vehicles Available | Male | Female |
| No Vehicle | 0 (0.0%) | 0 (0.0%) |
| 1 Vehicle | 0 (0.0%) | 0 (0.0%) |
| 2 Vehicles | 0 (0.0%) | 0 (0.0%) |
| 3 Vehicles | 1 (50.0%) | 2 (100.0%) |
| 4 Vehicles | 0 (0.0%) | 0 (0.0%) |
| 5 or more Vehicles | 1 (50.0%) | 0 (0.0%) |
| Total | 2 (100.0%) | 2 (100.0%) |
Commute Time in Sibley
The most frequently occuring commute durations in Sibley are 60 to 89 minutes (3 commuters, 75.0%), 90 or more minutes (1 commuters, 25.0%), and less than 5 minutes (0 commuters, 0.0%).
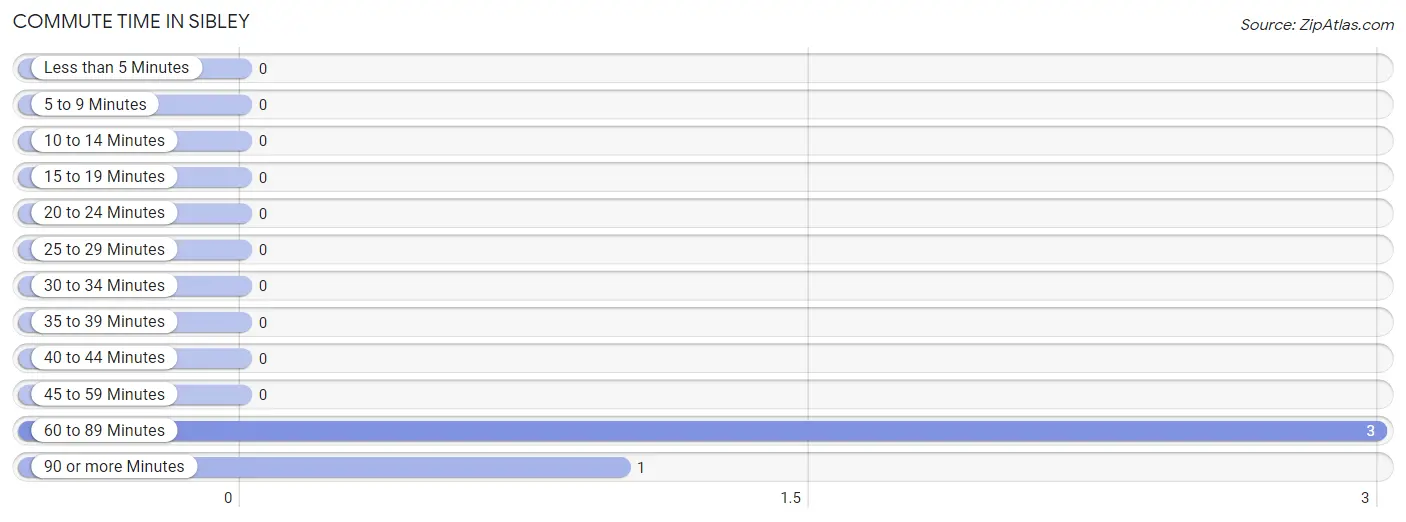
| Commute Time | # Commuters | % Commuters |
| Less than 5 Minutes | 0 | 0.0% |
| 5 to 9 Minutes | 0 | 0.0% |
| 10 to 14 Minutes | 0 | 0.0% |
| 15 to 19 Minutes | 0 | 0.0% |
| 20 to 24 Minutes | 0 | 0.0% |
| 25 to 29 Minutes | 0 | 0.0% |
| 30 to 34 Minutes | 0 | 0.0% |
| 35 to 39 Minutes | 0 | 0.0% |
| 40 to 44 Minutes | 0 | 0.0% |
| 45 to 59 Minutes | 0 | 0.0% |
| 60 to 89 Minutes | 3 | 75.0% |
| 90 or more Minutes | 1 | 25.0% |
Commute Time by Sex in Sibley
The most common commute times in Sibley are 60 to 89 minutes (1 commuters, 50.0%) for males and 60 to 89 minutes (2 commuters, 100.0%) for females.
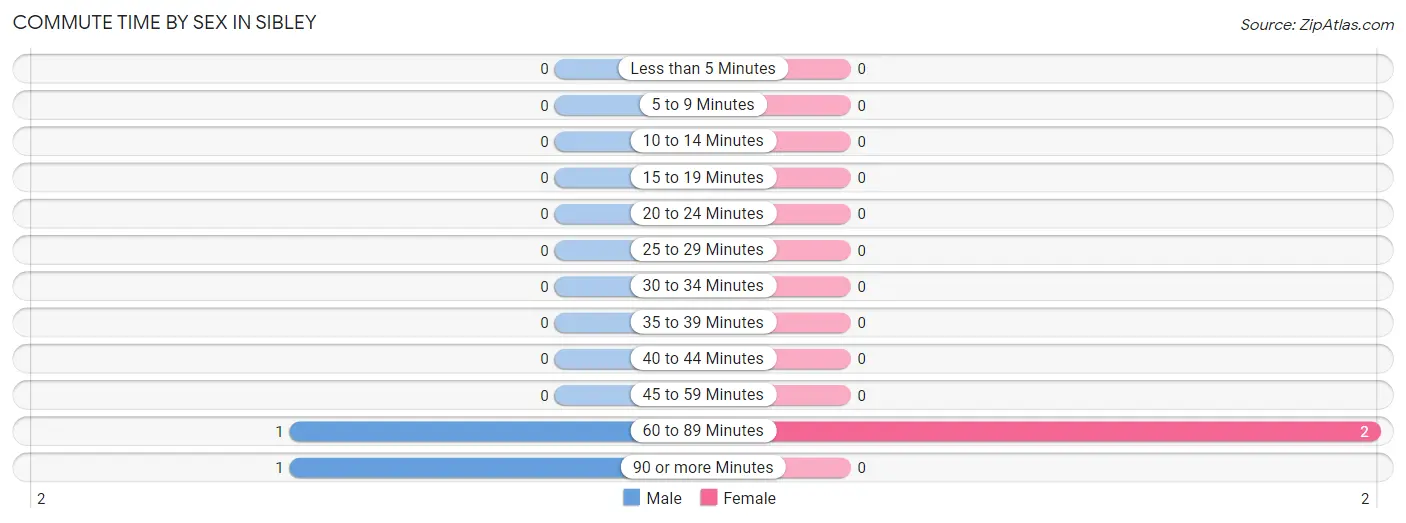
| Commute Time | Male | Female |
| Less than 5 Minutes | 0 (0.0%) | 0 (0.0%) |
| 5 to 9 Minutes | 0 (0.0%) | 0 (0.0%) |
| 10 to 14 Minutes | 0 (0.0%) | 0 (0.0%) |
| 15 to 19 Minutes | 0 (0.0%) | 0 (0.0%) |
| 20 to 24 Minutes | 0 (0.0%) | 0 (0.0%) |
| 25 to 29 Minutes | 0 (0.0%) | 0 (0.0%) |
| 30 to 34 Minutes | 0 (0.0%) | 0 (0.0%) |
| 35 to 39 Minutes | 0 (0.0%) | 0 (0.0%) |
| 40 to 44 Minutes | 0 (0.0%) | 0 (0.0%) |
| 45 to 59 Minutes | 0 (0.0%) | 0 (0.0%) |
| 60 to 89 Minutes | 1 (50.0%) | 2 (100.0%) |
| 90 or more Minutes | 1 (50.0%) | 0 (0.0%) |
Time of Departure to Work by Sex in Sibley
The most frequent times of departure to work in Sibley are 6:30 AM to 6:59 AM (1, 50.0%) for males and 4:00 PM to 11:59 PM (2, 100.0%) for females.
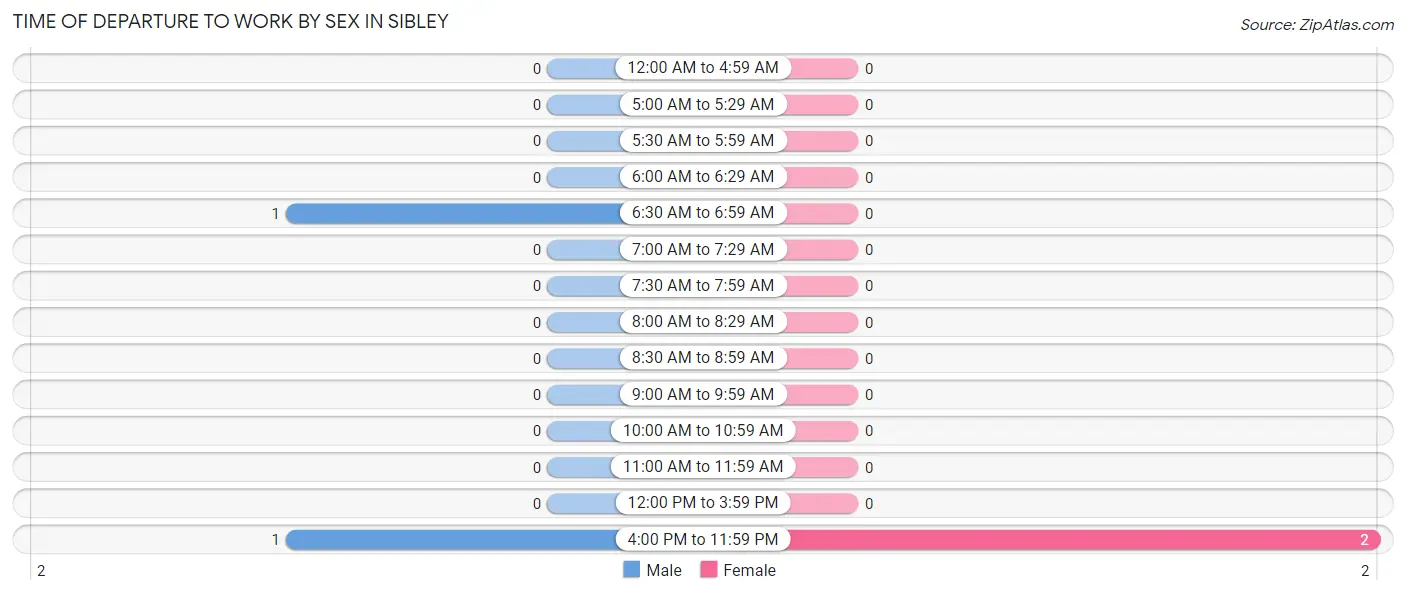
| Time of Departure | Male | Female |
| 12:00 AM to 4:59 AM | 0 (0.0%) | 0 (0.0%) |
| 5:00 AM to 5:29 AM | 0 (0.0%) | 0 (0.0%) |
| 5:30 AM to 5:59 AM | 0 (0.0%) | 0 (0.0%) |
| 6:00 AM to 6:29 AM | 0 (0.0%) | 0 (0.0%) |
| 6:30 AM to 6:59 AM | 1 (50.0%) | 0 (0.0%) |
| 7:00 AM to 7:29 AM | 0 (0.0%) | 0 (0.0%) |
| 7:30 AM to 7:59 AM | 0 (0.0%) | 0 (0.0%) |
| 8:00 AM to 8:29 AM | 0 (0.0%) | 0 (0.0%) |
| 8:30 AM to 8:59 AM | 0 (0.0%) | 0 (0.0%) |
| 9:00 AM to 9:59 AM | 0 (0.0%) | 0 (0.0%) |
| 10:00 AM to 10:59 AM | 0 (0.0%) | 0 (0.0%) |
| 11:00 AM to 11:59 AM | 0 (0.0%) | 0 (0.0%) |
| 12:00 PM to 3:59 PM | 0 (0.0%) | 0 (0.0%) |
| 4:00 PM to 11:59 PM | 1 (50.0%) | 2 (100.0%) |
| Total | 2 (100.0%) | 2 (100.0%) |
Housing Occupancy in Sibley
Occupancy by Ownership in Sibley
Of the total 10 dwellings in Sibley, owner-occupied units account for 10 (100.0%), while renter-occupied units make up 0 (0.0%).
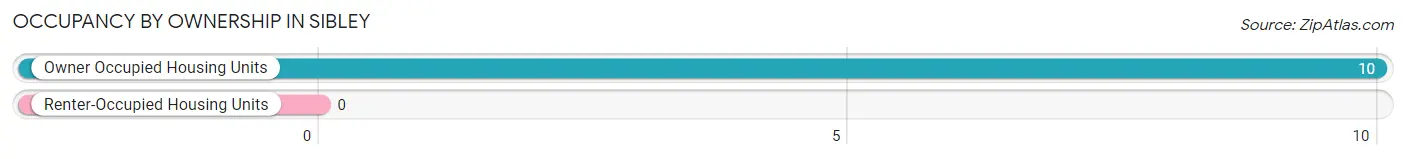
| Occupancy | # Housing Units | % Housing Units |
| Owner Occupied Housing Units | 10 | 100.0% |
| Renter-Occupied Housing Units | 0 | 0.0% |
| Total Occupied Housing Units | 10 | 100.0% |
Occupancy by Household Size in Sibley
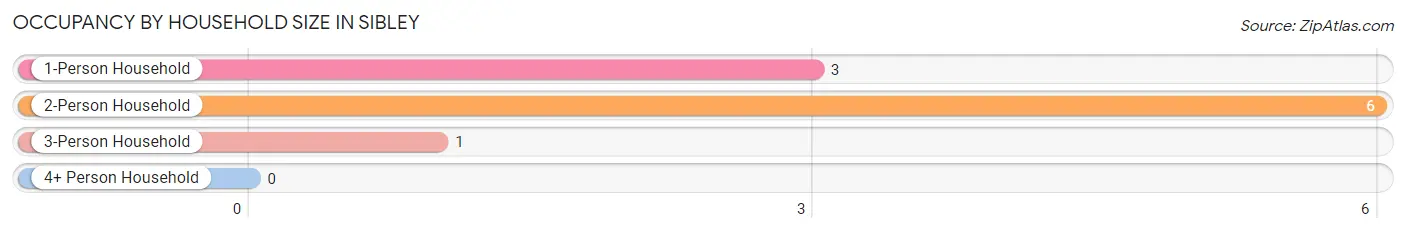
| Household Size | # Housing Units | % Housing Units |
| 1-Person Household | 3 | 30.0% |
| 2-Person Household | 6 | 60.0% |
| 3-Person Household | 1 | 10.0% |
| 4+ Person Household | 0 | 0.0% |
| Total Housing Units | 10 | 100.0% |
Occupancy by Ownership by Household Size in Sibley
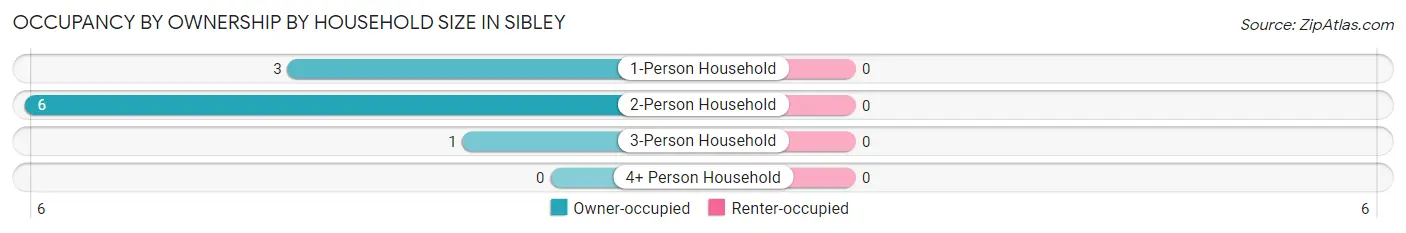
| Household Size | Owner-occupied | Renter-occupied |
| 1-Person Household | 3 (100.0%) | 0 (0.0%) |
| 2-Person Household | 6 (100.0%) | 0 (0.0%) |
| 3-Person Household | 1 (100.0%) | 0 (0.0%) |
| 4+ Person Household | 0 (0.0%) | 0 (0.0%) |
| Total Housing Units | 10 (100.0%) | 0 (0.0%) |
Occupancy by Educational Attainment in Sibley
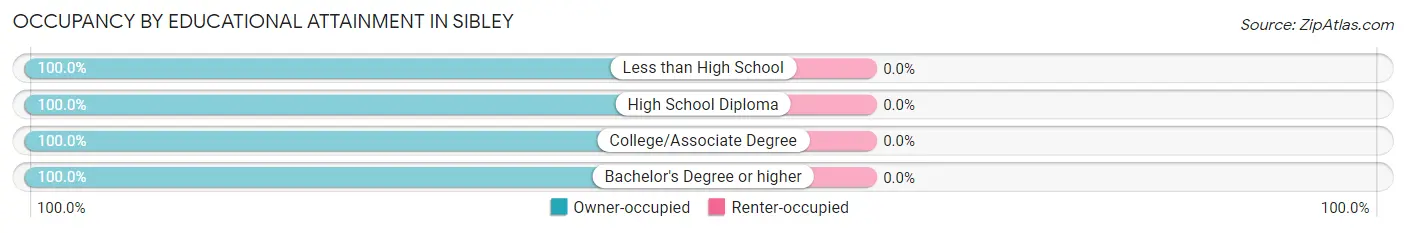
| Household Size | Owner-occupied | Renter-occupied |
| Less than High School | 1 (100.0%) | 0 (0.0%) |
| High School Diploma | 2 (100.0%) | 0 (0.0%) |
| College/Associate Degree | 5 (100.0%) | 0 (0.0%) |
| Bachelor's Degree or higher | 2 (100.0%) | 0 (0.0%) |
Occupancy by Age of Householder in Sibley
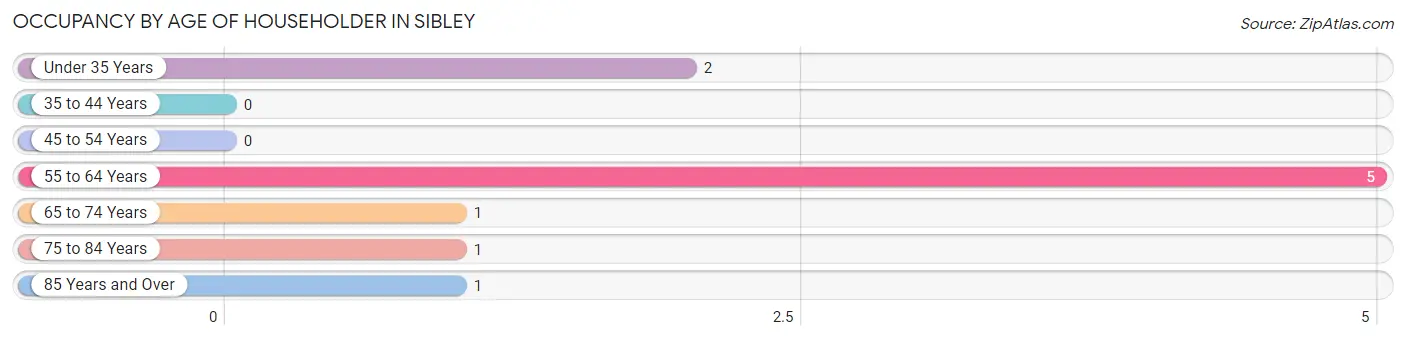
| Age Bracket | # Households | % Households |
| Under 35 Years | 2 | 20.0% |
| 35 to 44 Years | 0 | 0.0% |
| 45 to 54 Years | 0 | 0.0% |
| 55 to 64 Years | 5 | 50.0% |
| 65 to 74 Years | 1 | 10.0% |
| 75 to 84 Years | 1 | 10.0% |
| 85 Years and Over | 1 | 10.0% |
| Total | 10 | 100.0% |
Housing Finances in Sibley
Median Income by Occupancy in Sibley
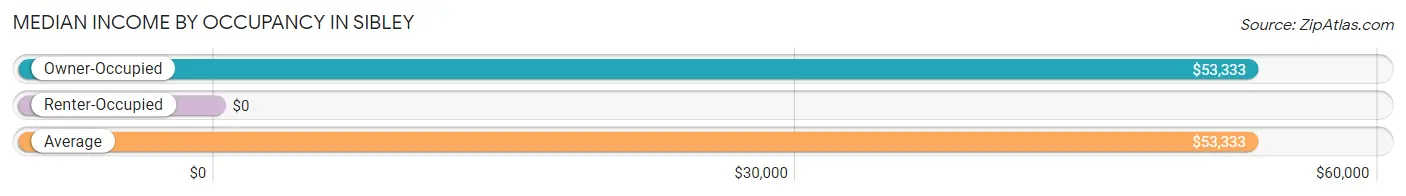
| Occupancy Type | # Households | Median Income |
| Owner-Occupied | 10 (100.0%) | $53,333 |
| Renter-Occupied | 0 (0.0%) | $0 |
| Average | 10 (100.0%) | $53,333 |
Occupancy by Householder Income Bracket in Sibley
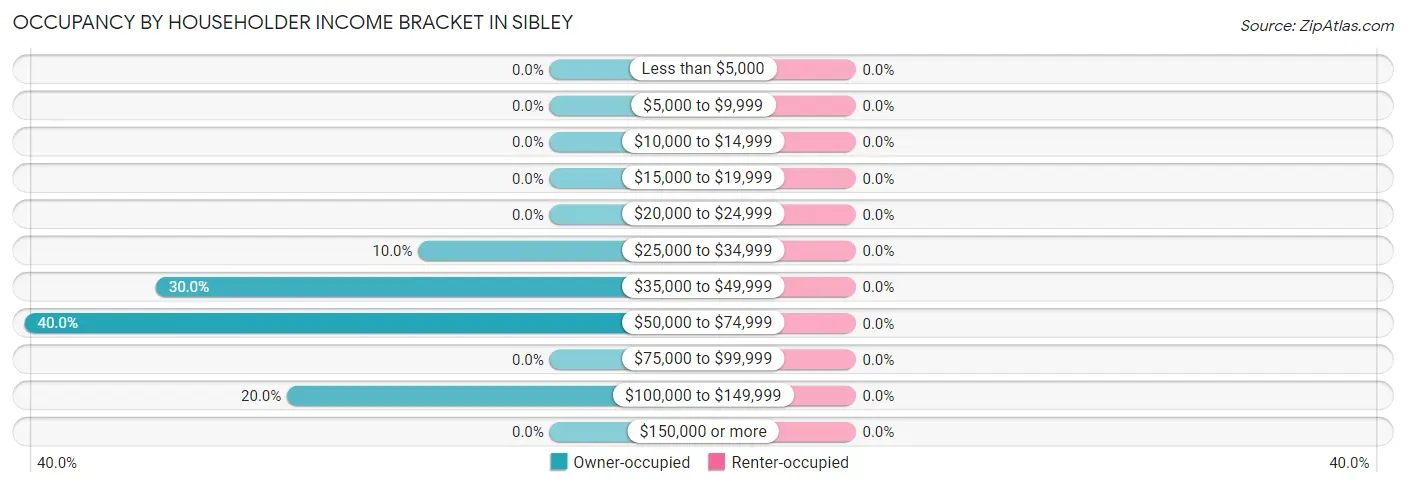
| Income Bracket | Owner-occupied | Renter-occupied |
| Less than $5,000 | 0 (0.0%) | 0 (0.0%) |
| $5,000 to $9,999 | 0 (0.0%) | 0 (0.0%) |
| $10,000 to $14,999 | 0 (0.0%) | 0 (0.0%) |
| $15,000 to $19,999 | 0 (0.0%) | 0 (0.0%) |
| $20,000 to $24,999 | 0 (0.0%) | 0 (0.0%) |
| $25,000 to $34,999 | 1 (10.0%) | 0 (0.0%) |
| $35,000 to $49,999 | 3 (30.0%) | 0 (0.0%) |
| $50,000 to $74,999 | 4 (40.0%) | 0 (0.0%) |
| $75,000 to $99,999 | 0 (0.0%) | 0 (0.0%) |
| $100,000 to $149,999 | 2 (20.0%) | 0 (0.0%) |
| $150,000 or more | 0 (0.0%) | 0 (0.0%) |
| Total | 10 (100.0%) | 0 (0.0%) |
Monthly Housing Cost Tiers in Sibley
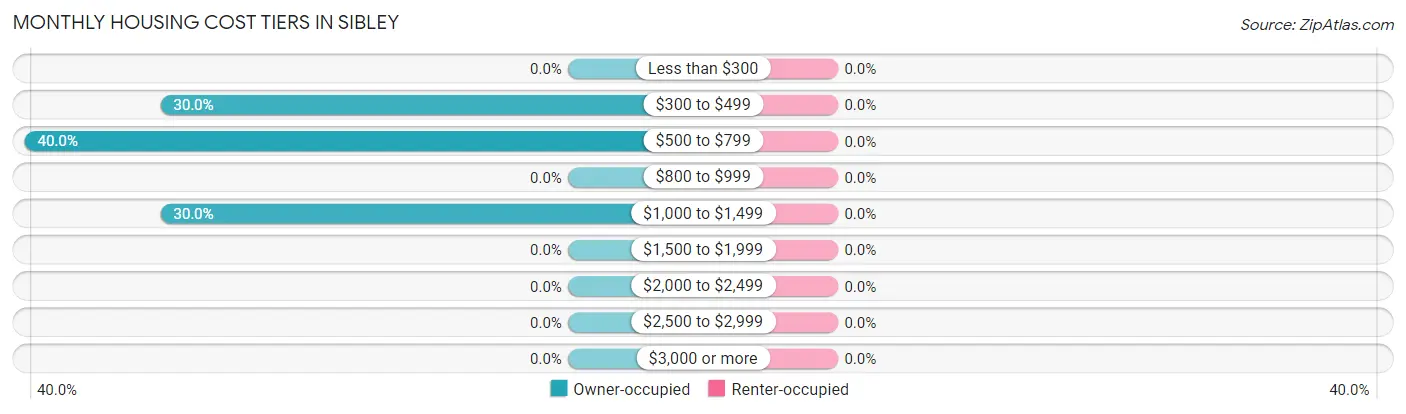
| Monthly Cost | Owner-occupied | Renter-occupied |
| Less than $300 | 0 (0.0%) | 0 (0.0%) |
| $300 to $499 | 3 (30.0%) | 0 (0.0%) |
| $500 to $799 | 4 (40.0%) | 0 (0.0%) |
| $800 to $999 | 0 (0.0%) | 0 (0.0%) |
| $1,000 to $1,499 | 3 (30.0%) | 0 (0.0%) |
| $1,500 to $1,999 | 0 (0.0%) | 0 (0.0%) |
| $2,000 to $2,499 | 0 (0.0%) | 0 (0.0%) |
| $2,500 to $2,999 | 0 (0.0%) | 0 (0.0%) |
| $3,000 or more | 0 (0.0%) | 0 (0.0%) |
| Total | 10 (100.0%) | 0 (0.0%) |
Physical Housing Characteristics in Sibley
Housing Structures in Sibley
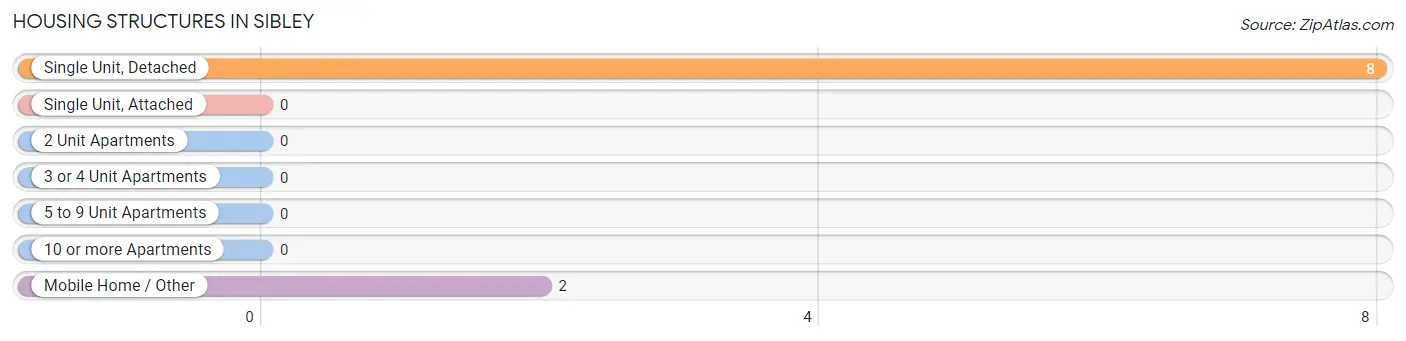
| Structure Type | # Housing Units | % Housing Units |
| Single Unit, Detached | 8 | 80.0% |
| Single Unit, Attached | 0 | 0.0% |
| 2 Unit Apartments | 0 | 0.0% |
| 3 or 4 Unit Apartments | 0 | 0.0% |
| 5 to 9 Unit Apartments | 0 | 0.0% |
| 10 or more Apartments | 0 | 0.0% |
| Mobile Home / Other | 2 | 20.0% |
| Total | 10 | 100.0% |
Housing Structures by Occupancy in Sibley
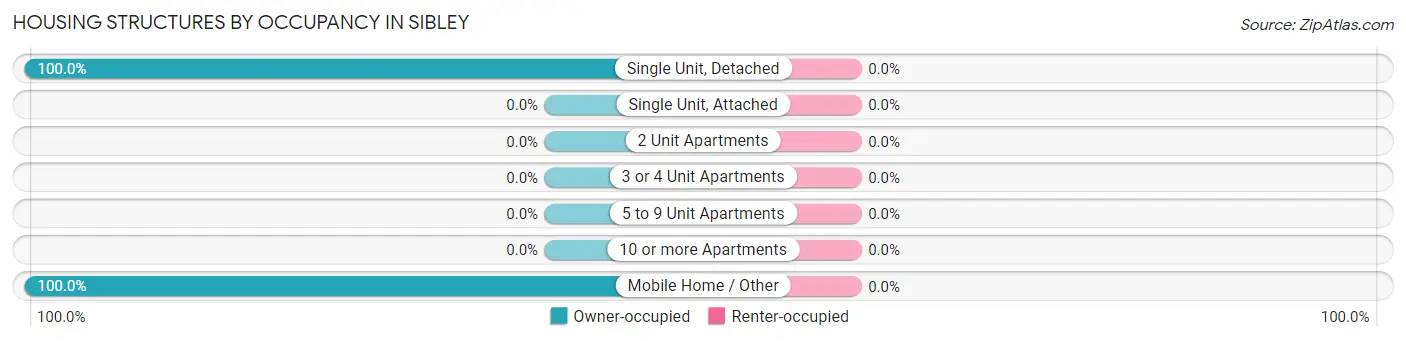
| Structure Type | Owner-occupied | Renter-occupied |
| Single Unit, Detached | 8 (100.0%) | 0 (0.0%) |
| Single Unit, Attached | 0 (0.0%) | 0 (0.0%) |
| 2 Unit Apartments | 0 (0.0%) | 0 (0.0%) |
| 3 or 4 Unit Apartments | 0 (0.0%) | 0 (0.0%) |
| 5 to 9 Unit Apartments | 0 (0.0%) | 0 (0.0%) |
| 10 or more Apartments | 0 (0.0%) | 0 (0.0%) |
| Mobile Home / Other | 2 (100.0%) | 0 (0.0%) |
| Total | 10 (100.0%) | 0 (0.0%) |
Housing Structures by Number of Rooms in Sibley
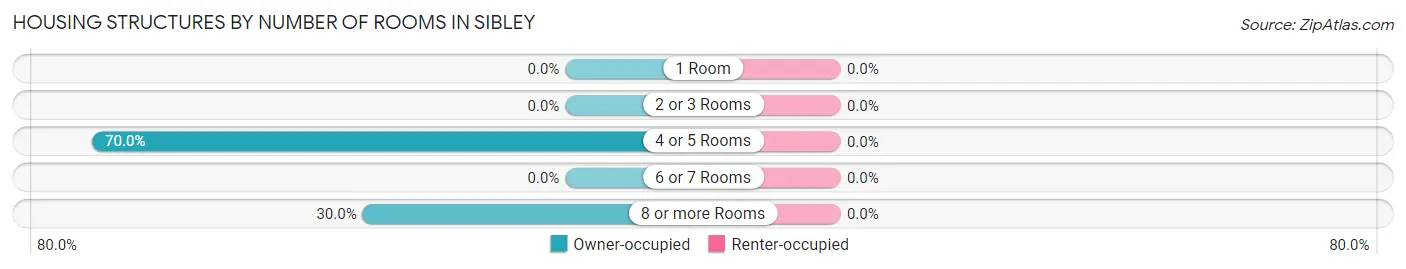
| Number of Rooms | Owner-occupied | Renter-occupied |
| 1 Room | 0 (0.0%) | 0 (0.0%) |
| 2 or 3 Rooms | 0 (0.0%) | 0 (0.0%) |
| 4 or 5 Rooms | 7 (70.0%) | 0 (0.0%) |
| 6 or 7 Rooms | 0 (0.0%) | 0 (0.0%) |
| 8 or more Rooms | 3 (30.0%) | 0 (0.0%) |
| Total | 10 (100.0%) | 0 (0.0%) |
Housing Structure by Heating Type in Sibley
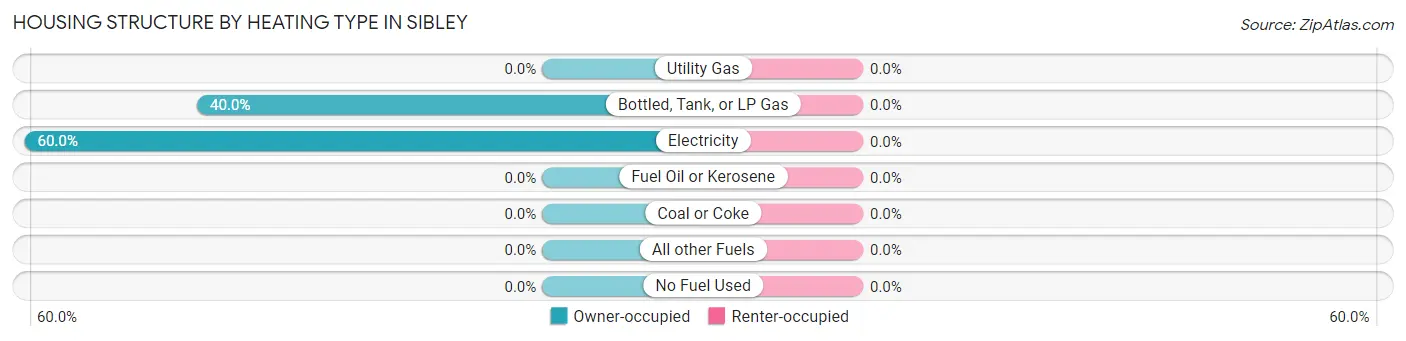
| Heating Type | Owner-occupied | Renter-occupied |
| Utility Gas | 0 (0.0%) | 0 (0.0%) |
| Bottled, Tank, or LP Gas | 4 (40.0%) | 0 (0.0%) |
| Electricity | 6 (60.0%) | 0 (0.0%) |
| Fuel Oil or Kerosene | 0 (0.0%) | 0 (0.0%) |
| Coal or Coke | 0 (0.0%) | 0 (0.0%) |
| All other Fuels | 0 (0.0%) | 0 (0.0%) |
| No Fuel Used | 0 (0.0%) | 0 (0.0%) |
| Total | 10 (100.0%) | 0 (0.0%) |
Household Vehicle Usage in Sibley
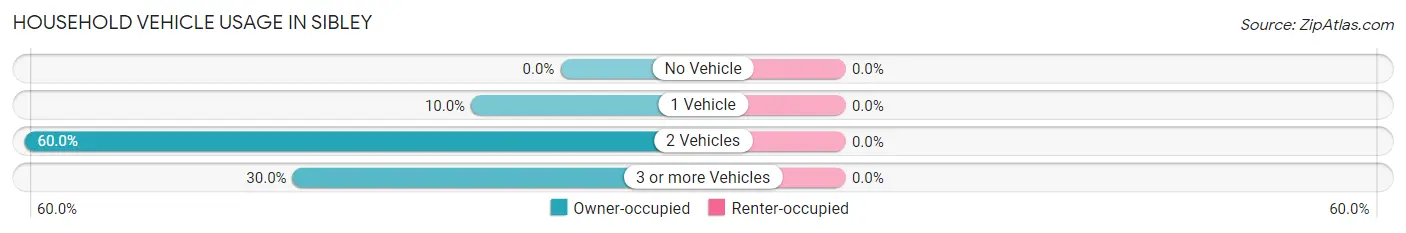
| Vehicles per Household | Owner-occupied | Renter-occupied |
| No Vehicle | 0 (0.0%) | 0 (0.0%) |
| 1 Vehicle | 1 (10.0%) | 0 (0.0%) |
| 2 Vehicles | 6 (60.0%) | 0 (0.0%) |
| 3 or more Vehicles | 3 (30.0%) | 0 (0.0%) |
| Total | 10 (100.0%) | 0 (0.0%) |
Real Estate & Mortgages in Sibley
Real Estate and Mortgage Overview in Sibley
| Characteristic | Without Mortgage | With Mortgage |
| Housing Units | 8 | 2 |
| Median Property Value | $187,500 | $0 |
| Median Household Income | $48,750 | $0 |
| Monthly Housing Costs | $533 | $0 |
| Real Estate Taxes | $1,167 | $0 |
Property Value by Mortgage Status in Sibley
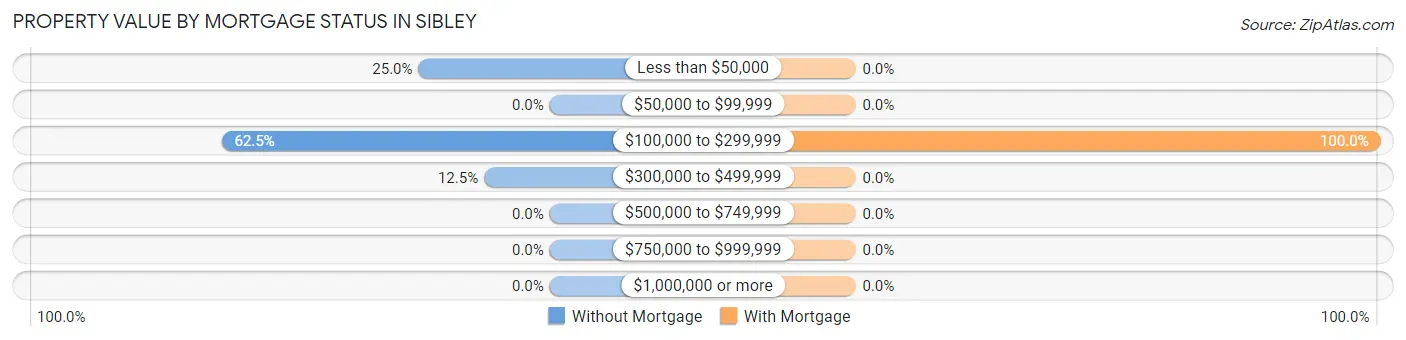
| Property Value | Without Mortgage | With Mortgage |
| Less than $50,000 | 2 (25.0%) | 0 (0.0%) |
| $50,000 to $99,999 | 0 (0.0%) | 0 (0.0%) |
| $100,000 to $299,999 | 5 (62.5%) | 2 (100.0%) |
| $300,000 to $499,999 | 1 (12.5%) | 0 (0.0%) |
| $500,000 to $749,999 | 0 (0.0%) | 0 (0.0%) |
| $750,000 to $999,999 | 0 (0.0%) | 0 (0.0%) |
| $1,000,000 or more | 0 (0.0%) | 0 (0.0%) |
| Total | 8 (100.0%) | 2 (100.0%) |
Household Income by Mortgage Status in Sibley
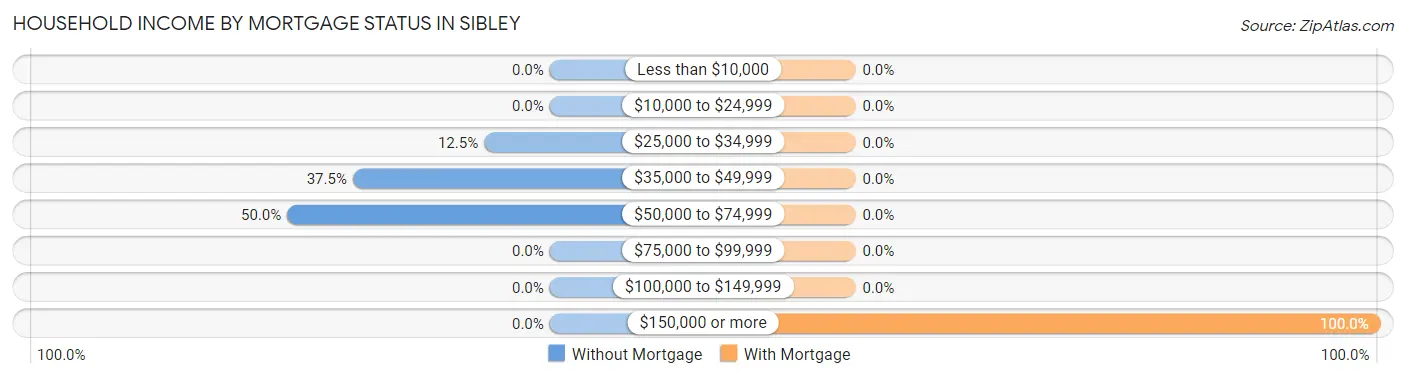
| Household Income | Without Mortgage | With Mortgage |
| Less than $10,000 | 0 (0.0%) | 0 (0.0%) |
| $10,000 to $24,999 | 0 (0.0%) | 0 (0.0%) |
| $25,000 to $34,999 | 1 (12.5%) | 0 (0.0%) |
| $35,000 to $49,999 | 3 (37.5%) | 0 (0.0%) |
| $50,000 to $74,999 | 4 (50.0%) | 0 (0.0%) |
| $75,000 to $99,999 | 0 (0.0%) | 0 (0.0%) |
| $100,000 to $149,999 | 0 (0.0%) | 0 (0.0%) |
| $150,000 or more | 0 (0.0%) | 2 (100.0%) |
| Total | 8 (100.0%) | 2 (100.0%) |
Property Value to Household Income Ratio in Sibley
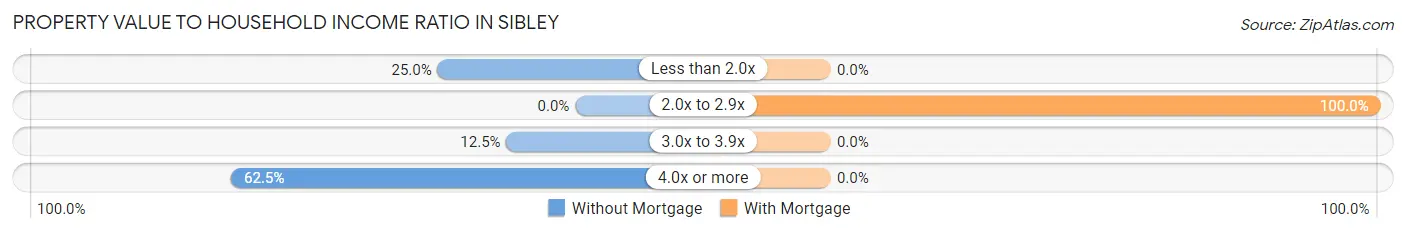
| Value-to-Income Ratio | Without Mortgage | With Mortgage |
| Less than 2.0x | 2 (25.0%) | 0 (0.0%) |
| 2.0x to 2.9x | 0 (0.0%) | 2 (100.0%) |
| 3.0x to 3.9x | 1 (12.5%) | 0 (0.0%) |
| 4.0x or more | 5 (62.5%) | 0 (0.0%) |
| Total | 8 (100.0%) | 2 (100.0%) |
Real Estate Taxes by Mortgage Status in Sibley
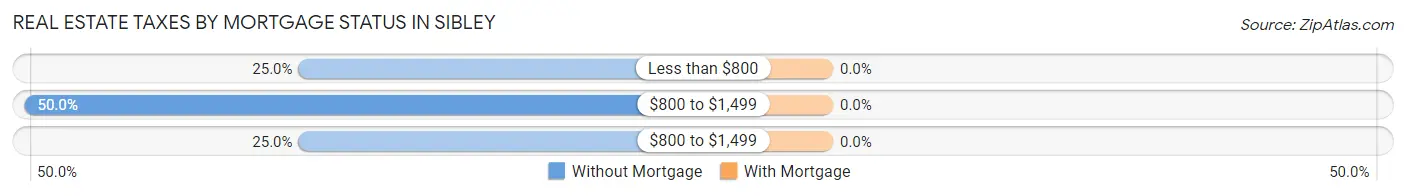
| Property Taxes | Without Mortgage | With Mortgage |
| Less than $800 | 2 (25.0%) | 0 (0.0%) |
| $800 to $1,499 | 4 (50.0%) | 0 (0.0%) |
| $800 to $1,499 | 2 (25.0%) | 0 (0.0%) |
| Total | 8 (100.0%) | 2 (100.0%) |
Health & Disability in Sibley
Health Insurance Coverage by Age in Sibley
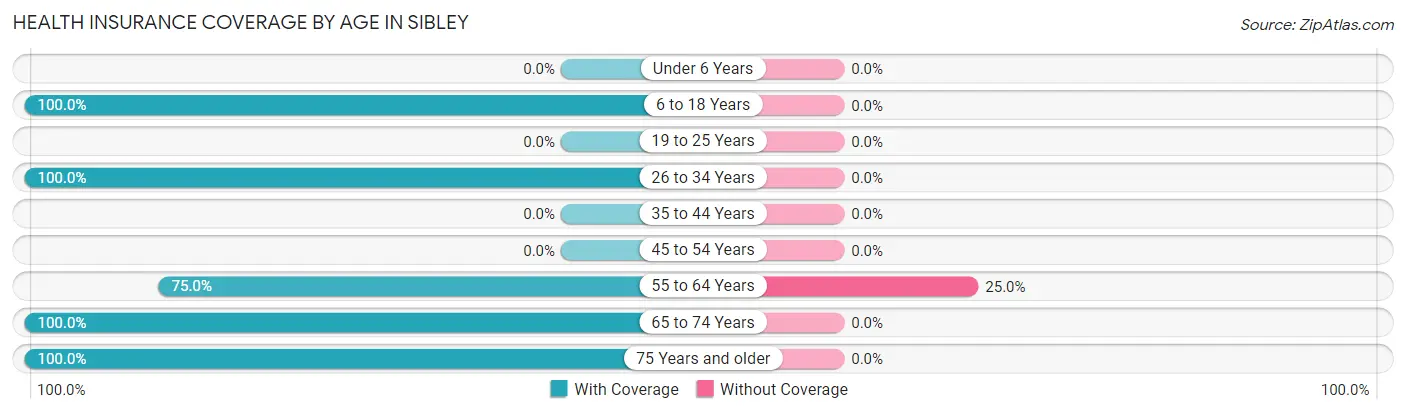
| Age Bracket | With Coverage | Without Coverage |
| Under 6 Years | 0 (0.0%) | 0 (0.0%) |
| 6 to 18 Years | 2 (100.0%) | 0 (0.0%) |
| 19 to 25 Years | 0 (0.0%) | 0 (0.0%) |
| 26 to 34 Years | 3 (100.0%) | 0 (0.0%) |
| 35 to 44 Years | 0 (0.0%) | 0 (0.0%) |
| 45 to 54 Years | 0 (0.0%) | 0 (0.0%) |
| 55 to 64 Years | 6 (75.0%) | 2 (25.0%) |
| 65 to 74 Years | 2 (100.0%) | 0 (0.0%) |
| 75 Years and older | 3 (100.0%) | 0 (0.0%) |
| Total | 16 (88.9%) | 2 (11.1%) |
Health Insurance Coverage by Citizenship Status in Sibley
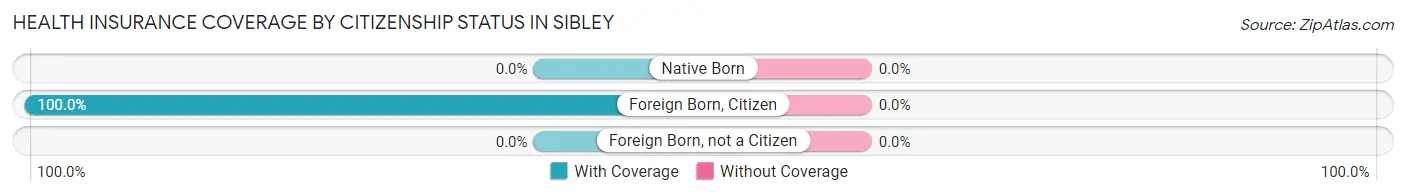
| Citizenship Status | With Coverage | Without Coverage |
| Native Born | 0 (0.0%) | 0 (0.0%) |
| Foreign Born, Citizen | 2 (100.0%) | 0 (0.0%) |
| Foreign Born, not a Citizen | 0 (0.0%) | 0 (0.0%) |
Health Insurance Coverage by Household Income in Sibley
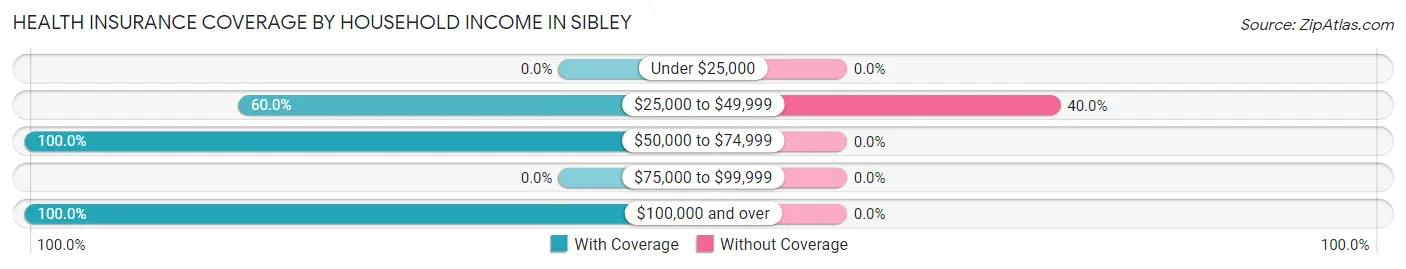
| Household Income | With Coverage | Without Coverage |
| Under $25,000 | 0 (0.0%) | 0 (0.0%) |
| $25,000 to $49,999 | 3 (60.0%) | 2 (40.0%) |
| $50,000 to $74,999 | 10 (100.0%) | 0 (0.0%) |
| $75,000 to $99,999 | 0 (0.0%) | 0 (0.0%) |
| $100,000 and over | 3 (100.0%) | 0 (0.0%) |
Public vs Private Health Insurance Coverage by Age in Sibley
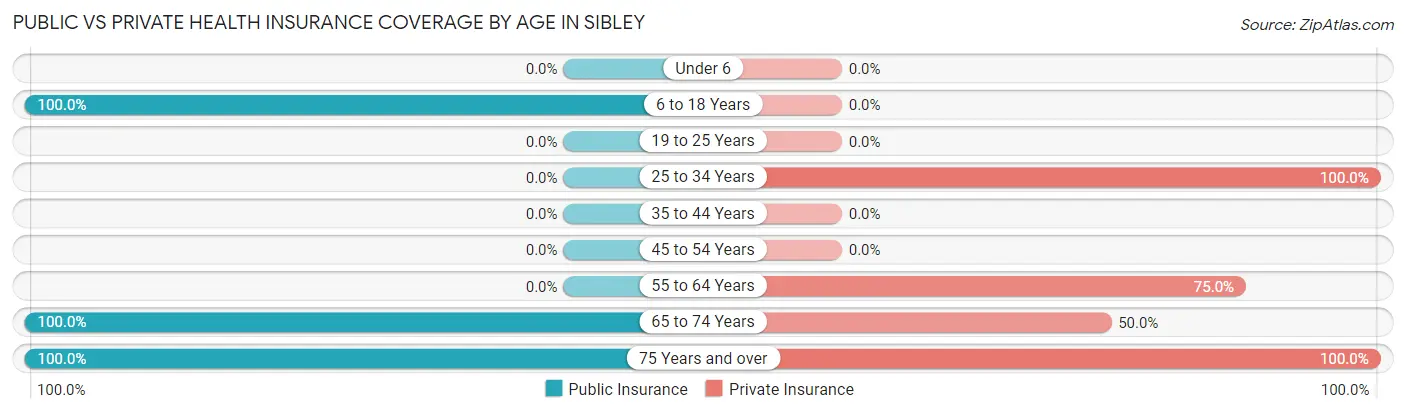
| Age Bracket | Public Insurance | Private Insurance |
| Under 6 | 0 (0.0%) | 0 (0.0%) |
| 6 to 18 Years | 2 (100.0%) | 0 (0.0%) |
| 19 to 25 Years | 0 (0.0%) | 0 (0.0%) |
| 25 to 34 Years | 0 (0.0%) | 3 (100.0%) |
| 35 to 44 Years | 0 (0.0%) | 0 (0.0%) |
| 45 to 54 Years | 0 (0.0%) | 0 (0.0%) |
| 55 to 64 Years | 0 (0.0%) | 6 (75.0%) |
| 65 to 74 Years | 2 (100.0%) | 1 (50.0%) |
| 75 Years and over | 3 (100.0%) | 3 (100.0%) |
| Total | 7 (38.9%) | 13 (72.2%) |
Disability Status by Sex by Age in Sibley
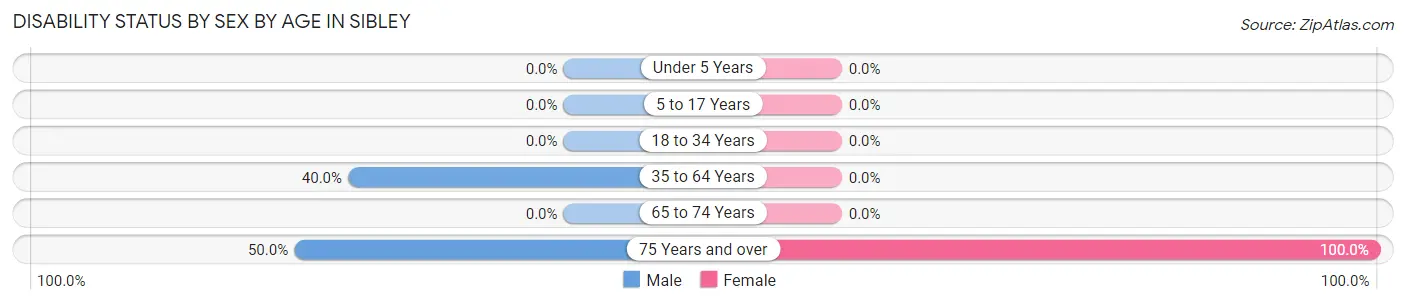
| Age Bracket | Male | Female |
| Under 5 Years | 0 (0.0%) | 0 (0.0%) |
| 5 to 17 Years | 0 (0.0%) | 0 (0.0%) |
| 18 to 34 Years | 0 (0.0%) | 0 (0.0%) |
| 35 to 64 Years | 2 (40.0%) | 0 (0.0%) |
| 65 to 74 Years | 0 (0.0%) | 0 (0.0%) |
| 75 Years and over | 1 (50.0%) | 1 (100.0%) |
Disability Class by Sex by Age in Sibley
Disability Class: Hearing Difficulty
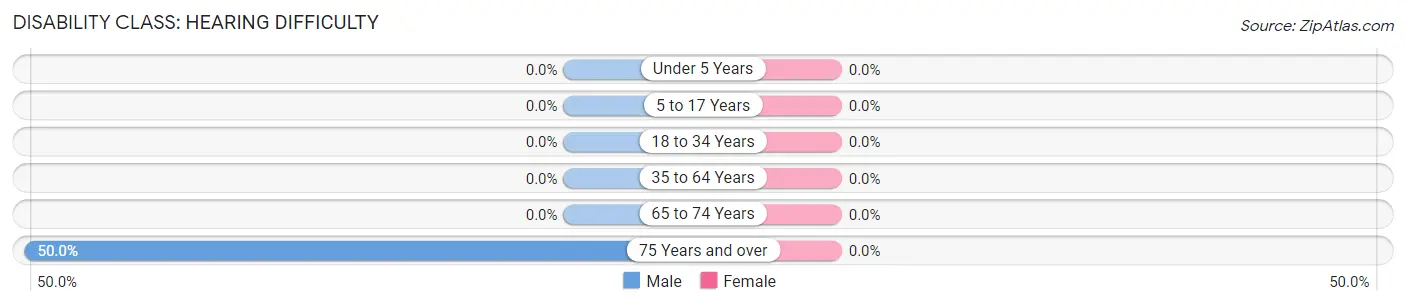
| Age Bracket | Male | Female |
| Under 5 Years | 0 (0.0%) | 0 (0.0%) |
| 5 to 17 Years | 0 (0.0%) | 0 (0.0%) |
| 18 to 34 Years | 0 (0.0%) | 0 (0.0%) |
| 35 to 64 Years | 0 (0.0%) | 0 (0.0%) |
| 65 to 74 Years | 0 (0.0%) | 0 (0.0%) |
| 75 Years and over | 1 (50.0%) | 0 (0.0%) |
Disability Class: Vision Difficulty
| Age Bracket | Male | Female |
| Under 5 Years | 0 (0.0%) | 0 (0.0%) |
| 5 to 17 Years | 0 (0.0%) | 0 (0.0%) |
| 18 to 34 Years | 0 (0.0%) | 0 (0.0%) |
| 35 to 64 Years | 0 (0.0%) | 0 (0.0%) |
| 65 to 74 Years | 0 (0.0%) | 0 (0.0%) |
| 75 Years and over | 0 (0.0%) | 0 (0.0%) |
Disability Class: Cognitive Difficulty
| Age Bracket | Male | Female |
| 5 to 17 Years | 0 (0.0%) | 0 (0.0%) |
| 18 to 34 Years | 0 (0.0%) | 0 (0.0%) |
| 35 to 64 Years | 0 (0.0%) | 0 (0.0%) |
| 65 to 74 Years | 0 (0.0%) | 0 (0.0%) |
| 75 Years and over | 0 (0.0%) | 0 (0.0%) |
Disability Class: Ambulatory Difficulty
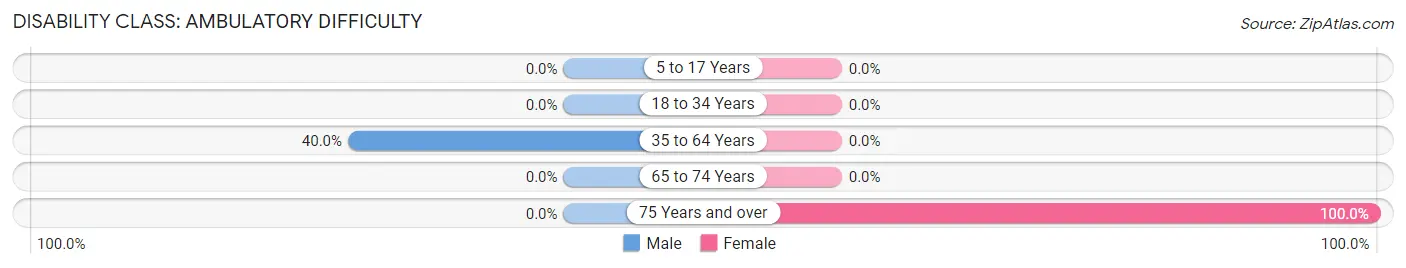
| Age Bracket | Male | Female |
| 5 to 17 Years | 0 (0.0%) | 0 (0.0%) |
| 18 to 34 Years | 0 (0.0%) | 0 (0.0%) |
| 35 to 64 Years | 2 (40.0%) | 0 (0.0%) |
| 65 to 74 Years | 0 (0.0%) | 0 (0.0%) |
| 75 Years and over | 0 (0.0%) | 1 (100.0%) |
Disability Class: Self-Care Difficulty
| Age Bracket | Male | Female |
| 5 to 17 Years | 0 (0.0%) | 0 (0.0%) |
| 18 to 34 Years | 0 (0.0%) | 0 (0.0%) |
| 35 to 64 Years | 0 (0.0%) | 0 (0.0%) |
| 65 to 74 Years | 0 (0.0%) | 0 (0.0%) |
| 75 Years and over | 0 (0.0%) | 0 (0.0%) |
Technology Access in Sibley
Computing Device Access in Sibley
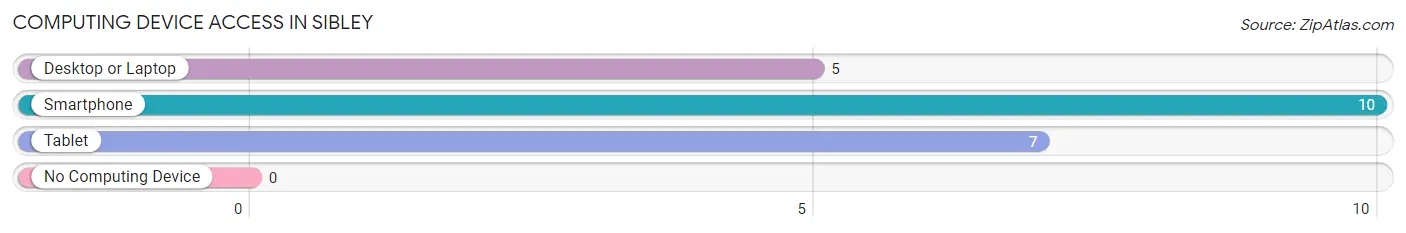
| Device Type | # Households | % Households |
| Desktop or Laptop | 5 | 50.0% |
| Smartphone | 10 | 100.0% |
| Tablet | 7 | 70.0% |
| No Computing Device | 0 | 0.0% |
| Total | 10 | 100.0% |
Internet Access in Sibley
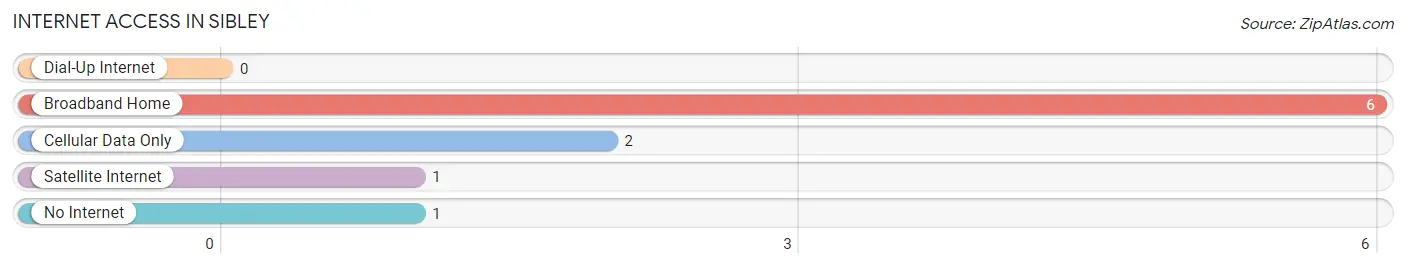
| Internet Type | # Households | % Households |
| Dial-Up Internet | 0 | 0.0% |
| Broadband Home | 6 | 60.0% |
| Cellular Data Only | 2 | 20.0% |
| Satellite Internet | 1 | 10.0% |
| No Internet | 1 | 10.0% |
| Total | 10 | 100.0% |
Sibley Summary
Sibley is a small city located in the state of North Dakota, United States. It is situated in the southeastern corner of the state, in the county of Dickey. The city has a population of approximately 1,000 people, and is the county seat of Dickey County.
History
Sibley was founded in 1883 by a group of settlers from Wisconsin. The city was named after Henry Hastings Sibley, a prominent figure in the early history of the state. The city was incorporated in 1887, and the first post office was established in 1888.
The city was initially a farming community, and the main crops grown were wheat, oats, and barley. In the early 1900s, the city began to diversify its economy, and the first bank was established in 1906. The city also became a hub for the railroad industry, and the first railroad line was built in 1910.
In the 1920s, the city experienced a period of growth, and the population increased from 500 to 1,000. The city also became a center for the oil industry, and the first oil well was drilled in 1923.
Geography
Sibley is located in the southeastern corner of North Dakota, in the county of Dickey. The city is situated on the banks of the James River, and is surrounded by rolling hills and prairies. The city has a total area of 1.2 square miles, and has an elevation of 1,717 feet.
The climate in Sibley is classified as humid continental, with cold winters and hot summers. The average annual temperature is 45 degrees Fahrenheit, and the average annual precipitation is 17 inches.
Economy
The economy of Sibley is largely based on agriculture and oil production. The city is home to several large farms, and the main crops grown are wheat, oats, and barley. The city is also a hub for the oil industry, and the first oil well was drilled in 1923.
The city also has a small manufacturing sector, and the main industries are food processing, metal fabrication, and woodworking. The city also has a small retail sector, and the main stores are grocery stores, hardware stores, and clothing stores.
Demographics
As of the 2010 census, the population of Sibley was 1,000 people. The racial makeup of the city was 97.2% White, 0.7% Native American, 0.3% Asian, 0.2% African American, and 1.6% from other races. The median household income was $41,250, and the median family income was $50,000.
The city has a high rate of poverty, with 24.3% of the population living below the poverty line. The city also has a high rate of unemployment, with 8.3% of the population unemployed. The city also has a high rate of crime, with a crime rate of 8.3 per 1,000 people.
Common Questions
What is Per Capita Income in Sibley?
Per Capita income in Sibley is $33,400.
What is the Median Family Income in Sibley?
Median Family Income in Sibley is $54,583.
What is the Median Household income in Sibley?
Median Household Income in Sibley is $53,333.
What is Inequality or Gini Index in Sibley?
Inequality or Gini Index in Sibley is 0.30.
What is the Total Population of Sibley?
Total Population of Sibley is 18.
What is the Total Male Population of Sibley?
Total Male Population of Sibley is 9.
What is the Total Female Population of Sibley?
Total Female Population of Sibley is 9.
What is the Ratio of Males per 100 Females in Sibley?
There are 100.00 Males per 100 Females in Sibley.
What is the Ratio of Females per 100 Males in Sibley?
There are 100.00 Females per 100 Males in Sibley.
What is the Median Population Age in Sibley?
Median Population Age in Sibley is 63.7 Years.
What is the Average Family Size in Sibley
Average Family Size in Sibley is 2.1 People.
What is the Average Household Size in Sibley
Average Household Size in Sibley is 1.8 People.
How Large is the Labor Force in Sibley?
There are 6 People in the Labor Forcein in Sibley.
What is the Percentage of People in the Labor Force in Sibley?
37.5% of People are in the Labor Force in Sibley.