Rainbow City, AZ Map & Demographics
Rainbow City Map
Rainbow City Overview
$6,636
PER CAPITA INCOME
0.69
INEQUALITY / GINI INDEX
596
TOTAL POPULATION
281
MALE POPULATION
315
FEMALE POPULATION
89.21
MALES / 100 FEMALES
112.10
FEMALES / 100 MALES
29.6
MEDIAN AGE
4.9
AVG FAMILY SIZE
4.5
AVG HOUSEHOLD SIZE
107
LABOR FORCE [ PEOPLE ]
25.5%
PERCENT IN LABOR FORCE
42.1%
UNEMPLOYMENT RATE
Income in Rainbow City
Income Overview in Rainbow City
| Characteristic | Number | Measure |
| Per Capita Income | 596 | $6,636 |
| Median Family Income | 119 | $0 |
| Mean Family Income | 119 | $27,321 |
| Median Household Income | 132 | $0 |
| Mean Household Income | 132 | $24,881 |
| Income Deficit | 119 | $0 |
| Wage / Income Gap (%) | 596 | 0.00% |
| Wage / Income Gap ($) | 596 | 100.00¢ per $1 |
| Gini / Inequality Index | 596 | 0.69 |
Earnings by Sex in Rainbow City
| Sex | Number | Average Earnings |
| Male | 25 (40.3%) | $0 |
| Female | 37 (59.7%) | $0 |
| Total | 62 (100.0%) | $0 |
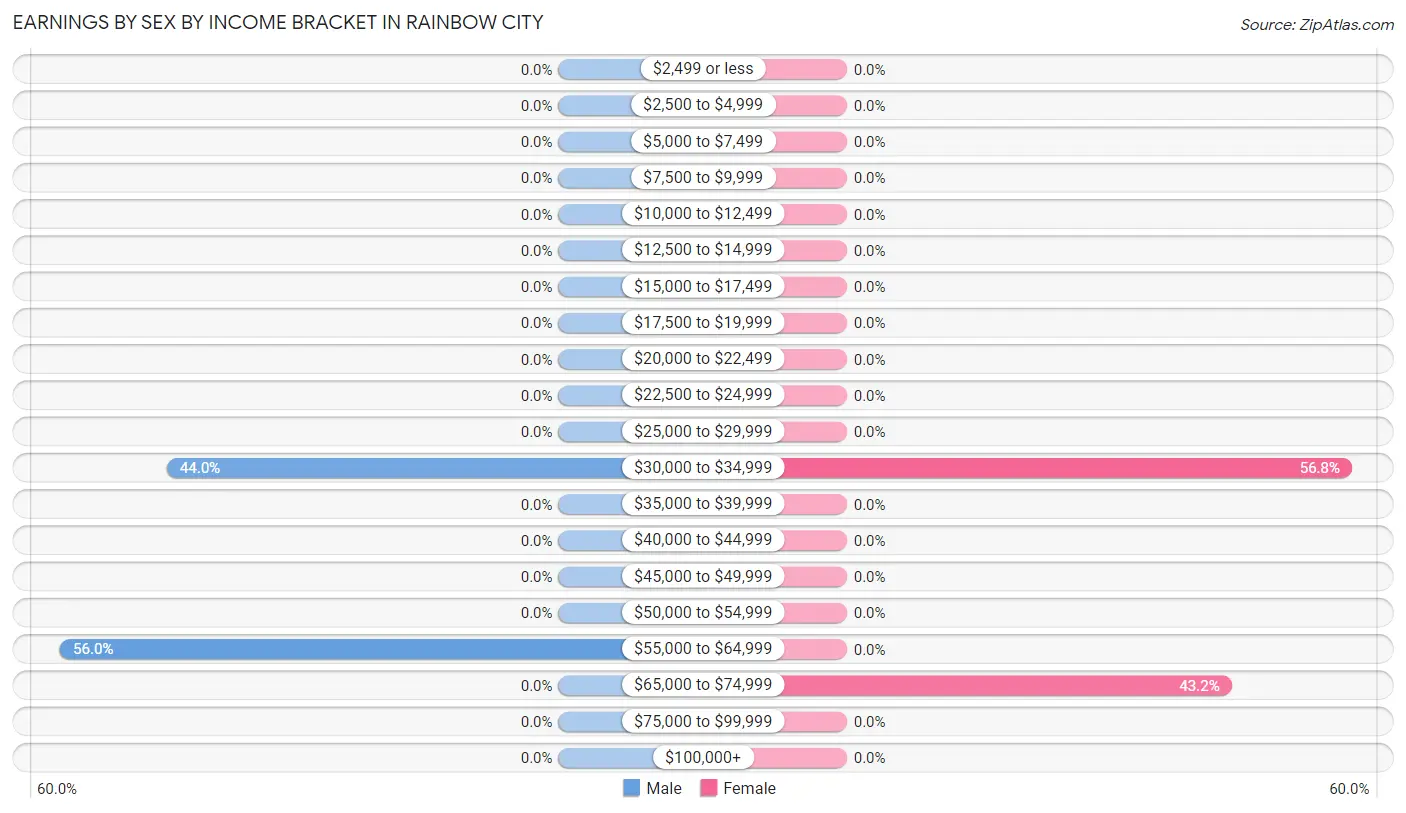
Earnings by Sex by Income Bracket in Rainbow City
The most common earnings brackets in Rainbow City are $55,000 to $64,999 for men (14 | 56.0%) and $30,000 to $34,999 for women (21 | 56.8%).
| Income | Male | Female |
| $2,499 or less | 0 (0.0%) | 0 (0.0%) |
| $2,500 to $4,999 | 0 (0.0%) | 0 (0.0%) |
| $5,000 to $7,499 | 0 (0.0%) | 0 (0.0%) |
| $7,500 to $9,999 | 0 (0.0%) | 0 (0.0%) |
| $10,000 to $12,499 | 0 (0.0%) | 0 (0.0%) |
| $12,500 to $14,999 | 0 (0.0%) | 0 (0.0%) |
| $15,000 to $17,499 | 0 (0.0%) | 0 (0.0%) |
| $17,500 to $19,999 | 0 (0.0%) | 0 (0.0%) |
| $20,000 to $22,499 | 0 (0.0%) | 0 (0.0%) |
| $22,500 to $24,999 | 0 (0.0%) | 0 (0.0%) |
| $25,000 to $29,999 | 0 (0.0%) | 0 (0.0%) |
| $30,000 to $34,999 | 11 (44.0%) | 21 (56.8%) |
| $35,000 to $39,999 | 0 (0.0%) | 0 (0.0%) |
| $40,000 to $44,999 | 0 (0.0%) | 0 (0.0%) |
| $45,000 to $49,999 | 0 (0.0%) | 0 (0.0%) |
| $50,000 to $54,999 | 0 (0.0%) | 0 (0.0%) |
| $55,000 to $64,999 | 14 (56.0%) | 0 (0.0%) |
| $65,000 to $74,999 | 0 (0.0%) | 16 (43.2%) |
| $75,000 to $99,999 | 0 (0.0%) | 0 (0.0%) |
| $100,000+ | 0 (0.0%) | 0 (0.0%) |
| Total | 25 (100.0%) | 37 (100.0%) |
Earnings by Sex by Educational Attainment in Rainbow City
| Educational Attainment | Male Income | Female Income |
| Less than High School | - | - |
| High School Diploma | - | - |
| College or Associate's Degree | - | - |
| Bachelor's Degree | - | - |
| Graduate Degree | - | - |
| Total | - | - |
Family Income in Rainbow City
Family Income Brackets in Rainbow City
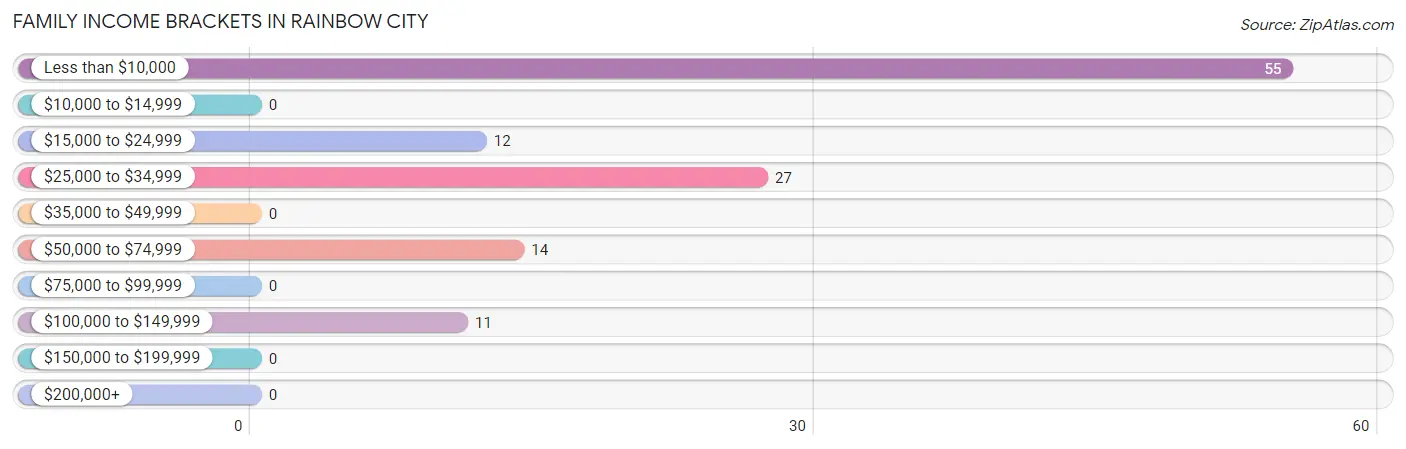
According to the Rainbow City family income data, there are 55 families falling into the less than $10,000 income range, which is the most common income bracket and makes up 46.2% of all families.
| Income Bracket | # Families | % Families |
| Less than $10,000 | 55 | 46.2% |
| $10,000 to $14,999 | 0 | 0.0% |
| $15,000 to $24,999 | 12 | 10.1% |
| $25,000 to $34,999 | 27 | 22.7% |
| $35,000 to $49,999 | 0 | 0.0% |
| $50,000 to $74,999 | 14 | 11.8% |
| $75,000 to $99,999 | 0 | 0.0% |
| $100,000 to $149,999 | 11 | 9.2% |
| $150,000 to $199,999 | 0 | 0.0% |
| $200,000+ | 0 | 0.0% |
Family Income by Famaliy Size in Rainbow City
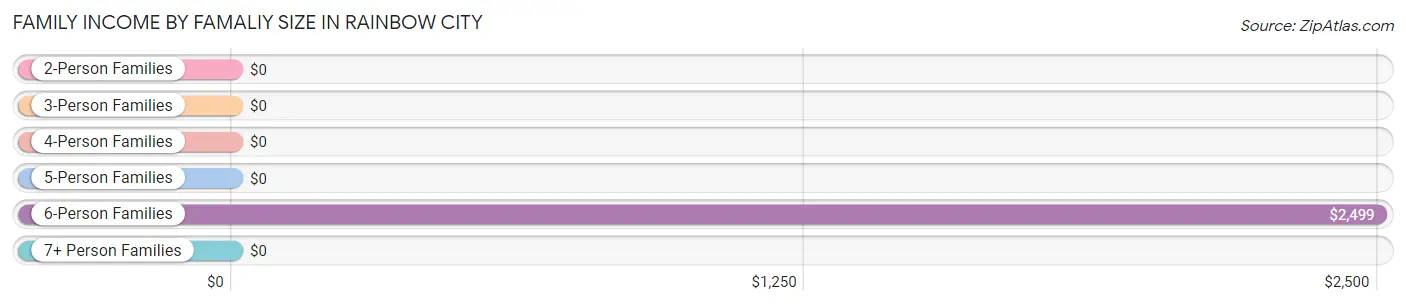
6-person families (48 | 40.3%) account for the highest median family income in Rainbow City with $2,499 per family, while 6-person families (48 | 40.3%) have the highest median income of $416 per family member.
| Income Bracket | # Families | Median Income |
| 2-Person Families | 27 (22.7%) | $0 |
| 3-Person Families | 26 (21.8%) | $0 |
| 4-Person Families | 0 (0.0%) | $0 |
| 5-Person Families | 0 (0.0%) | $0 |
| 6-Person Families | 48 (40.3%) | $2,499 |
| 7+ Person Families | 18 (15.1%) | $0 |
| Total | 119 (100.0%) | $0 |
Family Income by Number of Earners in Rainbow City
| Number of Earners | # Families | Median Income |
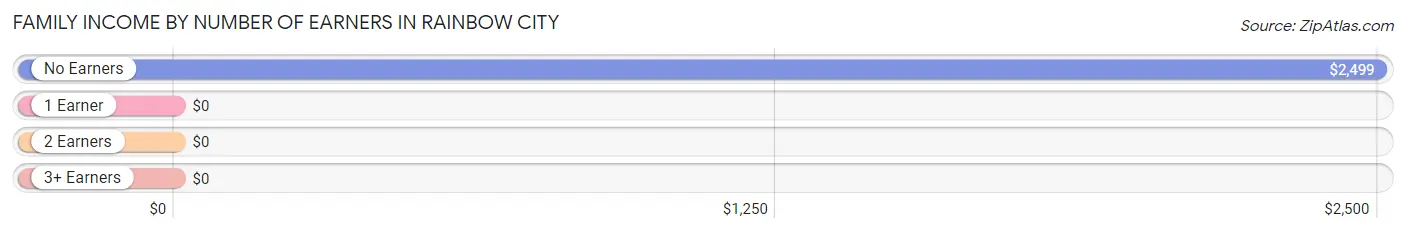
| No Earners | 94 (79.0%) | $2,499 |
| 1 Earner | 14 (11.8%) | $0 |
| 2 Earners | 0 (0.0%) | $0 |
| 3+ Earners | 11 (9.2%) | $0 |
| Total | 119 (100.0%) | $0 |
Household Income in Rainbow City
Household Income Brackets in Rainbow City
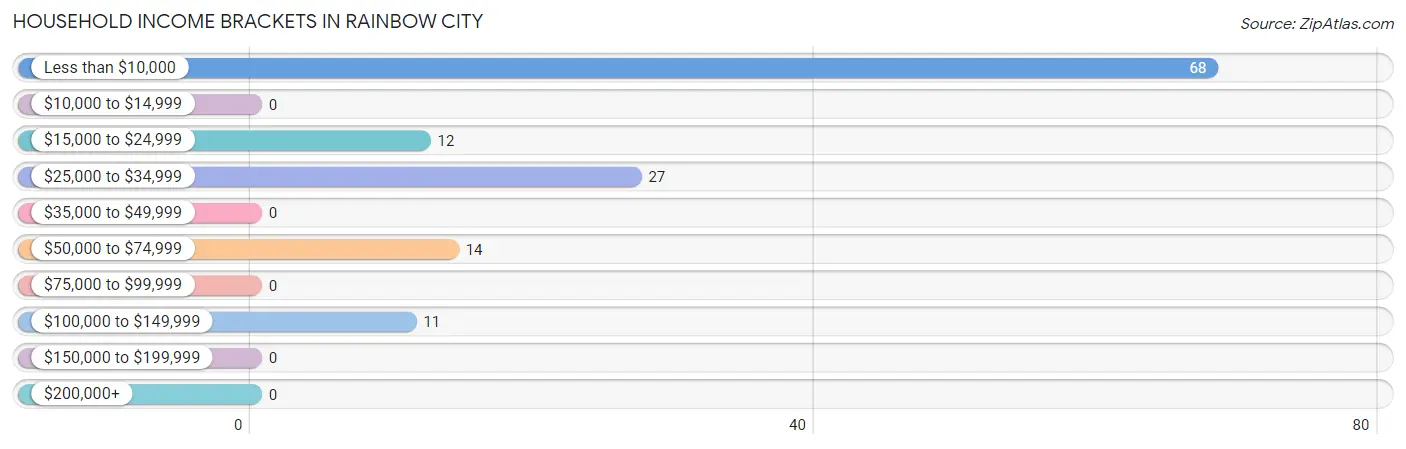
With 68 households falling in the category, the less than $10,000 income range is the most frequent in Rainbow City, accounting for 51.5% of all households.
| Income Bracket | # Households | % Households |
| Less than $10,000 | 68 | 51.5% |
| $10,000 to $14,999 | 0 | 0.0% |
| $15,000 to $24,999 | 12 | 9.1% |
| $25,000 to $34,999 | 27 | 20.5% |
| $35,000 to $49,999 | 0 | 0.0% |
| $50,000 to $74,999 | 14 | 10.6% |
| $75,000 to $99,999 | 0 | 0.0% |
| $100,000 to $149,999 | 11 | 8.3% |
| $150,000 to $199,999 | 0 | 0.0% |
| $200,000+ | 0 | 0.0% |
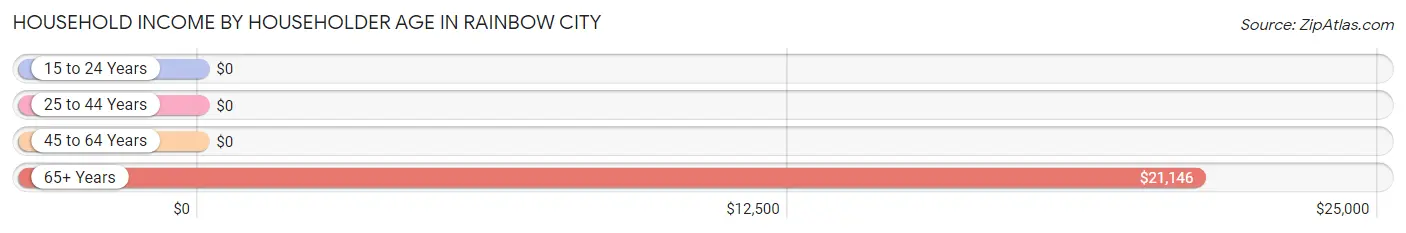
Household Income by Householder Age in Rainbow City
The median household income in Rainbow City is $0, with the highest median household income of $21,146 found in the 65+ years age bracket for the primary householder. A total of 37 households (28.0%) fall into this category.
| Income Bracket | # Households | Median Income |
| 15 to 24 Years | 0 (0.0%) | $0 |
| 25 to 44 Years | 19 (14.4%) | $0 |
| 45 to 64 Years | 76 (57.6%) | $0 |
| 65+ Years | 37 (28.0%) | $21,146 |
| Total | 132 (100.0%) | $0 |
Poverty in Rainbow City
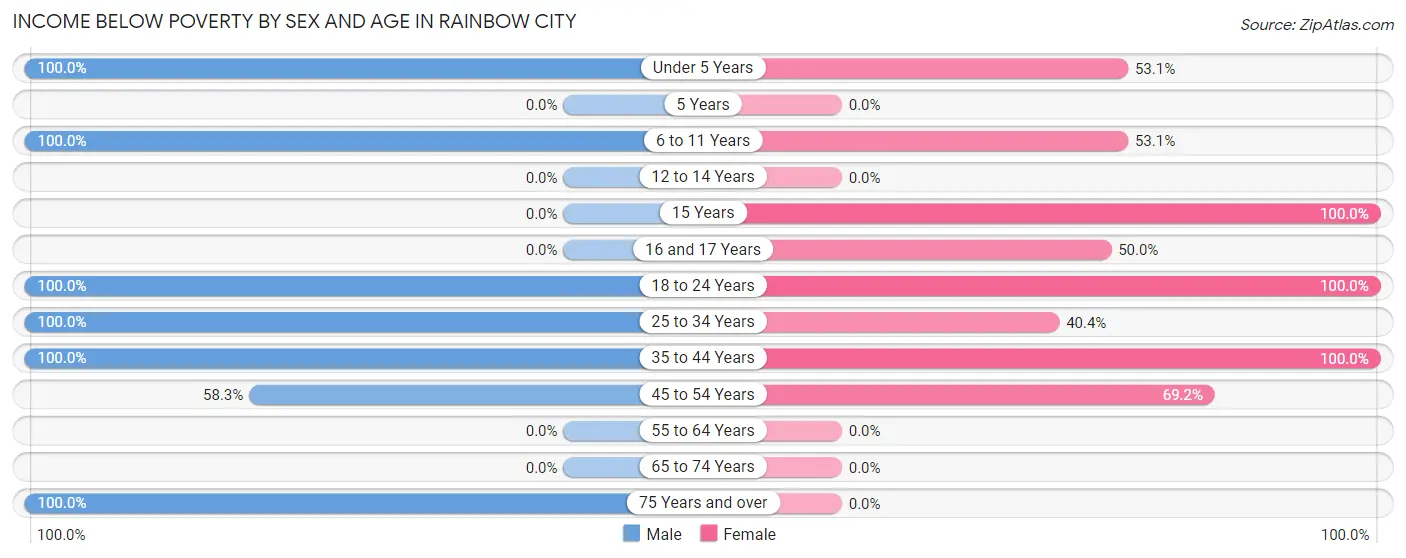
Income Below Poverty by Sex and Age in Rainbow City
With 69.8% poverty level for males and 53.3% for females among the residents of Rainbow City, under 5 year old males and 15 year old females are the most vulnerable to poverty, with 14 males (100.0%) and 15 females (100.0%) in their respective age groups living below the poverty level.
| Age Bracket | Male | Female |
| Under 5 Years | 14 (100.0%) | 17 (53.1%) |
| 5 Years | 0 (0.0%) | 0 (0.0%) |
| 6 to 11 Years | 71 (100.0%) | 17 (53.1%) |
| 12 to 14 Years | 0 (0.0%) | 0 (0.0%) |
| 15 Years | 0 (0.0%) | 15 (100.0%) |
| 16 and 17 Years | 0 (0.0%) | 15 (50.0%) |
| 18 to 24 Years | 18 (100.0%) | 26 (100.0%) |
| 25 to 34 Years | 21 (100.0%) | 23 (40.4%) |
| 35 to 44 Years | 17 (100.0%) | 19 (100.0%) |
| 45 to 54 Years | 42 (58.3%) | 36 (69.2%) |
| 55 to 64 Years | 0 (0.0%) | 0 (0.0%) |
| 65 to 74 Years | 0 (0.0%) | 0 (0.0%) |
| 75 Years and over | 13 (100.0%) | 0 (0.0%) |
| Total | 196 (69.8%) | 168 (53.3%) |
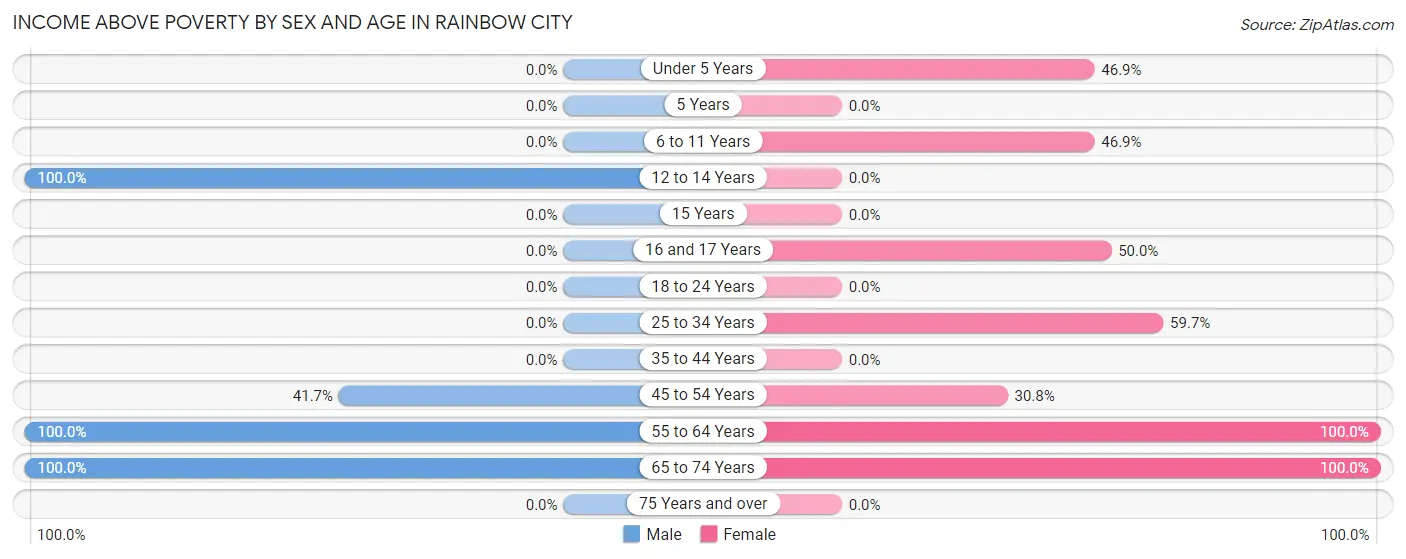
Income Above Poverty by Sex and Age in Rainbow City
According to the poverty statistics in Rainbow City, males aged 12 to 14 years and females aged 55 to 64 years are the age groups that are most secure financially, with 100.0% of males and 100.0% of females in these age groups living above the poverty line.
| Age Bracket | Male | Female |
| Under 5 Years | 0 (0.0%) | 15 (46.9%) |
| 5 Years | 0 (0.0%) | 0 (0.0%) |
| 6 to 11 Years | 0 (0.0%) | 15 (46.9%) |
| 12 to 14 Years | 13 (100.0%) | 0 (0.0%) |
| 15 Years | 0 (0.0%) | 0 (0.0%) |
| 16 and 17 Years | 0 (0.0%) | 15 (50.0%) |
| 18 to 24 Years | 0 (0.0%) | 0 (0.0%) |
| 25 to 34 Years | 0 (0.0%) | 34 (59.7%) |
| 35 to 44 Years | 0 (0.0%) | 0 (0.0%) |
| 45 to 54 Years | 30 (41.7%) | 16 (30.8%) |
| 55 to 64 Years | 29 (100.0%) | 28 (100.0%) |
| 65 to 74 Years | 13 (100.0%) | 24 (100.0%) |
| 75 Years and over | 0 (0.0%) | 0 (0.0%) |
| Total | 85 (30.2%) | 147 (46.7%) |
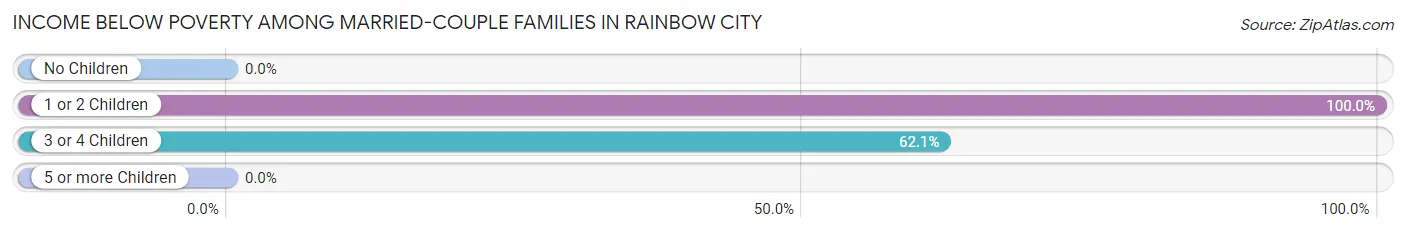
Income Below Poverty Among Married-Couple Families in Rainbow City
The poverty statistics for married-couple families in Rainbow City show that 40.9% or 36 of the total 88 families live below the poverty line. Families with 1 or 2 children have the highest poverty rate of 100.0%, comprising of 18 families. On the other hand, families with no children have the lowest poverty rate of 0.0%, which includes 0 families.
| Children | Above Poverty | Below Poverty |
| No Children | 41 (100.0%) | 0 (0.0%) |
| 1 or 2 Children | 0 (0.0%) | 18 (100.0%) |
| 3 or 4 Children | 11 (37.9%) | 18 (62.1%) |
| 5 or more Children | 0 (0.0%) | 0 (0.0%) |
| Total | 52 (59.1%) | 36 (40.9%) |
Income Below Poverty Among Single-Parent Households in Rainbow City
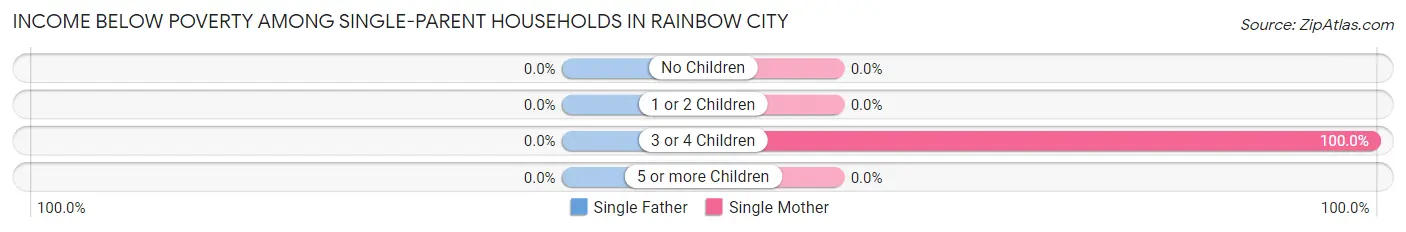
| Children | Single Father | Single Mother |
| No Children | 0 (0.0%) | 0 (0.0%) |
| 1 or 2 Children | 0 (0.0%) | 0 (0.0%) |
| 3 or 4 Children | 0 (0.0%) | 19 (100.0%) |
| 5 or more Children | 0 (0.0%) | 0 (0.0%) |
| Total | 0 (0.0%) | 19 (61.3%) |
Income Below Poverty Among Married-Couple vs Single-Parent Households in Rainbow City
The poverty data for Rainbow City shows that 36 of the married-couple family households (40.9%) and 19 of the single-parent households (61.3%) are living below the poverty level. Within the married-couple family households, those with 1 or 2 children have the highest poverty rate, with 18 households (100.0%) falling below the poverty line. Among the single-parent households, those with 3 or 4 children have the highest poverty rate, with 19 household (100.0%) living below poverty.
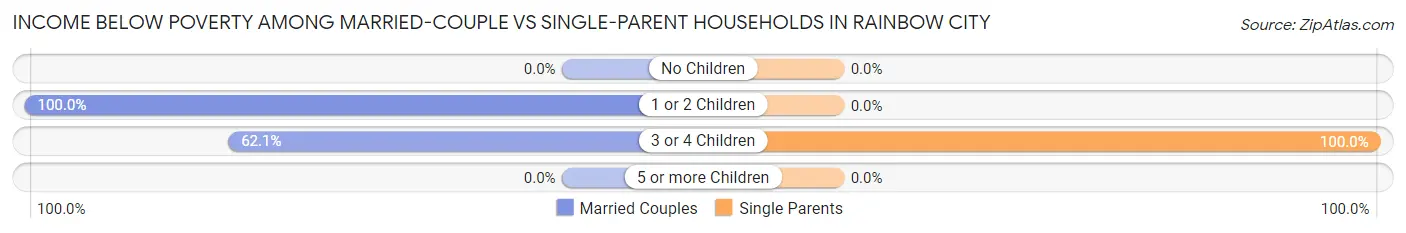
| Children | Married-Couple Families | Single-Parent Households |
| No Children | 0 (0.0%) | 0 (0.0%) |
| 1 or 2 Children | 18 (100.0%) | 0 (0.0%) |
| 3 or 4 Children | 18 (62.1%) | 19 (100.0%) |
| 5 or more Children | 0 (0.0%) | 0 (0.0%) |
| Total | 36 (40.9%) | 19 (61.3%) |
Race in Rainbow City
The most populous races in Rainbow City are Native / Alaskan (567 | 95.1%), Hispanic or Latino (29 | 4.9%), and Two or more Races (29 | 4.9%).
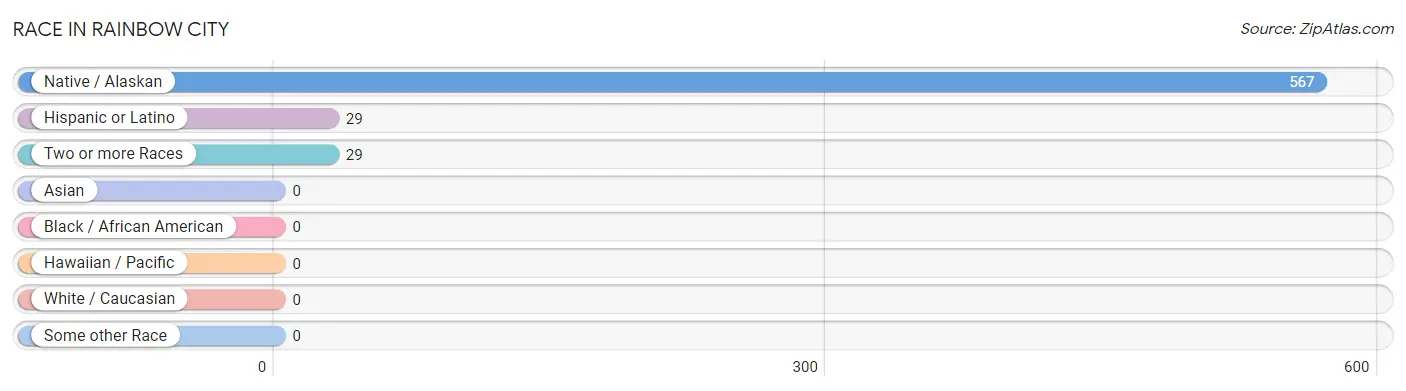
| Race | # Population | % Population |
| Asian | 0 | 0.0% |
| Black / African American | 0 | 0.0% |
| Hawaiian / Pacific | 0 | 0.0% |
| Hispanic or Latino | 29 | 4.9% |
| Native / Alaskan | 567 | 95.1% |
| White / Caucasian | 0 | 0.0% |
| Two or more Races | 29 | 4.9% |
| Some other Race | 0 | 0.0% |
| Total | 596 | 100.0% |
Ancestry in Rainbow City
The most populous ancestries reported in Rainbow City are Apache (554 | 92.9%), Mexican (29 | 4.9%), and Navajo (14 | 2.4%), together accounting for 100.2% of all Rainbow City residents.
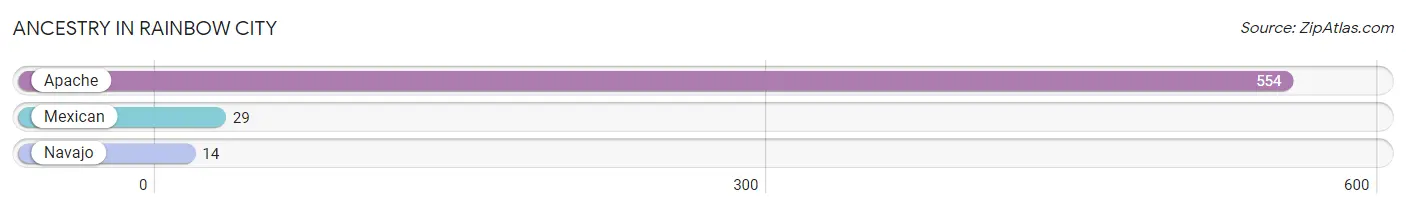
| Ancestry | # Population | % Population |
| Apache | 554 | 92.9% |
| Mexican | 29 | 4.9% |
| Navajo | 14 | 2.4% | View All 3 Rows |
Immigrants in Rainbow City

| Immigration Origin | # Population | % Population | View All 0 Rows |
Sex and Age in Rainbow City
Sex and Age in Rainbow City
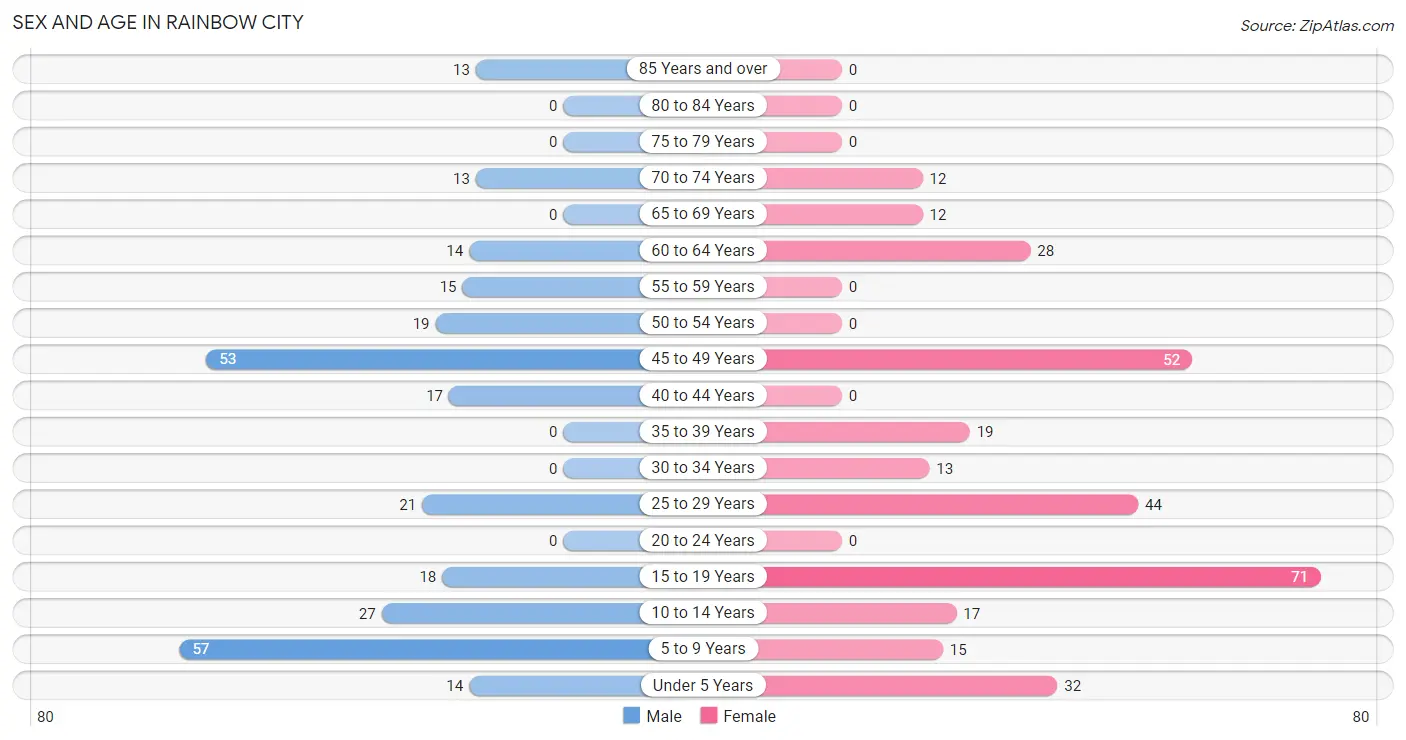
The most populous age groups in Rainbow City are 5 to 9 Years (57 | 20.3%) for men and 15 to 19 Years (71 | 22.5%) for women.
| Age Bracket | Male | Female |
| Under 5 Years | 14 (5.0%) | 32 (10.2%) |
| 5 to 9 Years | 57 (20.3%) | 15 (4.8%) |
| 10 to 14 Years | 27 (9.6%) | 17 (5.4%) |
| 15 to 19 Years | 18 (6.4%) | 71 (22.5%) |
| 20 to 24 Years | 0 (0.0%) | 0 (0.0%) |
| 25 to 29 Years | 21 (7.5%) | 44 (14.0%) |
| 30 to 34 Years | 0 (0.0%) | 13 (4.1%) |
| 35 to 39 Years | 0 (0.0%) | 19 (6.0%) |
| 40 to 44 Years | 17 (6.0%) | 0 (0.0%) |
| 45 to 49 Years | 53 (18.9%) | 52 (16.5%) |
| 50 to 54 Years | 19 (6.8%) | 0 (0.0%) |
| 55 to 59 Years | 15 (5.3%) | 0 (0.0%) |
| 60 to 64 Years | 14 (5.0%) | 28 (8.9%) |
| 65 to 69 Years | 0 (0.0%) | 12 (3.8%) |
| 70 to 74 Years | 13 (4.6%) | 12 (3.8%) |
| 75 to 79 Years | 0 (0.0%) | 0 (0.0%) |
| 80 to 84 Years | 0 (0.0%) | 0 (0.0%) |
| 85 Years and over | 13 (4.6%) | 0 (0.0%) |
| Total | 281 (100.0%) | 315 (100.0%) |
Families and Households in Rainbow City
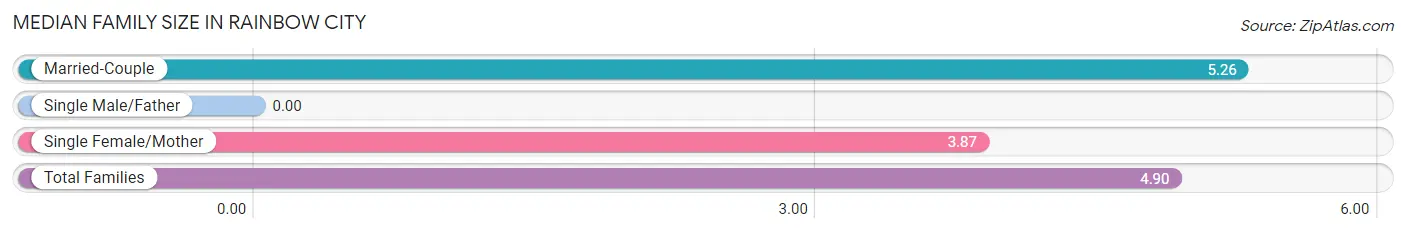
Median Family Size in Rainbow City
| Family Type | # Families | Family Size |
| Married-Couple | 88 (74.0%) | 5.26 |
| Single Male/Father | 0 (0.0%) | - |
| Single Female/Mother | 31 (26.1%) | 3.87 |
| Total Families | 119 (100.0%) | 4.90 |
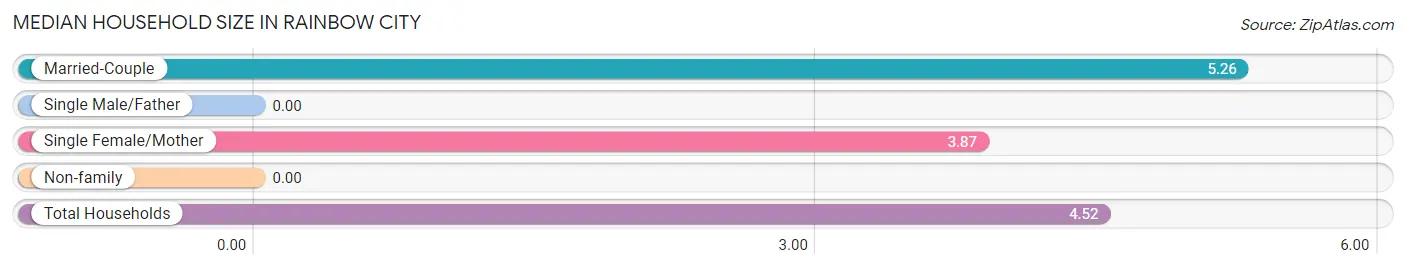
Median Household Size in Rainbow City
| Household Type | # Households | Household Size |
| Married-Couple | 88 (66.7%) | 5.26 |
| Single Male/Father | 0 (0.0%) | - |
| Single Female/Mother | 31 (23.5%) | 3.87 |
| Non-family | 13 (9.9%) | - |
| Total Households | 132 (100.0%) | 4.52 |
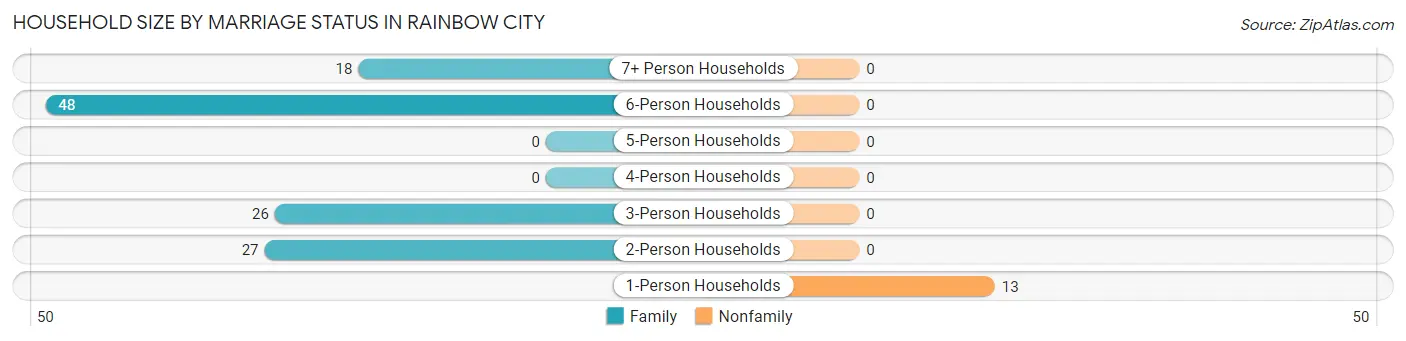
Household Size by Marriage Status in Rainbow City
Out of a total of 132 households in Rainbow City, 119 (90.1%) are family households, while 13 (9.9%) are nonfamily households. The most numerous type of family households are 6-person households, comprising 48, and the most common type of nonfamily households are 1-person households, comprising 13.
| Household Size | Family Households | Nonfamily Households |
| 1-Person Households | - | 13 (9.9%) |
| 2-Person Households | 27 (20.4%) | 0 (0.0%) |
| 3-Person Households | 26 (19.7%) | 0 (0.0%) |
| 4-Person Households | 0 (0.0%) | 0 (0.0%) |
| 5-Person Households | 0 (0.0%) | 0 (0.0%) |
| 6-Person Households | 48 (36.4%) | 0 (0.0%) |
| 7+ Person Households | 18 (13.6%) | 0 (0.0%) |
| Total | 119 (90.1%) | 13 (9.9%) |
Female Fertility in Rainbow City
Fertility by Age in Rainbow City
Average fertility rate in Rainbow City is 211.0 births per 1,000 women. Women in the age bracket of 20 to 34 years have the highest fertility rate with 404.0 births per 1,000 women. Women in the age bracket of 20 to 34 years acount for 54.8% of all women with births.
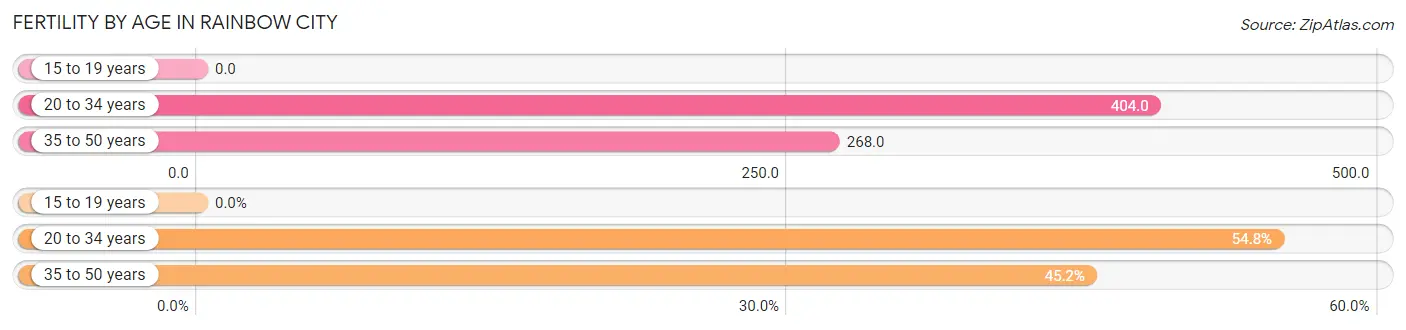
| Age Bracket | Women with Births | Births / 1,000 Women |
| 15 to 19 years | 0 (0.0%) | 0.0 |
| 20 to 34 years | 23 (54.8%) | 404.0 |
| 35 to 50 years | 19 (45.2%) | 268.0 |
| Total | 42 (100.0%) | 211.0 |
Fertility by Age by Marriage Status in Rainbow City
45.2% of women with births (42) in Rainbow City are married. The highest percentage of unmarried women with births falls into 20 to 34 years age bracket with 100.0% of them unmarried at the time of birth, while the lowest percentage of unmarried women with births belong to 35 to 50 years age bracket with 0.0% of them unmarried.
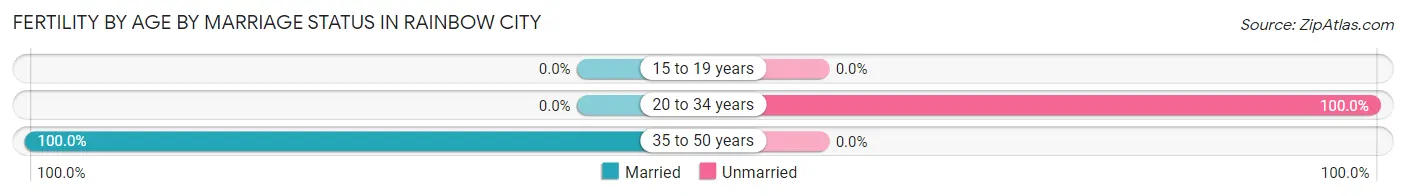
| Age Bracket | Married | Unmarried |
| 15 to 19 years | 0 (0.0%) | 0 (0.0%) |
| 20 to 34 years | 0 (0.0%) | 23 (100.0%) |
| 35 to 50 years | 19 (100.0%) | 0 (0.0%) |
| Total | 19 (45.2%) | 23 (54.8%) |
Fertility by Education in Rainbow City
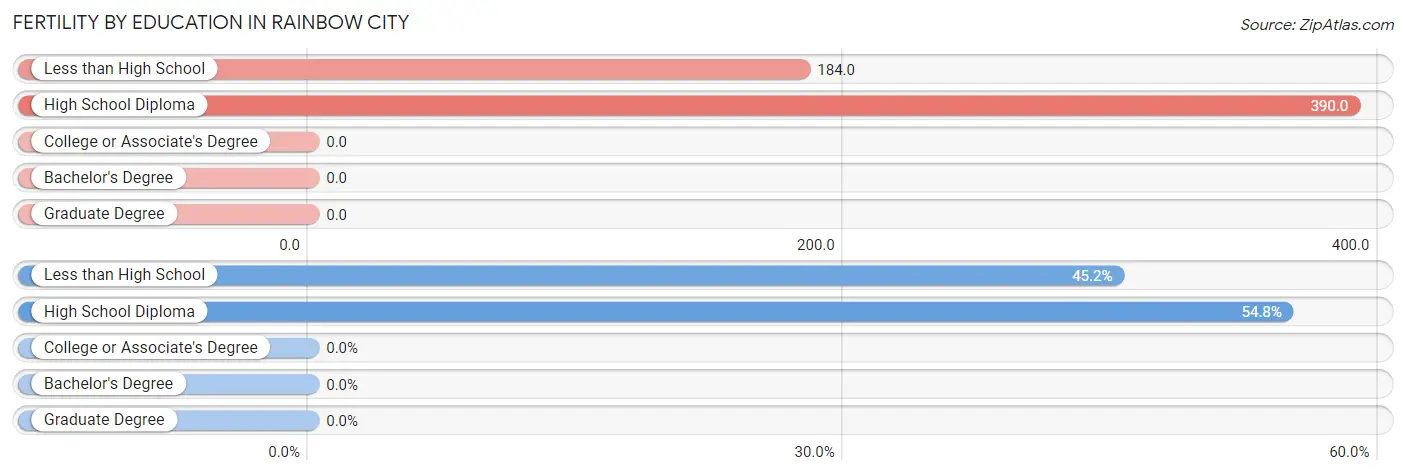
| Educational Attainment | Women with Births | Births / 1,000 Women |
| Less than High School | 19 (45.2%) | 184.0 |
| High School Diploma | 23 (54.8%) | 390.0 |
| College or Associate's Degree | 0 (0.0%) | 0.0 |
| Bachelor's Degree | 0 (0.0%) | 0.0 |
| Graduate Degree | 0 (0.0%) | 0.0 |
| Total | 42 (100.0%) | 211.0 |
Fertility by Education by Marriage Status in Rainbow City
54.8% of women with births in Rainbow City are unmarried. Women with the educational attainment of less than high school are most likely to be married with 100.0% of them married at childbirth, while women with the educational attainment of high school diploma are least likely to be married with 100.0% of them unmarried at childbirth.
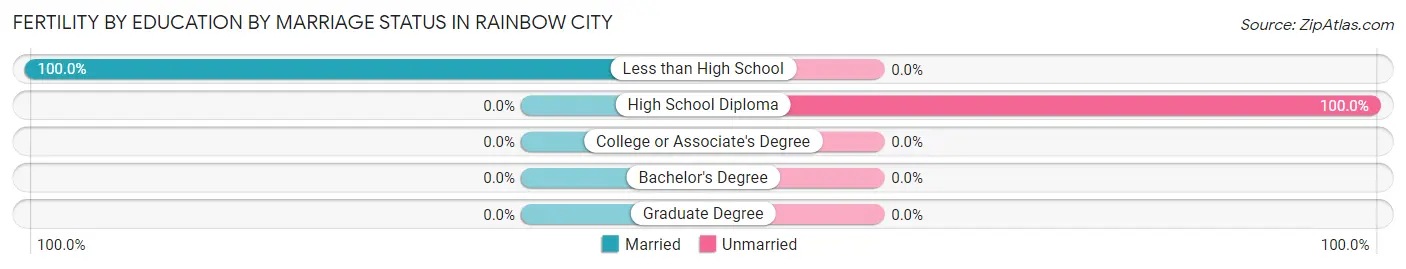
| Educational Attainment | Married | Unmarried |
| Less than High School | 19 (100.0%) | 0 (0.0%) |
| High School Diploma | 0 (0.0%) | 23 (100.0%) |
| College or Associate's Degree | 0 (0.0%) | 0 (0.0%) |
| Bachelor's Degree | 0 (0.0%) | 0 (0.0%) |
| Graduate Degree | 0 (0.0%) | 0 (0.0%) |
| Total | 19 (45.2%) | 23 (54.8%) |
Employment Characteristics in Rainbow City
Employment by Class of Employer in Rainbow City
Among the 62 employed individuals in Rainbow City, local government employees (27 | 43.5%), federal government employees (21 | 33.9%), and private company employees (14 | 22.6%) make up the most common classes of employment.
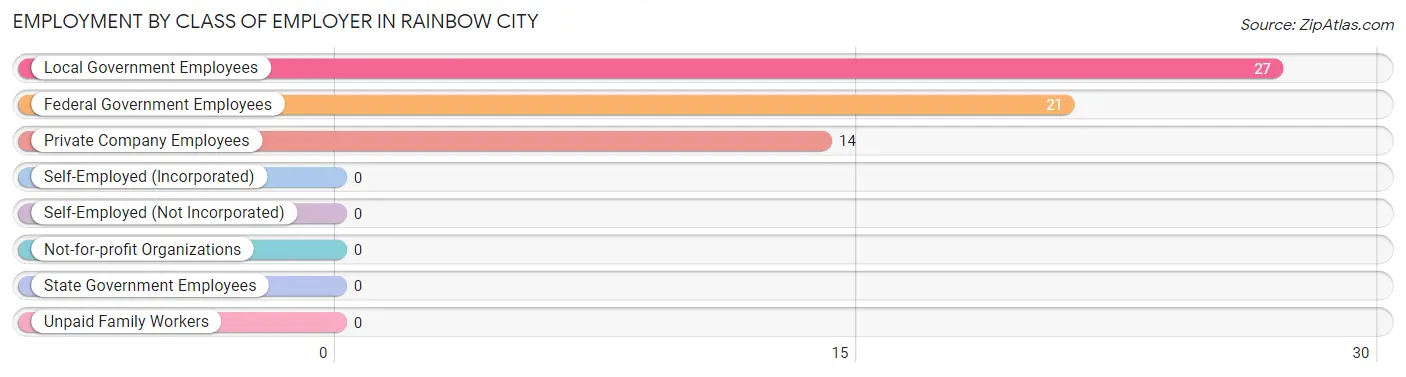
| Employer Class | # Employees | % Employees |
| Private Company Employees | 14 | 22.6% |
| Self-Employed (Incorporated) | 0 | 0.0% |
| Self-Employed (Not Incorporated) | 0 | 0.0% |
| Not-for-profit Organizations | 0 | 0.0% |
| Local Government Employees | 27 | 43.5% |
| State Government Employees | 0 | 0.0% |
| Federal Government Employees | 21 | 33.9% |
| Unpaid Family Workers | 0 | 0.0% |
| Total | 62 | 100.0% |
Employment Status by Age in Rainbow City
According to the labor force statistics for Rainbow City, out of the total population over 16 years of age (419), 25.5% or 107 individuals are in the labor force, with 42.1% or 45 of them unemployed. The age group with the highest labor force participation rate is 35 to 44 years, with 47.2% or 17 individuals in the labor force. Within the labor force, the 16 to 19 years age range has the highest percentage of unemployed individuals, with 100.0% or 15 of them being unemployed.
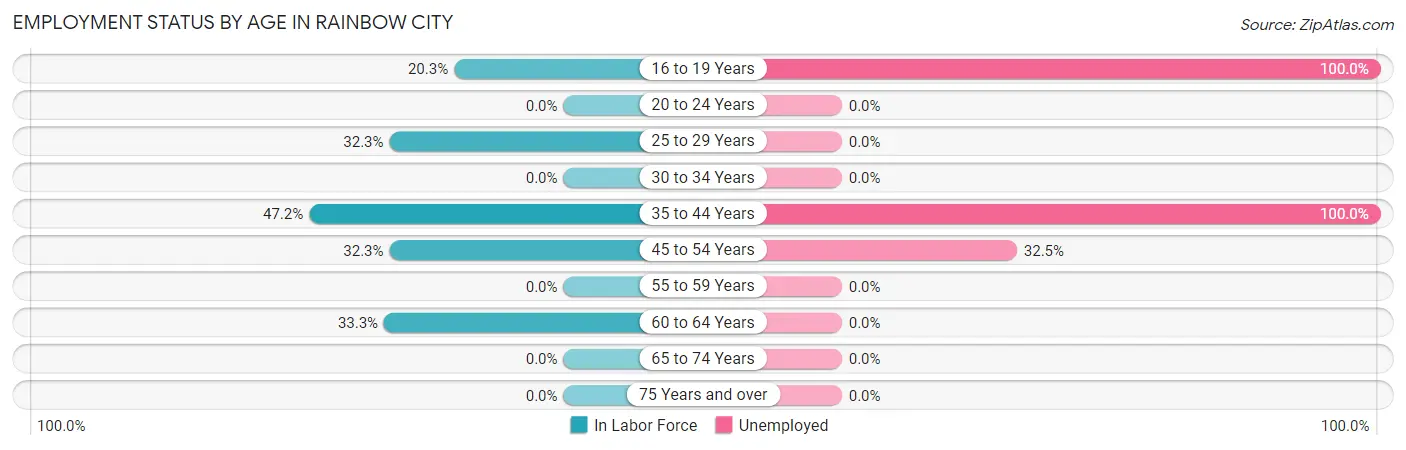
| Age Bracket | In Labor Force | Unemployed |
| 16 to 19 Years | 15 (20.3%) | 15 (100.0%) |
| 20 to 24 Years | 0 (0.0%) | 0 (0.0%) |
| 25 to 29 Years | 21 (32.3%) | 0 (0.0%) |
| 30 to 34 Years | 0 (0.0%) | 0 (0.0%) |
| 35 to 44 Years | 17 (47.2%) | 17 (100.0%) |
| 45 to 54 Years | 40 (32.3%) | 13 (32.5%) |
| 55 to 59 Years | 0 (0.0%) | 0 (0.0%) |
| 60 to 64 Years | 14 (33.3%) | 0 (0.0%) |
| 65 to 74 Years | 0 (0.0%) | 0 (0.0%) |
| 75 Years and over | 0 (0.0%) | 0 (0.0%) |
| Total | 107 (25.5%) | 45 (42.1%) |
Employment Status by Educational Attainment in Rainbow City
According to labor force statistics for Rainbow City, 31.2% of individuals (92) out of the total population between 25 and 64 years of age (295) are in the labor force, with 32.6% or 30 of them being unemployed. The group with the highest labor force participation rate are those with the educational attainment of college / associate degree, with 100.0% or 45 individuals in the labor force. Within the labor force, individuals with high school diploma education have the highest percentage of unemployment, with 100.0% or 17 of them being unemployed.
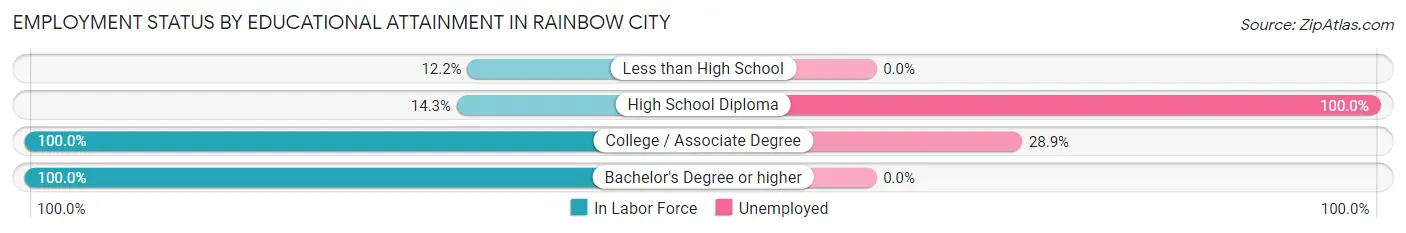
| Educational Attainment | In Labor Force | Unemployed |
| Less than High School | 14 (12.2%) | 0 (0.0%) |
| High School Diploma | 17 (14.3%) | 119 (100.0%) |
| College / Associate Degree | 45 (100.0%) | 13 (28.9%) |
| Bachelor's Degree or higher | 16 (100.0%) | 0 (0.0%) |
| Total | 92 (31.2%) | 96 (32.6%) |
Employment Occupations by Sex in Rainbow City
Management, Business, Science and Arts Occupations
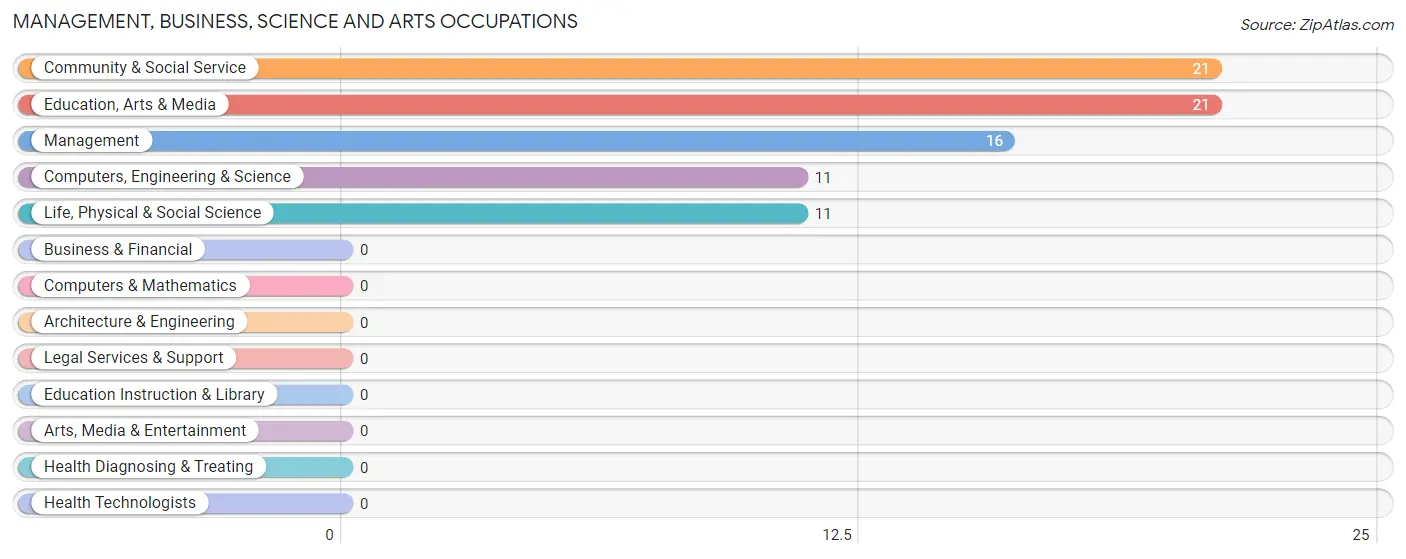
The most common Management, Business, Science and Arts occupations in Rainbow City are Community & Social Service (21 | 33.9%), Education, Arts & Media (21 | 33.9%), Management (16 | 25.8%), Computers, Engineering & Science (11 | 17.7%), and Life, Physical & Social Science (11 | 17.7%).
Management, Business, Science and Arts Occupations by Sex
Within the Management, Business, Science and Arts occupations in Rainbow City, the most male-oriented occupations are Computers, Engineering & Science (100.0%), and Life, Physical & Social Science (100.0%), while the most female-oriented occupations are Management (100.0%), Community & Social Service (100.0%), and Education, Arts & Media (100.0%).
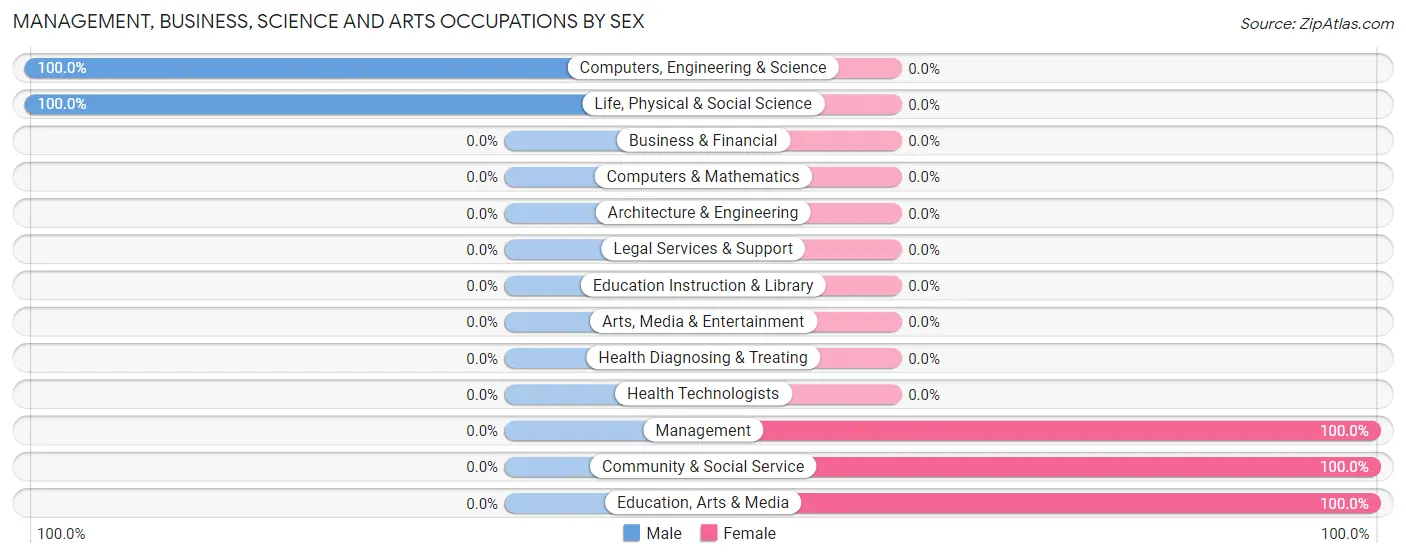
| Occupation | Male | Female |
| Management | 0 (0.0%) | 16 (100.0%) |
| Business & Financial | 0 (0.0%) | 0 (0.0%) |
| Computers, Engineering & Science | 11 (100.0%) | 0 (0.0%) |
| Computers & Mathematics | 0 (0.0%) | 0 (0.0%) |
| Architecture & Engineering | 0 (0.0%) | 0 (0.0%) |
| Life, Physical & Social Science | 11 (100.0%) | 0 (0.0%) |
| Community & Social Service | 0 (0.0%) | 21 (100.0%) |
| Education, Arts & Media | 0 (0.0%) | 21 (100.0%) |
| Legal Services & Support | 0 (0.0%) | 0 (0.0%) |
| Education Instruction & Library | 0 (0.0%) | 0 (0.0%) |
| Arts, Media & Entertainment | 0 (0.0%) | 0 (0.0%) |
| Health Diagnosing & Treating | 0 (0.0%) | 0 (0.0%) |
| Health Technologists | 0 (0.0%) | 0 (0.0%) |
| Total (Category) | 11 (22.9%) | 37 (77.1%) |
| Total (Overall) | 25 (40.3%) | 37 (59.7%) |
Services Occupations
Services Occupations by Sex
| Occupation | Male | Female |
| Healthcare Support | 0 (0.0%) | 0 (0.0%) |
| Security & Protection | 0 (0.0%) | 0 (0.0%) |
| Firefighting & Prevention | 0 (0.0%) | 0 (0.0%) |
| Law Enforcement | 0 (0.0%) | 0 (0.0%) |
| Food Preparation & Serving | 0 (0.0%) | 0 (0.0%) |
| Cleaning & Maintenance | 0 (0.0%) | 0 (0.0%) |
| Personal Care & Service | 0 (0.0%) | 0 (0.0%) |
| Total (Category) | 0 (0.0%) | 0 (0.0%) |
| Total (Overall) | 25 (40.3%) | 37 (59.7%) |
Sales and Office Occupations
Sales and Office Occupations by Sex
| Occupation | Male | Female |
| Sales & Related | 0 (0.0%) | 0 (0.0%) |
| Office & Administration | 0 (0.0%) | 0 (0.0%) |
| Total (Category) | 0 (0.0%) | 0 (0.0%) |
| Total (Overall) | 25 (40.3%) | 37 (59.7%) |
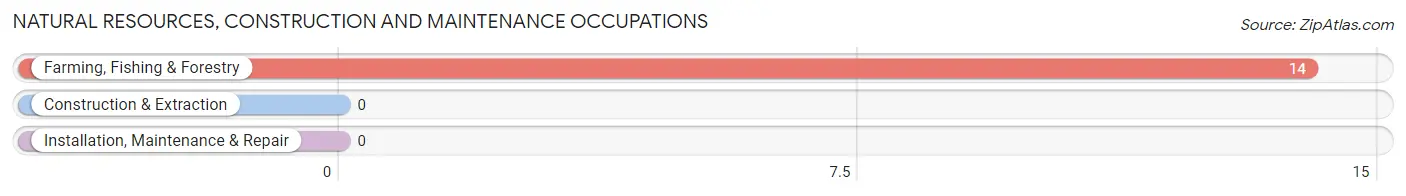
Natural Resources, Construction and Maintenance Occupations
The most common Natural Resources, Construction and Maintenance occupations in Rainbow City are , and Farming, Fishing & Forestry (14 | 22.6%).
Natural Resources, Construction and Maintenance Occupations by Sex
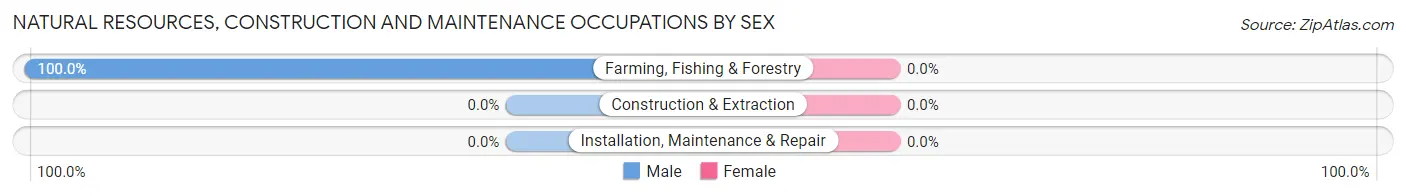
| Occupation | Male | Female |
| Farming, Fishing & Forestry | 14 (100.0%) | 0 (0.0%) |
| Construction & Extraction | 0 (0.0%) | 0 (0.0%) |
| Installation, Maintenance & Repair | 0 (0.0%) | 0 (0.0%) |
| Total (Category) | 14 (100.0%) | 0 (0.0%) |
| Total (Overall) | 25 (40.3%) | 37 (59.7%) |
Production, Transportation and Moving Occupations
Production, Transportation and Moving Occupations by Sex
| Occupation | Male | Female |
| Production | 0 (0.0%) | 0 (0.0%) |
| Transportation | 0 (0.0%) | 0 (0.0%) |
| Material Moving | 0 (0.0%) | 0 (0.0%) |
| Total (Category) | 0 (0.0%) | 0 (0.0%) |
| Total (Overall) | 25 (40.3%) | 37 (59.7%) |
Employment Industries by Sex in Rainbow City
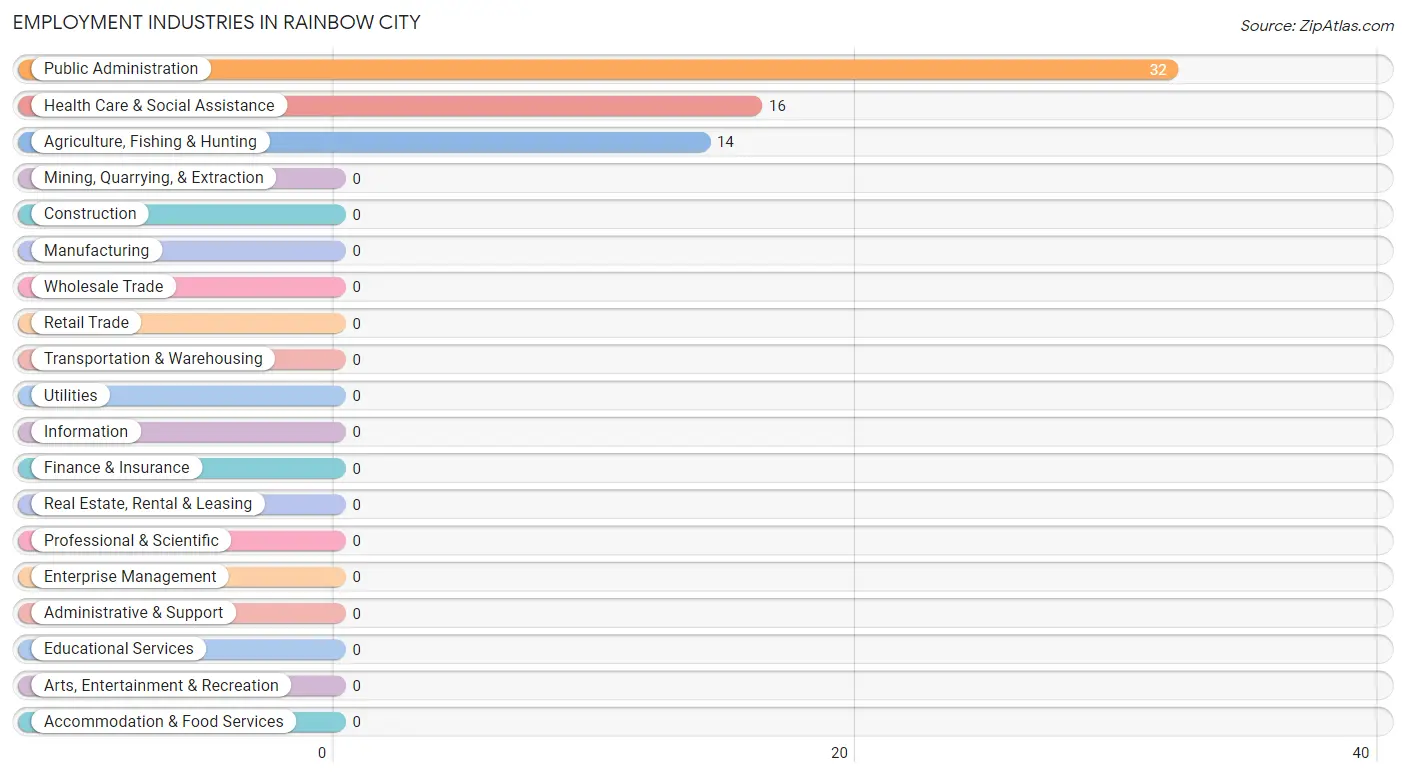
Employment Industries in Rainbow City
The major employment industries in Rainbow City include Public Administration (32 | 51.6%), Health Care & Social Assistance (16 | 25.8%), and Agriculture, Fishing & Hunting (14 | 22.6%).
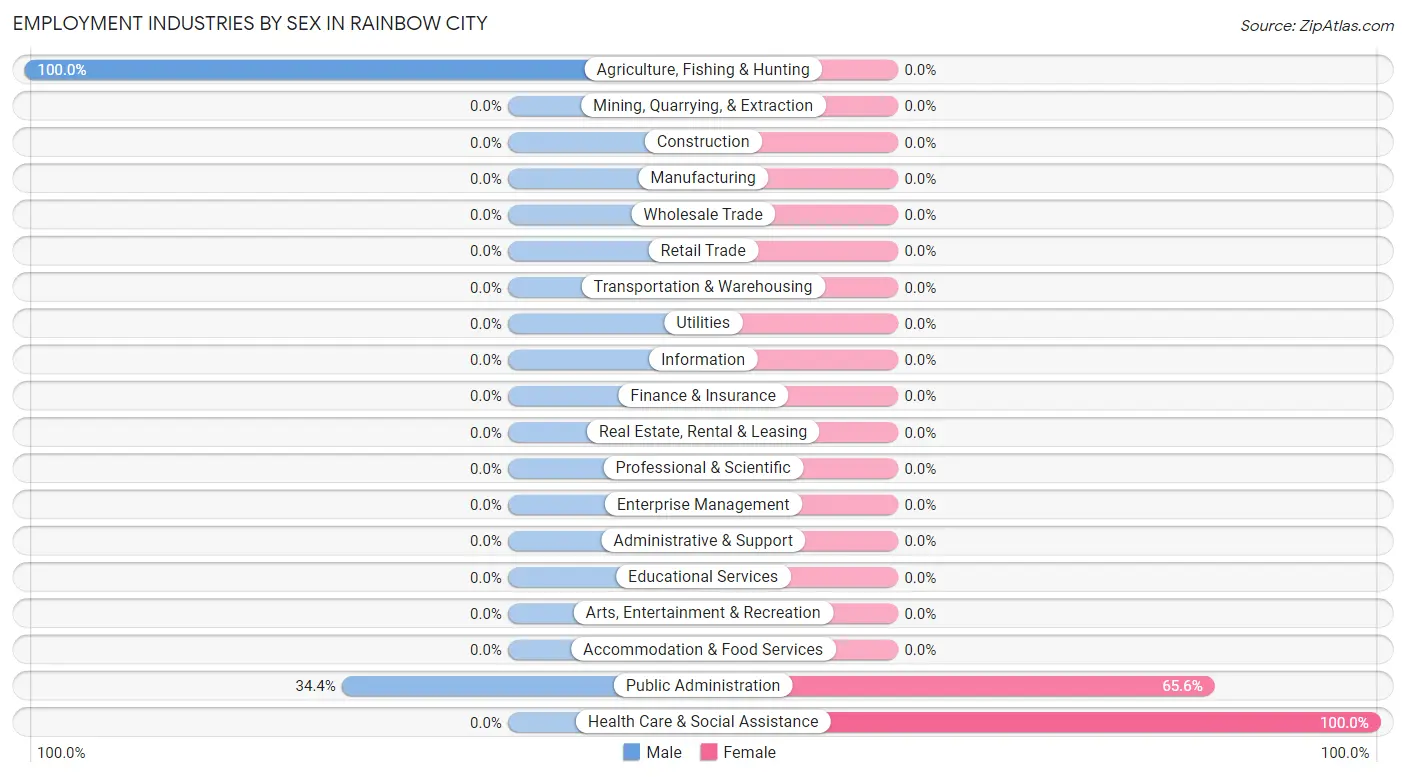
Employment Industries by Sex in Rainbow City
The Rainbow City industries that see more men than women are Agriculture, Fishing & Hunting (100.0%), and Public Administration (34.4%), whereas the industries that tend to have a higher number of women are Health Care & Social Assistance (100.0%), and Public Administration (65.6%).
| Industry | Male | Female |
| Agriculture, Fishing & Hunting | 14 (100.0%) | 0 (0.0%) |
| Mining, Quarrying, & Extraction | 0 (0.0%) | 0 (0.0%) |
| Construction | 0 (0.0%) | 0 (0.0%) |
| Manufacturing | 0 (0.0%) | 0 (0.0%) |
| Wholesale Trade | 0 (0.0%) | 0 (0.0%) |
| Retail Trade | 0 (0.0%) | 0 (0.0%) |
| Transportation & Warehousing | 0 (0.0%) | 0 (0.0%) |
| Utilities | 0 (0.0%) | 0 (0.0%) |
| Information | 0 (0.0%) | 0 (0.0%) |
| Finance & Insurance | 0 (0.0%) | 0 (0.0%) |
| Real Estate, Rental & Leasing | 0 (0.0%) | 0 (0.0%) |
| Professional & Scientific | 0 (0.0%) | 0 (0.0%) |
| Enterprise Management | 0 (0.0%) | 0 (0.0%) |
| Administrative & Support | 0 (0.0%) | 0 (0.0%) |
| Educational Services | 0 (0.0%) | 0 (0.0%) |
| Health Care & Social Assistance | 0 (0.0%) | 16 (100.0%) |
| Arts, Entertainment & Recreation | 0 (0.0%) | 0 (0.0%) |
| Accommodation & Food Services | 0 (0.0%) | 0 (0.0%) |
| Public Administration | 11 (34.4%) | 21 (65.6%) |
| Total | 25 (40.3%) | 37 (59.7%) |
Education in Rainbow City
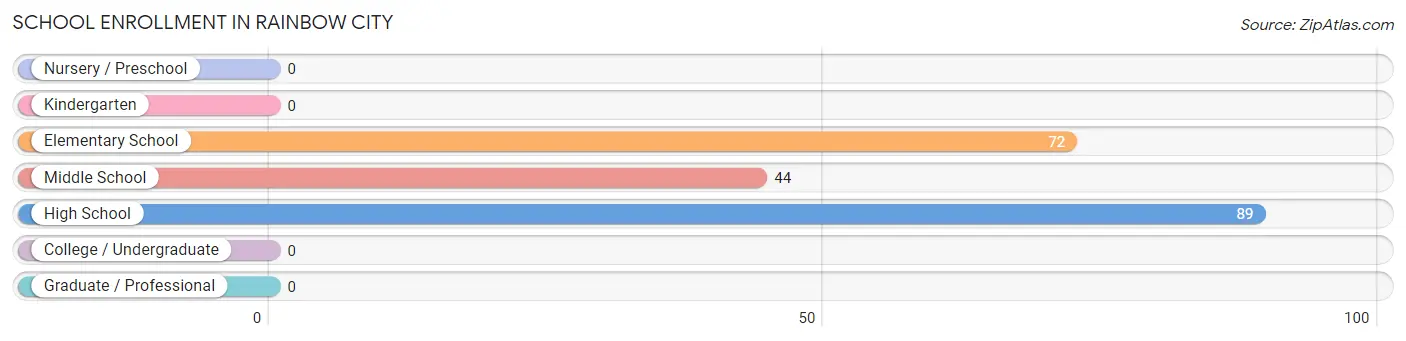
School Enrollment in Rainbow City
The most common levels of schooling among the 205 students in Rainbow City are high school (89 | 43.4%), elementary school (72 | 35.1%), and middle school (44 | 21.5%).
| School Level | # Students | % Students |
| Nursery / Preschool | 0 | 0.0% |
| Kindergarten | 0 | 0.0% |
| Elementary School | 72 | 35.1% |
| Middle School | 44 | 21.5% |
| High School | 89 | 43.4% |
| College / Undergraduate | 0 | 0.0% |
| Graduate / Professional | 0 | 0.0% |
| Total | 205 | 100.0% |
School Enrollment by Age by Funding Source in Rainbow City
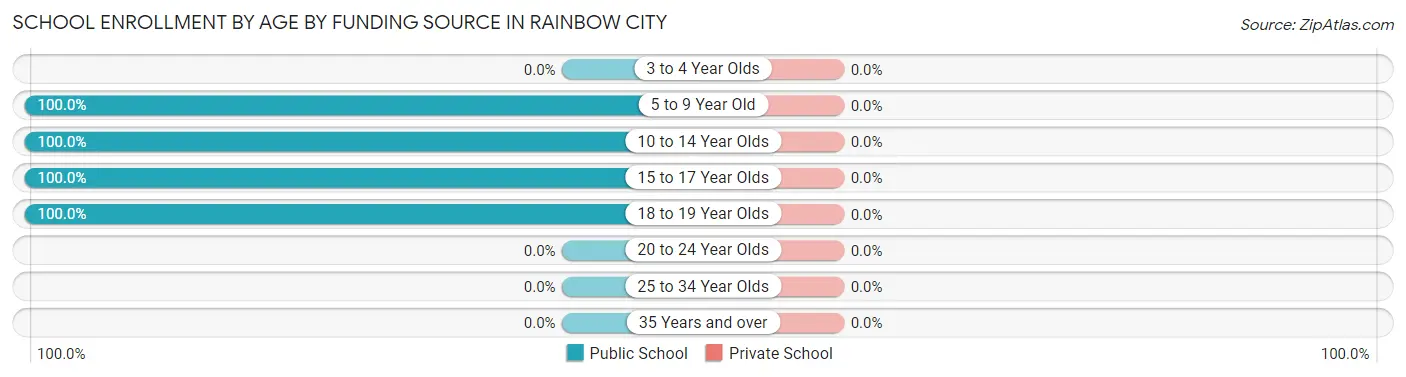
| Age Bracket | Public School | Private School |
| 3 to 4 Year Olds | 0 (0.0%) | 0 (0.0%) |
| 5 to 9 Year Old | 72 (100.0%) | 0 (0.0%) |
| 10 to 14 Year Olds | 44 (100.0%) | 0 (0.0%) |
| 15 to 17 Year Olds | 45 (100.0%) | 0 (0.0%) |
| 18 to 19 Year Olds | 44 (100.0%) | 0 (0.0%) |
| 20 to 24 Year Olds | 0 (0.0%) | 0 (0.0%) |
| 25 to 34 Year Olds | 0 (0.0%) | 0 (0.0%) |
| 35 Years and over | 0 (0.0%) | 0 (0.0%) |
| Total | 205 (100.0%) | 0 (0.0%) |
Educational Attainment by Field of Study in Rainbow City
, and social sciences (16 | 100.0%) are the most common fields of study among 16 individuals in Rainbow City who have obtained a bachelor's degree or higher.
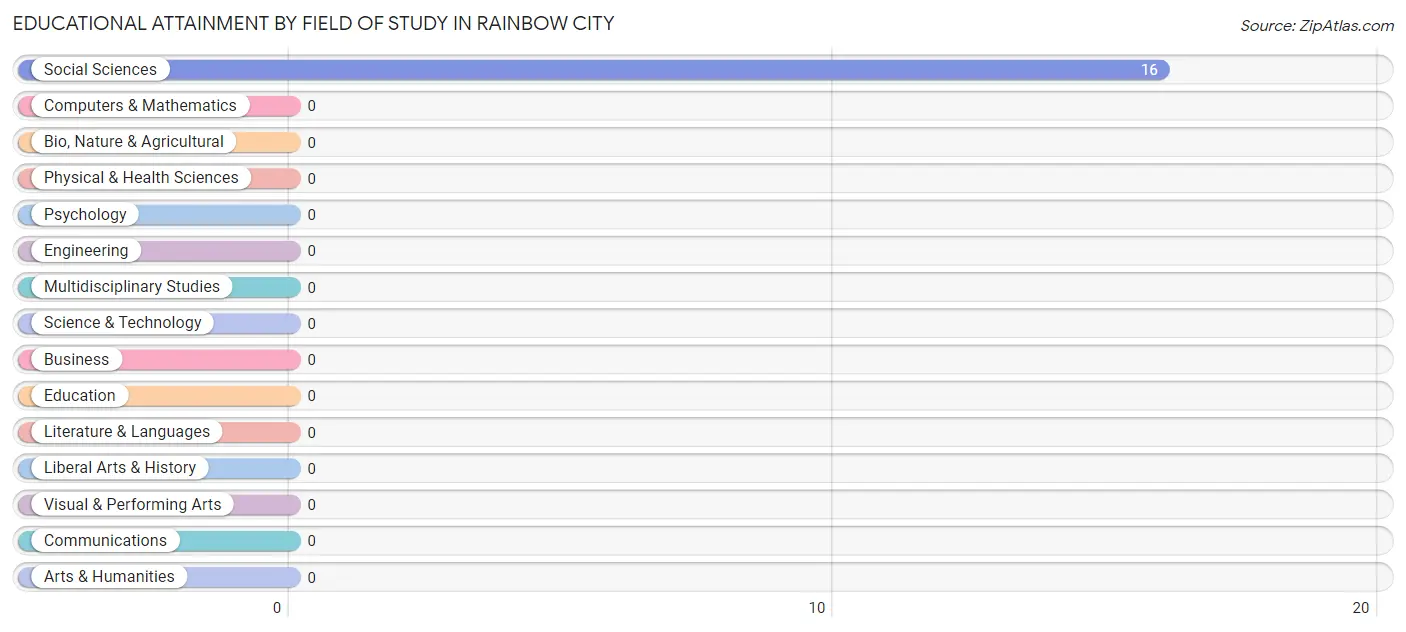
| Field of Study | # Graduates | % Graduates |
| Computers & Mathematics | 0 | 0.0% |
| Bio, Nature & Agricultural | 0 | 0.0% |
| Physical & Health Sciences | 0 | 0.0% |
| Psychology | 0 | 0.0% |
| Social Sciences | 16 | 100.0% |
| Engineering | 0 | 0.0% |
| Multidisciplinary Studies | 0 | 0.0% |
| Science & Technology | 0 | 0.0% |
| Business | 0 | 0.0% |
| Education | 0 | 0.0% |
| Literature & Languages | 0 | 0.0% |
| Liberal Arts & History | 0 | 0.0% |
| Visual & Performing Arts | 0 | 0.0% |
| Communications | 0 | 0.0% |
| Arts & Humanities | 0 | 0.0% |
| Total | 16 | 100.0% |
Transportation & Commute in Rainbow City
Vehicle Availability by Sex in Rainbow City
The most prevalent vehicle ownership categories in Rainbow City are males with 2 vehicles (14, accounting for 56.0%) and females with 2 vehicles (0, making up 37.8%).
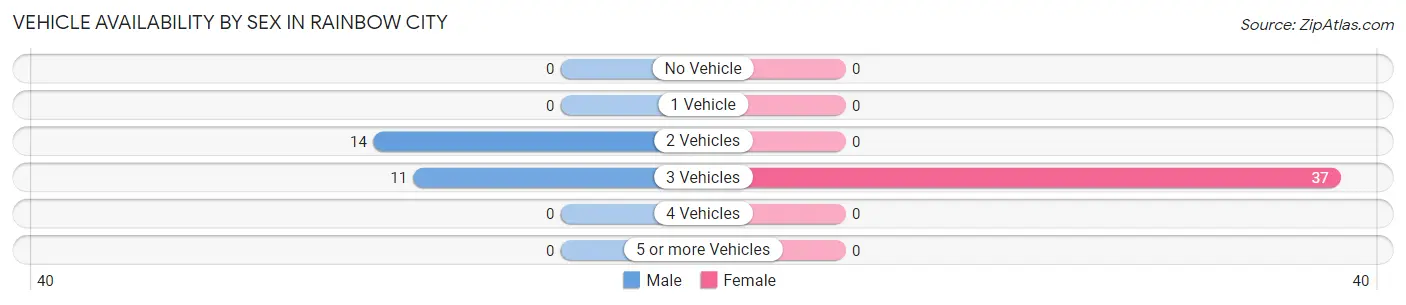
| Vehicles Available | Male | Female |
| No Vehicle | 0 (0.0%) | 0 (0.0%) |
| 1 Vehicle | 0 (0.0%) | 0 (0.0%) |
| 2 Vehicles | 14 (56.0%) | 0 (0.0%) |
| 3 Vehicles | 11 (44.0%) | 37 (100.0%) |
| 4 Vehicles | 0 (0.0%) | 0 (0.0%) |
| 5 or more Vehicles | 0 (0.0%) | 0 (0.0%) |
| Total | 25 (100.0%) | 37 (100.0%) |
Commute Time in Rainbow City
The most frequently occuring commute durations in Rainbow City are 5 to 9 minutes (37 commuters, 59.7%), 90 or more minutes (14 commuters, 22.6%), and 10 to 14 minutes (11 commuters, 17.7%).
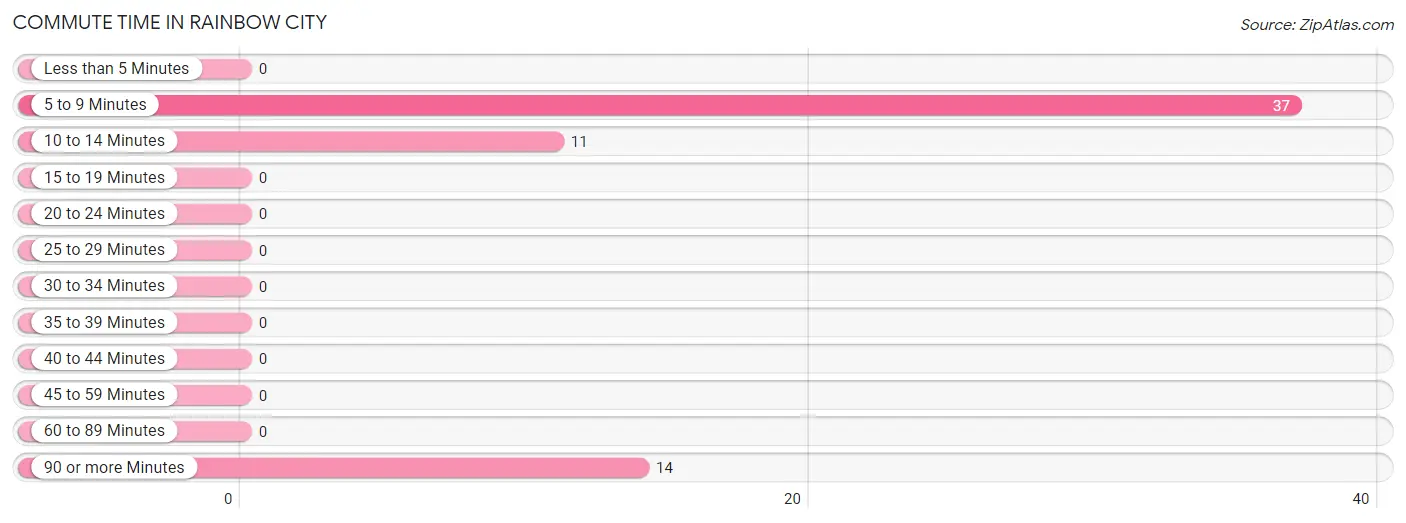
| Commute Time | # Commuters | % Commuters |
| Less than 5 Minutes | 0 | 0.0% |
| 5 to 9 Minutes | 37 | 59.7% |
| 10 to 14 Minutes | 11 | 17.7% |
| 15 to 19 Minutes | 0 | 0.0% |
| 20 to 24 Minutes | 0 | 0.0% |
| 25 to 29 Minutes | 0 | 0.0% |
| 30 to 34 Minutes | 0 | 0.0% |
| 35 to 39 Minutes | 0 | 0.0% |
| 40 to 44 Minutes | 0 | 0.0% |
| 45 to 59 Minutes | 0 | 0.0% |
| 60 to 89 Minutes | 0 | 0.0% |
| 90 or more Minutes | 14 | 22.6% |
Commute Time by Sex in Rainbow City
The most common commute times in Rainbow City are 90 or more minutes (14 commuters, 56.0%) for males and 5 to 9 minutes (37 commuters, 100.0%) for females.
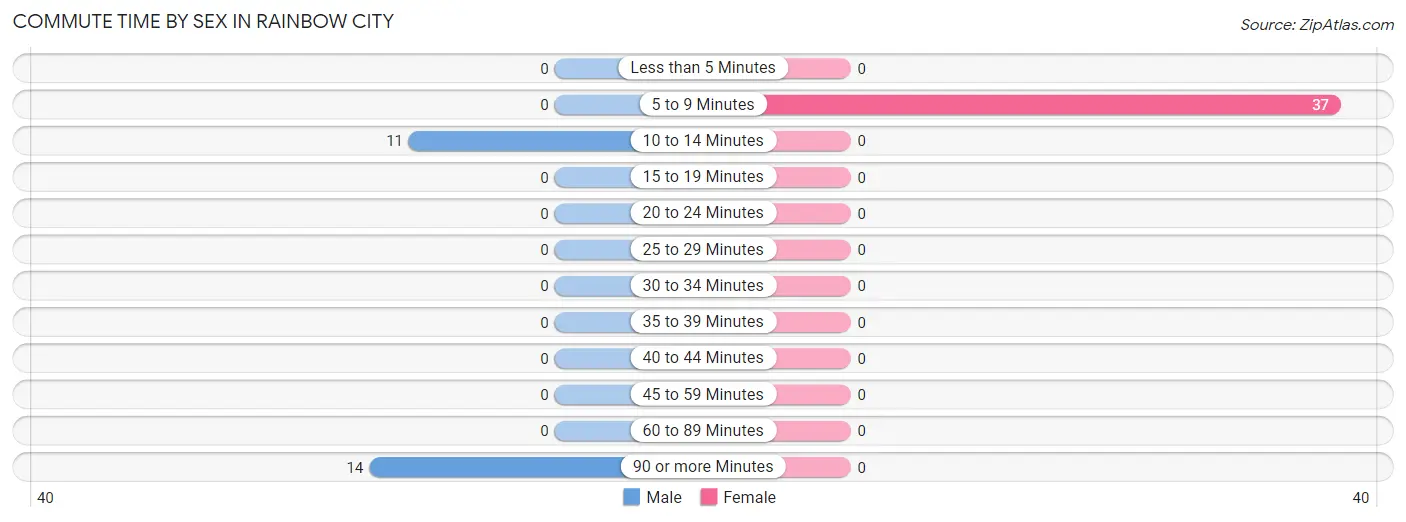
| Commute Time | Male | Female |
| Less than 5 Minutes | 0 (0.0%) | 0 (0.0%) |
| 5 to 9 Minutes | 0 (0.0%) | 37 (100.0%) |
| 10 to 14 Minutes | 11 (44.0%) | 0 (0.0%) |
| 15 to 19 Minutes | 0 (0.0%) | 0 (0.0%) |
| 20 to 24 Minutes | 0 (0.0%) | 0 (0.0%) |
| 25 to 29 Minutes | 0 (0.0%) | 0 (0.0%) |
| 30 to 34 Minutes | 0 (0.0%) | 0 (0.0%) |
| 35 to 39 Minutes | 0 (0.0%) | 0 (0.0%) |
| 40 to 44 Minutes | 0 (0.0%) | 0 (0.0%) |
| 45 to 59 Minutes | 0 (0.0%) | 0 (0.0%) |
| 60 to 89 Minutes | 0 (0.0%) | 0 (0.0%) |
| 90 or more Minutes | 14 (56.0%) | 0 (0.0%) |
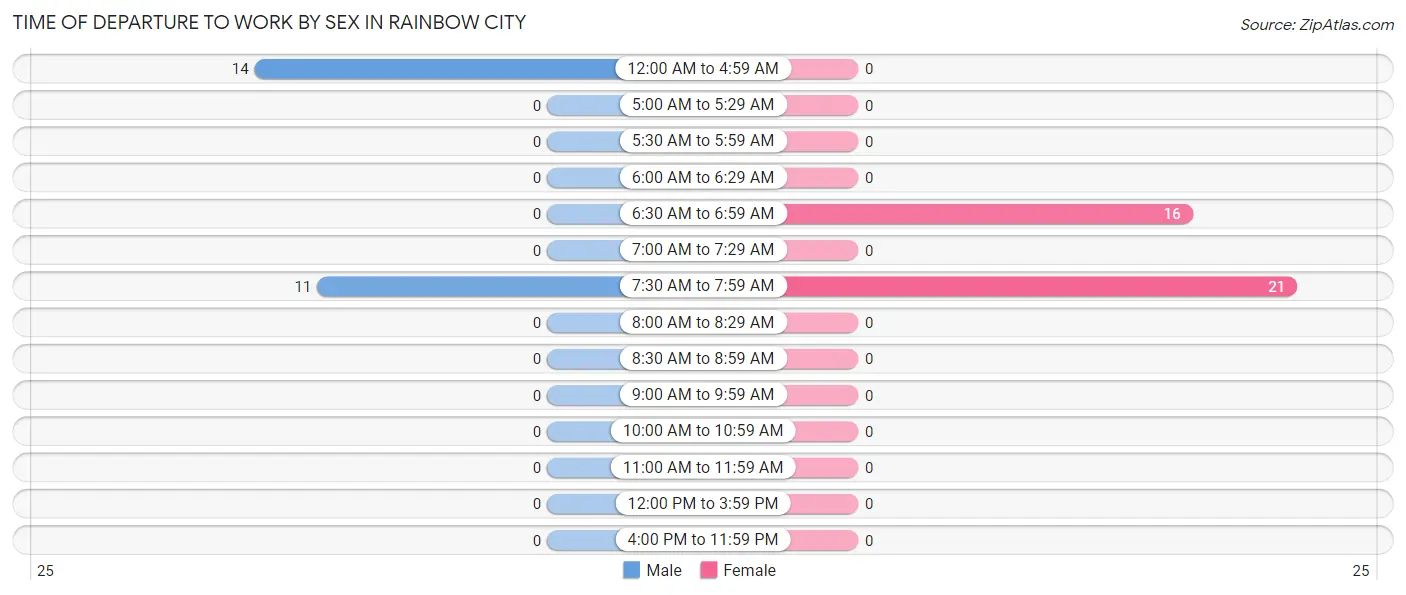
Time of Departure to Work by Sex in Rainbow City
The most frequent times of departure to work in Rainbow City are 12:00 AM to 4:59 AM (14, 56.0%) for males and 7:30 AM to 7:59 AM (21, 56.8%) for females.
| Time of Departure | Male | Female |
| 12:00 AM to 4:59 AM | 14 (56.0%) | 0 (0.0%) |
| 5:00 AM to 5:29 AM | 0 (0.0%) | 0 (0.0%) |
| 5:30 AM to 5:59 AM | 0 (0.0%) | 0 (0.0%) |
| 6:00 AM to 6:29 AM | 0 (0.0%) | 0 (0.0%) |
| 6:30 AM to 6:59 AM | 0 (0.0%) | 16 (43.2%) |
| 7:00 AM to 7:29 AM | 0 (0.0%) | 0 (0.0%) |
| 7:30 AM to 7:59 AM | 11 (44.0%) | 21 (56.8%) |
| 8:00 AM to 8:29 AM | 0 (0.0%) | 0 (0.0%) |
| 8:30 AM to 8:59 AM | 0 (0.0%) | 0 (0.0%) |
| 9:00 AM to 9:59 AM | 0 (0.0%) | 0 (0.0%) |
| 10:00 AM to 10:59 AM | 0 (0.0%) | 0 (0.0%) |
| 11:00 AM to 11:59 AM | 0 (0.0%) | 0 (0.0%) |
| 12:00 PM to 3:59 PM | 0 (0.0%) | 0 (0.0%) |
| 4:00 PM to 11:59 PM | 0 (0.0%) | 0 (0.0%) |
| Total | 25 (100.0%) | 37 (100.0%) |
Housing Occupancy in Rainbow City
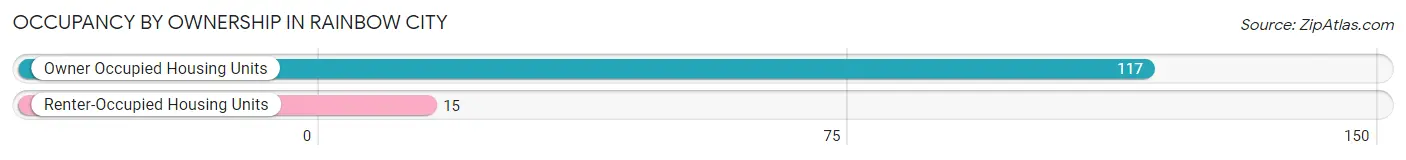
Occupancy by Ownership in Rainbow City
Of the total 132 dwellings in Rainbow City, owner-occupied units account for 117 (88.6%), while renter-occupied units make up 15 (11.4%).
| Occupancy | # Housing Units | % Housing Units |
| Owner Occupied Housing Units | 117 | 88.6% |
| Renter-Occupied Housing Units | 15 | 11.4% |
| Total Occupied Housing Units | 132 | 100.0% |
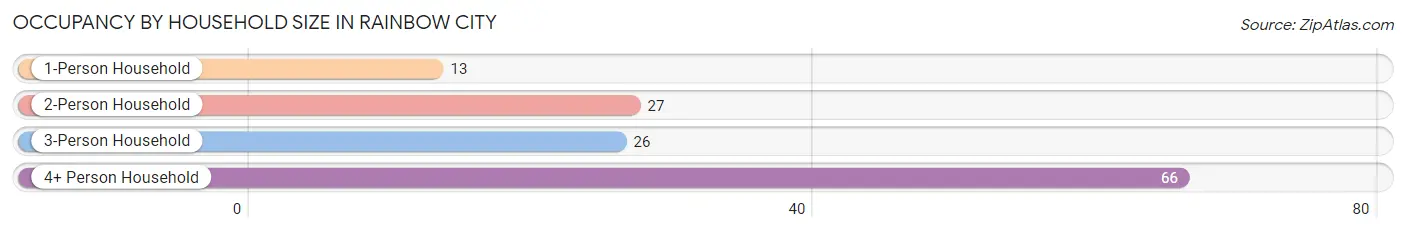
Occupancy by Household Size in Rainbow City
| Household Size | # Housing Units | % Housing Units |
| 1-Person Household | 13 | 9.9% |
| 2-Person Household | 27 | 20.4% |
| 3-Person Household | 26 | 19.7% |
| 4+ Person Household | 66 | 50.0% |
| Total Housing Units | 132 | 100.0% |
Occupancy by Ownership by Household Size in Rainbow City
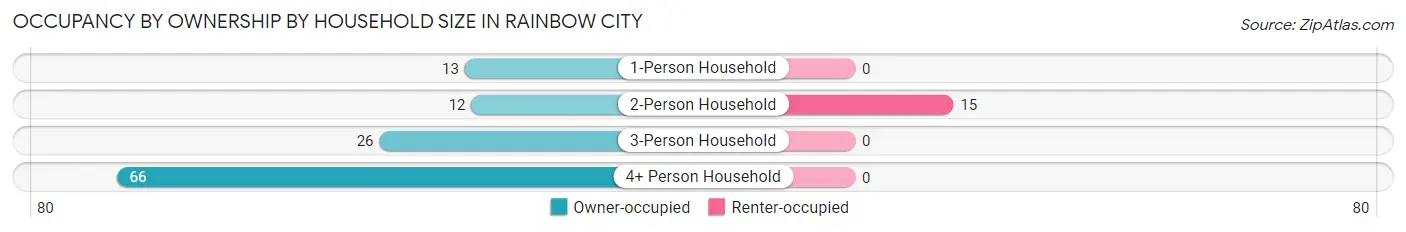
| Household Size | Owner-occupied | Renter-occupied |
| 1-Person Household | 13 (100.0%) | 0 (0.0%) |
| 2-Person Household | 12 (44.4%) | 15 (55.6%) |
| 3-Person Household | 26 (100.0%) | 0 (0.0%) |
| 4+ Person Household | 66 (100.0%) | 0 (0.0%) |
| Total Housing Units | 117 (88.6%) | 15 (11.4%) |
Occupancy by Educational Attainment in Rainbow City
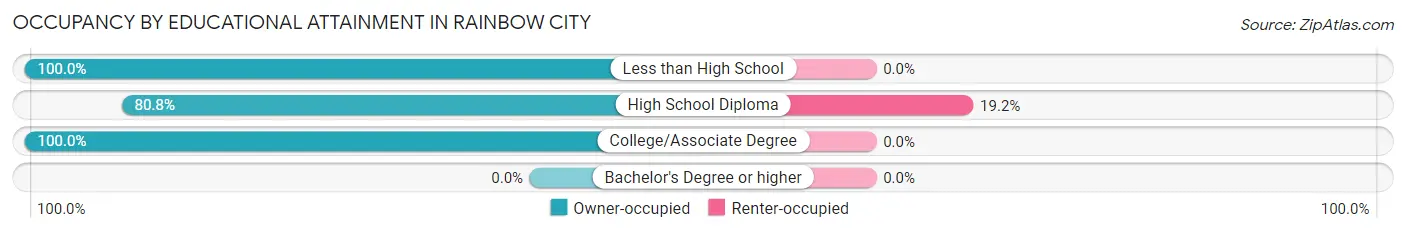
| Household Size | Owner-occupied | Renter-occupied |
| Less than High School | 31 (100.0%) | 0 (0.0%) |
| High School Diploma | 63 (80.8%) | 15 (19.2%) |
| College/Associate Degree | 23 (100.0%) | 0 (0.0%) |
| Bachelor's Degree or higher | 0 (0.0%) | 0 (0.0%) |
Occupancy by Age of Householder in Rainbow City
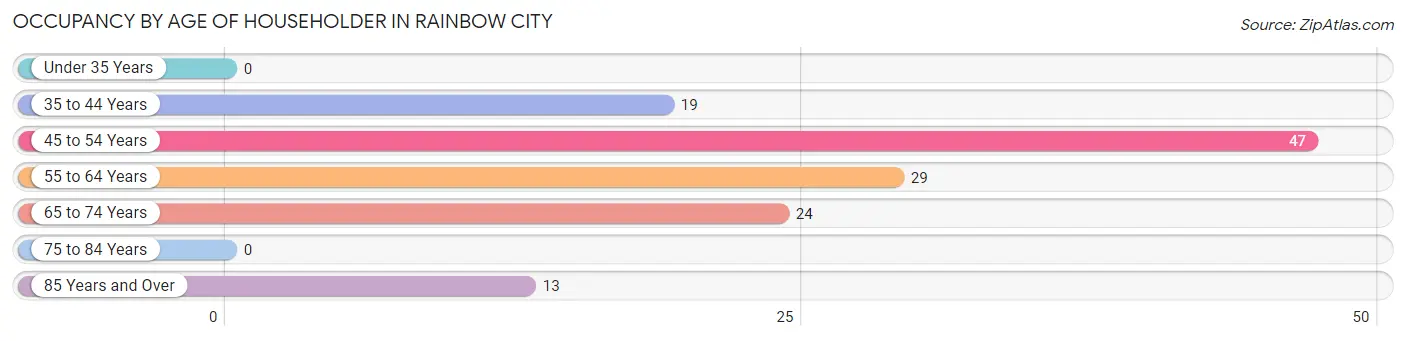
| Age Bracket | # Households | % Households |
| Under 35 Years | 0 | 0.0% |
| 35 to 44 Years | 19 | 14.4% |
| 45 to 54 Years | 47 | 35.6% |
| 55 to 64 Years | 29 | 22.0% |
| 65 to 74 Years | 24 | 18.2% |
| 75 to 84 Years | 0 | 0.0% |
| 85 Years and Over | 13 | 9.9% |
| Total | 132 | 100.0% |
Housing Finances in Rainbow City
Median Income by Occupancy in Rainbow City
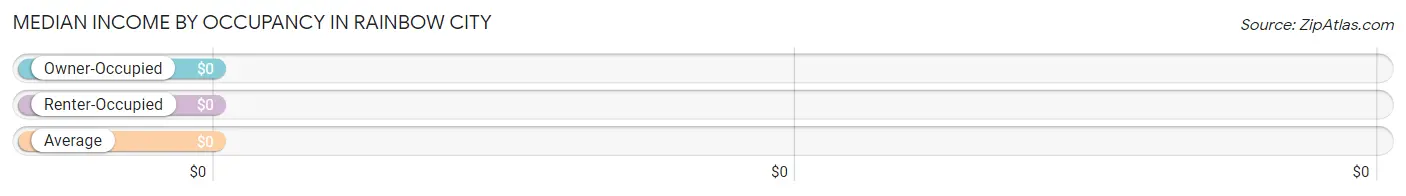
| Occupancy Type | # Households | Median Income |
| Owner-Occupied | 117 (88.6%) | $0 |
| Renter-Occupied | 15 (11.4%) | $0 |
| Average | 132 (100.0%) | $0 |
Occupancy by Householder Income Bracket in Rainbow City
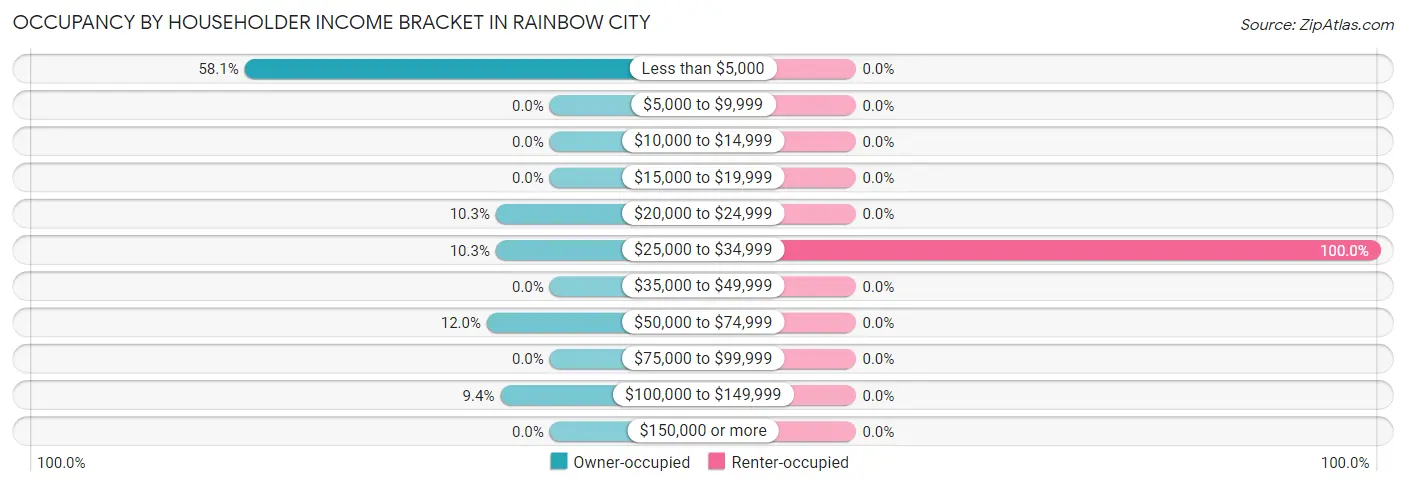
| Income Bracket | Owner-occupied | Renter-occupied |
| Less than $5,000 | 68 (58.1%) | 0 (0.0%) |
| $5,000 to $9,999 | 0 (0.0%) | 0 (0.0%) |
| $10,000 to $14,999 | 0 (0.0%) | 0 (0.0%) |
| $15,000 to $19,999 | 0 (0.0%) | 0 (0.0%) |
| $20,000 to $24,999 | 12 (10.3%) | 0 (0.0%) |
| $25,000 to $34,999 | 12 (10.3%) | 15 (100.0%) |
| $35,000 to $49,999 | 0 (0.0%) | 0 (0.0%) |
| $50,000 to $74,999 | 14 (12.0%) | 0 (0.0%) |
| $75,000 to $99,999 | 0 (0.0%) | 0 (0.0%) |
| $100,000 to $149,999 | 11 (9.4%) | 0 (0.0%) |
| $150,000 or more | 0 (0.0%) | 0 (0.0%) |
| Total | 117 (100.0%) | 15 (100.0%) |
Monthly Housing Cost Tiers in Rainbow City
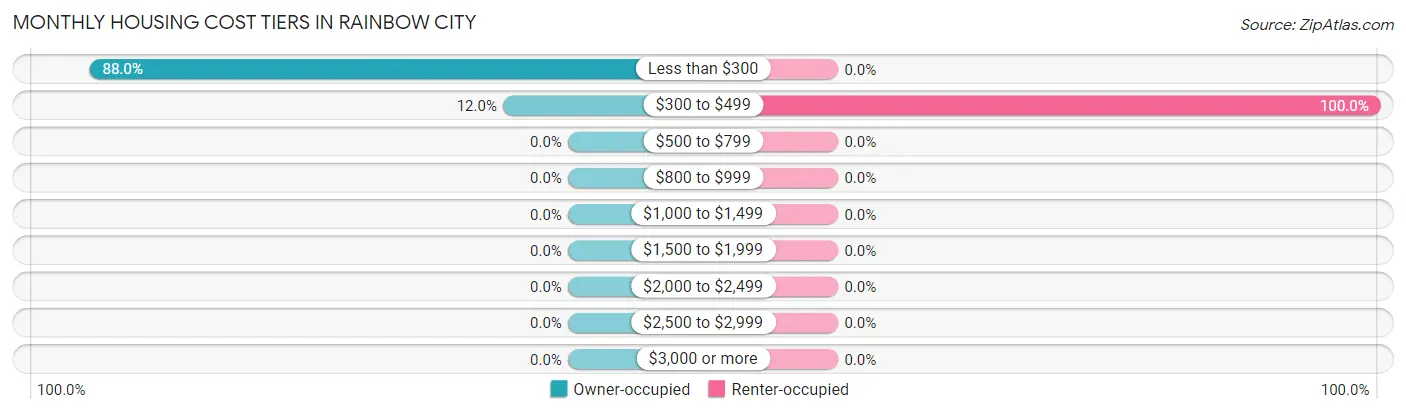
| Monthly Cost | Owner-occupied | Renter-occupied |
| Less than $300 | 103 (88.0%) | 0 (0.0%) |
| $300 to $499 | 14 (12.0%) | 15 (100.0%) |
| $500 to $799 | 0 (0.0%) | 0 (0.0%) |
| $800 to $999 | 0 (0.0%) | 0 (0.0%) |
| $1,000 to $1,499 | 0 (0.0%) | 0 (0.0%) |
| $1,500 to $1,999 | 0 (0.0%) | 0 (0.0%) |
| $2,000 to $2,499 | 0 (0.0%) | 0 (0.0%) |
| $2,500 to $2,999 | 0 (0.0%) | 0 (0.0%) |
| $3,000 or more | 0 (0.0%) | 0 (0.0%) |
| Total | 117 (100.0%) | 15 (100.0%) |
Physical Housing Characteristics in Rainbow City
Housing Structures in Rainbow City
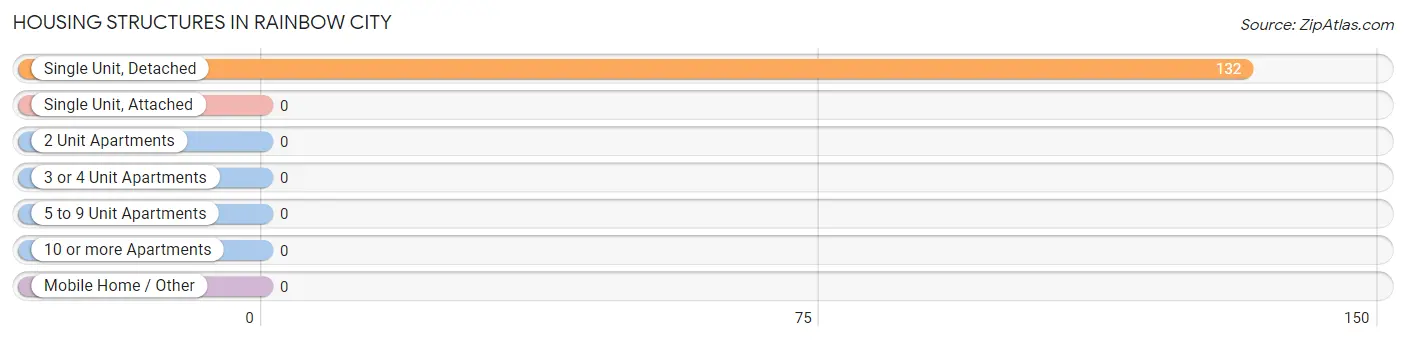
| Structure Type | # Housing Units | % Housing Units |
| Single Unit, Detached | 132 | 100.0% |
| Single Unit, Attached | 0 | 0.0% |
| 2 Unit Apartments | 0 | 0.0% |
| 3 or 4 Unit Apartments | 0 | 0.0% |
| 5 to 9 Unit Apartments | 0 | 0.0% |
| 10 or more Apartments | 0 | 0.0% |
| Mobile Home / Other | 0 | 0.0% |
| Total | 132 | 100.0% |
Housing Structures by Occupancy in Rainbow City
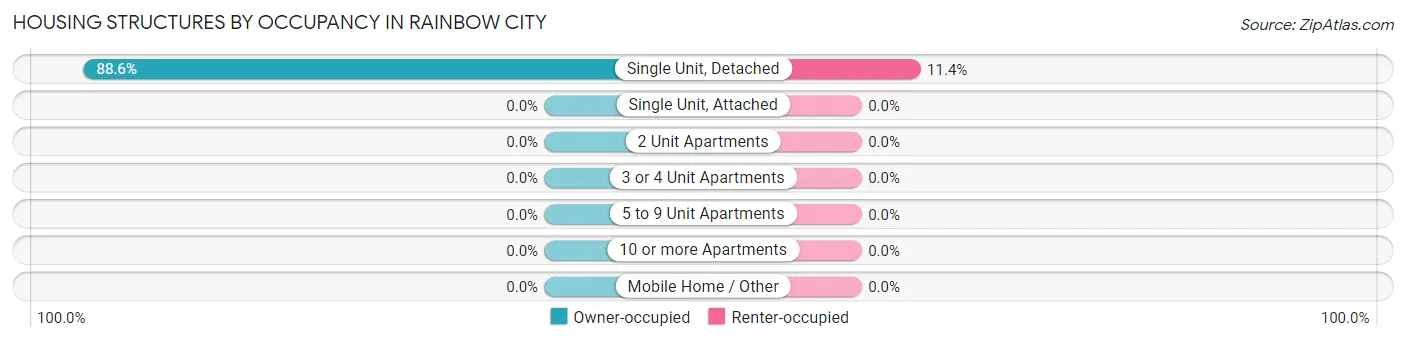
| Structure Type | Owner-occupied | Renter-occupied |
| Single Unit, Detached | 117 (88.6%) | 15 (11.4%) |
| Single Unit, Attached | 0 (0.0%) | 0 (0.0%) |
| 2 Unit Apartments | 0 (0.0%) | 0 (0.0%) |
| 3 or 4 Unit Apartments | 0 (0.0%) | 0 (0.0%) |
| 5 to 9 Unit Apartments | 0 (0.0%) | 0 (0.0%) |
| 10 or more Apartments | 0 (0.0%) | 0 (0.0%) |
| Mobile Home / Other | 0 (0.0%) | 0 (0.0%) |
| Total | 117 (88.6%) | 15 (11.4%) |
Housing Structures by Number of Rooms in Rainbow City
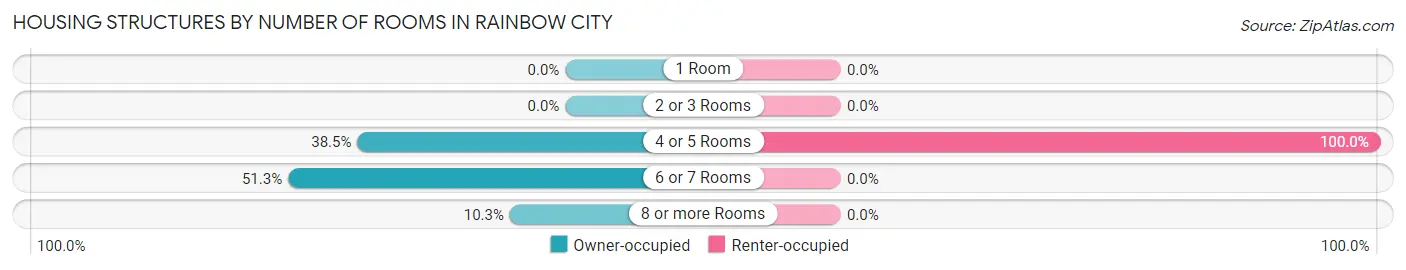
| Number of Rooms | Owner-occupied | Renter-occupied |
| 1 Room | 0 (0.0%) | 0 (0.0%) |
| 2 or 3 Rooms | 0 (0.0%) | 0 (0.0%) |
| 4 or 5 Rooms | 45 (38.5%) | 15 (100.0%) |
| 6 or 7 Rooms | 60 (51.3%) | 0 (0.0%) |
| 8 or more Rooms | 12 (10.3%) | 0 (0.0%) |
| Total | 117 (100.0%) | 15 (100.0%) |
Housing Structure by Heating Type in Rainbow City
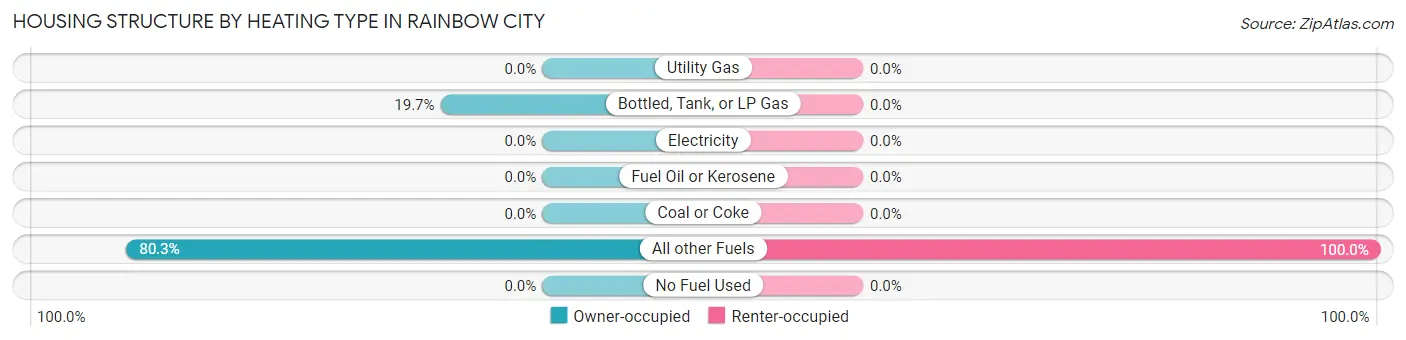
| Heating Type | Owner-occupied | Renter-occupied |
| Utility Gas | 0 (0.0%) | 0 (0.0%) |
| Bottled, Tank, or LP Gas | 23 (19.7%) | 0 (0.0%) |
| Electricity | 0 (0.0%) | 0 (0.0%) |
| Fuel Oil or Kerosene | 0 (0.0%) | 0 (0.0%) |
| Coal or Coke | 0 (0.0%) | 0 (0.0%) |
| All other Fuels | 94 (80.3%) | 15 (100.0%) |
| No Fuel Used | 0 (0.0%) | 0 (0.0%) |
| Total | 117 (100.0%) | 15 (100.0%) |
Household Vehicle Usage in Rainbow City
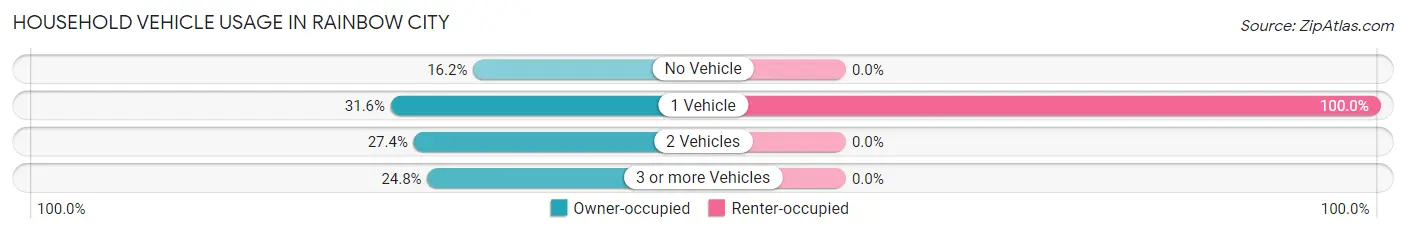
| Vehicles per Household | Owner-occupied | Renter-occupied |
| No Vehicle | 19 (16.2%) | 0 (0.0%) |
| 1 Vehicle | 37 (31.6%) | 15 (100.0%) |
| 2 Vehicles | 32 (27.4%) | 0 (0.0%) |
| 3 or more Vehicles | 29 (24.8%) | 0 (0.0%) |
| Total | 117 (100.0%) | 15 (100.0%) |
Real Estate & Mortgages in Rainbow City
Real Estate and Mortgage Overview in Rainbow City
| Characteristic | Without Mortgage | With Mortgage |
| Housing Units | 117 | 0 |
| Median Property Value | $65,500 | $0 |
| Median Household Income | - | - |
| Monthly Housing Costs | $195 | $0 |
| Real Estate Taxes | - | - |
Property Value by Mortgage Status in Rainbow City
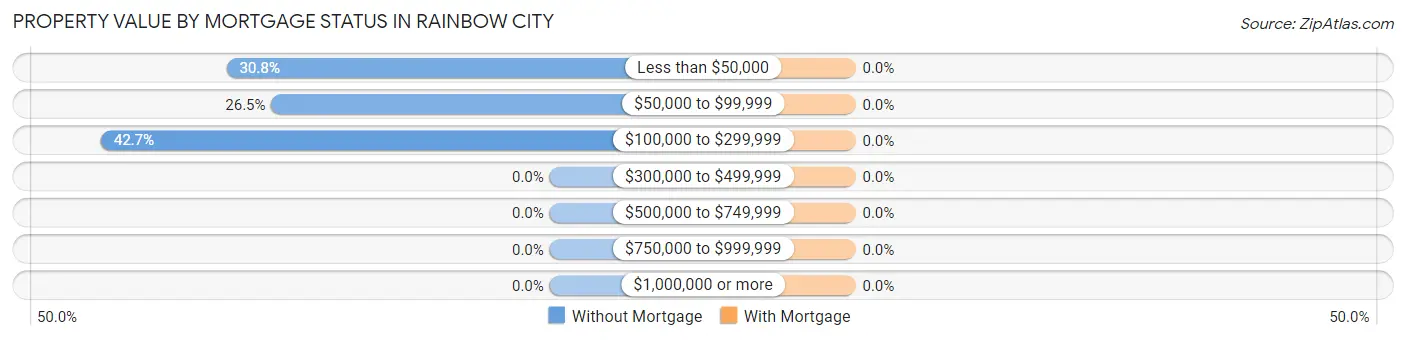
| Property Value | Without Mortgage | With Mortgage |
| Less than $50,000 | 36 (30.8%) | 0 (0.0%) |
| $50,000 to $99,999 | 31 (26.5%) | 0 (0.0%) |
| $100,000 to $299,999 | 50 (42.7%) | 0 (0.0%) |
| $300,000 to $499,999 | 0 (0.0%) | 0 (0.0%) |
| $500,000 to $749,999 | 0 (0.0%) | 0 (0.0%) |
| $750,000 to $999,999 | 0 (0.0%) | 0 (0.0%) |
| $1,000,000 or more | 0 (0.0%) | 0 (0.0%) |
| Total | 117 (100.0%) | 0 (0.0%) |
Household Income by Mortgage Status in Rainbow City
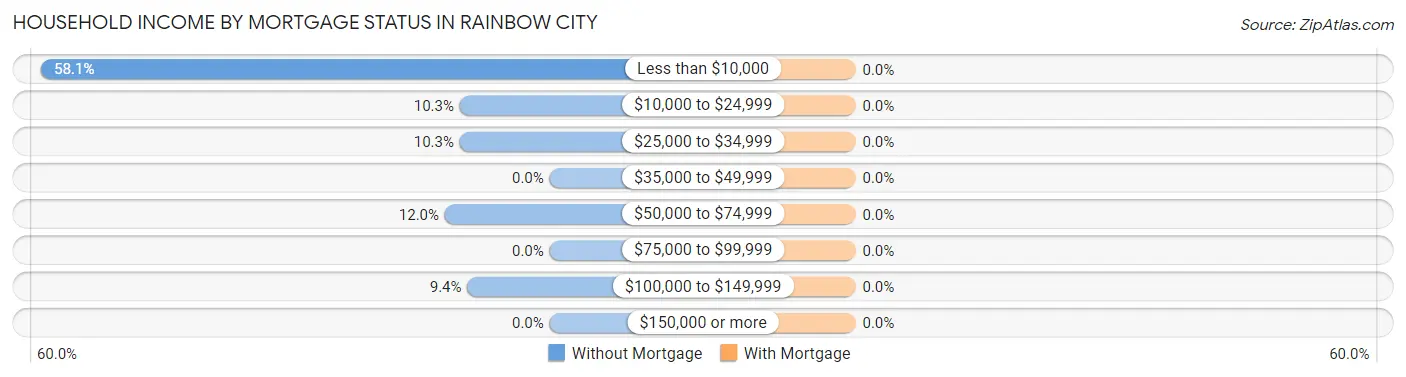
| Household Income | Without Mortgage | With Mortgage |
| Less than $10,000 | 68 (58.1%) | 0 (0.0%) |
| $10,000 to $24,999 | 12 (10.3%) | 0 (0.0%) |
| $25,000 to $34,999 | 12 (10.3%) | 0 (0.0%) |
| $35,000 to $49,999 | 0 (0.0%) | 0 (0.0%) |
| $50,000 to $74,999 | 14 (12.0%) | 0 (0.0%) |
| $75,000 to $99,999 | 0 (0.0%) | 0 (0.0%) |
| $100,000 to $149,999 | 11 (9.4%) | 0 (0.0%) |
| $150,000 or more | 0 (0.0%) | 0 (0.0%) |
| Total | 117 (100.0%) | 0 (0.0%) |
Property Value to Household Income Ratio in Rainbow City
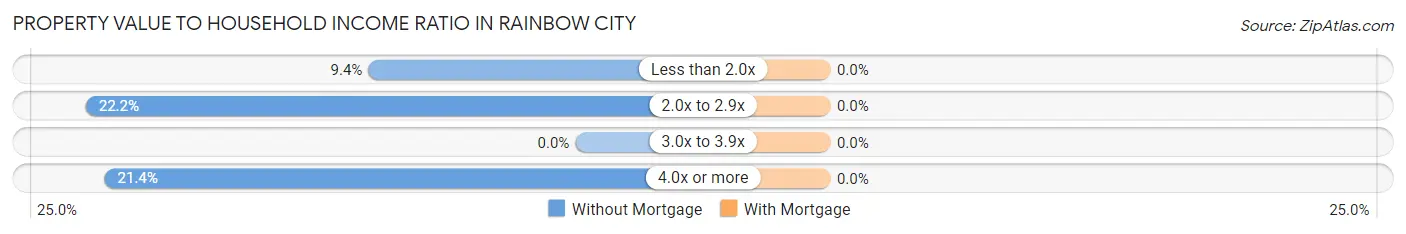
| Value-to-Income Ratio | Without Mortgage | With Mortgage |
| Less than 2.0x | 11 (9.4%) | 0 (0.0%) |
| 2.0x to 2.9x | 26 (22.2%) | 0 (0.0%) |
| 3.0x to 3.9x | 0 (0.0%) | 0 (0.0%) |
| 4.0x or more | 25 (21.4%) | 0 (0.0%) |
| Total | 117 (100.0%) | 0 (0.0%) |
Real Estate Taxes by Mortgage Status in Rainbow City
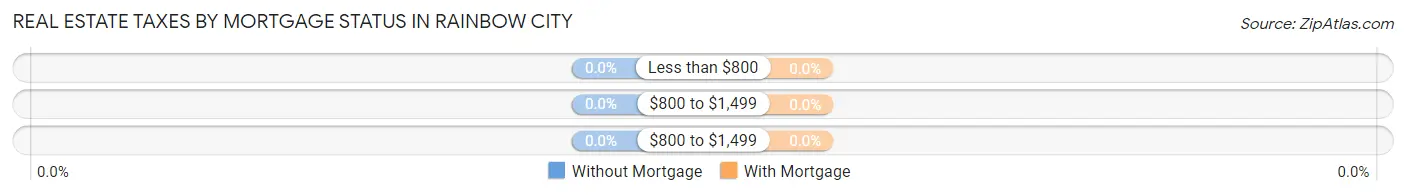
| Property Taxes | Without Mortgage | With Mortgage |
| Less than $800 | 0 (0.0%) | 0 (0.0%) |
| $800 to $1,499 | 0 (0.0%) | 0 (0.0%) |
| $800 to $1,499 | 0 (0.0%) | 0 (0.0%) |
| Total | 117 (100.0%) | 0 (0.0%) |
Health & Disability in Rainbow City
Health Insurance Coverage by Age in Rainbow City
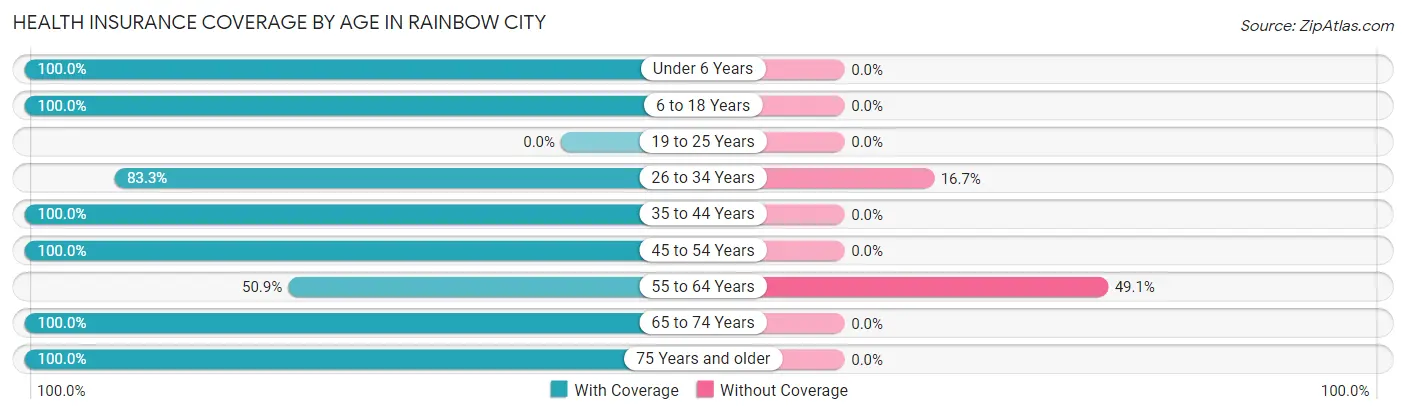
| Age Bracket | With Coverage | Without Coverage |
| Under 6 Years | 46 (100.0%) | 0 (0.0%) |
| 6 to 18 Years | 205 (100.0%) | 0 (0.0%) |
| 19 to 25 Years | 0 (0.0%) | 0 (0.0%) |
| 26 to 34 Years | 65 (83.3%) | 13 (16.7%) |
| 35 to 44 Years | 36 (100.0%) | 0 (0.0%) |
| 45 to 54 Years | 124 (100.0%) | 0 (0.0%) |
| 55 to 64 Years | 29 (50.9%) | 28 (49.1%) |
| 65 to 74 Years | 37 (100.0%) | 0 (0.0%) |
| 75 Years and older | 13 (100.0%) | 0 (0.0%) |
| Total | 555 (93.1%) | 41 (6.9%) |
Health Insurance Coverage by Citizenship Status in Rainbow City
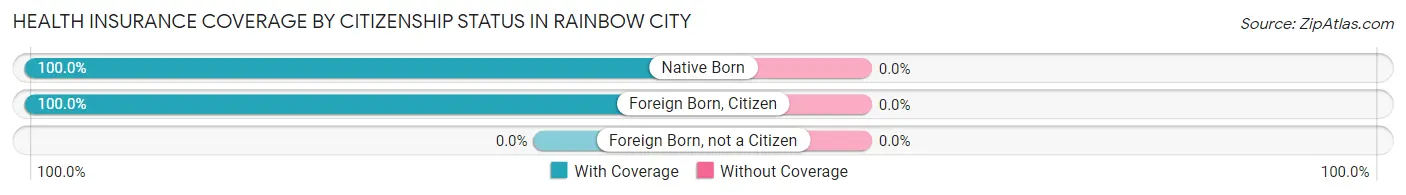
| Citizenship Status | With Coverage | Without Coverage |
| Native Born | 46 (100.0%) | 0 (0.0%) |
| Foreign Born, Citizen | 205 (100.0%) | 0 (0.0%) |
| Foreign Born, not a Citizen | 0 (0.0%) | 0 (0.0%) |
Health Insurance Coverage by Household Income in Rainbow City
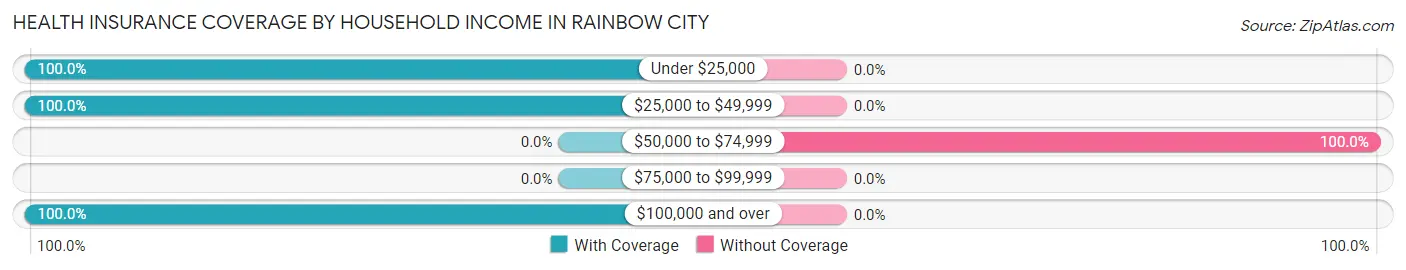
| Household Income | With Coverage | Without Coverage |
| Under $25,000 | 391 (100.0%) | 0 (0.0%) |
| $25,000 to $49,999 | 73 (100.0%) | 0 (0.0%) |
| $50,000 to $74,999 | 0 (0.0%) | 41 (100.0%) |
| $75,000 to $99,999 | 0 (0.0%) | 0 (0.0%) |
| $100,000 and over | 91 (100.0%) | 0 (0.0%) |
Public vs Private Health Insurance Coverage by Age in Rainbow City
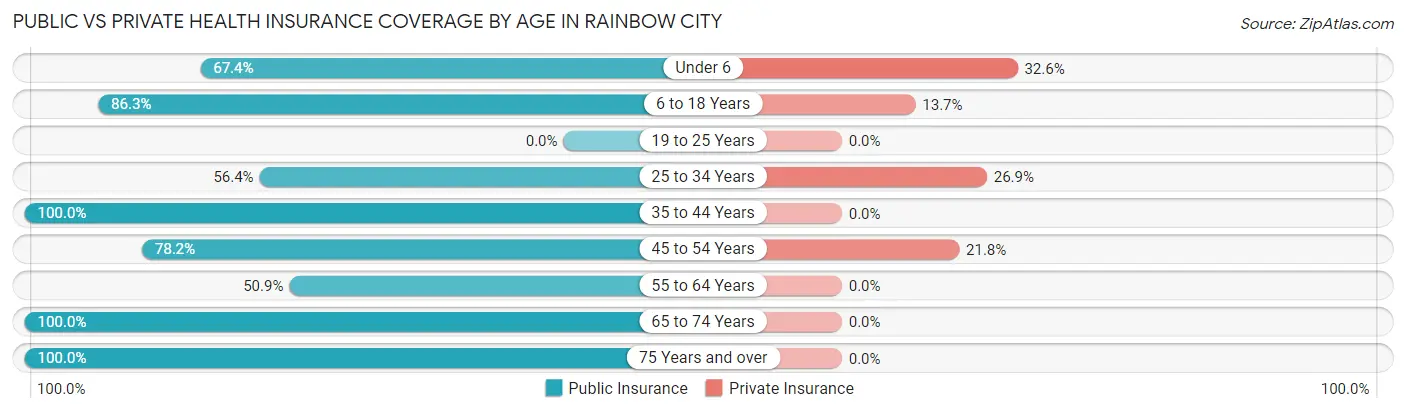
| Age Bracket | Public Insurance | Private Insurance |
| Under 6 | 31 (67.4%) | 15 (32.6%) |
| 6 to 18 Years | 177 (86.3%) | 28 (13.7%) |
| 19 to 25 Years | 0 (0.0%) | 0 (0.0%) |
| 25 to 34 Years | 44 (56.4%) | 21 (26.9%) |
| 35 to 44 Years | 36 (100.0%) | 0 (0.0%) |
| 45 to 54 Years | 97 (78.2%) | 27 (21.8%) |
| 55 to 64 Years | 29 (50.9%) | 0 (0.0%) |
| 65 to 74 Years | 37 (100.0%) | 0 (0.0%) |
| 75 Years and over | 13 (100.0%) | 0 (0.0%) |
| Total | 464 (77.8%) | 91 (15.3%) |
Disability Status by Sex by Age in Rainbow City
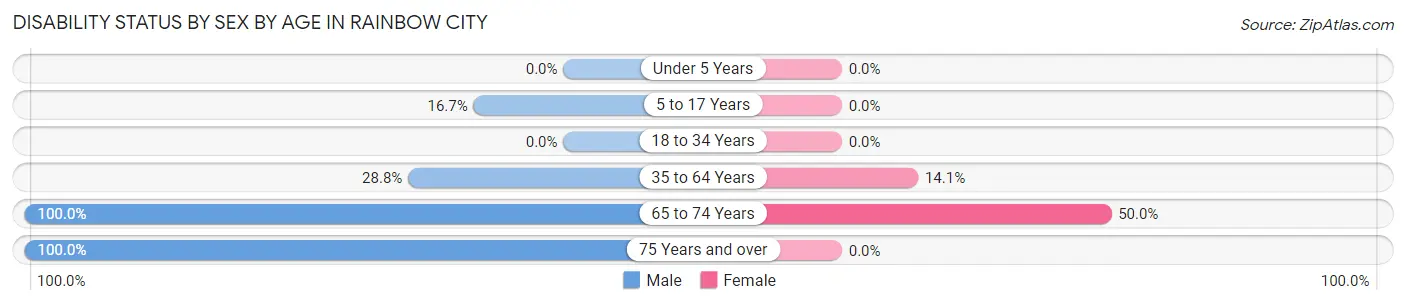
| Age Bracket | Male | Female |
| Under 5 Years | 0 (0.0%) | 0 (0.0%) |
| 5 to 17 Years | 14 (16.7%) | 0 (0.0%) |
| 18 to 34 Years | 0 (0.0%) | 0 (0.0%) |
| 35 to 64 Years | 34 (28.8%) | 14 (14.1%) |
| 65 to 74 Years | 13 (100.0%) | 12 (50.0%) |
| 75 Years and over | 13 (100.0%) | 0 (0.0%) |
Disability Class by Sex by Age in Rainbow City
Disability Class: Hearing Difficulty
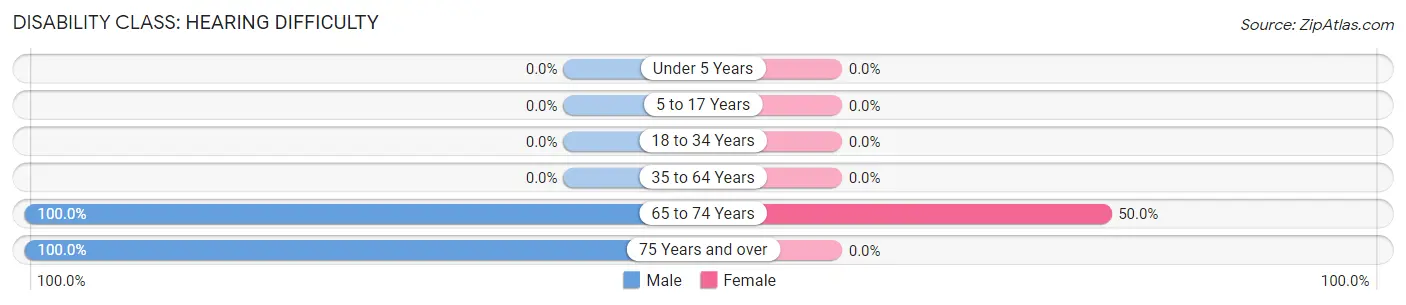
| Age Bracket | Male | Female |
| Under 5 Years | 0 (0.0%) | 0 (0.0%) |
| 5 to 17 Years | 0 (0.0%) | 0 (0.0%) |
| 18 to 34 Years | 0 (0.0%) | 0 (0.0%) |
| 35 to 64 Years | 0 (0.0%) | 0 (0.0%) |
| 65 to 74 Years | 13 (100.0%) | 12 (50.0%) |
| 75 Years and over | 13 (100.0%) | 0 (0.0%) |
Disability Class: Vision Difficulty
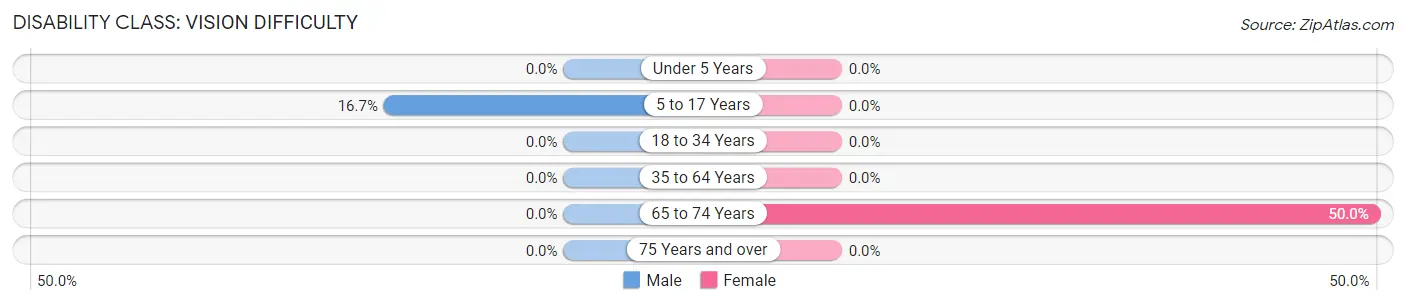
| Age Bracket | Male | Female |
| Under 5 Years | 0 (0.0%) | 0 (0.0%) |
| 5 to 17 Years | 14 (16.7%) | 0 (0.0%) |
| 18 to 34 Years | 0 (0.0%) | 0 (0.0%) |
| 35 to 64 Years | 0 (0.0%) | 0 (0.0%) |
| 65 to 74 Years | 0 (0.0%) | 12 (50.0%) |
| 75 Years and over | 0 (0.0%) | 0 (0.0%) |
Disability Class: Cognitive Difficulty
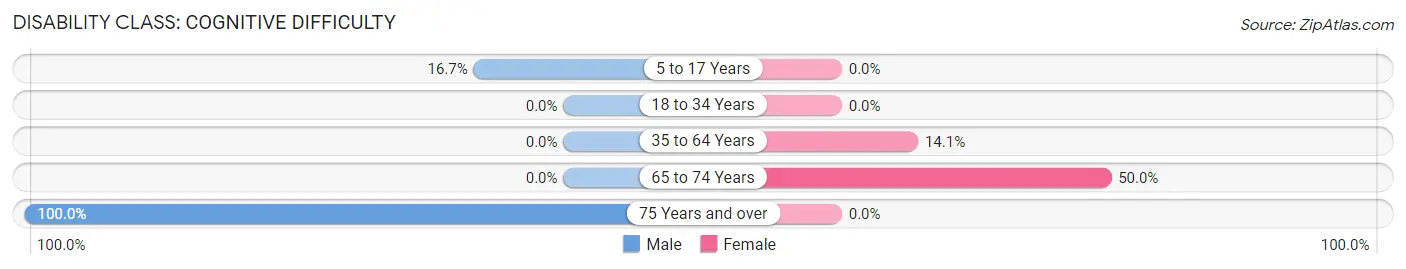
| Age Bracket | Male | Female |
| 5 to 17 Years | 14 (16.7%) | 0 (0.0%) |
| 18 to 34 Years | 0 (0.0%) | 0 (0.0%) |
| 35 to 64 Years | 0 (0.0%) | 14 (14.1%) |
| 65 to 74 Years | 0 (0.0%) | 12 (50.0%) |
| 75 Years and over | 13 (100.0%) | 0 (0.0%) |
Disability Class: Ambulatory Difficulty
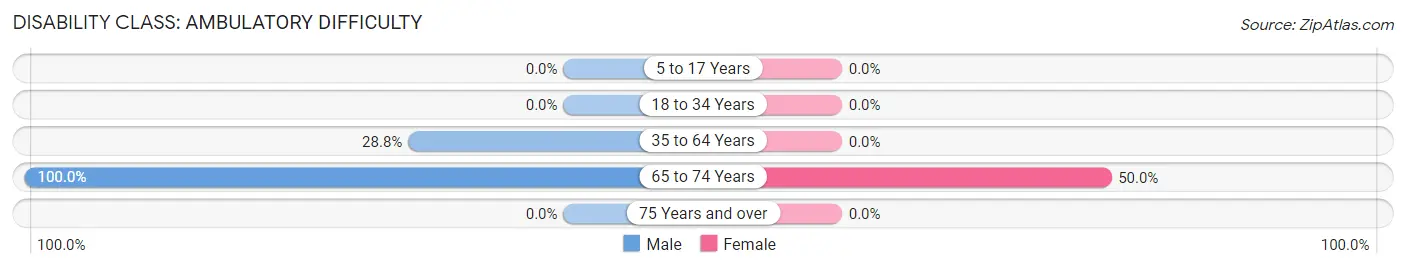
| Age Bracket | Male | Female |
| 5 to 17 Years | 0 (0.0%) | 0 (0.0%) |
| 18 to 34 Years | 0 (0.0%) | 0 (0.0%) |
| 35 to 64 Years | 34 (28.8%) | 0 (0.0%) |
| 65 to 74 Years | 13 (100.0%) | 12 (50.0%) |
| 75 Years and over | 0 (0.0%) | 0 (0.0%) |
Disability Class: Self-Care Difficulty
| Age Bracket | Male | Female |
| 5 to 17 Years | 0 (0.0%) | 0 (0.0%) |
| 18 to 34 Years | 0 (0.0%) | 0 (0.0%) |
| 35 to 64 Years | 0 (0.0%) | 0 (0.0%) |
| 65 to 74 Years | 0 (0.0%) | 0 (0.0%) |
| 75 Years and over | 0 (0.0%) | 0 (0.0%) |
Technology Access in Rainbow City
Computing Device Access in Rainbow City
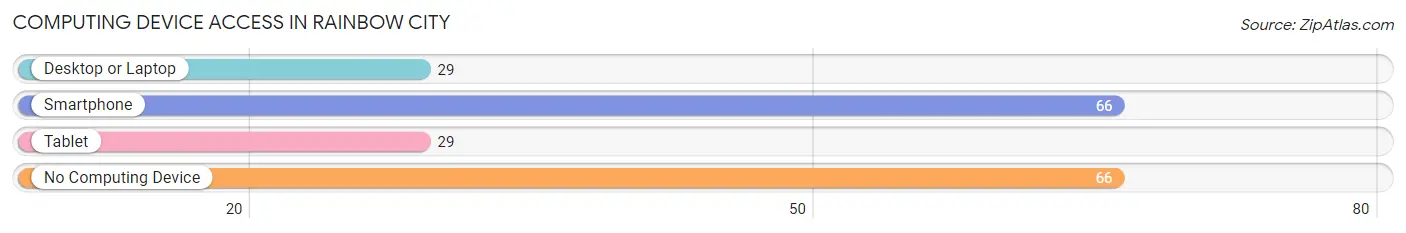
| Device Type | # Households | % Households |
| Desktop or Laptop | 29 | 22.0% |
| Smartphone | 66 | 50.0% |
| Tablet | 29 | 22.0% |
| No Computing Device | 66 | 50.0% |
| Total | 132 | 100.0% |
Internet Access in Rainbow City
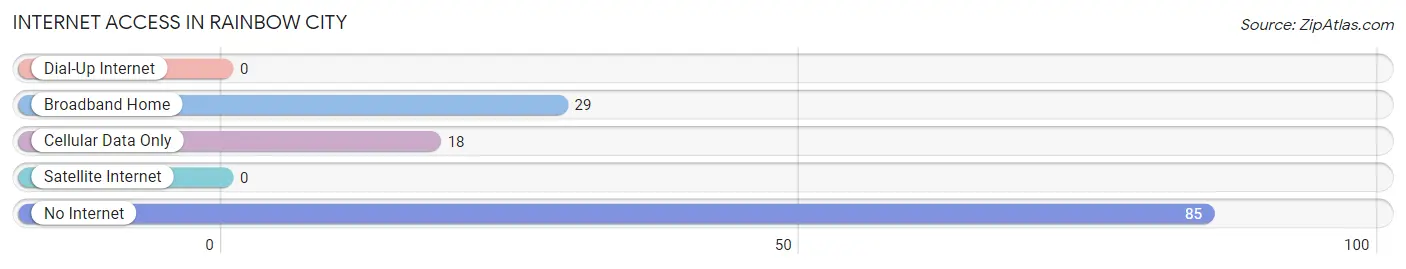
| Internet Type | # Households | % Households |
| Dial-Up Internet | 0 | 0.0% |
| Broadband Home | 29 | 22.0% |
| Cellular Data Only | 18 | 13.6% |
| Satellite Internet | 0 | 0.0% |
| No Internet | 85 | 64.4% |
| Total | 132 | 100.0% |
Rainbow City Summary
Rainbow City, Arizona is a small town located in the northern part of the state, near the border of Utah. It is situated in the high desert of the Colorado Plateau, and is surrounded by the majestic red rock formations of the Grand Canyon. The town was founded in 1882 by a group of Mormon settlers, and has since grown to a population of just over 1,000 people.
Geography
Rainbow City is located in Coconino County, Arizona, and is situated at an elevation of 5,400 feet. The town is surrounded by the red rock formations of the Grand Canyon, and is located near the border of Utah. The town is located in the high desert of the Colorado Plateau, and is characterized by its dry climate and sparse vegetation. The town is located in a region of the state known as the “Four Corners”, which is the intersection of Arizona, Utah, Colorado, and New Mexico.
The town is located near the Colorado River, which is the main source of water for the area. The town is also located near the Kaibab National Forest, which is a popular destination for outdoor recreation. The town is also located near the Navajo Nation, which is the largest Native American reservation in the United States.
Economy
The economy of Rainbow City is largely based on tourism and agriculture. The town is a popular destination for tourists, who come to visit the nearby Grand Canyon and other attractions in the area. The town is also home to a number of small businesses, including restaurants, hotels, and retail stores.
Agriculture is also an important part of the local economy. The town is located in an area of the state known for its agricultural production, and the town is home to a number of farms and ranches. The town is also home to a number of wineries, which produce a variety of wines from the local grapes.
Demographics
As of the 2010 census, the population of Rainbow City was 1,072. The town is predominantly white, with a population that is 94.3% white, 1.2% Native American, 0.7% Asian, 0.3% African American, and 3.5% other. The median household income in the town is $41,250, and the median age is 44.
The town is home to a number of churches, including the Church of Jesus Christ of Latter-day Saints, the Catholic Church, and the United Methodist Church. The town is also home to a number of schools, including Rainbow City Elementary School, Rainbow City High School, and Rainbow City Middle School.
Conclusion
Rainbow City, Arizona is a small town located in the northern part of the state, near the border of Utah. The town was founded in 1882 by a group of Mormon settlers, and has since grown to a population of just over 1,000 people. The town is surrounded by the red rock formations of the Grand Canyon, and is located in the high desert of the Colorado Plateau. The economy of the town is largely based on tourism and agriculture, and the town is home to a number of small businesses, farms, and wineries. The population of the town is predominantly white, with a median household income of $41,250 and a median age of 44.
Common Questions
What is Per Capita Income in Rainbow City?
Per Capita income in Rainbow City is $6,636.
What is Inequality or Gini Index in Rainbow City?
Inequality or Gini Index in Rainbow City is 0.69.
What is the Total Population of Rainbow City?
Total Population of Rainbow City is 596.
What is the Total Male Population of Rainbow City?
Total Male Population of Rainbow City is 281.
What is the Total Female Population of Rainbow City?
Total Female Population of Rainbow City is 315.
What is the Ratio of Males per 100 Females in Rainbow City?
There are 89.21 Males per 100 Females in Rainbow City.
What is the Ratio of Females per 100 Males in Rainbow City?
There are 112.10 Females per 100 Males in Rainbow City.
What is the Median Population Age in Rainbow City?
Median Population Age in Rainbow City is 29.6 Years.
What is the Average Family Size in Rainbow City
Average Family Size in Rainbow City is 4.9 People.
What is the Average Household Size in Rainbow City
Average Household Size in Rainbow City is 4.5 People.
How Large is the Labor Force in Rainbow City?
There are 107 People in the Labor Forcein in Rainbow City.
What is the Percentage of People in the Labor Force in Rainbow City?
25.5% of People are in the Labor Force in Rainbow City.
What is the Unemployment Rate in Rainbow City?
Unemployment Rate in Rainbow City is 42.1%.