Evansville, AK Map & Demographics
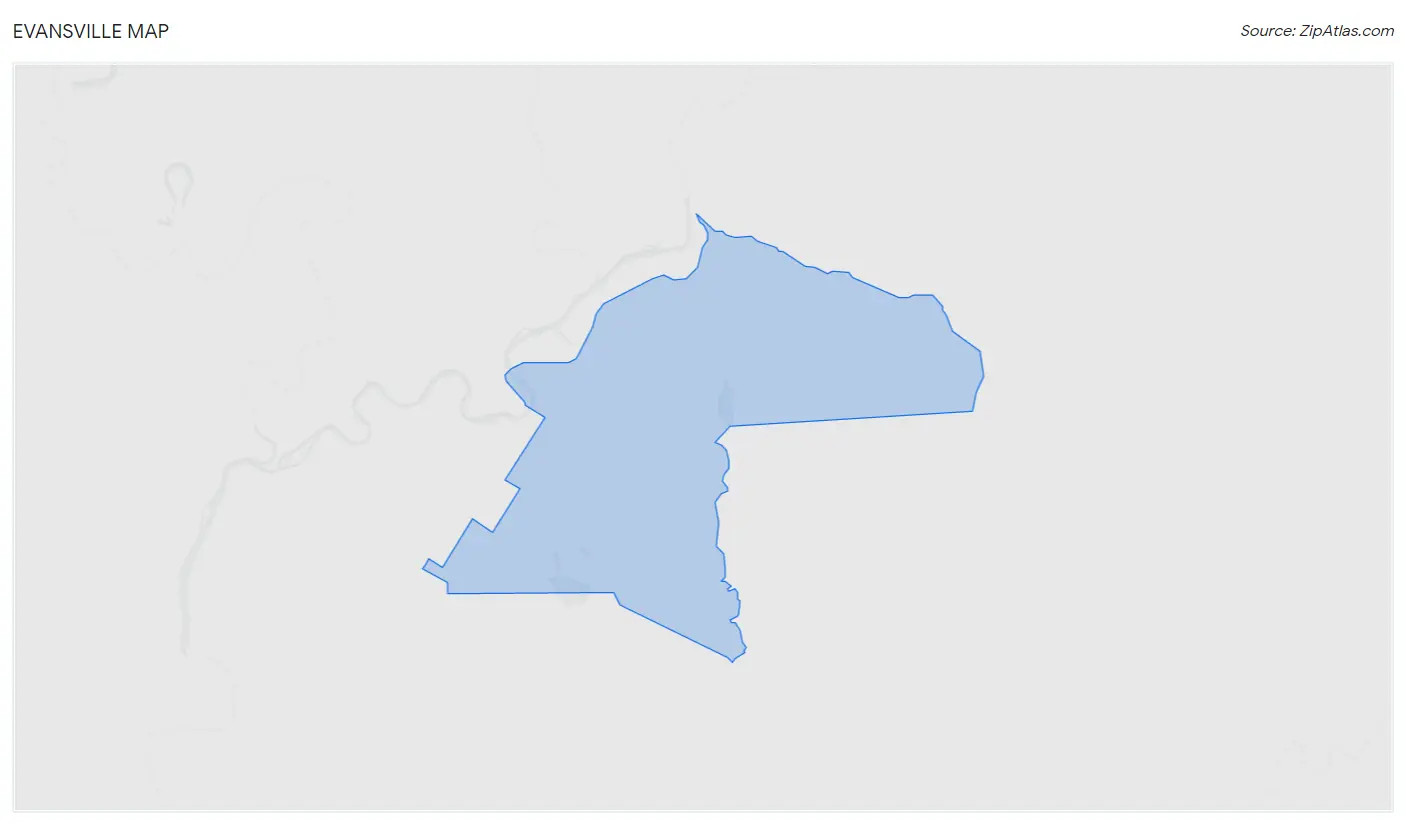
Evansville Map
Evansville Overview
$89,067
PER CAPITA INCOME
$89,643
AVG HOUSEHOLD INCOME
0.28
INEQUALITY / GINI INDEX
27
TOTAL POPULATION
20
MALE POPULATION
7
FEMALE POPULATION
285.71
MALES / 100 FEMALES
35.00
FEMALES / 100 MALES
49.6
MEDIAN AGE
2.5
AVG FAMILY SIZE
1.4
AVG HOUSEHOLD SIZE
24
LABOR FORCE [ PEOPLE ]
88.9%
PERCENT IN LABOR FORCE
Income in Evansville
Income Overview in Evansville
| Characteristic | Number | Measure |
| Per Capita Income | 27 | $89,067 |
| Median Family Income | 2 | $0 |
| Mean Family Income | 2 | $0 |
| Median Household Income | 20 | $89,643 |
| Mean Household Income | 20 | $108,820 |
| Income Deficit | 2 | $0 |
| Wage / Income Gap (%) | 27 | 0.00% |
| Wage / Income Gap ($) | 27 | 100.00¢ per $1 |
| Gini / Inequality Index | 27 | 0.28 |
Earnings by Sex in Evansville
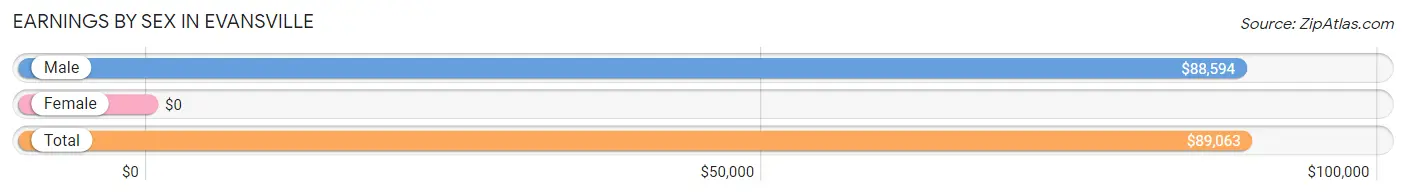
| Sex | Number | Average Earnings |
| Male | 17 (70.8%) | $88,594 |
| Female | 7 (29.2%) | $0 |
| Total | 24 (100.0%) | $89,063 |
Earnings by Sex by Income Bracket in Evansville
The most common earnings brackets in Evansville are $75,000 to $99,999 for men (9 | 52.9%) and $100,000+ for women (3 | 42.9%).
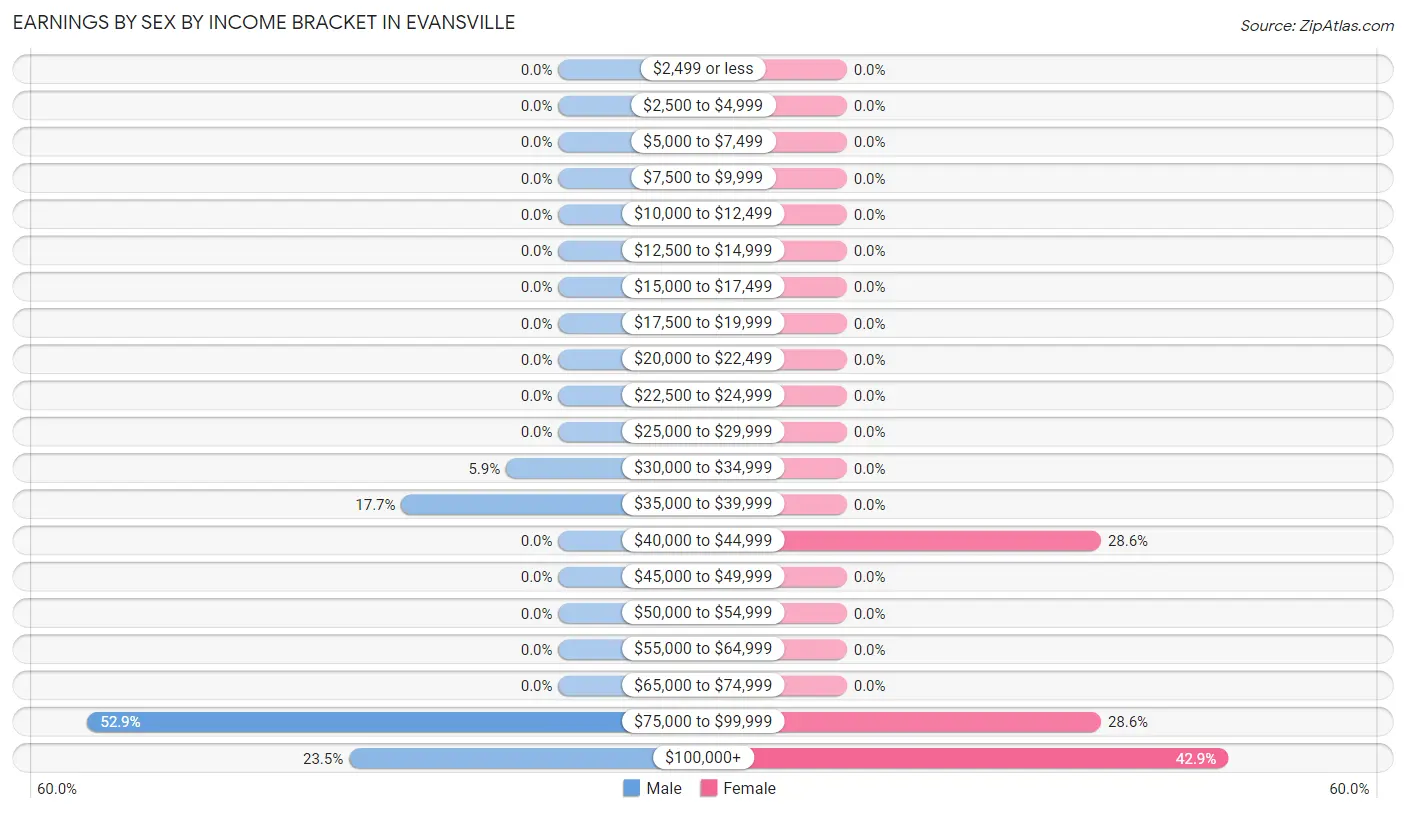
| Income | Male | Female |
| $2,499 or less | 0 (0.0%) | 0 (0.0%) |
| $2,500 to $4,999 | 0 (0.0%) | 0 (0.0%) |
| $5,000 to $7,499 | 0 (0.0%) | 0 (0.0%) |
| $7,500 to $9,999 | 0 (0.0%) | 0 (0.0%) |
| $10,000 to $12,499 | 0 (0.0%) | 0 (0.0%) |
| $12,500 to $14,999 | 0 (0.0%) | 0 (0.0%) |
| $15,000 to $17,499 | 0 (0.0%) | 0 (0.0%) |
| $17,500 to $19,999 | 0 (0.0%) | 0 (0.0%) |
| $20,000 to $22,499 | 0 (0.0%) | 0 (0.0%) |
| $22,500 to $24,999 | 0 (0.0%) | 0 (0.0%) |
| $25,000 to $29,999 | 0 (0.0%) | 0 (0.0%) |
| $30,000 to $34,999 | 1 (5.9%) | 0 (0.0%) |
| $35,000 to $39,999 | 3 (17.6%) | 0 (0.0%) |
| $40,000 to $44,999 | 0 (0.0%) | 2 (28.6%) |
| $45,000 to $49,999 | 0 (0.0%) | 0 (0.0%) |
| $50,000 to $54,999 | 0 (0.0%) | 0 (0.0%) |
| $55,000 to $64,999 | 0 (0.0%) | 0 (0.0%) |
| $65,000 to $74,999 | 0 (0.0%) | 0 (0.0%) |
| $75,000 to $99,999 | 9 (52.9%) | 2 (28.6%) |
| $100,000+ | 4 (23.5%) | 3 (42.9%) |
| Total | 17 (100.0%) | 7 (100.0%) |
Earnings by Sex by Educational Attainment in Evansville
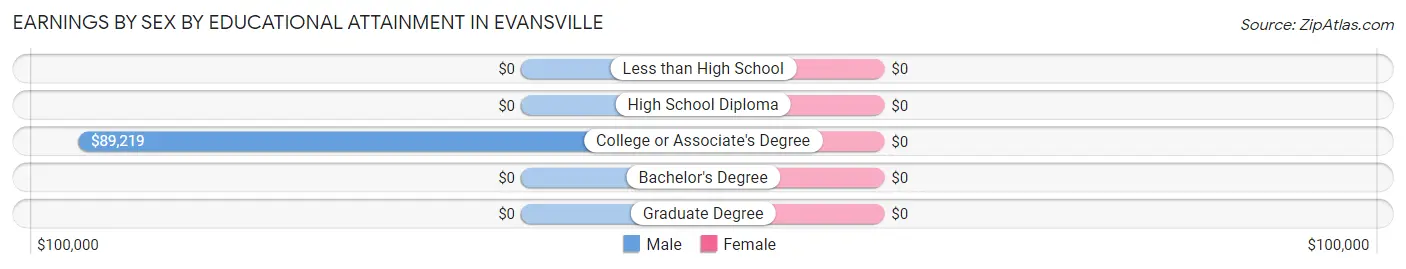
| Educational Attainment | Male Income | Female Income |
| Less than High School | - | - |
| High School Diploma | - | - |
| College or Associate's Degree | $89,219 | $0 |
| Bachelor's Degree | - | - |
| Graduate Degree | - | - |
| Total | $88,594 | $0 |
Family Income in Evansville
Family Income Brackets in Evansville
According to the Evansville family income data, there are 2 families falling into the $75,000 to $99,999 income range, which is the most common income bracket and makes up 100.0% of all families.
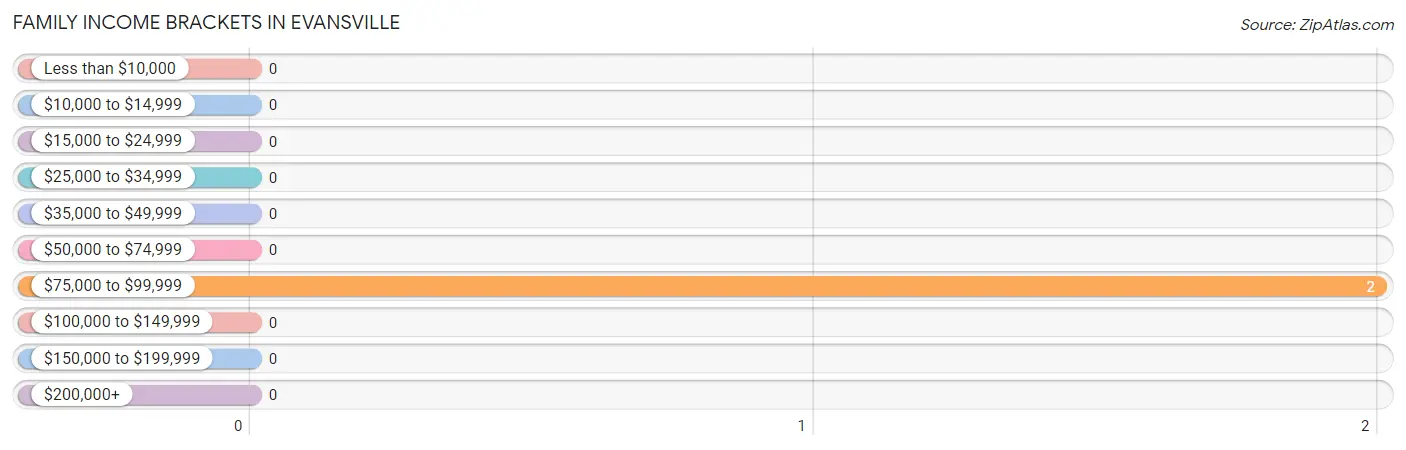
| Income Bracket | # Families | % Families |
| Less than $10,000 | 0 | 0.0% |
| $10,000 to $14,999 | 0 | 0.0% |
| $15,000 to $24,999 | 0 | 0.0% |
| $25,000 to $34,999 | 0 | 0.0% |
| $35,000 to $49,999 | 0 | 0.0% |
| $50,000 to $74,999 | 0 | 0.0% |
| $75,000 to $99,999 | 2 | 100.0% |
| $100,000 to $149,999 | 0 | 0.0% |
| $150,000 to $199,999 | 0 | 0.0% |
| $200,000+ | 0 | 0.0% |
Family Income by Famaliy Size in Evansville
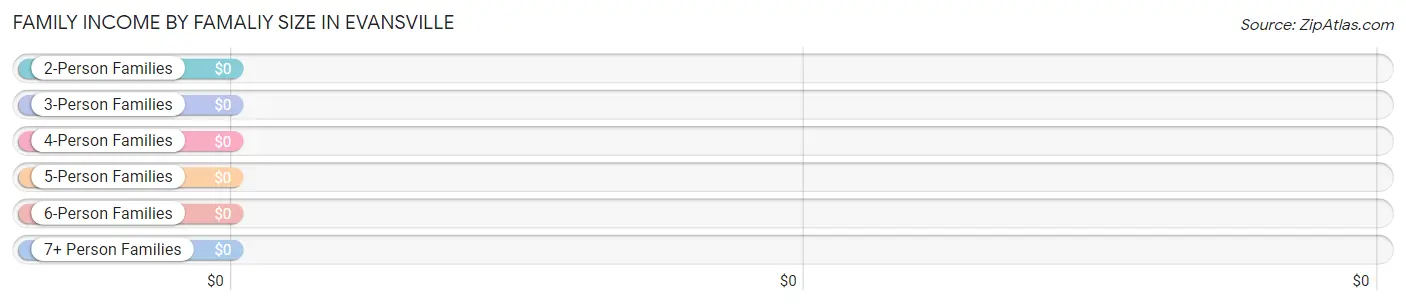
| Income Bracket | # Families | Median Income |
| 2-Person Families | 2 (100.0%) | $0 |
| 3-Person Families | 0 (0.0%) | $0 |
| 4-Person Families | 0 (0.0%) | $0 |
| 5-Person Families | 0 (0.0%) | $0 |
| 6-Person Families | 0 (0.0%) | $0 |
| 7+ Person Families | 0 (0.0%) | $0 |
| Total | 2 (100.0%) | $0 |
Family Income by Number of Earners in Evansville
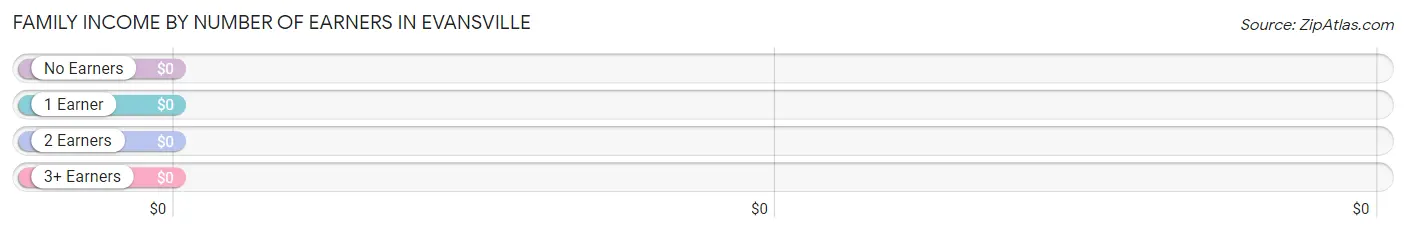
| Number of Earners | # Families | Median Income |
| No Earners | 0 (0.0%) | $0 |
| 1 Earner | 2 (100.0%) | $0 |
| 2 Earners | 0 (0.0%) | $0 |
| 3+ Earners | 0 (0.0%) | $0 |
| Total | 2 (100.0%) | $0 |
Household Income in Evansville
Household Income Brackets in Evansville
With 7 households falling in the category, the $75,000 to $99,999 income range is the most frequent in Evansville, accounting for 35.0% of all households.
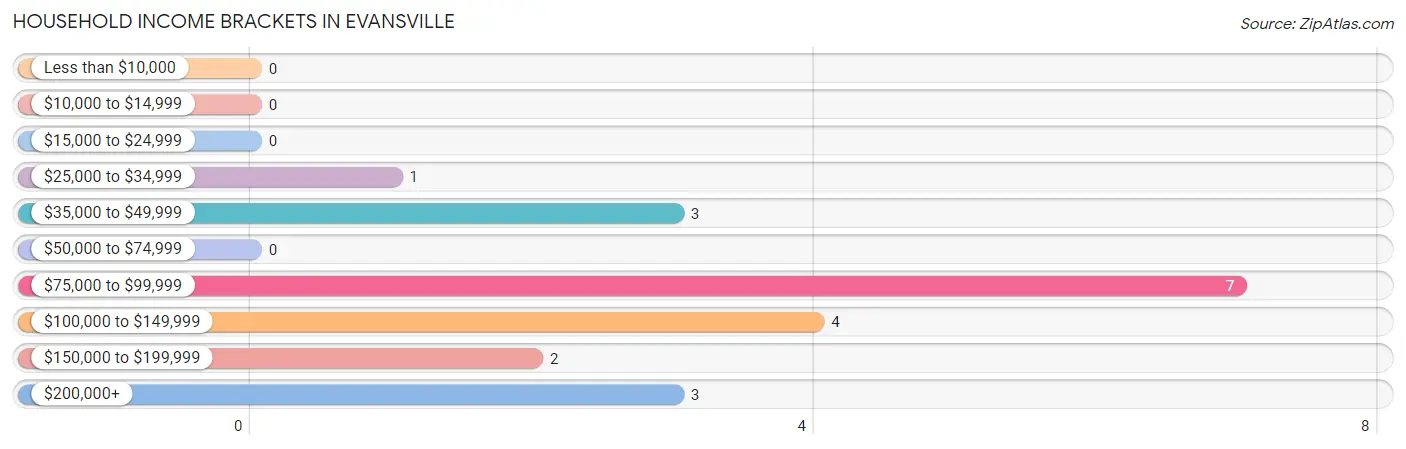
| Income Bracket | # Households | % Households |
| Less than $10,000 | 0 | 0.0% |
| $10,000 to $14,999 | 0 | 0.0% |
| $15,000 to $24,999 | 0 | 0.0% |
| $25,000 to $34,999 | 1 | 5.0% |
| $35,000 to $49,999 | 3 | 15.0% |
| $50,000 to $74,999 | 0 | 0.0% |
| $75,000 to $99,999 | 7 | 35.0% |
| $100,000 to $149,999 | 4 | 20.0% |
| $150,000 to $199,999 | 2 | 10.0% |
| $200,000+ | 3 | 15.0% |
Household Income by Householder Age in Evansville
The median household income in Evansville is $89,643, with the highest median household income of $100,313 found in the 45 to 64 years age bracket for the primary householder. A total of 13 households (65.0%) fall into this category.
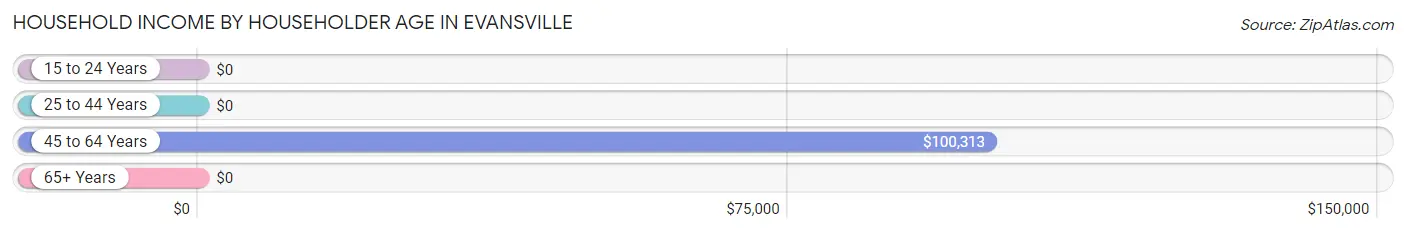
| Income Bracket | # Households | Median Income |
| 15 to 24 Years | 0 (0.0%) | $0 |
| 25 to 44 Years | 7 (35.0%) | $0 |
| 45 to 64 Years | 13 (65.0%) | $100,313 |
| 65+ Years | 0 (0.0%) | $0 |
| Total | 20 (100.0%) | $89,643 |
Poverty in Evansville
Income Below Poverty by Sex and Age in Evansville
| Age Bracket | Male | Female |
| Under 5 Years | 0 (0.0%) | 0 (0.0%) |
| 5 Years | 0 (0.0%) | 0 (0.0%) |
| 6 to 11 Years | 0 (0.0%) | 0 (0.0%) |
| 12 to 14 Years | 0 (0.0%) | 0 (0.0%) |
| 15 Years | 0 (0.0%) | 0 (0.0%) |
| 16 and 17 Years | 0 (0.0%) | 0 (0.0%) |
| 18 to 24 Years | 0 (0.0%) | 0 (0.0%) |
| 25 to 34 Years | 0 (0.0%) | 0 (0.0%) |
| 35 to 44 Years | 0 (0.0%) | 0 (0.0%) |
| 45 to 54 Years | 0 (0.0%) | 0 (0.0%) |
| 55 to 64 Years | 0 (0.0%) | 0 (0.0%) |
| 65 to 74 Years | 0 (0.0%) | 0 (0.0%) |
| 75 Years and over | 0 (0.0%) | 0 (0.0%) |
| Total | 0 (0.0%) | 0 (0.0%) |
Income Above Poverty by Sex and Age in Evansville
According to the poverty statistics in Evansville, males aged 25 to 34 years and females aged 25 to 34 years are the age groups that are most secure financially, with 100.0% of males and 100.0% of females in these age groups living above the poverty line.
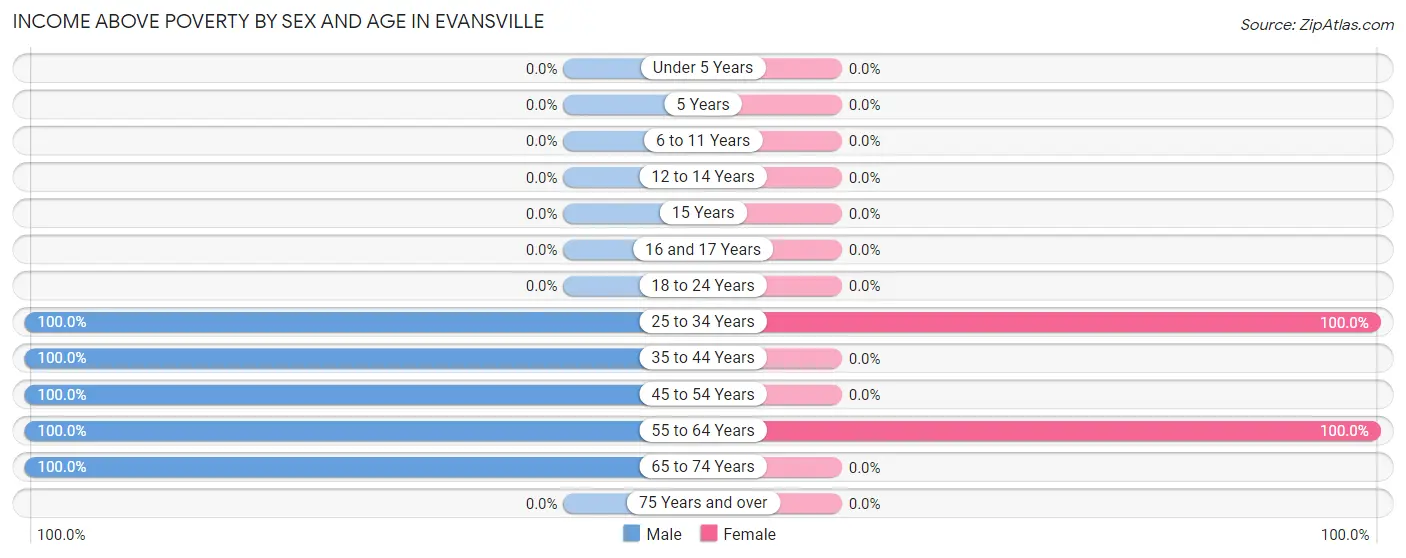
| Age Bracket | Male | Female |
| Under 5 Years | 0 (0.0%) | 0 (0.0%) |
| 5 Years | 0 (0.0%) | 0 (0.0%) |
| 6 to 11 Years | 0 (0.0%) | 0 (0.0%) |
| 12 to 14 Years | 0 (0.0%) | 0 (0.0%) |
| 15 Years | 0 (0.0%) | 0 (0.0%) |
| 16 and 17 Years | 0 (0.0%) | 0 (0.0%) |
| 18 to 24 Years | 0 (0.0%) | 0 (0.0%) |
| 25 to 34 Years | 8 (100.0%) | 2 (100.0%) |
| 35 to 44 Years | 1 (100.0%) | 0 (0.0%) |
| 45 to 54 Years | 7 (100.0%) | 0 (0.0%) |
| 55 to 64 Years | 1 (100.0%) | 5 (100.0%) |
| 65 to 74 Years | 3 (100.0%) | 0 (0.0%) |
| 75 Years and over | 0 (0.0%) | 0 (0.0%) |
| Total | 20 (100.0%) | 7 (100.0%) |
Income Below Poverty Among Married-Couple Families in Evansville
| Children | Above Poverty | Below Poverty |
| No Children | 2 (100.0%) | 0 (0.0%) |
| 1 or 2 Children | 0 (0.0%) | 0 (0.0%) |
| 3 or 4 Children | 0 (0.0%) | 0 (0.0%) |
| 5 or more Children | 0 (0.0%) | 0 (0.0%) |
| Total | 2 (100.0%) | 0 (0.0%) |
Income Below Poverty Among Single-Parent Households in Evansville
| Children | Single Father | Single Mother |
| No Children | 0 (0.0%) | 0 (0.0%) |
| 1 or 2 Children | 0 (0.0%) | 0 (0.0%) |
| 3 or 4 Children | 0 (0.0%) | 0 (0.0%) |
| 5 or more Children | 0 (0.0%) | 0 (0.0%) |
| Total | 0 (0.0%) | 0 (0.0%) |
Income Below Poverty Among Married-Couple vs Single-Parent Households in Evansville
| Children | Married-Couple Families | Single-Parent Households |
| No Children | 0 (0.0%) | 0 (0.0%) |
| 1 or 2 Children | 0 (0.0%) | 0 (0.0%) |
| 3 or 4 Children | 0 (0.0%) | 0 (0.0%) |
| 5 or more Children | 0 (0.0%) | 0 (0.0%) |
| Total | 0 (0.0%) | 0 (0.0%) |
Race in Evansville
The most populous races in Evansville are White / Caucasian (18 | 66.7%), Native / Alaskan (7 | 25.9%), and Two or more Races (2 | 7.4%).
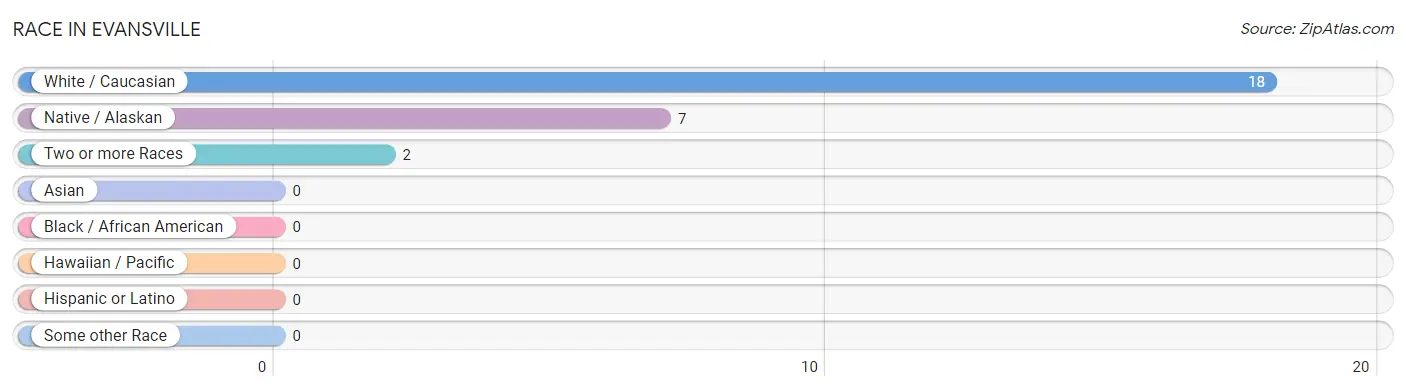
| Race | # Population | % Population |
| Asian | 0 | 0.0% |
| Black / African American | 0 | 0.0% |
| Hawaiian / Pacific | 0 | 0.0% |
| Hispanic or Latino | 0 | 0.0% |
| Native / Alaskan | 7 | 25.9% |
| White / Caucasian | 18 | 66.7% |
| Two or more Races | 2 | 7.4% |
| Some other Race | 0 | 0.0% |
| Total | 27 | 100.0% |
Ancestry in Evansville
The most populous ancestries reported in Evansville are Alaskan Athabascan (7 | 25.9%), Danish (4 | 14.8%), German (4 | 14.8%), Norwegian (4 | 14.8%), and Dutch (3 | 11.1%), together accounting for 81.5% of all Evansville residents.
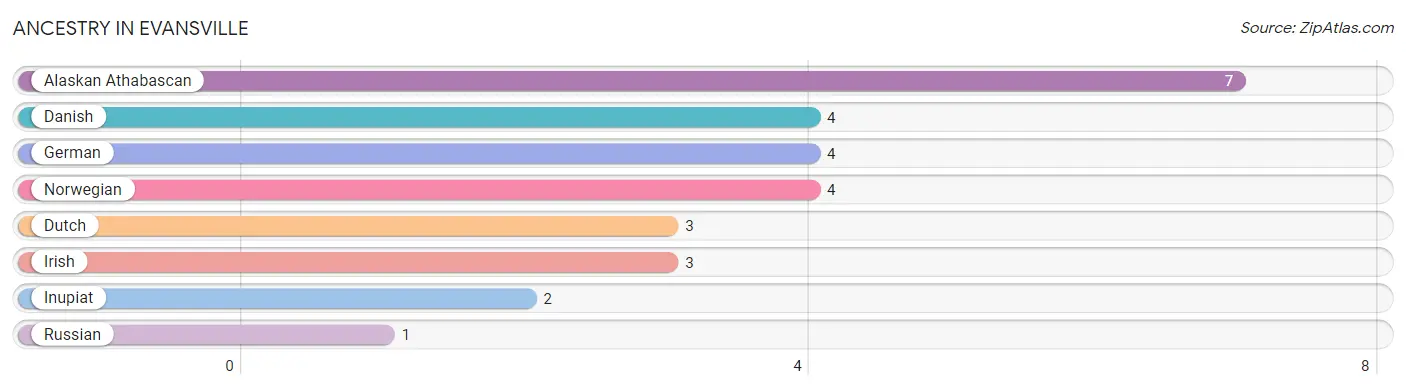
| Ancestry | # Population | % Population |
| Alaskan Athabascan | 7 | 25.9% |
| Danish | 4 | 14.8% |
| Dutch | 3 | 11.1% |
| German | 4 | 14.8% |
| Inupiat | 2 | 7.4% |
| Irish | 3 | 11.1% |
| Norwegian | 4 | 14.8% |
| Russian | 1 | 3.7% | View All 8 Rows |
Immigrants in Evansville

| Immigration Origin | # Population | % Population | View All 0 Rows |
Sex and Age in Evansville
Sex and Age in Evansville
The most populous age groups in Evansville are 25 to 29 Years (8 | 40.0%) for men and 60 to 64 Years (5 | 71.4%) for women.
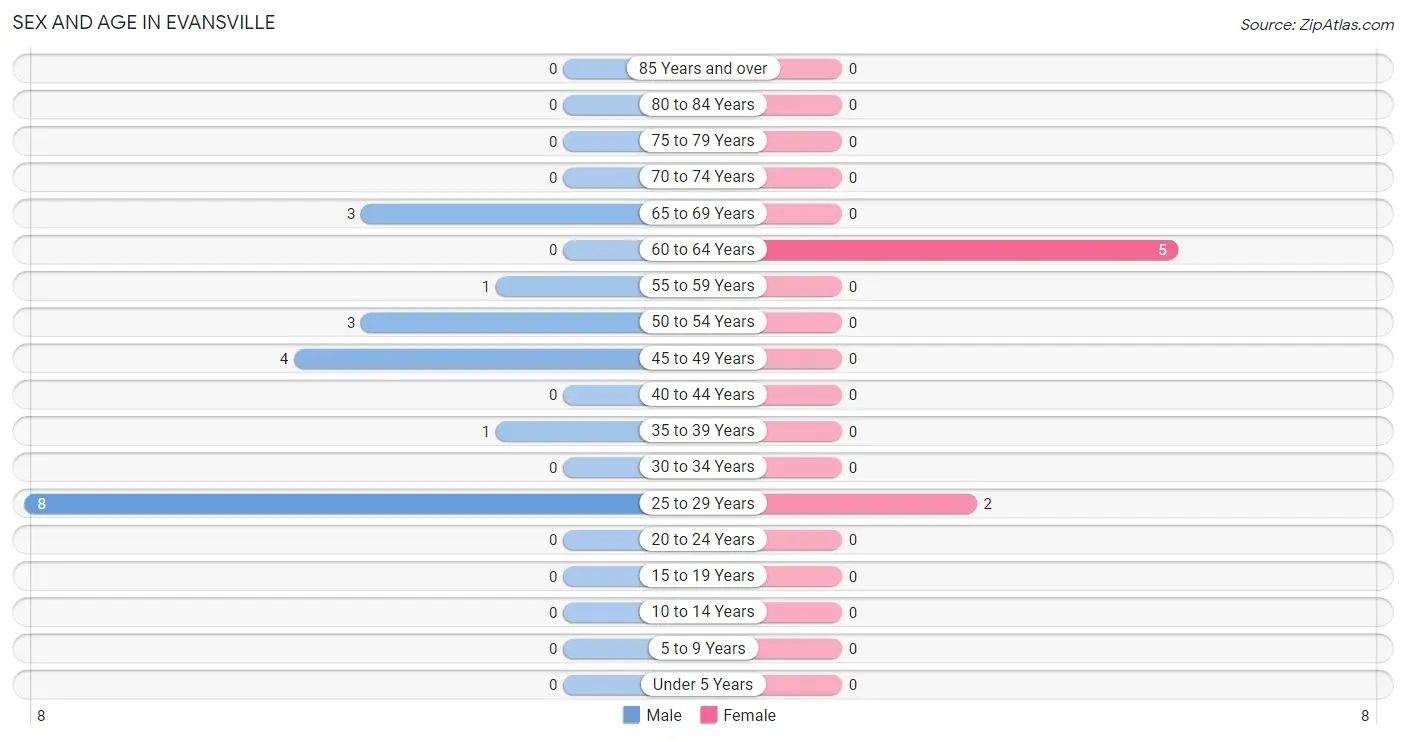
| Age Bracket | Male | Female |
| Under 5 Years | 0 (0.0%) | 0 (0.0%) |
| 5 to 9 Years | 0 (0.0%) | 0 (0.0%) |
| 10 to 14 Years | 0 (0.0%) | 0 (0.0%) |
| 15 to 19 Years | 0 (0.0%) | 0 (0.0%) |
| 20 to 24 Years | 0 (0.0%) | 0 (0.0%) |
| 25 to 29 Years | 8 (40.0%) | 2 (28.6%) |
| 30 to 34 Years | 0 (0.0%) | 0 (0.0%) |
| 35 to 39 Years | 1 (5.0%) | 0 (0.0%) |
| 40 to 44 Years | 0 (0.0%) | 0 (0.0%) |
| 45 to 49 Years | 4 (20.0%) | 0 (0.0%) |
| 50 to 54 Years | 3 (15.0%) | 0 (0.0%) |
| 55 to 59 Years | 1 (5.0%) | 0 (0.0%) |
| 60 to 64 Years | 0 (0.0%) | 5 (71.4%) |
| 65 to 69 Years | 3 (15.0%) | 0 (0.0%) |
| 70 to 74 Years | 0 (0.0%) | 0 (0.0%) |
| 75 to 79 Years | 0 (0.0%) | 0 (0.0%) |
| 80 to 84 Years | 0 (0.0%) | 0 (0.0%) |
| 85 Years and over | 0 (0.0%) | 0 (0.0%) |
| Total | 20 (100.0%) | 7 (100.0%) |
Families and Households in Evansville
Median Family Size in Evansville
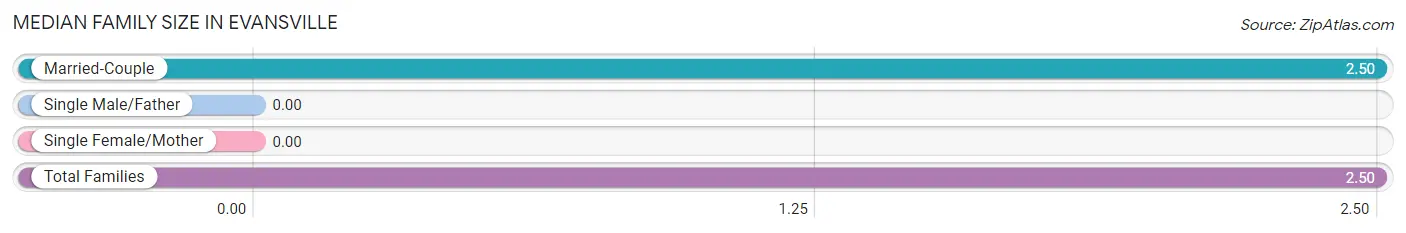
| Family Type | # Families | Family Size |
| Married-Couple | 2 (100.0%) | 2.50 |
| Single Male/Father | 0 (0.0%) | - |
| Single Female/Mother | 0 (0.0%) | - |
| Total Families | 2 (100.0%) | 2.50 |
Median Household Size in Evansville
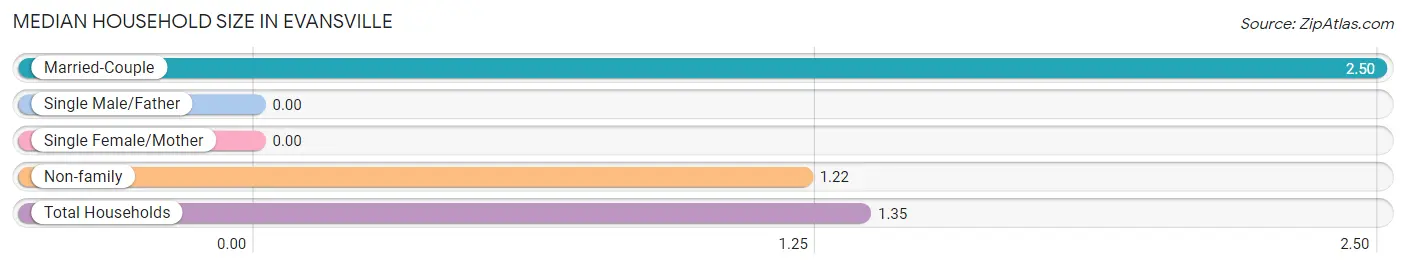
| Household Type | # Households | Household Size |
| Married-Couple | 2 (10.0%) | 2.50 |
| Single Male/Father | 0 (0.0%) | - |
| Single Female/Mother | 0 (0.0%) | - |
| Non-family | 18 (90.0%) | 1.22 |
| Total Households | 20 (100.0%) | 1.35 |
Household Size by Marriage Status in Evansville
Out of a total of 20 households in Evansville, 2 (10.0%) are family households, while 18 (90.0%) are nonfamily households. The most numerous type of family households are 2-person households, comprising 2, and the most common type of nonfamily households are 1-person households, comprising 16.
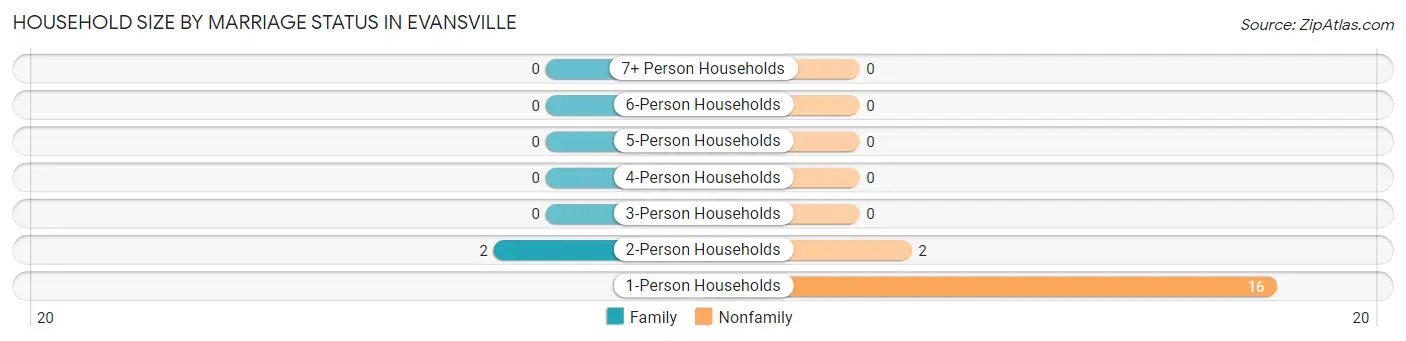
| Household Size | Family Households | Nonfamily Households |
| 1-Person Households | - | 16 (80.0%) |
| 2-Person Households | 2 (10.0%) | 2 (10.0%) |
| 3-Person Households | 0 (0.0%) | 0 (0.0%) |
| 4-Person Households | 0 (0.0%) | 0 (0.0%) |
| 5-Person Households | 0 (0.0%) | 0 (0.0%) |
| 6-Person Households | 0 (0.0%) | 0 (0.0%) |
| 7+ Person Households | 0 (0.0%) | 0 (0.0%) |
| Total | 2 (10.0%) | 18 (90.0%) |
Female Fertility in Evansville
Fertility by Age in Evansville
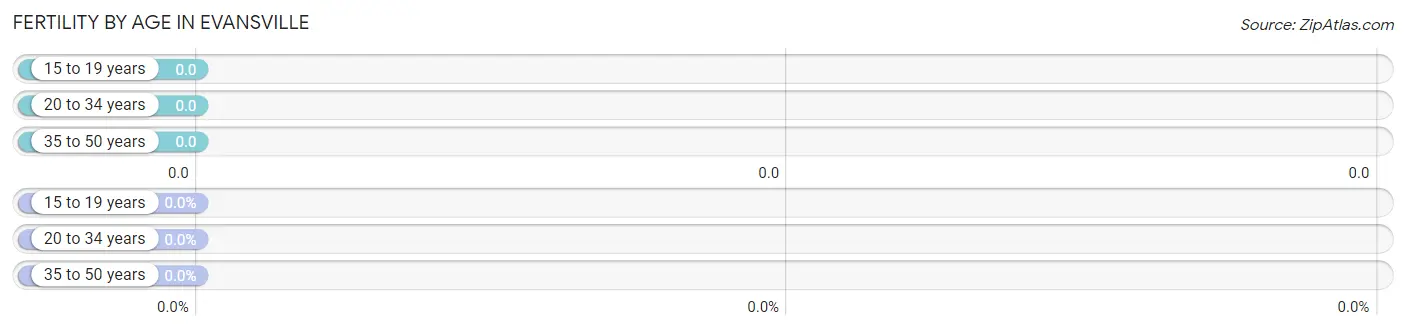
| Age Bracket | Women with Births | Births / 1,000 Women |
| 15 to 19 years | 0 (0.0%) | 0.0 |
| 20 to 34 years | 0 (0.0%) | 0.0 |
| 35 to 50 years | 0 (0.0%) | 0.0 |
| Total | 0 (0.0%) | 0.0 |
Fertility by Age by Marriage Status in Evansville
| Age Bracket | Married | Unmarried |
| 15 to 19 years | 0 (0.0%) | 0 (0.0%) |
| 20 to 34 years | 0 (0.0%) | 0 (0.0%) |
| 35 to 50 years | 0 (0.0%) | 0 (0.0%) |
| Total | 0 (0.0%) | 0 (0.0%) |
Fertility by Education in Evansville
| Educational Attainment | Women with Births | Births / 1,000 Women |
| Less than High School | 0 (0.0%) | 0.0 |
| High School Diploma | 0 (0.0%) | 0.0 |
| College or Associate's Degree | 0 (0.0%) | 0.0 |
| Bachelor's Degree | 0 (0.0%) | 0.0 |
| Graduate Degree | 0 (0.0%) | 0.0 |
| Total | 0 (0.0%) | 0.0 |
Fertility by Education by Marriage Status in Evansville
| Educational Attainment | Married | Unmarried |
| Less than High School | 0 (0.0%) | 0 (0.0%) |
| High School Diploma | 0 (0.0%) | 0 (0.0%) |
| College or Associate's Degree | 0 (0.0%) | 0 (0.0%) |
| Bachelor's Degree | 0 (0.0%) | 0 (0.0%) |
| Graduate Degree | 0 (0.0%) | 0 (0.0%) |
| Total | 0 (0.0%) | 0 (0.0%) |
Employment Characteristics in Evansville
Employment by Class of Employer in Evansville
Among the 24 employed individuals in Evansville, private company employees (10 | 41.7%), local government employees (6 | 25.0%), and not-for-profit organizations (5 | 20.8%) make up the most common classes of employment.
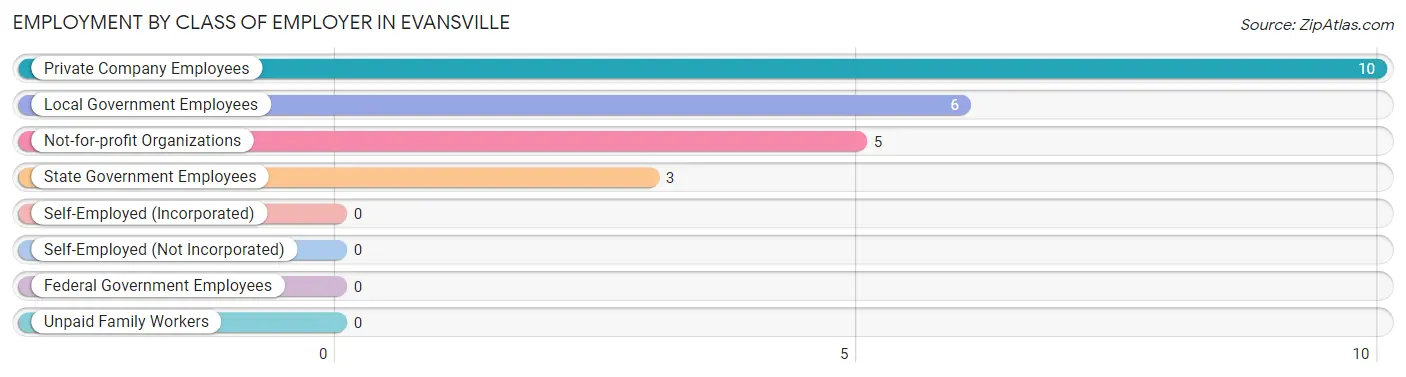
| Employer Class | # Employees | % Employees |
| Private Company Employees | 10 | 41.7% |
| Self-Employed (Incorporated) | 0 | 0.0% |
| Self-Employed (Not Incorporated) | 0 | 0.0% |
| Not-for-profit Organizations | 5 | 20.8% |
| Local Government Employees | 6 | 25.0% |
| State Government Employees | 3 | 12.5% |
| Federal Government Employees | 0 | 0.0% |
| Unpaid Family Workers | 0 | 0.0% |
| Total | 24 | 100.0% |
Employment Status by Age in Evansville
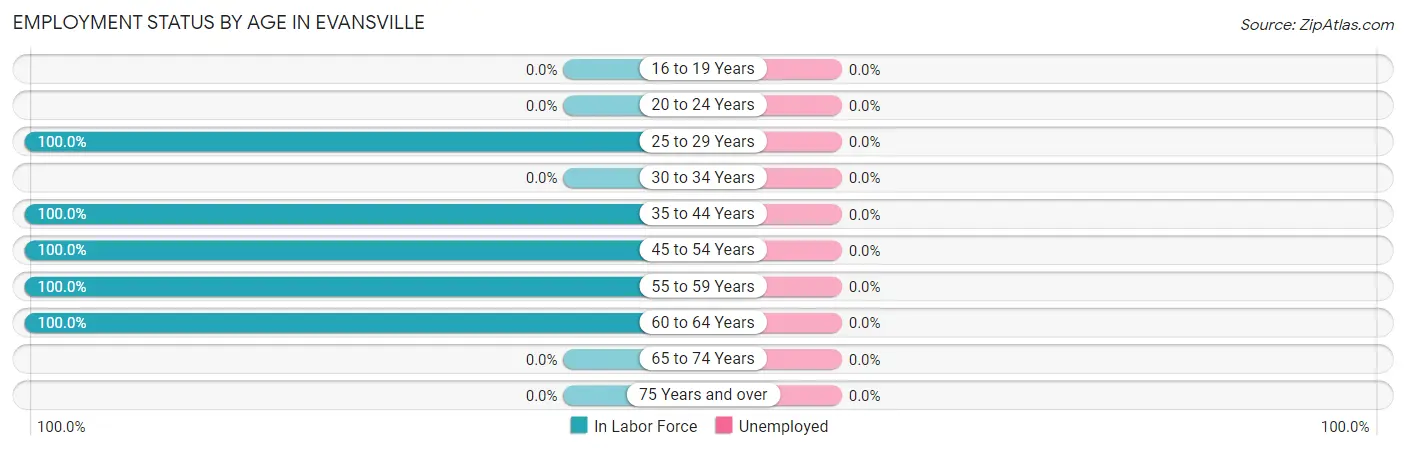
| Age Bracket | In Labor Force | Unemployed |
| 16 to 19 Years | 0 (0.0%) | 0 (0.0%) |
| 20 to 24 Years | 0 (0.0%) | 0 (0.0%) |
| 25 to 29 Years | 10 (100.0%) | 0 (0.0%) |
| 30 to 34 Years | 0 (0.0%) | 0 (0.0%) |
| 35 to 44 Years | 1 (100.0%) | 0 (0.0%) |
| 45 to 54 Years | 7 (100.0%) | 0 (0.0%) |
| 55 to 59 Years | 1 (100.0%) | 0 (0.0%) |
| 60 to 64 Years | 5 (100.0%) | 0 (0.0%) |
| 65 to 74 Years | 0 (0.0%) | 0 (0.0%) |
| 75 Years and over | 0 (0.0%) | 0 (0.0%) |
| Total | 24 (88.9%) | 0 (0.0%) |
Employment Status by Educational Attainment in Evansville
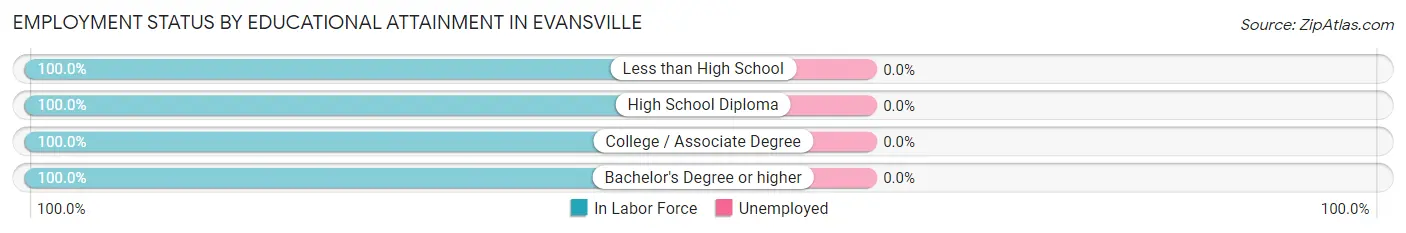
| Educational Attainment | In Labor Force | Unemployed |
| Less than High School | 3 (100.0%) | 0 (0.0%) |
| High School Diploma | 1 (100.0%) | 0 (0.0%) |
| College / Associate Degree | 13 (100.0%) | 0 (0.0%) |
| Bachelor's Degree or higher | 7 (100.0%) | 0 (0.0%) |
| Total | 24 (100.0%) | 0 (0.0%) |
Employment Occupations by Sex in Evansville
Management, Business, Science and Arts Occupations
The most common Management, Business, Science and Arts occupations in Evansville are Computers, Engineering & Science (9 | 37.5%), Life, Physical & Social Science (8 | 33.3%), Management (7 | 29.2%), Health Diagnosing & Treating (2 | 8.3%), and Architecture & Engineering (1 | 4.2%).
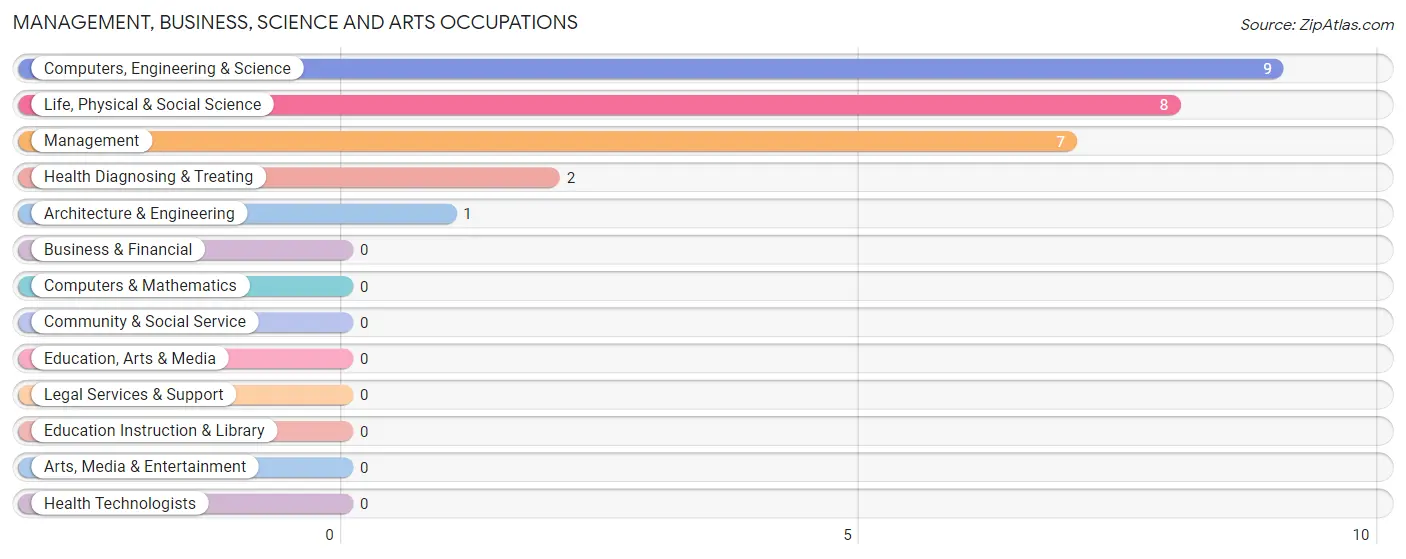
Management, Business, Science and Arts Occupations by Sex
Within the Management, Business, Science and Arts occupations in Evansville, the most male-oriented occupations are Computers, Engineering & Science (100.0%), Architecture & Engineering (100.0%), and Life, Physical & Social Science (100.0%), while the most female-oriented occupations are Health Diagnosing & Treating (100.0%), and Management (42.9%).
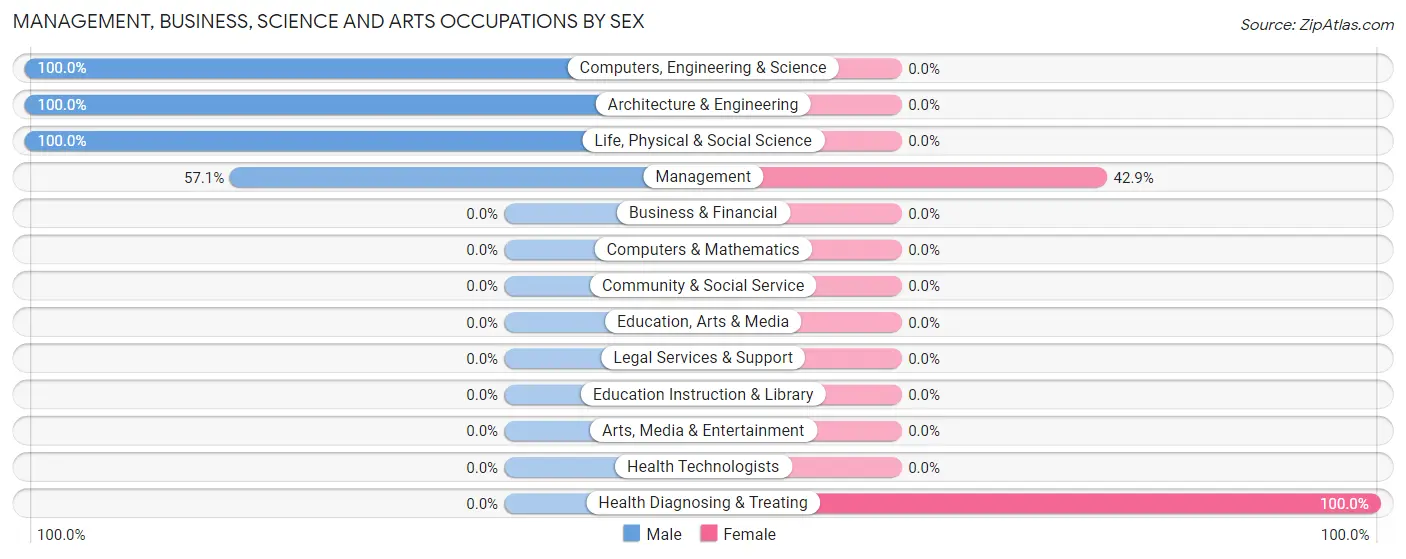
| Occupation | Male | Female |
| Management | 4 (57.1%) | 3 (42.9%) |
| Business & Financial | 0 (0.0%) | 0 (0.0%) |
| Computers, Engineering & Science | 9 (100.0%) | 0 (0.0%) |
| Computers & Mathematics | 0 (0.0%) | 0 (0.0%) |
| Architecture & Engineering | 1 (100.0%) | 0 (0.0%) |
| Life, Physical & Social Science | 8 (100.0%) | 0 (0.0%) |
| Community & Social Service | 0 (0.0%) | 0 (0.0%) |
| Education, Arts & Media | 0 (0.0%) | 0 (0.0%) |
| Legal Services & Support | 0 (0.0%) | 0 (0.0%) |
| Education Instruction & Library | 0 (0.0%) | 0 (0.0%) |
| Arts, Media & Entertainment | 0 (0.0%) | 0 (0.0%) |
| Health Diagnosing & Treating | 0 (0.0%) | 2 (100.0%) |
| Health Technologists | 0 (0.0%) | 0 (0.0%) |
| Total (Category) | 13 (72.2%) | 5 (27.8%) |
| Total (Overall) | 17 (70.8%) | 7 (29.2%) |
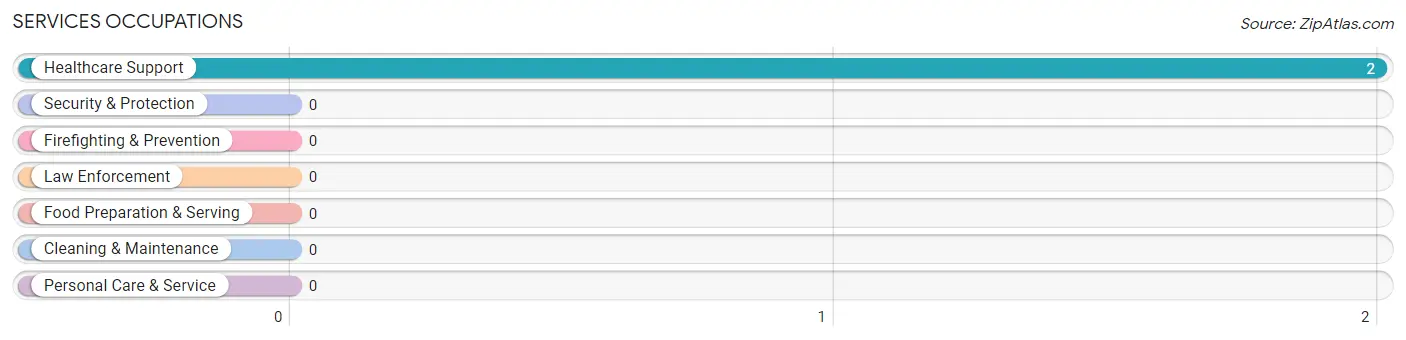
Services Occupations
The most common Services occupations in Evansville are , and Healthcare Support (2 | 8.3%).
Services Occupations by Sex
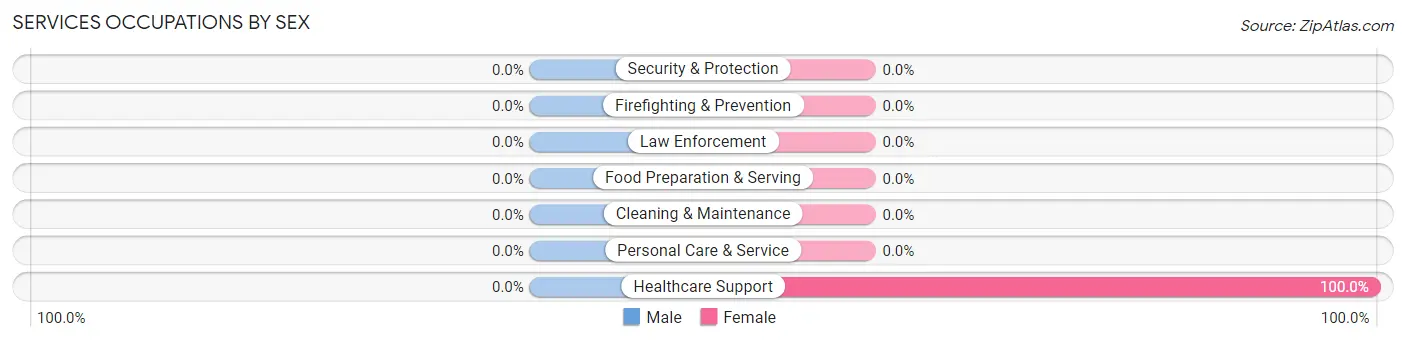
| Occupation | Male | Female |
| Healthcare Support | 0 (0.0%) | 2 (100.0%) |
| Security & Protection | 0 (0.0%) | 0 (0.0%) |
| Firefighting & Prevention | 0 (0.0%) | 0 (0.0%) |
| Law Enforcement | 0 (0.0%) | 0 (0.0%) |
| Food Preparation & Serving | 0 (0.0%) | 0 (0.0%) |
| Cleaning & Maintenance | 0 (0.0%) | 0 (0.0%) |
| Personal Care & Service | 0 (0.0%) | 0 (0.0%) |
| Total (Category) | 0 (0.0%) | 2 (100.0%) |
| Total (Overall) | 17 (70.8%) | 7 (29.2%) |
Sales and Office Occupations
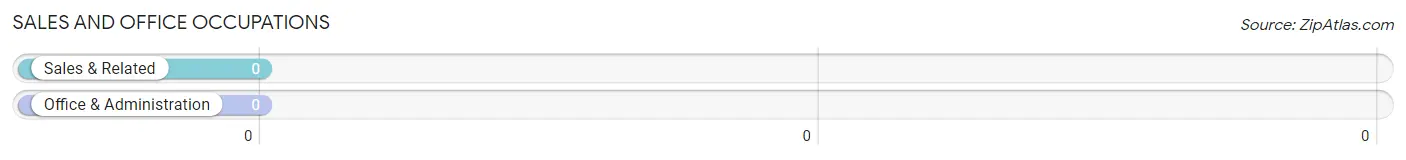
Sales and Office Occupations by Sex
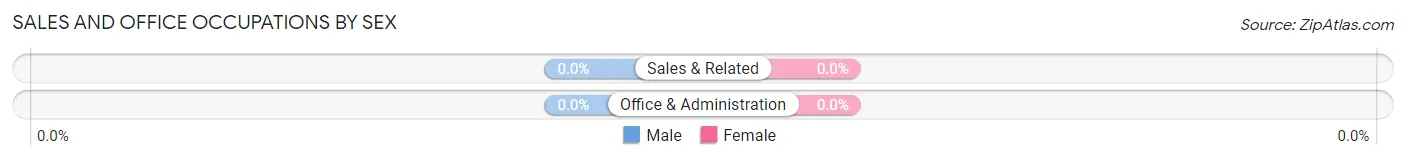
| Occupation | Male | Female |
| Sales & Related | 0 (0.0%) | 0 (0.0%) |
| Office & Administration | 0 (0.0%) | 0 (0.0%) |
| Total (Category) | 0 (0.0%) | 0 (0.0%) |
| Total (Overall) | 17 (70.8%) | 7 (29.2%) |
Natural Resources, Construction and Maintenance Occupations
Natural Resources, Construction and Maintenance Occupations by Sex
| Occupation | Male | Female |
| Farming, Fishing & Forestry | 0 (0.0%) | 0 (0.0%) |
| Construction & Extraction | 0 (0.0%) | 0 (0.0%) |
| Installation, Maintenance & Repair | 0 (0.0%) | 0 (0.0%) |
| Total (Category) | 0 (0.0%) | 0 (0.0%) |
| Total (Overall) | 17 (70.8%) | 7 (29.2%) |
Production, Transportation and Moving Occupations
The most common Production, Transportation and Moving occupations in Evansville are , and Material Moving (4 | 16.7%).
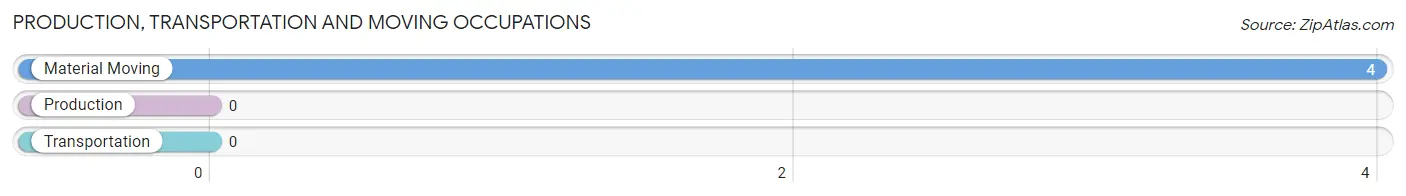
Production, Transportation and Moving Occupations by Sex
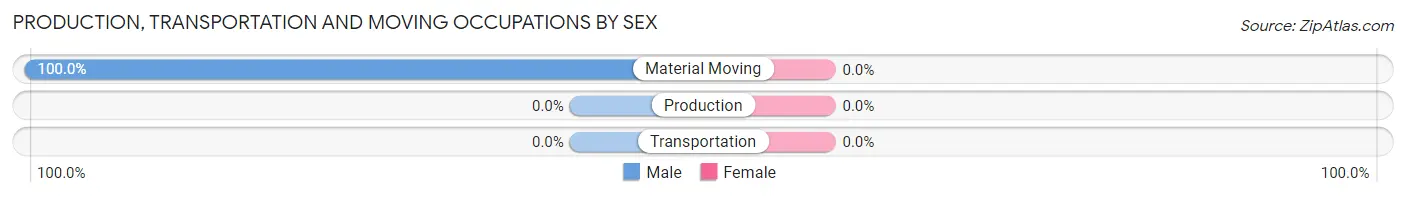
| Occupation | Male | Female |
| Production | 0 (0.0%) | 0 (0.0%) |
| Transportation | 0 (0.0%) | 0 (0.0%) |
| Material Moving | 4 (100.0%) | 0 (0.0%) |
| Total (Category) | 4 (100.0%) | 0 (0.0%) |
| Total (Overall) | 17 (70.8%) | 7 (29.2%) |
Employment Industries by Sex in Evansville
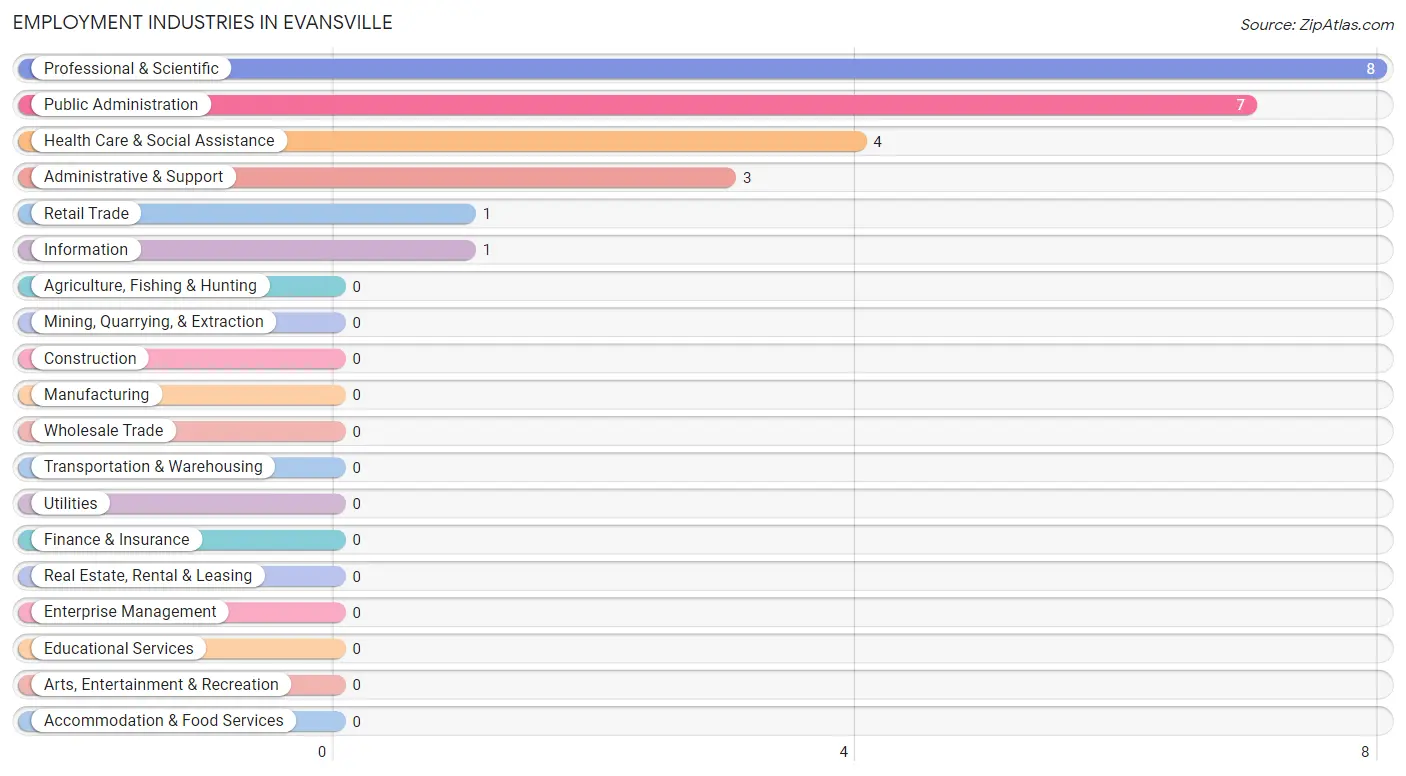
Employment Industries in Evansville
The major employment industries in Evansville include Professional & Scientific (8 | 33.3%), Public Administration (7 | 29.2%), Health Care & Social Assistance (4 | 16.7%), Administrative & Support (3 | 12.5%), and Retail Trade (1 | 4.2%).
Employment Industries by Sex in Evansville
The Evansville industries that see more men than women are Retail Trade (100.0%), Information (100.0%), and Professional & Scientific (100.0%), whereas the industries that tend to have a higher number of women are Health Care & Social Assistance (100.0%), and Public Administration (42.9%).
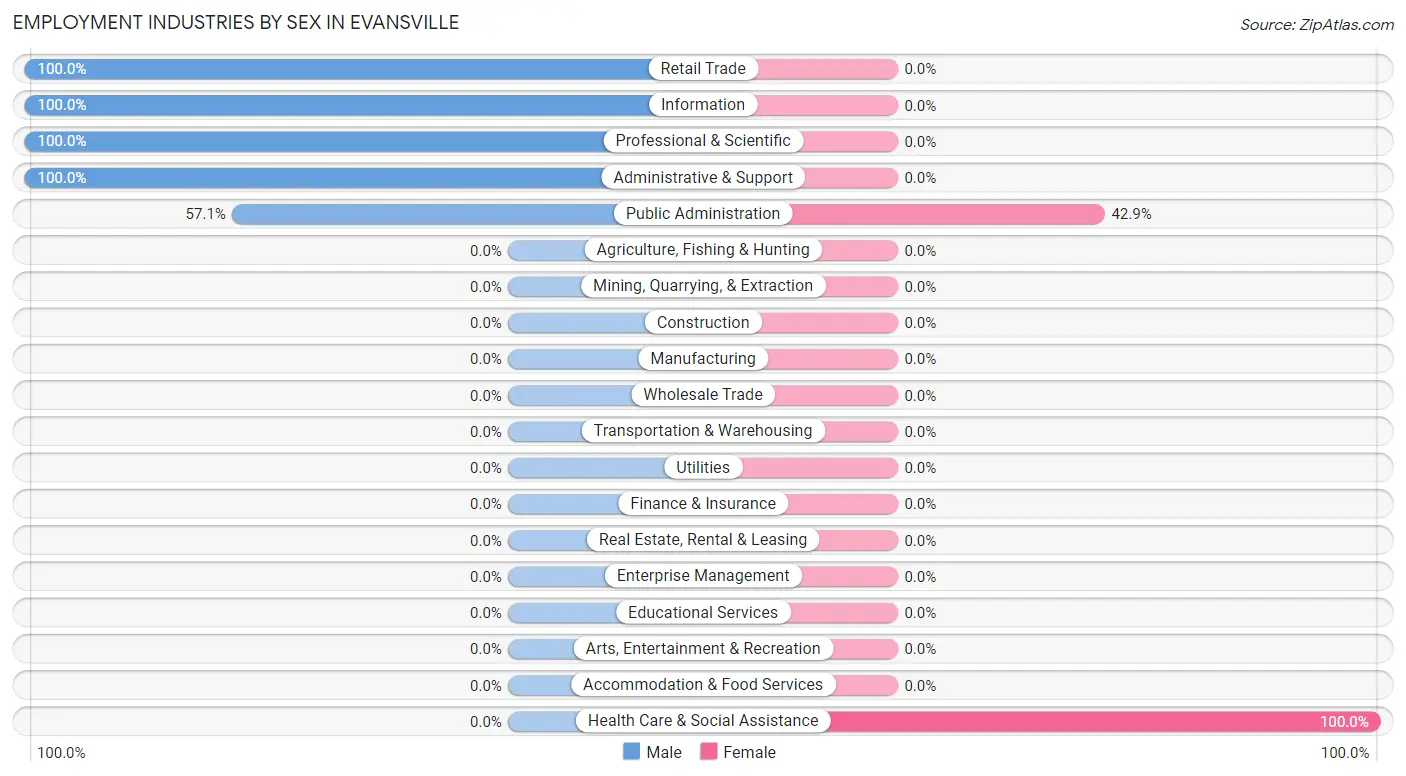
| Industry | Male | Female |
| Agriculture, Fishing & Hunting | 0 (0.0%) | 0 (0.0%) |
| Mining, Quarrying, & Extraction | 0 (0.0%) | 0 (0.0%) |
| Construction | 0 (0.0%) | 0 (0.0%) |
| Manufacturing | 0 (0.0%) | 0 (0.0%) |
| Wholesale Trade | 0 (0.0%) | 0 (0.0%) |
| Retail Trade | 1 (100.0%) | 0 (0.0%) |
| Transportation & Warehousing | 0 (0.0%) | 0 (0.0%) |
| Utilities | 0 (0.0%) | 0 (0.0%) |
| Information | 1 (100.0%) | 0 (0.0%) |
| Finance & Insurance | 0 (0.0%) | 0 (0.0%) |
| Real Estate, Rental & Leasing | 0 (0.0%) | 0 (0.0%) |
| Professional & Scientific | 8 (100.0%) | 0 (0.0%) |
| Enterprise Management | 0 (0.0%) | 0 (0.0%) |
| Administrative & Support | 3 (100.0%) | 0 (0.0%) |
| Educational Services | 0 (0.0%) | 0 (0.0%) |
| Health Care & Social Assistance | 0 (0.0%) | 4 (100.0%) |
| Arts, Entertainment & Recreation | 0 (0.0%) | 0 (0.0%) |
| Accommodation & Food Services | 0 (0.0%) | 0 (0.0%) |
| Public Administration | 4 (57.1%) | 3 (42.9%) |
| Total | 17 (70.8%) | 7 (29.2%) |
Education in Evansville
School Enrollment in Evansville
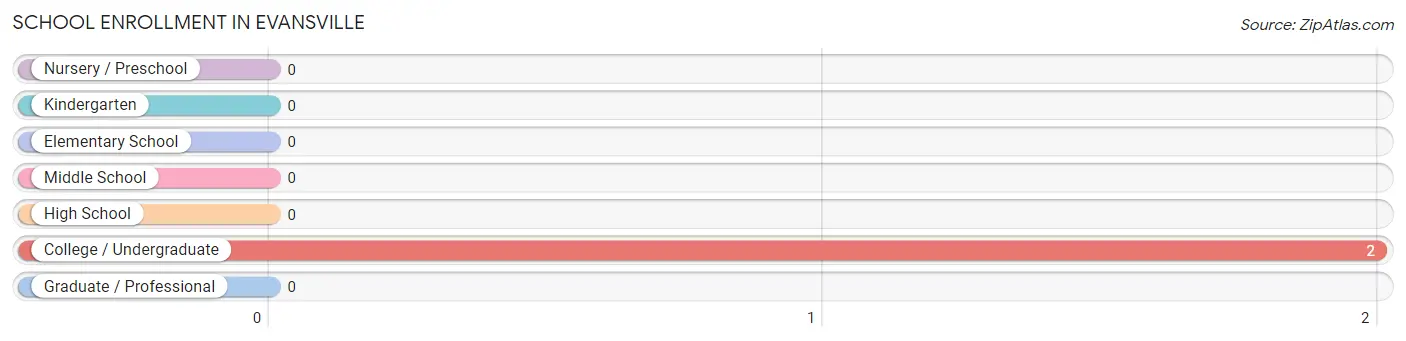
| School Level | # Students | % Students |
| Nursery / Preschool | 0 | 0.0% |
| Kindergarten | 0 | 0.0% |
| Elementary School | 0 | 0.0% |
| Middle School | 0 | 0.0% |
| High School | 0 | 0.0% |
| College / Undergraduate | 2 | 100.0% |
| Graduate / Professional | 0 | 0.0% |
| Total | 2 | 100.0% |
School Enrollment by Age by Funding Source in Evansville
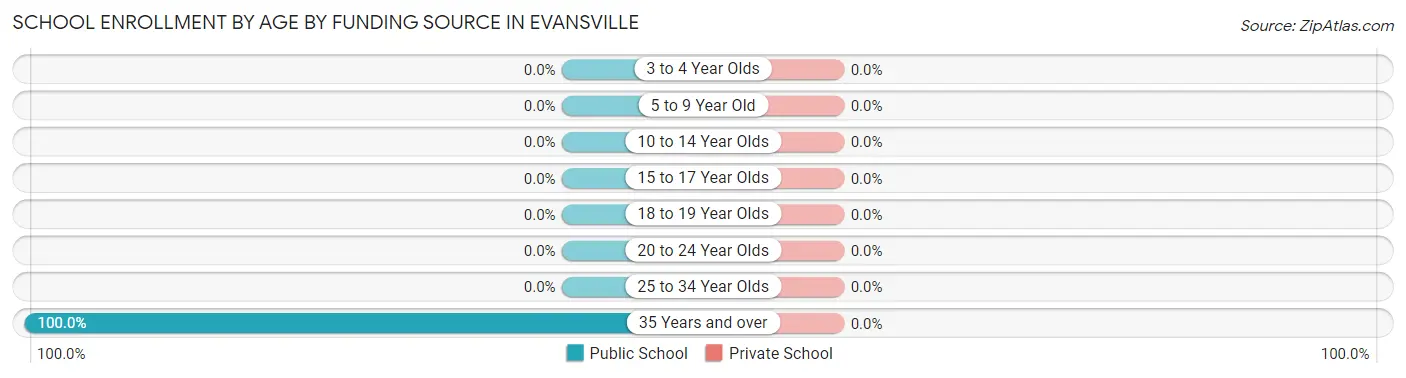
| Age Bracket | Public School | Private School |
| 3 to 4 Year Olds | 0 (0.0%) | 0 (0.0%) |
| 5 to 9 Year Old | 0 (0.0%) | 0 (0.0%) |
| 10 to 14 Year Olds | 0 (0.0%) | 0 (0.0%) |
| 15 to 17 Year Olds | 0 (0.0%) | 0 (0.0%) |
| 18 to 19 Year Olds | 0 (0.0%) | 0 (0.0%) |
| 20 to 24 Year Olds | 0 (0.0%) | 0 (0.0%) |
| 25 to 34 Year Olds | 0 (0.0%) | 0 (0.0%) |
| 35 Years and over | 2 (100.0%) | 0 (0.0%) |
| Total | 2 (100.0%) | 0 (0.0%) |
Educational Attainment by Field of Study in Evansville
Science & technology (3 | 30.0%), education (3 | 30.0%), bio, nature & agricultural (2 | 20.0%), and psychology (2 | 20.0%) are the most common fields of study among 10 individuals in Evansville who have obtained a bachelor's degree or higher.
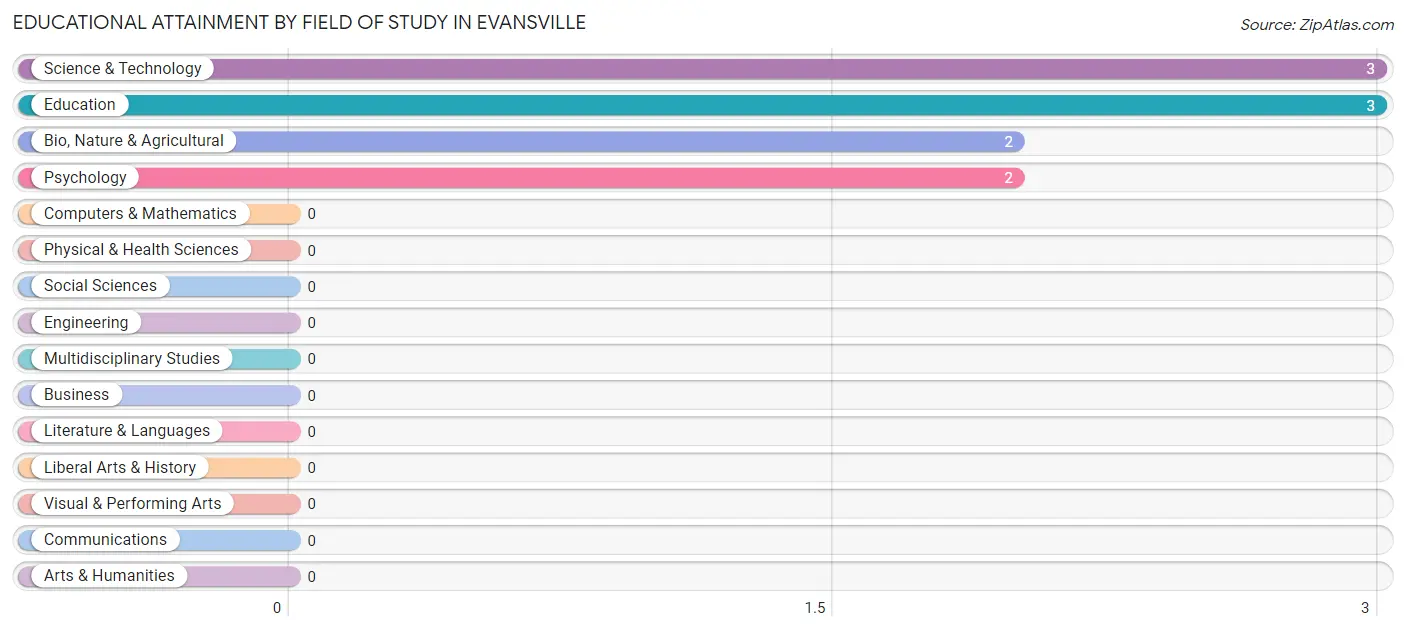
| Field of Study | # Graduates | % Graduates |
| Computers & Mathematics | 0 | 0.0% |
| Bio, Nature & Agricultural | 2 | 20.0% |
| Physical & Health Sciences | 0 | 0.0% |
| Psychology | 2 | 20.0% |
| Social Sciences | 0 | 0.0% |
| Engineering | 0 | 0.0% |
| Multidisciplinary Studies | 0 | 0.0% |
| Science & Technology | 3 | 30.0% |
| Business | 0 | 0.0% |
| Education | 3 | 30.0% |
| Literature & Languages | 0 | 0.0% |
| Liberal Arts & History | 0 | 0.0% |
| Visual & Performing Arts | 0 | 0.0% |
| Communications | 0 | 0.0% |
| Arts & Humanities | 0 | 0.0% |
| Total | 10 | 100.0% |
Transportation & Commute in Evansville
Vehicle Availability by Sex in Evansville
The most prevalent vehicle ownership categories in Evansville are males with 2 vehicles (4, accounting for 23.5%) and females with 2 vehicles (0, making up 57.1%).
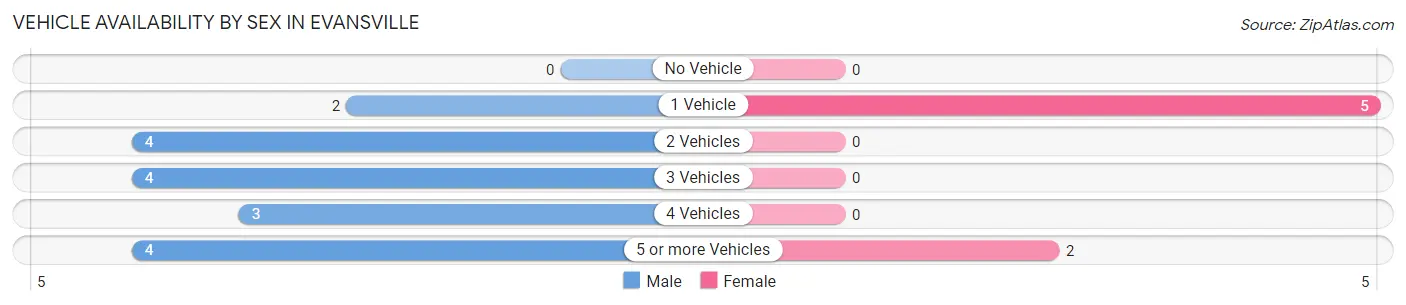
| Vehicles Available | Male | Female |
| No Vehicle | 0 (0.0%) | 0 (0.0%) |
| 1 Vehicle | 2 (11.8%) | 5 (71.4%) |
| 2 Vehicles | 4 (23.5%) | 0 (0.0%) |
| 3 Vehicles | 4 (23.5%) | 0 (0.0%) |
| 4 Vehicles | 3 (17.6%) | 0 (0.0%) |
| 5 or more Vehicles | 4 (23.5%) | 2 (28.6%) |
| Total | 17 (100.0%) | 7 (100.0%) |
Commute Time in Evansville
The most frequently occuring commute durations in Evansville are 5 to 9 minutes (11 commuters, 52.4%), less than 5 minutes (10 commuters, 47.6%), and 10 to 14 minutes (0 commuters, 0.0%).
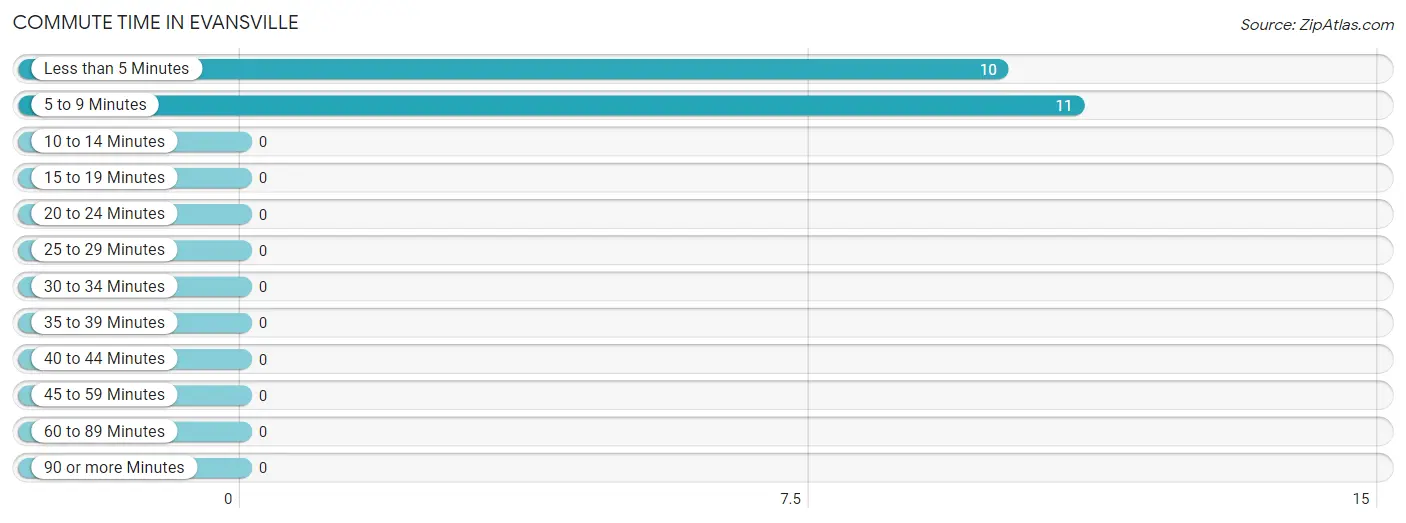
| Commute Time | # Commuters | % Commuters |
| Less than 5 Minutes | 10 | 47.6% |
| 5 to 9 Minutes | 11 | 52.4% |
| 10 to 14 Minutes | 0 | 0.0% |
| 15 to 19 Minutes | 0 | 0.0% |
| 20 to 24 Minutes | 0 | 0.0% |
| 25 to 29 Minutes | 0 | 0.0% |
| 30 to 34 Minutes | 0 | 0.0% |
| 35 to 39 Minutes | 0 | 0.0% |
| 40 to 44 Minutes | 0 | 0.0% |
| 45 to 59 Minutes | 0 | 0.0% |
| 60 to 89 Minutes | 0 | 0.0% |
| 90 or more Minutes | 0 | 0.0% |
Commute Time by Sex in Evansville
The most common commute times in Evansville are less than 5 minutes (8 commuters, 50.0%) for males and 5 to 9 minutes (3 commuters, 60.0%) for females.
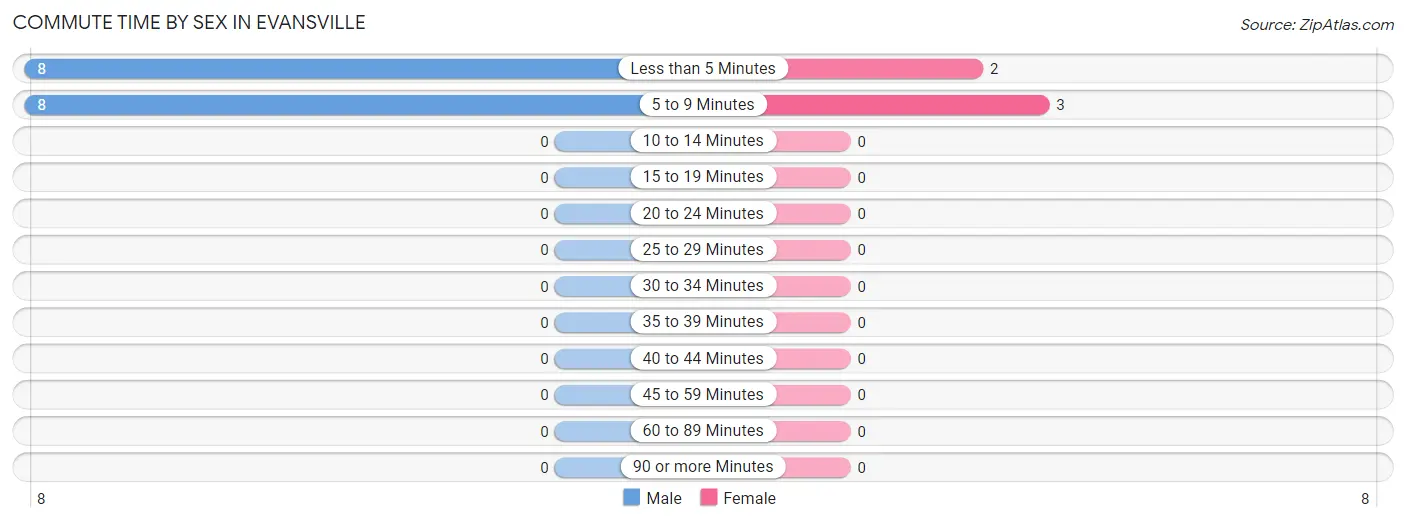
| Commute Time | Male | Female |
| Less than 5 Minutes | 8 (50.0%) | 2 (40.0%) |
| 5 to 9 Minutes | 8 (50.0%) | 3 (60.0%) |
| 10 to 14 Minutes | 0 (0.0%) | 0 (0.0%) |
| 15 to 19 Minutes | 0 (0.0%) | 0 (0.0%) |
| 20 to 24 Minutes | 0 (0.0%) | 0 (0.0%) |
| 25 to 29 Minutes | 0 (0.0%) | 0 (0.0%) |
| 30 to 34 Minutes | 0 (0.0%) | 0 (0.0%) |
| 35 to 39 Minutes | 0 (0.0%) | 0 (0.0%) |
| 40 to 44 Minutes | 0 (0.0%) | 0 (0.0%) |
| 45 to 59 Minutes | 0 (0.0%) | 0 (0.0%) |
| 60 to 89 Minutes | 0 (0.0%) | 0 (0.0%) |
| 90 or more Minutes | 0 (0.0%) | 0 (0.0%) |
Time of Departure to Work by Sex in Evansville
The most frequent times of departure to work in Evansville are 8:30 AM to 8:59 AM (5, 31.2%) for males and 9:00 AM to 9:59 AM (3, 60.0%) for females.
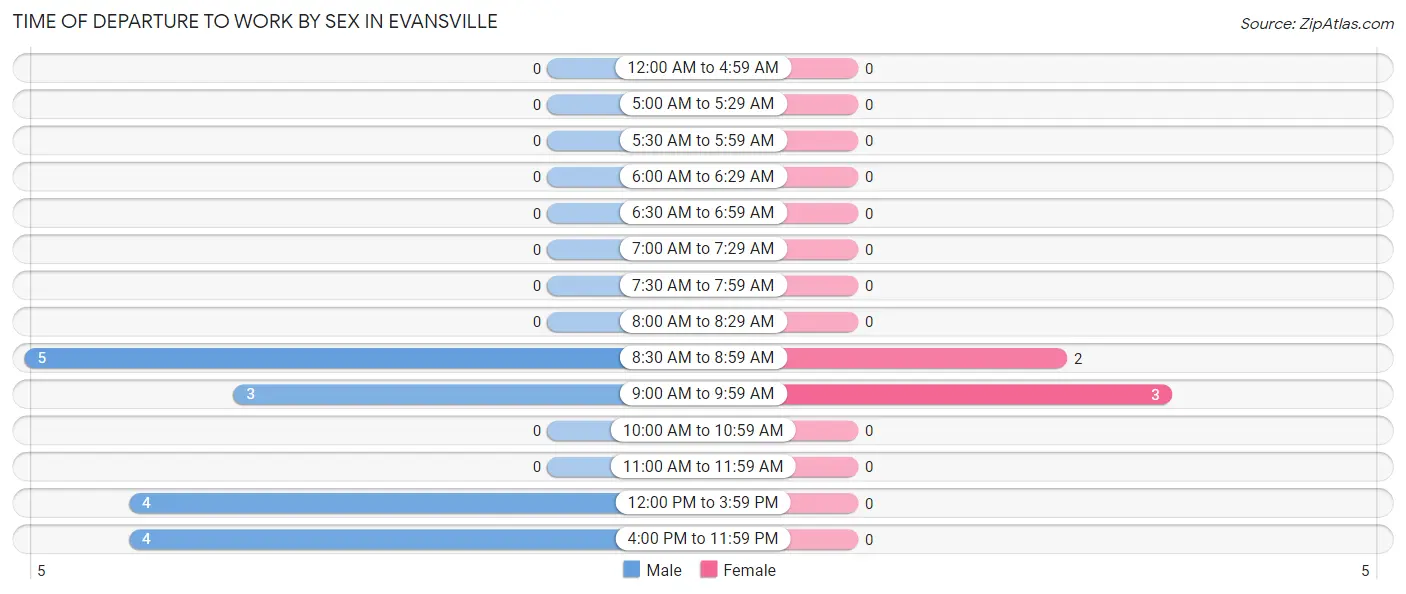
| Time of Departure | Male | Female |
| 12:00 AM to 4:59 AM | 0 (0.0%) | 0 (0.0%) |
| 5:00 AM to 5:29 AM | 0 (0.0%) | 0 (0.0%) |
| 5:30 AM to 5:59 AM | 0 (0.0%) | 0 (0.0%) |
| 6:00 AM to 6:29 AM | 0 (0.0%) | 0 (0.0%) |
| 6:30 AM to 6:59 AM | 0 (0.0%) | 0 (0.0%) |
| 7:00 AM to 7:29 AM | 0 (0.0%) | 0 (0.0%) |
| 7:30 AM to 7:59 AM | 0 (0.0%) | 0 (0.0%) |
| 8:00 AM to 8:29 AM | 0 (0.0%) | 0 (0.0%) |
| 8:30 AM to 8:59 AM | 5 (31.2%) | 2 (40.0%) |
| 9:00 AM to 9:59 AM | 3 (18.8%) | 3 (60.0%) |
| 10:00 AM to 10:59 AM | 0 (0.0%) | 0 (0.0%) |
| 11:00 AM to 11:59 AM | 0 (0.0%) | 0 (0.0%) |
| 12:00 PM to 3:59 PM | 4 (25.0%) | 0 (0.0%) |
| 4:00 PM to 11:59 PM | 4 (25.0%) | 0 (0.0%) |
| Total | 16 (100.0%) | 5 (100.0%) |
Housing Occupancy in Evansville
Occupancy by Ownership in Evansville
Of the total 20 dwellings in Evansville, owner-occupied units account for 12 (60.0%), while renter-occupied units make up 8 (40.0%).
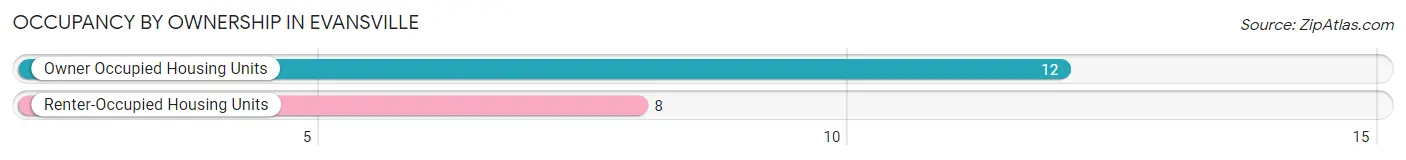
| Occupancy | # Housing Units | % Housing Units |
| Owner Occupied Housing Units | 12 | 60.0% |
| Renter-Occupied Housing Units | 8 | 40.0% |
| Total Occupied Housing Units | 20 | 100.0% |
Occupancy by Household Size in Evansville
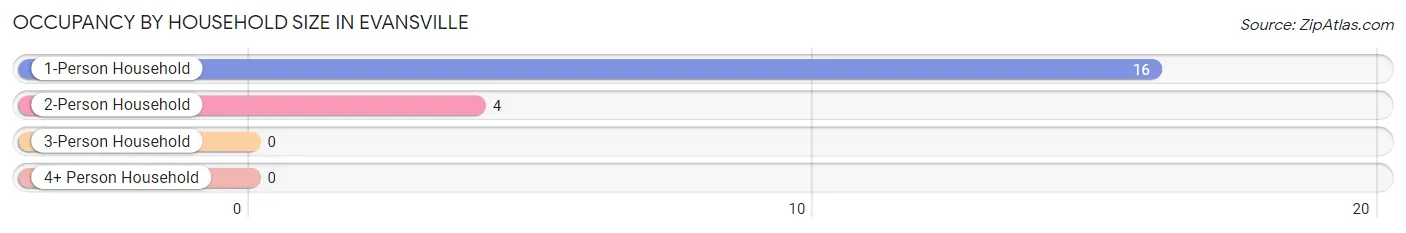
| Household Size | # Housing Units | % Housing Units |
| 1-Person Household | 16 | 80.0% |
| 2-Person Household | 4 | 20.0% |
| 3-Person Household | 0 | 0.0% |
| 4+ Person Household | 0 | 0.0% |
| Total Housing Units | 20 | 100.0% |
Occupancy by Ownership by Household Size in Evansville
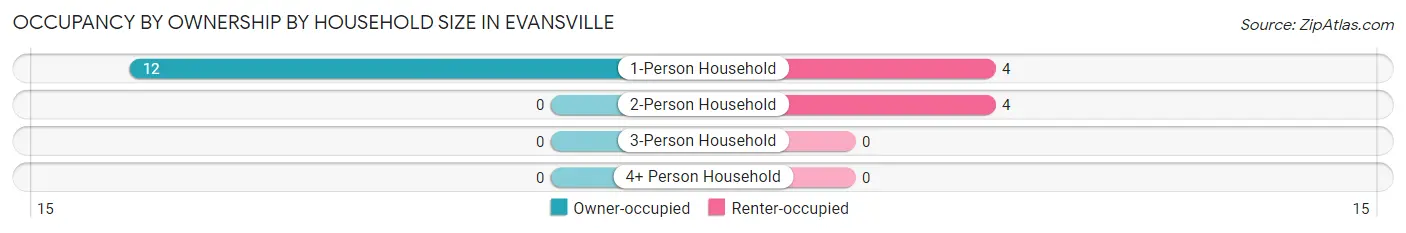
| Household Size | Owner-occupied | Renter-occupied |
| 1-Person Household | 12 (75.0%) | 4 (25.0%) |
| 2-Person Household | 0 (0.0%) | 4 (100.0%) |
| 3-Person Household | 0 (0.0%) | 0 (0.0%) |
| 4+ Person Household | 0 (0.0%) | 0 (0.0%) |
| Total Housing Units | 12 (60.0%) | 8 (40.0%) |
Occupancy by Educational Attainment in Evansville
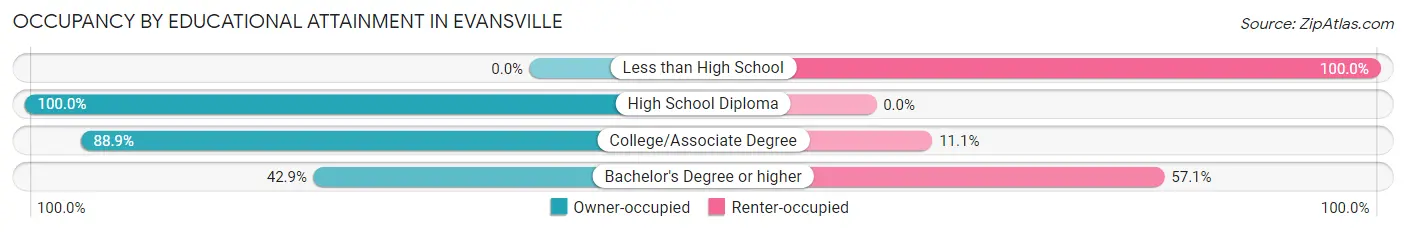
| Household Size | Owner-occupied | Renter-occupied |
| Less than High School | 0 (0.0%) | 3 (100.0%) |
| High School Diploma | 1 (100.0%) | 0 (0.0%) |
| College/Associate Degree | 8 (88.9%) | 1 (11.1%) |
| Bachelor's Degree or higher | 3 (42.9%) | 4 (57.1%) |
Occupancy by Age of Householder in Evansville
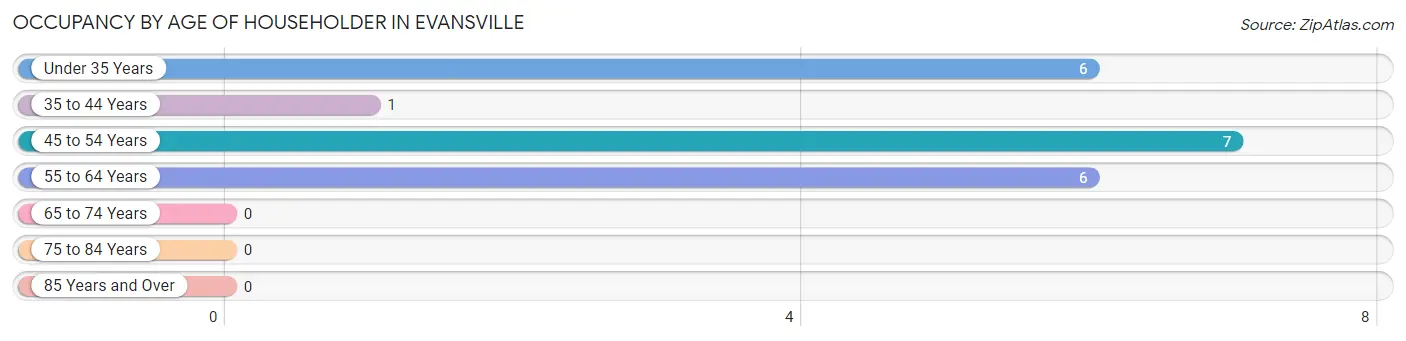
| Age Bracket | # Households | % Households |
| Under 35 Years | 6 | 30.0% |
| 35 to 44 Years | 1 | 5.0% |
| 45 to 54 Years | 7 | 35.0% |
| 55 to 64 Years | 6 | 30.0% |
| 65 to 74 Years | 0 | 0.0% |
| 75 to 84 Years | 0 | 0.0% |
| 85 Years and Over | 0 | 0.0% |
| Total | 20 | 100.0% |
Housing Finances in Evansville
Median Income by Occupancy in Evansville
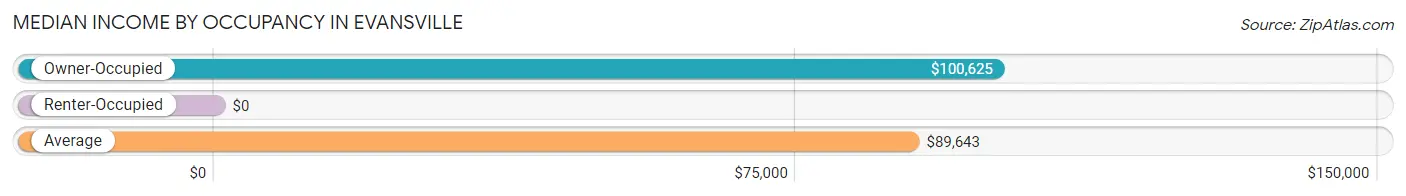
| Occupancy Type | # Households | Median Income |
| Owner-Occupied | 12 (60.0%) | $100,625 |
| Renter-Occupied | 8 (40.0%) | $0 |
| Average | 20 (100.0%) | $89,643 |
Occupancy by Householder Income Bracket in Evansville
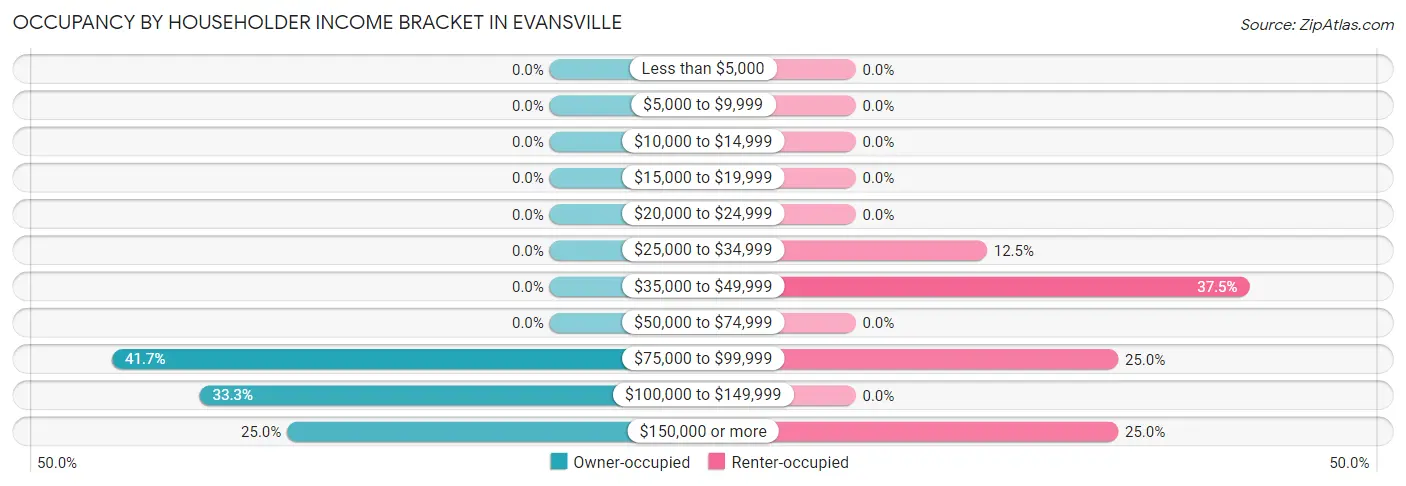
| Income Bracket | Owner-occupied | Renter-occupied |
| Less than $5,000 | 0 (0.0%) | 0 (0.0%) |
| $5,000 to $9,999 | 0 (0.0%) | 0 (0.0%) |
| $10,000 to $14,999 | 0 (0.0%) | 0 (0.0%) |
| $15,000 to $19,999 | 0 (0.0%) | 0 (0.0%) |
| $20,000 to $24,999 | 0 (0.0%) | 0 (0.0%) |
| $25,000 to $34,999 | 0 (0.0%) | 1 (12.5%) |
| $35,000 to $49,999 | 0 (0.0%) | 3 (37.5%) |
| $50,000 to $74,999 | 0 (0.0%) | 0 (0.0%) |
| $75,000 to $99,999 | 5 (41.7%) | 2 (25.0%) |
| $100,000 to $149,999 | 4 (33.3%) | 0 (0.0%) |
| $150,000 or more | 3 (25.0%) | 2 (25.0%) |
| Total | 12 (100.0%) | 8 (100.0%) |
Monthly Housing Cost Tiers in Evansville
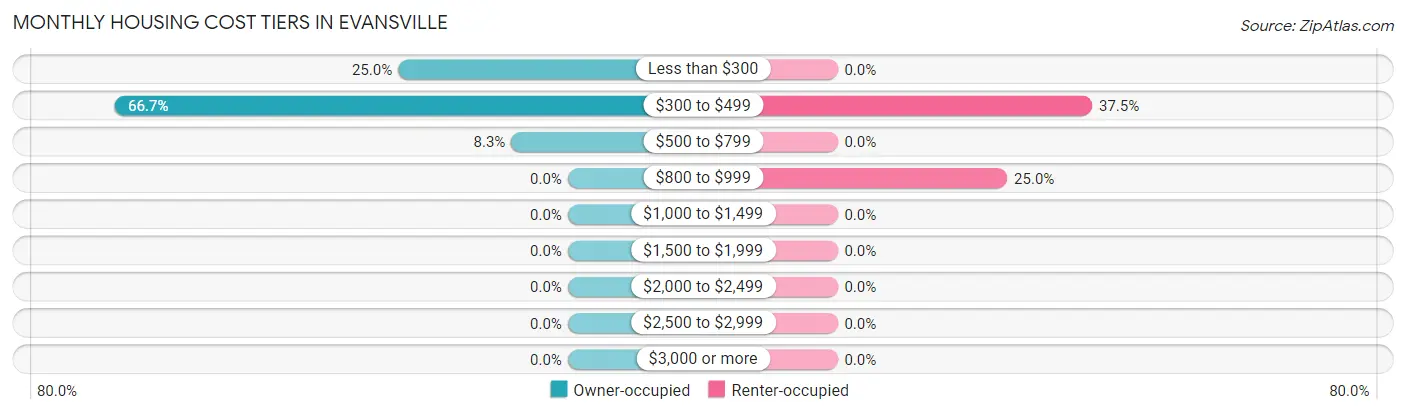
| Monthly Cost | Owner-occupied | Renter-occupied |
| Less than $300 | 3 (25.0%) | 0 (0.0%) |
| $300 to $499 | 8 (66.7%) | 3 (37.5%) |
| $500 to $799 | 1 (8.3%) | 0 (0.0%) |
| $800 to $999 | 0 (0.0%) | 2 (25.0%) |
| $1,000 to $1,499 | 0 (0.0%) | 0 (0.0%) |
| $1,500 to $1,999 | 0 (0.0%) | 0 (0.0%) |
| $2,000 to $2,499 | 0 (0.0%) | 0 (0.0%) |
| $2,500 to $2,999 | 0 (0.0%) | 0 (0.0%) |
| $3,000 or more | 0 (0.0%) | 0 (0.0%) |
| Total | 12 (100.0%) | 8 (100.0%) |
Physical Housing Characteristics in Evansville
Housing Structures in Evansville
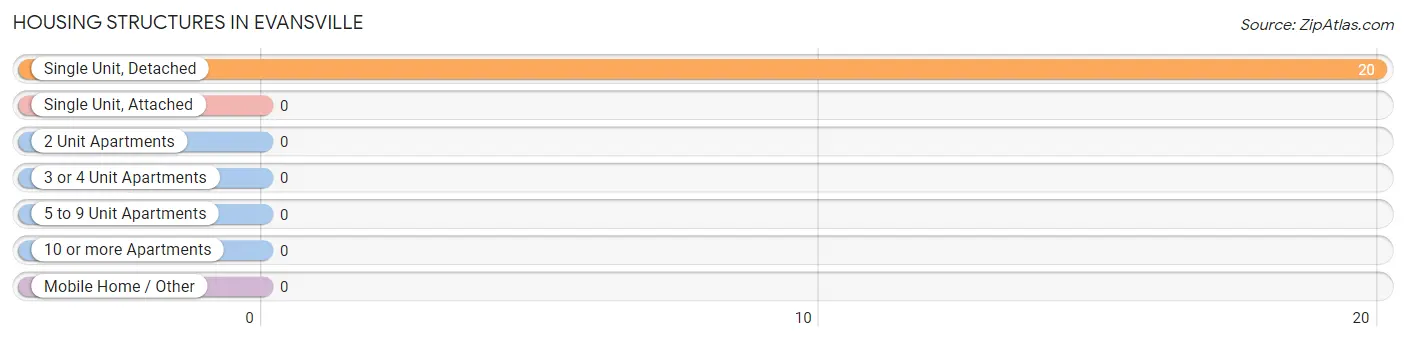
| Structure Type | # Housing Units | % Housing Units |
| Single Unit, Detached | 20 | 100.0% |
| Single Unit, Attached | 0 | 0.0% |
| 2 Unit Apartments | 0 | 0.0% |
| 3 or 4 Unit Apartments | 0 | 0.0% |
| 5 to 9 Unit Apartments | 0 | 0.0% |
| 10 or more Apartments | 0 | 0.0% |
| Mobile Home / Other | 0 | 0.0% |
| Total | 20 | 100.0% |
Housing Structures by Occupancy in Evansville
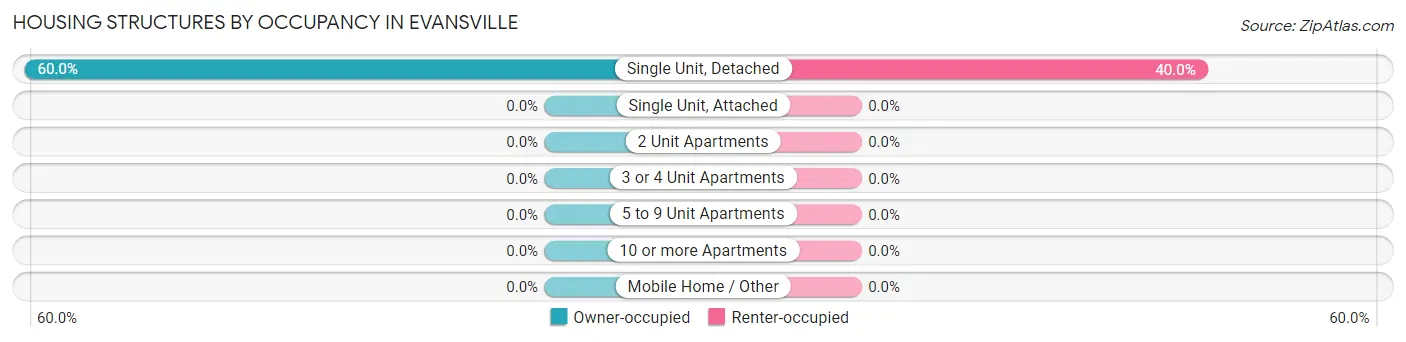
| Structure Type | Owner-occupied | Renter-occupied |
| Single Unit, Detached | 12 (60.0%) | 8 (40.0%) |
| Single Unit, Attached | 0 (0.0%) | 0 (0.0%) |
| 2 Unit Apartments | 0 (0.0%) | 0 (0.0%) |
| 3 or 4 Unit Apartments | 0 (0.0%) | 0 (0.0%) |
| 5 to 9 Unit Apartments | 0 (0.0%) | 0 (0.0%) |
| 10 or more Apartments | 0 (0.0%) | 0 (0.0%) |
| Mobile Home / Other | 0 (0.0%) | 0 (0.0%) |
| Total | 12 (60.0%) | 8 (40.0%) |
Housing Structures by Number of Rooms in Evansville
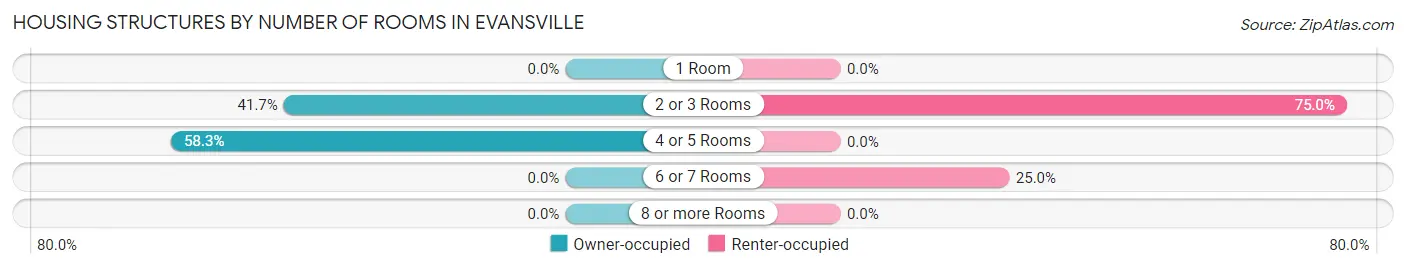
| Number of Rooms | Owner-occupied | Renter-occupied |
| 1 Room | 0 (0.0%) | 0 (0.0%) |
| 2 or 3 Rooms | 5 (41.7%) | 6 (75.0%) |
| 4 or 5 Rooms | 7 (58.3%) | 0 (0.0%) |
| 6 or 7 Rooms | 0 (0.0%) | 2 (25.0%) |
| 8 or more Rooms | 0 (0.0%) | 0 (0.0%) |
| Total | 12 (100.0%) | 8 (100.0%) |
Housing Structure by Heating Type in Evansville
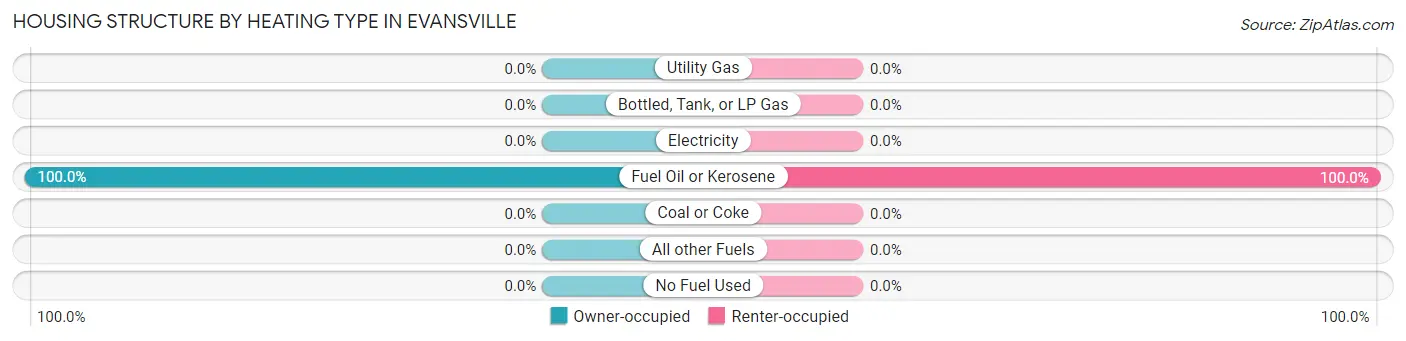
| Heating Type | Owner-occupied | Renter-occupied |
| Utility Gas | 0 (0.0%) | 0 (0.0%) |
| Bottled, Tank, or LP Gas | 0 (0.0%) | 0 (0.0%) |
| Electricity | 0 (0.0%) | 0 (0.0%) |
| Fuel Oil or Kerosene | 12 (100.0%) | 8 (100.0%) |
| Coal or Coke | 0 (0.0%) | 0 (0.0%) |
| All other Fuels | 0 (0.0%) | 0 (0.0%) |
| No Fuel Used | 0 (0.0%) | 0 (0.0%) |
| Total | 12 (100.0%) | 8 (100.0%) |
Household Vehicle Usage in Evansville
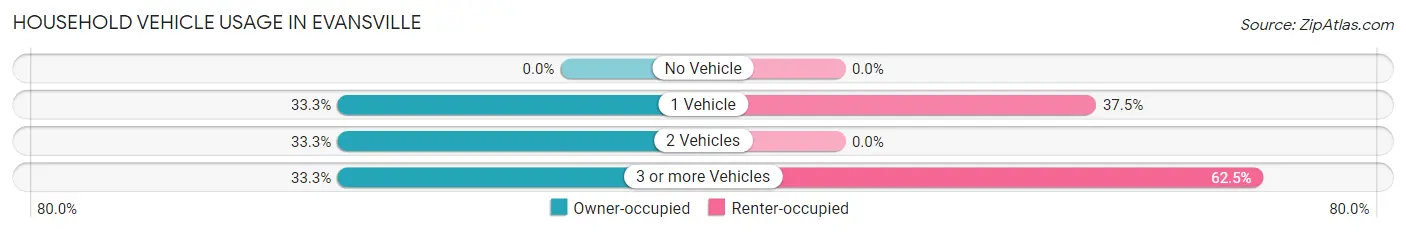
| Vehicles per Household | Owner-occupied | Renter-occupied |
| No Vehicle | 0 (0.0%) | 0 (0.0%) |
| 1 Vehicle | 4 (33.3%) | 3 (37.5%) |
| 2 Vehicles | 4 (33.3%) | 0 (0.0%) |
| 3 or more Vehicles | 4 (33.3%) | 5 (62.5%) |
| Total | 12 (100.0%) | 8 (100.0%) |
Real Estate & Mortgages in Evansville
Real Estate and Mortgage Overview in Evansville
| Characteristic | Without Mortgage | With Mortgage |
| Housing Units | 12 | 0 |
| Median Property Value | $76,700 | $0 |
| Median Household Income | $100,625 | $0 |
| Monthly Housing Costs | $338 | $0 |
| Real Estate Taxes | - | - |
Property Value by Mortgage Status in Evansville
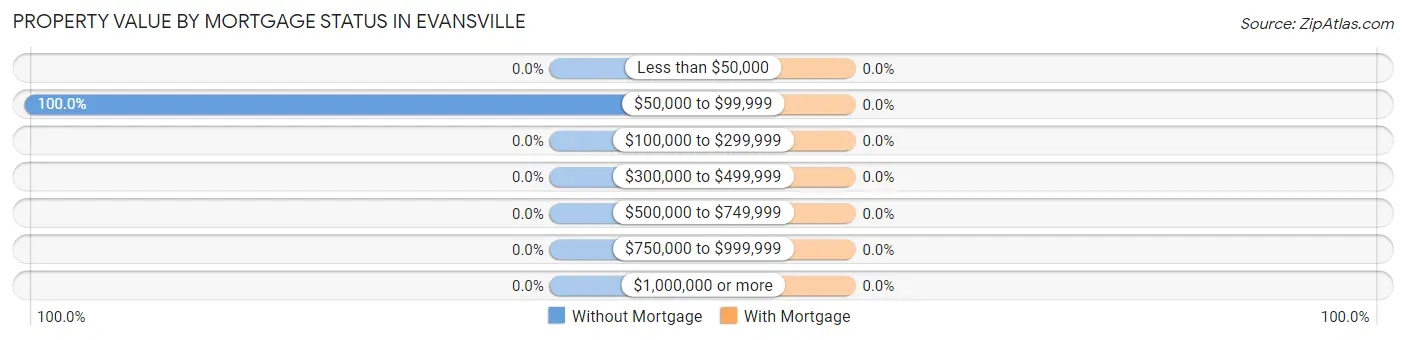
| Property Value | Without Mortgage | With Mortgage |
| Less than $50,000 | 0 (0.0%) | 0 (0.0%) |
| $50,000 to $99,999 | 12 (100.0%) | 0 (0.0%) |
| $100,000 to $299,999 | 0 (0.0%) | 0 (0.0%) |
| $300,000 to $499,999 | 0 (0.0%) | 0 (0.0%) |
| $500,000 to $749,999 | 0 (0.0%) | 0 (0.0%) |
| $750,000 to $999,999 | 0 (0.0%) | 0 (0.0%) |
| $1,000,000 or more | 0 (0.0%) | 0 (0.0%) |
| Total | 12 (100.0%) | 0 (0.0%) |
Household Income by Mortgage Status in Evansville
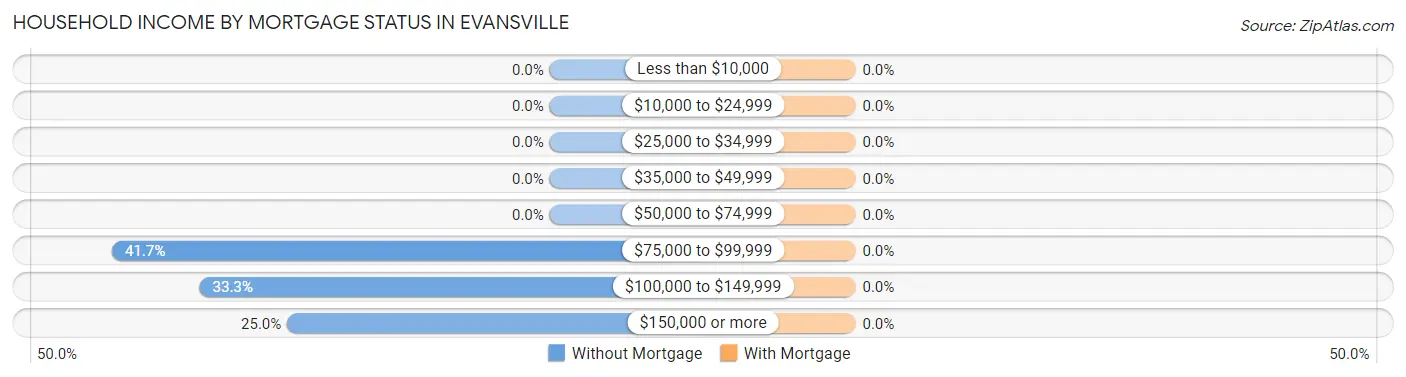
| Household Income | Without Mortgage | With Mortgage |
| Less than $10,000 | 0 (0.0%) | 0 (0.0%) |
| $10,000 to $24,999 | 0 (0.0%) | 0 (0.0%) |
| $25,000 to $34,999 | 0 (0.0%) | 0 (0.0%) |
| $35,000 to $49,999 | 0 (0.0%) | 0 (0.0%) |
| $50,000 to $74,999 | 0 (0.0%) | 0 (0.0%) |
| $75,000 to $99,999 | 5 (41.7%) | 0 (0.0%) |
| $100,000 to $149,999 | 4 (33.3%) | 0 (0.0%) |
| $150,000 or more | 3 (25.0%) | 0 (0.0%) |
| Total | 12 (100.0%) | 0 (0.0%) |
Property Value to Household Income Ratio in Evansville
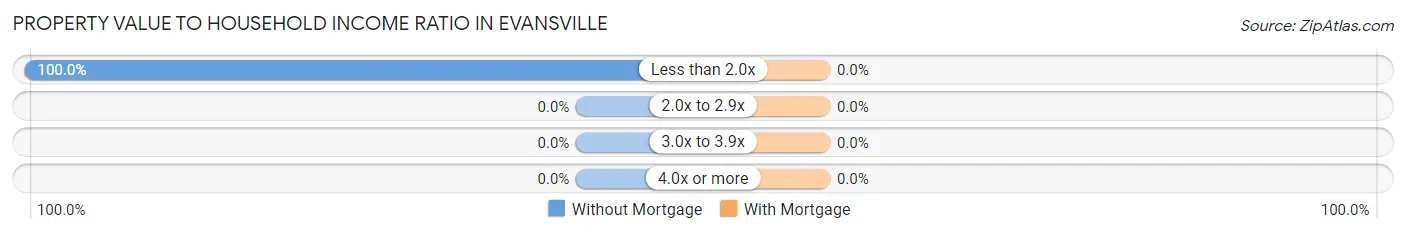
| Value-to-Income Ratio | Without Mortgage | With Mortgage |
| Less than 2.0x | 12 (100.0%) | 0 (0.0%) |
| 2.0x to 2.9x | 0 (0.0%) | 0 (0.0%) |
| 3.0x to 3.9x | 0 (0.0%) | 0 (0.0%) |
| 4.0x or more | 0 (0.0%) | 0 (0.0%) |
| Total | 12 (100.0%) | 0 (0.0%) |
Real Estate Taxes by Mortgage Status in Evansville
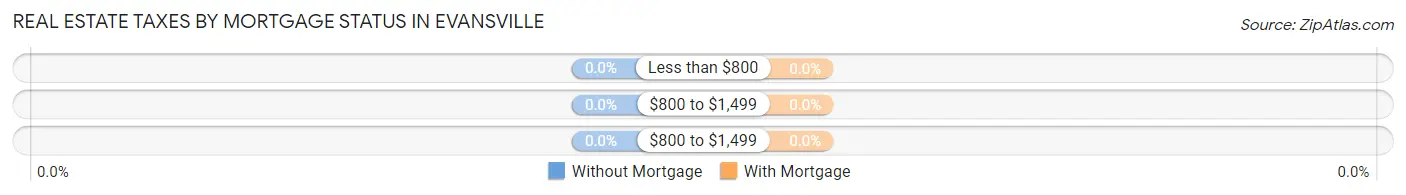
| Property Taxes | Without Mortgage | With Mortgage |
| Less than $800 | 0 (0.0%) | 0 (0.0%) |
| $800 to $1,499 | 0 (0.0%) | 0 (0.0%) |
| $800 to $1,499 | 0 (0.0%) | 0 (0.0%) |
| Total | 12 (100.0%) | 0 (0.0%) |
Health & Disability in Evansville
Health Insurance Coverage by Age in Evansville
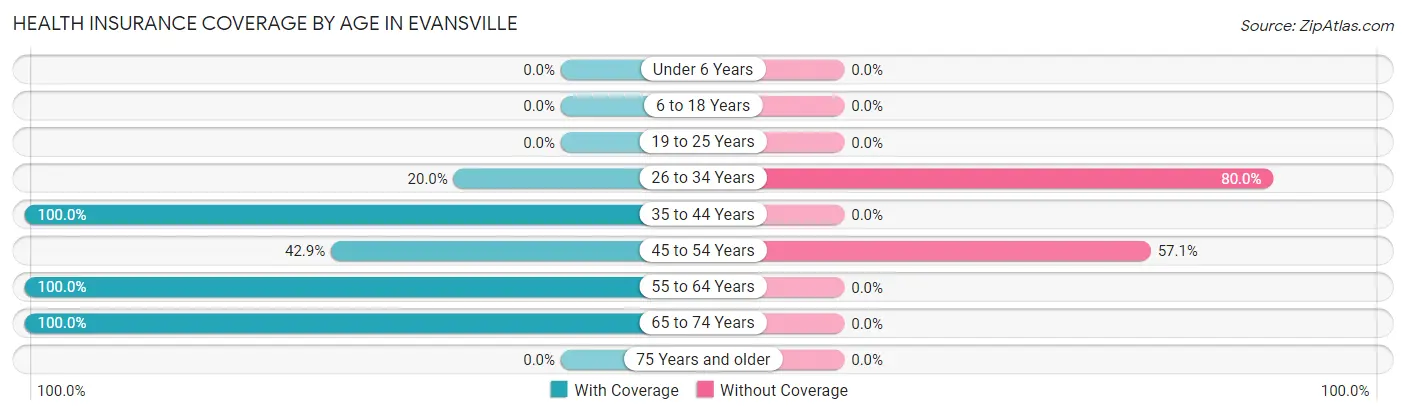
| Age Bracket | With Coverage | Without Coverage |
| Under 6 Years | 0 (0.0%) | 0 (0.0%) |
| 6 to 18 Years | 0 (0.0%) | 0 (0.0%) |
| 19 to 25 Years | 0 (0.0%) | 0 (0.0%) |
| 26 to 34 Years | 2 (20.0%) | 8 (80.0%) |
| 35 to 44 Years | 1 (100.0%) | 0 (0.0%) |
| 45 to 54 Years | 3 (42.9%) | 4 (57.1%) |
| 55 to 64 Years | 6 (100.0%) | 0 (0.0%) |
| 65 to 74 Years | 3 (100.0%) | 0 (0.0%) |
| 75 Years and older | 0 (0.0%) | 0 (0.0%) |
| Total | 15 (55.6%) | 12 (44.4%) |
Health Insurance Coverage by Citizenship Status in Evansville
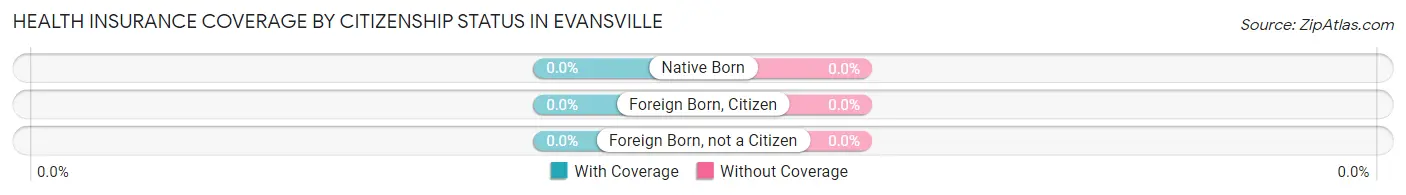
| Citizenship Status | With Coverage | Without Coverage |
| Native Born | 0 (0.0%) | 0 (0.0%) |
| Foreign Born, Citizen | 0 (0.0%) | 0 (0.0%) |
| Foreign Born, not a Citizen | 0 (0.0%) | 0 (0.0%) |
Health Insurance Coverage by Household Income in Evansville
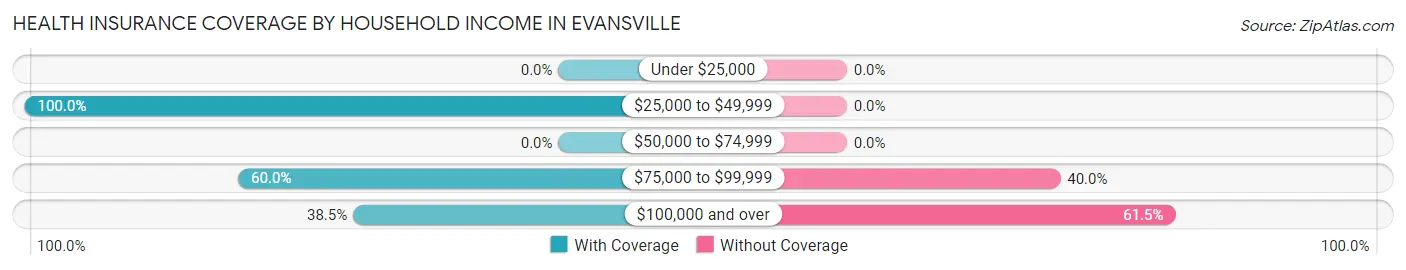
| Household Income | With Coverage | Without Coverage |
| Under $25,000 | 0 (0.0%) | 0 (0.0%) |
| $25,000 to $49,999 | 4 (100.0%) | 0 (0.0%) |
| $50,000 to $74,999 | 0 (0.0%) | 0 (0.0%) |
| $75,000 to $99,999 | 6 (60.0%) | 4 (40.0%) |
| $100,000 and over | 5 (38.5%) | 8 (61.5%) |
Public vs Private Health Insurance Coverage by Age in Evansville
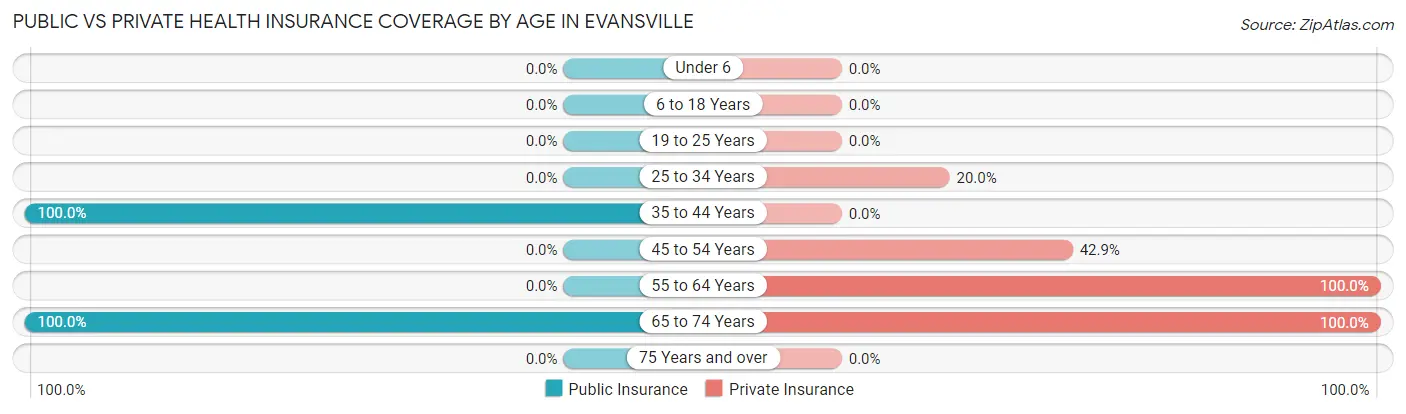
| Age Bracket | Public Insurance | Private Insurance |
| Under 6 | 0 (0.0%) | 0 (0.0%) |
| 6 to 18 Years | 0 (0.0%) | 0 (0.0%) |
| 19 to 25 Years | 0 (0.0%) | 0 (0.0%) |
| 25 to 34 Years | 0 (0.0%) | 2 (20.0%) |
| 35 to 44 Years | 1 (100.0%) | 0 (0.0%) |
| 45 to 54 Years | 0 (0.0%) | 3 (42.9%) |
| 55 to 64 Years | 0 (0.0%) | 6 (100.0%) |
| 65 to 74 Years | 3 (100.0%) | 3 (100.0%) |
| 75 Years and over | 0 (0.0%) | 0 (0.0%) |
| Total | 4 (14.8%) | 14 (51.8%) |
Disability Status by Sex by Age in Evansville
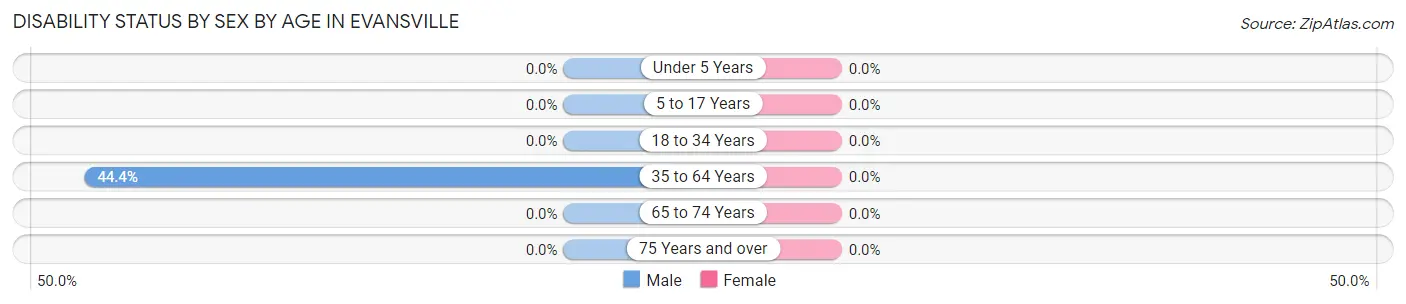
| Age Bracket | Male | Female |
| Under 5 Years | 0 (0.0%) | 0 (0.0%) |
| 5 to 17 Years | 0 (0.0%) | 0 (0.0%) |
| 18 to 34 Years | 0 (0.0%) | 0 (0.0%) |
| 35 to 64 Years | 4 (44.4%) | 0 (0.0%) |
| 65 to 74 Years | 0 (0.0%) | 0 (0.0%) |
| 75 Years and over | 0 (0.0%) | 0 (0.0%) |
Disability Class by Sex by Age in Evansville
Disability Class: Hearing Difficulty
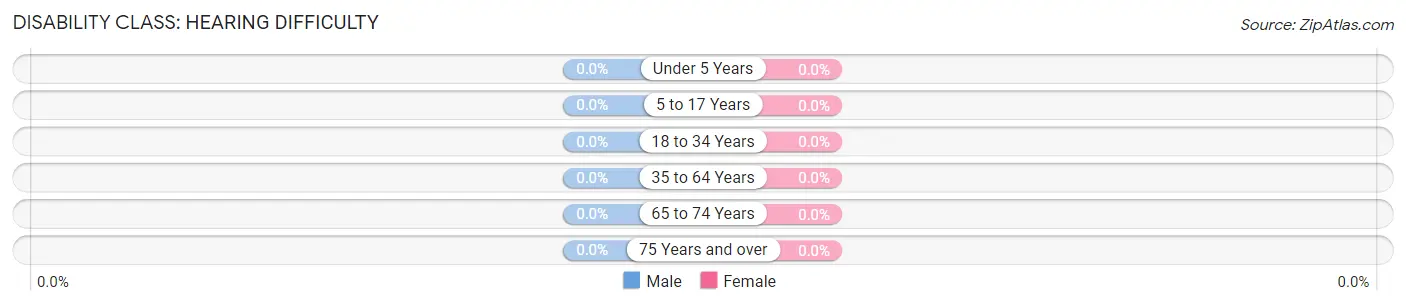
| Age Bracket | Male | Female |
| Under 5 Years | 0 (0.0%) | 0 (0.0%) |
| 5 to 17 Years | 0 (0.0%) | 0 (0.0%) |
| 18 to 34 Years | 0 (0.0%) | 0 (0.0%) |
| 35 to 64 Years | 0 (0.0%) | 0 (0.0%) |
| 65 to 74 Years | 0 (0.0%) | 0 (0.0%) |
| 75 Years and over | 0 (0.0%) | 0 (0.0%) |
Disability Class: Vision Difficulty
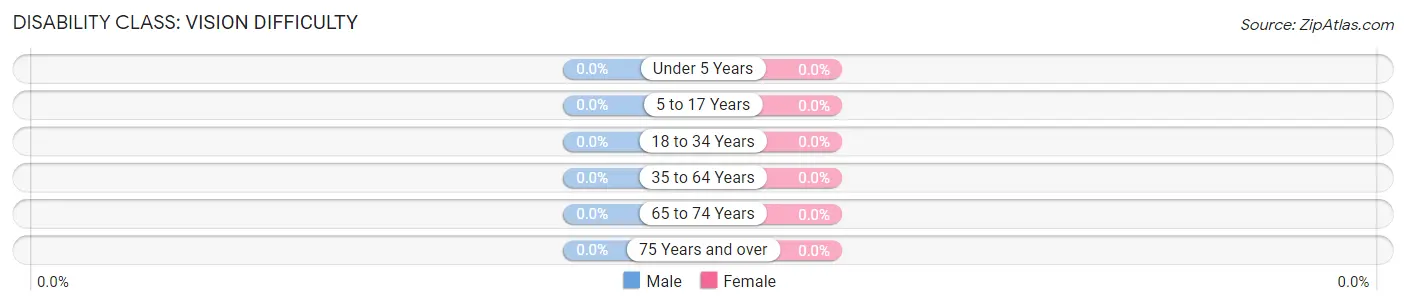
| Age Bracket | Male | Female |
| Under 5 Years | 0 (0.0%) | 0 (0.0%) |
| 5 to 17 Years | 0 (0.0%) | 0 (0.0%) |
| 18 to 34 Years | 0 (0.0%) | 0 (0.0%) |
| 35 to 64 Years | 0 (0.0%) | 0 (0.0%) |
| 65 to 74 Years | 0 (0.0%) | 0 (0.0%) |
| 75 Years and over | 0 (0.0%) | 0 (0.0%) |
Disability Class: Cognitive Difficulty
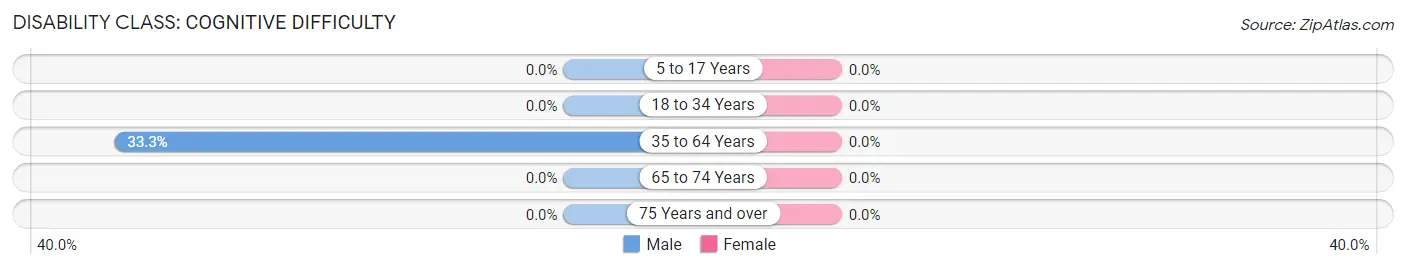
| Age Bracket | Male | Female |
| 5 to 17 Years | 0 (0.0%) | 0 (0.0%) |
| 18 to 34 Years | 0 (0.0%) | 0 (0.0%) |
| 35 to 64 Years | 3 (33.3%) | 0 (0.0%) |
| 65 to 74 Years | 0 (0.0%) | 0 (0.0%) |
| 75 Years and over | 0 (0.0%) | 0 (0.0%) |
Disability Class: Ambulatory Difficulty
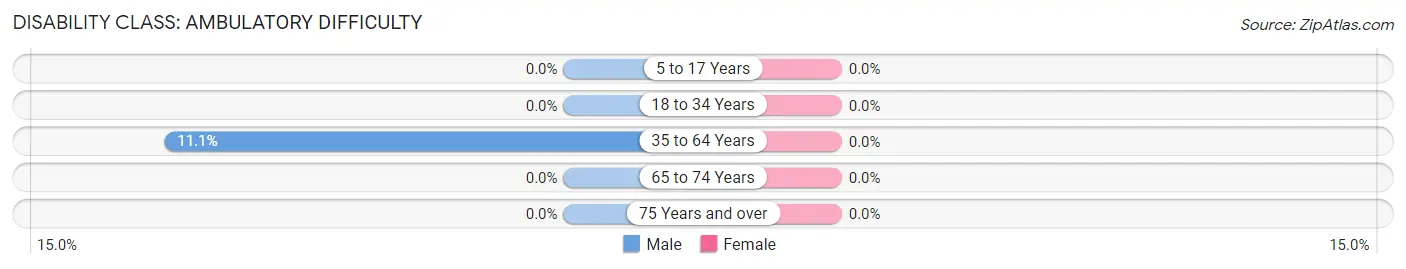
| Age Bracket | Male | Female |
| 5 to 17 Years | 0 (0.0%) | 0 (0.0%) |
| 18 to 34 Years | 0 (0.0%) | 0 (0.0%) |
| 35 to 64 Years | 1 (11.1%) | 0 (0.0%) |
| 65 to 74 Years | 0 (0.0%) | 0 (0.0%) |
| 75 Years and over | 0 (0.0%) | 0 (0.0%) |
Disability Class: Self-Care Difficulty
| Age Bracket | Male | Female |
| 5 to 17 Years | 0 (0.0%) | 0 (0.0%) |
| 18 to 34 Years | 0 (0.0%) | 0 (0.0%) |
| 35 to 64 Years | 0 (0.0%) | 0 (0.0%) |
| 65 to 74 Years | 0 (0.0%) | 0 (0.0%) |
| 75 Years and over | 0 (0.0%) | 0 (0.0%) |
Technology Access in Evansville
Computing Device Access in Evansville
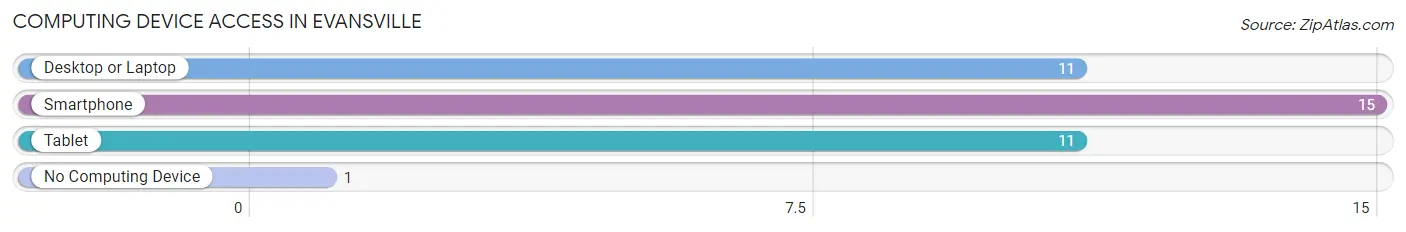
| Device Type | # Households | % Households |
| Desktop or Laptop | 11 | 55.0% |
| Smartphone | 15 | 75.0% |
| Tablet | 11 | 55.0% |
| No Computing Device | 1 | 5.0% |
| Total | 20 | 100.0% |
Internet Access in Evansville
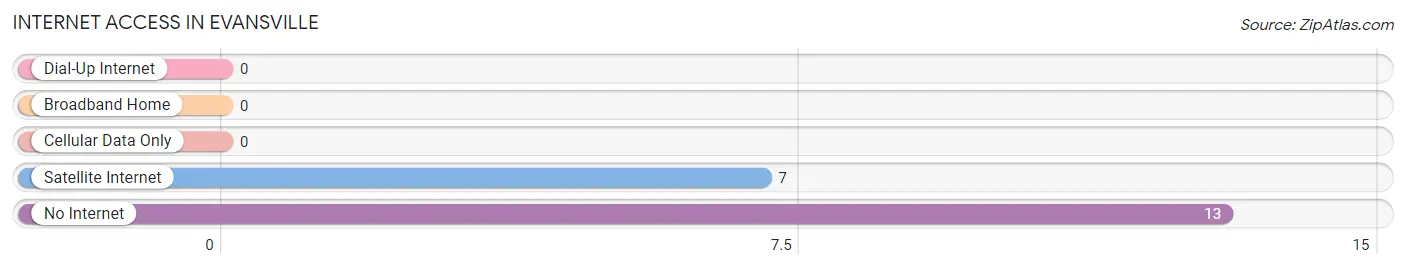
| Internet Type | # Households | % Households |
| Dial-Up Internet | 0 | 0.0% |
| Broadband Home | 0 | 0.0% |
| Cellular Data Only | 0 | 0.0% |
| Satellite Internet | 7 | 35.0% |
| No Internet | 13 | 65.0% |
| Total | 20 | 100.0% |
Evansville Summary
Evansville is a city located in the state of Alaska, United States. It is the county seat of the Unorganized Borough of Alaska, and is the largest city in the state. The city is located on the banks of the Chena River, and is home to a population of approximately 4,000 people.
History
The area that is now Evansville was first inhabited by the Tanana Athabascans, who were the first people to settle in the area. The Tanana Athabascans were a nomadic people who lived off the land, hunting and fishing for their sustenance. The first Europeans to arrive in the area were Russian fur traders, who established a trading post in the area in 1847. The trading post was named Fort St. Michael, and was the first permanent settlement in the area.
In 1867, the United States purchased Alaska from Russia, and the area became part of the United States. In 1885, the town of Evansville was founded by William Evans, who named the town after himself. The town quickly grew, and by 1900, it had a population of over 1,000 people.
Geography
Evansville is located in the interior of Alaska, in the Unorganized Borough of Alaska. The city is situated on the banks of the Chena River, and is surrounded by mountains and forests. The city is located approximately 100 miles north of Fairbanks, and is the largest city in the Unorganized Borough.
The climate in Evansville is subarctic, with cold winters and mild summers. The average temperature in the summer is around 50°F, and the average temperature in the winter is around -20°F. The city receives an average of 20 inches of precipitation per year, with most of it falling in the form of snow.
Economy
The economy of Evansville is largely based on the oil and gas industry. The city is home to several oil and gas companies, and is a major hub for the industry in Alaska. The city is also home to several manufacturing companies, and is a major center for the production of aircraft parts.
The city is also home to several tourist attractions, including the Chena Hot Springs Resort, the Chena River State Recreation Area, and the University of Alaska Fairbanks. Tourism is a major contributor to the city’s economy, and the city is home to several hotels and restaurants.
Demographics
As of the 2010 census, the population of Evansville was 4,000 people. The racial makeup of the city was 75.3% White, 0.7% African American, 11.2% Native American, 0.7% Asian, 0.2% Pacific Islander, and 11.6% from other races. The median household income in the city was $50,000, and the median family income was $60,000.
The city is home to several religious denominations, including Catholic, Protestant, and Orthodox Christian. The city is also home to several Native American tribes, including the Tanana Athabascans, the Koyukon, and the Inupiat.
Conclusion
Evansville is a city located in the Unorganized Borough of Alaska, United States. The city is located on the banks of the Chena River, and is home to a population of approximately 4,000 people. The economy of the city is largely based on the oil and gas industry, and the city is also home to several tourist attractions. The city is home to several religious denominations, and is also home to several Native American tribes.
Common Questions
What is Per Capita Income in Evansville?
Per Capita income in Evansville is $89,067.
What is the Median Household income in Evansville?
Median Household Income in Evansville is $89,643.
What is Inequality or Gini Index in Evansville?
Inequality or Gini Index in Evansville is 0.28.
What is the Total Population of Evansville?
Total Population of Evansville is 27.
What is the Total Male Population of Evansville?
Total Male Population of Evansville is 20.
What is the Total Female Population of Evansville?
Total Female Population of Evansville is 7.
What is the Ratio of Males per 100 Females in Evansville?
There are 285.71 Males per 100 Females in Evansville.
What is the Ratio of Females per 100 Males in Evansville?
There are 35.00 Females per 100 Males in Evansville.
What is the Median Population Age in Evansville?
Median Population Age in Evansville is 49.6 Years.
What is the Average Family Size in Evansville
Average Family Size in Evansville is 2.5 People.
What is the Average Household Size in Evansville
Average Household Size in Evansville is 1.4 People.
How Large is the Labor Force in Evansville?
There are 24 People in the Labor Forcein in Evansville.
What is the Percentage of People in the Labor Force in Evansville?
88.9% of People are in the Labor Force in Evansville.