Neskowin, OR Map & Demographics
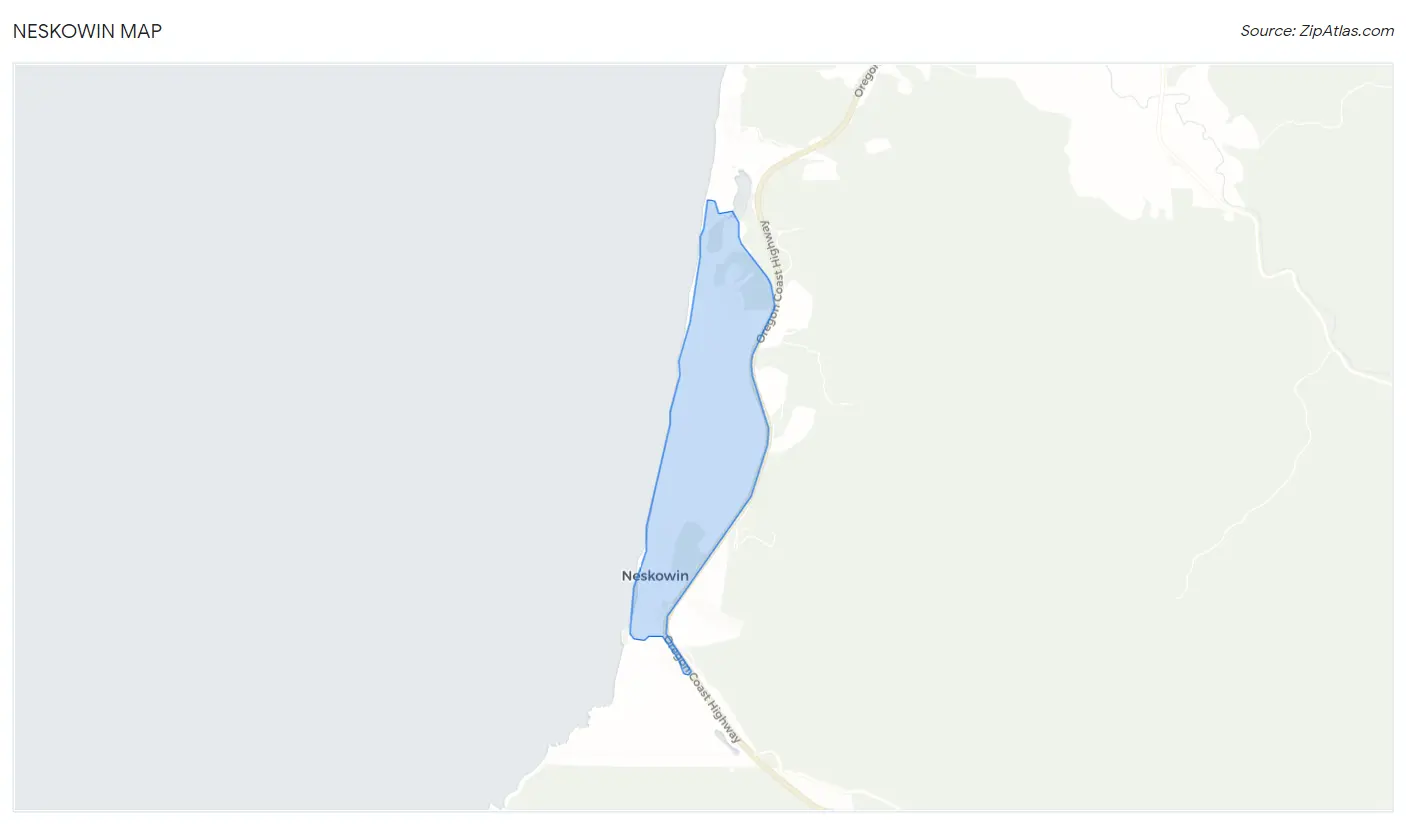
Neskowin Map
Neskowin Overview
$20,411
PER CAPITA INCOME
0.24
INEQUALITY / GINI INDEX
177
TOTAL POPULATION
92
MALE POPULATION
85
FEMALE POPULATION
108.24
MALES / 100 FEMALES
92.39
FEMALES / 100 MALES
24.0
MEDIAN AGE
6.0
AVG FAMILY SIZE
3.9
AVG HOUSEHOLD SIZE
121
LABOR FORCE [ PEOPLE ]
83.4%
PERCENT IN LABOR FORCE
28.1%
UNEMPLOYMENT RATE
Neskowin Zip Codes
Neskowin Area Codes
Income in Neskowin
Income Overview in Neskowin
| Characteristic | Number | Measure |
| Per Capita Income | 177 | $20,411 |
| Median Family Income | 22 | $0 |
| Mean Family Income | 22 | $0 |
| Median Household Income | 45 | $0 |
| Mean Household Income | 45 | $83,156 |
| Income Deficit | 22 | $0 |
| Wage / Income Gap (%) | 177 | 0.00% |
| Wage / Income Gap ($) | 177 | 100.00¢ per $1 |
| Gini / Inequality Index | 177 | 0.24 |
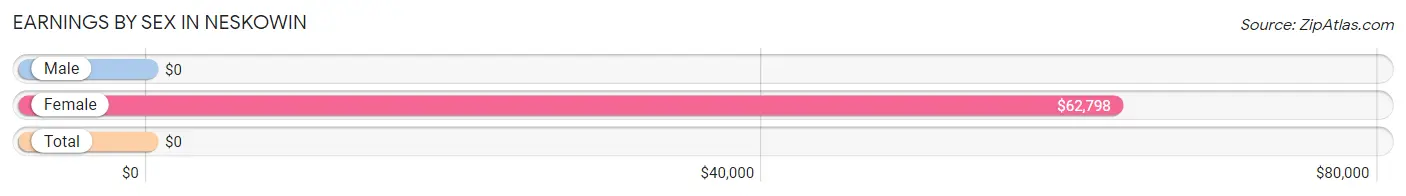
Earnings by Sex in Neskowin
| Sex | Number | Average Earnings |
| Male | 78 (64.5%) | $0 |
| Female | 43 (35.5%) | $62,798 |
| Total | 121 (100.0%) | $0 |
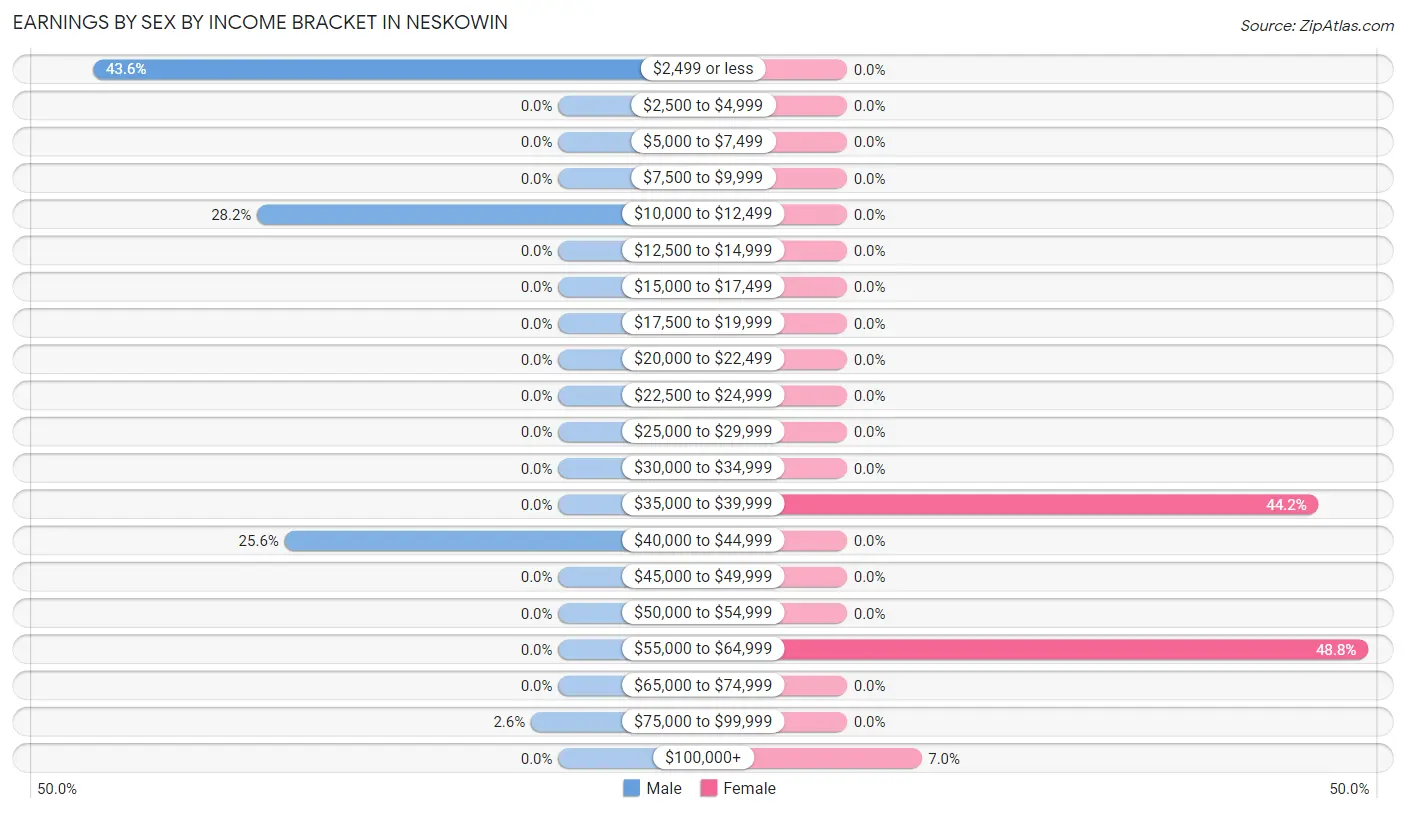
Earnings by Sex by Income Bracket in Neskowin
The most common earnings brackets in Neskowin are $2,499 or less for men (34 | 43.6%) and $55,000 to $64,999 for women (21 | 48.8%).
| Income | Male | Female |
| $2,499 or less | 34 (43.6%) | 0 (0.0%) |
| $2,500 to $4,999 | 0 (0.0%) | 0 (0.0%) |
| $5,000 to $7,499 | 0 (0.0%) | 0 (0.0%) |
| $7,500 to $9,999 | 0 (0.0%) | 0 (0.0%) |
| $10,000 to $12,499 | 22 (28.2%) | 0 (0.0%) |
| $12,500 to $14,999 | 0 (0.0%) | 0 (0.0%) |
| $15,000 to $17,499 | 0 (0.0%) | 0 (0.0%) |
| $17,500 to $19,999 | 0 (0.0%) | 0 (0.0%) |
| $20,000 to $22,499 | 0 (0.0%) | 0 (0.0%) |
| $22,500 to $24,999 | 0 (0.0%) | 0 (0.0%) |
| $25,000 to $29,999 | 0 (0.0%) | 0 (0.0%) |
| $30,000 to $34,999 | 0 (0.0%) | 0 (0.0%) |
| $35,000 to $39,999 | 0 (0.0%) | 19 (44.2%) |
| $40,000 to $44,999 | 20 (25.6%) | 0 (0.0%) |
| $45,000 to $49,999 | 0 (0.0%) | 0 (0.0%) |
| $50,000 to $54,999 | 0 (0.0%) | 0 (0.0%) |
| $55,000 to $64,999 | 0 (0.0%) | 21 (48.8%) |
| $65,000 to $74,999 | 0 (0.0%) | 0 (0.0%) |
| $75,000 to $99,999 | 2 (2.6%) | 0 (0.0%) |
| $100,000+ | 0 (0.0%) | 3 (7.0%) |
| Total | 78 (100.0%) | 43 (100.0%) |
Earnings by Sex by Educational Attainment in Neskowin
| Educational Attainment | Male Income | Female Income |
| Less than High School | - | - |
| High School Diploma | - | - |
| College or Associate's Degree | - | - |
| Bachelor's Degree | - | - |
| Graduate Degree | - | - |
| Total | - | - |
Family Income in Neskowin
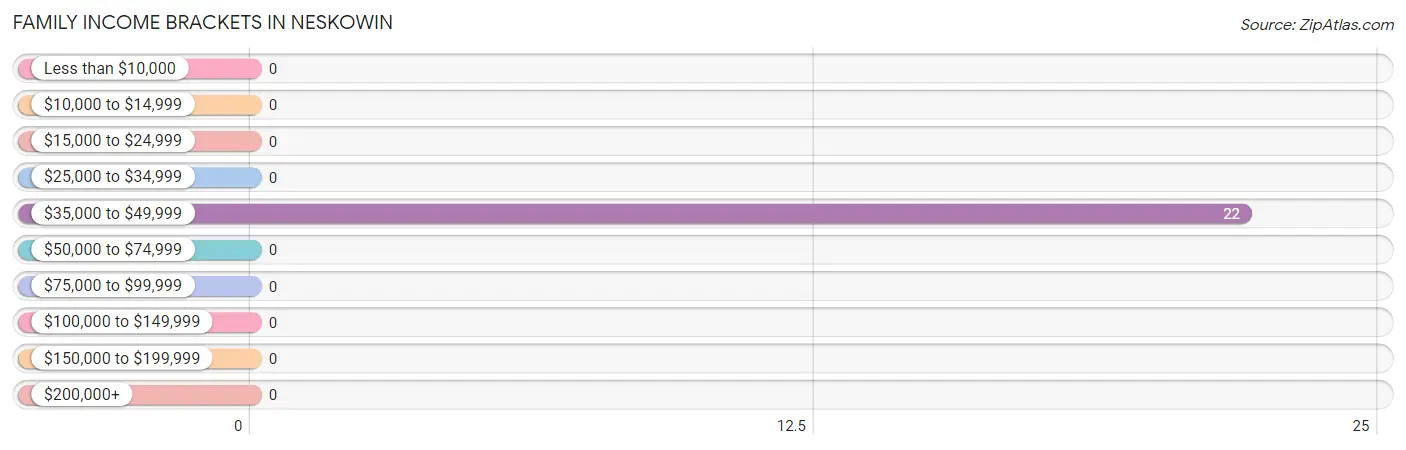
Family Income Brackets in Neskowin
According to the Neskowin family income data, there are 22 families falling into the $35,000 to $49,999 income range, which is the most common income bracket and makes up 100.0% of all families.
| Income Bracket | # Families | % Families |
| Less than $10,000 | 0 | 0.0% |
| $10,000 to $14,999 | 0 | 0.0% |
| $15,000 to $24,999 | 0 | 0.0% |
| $25,000 to $34,999 | 0 | 0.0% |
| $35,000 to $49,999 | 22 | 100.0% |
| $50,000 to $74,999 | 0 | 0.0% |
| $75,000 to $99,999 | 0 | 0.0% |
| $100,000 to $149,999 | 0 | 0.0% |
| $150,000 to $199,999 | 0 | 0.0% |
| $200,000+ | 0 | 0.0% |
Family Income by Famaliy Size in Neskowin
| Income Bracket | # Families | Median Income |
| 2-Person Families | 0 (0.0%) | $0 |
| 3-Person Families | 0 (0.0%) | $0 |
| 4-Person Families | 0 (0.0%) | $0 |
| 5-Person Families | 0 (0.0%) | $0 |
| 6-Person Families | 22 (100.0%) | $0 |
| 7+ Person Families | 0 (0.0%) | $0 |
| Total | 22 (100.0%) | $0 |
Family Income by Number of Earners in Neskowin
| Number of Earners | # Families | Median Income |
| No Earners | 0 (0.0%) | $0 |
| 1 Earner | 0 (0.0%) | $0 |
| 2 Earners | 0 (0.0%) | $0 |
| 3+ Earners | 22 (100.0%) | $0 |
| Total | 22 (100.0%) | $0 |
Household Income in Neskowin
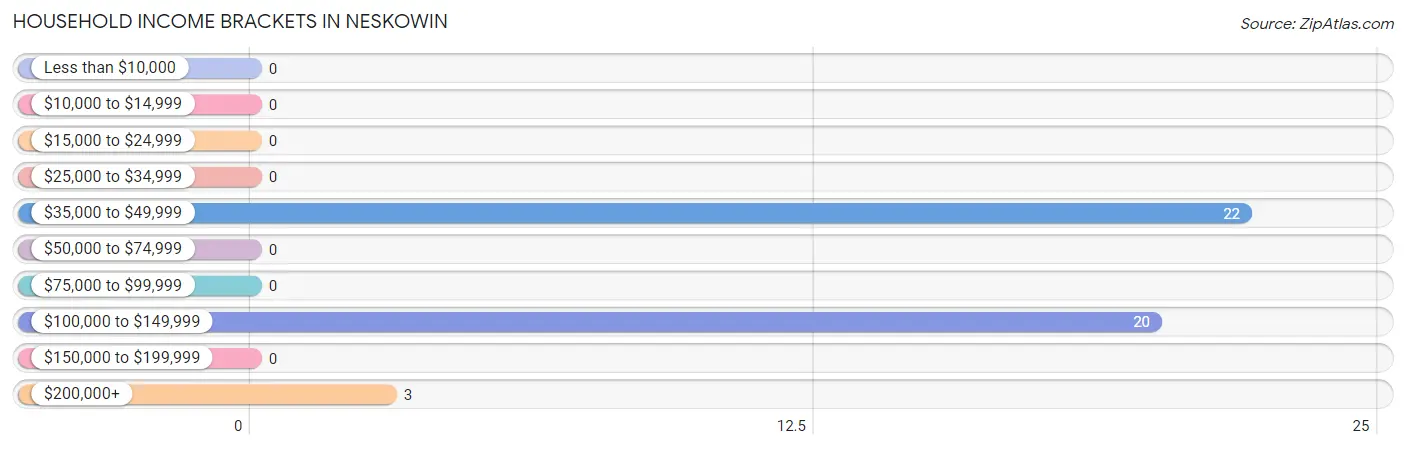
Household Income Brackets in Neskowin
With 22 households falling in the category, the $35,000 to $49,999 income range is the most frequent in Neskowin, accounting for 48.9% of all households.
| Income Bracket | # Households | % Households |
| Less than $10,000 | 0 | 0.0% |
| $10,000 to $14,999 | 0 | 0.0% |
| $15,000 to $24,999 | 0 | 0.0% |
| $25,000 to $34,999 | 0 | 0.0% |
| $35,000 to $49,999 | 22 | 48.9% |
| $50,000 to $74,999 | 0 | 0.0% |
| $75,000 to $99,999 | 0 | 0.0% |
| $100,000 to $149,999 | 20 | 44.4% |
| $150,000 to $199,999 | 0 | 0.0% |
| $200,000+ | 3 | 6.7% |
Household Income by Householder Age in Neskowin
| Income Bracket | # Households | Median Income |
| 15 to 24 Years | 0 (0.0%) | $0 |
| 25 to 44 Years | 20 (44.4%) | $0 |
| 45 to 64 Years | 25 (55.6%) | $0 |
| 65+ Years | 0 (0.0%) | $0 |
| Total | 45 (100.0%) | $0 |
Poverty in Neskowin
Income Below Poverty by Sex and Age in Neskowin
| Age Bracket | Male | Female |
| Under 5 Years | 0 (0.0%) | 0 (0.0%) |
| 5 Years | 0 (0.0%) | 0 (0.0%) |
| 6 to 11 Years | 0 (0.0%) | 0 (0.0%) |
| 12 to 14 Years | 0 (0.0%) | 0 (0.0%) |
| 15 Years | 0 (0.0%) | 0 (0.0%) |
| 16 and 17 Years | 0 (0.0%) | 0 (0.0%) |
| 18 to 24 Years | 0 (0.0%) | 0 (0.0%) |
| 25 to 34 Years | 0 (0.0%) | 0 (0.0%) |
| 35 to 44 Years | 0 (0.0%) | 0 (0.0%) |
| 45 to 54 Years | 0 (0.0%) | 0 (0.0%) |
| 55 to 64 Years | 0 (0.0%) | 0 (0.0%) |
| 65 to 74 Years | 0 (0.0%) | 0 (0.0%) |
| 75 Years and over | 0 (0.0%) | 0 (0.0%) |
| Total | 0 (0.0%) | 0 (0.0%) |
Income Above Poverty by Sex and Age in Neskowin
According to the poverty statistics in Neskowin, males aged 15 years and females aged 12 to 14 years are the age groups that are most secure financially, with 100.0% of males and 100.0% of females in these age groups living above the poverty line.
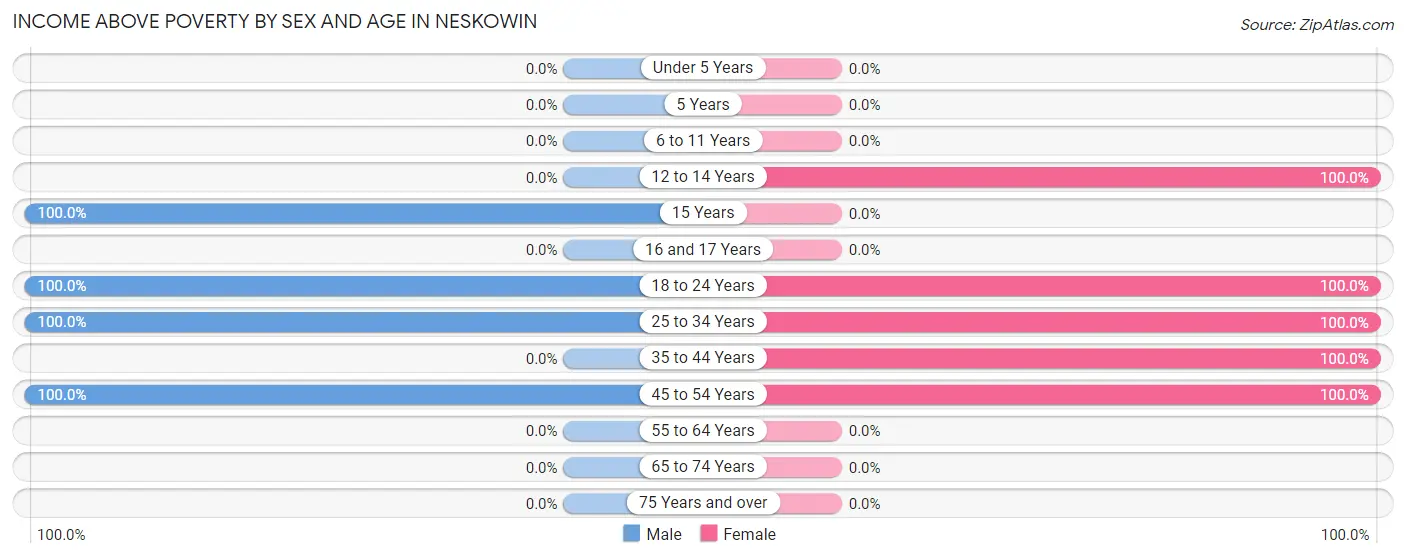
| Age Bracket | Male | Female |
| Under 5 Years | 0 (0.0%) | 0 (0.0%) |
| 5 Years | 0 (0.0%) | 0 (0.0%) |
| 6 to 11 Years | 0 (0.0%) | 0 (0.0%) |
| 12 to 14 Years | 0 (0.0%) | 18 (100.0%) |
| 15 Years | 14 (100.0%) | 0 (0.0%) |
| 16 and 17 Years | 0 (0.0%) | 0 (0.0%) |
| 18 to 24 Years | 34 (100.0%) | 24 (100.0%) |
| 25 to 34 Years | 20 (100.0%) | 21 (100.0%) |
| 35 to 44 Years | 0 (0.0%) | 19 (100.0%) |
| 45 to 54 Years | 24 (100.0%) | 3 (100.0%) |
| 55 to 64 Years | 0 (0.0%) | 0 (0.0%) |
| 65 to 74 Years | 0 (0.0%) | 0 (0.0%) |
| 75 Years and over | 0 (0.0%) | 0 (0.0%) |
| Total | 92 (100.0%) | 85 (100.0%) |
Income Below Poverty Among Married-Couple Families in Neskowin
| Children | Above Poverty | Below Poverty |
| No Children | 0 (0.0%) | 0 (0.0%) |
| 1 or 2 Children | 22 (100.0%) | 0 (0.0%) |
| 3 or 4 Children | 0 (0.0%) | 0 (0.0%) |
| 5 or more Children | 0 (0.0%) | 0 (0.0%) |
| Total | 22 (100.0%) | 0 (0.0%) |
Income Below Poverty Among Single-Parent Households in Neskowin
| Children | Single Father | Single Mother |
| No Children | 0 (0.0%) | 0 (0.0%) |
| 1 or 2 Children | 0 (0.0%) | 0 (0.0%) |
| 3 or 4 Children | 0 (0.0%) | 0 (0.0%) |
| 5 or more Children | 0 (0.0%) | 0 (0.0%) |
| Total | 0 (0.0%) | 0 (0.0%) |
Income Below Poverty Among Married-Couple vs Single-Parent Households in Neskowin
| Children | Married-Couple Families | Single-Parent Households |
| No Children | 0 (0.0%) | 0 (0.0%) |
| 1 or 2 Children | 0 (0.0%) | 0 (0.0%) |
| 3 or 4 Children | 0 (0.0%) | 0 (0.0%) |
| 5 or more Children | 0 (0.0%) | 0 (0.0%) |
| Total | 0 (0.0%) | 0 (0.0%) |
Race in Neskowin
The most populous races in Neskowin are , and White / Caucasian (177 | 100.0%).
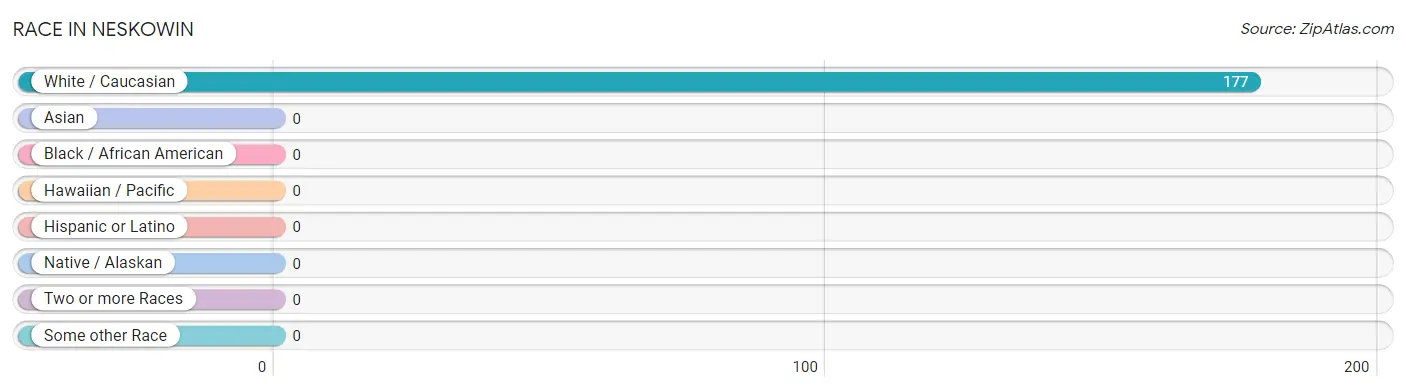
| Race | # Population | % Population |
| Asian | 0 | 0.0% |
| Black / African American | 0 | 0.0% |
| Hawaiian / Pacific | 0 | 0.0% |
| Hispanic or Latino | 0 | 0.0% |
| Native / Alaskan | 0 | 0.0% |
| White / Caucasian | 177 | 100.0% |
| Two or more Races | 0 | 0.0% |
| Some other Race | 0 | 0.0% |
| Total | 177 | 100.0% |
Ancestry in Neskowin
The most populous ancestries reported in Neskowin are Irish (21 | 11.9%), European (20 | 11.3%), German (3 | 1.7%), and Scottish (3 | 1.7%), together accounting for 26.5% of all Neskowin residents.
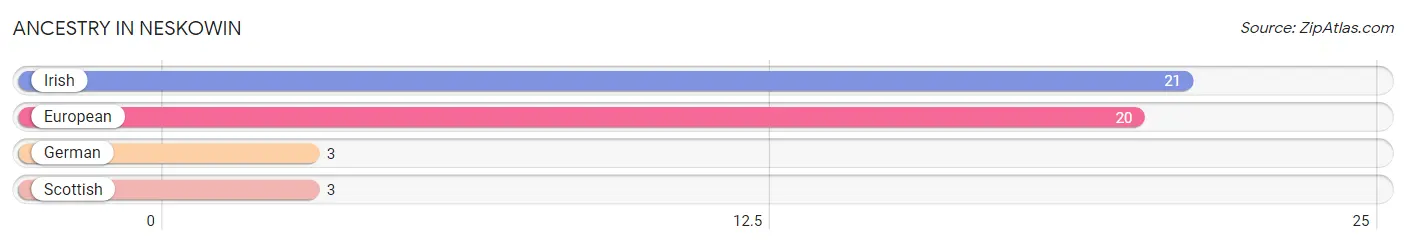
| Ancestry | # Population | % Population |
| European | 20 | 11.3% |
| German | 3 | 1.7% |
| Irish | 21 | 11.9% |
| Scottish | 3 | 1.7% | View All 4 Rows |
Immigrants in Neskowin

| Immigration Origin | # Population | % Population | View All 0 Rows |
Sex and Age in Neskowin
Sex and Age in Neskowin
The most populous age groups in Neskowin are 20 to 24 Years (34 | 37.0%) for men and 20 to 24 Years (24 | 28.2%) for women.
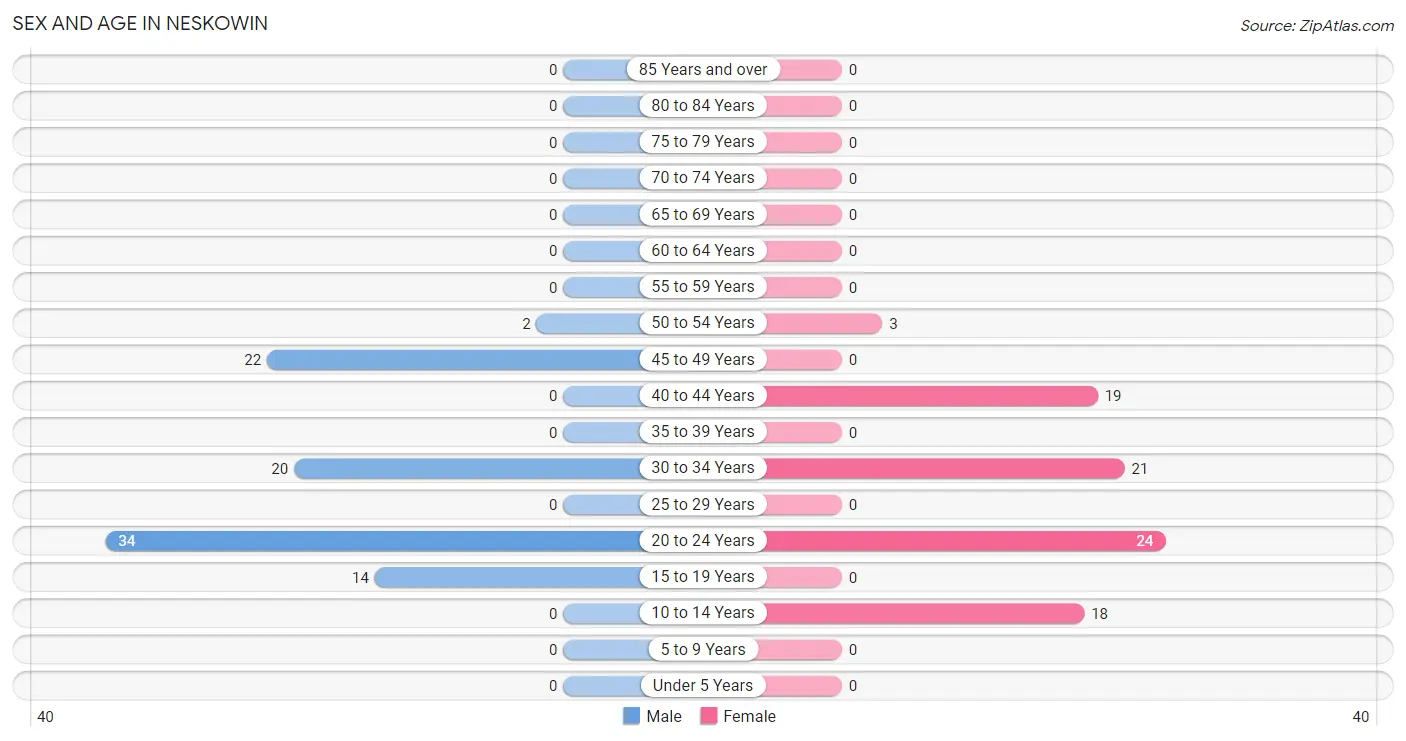
| Age Bracket | Male | Female |
| Under 5 Years | 0 (0.0%) | 0 (0.0%) |
| 5 to 9 Years | 0 (0.0%) | 0 (0.0%) |
| 10 to 14 Years | 0 (0.0%) | 18 (21.2%) |
| 15 to 19 Years | 14 (15.2%) | 0 (0.0%) |
| 20 to 24 Years | 34 (37.0%) | 24 (28.2%) |
| 25 to 29 Years | 0 (0.0%) | 0 (0.0%) |
| 30 to 34 Years | 20 (21.7%) | 21 (24.7%) |
| 35 to 39 Years | 0 (0.0%) | 0 (0.0%) |
| 40 to 44 Years | 0 (0.0%) | 19 (22.4%) |
| 45 to 49 Years | 22 (23.9%) | 0 (0.0%) |
| 50 to 54 Years | 2 (2.2%) | 3 (3.5%) |
| 55 to 59 Years | 0 (0.0%) | 0 (0.0%) |
| 60 to 64 Years | 0 (0.0%) | 0 (0.0%) |
| 65 to 69 Years | 0 (0.0%) | 0 (0.0%) |
| 70 to 74 Years | 0 (0.0%) | 0 (0.0%) |
| 75 to 79 Years | 0 (0.0%) | 0 (0.0%) |
| 80 to 84 Years | 0 (0.0%) | 0 (0.0%) |
| 85 Years and over | 0 (0.0%) | 0 (0.0%) |
| Total | 92 (100.0%) | 85 (100.0%) |
Families and Households in Neskowin
Median Family Size in Neskowin
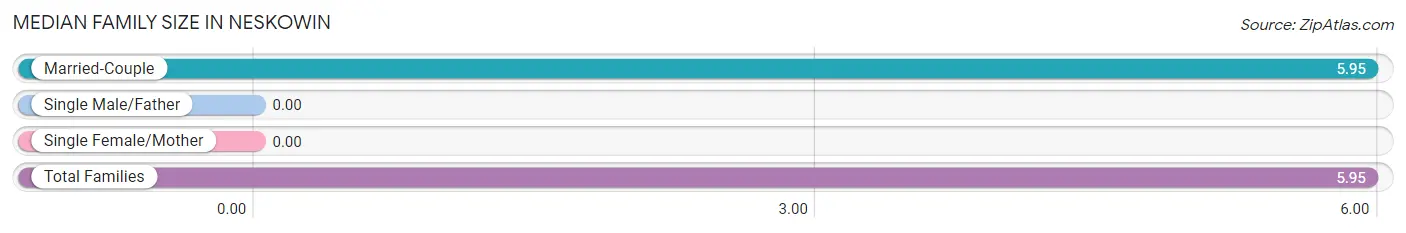
| Family Type | # Families | Family Size |
| Married-Couple | 22 (100.0%) | 5.95 |
| Single Male/Father | 0 (0.0%) | - |
| Single Female/Mother | 0 (0.0%) | - |
| Total Families | 22 (100.0%) | 5.95 |
Median Household Size in Neskowin
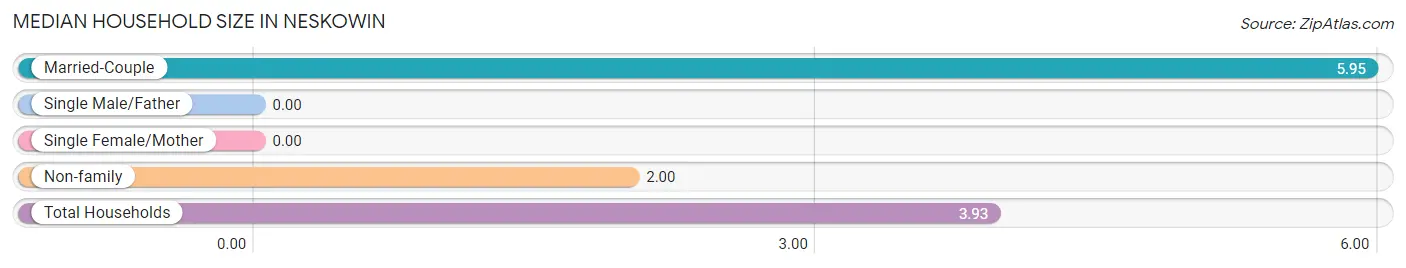
| Household Type | # Households | Household Size |
| Married-Couple | 22 (48.9%) | 5.95 |
| Single Male/Father | 0 (0.0%) | - |
| Single Female/Mother | 0 (0.0%) | - |
| Non-family | 23 (51.1%) | 2.00 |
| Total Households | 45 (100.0%) | 3.93 |
Household Size by Marriage Status in Neskowin
Out of a total of 45 households in Neskowin, 22 (48.9%) are family households, while 23 (51.1%) are nonfamily households. The most numerous type of family households are 6-person households, comprising 22, and the most common type of nonfamily households are 2-person households, comprising 23.
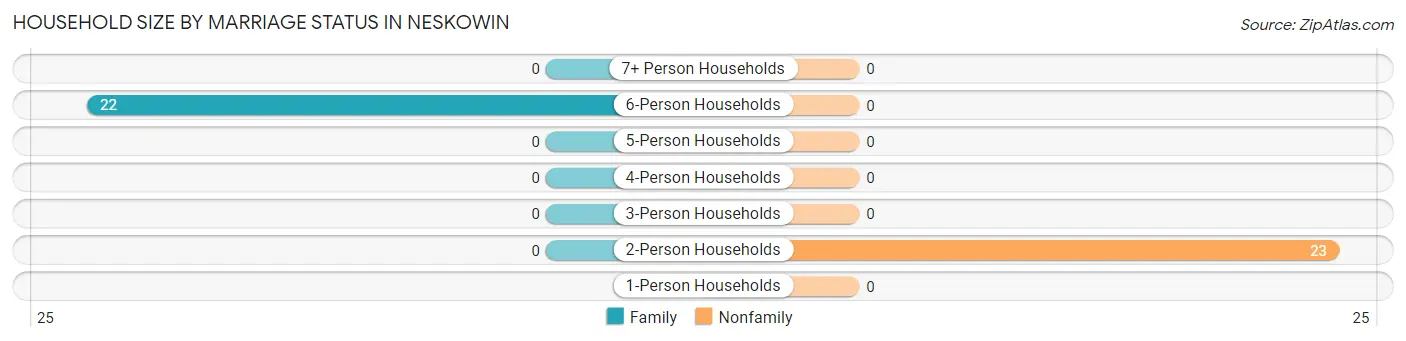
| Household Size | Family Households | Nonfamily Households |
| 1-Person Households | - | 0 (0.0%) |
| 2-Person Households | 0 (0.0%) | 23 (51.1%) |
| 3-Person Households | 0 (0.0%) | 0 (0.0%) |
| 4-Person Households | 0 (0.0%) | 0 (0.0%) |
| 5-Person Households | 0 (0.0%) | 0 (0.0%) |
| 6-Person Households | 22 (48.9%) | 0 (0.0%) |
| 7+ Person Households | 0 (0.0%) | 0 (0.0%) |
| Total | 22 (48.9%) | 23 (51.1%) |
Female Fertility in Neskowin
Fertility by Age in Neskowin
| Age Bracket | Women with Births | Births / 1,000 Women |
| 15 to 19 years | 0 (0.0%) | 0.0 |
| 20 to 34 years | 0 (0.0%) | 0.0 |
| 35 to 50 years | 0 (0.0%) | 0.0 |
| Total | 0 (0.0%) | 0.0 |
Fertility by Age by Marriage Status in Neskowin
| Age Bracket | Married | Unmarried |
| 15 to 19 years | 0 (0.0%) | 0 (0.0%) |
| 20 to 34 years | 0 (0.0%) | 0 (0.0%) |
| 35 to 50 years | 0 (0.0%) | 0 (0.0%) |
| Total | 0 (0.0%) | 0 (0.0%) |
Fertility by Education in Neskowin
| Educational Attainment | Women with Births | Births / 1,000 Women |
| Less than High School | 0 (0.0%) | 0.0 |
| High School Diploma | 0 (0.0%) | 0.0 |
| College or Associate's Degree | 0 (0.0%) | 0.0 |
| Bachelor's Degree | 0 (0.0%) | 0.0 |
| Graduate Degree | 0 (0.0%) | 0.0 |
| Total | 0 (0.0%) | 0.0 |
Fertility by Education by Marriage Status in Neskowin

| Educational Attainment | Married | Unmarried |
| Less than High School | 0 (0.0%) | 0 (0.0%) |
| High School Diploma | 0 (0.0%) | 0 (0.0%) |
| College or Associate's Degree | 0 (0.0%) | 0 (0.0%) |
| Bachelor's Degree | 0 (0.0%) | 0 (0.0%) |
| Graduate Degree | 0 (0.0%) | 0 (0.0%) |
| Total | 0 (0.0%) | 0 (0.0%) |
Employment Characteristics in Neskowin
Employment by Class of Employer in Neskowin
Among the 65 employed individuals in Neskowin, federal government employees (21 | 32.3%), state government employees (20 | 30.8%), and local government employees (19 | 29.2%) make up the most common classes of employment.
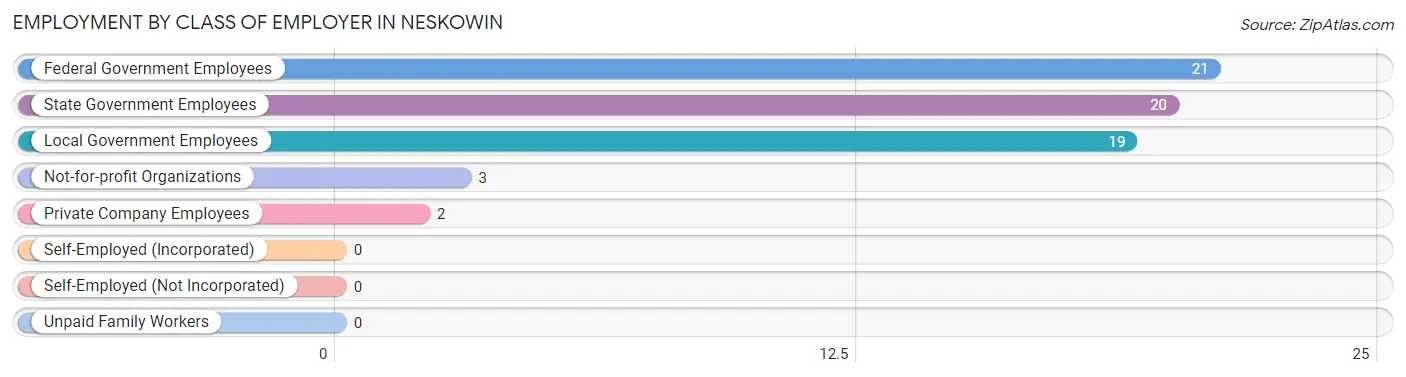
| Employer Class | # Employees | % Employees |
| Private Company Employees | 2 | 3.1% |
| Self-Employed (Incorporated) | 0 | 0.0% |
| Self-Employed (Not Incorporated) | 0 | 0.0% |
| Not-for-profit Organizations | 3 | 4.6% |
| Local Government Employees | 19 | 29.2% |
| State Government Employees | 20 | 30.8% |
| Federal Government Employees | 21 | 32.3% |
| Unpaid Family Workers | 0 | 0.0% |
| Total | 65 | 100.0% |
Employment Status by Age in Neskowin
According to the labor force statistics for Neskowin, out of the total population over 16 years of age (145), 83.4% or 121 individuals are in the labor force, with 28.1% or 34 of them unemployed. The age group with the highest labor force participation rate is 30 to 34 years, with 100.0% or 41 individuals in the labor force. Within the labor force, the 20 to 24 years age range has the highest percentage of unemployed individuals, with 100.0% or 34 of them being unemployed.
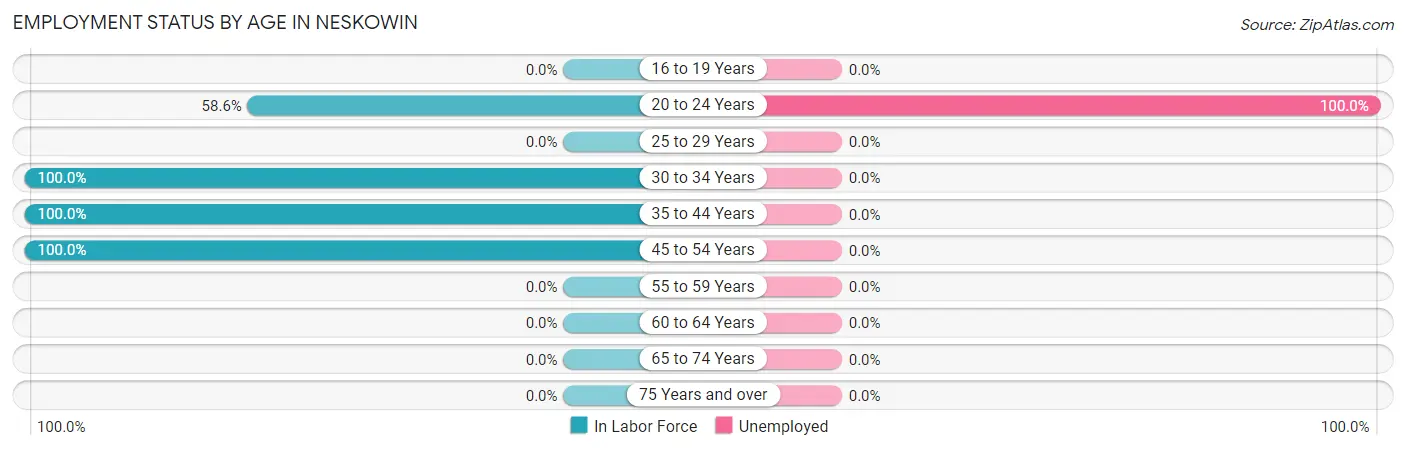
| Age Bracket | In Labor Force | Unemployed |
| 16 to 19 Years | 0 (0.0%) | 0 (0.0%) |
| 20 to 24 Years | 34 (58.6%) | 34 (100.0%) |
| 25 to 29 Years | 0 (0.0%) | 0 (0.0%) |
| 30 to 34 Years | 41 (100.0%) | 0 (0.0%) |
| 35 to 44 Years | 19 (100.0%) | 0 (0.0%) |
| 45 to 54 Years | 27 (100.0%) | 0 (0.0%) |
| 55 to 59 Years | 0 (0.0%) | 0 (0.0%) |
| 60 to 64 Years | 0 (0.0%) | 0 (0.0%) |
| 65 to 74 Years | 0 (0.0%) | 0 (0.0%) |
| 75 Years and over | 0 (0.0%) | 0 (0.0%) |
| Total | 121 (83.4%) | 34 (28.1%) |
Employment Status by Educational Attainment in Neskowin
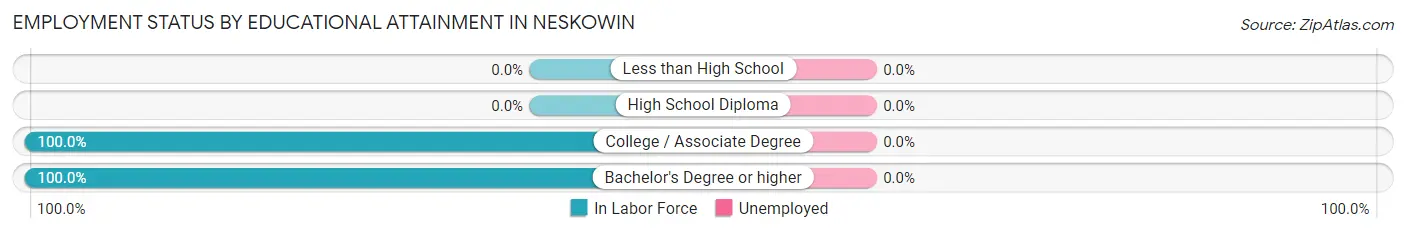
| Educational Attainment | In Labor Force | Unemployed |
| Less than High School | 0 (0.0%) | 0 (0.0%) |
| High School Diploma | 0 (0.0%) | 0 (0.0%) |
| College / Associate Degree | 43 (100.0%) | 0 (0.0%) |
| Bachelor's Degree or higher | 44 (100.0%) | 0 (0.0%) |
| Total | 87 (100.0%) | 0 (0.0%) |
Employment Occupations by Sex in Neskowin
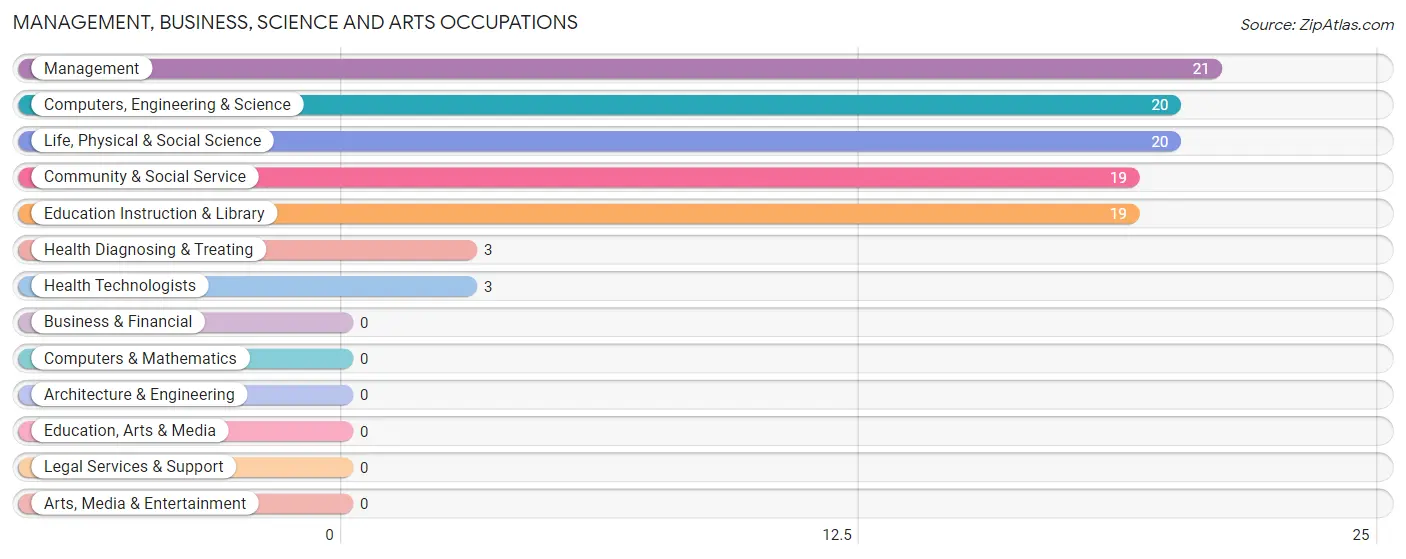
Management, Business, Science and Arts Occupations
The most common Management, Business, Science and Arts occupations in Neskowin are Management (21 | 24.1%), Computers, Engineering & Science (20 | 23.0%), Life, Physical & Social Science (20 | 23.0%), Community & Social Service (19 | 21.8%), and Education Instruction & Library (19 | 21.8%).
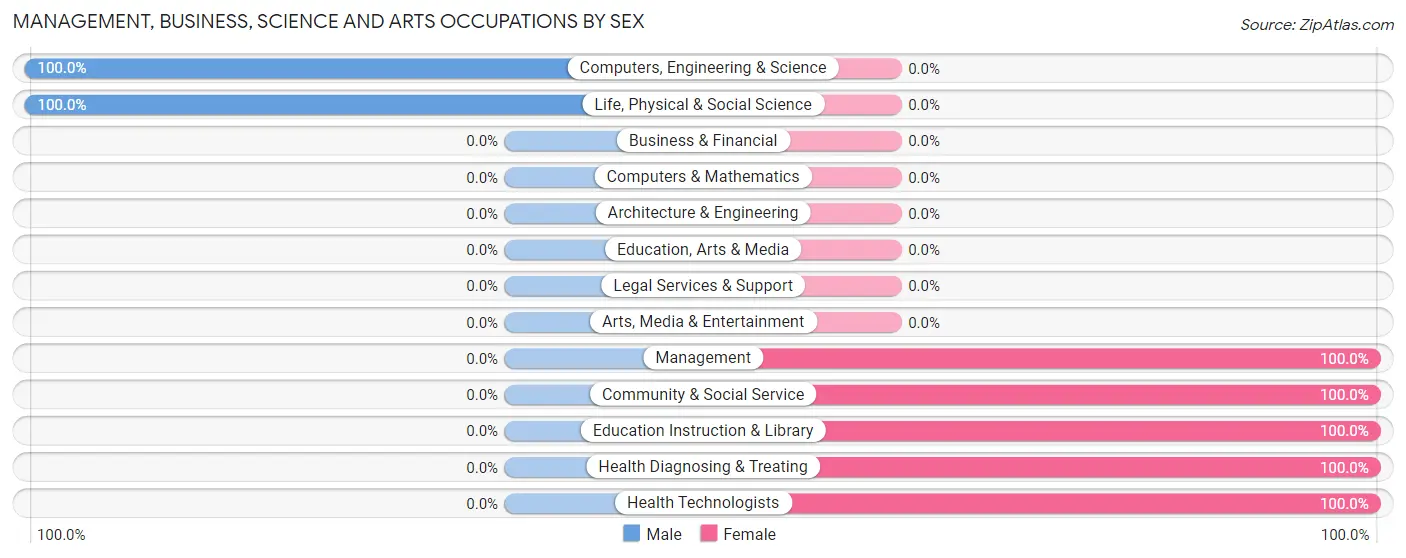
Management, Business, Science and Arts Occupations by Sex
Within the Management, Business, Science and Arts occupations in Neskowin, the most male-oriented occupations are Computers, Engineering & Science (100.0%), and Life, Physical & Social Science (100.0%), while the most female-oriented occupations are Management (100.0%), Community & Social Service (100.0%), and Education Instruction & Library (100.0%).
| Occupation | Male | Female |
| Management | 0 (0.0%) | 21 (100.0%) |
| Business & Financial | 0 (0.0%) | 0 (0.0%) |
| Computers, Engineering & Science | 20 (100.0%) | 0 (0.0%) |
| Computers & Mathematics | 0 (0.0%) | 0 (0.0%) |
| Architecture & Engineering | 0 (0.0%) | 0 (0.0%) |
| Life, Physical & Social Science | 20 (100.0%) | 0 (0.0%) |
| Community & Social Service | 0 (0.0%) | 19 (100.0%) |
| Education, Arts & Media | 0 (0.0%) | 0 (0.0%) |
| Legal Services & Support | 0 (0.0%) | 0 (0.0%) |
| Education Instruction & Library | 0 (0.0%) | 19 (100.0%) |
| Arts, Media & Entertainment | 0 (0.0%) | 0 (0.0%) |
| Health Diagnosing & Treating | 0 (0.0%) | 3 (100.0%) |
| Health Technologists | 0 (0.0%) | 3 (100.0%) |
| Total (Category) | 20 (31.8%) | 43 (68.2%) |
| Total (Overall) | 44 (50.6%) | 43 (49.4%) |
Services Occupations
Services Occupations by Sex
| Occupation | Male | Female |
| Healthcare Support | 0 (0.0%) | 0 (0.0%) |
| Security & Protection | 0 (0.0%) | 0 (0.0%) |
| Firefighting & Prevention | 0 (0.0%) | 0 (0.0%) |
| Law Enforcement | 0 (0.0%) | 0 (0.0%) |
| Food Preparation & Serving | 0 (0.0%) | 0 (0.0%) |
| Cleaning & Maintenance | 0 (0.0%) | 0 (0.0%) |
| Personal Care & Service | 0 (0.0%) | 0 (0.0%) |
| Total (Category) | 0 (0.0%) | 0 (0.0%) |
| Total (Overall) | 44 (50.6%) | 43 (49.4%) |
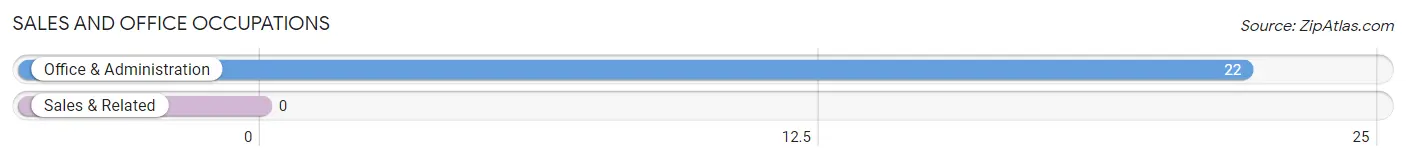
Sales and Office Occupations
The most common Sales and Office occupations in Neskowin are , and Office & Administration (22 | 25.3%).
Sales and Office Occupations by Sex
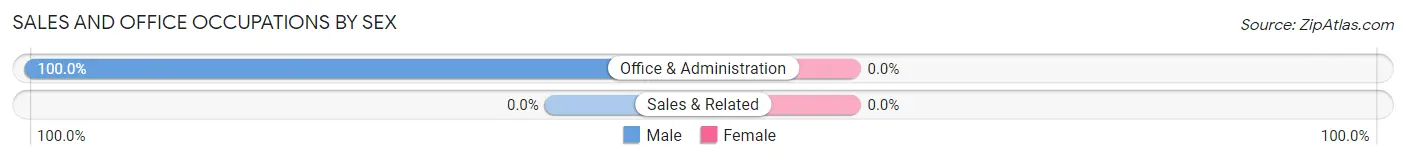
| Occupation | Male | Female |
| Sales & Related | 0 (0.0%) | 0 (0.0%) |
| Office & Administration | 22 (100.0%) | 0 (0.0%) |
| Total (Category) | 22 (100.0%) | 0 (0.0%) |
| Total (Overall) | 44 (50.6%) | 43 (49.4%) |
Natural Resources, Construction and Maintenance Occupations
The most common Natural Resources, Construction and Maintenance occupations in Neskowin are , and Installation, Maintenance & Repair (2 | 2.3%).
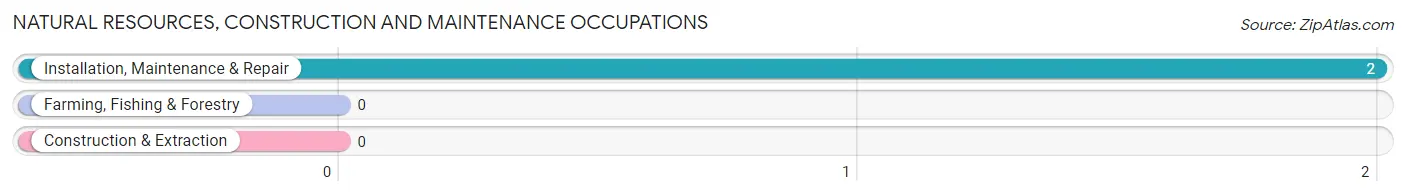
Natural Resources, Construction and Maintenance Occupations by Sex
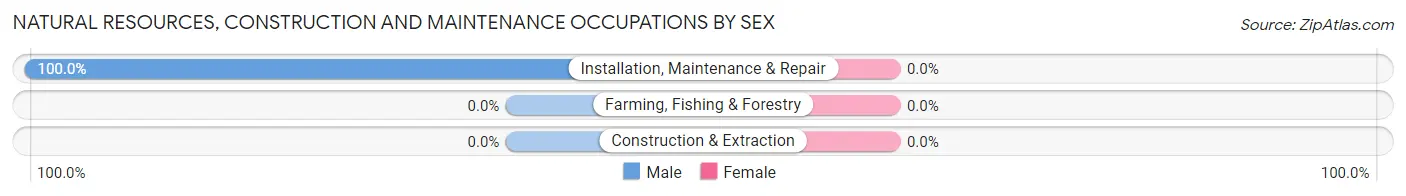
| Occupation | Male | Female |
| Farming, Fishing & Forestry | 0 (0.0%) | 0 (0.0%) |
| Construction & Extraction | 0 (0.0%) | 0 (0.0%) |
| Installation, Maintenance & Repair | 2 (100.0%) | 0 (0.0%) |
| Total (Category) | 2 (100.0%) | 0 (0.0%) |
| Total (Overall) | 44 (50.6%) | 43 (49.4%) |
Production, Transportation and Moving Occupations
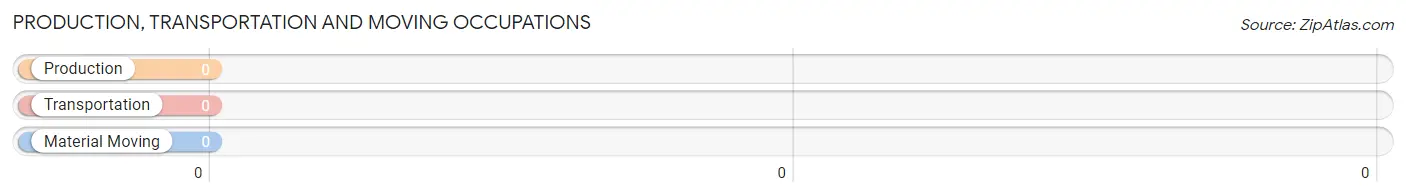
Production, Transportation and Moving Occupations by Sex
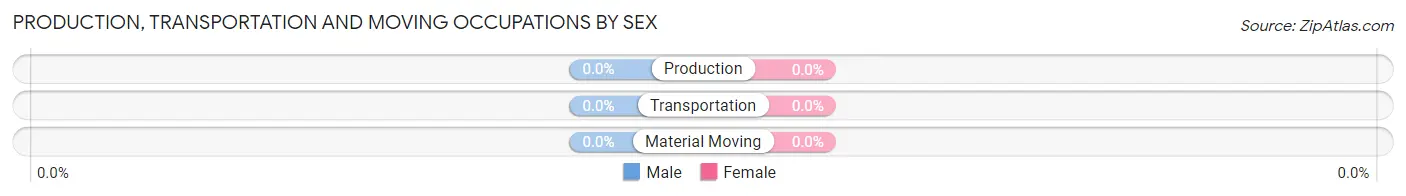
| Occupation | Male | Female |
| Production | 0 (0.0%) | 0 (0.0%) |
| Transportation | 0 (0.0%) | 0 (0.0%) |
| Material Moving | 0 (0.0%) | 0 (0.0%) |
| Total (Category) | 0 (0.0%) | 0 (0.0%) |
| Total (Overall) | 44 (50.6%) | 43 (49.4%) |
Employment Industries by Sex in Neskowin
Employment Industries in Neskowin
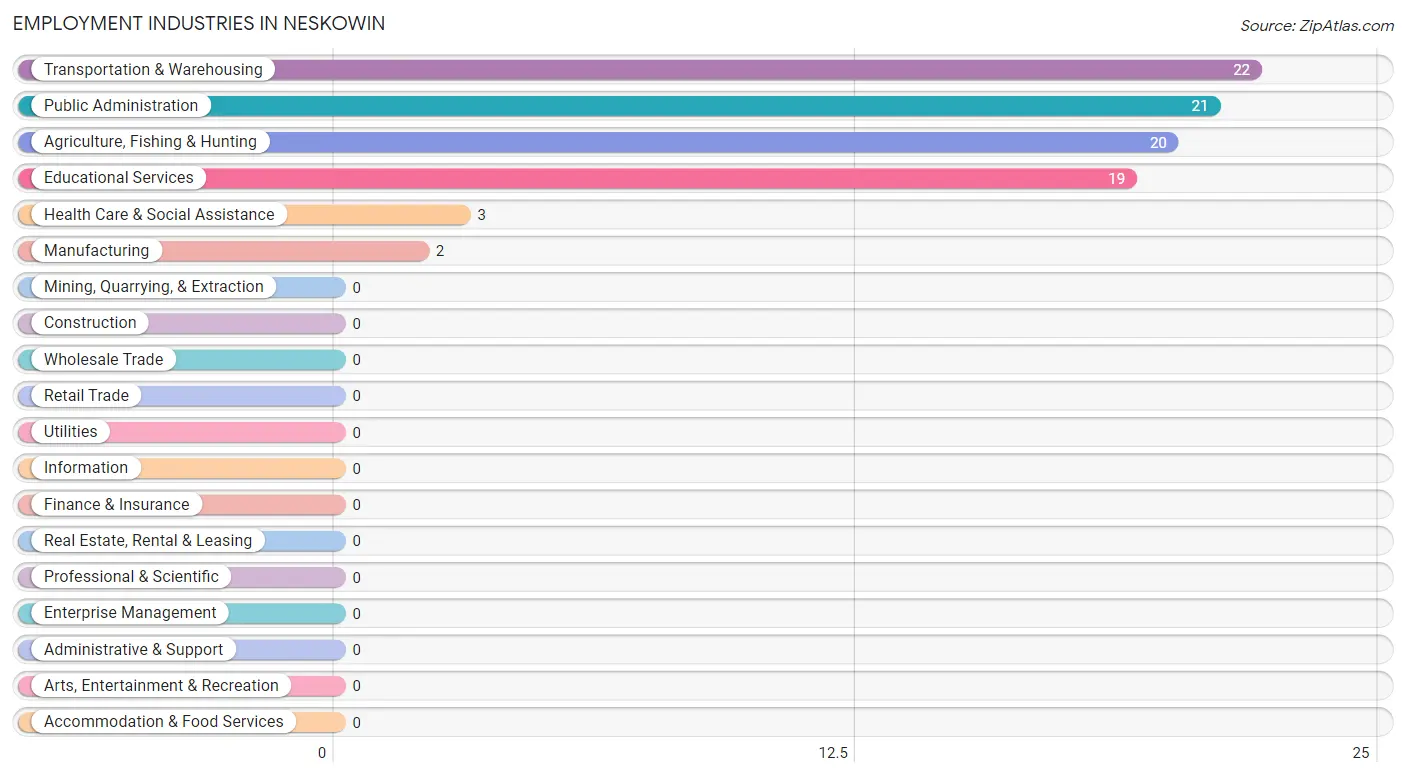
The major employment industries in Neskowin include Transportation & Warehousing (22 | 25.3%), Public Administration (21 | 24.1%), Agriculture, Fishing & Hunting (20 | 23.0%), Educational Services (19 | 21.8%), and Health Care & Social Assistance (3 | 3.5%).
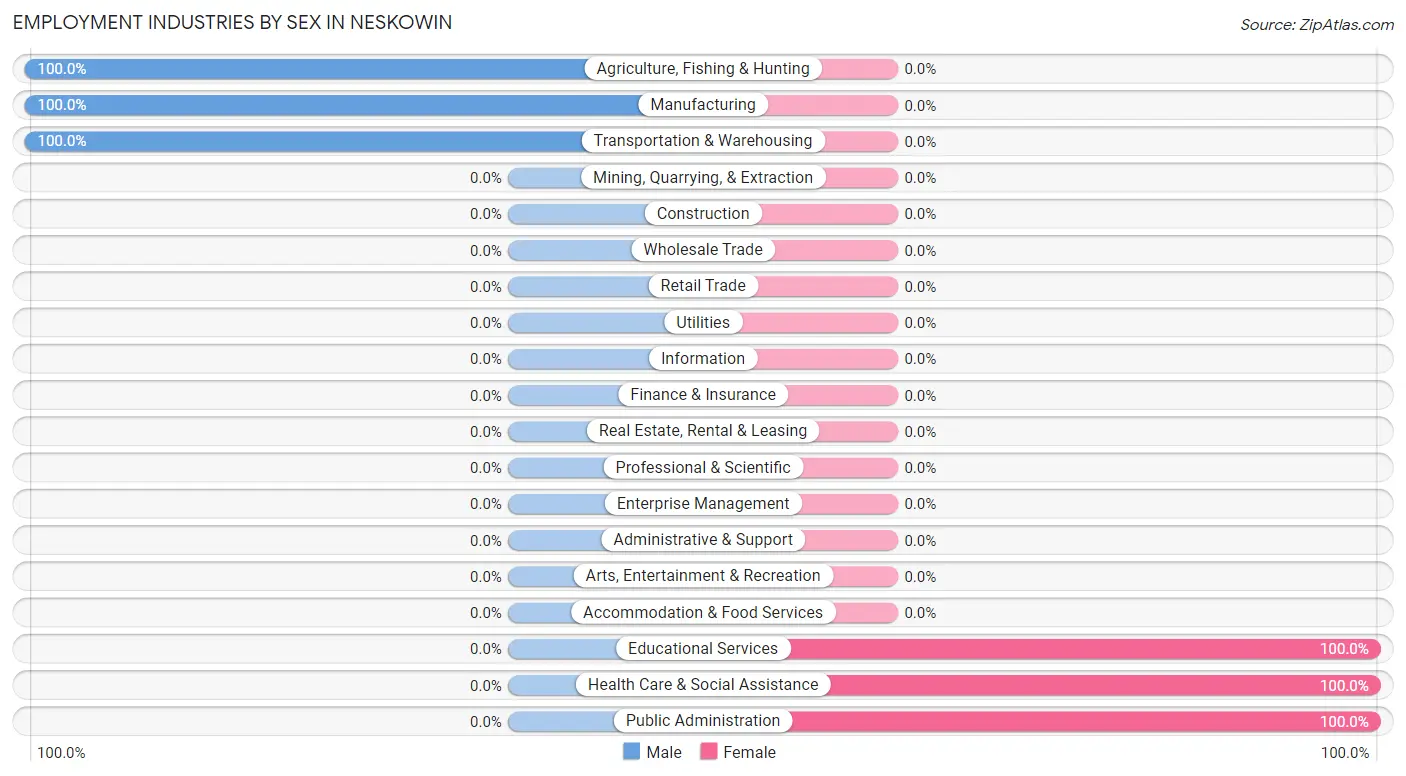
Employment Industries by Sex in Neskowin
The Neskowin industries that see more men than women are Agriculture, Fishing & Hunting (100.0%), Manufacturing (100.0%), and Transportation & Warehousing (100.0%), whereas the industries that tend to have a higher number of women are Educational Services (100.0%), Health Care & Social Assistance (100.0%), and Public Administration (100.0%).
| Industry | Male | Female |
| Agriculture, Fishing & Hunting | 20 (100.0%) | 0 (0.0%) |
| Mining, Quarrying, & Extraction | 0 (0.0%) | 0 (0.0%) |
| Construction | 0 (0.0%) | 0 (0.0%) |
| Manufacturing | 2 (100.0%) | 0 (0.0%) |
| Wholesale Trade | 0 (0.0%) | 0 (0.0%) |
| Retail Trade | 0 (0.0%) | 0 (0.0%) |
| Transportation & Warehousing | 22 (100.0%) | 0 (0.0%) |
| Utilities | 0 (0.0%) | 0 (0.0%) |
| Information | 0 (0.0%) | 0 (0.0%) |
| Finance & Insurance | 0 (0.0%) | 0 (0.0%) |
| Real Estate, Rental & Leasing | 0 (0.0%) | 0 (0.0%) |
| Professional & Scientific | 0 (0.0%) | 0 (0.0%) |
| Enterprise Management | 0 (0.0%) | 0 (0.0%) |
| Administrative & Support | 0 (0.0%) | 0 (0.0%) |
| Educational Services | 0 (0.0%) | 19 (100.0%) |
| Health Care & Social Assistance | 0 (0.0%) | 3 (100.0%) |
| Arts, Entertainment & Recreation | 0 (0.0%) | 0 (0.0%) |
| Accommodation & Food Services | 0 (0.0%) | 0 (0.0%) |
| Public Administration | 0 (0.0%) | 21 (100.0%) |
| Total | 44 (50.6%) | 43 (49.4%) |
Education in Neskowin
School Enrollment in Neskowin
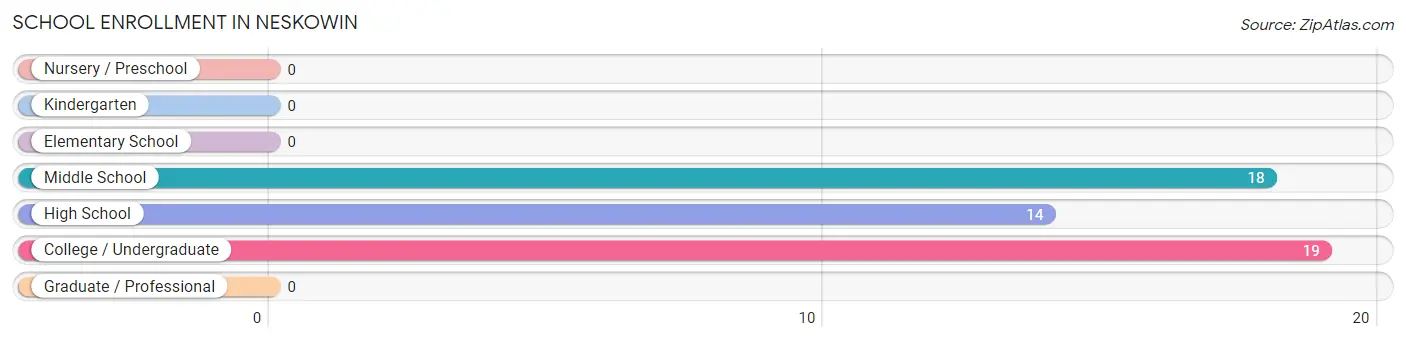
The most common levels of schooling among the 51 students in Neskowin are college / undergraduate (19 | 37.2%), middle school (18 | 35.3%), and high school (14 | 27.5%).
| School Level | # Students | % Students |
| Nursery / Preschool | 0 | 0.0% |
| Kindergarten | 0 | 0.0% |
| Elementary School | 0 | 0.0% |
| Middle School | 18 | 35.3% |
| High School | 14 | 27.5% |
| College / Undergraduate | 19 | 37.2% |
| Graduate / Professional | 0 | 0.0% |
| Total | 51 | 100.0% |
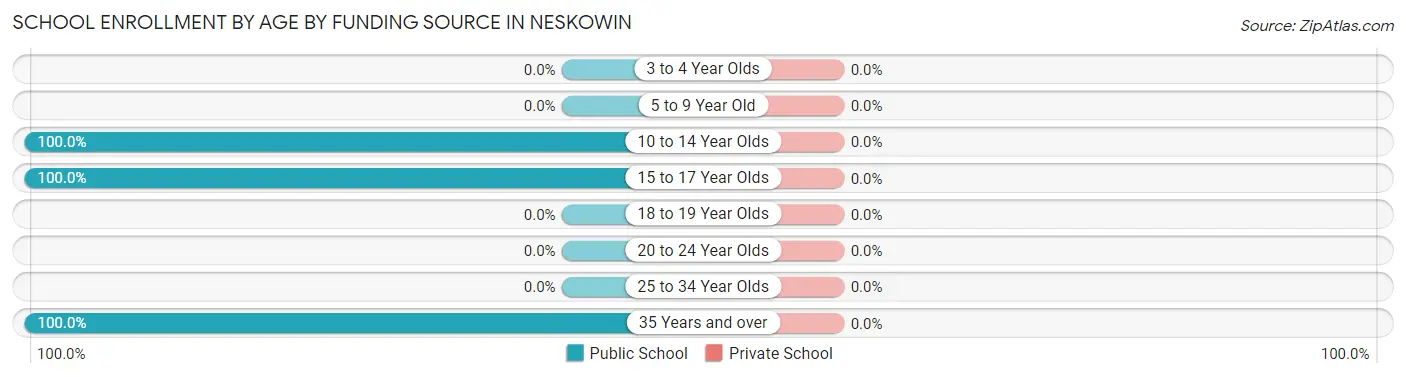
School Enrollment by Age by Funding Source in Neskowin
| Age Bracket | Public School | Private School |
| 3 to 4 Year Olds | 0 (0.0%) | 0 (0.0%) |
| 5 to 9 Year Old | 0 (0.0%) | 0 (0.0%) |
| 10 to 14 Year Olds | 18 (100.0%) | 0 (0.0%) |
| 15 to 17 Year Olds | 14 (100.0%) | 0 (0.0%) |
| 18 to 19 Year Olds | 0 (0.0%) | 0 (0.0%) |
| 20 to 24 Year Olds | 0 (0.0%) | 0 (0.0%) |
| 25 to 34 Year Olds | 0 (0.0%) | 0 (0.0%) |
| 35 Years and over | 19 (100.0%) | 0 (0.0%) |
| Total | 51 (100.0%) | 0 (0.0%) |
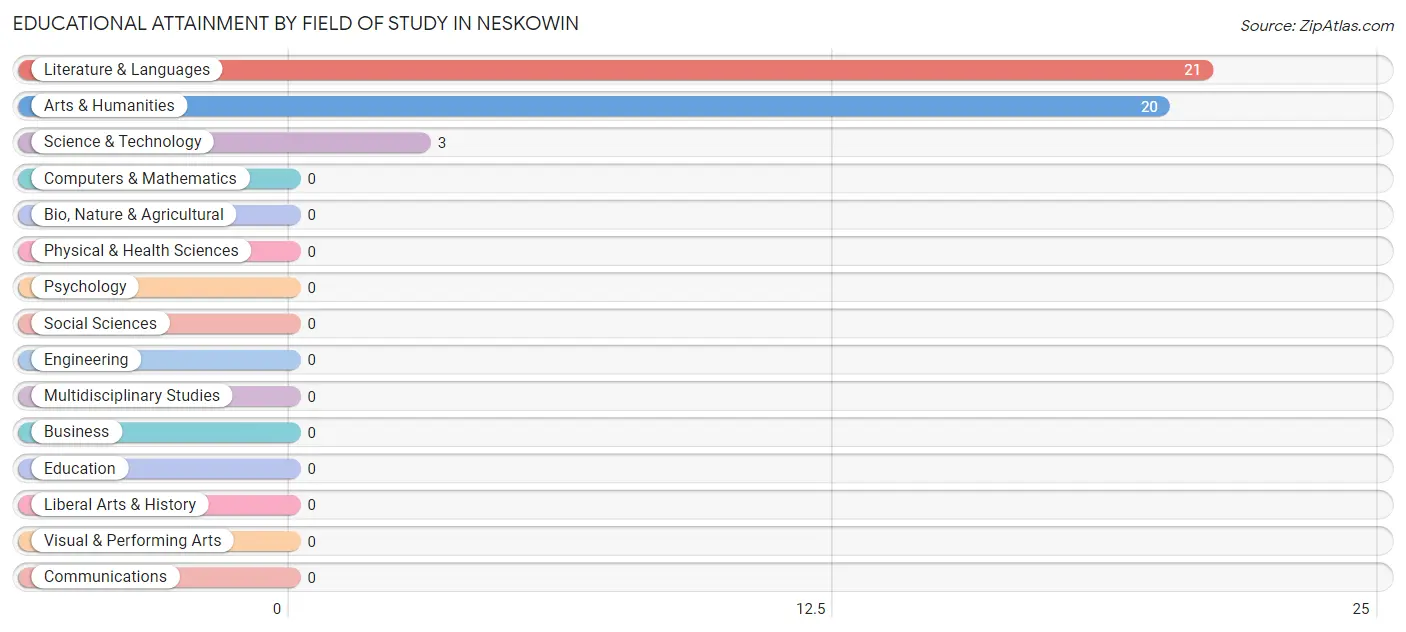
Educational Attainment by Field of Study in Neskowin
Literature & languages (21 | 47.7%), arts & humanities (20 | 45.5%), and science & technology (3 | 6.8%) are the most common fields of study among 44 individuals in Neskowin who have obtained a bachelor's degree or higher.
| Field of Study | # Graduates | % Graduates |
| Computers & Mathematics | 0 | 0.0% |
| Bio, Nature & Agricultural | 0 | 0.0% |
| Physical & Health Sciences | 0 | 0.0% |
| Psychology | 0 | 0.0% |
| Social Sciences | 0 | 0.0% |
| Engineering | 0 | 0.0% |
| Multidisciplinary Studies | 0 | 0.0% |
| Science & Technology | 3 | 6.8% |
| Business | 0 | 0.0% |
| Education | 0 | 0.0% |
| Literature & Languages | 21 | 47.7% |
| Liberal Arts & History | 0 | 0.0% |
| Visual & Performing Arts | 0 | 0.0% |
| Communications | 0 | 0.0% |
| Arts & Humanities | 20 | 45.5% |
| Total | 44 | 100.0% |
Transportation & Commute in Neskowin
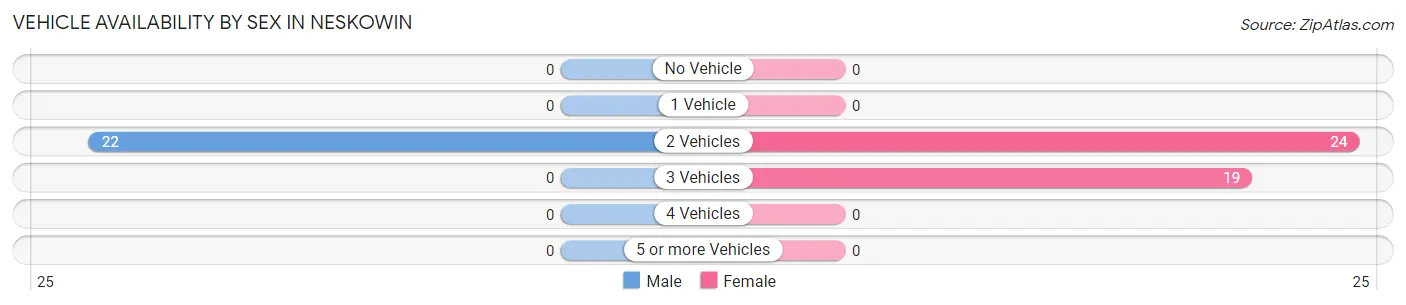
Vehicle Availability by Sex in Neskowin
The most prevalent vehicle ownership categories in Neskowin are males with 2 vehicles (22, accounting for 100.0%) and females with 2 vehicles (24, making up 51.2%).
| Vehicles Available | Male | Female |
| No Vehicle | 0 (0.0%) | 0 (0.0%) |
| 1 Vehicle | 0 (0.0%) | 0 (0.0%) |
| 2 Vehicles | 22 (100.0%) | 24 (55.8%) |
| 3 Vehicles | 0 (0.0%) | 19 (44.2%) |
| 4 Vehicles | 0 (0.0%) | 0 (0.0%) |
| 5 or more Vehicles | 0 (0.0%) | 0 (0.0%) |
| Total | 22 (100.0%) | 43 (100.0%) |
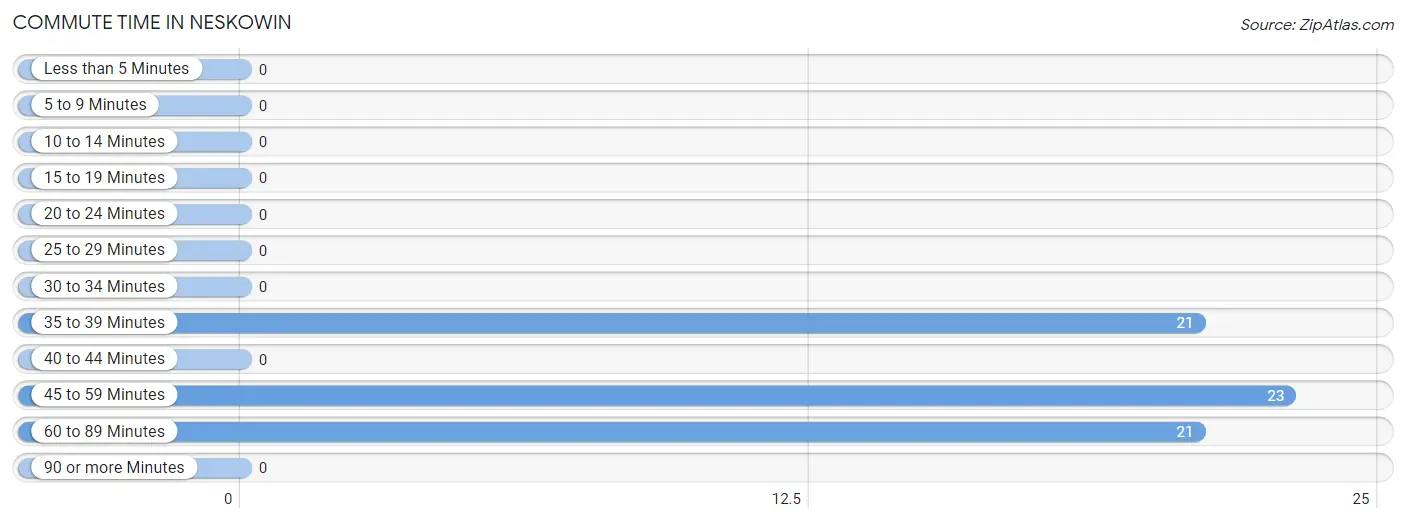
Commute Time in Neskowin
The most frequently occuring commute durations in Neskowin are 45 to 59 minutes (23 commuters, 35.4%), 35 to 39 minutes (21 commuters, 32.3%), and 60 to 89 minutes (21 commuters, 32.3%).
| Commute Time | # Commuters | % Commuters |
| Less than 5 Minutes | 0 | 0.0% |
| 5 to 9 Minutes | 0 | 0.0% |
| 10 to 14 Minutes | 0 | 0.0% |
| 15 to 19 Minutes | 0 | 0.0% |
| 20 to 24 Minutes | 0 | 0.0% |
| 25 to 29 Minutes | 0 | 0.0% |
| 30 to 34 Minutes | 0 | 0.0% |
| 35 to 39 Minutes | 21 | 32.3% |
| 40 to 44 Minutes | 0 | 0.0% |
| 45 to 59 Minutes | 23 | 35.4% |
| 60 to 89 Minutes | 21 | 32.3% |
| 90 or more Minutes | 0 | 0.0% |
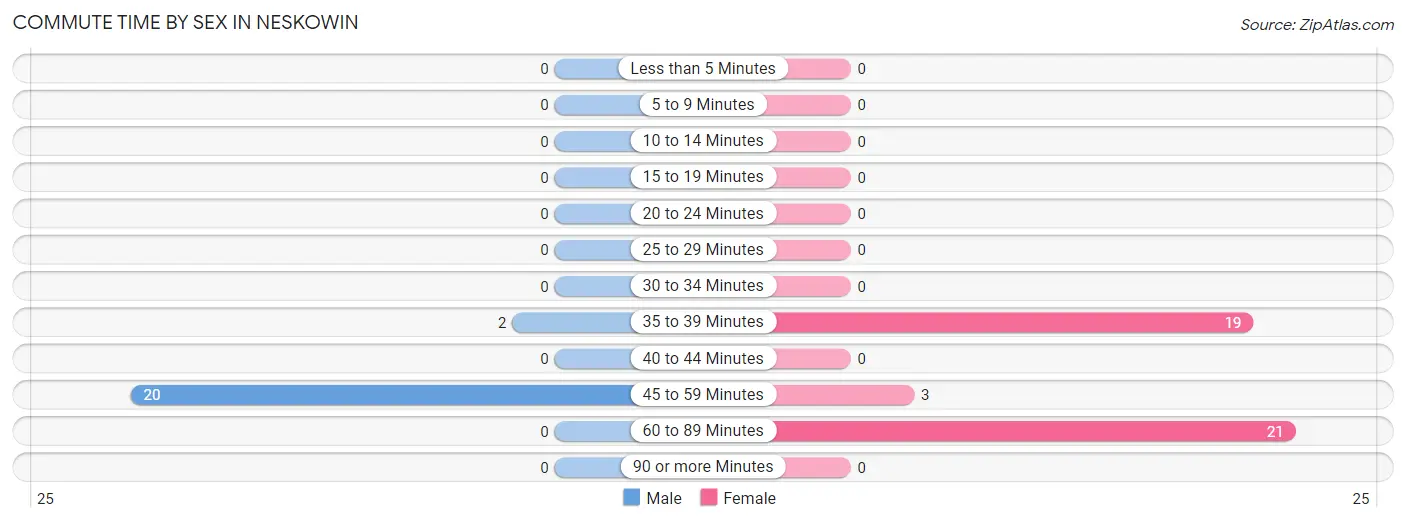
Commute Time by Sex in Neskowin
The most common commute times in Neskowin are 45 to 59 minutes (20 commuters, 90.9%) for males and 60 to 89 minutes (21 commuters, 48.8%) for females.
| Commute Time | Male | Female |
| Less than 5 Minutes | 0 (0.0%) | 0 (0.0%) |
| 5 to 9 Minutes | 0 (0.0%) | 0 (0.0%) |
| 10 to 14 Minutes | 0 (0.0%) | 0 (0.0%) |
| 15 to 19 Minutes | 0 (0.0%) | 0 (0.0%) |
| 20 to 24 Minutes | 0 (0.0%) | 0 (0.0%) |
| 25 to 29 Minutes | 0 (0.0%) | 0 (0.0%) |
| 30 to 34 Minutes | 0 (0.0%) | 0 (0.0%) |
| 35 to 39 Minutes | 2 (9.1%) | 19 (44.2%) |
| 40 to 44 Minutes | 0 (0.0%) | 0 (0.0%) |
| 45 to 59 Minutes | 20 (90.9%) | 3 (7.0%) |
| 60 to 89 Minutes | 0 (0.0%) | 21 (48.8%) |
| 90 or more Minutes | 0 (0.0%) | 0 (0.0%) |
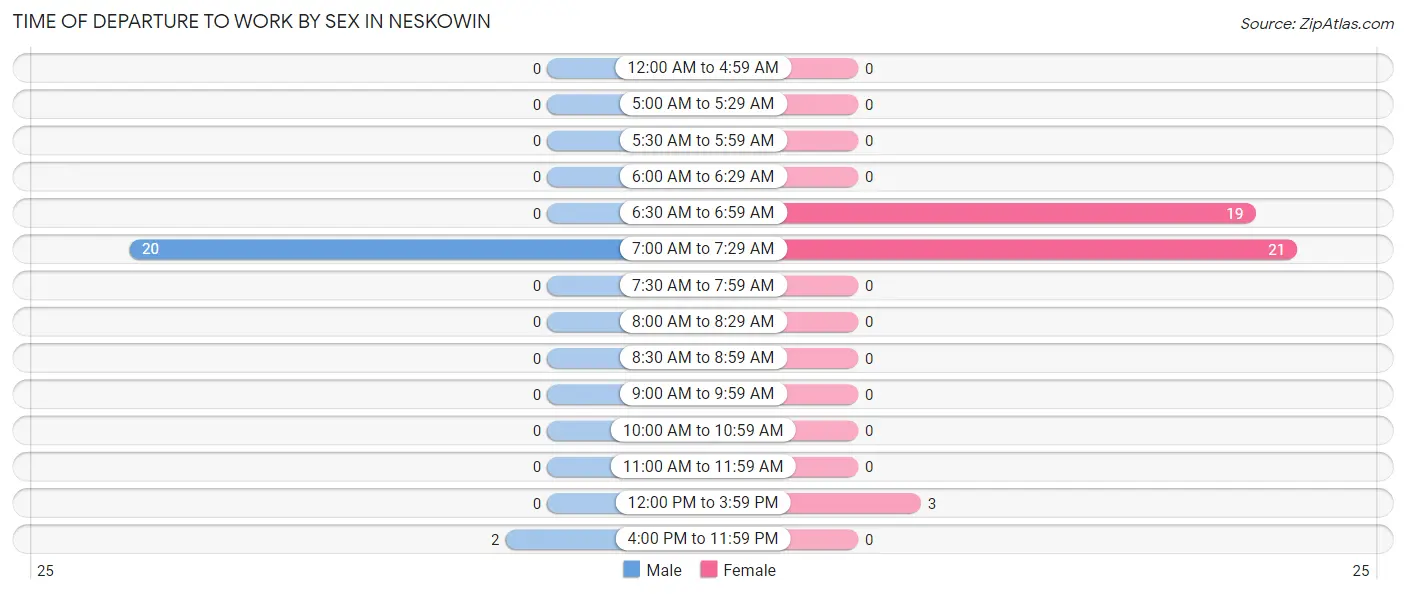
Time of Departure to Work by Sex in Neskowin
The most frequent times of departure to work in Neskowin are 7:00 AM to 7:29 AM (20, 90.9%) for males and 7:00 AM to 7:29 AM (21, 48.8%) for females.
| Time of Departure | Male | Female |
| 12:00 AM to 4:59 AM | 0 (0.0%) | 0 (0.0%) |
| 5:00 AM to 5:29 AM | 0 (0.0%) | 0 (0.0%) |
| 5:30 AM to 5:59 AM | 0 (0.0%) | 0 (0.0%) |
| 6:00 AM to 6:29 AM | 0 (0.0%) | 0 (0.0%) |
| 6:30 AM to 6:59 AM | 0 (0.0%) | 19 (44.2%) |
| 7:00 AM to 7:29 AM | 20 (90.9%) | 21 (48.8%) |
| 7:30 AM to 7:59 AM | 0 (0.0%) | 0 (0.0%) |
| 8:00 AM to 8:29 AM | 0 (0.0%) | 0 (0.0%) |
| 8:30 AM to 8:59 AM | 0 (0.0%) | 0 (0.0%) |
| 9:00 AM to 9:59 AM | 0 (0.0%) | 0 (0.0%) |
| 10:00 AM to 10:59 AM | 0 (0.0%) | 0 (0.0%) |
| 11:00 AM to 11:59 AM | 0 (0.0%) | 0 (0.0%) |
| 12:00 PM to 3:59 PM | 0 (0.0%) | 3 (7.0%) |
| 4:00 PM to 11:59 PM | 2 (9.1%) | 0 (0.0%) |
| Total | 22 (100.0%) | 43 (100.0%) |
Housing Occupancy in Neskowin
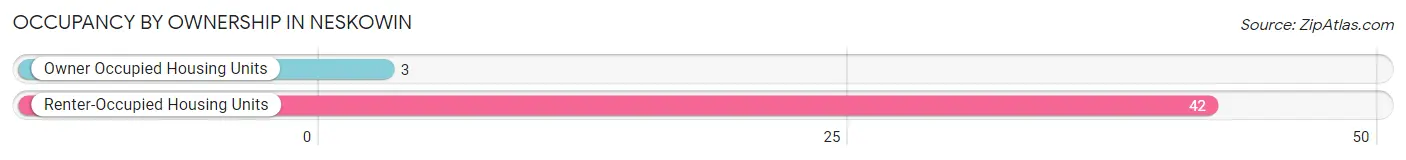
Occupancy by Ownership in Neskowin
Of the total 45 dwellings in Neskowin, owner-occupied units account for 3 (6.7%), while renter-occupied units make up 42 (93.3%).
| Occupancy | # Housing Units | % Housing Units |
| Owner Occupied Housing Units | 3 | 6.7% |
| Renter-Occupied Housing Units | 42 | 93.3% |
| Total Occupied Housing Units | 45 | 100.0% |
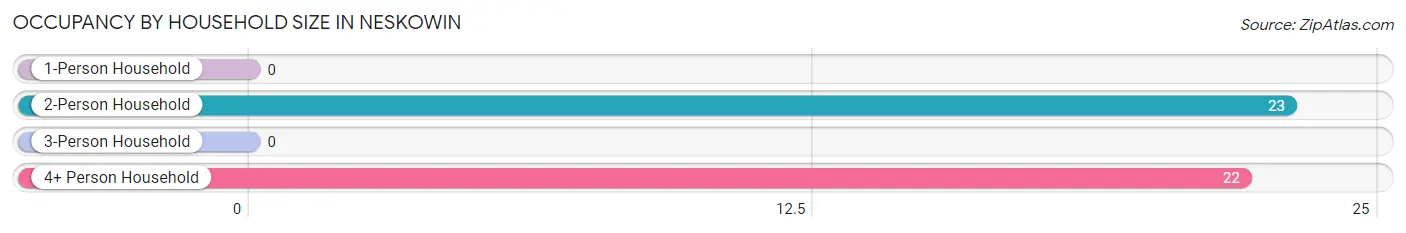
Occupancy by Household Size in Neskowin
| Household Size | # Housing Units | % Housing Units |
| 1-Person Household | 0 | 0.0% |
| 2-Person Household | 23 | 51.1% |
| 3-Person Household | 0 | 0.0% |
| 4+ Person Household | 22 | 48.9% |
| Total Housing Units | 45 | 100.0% |
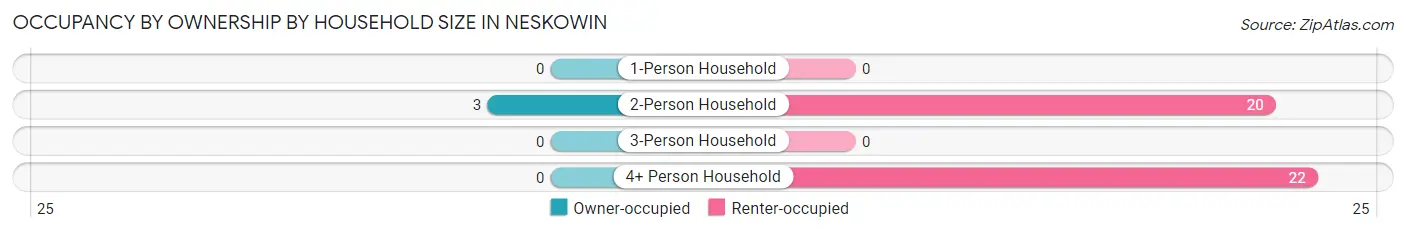
Occupancy by Ownership by Household Size in Neskowin
| Household Size | Owner-occupied | Renter-occupied |
| 1-Person Household | 0 (0.0%) | 0 (0.0%) |
| 2-Person Household | 3 (13.0%) | 20 (87.0%) |
| 3-Person Household | 0 (0.0%) | 0 (0.0%) |
| 4+ Person Household | 0 (0.0%) | 22 (100.0%) |
| Total Housing Units | 3 (6.7%) | 42 (93.3%) |
Occupancy by Educational Attainment in Neskowin
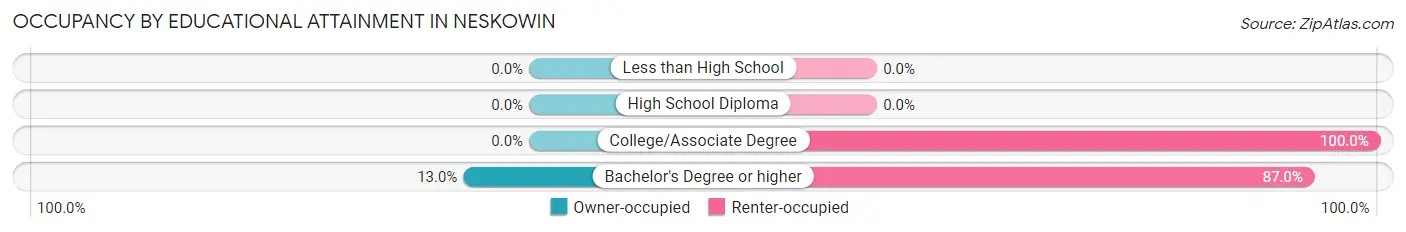
| Household Size | Owner-occupied | Renter-occupied |
| Less than High School | 0 (0.0%) | 0 (0.0%) |
| High School Diploma | 0 (0.0%) | 0 (0.0%) |
| College/Associate Degree | 0 (0.0%) | 22 (100.0%) |
| Bachelor's Degree or higher | 3 (13.0%) | 20 (87.0%) |
Occupancy by Age of Householder in Neskowin
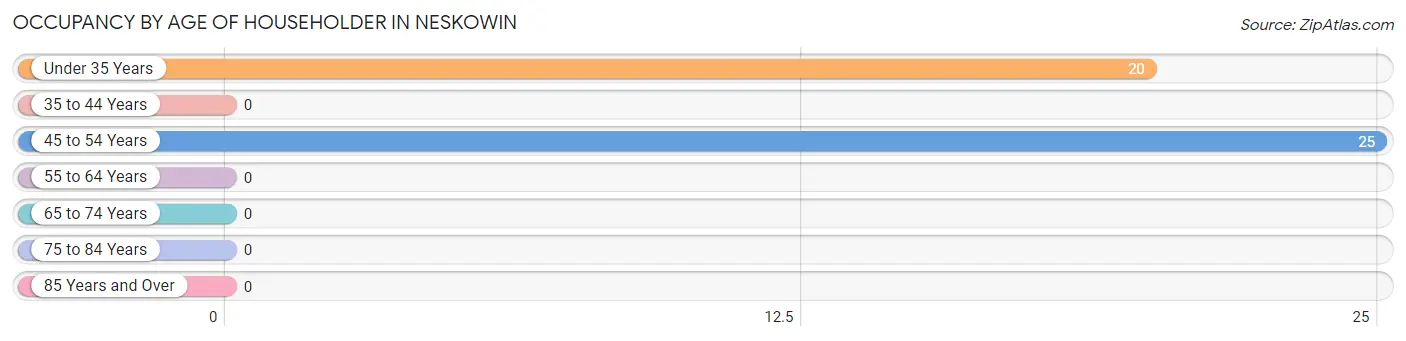
| Age Bracket | # Households | % Households |
| Under 35 Years | 20 | 44.4% |
| 35 to 44 Years | 0 | 0.0% |
| 45 to 54 Years | 25 | 55.6% |
| 55 to 64 Years | 0 | 0.0% |
| 65 to 74 Years | 0 | 0.0% |
| 75 to 84 Years | 0 | 0.0% |
| 85 Years and Over | 0 | 0.0% |
| Total | 45 | 100.0% |
Housing Finances in Neskowin
Median Income by Occupancy in Neskowin
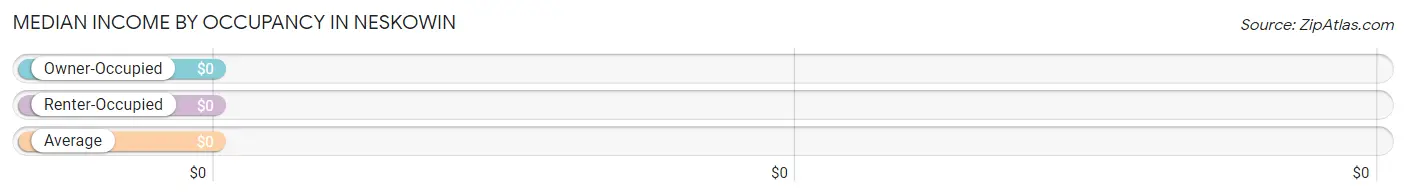
| Occupancy Type | # Households | Median Income |
| Owner-Occupied | 3 (6.7%) | $0 |
| Renter-Occupied | 42 (93.3%) | $0 |
| Average | 45 (100.0%) | $0 |
Occupancy by Householder Income Bracket in Neskowin
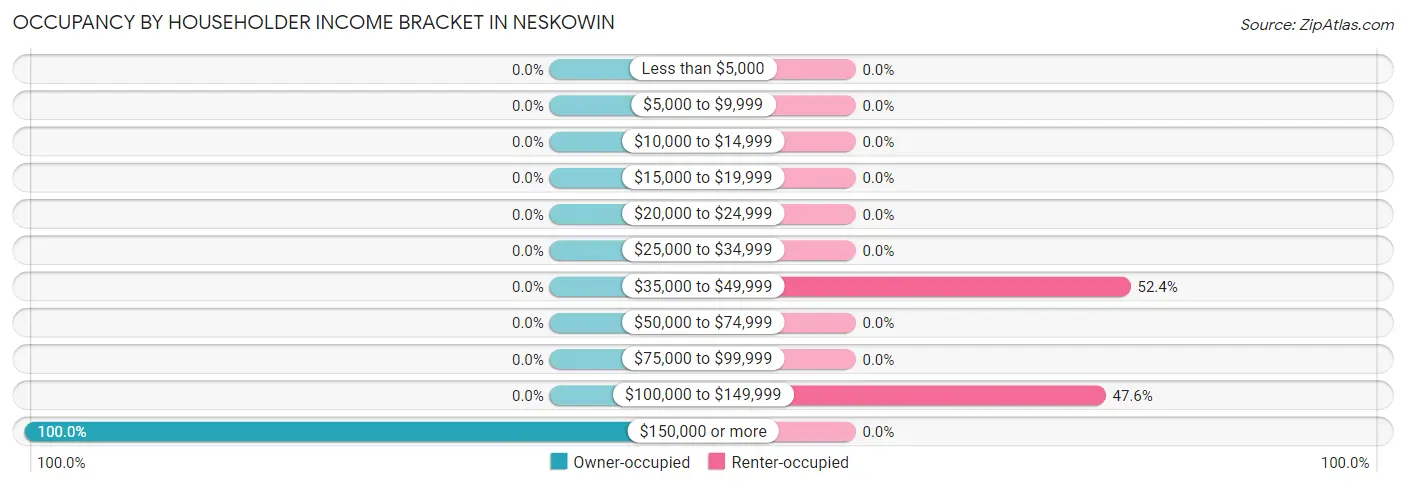
| Income Bracket | Owner-occupied | Renter-occupied |
| Less than $5,000 | 0 (0.0%) | 0 (0.0%) |
| $5,000 to $9,999 | 0 (0.0%) | 0 (0.0%) |
| $10,000 to $14,999 | 0 (0.0%) | 0 (0.0%) |
| $15,000 to $19,999 | 0 (0.0%) | 0 (0.0%) |
| $20,000 to $24,999 | 0 (0.0%) | 0 (0.0%) |
| $25,000 to $34,999 | 0 (0.0%) | 0 (0.0%) |
| $35,000 to $49,999 | 0 (0.0%) | 22 (52.4%) |
| $50,000 to $74,999 | 0 (0.0%) | 0 (0.0%) |
| $75,000 to $99,999 | 0 (0.0%) | 0 (0.0%) |
| $100,000 to $149,999 | 0 (0.0%) | 20 (47.6%) |
| $150,000 or more | 3 (100.0%) | 0 (0.0%) |
| Total | 3 (100.0%) | 42 (100.0%) |
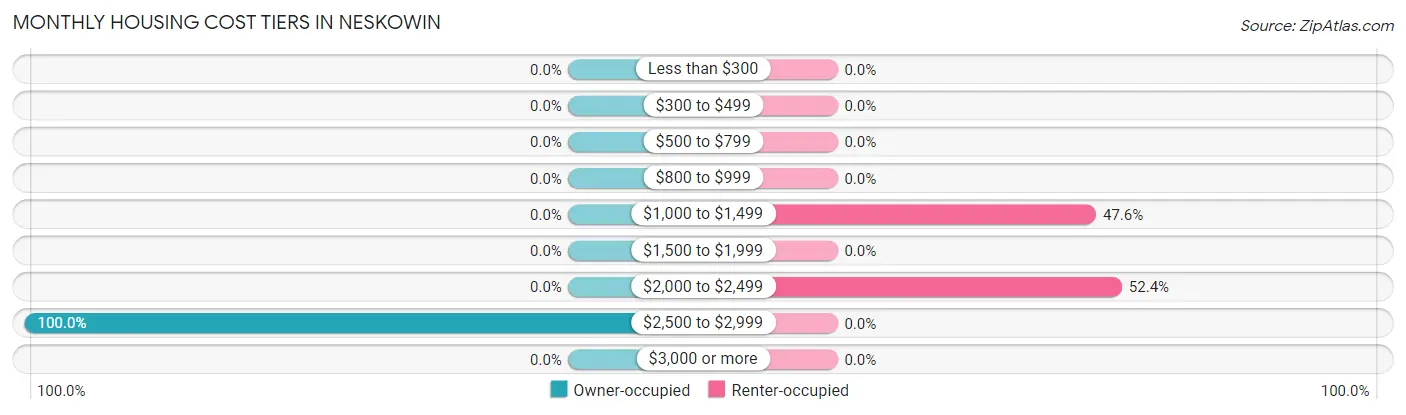
Monthly Housing Cost Tiers in Neskowin
| Monthly Cost | Owner-occupied | Renter-occupied |
| Less than $300 | 0 (0.0%) | 0 (0.0%) |
| $300 to $499 | 0 (0.0%) | 0 (0.0%) |
| $500 to $799 | 0 (0.0%) | 0 (0.0%) |
| $800 to $999 | 0 (0.0%) | 0 (0.0%) |
| $1,000 to $1,499 | 0 (0.0%) | 20 (47.6%) |
| $1,500 to $1,999 | 0 (0.0%) | 0 (0.0%) |
| $2,000 to $2,499 | 0 (0.0%) | 22 (52.4%) |
| $2,500 to $2,999 | 3 (100.0%) | 0 (0.0%) |
| $3,000 or more | 0 (0.0%) | 0 (0.0%) |
| Total | 3 (100.0%) | 42 (100.0%) |
Physical Housing Characteristics in Neskowin
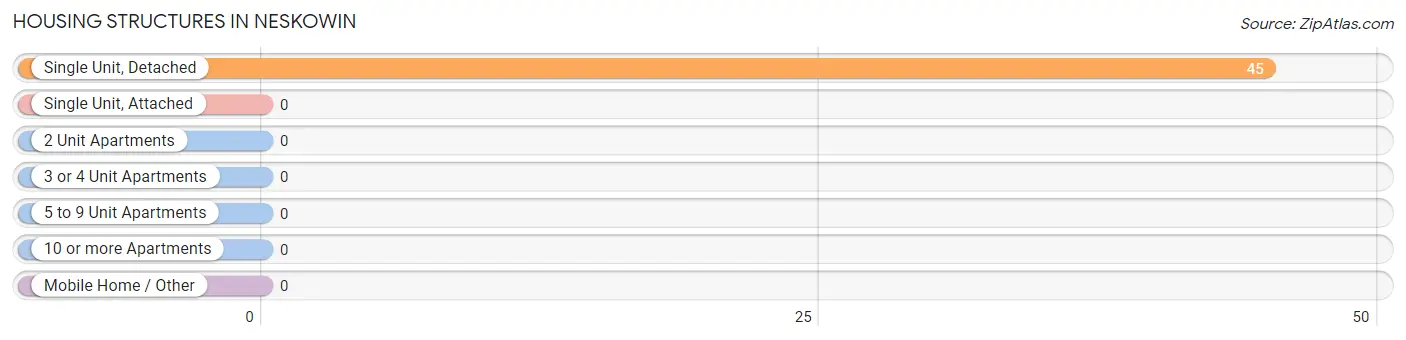
Housing Structures in Neskowin
| Structure Type | # Housing Units | % Housing Units |
| Single Unit, Detached | 45 | 100.0% |
| Single Unit, Attached | 0 | 0.0% |
| 2 Unit Apartments | 0 | 0.0% |
| 3 or 4 Unit Apartments | 0 | 0.0% |
| 5 to 9 Unit Apartments | 0 | 0.0% |
| 10 or more Apartments | 0 | 0.0% |
| Mobile Home / Other | 0 | 0.0% |
| Total | 45 | 100.0% |
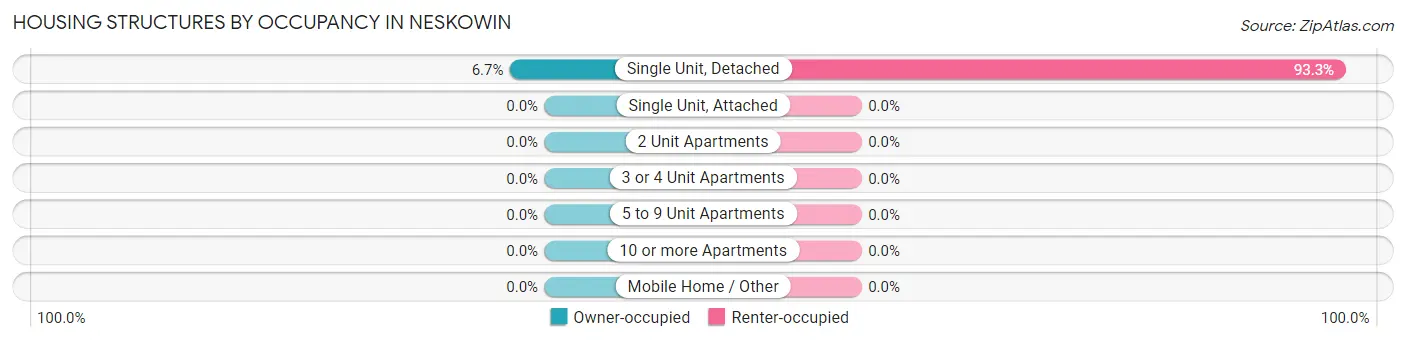
Housing Structures by Occupancy in Neskowin
| Structure Type | Owner-occupied | Renter-occupied |
| Single Unit, Detached | 3 (6.7%) | 42 (93.3%) |
| Single Unit, Attached | 0 (0.0%) | 0 (0.0%) |
| 2 Unit Apartments | 0 (0.0%) | 0 (0.0%) |
| 3 or 4 Unit Apartments | 0 (0.0%) | 0 (0.0%) |
| 5 to 9 Unit Apartments | 0 (0.0%) | 0 (0.0%) |
| 10 or more Apartments | 0 (0.0%) | 0 (0.0%) |
| Mobile Home / Other | 0 (0.0%) | 0 (0.0%) |
| Total | 3 (6.7%) | 42 (93.3%) |
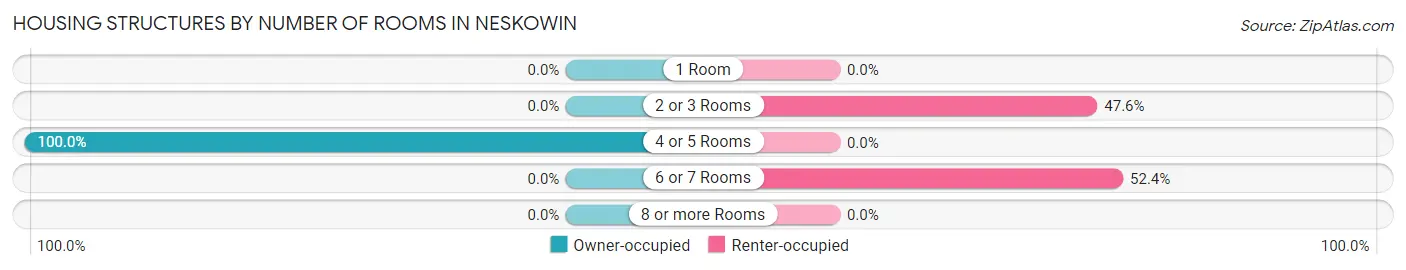
Housing Structures by Number of Rooms in Neskowin
| Number of Rooms | Owner-occupied | Renter-occupied |
| 1 Room | 0 (0.0%) | 0 (0.0%) |
| 2 or 3 Rooms | 0 (0.0%) | 20 (47.6%) |
| 4 or 5 Rooms | 3 (100.0%) | 0 (0.0%) |
| 6 or 7 Rooms | 0 (0.0%) | 22 (52.4%) |
| 8 or more Rooms | 0 (0.0%) | 0 (0.0%) |
| Total | 3 (100.0%) | 42 (100.0%) |
Housing Structure by Heating Type in Neskowin
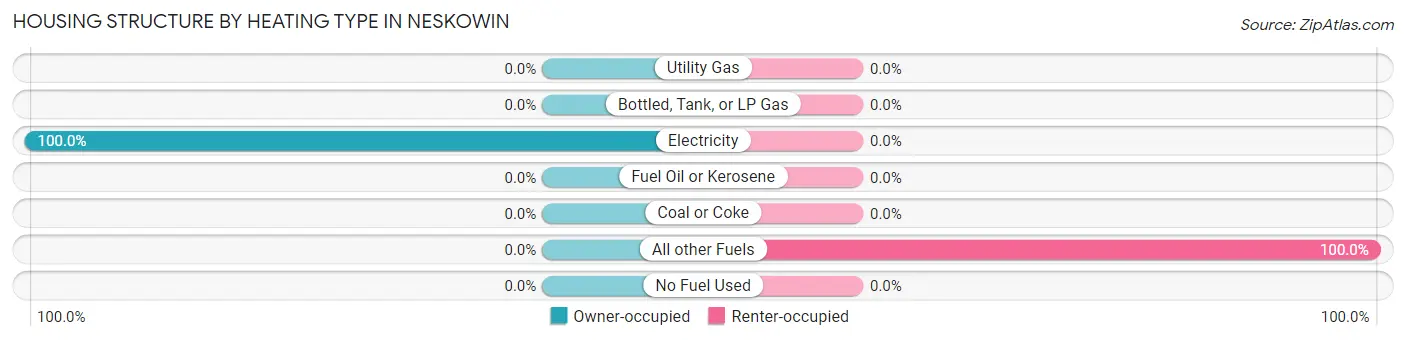
| Heating Type | Owner-occupied | Renter-occupied |
| Utility Gas | 0 (0.0%) | 0 (0.0%) |
| Bottled, Tank, or LP Gas | 0 (0.0%) | 0 (0.0%) |
| Electricity | 3 (100.0%) | 0 (0.0%) |
| Fuel Oil or Kerosene | 0 (0.0%) | 0 (0.0%) |
| Coal or Coke | 0 (0.0%) | 0 (0.0%) |
| All other Fuels | 0 (0.0%) | 42 (100.0%) |
| No Fuel Used | 0 (0.0%) | 0 (0.0%) |
| Total | 3 (100.0%) | 42 (100.0%) |
Household Vehicle Usage in Neskowin
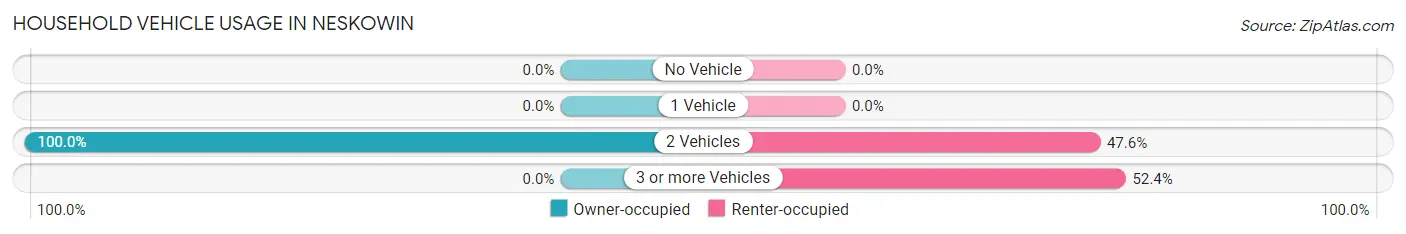
| Vehicles per Household | Owner-occupied | Renter-occupied |
| No Vehicle | 0 (0.0%) | 0 (0.0%) |
| 1 Vehicle | 0 (0.0%) | 0 (0.0%) |
| 2 Vehicles | 3 (100.0%) | 20 (47.6%) |
| 3 or more Vehicles | 0 (0.0%) | 22 (52.4%) |
| Total | 3 (100.0%) | 42 (100.0%) |
Real Estate & Mortgages in Neskowin
Real Estate and Mortgage Overview in Neskowin
| Characteristic | Without Mortgage | With Mortgage |
| Housing Units | 0 | 3 |
| Median Property Value | - | - |
| Median Household Income | - | - |
| Monthly Housing Costs | - | - |
| Real Estate Taxes | - | - |
Property Value by Mortgage Status in Neskowin
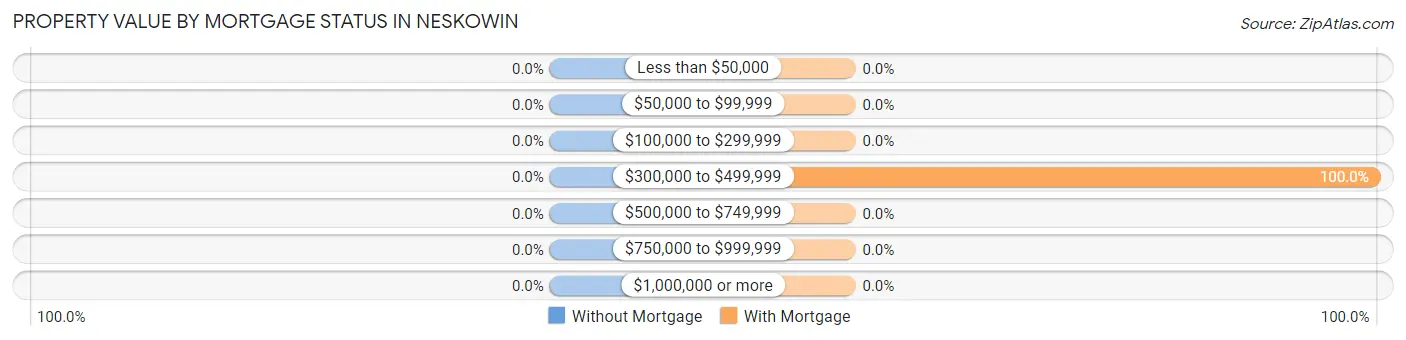
| Property Value | Without Mortgage | With Mortgage |
| Less than $50,000 | 0 (0.0%) | 0 (0.0%) |
| $50,000 to $99,999 | 0 (0.0%) | 0 (0.0%) |
| $100,000 to $299,999 | 0 (0.0%) | 0 (0.0%) |
| $300,000 to $499,999 | 0 (0.0%) | 3 (100.0%) |
| $500,000 to $749,999 | 0 (0.0%) | 0 (0.0%) |
| $750,000 to $999,999 | 0 (0.0%) | 0 (0.0%) |
| $1,000,000 or more | 0 (0.0%) | 0 (0.0%) |
| Total | 0 (0.0%) | 3 (100.0%) |
Household Income by Mortgage Status in Neskowin
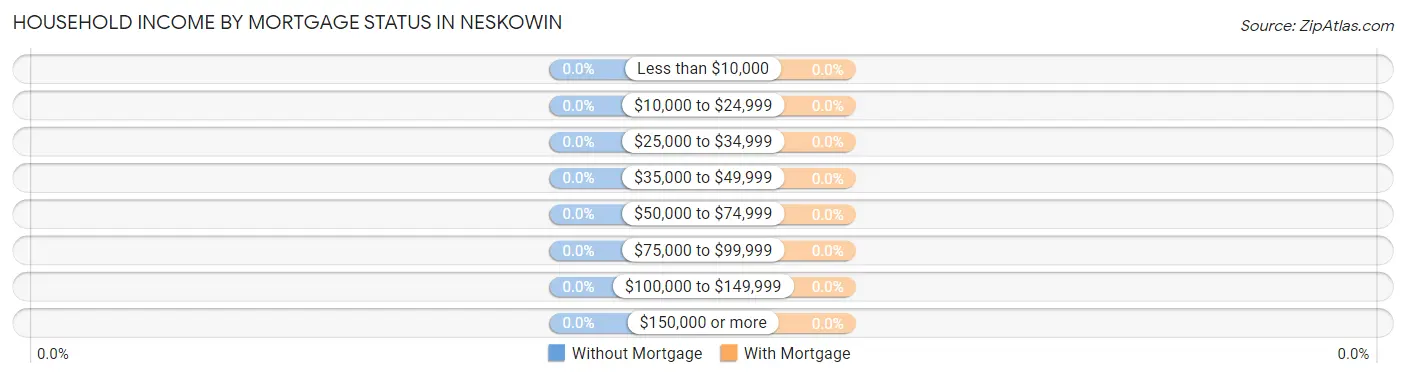
| Household Income | Without Mortgage | With Mortgage |
| Less than $10,000 | 0 (0.0%) | 0 (0.0%) |
| $10,000 to $24,999 | 0 (0.0%) | 0 (0.0%) |
| $25,000 to $34,999 | 0 (0.0%) | 0 (0.0%) |
| $35,000 to $49,999 | 0 (0.0%) | 0 (0.0%) |
| $50,000 to $74,999 | 0 (0.0%) | 0 (0.0%) |
| $75,000 to $99,999 | 0 (0.0%) | 0 (0.0%) |
| $100,000 to $149,999 | 0 (0.0%) | 0 (0.0%) |
| $150,000 or more | 0 (0.0%) | 0 (0.0%) |
| Total | 0 (0.0%) | 3 (100.0%) |
Property Value to Household Income Ratio in Neskowin
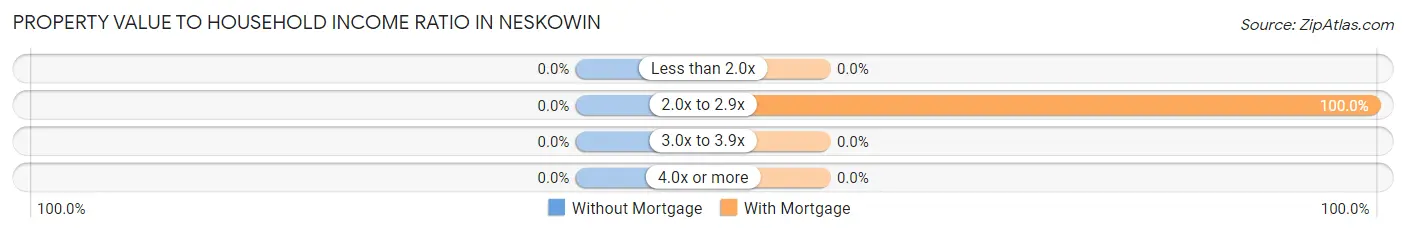
| Value-to-Income Ratio | Without Mortgage | With Mortgage |
| Less than 2.0x | 0 (0.0%) | 0 (0.0%) |
| 2.0x to 2.9x | 0 (0.0%) | 3 (100.0%) |
| 3.0x to 3.9x | 0 (0.0%) | 0 (0.0%) |
| 4.0x or more | 0 (0.0%) | 0 (0.0%) |
| Total | 0 (0.0%) | 3 (100.0%) |
Real Estate Taxes by Mortgage Status in Neskowin
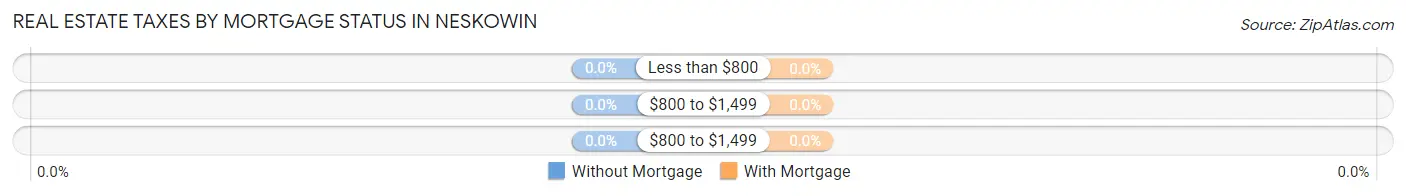
| Property Taxes | Without Mortgage | With Mortgage |
| Less than $800 | 0 (0.0%) | 0 (0.0%) |
| $800 to $1,499 | 0 (0.0%) | 0 (0.0%) |
| $800 to $1,499 | 0 (0.0%) | 0 (0.0%) |
| Total | 0 (0.0%) | 3 (100.0%) |
Health & Disability in Neskowin
Health Insurance Coverage by Age in Neskowin
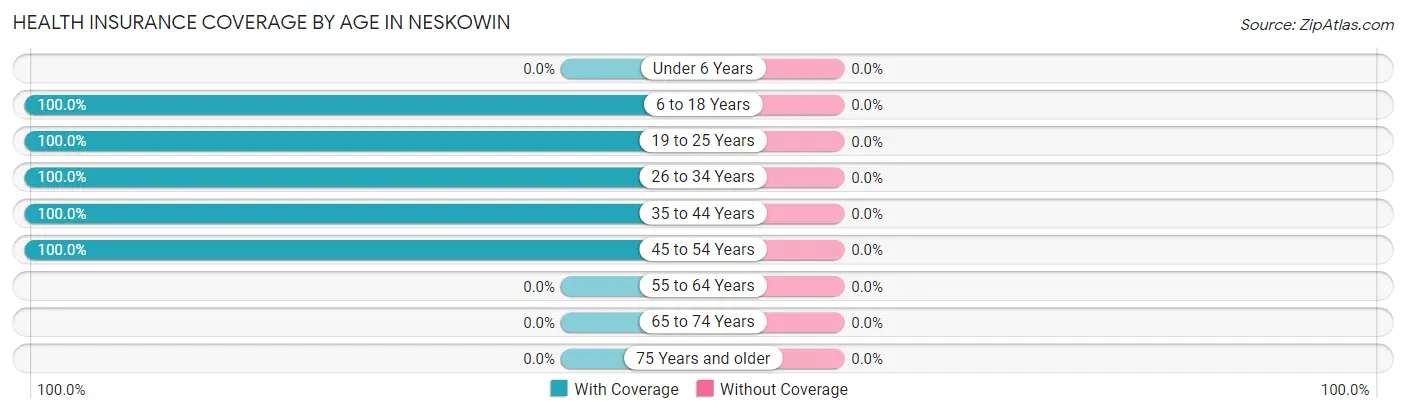
| Age Bracket | With Coverage | Without Coverage |
| Under 6 Years | 0 (0.0%) | 0 (0.0%) |
| 6 to 18 Years | 32 (100.0%) | 0 (0.0%) |
| 19 to 25 Years | 58 (100.0%) | 0 (0.0%) |
| 26 to 34 Years | 41 (100.0%) | 0 (0.0%) |
| 35 to 44 Years | 19 (100.0%) | 0 (0.0%) |
| 45 to 54 Years | 27 (100.0%) | 0 (0.0%) |
| 55 to 64 Years | 0 (0.0%) | 0 (0.0%) |
| 65 to 74 Years | 0 (0.0%) | 0 (0.0%) |
| 75 Years and older | 0 (0.0%) | 0 (0.0%) |
| Total | 177 (100.0%) | 0 (0.0%) |
Health Insurance Coverage by Citizenship Status in Neskowin
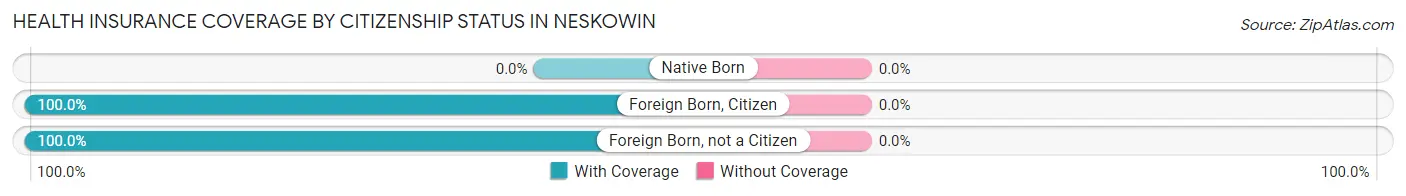
| Citizenship Status | With Coverage | Without Coverage |
| Native Born | 0 (0.0%) | 0 (0.0%) |
| Foreign Born, Citizen | 32 (100.0%) | 0 (0.0%) |
| Foreign Born, not a Citizen | 58 (100.0%) | 0 (0.0%) |
Health Insurance Coverage by Household Income in Neskowin
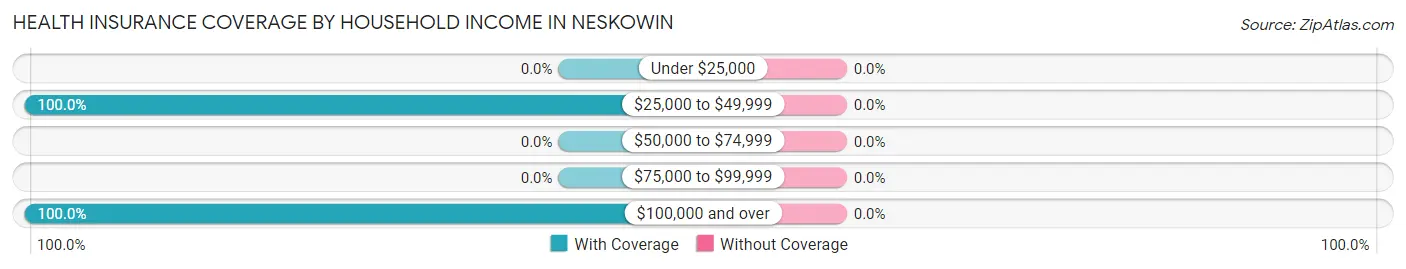
| Household Income | With Coverage | Without Coverage |
| Under $25,000 | 0 (0.0%) | 0 (0.0%) |
| $25,000 to $49,999 | 131 (100.0%) | 0 (0.0%) |
| $50,000 to $74,999 | 0 (0.0%) | 0 (0.0%) |
| $75,000 to $99,999 | 0 (0.0%) | 0 (0.0%) |
| $100,000 and over | 46 (100.0%) | 0 (0.0%) |
Public vs Private Health Insurance Coverage by Age in Neskowin
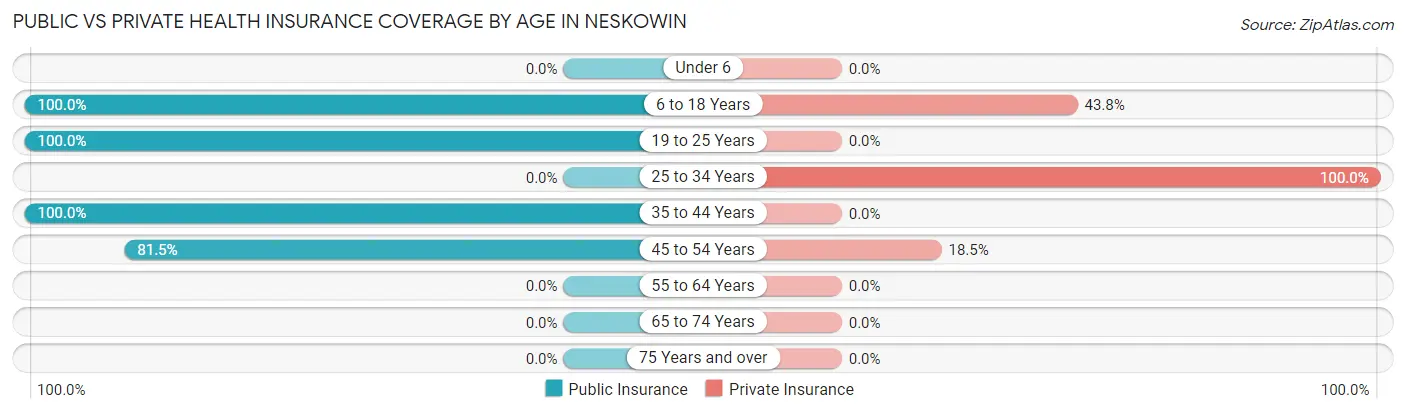
| Age Bracket | Public Insurance | Private Insurance |
| Under 6 | 0 (0.0%) | 0 (0.0%) |
| 6 to 18 Years | 32 (100.0%) | 14 (43.8%) |
| 19 to 25 Years | 58 (100.0%) | 0 (0.0%) |
| 25 to 34 Years | 0 (0.0%) | 41 (100.0%) |
| 35 to 44 Years | 19 (100.0%) | 0 (0.0%) |
| 45 to 54 Years | 22 (81.5%) | 5 (18.5%) |
| 55 to 64 Years | 0 (0.0%) | 0 (0.0%) |
| 65 to 74 Years | 0 (0.0%) | 0 (0.0%) |
| 75 Years and over | 0 (0.0%) | 0 (0.0%) |
| Total | 131 (74.0%) | 60 (33.9%) |
Disability Status by Sex by Age in Neskowin
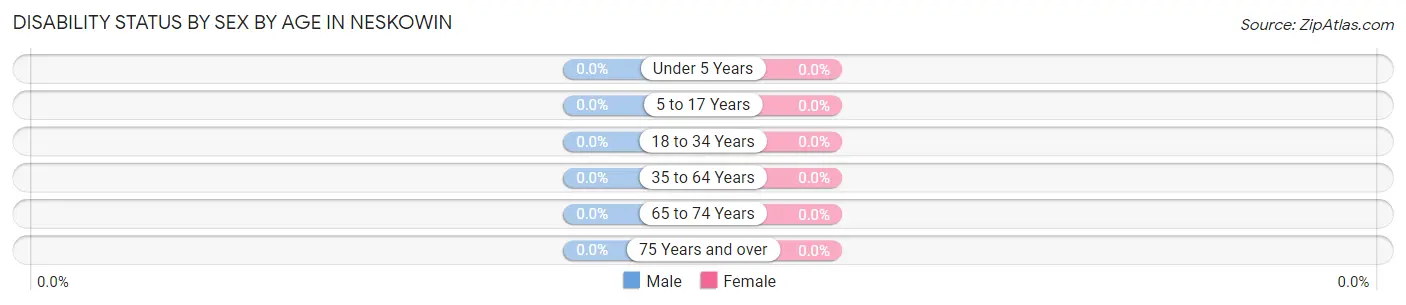
| Age Bracket | Male | Female |
| Under 5 Years | 0 (0.0%) | 0 (0.0%) |
| 5 to 17 Years | 0 (0.0%) | 0 (0.0%) |
| 18 to 34 Years | 0 (0.0%) | 0 (0.0%) |
| 35 to 64 Years | 0 (0.0%) | 0 (0.0%) |
| 65 to 74 Years | 0 (0.0%) | 0 (0.0%) |
| 75 Years and over | 0 (0.0%) | 0 (0.0%) |
Disability Class by Sex by Age in Neskowin
Disability Class: Hearing Difficulty
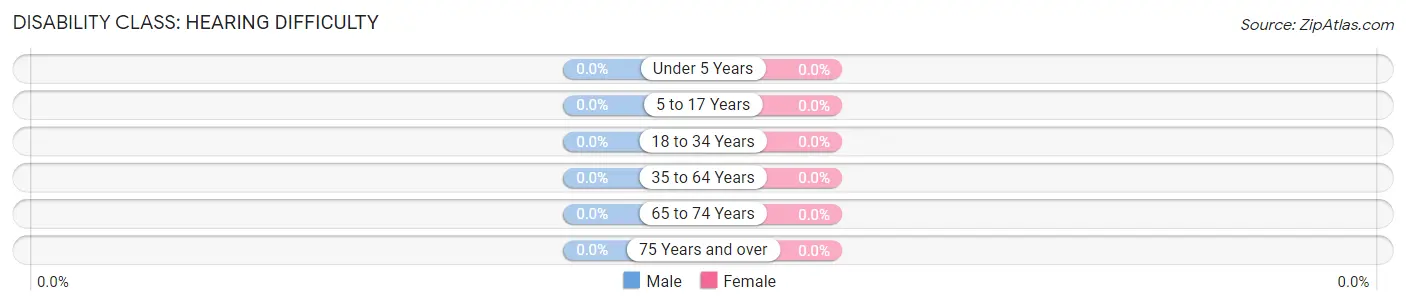
| Age Bracket | Male | Female |
| Under 5 Years | 0 (0.0%) | 0 (0.0%) |
| 5 to 17 Years | 0 (0.0%) | 0 (0.0%) |
| 18 to 34 Years | 0 (0.0%) | 0 (0.0%) |
| 35 to 64 Years | 0 (0.0%) | 0 (0.0%) |
| 65 to 74 Years | 0 (0.0%) | 0 (0.0%) |
| 75 Years and over | 0 (0.0%) | 0 (0.0%) |
Disability Class: Vision Difficulty
| Age Bracket | Male | Female |
| Under 5 Years | 0 (0.0%) | 0 (0.0%) |
| 5 to 17 Years | 0 (0.0%) | 0 (0.0%) |
| 18 to 34 Years | 0 (0.0%) | 0 (0.0%) |
| 35 to 64 Years | 0 (0.0%) | 0 (0.0%) |
| 65 to 74 Years | 0 (0.0%) | 0 (0.0%) |
| 75 Years and over | 0 (0.0%) | 0 (0.0%) |
Disability Class: Cognitive Difficulty

| Age Bracket | Male | Female |
| 5 to 17 Years | 0 (0.0%) | 0 (0.0%) |
| 18 to 34 Years | 0 (0.0%) | 0 (0.0%) |
| 35 to 64 Years | 0 (0.0%) | 0 (0.0%) |
| 65 to 74 Years | 0 (0.0%) | 0 (0.0%) |
| 75 Years and over | 0 (0.0%) | 0 (0.0%) |
Disability Class: Ambulatory Difficulty
| Age Bracket | Male | Female |
| 5 to 17 Years | 0 (0.0%) | 0 (0.0%) |
| 18 to 34 Years | 0 (0.0%) | 0 (0.0%) |
| 35 to 64 Years | 0 (0.0%) | 0 (0.0%) |
| 65 to 74 Years | 0 (0.0%) | 0 (0.0%) |
| 75 Years and over | 0 (0.0%) | 0 (0.0%) |
Disability Class: Self-Care Difficulty
| Age Bracket | Male | Female |
| 5 to 17 Years | 0 (0.0%) | 0 (0.0%) |
| 18 to 34 Years | 0 (0.0%) | 0 (0.0%) |
| 35 to 64 Years | 0 (0.0%) | 0 (0.0%) |
| 65 to 74 Years | 0 (0.0%) | 0 (0.0%) |
| 75 Years and over | 0 (0.0%) | 0 (0.0%) |
Technology Access in Neskowin
Computing Device Access in Neskowin
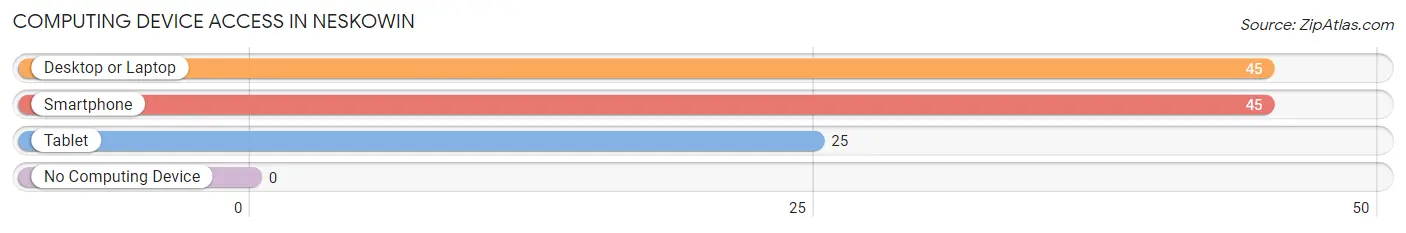
| Device Type | # Households | % Households |
| Desktop or Laptop | 45 | 100.0% |
| Smartphone | 45 | 100.0% |
| Tablet | 25 | 55.6% |
| No Computing Device | 0 | 0.0% |
| Total | 45 | 100.0% |
Internet Access in Neskowin
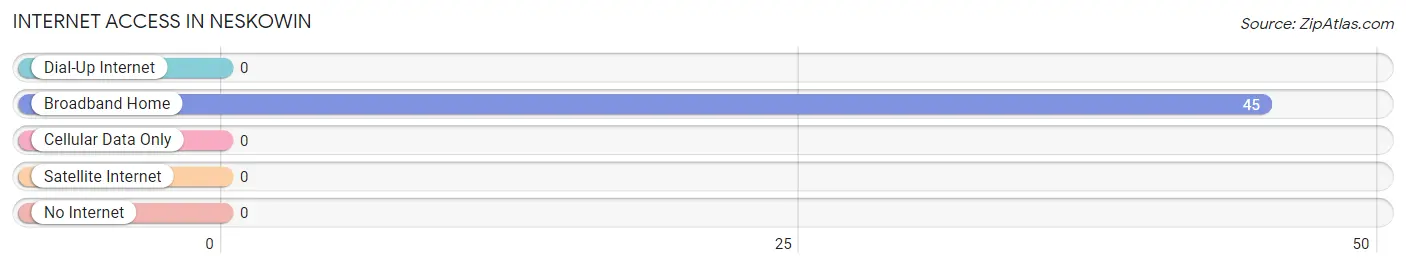
| Internet Type | # Households | % Households |
| Dial-Up Internet | 0 | 0.0% |
| Broadband Home | 45 | 100.0% |
| Cellular Data Only | 0 | 0.0% |
| Satellite Internet | 0 | 0.0% |
| No Internet | 0 | 0.0% |
| Total | 45 | 100.0% |
Neskowin Summary
Neskowin is a small unincorporated community located in Tillamook County, Oregon, United States. It is situated on the Oregon Coast, approximately 50 miles (80 km) southwest of Portland. The population of Neskowin was estimated to be around 300 in 2000.
History
The area now known as Neskowin was first inhabited by the Tillamook people, who lived in the area for thousands of years before the arrival of European settlers. The first European settlers arrived in the area in the late 19th century, and the town was officially established in 1891. The town was named after the Neskowin Creek, which flows through the area.
The town was initially a logging and fishing community, and the local economy was largely based on these industries. In the early 20th century, the town began to attract tourists, and the local economy shifted to focus on tourism. The town was also home to a number of resorts, which attracted visitors from all over the country.
Geography
Neskowin is located on the Oregon Coast, approximately 50 miles (80 km) southwest of Portland. The town is situated on a peninsula, surrounded by the Pacific Ocean to the west and Neskowin Creek to the east. The town is located in a temperate rainforest climate, with mild temperatures and high precipitation.
The town is home to a number of beaches, including Proposal Rock Beach, Neskowin Beach, and Hawk Creek Beach. The beaches are popular for swimming, surfing, and other beach activities. The town is also home to a number of parks, including Neskowin State Park and Hawk Creek State Natural Area.
Economy
The economy of Neskowin is largely based on tourism. The town is home to a number of resorts, hotels, and restaurants, which attract visitors from all over the country. The town is also home to a number of art galleries, which feature the work of local artists.
The town is also home to a number of small businesses, including a grocery store, a hardware store, and a post office. The local economy is also supported by the nearby Tillamook Cheese Factory, which is one of the largest cheese factories in the United States.
Demographics
The population of Neskowin was estimated to be around 300 in 2000. The town is predominantly white, with a small minority population. The median household income in the town is around $50,000, and the median home value is around $200,000. The town is served by the Tillamook County School District.
Common Questions
What is Per Capita Income in Neskowin?
Per Capita income in Neskowin is $20,411.
What is Inequality or Gini Index in Neskowin?
Inequality or Gini Index in Neskowin is 0.24.
What is the Total Population of Neskowin?
Total Population of Neskowin is 177.
What is the Total Male Population of Neskowin?
Total Male Population of Neskowin is 92.
What is the Total Female Population of Neskowin?
Total Female Population of Neskowin is 85.
What is the Ratio of Males per 100 Females in Neskowin?
There are 108.24 Males per 100 Females in Neskowin.
What is the Ratio of Females per 100 Males in Neskowin?
There are 92.39 Females per 100 Males in Neskowin.
What is the Median Population Age in Neskowin?
Median Population Age in Neskowin is 24.0 Years.
What is the Average Family Size in Neskowin
Average Family Size in Neskowin is 6.0 People.
What is the Average Household Size in Neskowin
Average Household Size in Neskowin is 3.9 People.
How Large is the Labor Force in Neskowin?
There are 121 People in the Labor Forcein in Neskowin.
What is the Percentage of People in the Labor Force in Neskowin?
83.4% of People are in the Labor Force in Neskowin.
What is the Unemployment Rate in Neskowin?
Unemployment Rate in Neskowin is 28.1%.