Zip Codes with the Highest Percentage of Population Employed in Life, Physical & Social Science in the United States
RELATED REPORTS & OPTIONS
Life, Physical & Social Science
United States
Compare Zip Codes
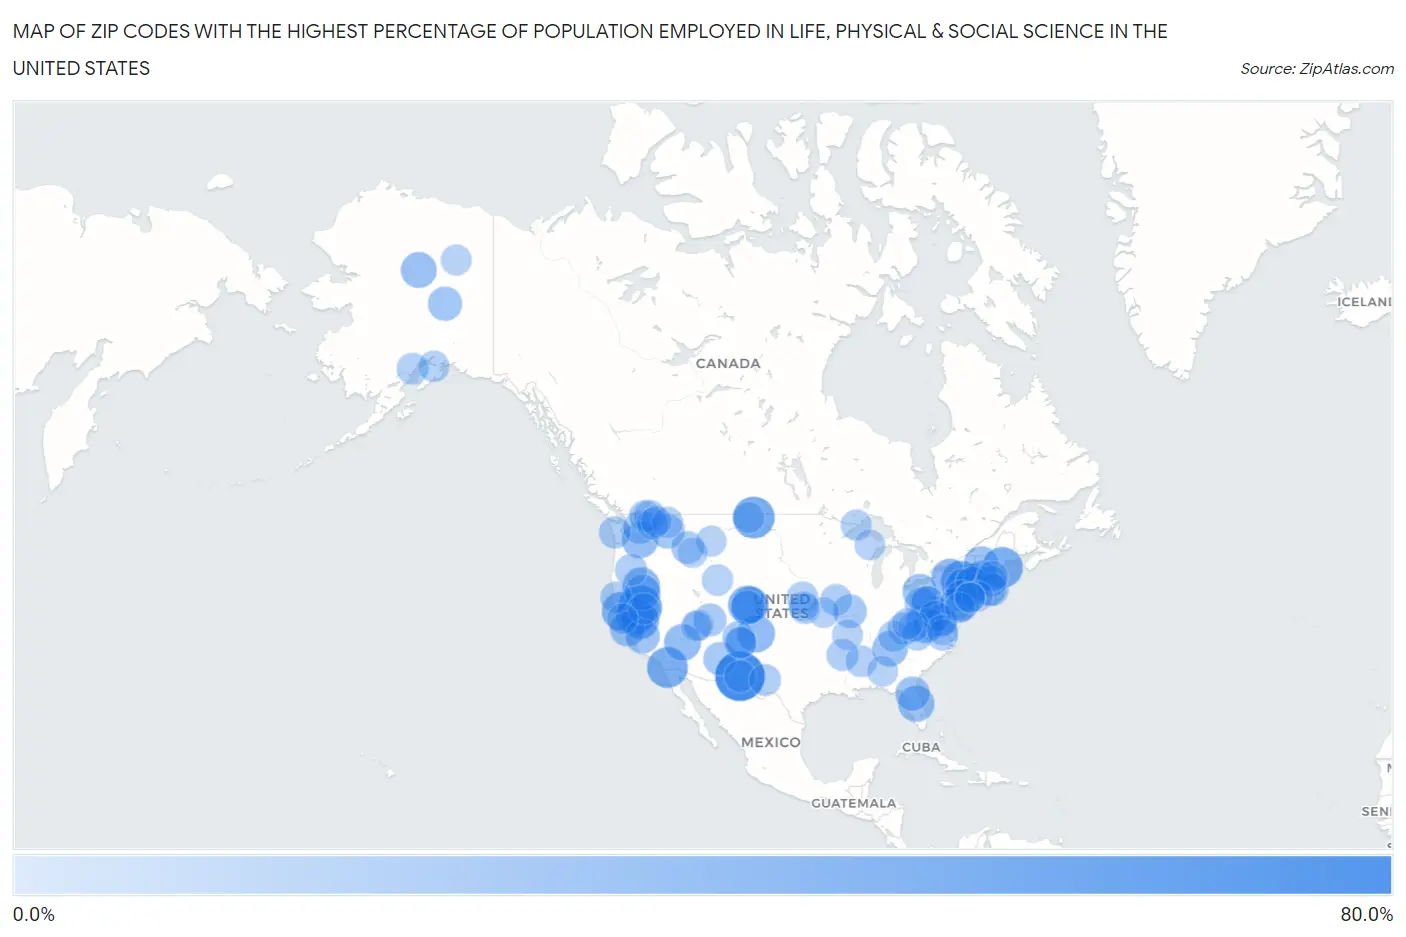
Map of Zip Codes with the Highest Percentage of Population Employed in Life, Physical & Social Science in the United States
0.0%
80.0%
Zip Codes with the Highest Percentage of Population Employed in Life, Physical & Social Science in the United States
| Zip Code | % Employed | vs State | vs National | |
| 1. | 79918 | 80.0% | 0.84%(+79.2)#1 | 1.1%(+78.9)#1 |
| 2. | 96124 | 60.1% | 1.3%(+58.8)#1 | 1.1%(+59.0)#2 |
| 3. | 59211 | 53.2% | 1.5%(+51.8)#1 | 1.1%(+52.2)#3 |
| 4. | 91948 | 50.0% | 1.3%(+48.7)#2 | 1.1%(+48.9)#4 |
| 5. | 12495 | 50.0% | 1.1%(+48.9)#1 | 1.1%(+48.9)#5 |
| 6. | 04541 | 50.0% | 1.1%(+48.9)#1 | 1.1%(+48.9)#6 |
| 7. | 13859 | 49.1% | 1.1%(+48.0)#2 | 1.1%(+48.0)#7 |
| 8. | 95493 | 43.5% | 1.3%(+42.2)#3 | 1.1%(+42.4)#8 |
| 9. | 80025 | 42.9% | 1.3%(+41.5)#1 | 1.1%(+41.8)#9 |
| 10. | 24957 | 42.2% | 0.95%(+41.3)#1 | 1.1%(+41.2)#10 |
| 11. | 19490 | 41.7% | 1.2%(+40.5)#1 | 1.1%(+40.6)#11 |
| 12. | 95671 | 41.7% | 1.3%(+40.4)#4 | 1.1%(+40.6)#12 |
| 13. | 95224 | 41.3% | 1.3%(+40.0)#5 | 1.1%(+40.2)#13 |
| 14. | 97635 | 39.2% | 1.3%(+37.9)#1 | 1.1%(+38.1)#14 |
| 15. | 13065 | 38.6% | 1.1%(+37.6)#3 | 1.1%(+37.5)#15 |
| 16. | 88414 | 38.5% | 1.7%(+36.8)#1 | 1.1%(+37.4)#16 |
| 17. | 80024 | 38.2% | 1.3%(+36.9)#2 | 1.1%(+37.1)#17 |
| 18. | 86445 | 36.6% | 0.83%(+35.8)#1 | 1.1%(+35.5)#18 |
| 19. | 98939 | 35.5% | 1.3%(+34.2)#1 | 1.1%(+34.4)#19 |
| 20. | 32830 | 35.0% | 0.67%(+34.3)#1 | 1.1%(+33.9)#20 |
| 21. | 96110 | 33.3% | 1.3%(+32.0)#6 | 1.1%(+32.2)#21 |
| 22. | 99726 | 33.3% | 2.0%(+31.3)#1 | 1.1%(+32.2)#22 |
| 23. | 12195 | 32.4% | 1.1%(+31.3)#4 | 1.1%(+31.3)#23 |
| 24. | 37351 | 32.1% | 0.83%(+31.3)#1 | 1.1%(+31.0)#24 |
| 25. | 94021 | 31.5% | 1.3%(+30.2)#7 | 1.1%(+30.4)#25 |
| 26. | 05678 | 30.6% | 1.2%(+29.4)#1 | 1.1%(+29.5)#26 |
| 27. | 12736 | 30.6% | 1.1%(+29.5)#5 | 1.1%(+29.5)#27 |
| 28. | 44080 | 30.0% | 0.90%(+29.1)#1 | 1.1%(+28.9)#28 |
| 29. | 93627 | 29.1% | 1.3%(+27.8)#8 | 1.1%(+28.0)#29 |
| 30. | 32631 | 29.0% | 0.67%(+28.3)#2 | 1.1%(+27.9)#30 |
| 31. | 83842 | 28.6% | 1.2%(+27.4)#1 | 1.1%(+27.5)#31 |
| 32. | 03441 | 28.0% | 1.1%(+26.9)#1 | 1.1%(+26.9)#32 |
| 33. | 99775 | 27.9% | 2.0%(+25.9)#2 | 1.1%(+26.8)#33 |
| 34. | 26810 | 27.8% | 0.95%(+26.9)#2 | 1.1%(+26.7)#34 |
| 35. | 12513 | 27.8% | 1.1%(+26.7)#6 | 1.1%(+26.7)#35 |
| 36. | 02872 | 27.8% | 1.3%(+26.5)#1 | 1.1%(+26.7)#36 |
| 37. | 80453 | 27.0% | 1.3%(+25.7)#3 | 1.1%(+25.9)#37 |
| 38. | 15347 | 26.7% | 1.2%(+25.4)#2 | 1.1%(+25.6)#38 |
| 39. | 63330 | 26.1% | 0.98%(+25.1)#1 | 1.1%(+25.0)#39 |
| 40. | 98811 | 25.6% | 1.3%(+24.3)#2 | 1.1%(+24.6)#40 |
| 41. | 85920 | 25.3% | 0.83%(+24.5)#2 | 1.1%(+24.2)#41 |
| 42. | 22732 | 24.1% | 1.3%(+22.8)#1 | 1.1%(+23.0)#42 |
| 43. | 43934 | 23.8% | 0.90%(+22.9)#2 | 1.1%(+22.7)#43 |
| 44. | 84734 | 23.8% | 1.0%(+22.7)#1 | 1.1%(+22.7)#44 |
| 45. | 15366 | 23.1% | 1.2%(+21.9)#3 | 1.1%(+22.0)#45 |
| 46. | 22989 | 22.6% | 1.3%(+21.4)#2 | 1.1%(+21.6)#46 |
| 47. | 87510 | 22.6% | 1.7%(+20.9)#2 | 1.1%(+21.5)#47 |
| 48. | 59871 | 22.5% | 1.5%(+21.0)#2 | 1.1%(+21.4)#48 |
| 49. | 19369 | 22.4% | 1.2%(+21.2)#4 | 1.1%(+21.3)#49 |
| 50. | 02543 | 22.3% | 2.4%(+19.9)#1 | 1.1%(+21.2)#50 |
| 51. | 41754 | 22.1% | 0.77%(+21.4)#1 | 1.1%(+21.0)#51 |
| 52. | 87544 | 21.5% | 1.7%(+19.8)#3 | 1.1%(+20.4)#52 |
| 53. | 98859 | 21.4% | 1.3%(+20.1)#3 | 1.1%(+20.3)#53 |
| 54. | 98552 | 21.4% | 1.3%(+20.1)#4 | 1.1%(+20.3)#54 |
| 55. | 97737 | 21.1% | 1.3%(+19.8)#2 | 1.1%(+20.0)#55 |
| 56. | 98827 | 20.8% | 1.3%(+19.5)#5 | 1.1%(+19.7)#56 |
| 57. | 18063 | 20.6% | 1.2%(+19.3)#5 | 1.1%(+19.5)#57 |
| 58. | 79916 | 20.6% | 0.84%(+19.7)#2 | 1.1%(+19.5)#58 |
| 59. | 79742 | 20.3% | 0.84%(+19.5)#3 | 1.1%(+19.2)#59 |
| 60. | 95550 | 20.3% | 1.3%(+19.0)#9 | 1.1%(+19.2)#60 |
| 61. | 02142 | 20.2% | 2.4%(+17.8)#2 | 1.1%(+19.1)#61 |
| 62. | 72152 | 20.1% | 0.65%(+19.5)#1 | 1.1%(+19.1)#62 |
| 63. | 63551 | 20.0% | 0.98%(+19.0)#2 | 1.1%(+18.9)#63 |
| 64. | 24457 | 19.7% | 1.3%(+18.4)#3 | 1.1%(+18.6)#64 |
| 65. | 68401 | 19.5% | 1.1%(+18.5)#1 | 1.1%(+18.4)#65 |
| 66. | 99635 | 19.4% | 2.0%(+17.4)#3 | 1.1%(+18.4)#66 |
| 67. | 22820 | 19.4% | 1.3%(+18.1)#4 | 1.1%(+18.3)#67 |
| 68. | 99140 | 19.4% | 1.3%(+18.1)#6 | 1.1%(+18.3)#68 |
| 69. | 89557 | 19.3% | 0.68%(+18.6)#1 | 1.1%(+18.2)#69 |
| 70. | 39737 | 19.2% | 0.76%(+18.5)#1 | 1.1%(+18.1)#70 |
| 71. | 23857 | 18.9% | 1.3%(+17.6)#5 | 1.1%(+17.8)#71 |
| 72. | 38504 | 18.7% | 0.83%(+17.8)#2 | 1.1%(+17.6)#72 |
| 73. | 82923 | 18.4% | 1.4%(+17.0)#1 | 1.1%(+17.3)#73 |
| 74. | 59222 | 18.3% | 1.5%(+16.9)#3 | 1.1%(+17.3)#74 |
| 75. | 87547 | 18.2% | 1.7%(+16.5)#4 | 1.1%(+17.1)#75 |
| 76. | 83825 | 17.9% | 1.2%(+16.8)#2 | 1.1%(+16.9)#76 |
| 77. | 24363 | 17.8% | 1.3%(+16.6)#6 | 1.1%(+16.8)#77 |
| 78. | 99605 | 17.7% | 2.0%(+15.7)#4 | 1.1%(+16.7)#78 |
| 79. | 24851 | 17.5% | 0.95%(+16.6)#3 | 1.1%(+16.4)#79 |
| 80. | 41260 | 17.4% | 0.77%(+16.6)#2 | 1.1%(+16.3)#80 |
| 81. | 55606 | 17.3% | 1.2%(+16.1)#1 | 1.1%(+16.3)#81 |
| 82. | 03871 | 17.3% | 1.1%(+16.2)#2 | 1.1%(+16.2)#82 |
| 83. | 94922 | 17.1% | 1.3%(+15.8)#10 | 1.1%(+16.0)#83 |
| 84. | 99781 | 17.1% | 2.0%(+15.0)#5 | 1.1%(+16.0)#84 |
| 85. | 23894 | 17.0% | 1.3%(+15.7)#7 | 1.1%(+15.9)#85 |
| 86. | 64101 | 16.9% | 0.98%(+15.9)#3 | 1.1%(+15.8)#86 |
| 87. | 59053 | 16.8% | 1.5%(+15.3)#4 | 1.1%(+15.7)#87 |
| 88. | 67468 | 16.8% | 0.94%(+15.8)#1 | 1.1%(+15.7)#88 |
| 89. | 36112 | 16.7% | 0.74%(+15.9)#1 | 1.1%(+15.6)#89 |
| 90. | 65690 | 16.7% | 0.98%(+15.7)#4 | 1.1%(+15.6)#90 |
| 91. | 99131 | 16.7% | 1.3%(+15.4)#7 | 1.1%(+15.6)#91 |
| 92. | 11973 | 16.7% | 1.1%(+15.6)#7 | 1.1%(+15.6)#92 |
| 93. | 84764 | 16.3% | 1.0%(+15.3)#2 | 1.1%(+15.2)#93 |
| 94. | 84735 | 16.3% | 1.0%(+15.3)#3 | 1.1%(+15.2)#94 |
| 95. | 49881 | 16.1% | 0.88%(+15.2)#1 | 1.1%(+15.0)#95 |
| 96. | 10044 | 15.6% | 1.1%(+14.6)#8 | 1.1%(+14.5)#96 |
| 97. | 66940 | 15.5% | 0.94%(+14.5)#2 | 1.1%(+14.4)#97 |
| 98. | 59746 | 15.4% | 1.5%(+13.9)#5 | 1.1%(+14.3)#98 |
| 99. | 08023 | 15.3% | 1.3%(+14.0)#1 | 1.1%(+14.2)#99 |
| 100. | 10162 | 15.3% | 1.1%(+14.2)#9 | 1.1%(+14.2)#100 |
Common Questions
What are the Top 10 Zip Codes with the Highest Percentage of Population Employed in Life, Physical & Social Science in the United States?
Top 10 Zip Codes with the Highest Percentage of Population Employed in Life, Physical & Social Science in the United States are:
#1
80.0%
#2
60.1%
#3
53.2%
#4
50.0%
#5
50.0%
#6
50.0%
#7
49.1%
#8
43.5%
#9
42.9%
#10
42.2%
What zip code has the Highest Percentage of Population Employed in Life, Physical & Social Science in the United States?
79918 has the Highest Percentage of Population Employed in Life, Physical & Social Science in the United States with 80.0%.
What is the Percentage of Population Employed in Life, Physical & Social Science in the United States?
Percentage of Population Employed in Life, Physical & Social Science in the United States is 1.1%.