Bay Lake, FL Map & Demographics
Bay Lake Map
Bay Lake Overview
$66,536
PER CAPITA INCOME
$250,001
AVG FAMILY INCOME
$119,107
AVG HOUSEHOLD INCOME
0.12
INEQUALITY / GINI INDEX
42
TOTAL POPULATION
23
MALE POPULATION
19
FEMALE POPULATION
121.05
MALES / 100 FEMALES
82.61
FEMALES / 100 MALES
40.1
MEDIAN AGE
3.0
AVG FAMILY SIZE
2.1
AVG HOUSEHOLD SIZE
39
LABOR FORCE [ PEOPLE ]
95.1%
PERCENT IN LABOR FORCE
Income in Bay Lake
Income Overview in Bay Lake
Per Capita Income in Bay Lake is $66,536, while median incomes of families and households are $250,001 and $119,107 respectively.
| Characteristic | Number | Measure |
| Per Capita Income | 42 | $66,536 |
| Median Family Income | 3 | $250,001 |
| Mean Family Income | 3 | $218,900 |
| Median Household Income | 20 | $119,107 |
| Mean Household Income | 20 | $136,665 |
| Income Deficit | 3 | $0 |
| Wage / Income Gap (%) | 42 | 0.00% |
| Wage / Income Gap ($) | 42 | 100.00¢ per $1 |
| Gini / Inequality Index | 42 | 0.12 |
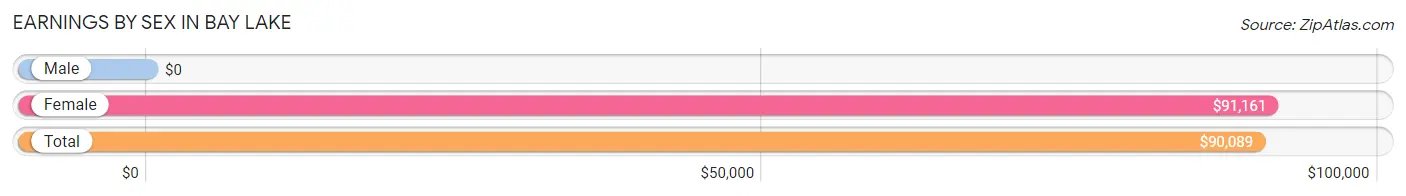
Earnings by Sex in Bay Lake
| Sex | Number | Average Earnings |
| Male | 22 (56.4%) | $0 |
| Female | 17 (43.6%) | $91,161 |
| Total | 39 (100.0%) | $90,089 |
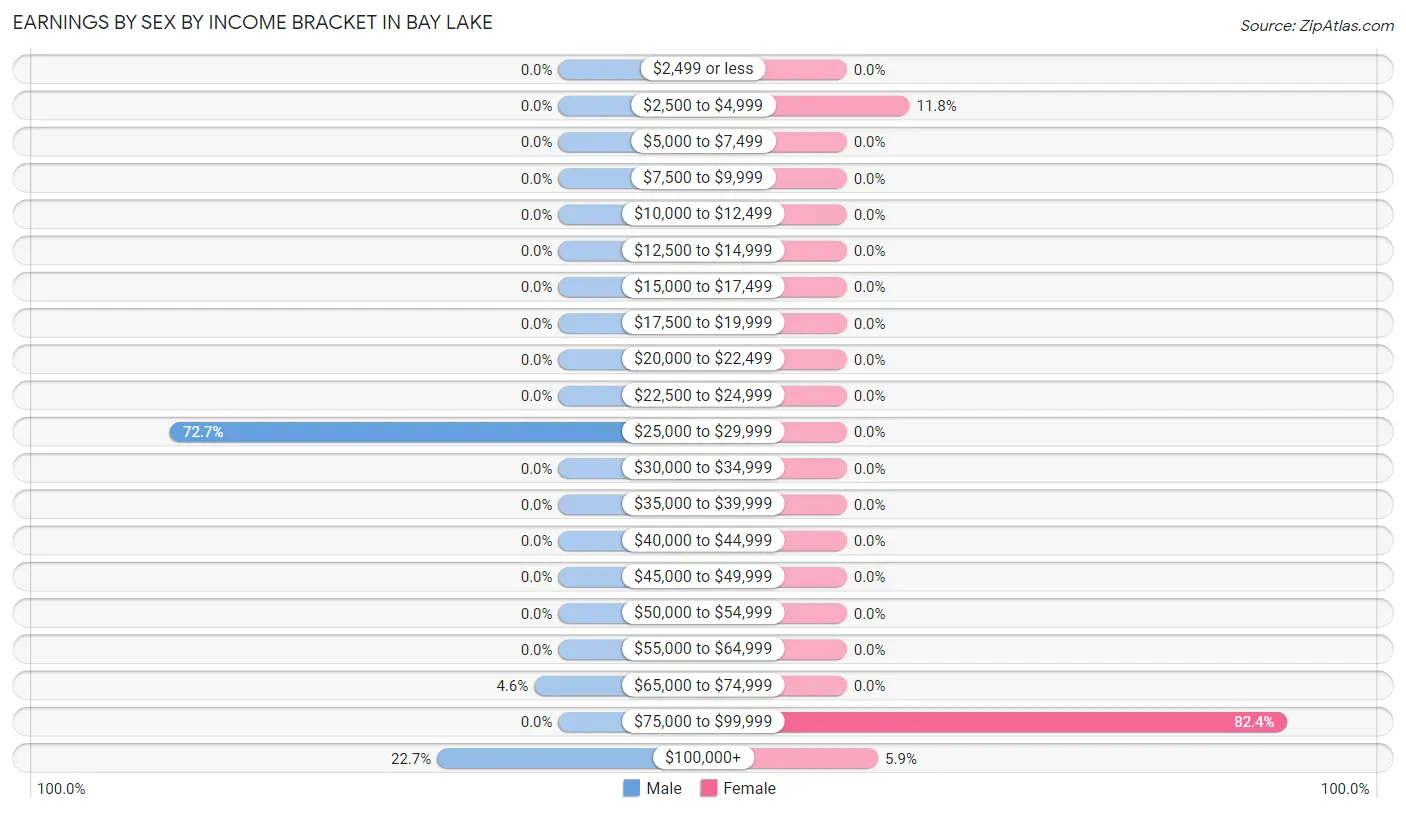
Earnings by Sex by Income Bracket in Bay Lake
The most common earnings brackets in Bay Lake are $25,000 to $29,999 for men (16 | 72.7%) and $75,000 to $99,999 for women (14 | 82.4%).
| Income | Male | Female |
| $2,499 or less | 0 (0.0%) | 0 (0.0%) |
| $2,500 to $4,999 | 0 (0.0%) | 2 (11.8%) |
| $5,000 to $7,499 | 0 (0.0%) | 0 (0.0%) |
| $7,500 to $9,999 | 0 (0.0%) | 0 (0.0%) |
| $10,000 to $12,499 | 0 (0.0%) | 0 (0.0%) |
| $12,500 to $14,999 | 0 (0.0%) | 0 (0.0%) |
| $15,000 to $17,499 | 0 (0.0%) | 0 (0.0%) |
| $17,500 to $19,999 | 0 (0.0%) | 0 (0.0%) |
| $20,000 to $22,499 | 0 (0.0%) | 0 (0.0%) |
| $22,500 to $24,999 | 0 (0.0%) | 0 (0.0%) |
| $25,000 to $29,999 | 16 (72.7%) | 0 (0.0%) |
| $30,000 to $34,999 | 0 (0.0%) | 0 (0.0%) |
| $35,000 to $39,999 | 0 (0.0%) | 0 (0.0%) |
| $40,000 to $44,999 | 0 (0.0%) | 0 (0.0%) |
| $45,000 to $49,999 | 0 (0.0%) | 0 (0.0%) |
| $50,000 to $54,999 | 0 (0.0%) | 0 (0.0%) |
| $55,000 to $64,999 | 0 (0.0%) | 0 (0.0%) |
| $65,000 to $74,999 | 1 (4.5%) | 0 (0.0%) |
| $75,000 to $99,999 | 0 (0.0%) | 14 (82.4%) |
| $100,000+ | 5 (22.7%) | 1 (5.9%) |
| Total | 22 (100.0%) | 17 (100.0%) |
Earnings by Sex by Educational Attainment in Bay Lake
| Educational Attainment | Male Income | Female Income |
| Less than High School | - | - |
| High School Diploma | - | - |
| College or Associate's Degree | - | - |
| Bachelor's Degree | - | - |
| Graduate Degree | - | - |
| Total | - | - |
Family Income in Bay Lake
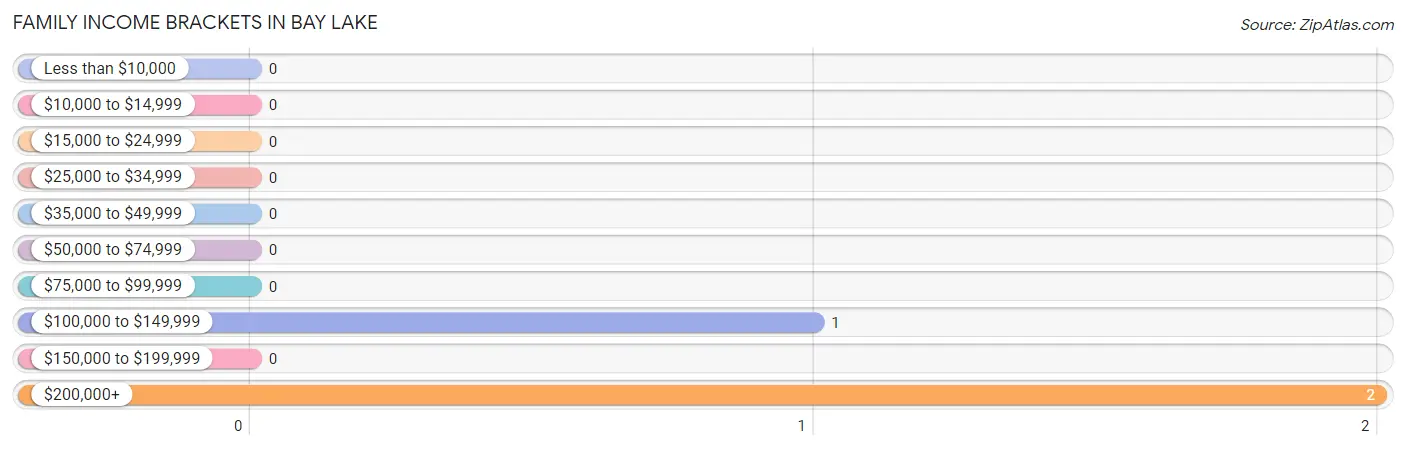
Family Income Brackets in Bay Lake
According to the Bay Lake family income data, there are 2 families falling into the $200,000+ income range, which is the most common income bracket and makes up 66.7% of all families.
| Income Bracket | # Families | % Families |
| Less than $10,000 | 0 | 0.0% |
| $10,000 to $14,999 | 0 | 0.0% |
| $15,000 to $24,999 | 0 | 0.0% |
| $25,000 to $34,999 | 0 | 0.0% |
| $35,000 to $49,999 | 0 | 0.0% |
| $50,000 to $74,999 | 0 | 0.0% |
| $75,000 to $99,999 | 0 | 0.0% |
| $100,000 to $149,999 | 1 | 33.3% |
| $150,000 to $199,999 | 0 | 0.0% |
| $200,000+ | 2 | 66.7% |
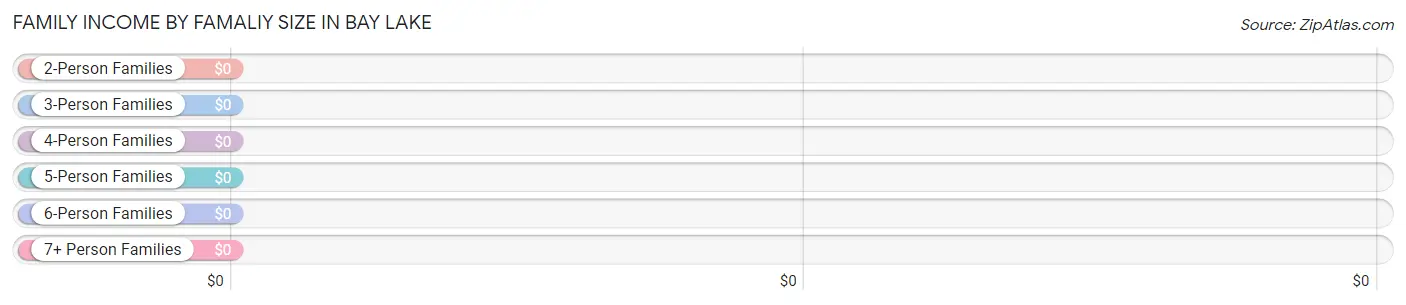
Family Income by Famaliy Size in Bay Lake
| Income Bracket | # Families | Median Income |
| 2-Person Families | 2 (66.7%) | $0 |
| 3-Person Families | 0 (0.0%) | $0 |
| 4-Person Families | 1 (33.3%) | $0 |
| 5-Person Families | 0 (0.0%) | $0 |
| 6-Person Families | 0 (0.0%) | $0 |
| 7+ Person Families | 0 (0.0%) | $0 |
| Total | 3 (100.0%) | $250,001 |
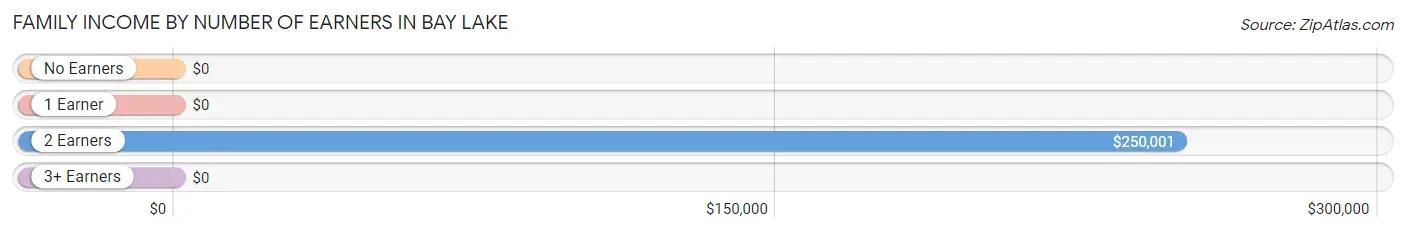
Family Income by Number of Earners in Bay Lake
| Number of Earners | # Families | Median Income |
| No Earners | 0 (0.0%) | $0 |
| 1 Earner | 0 (0.0%) | $0 |
| 2 Earners | 3 (100.0%) | $250,001 |
| 3+ Earners | 0 (0.0%) | $0 |
| Total | 3 (100.0%) | $250,001 |
Household Income in Bay Lake
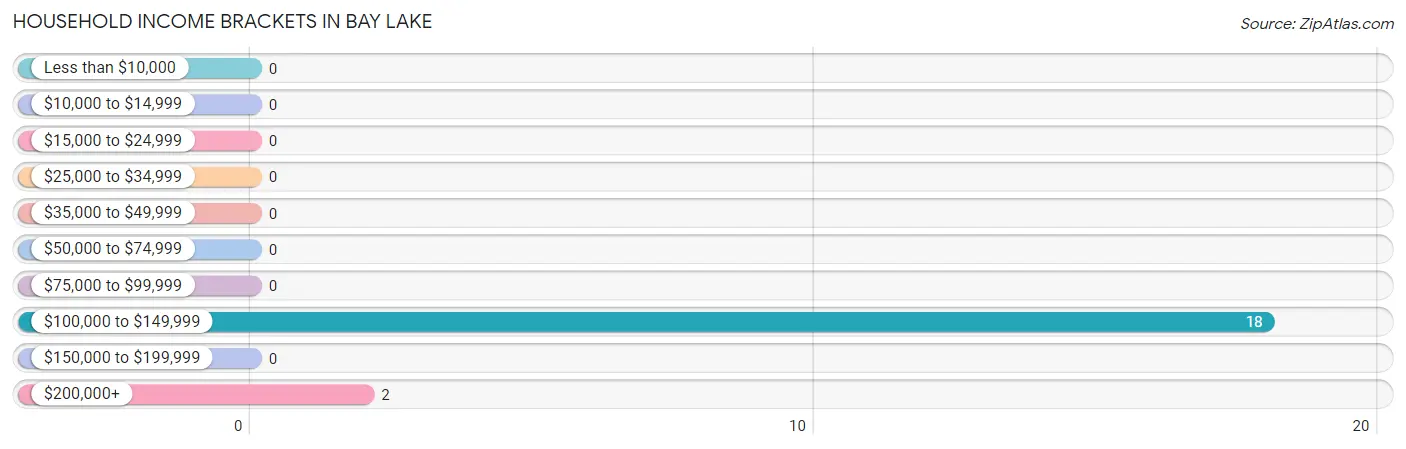
Household Income Brackets in Bay Lake
With 18 households falling in the category, the $100,000 to $149,999 income range is the most frequent in Bay Lake, accounting for 90.0% of all households.
| Income Bracket | # Households | % Households |
| Less than $10,000 | 0 | 0.0% |
| $10,000 to $14,999 | 0 | 0.0% |
| $15,000 to $24,999 | 0 | 0.0% |
| $25,000 to $34,999 | 0 | 0.0% |
| $35,000 to $49,999 | 0 | 0.0% |
| $50,000 to $74,999 | 0 | 0.0% |
| $75,000 to $99,999 | 0 | 0.0% |
| $100,000 to $149,999 | 18 | 90.0% |
| $150,000 to $199,999 | 0 | 0.0% |
| $200,000+ | 2 | 10.0% |
Household Income by Householder Age in Bay Lake
The median household income in Bay Lake is $119,107, with the highest median household income of $250,001 found in the 45 to 64 years age bracket for the primary householder. A total of 3 households (15.0%) fall into this category.
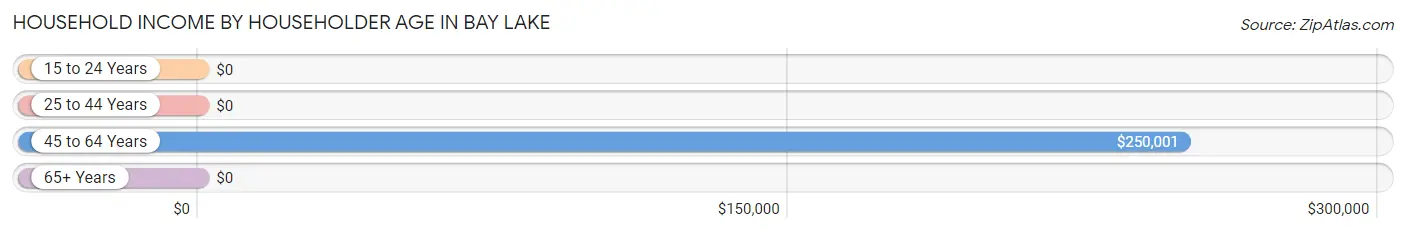
| Income Bracket | # Households | Median Income |
| 15 to 24 Years | 0 (0.0%) | $0 |
| 25 to 44 Years | 16 (80.0%) | $0 |
| 45 to 64 Years | 3 (15.0%) | $250,001 |
| 65+ Years | 1 (5.0%) | $0 |
| Total | 20 (100.0%) | $119,107 |
Poverty in Bay Lake
Income Below Poverty by Sex and Age in Bay Lake
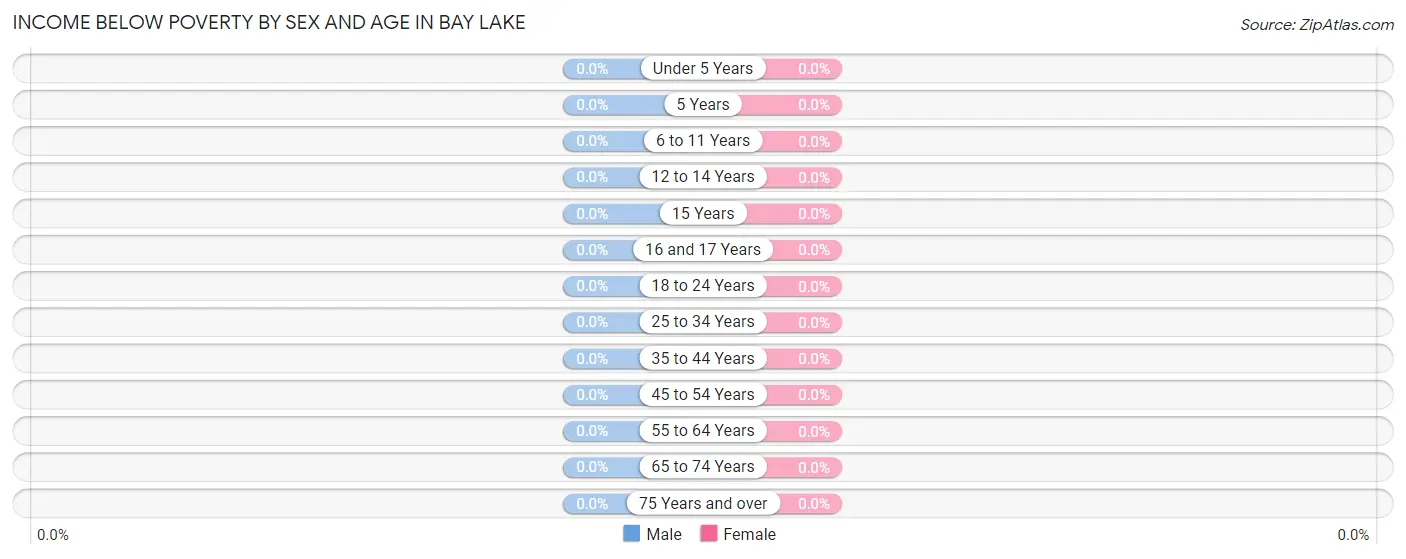
| Age Bracket | Male | Female |
| Under 5 Years | 0 (0.0%) | 0 (0.0%) |
| 5 Years | 0 (0.0%) | 0 (0.0%) |
| 6 to 11 Years | 0 (0.0%) | 0 (0.0%) |
| 12 to 14 Years | 0 (0.0%) | 0 (0.0%) |
| 15 Years | 0 (0.0%) | 0 (0.0%) |
| 16 and 17 Years | 0 (0.0%) | 0 (0.0%) |
| 18 to 24 Years | 0 (0.0%) | 0 (0.0%) |
| 25 to 34 Years | 0 (0.0%) | 0 (0.0%) |
| 35 to 44 Years | 0 (0.0%) | 0 (0.0%) |
| 45 to 54 Years | 0 (0.0%) | 0 (0.0%) |
| 55 to 64 Years | 0 (0.0%) | 0 (0.0%) |
| 65 to 74 Years | 0 (0.0%) | 0 (0.0%) |
| 75 Years and over | 0 (0.0%) | 0 (0.0%) |
| Total | 0 (0.0%) | 0 (0.0%) |
Income Above Poverty by Sex and Age in Bay Lake
According to the poverty statistics in Bay Lake, males aged 25 to 34 years and females aged 5 years are the age groups that are most secure financially, with 100.0% of males and 100.0% of females in these age groups living above the poverty line.
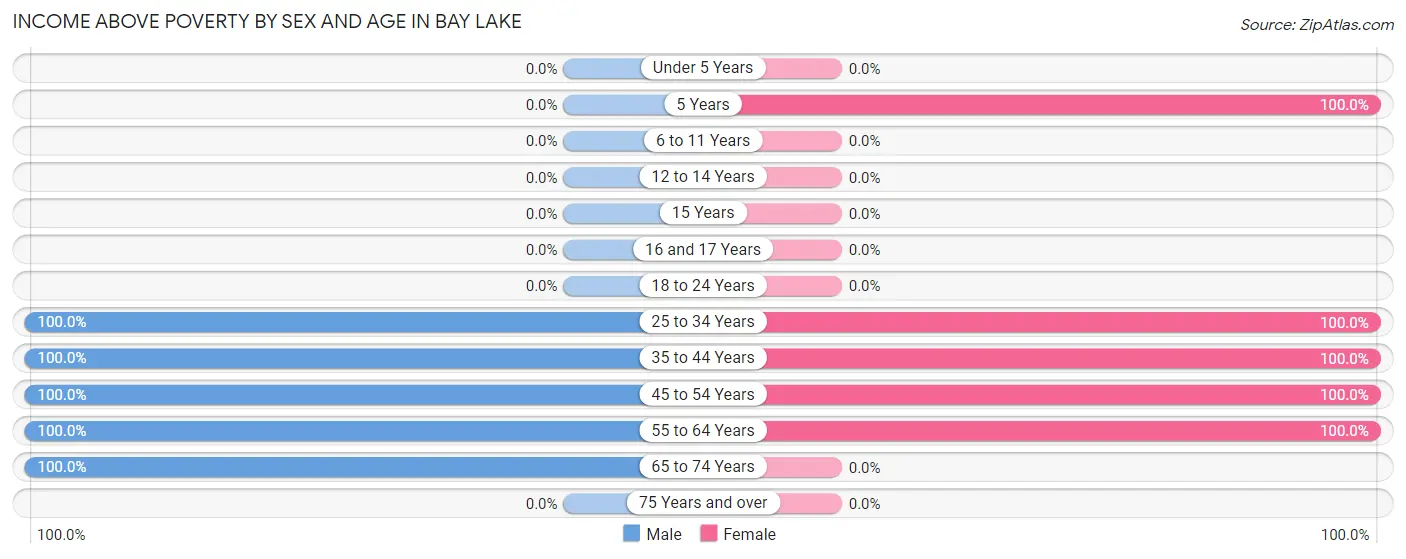
| Age Bracket | Male | Female |
| Under 5 Years | 0 (0.0%) | 0 (0.0%) |
| 5 Years | 0 (0.0%) | 1 (100.0%) |
| 6 to 11 Years | 0 (0.0%) | 0 (0.0%) |
| 12 to 14 Years | 0 (0.0%) | 0 (0.0%) |
| 15 Years | 0 (0.0%) | 0 (0.0%) |
| 16 and 17 Years | 0 (0.0%) | 0 (0.0%) |
| 18 to 24 Years | 0 (0.0%) | 0 (0.0%) |
| 25 to 34 Years | 17 (100.0%) | 2 (100.0%) |
| 35 to 44 Years | 2 (100.0%) | 14 (100.0%) |
| 45 to 54 Years | 1 (100.0%) | 1 (100.0%) |
| 55 to 64 Years | 2 (100.0%) | 1 (100.0%) |
| 65 to 74 Years | 1 (100.0%) | 0 (0.0%) |
| 75 Years and over | 0 (0.0%) | 0 (0.0%) |
| Total | 23 (100.0%) | 19 (100.0%) |
Income Below Poverty Among Married-Couple Families in Bay Lake
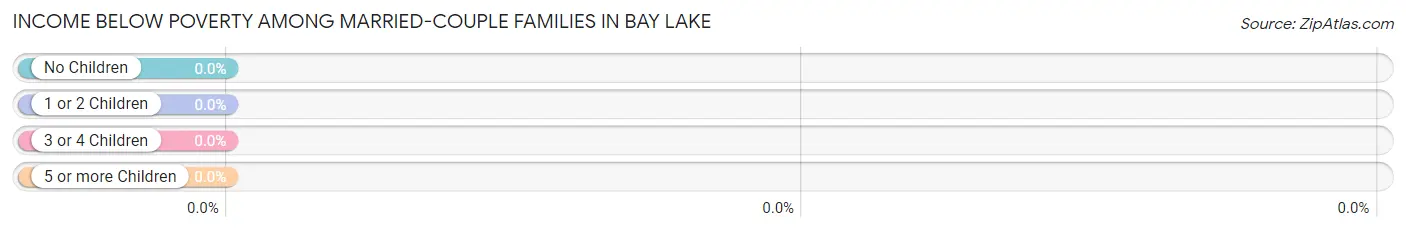
| Children | Above Poverty | Below Poverty |
| No Children | 2 (100.0%) | 0 (0.0%) |
| 1 or 2 Children | 1 (100.0%) | 0 (0.0%) |
| 3 or 4 Children | 0 (0.0%) | 0 (0.0%) |
| 5 or more Children | 0 (0.0%) | 0 (0.0%) |
| Total | 3 (100.0%) | 0 (0.0%) |
Income Below Poverty Among Single-Parent Households in Bay Lake
| Children | Single Father | Single Mother |
| No Children | 0 (0.0%) | 0 (0.0%) |
| 1 or 2 Children | 0 (0.0%) | 0 (0.0%) |
| 3 or 4 Children | 0 (0.0%) | 0 (0.0%) |
| 5 or more Children | 0 (0.0%) | 0 (0.0%) |
| Total | 0 (0.0%) | 0 (0.0%) |
Income Below Poverty Among Married-Couple vs Single-Parent Households in Bay Lake
| Children | Married-Couple Families | Single-Parent Households |
| No Children | 0 (0.0%) | 0 (0.0%) |
| 1 or 2 Children | 0 (0.0%) | 0 (0.0%) |
| 3 or 4 Children | 0 (0.0%) | 0 (0.0%) |
| 5 or more Children | 0 (0.0%) | 0 (0.0%) |
| Total | 0 (0.0%) | 0 (0.0%) |
Race in Bay Lake
The most populous races in Bay Lake are White / Caucasian (40 | 95.2%), Black / African American (1 | 2.4%), and Two or more Races (1 | 2.4%).
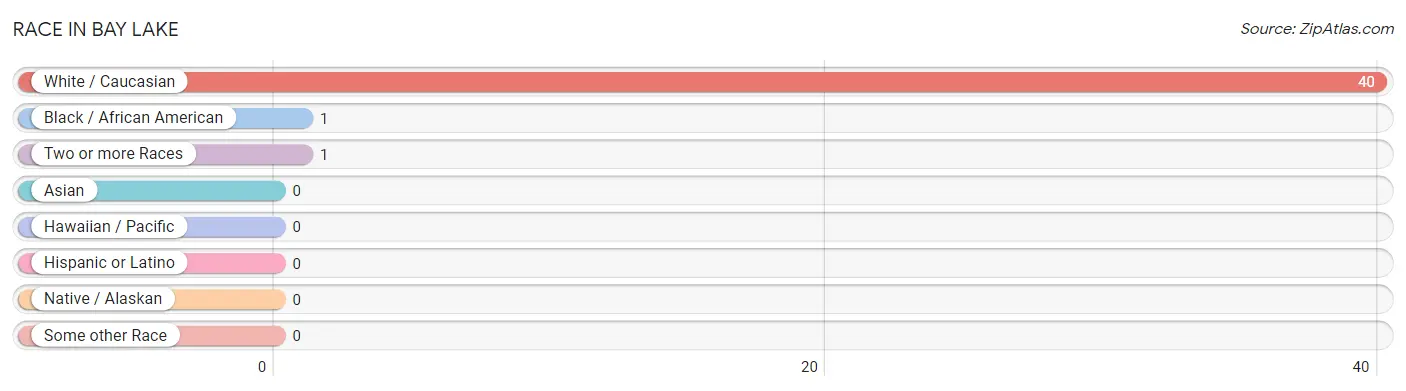
| Race | # Population | % Population |
| Asian | 0 | 0.0% |
| Black / African American | 1 | 2.4% |
| Hawaiian / Pacific | 0 | 0.0% |
| Hispanic or Latino | 0 | 0.0% |
| Native / Alaskan | 0 | 0.0% |
| White / Caucasian | 40 | 95.2% |
| Two or more Races | 1 | 2.4% |
| Some other Race | 0 | 0.0% |
| Total | 42 | 100.0% |
Ancestry in Bay Lake
The most populous ancestries reported in Bay Lake are American (30 | 71.4%), German (5 | 11.9%), Scotch-Irish (4 | 9.5%), Dutch (1 | 2.4%), and English (1 | 2.4%), together accounting for 97.6% of all Bay Lake residents.
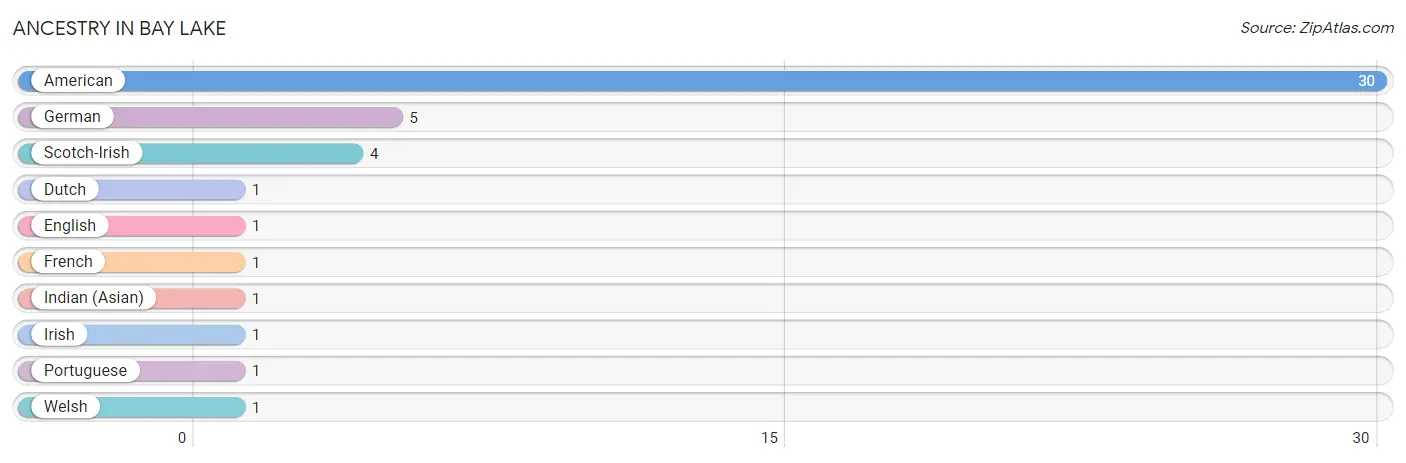
| Ancestry | # Population | % Population |
| American | 30 | 71.4% |
| Dutch | 1 | 2.4% |
| English | 1 | 2.4% |
| French | 1 | 2.4% |
| German | 5 | 11.9% |
| Indian (Asian) | 1 | 2.4% |
| Irish | 1 | 2.4% |
| Portuguese | 1 | 2.4% |
| Scotch-Irish | 4 | 9.5% |
| Welsh | 1 | 2.4% | View All 10 Rows |
Immigrants in Bay Lake
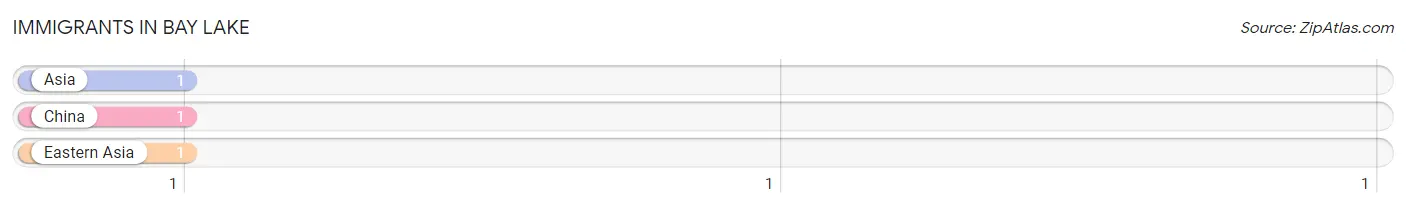
The most numerous immigrant groups reported in Bay Lake came from Asia (1 | 2.4%), China (1 | 2.4%), and Eastern Asia (1 | 2.4%), together accounting for 7.1% of all Bay Lake residents.
| Immigration Origin | # Population | % Population |
| Asia | 1 | 2.4% |
| China | 1 | 2.4% |
| Eastern Asia | 1 | 2.4% | View All 3 Rows |
Sex and Age in Bay Lake
Sex and Age in Bay Lake
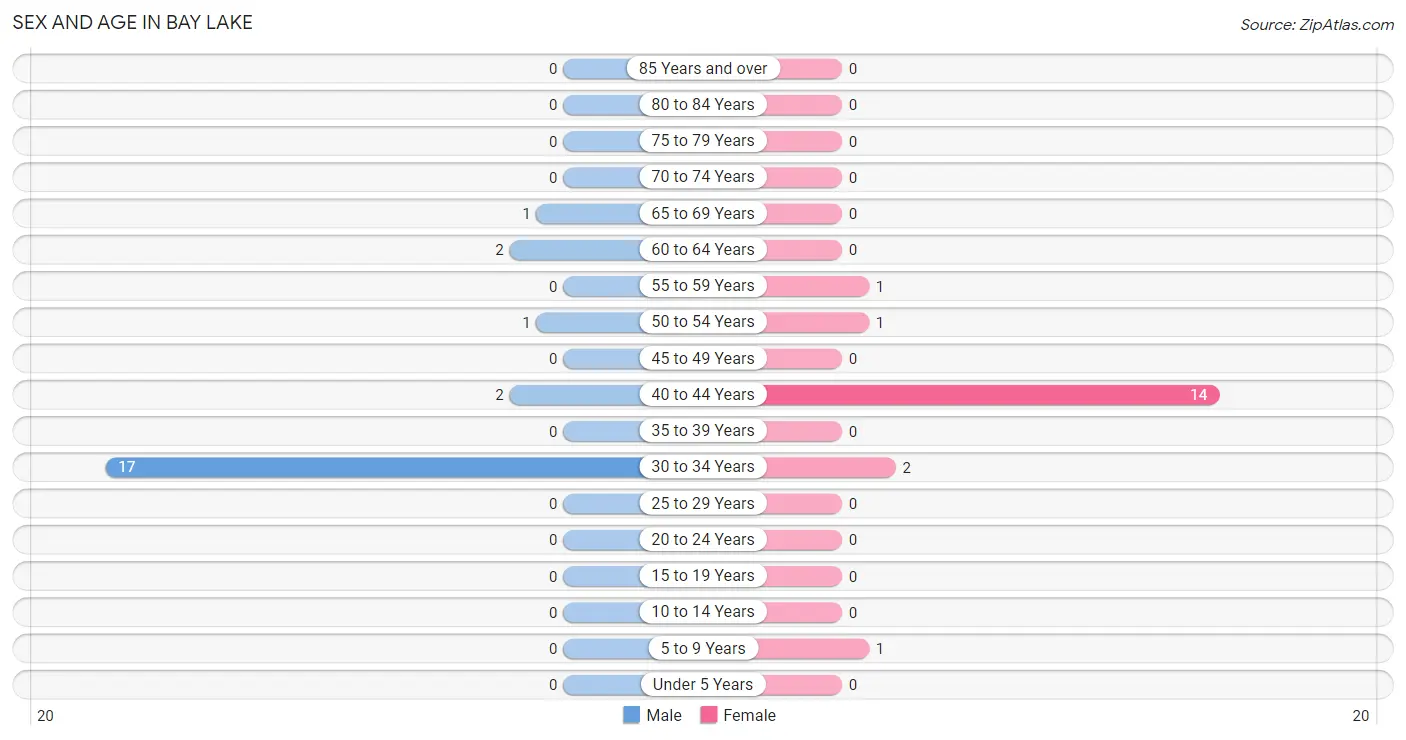
The most populous age groups in Bay Lake are 30 to 34 Years (17 | 73.9%) for men and 40 to 44 Years (14 | 73.7%) for women.
| Age Bracket | Male | Female |
| Under 5 Years | 0 (0.0%) | 0 (0.0%) |
| 5 to 9 Years | 0 (0.0%) | 1 (5.3%) |
| 10 to 14 Years | 0 (0.0%) | 0 (0.0%) |
| 15 to 19 Years | 0 (0.0%) | 0 (0.0%) |
| 20 to 24 Years | 0 (0.0%) | 0 (0.0%) |
| 25 to 29 Years | 0 (0.0%) | 0 (0.0%) |
| 30 to 34 Years | 17 (73.9%) | 2 (10.5%) |
| 35 to 39 Years | 0 (0.0%) | 0 (0.0%) |
| 40 to 44 Years | 2 (8.7%) | 14 (73.7%) |
| 45 to 49 Years | 0 (0.0%) | 0 (0.0%) |
| 50 to 54 Years | 1 (4.3%) | 1 (5.3%) |
| 55 to 59 Years | 0 (0.0%) | 1 (5.3%) |
| 60 to 64 Years | 2 (8.7%) | 0 (0.0%) |
| 65 to 69 Years | 1 (4.3%) | 0 (0.0%) |
| 70 to 74 Years | 0 (0.0%) | 0 (0.0%) |
| 75 to 79 Years | 0 (0.0%) | 0 (0.0%) |
| 80 to 84 Years | 0 (0.0%) | 0 (0.0%) |
| 85 Years and over | 0 (0.0%) | 0 (0.0%) |
| Total | 23 (100.0%) | 19 (100.0%) |
Families and Households in Bay Lake
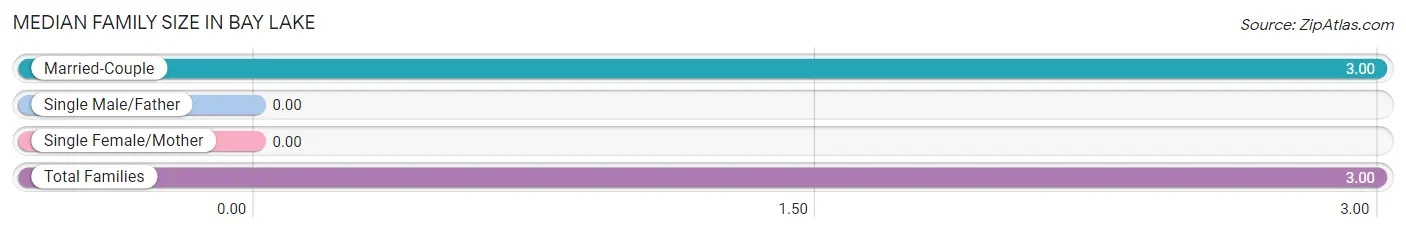
Median Family Size in Bay Lake
| Family Type | # Families | Family Size |
| Married-Couple | 3 (100.0%) | 3.00 |
| Single Male/Father | 0 (0.0%) | - |
| Single Female/Mother | 0 (0.0%) | - |
| Total Families | 3 (100.0%) | 3.00 |
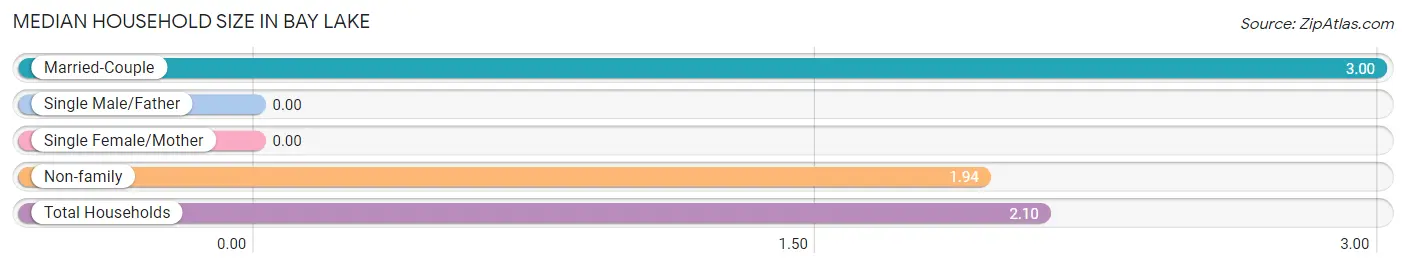
Median Household Size in Bay Lake
| Household Type | # Households | Household Size |
| Married-Couple | 3 (15.0%) | 3.00 |
| Single Male/Father | 0 (0.0%) | - |
| Single Female/Mother | 0 (0.0%) | - |
| Non-family | 17 (85.0%) | 1.94 |
| Total Households | 20 (100.0%) | 2.10 |
Household Size by Marriage Status in Bay Lake
Out of a total of 20 households in Bay Lake, 3 (15.0%) are family households, while 17 (85.0%) are nonfamily households. The most numerous type of family households are 2-person households, comprising 2, and the most common type of nonfamily households are 2-person households, comprising 14.
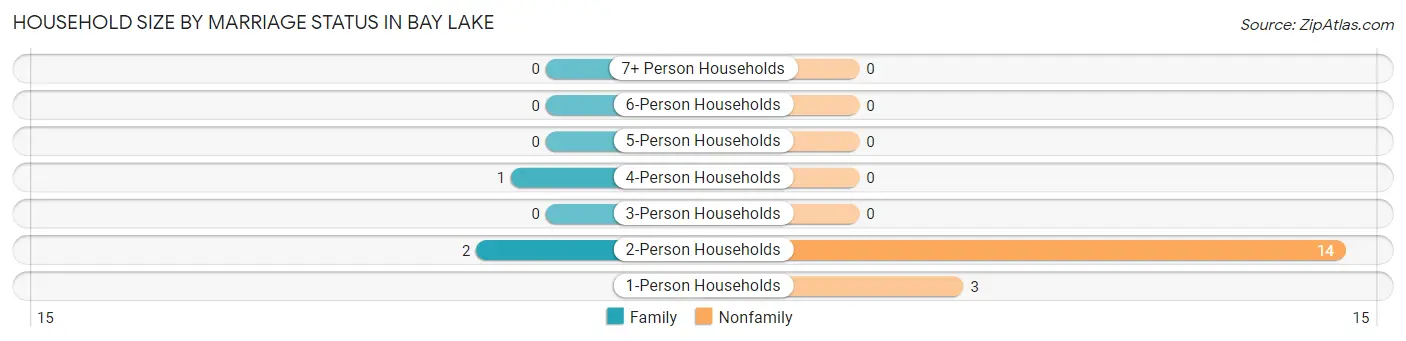
| Household Size | Family Households | Nonfamily Households |
| 1-Person Households | - | 3 (15.0%) |
| 2-Person Households | 2 (10.0%) | 14 (70.0%) |
| 3-Person Households | 0 (0.0%) | 0 (0.0%) |
| 4-Person Households | 1 (5.0%) | 0 (0.0%) |
| 5-Person Households | 0 (0.0%) | 0 (0.0%) |
| 6-Person Households | 0 (0.0%) | 0 (0.0%) |
| 7+ Person Households | 0 (0.0%) | 0 (0.0%) |
| Total | 3 (15.0%) | 17 (85.0%) |
Female Fertility in Bay Lake
Fertility by Age in Bay Lake
| Age Bracket | Women with Births | Births / 1,000 Women |
| 15 to 19 years | 0 (0.0%) | 0.0 |
| 20 to 34 years | 0 (0.0%) | 0.0 |
| 35 to 50 years | 0 (0.0%) | 0.0 |
| Total | 0 (0.0%) | 0.0 |
Fertility by Age by Marriage Status in Bay Lake
| Age Bracket | Married | Unmarried |
| 15 to 19 years | 0 (0.0%) | 0 (0.0%) |
| 20 to 34 years | 0 (0.0%) | 0 (0.0%) |
| 35 to 50 years | 0 (0.0%) | 0 (0.0%) |
| Total | 0 (0.0%) | 0 (0.0%) |
Fertility by Education in Bay Lake
| Educational Attainment | Women with Births | Births / 1,000 Women |
| Less than High School | 0 (0.0%) | 0.0 |
| High School Diploma | 0 (0.0%) | 0.0 |
| College or Associate's Degree | 0 (0.0%) | 0.0 |
| Bachelor's Degree | 0 (0.0%) | 0.0 |
| Graduate Degree | 0 (0.0%) | 0.0 |
| Total | 0 (0.0%) | 0.0 |
Fertility by Education by Marriage Status in Bay Lake
| Educational Attainment | Married | Unmarried |
| Less than High School | 0 (0.0%) | 0 (0.0%) |
| High School Diploma | 0 (0.0%) | 0 (0.0%) |
| College or Associate's Degree | 0 (0.0%) | 0 (0.0%) |
| Bachelor's Degree | 0 (0.0%) | 0 (0.0%) |
| Graduate Degree | 0 (0.0%) | 0 (0.0%) |
| Total | 0 (0.0%) | 0 (0.0%) |
Employment Characteristics in Bay Lake
Employment by Class of Employer in Bay Lake
Among the 39 employed individuals in Bay Lake, private company employees (24 | 61.5%), state government employees (14 | 35.9%), and local government employees (1 | 2.6%) make up the most common classes of employment.
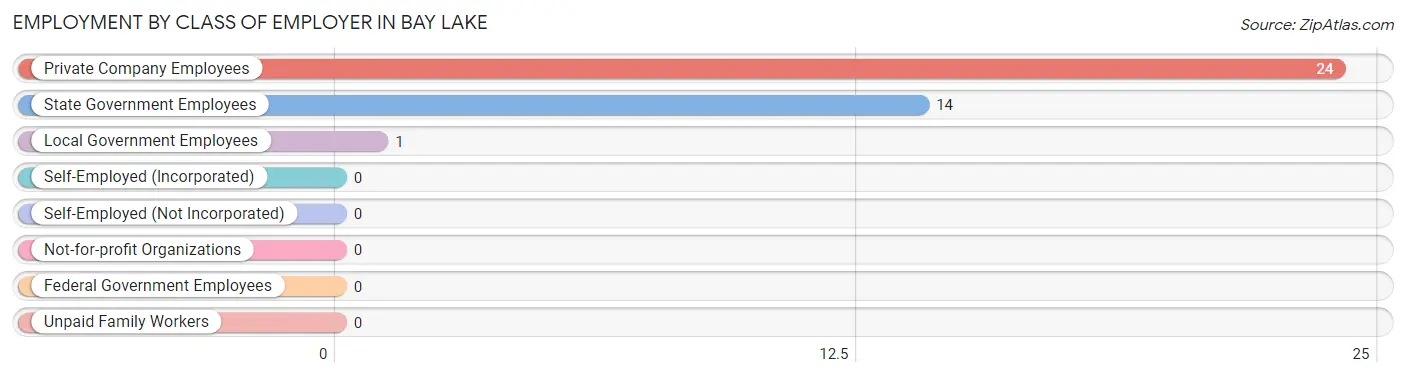
| Employer Class | # Employees | % Employees |
| Private Company Employees | 24 | 61.5% |
| Self-Employed (Incorporated) | 0 | 0.0% |
| Self-Employed (Not Incorporated) | 0 | 0.0% |
| Not-for-profit Organizations | 0 | 0.0% |
| Local Government Employees | 1 | 2.6% |
| State Government Employees | 14 | 35.9% |
| Federal Government Employees | 0 | 0.0% |
| Unpaid Family Workers | 0 | 0.0% |
| Total | 39 | 100.0% |
Employment Status by Age in Bay Lake
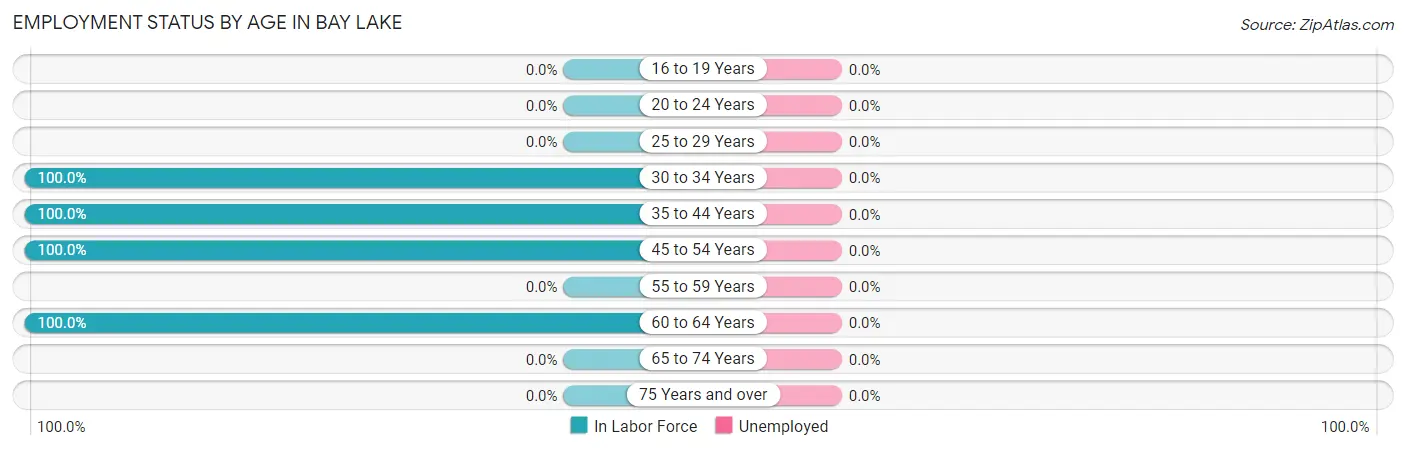
| Age Bracket | In Labor Force | Unemployed |
| 16 to 19 Years | 0 (0.0%) | 0 (0.0%) |
| 20 to 24 Years | 0 (0.0%) | 0 (0.0%) |
| 25 to 29 Years | 0 (0.0%) | 0 (0.0%) |
| 30 to 34 Years | 19 (100.0%) | 0 (0.0%) |
| 35 to 44 Years | 16 (100.0%) | 0 (0.0%) |
| 45 to 54 Years | 2 (100.0%) | 0 (0.0%) |
| 55 to 59 Years | 0 (0.0%) | 0 (0.0%) |
| 60 to 64 Years | 2 (100.0%) | 0 (0.0%) |
| 65 to 74 Years | 0 (0.0%) | 0 (0.0%) |
| 75 Years and over | 0 (0.0%) | 0 (0.0%) |
| Total | 39 (95.1%) | 0 (0.0%) |
Employment Status by Educational Attainment in Bay Lake
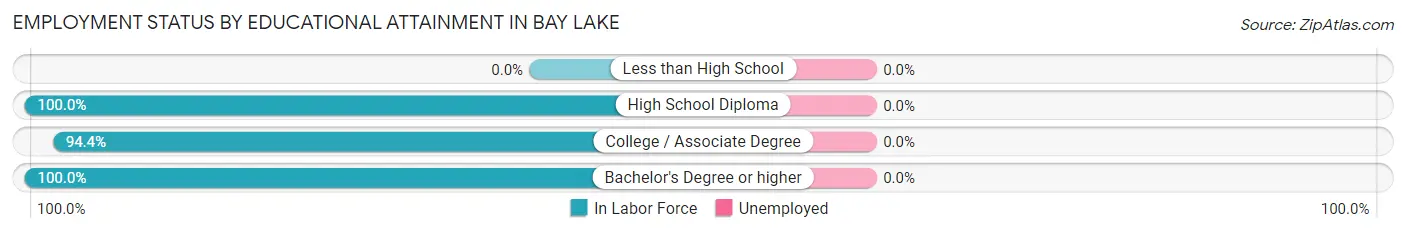
| Educational Attainment | In Labor Force | Unemployed |
| Less than High School | 0 (0.0%) | 0 (0.0%) |
| High School Diploma | 2 (100.0%) | 0 (0.0%) |
| College / Associate Degree | 17 (94.4%) | 0 (0.0%) |
| Bachelor's Degree or higher | 20 (100.0%) | 0 (0.0%) |
| Total | 39 (97.5%) | 0 (0.0%) |
Employment Occupations by Sex in Bay Lake
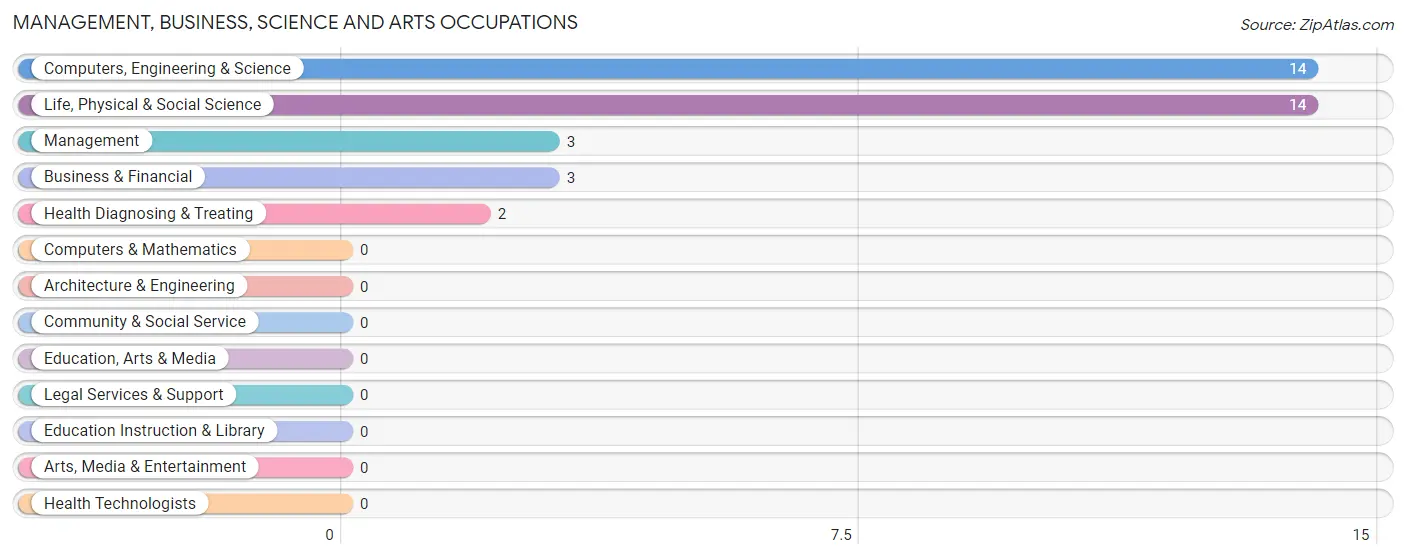
Management, Business, Science and Arts Occupations
The most common Management, Business, Science and Arts occupations in Bay Lake are Computers, Engineering & Science (14 | 35.9%), Life, Physical & Social Science (14 | 35.9%), Management (3 | 7.7%), Business & Financial (3 | 7.7%), and Health Diagnosing & Treating (2 | 5.1%).
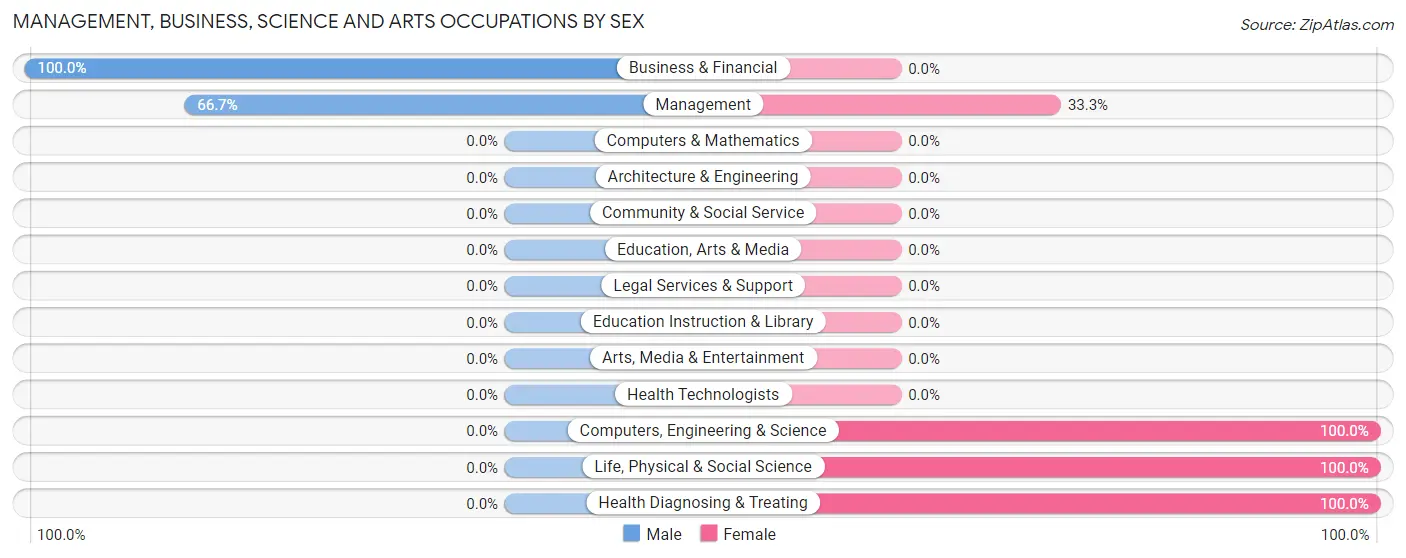
Management, Business, Science and Arts Occupations by Sex
Within the Management, Business, Science and Arts occupations in Bay Lake, the most male-oriented occupations are Business & Financial (100.0%), and Management (66.7%), while the most female-oriented occupations are Computers, Engineering & Science (100.0%), Life, Physical & Social Science (100.0%), and Health Diagnosing & Treating (100.0%).
| Occupation | Male | Female |
| Management | 2 (66.7%) | 1 (33.3%) |
| Business & Financial | 3 (100.0%) | 0 (0.0%) |
| Computers, Engineering & Science | 0 (0.0%) | 14 (100.0%) |
| Computers & Mathematics | 0 (0.0%) | 0 (0.0%) |
| Architecture & Engineering | 0 (0.0%) | 0 (0.0%) |
| Life, Physical & Social Science | 0 (0.0%) | 14 (100.0%) |
| Community & Social Service | 0 (0.0%) | 0 (0.0%) |
| Education, Arts & Media | 0 (0.0%) | 0 (0.0%) |
| Legal Services & Support | 0 (0.0%) | 0 (0.0%) |
| Education Instruction & Library | 0 (0.0%) | 0 (0.0%) |
| Arts, Media & Entertainment | 0 (0.0%) | 0 (0.0%) |
| Health Diagnosing & Treating | 0 (0.0%) | 2 (100.0%) |
| Health Technologists | 0 (0.0%) | 0 (0.0%) |
| Total (Category) | 5 (22.7%) | 17 (77.3%) |
| Total (Overall) | 22 (56.4%) | 17 (43.6%) |
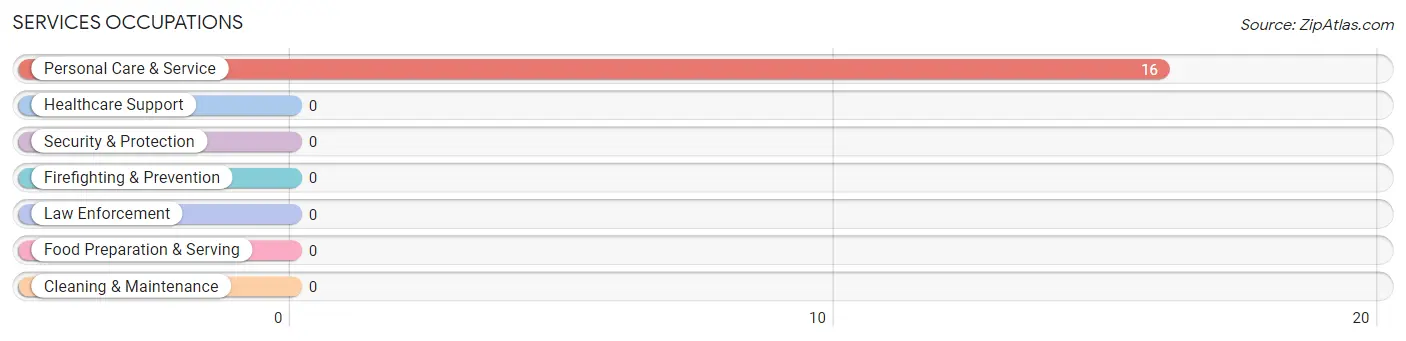
Services Occupations
The most common Services occupations in Bay Lake are , and Personal Care & Service (16 | 41.0%).
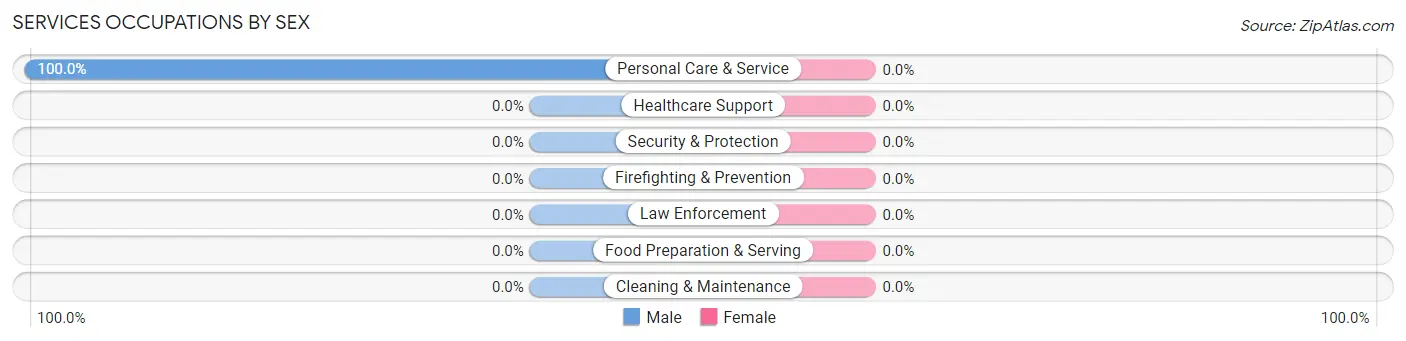
Services Occupations by Sex
| Occupation | Male | Female |
| Healthcare Support | 0 (0.0%) | 0 (0.0%) |
| Security & Protection | 0 (0.0%) | 0 (0.0%) |
| Firefighting & Prevention | 0 (0.0%) | 0 (0.0%) |
| Law Enforcement | 0 (0.0%) | 0 (0.0%) |
| Food Preparation & Serving | 0 (0.0%) | 0 (0.0%) |
| Cleaning & Maintenance | 0 (0.0%) | 0 (0.0%) |
| Personal Care & Service | 16 (100.0%) | 0 (0.0%) |
| Total (Category) | 16 (100.0%) | 0 (0.0%) |
| Total (Overall) | 22 (56.4%) | 17 (43.6%) |
Sales and Office Occupations
Sales and Office Occupations by Sex
| Occupation | Male | Female |
| Sales & Related | 0 (0.0%) | 0 (0.0%) |
| Office & Administration | 0 (0.0%) | 0 (0.0%) |
| Total (Category) | 0 (0.0%) | 0 (0.0%) |
| Total (Overall) | 22 (56.4%) | 17 (43.6%) |
Natural Resources, Construction and Maintenance Occupations
Natural Resources, Construction and Maintenance Occupations by Sex
| Occupation | Male | Female |
| Farming, Fishing & Forestry | 0 (0.0%) | 0 (0.0%) |
| Construction & Extraction | 0 (0.0%) | 0 (0.0%) |
| Installation, Maintenance & Repair | 0 (0.0%) | 0 (0.0%) |
| Total (Category) | 0 (0.0%) | 0 (0.0%) |
| Total (Overall) | 22 (56.4%) | 17 (43.6%) |
Production, Transportation and Moving Occupations
The most common Production, Transportation and Moving occupations in Bay Lake are , and Transportation (1 | 2.6%).
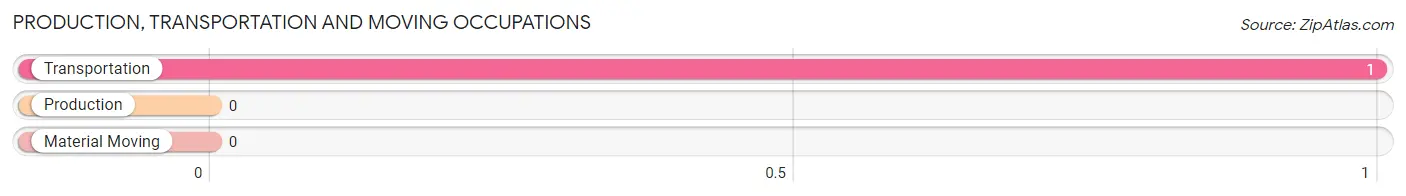
Production, Transportation and Moving Occupations by Sex
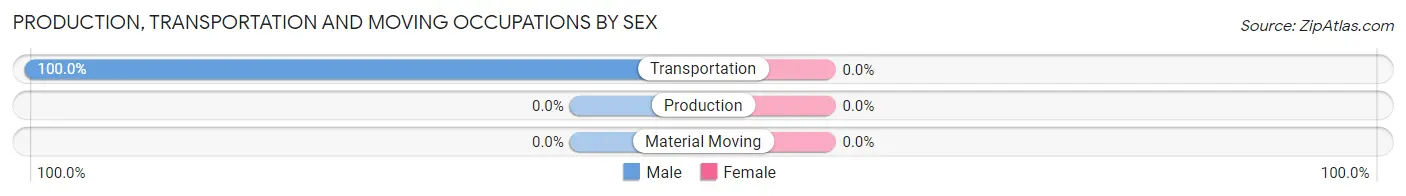
| Occupation | Male | Female |
| Production | 0 (0.0%) | 0 (0.0%) |
| Transportation | 1 (100.0%) | 0 (0.0%) |
| Material Moving | 0 (0.0%) | 0 (0.0%) |
| Total (Category) | 1 (100.0%) | 0 (0.0%) |
| Total (Overall) | 22 (56.4%) | 17 (43.6%) |
Employment Industries by Sex in Bay Lake
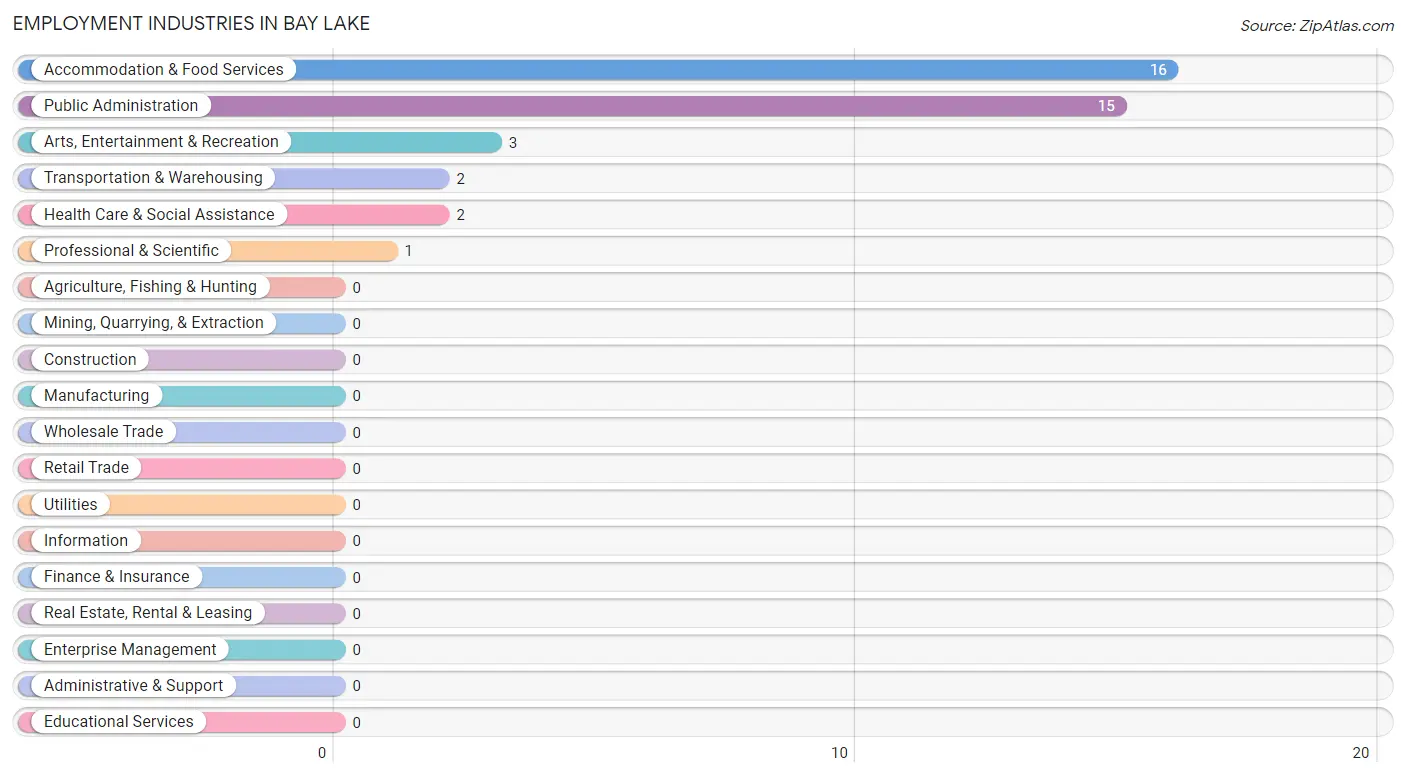
Employment Industries in Bay Lake
The major employment industries in Bay Lake include Accommodation & Food Services (16 | 41.0%), Public Administration (15 | 38.5%), Arts, Entertainment & Recreation (3 | 7.7%), Transportation & Warehousing (2 | 5.1%), and Health Care & Social Assistance (2 | 5.1%).
Employment Industries by Sex in Bay Lake
The Bay Lake industries that see more men than women are Transportation & Warehousing (100.0%), Professional & Scientific (100.0%), and Arts, Entertainment & Recreation (100.0%), whereas the industries that tend to have a higher number of women are Health Care & Social Assistance (100.0%), and Public Administration (100.0%).
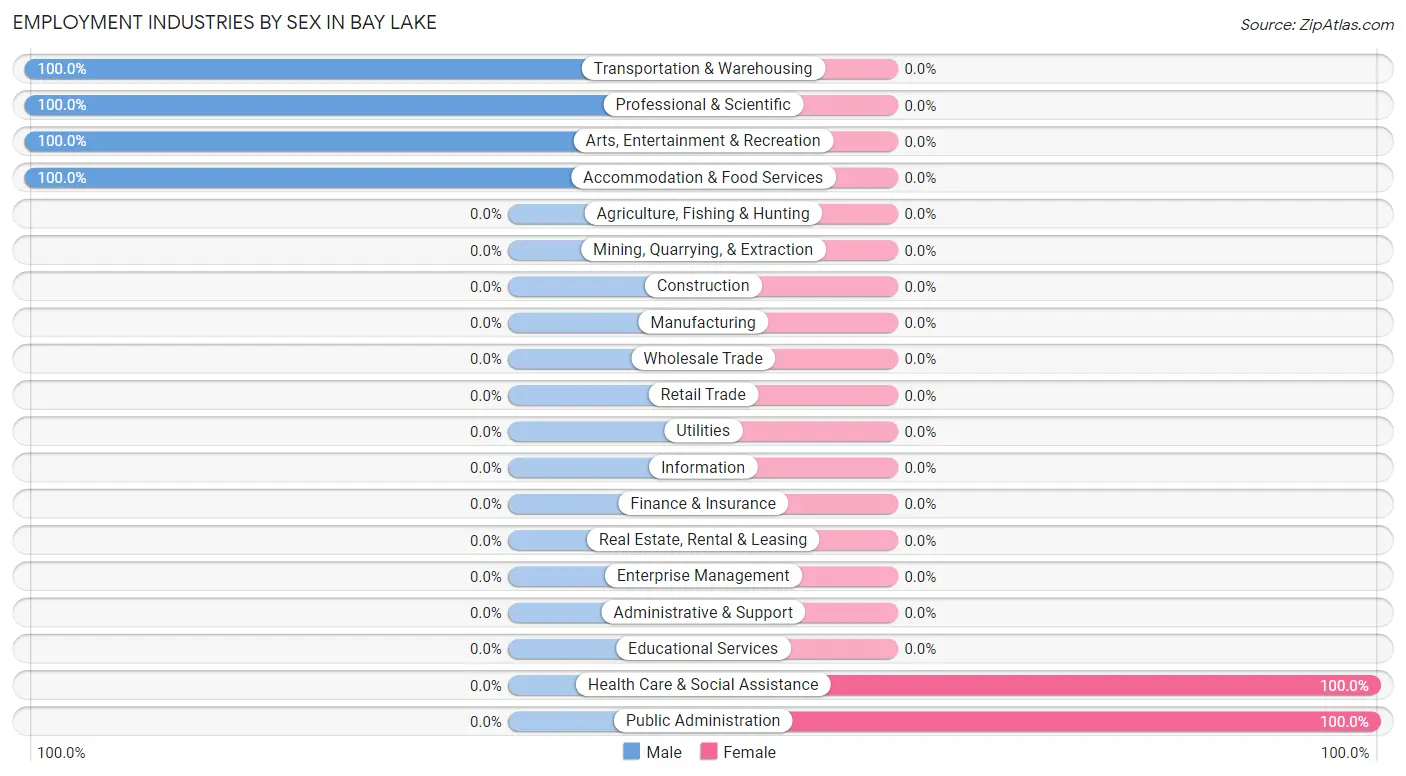
| Industry | Male | Female |
| Agriculture, Fishing & Hunting | 0 (0.0%) | 0 (0.0%) |
| Mining, Quarrying, & Extraction | 0 (0.0%) | 0 (0.0%) |
| Construction | 0 (0.0%) | 0 (0.0%) |
| Manufacturing | 0 (0.0%) | 0 (0.0%) |
| Wholesale Trade | 0 (0.0%) | 0 (0.0%) |
| Retail Trade | 0 (0.0%) | 0 (0.0%) |
| Transportation & Warehousing | 2 (100.0%) | 0 (0.0%) |
| Utilities | 0 (0.0%) | 0 (0.0%) |
| Information | 0 (0.0%) | 0 (0.0%) |
| Finance & Insurance | 0 (0.0%) | 0 (0.0%) |
| Real Estate, Rental & Leasing | 0 (0.0%) | 0 (0.0%) |
| Professional & Scientific | 1 (100.0%) | 0 (0.0%) |
| Enterprise Management | 0 (0.0%) | 0 (0.0%) |
| Administrative & Support | 0 (0.0%) | 0 (0.0%) |
| Educational Services | 0 (0.0%) | 0 (0.0%) |
| Health Care & Social Assistance | 0 (0.0%) | 2 (100.0%) |
| Arts, Entertainment & Recreation | 3 (100.0%) | 0 (0.0%) |
| Accommodation & Food Services | 16 (100.0%) | 0 (0.0%) |
| Public Administration | 0 (0.0%) | 15 (100.0%) |
| Total | 22 (56.4%) | 17 (43.6%) |
Education in Bay Lake
School Enrollment in Bay Lake
The most common levels of schooling among the 15 students in Bay Lake are graduate / professional (14 | 93.3%), and nursery / preschool (1 | 6.7%).
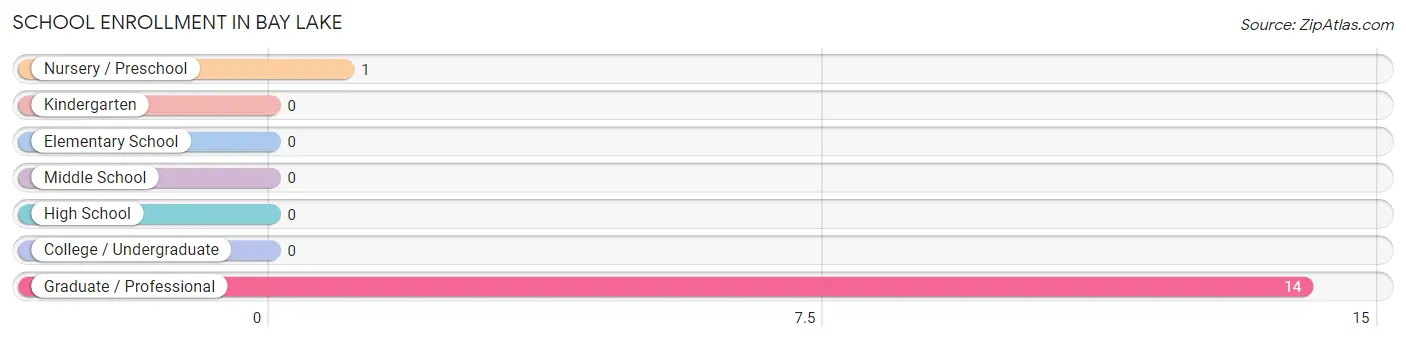
| School Level | # Students | % Students |
| Nursery / Preschool | 1 | 6.7% |
| Kindergarten | 0 | 0.0% |
| Elementary School | 0 | 0.0% |
| Middle School | 0 | 0.0% |
| High School | 0 | 0.0% |
| College / Undergraduate | 0 | 0.0% |
| Graduate / Professional | 14 | 93.3% |
| Total | 15 | 100.0% |
School Enrollment by Age by Funding Source in Bay Lake
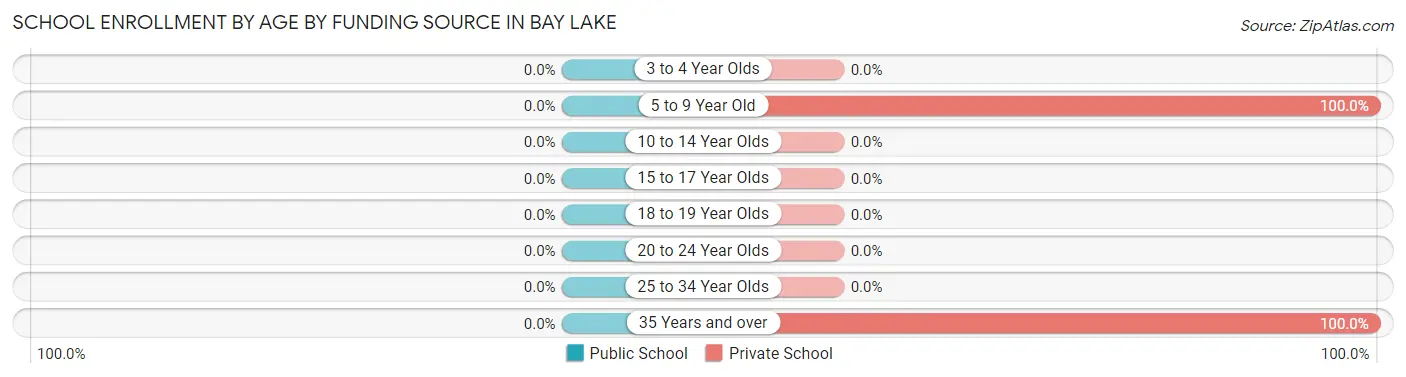
| Age Bracket | Public School | Private School |
| 3 to 4 Year Olds | 0 (0.0%) | 0 (0.0%) |
| 5 to 9 Year Old | 0 (0.0%) | 1 (100.0%) |
| 10 to 14 Year Olds | 0 (0.0%) | 0 (0.0%) |
| 15 to 17 Year Olds | 0 (0.0%) | 0 (0.0%) |
| 18 to 19 Year Olds | 0 (0.0%) | 0 (0.0%) |
| 20 to 24 Year Olds | 0 (0.0%) | 0 (0.0%) |
| 25 to 34 Year Olds | 0 (0.0%) | 0 (0.0%) |
| 35 Years and over | 0 (0.0%) | 14 (100.0%) |
| Total | 0 (0.0%) | 15 (100.0%) |
Educational Attainment by Field of Study in Bay Lake
Bio, nature & agricultural (16 | 76.2%), science & technology (3 | 14.3%), and business (2 | 9.5%) are the most common fields of study among 21 individuals in Bay Lake who have obtained a bachelor's degree or higher.
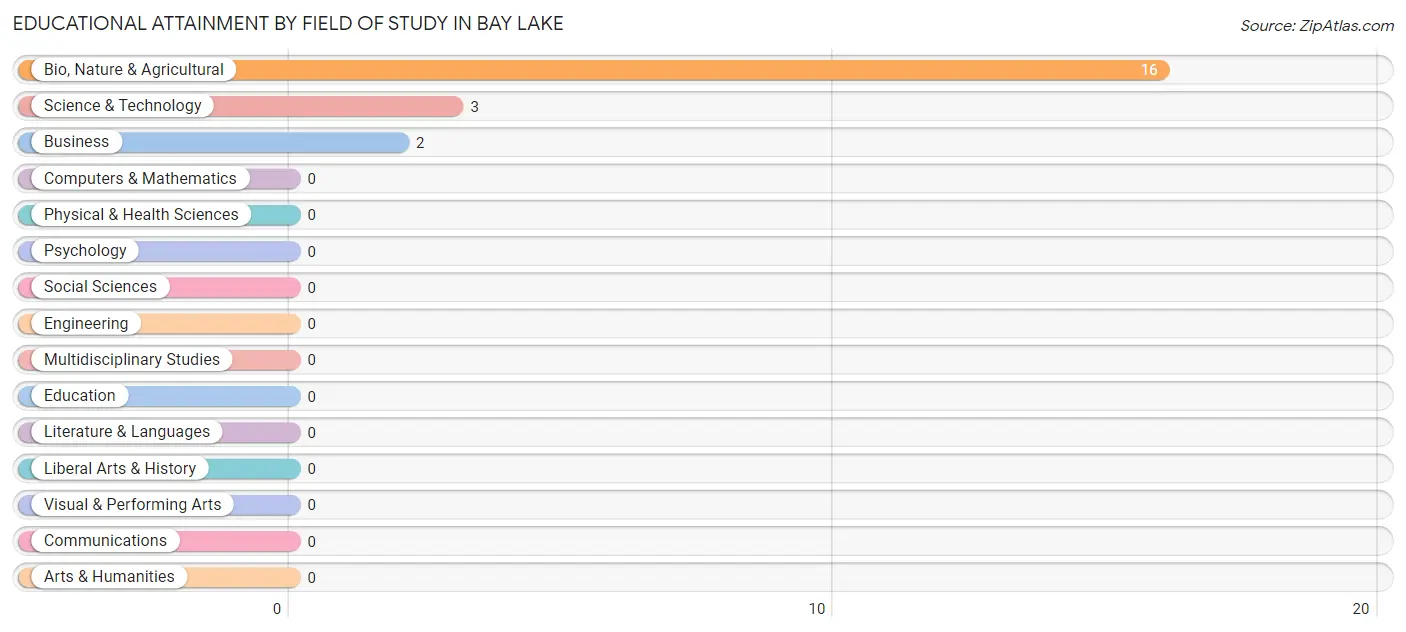
| Field of Study | # Graduates | % Graduates |
| Computers & Mathematics | 0 | 0.0% |
| Bio, Nature & Agricultural | 16 | 76.2% |
| Physical & Health Sciences | 0 | 0.0% |
| Psychology | 0 | 0.0% |
| Social Sciences | 0 | 0.0% |
| Engineering | 0 | 0.0% |
| Multidisciplinary Studies | 0 | 0.0% |
| Science & Technology | 3 | 14.3% |
| Business | 2 | 9.5% |
| Education | 0 | 0.0% |
| Literature & Languages | 0 | 0.0% |
| Liberal Arts & History | 0 | 0.0% |
| Visual & Performing Arts | 0 | 0.0% |
| Communications | 0 | 0.0% |
| Arts & Humanities | 0 | 0.0% |
| Total | 21 | 100.0% |
Transportation & Commute in Bay Lake
Vehicle Availability by Sex in Bay Lake
The most prevalent vehicle ownership categories in Bay Lake are males with 2 vehicles (16, accounting for 72.7%) and females with 2 vehicles (14, making up 94.1%).
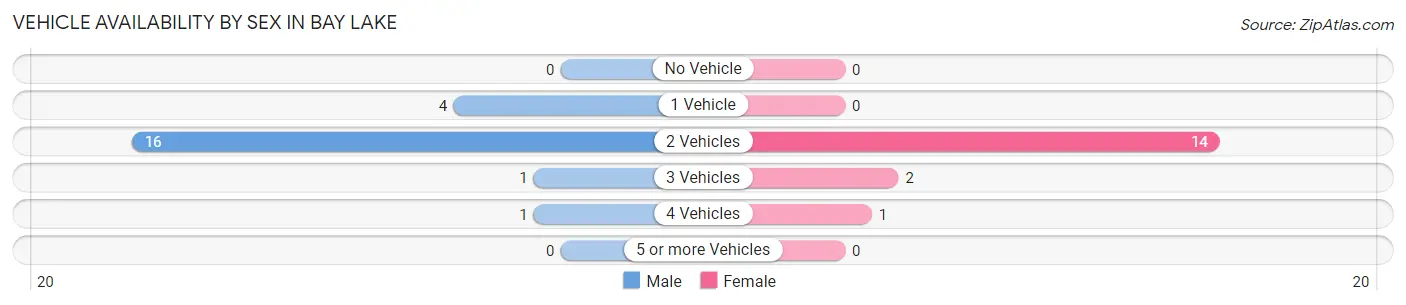
| Vehicles Available | Male | Female |
| No Vehicle | 0 (0.0%) | 0 (0.0%) |
| 1 Vehicle | 4 (18.2%) | 0 (0.0%) |
| 2 Vehicles | 16 (72.7%) | 14 (82.4%) |
| 3 Vehicles | 1 (4.5%) | 2 (11.8%) |
| 4 Vehicles | 1 (4.5%) | 1 (5.9%) |
| 5 or more Vehicles | 0 (0.0%) | 0 (0.0%) |
| Total | 22 (100.0%) | 17 (100.0%) |
Commute Time in Bay Lake
The most frequently occuring commute durations in Bay Lake are 20 to 24 minutes (30 commuters, 78.9%), 10 to 14 minutes (3 commuters, 7.9%), and 15 to 19 minutes (2 commuters, 5.3%).
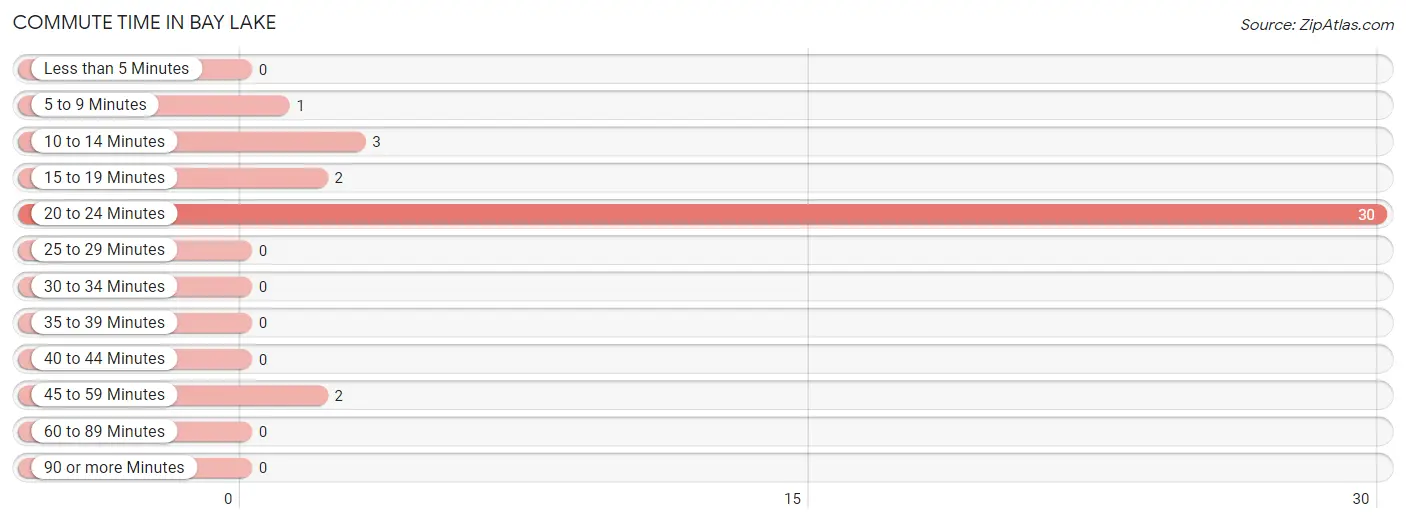
| Commute Time | # Commuters | % Commuters |
| Less than 5 Minutes | 0 | 0.0% |
| 5 to 9 Minutes | 1 | 2.6% |
| 10 to 14 Minutes | 3 | 7.9% |
| 15 to 19 Minutes | 2 | 5.3% |
| 20 to 24 Minutes | 30 | 78.9% |
| 25 to 29 Minutes | 0 | 0.0% |
| 30 to 34 Minutes | 0 | 0.0% |
| 35 to 39 Minutes | 0 | 0.0% |
| 40 to 44 Minutes | 0 | 0.0% |
| 45 to 59 Minutes | 2 | 5.3% |
| 60 to 89 Minutes | 0 | 0.0% |
| 90 or more Minutes | 0 | 0.0% |
Commute Time by Sex in Bay Lake
The most common commute times in Bay Lake are 20 to 24 minutes (16 commuters, 76.2%) for males and 20 to 24 minutes (14 commuters, 82.4%) for females.
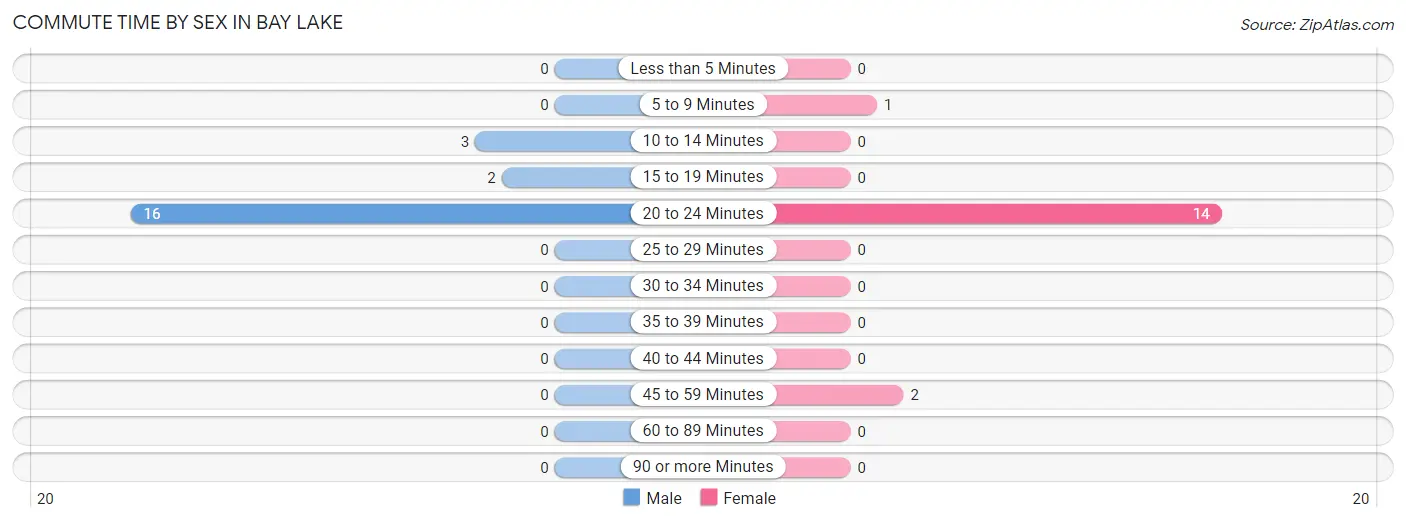
| Commute Time | Male | Female |
| Less than 5 Minutes | 0 (0.0%) | 0 (0.0%) |
| 5 to 9 Minutes | 0 (0.0%) | 1 (5.9%) |
| 10 to 14 Minutes | 3 (14.3%) | 0 (0.0%) |
| 15 to 19 Minutes | 2 (9.5%) | 0 (0.0%) |
| 20 to 24 Minutes | 16 (76.2%) | 14 (82.4%) |
| 25 to 29 Minutes | 0 (0.0%) | 0 (0.0%) |
| 30 to 34 Minutes | 0 (0.0%) | 0 (0.0%) |
| 35 to 39 Minutes | 0 (0.0%) | 0 (0.0%) |
| 40 to 44 Minutes | 0 (0.0%) | 0 (0.0%) |
| 45 to 59 Minutes | 0 (0.0%) | 2 (11.8%) |
| 60 to 89 Minutes | 0 (0.0%) | 0 (0.0%) |
| 90 or more Minutes | 0 (0.0%) | 0 (0.0%) |
Time of Departure to Work by Sex in Bay Lake
The most frequent times of departure to work in Bay Lake are 5:30 AM to 5:59 AM (16, 76.2%) for males and 6:00 AM to 6:29 AM (14, 82.4%) for females.
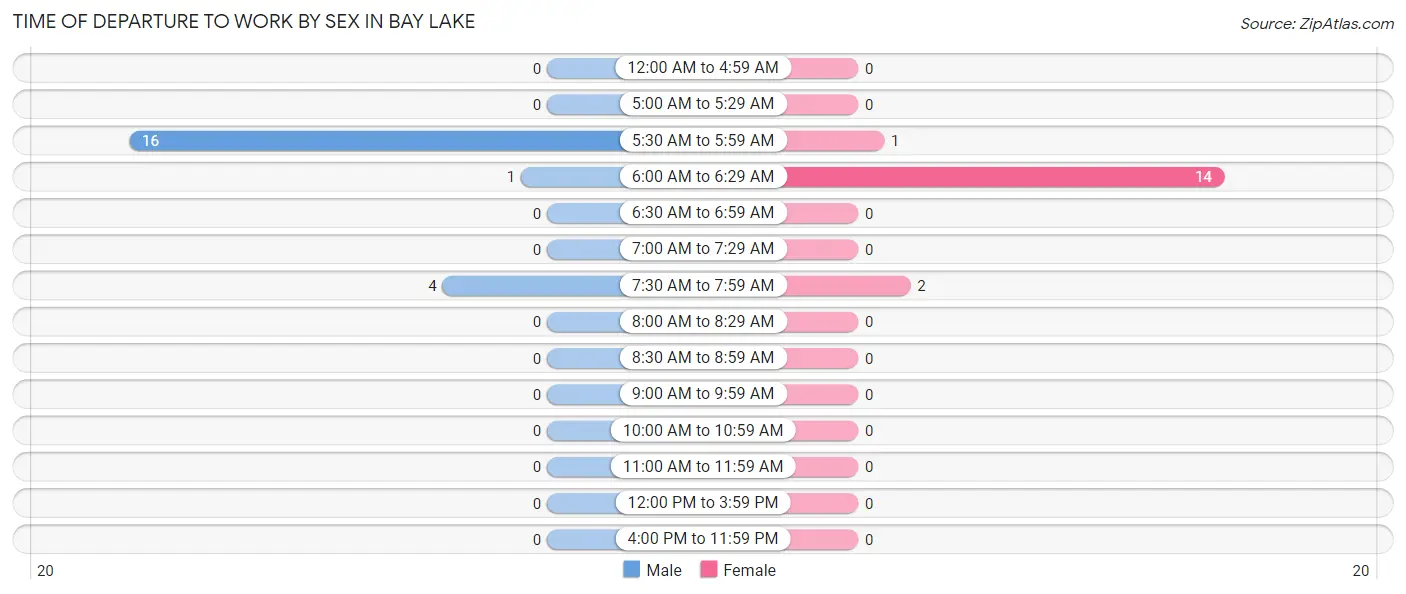
| Time of Departure | Male | Female |
| 12:00 AM to 4:59 AM | 0 (0.0%) | 0 (0.0%) |
| 5:00 AM to 5:29 AM | 0 (0.0%) | 0 (0.0%) |
| 5:30 AM to 5:59 AM | 16 (76.2%) | 1 (5.9%) |
| 6:00 AM to 6:29 AM | 1 (4.8%) | 14 (82.4%) |
| 6:30 AM to 6:59 AM | 0 (0.0%) | 0 (0.0%) |
| 7:00 AM to 7:29 AM | 0 (0.0%) | 0 (0.0%) |
| 7:30 AM to 7:59 AM | 4 (19.1%) | 2 (11.8%) |
| 8:00 AM to 8:29 AM | 0 (0.0%) | 0 (0.0%) |
| 8:30 AM to 8:59 AM | 0 (0.0%) | 0 (0.0%) |
| 9:00 AM to 9:59 AM | 0 (0.0%) | 0 (0.0%) |
| 10:00 AM to 10:59 AM | 0 (0.0%) | 0 (0.0%) |
| 11:00 AM to 11:59 AM | 0 (0.0%) | 0 (0.0%) |
| 12:00 PM to 3:59 PM | 0 (0.0%) | 0 (0.0%) |
| 4:00 PM to 11:59 PM | 0 (0.0%) | 0 (0.0%) |
| Total | 21 (100.0%) | 17 (100.0%) |
Housing Occupancy in Bay Lake
Occupancy by Ownership in Bay Lake
Of the total 20 dwellings in Bay Lake, owner-occupied units account for 20 (100.0%), while renter-occupied units make up 0 (0.0%).
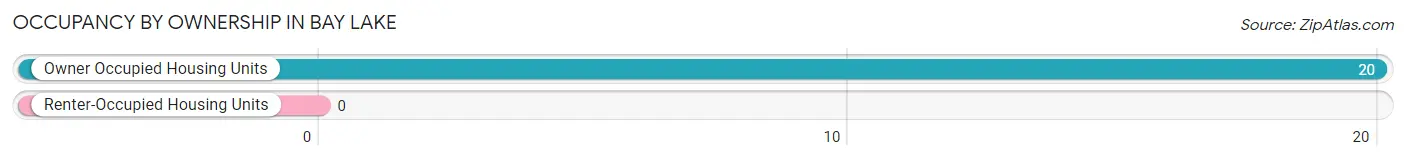
| Occupancy | # Housing Units | % Housing Units |
| Owner Occupied Housing Units | 20 | 100.0% |
| Renter-Occupied Housing Units | 0 | 0.0% |
| Total Occupied Housing Units | 20 | 100.0% |
Occupancy by Household Size in Bay Lake
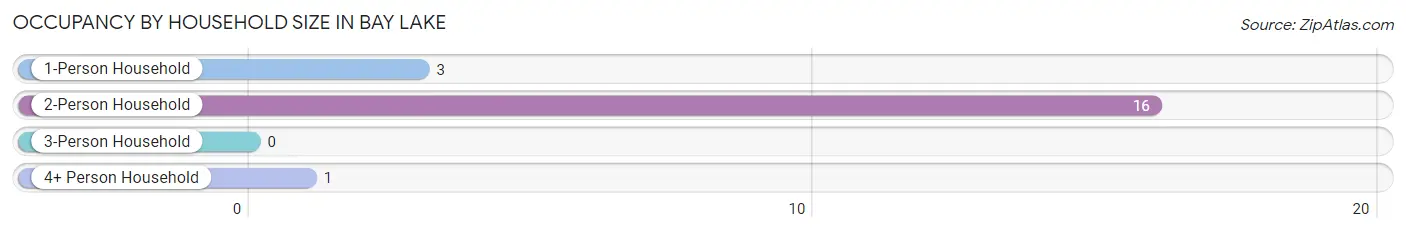
| Household Size | # Housing Units | % Housing Units |
| 1-Person Household | 3 | 15.0% |
| 2-Person Household | 16 | 80.0% |
| 3-Person Household | 0 | 0.0% |
| 4+ Person Household | 1 | 5.0% |
| Total Housing Units | 20 | 100.0% |
Occupancy by Ownership by Household Size in Bay Lake
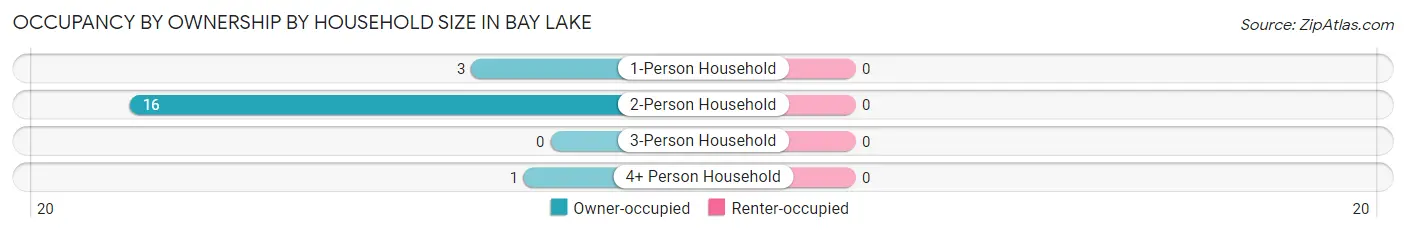
| Household Size | Owner-occupied | Renter-occupied |
| 1-Person Household | 3 (100.0%) | 0 (0.0%) |
| 2-Person Household | 16 (100.0%) | 0 (0.0%) |
| 3-Person Household | 0 (0.0%) | 0 (0.0%) |
| 4+ Person Household | 1 (100.0%) | 0 (0.0%) |
| Total Housing Units | 20 (100.0%) | 0 (0.0%) |
Occupancy by Educational Attainment in Bay Lake
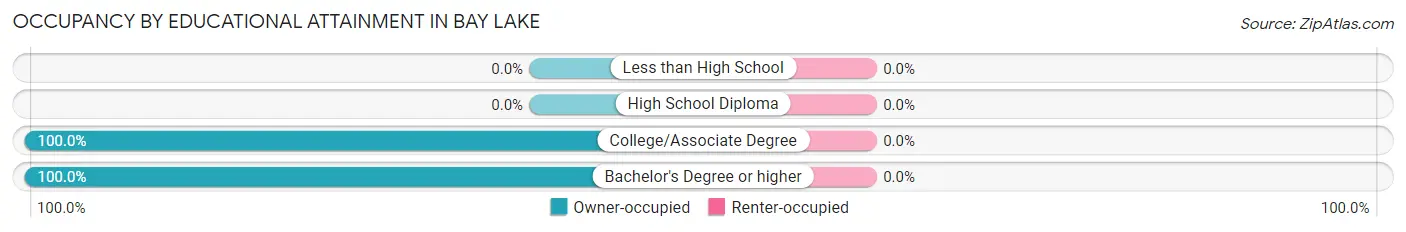
| Household Size | Owner-occupied | Renter-occupied |
| Less than High School | 0 (0.0%) | 0 (0.0%) |
| High School Diploma | 0 (0.0%) | 0 (0.0%) |
| College/Associate Degree | 1 (100.0%) | 0 (0.0%) |
| Bachelor's Degree or higher | 19 (100.0%) | 0 (0.0%) |
Occupancy by Age of Householder in Bay Lake
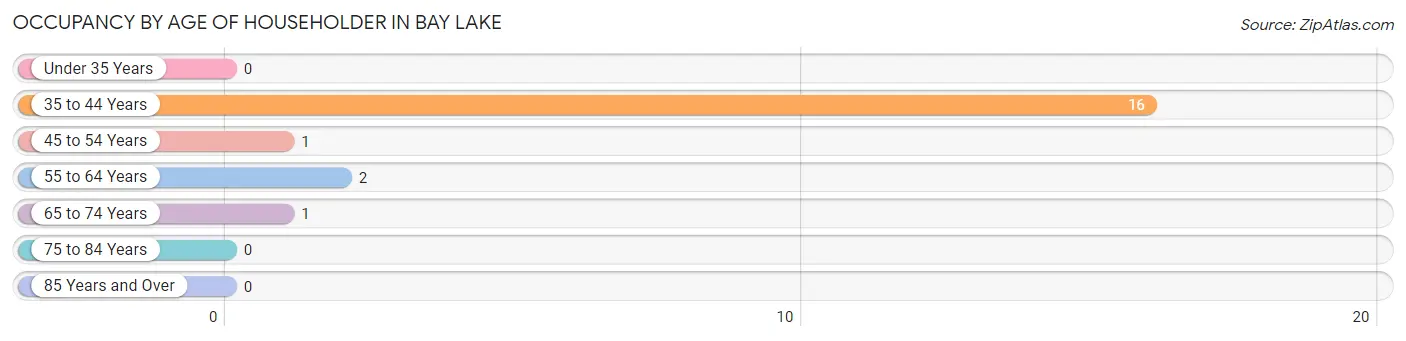
| Age Bracket | # Households | % Households |
| Under 35 Years | 0 | 0.0% |
| 35 to 44 Years | 16 | 80.0% |
| 45 to 54 Years | 1 | 5.0% |
| 55 to 64 Years | 2 | 10.0% |
| 65 to 74 Years | 1 | 5.0% |
| 75 to 84 Years | 0 | 0.0% |
| 85 Years and Over | 0 | 0.0% |
| Total | 20 | 100.0% |
Housing Finances in Bay Lake
Median Income by Occupancy in Bay Lake
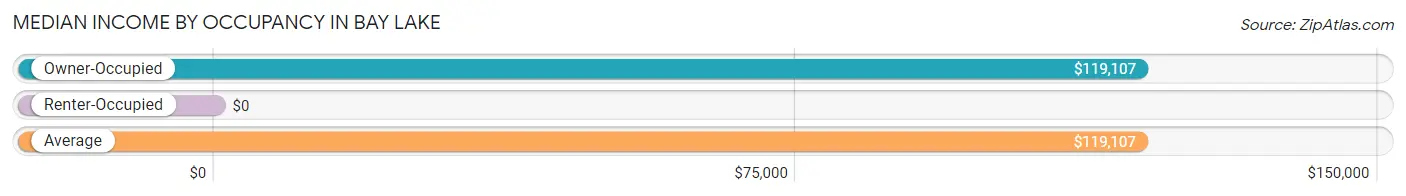
| Occupancy Type | # Households | Median Income |
| Owner-Occupied | 20 (100.0%) | $119,107 |
| Renter-Occupied | 0 (0.0%) | $0 |
| Average | 20 (100.0%) | $119,107 |
Occupancy by Householder Income Bracket in Bay Lake
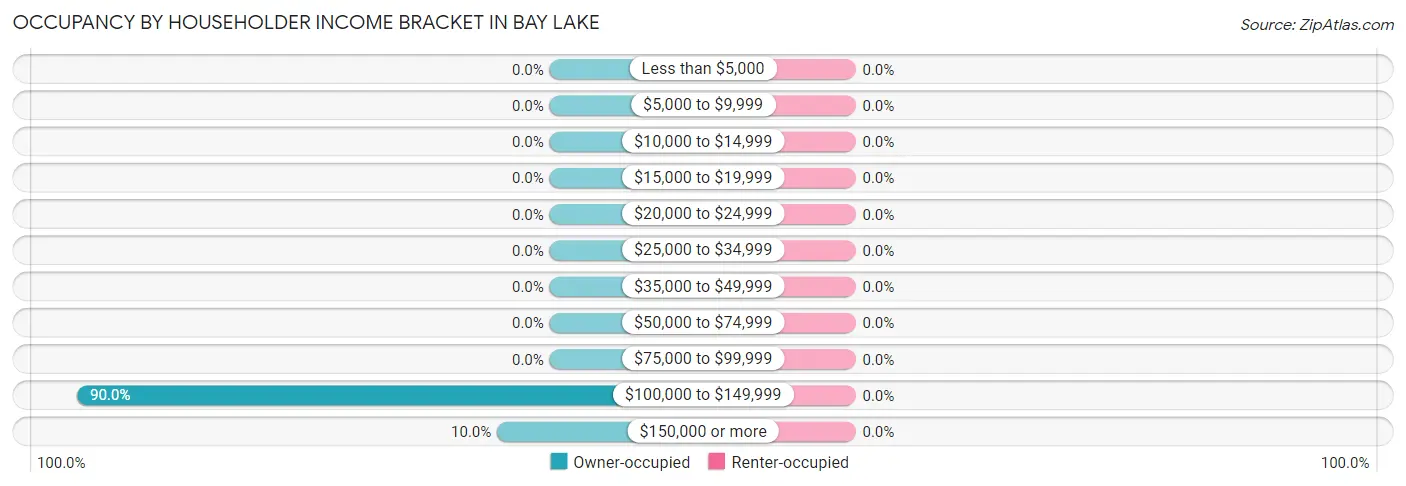
| Income Bracket | Owner-occupied | Renter-occupied |
| Less than $5,000 | 0 (0.0%) | 0 (0.0%) |
| $5,000 to $9,999 | 0 (0.0%) | 0 (0.0%) |
| $10,000 to $14,999 | 0 (0.0%) | 0 (0.0%) |
| $15,000 to $19,999 | 0 (0.0%) | 0 (0.0%) |
| $20,000 to $24,999 | 0 (0.0%) | 0 (0.0%) |
| $25,000 to $34,999 | 0 (0.0%) | 0 (0.0%) |
| $35,000 to $49,999 | 0 (0.0%) | 0 (0.0%) |
| $50,000 to $74,999 | 0 (0.0%) | 0 (0.0%) |
| $75,000 to $99,999 | 0 (0.0%) | 0 (0.0%) |
| $100,000 to $149,999 | 18 (90.0%) | 0 (0.0%) |
| $150,000 or more | 2 (10.0%) | 0 (0.0%) |
| Total | 20 (100.0%) | 0 (0.0%) |
Monthly Housing Cost Tiers in Bay Lake
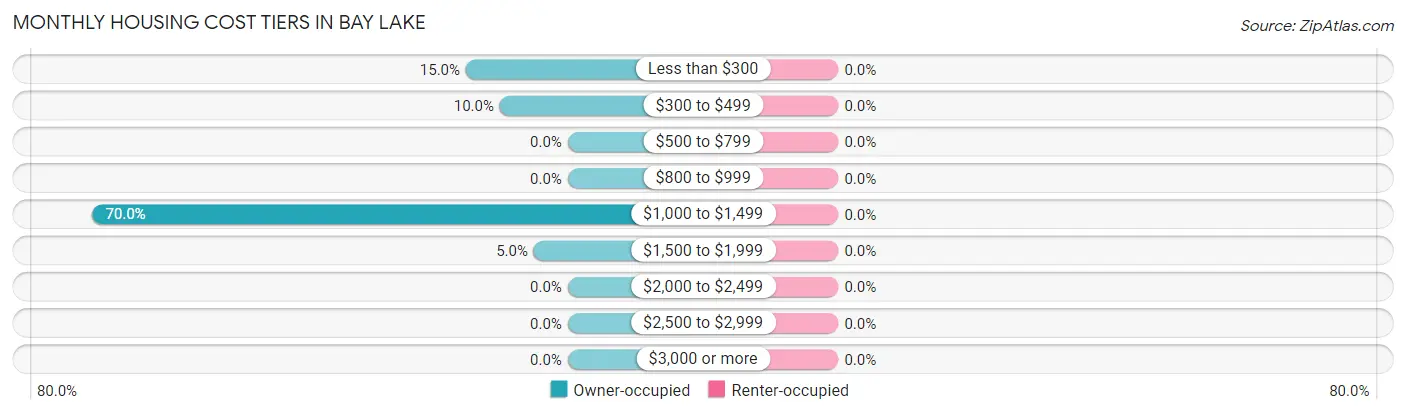
| Monthly Cost | Owner-occupied | Renter-occupied |
| Less than $300 | 3 (15.0%) | 0 (0.0%) |
| $300 to $499 | 2 (10.0%) | 0 (0.0%) |
| $500 to $799 | 0 (0.0%) | 0 (0.0%) |
| $800 to $999 | 0 (0.0%) | 0 (0.0%) |
| $1,000 to $1,499 | 14 (70.0%) | 0 (0.0%) |
| $1,500 to $1,999 | 1 (5.0%) | 0 (0.0%) |
| $2,000 to $2,499 | 0 (0.0%) | 0 (0.0%) |
| $2,500 to $2,999 | 0 (0.0%) | 0 (0.0%) |
| $3,000 or more | 0 (0.0%) | 0 (0.0%) |
| Total | 20 (100.0%) | 0 (0.0%) |
Physical Housing Characteristics in Bay Lake
Housing Structures in Bay Lake
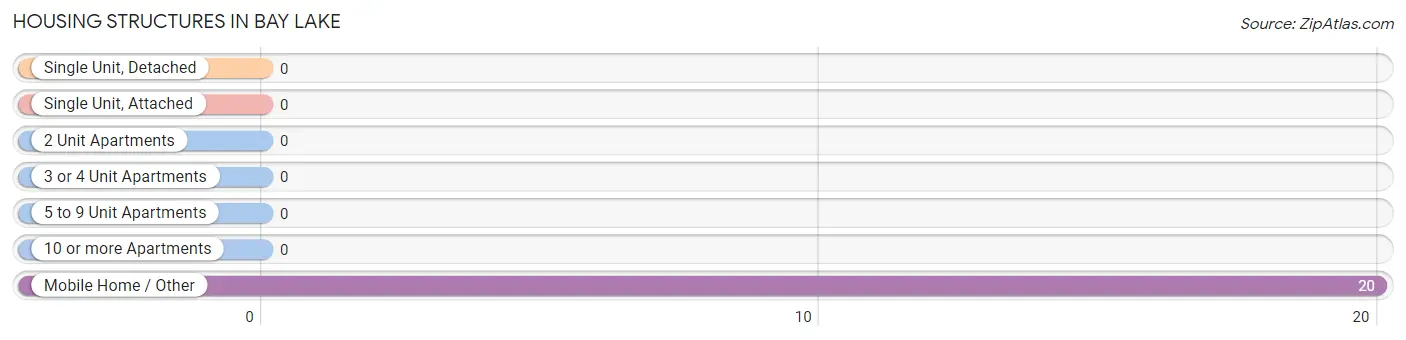
| Structure Type | # Housing Units | % Housing Units |
| Single Unit, Detached | 0 | 0.0% |
| Single Unit, Attached | 0 | 0.0% |
| 2 Unit Apartments | 0 | 0.0% |
| 3 or 4 Unit Apartments | 0 | 0.0% |
| 5 to 9 Unit Apartments | 0 | 0.0% |
| 10 or more Apartments | 0 | 0.0% |
| Mobile Home / Other | 20 | 100.0% |
| Total | 20 | 100.0% |
Housing Structures by Occupancy in Bay Lake
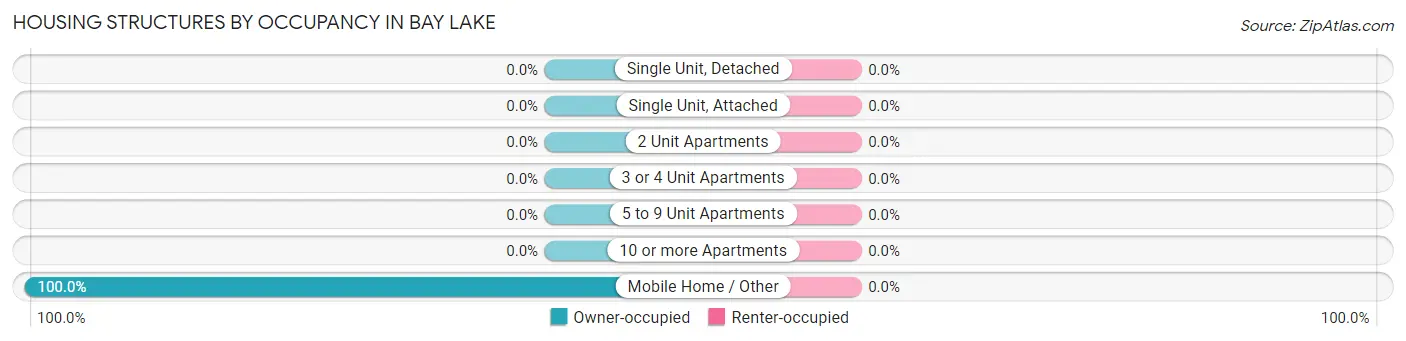
| Structure Type | Owner-occupied | Renter-occupied |
| Single Unit, Detached | 0 (0.0%) | 0 (0.0%) |
| Single Unit, Attached | 0 (0.0%) | 0 (0.0%) |
| 2 Unit Apartments | 0 (0.0%) | 0 (0.0%) |
| 3 or 4 Unit Apartments | 0 (0.0%) | 0 (0.0%) |
| 5 to 9 Unit Apartments | 0 (0.0%) | 0 (0.0%) |
| 10 or more Apartments | 0 (0.0%) | 0 (0.0%) |
| Mobile Home / Other | 20 (100.0%) | 0 (0.0%) |
| Total | 20 (100.0%) | 0 (0.0%) |
Housing Structures by Number of Rooms in Bay Lake
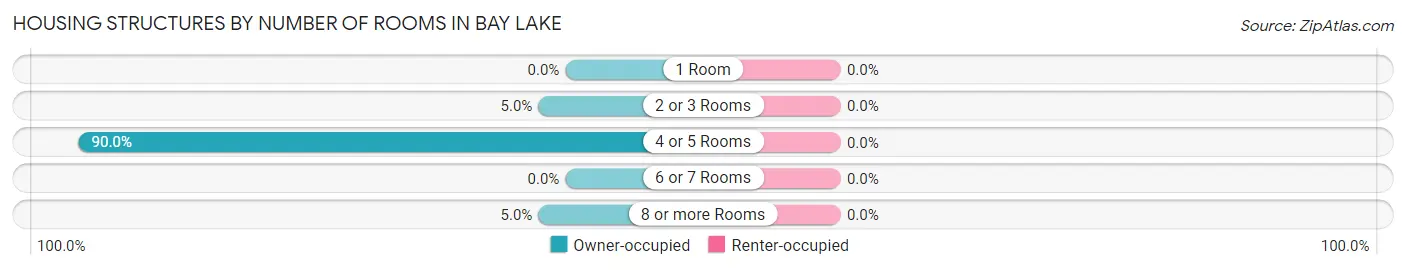
| Number of Rooms | Owner-occupied | Renter-occupied |
| 1 Room | 0 (0.0%) | 0 (0.0%) |
| 2 or 3 Rooms | 1 (5.0%) | 0 (0.0%) |
| 4 or 5 Rooms | 18 (90.0%) | 0 (0.0%) |
| 6 or 7 Rooms | 0 (0.0%) | 0 (0.0%) |
| 8 or more Rooms | 1 (5.0%) | 0 (0.0%) |
| Total | 20 (100.0%) | 0 (0.0%) |
Housing Structure by Heating Type in Bay Lake
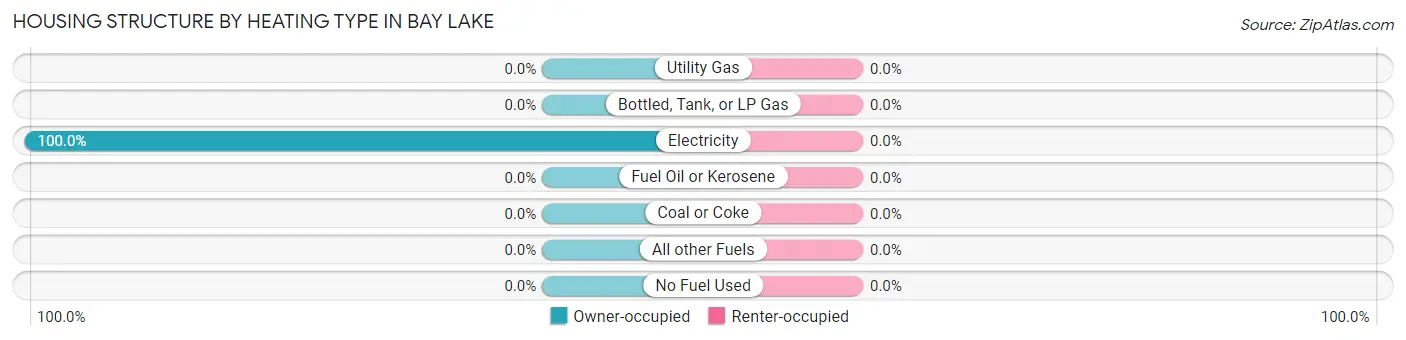
| Heating Type | Owner-occupied | Renter-occupied |
| Utility Gas | 0 (0.0%) | 0 (0.0%) |
| Bottled, Tank, or LP Gas | 0 (0.0%) | 0 (0.0%) |
| Electricity | 20 (100.0%) | 0 (0.0%) |
| Fuel Oil or Kerosene | 0 (0.0%) | 0 (0.0%) |
| Coal or Coke | 0 (0.0%) | 0 (0.0%) |
| All other Fuels | 0 (0.0%) | 0 (0.0%) |
| No Fuel Used | 0 (0.0%) | 0 (0.0%) |
| Total | 20 (100.0%) | 0 (0.0%) |
Household Vehicle Usage in Bay Lake
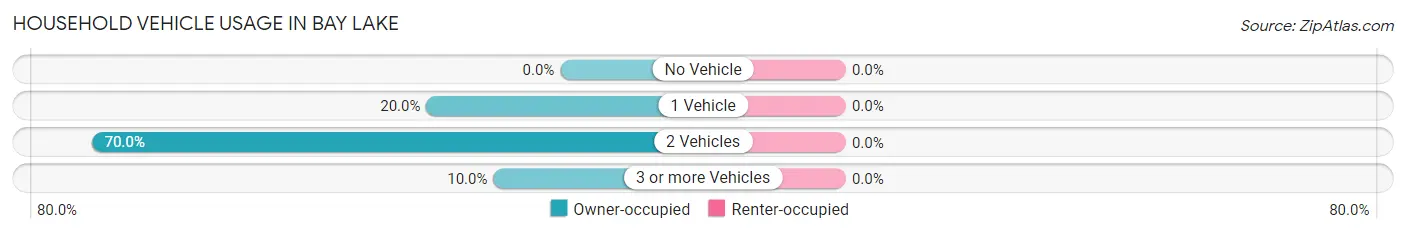
| Vehicles per Household | Owner-occupied | Renter-occupied |
| No Vehicle | 0 (0.0%) | 0 (0.0%) |
| 1 Vehicle | 4 (20.0%) | 0 (0.0%) |
| 2 Vehicles | 14 (70.0%) | 0 (0.0%) |
| 3 or more Vehicles | 2 (10.0%) | 0 (0.0%) |
| Total | 20 (100.0%) | 0 (0.0%) |
Real Estate & Mortgages in Bay Lake
Real Estate and Mortgage Overview in Bay Lake
| Characteristic | Without Mortgage | With Mortgage |
| Housing Units | 5 | 15 |
| Median Property Value | - | - |
| Median Household Income | - | - |
| Monthly Housing Costs | $292 | $0 |
| Real Estate Taxes | - | - |
Property Value by Mortgage Status in Bay Lake
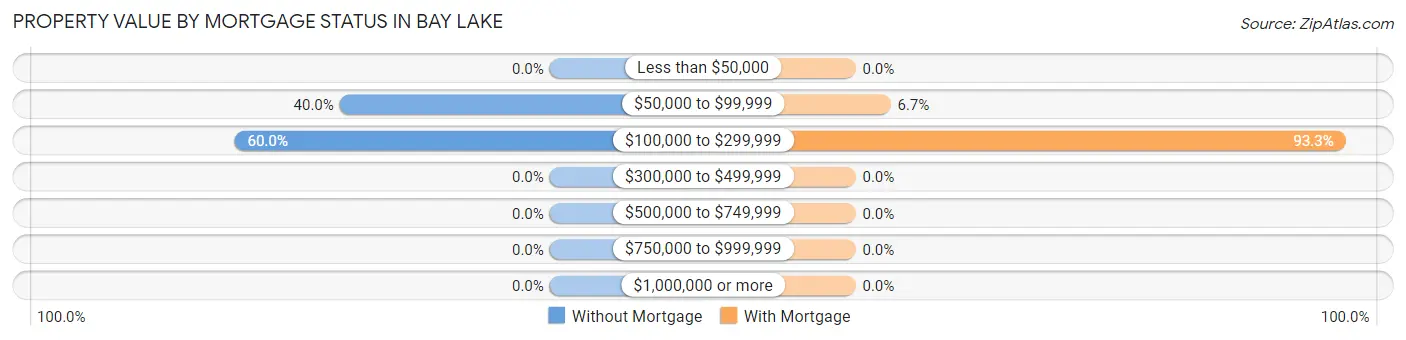
| Property Value | Without Mortgage | With Mortgage |
| Less than $50,000 | 0 (0.0%) | 0 (0.0%) |
| $50,000 to $99,999 | 2 (40.0%) | 1 (6.7%) |
| $100,000 to $299,999 | 3 (60.0%) | 14 (93.3%) |
| $300,000 to $499,999 | 0 (0.0%) | 0 (0.0%) |
| $500,000 to $749,999 | 0 (0.0%) | 0 (0.0%) |
| $750,000 to $999,999 | 0 (0.0%) | 0 (0.0%) |
| $1,000,000 or more | 0 (0.0%) | 0 (0.0%) |
| Total | 5 (100.0%) | 15 (100.0%) |
Household Income by Mortgage Status in Bay Lake
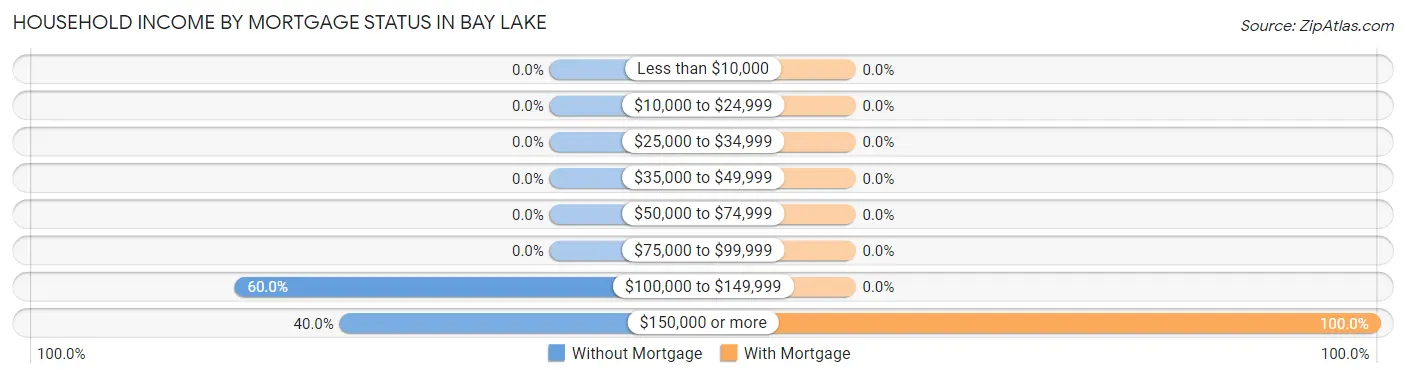
| Household Income | Without Mortgage | With Mortgage |
| Less than $10,000 | 0 (0.0%) | 0 (0.0%) |
| $10,000 to $24,999 | 0 (0.0%) | 0 (0.0%) |
| $25,000 to $34,999 | 0 (0.0%) | 0 (0.0%) |
| $35,000 to $49,999 | 0 (0.0%) | 0 (0.0%) |
| $50,000 to $74,999 | 0 (0.0%) | 0 (0.0%) |
| $75,000 to $99,999 | 0 (0.0%) | 0 (0.0%) |
| $100,000 to $149,999 | 3 (60.0%) | 0 (0.0%) |
| $150,000 or more | 2 (40.0%) | 15 (100.0%) |
| Total | 5 (100.0%) | 15 (100.0%) |
Property Value to Household Income Ratio in Bay Lake
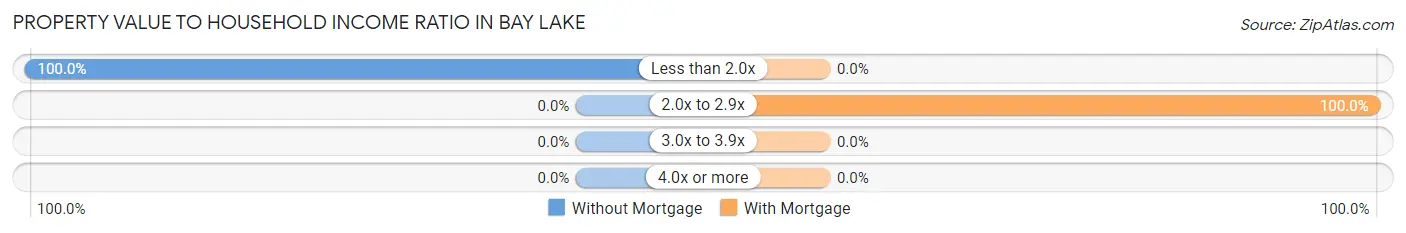
| Value-to-Income Ratio | Without Mortgage | With Mortgage |
| Less than 2.0x | 5 (100.0%) | 0 (0.0%) |
| 2.0x to 2.9x | 0 (0.0%) | 15 (100.0%) |
| 3.0x to 3.9x | 0 (0.0%) | 0 (0.0%) |
| 4.0x or more | 0 (0.0%) | 0 (0.0%) |
| Total | 5 (100.0%) | 15 (100.0%) |
Real Estate Taxes by Mortgage Status in Bay Lake
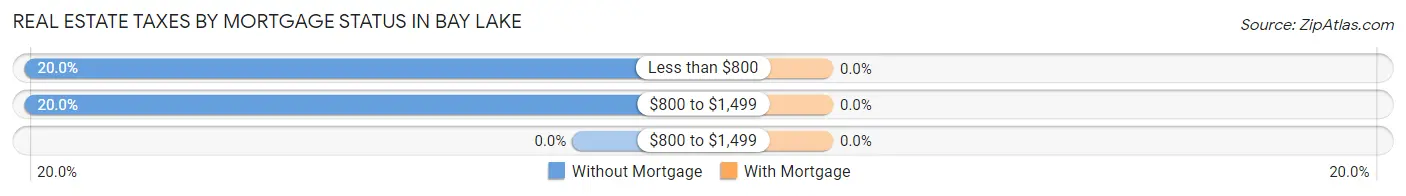
| Property Taxes | Without Mortgage | With Mortgage |
| Less than $800 | 1 (20.0%) | 0 (0.0%) |
| $800 to $1,499 | 1 (20.0%) | 0 (0.0%) |
| $800 to $1,499 | 0 (0.0%) | 0 (0.0%) |
| Total | 5 (100.0%) | 15 (100.0%) |
Health & Disability in Bay Lake
Health Insurance Coverage by Age in Bay Lake
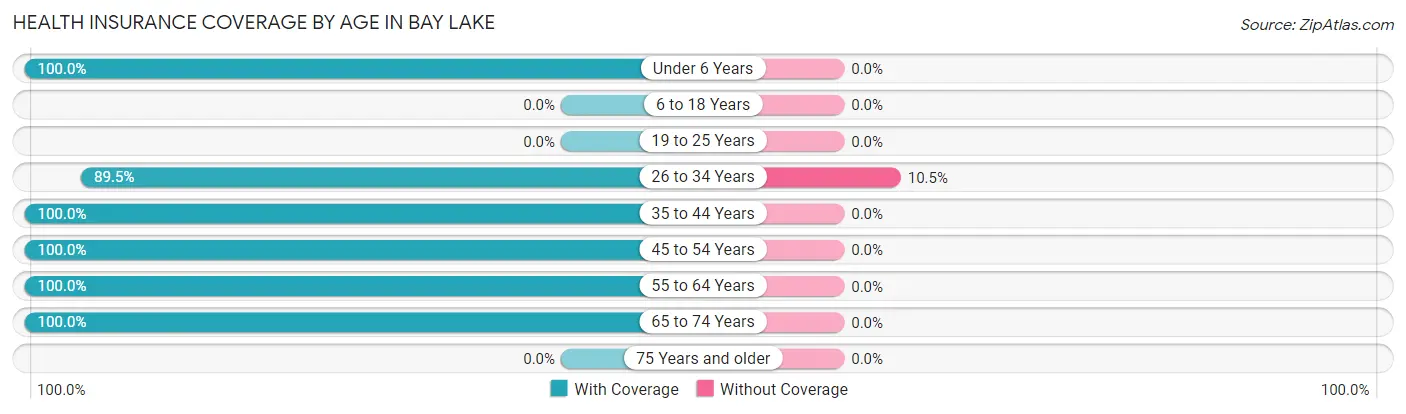
| Age Bracket | With Coverage | Without Coverage |
| Under 6 Years | 1 (100.0%) | 0 (0.0%) |
| 6 to 18 Years | 0 (0.0%) | 0 (0.0%) |
| 19 to 25 Years | 0 (0.0%) | 0 (0.0%) |
| 26 to 34 Years | 17 (89.5%) | 2 (10.5%) |
| 35 to 44 Years | 16 (100.0%) | 0 (0.0%) |
| 45 to 54 Years | 2 (100.0%) | 0 (0.0%) |
| 55 to 64 Years | 3 (100.0%) | 0 (0.0%) |
| 65 to 74 Years | 1 (100.0%) | 0 (0.0%) |
| 75 Years and older | 0 (0.0%) | 0 (0.0%) |
| Total | 40 (95.2%) | 2 (4.8%) |
Health Insurance Coverage by Citizenship Status in Bay Lake
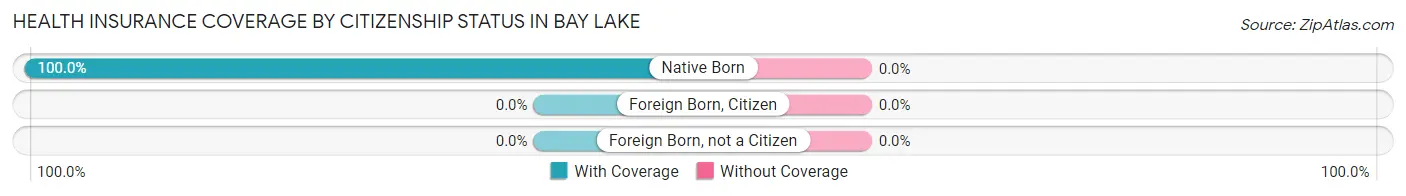
| Citizenship Status | With Coverage | Without Coverage |
| Native Born | 1 (100.0%) | 0 (0.0%) |
| Foreign Born, Citizen | 0 (0.0%) | 0 (0.0%) |
| Foreign Born, not a Citizen | 0 (0.0%) | 0 (0.0%) |
Health Insurance Coverage by Household Income in Bay Lake
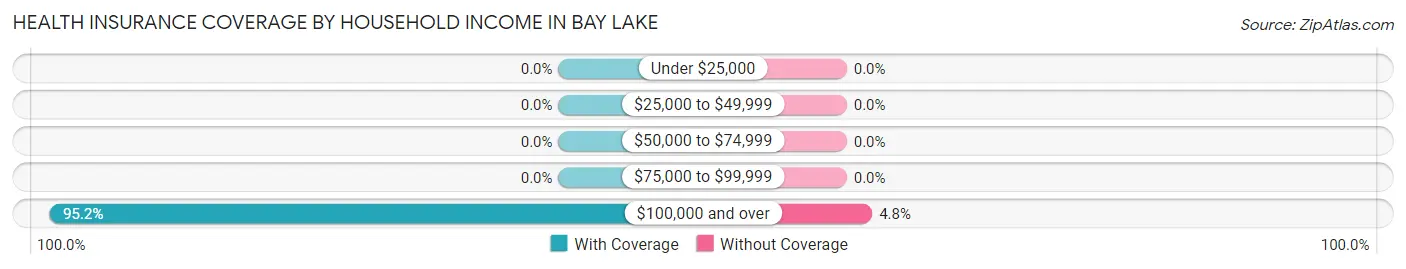
| Household Income | With Coverage | Without Coverage |
| Under $25,000 | 0 (0.0%) | 0 (0.0%) |
| $25,000 to $49,999 | 0 (0.0%) | 0 (0.0%) |
| $50,000 to $74,999 | 0 (0.0%) | 0 (0.0%) |
| $75,000 to $99,999 | 0 (0.0%) | 0 (0.0%) |
| $100,000 and over | 40 (95.2%) | 2 (4.8%) |
Public vs Private Health Insurance Coverage by Age in Bay Lake
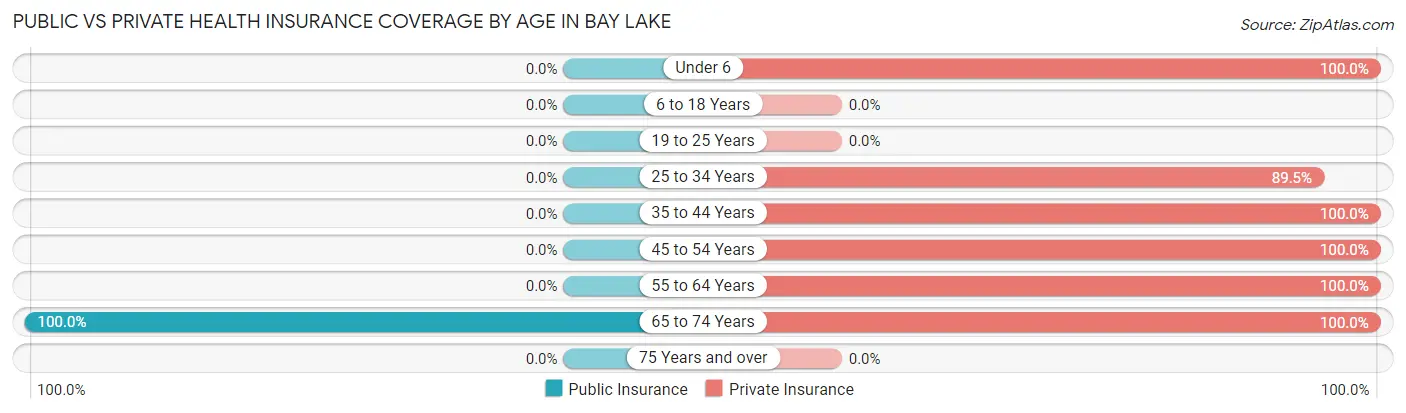
| Age Bracket | Public Insurance | Private Insurance |
| Under 6 | 0 (0.0%) | 1 (100.0%) |
| 6 to 18 Years | 0 (0.0%) | 0 (0.0%) |
| 19 to 25 Years | 0 (0.0%) | 0 (0.0%) |
| 25 to 34 Years | 0 (0.0%) | 17 (89.5%) |
| 35 to 44 Years | 0 (0.0%) | 16 (100.0%) |
| 45 to 54 Years | 0 (0.0%) | 2 (100.0%) |
| 55 to 64 Years | 0 (0.0%) | 3 (100.0%) |
| 65 to 74 Years | 1 (100.0%) | 1 (100.0%) |
| 75 Years and over | 0 (0.0%) | 0 (0.0%) |
| Total | 1 (2.4%) | 40 (95.2%) |
Disability Status by Sex by Age in Bay Lake
| Age Bracket | Male | Female |
| Under 5 Years | 0 (0.0%) | 0 (0.0%) |
| 5 to 17 Years | 0 (0.0%) | 0 (0.0%) |
| 18 to 34 Years | 0 (0.0%) | 0 (0.0%) |
| 35 to 64 Years | 0 (0.0%) | 0 (0.0%) |
| 65 to 74 Years | 0 (0.0%) | 0 (0.0%) |
| 75 Years and over | 0 (0.0%) | 0 (0.0%) |
Disability Class by Sex by Age in Bay Lake
Disability Class: Hearing Difficulty
| Age Bracket | Male | Female |
| Under 5 Years | 0 (0.0%) | 0 (0.0%) |
| 5 to 17 Years | 0 (0.0%) | 0 (0.0%) |
| 18 to 34 Years | 0 (0.0%) | 0 (0.0%) |
| 35 to 64 Years | 0 (0.0%) | 0 (0.0%) |
| 65 to 74 Years | 0 (0.0%) | 0 (0.0%) |
| 75 Years and over | 0 (0.0%) | 0 (0.0%) |
Disability Class: Vision Difficulty
| Age Bracket | Male | Female |
| Under 5 Years | 0 (0.0%) | 0 (0.0%) |
| 5 to 17 Years | 0 (0.0%) | 0 (0.0%) |
| 18 to 34 Years | 0 (0.0%) | 0 (0.0%) |
| 35 to 64 Years | 0 (0.0%) | 0 (0.0%) |
| 65 to 74 Years | 0 (0.0%) | 0 (0.0%) |
| 75 Years and over | 0 (0.0%) | 0 (0.0%) |
Disability Class: Cognitive Difficulty
| Age Bracket | Male | Female |
| 5 to 17 Years | 0 (0.0%) | 0 (0.0%) |
| 18 to 34 Years | 0 (0.0%) | 0 (0.0%) |
| 35 to 64 Years | 0 (0.0%) | 0 (0.0%) |
| 65 to 74 Years | 0 (0.0%) | 0 (0.0%) |
| 75 Years and over | 0 (0.0%) | 0 (0.0%) |
Disability Class: Ambulatory Difficulty
| Age Bracket | Male | Female |
| 5 to 17 Years | 0 (0.0%) | 0 (0.0%) |
| 18 to 34 Years | 0 (0.0%) | 0 (0.0%) |
| 35 to 64 Years | 0 (0.0%) | 0 (0.0%) |
| 65 to 74 Years | 0 (0.0%) | 0 (0.0%) |
| 75 Years and over | 0 (0.0%) | 0 (0.0%) |
Disability Class: Self-Care Difficulty

| Age Bracket | Male | Female |
| 5 to 17 Years | 0 (0.0%) | 0 (0.0%) |
| 18 to 34 Years | 0 (0.0%) | 0 (0.0%) |
| 35 to 64 Years | 0 (0.0%) | 0 (0.0%) |
| 65 to 74 Years | 0 (0.0%) | 0 (0.0%) |
| 75 Years and over | 0 (0.0%) | 0 (0.0%) |
Technology Access in Bay Lake
Computing Device Access in Bay Lake
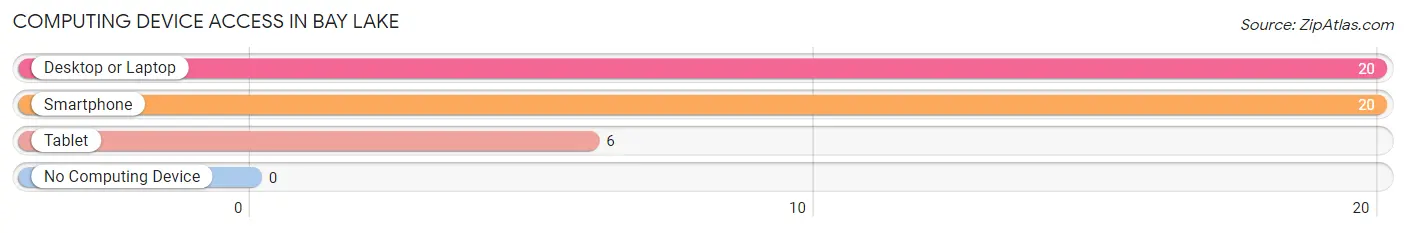
| Device Type | # Households | % Households |
| Desktop or Laptop | 20 | 100.0% |
| Smartphone | 20 | 100.0% |
| Tablet | 6 | 30.0% |
| No Computing Device | 0 | 0.0% |
| Total | 20 | 100.0% |
Internet Access in Bay Lake
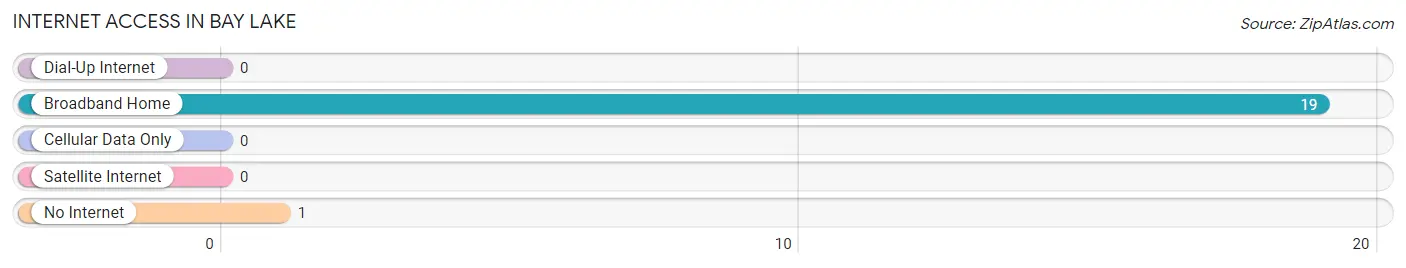
| Internet Type | # Households | % Households |
| Dial-Up Internet | 0 | 0.0% |
| Broadband Home | 19 | 95.0% |
| Cellular Data Only | 0 | 0.0% |
| Satellite Internet | 0 | 0.0% |
| No Internet | 1 | 5.0% |
| Total | 20 | 100.0% |
Bay Lake Summary
Bay Lake is a city located in Orange County, Florida, United States. It is part of the Orlando–Kissimmee–Sanford Metropolitan Statistical Area. The city was incorporated in 1997 and is home to the Walt Disney World Resort.
History
The area that is now Bay Lake was originally part of the vast wilderness of Central Florida. The area was first settled by Native Americans, who lived in the area for thousands of years before the arrival of Europeans. The first Europeans to settle in the area were the Spanish, who established a mission in the area in the late 1700s.
In the early 1900s, the area was developed as a tourist destination, with the construction of a number of hotels and resorts. The area was also home to a number of citrus groves and cattle ranches.
In 1965, the Walt Disney Company purchased 27,000 acres of land in the area, which would become the site of the Walt Disney World Resort. The resort opened in 1971 and has since become one of the most popular tourist destinations in the world.
Geography
Bay Lake is located in Central Florida, approximately 25 miles southwest of downtown Orlando. The city is situated on the northern shore of Bay Lake, a natural lake that is part of the larger Lake Tohopekaliga. The city is bordered by the cities of Lake Buena Vista to the east and Reedy Creek to the south.
The city has a total area of 4.2 square miles, of which 4.1 square miles is land and 0.1 square miles is water. The city is located at an elevation of approximately 100 feet above sea level.
Economy
The economy of Bay Lake is largely driven by tourism, as the city is home to the Walt Disney World Resort. The resort is the largest single-site employer in the United States, employing over 70,000 people. Other major employers in the city include the Orange County Public Schools, the University of Central Florida, and the Orange County Convention Center.
Demographics
As of the 2010 census, the population of Bay Lake was 2,918. The racial makeup of the city was 94.3% White, 1.2% African American, 0.2% Native American, 1.7% Asian, 0.1% Pacific Islander, 0.9% from other races, and 1.7% from two or more races. Hispanic or Latino of any race were 4.2% of the population.
The median household income in Bay Lake was $50,977, and the median family income was $58,977. The per capita income for the city was $25,977. About 4.2% of families and 5.7% of the population were below the poverty line, including 6.3% of those under age 18 and 4.2% of those age 65 or over.
Common Questions
What is Per Capita Income in Bay Lake?
Per Capita income in Bay Lake is $66,536.
What is the Median Family Income in Bay Lake?
Median Family Income in Bay Lake is $250,001.
What is the Median Household income in Bay Lake?
Median Household Income in Bay Lake is $119,107.
What is Inequality or Gini Index in Bay Lake?
Inequality or Gini Index in Bay Lake is 0.12.
What is the Total Population of Bay Lake?
Total Population of Bay Lake is 42.
What is the Total Male Population of Bay Lake?
Total Male Population of Bay Lake is 23.
What is the Total Female Population of Bay Lake?
Total Female Population of Bay Lake is 19.
What is the Ratio of Males per 100 Females in Bay Lake?
There are 121.05 Males per 100 Females in Bay Lake.
What is the Ratio of Females per 100 Males in Bay Lake?
There are 82.61 Females per 100 Males in Bay Lake.
What is the Median Population Age in Bay Lake?
Median Population Age in Bay Lake is 40.1 Years.
What is the Average Family Size in Bay Lake
Average Family Size in Bay Lake is 3.0 People.
What is the Average Household Size in Bay Lake
Average Household Size in Bay Lake is 2.1 People.
How Large is the Labor Force in Bay Lake?
There are 39 People in the Labor Forcein in Bay Lake.
What is the Percentage of People in the Labor Force in Bay Lake?
95.1% of People are in the Labor Force in Bay Lake.