Farmington, DE Map & Demographics
Farmington Map
Farmington Overview
$19,899
PER CAPITA INCOME
0.34
INEQUALITY / GINI INDEX
234
TOTAL POPULATION
109
MALE POPULATION
125
FEMALE POPULATION
87.20
MALES / 100 FEMALES
114.68
FEMALES / 100 MALES
35.8
MEDIAN AGE
2.1
AVG FAMILY SIZE
2.1
AVG HOUSEHOLD SIZE
145
LABOR FORCE [ PEOPLE ]
76.7%
PERCENT IN LABOR FORCE
39.3%
UNEMPLOYMENT RATE
Farmington Area Codes
Income in Farmington
Income Overview in Farmington
| Characteristic | Number | Measure |
| Per Capita Income | 234 | $19,899 |
| Median Family Income | 108 | $0 |
| Mean Family Income | 108 | $52,024 |
| Median Household Income | 109 | $0 |
| Mean Household Income | 109 | $52,580 |
| Income Deficit | 108 | $0 |
| Wage / Income Gap (%) | 234 | 0.00% |
| Wage / Income Gap ($) | 234 | 100.00¢ per $1 |
| Gini / Inequality Index | 234 | 0.34 |
Earnings by Sex in Farmington
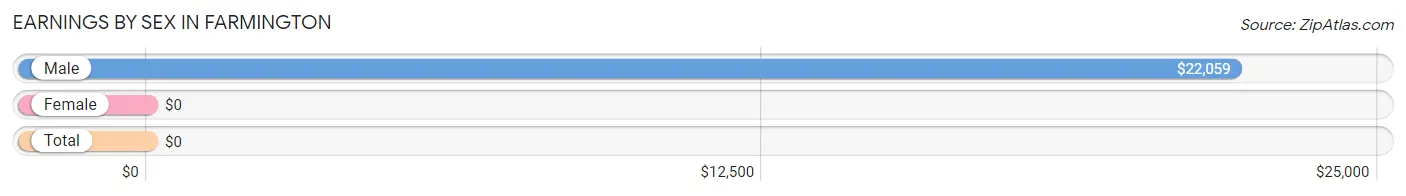
| Sex | Number | Average Earnings |
| Male | 60 (39.0%) | $22,059 |
| Female | 94 (61.0%) | $0 |
| Total | 154 (100.0%) | $0 |
Earnings by Sex by Income Bracket in Farmington
The most common earnings brackets in Farmington are $20,000 to $22,499 for men (17 | 28.3%) and $5,000 to $7,499 for women (57 | 60.6%).
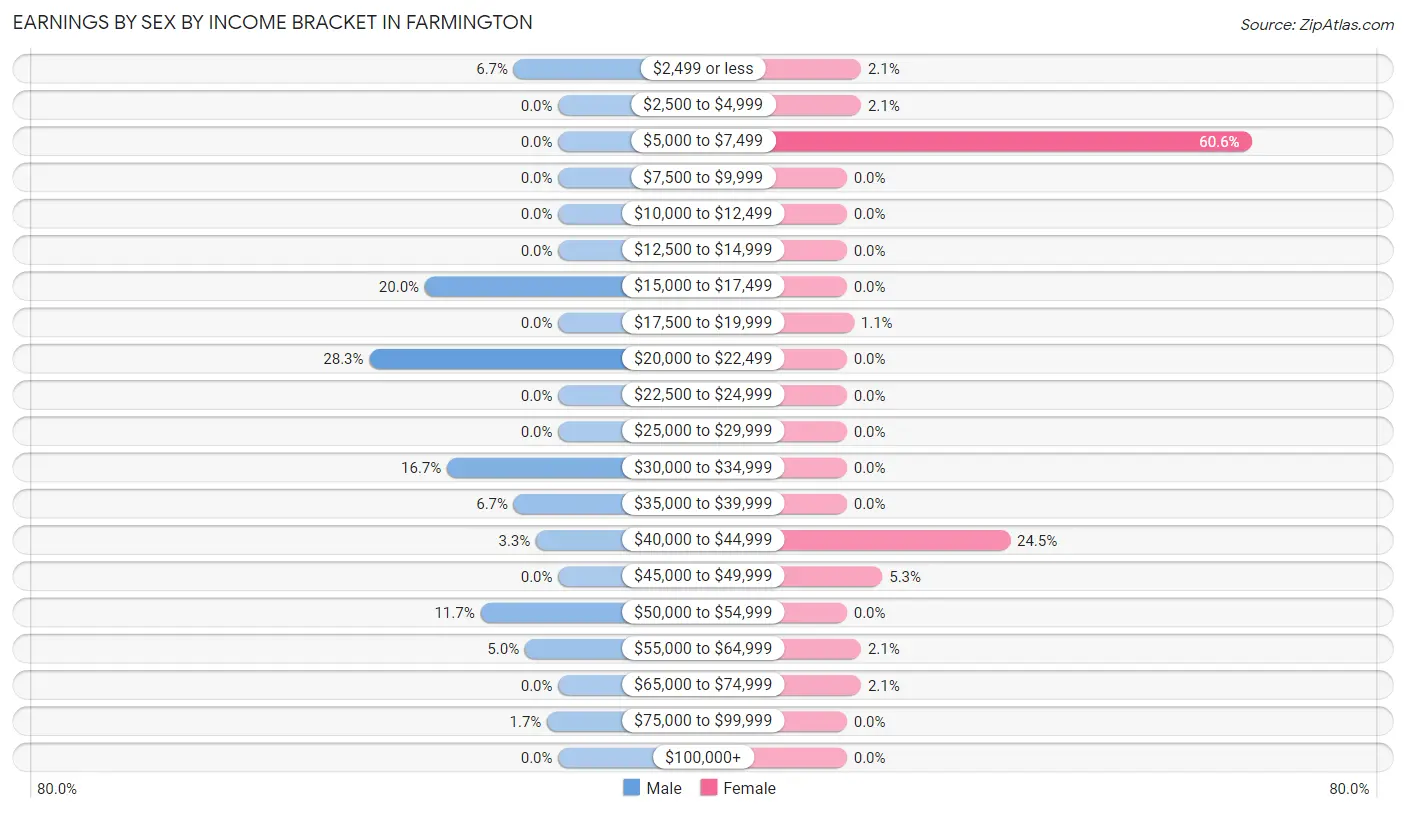
| Income | Male | Female |
| $2,499 or less | 4 (6.7%) | 2 (2.1%) |
| $2,500 to $4,999 | 0 (0.0%) | 2 (2.1%) |
| $5,000 to $7,499 | 0 (0.0%) | 57 (60.6%) |
| $7,500 to $9,999 | 0 (0.0%) | 0 (0.0%) |
| $10,000 to $12,499 | 0 (0.0%) | 0 (0.0%) |
| $12,500 to $14,999 | 0 (0.0%) | 0 (0.0%) |
| $15,000 to $17,499 | 12 (20.0%) | 0 (0.0%) |
| $17,500 to $19,999 | 0 (0.0%) | 1 (1.1%) |
| $20,000 to $22,499 | 17 (28.3%) | 0 (0.0%) |
| $22,500 to $24,999 | 0 (0.0%) | 0 (0.0%) |
| $25,000 to $29,999 | 0 (0.0%) | 0 (0.0%) |
| $30,000 to $34,999 | 10 (16.7%) | 0 (0.0%) |
| $35,000 to $39,999 | 4 (6.7%) | 0 (0.0%) |
| $40,000 to $44,999 | 2 (3.3%) | 23 (24.5%) |
| $45,000 to $49,999 | 0 (0.0%) | 5 (5.3%) |
| $50,000 to $54,999 | 7 (11.7%) | 0 (0.0%) |
| $55,000 to $64,999 | 3 (5.0%) | 2 (2.1%) |
| $65,000 to $74,999 | 0 (0.0%) | 2 (2.1%) |
| $75,000 to $99,999 | 1 (1.7%) | 0 (0.0%) |
| $100,000+ | 0 (0.0%) | 0 (0.0%) |
| Total | 60 (100.0%) | 94 (100.0%) |
Earnings by Sex by Educational Attainment in Farmington
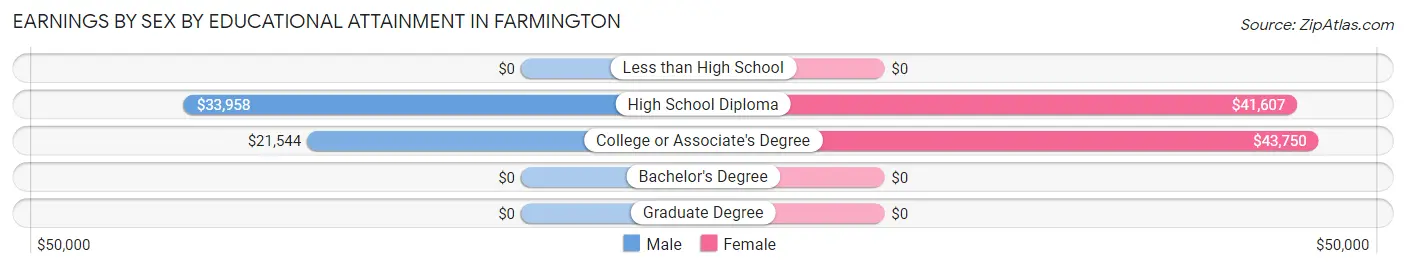
| Educational Attainment | Male Income | Female Income |
| Less than High School | - | - |
| High School Diploma | $33,958 | $41,607 |
| College or Associate's Degree | $21,544 | $43,750 |
| Bachelor's Degree | - | - |
| Graduate Degree | - | - |
| Total | $22,059 | $0 |
Family Income in Farmington
Family Income Brackets in Farmington
According to the Farmington family income data, there are 61 families falling into the $25,000 to $34,999 income range, which is the most common income bracket and makes up 56.5% of all families.
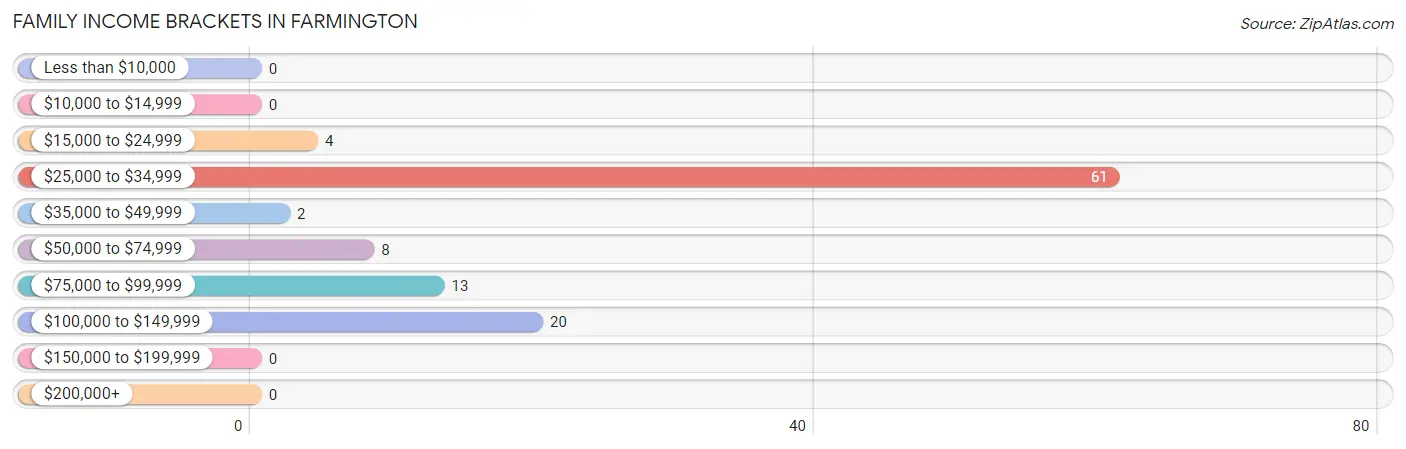
| Income Bracket | # Families | % Families |
| Less than $10,000 | 0 | 0.0% |
| $10,000 to $14,999 | 0 | 0.0% |
| $15,000 to $24,999 | 4 | 3.7% |
| $25,000 to $34,999 | 61 | 56.5% |
| $35,000 to $49,999 | 2 | 1.9% |
| $50,000 to $74,999 | 8 | 7.4% |
| $75,000 to $99,999 | 13 | 12.0% |
| $100,000 to $149,999 | 20 | 18.5% |
| $150,000 to $199,999 | 0 | 0.0% |
| $200,000+ | 0 | 0.0% |
Family Income by Famaliy Size in Farmington
2-person families (33 | 30.6%) account for the highest median family income in Farmington with $107,734 per family, while 2-person families (33 | 30.6%) have the highest median income of $53,867 per family member.
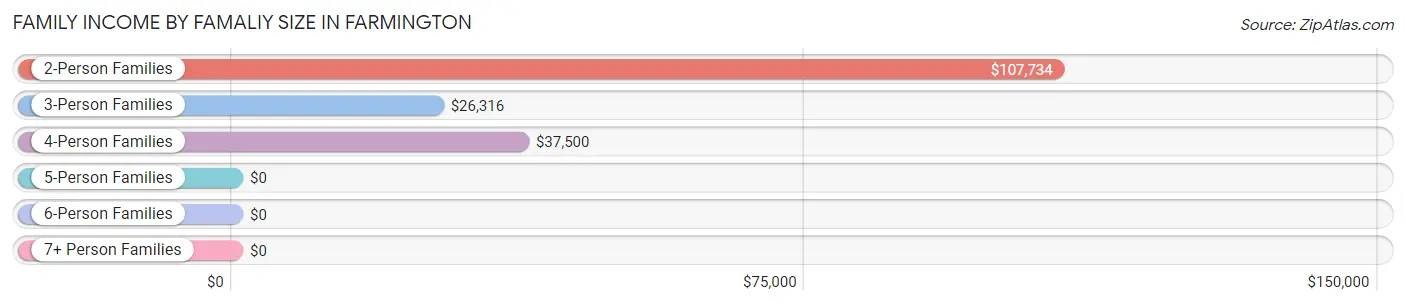
| Income Bracket | # Families | Median Income |
| 2-Person Families | 33 (30.6%) | $107,734 |
| 3-Person Families | 60 (55.6%) | $26,316 |
| 4-Person Families | 8 (7.4%) | $37,500 |
| 5-Person Families | 7 (6.5%) | $0 |
| 6-Person Families | 0 (0.0%) | $0 |
| 7+ Person Families | 0 (0.0%) | $0 |
| Total | 108 (100.0%) | $0 |
Family Income by Number of Earners in Farmington
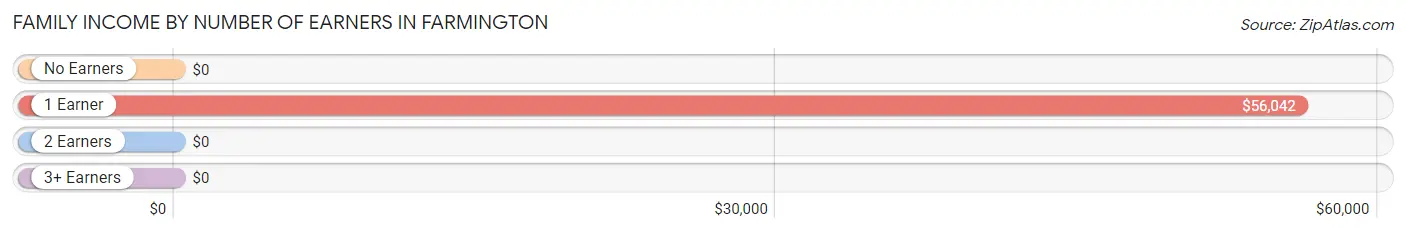
| Number of Earners | # Families | Median Income |
| No Earners | 2 (1.8%) | $0 |
| 1 Earner | 13 (12.0%) | $56,042 |
| 2 Earners | 93 (86.1%) | $0 |
| 3+ Earners | 0 (0.0%) | $0 |
| Total | 108 (100.0%) | $0 |
Household Income in Farmington
Household Income Brackets in Farmington
With 61 households falling in the category, the $25,000 to $34,999 income range is the most frequent in Farmington, accounting for 56.0% of all households.
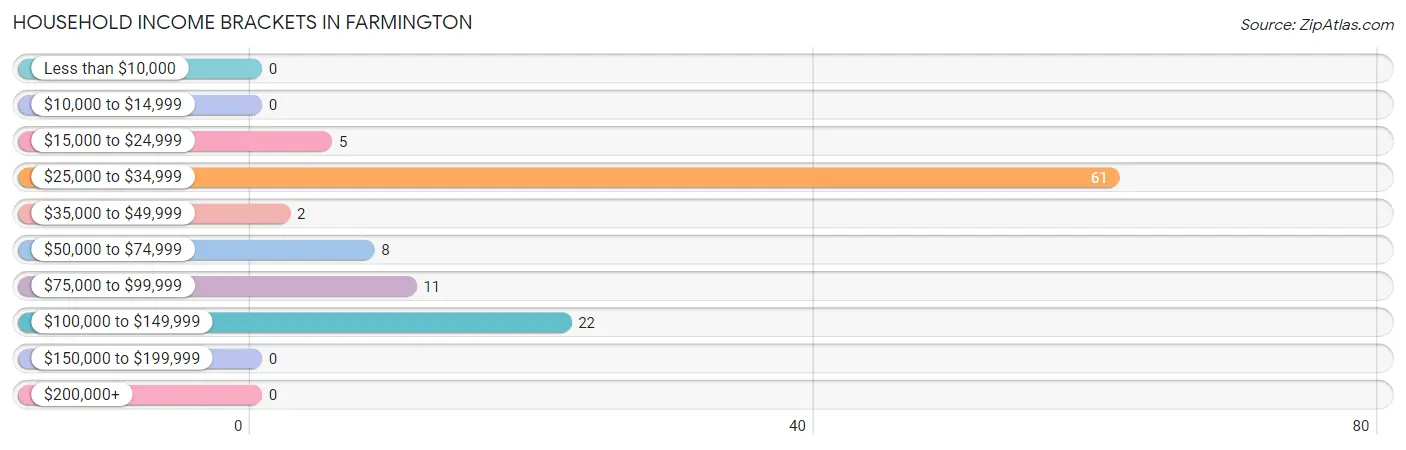
| Income Bracket | # Households | % Households |
| Less than $10,000 | 0 | 0.0% |
| $10,000 to $14,999 | 0 | 0.0% |
| $15,000 to $24,999 | 5 | 4.6% |
| $25,000 to $34,999 | 61 | 56.0% |
| $35,000 to $49,999 | 2 | 1.8% |
| $50,000 to $74,999 | 8 | 7.3% |
| $75,000 to $99,999 | 11 | 10.1% |
| $100,000 to $149,999 | 22 | 20.2% |
| $150,000 to $199,999 | 0 | 0.0% |
| $200,000+ | 0 | 0.0% |
Household Income by Householder Age in Farmington
The median household income in Farmington is $0, with the highest median household income of $107,969 found in the 25 to 44 years age bracket for the primary householder. A total of 30 households (27.5%) fall into this category. Meanwhile, the 15 to 24 years age bracket for the primary householder has the lowest median household income of $0, with 4 households (3.7%) in this group.
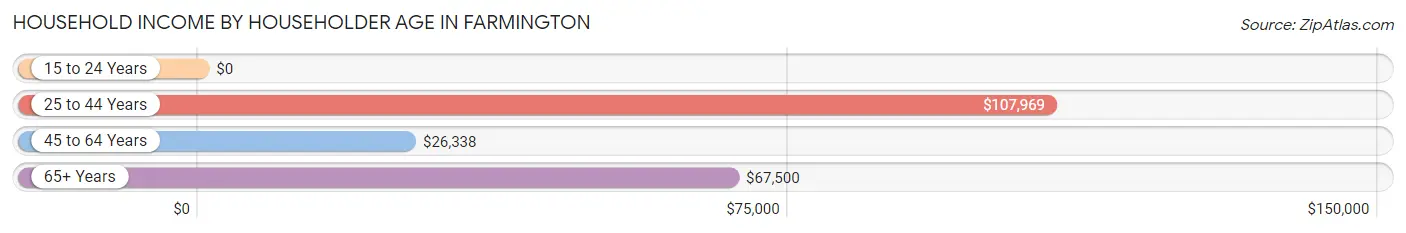
| Income Bracket | # Households | Median Income |
| 15 to 24 Years | 4 (3.7%) | $0 |
| 25 to 44 Years | 30 (27.5%) | $107,969 |
| 45 to 64 Years | 69 (63.3%) | $26,338 |
| 65+ Years | 6 (5.5%) | $67,500 |
| Total | 109 (100.0%) | $0 |
Poverty in Farmington
Income Below Poverty by Sex and Age in Farmington
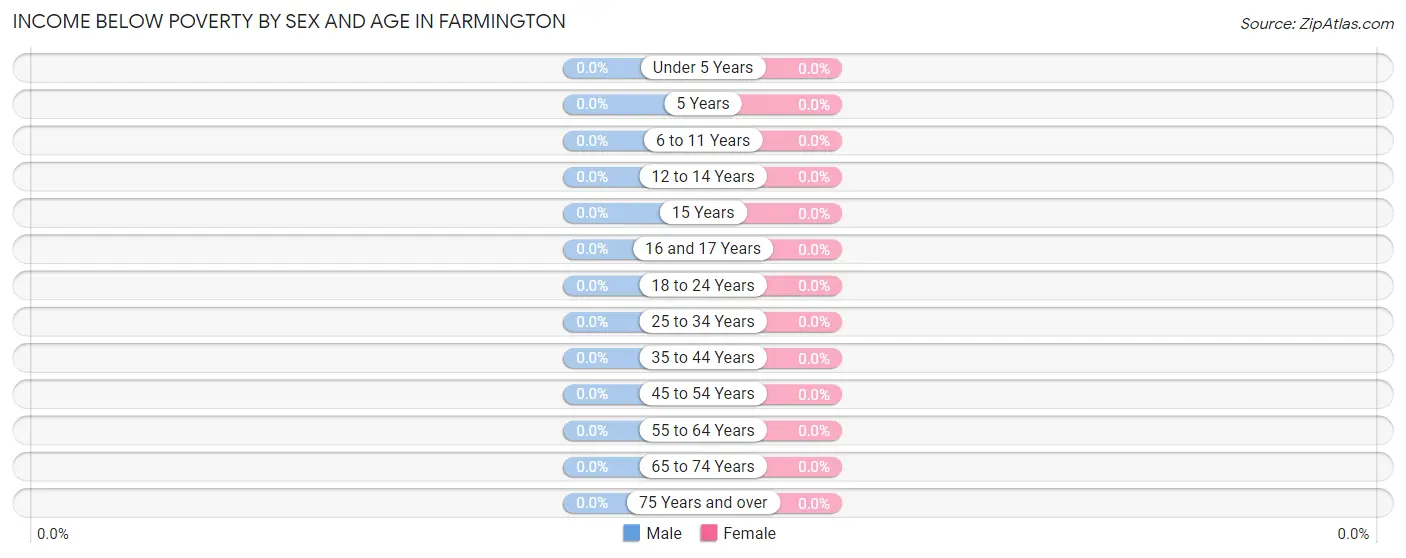
| Age Bracket | Male | Female |
| Under 5 Years | 0 (0.0%) | 0 (0.0%) |
| 5 Years | 0 (0.0%) | 0 (0.0%) |
| 6 to 11 Years | 0 (0.0%) | 0 (0.0%) |
| 12 to 14 Years | 0 (0.0%) | 0 (0.0%) |
| 15 Years | 0 (0.0%) | 0 (0.0%) |
| 16 and 17 Years | 0 (0.0%) | 0 (0.0%) |
| 18 to 24 Years | 0 (0.0%) | 0 (0.0%) |
| 25 to 34 Years | 0 (0.0%) | 0 (0.0%) |
| 35 to 44 Years | 0 (0.0%) | 0 (0.0%) |
| 45 to 54 Years | 0 (0.0%) | 0 (0.0%) |
| 55 to 64 Years | 0 (0.0%) | 0 (0.0%) |
| 65 to 74 Years | 0 (0.0%) | 0 (0.0%) |
| 75 Years and over | 0 (0.0%) | 0 (0.0%) |
| Total | 0 (0.0%) | 0 (0.0%) |
Income Above Poverty by Sex and Age in Farmington
According to the poverty statistics in Farmington, males aged under 5 years and females aged 6 to 11 years are the age groups that are most secure financially, with 100.0% of males and 100.0% of females in these age groups living above the poverty line.
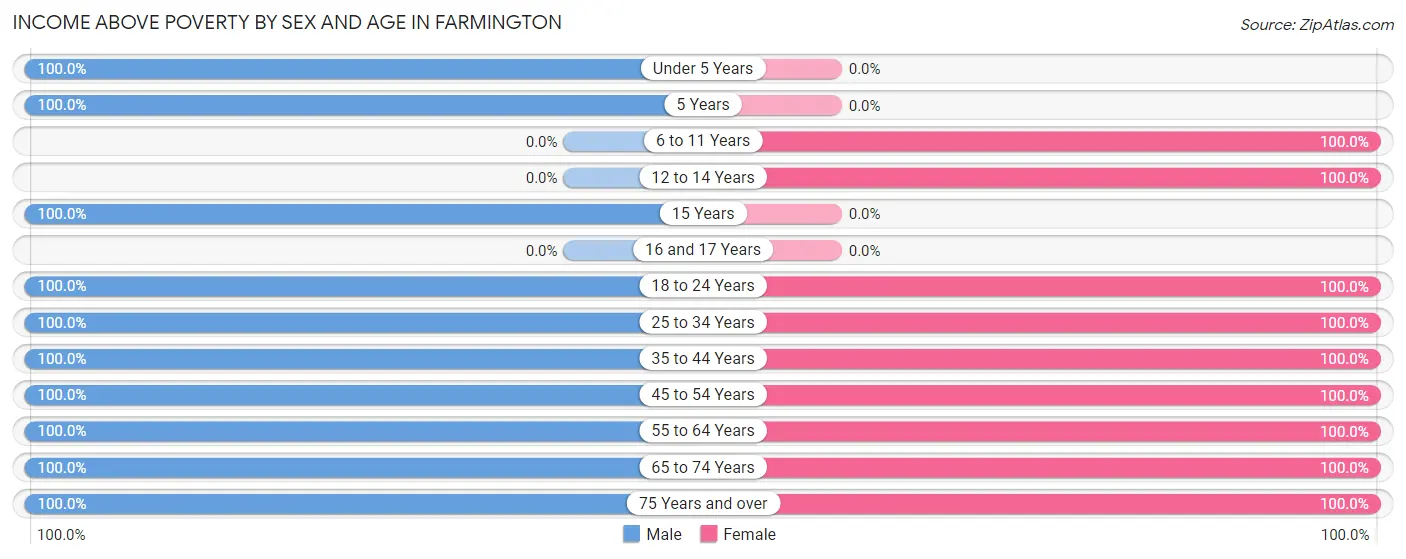
| Age Bracket | Male | Female |
| Under 5 Years | 12 (100.0%) | 0 (0.0%) |
| 5 Years | 8 (100.0%) | 0 (0.0%) |
| 6 to 11 Years | 0 (0.0%) | 8 (100.0%) |
| 12 to 14 Years | 0 (0.0%) | 8 (100.0%) |
| 15 Years | 9 (100.0%) | 0 (0.0%) |
| 16 and 17 Years | 0 (0.0%) | 0 (0.0%) |
| 18 to 24 Years | 8 (100.0%) | 7 (100.0%) |
| 25 to 34 Years | 17 (100.0%) | 20 (100.0%) |
| 35 to 44 Years | 22 (100.0%) | 13 (100.0%) |
| 45 to 54 Years | 8 (100.0%) | 59 (100.0%) |
| 55 to 64 Years | 22 (100.0%) | 2 (100.0%) |
| 65 to 74 Years | 2 (100.0%) | 7 (100.0%) |
| 75 Years and over | 1 (100.0%) | 1 (100.0%) |
| Total | 109 (100.0%) | 125 (100.0%) |
Income Below Poverty Among Married-Couple Families in Farmington
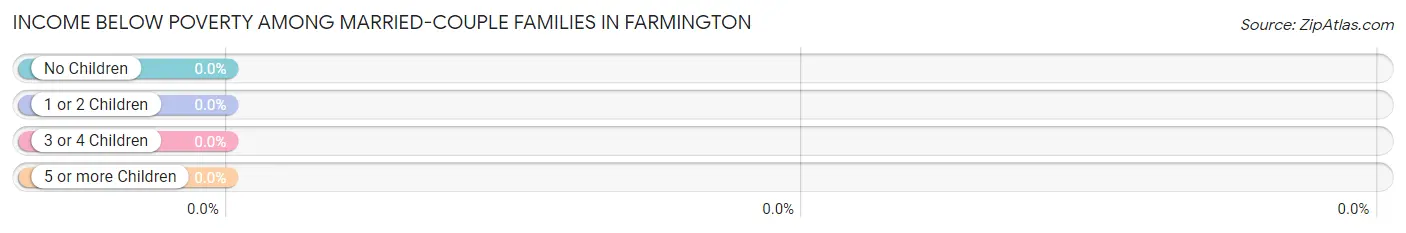
| Children | Above Poverty | Below Poverty |
| No Children | 82 (100.0%) | 0 (0.0%) |
| 1 or 2 Children | 11 (100.0%) | 0 (0.0%) |
| 3 or 4 Children | 7 (100.0%) | 0 (0.0%) |
| 5 or more Children | 0 (0.0%) | 0 (0.0%) |
| Total | 100 (100.0%) | 0 (0.0%) |
Income Below Poverty Among Single-Parent Households in Farmington
| Children | Single Father | Single Mother |
| No Children | 0 (0.0%) | 0 (0.0%) |
| 1 or 2 Children | 0 (0.0%) | 0 (0.0%) |
| 3 or 4 Children | 0 (0.0%) | 0 (0.0%) |
| 5 or more Children | 0 (0.0%) | 0 (0.0%) |
| Total | 0 (0.0%) | 0 (0.0%) |
Income Below Poverty Among Married-Couple vs Single-Parent Households in Farmington
| Children | Married-Couple Families | Single-Parent Households |
| No Children | 0 (0.0%) | 0 (0.0%) |
| 1 or 2 Children | 0 (0.0%) | 0 (0.0%) |
| 3 or 4 Children | 0 (0.0%) | 0 (0.0%) |
| 5 or more Children | 0 (0.0%) | 0 (0.0%) |
| Total | 0 (0.0%) | 0 (0.0%) |
Race in Farmington
The most populous races in Farmington are White / Caucasian (150 | 64.1%), Black / African American (84 | 35.9%), and Hispanic or Latino (4 | 1.7%).
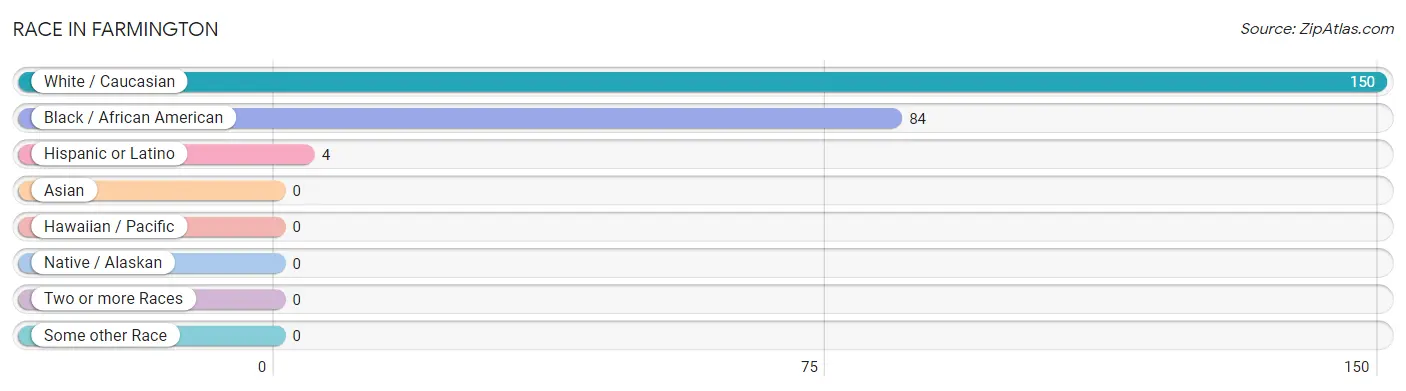
| Race | # Population | % Population |
| Asian | 0 | 0.0% |
| Black / African American | 84 | 35.9% |
| Hawaiian / Pacific | 0 | 0.0% |
| Hispanic or Latino | 4 | 1.7% |
| Native / Alaskan | 0 | 0.0% |
| White / Caucasian | 150 | 64.1% |
| Two or more Races | 0 | 0.0% |
| Some other Race | 0 | 0.0% |
| Total | 234 | 100.0% |
Ancestry in Farmington
The most populous ancestries reported in Farmington are American (45 | 19.2%), Italian (39 | 16.7%), Irish (20 | 8.6%), English (17 | 7.3%), and German (14 | 6.0%), together accounting for 57.7% of all Farmington residents.
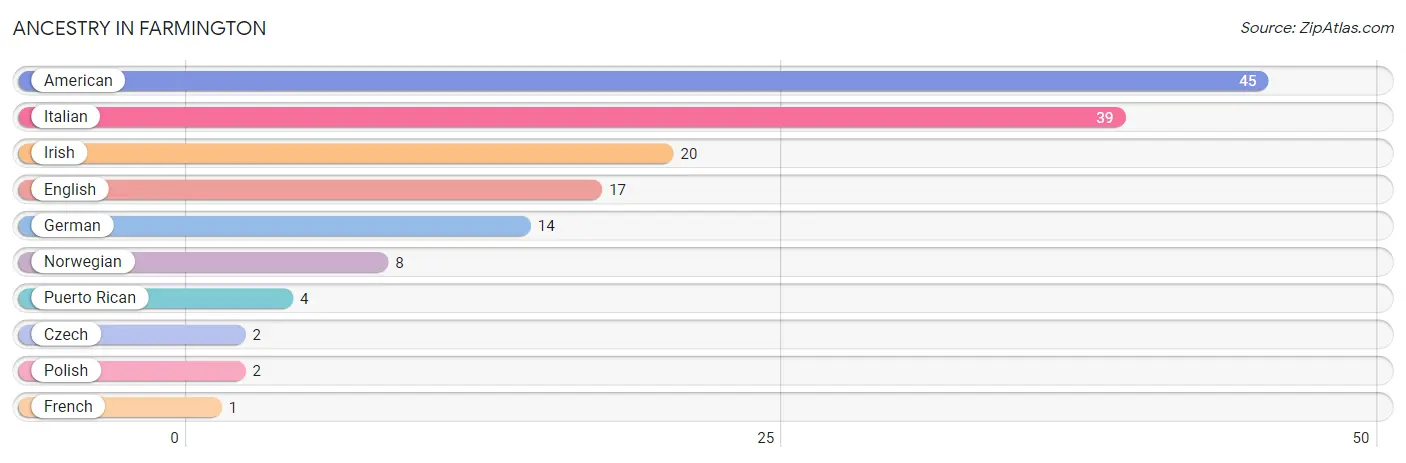
| Ancestry | # Population | % Population |
| American | 45 | 19.2% |
| Czech | 2 | 0.9% |
| English | 17 | 7.3% |
| French | 1 | 0.4% |
| German | 14 | 6.0% |
| Irish | 20 | 8.6% |
| Italian | 39 | 16.7% |
| Norwegian | 8 | 3.4% |
| Polish | 2 | 0.9% |
| Puerto Rican | 4 | 1.7% | View All 10 Rows |
Immigrants in Farmington

| Immigration Origin | # Population | % Population | View All 0 Rows |
Sex and Age in Farmington
Sex and Age in Farmington
The most populous age groups in Farmington are 60 to 64 Years (21 | 19.3%) for men and 50 to 54 Years (57 | 45.6%) for women.
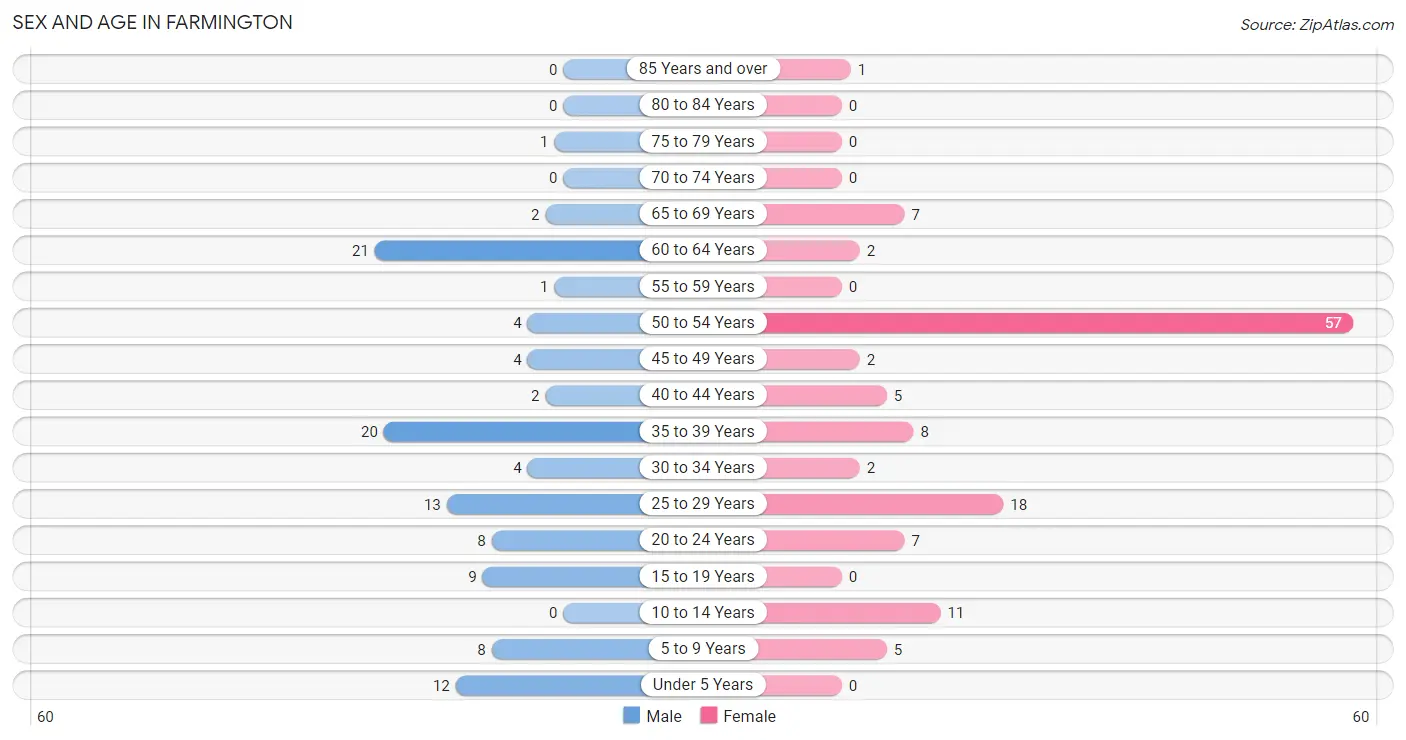
| Age Bracket | Male | Female |
| Under 5 Years | 12 (11.0%) | 0 (0.0%) |
| 5 to 9 Years | 8 (7.3%) | 5 (4.0%) |
| 10 to 14 Years | 0 (0.0%) | 11 (8.8%) |
| 15 to 19 Years | 9 (8.3%) | 0 (0.0%) |
| 20 to 24 Years | 8 (7.3%) | 7 (5.6%) |
| 25 to 29 Years | 13 (11.9%) | 18 (14.4%) |
| 30 to 34 Years | 4 (3.7%) | 2 (1.6%) |
| 35 to 39 Years | 20 (18.3%) | 8 (6.4%) |
| 40 to 44 Years | 2 (1.8%) | 5 (4.0%) |
| 45 to 49 Years | 4 (3.7%) | 2 (1.6%) |
| 50 to 54 Years | 4 (3.7%) | 57 (45.6%) |
| 55 to 59 Years | 1 (0.9%) | 0 (0.0%) |
| 60 to 64 Years | 21 (19.3%) | 2 (1.6%) |
| 65 to 69 Years | 2 (1.8%) | 7 (5.6%) |
| 70 to 74 Years | 0 (0.0%) | 0 (0.0%) |
| 75 to 79 Years | 1 (0.9%) | 0 (0.0%) |
| 80 to 84 Years | 0 (0.0%) | 0 (0.0%) |
| 85 Years and over | 0 (0.0%) | 1 (0.8%) |
| Total | 109 (100.0%) | 125 (100.0%) |
Families and Households in Farmington
Median Family Size in Farmington
The median family size in Farmington is 2.14 persons per family, with married-couple families (100 | 92.6%) accounting for the largest median family size of 2.15 persons per family. On the other hand, single male/father families (4 | 3.7%) represent the smallest median family size with 2.00 persons per family.
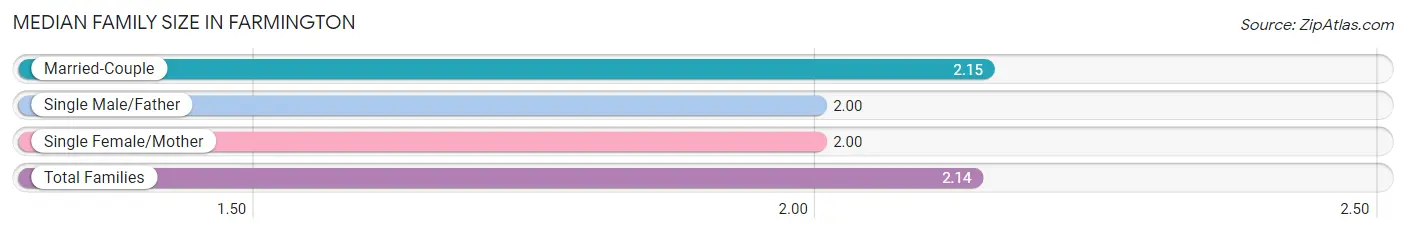
| Family Type | # Families | Family Size |
| Married-Couple | 100 (92.6%) | 2.15 |
| Single Male/Father | 4 (3.7%) | 2.00 |
| Single Female/Mother | 4 (3.7%) | 2.00 |
| Total Families | 108 (100.0%) | 2.14 |
Median Household Size in Farmington
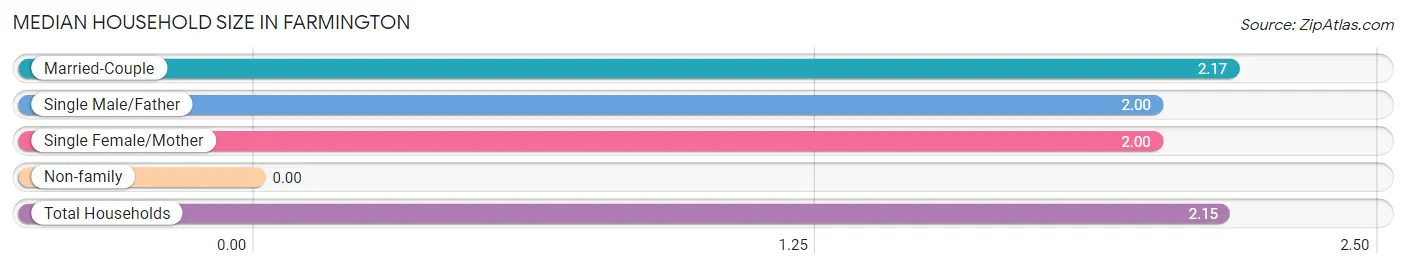
| Household Type | # Households | Household Size |
| Married-Couple | 100 (91.7%) | 2.17 |
| Single Male/Father | 4 (3.7%) | 2.00 |
| Single Female/Mother | 4 (3.7%) | 2.00 |
| Non-family | 1 (0.9%) | - |
| Total Households | 109 (100.0%) | 2.15 |
Household Size by Marriage Status in Farmington
Out of a total of 109 households in Farmington, 108 (99.1%) are family households, while 1 (0.9%) are nonfamily households. The most numerous type of family households are 3-person households, comprising 60, and the most common type of nonfamily households are 1-person households, comprising 1.
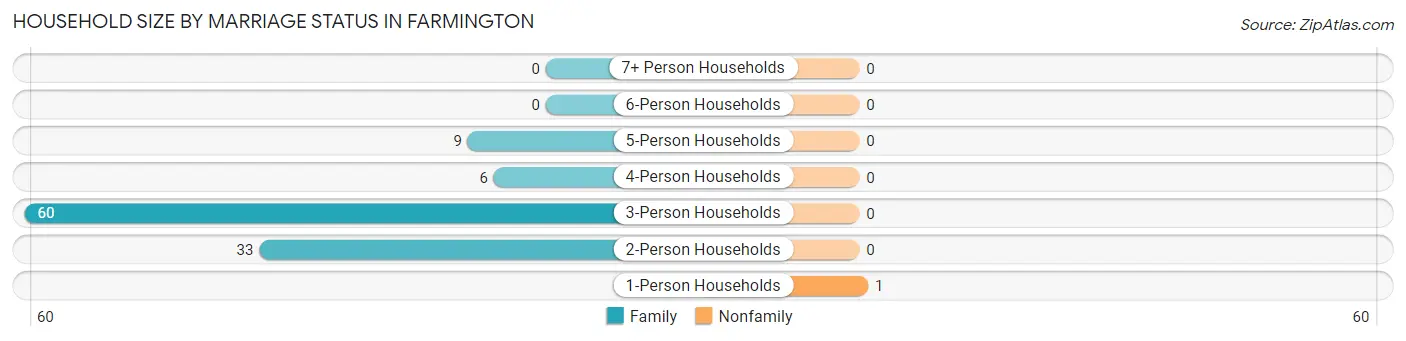
| Household Size | Family Households | Nonfamily Households |
| 1-Person Households | - | 1 (0.9%) |
| 2-Person Households | 33 (30.3%) | 0 (0.0%) |
| 3-Person Households | 60 (55.0%) | 0 (0.0%) |
| 4-Person Households | 6 (5.5%) | 0 (0.0%) |
| 5-Person Households | 9 (8.3%) | 0 (0.0%) |
| 6-Person Households | 0 (0.0%) | 0 (0.0%) |
| 7+ Person Households | 0 (0.0%) | 0 (0.0%) |
| Total | 108 (99.1%) | 1 (0.9%) |
Female Fertility in Farmington
Fertility by Age in Farmington
| Age Bracket | Women with Births | Births / 1,000 Women |
| 15 to 19 years | 0 (0.0%) | 0.0 |
| 20 to 34 years | 0 (0.0%) | 0.0 |
| 35 to 50 years | 0 (0.0%) | 0.0 |
| Total | 0 (0.0%) | 0.0 |
Fertility by Age by Marriage Status in Farmington
| Age Bracket | Married | Unmarried |
| 15 to 19 years | 0 (0.0%) | 0 (0.0%) |
| 20 to 34 years | 0 (0.0%) | 0 (0.0%) |
| 35 to 50 years | 0 (0.0%) | 0 (0.0%) |
| Total | 0 (0.0%) | 0 (0.0%) |
Fertility by Education in Farmington
| Educational Attainment | Women with Births | Births / 1,000 Women |
| Less than High School | 0 (0.0%) | 0.0 |
| High School Diploma | 0 (0.0%) | 0.0 |
| College or Associate's Degree | 0 (0.0%) | 0.0 |
| Bachelor's Degree | 0 (0.0%) | 0.0 |
| Graduate Degree | 0 (0.0%) | 0.0 |
| Total | 0 (0.0%) | 0.0 |
Fertility by Education by Marriage Status in Farmington
| Educational Attainment | Married | Unmarried |
| Less than High School | 0 (0.0%) | 0 (0.0%) |
| High School Diploma | 0 (0.0%) | 0 (0.0%) |
| College or Associate's Degree | 0 (0.0%) | 0 (0.0%) |
| Bachelor's Degree | 0 (0.0%) | 0 (0.0%) |
| Graduate Degree | 0 (0.0%) | 0 (0.0%) |
| Total | 0 (0.0%) | 0 (0.0%) |
Employment Characteristics in Farmington
Employment by Class of Employer in Farmington
Among the 88 employed individuals in Farmington, private company employees (48 | 54.5%), state government employees (27 | 30.7%), and self-employed (incorporated) (7 | 8.0%) make up the most common classes of employment.
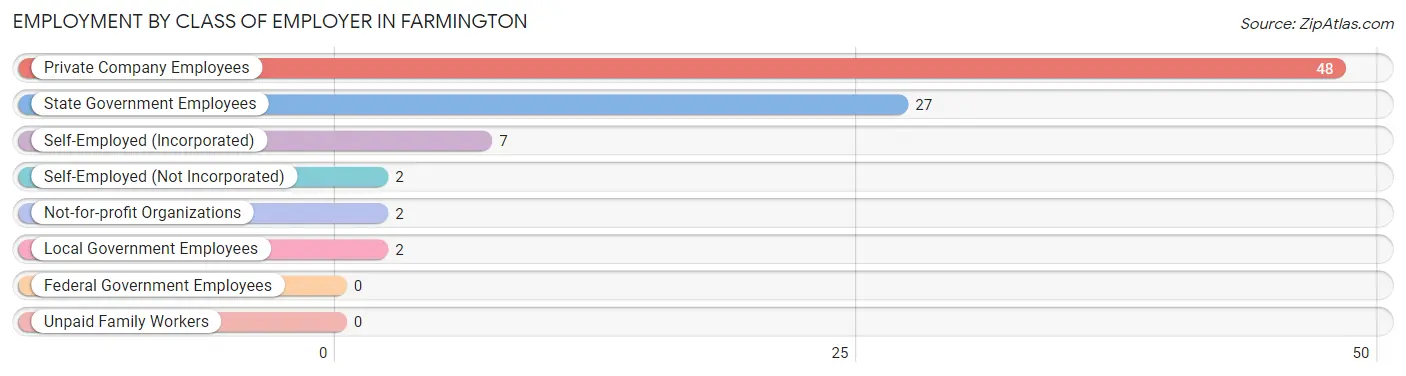
| Employer Class | # Employees | % Employees |
| Private Company Employees | 48 | 54.5% |
| Self-Employed (Incorporated) | 7 | 8.0% |
| Self-Employed (Not Incorporated) | 2 | 2.3% |
| Not-for-profit Organizations | 2 | 2.3% |
| Local Government Employees | 2 | 2.3% |
| State Government Employees | 27 | 30.7% |
| Federal Government Employees | 0 | 0.0% |
| Unpaid Family Workers | 0 | 0.0% |
| Total | 88 | 100.0% |
Employment Status by Age in Farmington
According to the labor force statistics for Farmington, out of the total population over 16 years of age (189), 76.7% or 145 individuals are in the labor force, with 39.3% or 57 of them unemployed. The age group with the highest labor force participation rate is 25 to 29 years, with 100.0% or 31 individuals in the labor force. Within the labor force, the 45 to 54 years age range has the highest percentage of unemployed individuals, with 93.4% or 57 of them being unemployed.
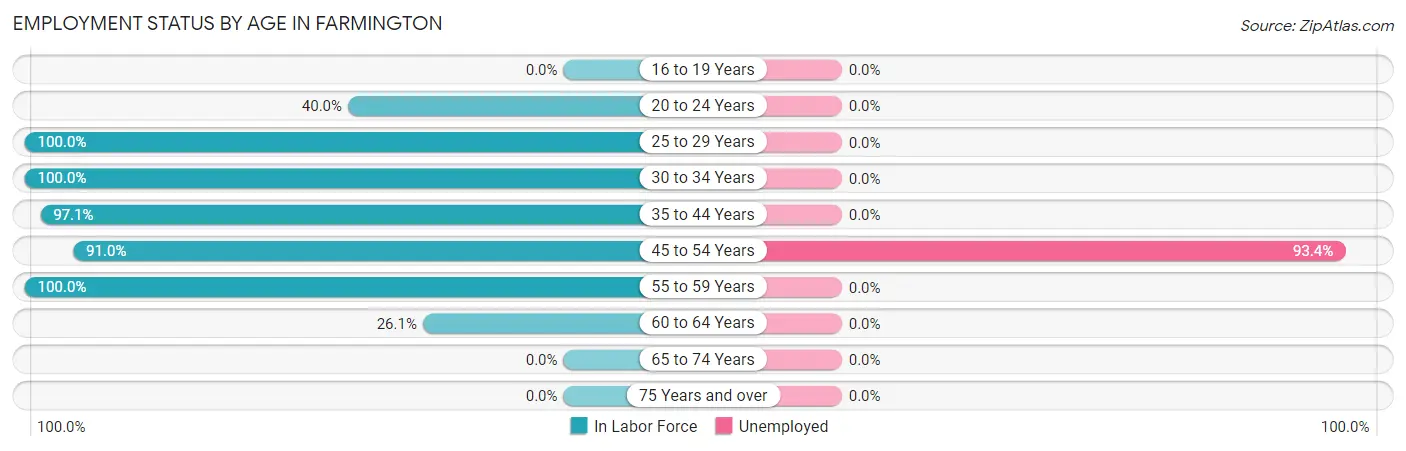
| Age Bracket | In Labor Force | Unemployed |
| 16 to 19 Years | 0 (0.0%) | 0 (0.0%) |
| 20 to 24 Years | 6 (40.0%) | 0 (0.0%) |
| 25 to 29 Years | 31 (100.0%) | 0 (0.0%) |
| 30 to 34 Years | 6 (100.0%) | 0 (0.0%) |
| 35 to 44 Years | 34 (97.1%) | 0 (0.0%) |
| 45 to 54 Years | 61 (91.0%) | 57 (93.4%) |
| 55 to 59 Years | 1 (100.0%) | 0 (0.0%) |
| 60 to 64 Years | 6 (26.1%) | 0 (0.0%) |
| 65 to 74 Years | 0 (0.0%) | 0 (0.0%) |
| 75 Years and over | 0 (0.0%) | 0 (0.0%) |
| Total | 145 (76.7%) | 57 (39.3%) |
Employment Status by Educational Attainment in Farmington
According to labor force statistics for Farmington, 85.3% of individuals (139) out of the total population between 25 and 64 years of age (163) are in the labor force, with 41.0% or 57 of them being unemployed. The group with the highest labor force participation rate are those with the educational attainment of bachelor's degree or higher, with 100.0% or 61 individuals in the labor force. Within the labor force, individuals with bachelor's degree or higher education have the highest percentage of unemployment, with 93.4% or 57 of them being unemployed.
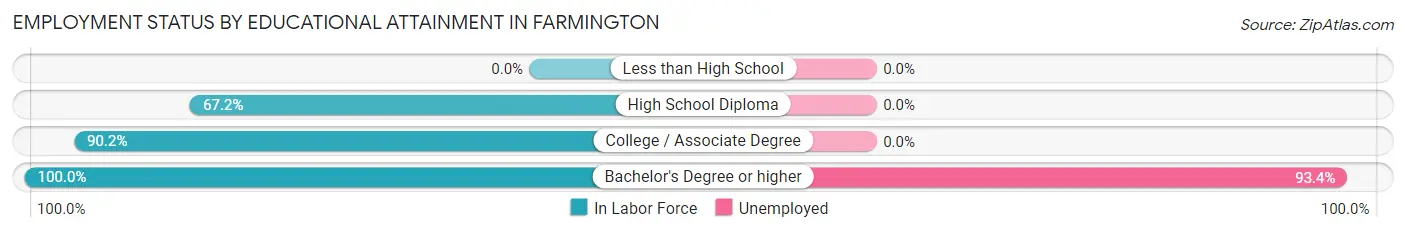
| Educational Attainment | In Labor Force | Unemployed |
| Less than High School | 0 (0.0%) | 0 (0.0%) |
| High School Diploma | 41 (67.2%) | 0 (0.0%) |
| College / Associate Degree | 37 (90.2%) | 0 (0.0%) |
| Bachelor's Degree or higher | 61 (100.0%) | 57 (93.4%) |
| Total | 139 (85.3%) | 67 (41.0%) |
Employment Occupations by Sex in Farmington
Management, Business, Science and Arts Occupations
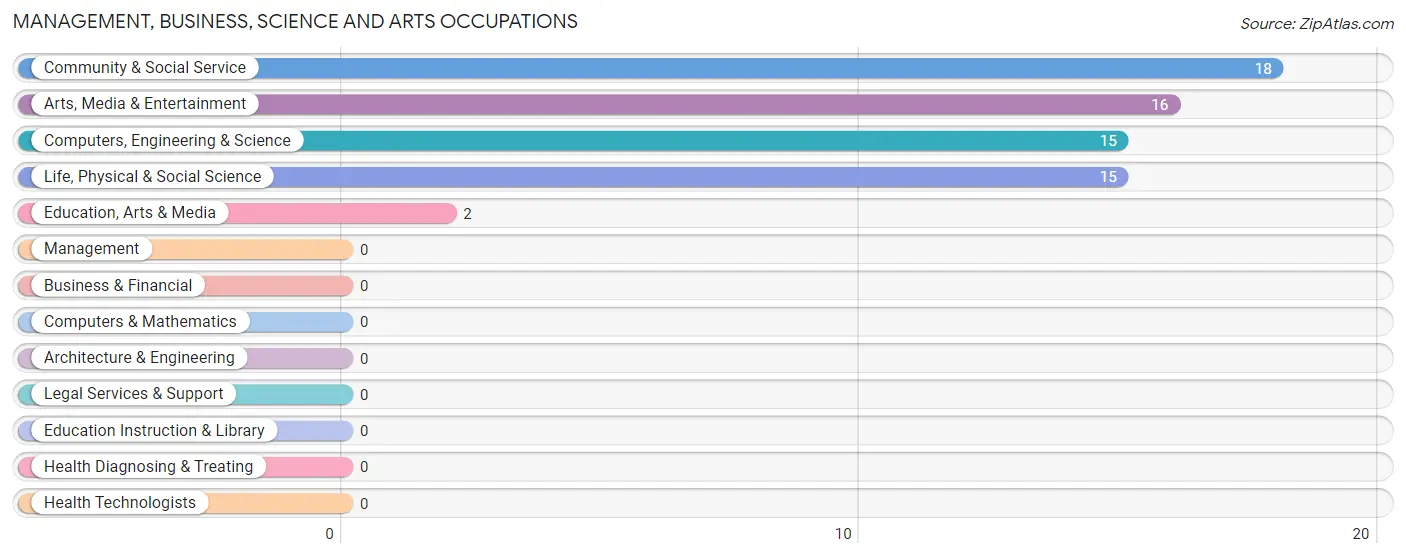
The most common Management, Business, Science and Arts occupations in Farmington are Community & Social Service (18 | 20.4%), Arts, Media & Entertainment (16 | 18.2%), Computers, Engineering & Science (15 | 17.1%), Life, Physical & Social Science (15 | 17.1%), and Education, Arts & Media (2 | 2.3%).
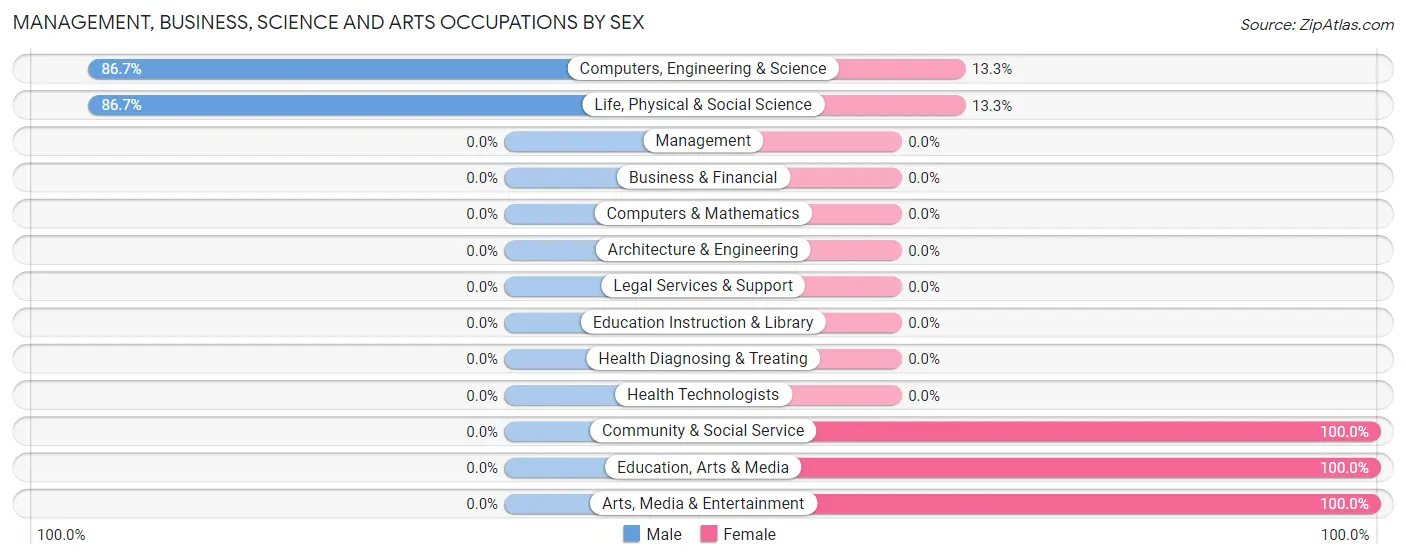
Management, Business, Science and Arts Occupations by Sex
Within the Management, Business, Science and Arts occupations in Farmington, the most male-oriented occupations are Computers, Engineering & Science (86.7%), and Life, Physical & Social Science (86.7%), while the most female-oriented occupations are Community & Social Service (100.0%), Education, Arts & Media (100.0%), and Arts, Media & Entertainment (100.0%).
| Occupation | Male | Female |
| Management | 0 (0.0%) | 0 (0.0%) |
| Business & Financial | 0 (0.0%) | 0 (0.0%) |
| Computers, Engineering & Science | 13 (86.7%) | 2 (13.3%) |
| Computers & Mathematics | 0 (0.0%) | 0 (0.0%) |
| Architecture & Engineering | 0 (0.0%) | 0 (0.0%) |
| Life, Physical & Social Science | 13 (86.7%) | 2 (13.3%) |
| Community & Social Service | 0 (0.0%) | 18 (100.0%) |
| Education, Arts & Media | 0 (0.0%) | 2 (100.0%) |
| Legal Services & Support | 0 (0.0%) | 0 (0.0%) |
| Education Instruction & Library | 0 (0.0%) | 0 (0.0%) |
| Arts, Media & Entertainment | 0 (0.0%) | 16 (100.0%) |
| Health Diagnosing & Treating | 0 (0.0%) | 0 (0.0%) |
| Health Technologists | 0 (0.0%) | 0 (0.0%) |
| Total (Category) | 13 (39.4%) | 20 (60.6%) |
| Total (Overall) | 52 (59.1%) | 36 (40.9%) |
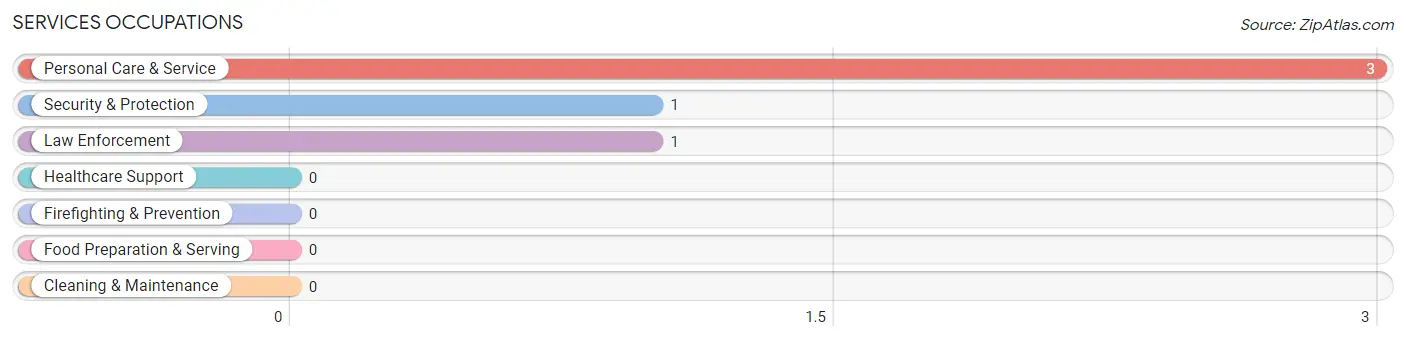
Services Occupations
The most common Services occupations in Farmington are Personal Care & Service (3 | 3.4%), Security & Protection (1 | 1.1%), and Law Enforcement (1 | 1.1%).
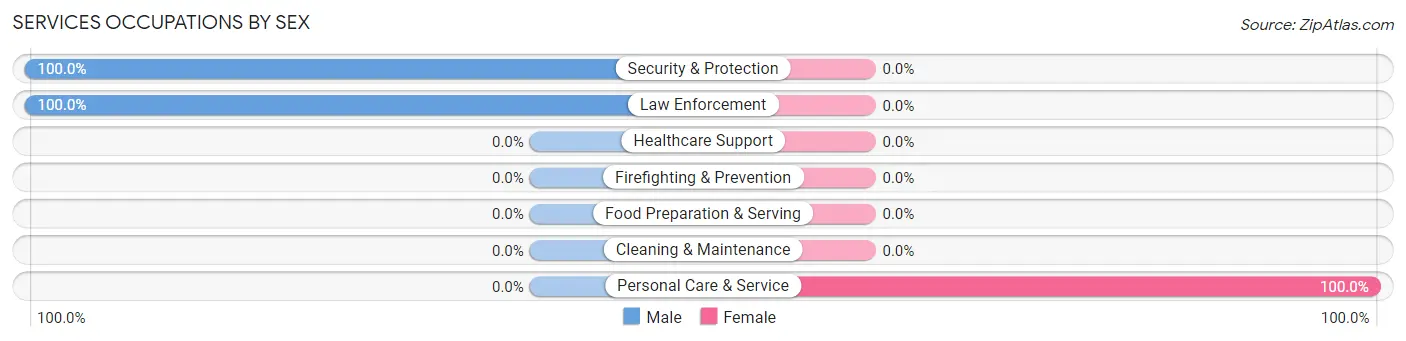
Services Occupations by Sex
| Occupation | Male | Female |
| Healthcare Support | 0 (0.0%) | 0 (0.0%) |
| Security & Protection | 1 (100.0%) | 0 (0.0%) |
| Firefighting & Prevention | 0 (0.0%) | 0 (0.0%) |
| Law Enforcement | 1 (100.0%) | 0 (0.0%) |
| Food Preparation & Serving | 0 (0.0%) | 0 (0.0%) |
| Cleaning & Maintenance | 0 (0.0%) | 0 (0.0%) |
| Personal Care & Service | 0 (0.0%) | 3 (100.0%) |
| Total (Category) | 1 (25.0%) | 3 (75.0%) |
| Total (Overall) | 52 (59.1%) | 36 (40.9%) |
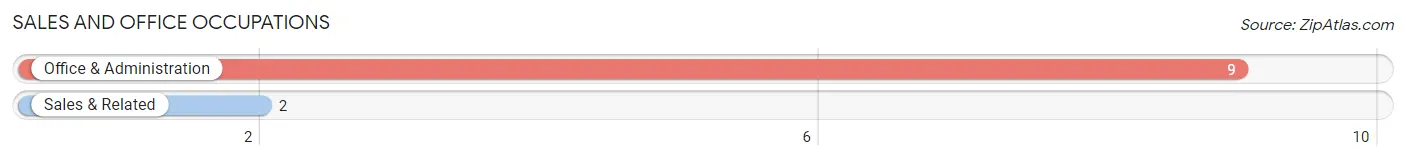
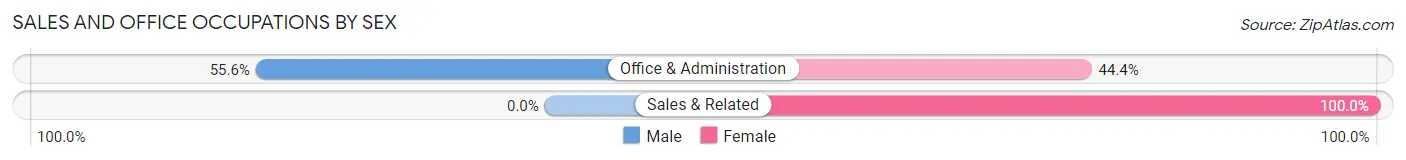
Sales and Office Occupations
The most common Sales and Office occupations in Farmington are Office & Administration (9 | 10.2%), and Sales & Related (2 | 2.3%).
Sales and Office Occupations by Sex
| Occupation | Male | Female |
| Sales & Related | 0 (0.0%) | 2 (100.0%) |
| Office & Administration | 5 (55.6%) | 4 (44.4%) |
| Total (Category) | 5 (45.5%) | 6 (54.5%) |
| Total (Overall) | 52 (59.1%) | 36 (40.9%) |
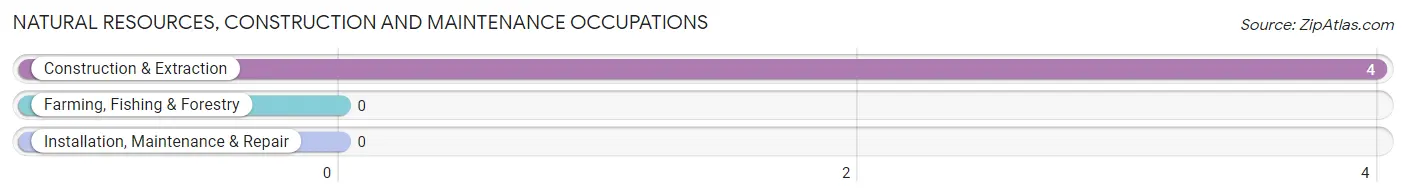
Natural Resources, Construction and Maintenance Occupations
The most common Natural Resources, Construction and Maintenance occupations in Farmington are , and Construction & Extraction (4 | 4.5%).
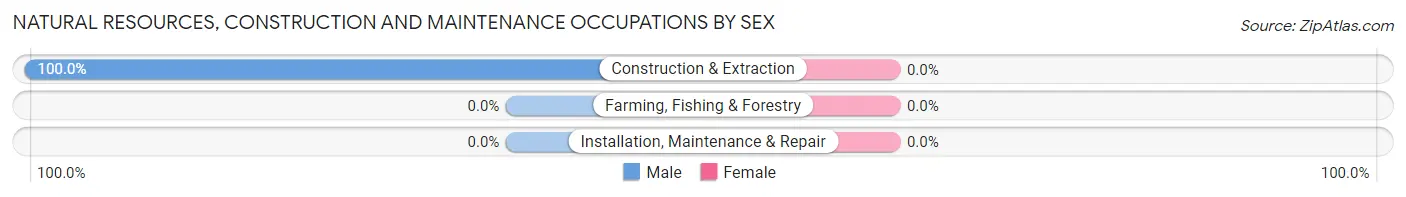
Natural Resources, Construction and Maintenance Occupations by Sex
| Occupation | Male | Female |
| Farming, Fishing & Forestry | 0 (0.0%) | 0 (0.0%) |
| Construction & Extraction | 4 (100.0%) | 0 (0.0%) |
| Installation, Maintenance & Repair | 0 (0.0%) | 0 (0.0%) |
| Total (Category) | 4 (100.0%) | 0 (0.0%) |
| Total (Overall) | 52 (59.1%) | 36 (40.9%) |
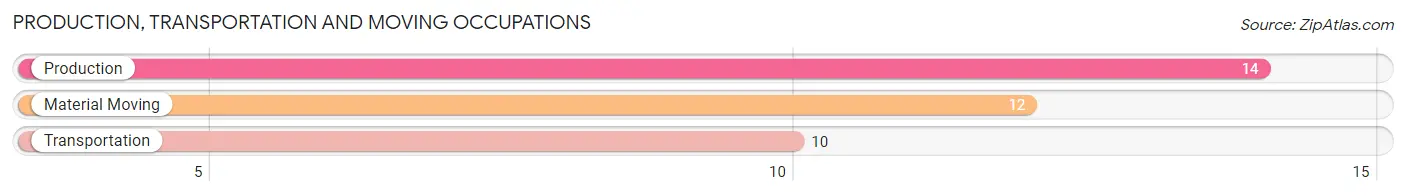
Production, Transportation and Moving Occupations
The most common Production, Transportation and Moving occupations in Farmington are Production (14 | 15.9%), Material Moving (12 | 13.6%), and Transportation (10 | 11.4%).
Production, Transportation and Moving Occupations by Sex
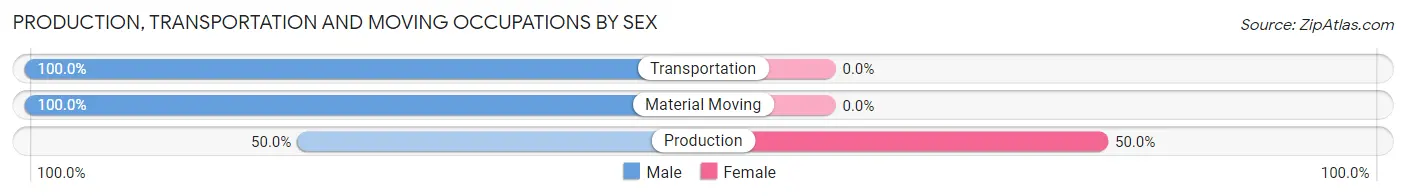
| Occupation | Male | Female |
| Production | 7 (50.0%) | 7 (50.0%) |
| Transportation | 10 (100.0%) | 0 (0.0%) |
| Material Moving | 12 (100.0%) | 0 (0.0%) |
| Total (Category) | 29 (80.6%) | 7 (19.4%) |
| Total (Overall) | 52 (59.1%) | 36 (40.9%) |
Employment Industries by Sex in Farmington
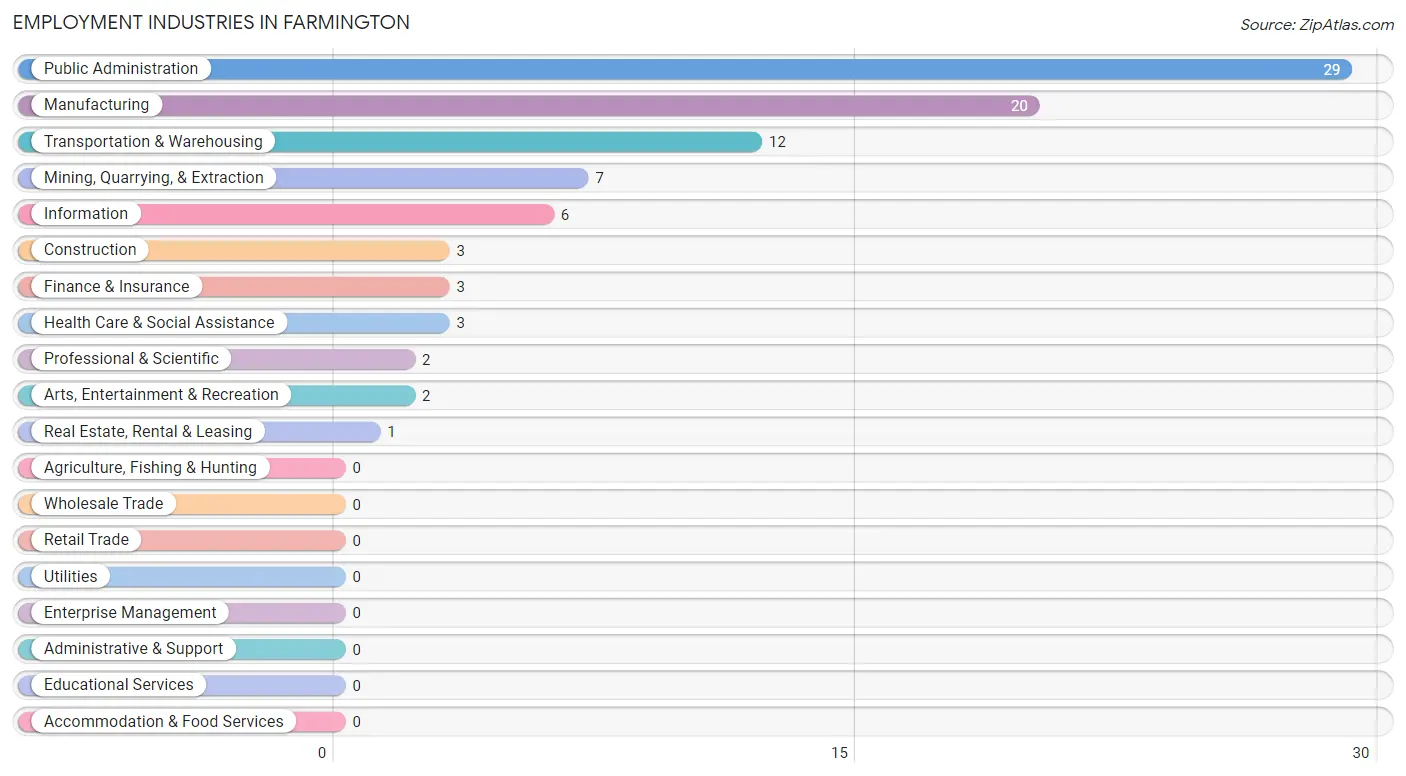
Employment Industries in Farmington
The major employment industries in Farmington include Public Administration (29 | 33.0%), Manufacturing (20 | 22.7%), Transportation & Warehousing (12 | 13.6%), Mining, Quarrying, & Extraction (7 | 8.0%), and Information (6 | 6.8%).
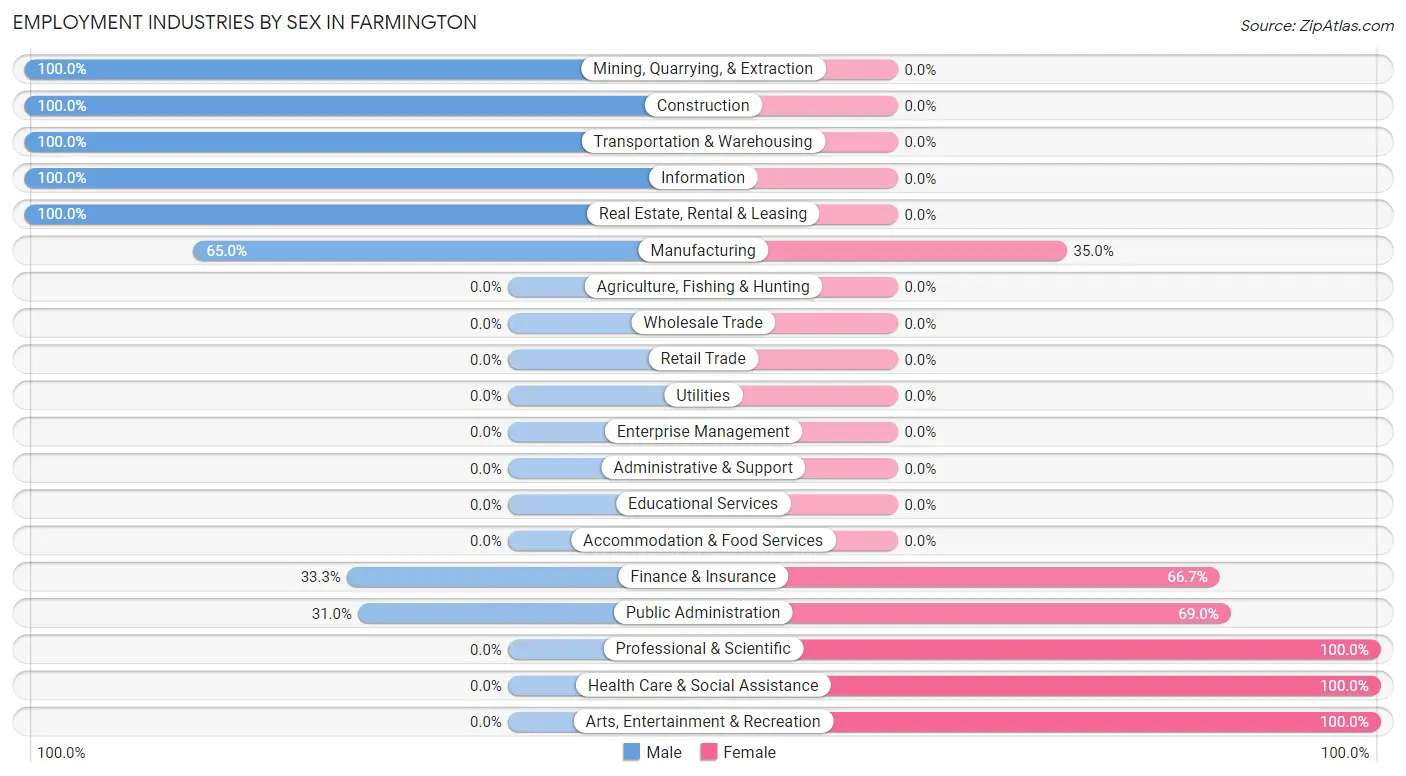
Employment Industries by Sex in Farmington
The Farmington industries that see more men than women are Mining, Quarrying, & Extraction (100.0%), Construction (100.0%), and Transportation & Warehousing (100.0%), whereas the industries that tend to have a higher number of women are Professional & Scientific (100.0%), Health Care & Social Assistance (100.0%), and Arts, Entertainment & Recreation (100.0%).
| Industry | Male | Female |
| Agriculture, Fishing & Hunting | 0 (0.0%) | 0 (0.0%) |
| Mining, Quarrying, & Extraction | 7 (100.0%) | 0 (0.0%) |
| Construction | 3 (100.0%) | 0 (0.0%) |
| Manufacturing | 13 (65.0%) | 7 (35.0%) |
| Wholesale Trade | 0 (0.0%) | 0 (0.0%) |
| Retail Trade | 0 (0.0%) | 0 (0.0%) |
| Transportation & Warehousing | 12 (100.0%) | 0 (0.0%) |
| Utilities | 0 (0.0%) | 0 (0.0%) |
| Information | 6 (100.0%) | 0 (0.0%) |
| Finance & Insurance | 1 (33.3%) | 2 (66.7%) |
| Real Estate, Rental & Leasing | 1 (100.0%) | 0 (0.0%) |
| Professional & Scientific | 0 (0.0%) | 2 (100.0%) |
| Enterprise Management | 0 (0.0%) | 0 (0.0%) |
| Administrative & Support | 0 (0.0%) | 0 (0.0%) |
| Educational Services | 0 (0.0%) | 0 (0.0%) |
| Health Care & Social Assistance | 0 (0.0%) | 3 (100.0%) |
| Arts, Entertainment & Recreation | 0 (0.0%) | 2 (100.0%) |
| Accommodation & Food Services | 0 (0.0%) | 0 (0.0%) |
| Public Administration | 9 (31.0%) | 20 (69.0%) |
| Total | 52 (59.1%) | 36 (40.9%) |
Education in Farmington
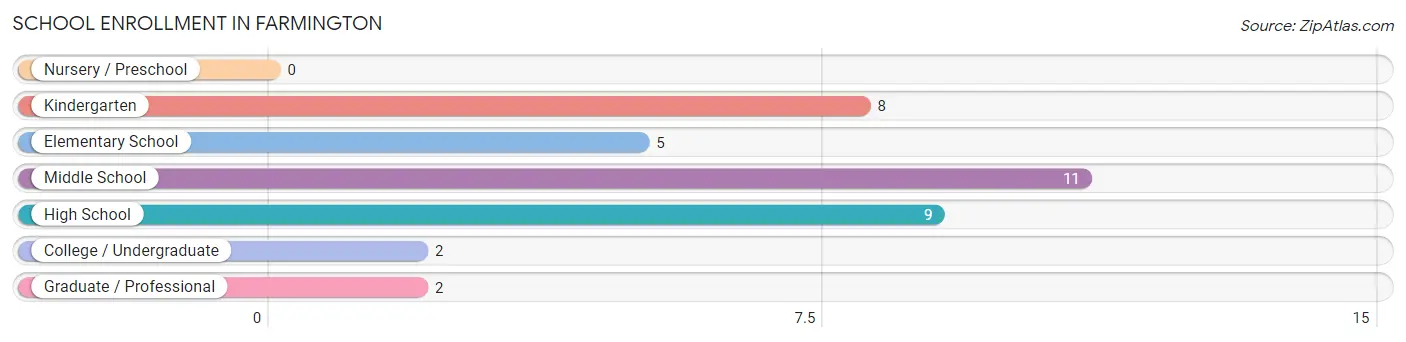
School Enrollment in Farmington
The most common levels of schooling among the 37 students in Farmington are middle school (11 | 29.7%), high school (9 | 24.3%), and kindergarten (8 | 21.6%).
| School Level | # Students | % Students |
| Nursery / Preschool | 0 | 0.0% |
| Kindergarten | 8 | 21.6% |
| Elementary School | 5 | 13.5% |
| Middle School | 11 | 29.7% |
| High School | 9 | 24.3% |
| College / Undergraduate | 2 | 5.4% |
| Graduate / Professional | 2 | 5.4% |
| Total | 37 | 100.0% |
School Enrollment by Age by Funding Source in Farmington
Out of a total of 37 students who are enrolled in schools in Farmington, 2 (5.4%) attend a private institution, while the remaining 35 (94.6%) are enrolled in public schools. The age group of 10 to 14 year olds has the highest likelihood of being enrolled in private schools, with 2 (18.2% in the age bracket) enrolled. Conversely, the age group of 5 to 9 year old has the lowest likelihood of being enrolled in a private school, with 13 (100.0% in the age bracket) attending a public institution.
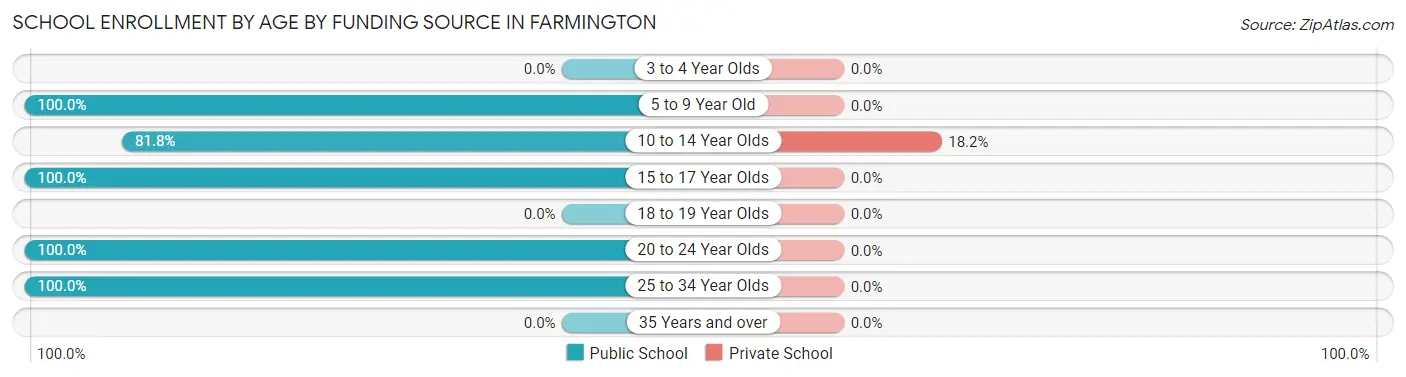
| Age Bracket | Public School | Private School |
| 3 to 4 Year Olds | 0 (0.0%) | 0 (0.0%) |
| 5 to 9 Year Old | 13 (100.0%) | 0 (0.0%) |
| 10 to 14 Year Olds | 9 (81.8%) | 2 (18.2%) |
| 15 to 17 Year Olds | 9 (100.0%) | 0 (0.0%) |
| 18 to 19 Year Olds | 0 (0.0%) | 0 (0.0%) |
| 20 to 24 Year Olds | 2 (100.0%) | 0 (0.0%) |
| 25 to 34 Year Olds | 2 (100.0%) | 0 (0.0%) |
| 35 Years and over | 0 (0.0%) | 0 (0.0%) |
| Total | 35 (94.6%) | 2 (5.4%) |
Educational Attainment by Field of Study in Farmington
Liberal arts & history (57 | 93.4%), bio, nature & agricultural (2 | 3.3%), and literature & languages (2 | 3.3%) are the most common fields of study among 61 individuals in Farmington who have obtained a bachelor's degree or higher.
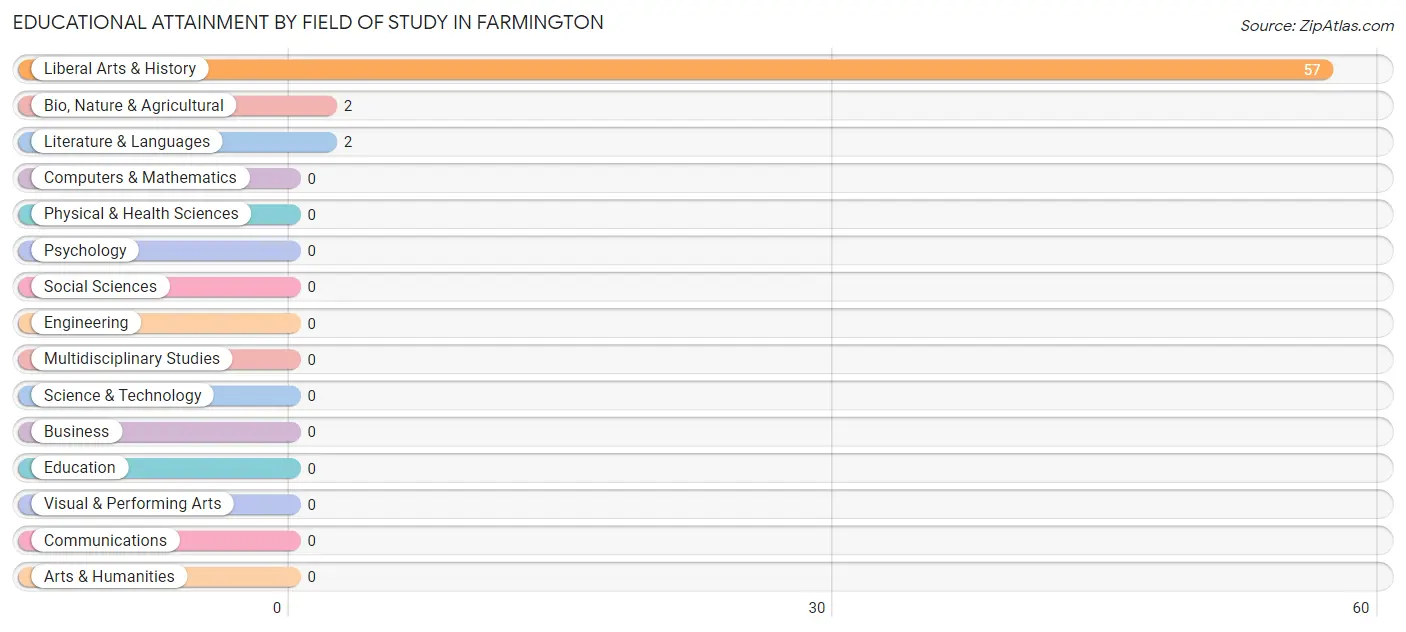
| Field of Study | # Graduates | % Graduates |
| Computers & Mathematics | 0 | 0.0% |
| Bio, Nature & Agricultural | 2 | 3.3% |
| Physical & Health Sciences | 0 | 0.0% |
| Psychology | 0 | 0.0% |
| Social Sciences | 0 | 0.0% |
| Engineering | 0 | 0.0% |
| Multidisciplinary Studies | 0 | 0.0% |
| Science & Technology | 0 | 0.0% |
| Business | 0 | 0.0% |
| Education | 0 | 0.0% |
| Literature & Languages | 2 | 3.3% |
| Liberal Arts & History | 57 | 93.4% |
| Visual & Performing Arts | 0 | 0.0% |
| Communications | 0 | 0.0% |
| Arts & Humanities | 0 | 0.0% |
| Total | 61 | 100.0% |
Transportation & Commute in Farmington
Vehicle Availability by Sex in Farmington
The most prevalent vehicle ownership categories in Farmington are males with 2 vehicles (36, accounting for 69.2%) and females with 2 vehicles (27, making up 100.0%).
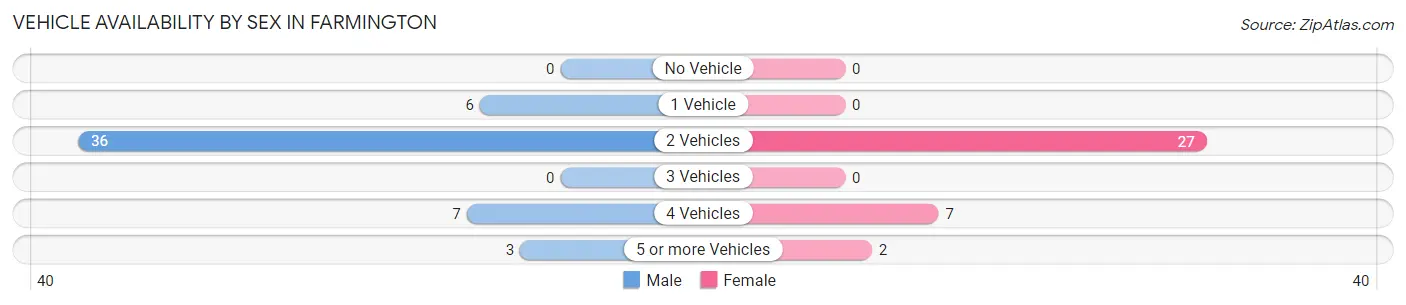
| Vehicles Available | Male | Female |
| No Vehicle | 0 (0.0%) | 0 (0.0%) |
| 1 Vehicle | 6 (11.5%) | 0 (0.0%) |
| 2 Vehicles | 36 (69.2%) | 27 (75.0%) |
| 3 Vehicles | 0 (0.0%) | 0 (0.0%) |
| 4 Vehicles | 7 (13.5%) | 7 (19.4%) |
| 5 or more Vehicles | 3 (5.8%) | 2 (5.6%) |
| Total | 52 (100.0%) | 36 (100.0%) |
Commute Time in Farmington
The most frequently occuring commute durations in Farmington are 30 to 34 minutes (21 commuters, 23.9%), 35 to 39 minutes (16 commuters, 18.2%), and 10 to 14 minutes (14 commuters, 15.9%).
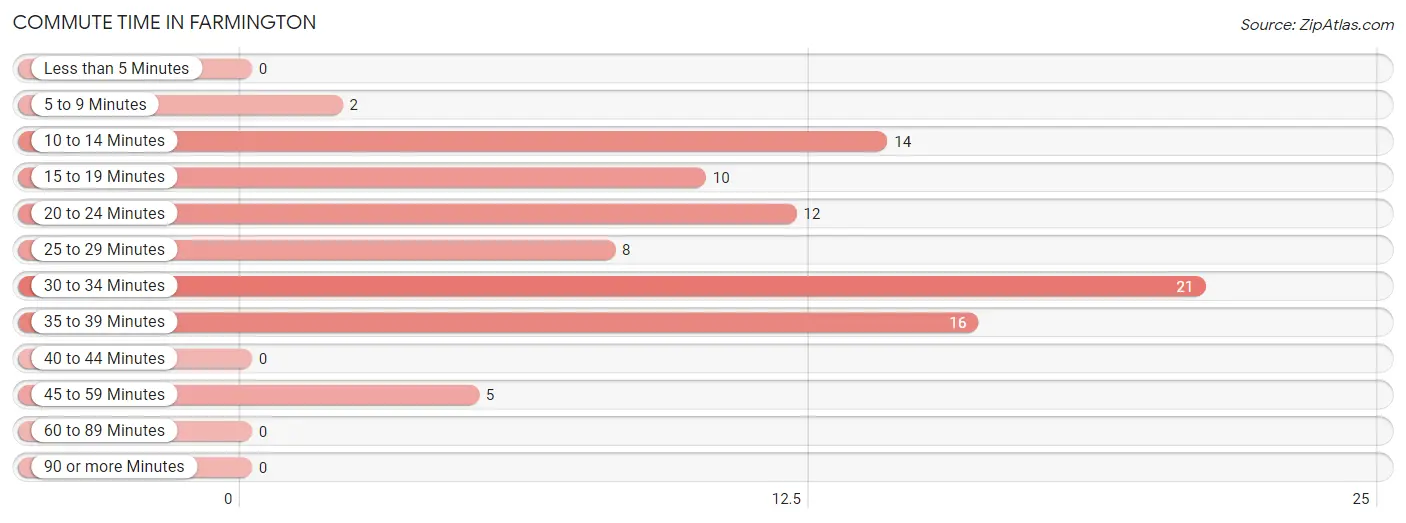
| Commute Time | # Commuters | % Commuters |
| Less than 5 Minutes | 0 | 0.0% |
| 5 to 9 Minutes | 2 | 2.3% |
| 10 to 14 Minutes | 14 | 15.9% |
| 15 to 19 Minutes | 10 | 11.4% |
| 20 to 24 Minutes | 12 | 13.6% |
| 25 to 29 Minutes | 8 | 9.1% |
| 30 to 34 Minutes | 21 | 23.9% |
| 35 to 39 Minutes | 16 | 18.2% |
| 40 to 44 Minutes | 0 | 0.0% |
| 45 to 59 Minutes | 5 | 5.7% |
| 60 to 89 Minutes | 0 | 0.0% |
| 90 or more Minutes | 0 | 0.0% |
Commute Time by Sex in Farmington
The most common commute times in Farmington are 30 to 34 minutes (21 commuters, 40.4%) for males and 35 to 39 minutes (16 commuters, 44.4%) for females.
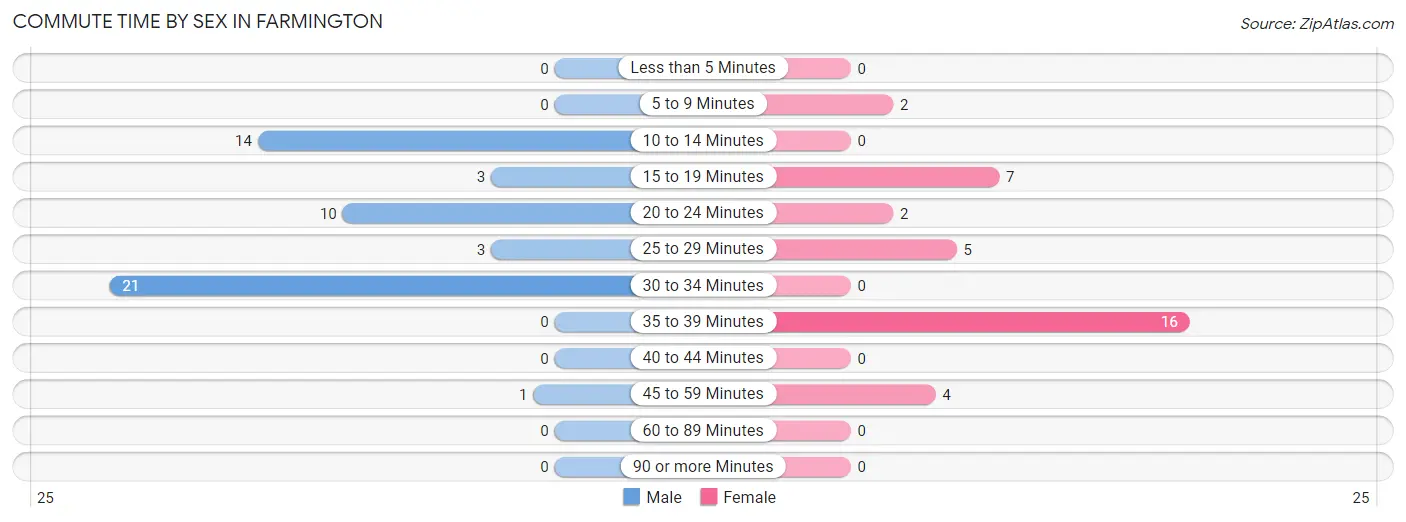
| Commute Time | Male | Female |
| Less than 5 Minutes | 0 (0.0%) | 0 (0.0%) |
| 5 to 9 Minutes | 0 (0.0%) | 2 (5.6%) |
| 10 to 14 Minutes | 14 (26.9%) | 0 (0.0%) |
| 15 to 19 Minutes | 3 (5.8%) | 7 (19.4%) |
| 20 to 24 Minutes | 10 (19.2%) | 2 (5.6%) |
| 25 to 29 Minutes | 3 (5.8%) | 5 (13.9%) |
| 30 to 34 Minutes | 21 (40.4%) | 0 (0.0%) |
| 35 to 39 Minutes | 0 (0.0%) | 16 (44.4%) |
| 40 to 44 Minutes | 0 (0.0%) | 0 (0.0%) |
| 45 to 59 Minutes | 1 (1.9%) | 4 (11.1%) |
| 60 to 89 Minutes | 0 (0.0%) | 0 (0.0%) |
| 90 or more Minutes | 0 (0.0%) | 0 (0.0%) |
Time of Departure to Work by Sex in Farmington
The most frequent times of departure to work in Farmington are 6:30 AM to 6:59 AM (14, 26.9%) for males and 7:00 AM to 7:29 AM (20, 55.6%) for females.
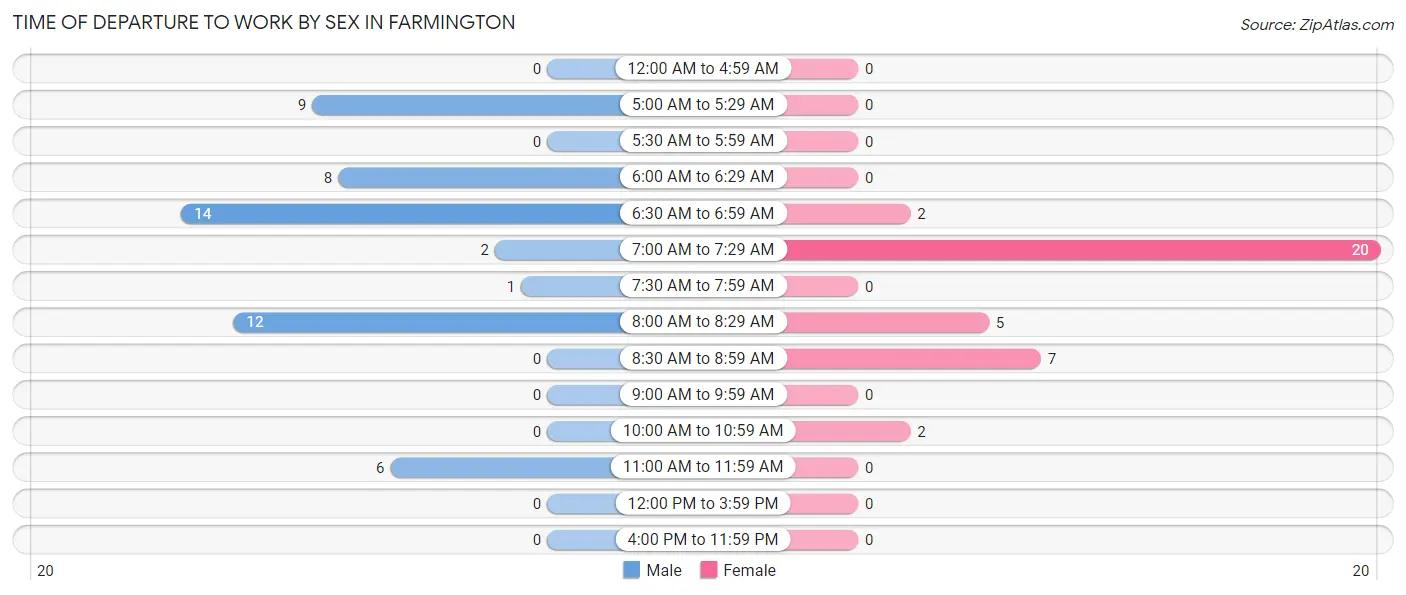
| Time of Departure | Male | Female |
| 12:00 AM to 4:59 AM | 0 (0.0%) | 0 (0.0%) |
| 5:00 AM to 5:29 AM | 9 (17.3%) | 0 (0.0%) |
| 5:30 AM to 5:59 AM | 0 (0.0%) | 0 (0.0%) |
| 6:00 AM to 6:29 AM | 8 (15.4%) | 0 (0.0%) |
| 6:30 AM to 6:59 AM | 14 (26.9%) | 2 (5.6%) |
| 7:00 AM to 7:29 AM | 2 (3.8%) | 20 (55.6%) |
| 7:30 AM to 7:59 AM | 1 (1.9%) | 0 (0.0%) |
| 8:00 AM to 8:29 AM | 12 (23.1%) | 5 (13.9%) |
| 8:30 AM to 8:59 AM | 0 (0.0%) | 7 (19.4%) |
| 9:00 AM to 9:59 AM | 0 (0.0%) | 0 (0.0%) |
| 10:00 AM to 10:59 AM | 0 (0.0%) | 2 (5.6%) |
| 11:00 AM to 11:59 AM | 6 (11.5%) | 0 (0.0%) |
| 12:00 PM to 3:59 PM | 0 (0.0%) | 0 (0.0%) |
| 4:00 PM to 11:59 PM | 0 (0.0%) | 0 (0.0%) |
| Total | 52 (100.0%) | 36 (100.0%) |
Housing Occupancy in Farmington
Occupancy by Ownership in Farmington
Of the total 109 dwellings in Farmington, owner-occupied units account for 104 (95.4%), while renter-occupied units make up 5 (4.6%).
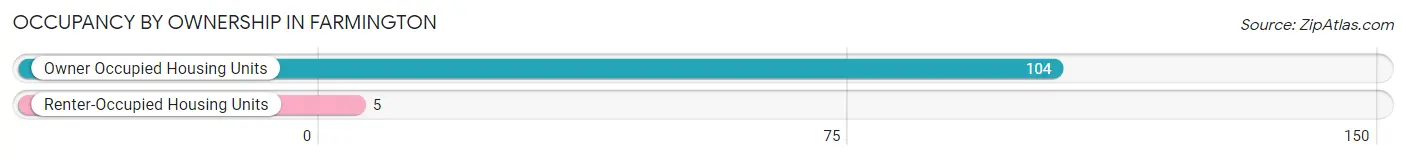
| Occupancy | # Housing Units | % Housing Units |
| Owner Occupied Housing Units | 104 | 95.4% |
| Renter-Occupied Housing Units | 5 | 4.6% |
| Total Occupied Housing Units | 109 | 100.0% |
Occupancy by Household Size in Farmington
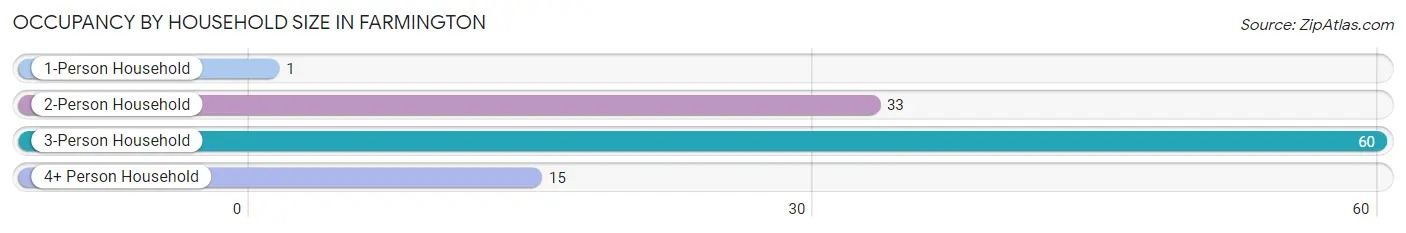
| Household Size | # Housing Units | % Housing Units |
| 1-Person Household | 1 | 0.9% |
| 2-Person Household | 33 | 30.3% |
| 3-Person Household | 60 | 55.0% |
| 4+ Person Household | 15 | 13.8% |
| Total Housing Units | 109 | 100.0% |
Occupancy by Ownership by Household Size in Farmington
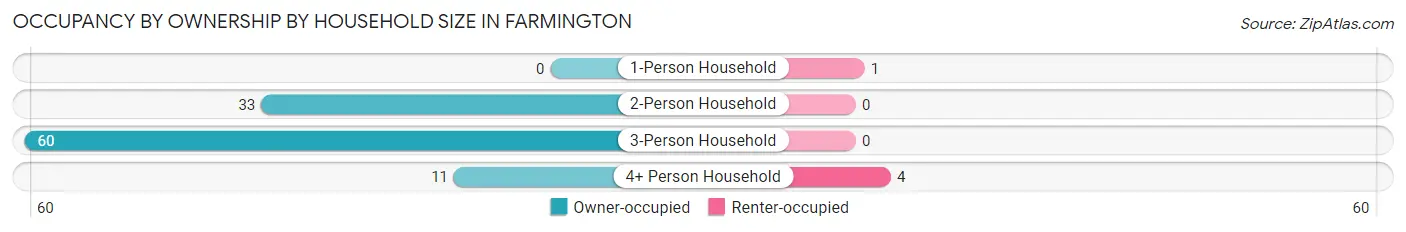
| Household Size | Owner-occupied | Renter-occupied |
| 1-Person Household | 0 (0.0%) | 1 (100.0%) |
| 2-Person Household | 33 (100.0%) | 0 (0.0%) |
| 3-Person Household | 60 (100.0%) | 0 (0.0%) |
| 4+ Person Household | 11 (73.3%) | 4 (26.7%) |
| Total Housing Units | 104 (95.4%) | 5 (4.6%) |
Occupancy by Educational Attainment in Farmington
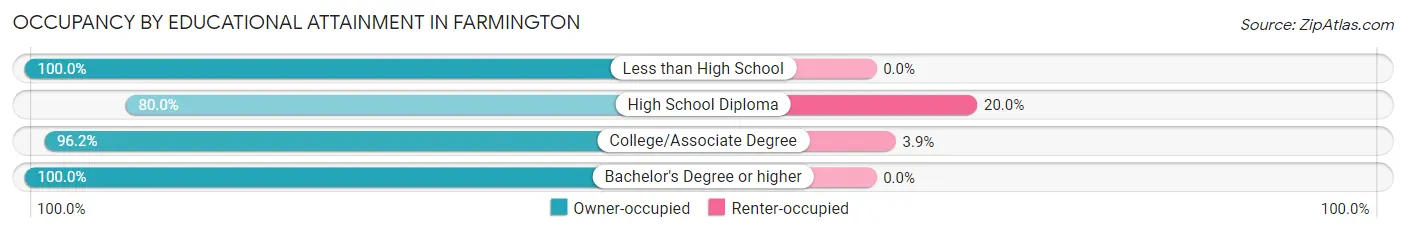
| Household Size | Owner-occupied | Renter-occupied |
| Less than High School | 2 (100.0%) | 0 (0.0%) |
| High School Diploma | 16 (80.0%) | 4 (20.0%) |
| College/Associate Degree | 25 (96.2%) | 1 (3.8%) |
| Bachelor's Degree or higher | 61 (100.0%) | 0 (0.0%) |
Occupancy by Age of Householder in Farmington
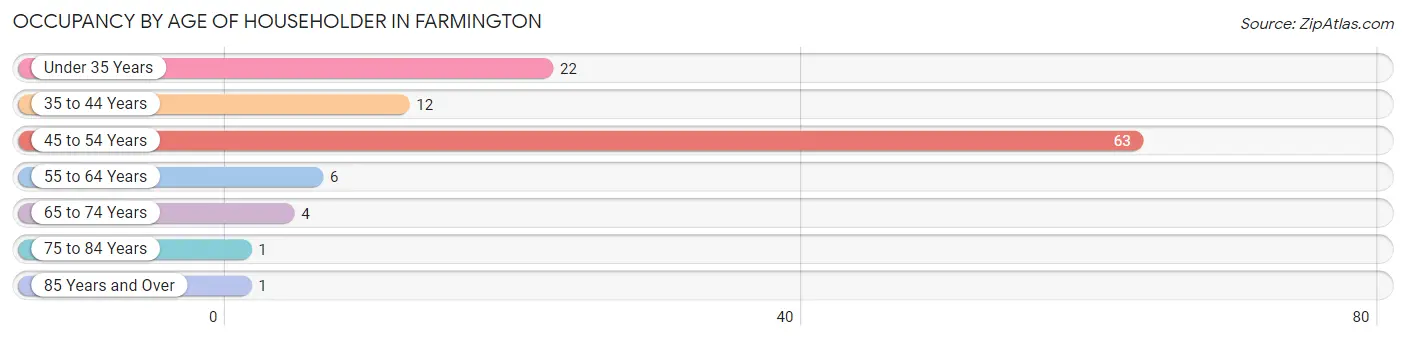
| Age Bracket | # Households | % Households |
| Under 35 Years | 22 | 20.2% |
| 35 to 44 Years | 12 | 11.0% |
| 45 to 54 Years | 63 | 57.8% |
| 55 to 64 Years | 6 | 5.5% |
| 65 to 74 Years | 4 | 3.7% |
| 75 to 84 Years | 1 | 0.9% |
| 85 Years and Over | 1 | 0.9% |
| Total | 109 | 100.0% |
Housing Finances in Farmington
Median Income by Occupancy in Farmington
| Occupancy Type | # Households | Median Income |
| Owner-Occupied | 104 (95.4%) | $0 |
| Renter-Occupied | 5 (4.6%) | $0 |
| Average | 109 (100.0%) | $0 |
Occupancy by Householder Income Bracket in Farmington
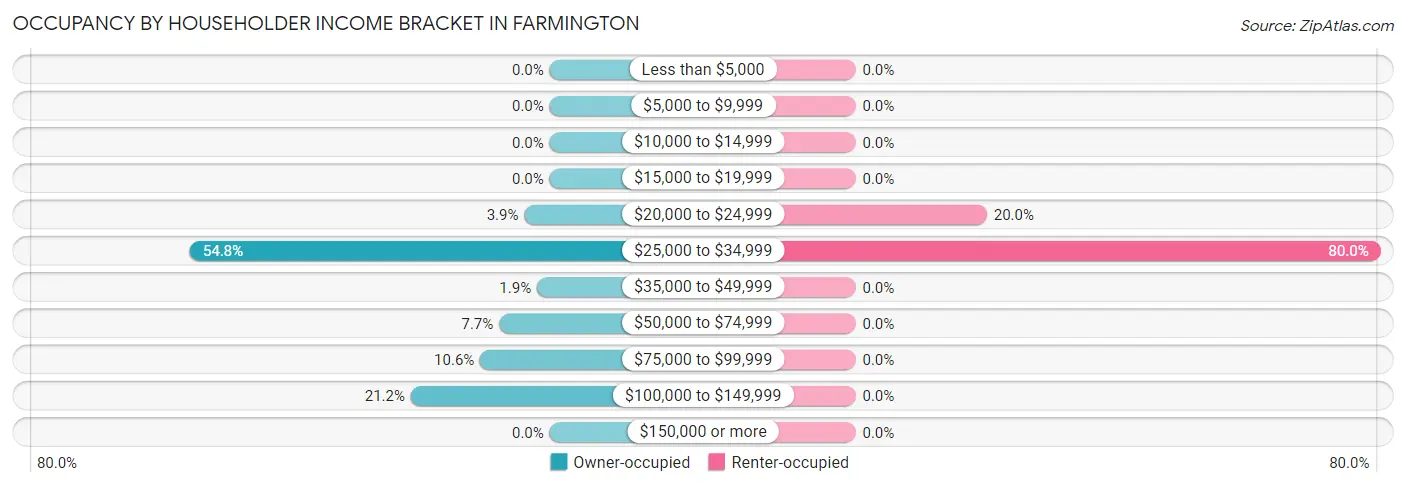
| Income Bracket | Owner-occupied | Renter-occupied |
| Less than $5,000 | 0 (0.0%) | 0 (0.0%) |
| $5,000 to $9,999 | 0 (0.0%) | 0 (0.0%) |
| $10,000 to $14,999 | 0 (0.0%) | 0 (0.0%) |
| $15,000 to $19,999 | 0 (0.0%) | 0 (0.0%) |
| $20,000 to $24,999 | 4 (3.8%) | 1 (20.0%) |
| $25,000 to $34,999 | 57 (54.8%) | 4 (80.0%) |
| $35,000 to $49,999 | 2 (1.9%) | 0 (0.0%) |
| $50,000 to $74,999 | 8 (7.7%) | 0 (0.0%) |
| $75,000 to $99,999 | 11 (10.6%) | 0 (0.0%) |
| $100,000 to $149,999 | 22 (21.1%) | 0 (0.0%) |
| $150,000 or more | 0 (0.0%) | 0 (0.0%) |
| Total | 104 (100.0%) | 5 (100.0%) |
Monthly Housing Cost Tiers in Farmington
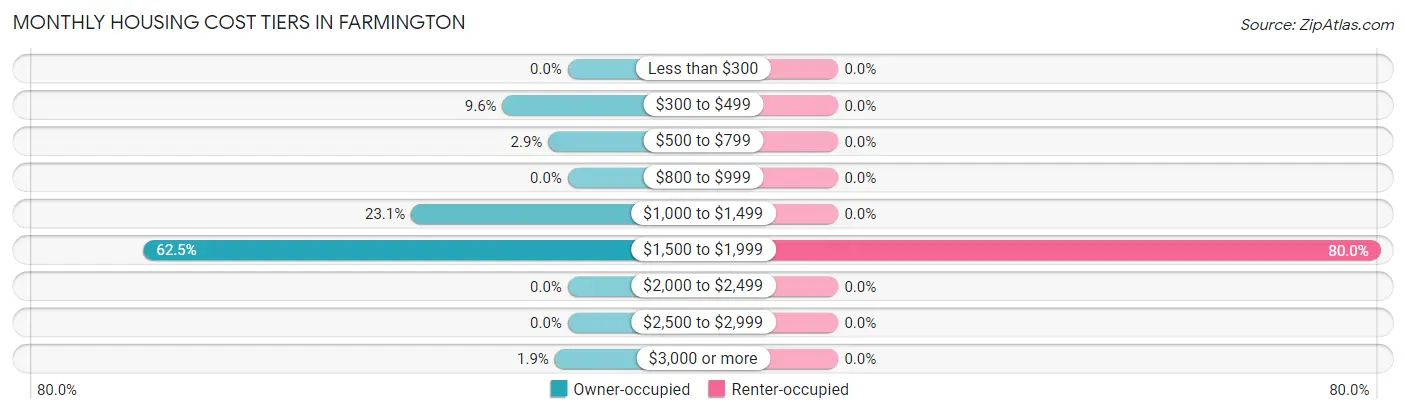
| Monthly Cost | Owner-occupied | Renter-occupied |
| Less than $300 | 0 (0.0%) | 0 (0.0%) |
| $300 to $499 | 10 (9.6%) | 0 (0.0%) |
| $500 to $799 | 3 (2.9%) | 0 (0.0%) |
| $800 to $999 | 0 (0.0%) | 0 (0.0%) |
| $1,000 to $1,499 | 24 (23.1%) | 0 (0.0%) |
| $1,500 to $1,999 | 65 (62.5%) | 4 (80.0%) |
| $2,000 to $2,499 | 0 (0.0%) | 0 (0.0%) |
| $2,500 to $2,999 | 0 (0.0%) | 0 (0.0%) |
| $3,000 or more | 2 (1.9%) | 0 (0.0%) |
| Total | 104 (100.0%) | 5 (100.0%) |
Physical Housing Characteristics in Farmington
Housing Structures in Farmington
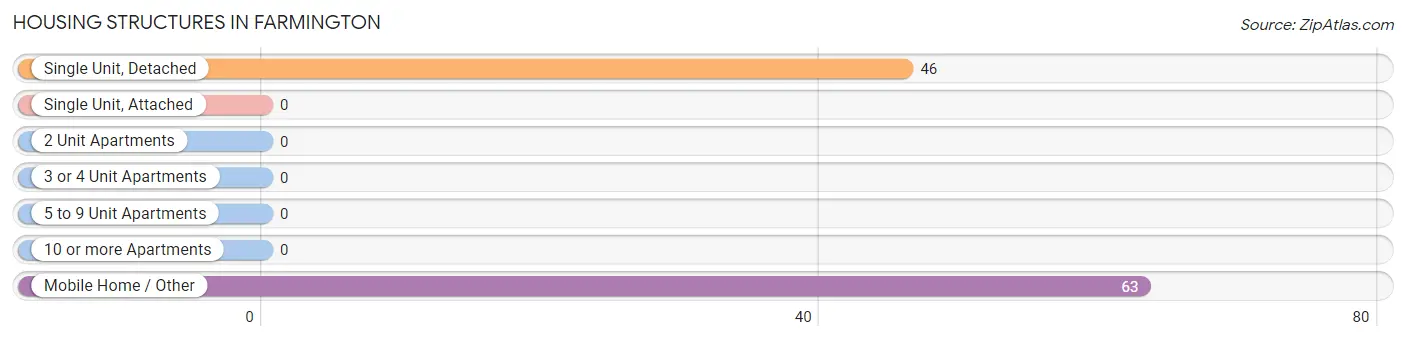
| Structure Type | # Housing Units | % Housing Units |
| Single Unit, Detached | 46 | 42.2% |
| Single Unit, Attached | 0 | 0.0% |
| 2 Unit Apartments | 0 | 0.0% |
| 3 or 4 Unit Apartments | 0 | 0.0% |
| 5 to 9 Unit Apartments | 0 | 0.0% |
| 10 or more Apartments | 0 | 0.0% |
| Mobile Home / Other | 63 | 57.8% |
| Total | 109 | 100.0% |
Housing Structures by Occupancy in Farmington
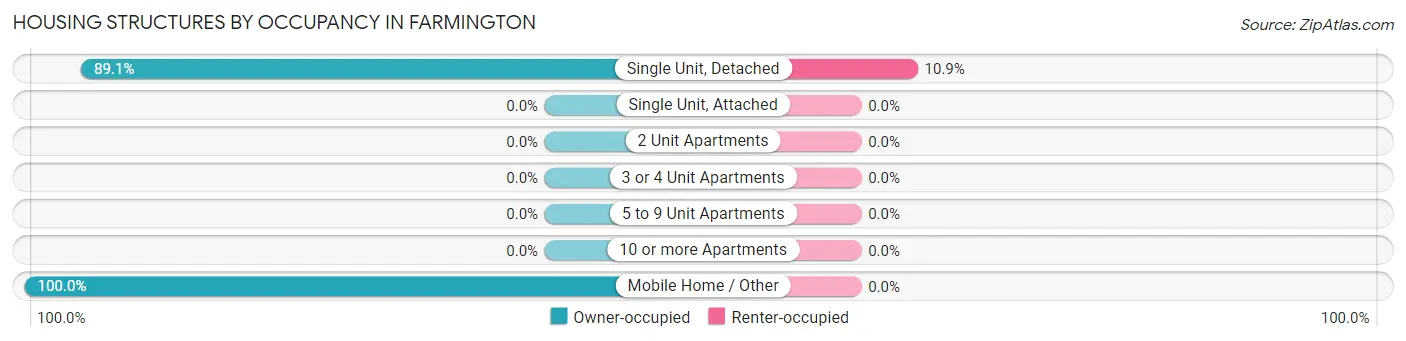
| Structure Type | Owner-occupied | Renter-occupied |
| Single Unit, Detached | 41 (89.1%) | 5 (10.9%) |
| Single Unit, Attached | 0 (0.0%) | 0 (0.0%) |
| 2 Unit Apartments | 0 (0.0%) | 0 (0.0%) |
| 3 or 4 Unit Apartments | 0 (0.0%) | 0 (0.0%) |
| 5 to 9 Unit Apartments | 0 (0.0%) | 0 (0.0%) |
| 10 or more Apartments | 0 (0.0%) | 0 (0.0%) |
| Mobile Home / Other | 63 (100.0%) | 0 (0.0%) |
| Total | 104 (95.4%) | 5 (4.6%) |
Housing Structures by Number of Rooms in Farmington
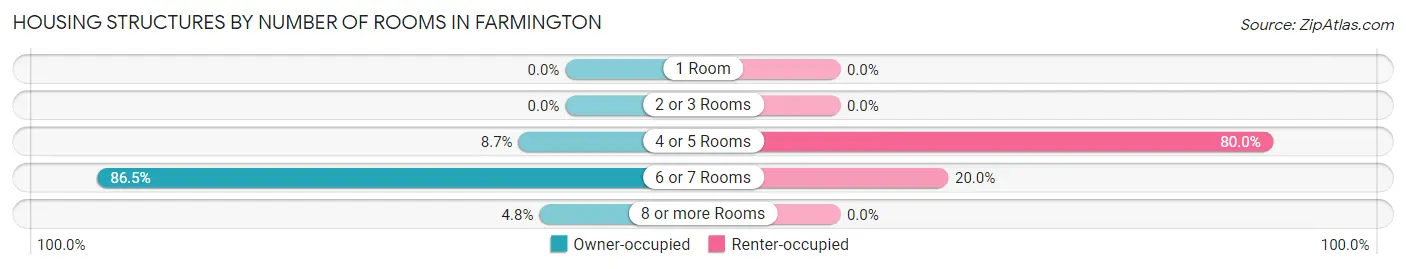
| Number of Rooms | Owner-occupied | Renter-occupied |
| 1 Room | 0 (0.0%) | 0 (0.0%) |
| 2 or 3 Rooms | 0 (0.0%) | 0 (0.0%) |
| 4 or 5 Rooms | 9 (8.6%) | 4 (80.0%) |
| 6 or 7 Rooms | 90 (86.5%) | 1 (20.0%) |
| 8 or more Rooms | 5 (4.8%) | 0 (0.0%) |
| Total | 104 (100.0%) | 5 (100.0%) |
Housing Structure by Heating Type in Farmington
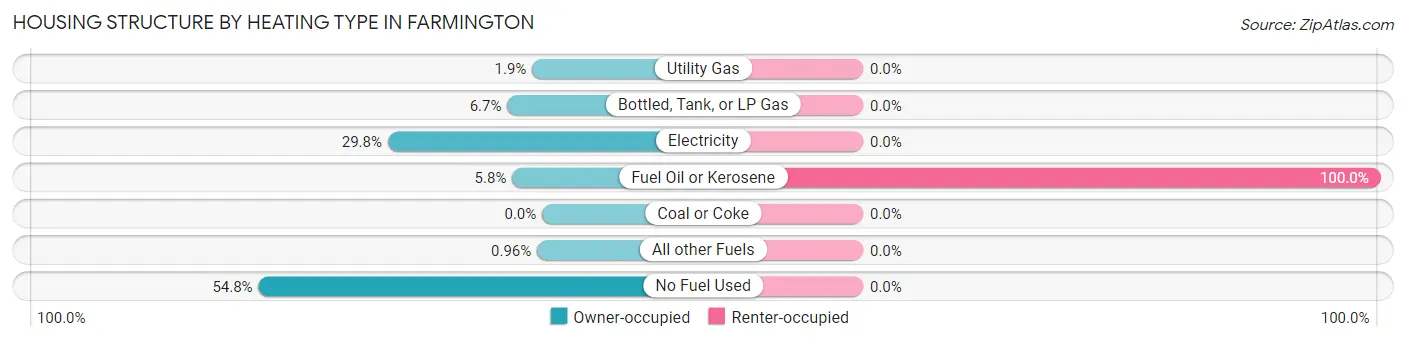
| Heating Type | Owner-occupied | Renter-occupied |
| Utility Gas | 2 (1.9%) | 0 (0.0%) |
| Bottled, Tank, or LP Gas | 7 (6.7%) | 0 (0.0%) |
| Electricity | 31 (29.8%) | 0 (0.0%) |
| Fuel Oil or Kerosene | 6 (5.8%) | 5 (100.0%) |
| Coal or Coke | 0 (0.0%) | 0 (0.0%) |
| All other Fuels | 1 (1.0%) | 0 (0.0%) |
| No Fuel Used | 57 (54.8%) | 0 (0.0%) |
| Total | 104 (100.0%) | 5 (100.0%) |
Household Vehicle Usage in Farmington
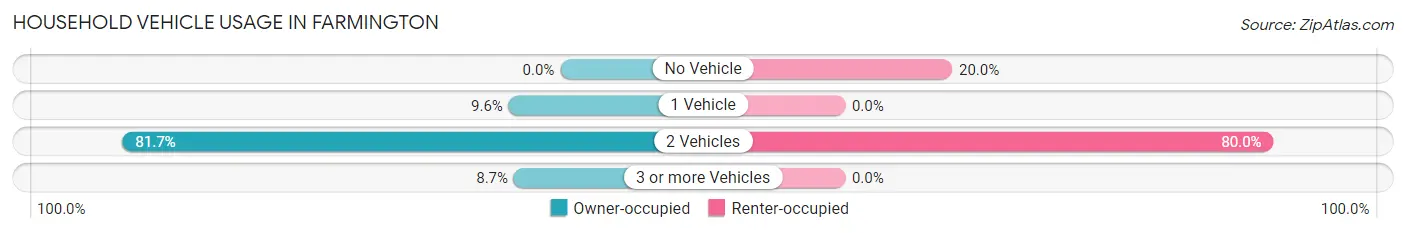
| Vehicles per Household | Owner-occupied | Renter-occupied |
| No Vehicle | 0 (0.0%) | 1 (20.0%) |
| 1 Vehicle | 10 (9.6%) | 0 (0.0%) |
| 2 Vehicles | 85 (81.7%) | 4 (80.0%) |
| 3 or more Vehicles | 9 (8.6%) | 0 (0.0%) |
| Total | 104 (100.0%) | 5 (100.0%) |
Real Estate & Mortgages in Farmington
Real Estate and Mortgage Overview in Farmington
| Characteristic | Without Mortgage | With Mortgage |
| Housing Units | 15 | 89 |
| Median Property Value | - | - |
| Median Household Income | $51,875 | $0 |
| Monthly Housing Costs | $458 | $0 |
| Real Estate Taxes | - | - |
Property Value by Mortgage Status in Farmington
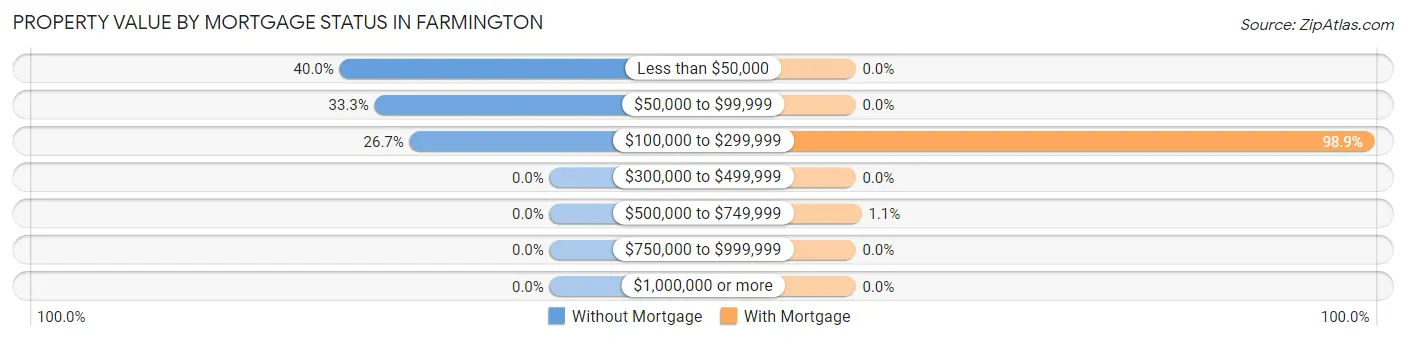
| Property Value | Without Mortgage | With Mortgage |
| Less than $50,000 | 6 (40.0%) | 0 (0.0%) |
| $50,000 to $99,999 | 5 (33.3%) | 0 (0.0%) |
| $100,000 to $299,999 | 4 (26.7%) | 88 (98.9%) |
| $300,000 to $499,999 | 0 (0.0%) | 0 (0.0%) |
| $500,000 to $749,999 | 0 (0.0%) | 1 (1.1%) |
| $750,000 to $999,999 | 0 (0.0%) | 0 (0.0%) |
| $1,000,000 or more | 0 (0.0%) | 0 (0.0%) |
| Total | 15 (100.0%) | 89 (100.0%) |
Household Income by Mortgage Status in Farmington
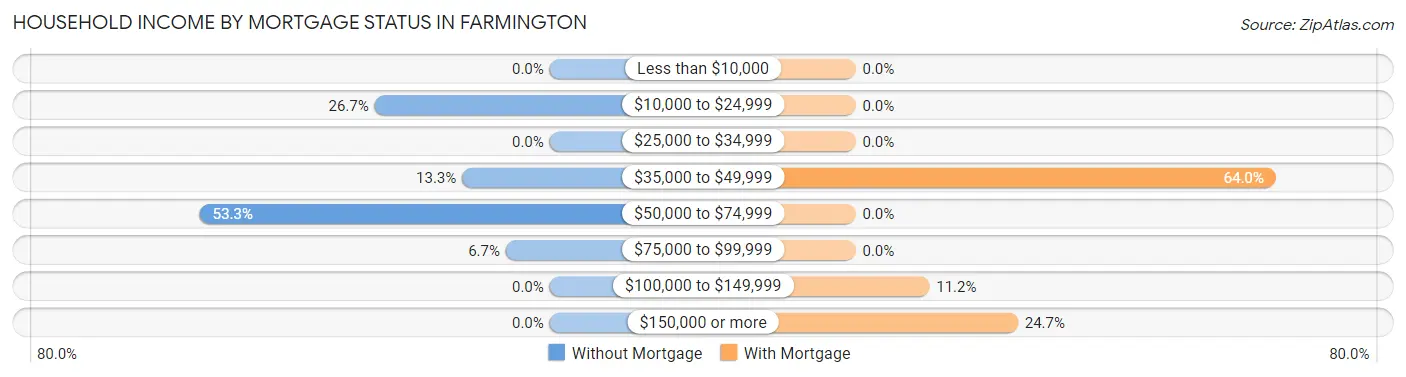
| Household Income | Without Mortgage | With Mortgage |
| Less than $10,000 | 0 (0.0%) | 0 (0.0%) |
| $10,000 to $24,999 | 4 (26.7%) | 0 (0.0%) |
| $25,000 to $34,999 | 0 (0.0%) | 0 (0.0%) |
| $35,000 to $49,999 | 2 (13.3%) | 57 (64.0%) |
| $50,000 to $74,999 | 8 (53.3%) | 0 (0.0%) |
| $75,000 to $99,999 | 1 (6.7%) | 0 (0.0%) |
| $100,000 to $149,999 | 0 (0.0%) | 10 (11.2%) |
| $150,000 or more | 0 (0.0%) | 22 (24.7%) |
| Total | 15 (100.0%) | 89 (100.0%) |
Property Value to Household Income Ratio in Farmington
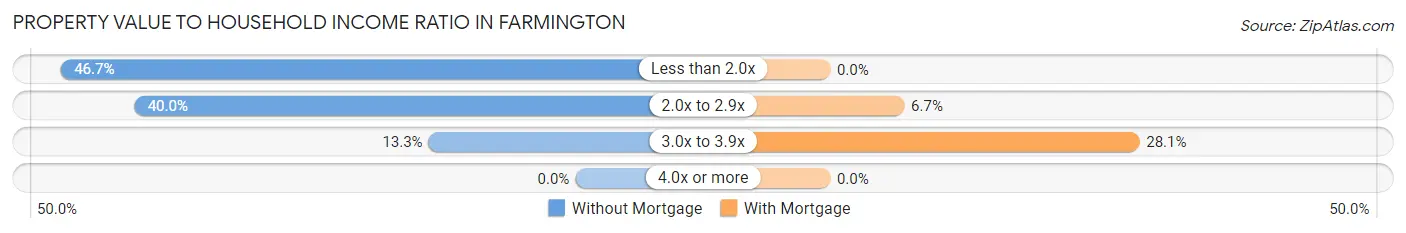
| Value-to-Income Ratio | Without Mortgage | With Mortgage |
| Less than 2.0x | 7 (46.7%) | 0 (0.0%) |
| 2.0x to 2.9x | 6 (40.0%) | 6 (6.7%) |
| 3.0x to 3.9x | 2 (13.3%) | 25 (28.1%) |
| 4.0x or more | 0 (0.0%) | 0 (0.0%) |
| Total | 15 (100.0%) | 89 (100.0%) |
Real Estate Taxes by Mortgage Status in Farmington
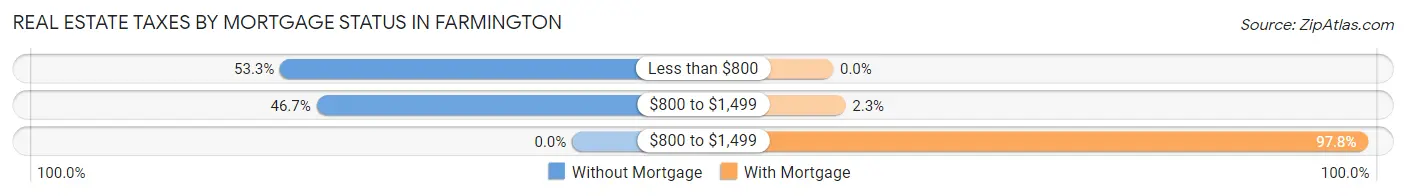
| Property Taxes | Without Mortgage | With Mortgage |
| Less than $800 | 8 (53.3%) | 0 (0.0%) |
| $800 to $1,499 | 7 (46.7%) | 2 (2.2%) |
| $800 to $1,499 | 0 (0.0%) | 87 (97.8%) |
| Total | 15 (100.0%) | 89 (100.0%) |
Health & Disability in Farmington
Health Insurance Coverage by Age in Farmington
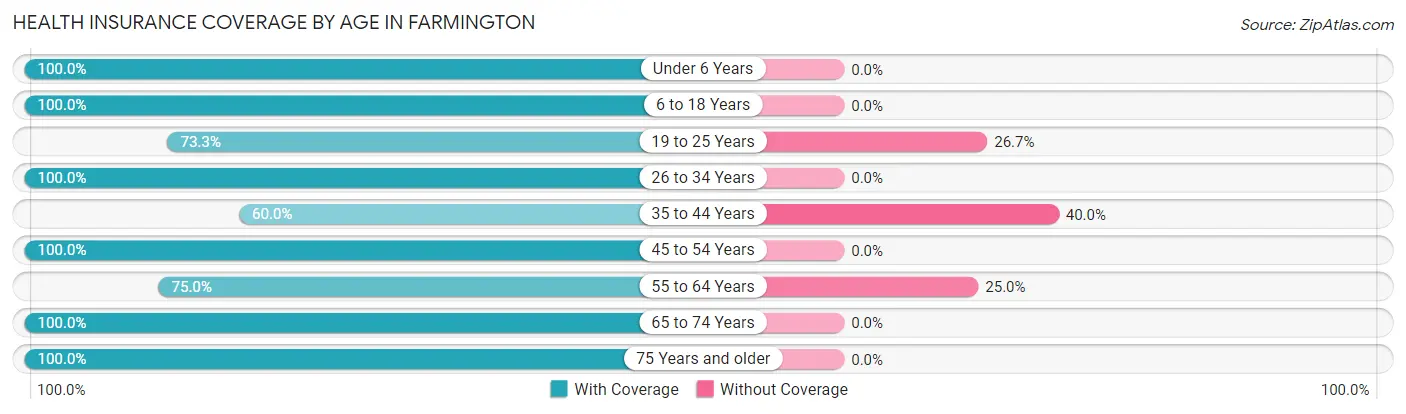
| Age Bracket | With Coverage | Without Coverage |
| Under 6 Years | 20 (100.0%) | 0 (0.0%) |
| 6 to 18 Years | 25 (100.0%) | 0 (0.0%) |
| 19 to 25 Years | 11 (73.3%) | 4 (26.7%) |
| 26 to 34 Years | 37 (100.0%) | 0 (0.0%) |
| 35 to 44 Years | 21 (60.0%) | 14 (40.0%) |
| 45 to 54 Years | 67 (100.0%) | 0 (0.0%) |
| 55 to 64 Years | 18 (75.0%) | 6 (25.0%) |
| 65 to 74 Years | 9 (100.0%) | 0 (0.0%) |
| 75 Years and older | 2 (100.0%) | 0 (0.0%) |
| Total | 210 (89.7%) | 24 (10.3%) |
Health Insurance Coverage by Citizenship Status in Farmington
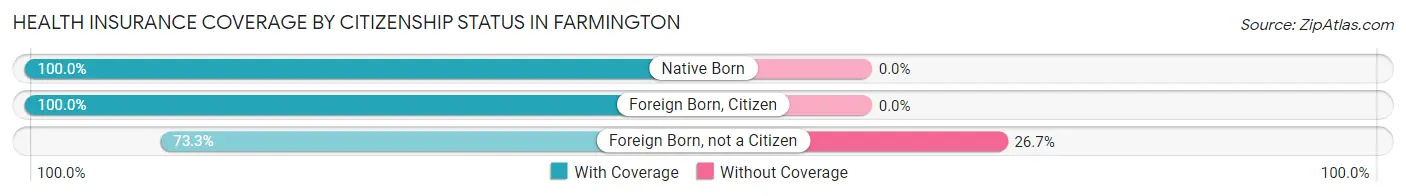
| Citizenship Status | With Coverage | Without Coverage |
| Native Born | 20 (100.0%) | 0 (0.0%) |
| Foreign Born, Citizen | 25 (100.0%) | 0 (0.0%) |
| Foreign Born, not a Citizen | 11 (73.3%) | 4 (26.7%) |
Health Insurance Coverage by Household Income in Farmington
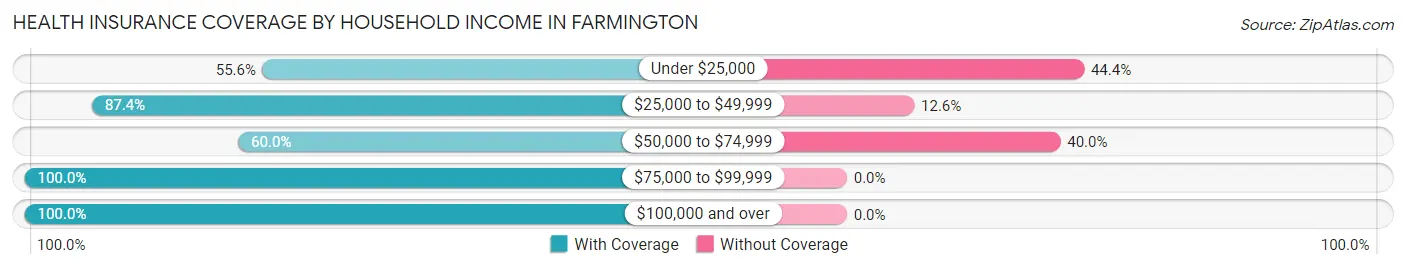
| Household Income | With Coverage | Without Coverage |
| Under $25,000 | 5 (55.6%) | 4 (44.4%) |
| $25,000 to $49,999 | 97 (87.4%) | 14 (12.6%) |
| $50,000 to $74,999 | 9 (60.0%) | 6 (40.0%) |
| $75,000 to $99,999 | 48 (100.0%) | 0 (0.0%) |
| $100,000 and over | 51 (100.0%) | 0 (0.0%) |
Public vs Private Health Insurance Coverage by Age in Farmington
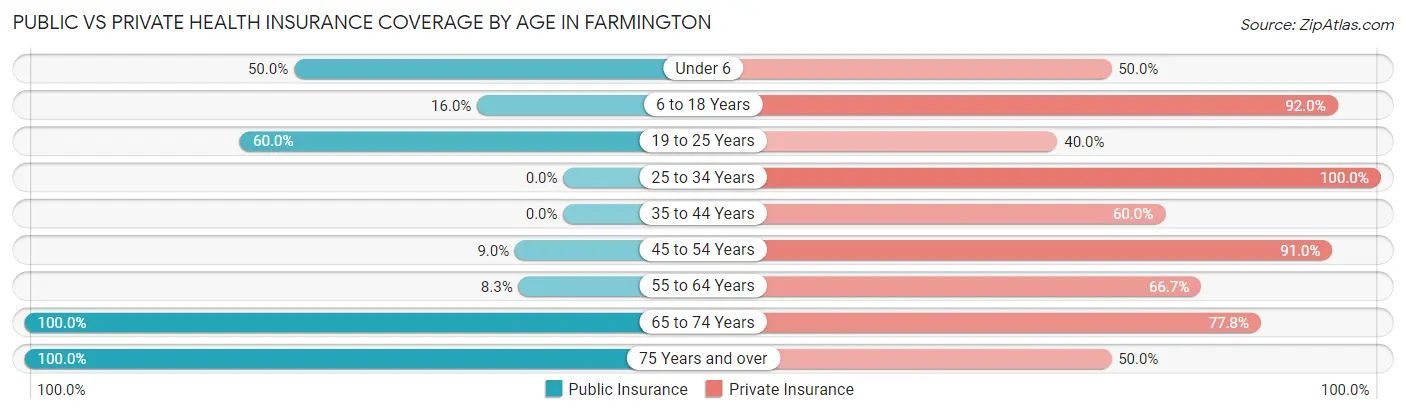
| Age Bracket | Public Insurance | Private Insurance |
| Under 6 | 10 (50.0%) | 10 (50.0%) |
| 6 to 18 Years | 4 (16.0%) | 23 (92.0%) |
| 19 to 25 Years | 9 (60.0%) | 6 (40.0%) |
| 25 to 34 Years | 0 (0.0%) | 37 (100.0%) |
| 35 to 44 Years | 0 (0.0%) | 21 (60.0%) |
| 45 to 54 Years | 6 (9.0%) | 61 (91.0%) |
| 55 to 64 Years | 2 (8.3%) | 16 (66.7%) |
| 65 to 74 Years | 9 (100.0%) | 7 (77.8%) |
| 75 Years and over | 2 (100.0%) | 1 (50.0%) |
| Total | 42 (17.9%) | 182 (77.8%) |
Disability Status by Sex by Age in Farmington
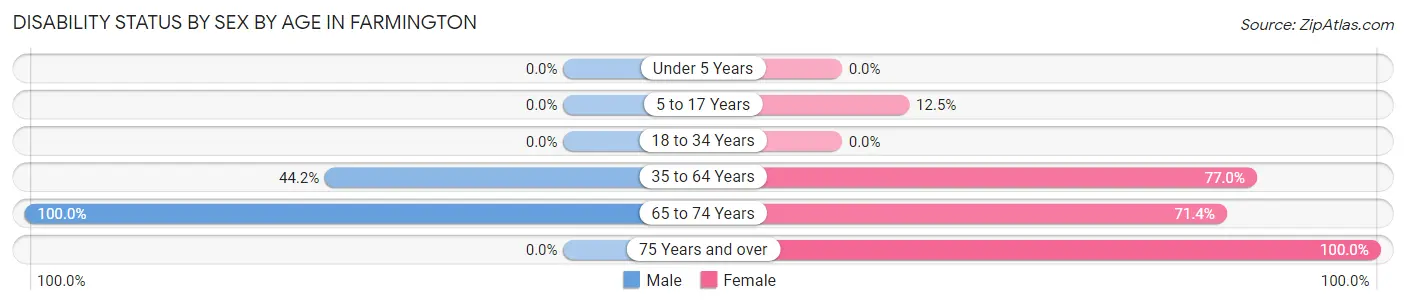
| Age Bracket | Male | Female |
| Under 5 Years | 0 (0.0%) | 0 (0.0%) |
| 5 to 17 Years | 0 (0.0%) | 2 (12.5%) |
| 18 to 34 Years | 0 (0.0%) | 0 (0.0%) |
| 35 to 64 Years | 23 (44.2%) | 57 (77.0%) |
| 65 to 74 Years | 2 (100.0%) | 5 (71.4%) |
| 75 Years and over | 0 (0.0%) | 1 (100.0%) |
Disability Class by Sex by Age in Farmington
Disability Class: Hearing Difficulty
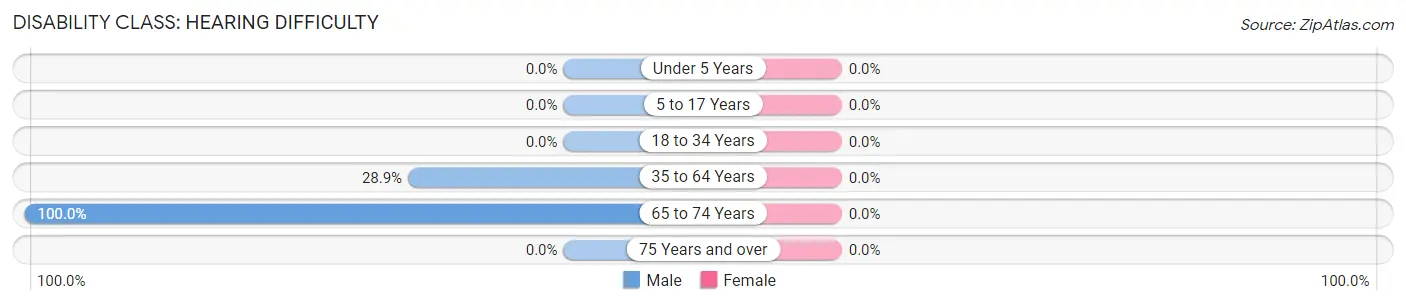
| Age Bracket | Male | Female |
| Under 5 Years | 0 (0.0%) | 0 (0.0%) |
| 5 to 17 Years | 0 (0.0%) | 0 (0.0%) |
| 18 to 34 Years | 0 (0.0%) | 0 (0.0%) |
| 35 to 64 Years | 15 (28.8%) | 0 (0.0%) |
| 65 to 74 Years | 2 (100.0%) | 0 (0.0%) |
| 75 Years and over | 0 (0.0%) | 0 (0.0%) |
Disability Class: Vision Difficulty
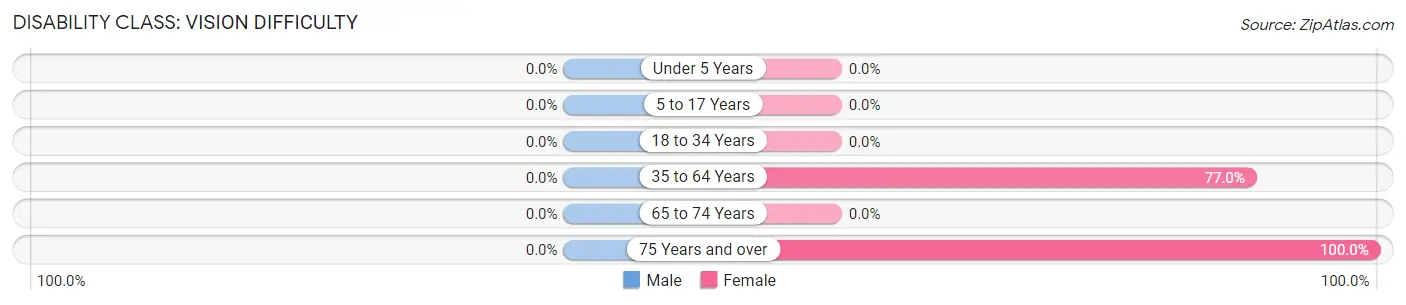
| Age Bracket | Male | Female |
| Under 5 Years | 0 (0.0%) | 0 (0.0%) |
| 5 to 17 Years | 0 (0.0%) | 0 (0.0%) |
| 18 to 34 Years | 0 (0.0%) | 0 (0.0%) |
| 35 to 64 Years | 0 (0.0%) | 57 (77.0%) |
| 65 to 74 Years | 0 (0.0%) | 0 (0.0%) |
| 75 Years and over | 0 (0.0%) | 1 (100.0%) |
Disability Class: Cognitive Difficulty
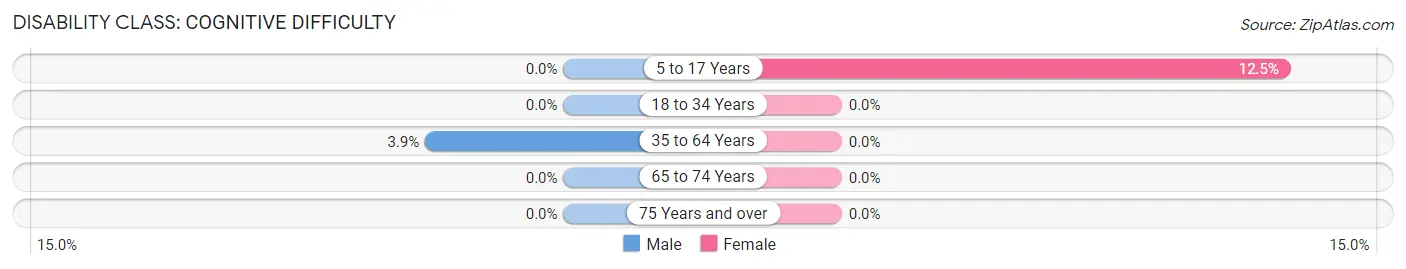
| Age Bracket | Male | Female |
| 5 to 17 Years | 0 (0.0%) | 2 (12.5%) |
| 18 to 34 Years | 0 (0.0%) | 0 (0.0%) |
| 35 to 64 Years | 2 (3.8%) | 0 (0.0%) |
| 65 to 74 Years | 0 (0.0%) | 0 (0.0%) |
| 75 Years and over | 0 (0.0%) | 0 (0.0%) |
Disability Class: Ambulatory Difficulty
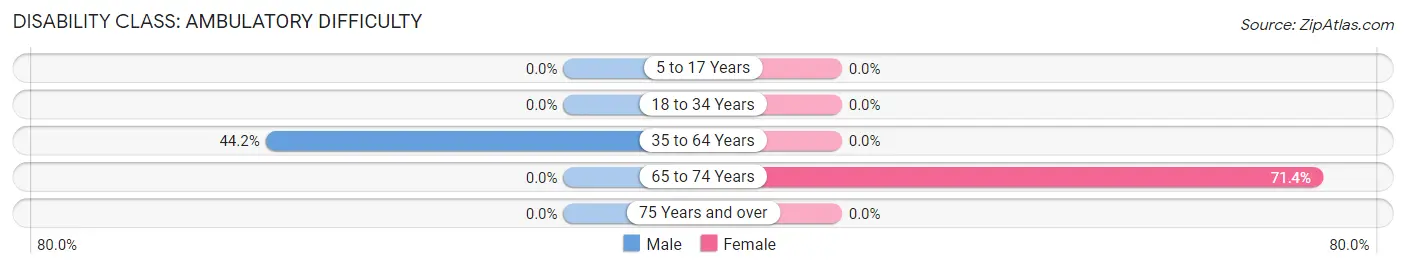
| Age Bracket | Male | Female |
| 5 to 17 Years | 0 (0.0%) | 0 (0.0%) |
| 18 to 34 Years | 0 (0.0%) | 0 (0.0%) |
| 35 to 64 Years | 23 (44.2%) | 0 (0.0%) |
| 65 to 74 Years | 0 (0.0%) | 5 (71.4%) |
| 75 Years and over | 0 (0.0%) | 0 (0.0%) |
Disability Class: Self-Care Difficulty
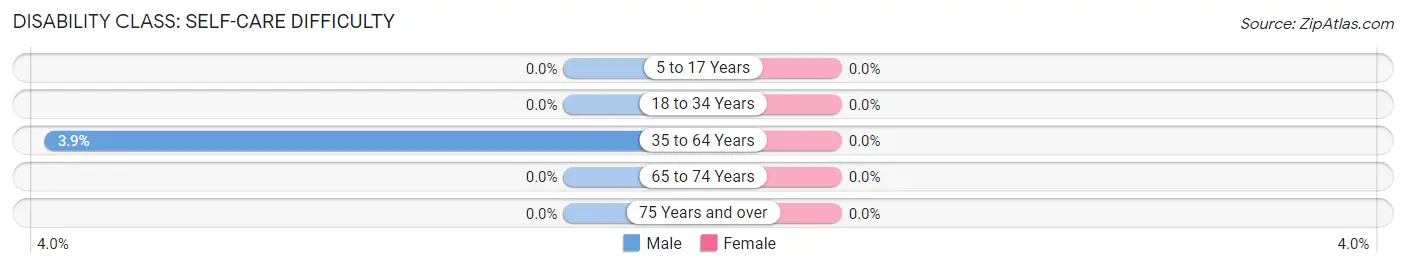
| Age Bracket | Male | Female |
| 5 to 17 Years | 0 (0.0%) | 0 (0.0%) |
| 18 to 34 Years | 0 (0.0%) | 0 (0.0%) |
| 35 to 64 Years | 2 (3.8%) | 0 (0.0%) |
| 65 to 74 Years | 0 (0.0%) | 0 (0.0%) |
| 75 Years and over | 0 (0.0%) | 0 (0.0%) |
Technology Access in Farmington
Computing Device Access in Farmington
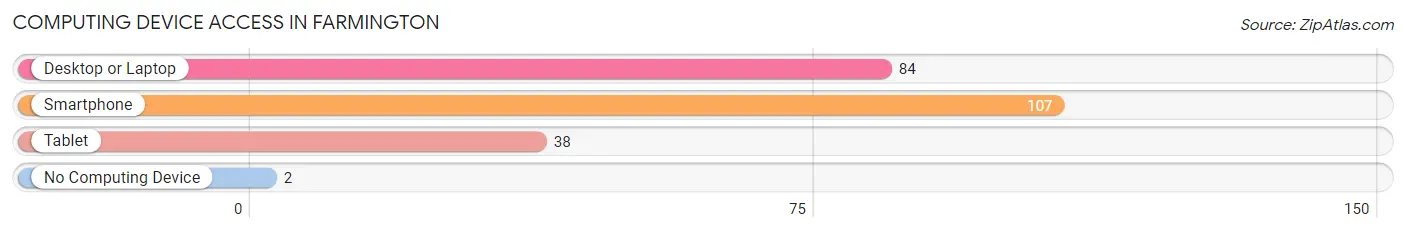
| Device Type | # Households | % Households |
| Desktop or Laptop | 84 | 77.1% |
| Smartphone | 107 | 98.2% |
| Tablet | 38 | 34.9% |
| No Computing Device | 2 | 1.8% |
| Total | 109 | 100.0% |
Internet Access in Farmington
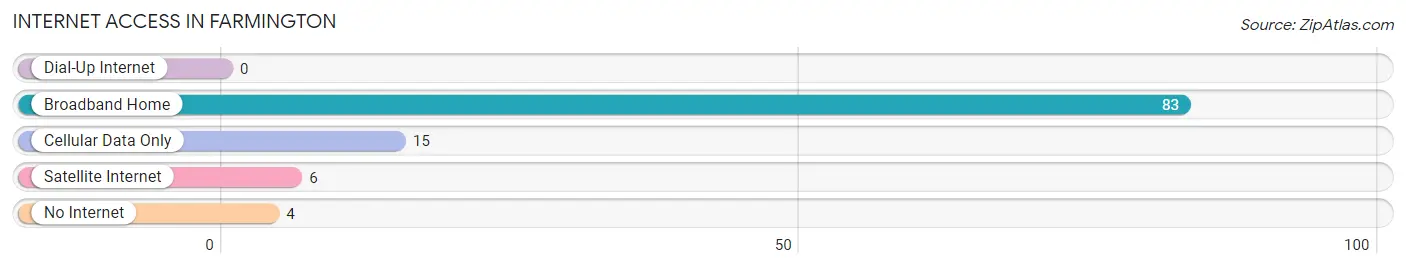
| Internet Type | # Households | % Households |
| Dial-Up Internet | 0 | 0.0% |
| Broadband Home | 83 | 76.1% |
| Cellular Data Only | 15 | 13.8% |
| Satellite Internet | 6 | 5.5% |
| No Internet | 4 | 3.7% |
| Total | 109 | 100.0% |
Farmington Summary
History
The area now known as Farmington, Delaware was first settled in the late 1600s by English and Dutch settlers. The town was originally known as “Farmingtown” and was part of the original New Castle County. The town was officially incorporated in 1819 and was named after the farming community that had grown up in the area.
The town of Farmington has a long and rich history. During the Revolutionary War, the town was a major supply center for the Continental Army. In the early 1800s, the town was a major stop on the Underground Railroad, providing a safe haven for escaped slaves.
In the late 1800s, the town was a major center for the production of tobacco and other agricultural products. The town was also home to several mills, including a paper mill, a grist mill, and a saw mill.
The town of Farmington has seen many changes over the years. In the early 1900s, the town was a major center for the production of poultry and eggs. In the 1950s, the town was home to a large number of chicken farms. In the 1970s, the town was home to a large number of manufacturing plants.
Today, the town of Farmington is a small, rural community with a population of just over 1,000 people. The town is home to several small businesses, including a grocery store, a hardware store, and a few restaurants.
Geography
Farmington is located in New Castle County, Delaware. The town is situated on the banks of the Christina River, about 25 miles south of Wilmington. The town is bordered by the towns of Newark, Middletown, and Townsend.
The town of Farmington covers an area of approximately 1.5 square miles. The town is located at an elevation of approximately 40 feet above sea level. The town is located in a humid subtropical climate zone, with hot, humid summers and mild winters.
Economy
The economy of Farmington is largely based on agriculture and manufacturing. The town is home to several small businesses, including a grocery store, a hardware store, and a few restaurants. The town is also home to several manufacturing plants, including a paper mill, a grist mill, and a saw mill.
The town is also home to several farms, including chicken farms, dairy farms, and vegetable farms. The town is also home to several wineries and breweries.
Demographics
As of the 2010 census, the population of Farmington was 1,072. The racial makeup of the town was 94.3% White, 2.2% African American, 0.3% Native American, 0.7% Asian, 0.1% Pacific Islander, 0.7% from other races, and 1.7% from two or more races. Hispanic or Latino of any race were 2.2% of the population.
The median household income in Farmington was $50,938, and the median family income was $60,000. The per capita income for the town was $25,938. About 8.3% of families and 10.2% of the population were below the poverty line, including 14.3% of those under age 18 and 5.3% of those age 65 or over.
Common Questions
What is Per Capita Income in Farmington?
Per Capita income in Farmington is $19,899.
What is Inequality or Gini Index in Farmington?
Inequality or Gini Index in Farmington is 0.34.
What is the Total Population of Farmington?
Total Population of Farmington is 234.
What is the Total Male Population of Farmington?
Total Male Population of Farmington is 109.
What is the Total Female Population of Farmington?
Total Female Population of Farmington is 125.
What is the Ratio of Males per 100 Females in Farmington?
There are 87.20 Males per 100 Females in Farmington.
What is the Ratio of Females per 100 Males in Farmington?
There are 114.68 Females per 100 Males in Farmington.
What is the Median Population Age in Farmington?
Median Population Age in Farmington is 35.8 Years.
What is the Average Family Size in Farmington
Average Family Size in Farmington is 2.1 People.
What is the Average Household Size in Farmington
Average Household Size in Farmington is 2.1 People.
How Large is the Labor Force in Farmington?
There are 145 People in the Labor Forcein in Farmington.
What is the Percentage of People in the Labor Force in Farmington?
76.7% of People are in the Labor Force in Farmington.
What is the Unemployment Rate in Farmington?
Unemployment Rate in Farmington is 39.3%.