Fort Green, FL Map & Demographics
Fort Green Map
Fort Green Overview
$26,166
PER CAPITA INCOME
$72,083
AVG FAMILY INCOME
$70,417
AVG HOUSEHOLD INCOME
0.20
INEQUALITY / GINI INDEX
105
TOTAL POPULATION
57
MALE POPULATION
48
FEMALE POPULATION
118.75
MALES / 100 FEMALES
84.21
FEMALES / 100 MALES
53.9
MEDIAN AGE
3.1
AVG FAMILY SIZE
2.8
AVG HOUSEHOLD SIZE
55
LABOR FORCE [ PEOPLE ]
56.7%
PERCENT IN LABOR FORCE
Income in Fort Green
Income Overview in Fort Green
Per Capita Income in Fort Green is $26,166, while median incomes of families and households are $72,083 and $70,417 respectively.
| Characteristic | Number | Measure |
| Per Capita Income | 105 | $26,166 |
| Median Family Income | 33 | $72,083 |
| Mean Family Income | 33 | $75,294 |
| Median Household Income | 37 | $70,417 |
| Mean Household Income | 37 | $70,195 |
| Income Deficit | 33 | $0 |
| Wage / Income Gap (%) | 105 | 0.00% |
| Wage / Income Gap ($) | 105 | 100.00¢ per $1 |
| Gini / Inequality Index | 105 | 0.20 |
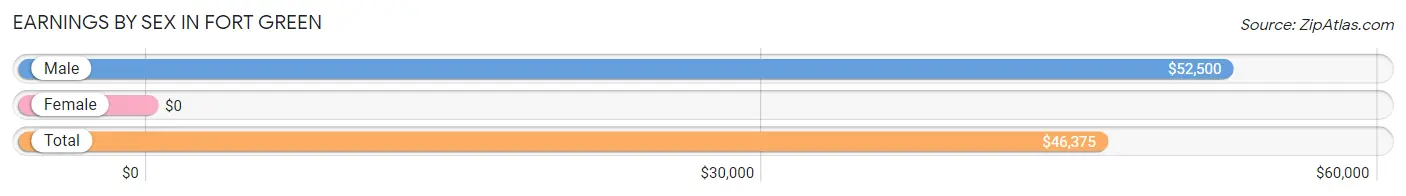
Earnings by Sex in Fort Green
| Sex | Number | Average Earnings |
| Male | 28 (50.9%) | $52,500 |
| Female | 27 (49.1%) | $0 |
| Total | 55 (100.0%) | $46,375 |
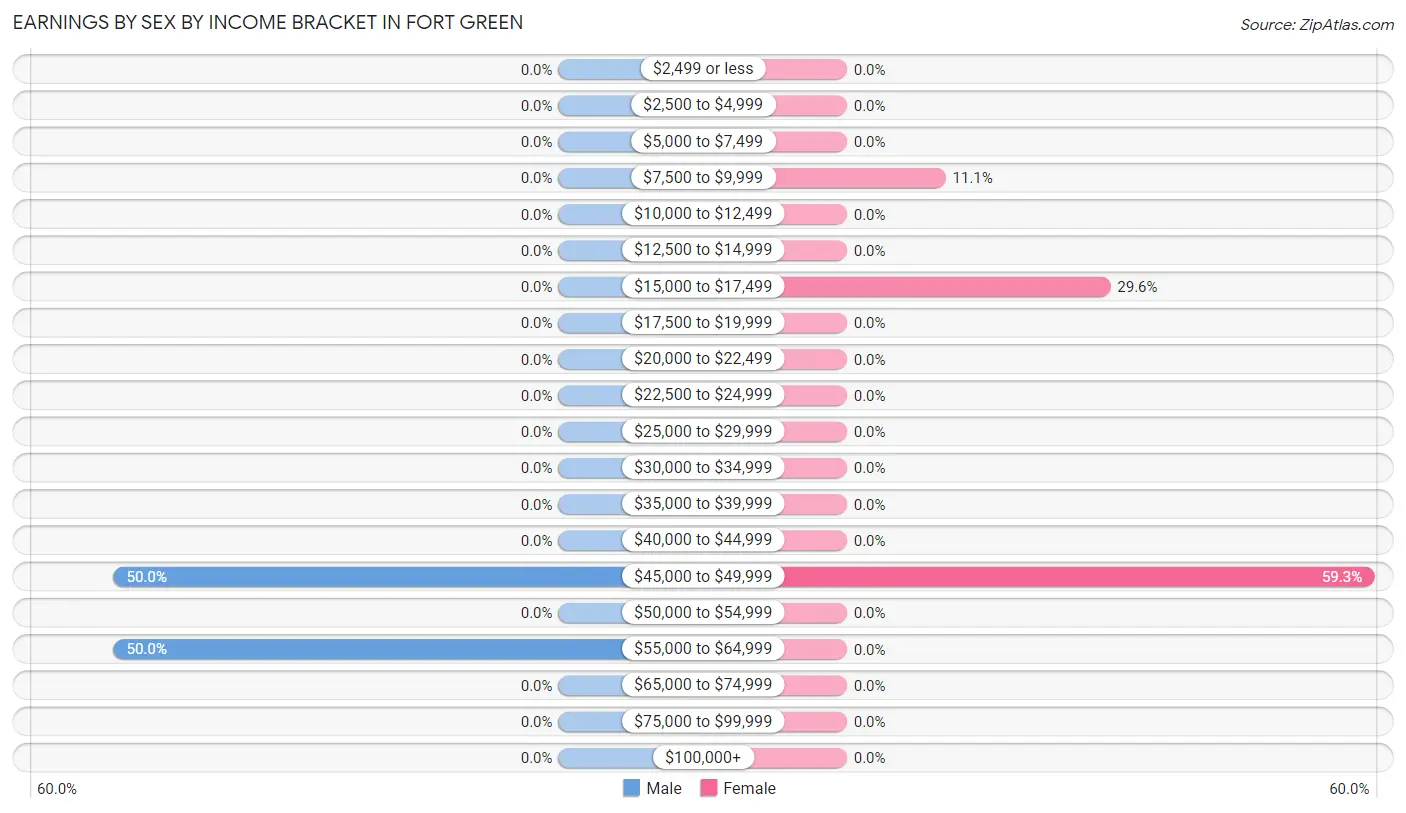
Earnings by Sex by Income Bracket in Fort Green
The most common earnings brackets in Fort Green are $45,000 to $49,999 for men (14 | 50.0%) and $45,000 to $49,999 for women (16 | 59.3%).
| Income | Male | Female |
| $2,499 or less | 0 (0.0%) | 0 (0.0%) |
| $2,500 to $4,999 | 0 (0.0%) | 0 (0.0%) |
| $5,000 to $7,499 | 0 (0.0%) | 0 (0.0%) |
| $7,500 to $9,999 | 0 (0.0%) | 3 (11.1%) |
| $10,000 to $12,499 | 0 (0.0%) | 0 (0.0%) |
| $12,500 to $14,999 | 0 (0.0%) | 0 (0.0%) |
| $15,000 to $17,499 | 0 (0.0%) | 8 (29.6%) |
| $17,500 to $19,999 | 0 (0.0%) | 0 (0.0%) |
| $20,000 to $22,499 | 0 (0.0%) | 0 (0.0%) |
| $22,500 to $24,999 | 0 (0.0%) | 0 (0.0%) |
| $25,000 to $29,999 | 0 (0.0%) | 0 (0.0%) |
| $30,000 to $34,999 | 0 (0.0%) | 0 (0.0%) |
| $35,000 to $39,999 | 0 (0.0%) | 0 (0.0%) |
| $40,000 to $44,999 | 0 (0.0%) | 0 (0.0%) |
| $45,000 to $49,999 | 14 (50.0%) | 16 (59.3%) |
| $50,000 to $54,999 | 0 (0.0%) | 0 (0.0%) |
| $55,000 to $64,999 | 14 (50.0%) | 0 (0.0%) |
| $65,000 to $74,999 | 0 (0.0%) | 0 (0.0%) |
| $75,000 to $99,999 | 0 (0.0%) | 0 (0.0%) |
| $100,000+ | 0 (0.0%) | 0 (0.0%) |
| Total | 28 (100.0%) | 27 (100.0%) |
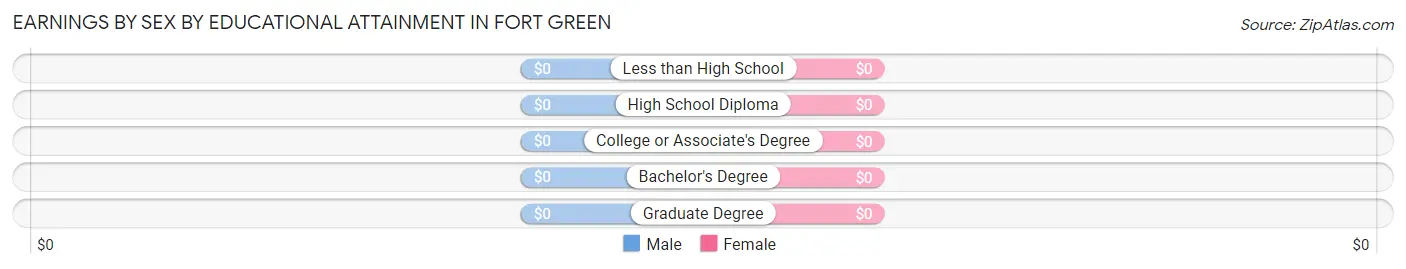
Earnings by Sex by Educational Attainment in Fort Green
| Educational Attainment | Male Income | Female Income |
| Less than High School | - | - |
| High School Diploma | - | - |
| College or Associate's Degree | - | - |
| Bachelor's Degree | - | - |
| Graduate Degree | - | - |
| Total | $52,500 | $0 |
Family Income in Fort Green
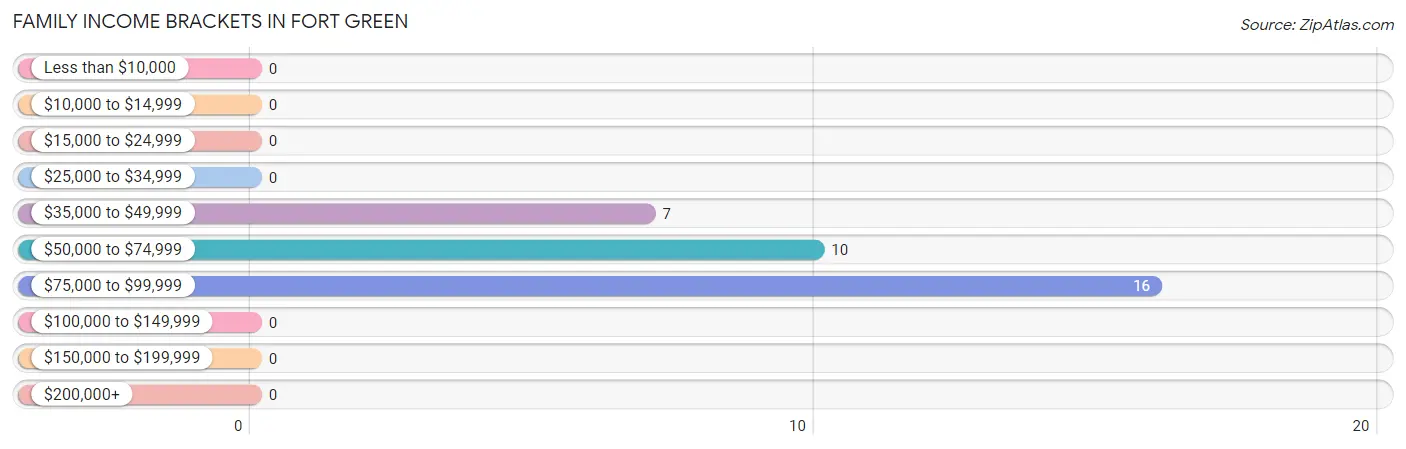
Family Income Brackets in Fort Green
According to the Fort Green family income data, there are 16 families falling into the $75,000 to $99,999 income range, which is the most common income bracket and makes up 48.5% of all families.
| Income Bracket | # Families | % Families |
| Less than $10,000 | 0 | 0.0% |
| $10,000 to $14,999 | 0 | 0.0% |
| $15,000 to $24,999 | 0 | 0.0% |
| $25,000 to $34,999 | 0 | 0.0% |
| $35,000 to $49,999 | 7 | 21.2% |
| $50,000 to $74,999 | 10 | 30.3% |
| $75,000 to $99,999 | 16 | 48.5% |
| $100,000 to $149,999 | 0 | 0.0% |
| $150,000 to $199,999 | 0 | 0.0% |
| $200,000+ | 0 | 0.0% |
Family Income by Famaliy Size in Fort Green
| Income Bracket | # Families | Median Income |
| 2-Person Families | 23 (69.7%) | $0 |
| 3-Person Families | 7 (21.2%) | $0 |
| 4-Person Families | 0 (0.0%) | $0 |
| 5-Person Families | 0 (0.0%) | $0 |
| 6-Person Families | 3 (9.1%) | $0 |
| 7+ Person Families | 0 (0.0%) | $0 |
| Total | 33 (100.0%) | $72,083 |
Family Income by Number of Earners in Fort Green
| Number of Earners | # Families | Median Income |
| No Earners | 0 (0.0%) | $0 |
| 1 Earner | 14 (42.4%) | $0 |
| 2 Earners | 19 (57.6%) | $0 |
| 3+ Earners | 0 (0.0%) | $0 |
| Total | 33 (100.0%) | $72,083 |
Household Income in Fort Green
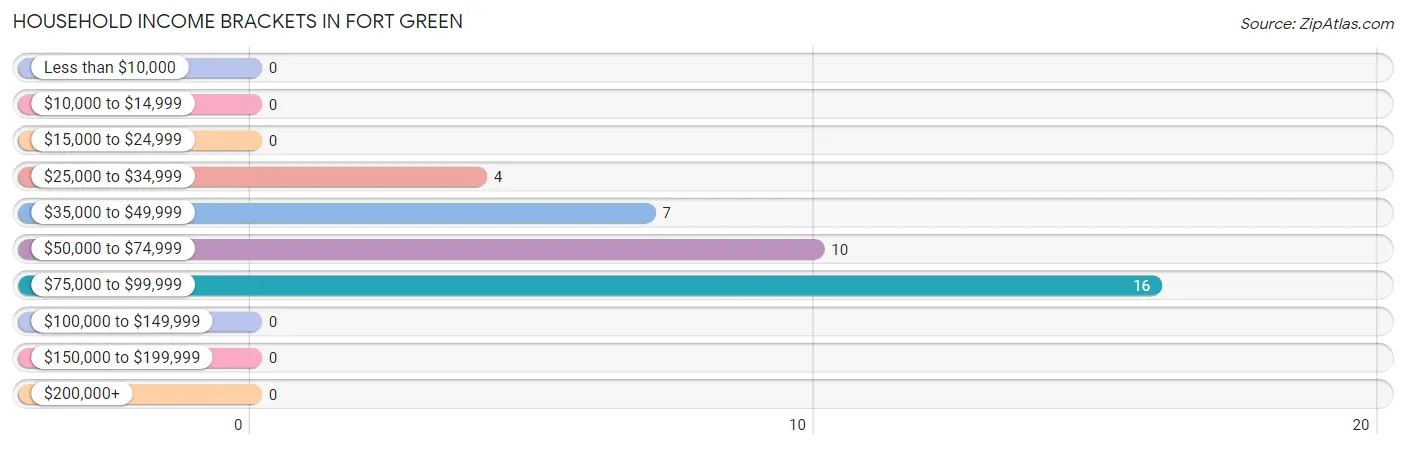
Household Income Brackets in Fort Green
With 16 households falling in the category, the $75,000 to $99,999 income range is the most frequent in Fort Green, accounting for 43.2% of all households.
| Income Bracket | # Households | % Households |
| Less than $10,000 | 0 | 0.0% |
| $10,000 to $14,999 | 0 | 0.0% |
| $15,000 to $24,999 | 0 | 0.0% |
| $25,000 to $34,999 | 4 | 10.8% |
| $35,000 to $49,999 | 7 | 18.9% |
| $50,000 to $74,999 | 10 | 27.0% |
| $75,000 to $99,999 | 16 | 43.2% |
| $100,000 to $149,999 | 0 | 0.0% |
| $150,000 to $199,999 | 0 | 0.0% |
| $200,000+ | 0 | 0.0% |
Household Income by Householder Age in Fort Green
The median household income in Fort Green is $70,417, with the highest median household income of $72,083 found in the 45 to 64 years age bracket for the primary householder. A total of 33 households (89.2%) fall into this category.
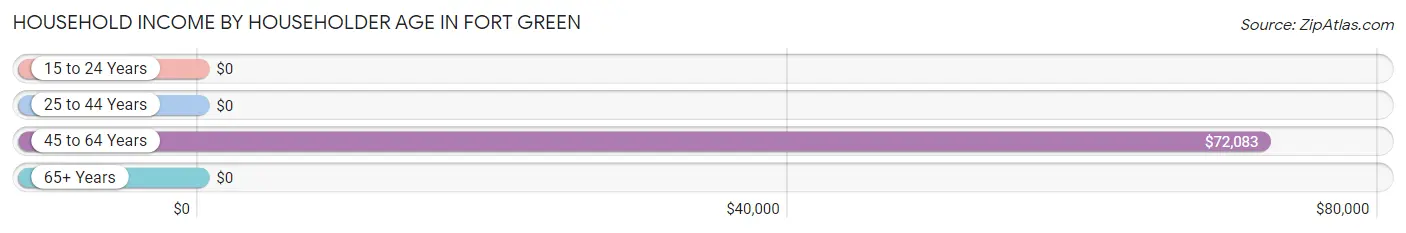
| Income Bracket | # Households | Median Income |
| 15 to 24 Years | 0 (0.0%) | $0 |
| 25 to 44 Years | 0 (0.0%) | $0 |
| 45 to 64 Years | 33 (89.2%) | $72,083 |
| 65+ Years | 4 (10.8%) | $0 |
| Total | 37 (100.0%) | $70,417 |
Poverty in Fort Green
Income Below Poverty by Sex and Age in Fort Green
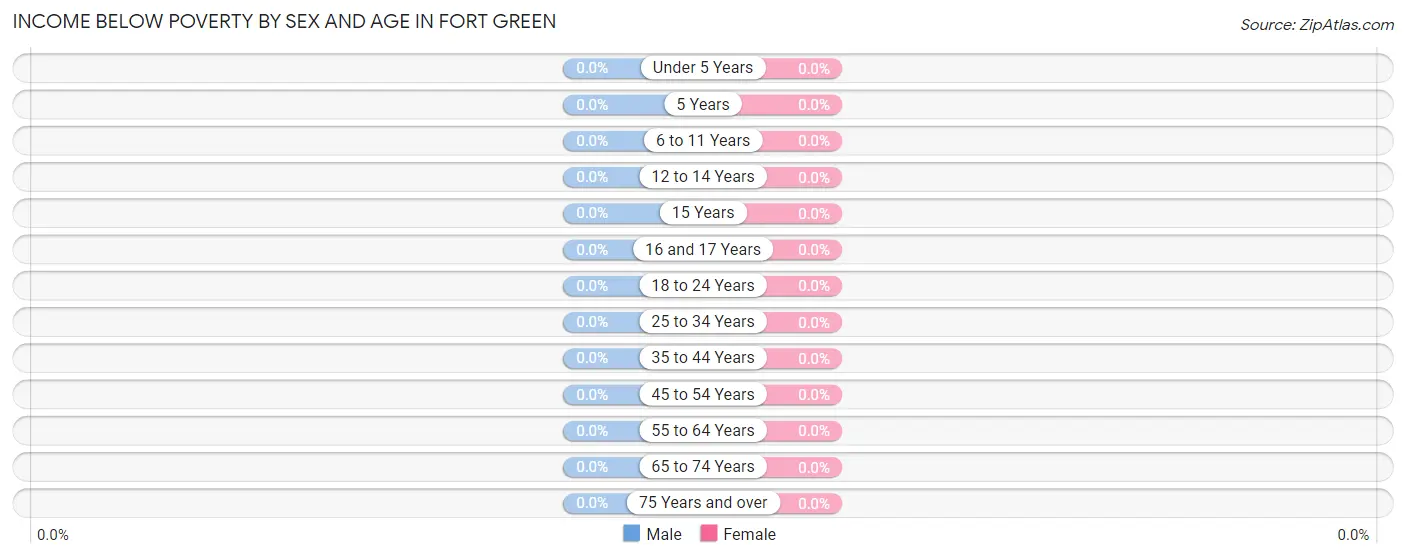
| Age Bracket | Male | Female |
| Under 5 Years | 0 (0.0%) | 0 (0.0%) |
| 5 Years | 0 (0.0%) | 0 (0.0%) |
| 6 to 11 Years | 0 (0.0%) | 0 (0.0%) |
| 12 to 14 Years | 0 (0.0%) | 0 (0.0%) |
| 15 Years | 0 (0.0%) | 0 (0.0%) |
| 16 and 17 Years | 0 (0.0%) | 0 (0.0%) |
| 18 to 24 Years | 0 (0.0%) | 0 (0.0%) |
| 25 to 34 Years | 0 (0.0%) | 0 (0.0%) |
| 35 to 44 Years | 0 (0.0%) | 0 (0.0%) |
| 45 to 54 Years | 0 (0.0%) | 0 (0.0%) |
| 55 to 64 Years | 0 (0.0%) | 0 (0.0%) |
| 65 to 74 Years | 0 (0.0%) | 0 (0.0%) |
| 75 Years and over | 0 (0.0%) | 0 (0.0%) |
| Total | 0 (0.0%) | 0 (0.0%) |
Income Above Poverty by Sex and Age in Fort Green
According to the poverty statistics in Fort Green, males aged 6 to 11 years and females aged 15 years are the age groups that are most secure financially, with 100.0% of males and 100.0% of females in these age groups living above the poverty line.
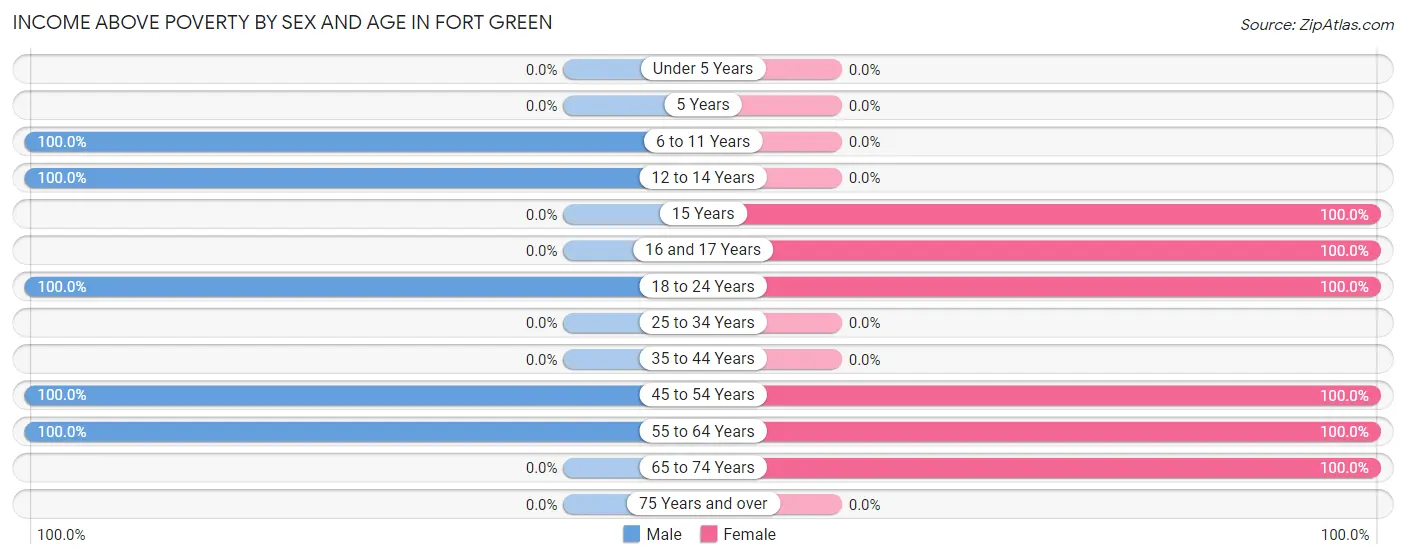
| Age Bracket | Male | Female |
| Under 5 Years | 0 (0.0%) | 0 (0.0%) |
| 5 Years | 0 (0.0%) | 0 (0.0%) |
| 6 to 11 Years | 3 (100.0%) | 0 (0.0%) |
| 12 to 14 Years | 3 (100.0%) | 0 (0.0%) |
| 15 Years | 0 (0.0%) | 2 (100.0%) |
| 16 and 17 Years | 0 (0.0%) | 1 (100.0%) |
| 18 to 24 Years | 23 (100.0%) | 8 (100.0%) |
| 25 to 34 Years | 0 (0.0%) | 0 (0.0%) |
| 35 to 44 Years | 0 (0.0%) | 0 (0.0%) |
| 45 to 54 Years | 14 (100.0%) | 10 (100.0%) |
| 55 to 64 Years | 14 (100.0%) | 23 (100.0%) |
| 65 to 74 Years | 0 (0.0%) | 4 (100.0%) |
| 75 Years and over | 0 (0.0%) | 0 (0.0%) |
| Total | 57 (100.0%) | 48 (100.0%) |
Income Below Poverty Among Married-Couple Families in Fort Green
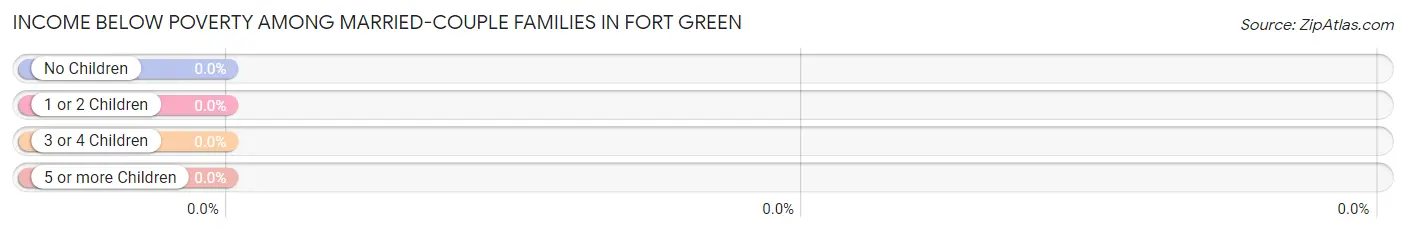
| Children | Above Poverty | Below Poverty |
| No Children | 23 (100.0%) | 0 (0.0%) |
| 1 or 2 Children | 0 (0.0%) | 0 (0.0%) |
| 3 or 4 Children | 3 (100.0%) | 0 (0.0%) |
| 5 or more Children | 0 (0.0%) | 0 (0.0%) |
| Total | 26 (100.0%) | 0 (0.0%) |
Income Below Poverty Among Single-Parent Households in Fort Green
| Children | Single Father | Single Mother |
| No Children | 0 (0.0%) | 0 (0.0%) |
| 1 or 2 Children | 0 (0.0%) | 0 (0.0%) |
| 3 or 4 Children | 0 (0.0%) | 0 (0.0%) |
| 5 or more Children | 0 (0.0%) | 0 (0.0%) |
| Total | 0 (0.0%) | 0 (0.0%) |
Income Below Poverty Among Married-Couple vs Single-Parent Households in Fort Green
| Children | Married-Couple Families | Single-Parent Households |
| No Children | 0 (0.0%) | 0 (0.0%) |
| 1 or 2 Children | 0 (0.0%) | 0 (0.0%) |
| 3 or 4 Children | 0 (0.0%) | 0 (0.0%) |
| 5 or more Children | 0 (0.0%) | 0 (0.0%) |
| Total | 0 (0.0%) | 0 (0.0%) |
Race in Fort Green
The most populous races in Fort Green are , and White / Caucasian (105 | 100.0%).
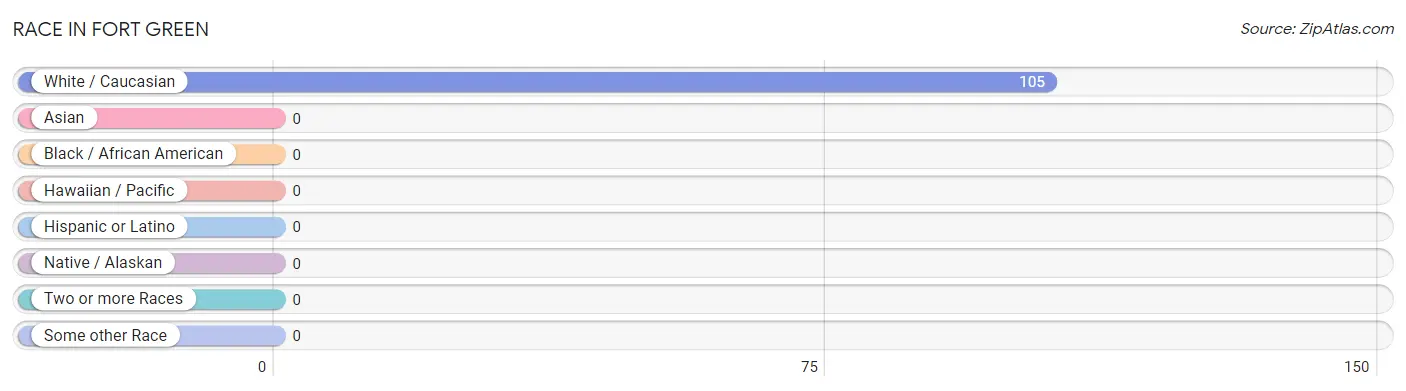
| Race | # Population | % Population |
| Asian | 0 | 0.0% |
| Black / African American | 0 | 0.0% |
| Hawaiian / Pacific | 0 | 0.0% |
| Hispanic or Latino | 0 | 0.0% |
| Native / Alaskan | 0 | 0.0% |
| White / Caucasian | 105 | 100.0% |
| Two or more Races | 0 | 0.0% |
| Some other Race | 0 | 0.0% |
| Total | 105 | 100.0% |
Ancestry in Fort Green
The most populous ancestries reported in Fort Green are American (21 | 20.0%), German (3 | 2.9%), and Irish (3 | 2.9%), together accounting for 25.7% of all Fort Green residents.
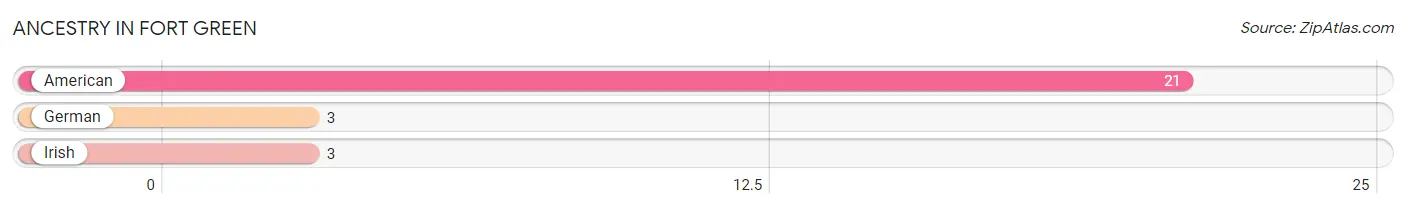
| Ancestry | # Population | % Population |
| American | 21 | 20.0% |
| German | 3 | 2.9% |
| Irish | 3 | 2.9% | View All 3 Rows |
Immigrants in Fort Green

| Immigration Origin | # Population | % Population | View All 0 Rows |
Sex and Age in Fort Green
Sex and Age in Fort Green
The most populous age groups in Fort Green are 20 to 24 Years (23 | 40.4%) for men and 55 to 59 Years (16 | 33.3%) for women.
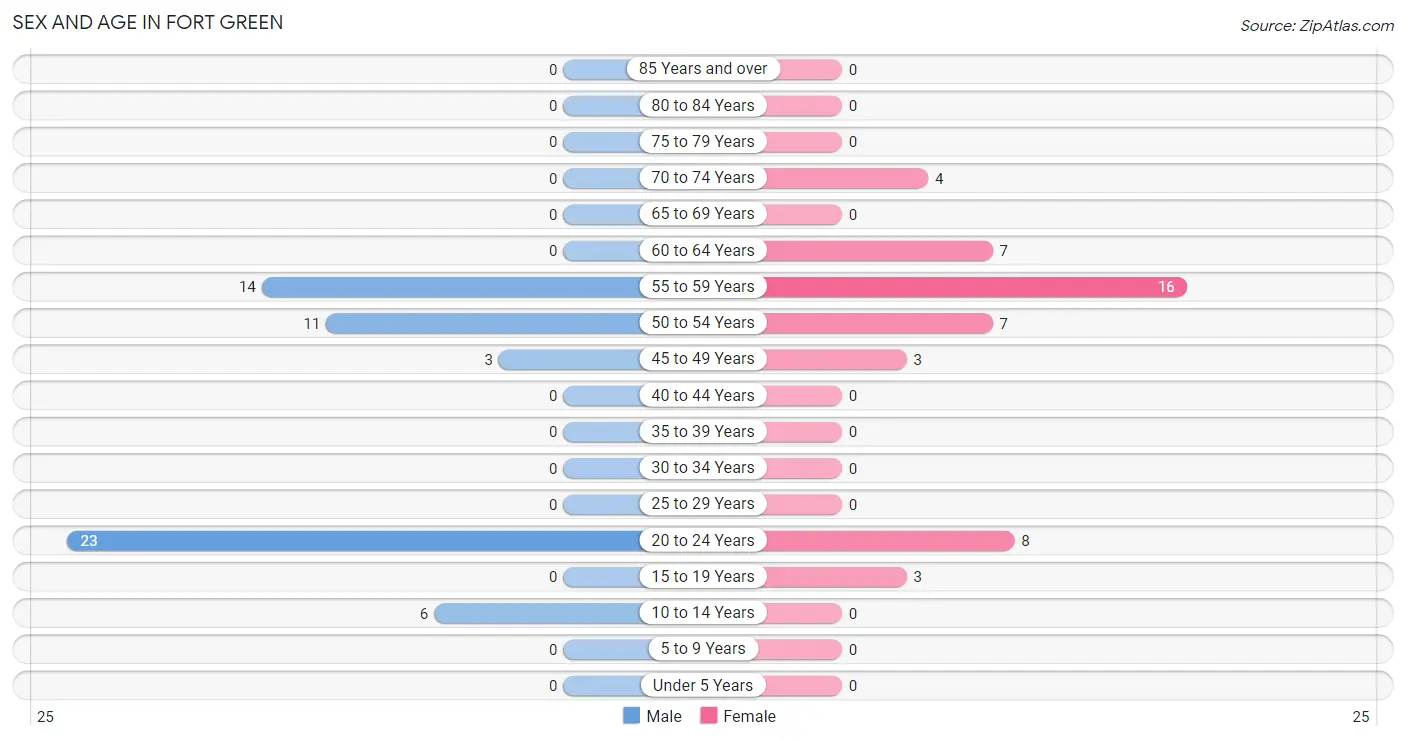
| Age Bracket | Male | Female |
| Under 5 Years | 0 (0.0%) | 0 (0.0%) |
| 5 to 9 Years | 0 (0.0%) | 0 (0.0%) |
| 10 to 14 Years | 6 (10.5%) | 0 (0.0%) |
| 15 to 19 Years | 0 (0.0%) | 3 (6.2%) |
| 20 to 24 Years | 23 (40.4%) | 8 (16.7%) |
| 25 to 29 Years | 0 (0.0%) | 0 (0.0%) |
| 30 to 34 Years | 0 (0.0%) | 0 (0.0%) |
| 35 to 39 Years | 0 (0.0%) | 0 (0.0%) |
| 40 to 44 Years | 0 (0.0%) | 0 (0.0%) |
| 45 to 49 Years | 3 (5.3%) | 3 (6.2%) |
| 50 to 54 Years | 11 (19.3%) | 7 (14.6%) |
| 55 to 59 Years | 14 (24.6%) | 16 (33.3%) |
| 60 to 64 Years | 0 (0.0%) | 7 (14.6%) |
| 65 to 69 Years | 0 (0.0%) | 0 (0.0%) |
| 70 to 74 Years | 0 (0.0%) | 4 (8.3%) |
| 75 to 79 Years | 0 (0.0%) | 0 (0.0%) |
| 80 to 84 Years | 0 (0.0%) | 0 (0.0%) |
| 85 Years and over | 0 (0.0%) | 0 (0.0%) |
| Total | 57 (100.0%) | 48 (100.0%) |
Families and Households in Fort Green
Median Family Size in Fort Green
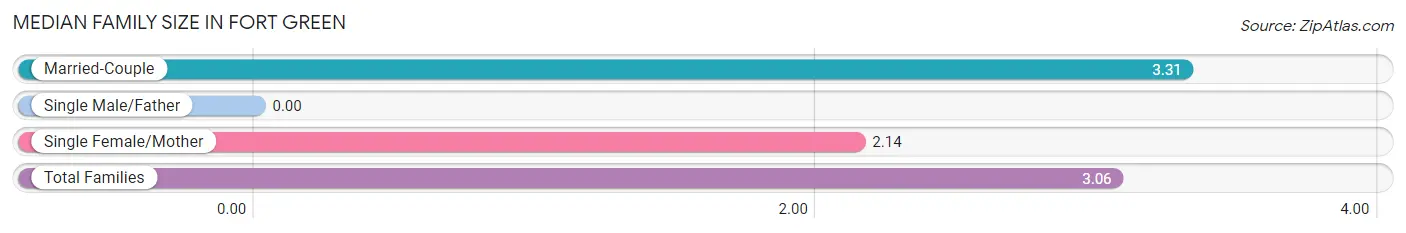
| Family Type | # Families | Family Size |
| Married-Couple | 26 (78.8%) | 3.31 |
| Single Male/Father | 0 (0.0%) | - |
| Single Female/Mother | 7 (21.2%) | 2.14 |
| Total Families | 33 (100.0%) | 3.06 |
Median Household Size in Fort Green
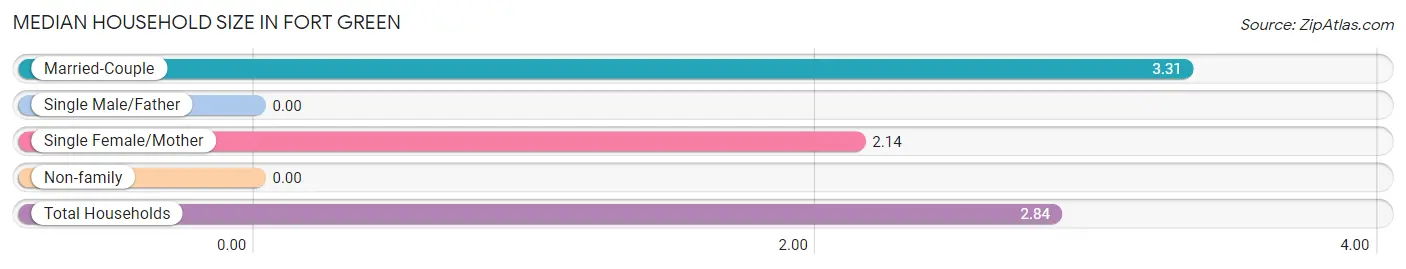
| Household Type | # Households | Household Size |
| Married-Couple | 26 (70.3%) | 3.31 |
| Single Male/Father | 0 (0.0%) | - |
| Single Female/Mother | 7 (18.9%) | 2.14 |
| Non-family | 4 (10.8%) | - |
| Total Households | 37 (100.0%) | 2.84 |
Household Size by Marriage Status in Fort Green
Out of a total of 37 households in Fort Green, 33 (89.2%) are family households, while 4 (10.8%) are nonfamily households. The most numerous type of family households are 2-person households, comprising 23, and the most common type of nonfamily households are 1-person households, comprising 4.
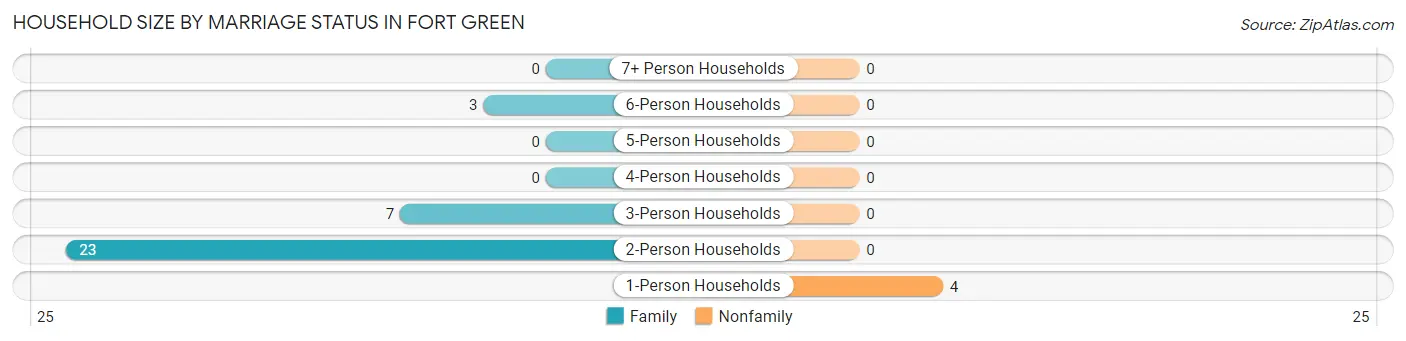
| Household Size | Family Households | Nonfamily Households |
| 1-Person Households | - | 4 (10.8%) |
| 2-Person Households | 23 (62.2%) | 0 (0.0%) |
| 3-Person Households | 7 (18.9%) | 0 (0.0%) |
| 4-Person Households | 0 (0.0%) | 0 (0.0%) |
| 5-Person Households | 0 (0.0%) | 0 (0.0%) |
| 6-Person Households | 3 (8.1%) | 0 (0.0%) |
| 7+ Person Households | 0 (0.0%) | 0 (0.0%) |
| Total | 33 (89.2%) | 4 (10.8%) |
Female Fertility in Fort Green
Fertility by Age in Fort Green
| Age Bracket | Women with Births | Births / 1,000 Women |
| 15 to 19 years | 0 (0.0%) | 0.0 |
| 20 to 34 years | 0 (0.0%) | 0.0 |
| 35 to 50 years | 0 (0.0%) | 0.0 |
| Total | 0 (0.0%) | 0.0 |
Fertility by Age by Marriage Status in Fort Green
| Age Bracket | Married | Unmarried |
| 15 to 19 years | 0 (0.0%) | 0 (0.0%) |
| 20 to 34 years | 0 (0.0%) | 0 (0.0%) |
| 35 to 50 years | 0 (0.0%) | 0 (0.0%) |
| Total | 0 (0.0%) | 0 (0.0%) |
Fertility by Education in Fort Green
| Educational Attainment | Women with Births | Births / 1,000 Women |
| Less than High School | 0 (0.0%) | 0.0 |
| High School Diploma | 0 (0.0%) | 0.0 |
| College or Associate's Degree | 0 (0.0%) | 0.0 |
| Bachelor's Degree | 0 (0.0%) | 0.0 |
| Graduate Degree | 0 (0.0%) | 0.0 |
| Total | 0 (0.0%) | 0.0 |
Fertility by Education by Marriage Status in Fort Green
| Educational Attainment | Married | Unmarried |
| Less than High School | 0 (0.0%) | 0 (0.0%) |
| High School Diploma | 0 (0.0%) | 0 (0.0%) |
| College or Associate's Degree | 0 (0.0%) | 0 (0.0%) |
| Bachelor's Degree | 0 (0.0%) | 0 (0.0%) |
| Graduate Degree | 0 (0.0%) | 0 (0.0%) |
| Total | 0 (0.0%) | 0 (0.0%) |
Employment Characteristics in Fort Green
Employment by Class of Employer in Fort Green
Among the 55 employed individuals in Fort Green, private company employees (36 | 65.4%), and state government employees (19 | 34.5%) make up the most common classes of employment.
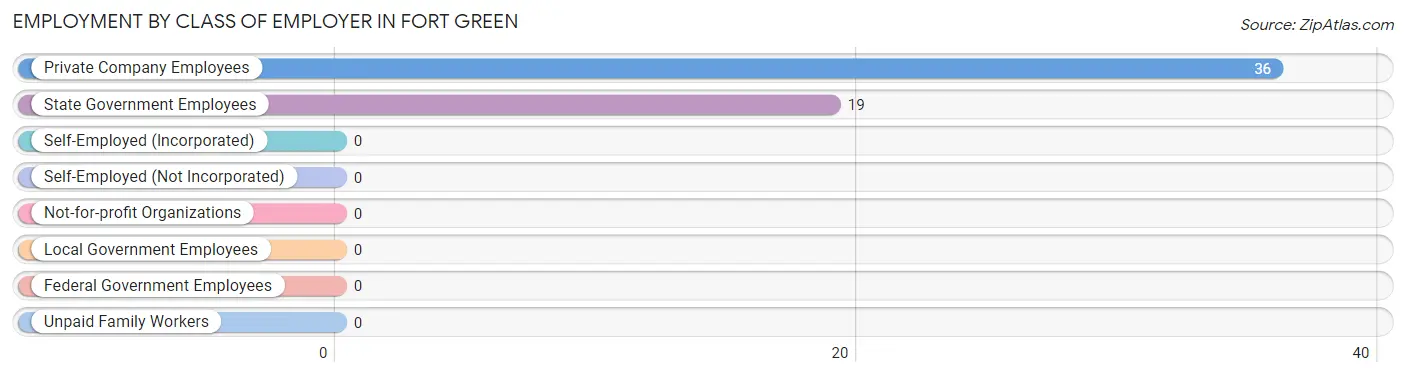
| Employer Class | # Employees | % Employees |
| Private Company Employees | 36 | 65.4% |
| Self-Employed (Incorporated) | 0 | 0.0% |
| Self-Employed (Not Incorporated) | 0 | 0.0% |
| Not-for-profit Organizations | 0 | 0.0% |
| Local Government Employees | 0 | 0.0% |
| State Government Employees | 19 | 34.5% |
| Federal Government Employees | 0 | 0.0% |
| Unpaid Family Workers | 0 | 0.0% |
| Total | 55 | 100.0% |
Employment Status by Age in Fort Green
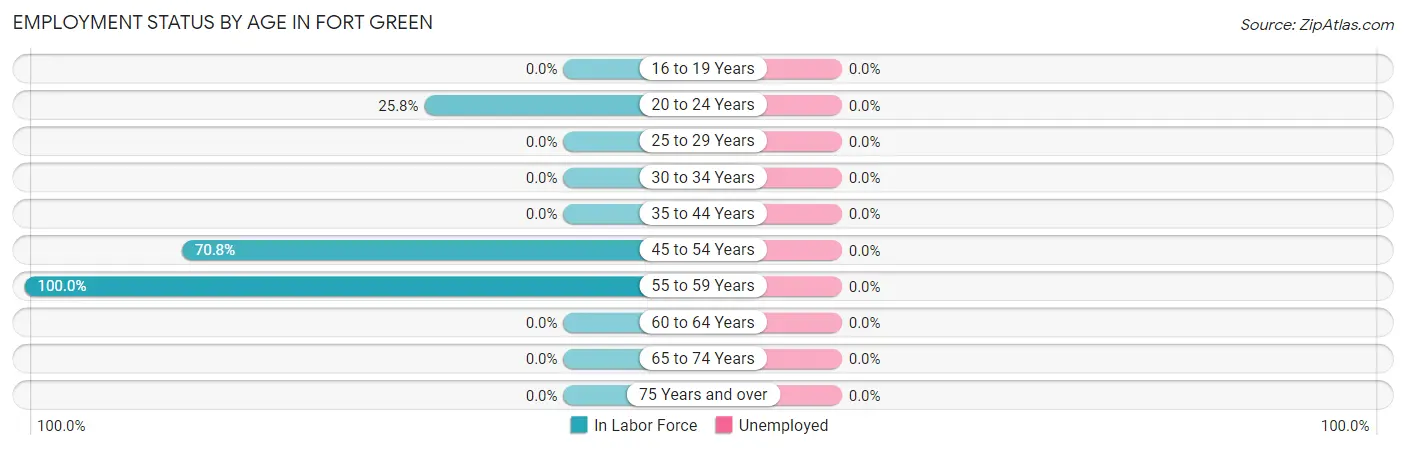
| Age Bracket | In Labor Force | Unemployed |
| 16 to 19 Years | 0 (0.0%) | 0 (0.0%) |
| 20 to 24 Years | 8 (25.8%) | 0 (0.0%) |
| 25 to 29 Years | 0 (0.0%) | 0 (0.0%) |
| 30 to 34 Years | 0 (0.0%) | 0 (0.0%) |
| 35 to 44 Years | 0 (0.0%) | 0 (0.0%) |
| 45 to 54 Years | 17 (70.8%) | 0 (0.0%) |
| 55 to 59 Years | 30 (100.0%) | 0 (0.0%) |
| 60 to 64 Years | 0 (0.0%) | 0 (0.0%) |
| 65 to 74 Years | 0 (0.0%) | 0 (0.0%) |
| 75 Years and over | 0 (0.0%) | 0 (0.0%) |
| Total | 55 (56.7%) | 0 (0.0%) |
Employment Status by Educational Attainment in Fort Green
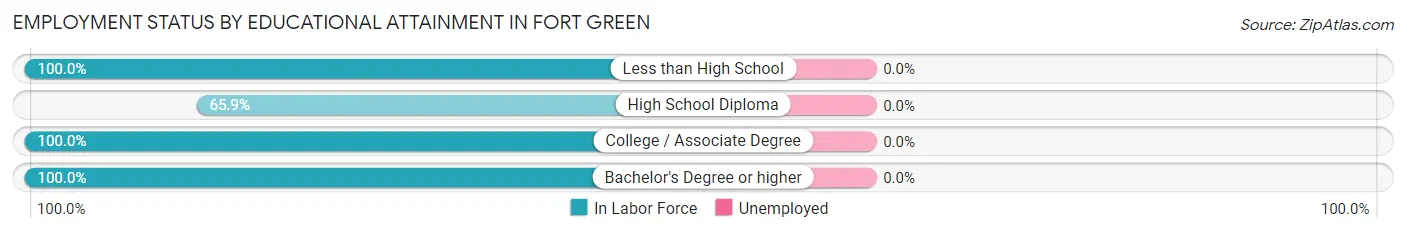
| Educational Attainment | In Labor Force | Unemployed |
| Less than High School | 14 (100.0%) | 0 (0.0%) |
| High School Diploma | 27 (65.9%) | 0 (0.0%) |
| College / Associate Degree | 3 (100.0%) | 0 (0.0%) |
| Bachelor's Degree or higher | 3 (100.0%) | 0 (0.0%) |
| Total | 47 (77.0%) | 0 (0.0%) |
Employment Occupations by Sex in Fort Green
Management, Business, Science and Arts Occupations
The most common Management, Business, Science and Arts occupations in Fort Green are Computers, Engineering & Science (11 | 20.0%), Life, Physical & Social Science (11 | 20.0%), Health Diagnosing & Treating (8 | 14.5%), Community & Social Service (3 | 5.4%), and Education Instruction & Library (3 | 5.4%).
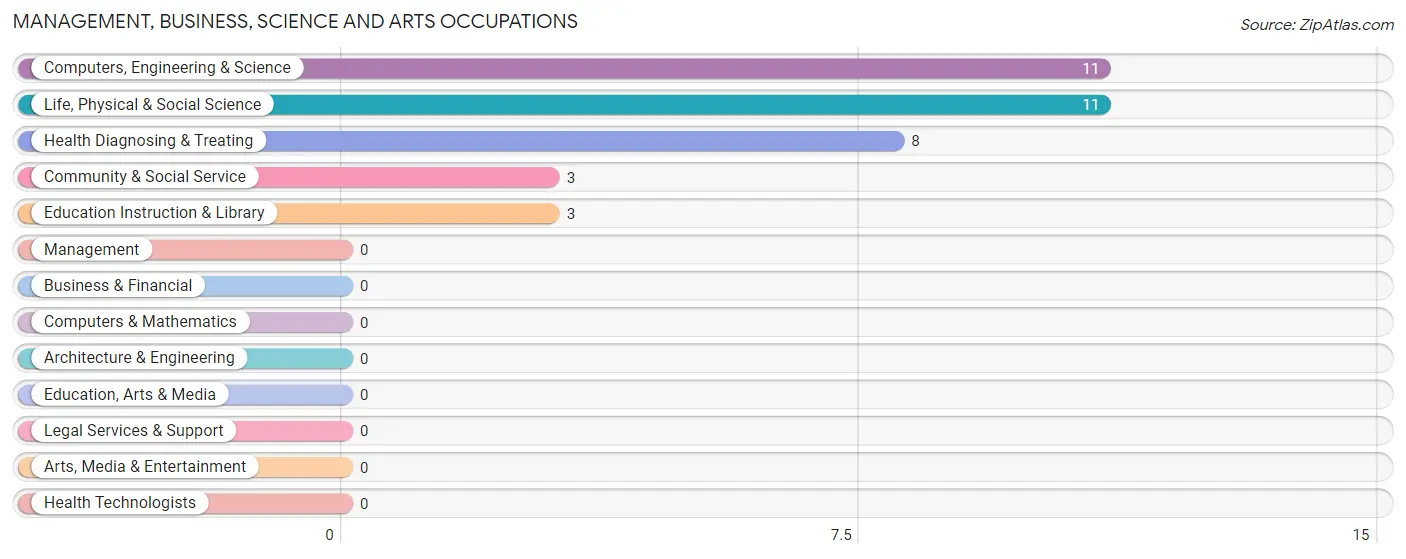
Management, Business, Science and Arts Occupations by Sex
Within the Management, Business, Science and Arts occupations in Fort Green, the most male-oriented occupations are Computers, Engineering & Science (100.0%), and Life, Physical & Social Science (100.0%), while the most female-oriented occupations are Community & Social Service (100.0%), Education Instruction & Library (100.0%), and Health Diagnosing & Treating (100.0%).
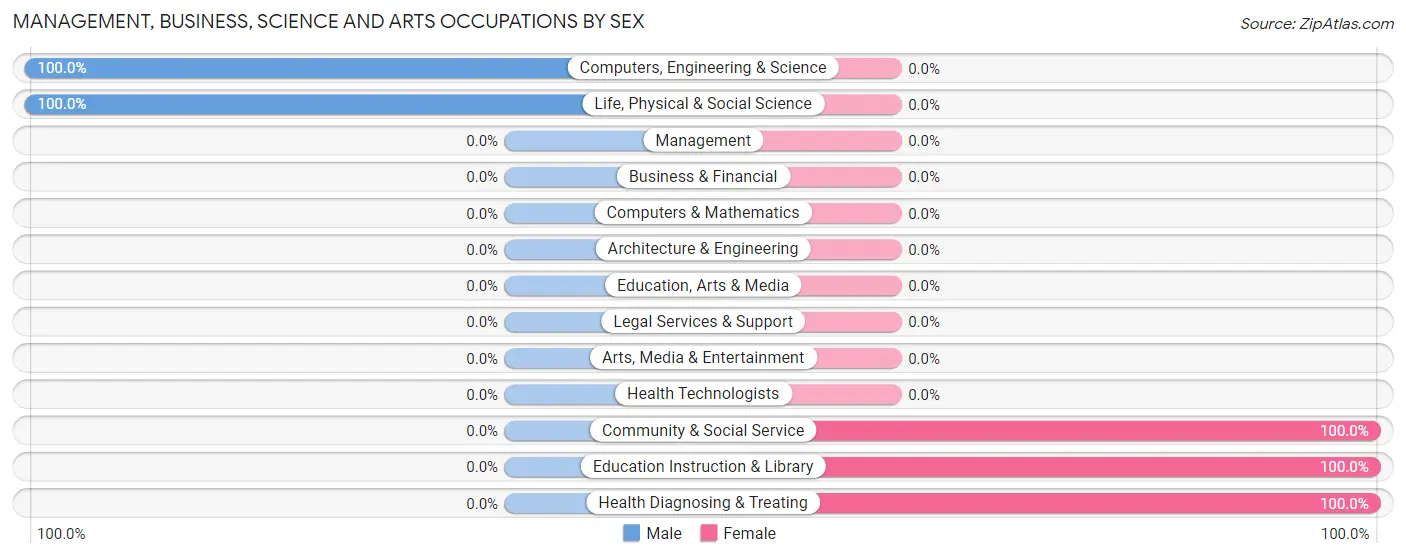
| Occupation | Male | Female |
| Management | 0 (0.0%) | 0 (0.0%) |
| Business & Financial | 0 (0.0%) | 0 (0.0%) |
| Computers, Engineering & Science | 11 (100.0%) | 0 (0.0%) |
| Computers & Mathematics | 0 (0.0%) | 0 (0.0%) |
| Architecture & Engineering | 0 (0.0%) | 0 (0.0%) |
| Life, Physical & Social Science | 11 (100.0%) | 0 (0.0%) |
| Community & Social Service | 0 (0.0%) | 3 (100.0%) |
| Education, Arts & Media | 0 (0.0%) | 0 (0.0%) |
| Legal Services & Support | 0 (0.0%) | 0 (0.0%) |
| Education Instruction & Library | 0 (0.0%) | 3 (100.0%) |
| Arts, Media & Entertainment | 0 (0.0%) | 0 (0.0%) |
| Health Diagnosing & Treating | 0 (0.0%) | 8 (100.0%) |
| Health Technologists | 0 (0.0%) | 0 (0.0%) |
| Total (Category) | 11 (50.0%) | 11 (50.0%) |
| Total (Overall) | 28 (50.9%) | 27 (49.1%) |
Services Occupations
Services Occupations by Sex
| Occupation | Male | Female |
| Healthcare Support | 0 (0.0%) | 0 (0.0%) |
| Security & Protection | 0 (0.0%) | 0 (0.0%) |
| Firefighting & Prevention | 0 (0.0%) | 0 (0.0%) |
| Law Enforcement | 0 (0.0%) | 0 (0.0%) |
| Food Preparation & Serving | 0 (0.0%) | 0 (0.0%) |
| Cleaning & Maintenance | 0 (0.0%) | 0 (0.0%) |
| Personal Care & Service | 0 (0.0%) | 0 (0.0%) |
| Total (Category) | 0 (0.0%) | 0 (0.0%) |
| Total (Overall) | 28 (50.9%) | 27 (49.1%) |
Sales and Office Occupations
Sales and Office Occupations by Sex
| Occupation | Male | Female |
| Sales & Related | 0 (0.0%) | 0 (0.0%) |
| Office & Administration | 0 (0.0%) | 0 (0.0%) |
| Total (Category) | 0 (0.0%) | 0 (0.0%) |
| Total (Overall) | 28 (50.9%) | 27 (49.1%) |
Natural Resources, Construction and Maintenance Occupations
Natural Resources, Construction and Maintenance Occupations by Sex
| Occupation | Male | Female |
| Farming, Fishing & Forestry | 0 (0.0%) | 0 (0.0%) |
| Construction & Extraction | 0 (0.0%) | 0 (0.0%) |
| Installation, Maintenance & Repair | 0 (0.0%) | 0 (0.0%) |
| Total (Category) | 0 (0.0%) | 0 (0.0%) |
| Total (Overall) | 28 (50.9%) | 27 (49.1%) |
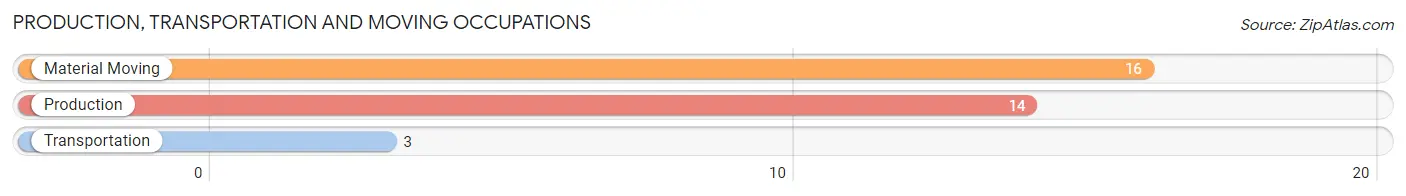
Production, Transportation and Moving Occupations
The most common Production, Transportation and Moving occupations in Fort Green are Material Moving (16 | 29.1%), Production (14 | 25.5%), and Transportation (3 | 5.4%).
Production, Transportation and Moving Occupations by Sex
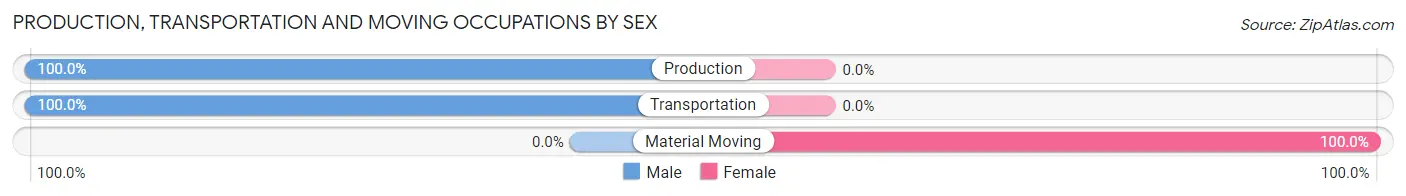
| Occupation | Male | Female |
| Production | 14 (100.0%) | 0 (0.0%) |
| Transportation | 3 (100.0%) | 0 (0.0%) |
| Material Moving | 0 (0.0%) | 16 (100.0%) |
| Total (Category) | 17 (51.5%) | 16 (48.5%) |
| Total (Overall) | 28 (50.9%) | 27 (49.1%) |
Employment Industries by Sex in Fort Green
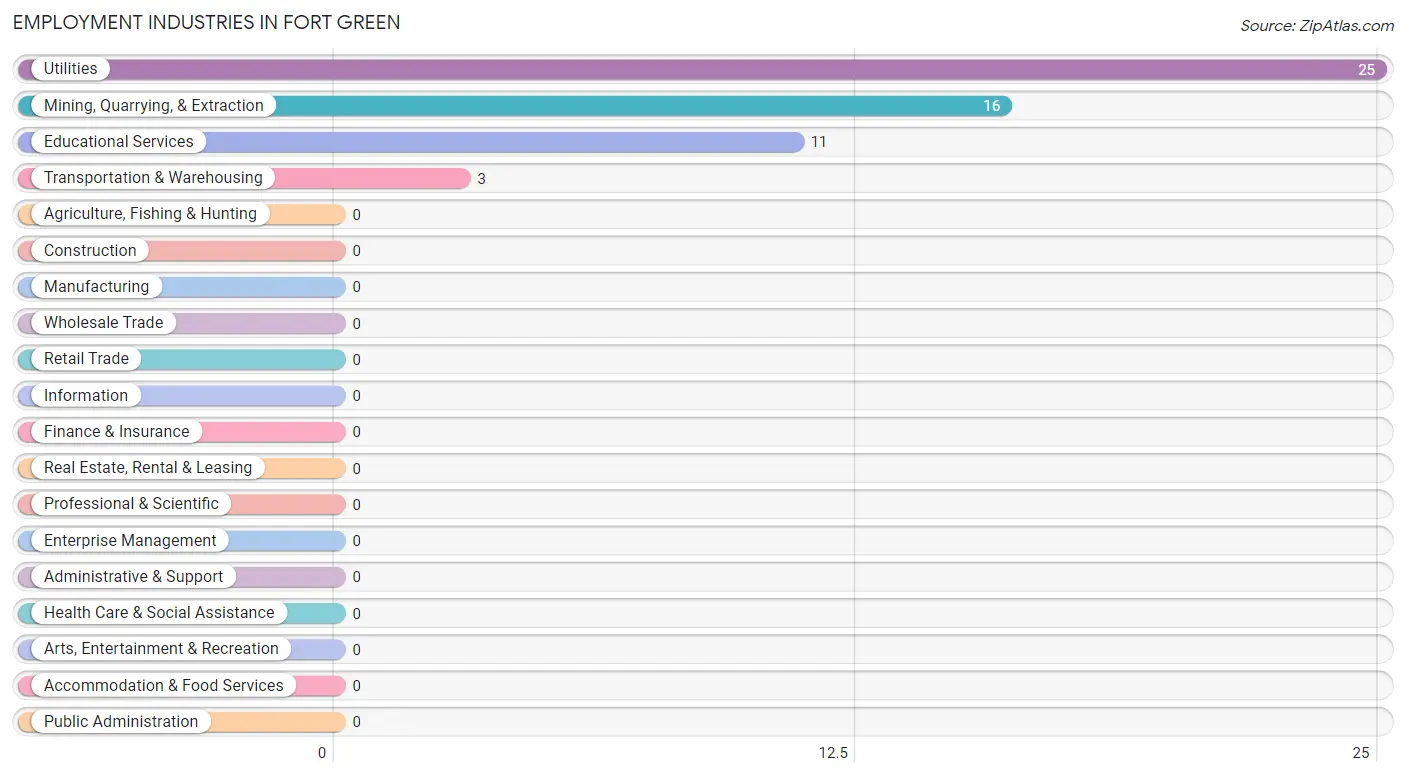
Employment Industries in Fort Green
The major employment industries in Fort Green include Utilities (25 | 45.5%), Mining, Quarrying, & Extraction (16 | 29.1%), Educational Services (11 | 20.0%), and Transportation & Warehousing (3 | 5.4%).
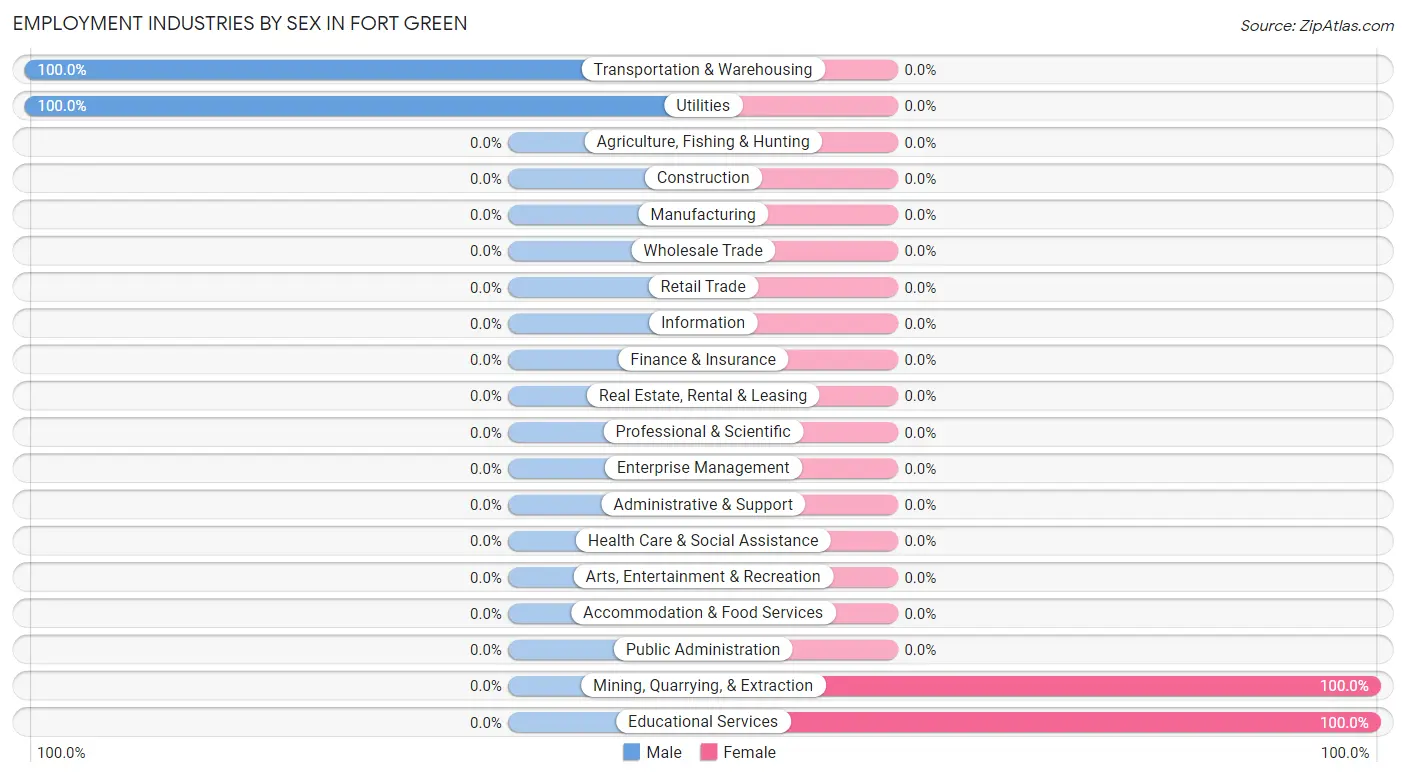
Employment Industries by Sex in Fort Green
The Fort Green industries that see more men than women are Transportation & Warehousing (100.0%), and Utilities (100.0%), whereas the industries that tend to have a higher number of women are Mining, Quarrying, & Extraction (100.0%), and Educational Services (100.0%).
| Industry | Male | Female |
| Agriculture, Fishing & Hunting | 0 (0.0%) | 0 (0.0%) |
| Mining, Quarrying, & Extraction | 0 (0.0%) | 16 (100.0%) |
| Construction | 0 (0.0%) | 0 (0.0%) |
| Manufacturing | 0 (0.0%) | 0 (0.0%) |
| Wholesale Trade | 0 (0.0%) | 0 (0.0%) |
| Retail Trade | 0 (0.0%) | 0 (0.0%) |
| Transportation & Warehousing | 3 (100.0%) | 0 (0.0%) |
| Utilities | 25 (100.0%) | 0 (0.0%) |
| Information | 0 (0.0%) | 0 (0.0%) |
| Finance & Insurance | 0 (0.0%) | 0 (0.0%) |
| Real Estate, Rental & Leasing | 0 (0.0%) | 0 (0.0%) |
| Professional & Scientific | 0 (0.0%) | 0 (0.0%) |
| Enterprise Management | 0 (0.0%) | 0 (0.0%) |
| Administrative & Support | 0 (0.0%) | 0 (0.0%) |
| Educational Services | 0 (0.0%) | 11 (100.0%) |
| Health Care & Social Assistance | 0 (0.0%) | 0 (0.0%) |
| Arts, Entertainment & Recreation | 0 (0.0%) | 0 (0.0%) |
| Accommodation & Food Services | 0 (0.0%) | 0 (0.0%) |
| Public Administration | 0 (0.0%) | 0 (0.0%) |
| Total | 28 (50.9%) | 27 (49.1%) |
Education in Fort Green
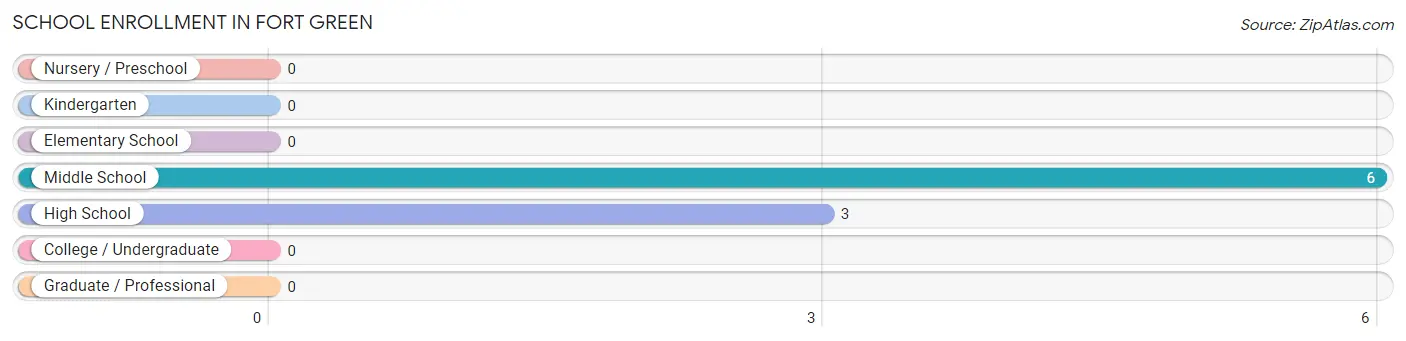
School Enrollment in Fort Green
The most common levels of schooling among the 9 students in Fort Green are middle school (6 | 66.7%), and high school (3 | 33.3%).
| School Level | # Students | % Students |
| Nursery / Preschool | 0 | 0.0% |
| Kindergarten | 0 | 0.0% |
| Elementary School | 0 | 0.0% |
| Middle School | 6 | 66.7% |
| High School | 3 | 33.3% |
| College / Undergraduate | 0 | 0.0% |
| Graduate / Professional | 0 | 0.0% |
| Total | 9 | 100.0% |
School Enrollment by Age by Funding Source in Fort Green
Out of a total of 9 students who are enrolled in schools in Fort Green, 3 (33.3%) attend a private institution, while the remaining 6 (66.7%) are enrolled in public schools. The age group of 15 to 17 year olds has the highest likelihood of being enrolled in private schools, with 3 (100.0% in the age bracket) enrolled. Conversely, the age group of 10 to 14 year olds has the lowest likelihood of being enrolled in a private school, with 6 (100.0% in the age bracket) attending a public institution.
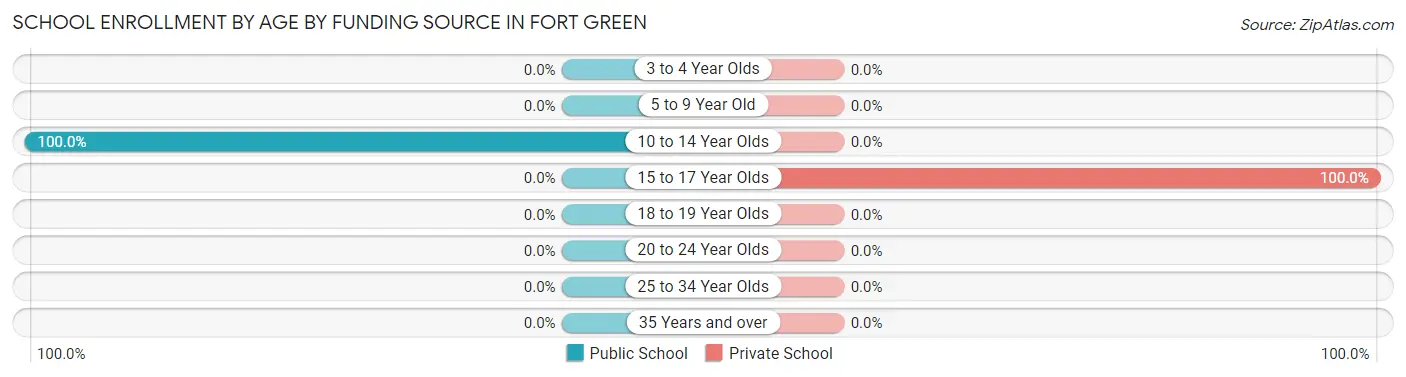
| Age Bracket | Public School | Private School |
| 3 to 4 Year Olds | 0 (0.0%) | 0 (0.0%) |
| 5 to 9 Year Old | 0 (0.0%) | 0 (0.0%) |
| 10 to 14 Year Olds | 6 (100.0%) | 0 (0.0%) |
| 15 to 17 Year Olds | 0 (0.0%) | 3 (100.0%) |
| 18 to 19 Year Olds | 0 (0.0%) | 0 (0.0%) |
| 20 to 24 Year Olds | 0 (0.0%) | 0 (0.0%) |
| 25 to 34 Year Olds | 0 (0.0%) | 0 (0.0%) |
| 35 Years and over | 0 (0.0%) | 0 (0.0%) |
| Total | 6 (66.7%) | 3 (33.3%) |
Educational Attainment by Field of Study in Fort Green
Psychology (4 | 36.4%), literature & languages (4 | 36.4%), and arts & humanities (3 | 27.3%) are the most common fields of study among 11 individuals in Fort Green who have obtained a bachelor's degree or higher.
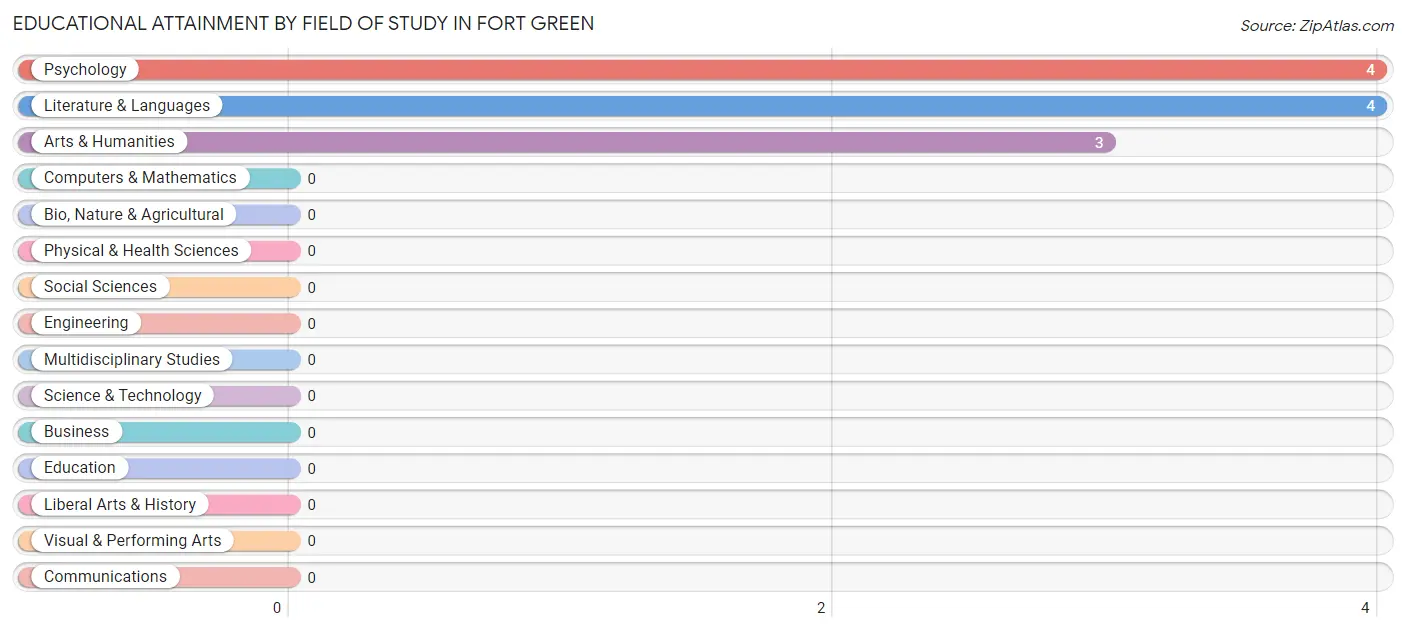
| Field of Study | # Graduates | % Graduates |
| Computers & Mathematics | 0 | 0.0% |
| Bio, Nature & Agricultural | 0 | 0.0% |
| Physical & Health Sciences | 0 | 0.0% |
| Psychology | 4 | 36.4% |
| Social Sciences | 0 | 0.0% |
| Engineering | 0 | 0.0% |
| Multidisciplinary Studies | 0 | 0.0% |
| Science & Technology | 0 | 0.0% |
| Business | 0 | 0.0% |
| Education | 0 | 0.0% |
| Literature & Languages | 4 | 36.4% |
| Liberal Arts & History | 0 | 0.0% |
| Visual & Performing Arts | 0 | 0.0% |
| Communications | 0 | 0.0% |
| Arts & Humanities | 3 | 27.3% |
| Total | 11 | 100.0% |
Transportation & Commute in Fort Green
Vehicle Availability by Sex in Fort Green
The most prevalent vehicle ownership categories in Fort Green are males with 5 or more vehicles (14, accounting for 50.0%) and females with 5 or more vehicles (16, making up 51.8%).
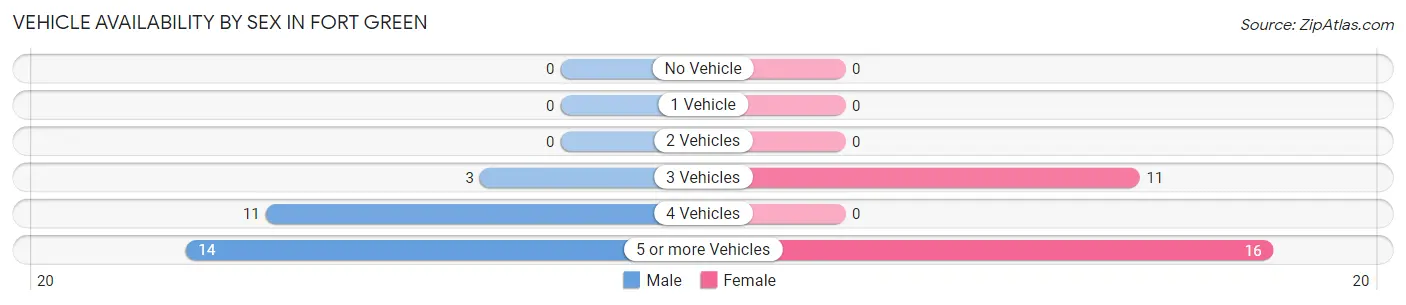
| Vehicles Available | Male | Female |
| No Vehicle | 0 (0.0%) | 0 (0.0%) |
| 1 Vehicle | 0 (0.0%) | 0 (0.0%) |
| 2 Vehicles | 0 (0.0%) | 0 (0.0%) |
| 3 Vehicles | 3 (10.7%) | 11 (40.7%) |
| 4 Vehicles | 11 (39.3%) | 0 (0.0%) |
| 5 or more Vehicles | 14 (50.0%) | 16 (59.3%) |
| Total | 28 (100.0%) | 27 (100.0%) |
Commute Time in Fort Green
The most frequently occuring commute durations in Fort Green are 20 to 24 minutes (38 commuters, 69.1%), 90 or more minutes (14 commuters, 25.5%), and 60 to 89 minutes (3 commuters, 5.4%).
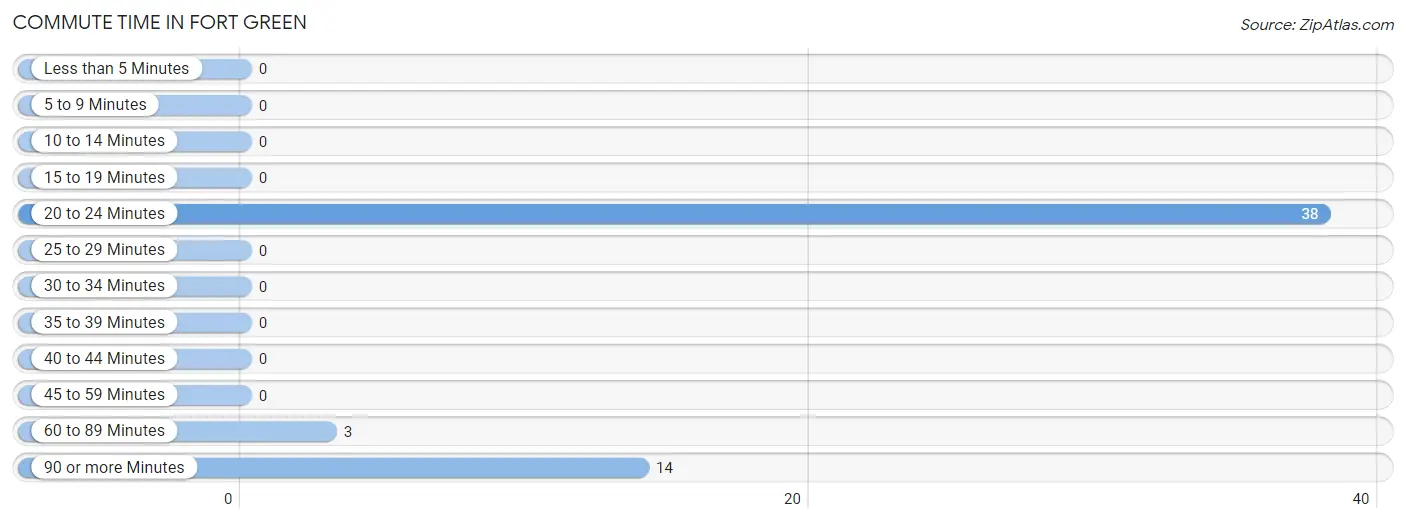
| Commute Time | # Commuters | % Commuters |
| Less than 5 Minutes | 0 | 0.0% |
| 5 to 9 Minutes | 0 | 0.0% |
| 10 to 14 Minutes | 0 | 0.0% |
| 15 to 19 Minutes | 0 | 0.0% |
| 20 to 24 Minutes | 38 | 69.1% |
| 25 to 29 Minutes | 0 | 0.0% |
| 30 to 34 Minutes | 0 | 0.0% |
| 35 to 39 Minutes | 0 | 0.0% |
| 40 to 44 Minutes | 0 | 0.0% |
| 45 to 59 Minutes | 0 | 0.0% |
| 60 to 89 Minutes | 3 | 5.4% |
| 90 or more Minutes | 14 | 25.5% |
Commute Time by Sex in Fort Green
The most common commute times in Fort Green are 20 to 24 minutes (14 commuters, 50.0%) for males and 20 to 24 minutes (24 commuters, 88.9%) for females.
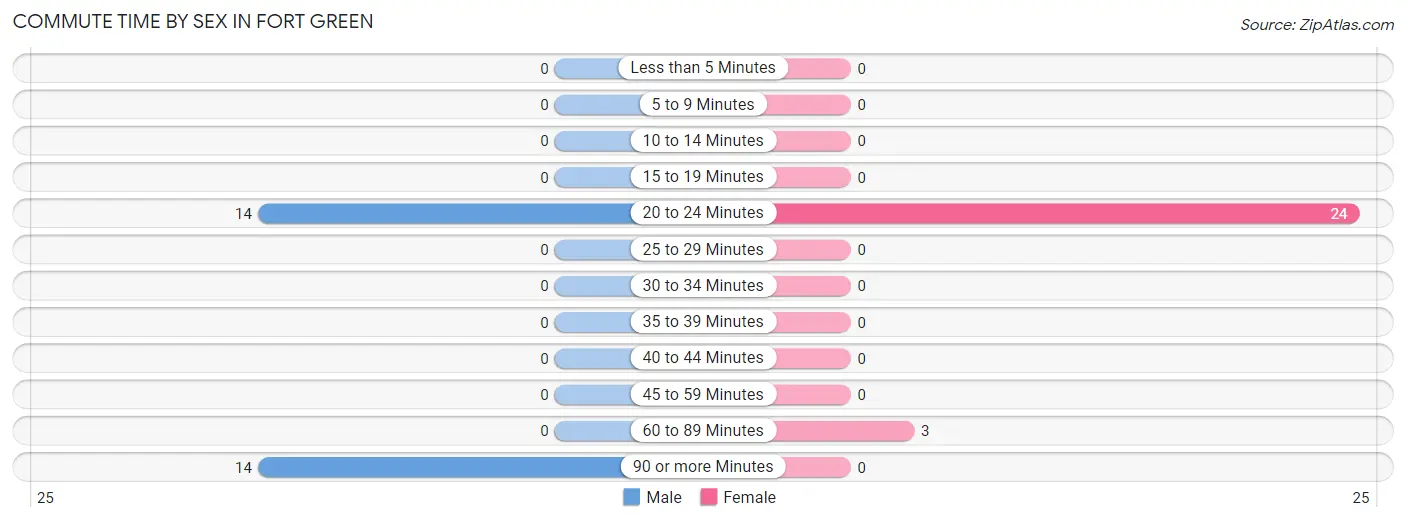
| Commute Time | Male | Female |
| Less than 5 Minutes | 0 (0.0%) | 0 (0.0%) |
| 5 to 9 Minutes | 0 (0.0%) | 0 (0.0%) |
| 10 to 14 Minutes | 0 (0.0%) | 0 (0.0%) |
| 15 to 19 Minutes | 0 (0.0%) | 0 (0.0%) |
| 20 to 24 Minutes | 14 (50.0%) | 24 (88.9%) |
| 25 to 29 Minutes | 0 (0.0%) | 0 (0.0%) |
| 30 to 34 Minutes | 0 (0.0%) | 0 (0.0%) |
| 35 to 39 Minutes | 0 (0.0%) | 0 (0.0%) |
| 40 to 44 Minutes | 0 (0.0%) | 0 (0.0%) |
| 45 to 59 Minutes | 0 (0.0%) | 0 (0.0%) |
| 60 to 89 Minutes | 0 (0.0%) | 3 (11.1%) |
| 90 or more Minutes | 14 (50.0%) | 0 (0.0%) |
Time of Departure to Work by Sex in Fort Green
The most frequent times of departure to work in Fort Green are 12:00 AM to 4:59 AM (28, 100.0%) for males and 7:30 AM to 7:59 AM (16, 59.3%) for females.
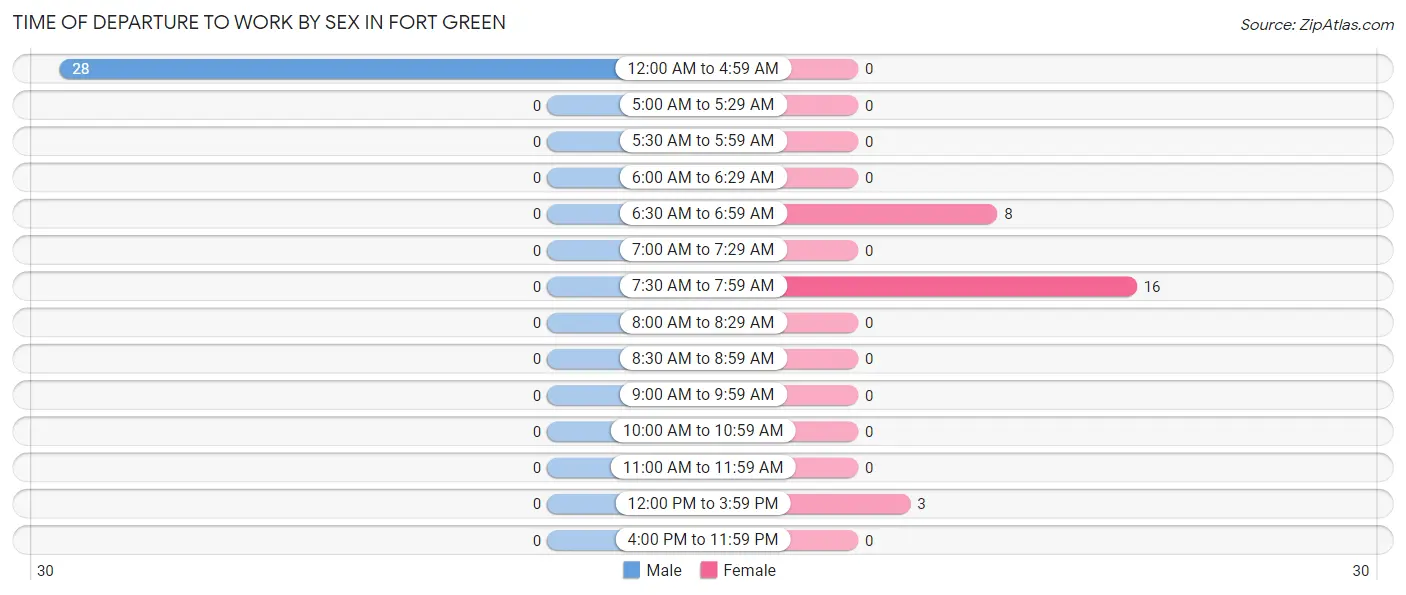
| Time of Departure | Male | Female |
| 12:00 AM to 4:59 AM | 28 (100.0%) | 0 (0.0%) |
| 5:00 AM to 5:29 AM | 0 (0.0%) | 0 (0.0%) |
| 5:30 AM to 5:59 AM | 0 (0.0%) | 0 (0.0%) |
| 6:00 AM to 6:29 AM | 0 (0.0%) | 0 (0.0%) |
| 6:30 AM to 6:59 AM | 0 (0.0%) | 8 (29.6%) |
| 7:00 AM to 7:29 AM | 0 (0.0%) | 0 (0.0%) |
| 7:30 AM to 7:59 AM | 0 (0.0%) | 16 (59.3%) |
| 8:00 AM to 8:29 AM | 0 (0.0%) | 0 (0.0%) |
| 8:30 AM to 8:59 AM | 0 (0.0%) | 0 (0.0%) |
| 9:00 AM to 9:59 AM | 0 (0.0%) | 0 (0.0%) |
| 10:00 AM to 10:59 AM | 0 (0.0%) | 0 (0.0%) |
| 11:00 AM to 11:59 AM | 0 (0.0%) | 0 (0.0%) |
| 12:00 PM to 3:59 PM | 0 (0.0%) | 3 (11.1%) |
| 4:00 PM to 11:59 PM | 0 (0.0%) | 0 (0.0%) |
| Total | 28 (100.0%) | 27 (100.0%) |
Housing Occupancy in Fort Green
Occupancy by Ownership in Fort Green
Of the total 37 dwellings in Fort Green, owner-occupied units account for 37 (100.0%), while renter-occupied units make up 0 (0.0%).
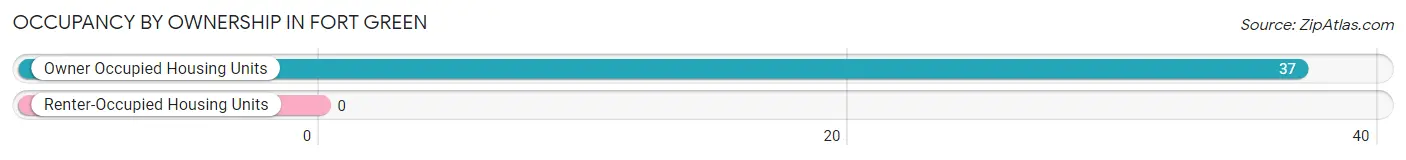
| Occupancy | # Housing Units | % Housing Units |
| Owner Occupied Housing Units | 37 | 100.0% |
| Renter-Occupied Housing Units | 0 | 0.0% |
| Total Occupied Housing Units | 37 | 100.0% |
Occupancy by Household Size in Fort Green
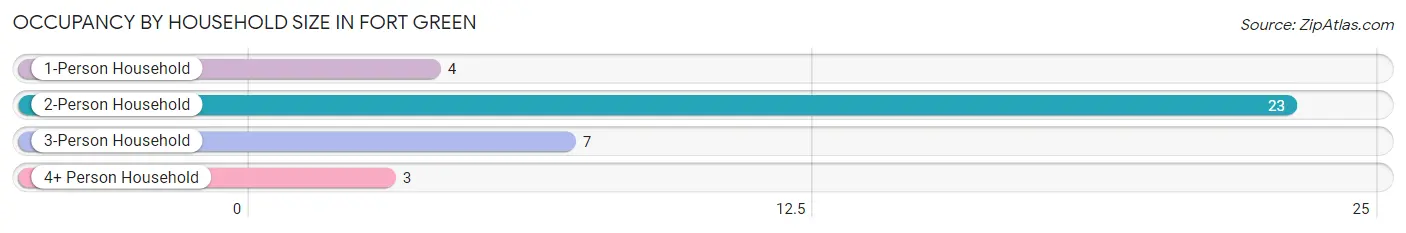
| Household Size | # Housing Units | % Housing Units |
| 1-Person Household | 4 | 10.8% |
| 2-Person Household | 23 | 62.2% |
| 3-Person Household | 7 | 18.9% |
| 4+ Person Household | 3 | 8.1% |
| Total Housing Units | 37 | 100.0% |
Occupancy by Ownership by Household Size in Fort Green
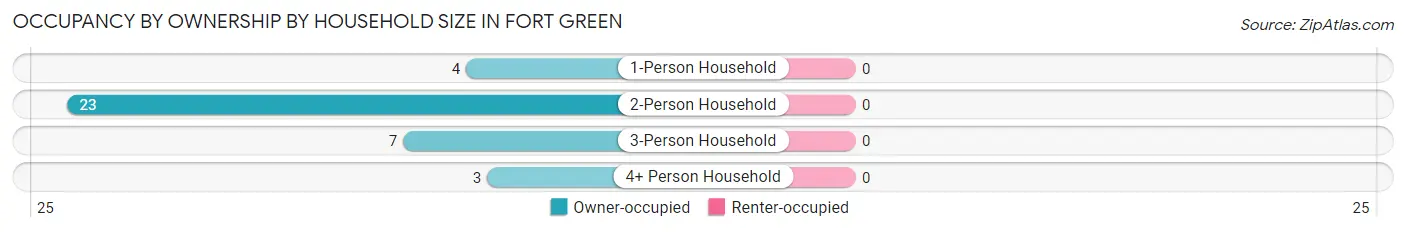
| Household Size | Owner-occupied | Renter-occupied |
| 1-Person Household | 4 (100.0%) | 0 (0.0%) |
| 2-Person Household | 23 (100.0%) | 0 (0.0%) |
| 3-Person Household | 7 (100.0%) | 0 (0.0%) |
| 4+ Person Household | 3 (100.0%) | 0 (0.0%) |
| Total Housing Units | 37 (100.0%) | 0 (0.0%) |
Occupancy by Educational Attainment in Fort Green
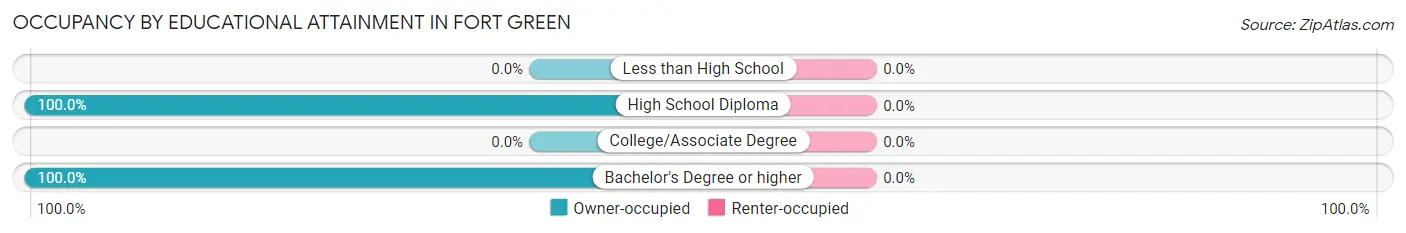
| Household Size | Owner-occupied | Renter-occupied |
| Less than High School | 0 (0.0%) | 0 (0.0%) |
| High School Diploma | 30 (100.0%) | 0 (0.0%) |
| College/Associate Degree | 0 (0.0%) | 0 (0.0%) |
| Bachelor's Degree or higher | 7 (100.0%) | 0 (0.0%) |
Occupancy by Age of Householder in Fort Green
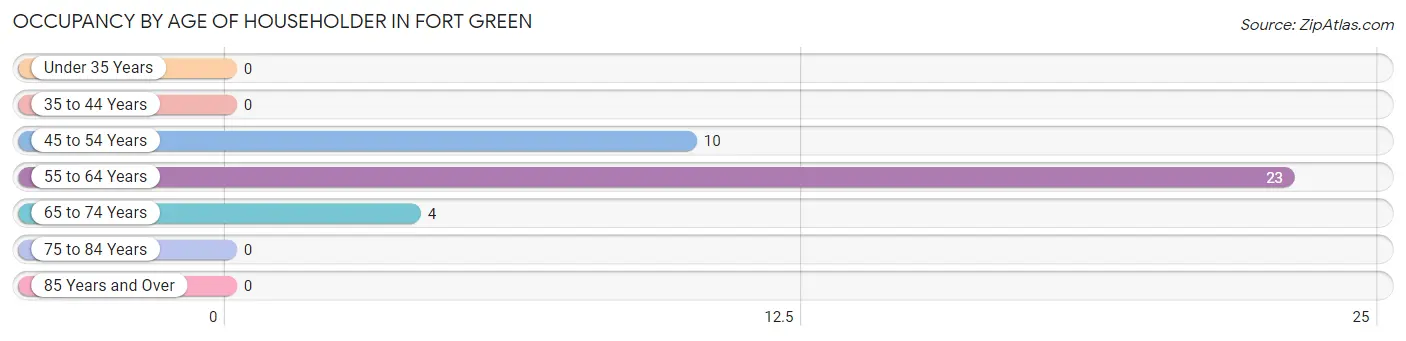
| Age Bracket | # Households | % Households |
| Under 35 Years | 0 | 0.0% |
| 35 to 44 Years | 0 | 0.0% |
| 45 to 54 Years | 10 | 27.0% |
| 55 to 64 Years | 23 | 62.2% |
| 65 to 74 Years | 4 | 10.8% |
| 75 to 84 Years | 0 | 0.0% |
| 85 Years and Over | 0 | 0.0% |
| Total | 37 | 100.0% |
Housing Finances in Fort Green
Median Income by Occupancy in Fort Green
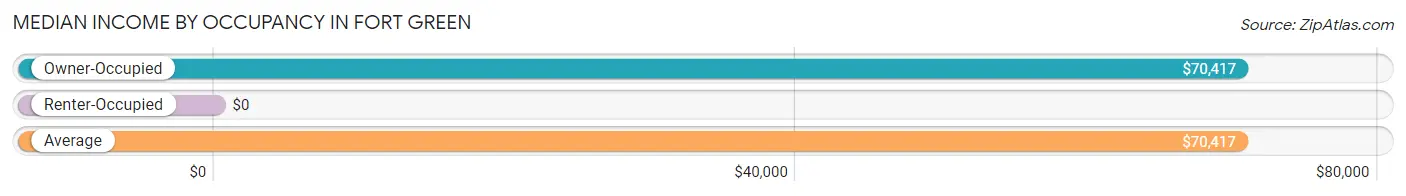
| Occupancy Type | # Households | Median Income |
| Owner-Occupied | 37 (100.0%) | $70,417 |
| Renter-Occupied | 0 (0.0%) | $0 |
| Average | 37 (100.0%) | $70,417 |
Occupancy by Householder Income Bracket in Fort Green
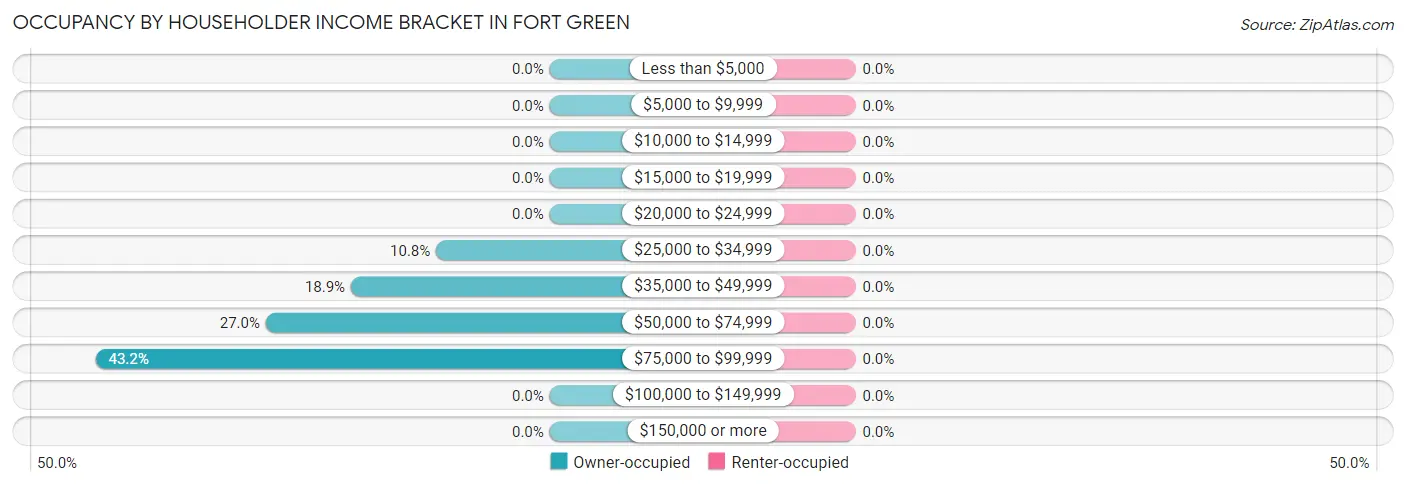
| Income Bracket | Owner-occupied | Renter-occupied |
| Less than $5,000 | 0 (0.0%) | 0 (0.0%) |
| $5,000 to $9,999 | 0 (0.0%) | 0 (0.0%) |
| $10,000 to $14,999 | 0 (0.0%) | 0 (0.0%) |
| $15,000 to $19,999 | 0 (0.0%) | 0 (0.0%) |
| $20,000 to $24,999 | 0 (0.0%) | 0 (0.0%) |
| $25,000 to $34,999 | 4 (10.8%) | 0 (0.0%) |
| $35,000 to $49,999 | 7 (18.9%) | 0 (0.0%) |
| $50,000 to $74,999 | 10 (27.0%) | 0 (0.0%) |
| $75,000 to $99,999 | 16 (43.2%) | 0 (0.0%) |
| $100,000 to $149,999 | 0 (0.0%) | 0 (0.0%) |
| $150,000 or more | 0 (0.0%) | 0 (0.0%) |
| Total | 37 (100.0%) | 0 (0.0%) |
Monthly Housing Cost Tiers in Fort Green
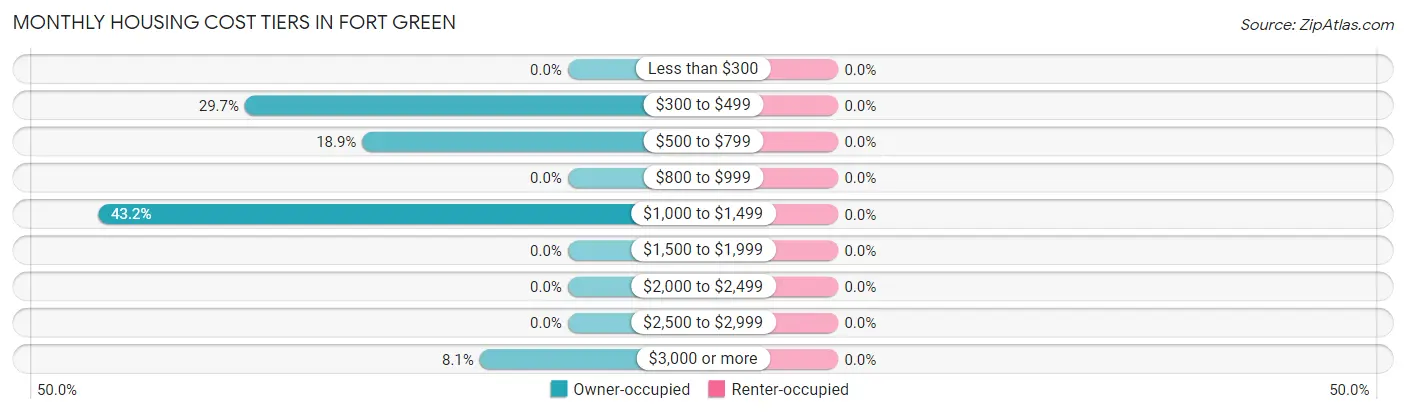
| Monthly Cost | Owner-occupied | Renter-occupied |
| Less than $300 | 0 (0.0%) | 0 (0.0%) |
| $300 to $499 | 11 (29.7%) | 0 (0.0%) |
| $500 to $799 | 7 (18.9%) | 0 (0.0%) |
| $800 to $999 | 0 (0.0%) | 0 (0.0%) |
| $1,000 to $1,499 | 16 (43.2%) | 0 (0.0%) |
| $1,500 to $1,999 | 0 (0.0%) | 0 (0.0%) |
| $2,000 to $2,499 | 0 (0.0%) | 0 (0.0%) |
| $2,500 to $2,999 | 0 (0.0%) | 0 (0.0%) |
| $3,000 or more | 3 (8.1%) | 0 (0.0%) |
| Total | 37 (100.0%) | 0 (0.0%) |
Physical Housing Characteristics in Fort Green
Housing Structures in Fort Green
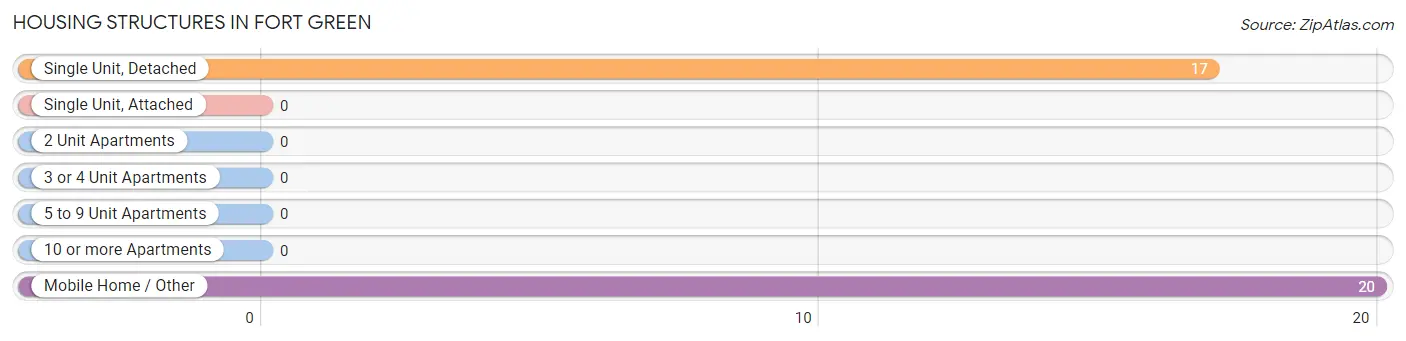
| Structure Type | # Housing Units | % Housing Units |
| Single Unit, Detached | 17 | 46.0% |
| Single Unit, Attached | 0 | 0.0% |
| 2 Unit Apartments | 0 | 0.0% |
| 3 or 4 Unit Apartments | 0 | 0.0% |
| 5 to 9 Unit Apartments | 0 | 0.0% |
| 10 or more Apartments | 0 | 0.0% |
| Mobile Home / Other | 20 | 54.0% |
| Total | 37 | 100.0% |
Housing Structures by Occupancy in Fort Green
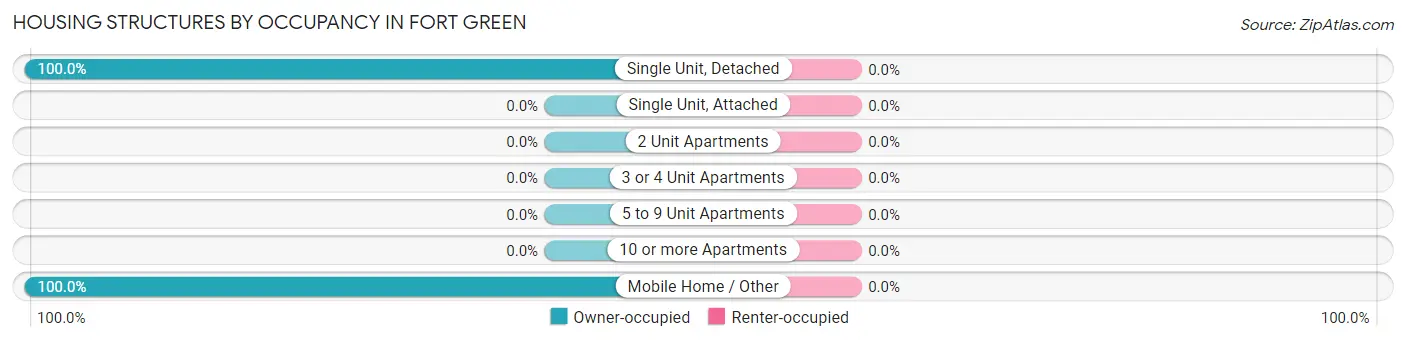
| Structure Type | Owner-occupied | Renter-occupied |
| Single Unit, Detached | 17 (100.0%) | 0 (0.0%) |
| Single Unit, Attached | 0 (0.0%) | 0 (0.0%) |
| 2 Unit Apartments | 0 (0.0%) | 0 (0.0%) |
| 3 or 4 Unit Apartments | 0 (0.0%) | 0 (0.0%) |
| 5 to 9 Unit Apartments | 0 (0.0%) | 0 (0.0%) |
| 10 or more Apartments | 0 (0.0%) | 0 (0.0%) |
| Mobile Home / Other | 20 (100.0%) | 0 (0.0%) |
| Total | 37 (100.0%) | 0 (0.0%) |
Housing Structures by Number of Rooms in Fort Green
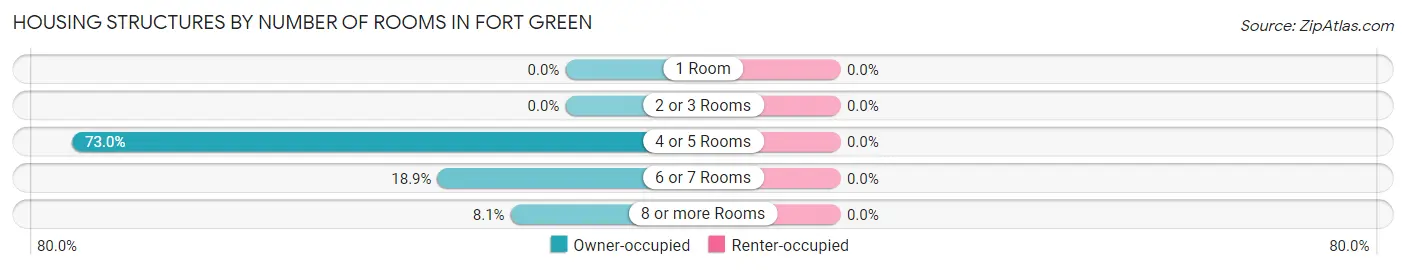
| Number of Rooms | Owner-occupied | Renter-occupied |
| 1 Room | 0 (0.0%) | 0 (0.0%) |
| 2 or 3 Rooms | 0 (0.0%) | 0 (0.0%) |
| 4 or 5 Rooms | 27 (73.0%) | 0 (0.0%) |
| 6 or 7 Rooms | 7 (18.9%) | 0 (0.0%) |
| 8 or more Rooms | 3 (8.1%) | 0 (0.0%) |
| Total | 37 (100.0%) | 0 (0.0%) |
Housing Structure by Heating Type in Fort Green
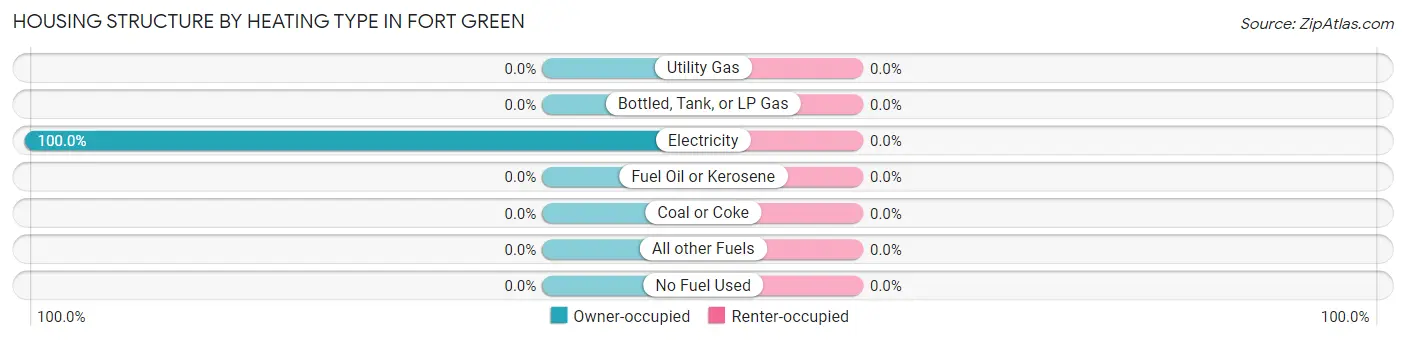
| Heating Type | Owner-occupied | Renter-occupied |
| Utility Gas | 0 (0.0%) | 0 (0.0%) |
| Bottled, Tank, or LP Gas | 0 (0.0%) | 0 (0.0%) |
| Electricity | 37 (100.0%) | 0 (0.0%) |
| Fuel Oil or Kerosene | 0 (0.0%) | 0 (0.0%) |
| Coal or Coke | 0 (0.0%) | 0 (0.0%) |
| All other Fuels | 0 (0.0%) | 0 (0.0%) |
| No Fuel Used | 0 (0.0%) | 0 (0.0%) |
| Total | 37 (100.0%) | 0 (0.0%) |
Household Vehicle Usage in Fort Green
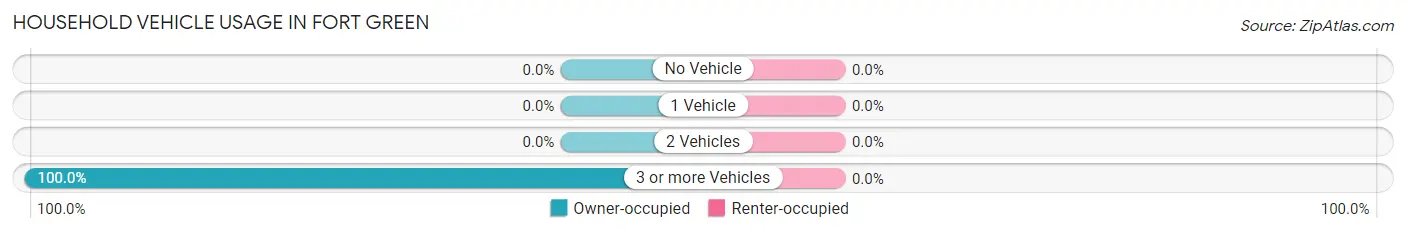
| Vehicles per Household | Owner-occupied | Renter-occupied |
| No Vehicle | 0 (0.0%) | 0 (0.0%) |
| 1 Vehicle | 0 (0.0%) | 0 (0.0%) |
| 2 Vehicles | 0 (0.0%) | 0 (0.0%) |
| 3 or more Vehicles | 37 (100.0%) | 0 (0.0%) |
| Total | 37 (100.0%) | 0 (0.0%) |
Real Estate & Mortgages in Fort Green
Real Estate and Mortgage Overview in Fort Green
| Characteristic | Without Mortgage | With Mortgage |
| Housing Units | 18 | 19 |
| Median Property Value | - | - |
| Median Household Income | $41,786 | $0 |
| Monthly Housing Costs | $450 | $3 |
| Real Estate Taxes | - | - |
Property Value by Mortgage Status in Fort Green
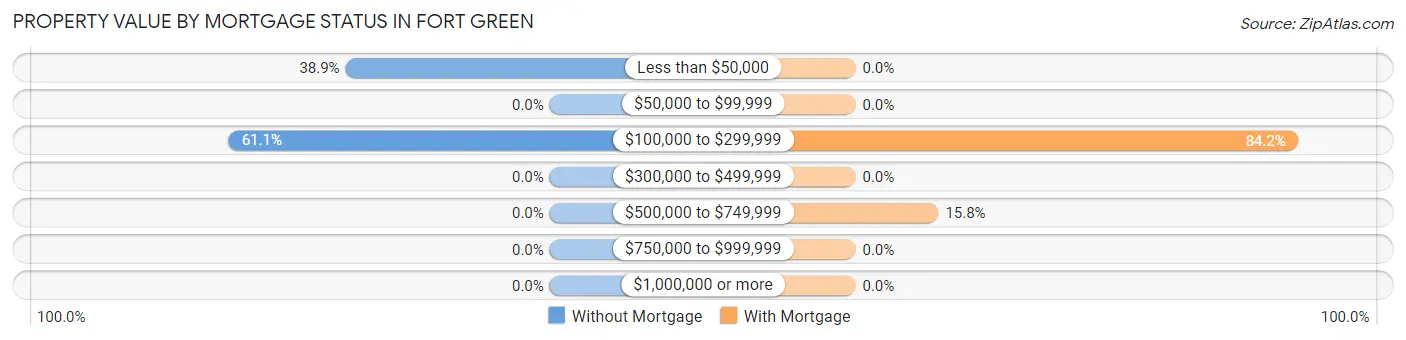
| Property Value | Without Mortgage | With Mortgage |
| Less than $50,000 | 7 (38.9%) | 0 (0.0%) |
| $50,000 to $99,999 | 0 (0.0%) | 0 (0.0%) |
| $100,000 to $299,999 | 11 (61.1%) | 16 (84.2%) |
| $300,000 to $499,999 | 0 (0.0%) | 0 (0.0%) |
| $500,000 to $749,999 | 0 (0.0%) | 3 (15.8%) |
| $750,000 to $999,999 | 0 (0.0%) | 0 (0.0%) |
| $1,000,000 or more | 0 (0.0%) | 0 (0.0%) |
| Total | 18 (100.0%) | 19 (100.0%) |
Household Income by Mortgage Status in Fort Green
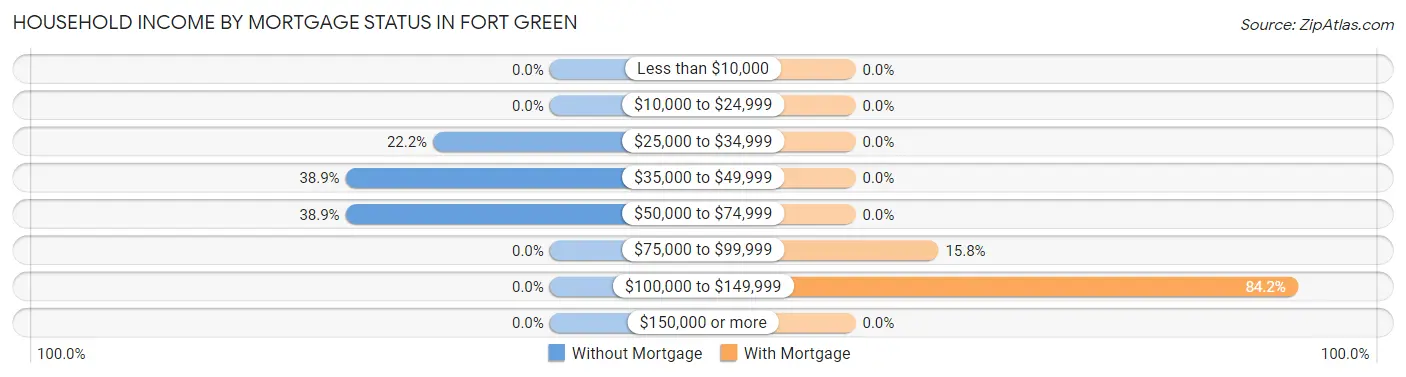
| Household Income | Without Mortgage | With Mortgage |
| Less than $10,000 | 0 (0.0%) | 0 (0.0%) |
| $10,000 to $24,999 | 0 (0.0%) | 0 (0.0%) |
| $25,000 to $34,999 | 4 (22.2%) | 0 (0.0%) |
| $35,000 to $49,999 | 7 (38.9%) | 0 (0.0%) |
| $50,000 to $74,999 | 7 (38.9%) | 0 (0.0%) |
| $75,000 to $99,999 | 0 (0.0%) | 3 (15.8%) |
| $100,000 to $149,999 | 0 (0.0%) | 16 (84.2%) |
| $150,000 or more | 0 (0.0%) | 0 (0.0%) |
| Total | 18 (100.0%) | 19 (100.0%) |
Property Value to Household Income Ratio in Fort Green
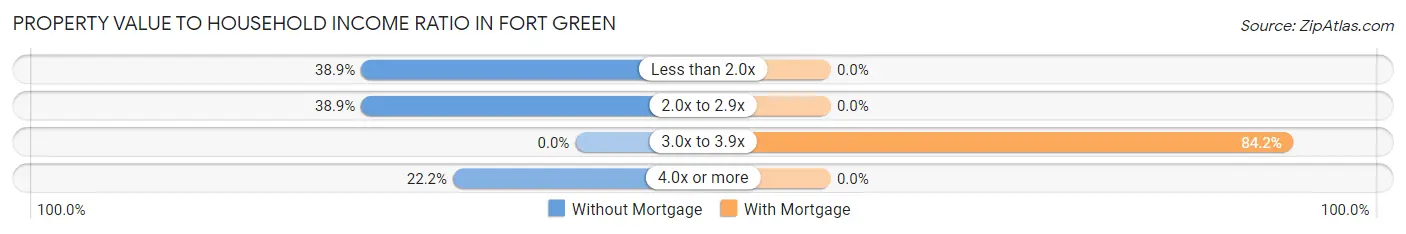
| Value-to-Income Ratio | Without Mortgage | With Mortgage |
| Less than 2.0x | 7 (38.9%) | 0 (0.0%) |
| 2.0x to 2.9x | 7 (38.9%) | 0 (0.0%) |
| 3.0x to 3.9x | 0 (0.0%) | 16 (84.2%) |
| 4.0x or more | 4 (22.2%) | 0 (0.0%) |
| Total | 18 (100.0%) | 19 (100.0%) |
Real Estate Taxes by Mortgage Status in Fort Green
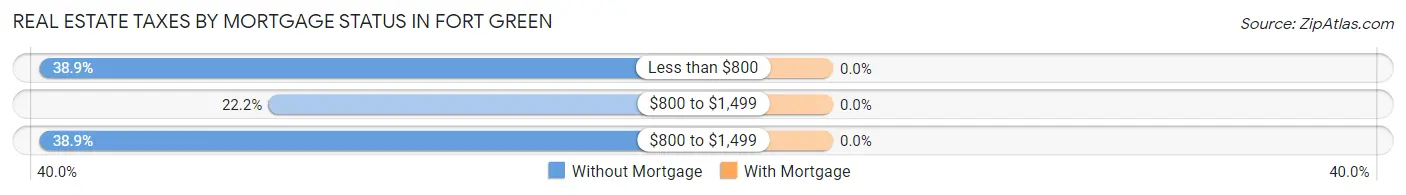
| Property Taxes | Without Mortgage | With Mortgage |
| Less than $800 | 7 (38.9%) | 0 (0.0%) |
| $800 to $1,499 | 4 (22.2%) | 0 (0.0%) |
| $800 to $1,499 | 7 (38.9%) | 0 (0.0%) |
| Total | 18 (100.0%) | 19 (100.0%) |
Health & Disability in Fort Green
Health Insurance Coverage by Age in Fort Green
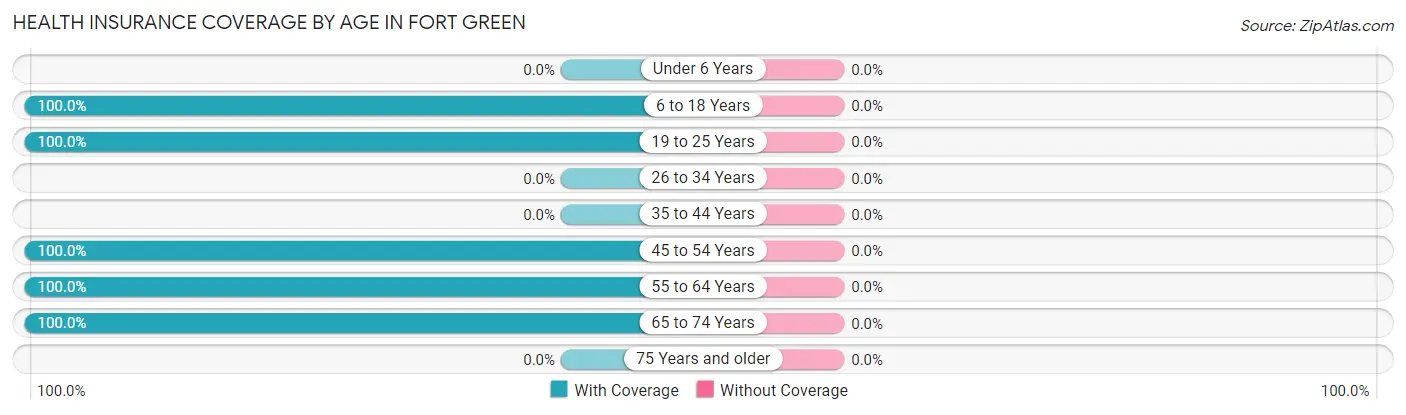
| Age Bracket | With Coverage | Without Coverage |
| Under 6 Years | 0 (0.0%) | 0 (0.0%) |
| 6 to 18 Years | 9 (100.0%) | 0 (0.0%) |
| 19 to 25 Years | 31 (100.0%) | 0 (0.0%) |
| 26 to 34 Years | 0 (0.0%) | 0 (0.0%) |
| 35 to 44 Years | 0 (0.0%) | 0 (0.0%) |
| 45 to 54 Years | 24 (100.0%) | 0 (0.0%) |
| 55 to 64 Years | 37 (100.0%) | 0 (0.0%) |
| 65 to 74 Years | 4 (100.0%) | 0 (0.0%) |
| 75 Years and older | 0 (0.0%) | 0 (0.0%) |
| Total | 105 (100.0%) | 0 (0.0%) |
Health Insurance Coverage by Citizenship Status in Fort Green
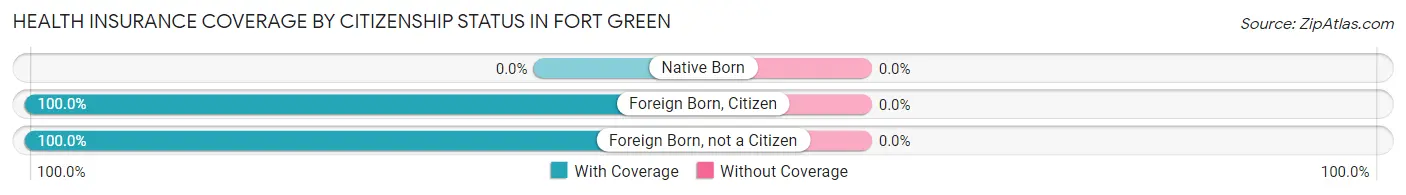
| Citizenship Status | With Coverage | Without Coverage |
| Native Born | 0 (0.0%) | 0 (0.0%) |
| Foreign Born, Citizen | 9 (100.0%) | 0 (0.0%) |
| Foreign Born, not a Citizen | 31 (100.0%) | 0 (0.0%) |
Health Insurance Coverage by Household Income in Fort Green
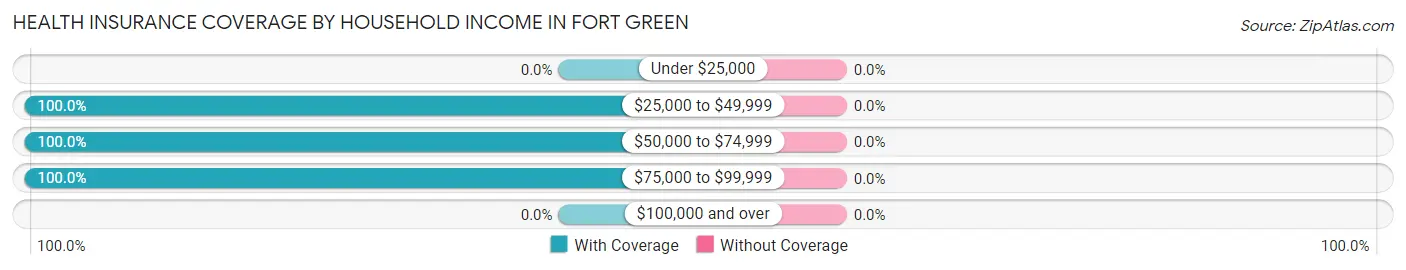
| Household Income | With Coverage | Without Coverage |
| Under $25,000 | 0 (0.0%) | 0 (0.0%) |
| $25,000 to $49,999 | 19 (100.0%) | 0 (0.0%) |
| $50,000 to $74,999 | 56 (100.0%) | 0 (0.0%) |
| $75,000 to $99,999 | 30 (100.0%) | 0 (0.0%) |
| $100,000 and over | 0 (0.0%) | 0 (0.0%) |
Public vs Private Health Insurance Coverage by Age in Fort Green
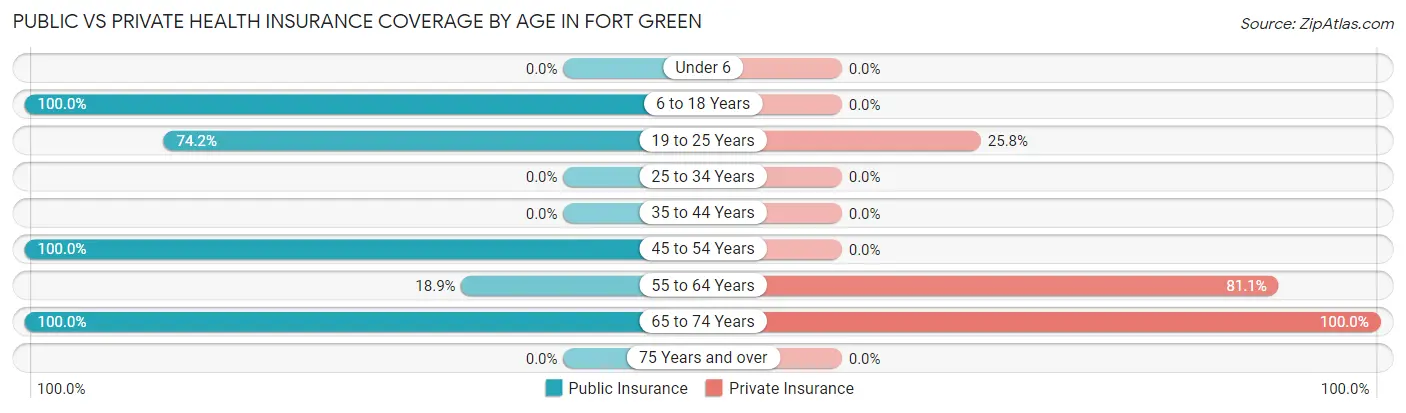
| Age Bracket | Public Insurance | Private Insurance |
| Under 6 | 0 (0.0%) | 0 (0.0%) |
| 6 to 18 Years | 9 (100.0%) | 0 (0.0%) |
| 19 to 25 Years | 23 (74.2%) | 8 (25.8%) |
| 25 to 34 Years | 0 (0.0%) | 0 (0.0%) |
| 35 to 44 Years | 0 (0.0%) | 0 (0.0%) |
| 45 to 54 Years | 24 (100.0%) | 0 (0.0%) |
| 55 to 64 Years | 7 (18.9%) | 30 (81.1%) |
| 65 to 74 Years | 4 (100.0%) | 4 (100.0%) |
| 75 Years and over | 0 (0.0%) | 0 (0.0%) |
| Total | 67 (63.8%) | 42 (40.0%) |
Disability Status by Sex by Age in Fort Green
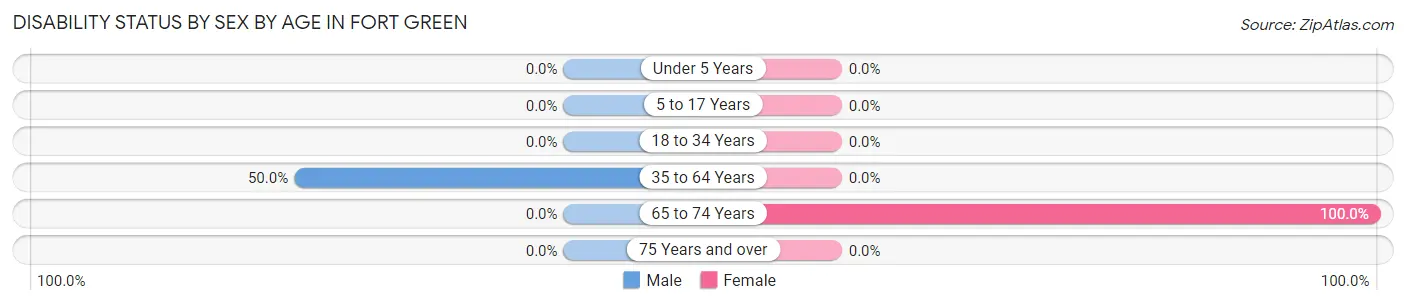
| Age Bracket | Male | Female |
| Under 5 Years | 0 (0.0%) | 0 (0.0%) |
| 5 to 17 Years | 0 (0.0%) | 0 (0.0%) |
| 18 to 34 Years | 0 (0.0%) | 0 (0.0%) |
| 35 to 64 Years | 14 (50.0%) | 0 (0.0%) |
| 65 to 74 Years | 0 (0.0%) | 4 (100.0%) |
| 75 Years and over | 0 (0.0%) | 0 (0.0%) |
Disability Class by Sex by Age in Fort Green
Disability Class: Hearing Difficulty
| Age Bracket | Male | Female |
| Under 5 Years | 0 (0.0%) | 0 (0.0%) |
| 5 to 17 Years | 0 (0.0%) | 0 (0.0%) |
| 18 to 34 Years | 0 (0.0%) | 0 (0.0%) |
| 35 to 64 Years | 0 (0.0%) | 0 (0.0%) |
| 65 to 74 Years | 0 (0.0%) | 0 (0.0%) |
| 75 Years and over | 0 (0.0%) | 0 (0.0%) |
Disability Class: Vision Difficulty
| Age Bracket | Male | Female |
| Under 5 Years | 0 (0.0%) | 0 (0.0%) |
| 5 to 17 Years | 0 (0.0%) | 0 (0.0%) |
| 18 to 34 Years | 0 (0.0%) | 0 (0.0%) |
| 35 to 64 Years | 0 (0.0%) | 0 (0.0%) |
| 65 to 74 Years | 0 (0.0%) | 0 (0.0%) |
| 75 Years and over | 0 (0.0%) | 0 (0.0%) |
Disability Class: Cognitive Difficulty
| Age Bracket | Male | Female |
| 5 to 17 Years | 0 (0.0%) | 0 (0.0%) |
| 18 to 34 Years | 0 (0.0%) | 0 (0.0%) |
| 35 to 64 Years | 0 (0.0%) | 0 (0.0%) |
| 65 to 74 Years | 0 (0.0%) | 0 (0.0%) |
| 75 Years and over | 0 (0.0%) | 0 (0.0%) |
Disability Class: Ambulatory Difficulty
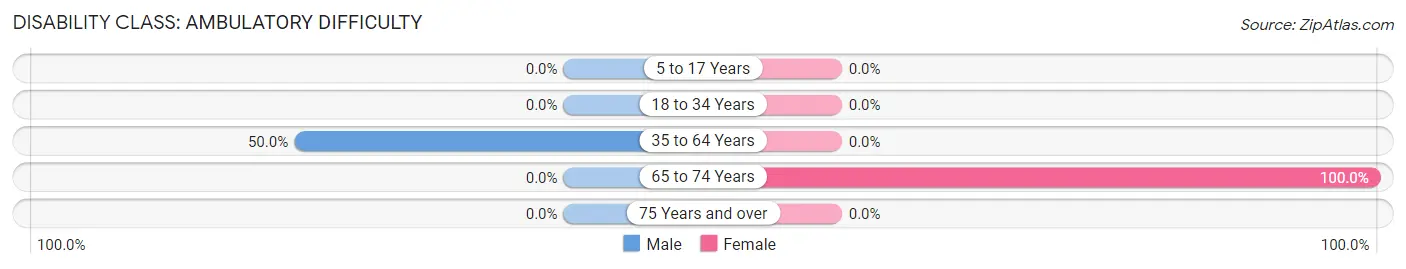
| Age Bracket | Male | Female |
| 5 to 17 Years | 0 (0.0%) | 0 (0.0%) |
| 18 to 34 Years | 0 (0.0%) | 0 (0.0%) |
| 35 to 64 Years | 14 (50.0%) | 0 (0.0%) |
| 65 to 74 Years | 0 (0.0%) | 4 (100.0%) |
| 75 Years and over | 0 (0.0%) | 0 (0.0%) |
Disability Class: Self-Care Difficulty
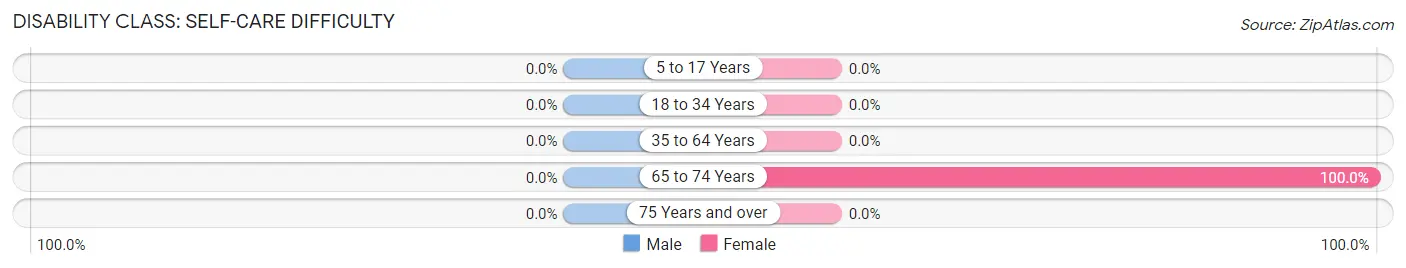
| Age Bracket | Male | Female |
| 5 to 17 Years | 0 (0.0%) | 0 (0.0%) |
| 18 to 34 Years | 0 (0.0%) | 0 (0.0%) |
| 35 to 64 Years | 0 (0.0%) | 0 (0.0%) |
| 65 to 74 Years | 0 (0.0%) | 4 (100.0%) |
| 75 Years and over | 0 (0.0%) | 0 (0.0%) |
Technology Access in Fort Green
Computing Device Access in Fort Green
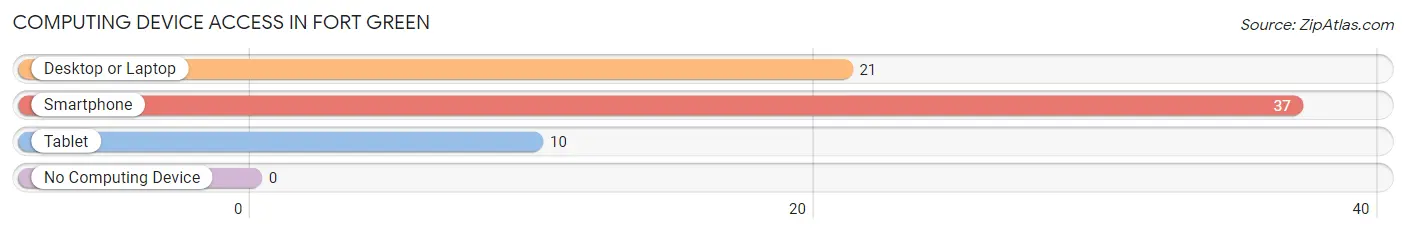
| Device Type | # Households | % Households |
| Desktop or Laptop | 21 | 56.8% |
| Smartphone | 37 | 100.0% |
| Tablet | 10 | 27.0% |
| No Computing Device | 0 | 0.0% |
| Total | 37 | 100.0% |
Internet Access in Fort Green
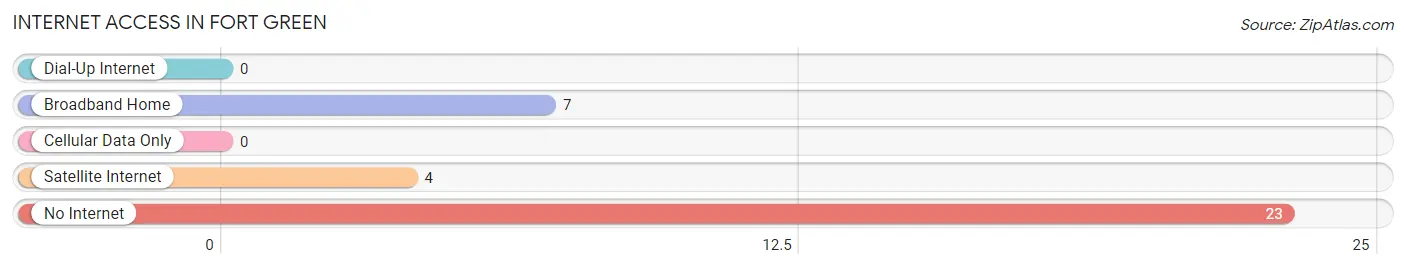
| Internet Type | # Households | % Households |
| Dial-Up Internet | 0 | 0.0% |
| Broadband Home | 7 | 18.9% |
| Cellular Data Only | 0 | 0.0% |
| Satellite Internet | 4 | 10.8% |
| No Internet | 23 | 62.2% |
| Total | 37 | 100.0% |
Fort Green Summary
Fort Green is a small town located in the state of Florida, in the United States. It is situated in the northern part of the state, in the panhandle region, and is part of the larger metropolitan area of Pensacola. The town has a population of approximately 1,500 people, and is known for its rural charm and small-town atmosphere.
History
Fort Green was founded in 1821 by settlers from the nearby town of Pensacola. The town was named after the nearby fort, which was built in 1819 to protect the area from Native American attacks. The fort was abandoned in 1821, and the town was established shortly thereafter.
The town grew slowly over the years, and by the early 1900s, it had become a popular destination for tourists. The town was known for its fishing, hunting, and outdoor recreation. In the 1950s, the town began to experience a population boom, as many people moved to the area to take advantage of the booming economy.
Geography
Fort Green is located in the northern part of Florida, in the panhandle region. It is situated on the banks of the Escambia River, and is surrounded by the Blackwater River State Forest. The town is located approximately 30 miles from Pensacola, and is part of the larger metropolitan area.
The town has a total area of 1.2 square miles, and is located at an elevation of 30 feet above sea level. The climate in the area is humid subtropical, with hot, humid summers and mild winters.
Economy
The economy of Fort Green is largely based on tourism and agriculture. The town is home to several tourist attractions, including the Blackwater River State Forest, which offers camping, fishing, and other outdoor activities. The town is also home to several farms, which produce a variety of crops, including corn, soybeans, and cotton.
The town is also home to several small businesses, including restaurants, shops, and other services. The town is served by the nearby Pensacola International Airport, which provides access to the rest of the state and the country.
Demographics
As of the 2010 census, the population of Fort Green was 1,500 people. The racial makeup of the town was 94.7% White, 1.3% African American, 0.7% Native American, 0.7% Asian, 0.3% from other races, and 2.0% from two or more races. Hispanic or Latino of any race were 1.3% of the population.
The median income for a household in the town was $37,500, and the median income for a family was $45,000. The per capita income for the town was $19,000. About 11.7% of families and 14.3% of the population were below the poverty line, including 18.2% of those under age 18 and 8.3% of those age 65 or over.
Common Questions
What is Per Capita Income in Fort Green?
Per Capita income in Fort Green is $26,166.
What is the Median Family Income in Fort Green?
Median Family Income in Fort Green is $72,083.
What is the Median Household income in Fort Green?
Median Household Income in Fort Green is $70,417.
What is Inequality or Gini Index in Fort Green?
Inequality or Gini Index in Fort Green is 0.20.
What is the Total Population of Fort Green?
Total Population of Fort Green is 105.
What is the Total Male Population of Fort Green?
Total Male Population of Fort Green is 57.
What is the Total Female Population of Fort Green?
Total Female Population of Fort Green is 48.
What is the Ratio of Males per 100 Females in Fort Green?
There are 118.75 Males per 100 Females in Fort Green.
What is the Ratio of Females per 100 Males in Fort Green?
There are 84.21 Females per 100 Males in Fort Green.
What is the Median Population Age in Fort Green?
Median Population Age in Fort Green is 53.9 Years.
What is the Average Family Size in Fort Green
Average Family Size in Fort Green is 3.1 People.
What is the Average Household Size in Fort Green
Average Household Size in Fort Green is 2.8 People.
How Large is the Labor Force in Fort Green?
There are 55 People in the Labor Forcein in Fort Green.
What is the Percentage of People in the Labor Force in Fort Green?
56.7% of People are in the Labor Force in Fort Green.