Womens Bay, AK Map & Demographics
Womens Bay Map
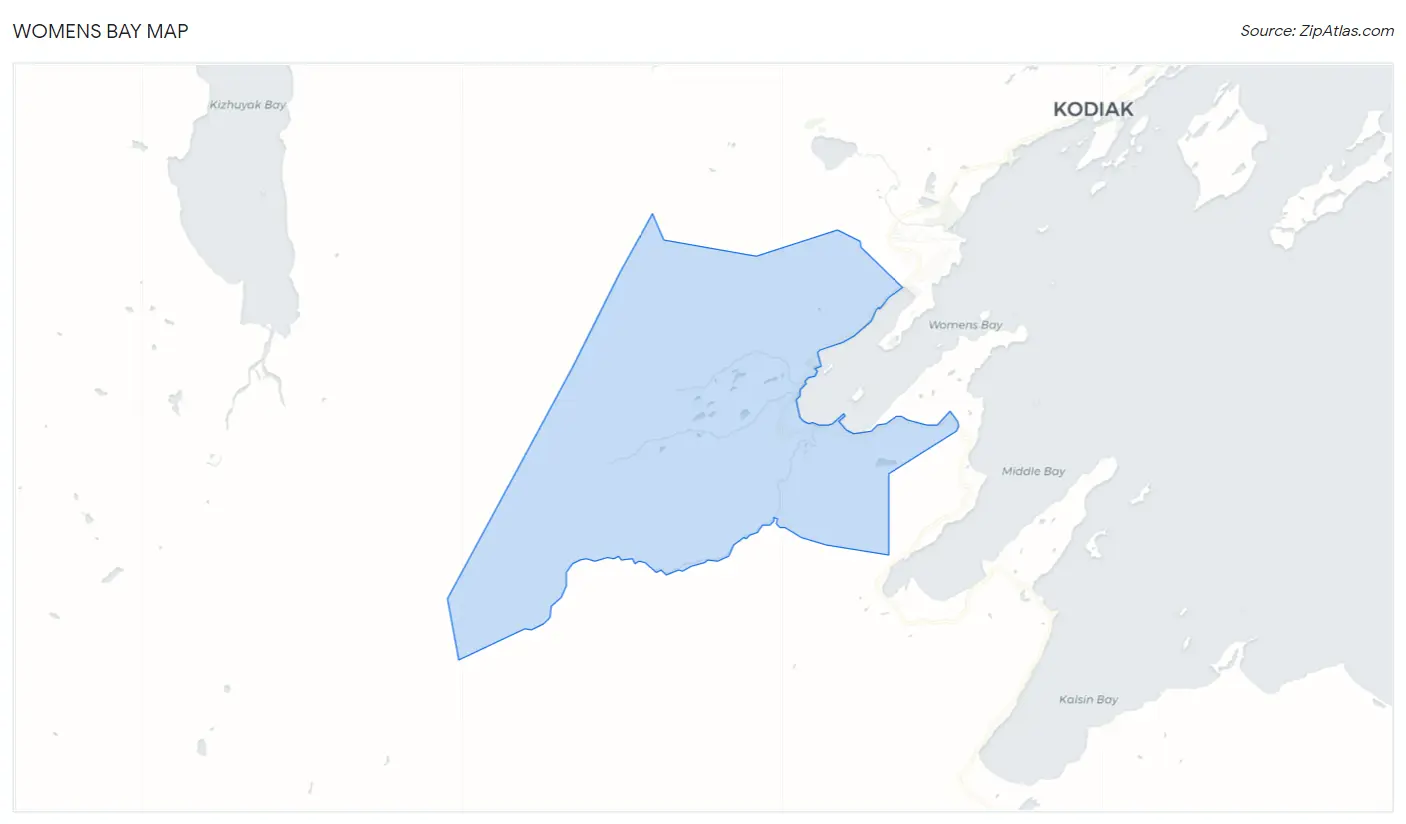
Womens Bay Overview
$47,312
PER CAPITA INCOME
$150,222
AVG FAMILY INCOME
$121,250
AVG HOUSEHOLD INCOME
28.5%
WAGE / INCOME GAP [ % ]
71.5¢/ $1
WAGE / INCOME GAP [ $ ]
0.37
INEQUALITY / GINI INDEX
1,063
TOTAL POPULATION
555
MALE POPULATION
508
FEMALE POPULATION
109.25
MALES / 100 FEMALES
91.53
FEMALES / 100 MALES
35.5
MEDIAN AGE
2.8
AVG FAMILY SIZE
2.5
AVG HOUSEHOLD SIZE
636
LABOR FORCE [ PEOPLE ]
72.4%
PERCENT IN LABOR FORCE
4.1%
UNEMPLOYMENT RATE
Income in Womens Bay
Income Overview in Womens Bay
Per Capita Income in Womens Bay is $47,312, while median incomes of families and households are $150,222 and $121,250 respectively.
| Characteristic | Number | Measure |
| Per Capita Income | 1,063 | $47,312 |
| Median Family Income | 340 | $150,222 |
| Mean Family Income | 340 | $133,092 |
| Median Household Income | 417 | $121,250 |
| Mean Household Income | 417 | $118,602 |
| Income Deficit | 340 | $0 |
| Wage / Income Gap (%) | 1,063 | 28.47% |
| Wage / Income Gap ($) | 1,063 | 71.53¢ per $1 |
| Gini / Inequality Index | 1,063 | 0.37 |
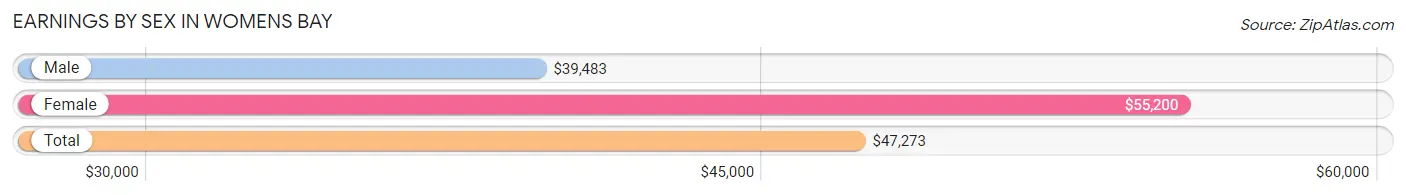
Earnings by Sex in Womens Bay
Average Earnings in Womens Bay are $47,273, $39,483 for men and $55,200 for women, a difference of 28.5%.
| Sex | Number | Average Earnings |
| Male | 410 (57.8%) | $39,483 |
| Female | 300 (42.2%) | $55,200 |
| Total | 710 (100.0%) | $47,273 |
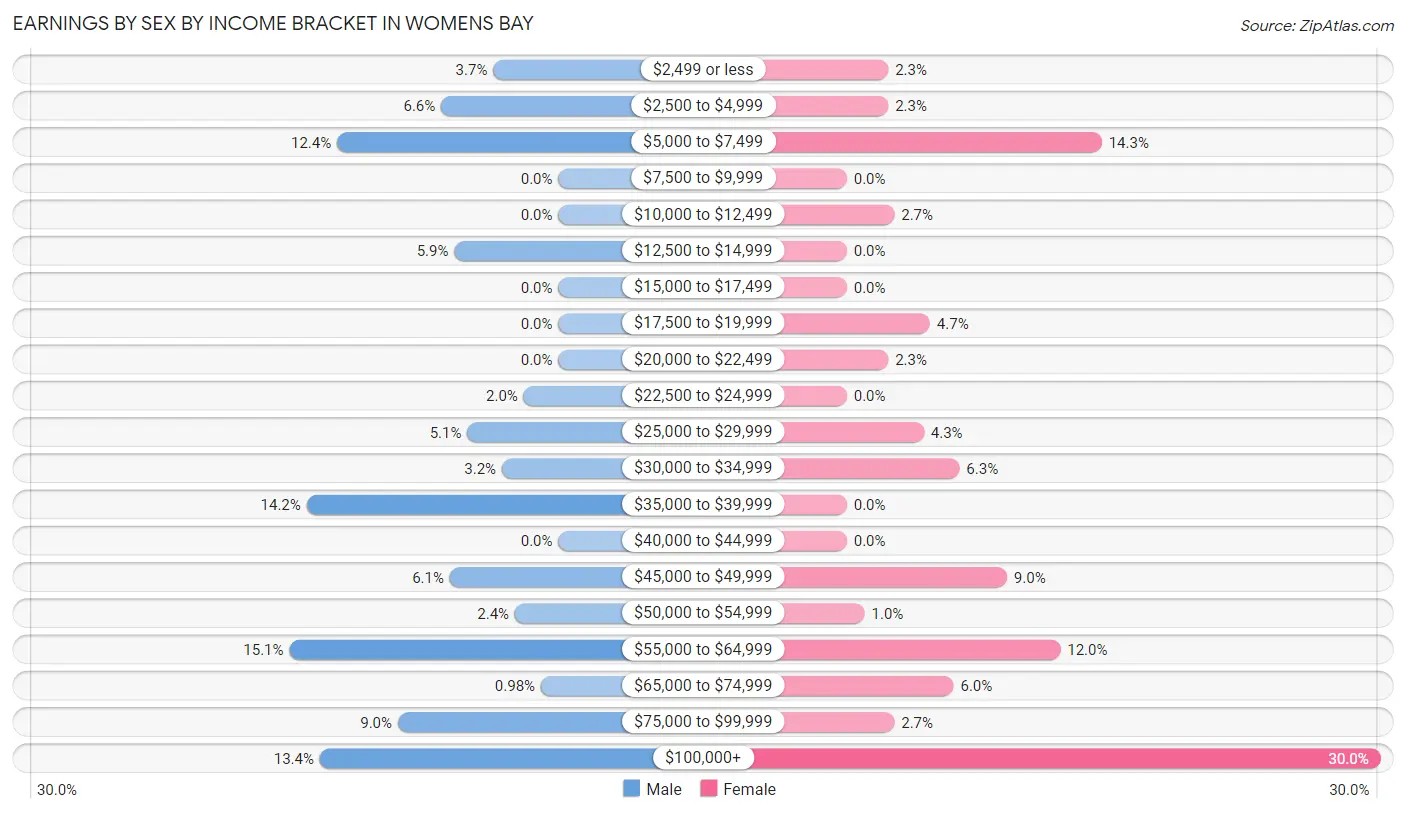
Earnings by Sex by Income Bracket in Womens Bay
The most common earnings brackets in Womens Bay are $55,000 to $64,999 for men (62 | 15.1%) and $100,000+ for women (90 | 30.0%).
| Income | Male | Female |
| $2,499 or less | 15 (3.7%) | 7 (2.3%) |
| $2,500 to $4,999 | 27 (6.6%) | 7 (2.3%) |
| $5,000 to $7,499 | 51 (12.4%) | 43 (14.3%) |
| $7,500 to $9,999 | 0 (0.0%) | 0 (0.0%) |
| $10,000 to $12,499 | 0 (0.0%) | 8 (2.7%) |
| $12,500 to $14,999 | 24 (5.9%) | 0 (0.0%) |
| $15,000 to $17,499 | 0 (0.0%) | 0 (0.0%) |
| $17,500 to $19,999 | 0 (0.0%) | 14 (4.7%) |
| $20,000 to $22,499 | 0 (0.0%) | 7 (2.3%) |
| $22,500 to $24,999 | 8 (1.9%) | 0 (0.0%) |
| $25,000 to $29,999 | 21 (5.1%) | 13 (4.3%) |
| $30,000 to $34,999 | 13 (3.2%) | 19 (6.3%) |
| $35,000 to $39,999 | 58 (14.1%) | 0 (0.0%) |
| $40,000 to $44,999 | 0 (0.0%) | 0 (0.0%) |
| $45,000 to $49,999 | 25 (6.1%) | 27 (9.0%) |
| $50,000 to $54,999 | 10 (2.4%) | 3 (1.0%) |
| $55,000 to $64,999 | 62 (15.1%) | 36 (12.0%) |
| $65,000 to $74,999 | 4 (1.0%) | 18 (6.0%) |
| $75,000 to $99,999 | 37 (9.0%) | 8 (2.7%) |
| $100,000+ | 55 (13.4%) | 90 (30.0%) |
| Total | 410 (100.0%) | 300 (100.0%) |
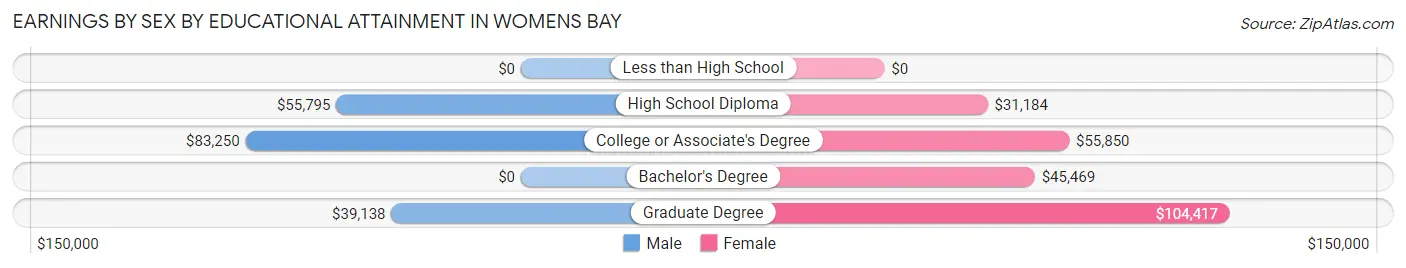
Earnings by Sex by Educational Attainment in Womens Bay
Average earnings in Womens Bay are $49,408 for men and $56,600 for women, a difference of 12.7%. Men with an educational attainment of college or associate's degree enjoy the highest average annual earnings of $83,250, while those with graduate degree education earn the least with $39,138. Women with an educational attainment of graduate degree earn the most with the average annual earnings of $104,417, while those with high school diploma education have the smallest earnings of $31,184.
| Educational Attainment | Male Income | Female Income |
| Less than High School | - | - |
| High School Diploma | $55,795 | $31,184 |
| College or Associate's Degree | $83,250 | $55,850 |
| Bachelor's Degree | - | - |
| Graduate Degree | $39,138 | $104,417 |
| Total | $49,408 | $56,600 |
Family Income in Womens Bay
Family Income Brackets in Womens Bay
According to the Womens Bay family income data, there are 111 families falling into the $150,000 to $199,999 income range, which is the most common income bracket and makes up 32.7% of all families.
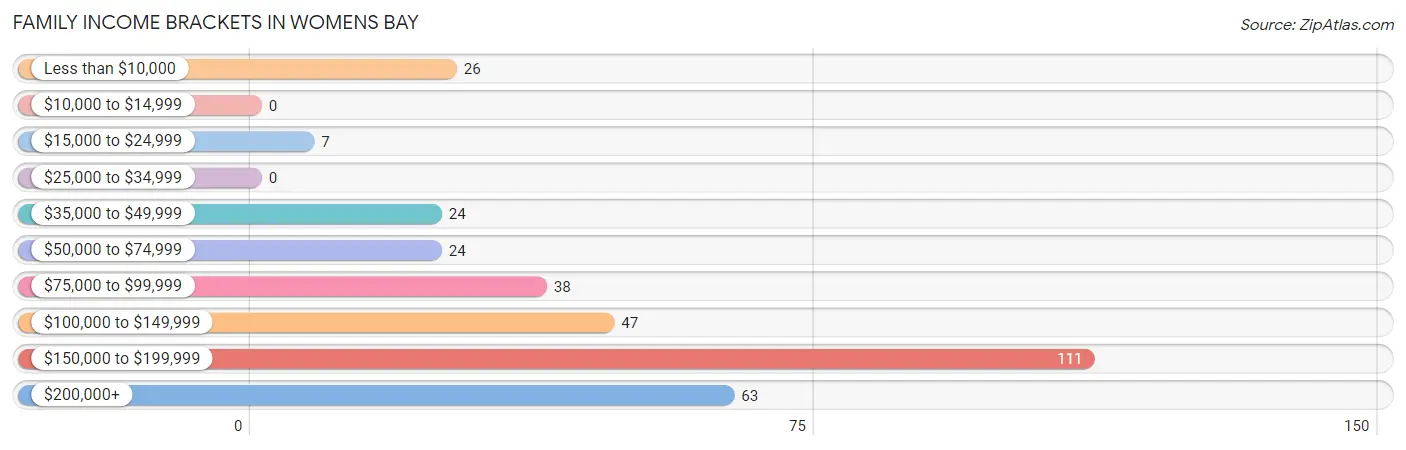
| Income Bracket | # Families | % Families |
| Less than $10,000 | 26 | 7.6% |
| $10,000 to $14,999 | 0 | 0.0% |
| $15,000 to $24,999 | 7 | 2.1% |
| $25,000 to $34,999 | 0 | 0.0% |
| $35,000 to $49,999 | 24 | 7.1% |
| $50,000 to $74,999 | 24 | 7.1% |
| $75,000 to $99,999 | 38 | 11.2% |
| $100,000 to $149,999 | 47 | 13.8% |
| $150,000 to $199,999 | 111 | 32.6% |
| $200,000+ | 63 | 18.5% |
Family Income by Famaliy Size in Womens Bay
2-person families (193 | 56.8%) account for the highest median family income in Womens Bay with $150,917 per family, while 2-person families (193 | 56.8%) have the highest median income of $75,458 per family member.
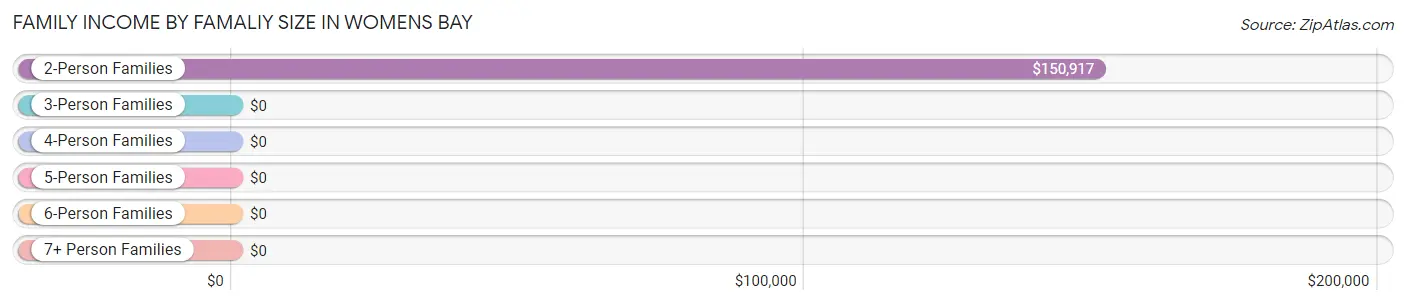
| Income Bracket | # Families | Median Income |
| 2-Person Families | 193 (56.8%) | $150,917 |
| 3-Person Families | 48 (14.1%) | $0 |
| 4-Person Families | 46 (13.5%) | $0 |
| 5-Person Families | 39 (11.5%) | $0 |
| 6-Person Families | 14 (4.1%) | $0 |
| 7+ Person Families | 0 (0.0%) | $0 |
| Total | 340 (100.0%) | $150,222 |
Family Income by Number of Earners in Womens Bay
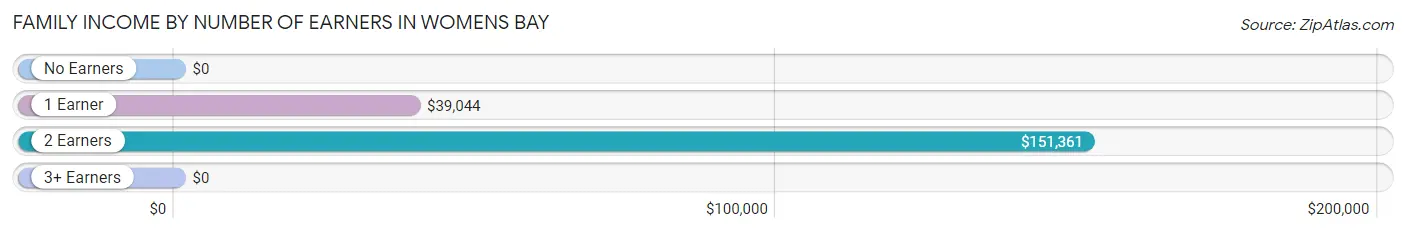
| Number of Earners | # Families | Median Income |
| No Earners | 44 (12.9%) | $0 |
| 1 Earner | 33 (9.7%) | $39,044 |
| 2 Earners | 227 (66.8%) | $151,361 |
| 3+ Earners | 36 (10.6%) | $0 |
| Total | 340 (100.0%) | $150,222 |
Household Income in Womens Bay
Household Income Brackets in Womens Bay
With 103 households falling in the category, the $150,000 to $199,999 income range is the most frequent in Womens Bay, accounting for 24.7% of all households.
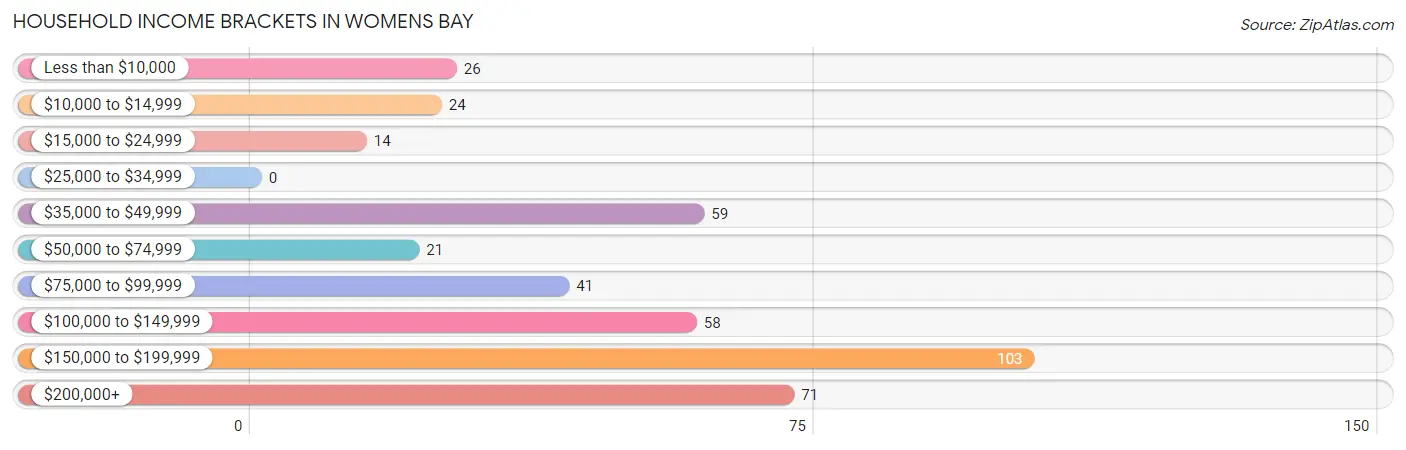
| Income Bracket | # Households | % Households |
| Less than $10,000 | 26 | 6.2% |
| $10,000 to $14,999 | 24 | 5.8% |
| $15,000 to $24,999 | 14 | 3.4% |
| $25,000 to $34,999 | 0 | 0.0% |
| $35,000 to $49,999 | 59 | 14.1% |
| $50,000 to $74,999 | 21 | 5.0% |
| $75,000 to $99,999 | 41 | 9.8% |
| $100,000 to $149,999 | 58 | 13.9% |
| $150,000 to $199,999 | 103 | 24.7% |
| $200,000+ | 71 | 17.0% |
Household Income by Householder Age in Womens Bay
The median household income in Womens Bay is $121,250, with the highest median household income of $152,656 found in the 45 to 64 years age bracket for the primary householder. A total of 129 households (30.9%) fall into this category.
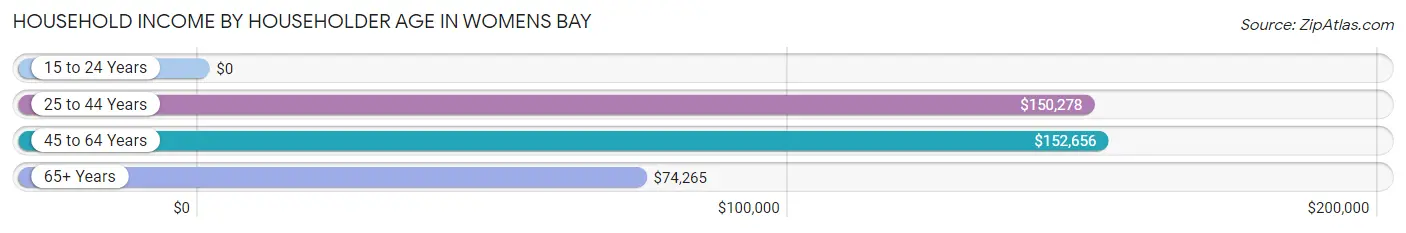
| Income Bracket | # Households | Median Income |
| 15 to 24 Years | 0 (0.0%) | $0 |
| 25 to 44 Years | 166 (39.8%) | $150,278 |
| 45 to 64 Years | 129 (30.9%) | $152,656 |
| 65+ Years | 122 (29.3%) | $74,265 |
| Total | 417 (100.0%) | $121,250 |
Poverty in Womens Bay
Income Below Poverty by Sex and Age in Womens Bay
With 6.7% poverty level for males and 14.2% for females among the residents of Womens Bay, 35 to 44 year old males and 6 to 11 year old females are the most vulnerable to poverty, with 24 males (19.7%) and 20 females (69.0%) in their respective age groups living below the poverty level.
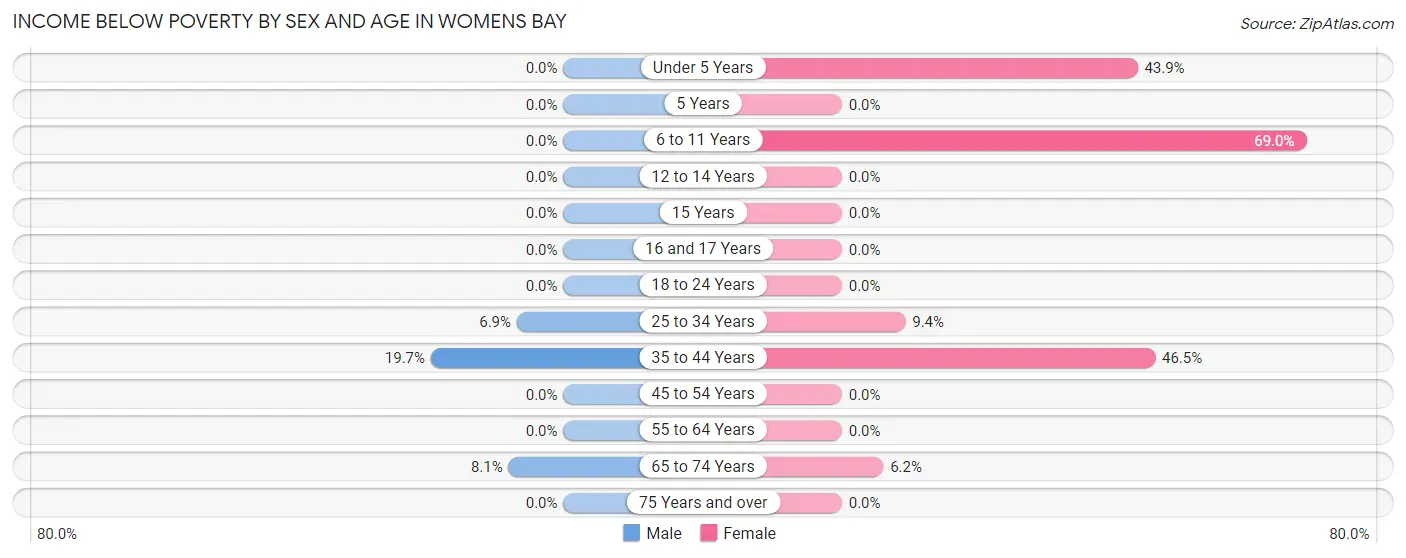
| Age Bracket | Male | Female |
| Under 5 Years | 0 (0.0%) | 18 (43.9%) |
| 5 Years | 0 (0.0%) | 0 (0.0%) |
| 6 to 11 Years | 0 (0.0%) | 20 (69.0%) |
| 12 to 14 Years | 0 (0.0%) | 0 (0.0%) |
| 15 Years | 0 (0.0%) | 0 (0.0%) |
| 16 and 17 Years | 0 (0.0%) | 0 (0.0%) |
| 18 to 24 Years | 0 (0.0%) | 0 (0.0%) |
| 25 to 34 Years | 6 (6.9%) | 10 (9.4%) |
| 35 to 44 Years | 24 (19.7%) | 20 (46.5%) |
| 45 to 54 Years | 0 (0.0%) | 0 (0.0%) |
| 55 to 64 Years | 0 (0.0%) | 0 (0.0%) |
| 65 to 74 Years | 7 (8.1%) | 4 (6.1%) |
| 75 Years and over | 0 (0.0%) | 0 (0.0%) |
| Total | 37 (6.7%) | 72 (14.2%) |
Income Above Poverty by Sex and Age in Womens Bay
According to the poverty statistics in Womens Bay, males aged under 5 years and females aged 12 to 14 years are the age groups that are most secure financially, with 100.0% of males and 100.0% of females in these age groups living above the poverty line.
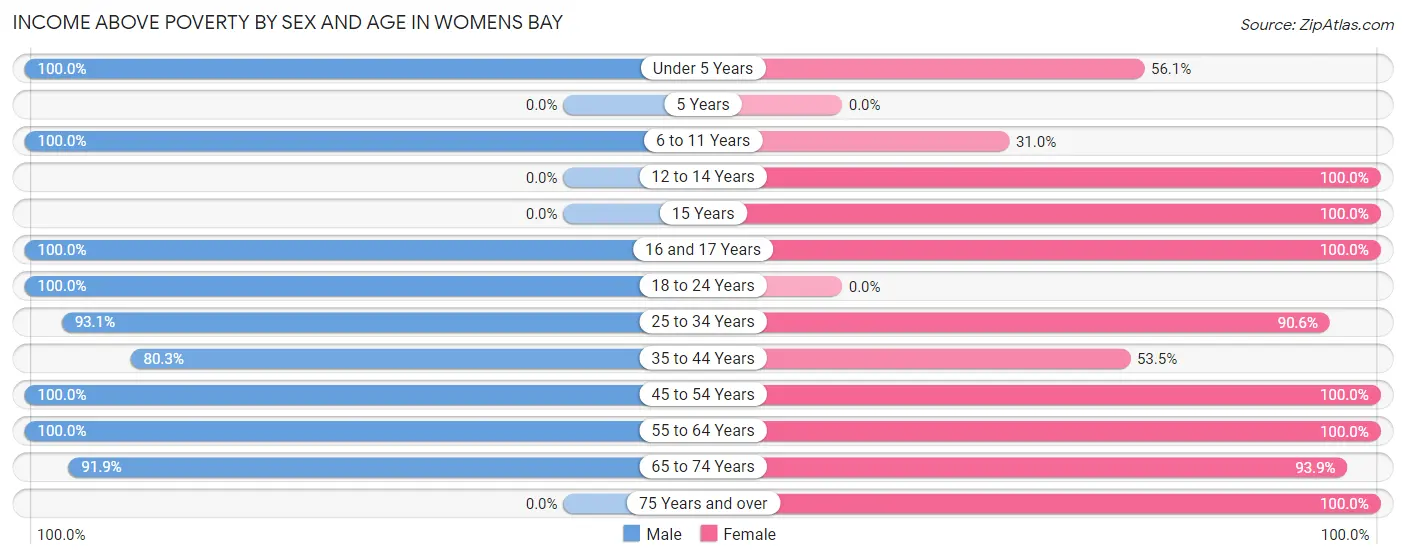
| Age Bracket | Male | Female |
| Under 5 Years | 14 (100.0%) | 23 (56.1%) |
| 5 Years | 0 (0.0%) | 0 (0.0%) |
| 6 to 11 Years | 57 (100.0%) | 9 (31.0%) |
| 12 to 14 Years | 0 (0.0%) | 29 (100.0%) |
| 15 Years | 0 (0.0%) | 11 (100.0%) |
| 16 and 17 Years | 34 (100.0%) | 28 (100.0%) |
| 18 to 24 Years | 65 (100.0%) | 0 (0.0%) |
| 25 to 34 Years | 81 (93.1%) | 96 (90.6%) |
| 35 to 44 Years | 98 (80.3%) | 23 (53.5%) |
| 45 to 54 Years | 9 (100.0%) | 42 (100.0%) |
| 55 to 64 Years | 78 (100.0%) | 90 (100.0%) |
| 65 to 74 Years | 79 (91.9%) | 61 (93.9%) |
| 75 Years and over | 0 (0.0%) | 24 (100.0%) |
| Total | 515 (93.3%) | 436 (85.8%) |
Income Below Poverty Among Married-Couple Families in Womens Bay
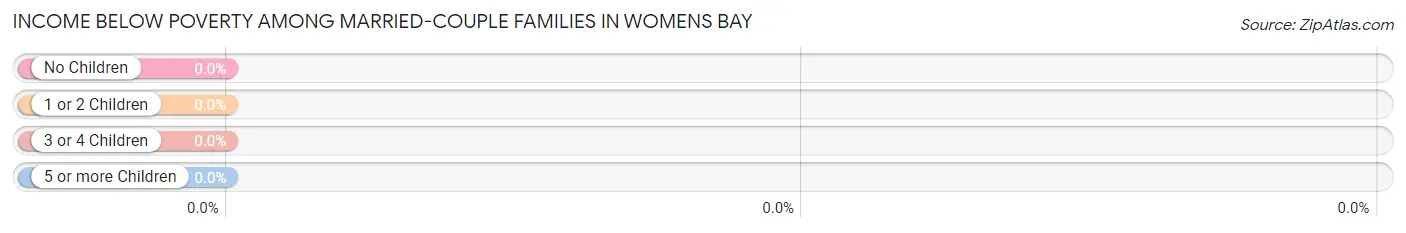
| Children | Above Poverty | Below Poverty |
| No Children | 187 (100.0%) | 0 (0.0%) |
| 1 or 2 Children | 38 (100.0%) | 0 (0.0%) |
| 3 or 4 Children | 29 (100.0%) | 0 (0.0%) |
| 5 or more Children | 0 (0.0%) | 0 (0.0%) |
| Total | 254 (100.0%) | 0 (0.0%) |
Income Below Poverty Among Single-Parent Households in Womens Bay
According to the poverty data in Womens Bay, 100.0% or 6 single-father households and 25.0% or 20 single-mother households are living below the poverty line. Among single-father households, those with 1 or 2 children have the highest poverty rate, with 6 households (100.0%) experiencing poverty. Likewise, among single-mother households, those with 3 or 4 children have the highest poverty rate, with 20 households (100.0%) falling below the poverty line.
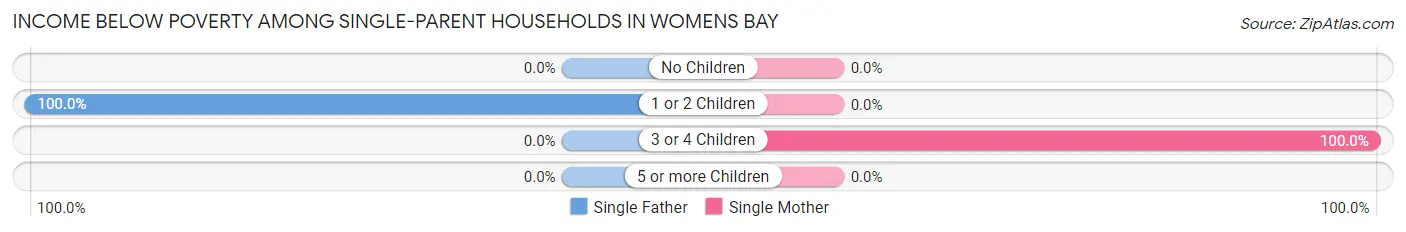
| Children | Single Father | Single Mother |
| No Children | 0 (0.0%) | 0 (0.0%) |
| 1 or 2 Children | 6 (100.0%) | 0 (0.0%) |
| 3 or 4 Children | 0 (0.0%) | 20 (100.0%) |
| 5 or more Children | 0 (0.0%) | 0 (0.0%) |
| Total | 6 (100.0%) | 20 (25.0%) |
Income Below Poverty Among Married-Couple vs Single-Parent Households in Womens Bay
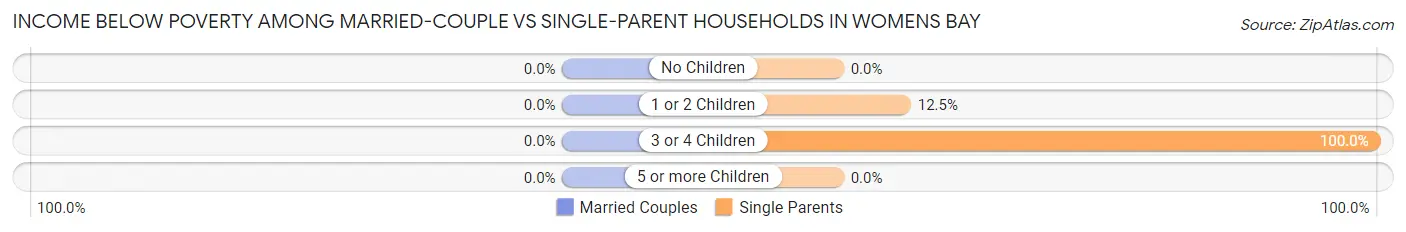
| Children | Married-Couple Families | Single-Parent Households |
| No Children | 0 (0.0%) | 0 (0.0%) |
| 1 or 2 Children | 0 (0.0%) | 6 (12.5%) |
| 3 or 4 Children | 0 (0.0%) | 20 (100.0%) |
| 5 or more Children | 0 (0.0%) | 0 (0.0%) |
| Total | 0 (0.0%) | 26 (30.2%) |
Race in Womens Bay
The most populous races in Womens Bay are White / Caucasian (795 | 74.8%), Two or more Races (147 | 13.8%), and Native / Alaskan (121 | 11.4%).
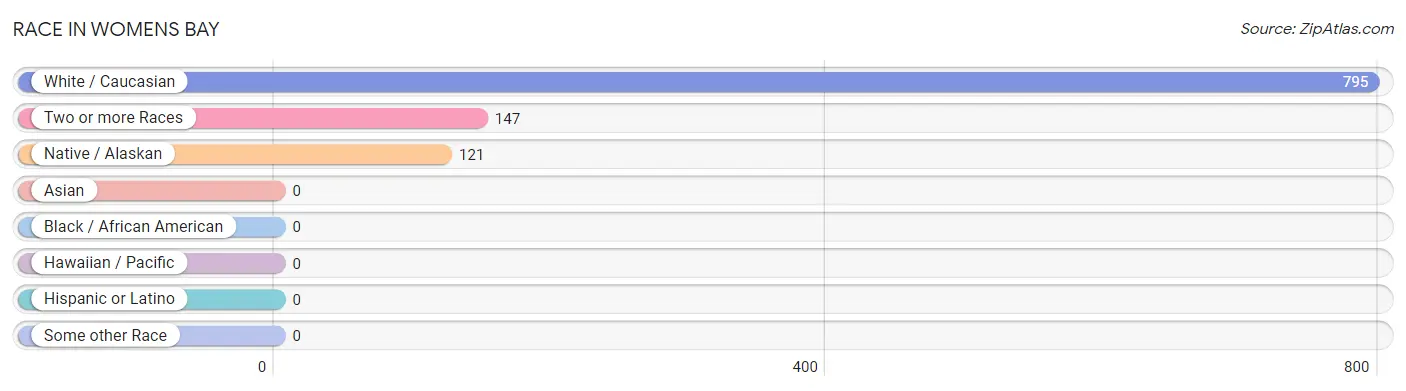
| Race | # Population | % Population |
| Asian | 0 | 0.0% |
| Black / African American | 0 | 0.0% |
| Hawaiian / Pacific | 0 | 0.0% |
| Hispanic or Latino | 0 | 0.0% |
| Native / Alaskan | 121 | 11.4% |
| White / Caucasian | 795 | 74.8% |
| Two or more Races | 147 | 13.8% |
| Some other Race | 0 | 0.0% |
| Total | 1,063 | 100.0% |
Ancestry in Womens Bay
The most populous ancestries reported in Womens Bay are Aleut (192 | 18.1%), Danish (140 | 13.2%), German (133 | 12.5%), Swedish (128 | 12.0%), and Norwegian (56 | 5.3%), together accounting for 61.0% of all Womens Bay residents.
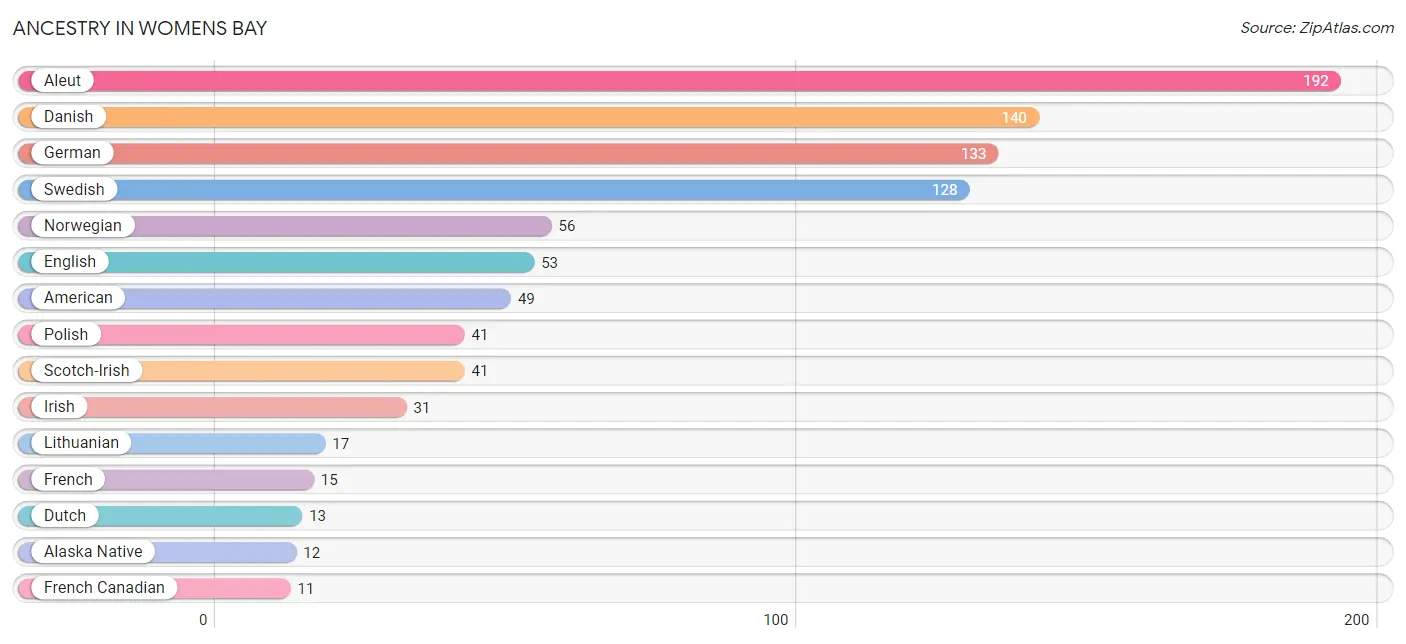
| Ancestry | # Population | % Population |
| Alaska Native | 12 | 1.1% |
| Aleut | 192 | 18.1% |
| American | 49 | 4.6% |
| British | 8 | 0.7% |
| Canadian | 9 | 0.9% |
| Danish | 140 | 13.2% |
| Dutch | 13 | 1.2% |
| English | 53 | 5.0% |
| European | 8 | 0.7% |
| French | 15 | 1.4% |
| French Canadian | 11 | 1.0% |
| German | 133 | 12.5% |
| Irish | 31 | 2.9% |
| Italian | 11 | 1.0% |
| Korean | 4 | 0.4% |
| Lithuanian | 17 | 1.6% |
| Norwegian | 56 | 5.3% |
| Polish | 41 | 3.9% |
| Portuguese | 7 | 0.7% |
| Scotch-Irish | 41 | 3.9% |
| Swedish | 128 | 12.0% |
| Welsh | 8 | 0.7% | View All 22 Rows |
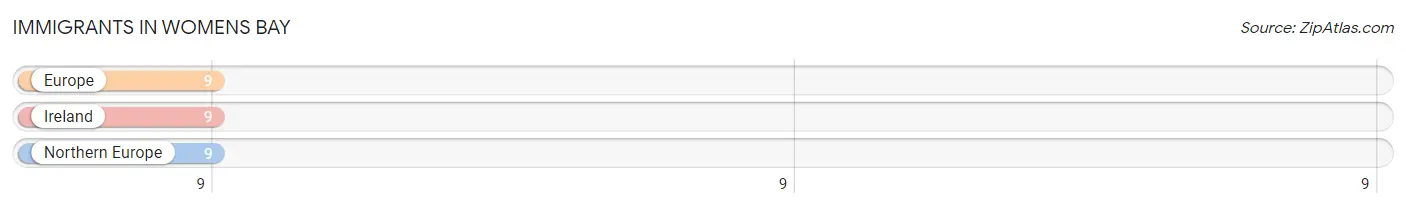
Immigrants in Womens Bay
The most numerous immigrant groups reported in Womens Bay came from Europe (9 | 0.9%), Ireland (9 | 0.9%), and Northern Europe (9 | 0.9%), together accounting for 2.6% of all Womens Bay residents.
| Immigration Origin | # Population | % Population |
| Europe | 9 | 0.9% |
| Ireland | 9 | 0.9% |
| Northern Europe | 9 | 0.9% | View All 3 Rows |
Sex and Age in Womens Bay
Sex and Age in Womens Bay
The most populous age groups in Womens Bay are 35 to 39 Years (100 | 18.0%) for men and 30 to 34 Years (92 | 18.1%) for women.
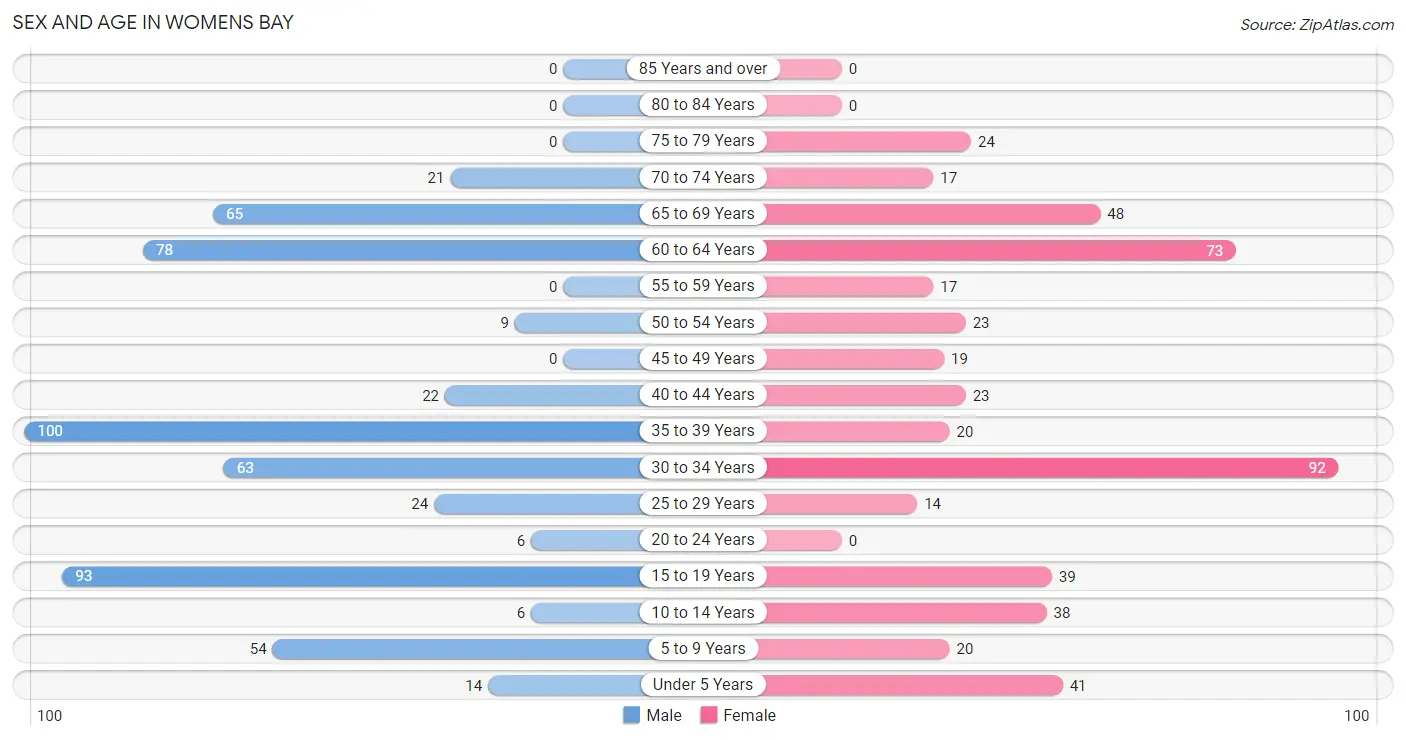
| Age Bracket | Male | Female |
| Under 5 Years | 14 (2.5%) | 41 (8.1%) |
| 5 to 9 Years | 54 (9.7%) | 20 (3.9%) |
| 10 to 14 Years | 6 (1.1%) | 38 (7.5%) |
| 15 to 19 Years | 93 (16.8%) | 39 (7.7%) |
| 20 to 24 Years | 6 (1.1%) | 0 (0.0%) |
| 25 to 29 Years | 24 (4.3%) | 14 (2.8%) |
| 30 to 34 Years | 63 (11.4%) | 92 (18.1%) |
| 35 to 39 Years | 100 (18.0%) | 20 (3.9%) |
| 40 to 44 Years | 22 (4.0%) | 23 (4.5%) |
| 45 to 49 Years | 0 (0.0%) | 19 (3.7%) |
| 50 to 54 Years | 9 (1.6%) | 23 (4.5%) |
| 55 to 59 Years | 0 (0.0%) | 17 (3.4%) |
| 60 to 64 Years | 78 (14.1%) | 73 (14.4%) |
| 65 to 69 Years | 65 (11.7%) | 48 (9.5%) |
| 70 to 74 Years | 21 (3.8%) | 17 (3.4%) |
| 75 to 79 Years | 0 (0.0%) | 24 (4.7%) |
| 80 to 84 Years | 0 (0.0%) | 0 (0.0%) |
| 85 Years and over | 0 (0.0%) | 0 (0.0%) |
| Total | 555 (100.0%) | 508 (100.0%) |
Families and Households in Womens Bay
Median Family Size in Womens Bay
The median family size in Womens Bay is 2.80 persons per family, with single female/mother families (80 | 23.5%) accounting for the largest median family size of 3.19 persons per family. On the other hand, single male/father families (6 | 1.8%) represent the smallest median family size with 2.00 persons per family.
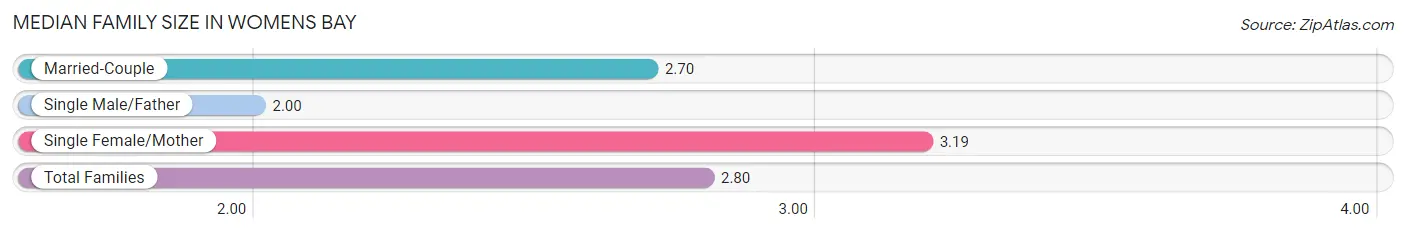
| Family Type | # Families | Family Size |
| Married-Couple | 254 (74.7%) | 2.70 |
| Single Male/Father | 6 (1.8%) | 2.00 |
| Single Female/Mother | 80 (23.5%) | 3.19 |
| Total Families | 340 (100.0%) | 2.80 |
Median Household Size in Womens Bay
The median household size in Womens Bay is 2.55 persons per household, with single female/mother households (80 | 19.2%) accounting for the largest median household size of 3.3 persons per household. non-family households (77 | 18.5%) represent the smallest median household size with 1.05 persons per household.
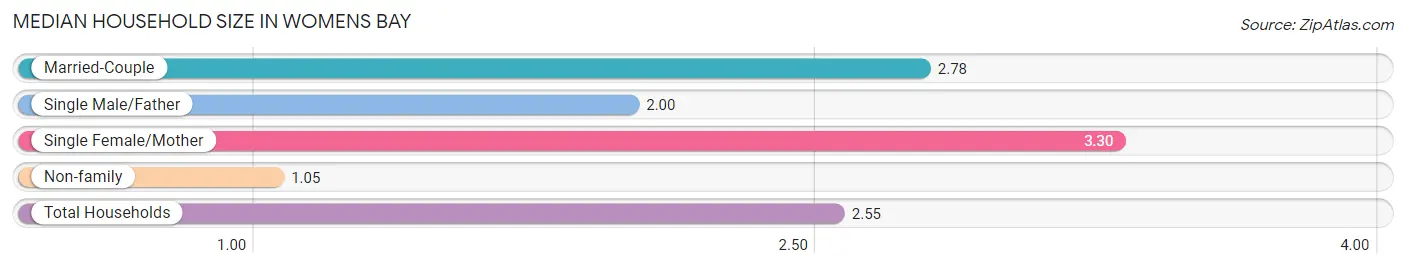
| Household Type | # Households | Household Size |
| Married-Couple | 254 (60.9%) | 2.78 |
| Single Male/Father | 6 (1.4%) | 2.00 |
| Single Female/Mother | 80 (19.2%) | 3.30 |
| Non-family | 77 (18.5%) | 1.05 |
| Total Households | 417 (100.0%) | 2.55 |
Household Size by Marriage Status in Womens Bay
Out of a total of 417 households in Womens Bay, 340 (81.5%) are family households, while 77 (18.5%) are nonfamily households. The most numerous type of family households are 2-person households, comprising 182, and the most common type of nonfamily households are 1-person households, comprising 70.
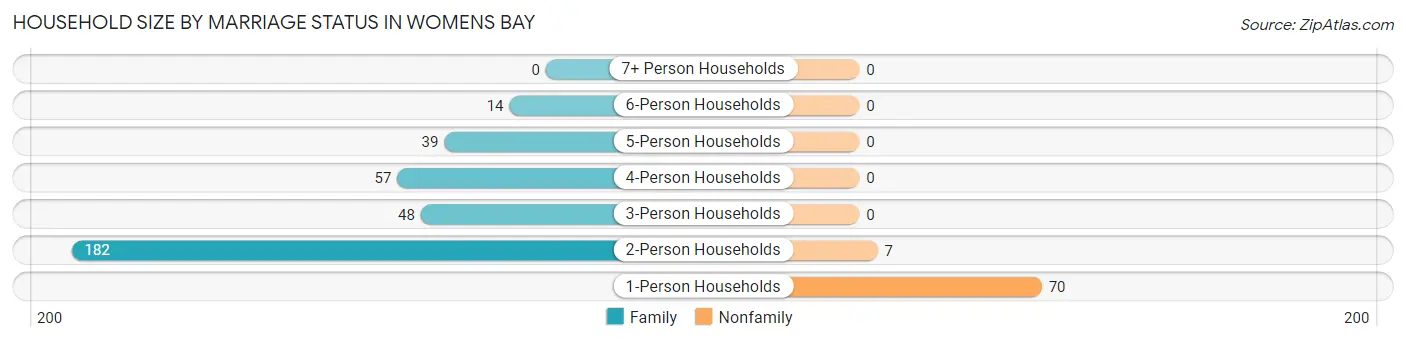
| Household Size | Family Households | Nonfamily Households |
| 1-Person Households | - | 70 (16.8%) |
| 2-Person Households | 182 (43.6%) | 7 (1.7%) |
| 3-Person Households | 48 (11.5%) | 0 (0.0%) |
| 4-Person Households | 57 (13.7%) | 0 (0.0%) |
| 5-Person Households | 39 (9.3%) | 0 (0.0%) |
| 6-Person Households | 14 (3.4%) | 0 (0.0%) |
| 7+ Person Households | 0 (0.0%) | 0 (0.0%) |
| Total | 340 (81.5%) | 77 (18.5%) |
Female Fertility in Womens Bay
Fertility by Age in Womens Bay
Average fertility rate in Womens Bay is 53.0 births per 1,000 women. Women in the age bracket of 20 to 34 years have the highest fertility rate with 104.0 births per 1,000 women. Women in the age bracket of 20 to 34 years acount for 100.0% of all women with births.
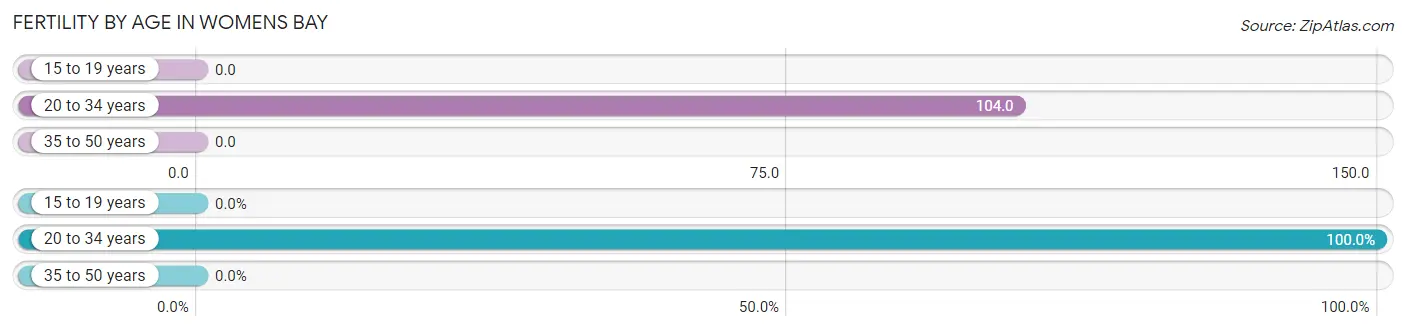
| Age Bracket | Women with Births | Births / 1,000 Women |
| 15 to 19 years | 0 (0.0%) | 0.0 |
| 20 to 34 years | 11 (100.0%) | 104.0 |
| 35 to 50 years | 0 (0.0%) | 0.0 |
| Total | 11 (100.0%) | 53.0 |
Fertility by Age by Marriage Status in Womens Bay
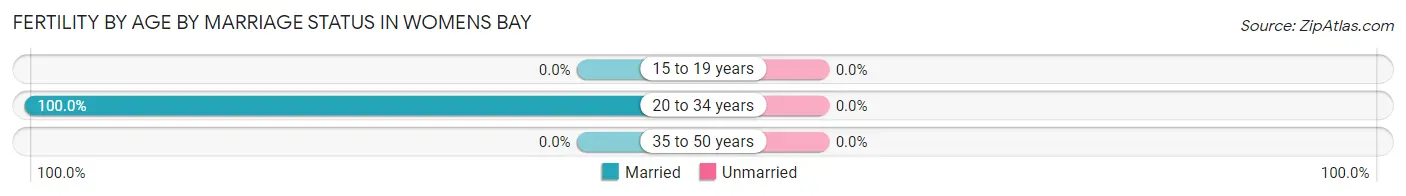
| Age Bracket | Married | Unmarried |
| 15 to 19 years | 0 (0.0%) | 0 (0.0%) |
| 20 to 34 years | 11 (100.0%) | 0 (0.0%) |
| 35 to 50 years | 0 (0.0%) | 0 (0.0%) |
| Total | 11 (100.0%) | 0 (0.0%) |
Fertility by Education in Womens Bay
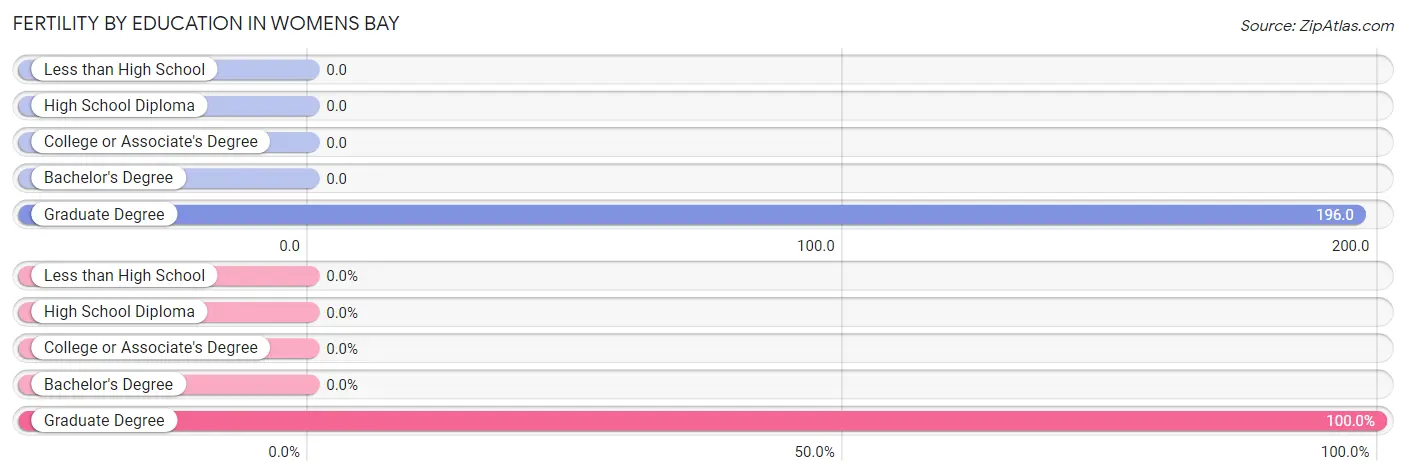
| Educational Attainment | Women with Births | Births / 1,000 Women |
| Less than High School | 0 (0.0%) | 0.0 |
| High School Diploma | 0 (0.0%) | 0.0 |
| College or Associate's Degree | 0 (0.0%) | 0.0 |
| Bachelor's Degree | 0 (0.0%) | 0.0 |
| Graduate Degree | 11 (100.0%) | 196.0 |
| Total | 11 (100.0%) | 53.0 |
Fertility by Education by Marriage Status in Womens Bay
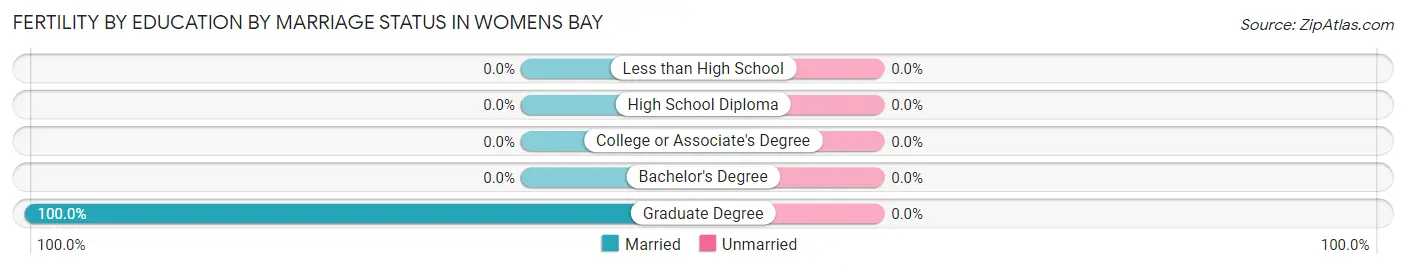
| Educational Attainment | Married | Unmarried |
| Less than High School | 0 (0.0%) | 0 (0.0%) |
| High School Diploma | 0 (0.0%) | 0 (0.0%) |
| College or Associate's Degree | 0 (0.0%) | 0 (0.0%) |
| Bachelor's Degree | 0 (0.0%) | 0 (0.0%) |
| Graduate Degree | 11 (100.0%) | 0 (0.0%) |
| Total | 11 (100.0%) | 0 (0.0%) |
Employment Characteristics in Womens Bay
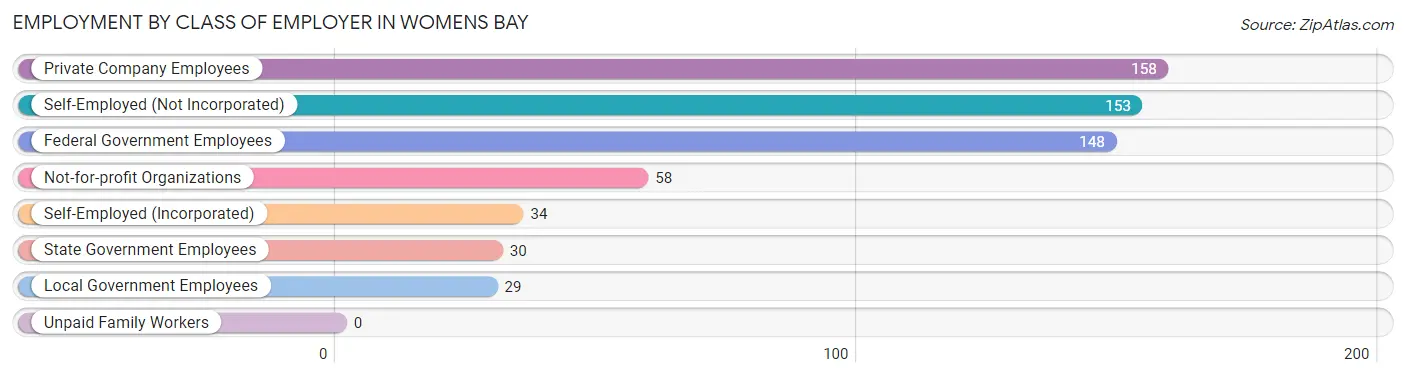
Employment by Class of Employer in Womens Bay
Among the 610 employed individuals in Womens Bay, private company employees (158 | 25.9%), self-employed (not incorporated) (153 | 25.1%), and federal government employees (148 | 24.3%) make up the most common classes of employment.
| Employer Class | # Employees | % Employees |
| Private Company Employees | 158 | 25.9% |
| Self-Employed (Incorporated) | 34 | 5.6% |
| Self-Employed (Not Incorporated) | 153 | 25.1% |
| Not-for-profit Organizations | 58 | 9.5% |
| Local Government Employees | 29 | 4.8% |
| State Government Employees | 30 | 4.9% |
| Federal Government Employees | 148 | 24.3% |
| Unpaid Family Workers | 0 | 0.0% |
| Total | 610 | 100.0% |
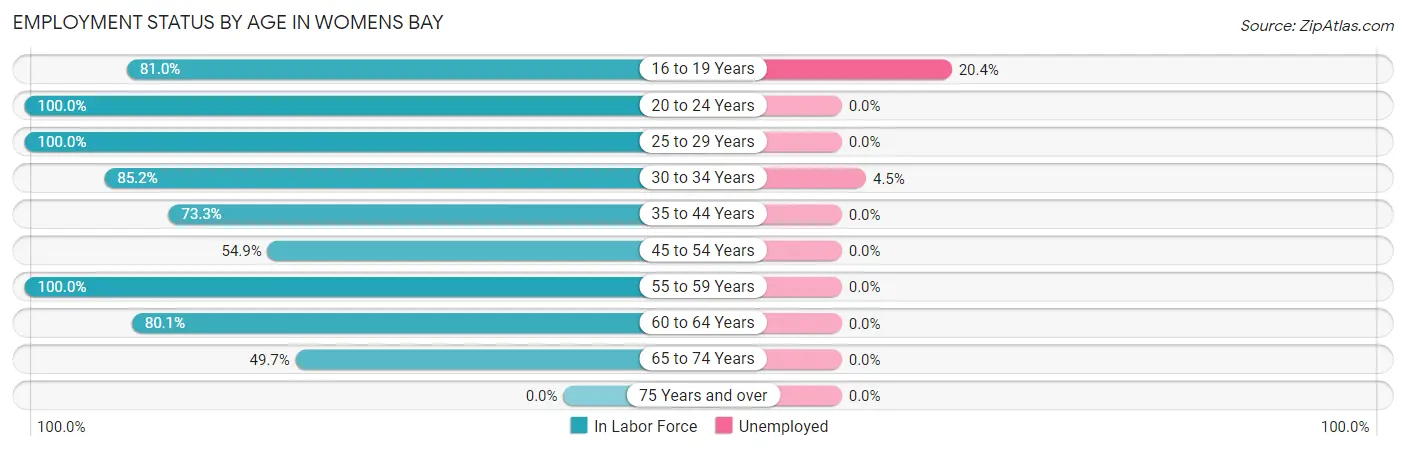
Employment Status by Age in Womens Bay
According to the labor force statistics for Womens Bay, out of the total population over 16 years of age (879), 72.4% or 636 individuals are in the labor force, with 4.1% or 26 of them unemployed. The age group with the highest labor force participation rate is 20 to 24 years, with 100.0% or 6 individuals in the labor force. Within the labor force, the 16 to 19 years age range has the highest percentage of unemployed individuals, with 20.4% or 20 of them being unemployed.
| Age Bracket | In Labor Force | Unemployed |
| 16 to 19 Years | 98 (81.0%) | 20 (20.4%) |
| 20 to 24 Years | 6 (100.0%) | 0 (0.0%) |
| 25 to 29 Years | 38 (100.0%) | 0 (0.0%) |
| 30 to 34 Years | 132 (85.2%) | 6 (4.5%) |
| 35 to 44 Years | 121 (73.3%) | 0 (0.0%) |
| 45 to 54 Years | 28 (54.9%) | 0 (0.0%) |
| 55 to 59 Years | 17 (100.0%) | 0 (0.0%) |
| 60 to 64 Years | 121 (80.1%) | 0 (0.0%) |
| 65 to 74 Years | 75 (49.7%) | 0 (0.0%) |
| 75 Years and over | 0 (0.0%) | 0 (0.0%) |
| Total | 636 (72.4%) | 26 (4.1%) |
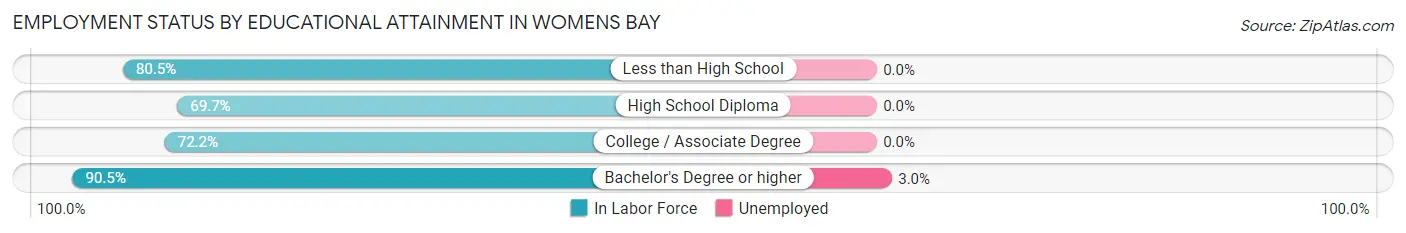
Employment Status by Educational Attainment in Womens Bay
According to labor force statistics for Womens Bay, 79.2% of individuals (457) out of the total population between 25 and 64 years of age (577) are in the labor force, with 1.3% or 6 of them being unemployed. The group with the highest labor force participation rate are those with the educational attainment of bachelor's degree or higher, with 90.5% or 199 individuals in the labor force. Within the labor force, individuals with bachelor's degree or higher education have the highest percentage of unemployment, with 3.0% or 6 of them being unemployed.
| Educational Attainment | In Labor Force | Unemployed |
| Less than High School | 33 (80.5%) | 0 (0.0%) |
| High School Diploma | 85 (69.7%) | 0 (0.0%) |
| College / Associate Degree | 140 (72.2%) | 0 (0.0%) |
| Bachelor's Degree or higher | 199 (90.5%) | 7 (3.0%) |
| Total | 457 (79.2%) | 8 (1.3%) |
Employment Occupations by Sex in Womens Bay
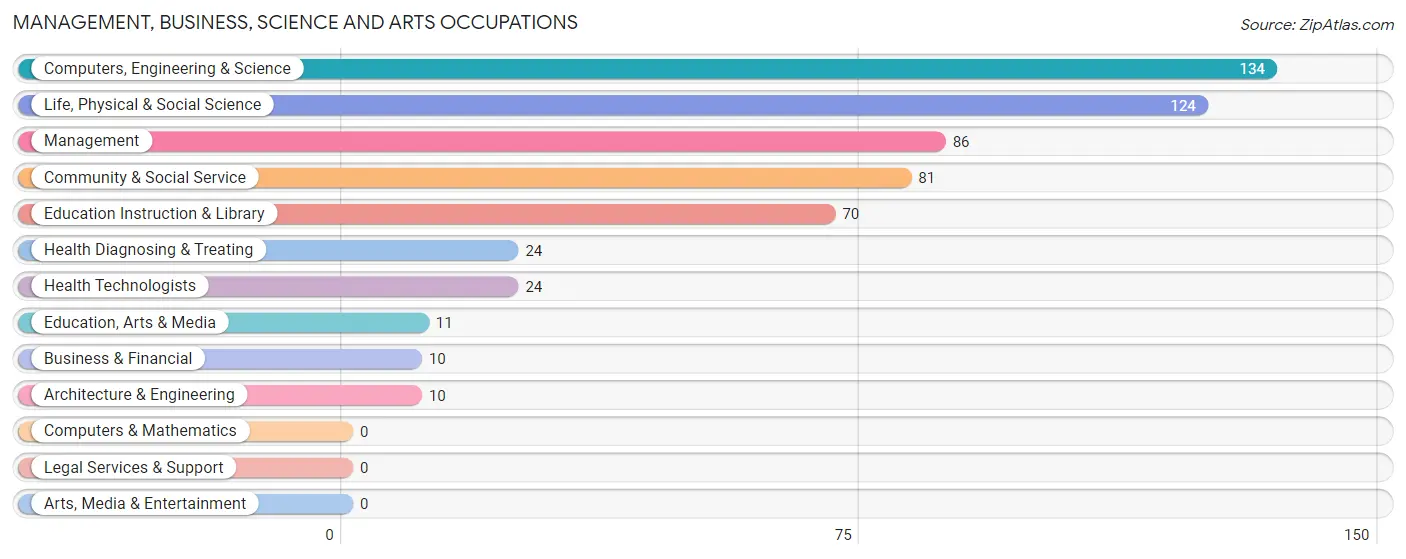
Management, Business, Science and Arts Occupations
The most common Management, Business, Science and Arts occupations in Womens Bay are Computers, Engineering & Science (134 | 22.2%), Life, Physical & Social Science (124 | 20.6%), Management (86 | 14.3%), Community & Social Service (81 | 13.4%), and Education Instruction & Library (70 | 11.6%).
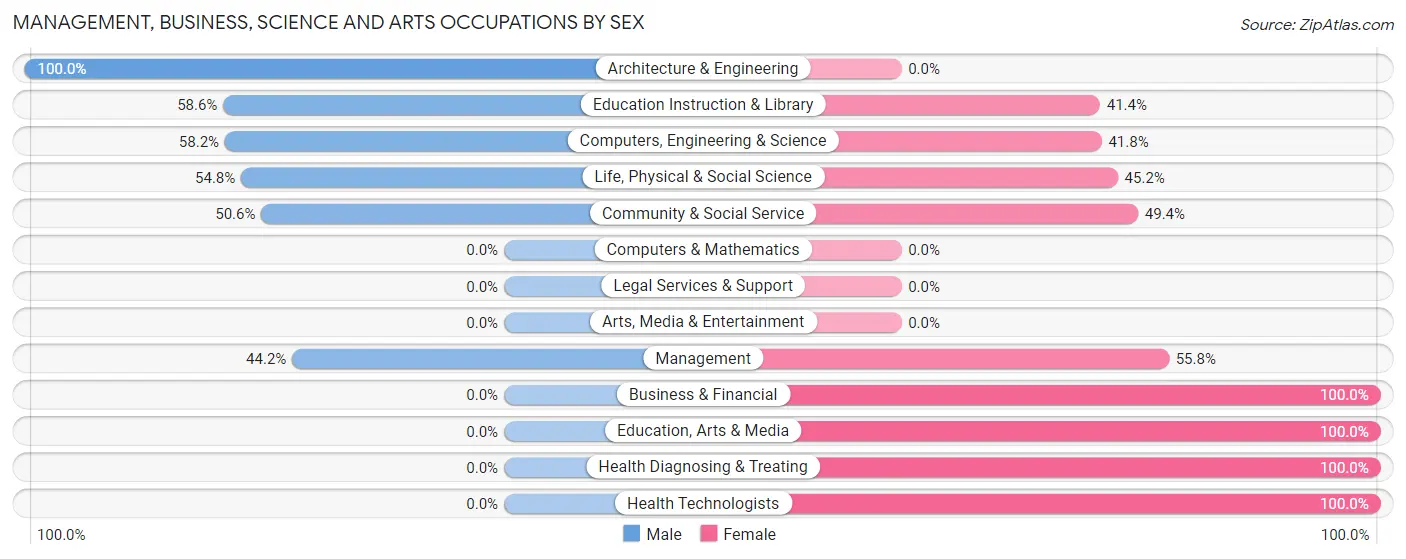
Management, Business, Science and Arts Occupations by Sex
Within the Management, Business, Science and Arts occupations in Womens Bay, the most male-oriented occupations are Architecture & Engineering (100.0%), Education Instruction & Library (58.6%), and Computers, Engineering & Science (58.2%), while the most female-oriented occupations are Business & Financial (100.0%), Education, Arts & Media (100.0%), and Health Diagnosing & Treating (100.0%).
| Occupation | Male | Female |
| Management | 38 (44.2%) | 48 (55.8%) |
| Business & Financial | 0 (0.0%) | 10 (100.0%) |
| Computers, Engineering & Science | 78 (58.2%) | 56 (41.8%) |
| Computers & Mathematics | 0 (0.0%) | 0 (0.0%) |
| Architecture & Engineering | 10 (100.0%) | 0 (0.0%) |
| Life, Physical & Social Science | 68 (54.8%) | 56 (45.2%) |
| Community & Social Service | 41 (50.6%) | 40 (49.4%) |
| Education, Arts & Media | 0 (0.0%) | 11 (100.0%) |
| Legal Services & Support | 0 (0.0%) | 0 (0.0%) |
| Education Instruction & Library | 41 (58.6%) | 29 (41.4%) |
| Arts, Media & Entertainment | 0 (0.0%) | 0 (0.0%) |
| Health Diagnosing & Treating | 0 (0.0%) | 24 (100.0%) |
| Health Technologists | 0 (0.0%) | 24 (100.0%) |
| Total (Category) | 157 (46.9%) | 178 (53.1%) |
| Total (Overall) | 329 (54.6%) | 274 (45.4%) |
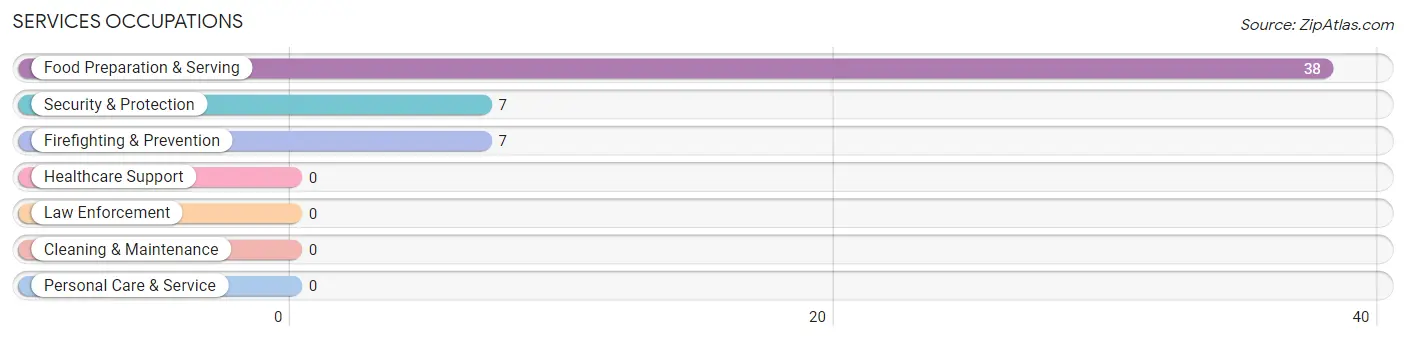
Services Occupations
The most common Services occupations in Womens Bay are Food Preparation & Serving (38 | 6.3%), Security & Protection (7 | 1.2%), and Firefighting & Prevention (7 | 1.2%).
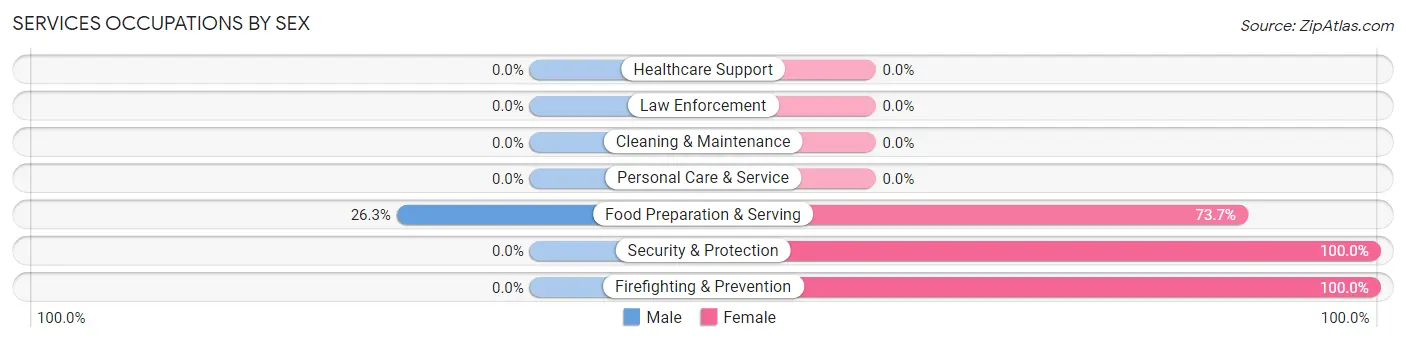
Services Occupations by Sex
| Occupation | Male | Female |
| Healthcare Support | 0 (0.0%) | 0 (0.0%) |
| Security & Protection | 0 (0.0%) | 7 (100.0%) |
| Firefighting & Prevention | 0 (0.0%) | 7 (100.0%) |
| Law Enforcement | 0 (0.0%) | 0 (0.0%) |
| Food Preparation & Serving | 10 (26.3%) | 28 (73.7%) |
| Cleaning & Maintenance | 0 (0.0%) | 0 (0.0%) |
| Personal Care & Service | 0 (0.0%) | 0 (0.0%) |
| Total (Category) | 10 (22.2%) | 35 (77.8%) |
| Total (Overall) | 329 (54.6%) | 274 (45.4%) |
Sales and Office Occupations
The most common Sales and Office occupations in Womens Bay are Sales & Related (88 | 14.6%), and Office & Administration (13 | 2.2%).
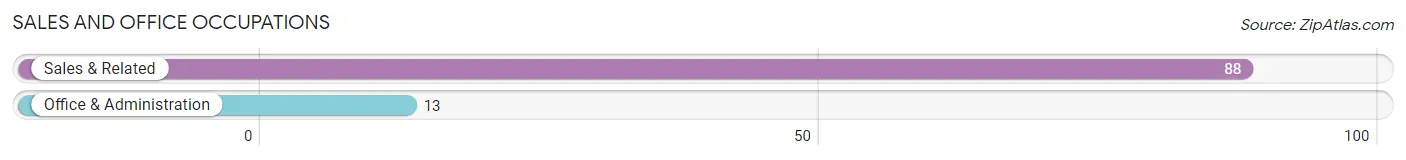
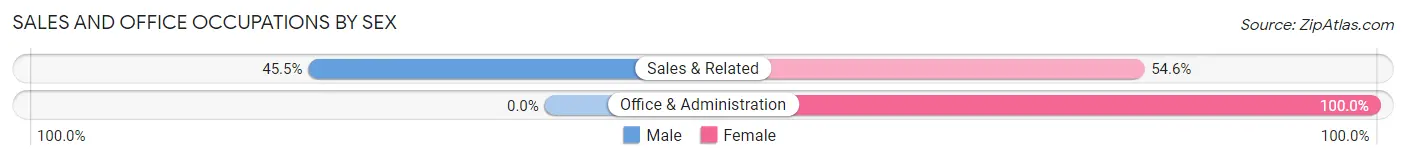
Sales and Office Occupations by Sex
| Occupation | Male | Female |
| Sales & Related | 40 (45.5%) | 48 (54.5%) |
| Office & Administration | 0 (0.0%) | 13 (100.0%) |
| Total (Category) | 40 (39.6%) | 61 (60.4%) |
| Total (Overall) | 329 (54.6%) | 274 (45.4%) |
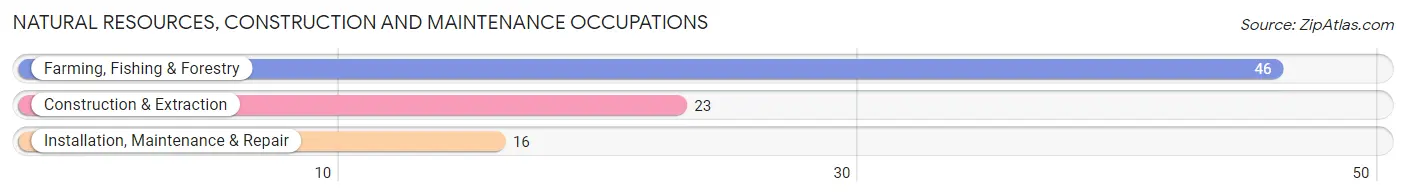
Natural Resources, Construction and Maintenance Occupations
The most common Natural Resources, Construction and Maintenance occupations in Womens Bay are Farming, Fishing & Forestry (46 | 7.6%), Construction & Extraction (23 | 3.8%), and Installation, Maintenance & Repair (16 | 2.6%).
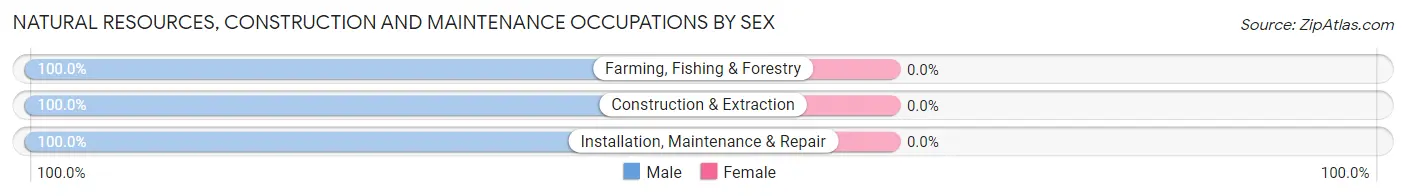
Natural Resources, Construction and Maintenance Occupations by Sex
| Occupation | Male | Female |
| Farming, Fishing & Forestry | 46 (100.0%) | 0 (0.0%) |
| Construction & Extraction | 23 (100.0%) | 0 (0.0%) |
| Installation, Maintenance & Repair | 16 (100.0%) | 0 (0.0%) |
| Total (Category) | 85 (100.0%) | 0 (0.0%) |
| Total (Overall) | 329 (54.6%) | 274 (45.4%) |
Production, Transportation and Moving Occupations
The most common Production, Transportation and Moving occupations in Womens Bay are Transportation (33 | 5.5%), and Production (4 | 0.7%).
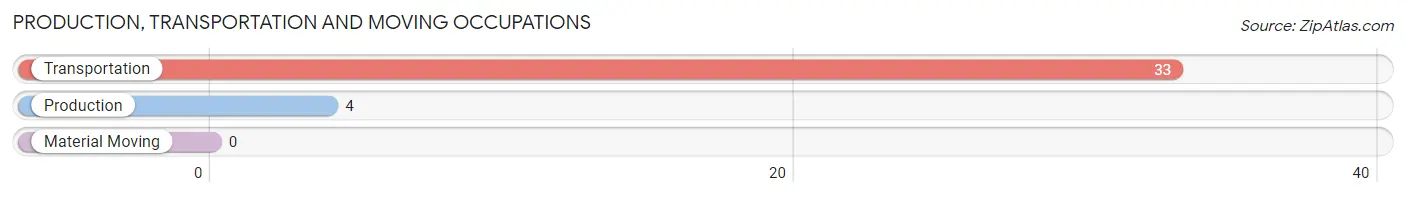
Production, Transportation and Moving Occupations by Sex
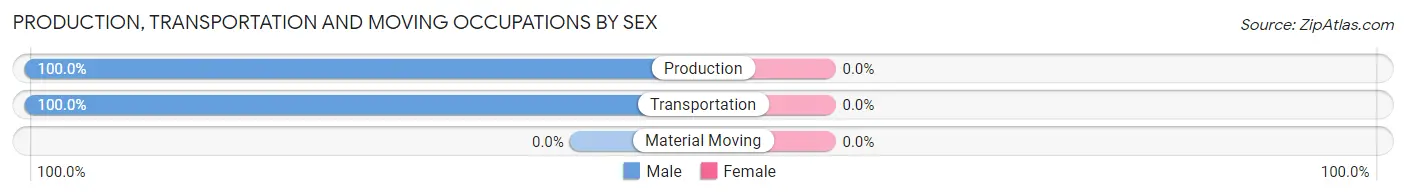
| Occupation | Male | Female |
| Production | 4 (100.0%) | 0 (0.0%) |
| Transportation | 33 (100.0%) | 0 (0.0%) |
| Material Moving | 0 (0.0%) | 0 (0.0%) |
| Total (Category) | 37 (100.0%) | 0 (0.0%) |
| Total (Overall) | 329 (54.6%) | 274 (45.4%) |
Employment Industries by Sex in Womens Bay
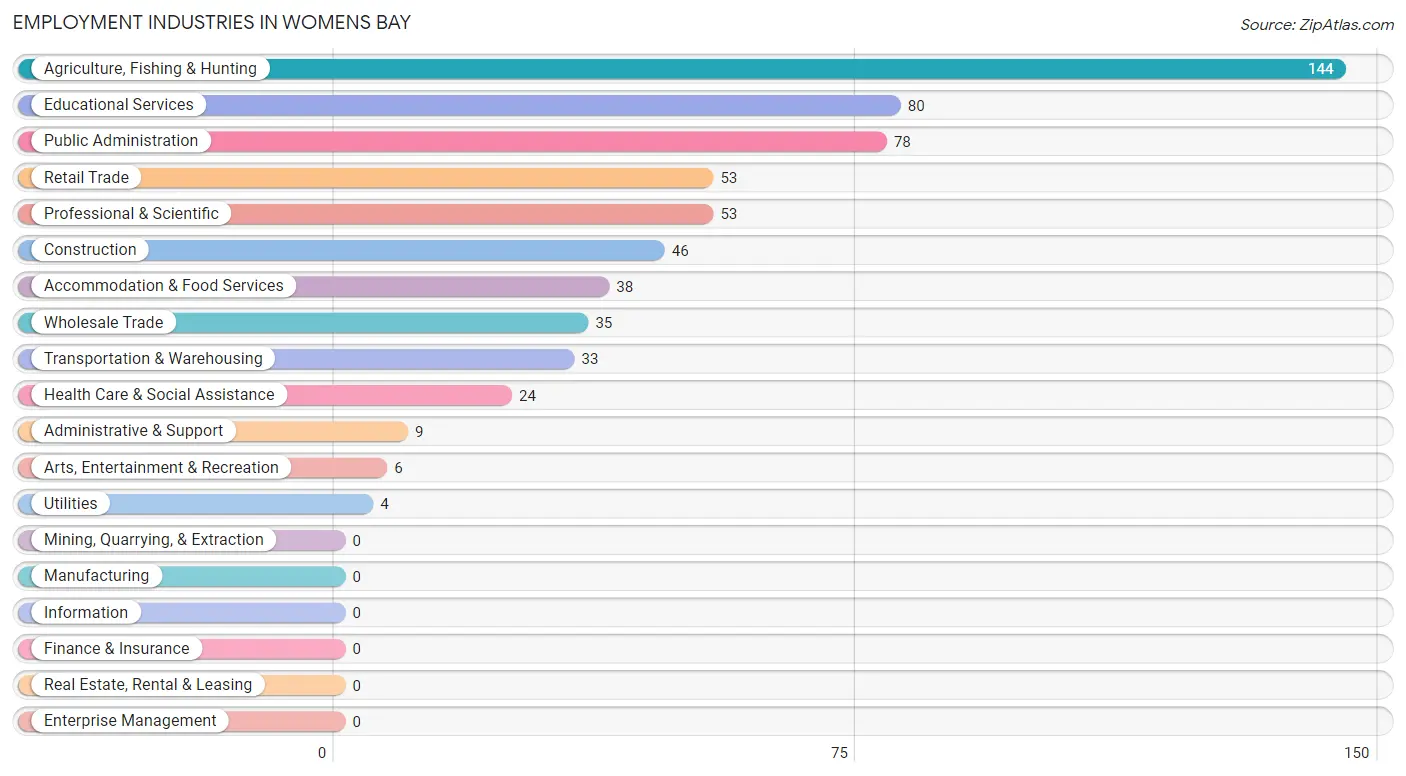
Employment Industries in Womens Bay
The major employment industries in Womens Bay include Agriculture, Fishing & Hunting (144 | 23.9%), Educational Services (80 | 13.3%), Public Administration (78 | 12.9%), Retail Trade (53 | 8.8%), and Professional & Scientific (53 | 8.8%).
Employment Industries by Sex in Womens Bay
The Womens Bay industries that see more men than women are Construction (100.0%), Transportation & Warehousing (100.0%), and Utilities (100.0%), whereas the industries that tend to have a higher number of women are Administrative & Support (100.0%), Health Care & Social Assistance (100.0%), and Public Administration (100.0%).
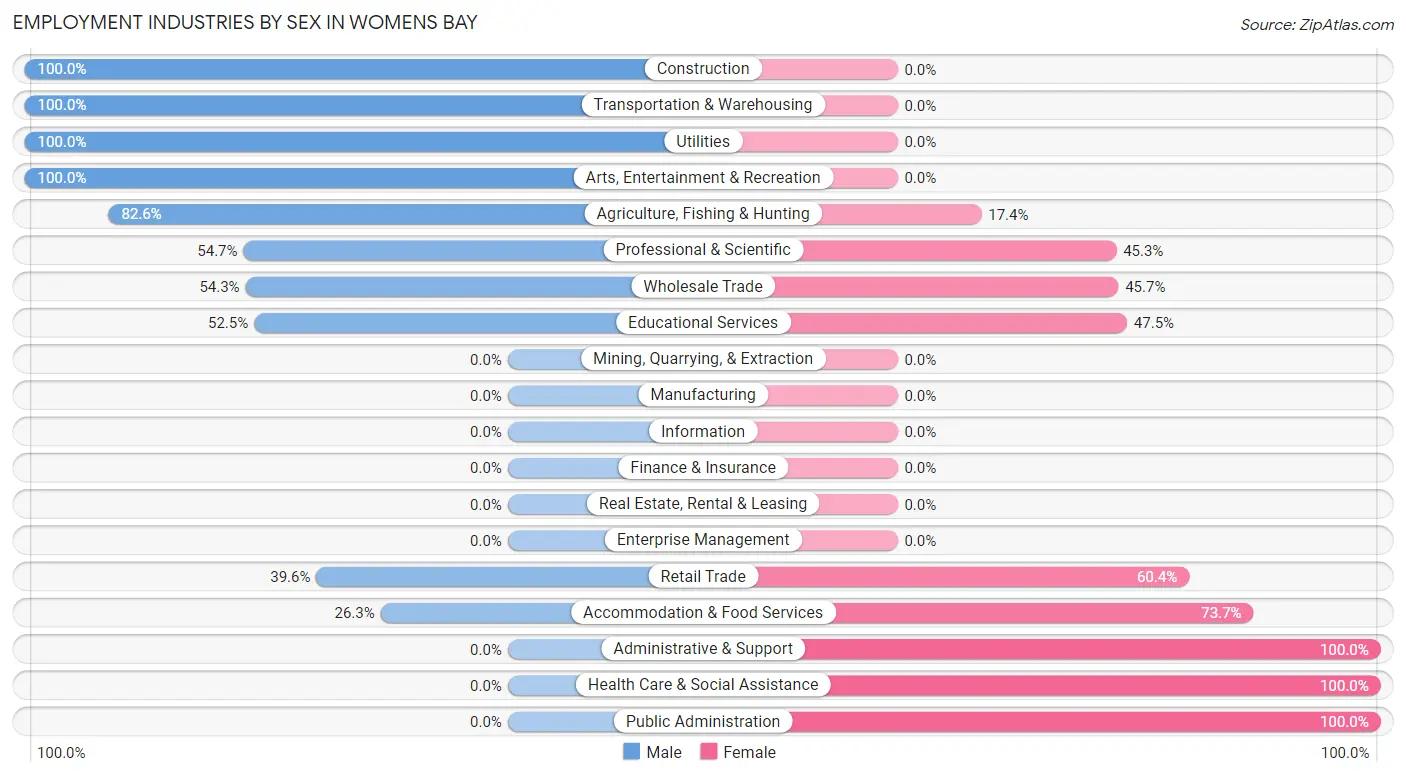
| Industry | Male | Female |
| Agriculture, Fishing & Hunting | 119 (82.6%) | 25 (17.4%) |
| Mining, Quarrying, & Extraction | 0 (0.0%) | 0 (0.0%) |
| Construction | 46 (100.0%) | 0 (0.0%) |
| Manufacturing | 0 (0.0%) | 0 (0.0%) |
| Wholesale Trade | 19 (54.3%) | 16 (45.7%) |
| Retail Trade | 21 (39.6%) | 32 (60.4%) |
| Transportation & Warehousing | 33 (100.0%) | 0 (0.0%) |
| Utilities | 4 (100.0%) | 0 (0.0%) |
| Information | 0 (0.0%) | 0 (0.0%) |
| Finance & Insurance | 0 (0.0%) | 0 (0.0%) |
| Real Estate, Rental & Leasing | 0 (0.0%) | 0 (0.0%) |
| Professional & Scientific | 29 (54.7%) | 24 (45.3%) |
| Enterprise Management | 0 (0.0%) | 0 (0.0%) |
| Administrative & Support | 0 (0.0%) | 9 (100.0%) |
| Educational Services | 42 (52.5%) | 38 (47.5%) |
| Health Care & Social Assistance | 0 (0.0%) | 24 (100.0%) |
| Arts, Entertainment & Recreation | 6 (100.0%) | 0 (0.0%) |
| Accommodation & Food Services | 10 (26.3%) | 28 (73.7%) |
| Public Administration | 0 (0.0%) | 78 (100.0%) |
| Total | 329 (54.6%) | 274 (45.4%) |
Education in Womens Bay
School Enrollment in Womens Bay
The most common levels of schooling among the 273 students in Womens Bay are high school (119 | 43.6%), elementary school (81 | 29.7%), and middle school (34 | 12.4%).
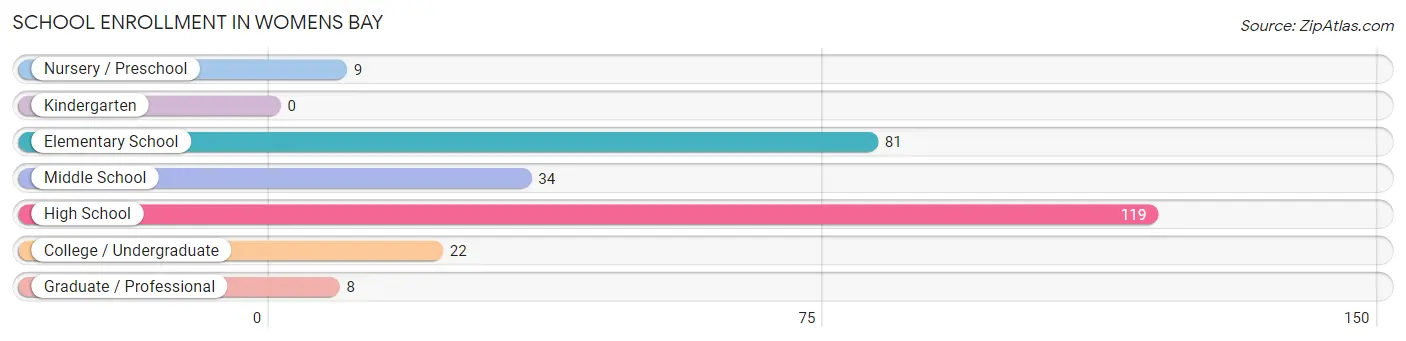
| School Level | # Students | % Students |
| Nursery / Preschool | 9 | 3.3% |
| Kindergarten | 0 | 0.0% |
| Elementary School | 81 | 29.7% |
| Middle School | 34 | 12.4% |
| High School | 119 | 43.6% |
| College / Undergraduate | 22 | 8.1% |
| Graduate / Professional | 8 | 2.9% |
| Total | 273 | 100.0% |
School Enrollment by Age by Funding Source in Womens Bay
Out of a total of 273 students who are enrolled in schools in Womens Bay, 6 (2.2%) attend a private institution, while the remaining 267 (97.8%) are enrolled in public schools. The age group of 3 to 4 year olds has the highest likelihood of being enrolled in private schools, with 6 (100.0% in the age bracket) enrolled. Conversely, the age group of 5 to 9 year old has the lowest likelihood of being enrolled in a private school, with 74 (100.0% in the age bracket) attending a public institution.
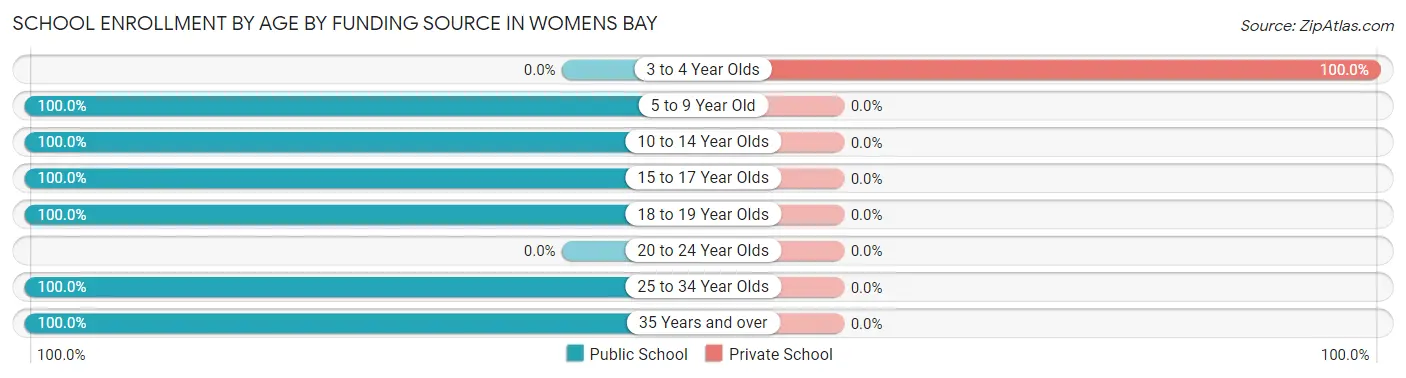
| Age Bracket | Public School | Private School |
| 3 to 4 Year Olds | 0 (0.0%) | 6 (100.0%) |
| 5 to 9 Year Old | 74 (100.0%) | 0 (0.0%) |
| 10 to 14 Year Olds | 44 (100.0%) | 0 (0.0%) |
| 15 to 17 Year Olds | 73 (100.0%) | 0 (0.0%) |
| 18 to 19 Year Olds | 37 (100.0%) | 0 (0.0%) |
| 20 to 24 Year Olds | 0 (0.0%) | 0 (0.0%) |
| 25 to 34 Year Olds | 14 (100.0%) | 0 (0.0%) |
| 35 Years and over | 25 (100.0%) | 0 (0.0%) |
| Total | 267 (97.8%) | 6 (2.2%) |
Educational Attainment by Field of Study in Womens Bay
Bio, nature & agricultural (170 | 60.5%), science & technology (30 | 10.7%), business (16 | 5.7%), liberal arts & history (15 | 5.3%), and visual & performing arts (13 | 4.6%) are the most common fields of study among 281 individuals in Womens Bay who have obtained a bachelor's degree or higher.
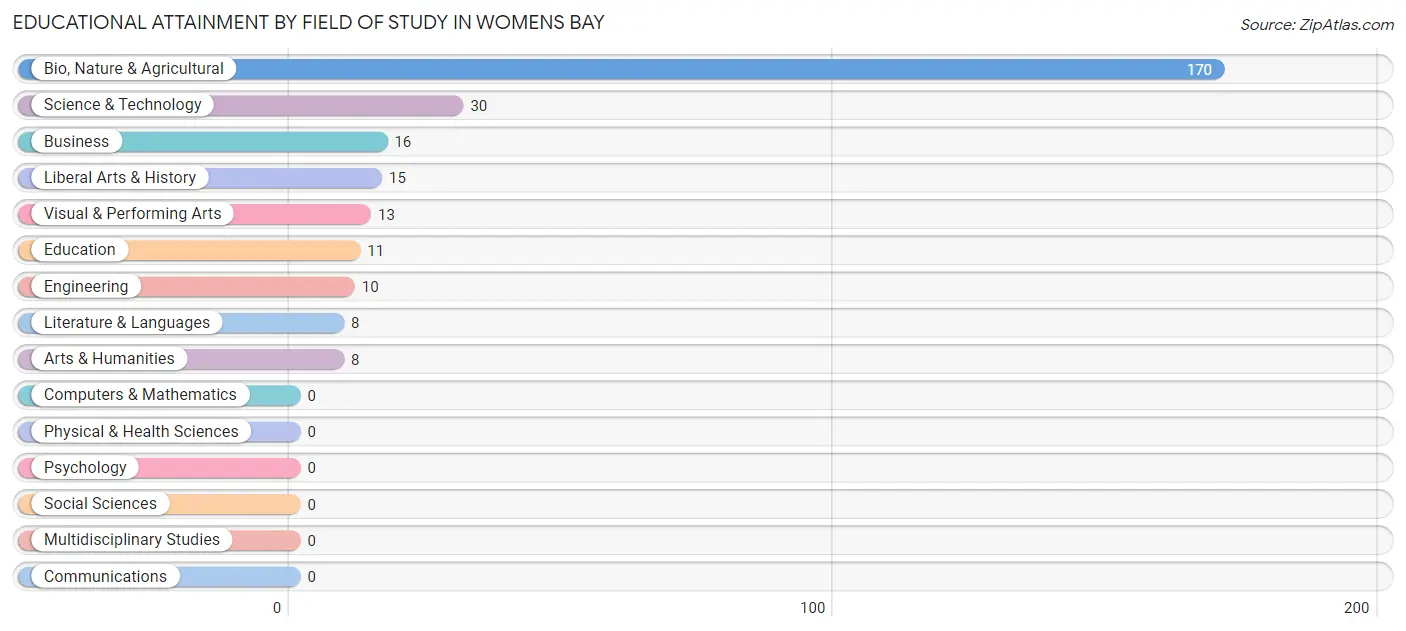
| Field of Study | # Graduates | % Graduates |
| Computers & Mathematics | 0 | 0.0% |
| Bio, Nature & Agricultural | 170 | 60.5% |
| Physical & Health Sciences | 0 | 0.0% |
| Psychology | 0 | 0.0% |
| Social Sciences | 0 | 0.0% |
| Engineering | 10 | 3.6% |
| Multidisciplinary Studies | 0 | 0.0% |
| Science & Technology | 30 | 10.7% |
| Business | 16 | 5.7% |
| Education | 11 | 3.9% |
| Literature & Languages | 8 | 2.9% |
| Liberal Arts & History | 15 | 5.3% |
| Visual & Performing Arts | 13 | 4.6% |
| Communications | 0 | 0.0% |
| Arts & Humanities | 8 | 2.9% |
| Total | 281 | 100.0% |
Transportation & Commute in Womens Bay
Vehicle Availability by Sex in Womens Bay
The most prevalent vehicle ownership categories in Womens Bay are males with 2 vehicles (151, accounting for 44.9%) and females with 2 vehicles (156, making up 55.1%).
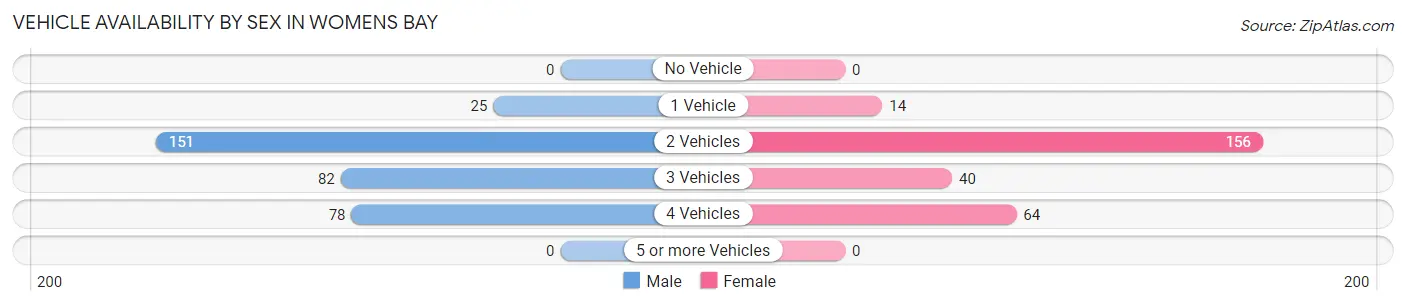
| Vehicles Available | Male | Female |
| No Vehicle | 0 (0.0%) | 0 (0.0%) |
| 1 Vehicle | 25 (7.4%) | 14 (5.1%) |
| 2 Vehicles | 151 (44.9%) | 156 (56.9%) |
| 3 Vehicles | 82 (24.4%) | 40 (14.6%) |
| 4 Vehicles | 78 (23.2%) | 64 (23.4%) |
| 5 or more Vehicles | 0 (0.0%) | 0 (0.0%) |
| Total | 336 (100.0%) | 274 (100.0%) |
Commute Time in Womens Bay
The most frequently occuring commute durations in Womens Bay are 40 to 44 minutes (83 commuters, 18.4%), 10 to 14 minutes (81 commuters, 17.9%), and 25 to 29 minutes (75 commuters, 16.6%).
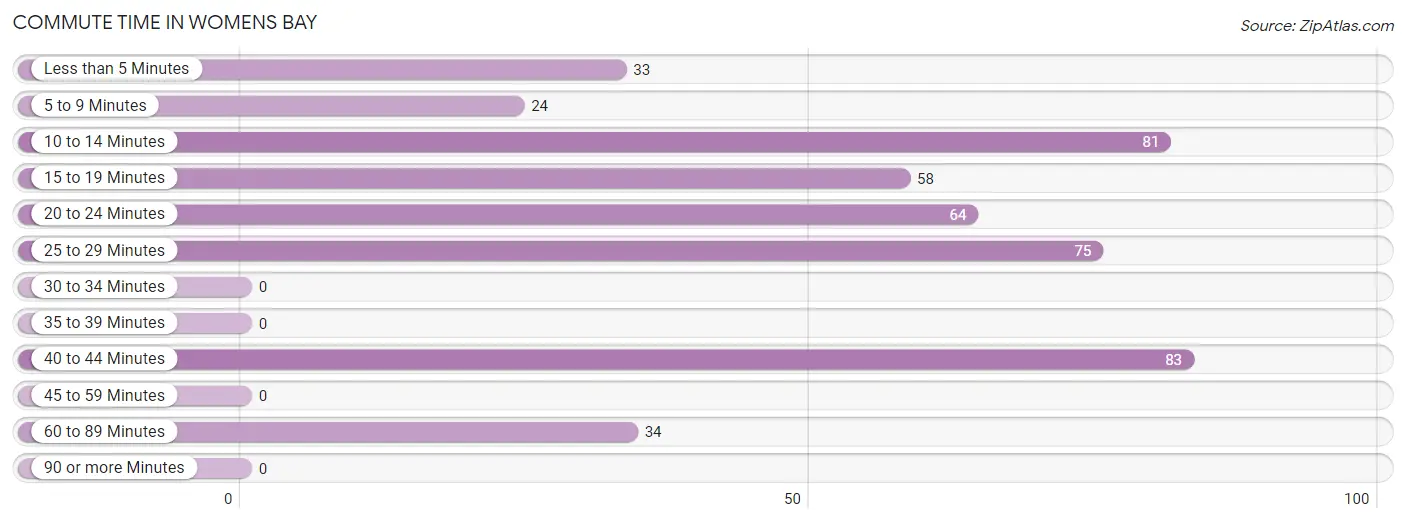
| Commute Time | # Commuters | % Commuters |
| Less than 5 Minutes | 33 | 7.3% |
| 5 to 9 Minutes | 24 | 5.3% |
| 10 to 14 Minutes | 81 | 17.9% |
| 15 to 19 Minutes | 58 | 12.8% |
| 20 to 24 Minutes | 64 | 14.2% |
| 25 to 29 Minutes | 75 | 16.6% |
| 30 to 34 Minutes | 0 | 0.0% |
| 35 to 39 Minutes | 0 | 0.0% |
| 40 to 44 Minutes | 83 | 18.4% |
| 45 to 59 Minutes | 0 | 0.0% |
| 60 to 89 Minutes | 34 | 7.5% |
| 90 or more Minutes | 0 | 0.0% |
Commute Time by Sex in Womens Bay
The most common commute times in Womens Bay are 40 to 44 minutes (58 commuters, 20.9%) for males and 20 to 24 minutes (42 commuters, 24.0%) for females.
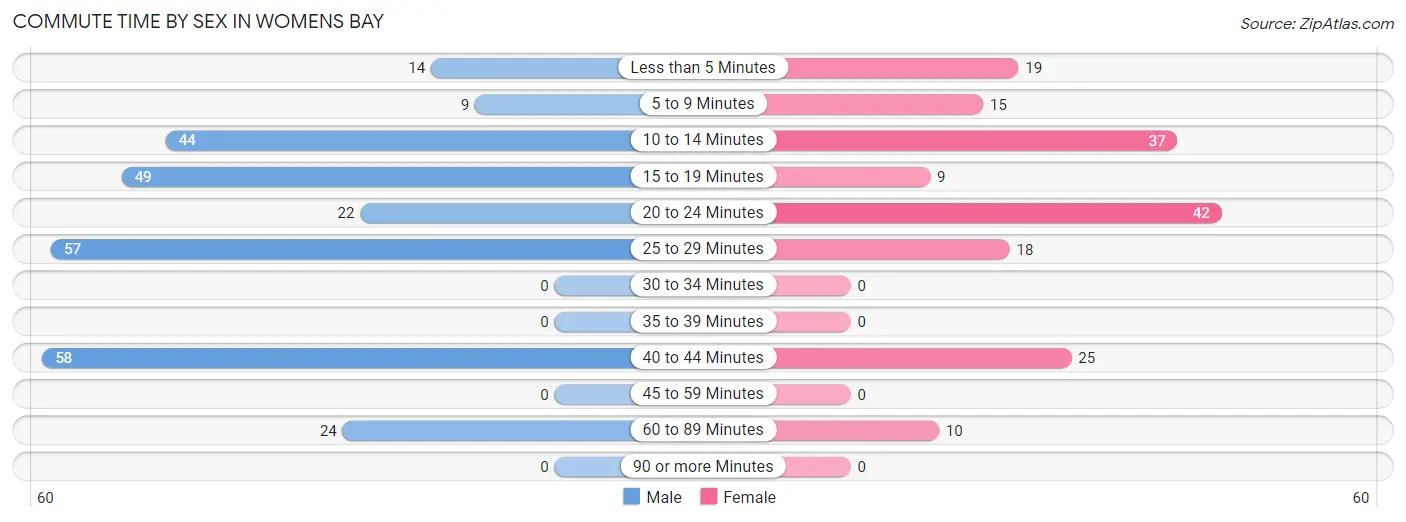
| Commute Time | Male | Female |
| Less than 5 Minutes | 14 (5.1%) | 19 (10.9%) |
| 5 to 9 Minutes | 9 (3.3%) | 15 (8.6%) |
| 10 to 14 Minutes | 44 (15.9%) | 37 (21.1%) |
| 15 to 19 Minutes | 49 (17.7%) | 9 (5.1%) |
| 20 to 24 Minutes | 22 (7.9%) | 42 (24.0%) |
| 25 to 29 Minutes | 57 (20.6%) | 18 (10.3%) |
| 30 to 34 Minutes | 0 (0.0%) | 0 (0.0%) |
| 35 to 39 Minutes | 0 (0.0%) | 0 (0.0%) |
| 40 to 44 Minutes | 58 (20.9%) | 25 (14.3%) |
| 45 to 59 Minutes | 0 (0.0%) | 0 (0.0%) |
| 60 to 89 Minutes | 24 (8.7%) | 10 (5.7%) |
| 90 or more Minutes | 0 (0.0%) | 0 (0.0%) |
Time of Departure to Work by Sex in Womens Bay
The most frequent times of departure to work in Womens Bay are 7:00 AM to 7:29 AM (128, 46.2%) for males and 7:30 AM to 7:59 AM (45, 25.7%) for females.
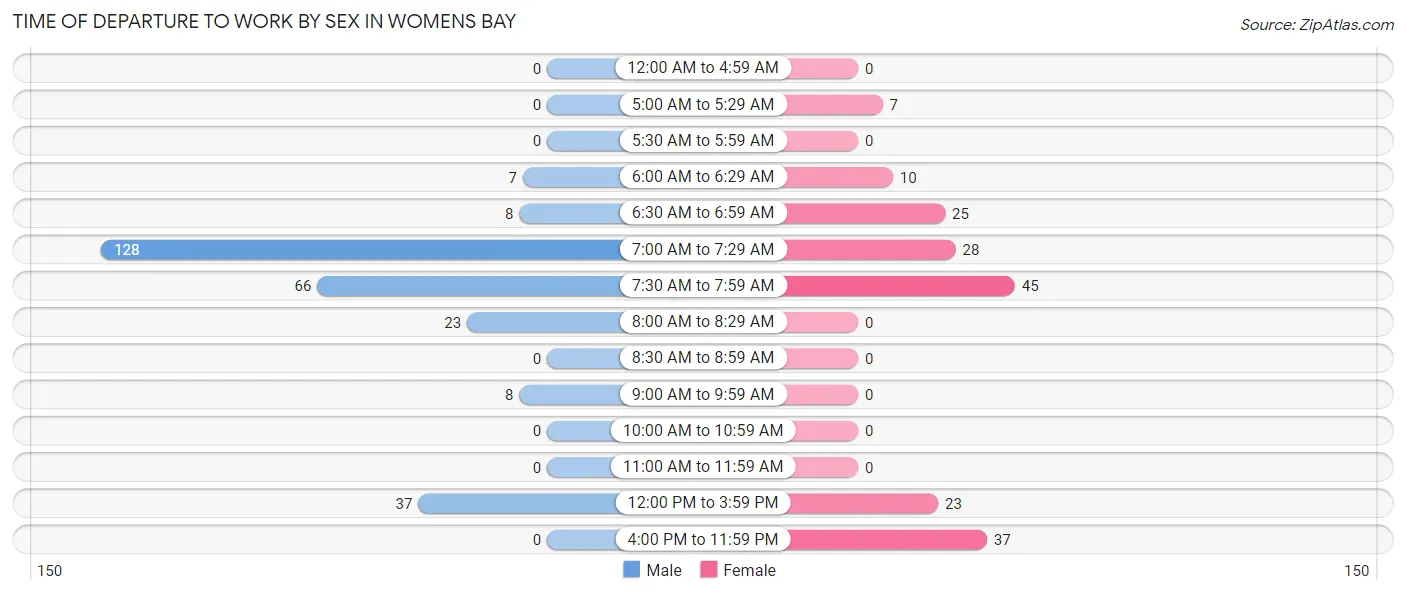
| Time of Departure | Male | Female |
| 12:00 AM to 4:59 AM | 0 (0.0%) | 0 (0.0%) |
| 5:00 AM to 5:29 AM | 0 (0.0%) | 7 (4.0%) |
| 5:30 AM to 5:59 AM | 0 (0.0%) | 0 (0.0%) |
| 6:00 AM to 6:29 AM | 7 (2.5%) | 10 (5.7%) |
| 6:30 AM to 6:59 AM | 8 (2.9%) | 25 (14.3%) |
| 7:00 AM to 7:29 AM | 128 (46.2%) | 28 (16.0%) |
| 7:30 AM to 7:59 AM | 66 (23.8%) | 45 (25.7%) |
| 8:00 AM to 8:29 AM | 23 (8.3%) | 0 (0.0%) |
| 8:30 AM to 8:59 AM | 0 (0.0%) | 0 (0.0%) |
| 9:00 AM to 9:59 AM | 8 (2.9%) | 0 (0.0%) |
| 10:00 AM to 10:59 AM | 0 (0.0%) | 0 (0.0%) |
| 11:00 AM to 11:59 AM | 0 (0.0%) | 0 (0.0%) |
| 12:00 PM to 3:59 PM | 37 (13.4%) | 23 (13.1%) |
| 4:00 PM to 11:59 PM | 0 (0.0%) | 37 (21.1%) |
| Total | 277 (100.0%) | 175 (100.0%) |
Housing Occupancy in Womens Bay
Occupancy by Ownership in Womens Bay
Of the total 417 dwellings in Womens Bay, owner-occupied units account for 393 (94.2%), while renter-occupied units make up 24 (5.8%).
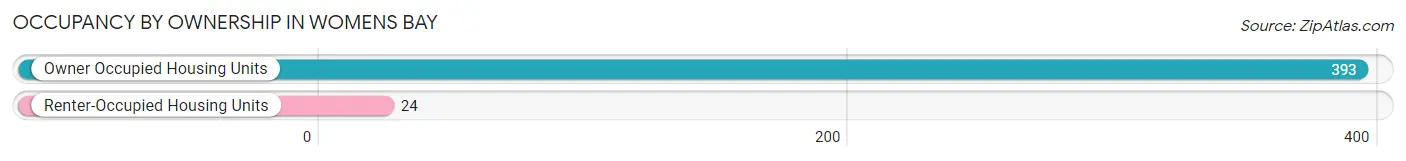
| Occupancy | # Housing Units | % Housing Units |
| Owner Occupied Housing Units | 393 | 94.2% |
| Renter-Occupied Housing Units | 24 | 5.8% |
| Total Occupied Housing Units | 417 | 100.0% |
Occupancy by Household Size in Womens Bay
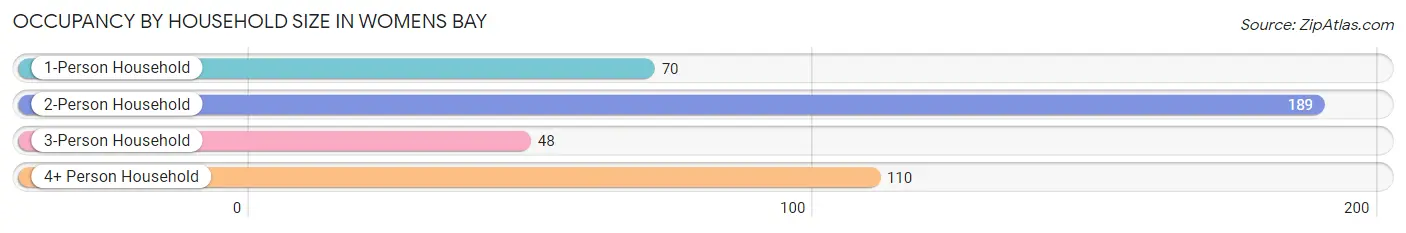
| Household Size | # Housing Units | % Housing Units |
| 1-Person Household | 70 | 16.8% |
| 2-Person Household | 189 | 45.3% |
| 3-Person Household | 48 | 11.5% |
| 4+ Person Household | 110 | 26.4% |
| Total Housing Units | 417 | 100.0% |
Occupancy by Ownership by Household Size in Womens Bay
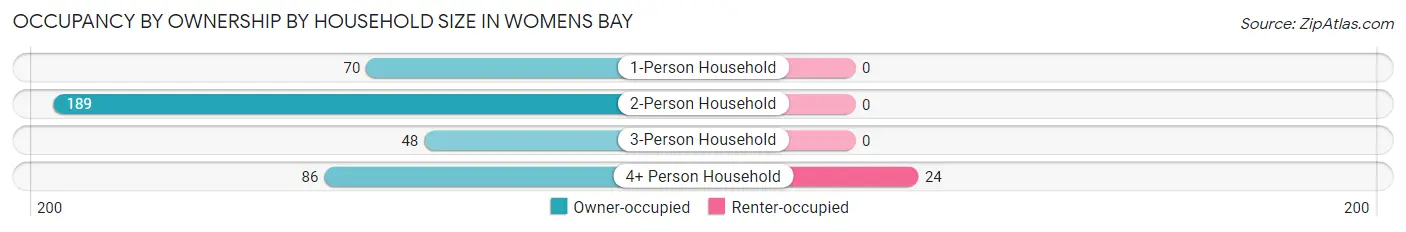
| Household Size | Owner-occupied | Renter-occupied |
| 1-Person Household | 70 (100.0%) | 0 (0.0%) |
| 2-Person Household | 189 (100.0%) | 0 (0.0%) |
| 3-Person Household | 48 (100.0%) | 0 (0.0%) |
| 4+ Person Household | 86 (78.2%) | 24 (21.8%) |
| Total Housing Units | 393 (94.2%) | 24 (5.8%) |
Occupancy by Educational Attainment in Womens Bay
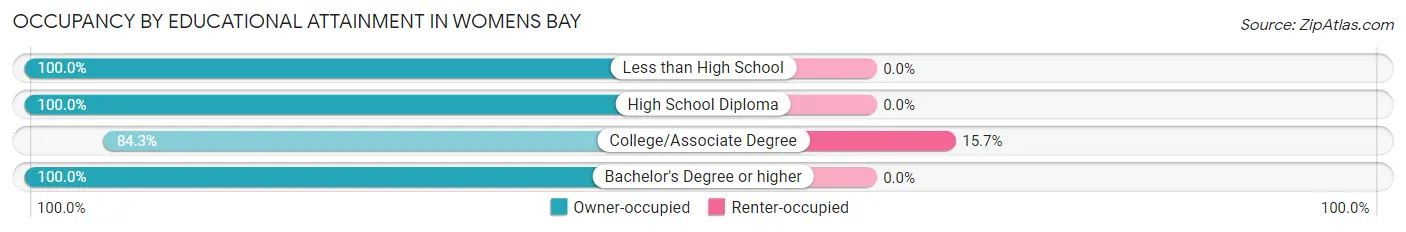
| Household Size | Owner-occupied | Renter-occupied |
| Less than High School | 8 (100.0%) | 0 (0.0%) |
| High School Diploma | 98 (100.0%) | 0 (0.0%) |
| College/Associate Degree | 129 (84.3%) | 24 (15.7%) |
| Bachelor's Degree or higher | 158 (100.0%) | 0 (0.0%) |
Occupancy by Age of Householder in Womens Bay
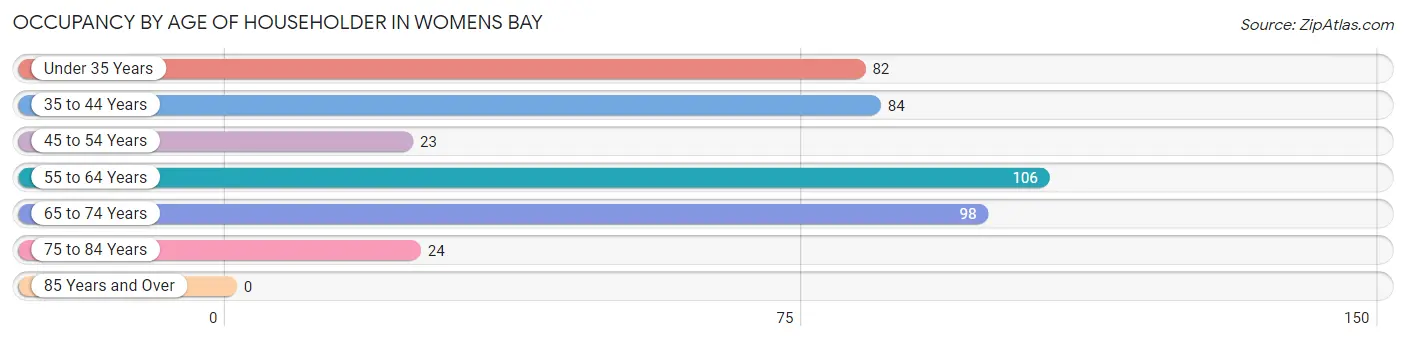
| Age Bracket | # Households | % Households |
| Under 35 Years | 82 | 19.7% |
| 35 to 44 Years | 84 | 20.1% |
| 45 to 54 Years | 23 | 5.5% |
| 55 to 64 Years | 106 | 25.4% |
| 65 to 74 Years | 98 | 23.5% |
| 75 to 84 Years | 24 | 5.8% |
| 85 Years and Over | 0 | 0.0% |
| Total | 417 | 100.0% |
Housing Finances in Womens Bay
Median Income by Occupancy in Womens Bay
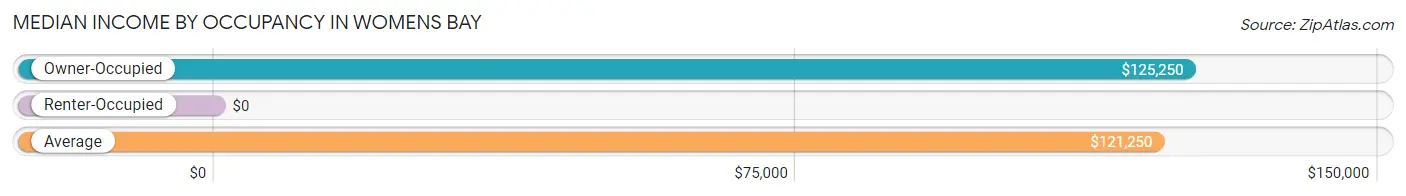
| Occupancy Type | # Households | Median Income |
| Owner-Occupied | 393 (94.2%) | $125,250 |
| Renter-Occupied | 24 (5.8%) | $0 |
| Average | 417 (100.0%) | $121,250 |
Occupancy by Householder Income Bracket in Womens Bay
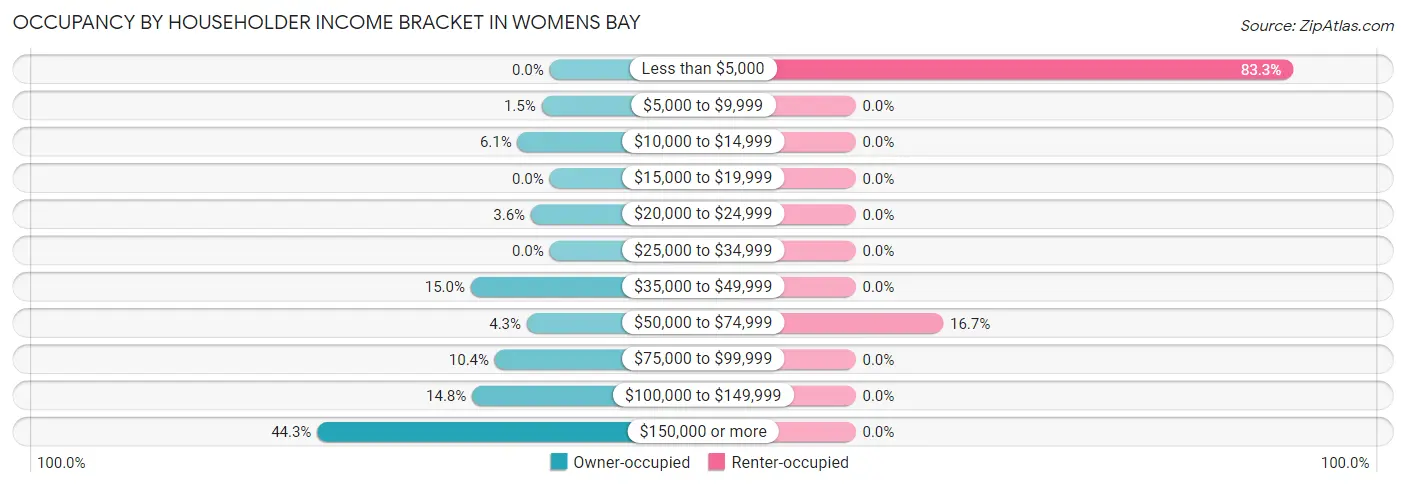
| Income Bracket | Owner-occupied | Renter-occupied |
| Less than $5,000 | 0 (0.0%) | 20 (83.3%) |
| $5,000 to $9,999 | 6 (1.5%) | 0 (0.0%) |
| $10,000 to $14,999 | 24 (6.1%) | 0 (0.0%) |
| $15,000 to $19,999 | 0 (0.0%) | 0 (0.0%) |
| $20,000 to $24,999 | 14 (3.6%) | 0 (0.0%) |
| $25,000 to $34,999 | 0 (0.0%) | 0 (0.0%) |
| $35,000 to $49,999 | 59 (15.0%) | 0 (0.0%) |
| $50,000 to $74,999 | 17 (4.3%) | 4 (16.7%) |
| $75,000 to $99,999 | 41 (10.4%) | 0 (0.0%) |
| $100,000 to $149,999 | 58 (14.8%) | 0 (0.0%) |
| $150,000 or more | 174 (44.3%) | 0 (0.0%) |
| Total | 393 (100.0%) | 24 (100.0%) |
Monthly Housing Cost Tiers in Womens Bay
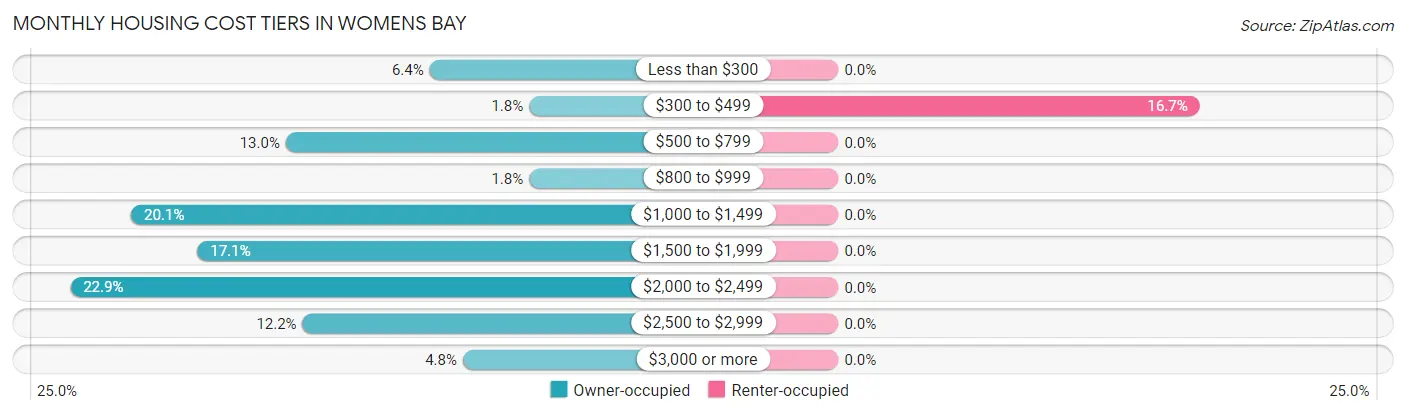
| Monthly Cost | Owner-occupied | Renter-occupied |
| Less than $300 | 25 (6.4%) | 0 (0.0%) |
| $300 to $499 | 7 (1.8%) | 4 (16.7%) |
| $500 to $799 | 51 (13.0%) | 0 (0.0%) |
| $800 to $999 | 7 (1.8%) | 0 (0.0%) |
| $1,000 to $1,499 | 79 (20.1%) | 0 (0.0%) |
| $1,500 to $1,999 | 67 (17.1%) | 0 (0.0%) |
| $2,000 to $2,499 | 90 (22.9%) | 0 (0.0%) |
| $2,500 to $2,999 | 48 (12.2%) | 0 (0.0%) |
| $3,000 or more | 19 (4.8%) | 0 (0.0%) |
| Total | 393 (100.0%) | 24 (100.0%) |
Physical Housing Characteristics in Womens Bay
Housing Structures in Womens Bay
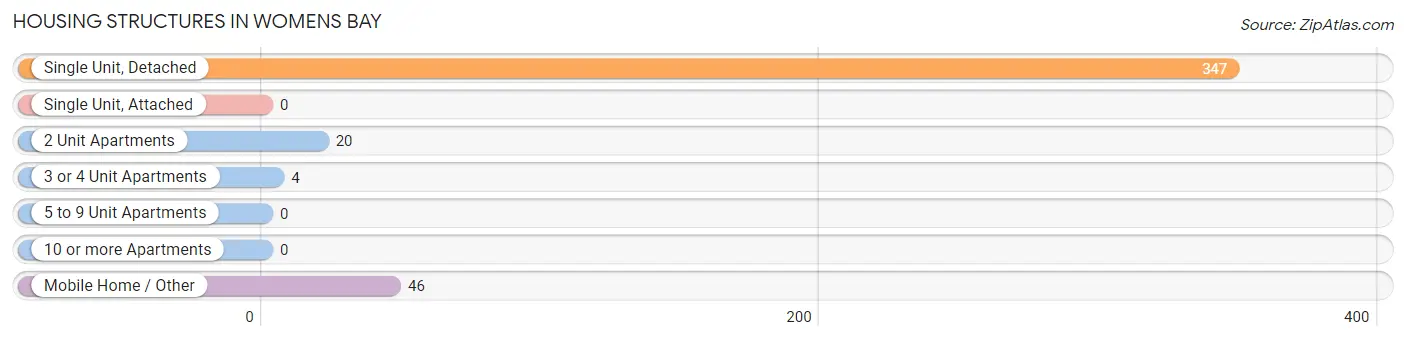
| Structure Type | # Housing Units | % Housing Units |
| Single Unit, Detached | 347 | 83.2% |
| Single Unit, Attached | 0 | 0.0% |
| 2 Unit Apartments | 20 | 4.8% |
| 3 or 4 Unit Apartments | 4 | 1.0% |
| 5 to 9 Unit Apartments | 0 | 0.0% |
| 10 or more Apartments | 0 | 0.0% |
| Mobile Home / Other | 46 | 11.0% |
| Total | 417 | 100.0% |
Housing Structures by Occupancy in Womens Bay
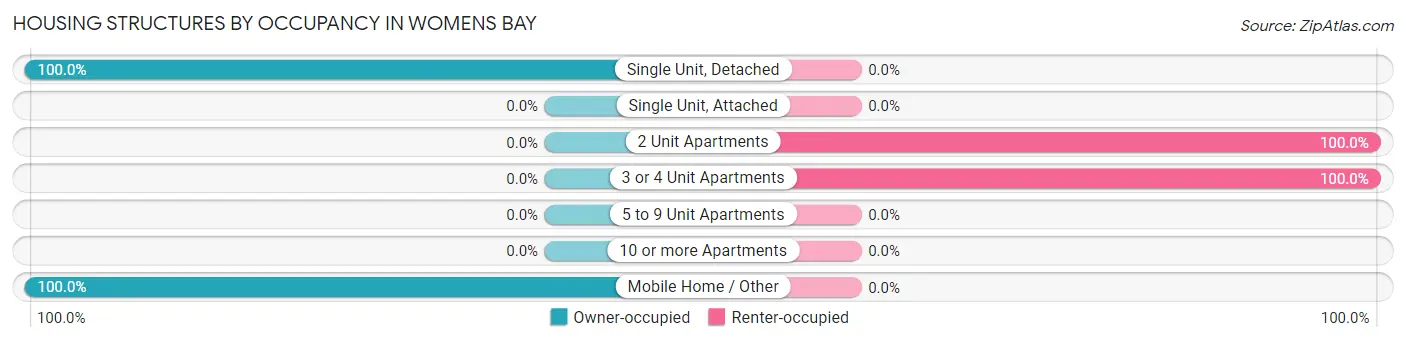
| Structure Type | Owner-occupied | Renter-occupied |
| Single Unit, Detached | 347 (100.0%) | 0 (0.0%) |
| Single Unit, Attached | 0 (0.0%) | 0 (0.0%) |
| 2 Unit Apartments | 0 (0.0%) | 20 (100.0%) |
| 3 or 4 Unit Apartments | 0 (0.0%) | 4 (100.0%) |
| 5 to 9 Unit Apartments | 0 (0.0%) | 0 (0.0%) |
| 10 or more Apartments | 0 (0.0%) | 0 (0.0%) |
| Mobile Home / Other | 46 (100.0%) | 0 (0.0%) |
| Total | 393 (94.2%) | 24 (5.8%) |
Housing Structures by Number of Rooms in Womens Bay
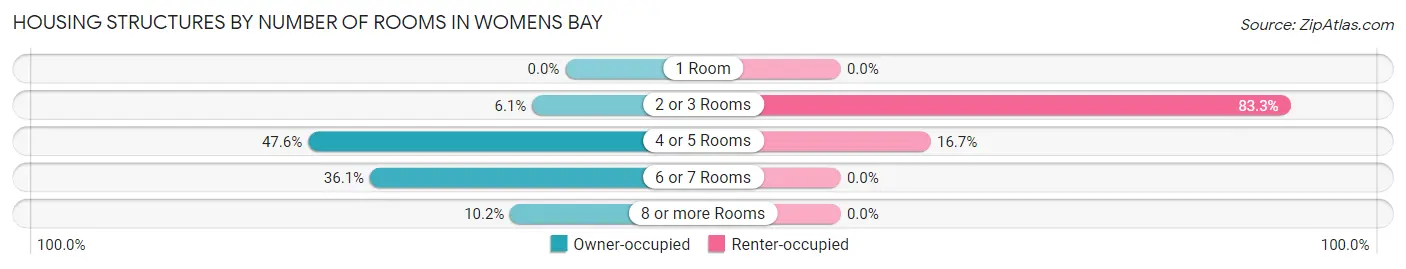
| Number of Rooms | Owner-occupied | Renter-occupied |
| 1 Room | 0 (0.0%) | 0 (0.0%) |
| 2 or 3 Rooms | 24 (6.1%) | 20 (83.3%) |
| 4 or 5 Rooms | 187 (47.6%) | 4 (16.7%) |
| 6 or 7 Rooms | 142 (36.1%) | 0 (0.0%) |
| 8 or more Rooms | 40 (10.2%) | 0 (0.0%) |
| Total | 393 (100.0%) | 24 (100.0%) |
Housing Structure by Heating Type in Womens Bay
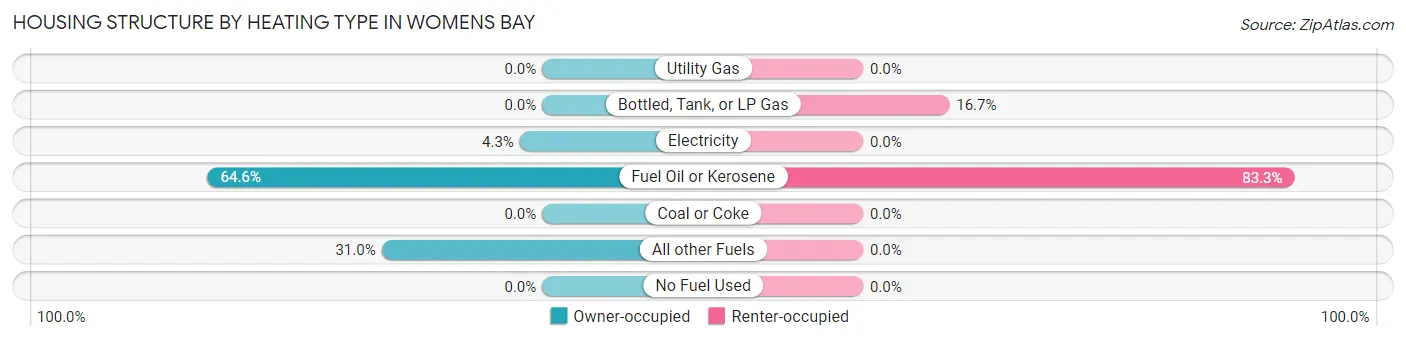
| Heating Type | Owner-occupied | Renter-occupied |
| Utility Gas | 0 (0.0%) | 0 (0.0%) |
| Bottled, Tank, or LP Gas | 0 (0.0%) | 4 (16.7%) |
| Electricity | 17 (4.3%) | 0 (0.0%) |
| Fuel Oil or Kerosene | 254 (64.6%) | 20 (83.3%) |
| Coal or Coke | 0 (0.0%) | 0 (0.0%) |
| All other Fuels | 122 (31.0%) | 0 (0.0%) |
| No Fuel Used | 0 (0.0%) | 0 (0.0%) |
| Total | 393 (100.0%) | 24 (100.0%) |
Household Vehicle Usage in Womens Bay
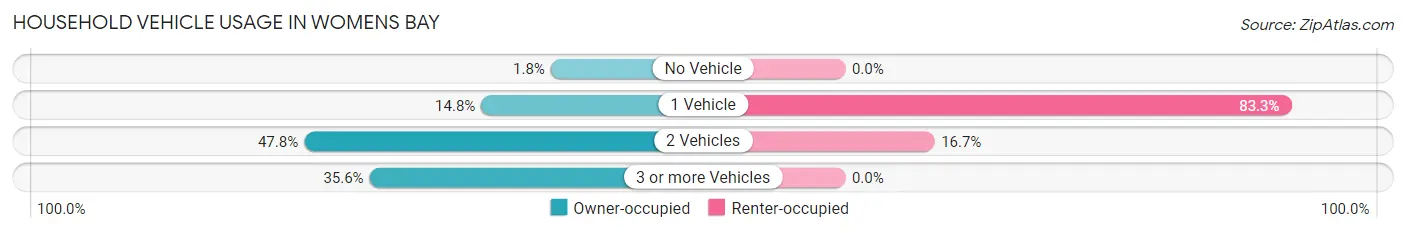
| Vehicles per Household | Owner-occupied | Renter-occupied |
| No Vehicle | 7 (1.8%) | 0 (0.0%) |
| 1 Vehicle | 58 (14.8%) | 20 (83.3%) |
| 2 Vehicles | 188 (47.8%) | 4 (16.7%) |
| 3 or more Vehicles | 140 (35.6%) | 0 (0.0%) |
| Total | 393 (100.0%) | 24 (100.0%) |
Real Estate & Mortgages in Womens Bay
Real Estate and Mortgage Overview in Womens Bay
| Characteristic | Without Mortgage | With Mortgage |
| Housing Units | 145 | 248 |
| Median Property Value | $457,800 | $440,200 |
| Median Household Income | $126,450 | $112 |
| Monthly Housing Costs | $1,065 | $19 |
| Real Estate Taxes | $4,640 | $0 |
Property Value by Mortgage Status in Womens Bay
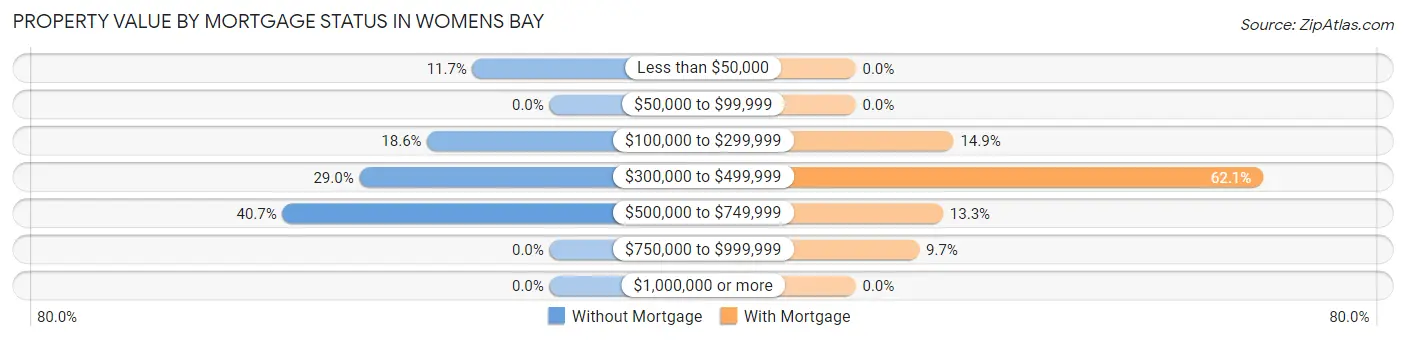
| Property Value | Without Mortgage | With Mortgage |
| Less than $50,000 | 17 (11.7%) | 0 (0.0%) |
| $50,000 to $99,999 | 0 (0.0%) | 0 (0.0%) |
| $100,000 to $299,999 | 27 (18.6%) | 37 (14.9%) |
| $300,000 to $499,999 | 42 (29.0%) | 154 (62.1%) |
| $500,000 to $749,999 | 59 (40.7%) | 33 (13.3%) |
| $750,000 to $999,999 | 0 (0.0%) | 24 (9.7%) |
| $1,000,000 or more | 0 (0.0%) | 0 (0.0%) |
| Total | 145 (100.0%) | 248 (100.0%) |
Household Income by Mortgage Status in Womens Bay
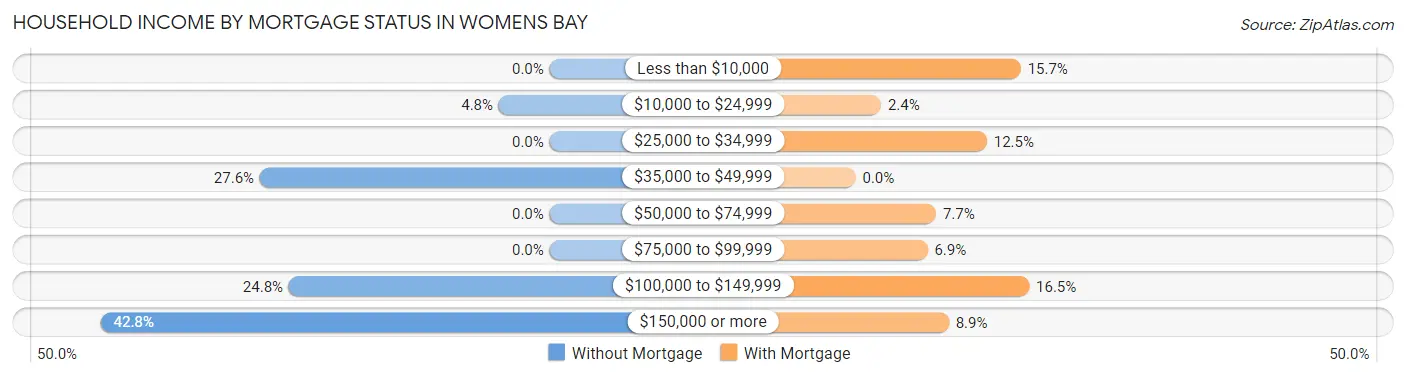
| Household Income | Without Mortgage | With Mortgage |
| Less than $10,000 | 0 (0.0%) | 39 (15.7%) |
| $10,000 to $24,999 | 7 (4.8%) | 6 (2.4%) |
| $25,000 to $34,999 | 0 (0.0%) | 31 (12.5%) |
| $35,000 to $49,999 | 40 (27.6%) | 0 (0.0%) |
| $50,000 to $74,999 | 0 (0.0%) | 19 (7.7%) |
| $75,000 to $99,999 | 0 (0.0%) | 17 (6.9%) |
| $100,000 to $149,999 | 36 (24.8%) | 41 (16.5%) |
| $150,000 or more | 62 (42.8%) | 22 (8.9%) |
| Total | 145 (100.0%) | 248 (100.0%) |
Property Value to Household Income Ratio in Womens Bay
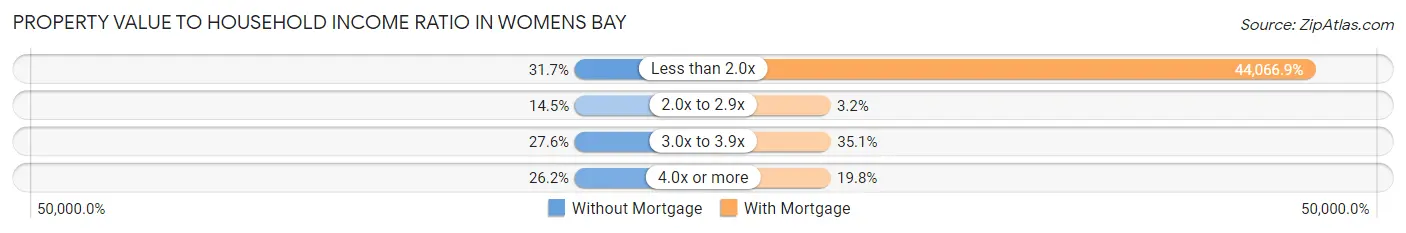
| Value-to-Income Ratio | Without Mortgage | With Mortgage |
| Less than 2.0x | 46 (31.7%) | 109,286 (44,066.9%) |
| 2.0x to 2.9x | 21 (14.5%) | 8 (3.2%) |
| 3.0x to 3.9x | 40 (27.6%) | 87 (35.1%) |
| 4.0x or more | 38 (26.2%) | 49 (19.8%) |
| Total | 145 (100.0%) | 248 (100.0%) |
Real Estate Taxes by Mortgage Status in Womens Bay
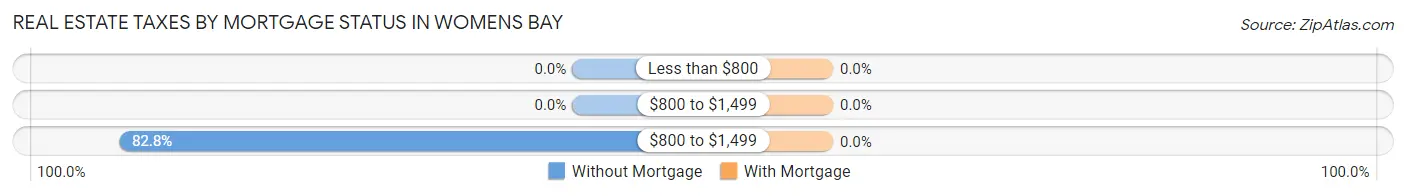
| Property Taxes | Without Mortgage | With Mortgage |
| Less than $800 | 0 (0.0%) | 0 (0.0%) |
| $800 to $1,499 | 0 (0.0%) | 0 (0.0%) |
| $800 to $1,499 | 120 (82.8%) | 0 (0.0%) |
| Total | 145 (100.0%) | 248 (100.0%) |
Health & Disability in Womens Bay
Health Insurance Coverage by Age in Womens Bay
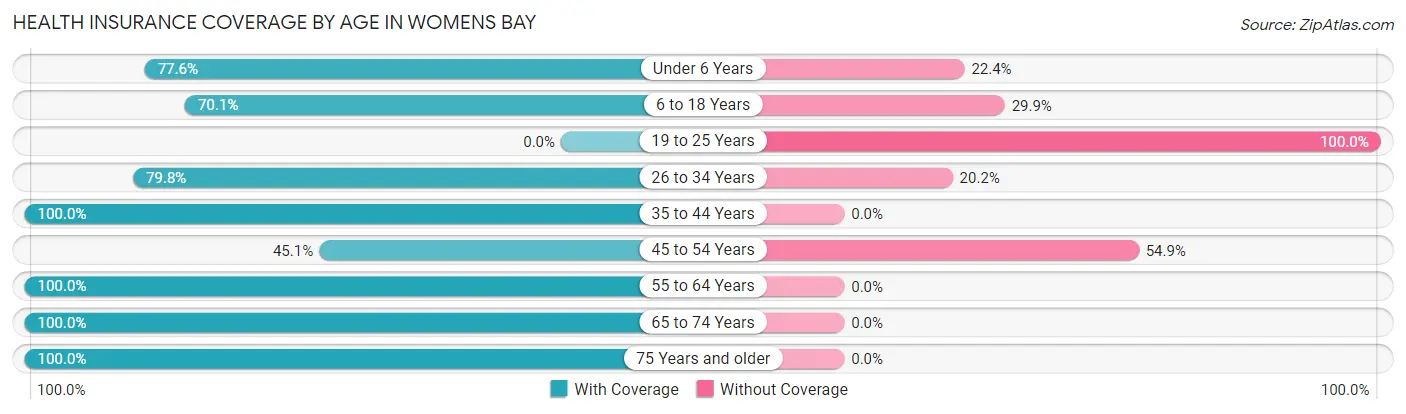
| Age Bracket | With Coverage | Without Coverage |
| Under 6 Years | 45 (77.6%) | 13 (22.4%) |
| 6 to 18 Years | 164 (70.1%) | 70 (29.9%) |
| 19 to 25 Years | 0 (0.0%) | 19 (100.0%) |
| 26 to 34 Years | 154 (79.8%) | 39 (20.2%) |
| 35 to 44 Years | 158 (100.0%) | 0 (0.0%) |
| 45 to 54 Years | 23 (45.1%) | 28 (54.9%) |
| 55 to 64 Years | 168 (100.0%) | 0 (0.0%) |
| 65 to 74 Years | 151 (100.0%) | 0 (0.0%) |
| 75 Years and older | 24 (100.0%) | 0 (0.0%) |
| Total | 887 (84.0%) | 169 (16.0%) |
Health Insurance Coverage by Citizenship Status in Womens Bay
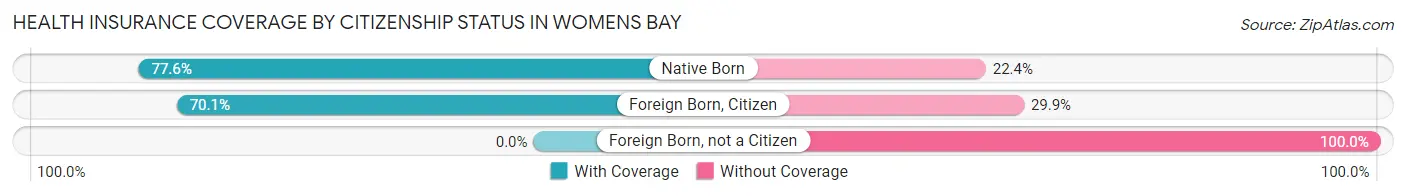
| Citizenship Status | With Coverage | Without Coverage |
| Native Born | 45 (77.6%) | 13 (22.4%) |
| Foreign Born, Citizen | 164 (70.1%) | 70 (29.9%) |
| Foreign Born, not a Citizen | 0 (0.0%) | 19 (100.0%) |
Health Insurance Coverage by Household Income in Womens Bay
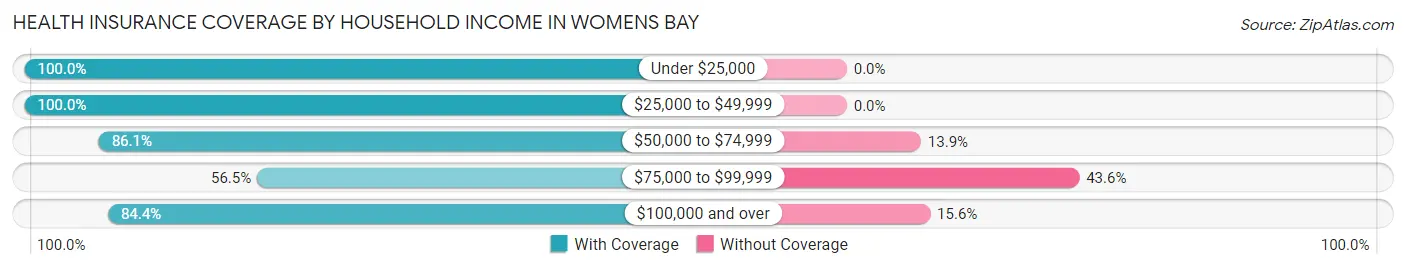
| Household Income | With Coverage | Without Coverage |
| Under $25,000 | 110 (100.0%) | 0 (0.0%) |
| $25,000 to $49,999 | 78 (100.0%) | 0 (0.0%) |
| $50,000 to $74,999 | 62 (86.1%) | 10 (13.9%) |
| $75,000 to $99,999 | 70 (56.5%) | 54 (43.5%) |
| $100,000 and over | 567 (84.4%) | 105 (15.6%) |
Public vs Private Health Insurance Coverage by Age in Womens Bay
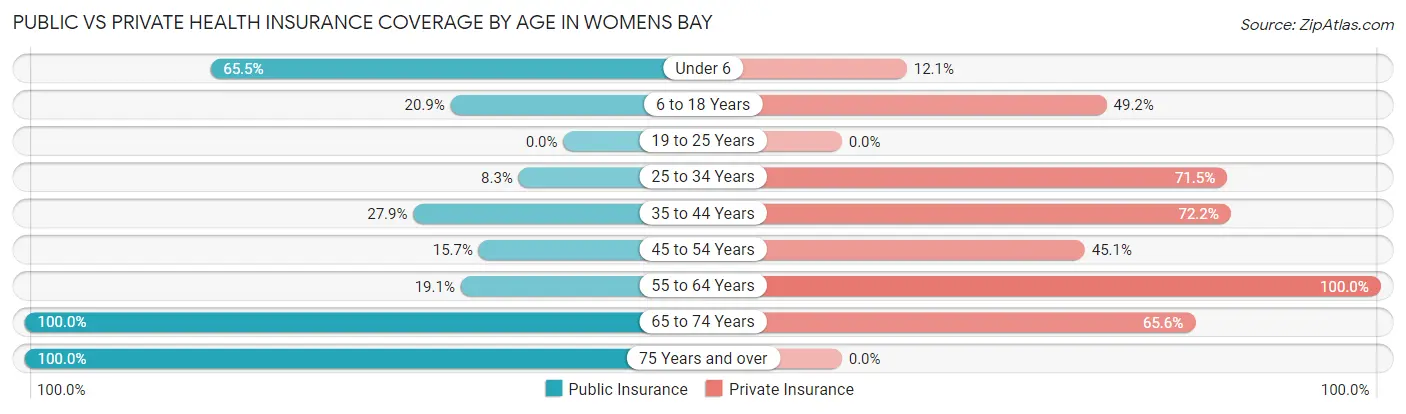
| Age Bracket | Public Insurance | Private Insurance |
| Under 6 | 38 (65.5%) | 7 (12.1%) |
| 6 to 18 Years | 49 (20.9%) | 115 (49.1%) |
| 19 to 25 Years | 0 (0.0%) | 0 (0.0%) |
| 25 to 34 Years | 16 (8.3%) | 138 (71.5%) |
| 35 to 44 Years | 44 (27.9%) | 114 (72.2%) |
| 45 to 54 Years | 8 (15.7%) | 23 (45.1%) |
| 55 to 64 Years | 32 (19.1%) | 168 (100.0%) |
| 65 to 74 Years | 151 (100.0%) | 99 (65.6%) |
| 75 Years and over | 24 (100.0%) | 0 (0.0%) |
| Total | 362 (34.3%) | 664 (62.9%) |
Disability Status by Sex by Age in Womens Bay
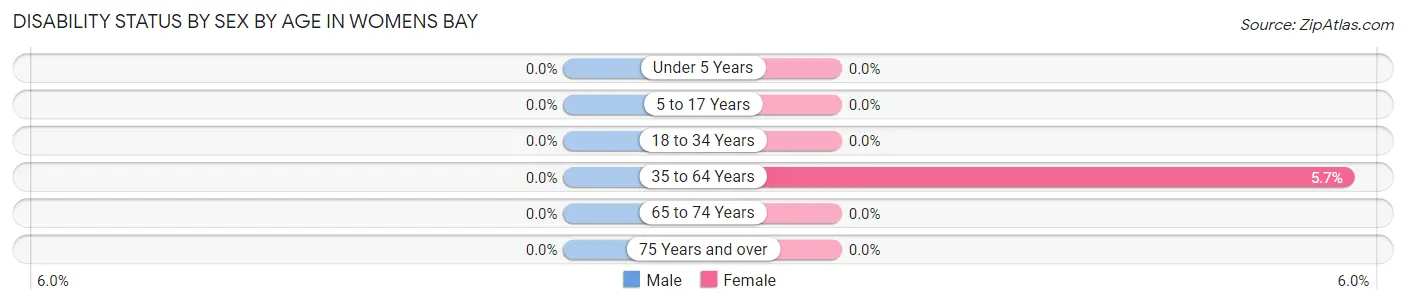
| Age Bracket | Male | Female |
| Under 5 Years | 0 (0.0%) | 0 (0.0%) |
| 5 to 17 Years | 0 (0.0%) | 0 (0.0%) |
| 18 to 34 Years | 0 (0.0%) | 0 (0.0%) |
| 35 to 64 Years | 0 (0.0%) | 10 (5.7%) |
| 65 to 74 Years | 0 (0.0%) | 0 (0.0%) |
| 75 Years and over | 0 (0.0%) | 0 (0.0%) |
Disability Class by Sex by Age in Womens Bay
Disability Class: Hearing Difficulty
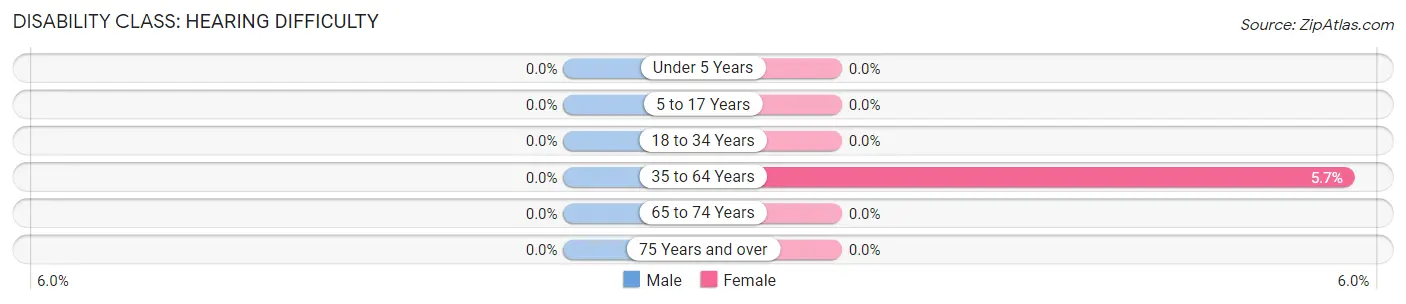
| Age Bracket | Male | Female |
| Under 5 Years | 0 (0.0%) | 0 (0.0%) |
| 5 to 17 Years | 0 (0.0%) | 0 (0.0%) |
| 18 to 34 Years | 0 (0.0%) | 0 (0.0%) |
| 35 to 64 Years | 0 (0.0%) | 10 (5.7%) |
| 65 to 74 Years | 0 (0.0%) | 0 (0.0%) |
| 75 Years and over | 0 (0.0%) | 0 (0.0%) |
Disability Class: Vision Difficulty
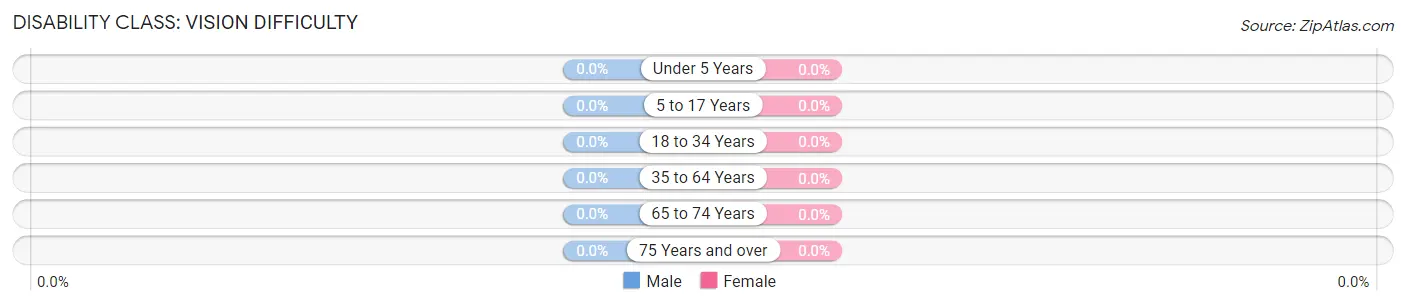
| Age Bracket | Male | Female |
| Under 5 Years | 0 (0.0%) | 0 (0.0%) |
| 5 to 17 Years | 0 (0.0%) | 0 (0.0%) |
| 18 to 34 Years | 0 (0.0%) | 0 (0.0%) |
| 35 to 64 Years | 0 (0.0%) | 0 (0.0%) |
| 65 to 74 Years | 0 (0.0%) | 0 (0.0%) |
| 75 Years and over | 0 (0.0%) | 0 (0.0%) |
Disability Class: Cognitive Difficulty
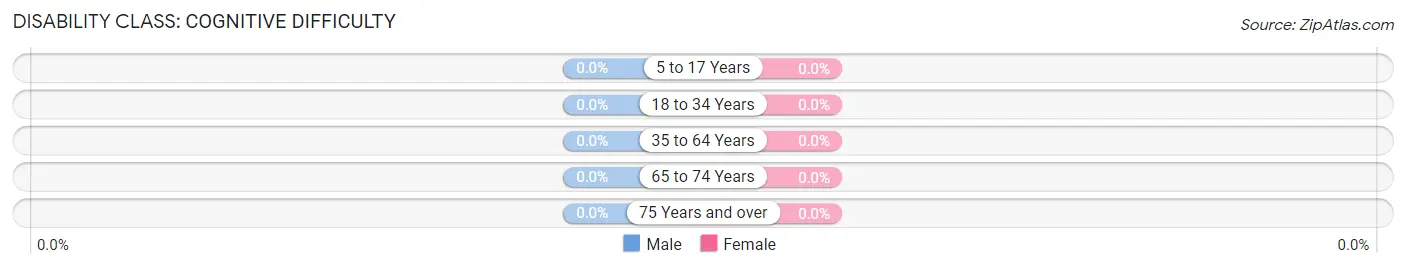
| Age Bracket | Male | Female |
| 5 to 17 Years | 0 (0.0%) | 0 (0.0%) |
| 18 to 34 Years | 0 (0.0%) | 0 (0.0%) |
| 35 to 64 Years | 0 (0.0%) | 0 (0.0%) |
| 65 to 74 Years | 0 (0.0%) | 0 (0.0%) |
| 75 Years and over | 0 (0.0%) | 0 (0.0%) |
Disability Class: Ambulatory Difficulty
| Age Bracket | Male | Female |
| 5 to 17 Years | 0 (0.0%) | 0 (0.0%) |
| 18 to 34 Years | 0 (0.0%) | 0 (0.0%) |
| 35 to 64 Years | 0 (0.0%) | 0 (0.0%) |
| 65 to 74 Years | 0 (0.0%) | 0 (0.0%) |
| 75 Years and over | 0 (0.0%) | 0 (0.0%) |
Disability Class: Self-Care Difficulty
| Age Bracket | Male | Female |
| 5 to 17 Years | 0 (0.0%) | 0 (0.0%) |
| 18 to 34 Years | 0 (0.0%) | 0 (0.0%) |
| 35 to 64 Years | 0 (0.0%) | 0 (0.0%) |
| 65 to 74 Years | 0 (0.0%) | 0 (0.0%) |
| 75 Years and over | 0 (0.0%) | 0 (0.0%) |
Technology Access in Womens Bay
Computing Device Access in Womens Bay
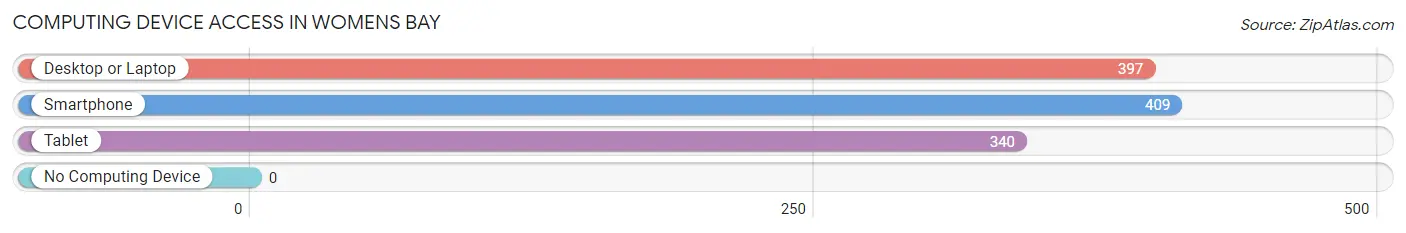
| Device Type | # Households | % Households |
| Desktop or Laptop | 397 | 95.2% |
| Smartphone | 409 | 98.1% |
| Tablet | 340 | 81.5% |
| No Computing Device | 0 | 0.0% |
| Total | 417 | 100.0% |
Internet Access in Womens Bay
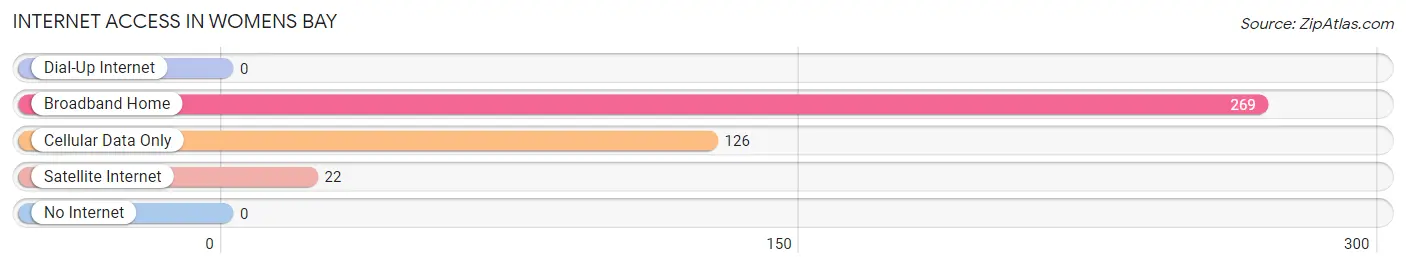
| Internet Type | # Households | % Households |
| Dial-Up Internet | 0 | 0.0% |
| Broadband Home | 269 | 64.5% |
| Cellular Data Only | 126 | 30.2% |
| Satellite Internet | 22 | 5.3% |
| No Internet | 0 | 0.0% |
| Total | 417 | 100.0% |
Womens Bay Summary
Womens Bay, Alaska is a small unincorporated community located in the Kodiak Island Borough of Alaska. It is located on the eastern shore of Kodiak Island, approximately 25 miles south of the city of Kodiak. The community is home to approximately 50 people, most of whom are of Native Alaskan descent.
Geography
Womens Bay is located on the eastern shore of Kodiak Island, approximately 25 miles south of the city of Kodiak. The community is situated on a small bay, which is surrounded by steep hills and mountains. The bay is protected from the open ocean by a small island, which is home to a large population of sea lions. The bay is also home to a variety of fish, including salmon, halibut, and cod. The area is also home to a variety of wildlife, including bears, moose, and eagles.
Economy
The economy of Womens Bay is largely based on fishing and subsistence activities. The community is home to a number of commercial fishing boats, which are used to harvest salmon, halibut, and cod. The fish are then sold to local markets and restaurants. The community also relies heavily on subsistence activities, such as hunting and gathering. The area is home to a variety of wildlife, including bears, moose, and eagles, which are hunted for food and fur.
Demographics
As of the 2010 census, the population of Womens Bay was 50 people. The racial makeup of the community was 100% Native Alaskan. The median age of the population was 37.5 years, and the median household income was $25,000.
History
Womens Bay has a long history of Native Alaskan occupation. The area was first inhabited by the Alutiiq people, who were the first to settle the area. The Alutiiq people were known for their fishing and hunting skills, and the area was a popular fishing spot for the tribe. In the late 1800s, the area was settled by Russian fur traders, who established a trading post in the area. In the early 1900s, the area was settled by American settlers, who established a cannery in the area. The cannery was used to process salmon, halibut, and cod, which were then sold to local markets and restaurants. The cannery closed in the 1950s, and the area has since become a small fishing and subsistence community.
Common Questions
What is Per Capita Income in Womens Bay?
Per Capita income in Womens Bay is $47,312.
What is the Median Family Income in Womens Bay?
Median Family Income in Womens Bay is $150,222.
What is the Median Household income in Womens Bay?
Median Household Income in Womens Bay is $121,250.
What is Income or Wage Gap in Womens Bay?
Income or Wage Gap in Womens Bay is 28.5%.
Women in Womens Bay earn 71.5 cents for every dollar earned by a man.
What is Inequality or Gini Index in Womens Bay?
Inequality or Gini Index in Womens Bay is 0.37.
What is the Total Population of Womens Bay?
Total Population of Womens Bay is 1,063.
What is the Total Male Population of Womens Bay?
Total Male Population of Womens Bay is 555.
What is the Total Female Population of Womens Bay?
Total Female Population of Womens Bay is 508.
What is the Ratio of Males per 100 Females in Womens Bay?
There are 109.25 Males per 100 Females in Womens Bay.
What is the Ratio of Females per 100 Males in Womens Bay?
There are 91.53 Females per 100 Males in Womens Bay.
What is the Median Population Age in Womens Bay?
Median Population Age in Womens Bay is 35.5 Years.
What is the Average Family Size in Womens Bay
Average Family Size in Womens Bay is 2.8 People.
What is the Average Household Size in Womens Bay
Average Household Size in Womens Bay is 2.5 People.
How Large is the Labor Force in Womens Bay?
There are 636 People in the Labor Forcein in Womens Bay.
What is the Percentage of People in the Labor Force in Womens Bay?
72.4% of People are in the Labor Force in Womens Bay.
What is the Unemployment Rate in Womens Bay?
Unemployment Rate in Womens Bay is 4.1%.