Los Alamos, NM Map & Demographics
Los Alamos Map
Los Alamos Overview
$73,654
PER CAPITA INCOME
$164,531
AVG FAMILY INCOME
$130,342
AVG HOUSEHOLD INCOME
33.0%
WAGE / INCOME GAP [ % ]
67.0¢/ $1
WAGE / INCOME GAP [ $ ]
$6,867
FAMILY INCOME DEFICIT
0.41
INEQUALITY / GINI INDEX
13,460
TOTAL POPULATION
7,050
MALE POPULATION
6,410
FEMALE POPULATION
109.98
MALES / 100 FEMALES
90.92
FEMALES / 100 MALES
41.3
MEDIAN AGE
2.9
AVG FAMILY SIZE
2.2
AVG HOUSEHOLD SIZE
7,727
LABOR FORCE [ PEOPLE ]
68.7%
PERCENT IN LABOR FORCE
1.8%
UNEMPLOYMENT RATE
Los Alamos Zip Codes
Los Alamos Area Codes
Income in Los Alamos
Income Overview in Los Alamos
Per Capita Income in Los Alamos is $73,654, while median incomes of families and households are $164,531 and $130,342 respectively.
| Characteristic | Number | Measure |
| Per Capita Income | 13,460 | $73,654 |
| Median Family Income | 3,640 | $164,531 |
| Mean Family Income | 3,640 | $197,593 |
| Median Household Income | 5,996 | $130,342 |
| Mean Household Income | 5,996 | $161,532 |
| Income Deficit | 3,640 | $6,867 |
| Wage / Income Gap (%) | 13,460 | 32.98% |
| Wage / Income Gap ($) | 13,460 | 67.02¢ per $1 |
| Gini / Inequality Index | 13,460 | 0.41 |
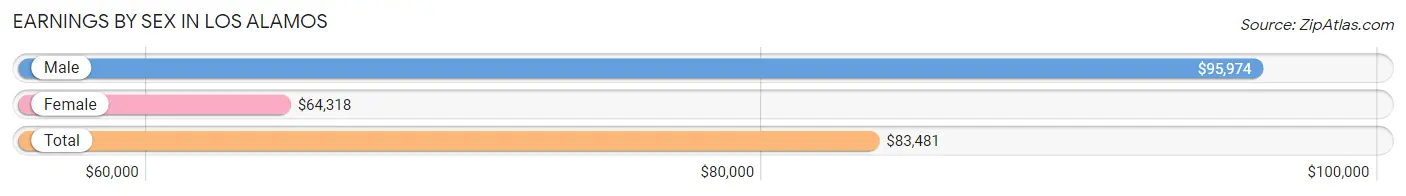
Earnings by Sex in Los Alamos
Average Earnings in Los Alamos are $83,481, $95,974 for men and $64,318 for women, a difference of 33.0%.
| Sex | Number | Average Earnings |
| Male | 4,545 (55.4%) | $95,974 |
| Female | 3,652 (44.6%) | $64,318 |
| Total | 8,197 (100.0%) | $83,481 |
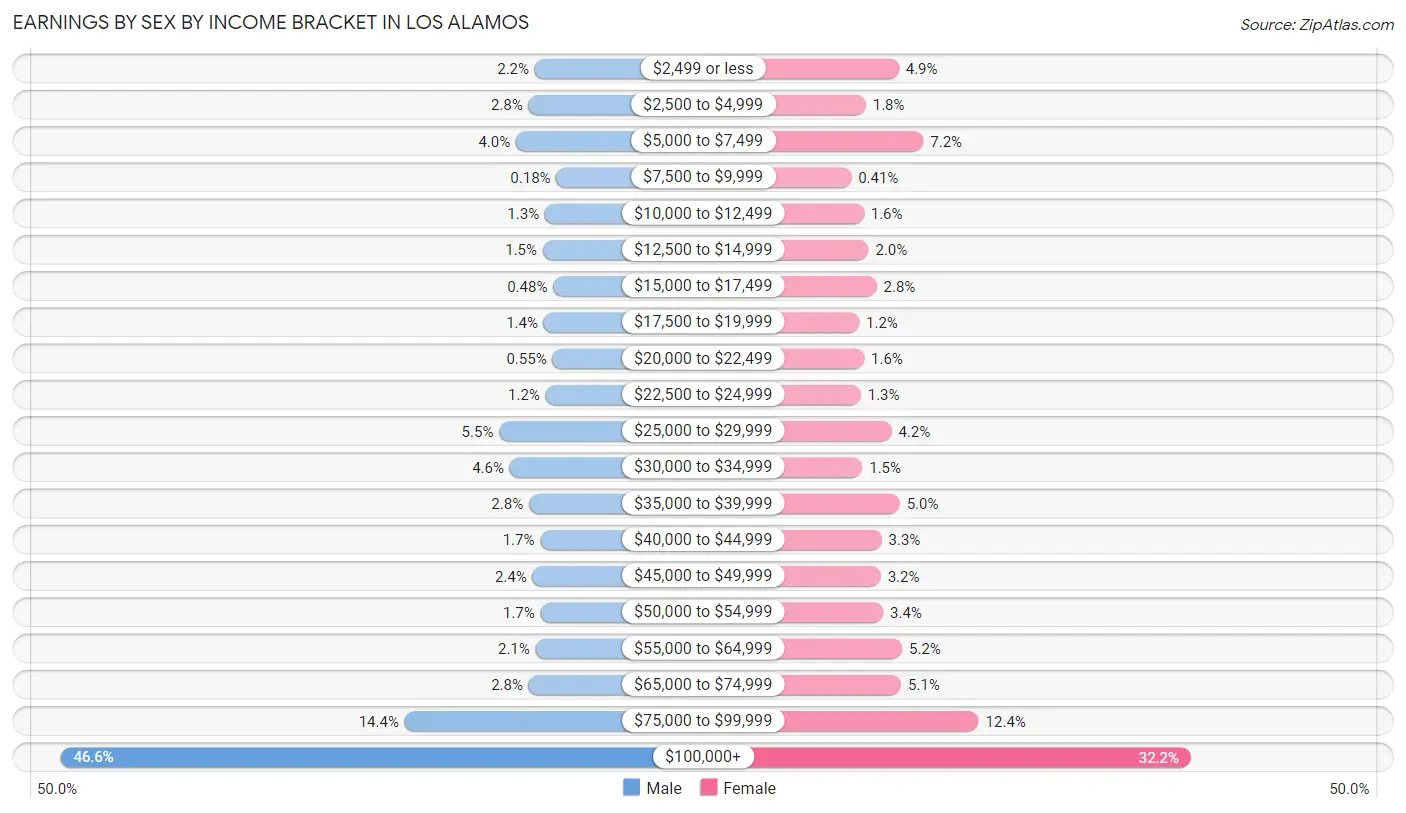
Earnings by Sex by Income Bracket in Los Alamos
The most common earnings brackets in Los Alamos are $100,000+ for men (2,120 | 46.6%) and $100,000+ for women (1,177 | 32.2%).
| Income | Male | Female |
| $2,499 or less | 100 (2.2%) | 178 (4.9%) |
| $2,500 to $4,999 | 127 (2.8%) | 65 (1.8%) |
| $5,000 to $7,499 | 180 (4.0%) | 262 (7.2%) |
| $7,500 to $9,999 | 8 (0.2%) | 15 (0.4%) |
| $10,000 to $12,499 | 57 (1.3%) | 58 (1.6%) |
| $12,500 to $14,999 | 66 (1.5%) | 74 (2.0%) |
| $15,000 to $17,499 | 22 (0.5%) | 102 (2.8%) |
| $17,500 to $19,999 | 62 (1.4%) | 42 (1.1%) |
| $20,000 to $22,499 | 25 (0.5%) | 59 (1.6%) |
| $22,500 to $24,999 | 54 (1.2%) | 48 (1.3%) |
| $25,000 to $29,999 | 252 (5.5%) | 153 (4.2%) |
| $30,000 to $34,999 | 207 (4.5%) | 53 (1.5%) |
| $35,000 to $39,999 | 125 (2.8%) | 181 (5.0%) |
| $40,000 to $44,999 | 77 (1.7%) | 119 (3.3%) |
| $45,000 to $49,999 | 110 (2.4%) | 116 (3.2%) |
| $50,000 to $54,999 | 76 (1.7%) | 124 (3.4%) |
| $55,000 to $64,999 | 97 (2.1%) | 189 (5.2%) |
| $65,000 to $74,999 | 126 (2.8%) | 186 (5.1%) |
| $75,000 to $99,999 | 654 (14.4%) | 451 (12.3%) |
| $100,000+ | 2,120 (46.6%) | 1,177 (32.2%) |
| Total | 4,545 (100.0%) | 3,652 (100.0%) |
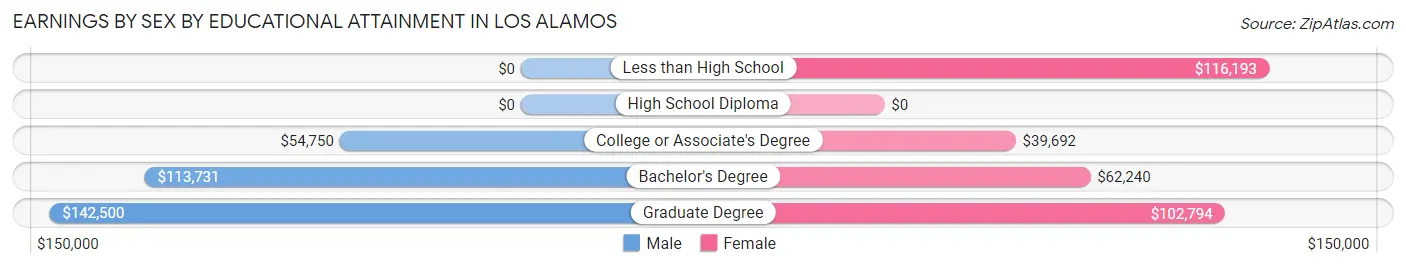
Earnings by Sex by Educational Attainment in Los Alamos
Average earnings in Los Alamos are $104,498 for men and $76,438 for women, a difference of 26.9%. Men with an educational attainment of graduate degree enjoy the highest average annual earnings of $142,500, while those with college or associate's degree education earn the least with $54,750. Women with an educational attainment of less than high school earn the most with the average annual earnings of $116,193, while those with college or associate's degree education have the smallest earnings of $39,692.
| Educational Attainment | Male Income | Female Income |
| Less than High School | - | - |
| High School Diploma | - | - |
| College or Associate's Degree | $54,750 | $39,692 |
| Bachelor's Degree | $113,731 | $62,240 |
| Graduate Degree | $142,500 | $102,794 |
| Total | $104,498 | $76,438 |
Family Income in Los Alamos
Family Income Brackets in Los Alamos
According to the Los Alamos family income data, there are 1,296 families falling into the $200,000+ income range, which is the most common income bracket and makes up 35.6% of all families. Conversely, the less than $10,000 income bracket is the least frequent group with only 18 families (0.5%) belonging to this category.
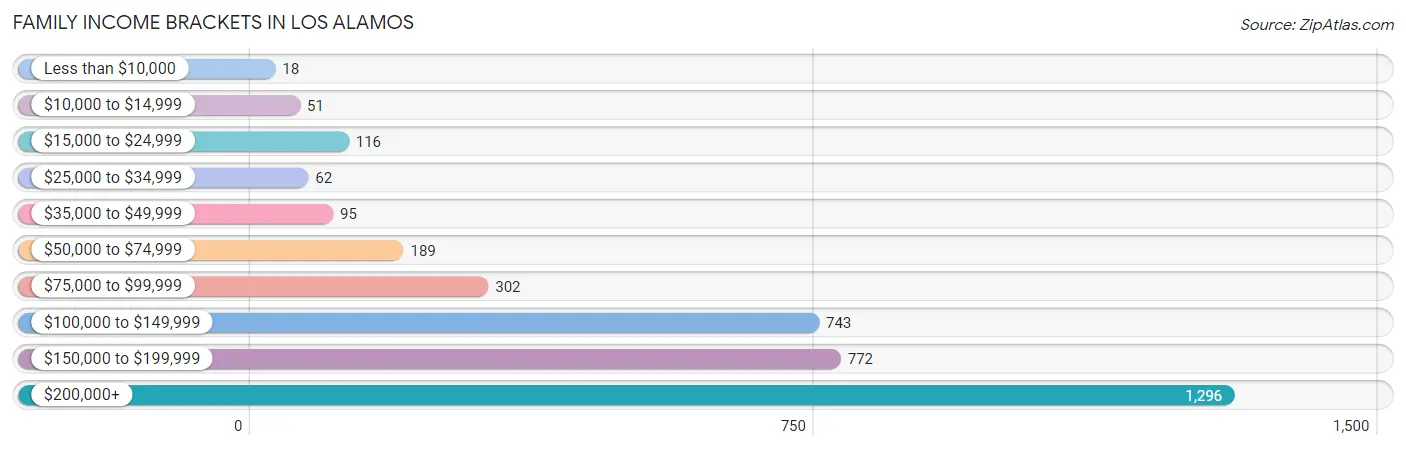
| Income Bracket | # Families | % Families |
| Less than $10,000 | 18 | 0.5% |
| $10,000 to $14,999 | 51 | 1.4% |
| $15,000 to $24,999 | 116 | 3.2% |
| $25,000 to $34,999 | 62 | 1.7% |
| $35,000 to $49,999 | 95 | 2.6% |
| $50,000 to $74,999 | 189 | 5.2% |
| $75,000 to $99,999 | 302 | 8.3% |
| $100,000 to $149,999 | 743 | 20.4% |
| $150,000 to $199,999 | 772 | 21.2% |
| $200,000+ | 1,296 | 35.6% |
Family Income by Famaliy Size in Los Alamos
4-person families (588 | 16.2%) account for the highest median family income in Los Alamos with $250,001 per family, while 2-person families (2,011 | 55.2%) have the highest median income of $66,354 per family member.
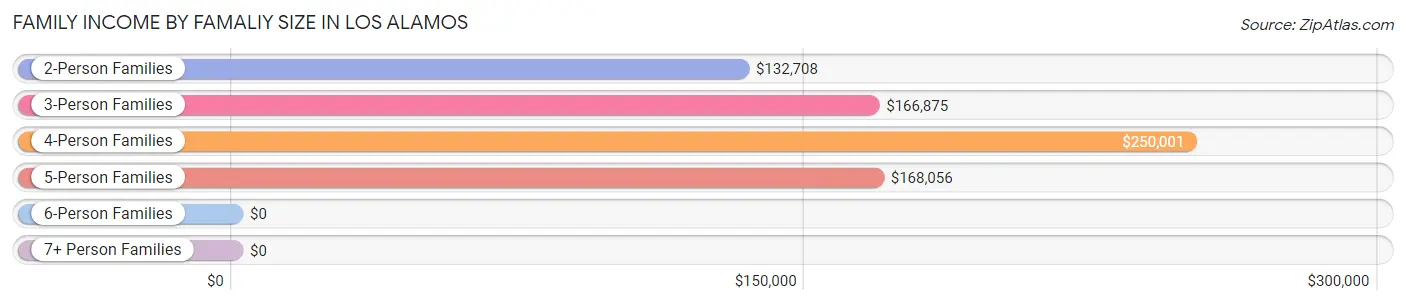
| Income Bracket | # Families | Median Income |
| 2-Person Families | 2,011 (55.2%) | $132,708 |
| 3-Person Families | 774 (21.3%) | $166,875 |
| 4-Person Families | 588 (16.2%) | $250,001 |
| 5-Person Families | 154 (4.2%) | $168,056 |
| 6-Person Families | 113 (3.1%) | $0 |
| 7+ Person Families | 0 (0.0%) | $0 |
| Total | 3,640 (100.0%) | $164,531 |
Family Income by Number of Earners in Los Alamos
The median family income in Los Alamos is $164,531, with families comprising 3+ earners (298) having the highest median family income of $218,875, while families with no earners (578) have the lowest median family income of $116,250, accounting for 8.2% and 15.9% of families, respectively.
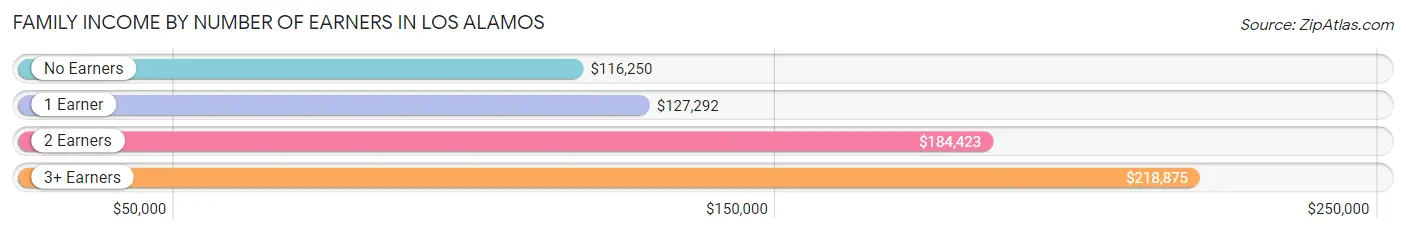
| Number of Earners | # Families | Median Income |
| No Earners | 578 (15.9%) | $116,250 |
| 1 Earner | 938 (25.8%) | $127,292 |
| 2 Earners | 1,826 (50.2%) | $184,423 |
| 3+ Earners | 298 (8.2%) | $218,875 |
| Total | 3,640 (100.0%) | $164,531 |
Household Income in Los Alamos
Household Income Brackets in Los Alamos
With 1,517 households falling in the category, the $200,000+ income range is the most frequent in Los Alamos, accounting for 25.3% of all households. In contrast, only 78 households (1.3%) fall into the $10,000 to $14,999 income bracket, making it the least populous group.
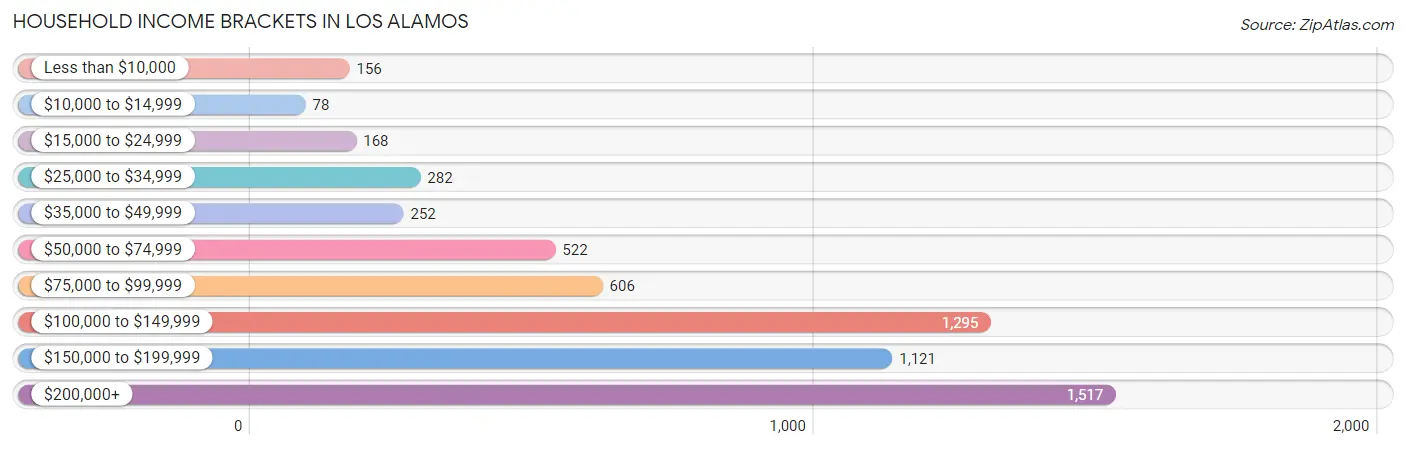
| Income Bracket | # Households | % Households |
| Less than $10,000 | 156 | 2.6% |
| $10,000 to $14,999 | 78 | 1.3% |
| $15,000 to $24,999 | 168 | 2.8% |
| $25,000 to $34,999 | 282 | 4.7% |
| $35,000 to $49,999 | 252 | 4.2% |
| $50,000 to $74,999 | 522 | 8.7% |
| $75,000 to $99,999 | 606 | 10.1% |
| $100,000 to $149,999 | 1,295 | 21.6% |
| $150,000 to $199,999 | 1,121 | 18.7% |
| $200,000+ | 1,517 | 25.3% |
Household Income by Householder Age in Los Alamos
The median household income in Los Alamos is $130,342, with the highest median household income of $153,913 found in the 45 to 64 years age bracket for the primary householder. A total of 2,578 households (43.0%) fall into this category. Meanwhile, the 15 to 24 years age bracket for the primary householder has the lowest median household income of $0, with 245 households (4.1%) in this group.
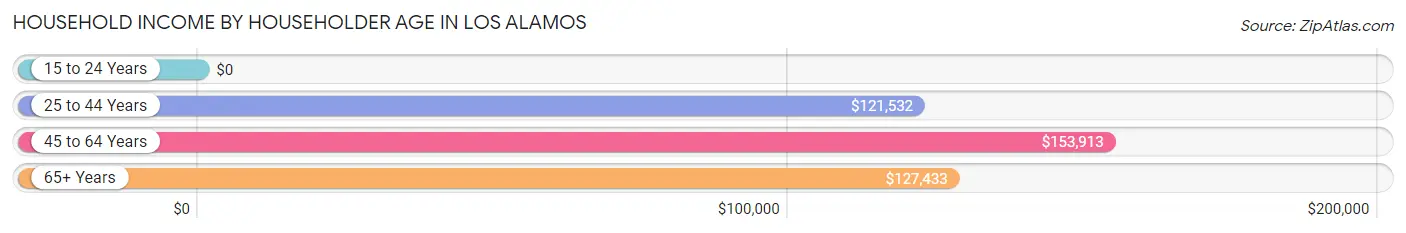
| Income Bracket | # Households | Median Income |
| 15 to 24 Years | 245 (4.1%) | $0 |
| 25 to 44 Years | 1,842 (30.7%) | $121,532 |
| 45 to 64 Years | 2,578 (43.0%) | $153,913 |
| 65+ Years | 1,331 (22.2%) | $127,433 |
| Total | 5,996 (100.0%) | $130,342 |
Poverty in Los Alamos
Income Below Poverty by Sex and Age in Los Alamos
With 4.3% poverty level for males and 4.7% for females among the residents of Los Alamos, under 5 year old males and 18 to 24 year old females are the most vulnerable to poverty, with 63 males (22.6%) and 107 females (30.0%) in their respective age groups living below the poverty level.
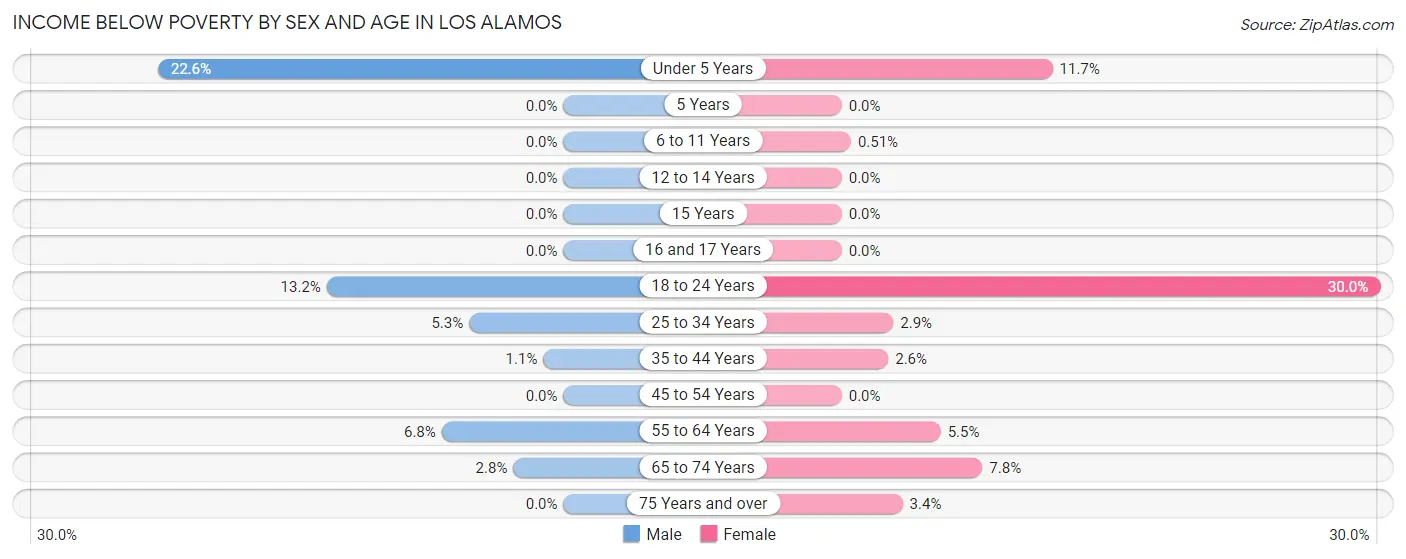
| Age Bracket | Male | Female |
| Under 5 Years | 63 (22.6%) | 25 (11.7%) |
| 5 Years | 0 (0.0%) | 0 (0.0%) |
| 6 to 11 Years | 0 (0.0%) | 2 (0.5%) |
| 12 to 14 Years | 0 (0.0%) | 0 (0.0%) |
| 15 Years | 0 (0.0%) | 0 (0.0%) |
| 16 and 17 Years | 0 (0.0%) | 0 (0.0%) |
| 18 to 24 Years | 75 (13.2%) | 107 (30.0%) |
| 25 to 34 Years | 62 (5.2%) | 26 (2.9%) |
| 35 to 44 Years | 9 (1.1%) | 19 (2.6%) |
| 45 to 54 Years | 0 (0.0%) | 0 (0.0%) |
| 55 to 64 Years | 74 (6.8%) | 51 (5.5%) |
| 65 to 74 Years | 18 (2.8%) | 49 (7.8%) |
| 75 Years and over | 0 (0.0%) | 19 (3.4%) |
| Total | 301 (4.3%) | 298 (4.7%) |
Income Above Poverty by Sex and Age in Los Alamos
According to the poverty statistics in Los Alamos, males aged 5 years and females aged 5 years are the age groups that are most secure financially, with 100.0% of males and 100.0% of females in these age groups living above the poverty line.
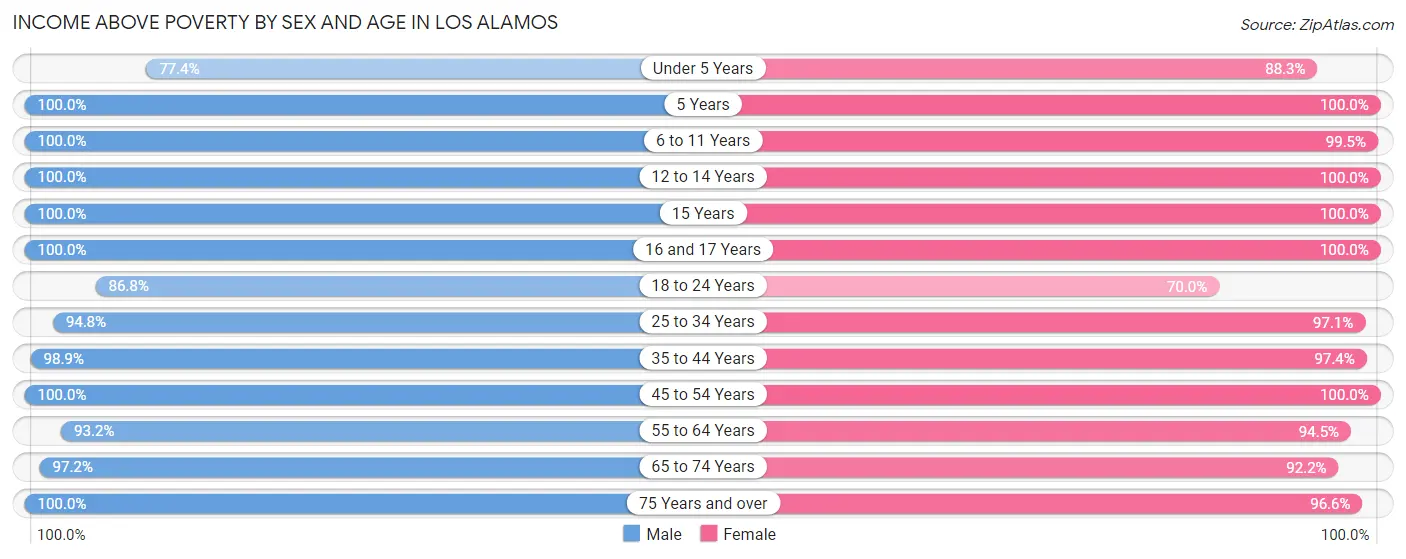
| Age Bracket | Male | Female |
| Under 5 Years | 216 (77.4%) | 188 (88.3%) |
| 5 Years | 24 (100.0%) | 41 (100.0%) |
| 6 to 11 Years | 567 (100.0%) | 394 (99.5%) |
| 12 to 14 Years | 179 (100.0%) | 314 (100.0%) |
| 15 Years | 128 (100.0%) | 53 (100.0%) |
| 16 and 17 Years | 188 (100.0%) | 220 (100.0%) |
| 18 to 24 Years | 494 (86.8%) | 250 (70.0%) |
| 25 to 34 Years | 1,120 (94.8%) | 879 (97.1%) |
| 35 to 44 Years | 797 (98.9%) | 715 (97.4%) |
| 45 to 54 Years | 875 (100.0%) | 995 (100.0%) |
| 55 to 64 Years | 1,017 (93.2%) | 875 (94.5%) |
| 65 to 74 Years | 628 (97.2%) | 577 (92.2%) |
| 75 Years and over | 477 (100.0%) | 542 (96.6%) |
| Total | 6,710 (95.7%) | 6,043 (95.3%) |
Income Below Poverty Among Married-Couple Families in Los Alamos
The poverty statistics for married-couple families in Los Alamos show that 2.1% or 62 of the total 2,988 families live below the poverty line. Families with 1 or 2 children have the highest poverty rate of 2.8%, comprising of 27 families. On the other hand, families with 3 or 4 children have the lowest poverty rate of 0.0%, which includes 0 families.
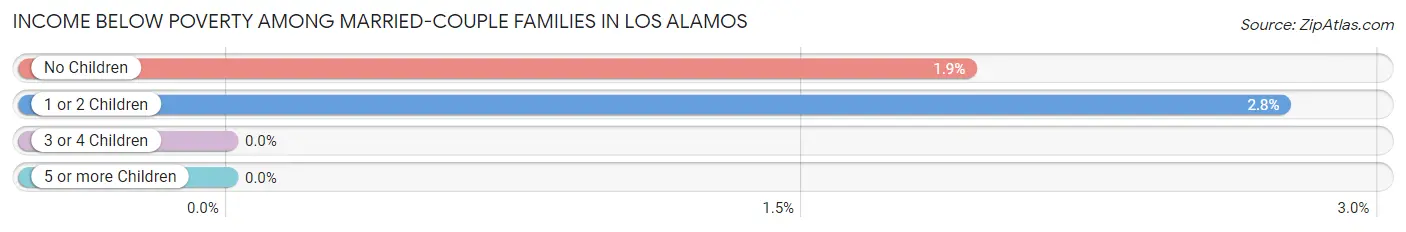
| Children | Above Poverty | Below Poverty |
| No Children | 1,782 (98.1%) | 35 (1.9%) |
| 1 or 2 Children | 955 (97.3%) | 27 (2.8%) |
| 3 or 4 Children | 189 (100.0%) | 0 (0.0%) |
| 5 or more Children | 0 (0.0%) | 0 (0.0%) |
| Total | 2,926 (97.9%) | 62 (2.1%) |
Income Below Poverty Among Single-Parent Households in Los Alamos
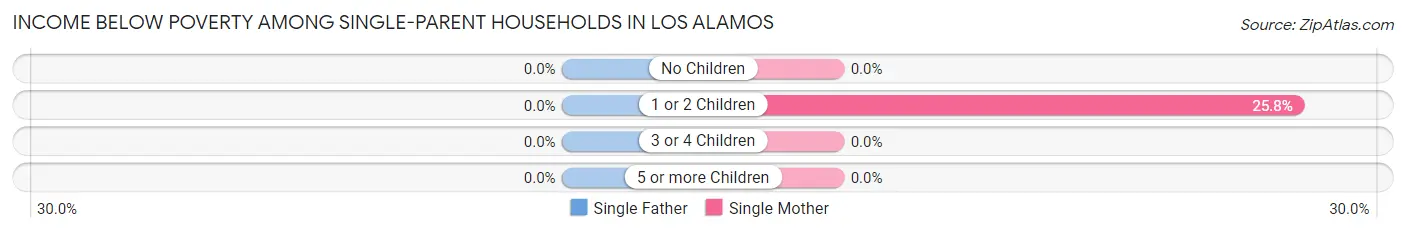
| Children | Single Father | Single Mother |
| No Children | 0 (0.0%) | 0 (0.0%) |
| 1 or 2 Children | 0 (0.0%) | 60 (25.8%) |
| 3 or 4 Children | 0 (0.0%) | 0 (0.0%) |
| 5 or more Children | 0 (0.0%) | 0 (0.0%) |
| Total | 0 (0.0%) | 60 (13.6%) |
Income Below Poverty Among Married-Couple vs Single-Parent Households in Los Alamos
The poverty data for Los Alamos shows that 62 of the married-couple family households (2.1%) and 60 of the single-parent households (9.2%) are living below the poverty level. Within the married-couple family households, those with 1 or 2 children have the highest poverty rate, with 27 households (2.8%) falling below the poverty line. Among the single-parent households, those with 1 or 2 children have the highest poverty rate, with 60 household (16.7%) living below poverty.
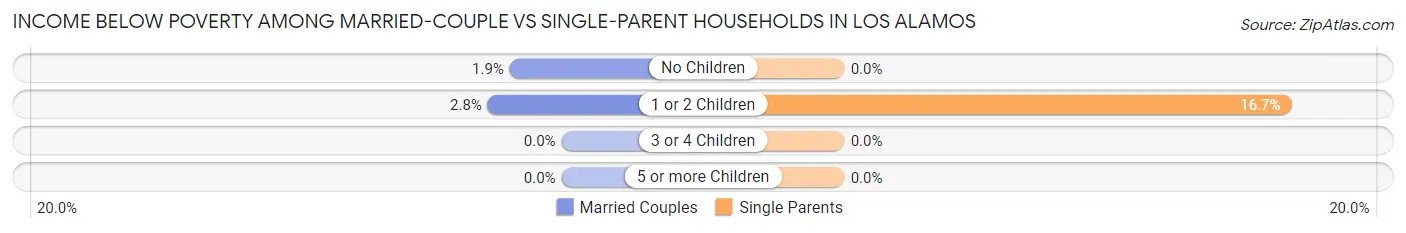
| Children | Married-Couple Families | Single-Parent Households |
| No Children | 35 (1.9%) | 0 (0.0%) |
| 1 or 2 Children | 27 (2.8%) | 60 (16.7%) |
| 3 or 4 Children | 0 (0.0%) | 0 (0.0%) |
| 5 or more Children | 0 (0.0%) | 0 (0.0%) |
| Total | 62 (2.1%) | 60 (9.2%) |
Race in Los Alamos
The most populous races in Los Alamos are White / Caucasian (10,340 | 76.8%), Hispanic or Latino (2,371 | 17.6%), and Two or more Races (1,386 | 10.3%).
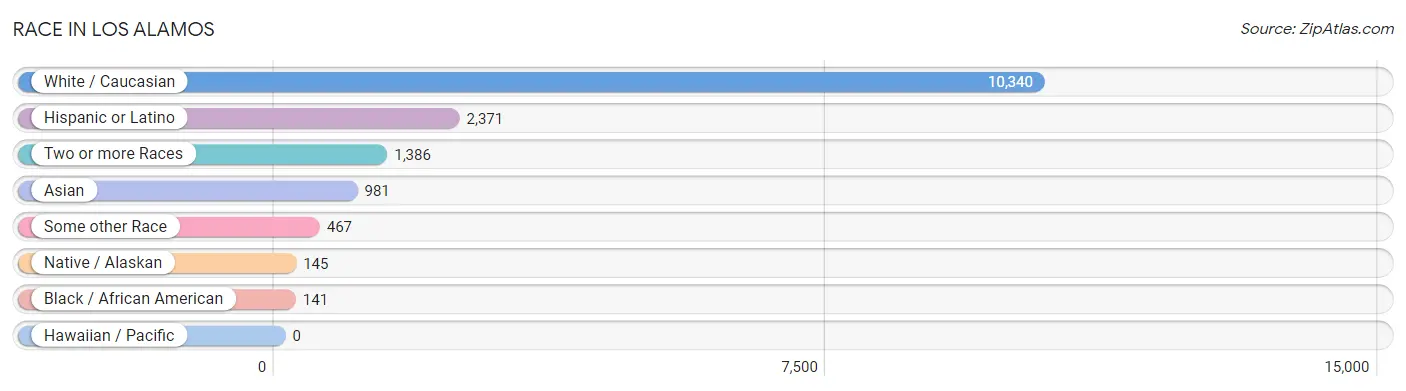
| Race | # Population | % Population |
| Asian | 981 | 7.3% |
| Black / African American | 141 | 1.1% |
| Hawaiian / Pacific | 0 | 0.0% |
| Hispanic or Latino | 2,371 | 17.6% |
| Native / Alaskan | 145 | 1.1% |
| White / Caucasian | 10,340 | 76.8% |
| Two or more Races | 1,386 | 10.3% |
| Some other Race | 467 | 3.5% |
| Total | 13,460 | 100.0% |
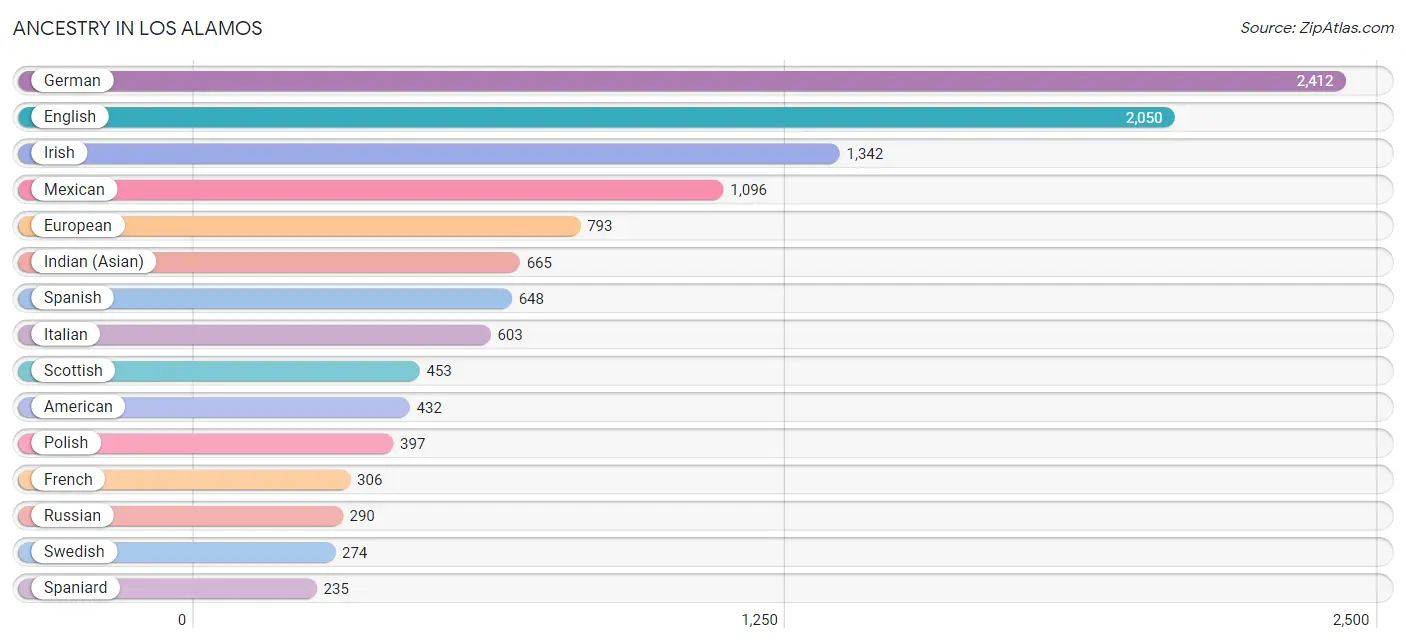
Ancestry in Los Alamos
The most populous ancestries reported in Los Alamos are German (2,412 | 17.9%), English (2,050 | 15.2%), Irish (1,342 | 10.0%), Mexican (1,096 | 8.1%), and European (793 | 5.9%), together accounting for 57.2% of all Los Alamos residents.
| Ancestry | # Population | % Population |
| African | 3 | 0.0% |
| American | 432 | 3.2% |
| Apache | 1 | 0.0% |
| Arab | 52 | 0.4% |
| Argentinean | 10 | 0.1% |
| Belgian | 81 | 0.6% |
| Bhutanese | 40 | 0.3% |
| British | 213 | 1.6% |
| Burmese | 116 | 0.9% |
| Canadian | 57 | 0.4% |
| Central American | 46 | 0.3% |
| Central American Indian | 11 | 0.1% |
| Cherokee | 48 | 0.4% |
| Chippewa | 19 | 0.1% |
| Choctaw | 45 | 0.3% |
| Colombian | 25 | 0.2% |
| Croatian | 11 | 0.1% |
| Czech | 31 | 0.2% |
| Czechoslovakian | 7 | 0.1% |
| Danish | 153 | 1.1% |
| Dutch | 155 | 1.1% |
| Eastern European | 130 | 1.0% |
| Ecuadorian | 15 | 0.1% |
| English | 2,050 | 15.2% |
| Ethiopian | 43 | 0.3% |
| European | 793 | 5.9% |
| Filipino | 84 | 0.6% |
| Finnish | 11 | 0.1% |
| French | 306 | 2.3% |
| French Canadian | 57 | 0.4% |
| German | 2,412 | 17.9% |
| Greek | 80 | 0.6% |
| Guamanian / Chamorro | 31 | 0.2% |
| Guatemalan | 30 | 0.2% |
| Hungarian | 57 | 0.4% |
| Indian (Asian) | 665 | 4.9% |
| Irish | 1,342 | 10.0% |
| Israeli | 11 | 0.1% |
| Italian | 603 | 4.5% |
| Korean | 126 | 0.9% |
| Latvian | 9 | 0.1% |
| Lebanese | 52 | 0.4% |
| Lithuanian | 6 | 0.0% |
| Malaysian | 20 | 0.2% |
| Mexican | 1,096 | 8.1% |
| Native Hawaiian | 3 | 0.0% |
| Navajo | 97 | 0.7% |
| New Zealander | 10 | 0.1% |
| Nicaraguan | 8 | 0.1% |
| Nigerian | 29 | 0.2% |
| Northern European | 34 | 0.3% |
| Norwegian | 227 | 1.7% |
| Pakistani | 3 | 0.0% |
| Panamanian | 8 | 0.1% |
| Peruvian | 17 | 0.1% |
| Polish | 397 | 2.9% |
| Portuguese | 108 | 0.8% |
| Pueblo | 41 | 0.3% |
| Puerto Rican | 114 | 0.9% |
| Romanian | 6 | 0.0% |
| Russian | 290 | 2.1% |
| Samoan | 22 | 0.2% |
| Scandinavian | 211 | 1.6% |
| Scotch-Irish | 229 | 1.7% |
| Scottish | 453 | 3.4% |
| Serbian | 42 | 0.3% |
| Slavic | 10 | 0.1% |
| Slovak | 15 | 0.1% |
| Slovene | 30 | 0.2% |
| South American | 67 | 0.5% |
| Spaniard | 235 | 1.8% |
| Spanish | 648 | 4.8% |
| Sri Lankan | 11 | 0.1% |
| Subsaharan African | 75 | 0.6% |
| Swedish | 274 | 2.0% |
| Swiss | 46 | 0.3% |
| Thai | 138 | 1.0% |
| Turkish | 9 | 0.1% |
| Ukrainian | 58 | 0.4% |
| Vietnamese | 45 | 0.3% |
| Welsh | 104 | 0.8% |
| Yugoslavian | 9 | 0.1% | View All 82 Rows |
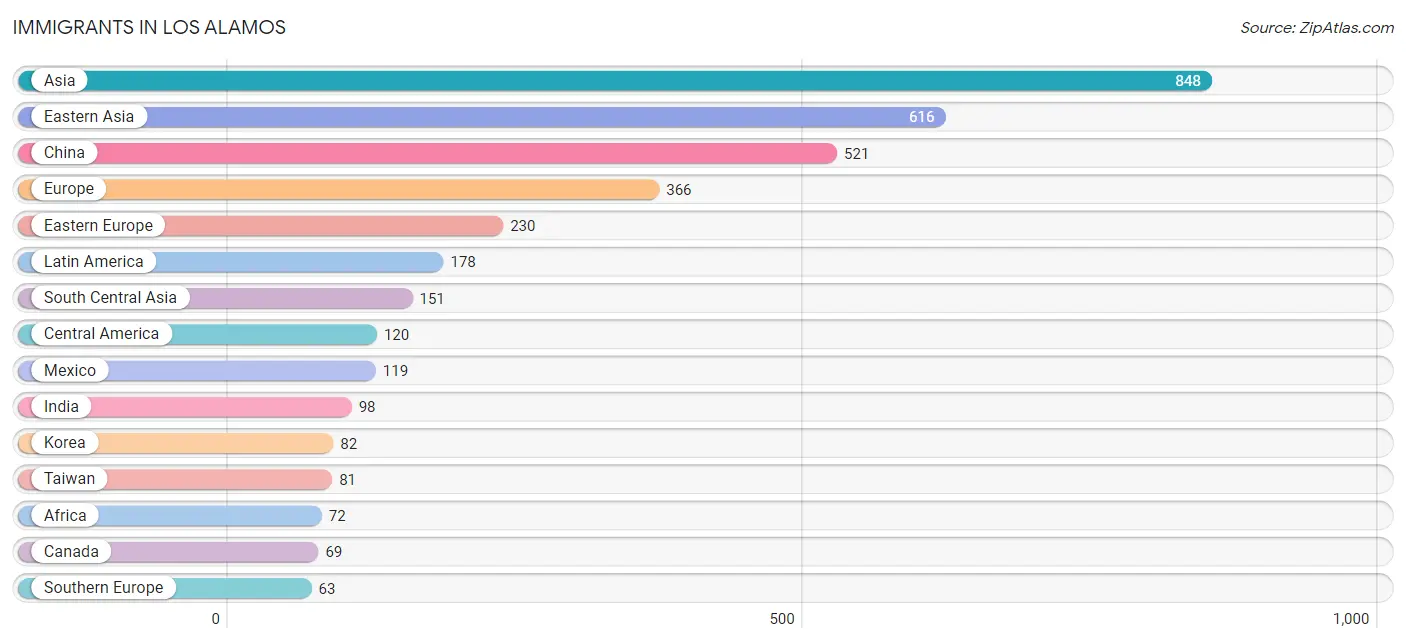
Immigrants in Los Alamos
The most numerous immigrant groups reported in Los Alamos came from Asia (848 | 6.3%), Eastern Asia (616 | 4.6%), China (521 | 3.9%), Europe (366 | 2.7%), and Eastern Europe (230 | 1.7%), together accounting for 19.2% of all Los Alamos residents.
| Immigration Origin | # Population | % Population |
| Africa | 72 | 0.5% |
| Argentina | 10 | 0.1% |
| Asia | 848 | 6.3% |
| Austria | 13 | 0.1% |
| Bangladesh | 45 | 0.3% |
| Belarus | 10 | 0.1% |
| Bosnia and Herzegovina | 12 | 0.1% |
| Canada | 69 | 0.5% |
| Caribbean | 8 | 0.1% |
| Central America | 120 | 0.9% |
| China | 521 | 3.9% |
| Colombia | 25 | 0.2% |
| Croatia | 5 | 0.0% |
| Eastern Africa | 43 | 0.3% |
| Eastern Asia | 616 | 4.6% |
| Eastern Europe | 230 | 1.7% |
| Ecuador | 15 | 0.1% |
| England | 20 | 0.2% |
| Ethiopia | 43 | 0.3% |
| Europe | 366 | 2.7% |
| Germany | 18 | 0.1% |
| Greece | 20 | 0.2% |
| Guatemala | 1 | 0.0% |
| India | 98 | 0.7% |
| Italy | 19 | 0.1% |
| Jamaica | 8 | 0.1% |
| Japan | 13 | 0.1% |
| Korea | 82 | 0.6% |
| Latin America | 178 | 1.3% |
| Latvia | 9 | 0.1% |
| Mexico | 119 | 0.9% |
| Nigeria | 29 | 0.2% |
| Northern Europe | 32 | 0.2% |
| Oceania | 10 | 0.1% |
| Pakistan | 8 | 0.1% |
| Philippines | 26 | 0.2% |
| Poland | 38 | 0.3% |
| Russia | 32 | 0.2% |
| Serbia | 42 | 0.3% |
| South America | 50 | 0.4% |
| South Central Asia | 151 | 1.1% |
| South Eastern Asia | 55 | 0.4% |
| Southern Europe | 63 | 0.5% |
| Spain | 24 | 0.2% |
| Switzerland | 10 | 0.1% |
| Taiwan | 81 | 0.6% |
| Turkey | 9 | 0.1% |
| Ukraine | 50 | 0.4% |
| Vietnam | 29 | 0.2% |
| Western Africa | 29 | 0.2% |
| Western Asia | 26 | 0.2% |
| Western Europe | 41 | 0.3% | View All 52 Rows |
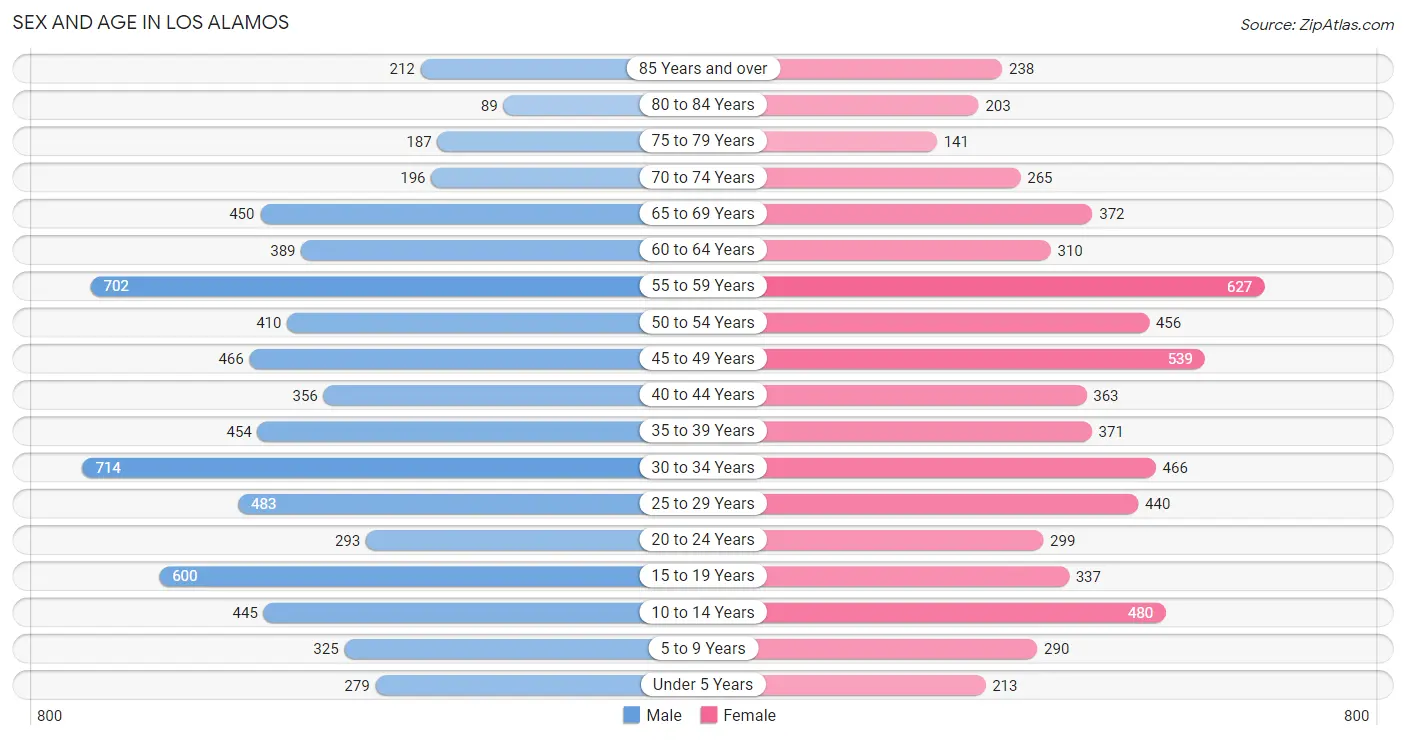
Sex and Age in Los Alamos
Sex and Age in Los Alamos
The most populous age groups in Los Alamos are 30 to 34 Years (714 | 10.1%) for men and 55 to 59 Years (627 | 9.8%) for women.
| Age Bracket | Male | Female |
| Under 5 Years | 279 (4.0%) | 213 (3.3%) |
| 5 to 9 Years | 325 (4.6%) | 290 (4.5%) |
| 10 to 14 Years | 445 (6.3%) | 480 (7.5%) |
| 15 to 19 Years | 600 (8.5%) | 337 (5.3%) |
| 20 to 24 Years | 293 (4.2%) | 299 (4.7%) |
| 25 to 29 Years | 483 (6.9%) | 440 (6.9%) |
| 30 to 34 Years | 714 (10.1%) | 466 (7.3%) |
| 35 to 39 Years | 454 (6.4%) | 371 (5.8%) |
| 40 to 44 Years | 356 (5.1%) | 363 (5.7%) |
| 45 to 49 Years | 466 (6.6%) | 539 (8.4%) |
| 50 to 54 Years | 410 (5.8%) | 456 (7.1%) |
| 55 to 59 Years | 702 (10.0%) | 627 (9.8%) |
| 60 to 64 Years | 389 (5.5%) | 310 (4.8%) |
| 65 to 69 Years | 450 (6.4%) | 372 (5.8%) |
| 70 to 74 Years | 196 (2.8%) | 265 (4.1%) |
| 75 to 79 Years | 187 (2.6%) | 141 (2.2%) |
| 80 to 84 Years | 89 (1.3%) | 203 (3.2%) |
| 85 Years and over | 212 (3.0%) | 238 (3.7%) |
| Total | 7,050 (100.0%) | 6,410 (100.0%) |
Families and Households in Los Alamos
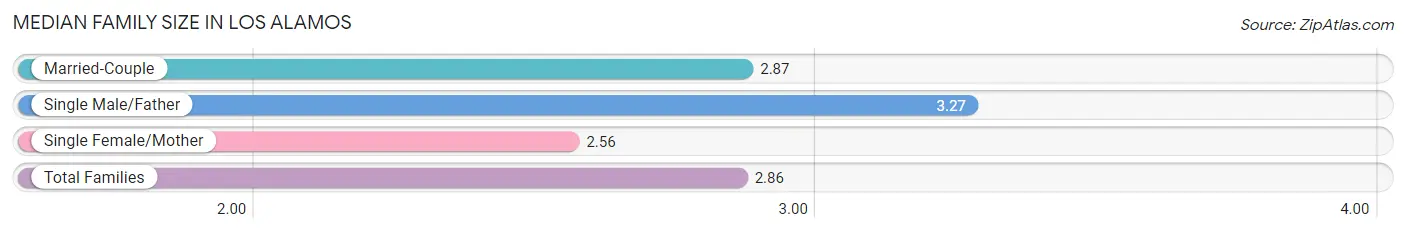
Median Family Size in Los Alamos
The median family size in Los Alamos is 2.86 persons per family, with single male/father families (210 | 5.8%) accounting for the largest median family size of 3.27 persons per family. On the other hand, single female/mother families (442 | 12.1%) represent the smallest median family size with 2.56 persons per family.
| Family Type | # Families | Family Size |
| Married-Couple | 2,988 (82.1%) | 2.87 |
| Single Male/Father | 210 (5.8%) | 3.27 |
| Single Female/Mother | 442 (12.1%) | 2.56 |
| Total Families | 3,640 (100.0%) | 2.86 |
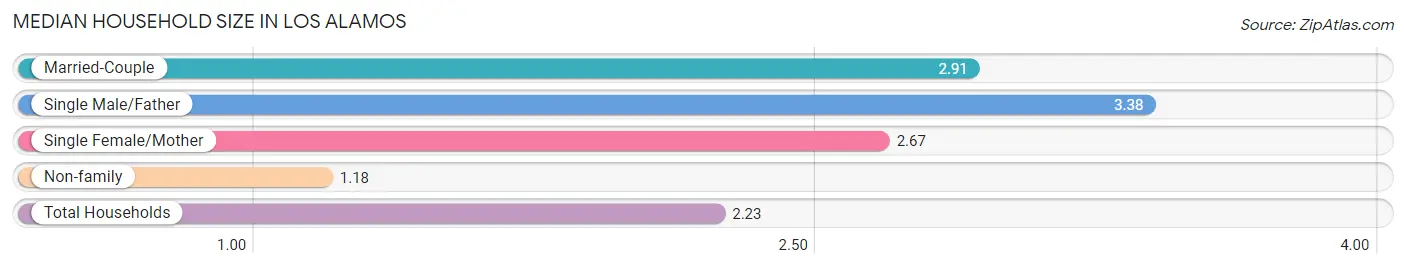
Median Household Size in Los Alamos
The median household size in Los Alamos is 2.23 persons per household, with single male/father households (210 | 3.5%) accounting for the largest median household size of 3.38 persons per household. non-family households (2,356 | 39.3%) represent the smallest median household size with 1.18 persons per household.
| Household Type | # Households | Household Size |
| Married-Couple | 2,988 (49.8%) | 2.91 |
| Single Male/Father | 210 (3.5%) | 3.38 |
| Single Female/Mother | 442 (7.4%) | 2.67 |
| Non-family | 2,356 (39.3%) | 1.18 |
| Total Households | 5,996 (100.0%) | 2.23 |
Household Size by Marriage Status in Los Alamos
Out of a total of 5,996 households in Los Alamos, 3,640 (60.7%) are family households, while 2,356 (39.3%) are nonfamily households. The most numerous type of family households are 2-person households, comprising 1,934, and the most common type of nonfamily households are 1-person households, comprising 1,969.
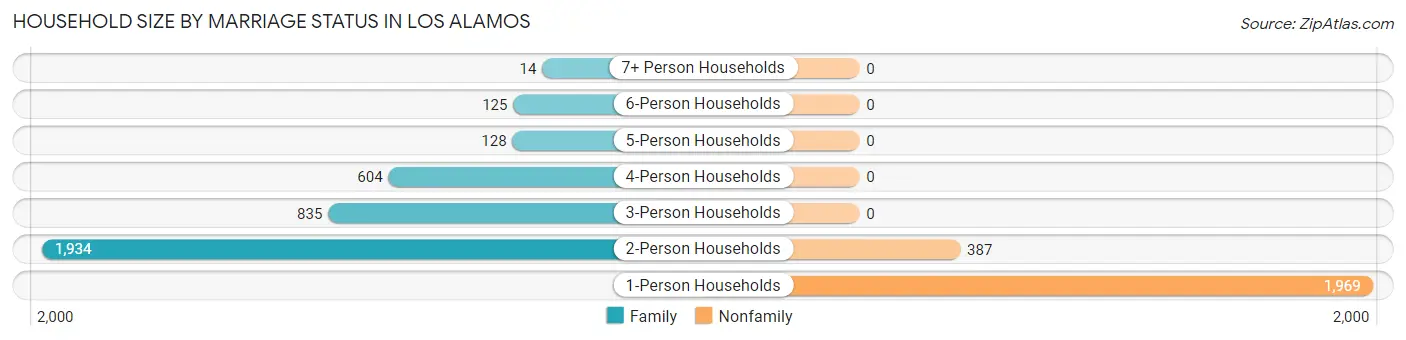
| Household Size | Family Households | Nonfamily Households |
| 1-Person Households | - | 1,969 (32.8%) |
| 2-Person Households | 1,934 (32.3%) | 387 (6.5%) |
| 3-Person Households | 835 (13.9%) | 0 (0.0%) |
| 4-Person Households | 604 (10.1%) | 0 (0.0%) |
| 5-Person Households | 128 (2.1%) | 0 (0.0%) |
| 6-Person Households | 125 (2.1%) | 0 (0.0%) |
| 7+ Person Households | 14 (0.2%) | 0 (0.0%) |
| Total | 3,640 (60.7%) | 2,356 (39.3%) |
Female Fertility in Los Alamos
Fertility by Age in Los Alamos
Average fertility rate in Los Alamos is 76.0 births per 1,000 women. Women in the age bracket of 20 to 34 years have the highest fertility rate with 152.0 births per 1,000 women. Women in the age bracket of 20 to 34 years acount for 82.8% of all women with births.
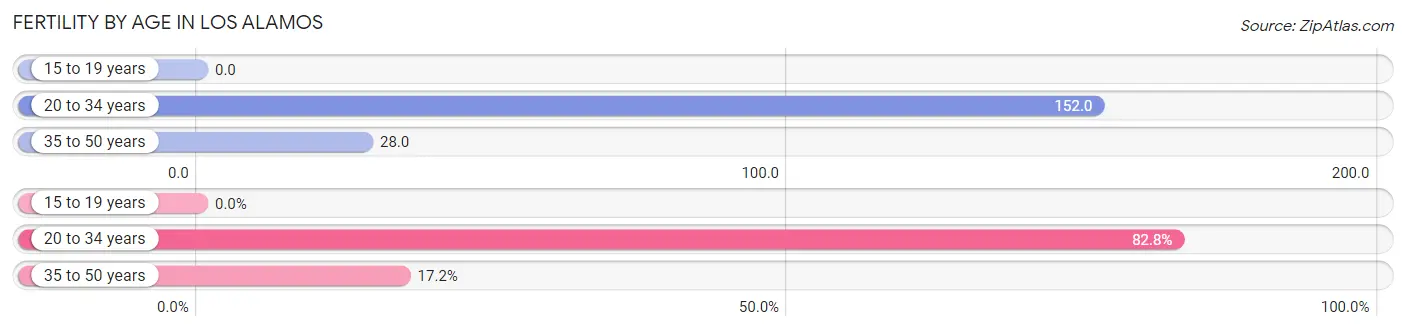
| Age Bracket | Women with Births | Births / 1,000 Women |
| 15 to 19 years | 0 (0.0%) | 0.0 |
| 20 to 34 years | 183 (82.8%) | 152.0 |
| 35 to 50 years | 38 (17.2%) | 28.0 |
| Total | 221 (100.0%) | 76.0 |
Fertility by Age by Marriage Status in Los Alamos
53.4% of women with births (221) in Los Alamos are married. The highest percentage of unmarried women with births falls into 20 to 34 years age bracket with 56.3% of them unmarried at the time of birth, while the lowest percentage of unmarried women with births belong to 35 to 50 years age bracket with 0.0% of them unmarried.
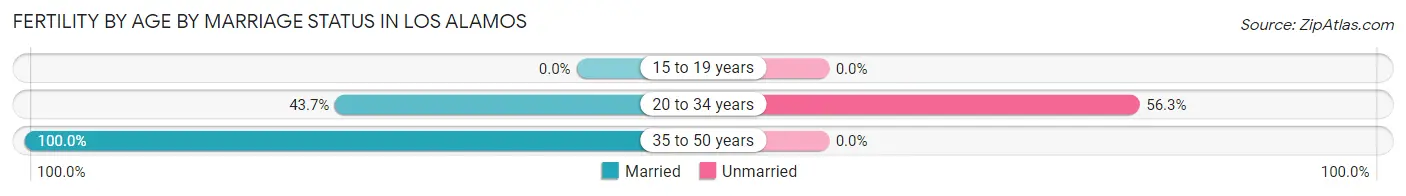
| Age Bracket | Married | Unmarried |
| 15 to 19 years | 0 (0.0%) | 0 (0.0%) |
| 20 to 34 years | 80 (43.7%) | 103 (56.3%) |
| 35 to 50 years | 38 (100.0%) | 0 (0.0%) |
| Total | 118 (53.4%) | 103 (46.6%) |
Fertility by Education in Los Alamos
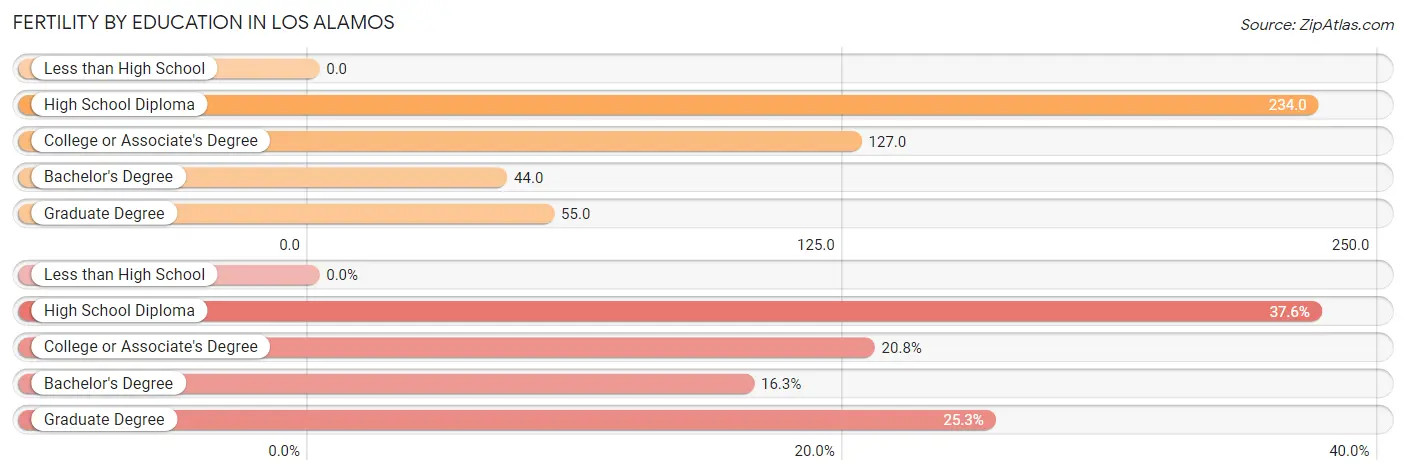
| Educational Attainment | Women with Births | Births / 1,000 Women |
| Less than High School | 0 (0.0%) | 0.0 |
| High School Diploma | 83 (37.6%) | 234.0 |
| College or Associate's Degree | 46 (20.8%) | 127.0 |
| Bachelor's Degree | 36 (16.3%) | 44.0 |
| Graduate Degree | 56 (25.3%) | 55.0 |
| Total | 221 (100.0%) | 76.0 |
Fertility by Education by Marriage Status in Los Alamos
46.6% of women with births in Los Alamos are unmarried. Women with the educational attainment of bachelor's degree are most likely to be married with 100.0% of them married at childbirth, while women with the educational attainment of college or associate's degree are least likely to be married with 100.0% of them unmarried at childbirth.
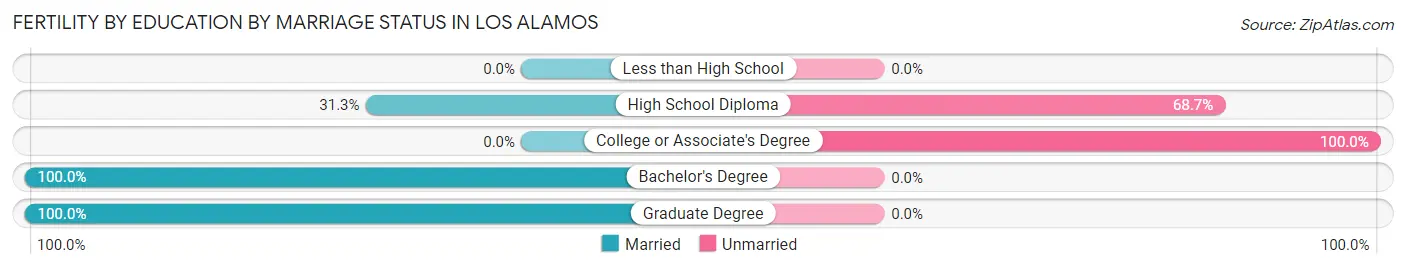
| Educational Attainment | Married | Unmarried |
| Less than High School | 0 (0.0%) | 0 (0.0%) |
| High School Diploma | 26 (31.3%) | 57 (68.7%) |
| College or Associate's Degree | 0 (0.0%) | 46 (100.0%) |
| Bachelor's Degree | 36 (100.0%) | 0 (0.0%) |
| Graduate Degree | 56 (100.0%) | 0 (0.0%) |
| Total | 118 (53.4%) | 103 (46.6%) |
Employment Characteristics in Los Alamos
Employment by Class of Employer in Los Alamos
Among the 7,474 employed individuals in Los Alamos, private company employees (3,102 | 41.5%), federal government employees (2,204 | 29.5%), and not-for-profit organizations (859 | 11.5%) make up the most common classes of employment.
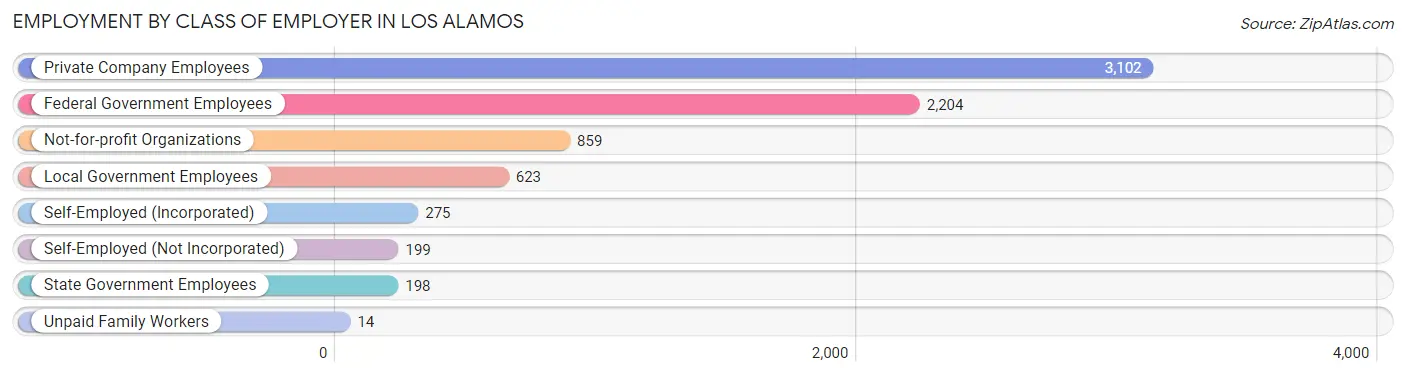
| Employer Class | # Employees | % Employees |
| Private Company Employees | 3,102 | 41.5% |
| Self-Employed (Incorporated) | 275 | 3.7% |
| Self-Employed (Not Incorporated) | 199 | 2.7% |
| Not-for-profit Organizations | 859 | 11.5% |
| Local Government Employees | 623 | 8.3% |
| State Government Employees | 198 | 2.6% |
| Federal Government Employees | 2,204 | 29.5% |
| Unpaid Family Workers | 14 | 0.2% |
| Total | 7,474 | 100.0% |
Employment Status by Age in Los Alamos
According to the labor force statistics for Los Alamos, out of the total population over 16 years of age (11,247), 68.7% or 7,727 individuals are in the labor force, with 1.8% or 139 of them unemployed. The age group with the highest labor force participation rate is 30 to 34 years, with 91.4% or 1,079 individuals in the labor force. Within the labor force, the 65 to 74 years age range has the highest percentage of unemployed individuals, with 7.7% or 28 of them being unemployed.
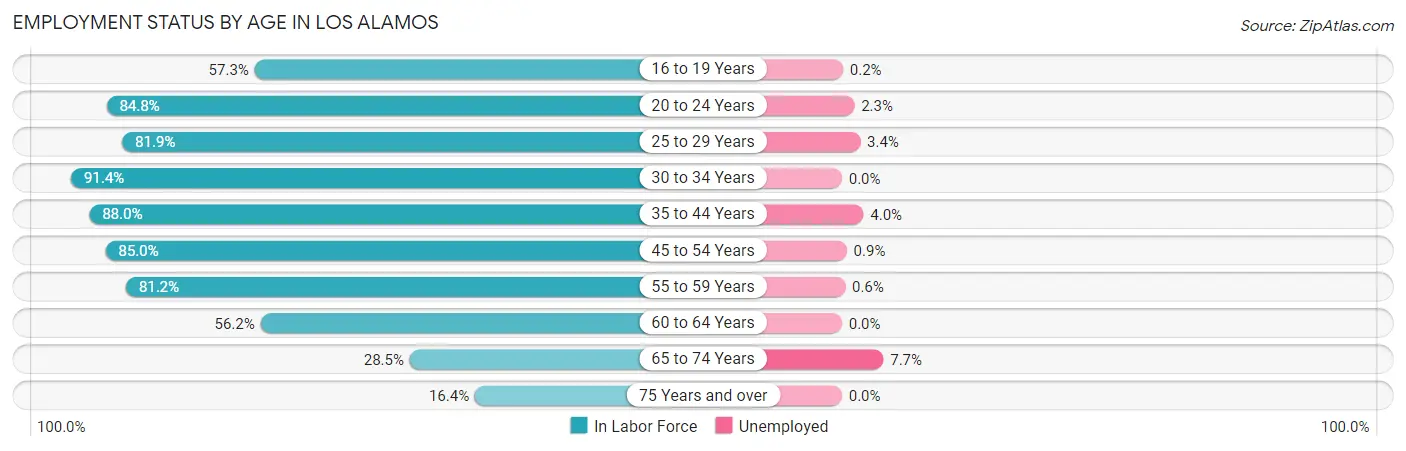
| Age Bracket | In Labor Force | Unemployed |
| 16 to 19 Years | 433 (57.3%) | 1 (0.2%) |
| 20 to 24 Years | 502 (84.8%) | 12 (2.3%) |
| 25 to 29 Years | 756 (81.9%) | 26 (3.4%) |
| 30 to 34 Years | 1,079 (91.4%) | 0 (0.0%) |
| 35 to 44 Years | 1,359 (88.0%) | 54 (4.0%) |
| 45 to 54 Years | 1,590 (85.0%) | 14 (0.9%) |
| 55 to 59 Years | 1,079 (81.2%) | 6 (0.6%) |
| 60 to 64 Years | 393 (56.2%) | 0 (0.0%) |
| 65 to 74 Years | 366 (28.5%) | 28 (7.7%) |
| 75 Years and over | 175 (16.4%) | 0 (0.0%) |
| Total | 7,727 (68.7%) | 139 (1.8%) |
Employment Status by Educational Attainment in Los Alamos
According to labor force statistics for Los Alamos, 82.9% of individuals (6,256) out of the total population between 25 and 64 years of age (7,546) are in the labor force, with 1.6% or 100 of them being unemployed. The group with the highest labor force participation rate are those with the educational attainment of bachelor's degree or higher, with 86.9% or 4,571 individuals in the labor force. Within the labor force, individuals with high school diploma education have the highest percentage of unemployment, with 4.7% or 26 of them being unemployed.
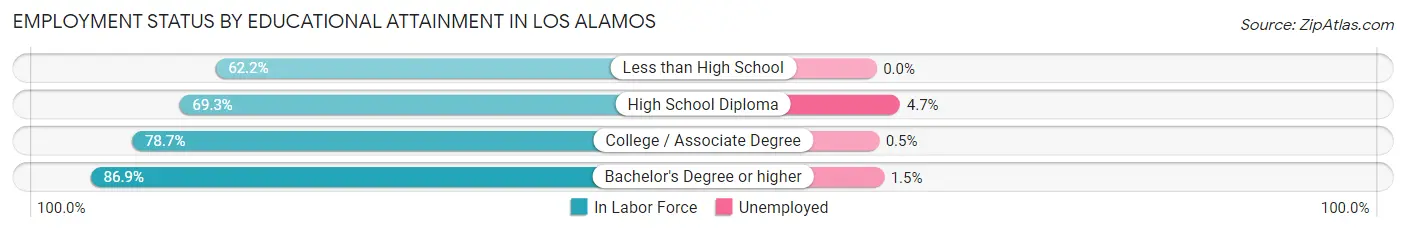
| Educational Attainment | In Labor Force | Unemployed |
| Less than High School | 148 (62.2%) | 0 (0.0%) |
| High School Diploma | 550 (69.3%) | 37 (4.7%) |
| College / Associate Degree | 987 (78.7%) | 6 (0.5%) |
| Bachelor's Degree or higher | 4,571 (86.9%) | 79 (1.5%) |
| Total | 6,256 (82.9%) | 121 (1.6%) |
Employment Occupations by Sex in Los Alamos
Management, Business, Science and Arts Occupations
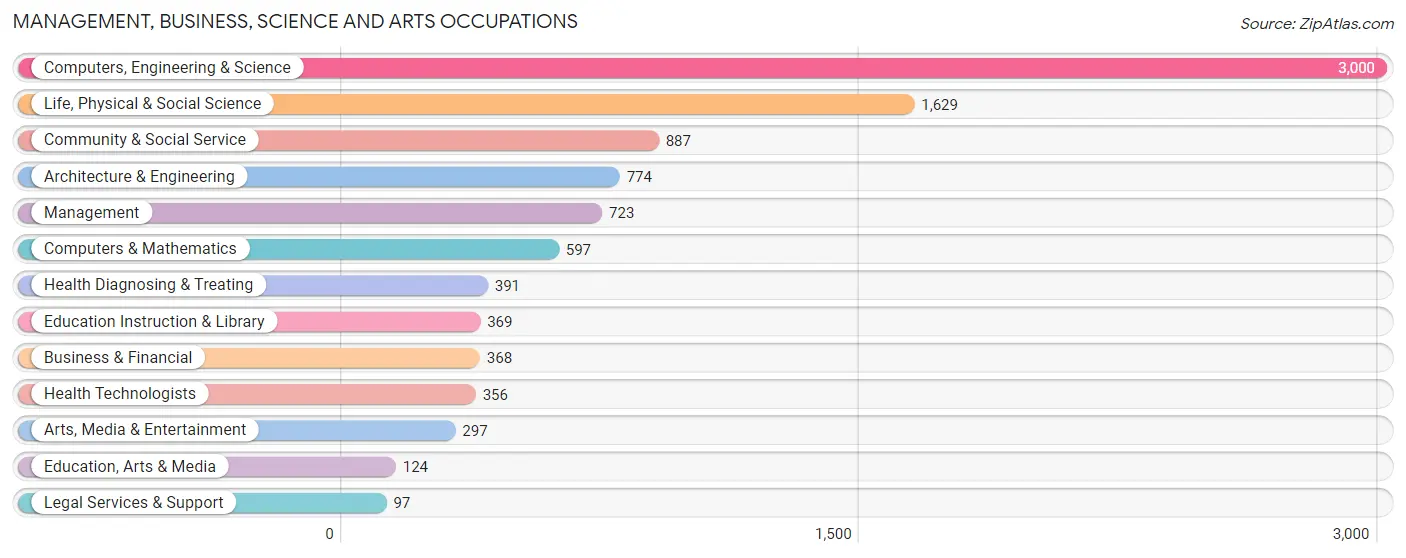
The most common Management, Business, Science and Arts occupations in Los Alamos are Computers, Engineering & Science (3,000 | 40.0%), Life, Physical & Social Science (1,629 | 21.7%), Community & Social Service (887 | 11.8%), Architecture & Engineering (774 | 10.3%), and Management (723 | 9.7%).
Management, Business, Science and Arts Occupations by Sex
Within the Management, Business, Science and Arts occupations in Los Alamos, the most male-oriented occupations are Architecture & Engineering (83.5%), Life, Physical & Social Science (69.4%), and Computers, Engineering & Science (68.3%), while the most female-oriented occupations are Health Technologists (90.2%), Health Diagnosing & Treating (85.9%), and Education, Arts & Media (83.1%).
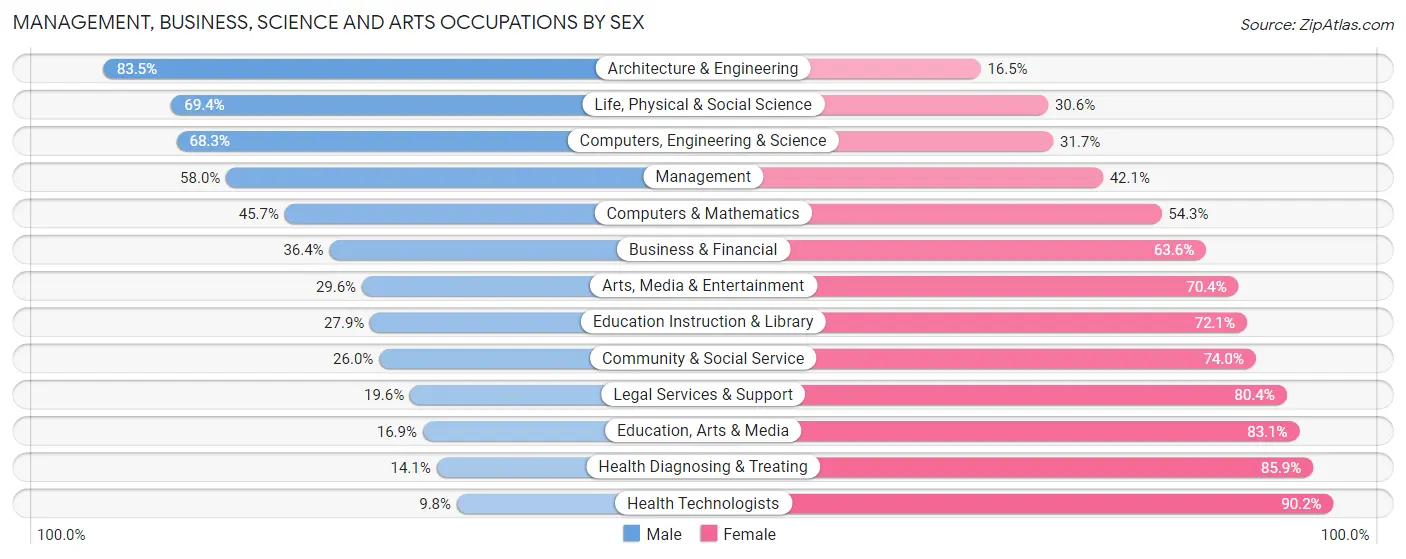
| Occupation | Male | Female |
| Management | 419 (58.0%) | 304 (42.0%) |
| Business & Financial | 134 (36.4%) | 234 (63.6%) |
| Computers, Engineering & Science | 2,049 (68.3%) | 951 (31.7%) |
| Computers & Mathematics | 273 (45.7%) | 324 (54.3%) |
| Architecture & Engineering | 646 (83.5%) | 128 (16.5%) |
| Life, Physical & Social Science | 1,130 (69.4%) | 499 (30.6%) |
| Community & Social Service | 231 (26.0%) | 656 (74.0%) |
| Education, Arts & Media | 21 (16.9%) | 103 (83.1%) |
| Legal Services & Support | 19 (19.6%) | 78 (80.4%) |
| Education Instruction & Library | 103 (27.9%) | 266 (72.1%) |
| Arts, Media & Entertainment | 88 (29.6%) | 209 (70.4%) |
| Health Diagnosing & Treating | 55 (14.1%) | 336 (85.9%) |
| Health Technologists | 35 (9.8%) | 321 (90.2%) |
| Total (Category) | 2,888 (53.8%) | 2,481 (46.2%) |
| Total (Overall) | 4,205 (56.1%) | 3,288 (43.9%) |
Services Occupations
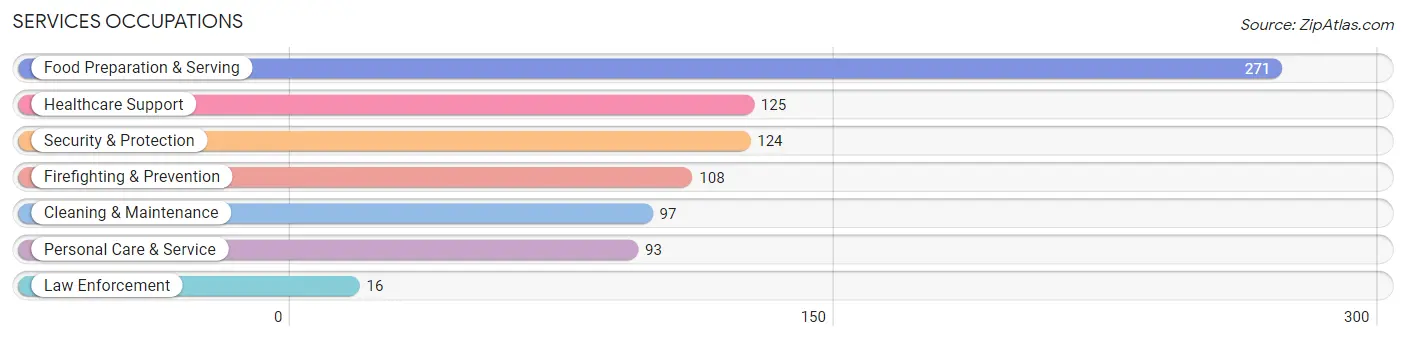
The most common Services occupations in Los Alamos are Food Preparation & Serving (271 | 3.6%), Healthcare Support (125 | 1.7%), Security & Protection (124 | 1.7%), Firefighting & Prevention (108 | 1.4%), and Cleaning & Maintenance (97 | 1.3%).
Services Occupations by Sex
Within the Services occupations in Los Alamos, the most male-oriented occupations are Law Enforcement (100.0%), Security & Protection (88.7%), and Firefighting & Prevention (87.0%), while the most female-oriented occupations are Healthcare Support (72.8%), Personal Care & Service (50.5%), and Cleaning & Maintenance (43.3%).
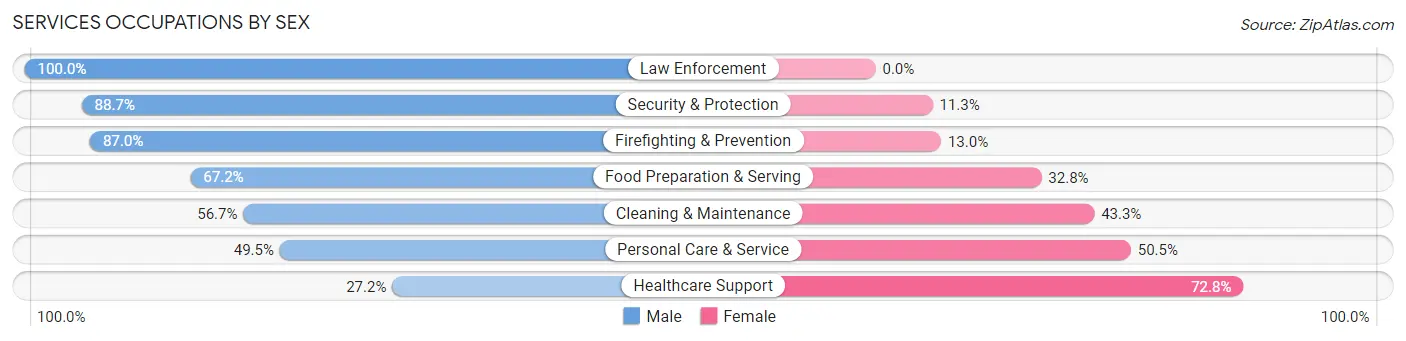
| Occupation | Male | Female |
| Healthcare Support | 34 (27.2%) | 91 (72.8%) |
| Security & Protection | 110 (88.7%) | 14 (11.3%) |
| Firefighting & Prevention | 94 (87.0%) | 14 (13.0%) |
| Law Enforcement | 16 (100.0%) | 0 (0.0%) |
| Food Preparation & Serving | 182 (67.2%) | 89 (32.8%) |
| Cleaning & Maintenance | 55 (56.7%) | 42 (43.3%) |
| Personal Care & Service | 46 (49.5%) | 47 (50.5%) |
| Total (Category) | 427 (60.1%) | 283 (39.9%) |
| Total (Overall) | 4,205 (56.1%) | 3,288 (43.9%) |
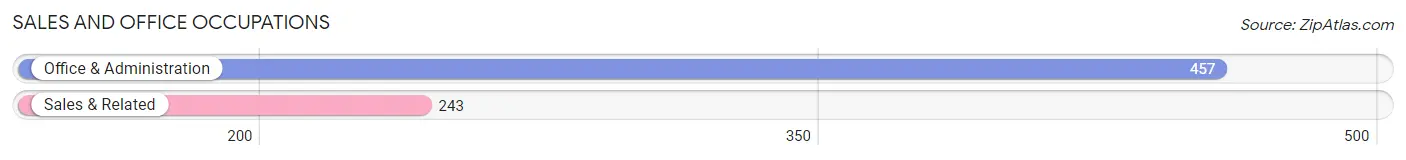
Sales and Office Occupations
The most common Sales and Office occupations in Los Alamos are Office & Administration (457 | 6.1%), and Sales & Related (243 | 3.2%).
Sales and Office Occupations by Sex
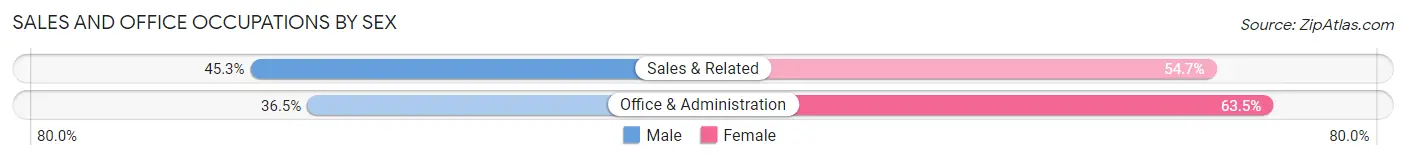
| Occupation | Male | Female |
| Sales & Related | 110 (45.3%) | 133 (54.7%) |
| Office & Administration | 167 (36.5%) | 290 (63.5%) |
| Total (Category) | 277 (39.6%) | 423 (60.4%) |
| Total (Overall) | 4,205 (56.1%) | 3,288 (43.9%) |
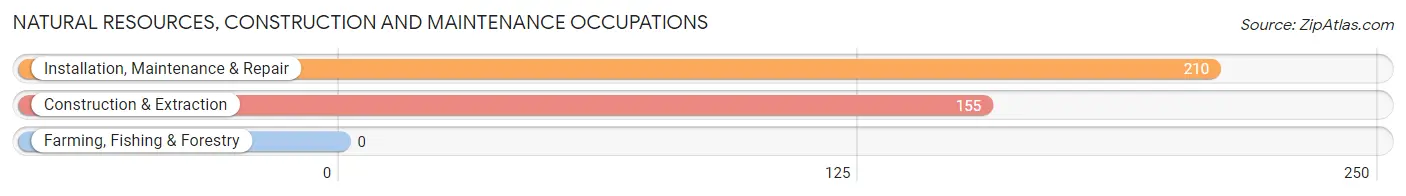
Natural Resources, Construction and Maintenance Occupations
The most common Natural Resources, Construction and Maintenance occupations in Los Alamos are Installation, Maintenance & Repair (210 | 2.8%), and Construction & Extraction (155 | 2.1%).
Natural Resources, Construction and Maintenance Occupations by Sex
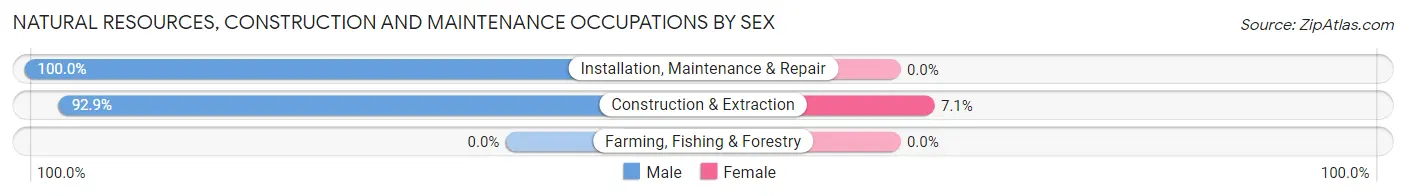
| Occupation | Male | Female |
| Farming, Fishing & Forestry | 0 (0.0%) | 0 (0.0%) |
| Construction & Extraction | 144 (92.9%) | 11 (7.1%) |
| Installation, Maintenance & Repair | 210 (100.0%) | 0 (0.0%) |
| Total (Category) | 354 (97.0%) | 11 (3.0%) |
| Total (Overall) | 4,205 (56.1%) | 3,288 (43.9%) |
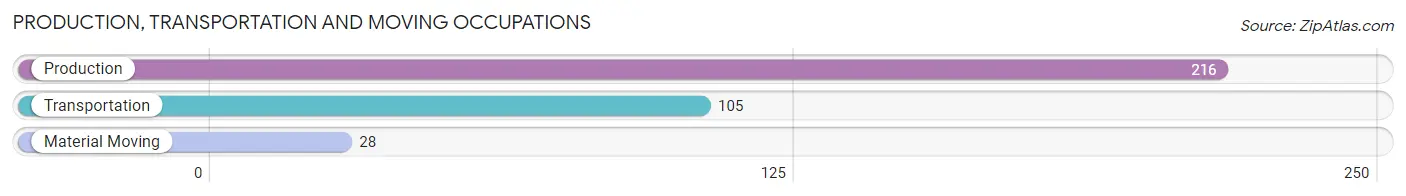
Production, Transportation and Moving Occupations
The most common Production, Transportation and Moving occupations in Los Alamos are Production (216 | 2.9%), Transportation (105 | 1.4%), and Material Moving (28 | 0.4%).
Production, Transportation and Moving Occupations by Sex
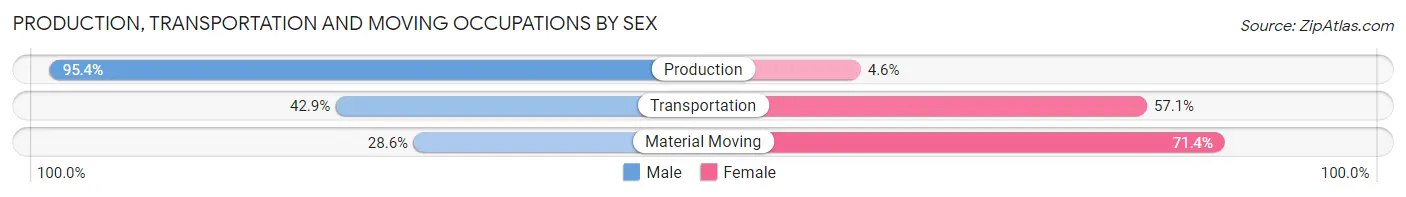
| Occupation | Male | Female |
| Production | 206 (95.4%) | 10 (4.6%) |
| Transportation | 45 (42.9%) | 60 (57.1%) |
| Material Moving | 8 (28.6%) | 20 (71.4%) |
| Total (Category) | 259 (74.2%) | 90 (25.8%) |
| Total (Overall) | 4,205 (56.1%) | 3,288 (43.9%) |
Employment Industries by Sex in Los Alamos
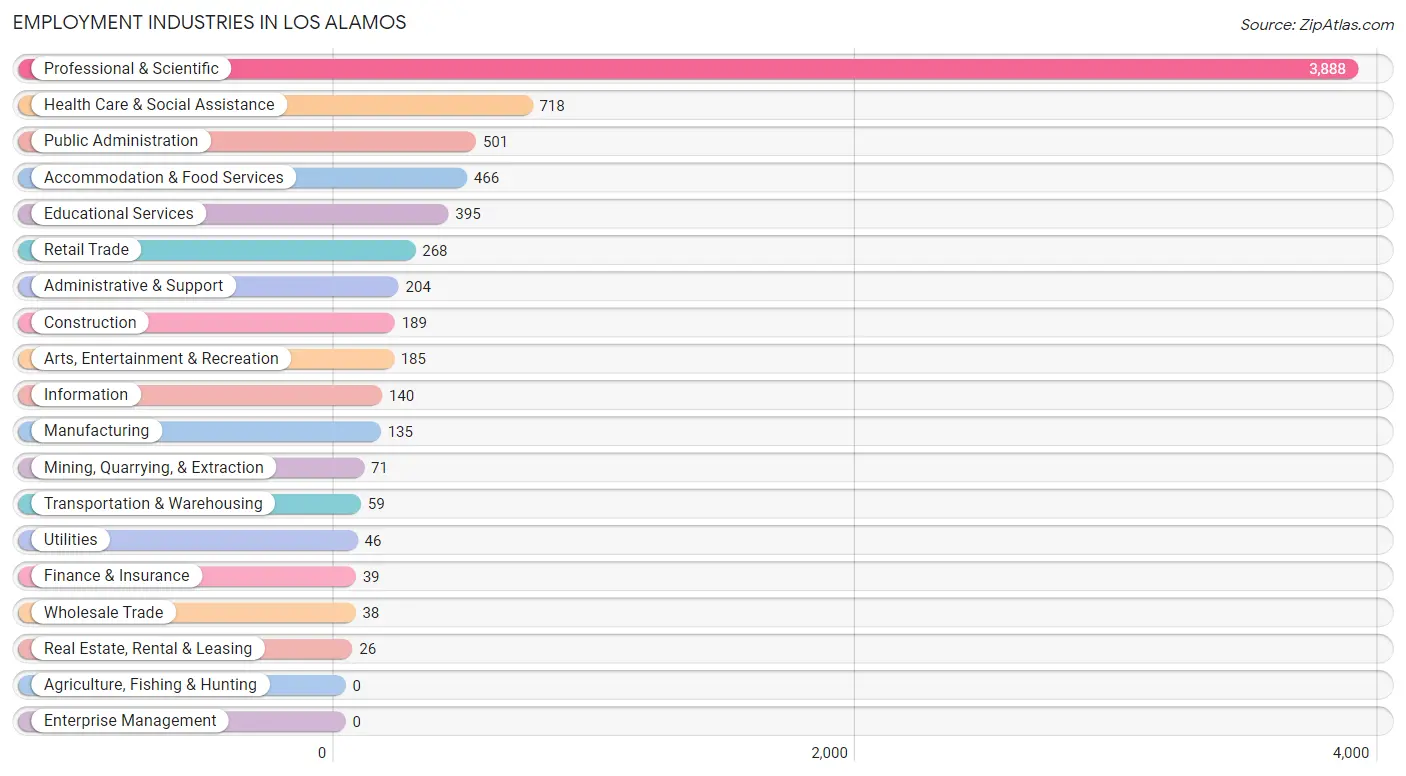
Employment Industries in Los Alamos
The major employment industries in Los Alamos include Professional & Scientific (3,888 | 51.9%), Health Care & Social Assistance (718 | 9.6%), Public Administration (501 | 6.7%), Accommodation & Food Services (466 | 6.2%), and Educational Services (395 | 5.3%).
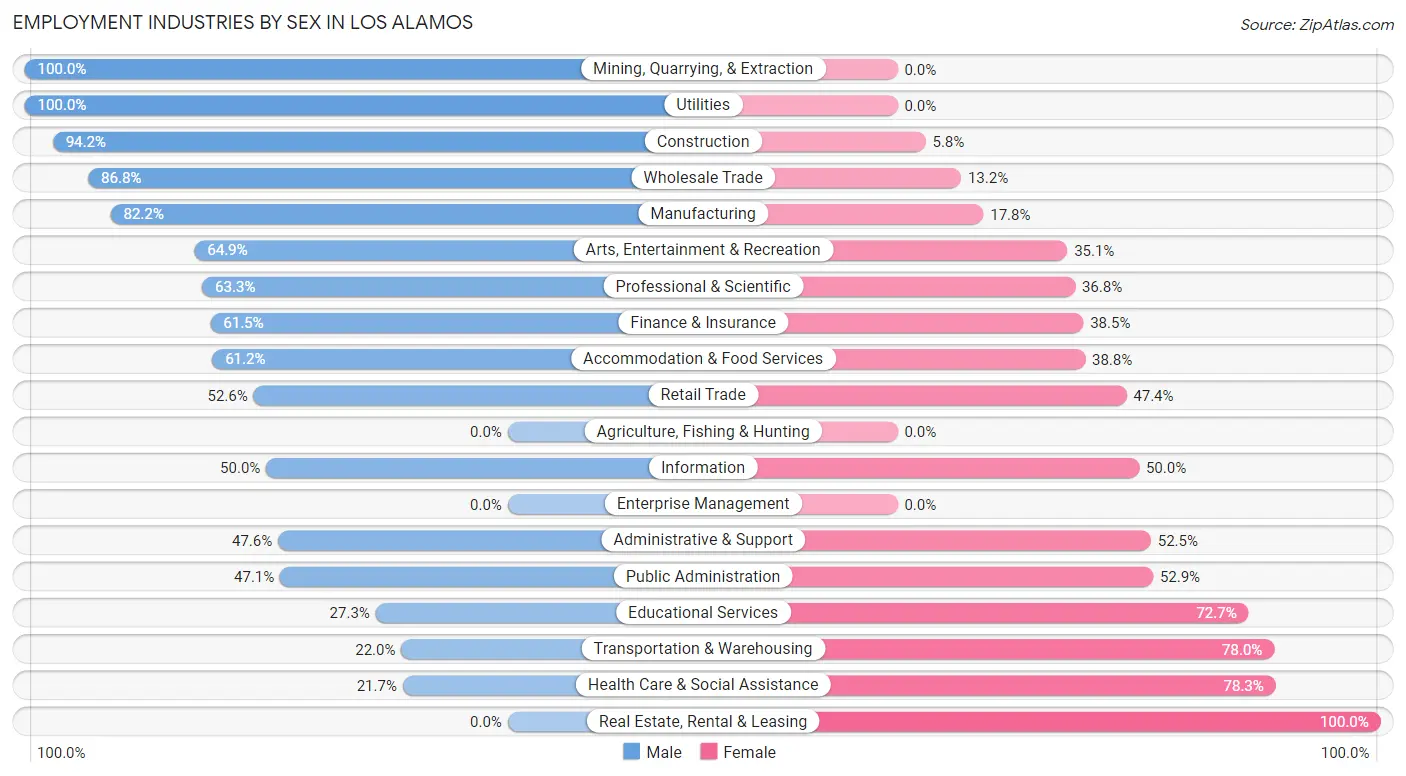
Employment Industries by Sex in Los Alamos
The Los Alamos industries that see more men than women are Mining, Quarrying, & Extraction (100.0%), Utilities (100.0%), and Construction (94.2%), whereas the industries that tend to have a higher number of women are Real Estate, Rental & Leasing (100.0%), Health Care & Social Assistance (78.3%), and Transportation & Warehousing (78.0%).
| Industry | Male | Female |
| Agriculture, Fishing & Hunting | 0 (0.0%) | 0 (0.0%) |
| Mining, Quarrying, & Extraction | 71 (100.0%) | 0 (0.0%) |
| Construction | 178 (94.2%) | 11 (5.8%) |
| Manufacturing | 111 (82.2%) | 24 (17.8%) |
| Wholesale Trade | 33 (86.8%) | 5 (13.2%) |
| Retail Trade | 141 (52.6%) | 127 (47.4%) |
| Transportation & Warehousing | 13 (22.0%) | 46 (78.0%) |
| Utilities | 46 (100.0%) | 0 (0.0%) |
| Information | 70 (50.0%) | 70 (50.0%) |
| Finance & Insurance | 24 (61.5%) | 15 (38.5%) |
| Real Estate, Rental & Leasing | 0 (0.0%) | 26 (100.0%) |
| Professional & Scientific | 2,459 (63.2%) | 1,429 (36.7%) |
| Enterprise Management | 0 (0.0%) | 0 (0.0%) |
| Administrative & Support | 97 (47.5%) | 107 (52.4%) |
| Educational Services | 108 (27.3%) | 287 (72.7%) |
| Health Care & Social Assistance | 156 (21.7%) | 562 (78.3%) |
| Arts, Entertainment & Recreation | 120 (64.9%) | 65 (35.1%) |
| Accommodation & Food Services | 285 (61.2%) | 181 (38.8%) |
| Public Administration | 236 (47.1%) | 265 (52.9%) |
| Total | 4,205 (56.1%) | 3,288 (43.9%) |
Education in Los Alamos
School Enrollment in Los Alamos
The most common levels of schooling among the 3,345 students in Los Alamos are high school (869 | 26.0%), middle school (671 | 20.1%), and college / undergraduate (652 | 19.5%).
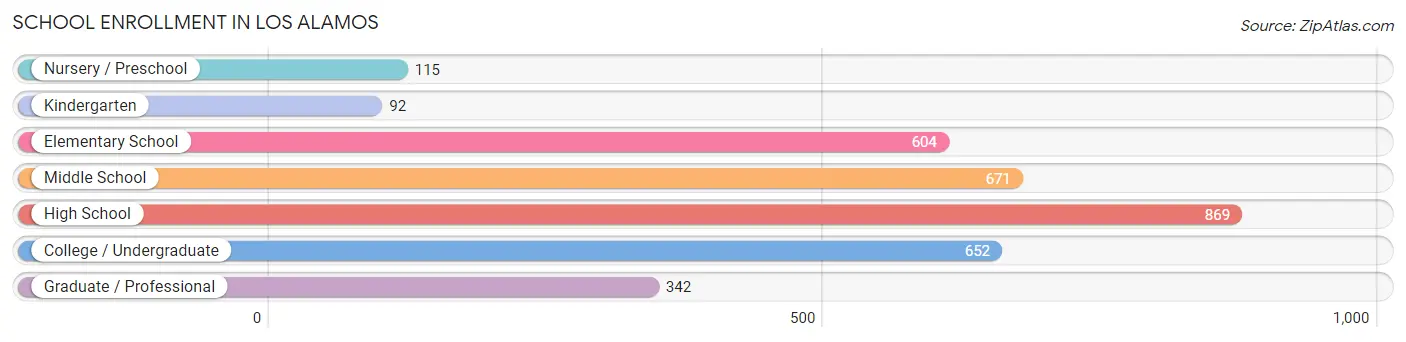
| School Level | # Students | % Students |
| Nursery / Preschool | 115 | 3.4% |
| Kindergarten | 92 | 2.8% |
| Elementary School | 604 | 18.1% |
| Middle School | 671 | 20.1% |
| High School | 869 | 26.0% |
| College / Undergraduate | 652 | 19.5% |
| Graduate / Professional | 342 | 10.2% |
| Total | 3,345 | 100.0% |
School Enrollment by Age by Funding Source in Los Alamos
Out of a total of 3,345 students who are enrolled in schools in Los Alamos, 472 (14.1%) attend a private institution, while the remaining 2,873 (85.9%) are enrolled in public schools. The age group of 3 to 4 year olds has the highest likelihood of being enrolled in private schools, with 51 (46.8% in the age bracket) enrolled. Conversely, the age group of 10 to 14 year olds has the lowest likelihood of being enrolled in a private school, with 906 (98.0% in the age bracket) attending a public institution.
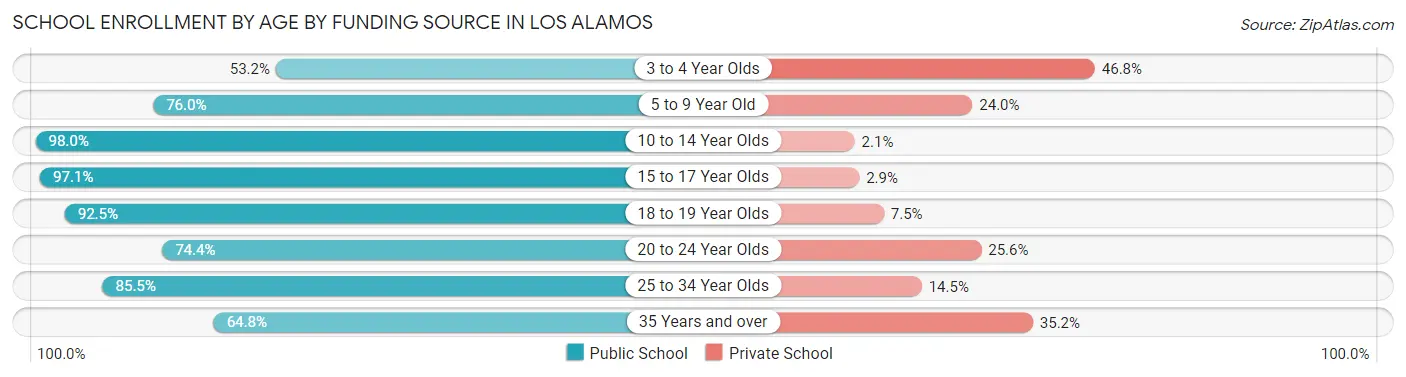
| Age Bracket | Public School | Private School |
| 3 to 4 Year Olds | 58 (53.2%) | 51 (46.8%) |
| 5 to 9 Year Old | 460 (76.0%) | 145 (24.0%) |
| 10 to 14 Year Olds | 906 (98.0%) | 19 (2.1%) |
| 15 to 17 Year Olds | 572 (97.1%) | 17 (2.9%) |
| 18 to 19 Year Olds | 284 (92.5%) | 23 (7.5%) |
| 20 to 24 Year Olds | 174 (74.4%) | 60 (25.6%) |
| 25 to 34 Year Olds | 194 (85.5%) | 33 (14.5%) |
| 35 Years and over | 226 (64.8%) | 123 (35.2%) |
| Total | 2,873 (85.9%) | 472 (14.1%) |
Educational Attainment by Field of Study in Los Alamos
Engineering (1,480 | 19.5%), physical & health sciences (1,396 | 18.4%), computers & mathematics (698 | 9.2%), bio, nature & agricultural (692 | 9.1%), and education (546 | 7.2%) are the most common fields of study among 7,592 individuals in Los Alamos who have obtained a bachelor's degree or higher.
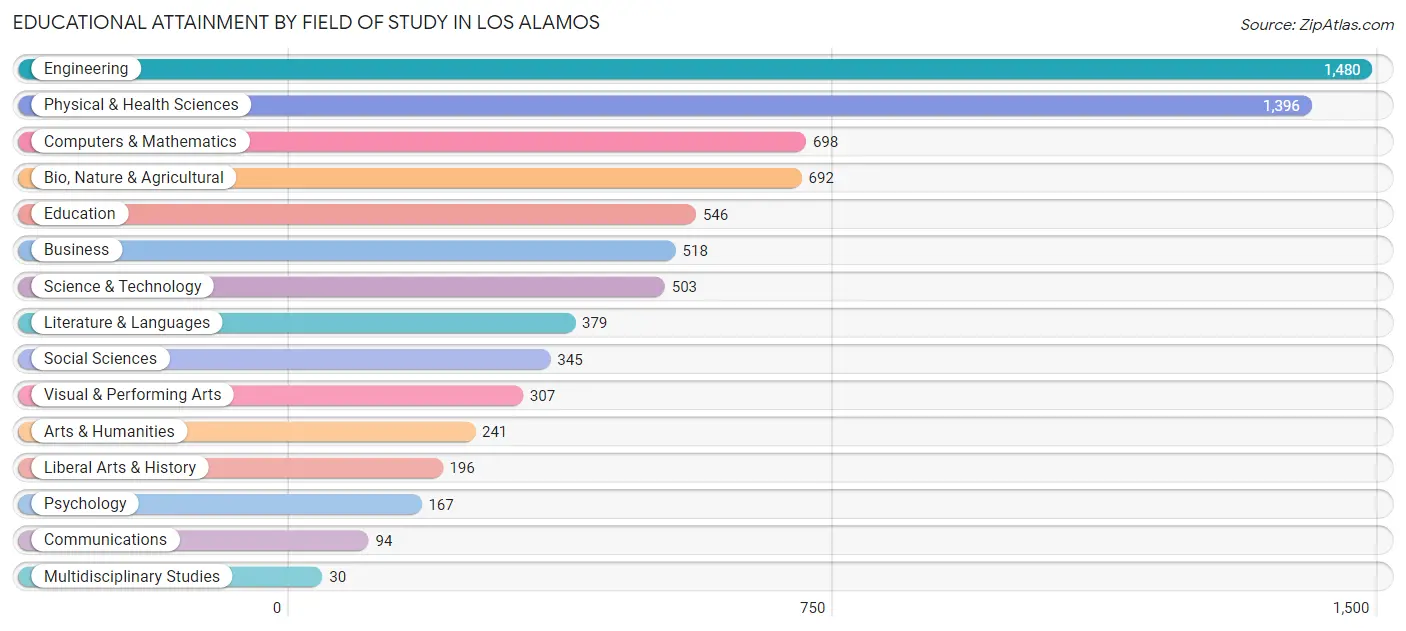
| Field of Study | # Graduates | % Graduates |
| Computers & Mathematics | 698 | 9.2% |
| Bio, Nature & Agricultural | 692 | 9.1% |
| Physical & Health Sciences | 1,396 | 18.4% |
| Psychology | 167 | 2.2% |
| Social Sciences | 345 | 4.5% |
| Engineering | 1,480 | 19.5% |
| Multidisciplinary Studies | 30 | 0.4% |
| Science & Technology | 503 | 6.6% |
| Business | 518 | 6.8% |
| Education | 546 | 7.2% |
| Literature & Languages | 379 | 5.0% |
| Liberal Arts & History | 196 | 2.6% |
| Visual & Performing Arts | 307 | 4.0% |
| Communications | 94 | 1.2% |
| Arts & Humanities | 241 | 3.2% |
| Total | 7,592 | 100.0% |
Transportation & Commute in Los Alamos
Vehicle Availability by Sex in Los Alamos
The most prevalent vehicle ownership categories in Los Alamos are males with 2 vehicles (1,837, accounting for 43.3%) and females with 2 vehicles (1,497, making up 56.9%).
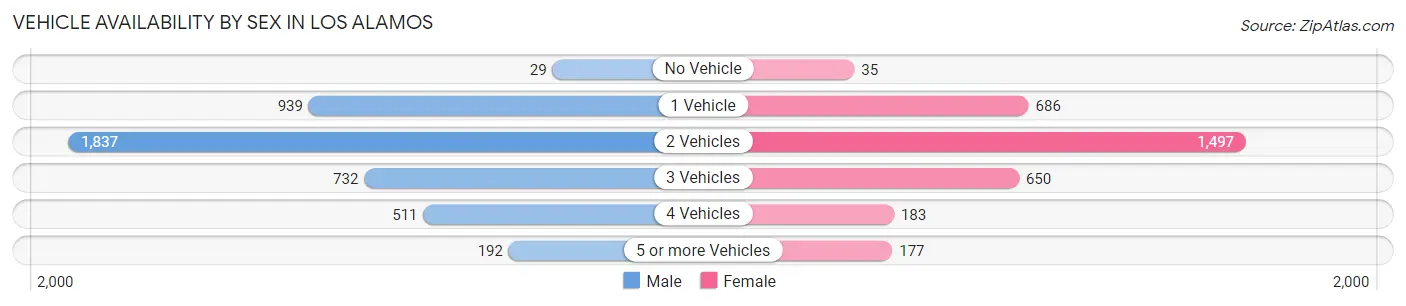
| Vehicles Available | Male | Female |
| No Vehicle | 29 (0.7%) | 35 (1.1%) |
| 1 Vehicle | 939 (22.2%) | 686 (21.2%) |
| 2 Vehicles | 1,837 (43.3%) | 1,497 (46.4%) |
| 3 Vehicles | 732 (17.3%) | 650 (20.1%) |
| 4 Vehicles | 511 (12.0%) | 183 (5.7%) |
| 5 or more Vehicles | 192 (4.5%) | 177 (5.5%) |
| Total | 4,240 (100.0%) | 3,228 (100.0%) |
Commute Time in Los Alamos
The most frequently occuring commute durations in Los Alamos are 10 to 14 minutes (2,335 commuters, 35.9%), 15 to 19 minutes (1,441 commuters, 22.1%), and 5 to 9 minutes (1,428 commuters, 21.9%).
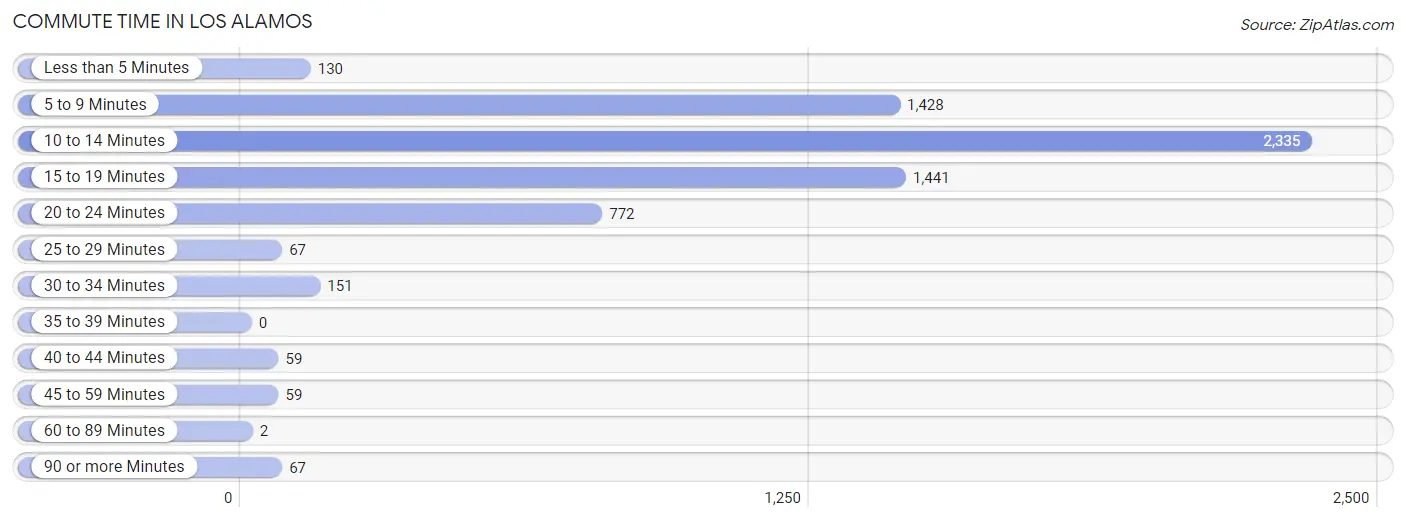
| Commute Time | # Commuters | % Commuters |
| Less than 5 Minutes | 130 | 2.0% |
| 5 to 9 Minutes | 1,428 | 21.9% |
| 10 to 14 Minutes | 2,335 | 35.9% |
| 15 to 19 Minutes | 1,441 | 22.1% |
| 20 to 24 Minutes | 772 | 11.9% |
| 25 to 29 Minutes | 67 | 1.0% |
| 30 to 34 Minutes | 151 | 2.3% |
| 35 to 39 Minutes | 0 | 0.0% |
| 40 to 44 Minutes | 59 | 0.9% |
| 45 to 59 Minutes | 59 | 0.9% |
| 60 to 89 Minutes | 2 | 0.0% |
| 90 or more Minutes | 67 | 1.0% |
Commute Time by Sex in Los Alamos
The most common commute times in Los Alamos are 10 to 14 minutes (1,356 commuters, 35.8%) for males and 10 to 14 minutes (979 commuters, 35.9%) for females.
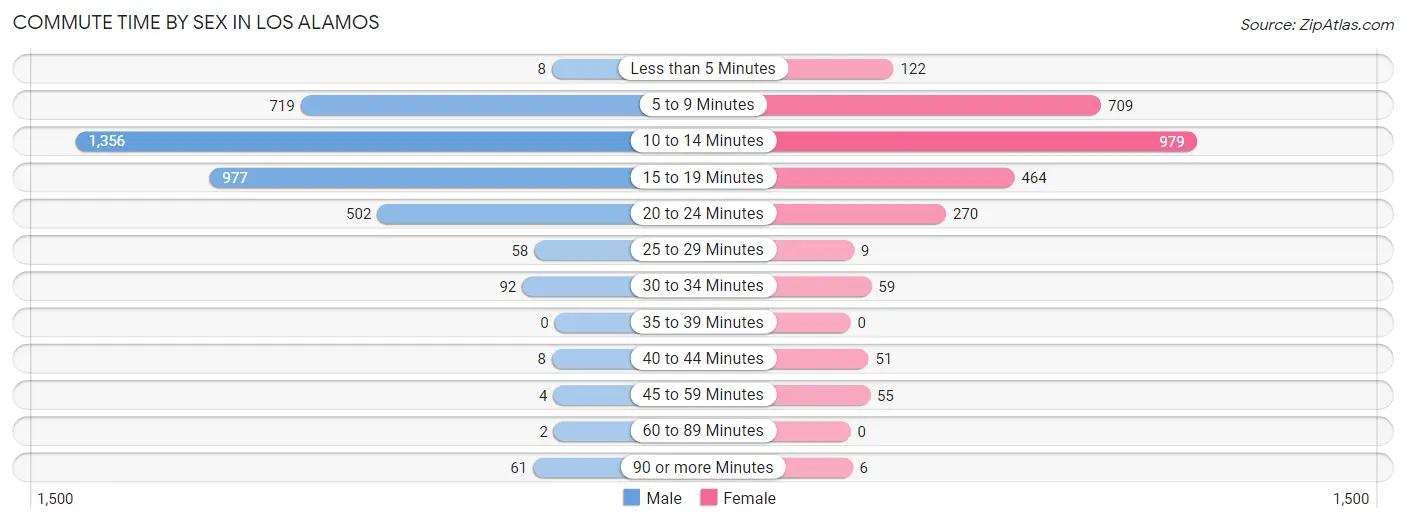
| Commute Time | Male | Female |
| Less than 5 Minutes | 8 (0.2%) | 122 (4.5%) |
| 5 to 9 Minutes | 719 (19.0%) | 709 (26.0%) |
| 10 to 14 Minutes | 1,356 (35.8%) | 979 (35.9%) |
| 15 to 19 Minutes | 977 (25.8%) | 464 (17.0%) |
| 20 to 24 Minutes | 502 (13.3%) | 270 (9.9%) |
| 25 to 29 Minutes | 58 (1.5%) | 9 (0.3%) |
| 30 to 34 Minutes | 92 (2.4%) | 59 (2.2%) |
| 35 to 39 Minutes | 0 (0.0%) | 0 (0.0%) |
| 40 to 44 Minutes | 8 (0.2%) | 51 (1.9%) |
| 45 to 59 Minutes | 4 (0.1%) | 55 (2.0%) |
| 60 to 89 Minutes | 2 (0.1%) | 0 (0.0%) |
| 90 or more Minutes | 61 (1.6%) | 6 (0.2%) |
Time of Departure to Work by Sex in Los Alamos
The most frequent times of departure to work in Los Alamos are 7:30 AM to 7:59 AM (743, 19.6%) for males and 7:30 AM to 7:59 AM (541, 19.9%) for females.
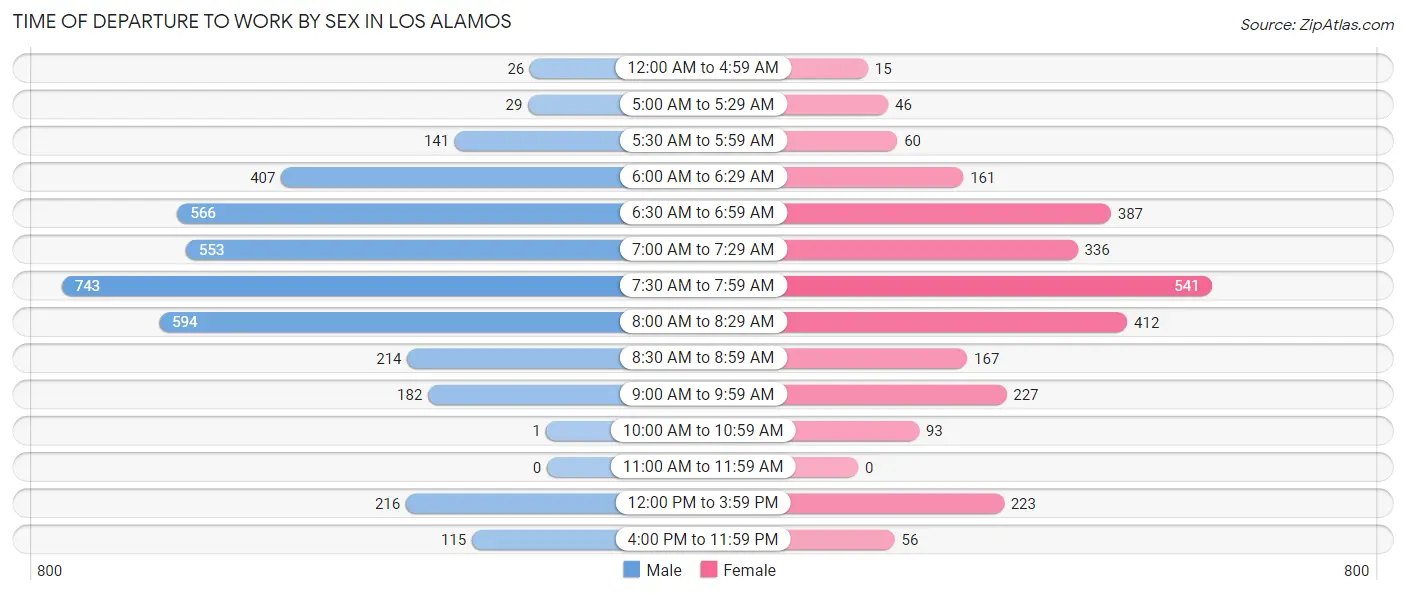
| Time of Departure | Male | Female |
| 12:00 AM to 4:59 AM | 26 (0.7%) | 15 (0.5%) |
| 5:00 AM to 5:29 AM | 29 (0.8%) | 46 (1.7%) |
| 5:30 AM to 5:59 AM | 141 (3.7%) | 60 (2.2%) |
| 6:00 AM to 6:29 AM | 407 (10.7%) | 161 (5.9%) |
| 6:30 AM to 6:59 AM | 566 (14.9%) | 387 (14.2%) |
| 7:00 AM to 7:29 AM | 553 (14.6%) | 336 (12.3%) |
| 7:30 AM to 7:59 AM | 743 (19.6%) | 541 (19.9%) |
| 8:00 AM to 8:29 AM | 594 (15.7%) | 412 (15.1%) |
| 8:30 AM to 8:59 AM | 214 (5.7%) | 167 (6.1%) |
| 9:00 AM to 9:59 AM | 182 (4.8%) | 227 (8.3%) |
| 10:00 AM to 10:59 AM | 1 (0.0%) | 93 (3.4%) |
| 11:00 AM to 11:59 AM | 0 (0.0%) | 0 (0.0%) |
| 12:00 PM to 3:59 PM | 216 (5.7%) | 223 (8.2%) |
| 4:00 PM to 11:59 PM | 115 (3.0%) | 56 (2.1%) |
| Total | 3,787 (100.0%) | 2,724 (100.0%) |
Housing Occupancy in Los Alamos
Occupancy by Ownership in Los Alamos
Of the total 5,996 dwellings in Los Alamos, owner-occupied units account for 3,911 (65.2%), while renter-occupied units make up 2,085 (34.8%).
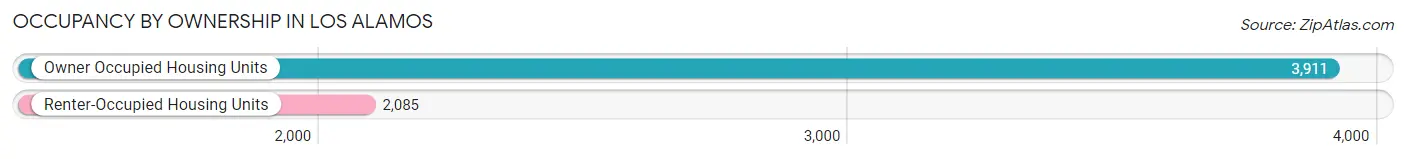
| Occupancy | # Housing Units | % Housing Units |
| Owner Occupied Housing Units | 3,911 | 65.2% |
| Renter-Occupied Housing Units | 2,085 | 34.8% |
| Total Occupied Housing Units | 5,996 | 100.0% |
Occupancy by Household Size in Los Alamos
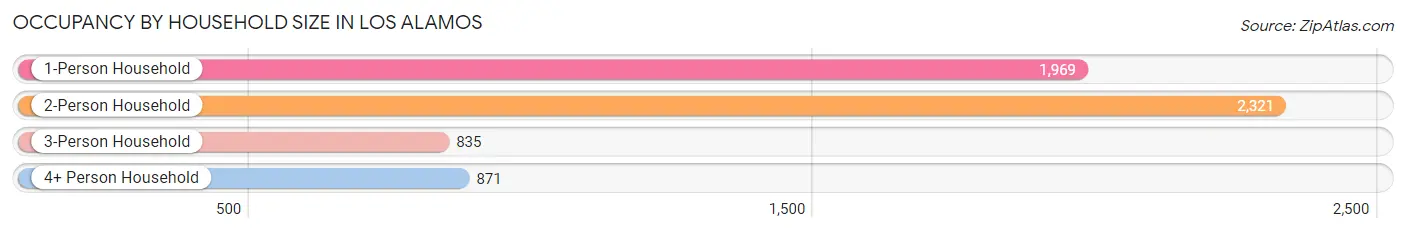
| Household Size | # Housing Units | % Housing Units |
| 1-Person Household | 1,969 | 32.8% |
| 2-Person Household | 2,321 | 38.7% |
| 3-Person Household | 835 | 13.9% |
| 4+ Person Household | 871 | 14.5% |
| Total Housing Units | 5,996 | 100.0% |
Occupancy by Ownership by Household Size in Los Alamos
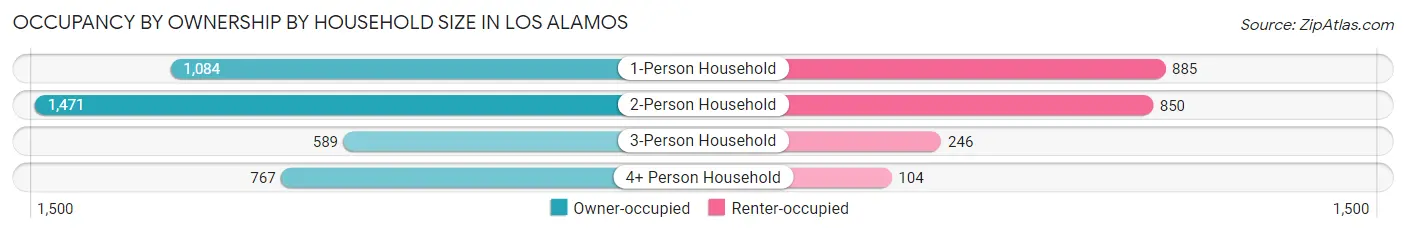
| Household Size | Owner-occupied | Renter-occupied |
| 1-Person Household | 1,084 (55.0%) | 885 (45.0%) |
| 2-Person Household | 1,471 (63.4%) | 850 (36.6%) |
| 3-Person Household | 589 (70.5%) | 246 (29.5%) |
| 4+ Person Household | 767 (88.1%) | 104 (11.9%) |
| Total Housing Units | 3,911 (65.2%) | 2,085 (34.8%) |
Occupancy by Educational Attainment in Los Alamos
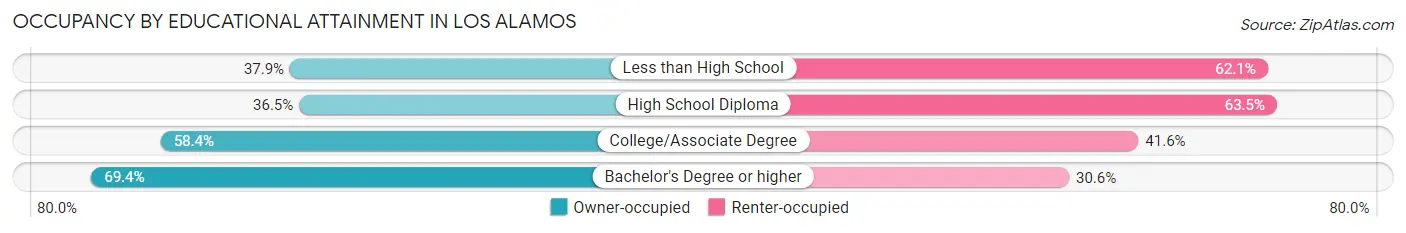
| Household Size | Owner-occupied | Renter-occupied |
| Less than High School | 69 (37.9%) | 113 (62.1%) |
| High School Diploma | 70 (36.5%) | 122 (63.5%) |
| College/Associate Degree | 691 (58.4%) | 492 (41.6%) |
| Bachelor's Degree or higher | 3,081 (69.4%) | 1,358 (30.6%) |
Occupancy by Age of Householder in Los Alamos
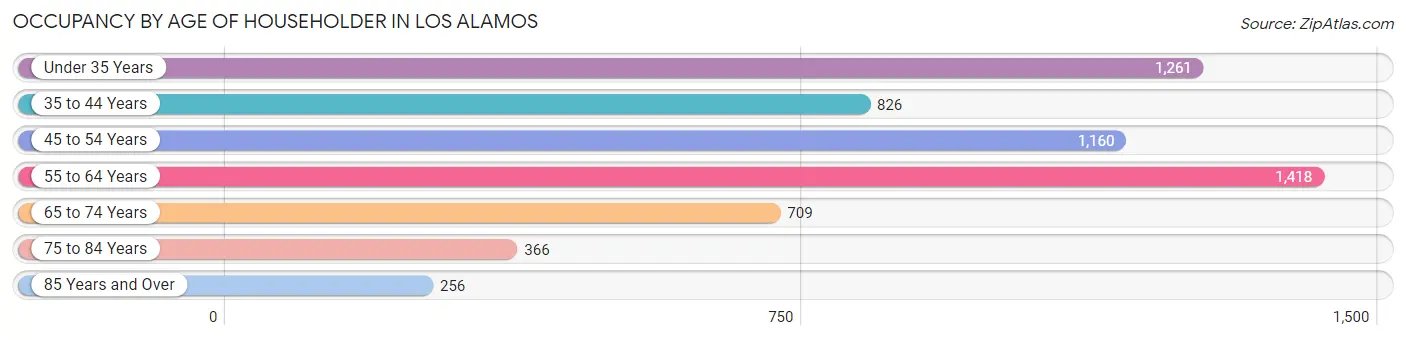
| Age Bracket | # Households | % Households |
| Under 35 Years | 1,261 | 21.0% |
| 35 to 44 Years | 826 | 13.8% |
| 45 to 54 Years | 1,160 | 19.4% |
| 55 to 64 Years | 1,418 | 23.6% |
| 65 to 74 Years | 709 | 11.8% |
| 75 to 84 Years | 366 | 6.1% |
| 85 Years and Over | 256 | 4.3% |
| Total | 5,996 | 100.0% |
Housing Finances in Los Alamos
Median Income by Occupancy in Los Alamos
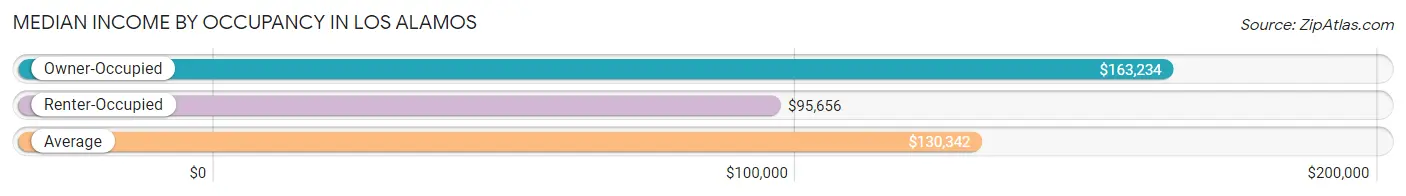
| Occupancy Type | # Households | Median Income |
| Owner-Occupied | 3,911 (65.2%) | $163,234 |
| Renter-Occupied | 2,085 (34.8%) | $95,656 |
| Average | 5,996 (100.0%) | $130,342 |
Occupancy by Householder Income Bracket in Los Alamos
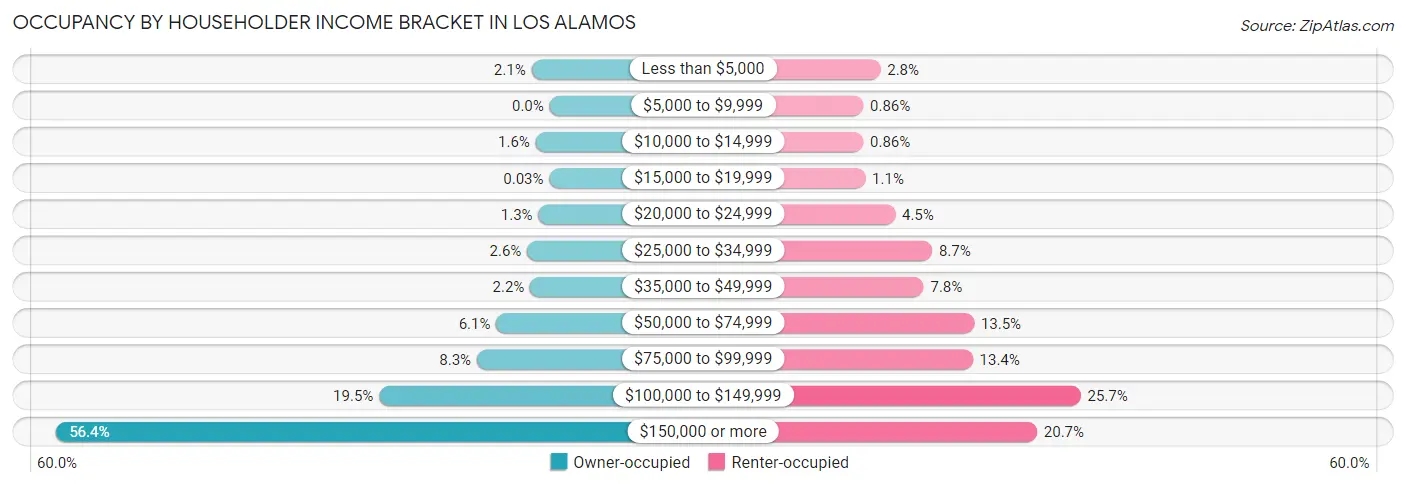
| Income Bracket | Owner-occupied | Renter-occupied |
| Less than $5,000 | 81 (2.1%) | 59 (2.8%) |
| $5,000 to $9,999 | 0 (0.0%) | 18 (0.9%) |
| $10,000 to $14,999 | 62 (1.6%) | 18 (0.9%) |
| $15,000 to $19,999 | 1 (0.0%) | 23 (1.1%) |
| $20,000 to $24,999 | 50 (1.3%) | 94 (4.5%) |
| $25,000 to $34,999 | 100 (2.6%) | 182 (8.7%) |
| $35,000 to $49,999 | 87 (2.2%) | 162 (7.8%) |
| $50,000 to $74,999 | 238 (6.1%) | 282 (13.5%) |
| $75,000 to $99,999 | 325 (8.3%) | 279 (13.4%) |
| $100,000 to $149,999 | 762 (19.5%) | 536 (25.7%) |
| $150,000 or more | 2,205 (56.4%) | 432 (20.7%) |
| Total | 3,911 (100.0%) | 2,085 (100.0%) |
Monthly Housing Cost Tiers in Los Alamos
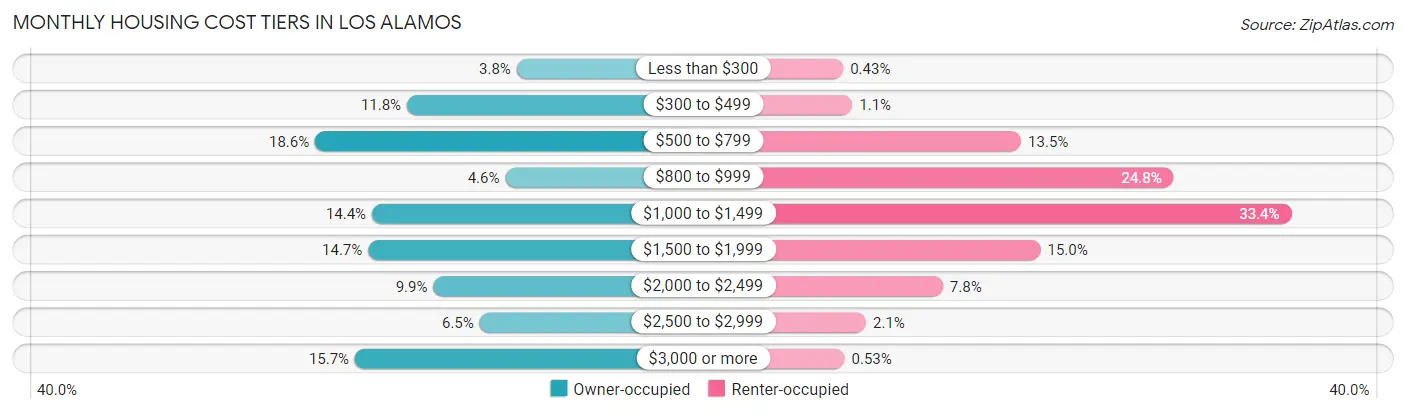
| Monthly Cost | Owner-occupied | Renter-occupied |
| Less than $300 | 147 (3.8%) | 9 (0.4%) |
| $300 to $499 | 463 (11.8%) | 23 (1.1%) |
| $500 to $799 | 728 (18.6%) | 282 (13.5%) |
| $800 to $999 | 180 (4.6%) | 516 (24.7%) |
| $1,000 to $1,499 | 564 (14.4%) | 697 (33.4%) |
| $1,500 to $1,999 | 575 (14.7%) | 312 (15.0%) |
| $2,000 to $2,499 | 387 (9.9%) | 162 (7.8%) |
| $2,500 to $2,999 | 254 (6.5%) | 44 (2.1%) |
| $3,000 or more | 613 (15.7%) | 11 (0.5%) |
| Total | 3,911 (100.0%) | 2,085 (100.0%) |
Physical Housing Characteristics in Los Alamos
Housing Structures in Los Alamos
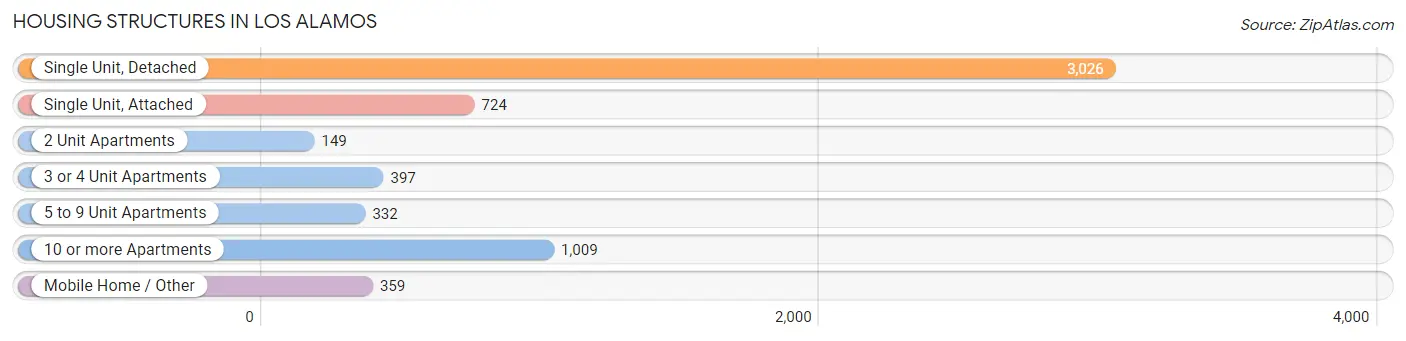
| Structure Type | # Housing Units | % Housing Units |
| Single Unit, Detached | 3,026 | 50.5% |
| Single Unit, Attached | 724 | 12.1% |
| 2 Unit Apartments | 149 | 2.5% |
| 3 or 4 Unit Apartments | 397 | 6.6% |
| 5 to 9 Unit Apartments | 332 | 5.5% |
| 10 or more Apartments | 1,009 | 16.8% |
| Mobile Home / Other | 359 | 6.0% |
| Total | 5,996 | 100.0% |
Housing Structures by Occupancy in Los Alamos
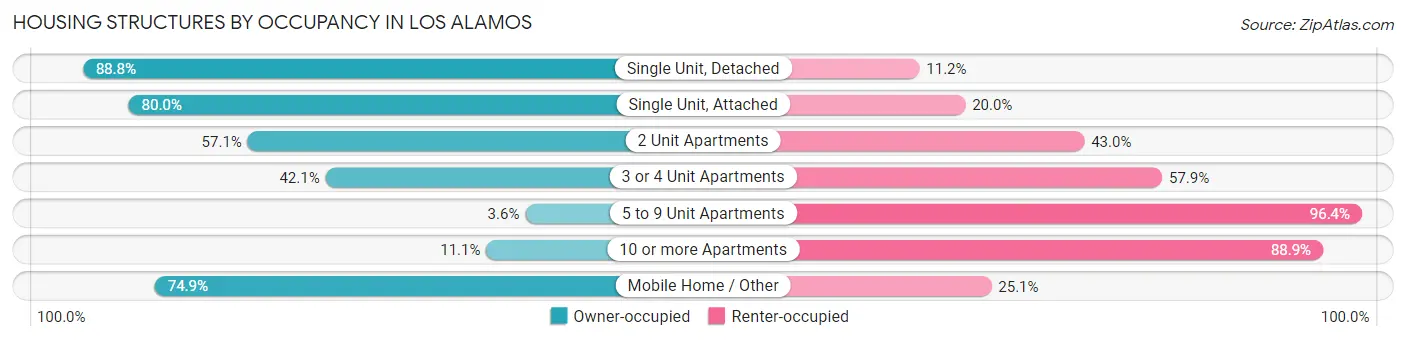
| Structure Type | Owner-occupied | Renter-occupied |
| Single Unit, Detached | 2,687 (88.8%) | 339 (11.2%) |
| Single Unit, Attached | 579 (80.0%) | 145 (20.0%) |
| 2 Unit Apartments | 85 (57.1%) | 64 (42.9%) |
| 3 or 4 Unit Apartments | 167 (42.1%) | 230 (57.9%) |
| 5 to 9 Unit Apartments | 12 (3.6%) | 320 (96.4%) |
| 10 or more Apartments | 112 (11.1%) | 897 (88.9%) |
| Mobile Home / Other | 269 (74.9%) | 90 (25.1%) |
| Total | 3,911 (65.2%) | 2,085 (34.8%) |
Housing Structures by Number of Rooms in Los Alamos
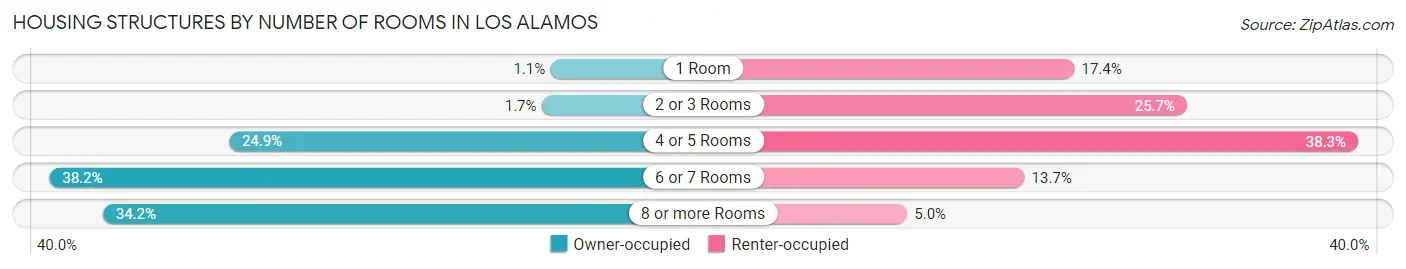
| Number of Rooms | Owner-occupied | Renter-occupied |
| 1 Room | 41 (1.1%) | 362 (17.4%) |
| 2 or 3 Rooms | 66 (1.7%) | 535 (25.7%) |
| 4 or 5 Rooms | 973 (24.9%) | 799 (38.3%) |
| 6 or 7 Rooms | 1,493 (38.2%) | 285 (13.7%) |
| 8 or more Rooms | 1,338 (34.2%) | 104 (5.0%) |
| Total | 3,911 (100.0%) | 2,085 (100.0%) |
Housing Structure by Heating Type in Los Alamos
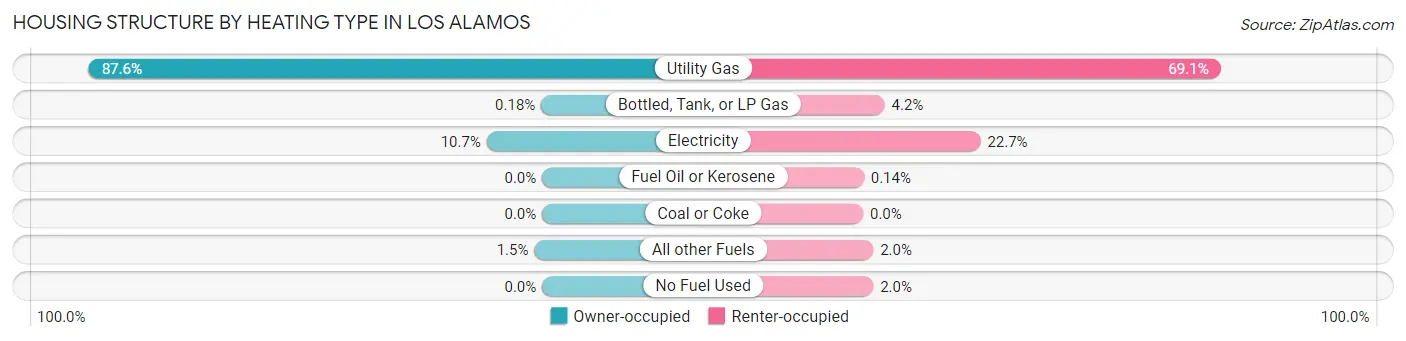
| Heating Type | Owner-occupied | Renter-occupied |
| Utility Gas | 3,426 (87.6%) | 1,440 (69.1%) |
| Bottled, Tank, or LP Gas | 7 (0.2%) | 87 (4.2%) |
| Electricity | 419 (10.7%) | 473 (22.7%) |
| Fuel Oil or Kerosene | 0 (0.0%) | 3 (0.1%) |
| Coal or Coke | 0 (0.0%) | 0 (0.0%) |
| All other Fuels | 59 (1.5%) | 41 (2.0%) |
| No Fuel Used | 0 (0.0%) | 41 (2.0%) |
| Total | 3,911 (100.0%) | 2,085 (100.0%) |
Household Vehicle Usage in Los Alamos
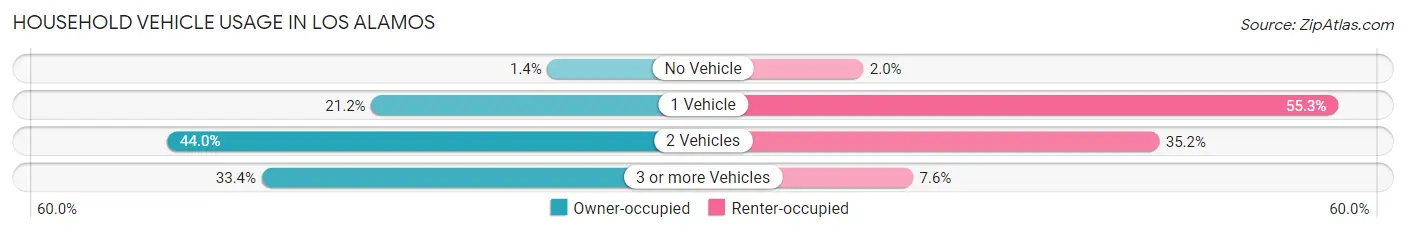
| Vehicles per Household | Owner-occupied | Renter-occupied |
| No Vehicle | 55 (1.4%) | 42 (2.0%) |
| 1 Vehicle | 827 (21.1%) | 1,152 (55.2%) |
| 2 Vehicles | 1,722 (44.0%) | 733 (35.2%) |
| 3 or more Vehicles | 1,307 (33.4%) | 158 (7.6%) |
| Total | 3,911 (100.0%) | 2,085 (100.0%) |
Real Estate & Mortgages in Los Alamos
Real Estate and Mortgage Overview in Los Alamos
| Characteristic | Without Mortgage | With Mortgage |
| Housing Units | 1,509 | 2,402 |
| Median Property Value | $369,100 | $437,100 |
| Median Household Income | $130,618 | $1,579 |
| Monthly Housing Costs | $564 | $613 |
| Real Estate Taxes | $2,187 | $62 |
Property Value by Mortgage Status in Los Alamos
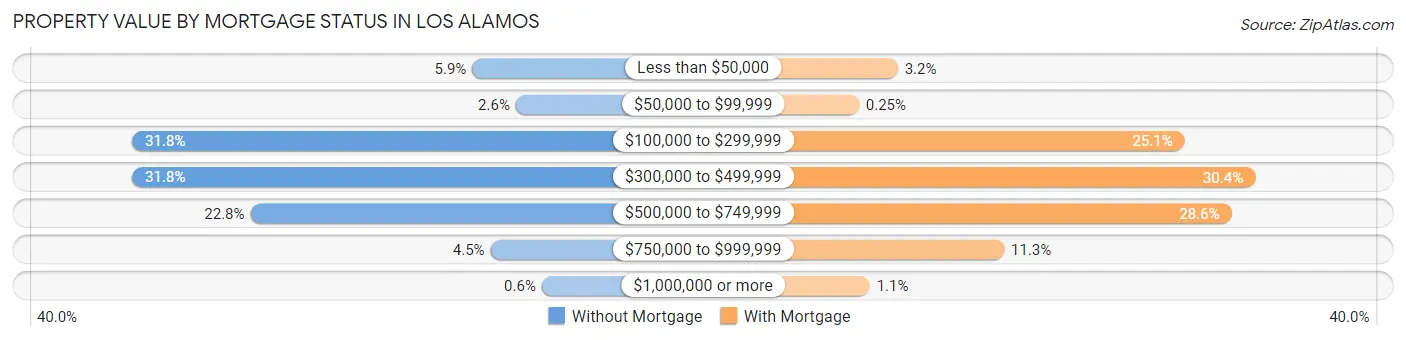
| Property Value | Without Mortgage | With Mortgage |
| Less than $50,000 | 89 (5.9%) | 77 (3.2%) |
| $50,000 to $99,999 | 39 (2.6%) | 6 (0.3%) |
| $100,000 to $299,999 | 480 (31.8%) | 602 (25.1%) |
| $300,000 to $499,999 | 480 (31.8%) | 731 (30.4%) |
| $500,000 to $749,999 | 344 (22.8%) | 688 (28.6%) |
| $750,000 to $999,999 | 68 (4.5%) | 272 (11.3%) |
| $1,000,000 or more | 9 (0.6%) | 26 (1.1%) |
| Total | 1,509 (100.0%) | 2,402 (100.0%) |
Household Income by Mortgage Status in Los Alamos
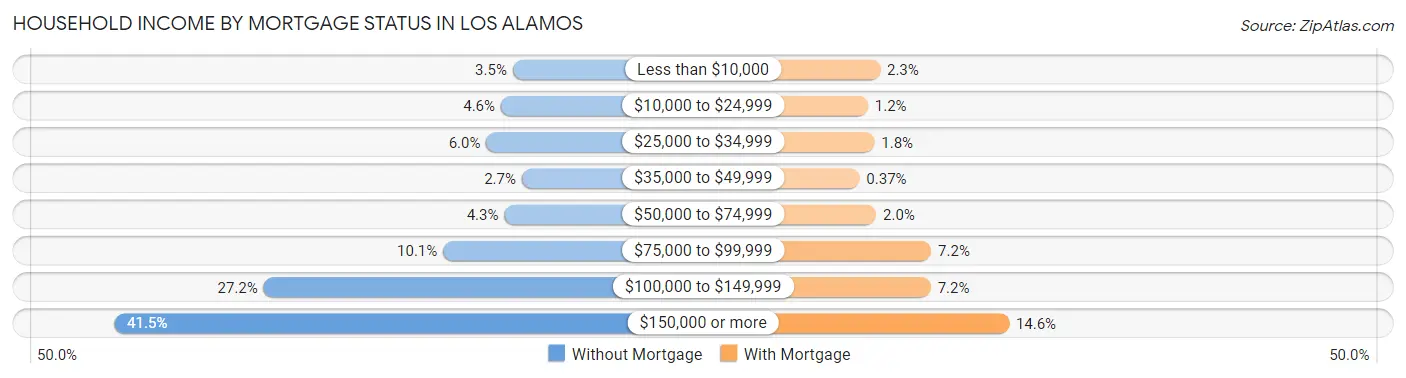
| Household Income | Without Mortgage | With Mortgage |
| Less than $10,000 | 53 (3.5%) | 56 (2.3%) |
| $10,000 to $24,999 | 70 (4.6%) | 28 (1.2%) |
| $25,000 to $34,999 | 91 (6.0%) | 43 (1.8%) |
| $35,000 to $49,999 | 40 (2.6%) | 9 (0.4%) |
| $50,000 to $74,999 | 65 (4.3%) | 47 (2.0%) |
| $75,000 to $99,999 | 153 (10.1%) | 173 (7.2%) |
| $100,000 to $149,999 | 411 (27.2%) | 172 (7.2%) |
| $150,000 or more | 626 (41.5%) | 351 (14.6%) |
| Total | 1,509 (100.0%) | 2,402 (100.0%) |
Property Value to Household Income Ratio in Los Alamos
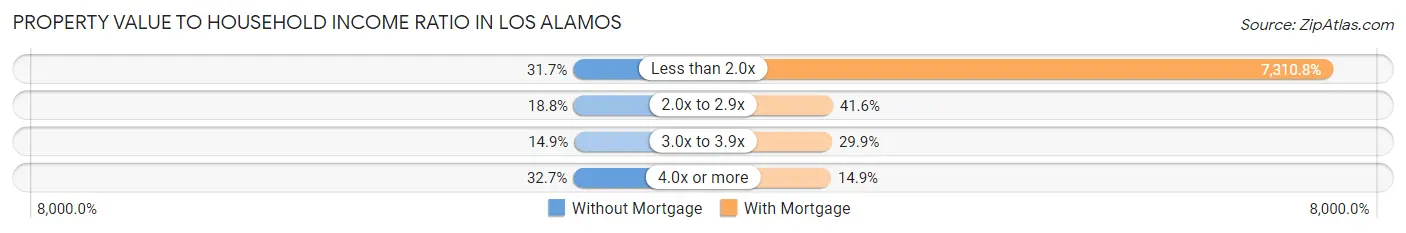
| Value-to-Income Ratio | Without Mortgage | With Mortgage |
| Less than 2.0x | 479 (31.7%) | 175,605 (7,310.8%) |
| 2.0x to 2.9x | 283 (18.8%) | 1,000 (41.6%) |
| 3.0x to 3.9x | 225 (14.9%) | 718 (29.9%) |
| 4.0x or more | 493 (32.7%) | 358 (14.9%) |
| Total | 1,509 (100.0%) | 2,402 (100.0%) |
Real Estate Taxes by Mortgage Status in Los Alamos
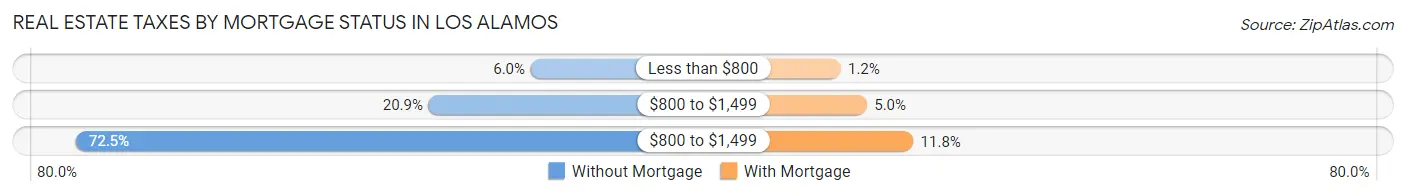
| Property Taxes | Without Mortgage | With Mortgage |
| Less than $800 | 91 (6.0%) | 28 (1.2%) |
| $800 to $1,499 | 316 (20.9%) | 120 (5.0%) |
| $800 to $1,499 | 1,094 (72.5%) | 283 (11.8%) |
| Total | 1,509 (100.0%) | 2,402 (100.0%) |
Health & Disability in Los Alamos
Health Insurance Coverage by Age in Los Alamos
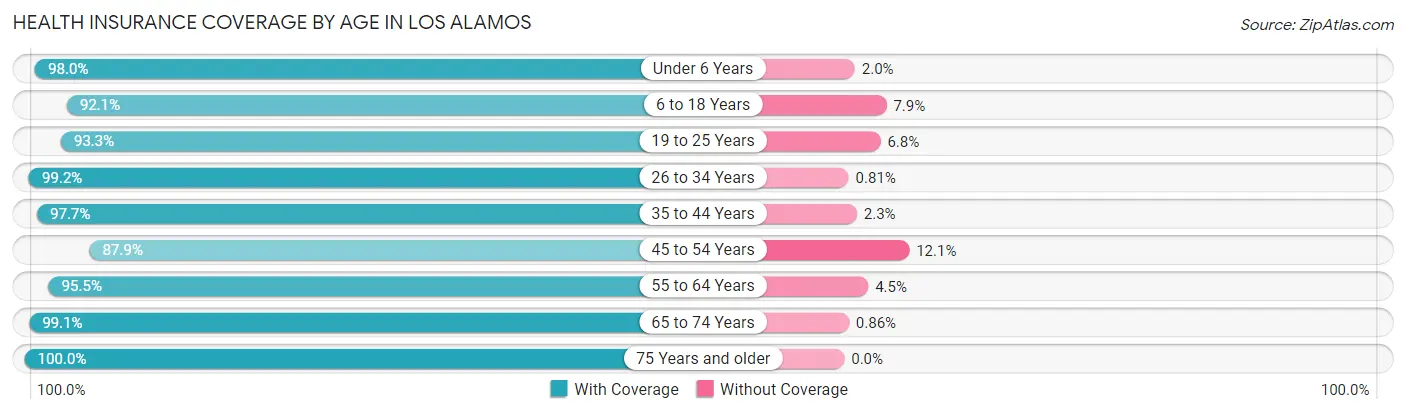
| Age Bracket | With Coverage | Without Coverage |
| Under 6 Years | 546 (98.0%) | 11 (2.0%) |
| 6 to 18 Years | 2,002 (92.1%) | 171 (7.9%) |
| 19 to 25 Years | 967 (93.2%) | 70 (6.8%) |
| 26 to 34 Years | 1,833 (99.2%) | 15 (0.8%) |
| 35 to 44 Years | 1,459 (97.7%) | 35 (2.3%) |
| 45 to 54 Years | 1,625 (87.9%) | 224 (12.1%) |
| 55 to 64 Years | 1,927 (95.5%) | 90 (4.5%) |
| 65 to 74 Years | 1,261 (99.1%) | 11 (0.9%) |
| 75 Years and older | 1,038 (100.0%) | 0 (0.0%) |
| Total | 12,658 (95.3%) | 627 (4.7%) |
Health Insurance Coverage by Citizenship Status in Los Alamos
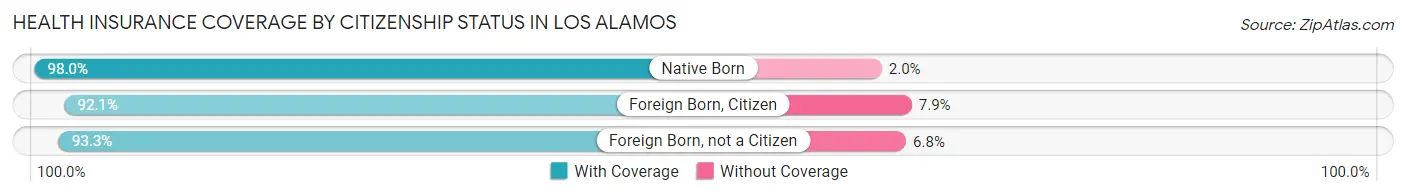
| Citizenship Status | With Coverage | Without Coverage |
| Native Born | 546 (98.0%) | 11 (2.0%) |
| Foreign Born, Citizen | 2,002 (92.1%) | 171 (7.9%) |
| Foreign Born, not a Citizen | 967 (93.2%) | 70 (6.8%) |
Health Insurance Coverage by Household Income in Los Alamos
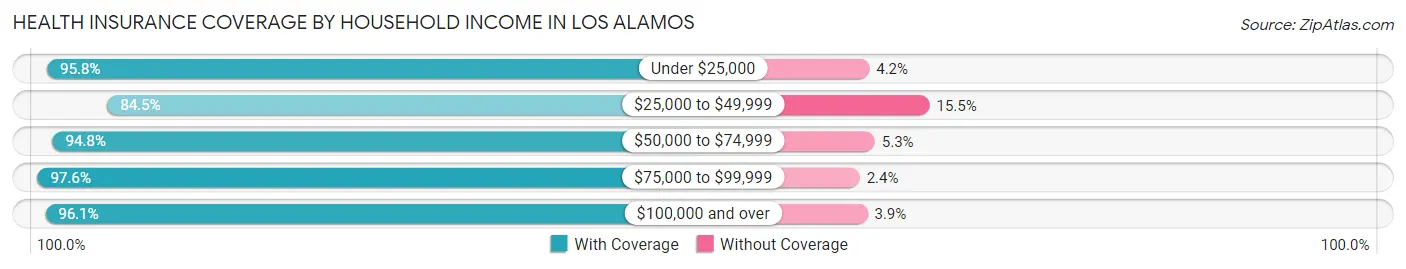
| Household Income | With Coverage | Without Coverage |
| Under $25,000 | 614 (95.8%) | 27 (4.2%) |
| $25,000 to $49,999 | 818 (84.5%) | 150 (15.5%) |
| $50,000 to $74,999 | 794 (94.8%) | 44 (5.2%) |
| $75,000 to $99,999 | 1,010 (97.6%) | 25 (2.4%) |
| $100,000 and over | 9,397 (96.1%) | 379 (3.9%) |
Public vs Private Health Insurance Coverage by Age in Los Alamos
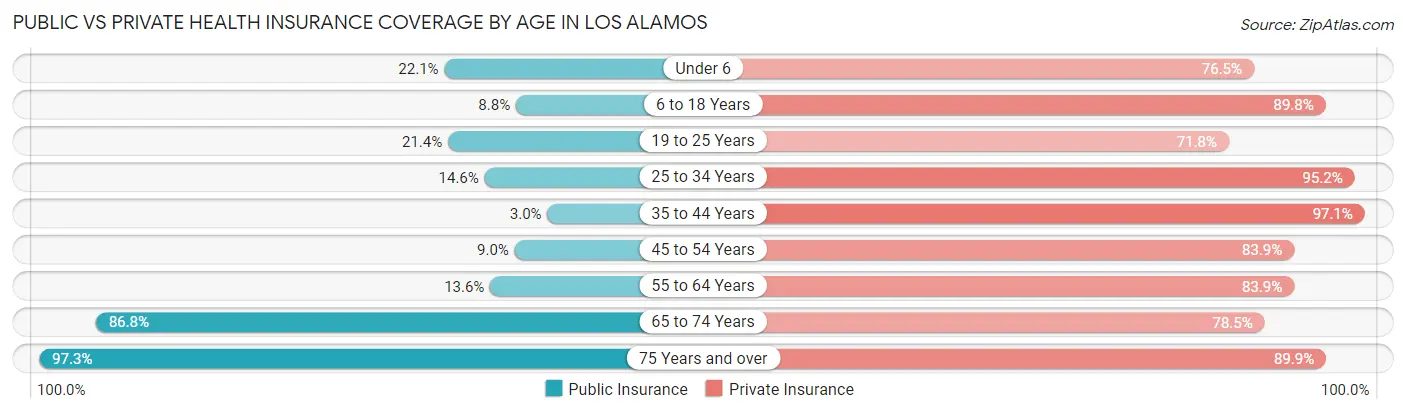
| Age Bracket | Public Insurance | Private Insurance |
| Under 6 | 123 (22.1%) | 426 (76.5%) |
| 6 to 18 Years | 191 (8.8%) | 1,951 (89.8%) |
| 19 to 25 Years | 222 (21.4%) | 745 (71.8%) |
| 25 to 34 Years | 270 (14.6%) | 1,759 (95.2%) |
| 35 to 44 Years | 44 (2.9%) | 1,450 (97.1%) |
| 45 to 54 Years | 167 (9.0%) | 1,552 (83.9%) |
| 55 to 64 Years | 274 (13.6%) | 1,693 (83.9%) |
| 65 to 74 Years | 1,104 (86.8%) | 998 (78.5%) |
| 75 Years and over | 1,010 (97.3%) | 933 (89.9%) |
| Total | 3,405 (25.6%) | 11,507 (86.6%) |
Disability Status by Sex by Age in Los Alamos
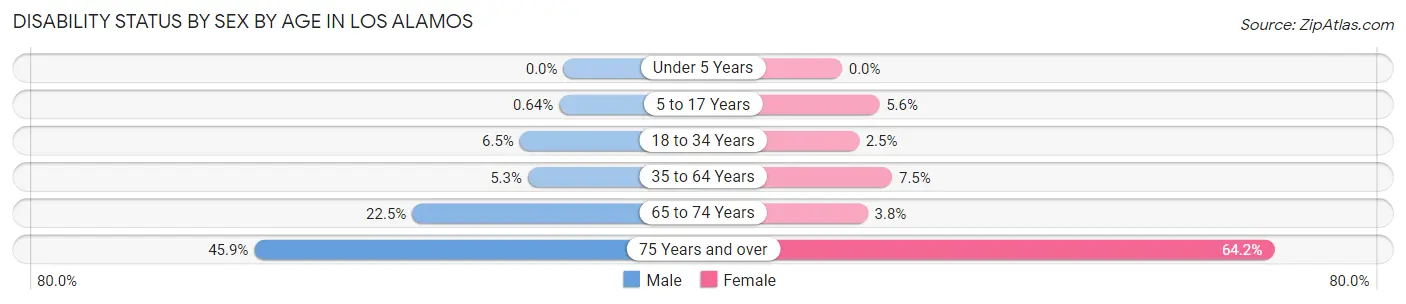
| Age Bracket | Male | Female |
| Under 5 Years | 0 (0.0%) | 0 (0.0%) |
| 5 to 17 Years | 7 (0.6%) | 58 (5.6%) |
| 18 to 34 Years | 114 (6.5%) | 31 (2.5%) |
| 35 to 64 Years | 143 (5.3%) | 198 (7.5%) |
| 65 to 74 Years | 145 (22.5%) | 24 (3.8%) |
| 75 Years and over | 219 (45.9%) | 360 (64.2%) |
Disability Class by Sex by Age in Los Alamos
Disability Class: Hearing Difficulty
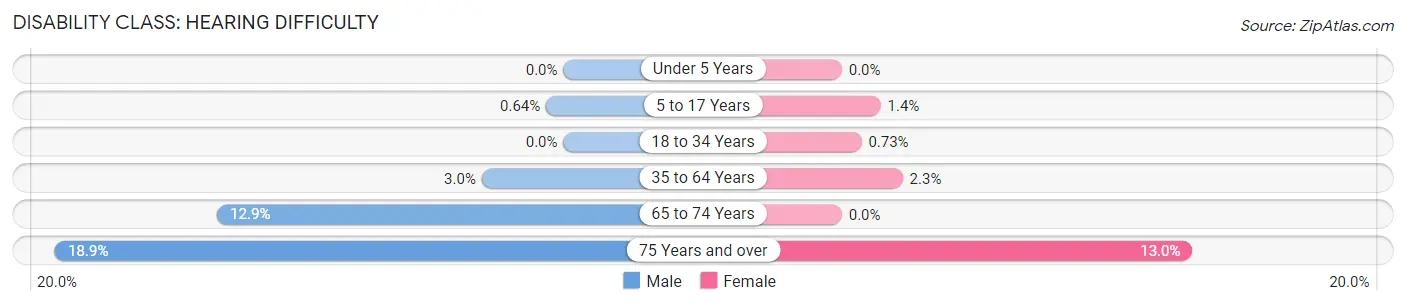
| Age Bracket | Male | Female |
| Under 5 Years | 0 (0.0%) | 0 (0.0%) |
| 5 to 17 Years | 7 (0.6%) | 15 (1.4%) |
| 18 to 34 Years | 0 (0.0%) | 9 (0.7%) |
| 35 to 64 Years | 82 (3.0%) | 60 (2.3%) |
| 65 to 74 Years | 83 (12.9%) | 0 (0.0%) |
| 75 Years and over | 90 (18.9%) | 73 (13.0%) |
Disability Class: Vision Difficulty
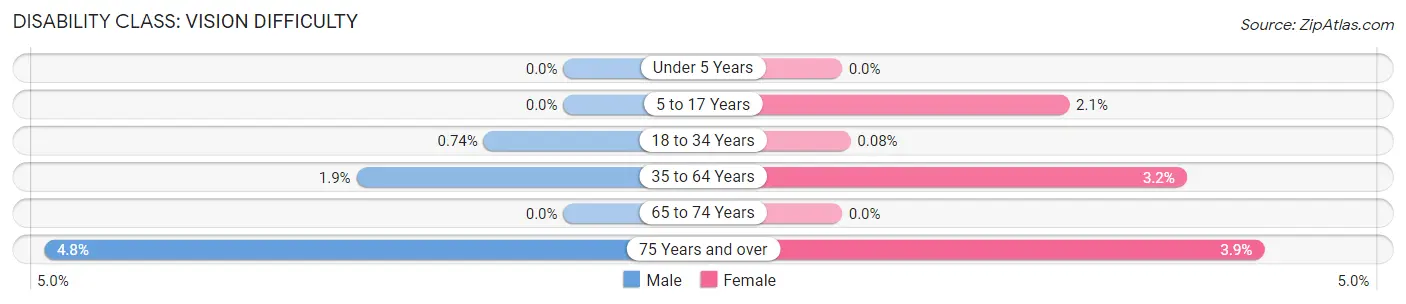
| Age Bracket | Male | Female |
| Under 5 Years | 0 (0.0%) | 0 (0.0%) |
| 5 to 17 Years | 0 (0.0%) | 22 (2.1%) |
| 18 to 34 Years | 13 (0.7%) | 1 (0.1%) |
| 35 to 64 Years | 52 (1.9%) | 85 (3.2%) |
| 65 to 74 Years | 0 (0.0%) | 0 (0.0%) |
| 75 Years and over | 23 (4.8%) | 22 (3.9%) |
Disability Class: Cognitive Difficulty
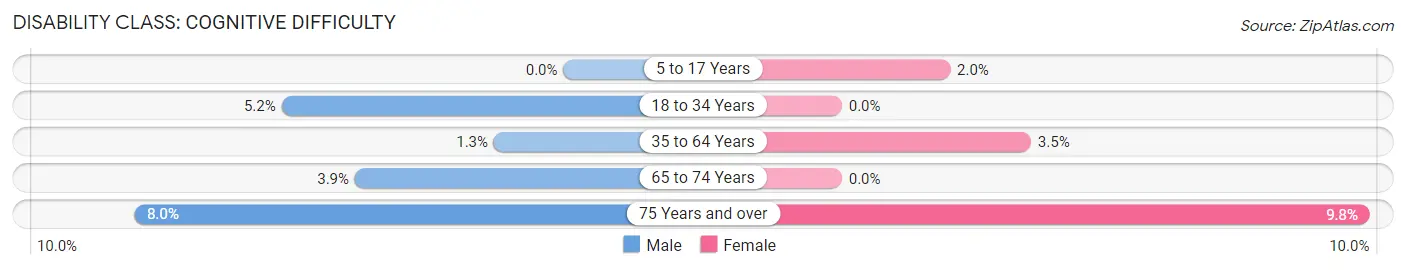
| Age Bracket | Male | Female |
| 5 to 17 Years | 0 (0.0%) | 21 (2.0%) |
| 18 to 34 Years | 92 (5.2%) | 0 (0.0%) |
| 35 to 64 Years | 35 (1.3%) | 93 (3.5%) |
| 65 to 74 Years | 25 (3.9%) | 0 (0.0%) |
| 75 Years and over | 38 (8.0%) | 55 (9.8%) |
Disability Class: Ambulatory Difficulty
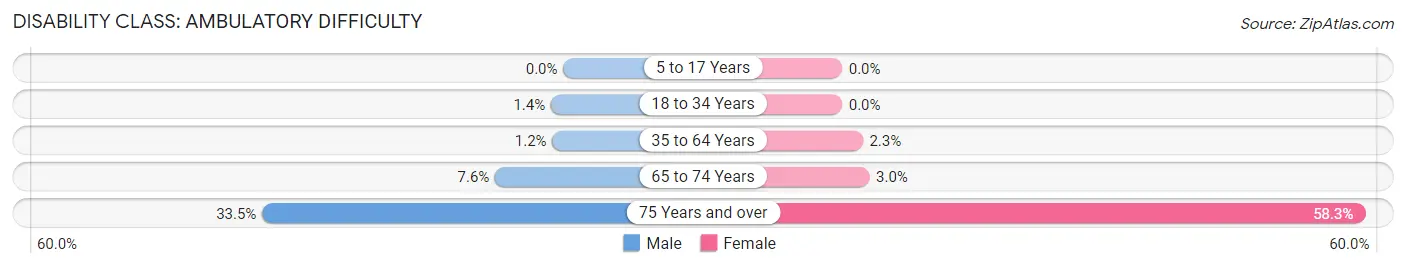
| Age Bracket | Male | Female |
| 5 to 17 Years | 0 (0.0%) | 0 (0.0%) |
| 18 to 34 Years | 24 (1.4%) | 0 (0.0%) |
| 35 to 64 Years | 33 (1.2%) | 61 (2.3%) |
| 65 to 74 Years | 49 (7.6%) | 19 (3.0%) |
| 75 Years and over | 160 (33.5%) | 327 (58.3%) |
Disability Class: Self-Care Difficulty
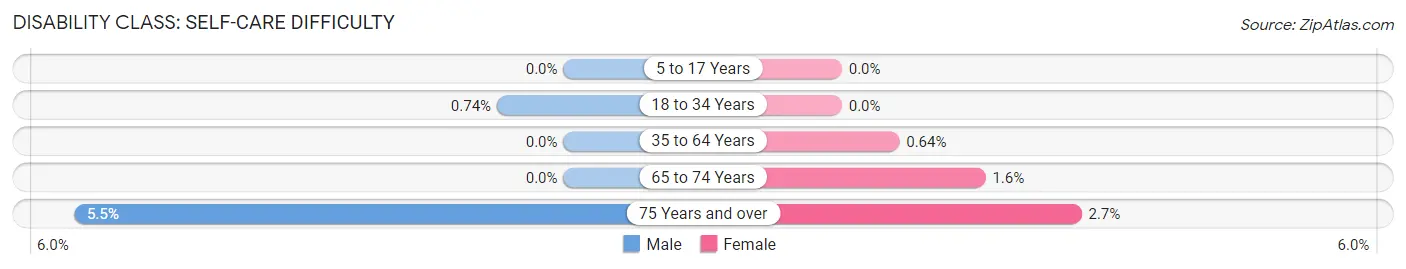
| Age Bracket | Male | Female |
| 5 to 17 Years | 0 (0.0%) | 0 (0.0%) |
| 18 to 34 Years | 13 (0.7%) | 0 (0.0%) |
| 35 to 64 Years | 0 (0.0%) | 17 (0.6%) |
| 65 to 74 Years | 0 (0.0%) | 10 (1.6%) |
| 75 Years and over | 26 (5.4%) | 15 (2.7%) |
Technology Access in Los Alamos
Computing Device Access in Los Alamos
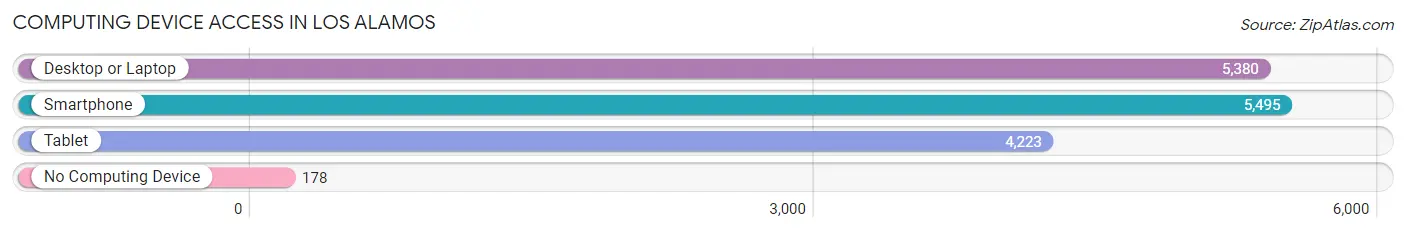
| Device Type | # Households | % Households |
| Desktop or Laptop | 5,380 | 89.7% |
| Smartphone | 5,495 | 91.6% |
| Tablet | 4,223 | 70.4% |
| No Computing Device | 178 | 3.0% |
| Total | 5,996 | 100.0% |
Internet Access in Los Alamos
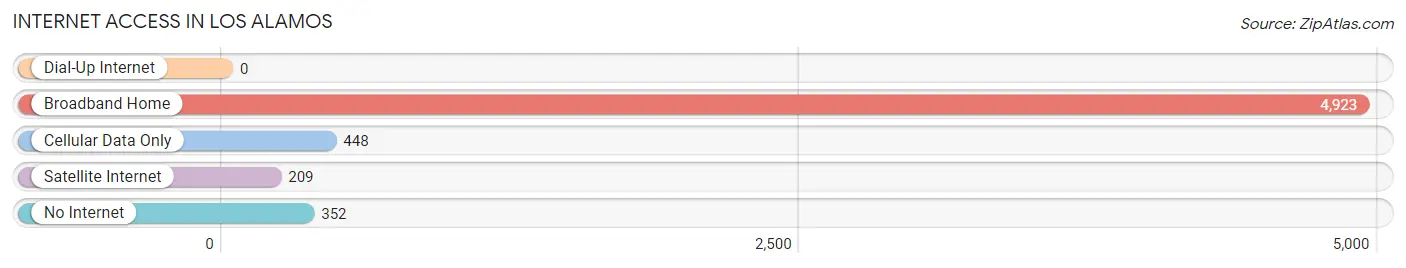
| Internet Type | # Households | % Households |
| Dial-Up Internet | 0 | 0.0% |
| Broadband Home | 4,923 | 82.1% |
| Cellular Data Only | 448 | 7.5% |
| Satellite Internet | 209 | 3.5% |
| No Internet | 352 | 5.9% |
| Total | 5,996 | 100.0% |
Los Alamos Summary
Los Alamos, New Mexico is a small town located in the northern part of the state, in Los Alamos County. It is situated in the Jemez Mountains, at an elevation of 7,320 feet. The town is best known for being the birthplace of the atomic bomb, as it was the site of the Los Alamos National Laboratory, where the Manhattan Project was conducted during World War II.
Geography
Los Alamos is located in the Jemez Mountains, a range of volcanic mountains in the northern part of the state. The town is situated at an elevation of 7,320 feet, and is surrounded by the Valles Caldera National Preserve. The town is located in a high desert climate, with hot summers and cold winters. The average annual precipitation is 12.5 inches, and the average annual snowfall is 33.5 inches.
Economy
Los Alamos is home to the Los Alamos National Laboratory, which is the largest employer in the town. The laboratory is a research and development facility that is operated by the United States Department of Energy. It is best known for its role in the Manhattan Project during World War II, when it was used to develop the atomic bomb. The laboratory is also involved in a variety of other research projects, including nuclear weapons research, energy research, and environmental research.
In addition to the laboratory, Los Alamos is home to a variety of other businesses, including retail stores, restaurants, and hotels. The town is also home to a number of government agencies, including the Los Alamos County government, the Los Alamos Public Schools, and the Los Alamos Medical Center.
Demographics
As of the 2010 census, the population of Los Alamos was 12,019. The racial makeup of the town was 79.3% White, 0.7% African American, 0.7% Native American, 8.2% Asian, 0.1% Pacific Islander, 8.2% from other races, and 2.7% from two or more races. Hispanic or Latino of any race were 24.3% of the population.
The median household income in Los Alamos was $87,837, and the median family income was $103,945. The per capita income was $45,945. About 4.3% of families and 5.7% of the population were below the poverty line, including 6.2% of those under age 18 and 4.2% of those age 65 or over.
History
Los Alamos was founded in the early 1900s as a small ranching community. In 1942, the United States government purchased the land and established the Los Alamos National Laboratory, which was used to develop the atomic bomb during World War II. After the war, the laboratory continued to be used for a variety of research projects, including nuclear weapons research, energy research, and environmental research.
In the 1950s, Los Alamos began to grow rapidly, as the population increased from 2,000 to 10,000. The town was incorporated in 1952, and the Los Alamos County government was established in 1954. In the 1960s, the town continued to grow, and the population reached its peak of 12,019 in 2010.
Today, Los Alamos is a small town with a population of 12,019. It is home to the Los Alamos National Laboratory, which is the largest employer in the town. The town is also home to a variety of other businesses, including retail stores, restaurants, and hotels. The town is known for its history as the birthplace of the atomic bomb, and for its beautiful mountain scenery.
Common Questions
What is Per Capita Income in Los Alamos?
Per Capita income in Los Alamos is $73,654.
What is the Median Family Income in Los Alamos?
Median Family Income in Los Alamos is $164,531.
What is the Median Household income in Los Alamos?
Median Household Income in Los Alamos is $130,342.
What is Income or Wage Gap in Los Alamos?
Income or Wage Gap in Los Alamos is 33.0%.
Women in Los Alamos earn 67.0 cents for every dollar earned by a man.
What is Family Income Deficit in Los Alamos?
Family Income Deficit in Los Alamos is $6,867.
Families that are below poverty line in Los Alamos earn $6,867 less on average than the poverty threshold level.
What is Inequality or Gini Index in Los Alamos?
Inequality or Gini Index in Los Alamos is 0.41.
What is the Total Population of Los Alamos?
Total Population of Los Alamos is 13,460.
What is the Total Male Population of Los Alamos?
Total Male Population of Los Alamos is 7,050.
What is the Total Female Population of Los Alamos?
Total Female Population of Los Alamos is 6,410.
What is the Ratio of Males per 100 Females in Los Alamos?
There are 109.98 Males per 100 Females in Los Alamos.
What is the Ratio of Females per 100 Males in Los Alamos?
There are 90.92 Females per 100 Males in Los Alamos.
What is the Median Population Age in Los Alamos?
Median Population Age in Los Alamos is 41.3 Years.
What is the Average Family Size in Los Alamos
Average Family Size in Los Alamos is 2.9 People.
What is the Average Household Size in Los Alamos
Average Household Size in Los Alamos is 2.2 People.
How Large is the Labor Force in Los Alamos?
There are 7,727 People in the Labor Forcein in Los Alamos.
What is the Percentage of People in the Labor Force in Los Alamos?
68.7% of People are in the Labor Force in Los Alamos.
What is the Unemployment Rate in Los Alamos?
Unemployment Rate in Los Alamos is 1.8%.