Odessa, FL Map & Demographics
Odessa Map
Odessa Overview
$46,880
PER CAPITA INCOME
$128,654
AVG FAMILY INCOME
$112,258
AVG HOUSEHOLD INCOME
43.5%
WAGE / INCOME GAP [ % ]
56.5¢/ $1
WAGE / INCOME GAP [ $ ]
0.34
INEQUALITY / GINI INDEX
7,538
TOTAL POPULATION
3,905
MALE POPULATION
3,633
FEMALE POPULATION
107.49
MALES / 100 FEMALES
93.03
FEMALES / 100 MALES
39.5
MEDIAN AGE
3.4
AVG FAMILY SIZE
2.9
AVG HOUSEHOLD SIZE
3,813
LABOR FORCE [ PEOPLE ]
65.8%
PERCENT IN LABOR FORCE
2.6%
UNEMPLOYMENT RATE
Odessa Zip Codes
Odessa Area Codes
Income in Odessa
Income Overview in Odessa
Per Capita Income in Odessa is $46,880, while median incomes of families and households are $128,654 and $112,258 respectively.
| Characteristic | Number | Measure |
| Per Capita Income | 7,538 | $46,880 |
| Median Family Income | 1,944 | $128,654 |
| Mean Family Income | 1,944 | $145,541 |
| Median Household Income | 2,622 | $112,258 |
| Mean Household Income | 2,622 | $132,354 |
| Income Deficit | 1,944 | $0 |
| Wage / Income Gap (%) | 7,538 | 43.48% |
| Wage / Income Gap ($) | 7,538 | 56.52¢ per $1 |
| Gini / Inequality Index | 7,538 | 0.34 |
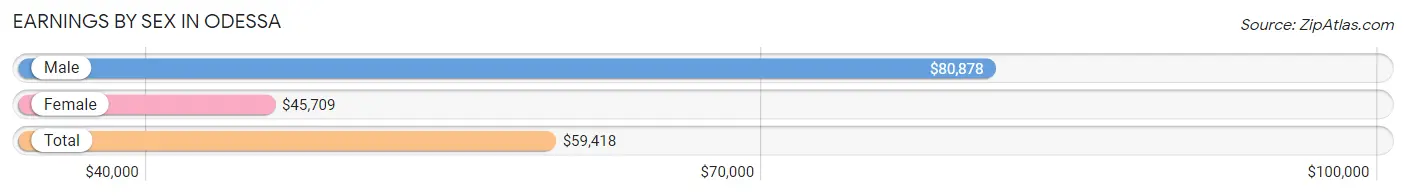
Earnings by Sex in Odessa
Average Earnings in Odessa are $59,418, $80,878 for men and $45,709 for women, a difference of 43.5%.
| Sex | Number | Average Earnings |
| Male | 2,158 (54.9%) | $80,878 |
| Female | 1,774 (45.1%) | $45,709 |
| Total | 3,932 (100.0%) | $59,418 |
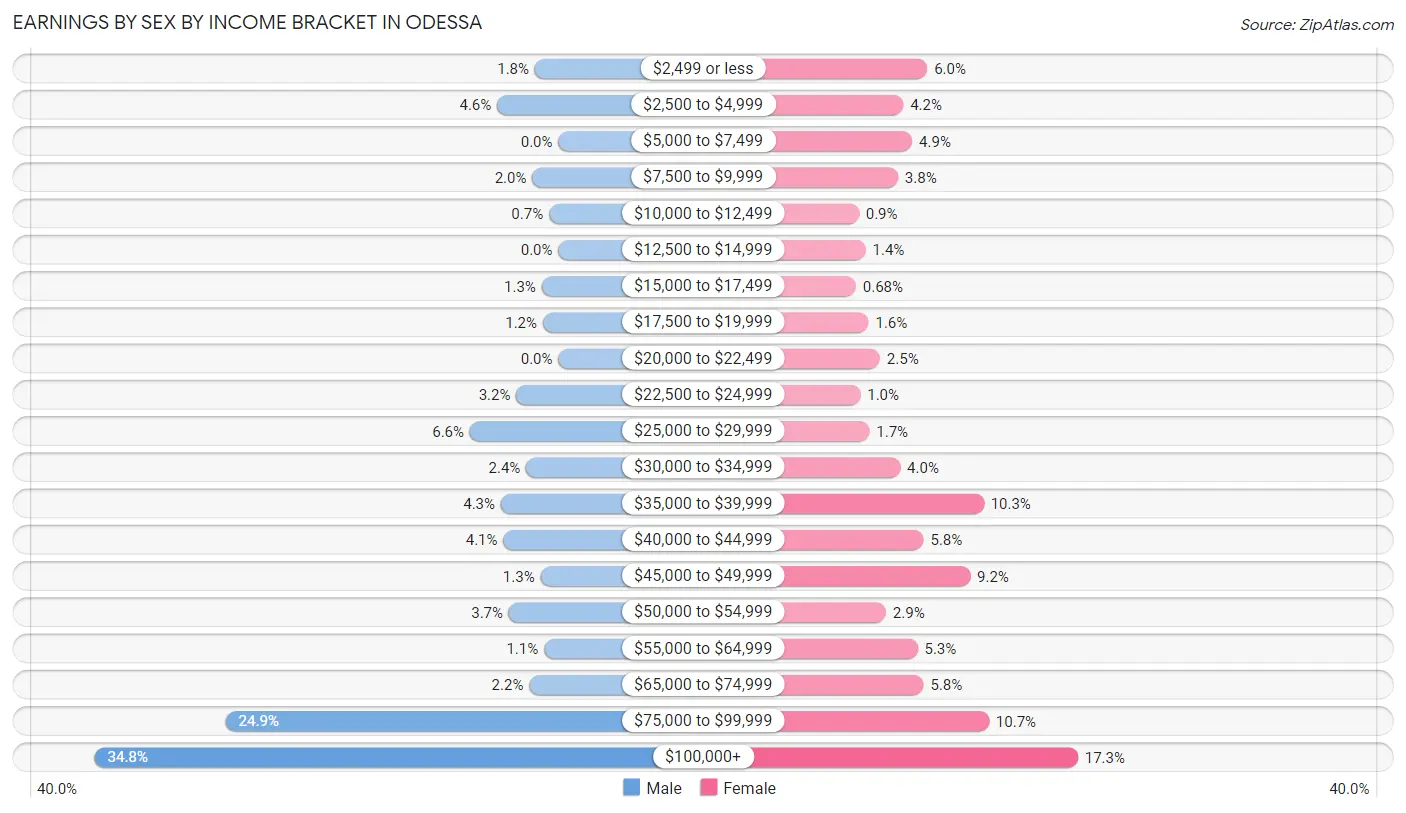
Earnings by Sex by Income Bracket in Odessa
The most common earnings brackets in Odessa are $100,000+ for men (750 | 34.7%) and $100,000+ for women (307 | 17.3%).
| Income | Male | Female |
| $2,499 or less | 38 (1.8%) | 107 (6.0%) |
| $2,500 to $4,999 | 99 (4.6%) | 75 (4.2%) |
| $5,000 to $7,499 | 0 (0.0%) | 87 (4.9%) |
| $7,500 to $9,999 | 42 (1.9%) | 68 (3.8%) |
| $10,000 to $12,499 | 15 (0.7%) | 16 (0.9%) |
| $12,500 to $14,999 | 0 (0.0%) | 25 (1.4%) |
| $15,000 to $17,499 | 27 (1.3%) | 12 (0.7%) |
| $17,500 to $19,999 | 25 (1.2%) | 29 (1.6%) |
| $20,000 to $22,499 | 0 (0.0%) | 44 (2.5%) |
| $22,500 to $24,999 | 68 (3.2%) | 18 (1.0%) |
| $25,000 to $29,999 | 143 (6.6%) | 30 (1.7%) |
| $30,000 to $34,999 | 52 (2.4%) | 71 (4.0%) |
| $35,000 to $39,999 | 93 (4.3%) | 182 (10.3%) |
| $40,000 to $44,999 | 89 (4.1%) | 102 (5.8%) |
| $45,000 to $49,999 | 29 (1.3%) | 164 (9.2%) |
| $50,000 to $54,999 | 80 (3.7%) | 52 (2.9%) |
| $55,000 to $64,999 | 23 (1.1%) | 94 (5.3%) |
| $65,000 to $74,999 | 47 (2.2%) | 102 (5.8%) |
| $75,000 to $99,999 | 538 (24.9%) | 189 (10.6%) |
| $100,000+ | 750 (34.7%) | 307 (17.3%) |
| Total | 2,158 (100.0%) | 1,774 (100.0%) |
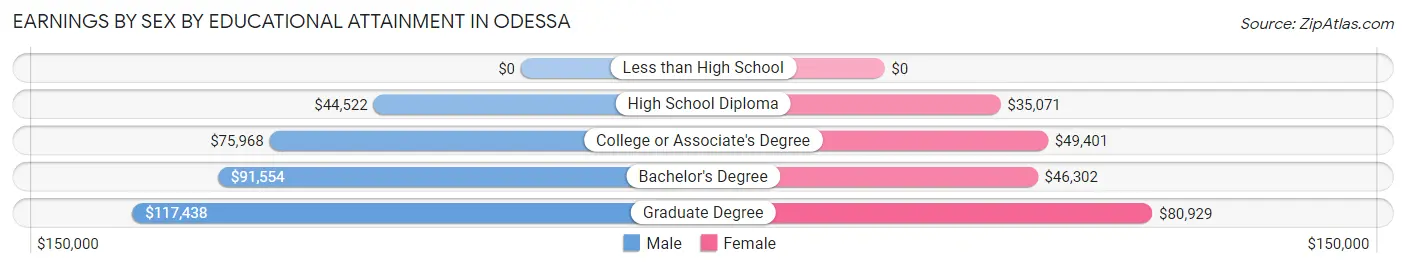
Earnings by Sex by Educational Attainment in Odessa
Average earnings in Odessa are $82,247 for men and $48,486 for women, a difference of 41.0%. Men with an educational attainment of graduate degree enjoy the highest average annual earnings of $117,438, while those with high school diploma education earn the least with $44,522. Women with an educational attainment of graduate degree earn the most with the average annual earnings of $80,929, while those with high school diploma education have the smallest earnings of $35,071.
| Educational Attainment | Male Income | Female Income |
| Less than High School | - | - |
| High School Diploma | $44,522 | $35,071 |
| College or Associate's Degree | $75,968 | $49,401 |
| Bachelor's Degree | $91,554 | $46,302 |
| Graduate Degree | $117,438 | $80,929 |
| Total | $82,247 | $48,486 |
Family Income in Odessa
Family Income Brackets in Odessa
According to the Odessa family income data, there are 455 families falling into the $150,000 to $199,999 income range, which is the most common income bracket and makes up 23.4% of all families.
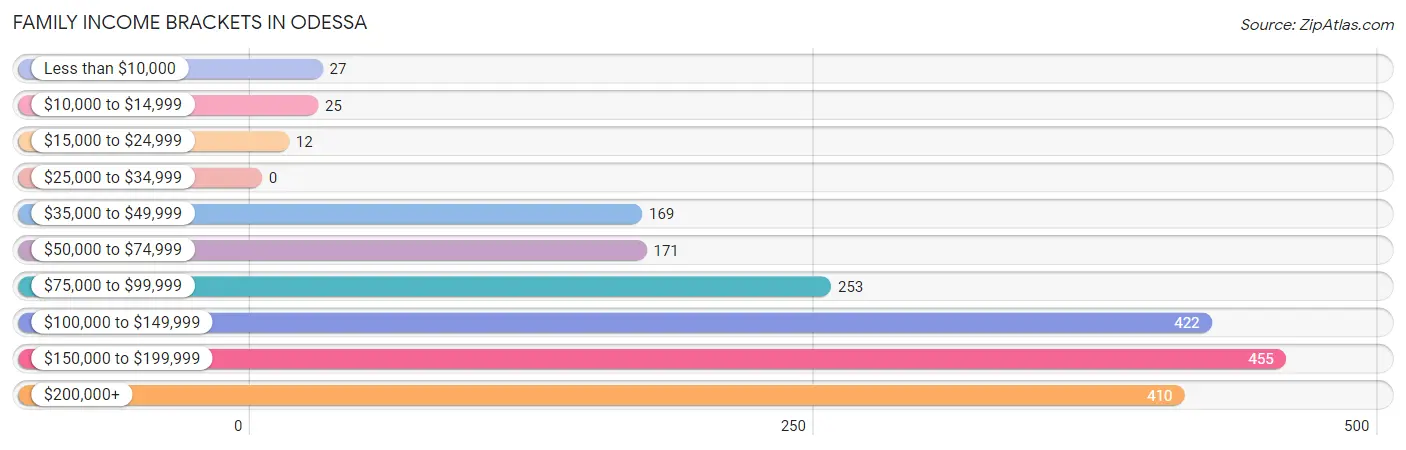
| Income Bracket | # Families | % Families |
| Less than $10,000 | 27 | 1.4% |
| $10,000 to $14,999 | 25 | 1.3% |
| $15,000 to $24,999 | 12 | 0.6% |
| $25,000 to $34,999 | 0 | 0.0% |
| $35,000 to $49,999 | 169 | 8.7% |
| $50,000 to $74,999 | 171 | 8.8% |
| $75,000 to $99,999 | 253 | 13.0% |
| $100,000 to $149,999 | 422 | 21.7% |
| $150,000 to $199,999 | 455 | 23.4% |
| $200,000+ | 410 | 21.1% |
Family Income by Famaliy Size in Odessa
5-person families (128 | 6.6%) account for the highest median family income in Odessa with $162,917 per family, while 2-person families (691 | 35.5%) have the highest median income of $58,988 per family member.
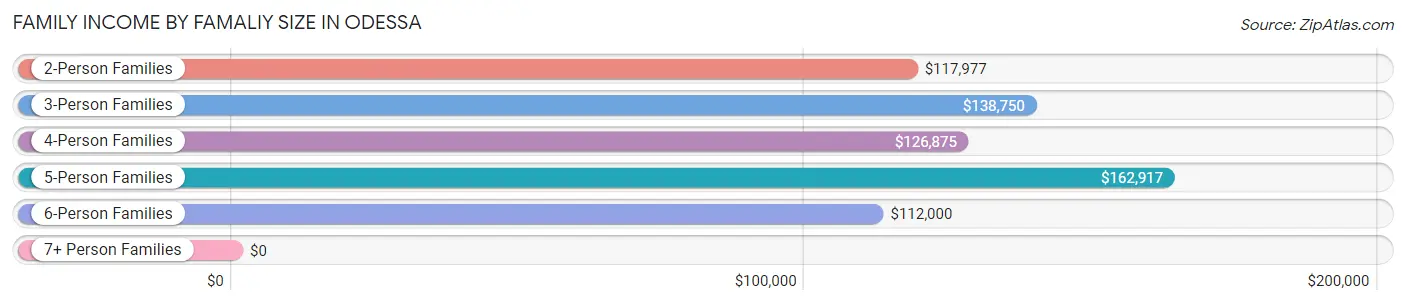
| Income Bracket | # Families | Median Income |
| 2-Person Families | 691 (35.5%) | $117,977 |
| 3-Person Families | 570 (29.3%) | $138,750 |
| 4-Person Families | 444 (22.8%) | $126,875 |
| 5-Person Families | 128 (6.6%) | $162,917 |
| 6-Person Families | 80 (4.1%) | $112,000 |
| 7+ Person Families | 31 (1.6%) | $0 |
| Total | 1,944 (100.0%) | $128,654 |
Family Income by Number of Earners in Odessa
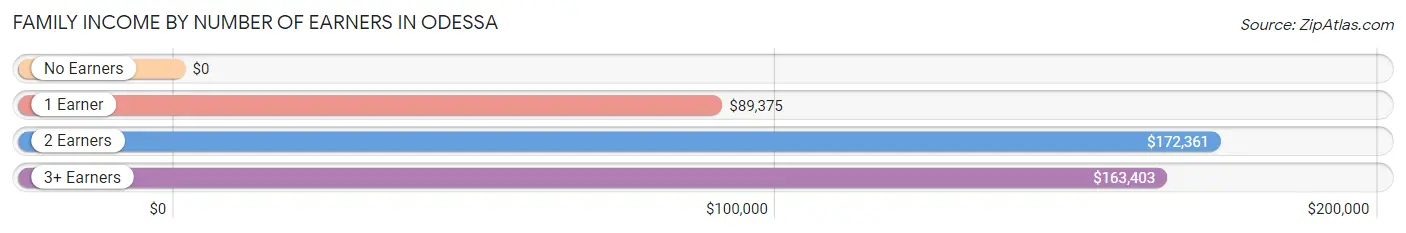
| Number of Earners | # Families | Median Income |
| No Earners | 107 (5.5%) | $0 |
| 1 Earner | 902 (46.4%) | $89,375 |
| 2 Earners | 842 (43.3%) | $172,361 |
| 3+ Earners | 93 (4.8%) | $163,403 |
| Total | 1,944 (100.0%) | $128,654 |
Household Income in Odessa
Household Income Brackets in Odessa
With 635 households falling in the category, the $100,000 to $149,999 income range is the most frequent in Odessa, accounting for 24.2% of all households. In contrast, only 13 households (0.5%) fall into the $15,000 to $24,999 income bracket, making it the least populous group.
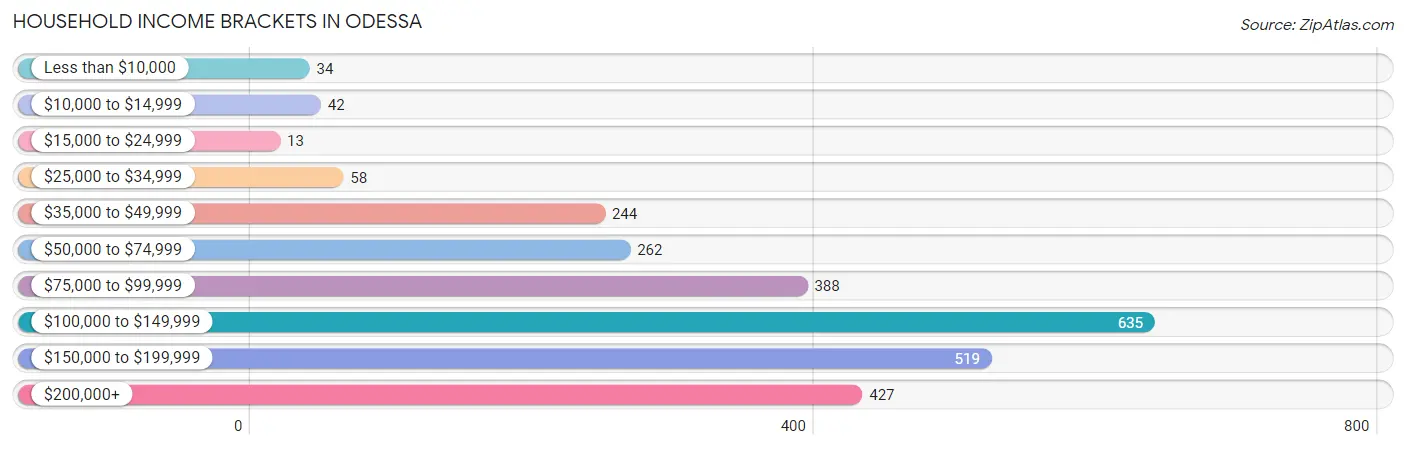
| Income Bracket | # Households | % Households |
| Less than $10,000 | 34 | 1.3% |
| $10,000 to $14,999 | 42 | 1.6% |
| $15,000 to $24,999 | 13 | 0.5% |
| $25,000 to $34,999 | 58 | 2.2% |
| $35,000 to $49,999 | 244 | 9.3% |
| $50,000 to $74,999 | 262 | 10.0% |
| $75,000 to $99,999 | 388 | 14.8% |
| $100,000 to $149,999 | 635 | 24.2% |
| $150,000 to $199,999 | 519 | 19.8% |
| $200,000+ | 427 | 16.3% |
Household Income by Householder Age in Odessa
The median household income in Odessa is $112,258, with the highest median household income of $124,519 found in the 45 to 64 years age bracket for the primary householder. A total of 1,135 households (43.3%) fall into this category. Meanwhile, the 15 to 24 years age bracket for the primary householder has the lowest median household income of $0, with 37 households (1.4%) in this group.
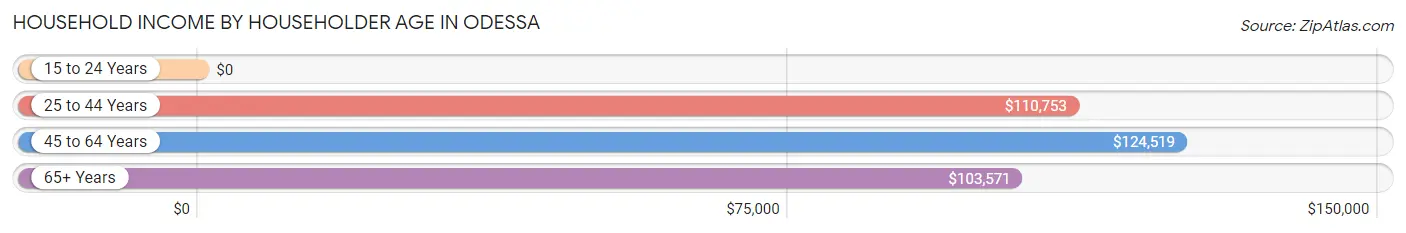
| Income Bracket | # Households | Median Income |
| 15 to 24 Years | 37 (1.4%) | $0 |
| 25 to 44 Years | 1,002 (38.2%) | $110,753 |
| 45 to 64 Years | 1,135 (43.3%) | $124,519 |
| 65+ Years | 448 (17.1%) | $103,571 |
| Total | 2,622 (100.0%) | $112,258 |
Poverty in Odessa
Income Below Poverty by Sex and Age in Odessa
With 3.8% poverty level for males and 5.2% for females among the residents of Odessa, 18 to 24 year old males and 45 to 54 year old females are the most vulnerable to poverty, with 31 males (14.4%) and 71 females (20.2%) in their respective age groups living below the poverty level.
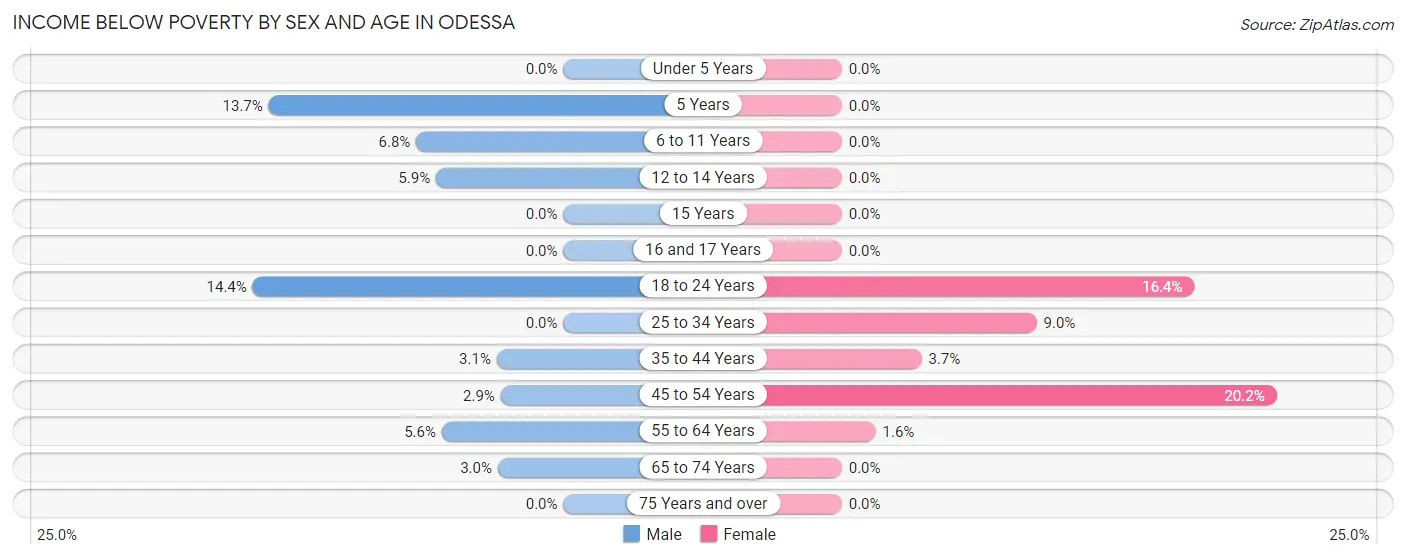
| Age Bracket | Male | Female |
| Under 5 Years | 0 (0.0%) | 0 (0.0%) |
| 5 Years | 13 (13.7%) | 0 (0.0%) |
| 6 to 11 Years | 22 (6.8%) | 0 (0.0%) |
| 12 to 14 Years | 12 (5.9%) | 0 (0.0%) |
| 15 Years | 0 (0.0%) | 0 (0.0%) |
| 16 and 17 Years | 0 (0.0%) | 0 (0.0%) |
| 18 to 24 Years | 31 (14.4%) | 45 (16.4%) |
| 25 to 34 Years | 0 (0.0%) | 46 (9.0%) |
| 35 to 44 Years | 17 (3.1%) | 18 (3.7%) |
| 45 to 54 Years | 15 (2.9%) | 71 (20.2%) |
| 55 to 64 Years | 25 (5.6%) | 10 (1.6%) |
| 65 to 74 Years | 12 (3.0%) | 0 (0.0%) |
| 75 Years and over | 0 (0.0%) | 0 (0.0%) |
| Total | 147 (3.8%) | 190 (5.2%) |
Income Above Poverty by Sex and Age in Odessa
According to the poverty statistics in Odessa, males aged under 5 years and females aged under 5 years are the age groups that are most secure financially, with 100.0% of males and 100.0% of females in these age groups living above the poverty line.
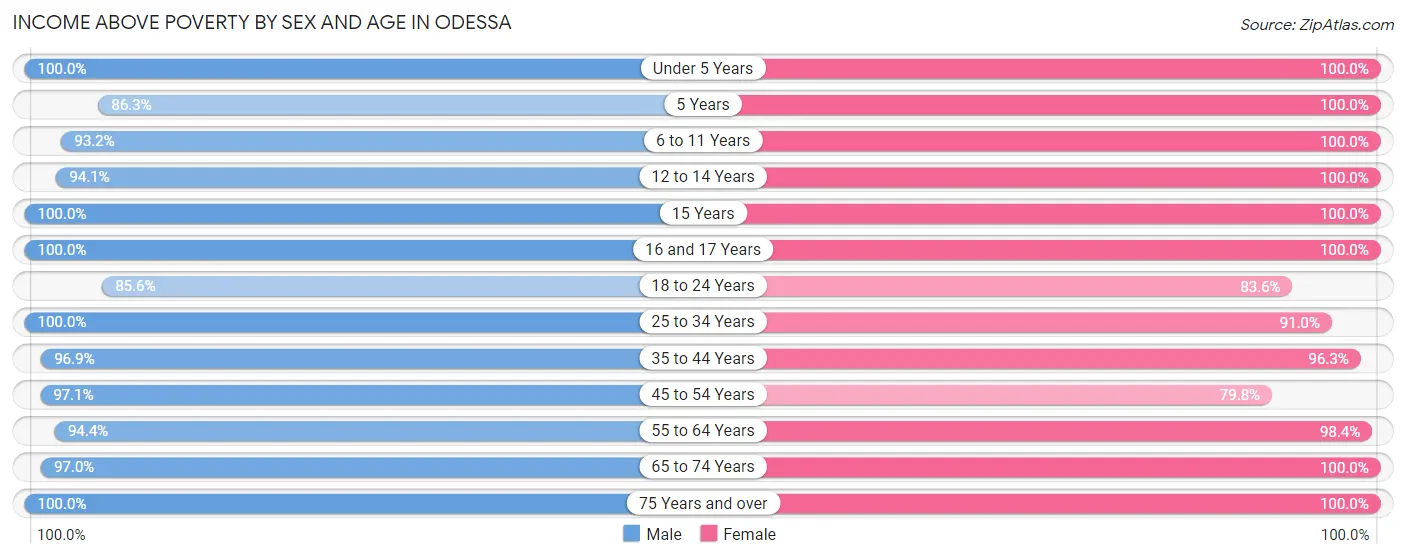
| Age Bracket | Male | Female |
| Under 5 Years | 281 (100.0%) | 223 (100.0%) |
| 5 Years | 82 (86.3%) | 33 (100.0%) |
| 6 to 11 Years | 300 (93.2%) | 284 (100.0%) |
| 12 to 14 Years | 191 (94.1%) | 182 (100.0%) |
| 15 Years | 67 (100.0%) | 53 (100.0%) |
| 16 and 17 Years | 93 (100.0%) | 50 (100.0%) |
| 18 to 24 Years | 184 (85.6%) | 230 (83.6%) |
| 25 to 34 Years | 569 (100.0%) | 463 (91.0%) |
| 35 to 44 Years | 533 (96.9%) | 468 (96.3%) |
| 45 to 54 Years | 500 (97.1%) | 281 (79.8%) |
| 55 to 64 Years | 418 (94.4%) | 626 (98.4%) |
| 65 to 74 Years | 383 (97.0%) | 404 (100.0%) |
| 75 Years and over | 157 (100.0%) | 146 (100.0%) |
| Total | 3,758 (96.2%) | 3,443 (94.8%) |
Income Below Poverty Among Married-Couple Families in Odessa
The poverty statistics for married-couple families in Odessa show that 1.1% or 16 of the total 1,502 families live below the poverty line. Families with no children have the highest poverty rate of 2.2%, comprising of 16 families. On the other hand, families with 1 or 2 children have the lowest poverty rate of 0.0%, which includes 0 families.
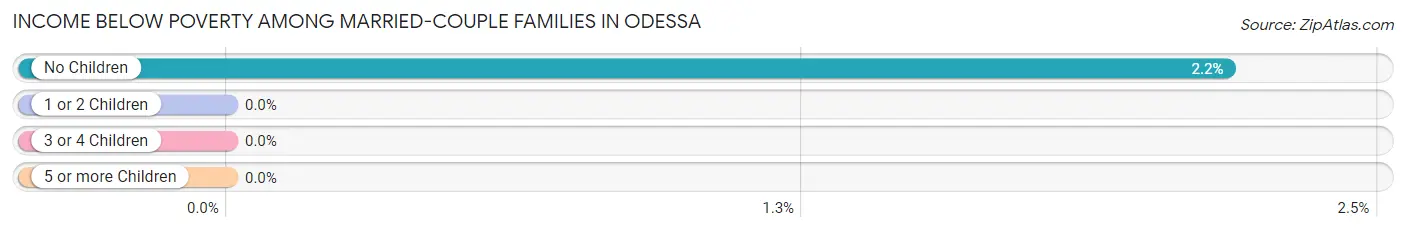
| Children | Above Poverty | Below Poverty |
| No Children | 721 (97.8%) | 16 (2.2%) |
| 1 or 2 Children | 592 (100.0%) | 0 (0.0%) |
| 3 or 4 Children | 142 (100.0%) | 0 (0.0%) |
| 5 or more Children | 31 (100.0%) | 0 (0.0%) |
| Total | 1,486 (98.9%) | 16 (1.1%) |
Income Below Poverty Among Single-Parent Households in Odessa
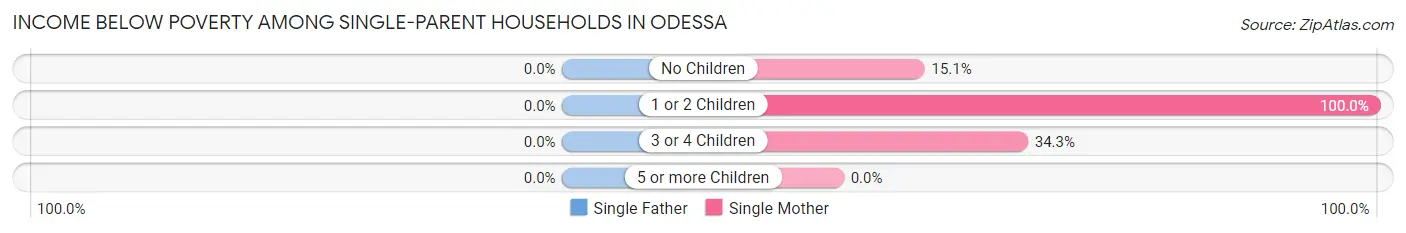
| Children | Single Father | Single Mother |
| No Children | 0 (0.0%) | 25 (15.1%) |
| 1 or 2 Children | 0 (0.0%) | 12 (100.0%) |
| 3 or 4 Children | 0 (0.0%) | 12 (34.3%) |
| 5 or more Children | 0 (0.0%) | 0 (0.0%) |
| Total | 0 (0.0%) | 49 (23.0%) |
Income Below Poverty Among Married-Couple vs Single-Parent Households in Odessa
The poverty data for Odessa shows that 16 of the married-couple family households (1.1%) and 49 of the single-parent households (11.1%) are living below the poverty level. Within the married-couple family households, those with no children have the highest poverty rate, with 16 households (2.2%) falling below the poverty line. Among the single-parent households, those with 3 or 4 children have the highest poverty rate, with 12 household (34.3%) living below poverty.
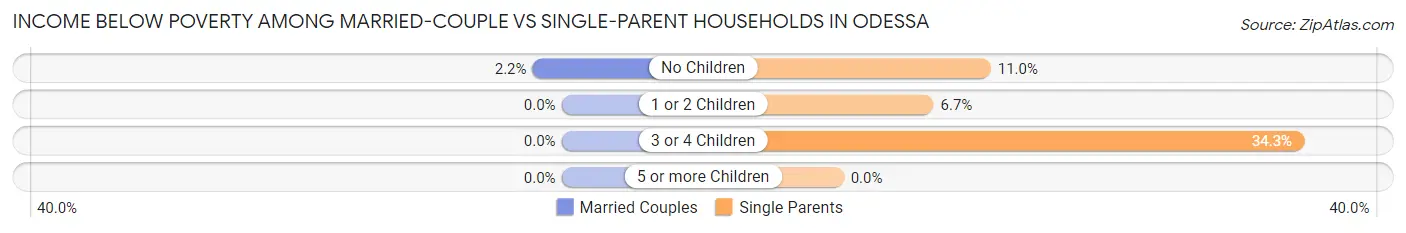
| Children | Married-Couple Families | Single-Parent Households |
| No Children | 16 (2.2%) | 25 (11.0%) |
| 1 or 2 Children | 0 (0.0%) | 12 (6.7%) |
| 3 or 4 Children | 0 (0.0%) | 12 (34.3%) |
| 5 or more Children | 0 (0.0%) | 0 (0.0%) |
| Total | 16 (1.1%) | 49 (11.1%) |
Race in Odessa
The most populous races in Odessa are White / Caucasian (5,302 | 70.3%), Hispanic or Latino (1,766 | 23.4%), and Two or more Races (1,266 | 16.8%).
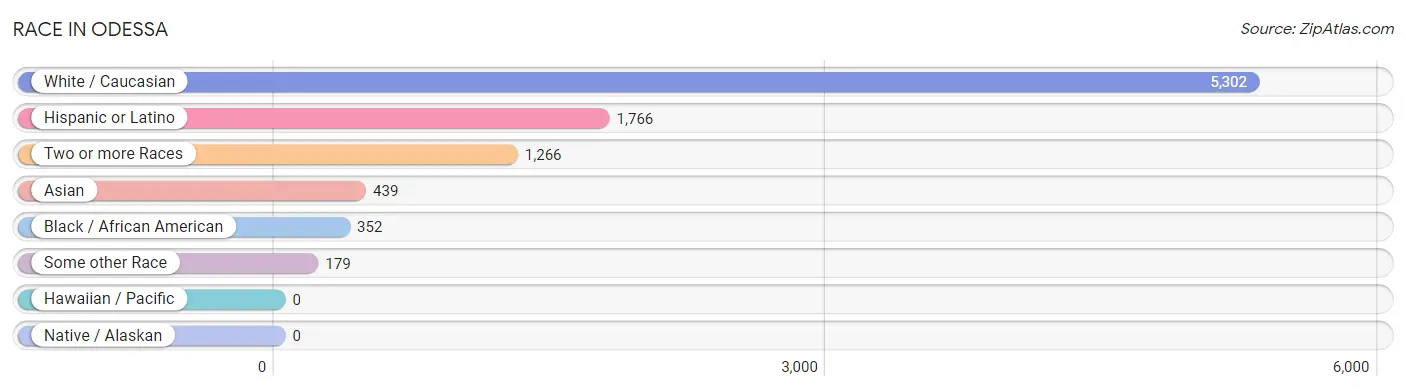
| Race | # Population | % Population |
| Asian | 439 | 5.8% |
| Black / African American | 352 | 4.7% |
| Hawaiian / Pacific | 0 | 0.0% |
| Hispanic or Latino | 1,766 | 23.4% |
| Native / Alaskan | 0 | 0.0% |
| White / Caucasian | 5,302 | 70.3% |
| Two or more Races | 1,266 | 16.8% |
| Some other Race | 179 | 2.4% |
| Total | 7,538 | 100.0% |
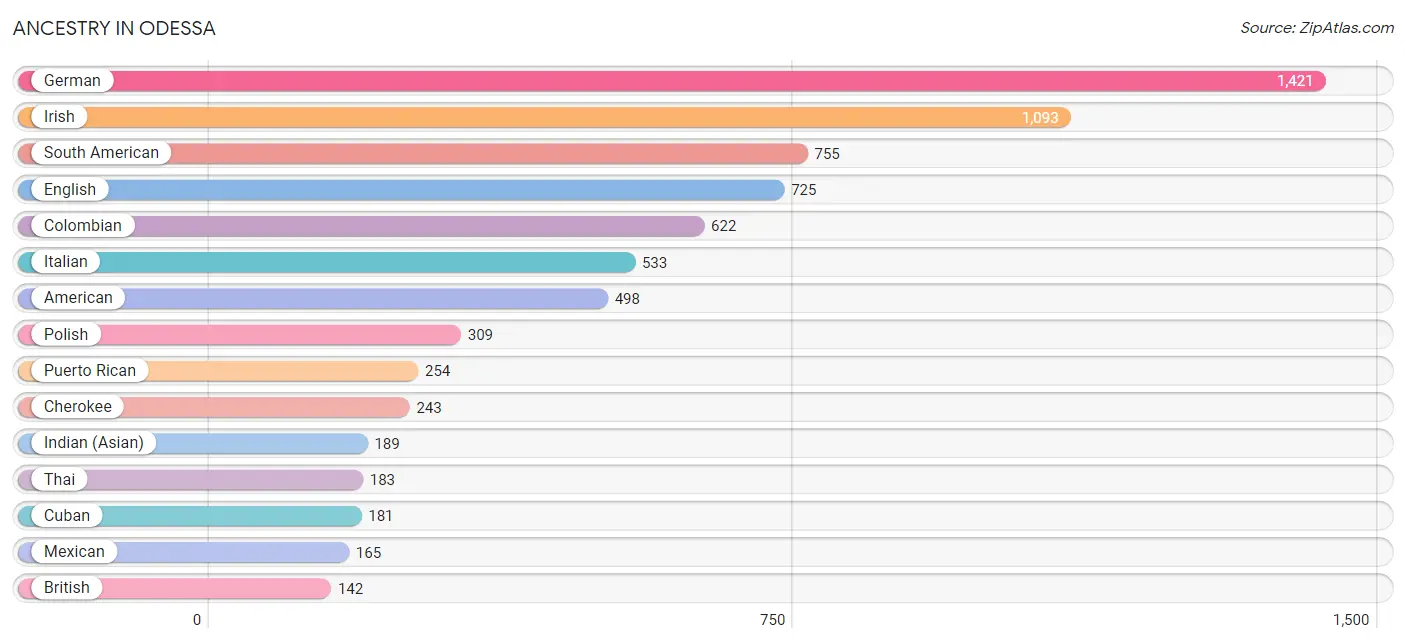
Ancestry in Odessa
The most populous ancestries reported in Odessa are German (1,421 | 18.9%), Irish (1,093 | 14.5%), South American (755 | 10.0%), English (725 | 9.6%), and Colombian (622 | 8.3%), together accounting for 61.2% of all Odessa residents.
| Ancestry | # Population | % Population |
| African | 34 | 0.4% |
| American | 498 | 6.6% |
| Arab | 32 | 0.4% |
| Argentinean | 120 | 1.6% |
| Austrian | 73 | 1.0% |
| Belgian | 10 | 0.1% |
| Bhutanese | 104 | 1.4% |
| Blackfeet | 5 | 0.1% |
| Bolivian | 13 | 0.2% |
| British | 142 | 1.9% |
| Canadian | 19 | 0.3% |
| Central American | 130 | 1.7% |
| Cherokee | 243 | 3.2% |
| Colombian | 622 | 8.3% |
| Creek | 101 | 1.3% |
| Cuban | 181 | 2.4% |
| Dominican | 64 | 0.9% |
| Dutch | 29 | 0.4% |
| Eastern European | 23 | 0.3% |
| English | 725 | 9.6% |
| European | 65 | 0.9% |
| Finnish | 13 | 0.2% |
| French | 88 | 1.2% |
| French Canadian | 59 | 0.8% |
| German | 1,421 | 18.9% |
| Greek | 30 | 0.4% |
| Indian (Asian) | 189 | 2.5% |
| Irish | 1,093 | 14.5% |
| Italian | 533 | 7.1% |
| Jamaican | 134 | 1.8% |
| Korean | 39 | 0.5% |
| Lebanese | 32 | 0.4% |
| Mexican | 165 | 2.2% |
| Nicaraguan | 84 | 1.1% |
| Norwegian | 61 | 0.8% |
| Panamanian | 46 | 0.6% |
| Polish | 309 | 4.1% |
| Portuguese | 26 | 0.3% |
| Puerto Rican | 254 | 3.4% |
| Scandinavian | 53 | 0.7% |
| Scotch-Irish | 15 | 0.2% |
| Scottish | 103 | 1.4% |
| Sioux | 24 | 0.3% |
| Slovak | 77 | 1.0% |
| South American | 755 | 10.0% |
| Spaniard | 46 | 0.6% |
| Spanish | 112 | 1.5% |
| Subsaharan African | 34 | 0.4% |
| Swedish | 45 | 0.6% |
| Swiss | 32 | 0.4% |
| Thai | 183 | 2.4% |
| Ukrainian | 36 | 0.5% |
| Welsh | 54 | 0.7% | View All 53 Rows |
Immigrants in Odessa
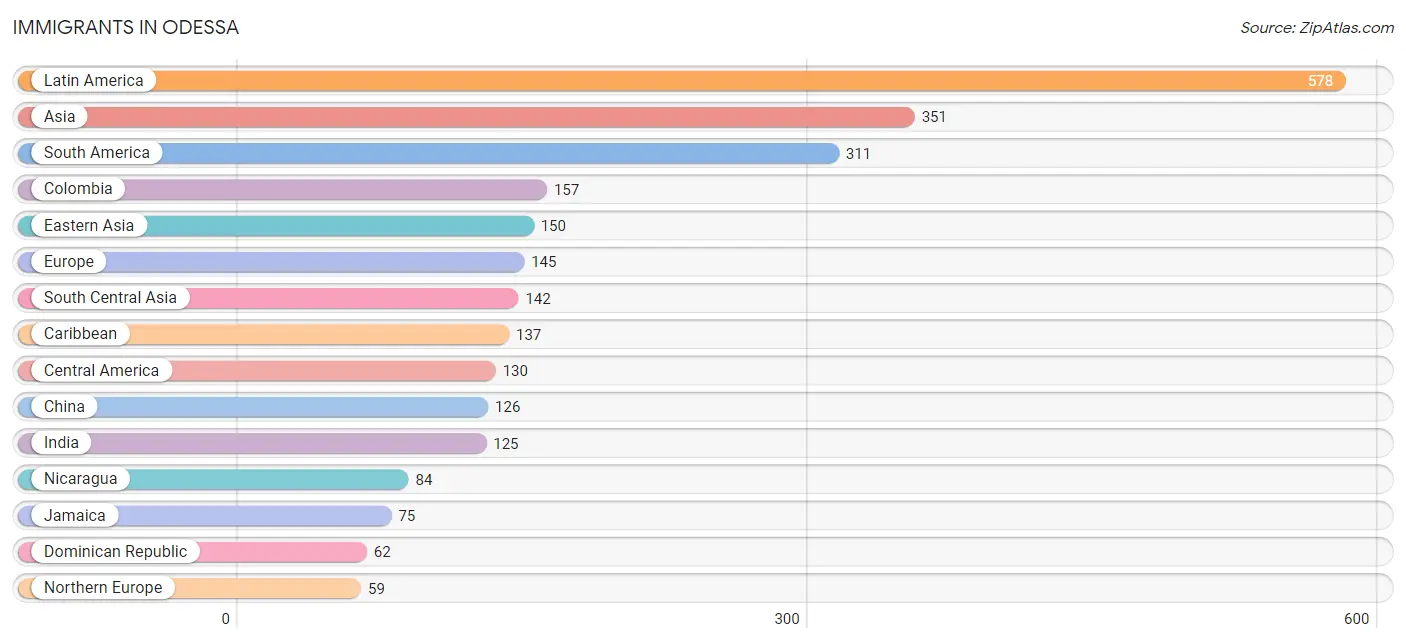
The most numerous immigrant groups reported in Odessa came from Latin America (578 | 7.7%), Asia (351 | 4.7%), South America (311 | 4.1%), Colombia (157 | 2.1%), and Eastern Asia (150 | 2.0%), together accounting for 20.5% of all Odessa residents.
| Immigration Origin | # Population | % Population |
| Africa | 8 | 0.1% |
| Argentina | 23 | 0.3% |
| Asia | 351 | 4.7% |
| Belarus | 30 | 0.4% |
| Bolivia | 13 | 0.2% |
| Brazil | 42 | 0.6% |
| Canada | 32 | 0.4% |
| Caribbean | 137 | 1.8% |
| Central America | 130 | 1.7% |
| China | 126 | 1.7% |
| Colombia | 157 | 2.1% |
| Dominican Republic | 62 | 0.8% |
| Eastern Asia | 150 | 2.0% |
| Eastern Europe | 30 | 0.4% |
| Ecuador | 17 | 0.2% |
| Europe | 145 | 1.9% |
| Germany | 56 | 0.7% |
| India | 125 | 1.7% |
| Jamaica | 75 | 1.0% |
| Korea | 24 | 0.3% |
| Latin America | 578 | 7.7% |
| Nicaragua | 84 | 1.1% |
| Northern Europe | 59 | 0.8% |
| Pakistan | 17 | 0.2% |
| Panama | 46 | 0.6% |
| Philippines | 39 | 0.5% |
| Saudi Arabia | 20 | 0.3% |
| South Africa | 8 | 0.1% |
| South America | 311 | 4.1% |
| South Central Asia | 142 | 1.9% |
| South Eastern Asia | 39 | 0.5% |
| Venezuela | 59 | 0.8% |
| Western Asia | 20 | 0.3% |
| Western Europe | 56 | 0.7% | View All 34 Rows |
Sex and Age in Odessa
Sex and Age in Odessa
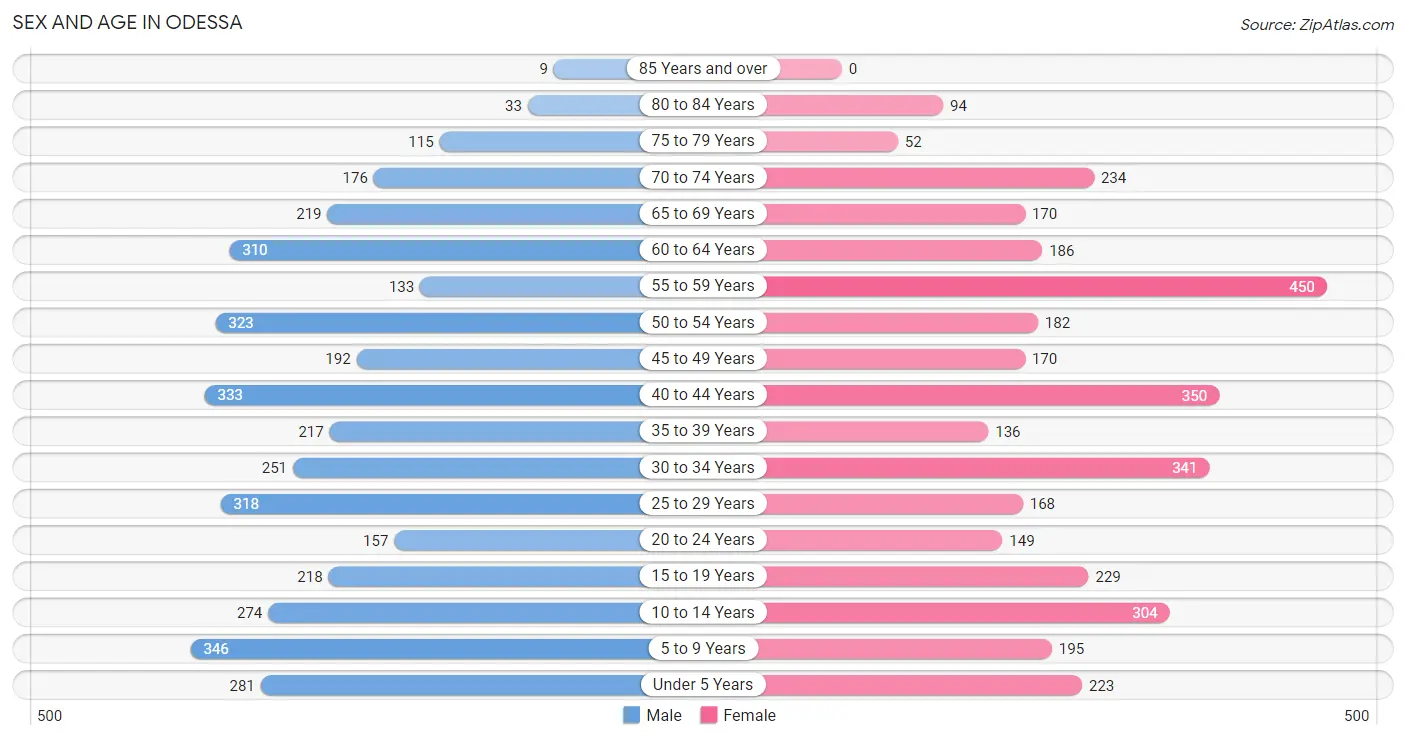
The most populous age groups in Odessa are 5 to 9 Years (346 | 8.9%) for men and 55 to 59 Years (450 | 12.4%) for women.
| Age Bracket | Male | Female |
| Under 5 Years | 281 (7.2%) | 223 (6.1%) |
| 5 to 9 Years | 346 (8.9%) | 195 (5.4%) |
| 10 to 14 Years | 274 (7.0%) | 304 (8.4%) |
| 15 to 19 Years | 218 (5.6%) | 229 (6.3%) |
| 20 to 24 Years | 157 (4.0%) | 149 (4.1%) |
| 25 to 29 Years | 318 (8.1%) | 168 (4.6%) |
| 30 to 34 Years | 251 (6.4%) | 341 (9.4%) |
| 35 to 39 Years | 217 (5.6%) | 136 (3.7%) |
| 40 to 44 Years | 333 (8.5%) | 350 (9.6%) |
| 45 to 49 Years | 192 (4.9%) | 170 (4.7%) |
| 50 to 54 Years | 323 (8.3%) | 182 (5.0%) |
| 55 to 59 Years | 133 (3.4%) | 450 (12.4%) |
| 60 to 64 Years | 310 (7.9%) | 186 (5.1%) |
| 65 to 69 Years | 219 (5.6%) | 170 (4.7%) |
| 70 to 74 Years | 176 (4.5%) | 234 (6.4%) |
| 75 to 79 Years | 115 (2.9%) | 52 (1.4%) |
| 80 to 84 Years | 33 (0.9%) | 94 (2.6%) |
| 85 Years and over | 9 (0.2%) | 0 (0.0%) |
| Total | 3,905 (100.0%) | 3,633 (100.0%) |
Families and Households in Odessa
Median Family Size in Odessa
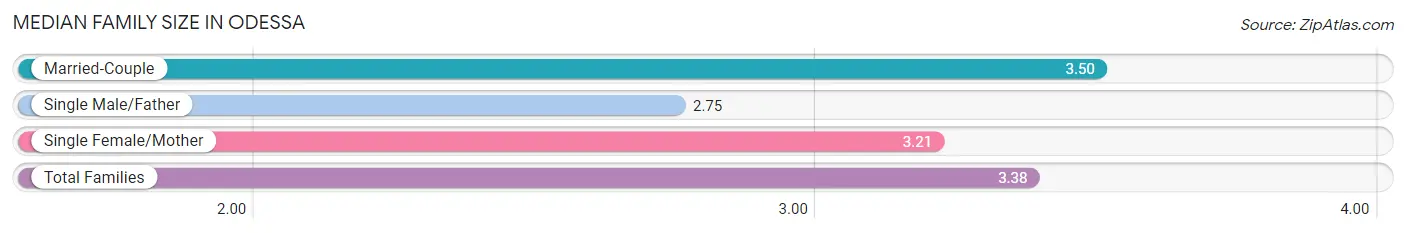
The median family size in Odessa is 3.38 persons per family, with married-couple families (1,502 | 77.3%) accounting for the largest median family size of 3.5 persons per family. On the other hand, single male/father families (229 | 11.8%) represent the smallest median family size with 2.75 persons per family.
| Family Type | # Families | Family Size |
| Married-Couple | 1,502 (77.3%) | 3.50 |
| Single Male/Father | 229 (11.8%) | 2.75 |
| Single Female/Mother | 213 (11.0%) | 3.21 |
| Total Families | 1,944 (100.0%) | 3.38 |
Median Household Size in Odessa
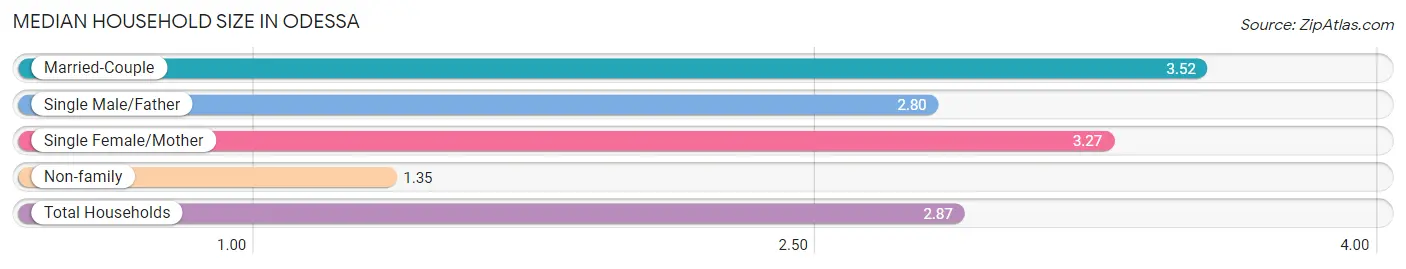
The median household size in Odessa is 2.87 persons per household, with married-couple households (1,502 | 57.3%) accounting for the largest median household size of 3.52 persons per household. non-family households (678 | 25.9%) represent the smallest median household size with 1.35 persons per household.
| Household Type | # Households | Household Size |
| Married-Couple | 1,502 (57.3%) | 3.52 |
| Single Male/Father | 229 (8.7%) | 2.80 |
| Single Female/Mother | 213 (8.1%) | 3.27 |
| Non-family | 678 (25.9%) | 1.35 |
| Total Households | 2,622 (100.0%) | 2.87 |
Household Size by Marriage Status in Odessa
Out of a total of 2,622 households in Odessa, 1,944 (74.1%) are family households, while 678 (25.9%) are nonfamily households. The most numerous type of family households are 2-person households, comprising 667, and the most common type of nonfamily households are 1-person households, comprising 453.
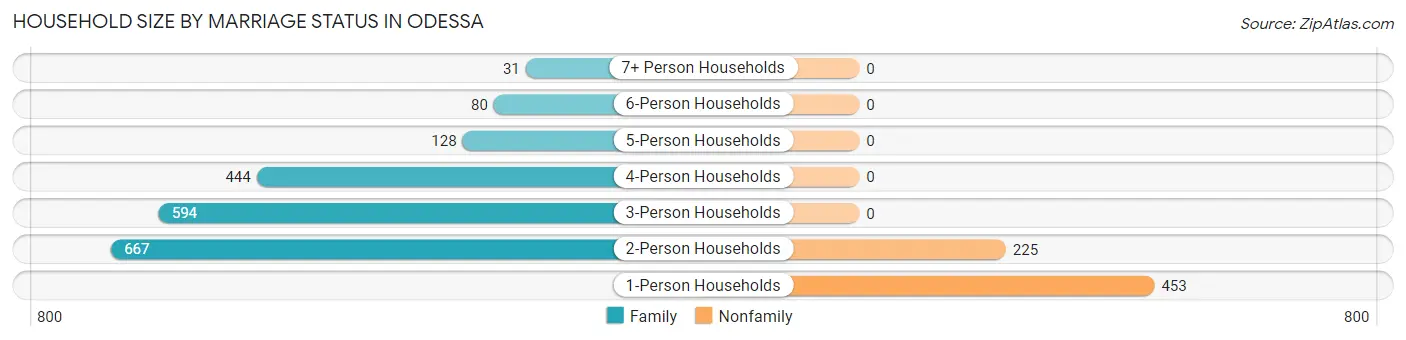
| Household Size | Family Households | Nonfamily Households |
| 1-Person Households | - | 453 (17.3%) |
| 2-Person Households | 667 (25.4%) | 225 (8.6%) |
| 3-Person Households | 594 (22.7%) | 0 (0.0%) |
| 4-Person Households | 444 (16.9%) | 0 (0.0%) |
| 5-Person Households | 128 (4.9%) | 0 (0.0%) |
| 6-Person Households | 80 (3.0%) | 0 (0.0%) |
| 7+ Person Households | 31 (1.2%) | 0 (0.0%) |
| Total | 1,944 (74.1%) | 678 (25.9%) |
Female Fertility in Odessa
Fertility by Age in Odessa
Average fertility rate in Odessa is 65.0 births per 1,000 women. Women in the age bracket of 20 to 34 years have the highest fertility rate with 116.0 births per 1,000 women. Women in the age bracket of 20 to 34 years acount for 72.4% of all women with births.
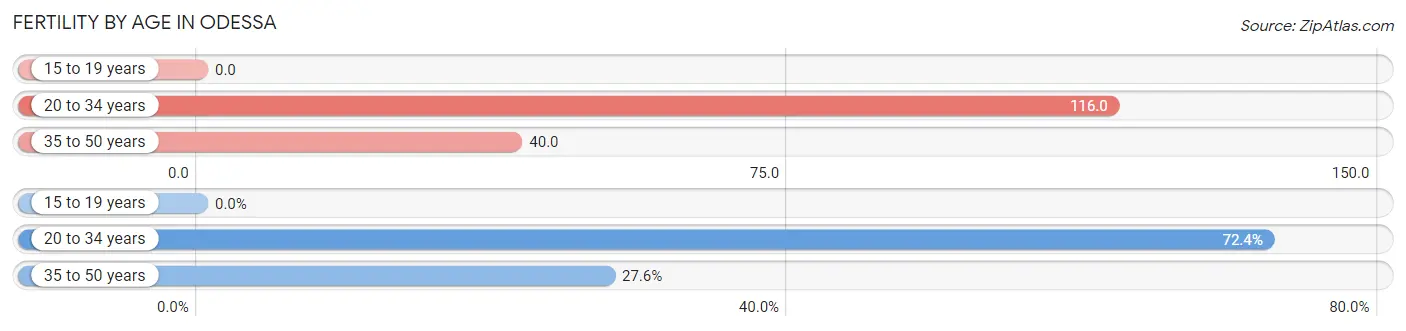
| Age Bracket | Women with Births | Births / 1,000 Women |
| 15 to 19 years | 0 (0.0%) | 0.0 |
| 20 to 34 years | 76 (72.4%) | 116.0 |
| 35 to 50 years | 29 (27.6%) | 40.0 |
| Total | 105 (100.0%) | 65.0 |
Fertility by Age by Marriage Status in Odessa
43.8% of women with births (105) in Odessa are married. The highest percentage of unmarried women with births falls into 20 to 34 years age bracket with 77.6% of them unmarried at the time of birth, while the lowest percentage of unmarried women with births belong to 35 to 50 years age bracket with 0.0% of them unmarried.
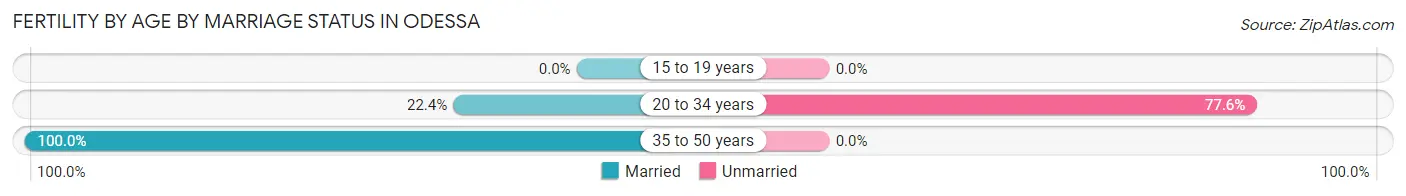
| Age Bracket | Married | Unmarried |
| 15 to 19 years | 0 (0.0%) | 0 (0.0%) |
| 20 to 34 years | 17 (22.4%) | 59 (77.6%) |
| 35 to 50 years | 29 (100.0%) | 0 (0.0%) |
| Total | 46 (43.8%) | 59 (56.2%) |
Fertility by Education in Odessa
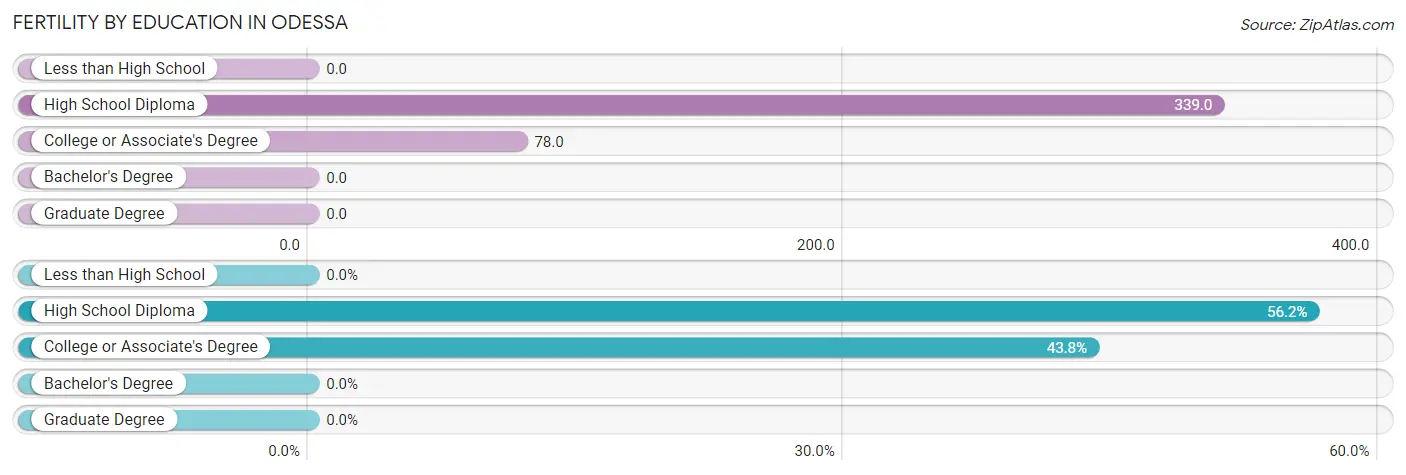
| Educational Attainment | Women with Births | Births / 1,000 Women |
| Less than High School | 0 (0.0%) | 0.0 |
| High School Diploma | 59 (56.2%) | 339.0 |
| College or Associate's Degree | 46 (43.8%) | 78.0 |
| Bachelor's Degree | 0 (0.0%) | 0.0 |
| Graduate Degree | 0 (0.0%) | 0.0 |
| Total | 105 (100.0%) | 65.0 |
Fertility by Education by Marriage Status in Odessa
56.2% of women with births in Odessa are unmarried. Women with the educational attainment of college or associate's degree are most likely to be married with 100.0% of them married at childbirth, while women with the educational attainment of high school diploma are least likely to be married with 100.0% of them unmarried at childbirth.
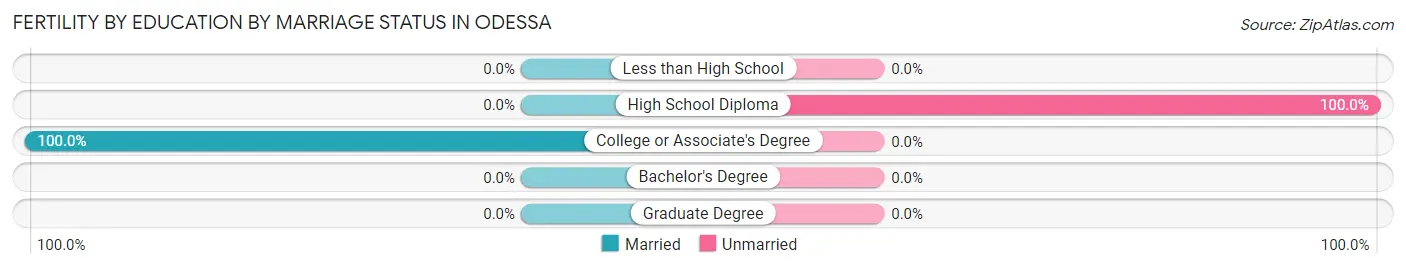
| Educational Attainment | Married | Unmarried |
| Less than High School | 0 (0.0%) | 0 (0.0%) |
| High School Diploma | 0 (0.0%) | 59 (100.0%) |
| College or Associate's Degree | 46 (100.0%) | 0 (0.0%) |
| Bachelor's Degree | 0 (0.0%) | 0 (0.0%) |
| Graduate Degree | 0 (0.0%) | 0 (0.0%) |
| Total | 46 (43.8%) | 59 (56.2%) |
Employment Characteristics in Odessa
Employment by Class of Employer in Odessa
Among the 3,615 employed individuals in Odessa, private company employees (2,452 | 67.8%), self-employed (not incorporated) (405 | 11.2%), and not-for-profit organizations (275 | 7.6%) make up the most common classes of employment.
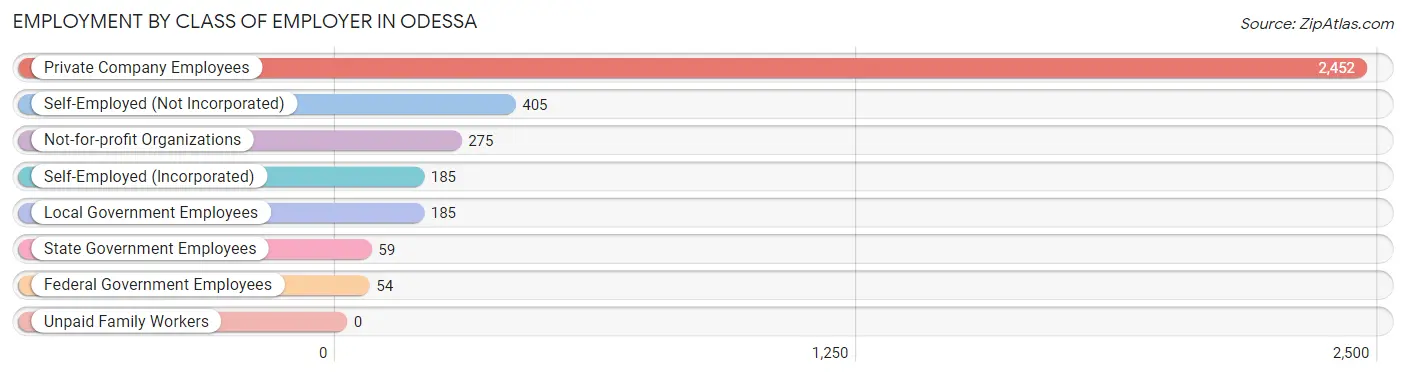
| Employer Class | # Employees | % Employees |
| Private Company Employees | 2,452 | 67.8% |
| Self-Employed (Incorporated) | 185 | 5.1% |
| Self-Employed (Not Incorporated) | 405 | 11.2% |
| Not-for-profit Organizations | 275 | 7.6% |
| Local Government Employees | 185 | 5.1% |
| State Government Employees | 59 | 1.6% |
| Federal Government Employees | 54 | 1.5% |
| Unpaid Family Workers | 0 | 0.0% |
| Total | 3,615 | 100.0% |
Employment Status by Age in Odessa
According to the labor force statistics for Odessa, out of the total population over 16 years of age (5,795), 65.8% or 3,813 individuals are in the labor force, with 2.6% or 99 of them unemployed. The age group with the highest labor force participation rate is 25 to 29 years, with 89.3% or 434 individuals in the labor force. Within the labor force, the 20 to 24 years age range has the highest percentage of unemployed individuals, with 9.7% or 20 of them being unemployed.
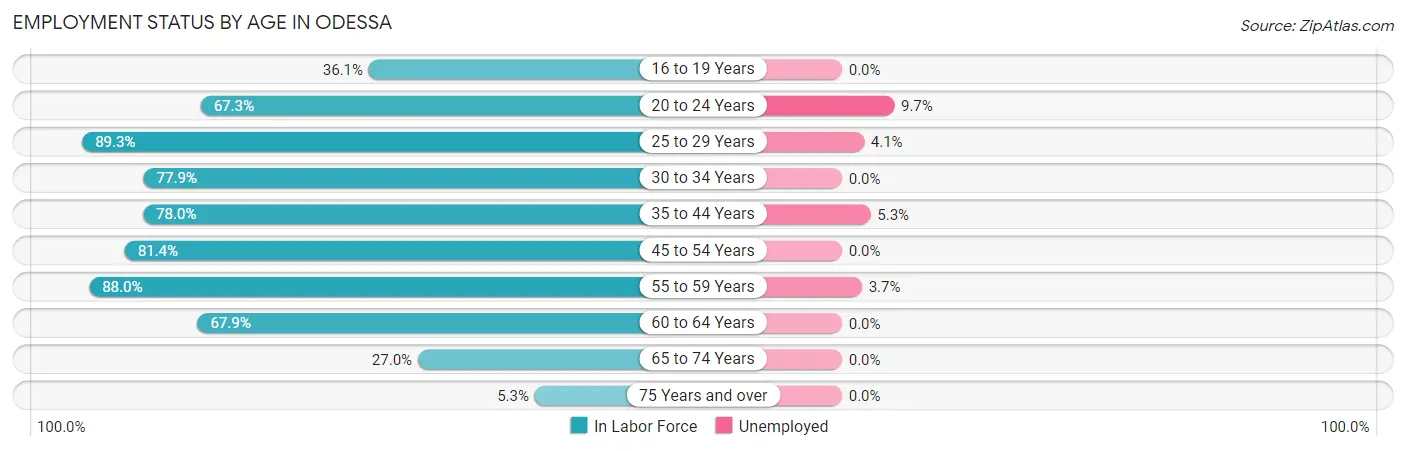
| Age Bracket | In Labor Force | Unemployed |
| 16 to 19 Years | 118 (36.1%) | 0 (0.0%) |
| 20 to 24 Years | 206 (67.3%) | 20 (9.7%) |
| 25 to 29 Years | 434 (89.3%) | 18 (4.1%) |
| 30 to 34 Years | 461 (77.9%) | 0 (0.0%) |
| 35 to 44 Years | 808 (78.0%) | 43 (5.3%) |
| 45 to 54 Years | 706 (81.4%) | 0 (0.0%) |
| 55 to 59 Years | 513 (88.0%) | 19 (3.7%) |
| 60 to 64 Years | 337 (67.9%) | 0 (0.0%) |
| 65 to 74 Years | 216 (27.0%) | 0 (0.0%) |
| 75 Years and over | 16 (5.3%) | 0 (0.0%) |
| Total | 3,813 (65.8%) | 99 (2.6%) |
Employment Status by Educational Attainment in Odessa
According to labor force statistics for Odessa, 80.3% of individuals (3,260) out of the total population between 25 and 64 years of age (4,060) are in the labor force, with 2.5% or 82 of them being unemployed. The group with the highest labor force participation rate are those with the educational attainment of high school diploma, with 84.1% or 634 individuals in the labor force. Within the labor force, individuals with high school diploma education have the highest percentage of unemployment, with 9.6% or 61 of them being unemployed.
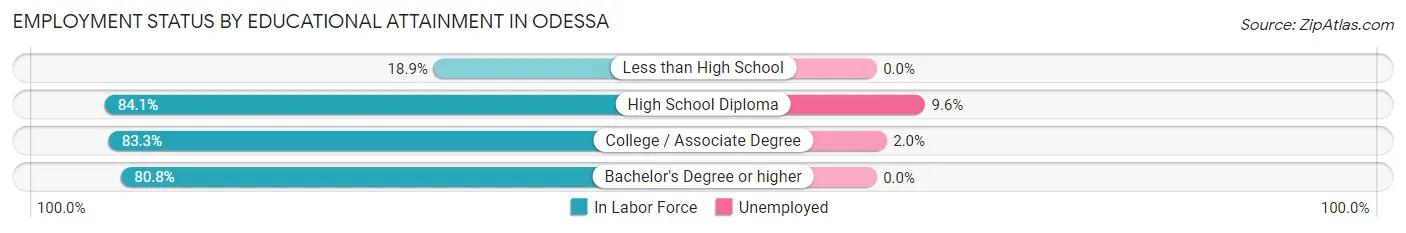
| Educational Attainment | In Labor Force | Unemployed |
| Less than High School | 23 (18.9%) | 0 (0.0%) |
| High School Diploma | 634 (84.1%) | 72 (9.6%) |
| College / Associate Degree | 955 (83.3%) | 23 (2.0%) |
| Bachelor's Degree or higher | 1,646 (80.8%) | 0 (0.0%) |
| Total | 3,260 (80.3%) | 102 (2.5%) |
Employment Occupations by Sex in Odessa
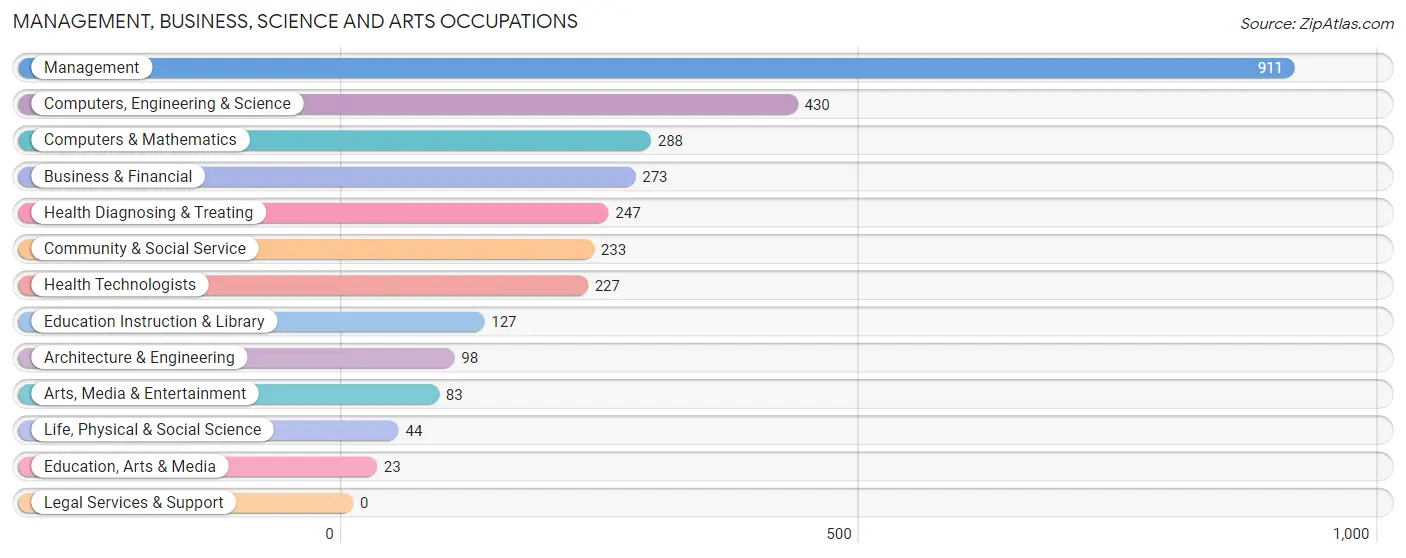
Management, Business, Science and Arts Occupations
The most common Management, Business, Science and Arts occupations in Odessa are Management (911 | 24.5%), Computers, Engineering & Science (430 | 11.6%), Computers & Mathematics (288 | 7.7%), Business & Financial (273 | 7.3%), and Health Diagnosing & Treating (247 | 6.7%).
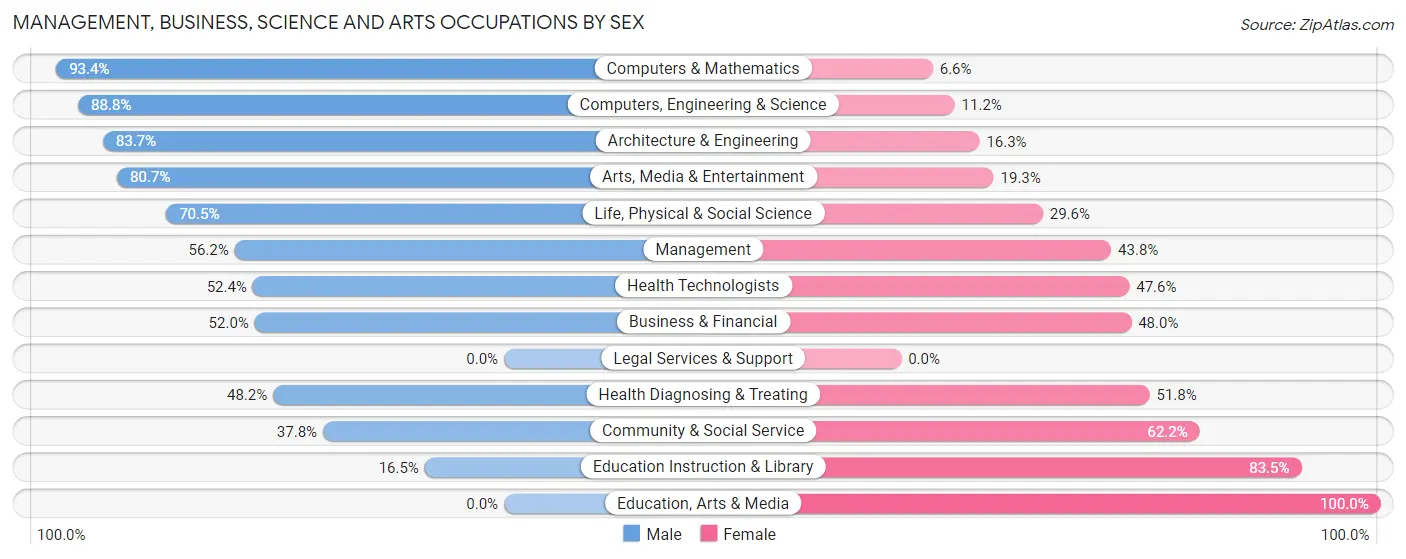
Management, Business, Science and Arts Occupations by Sex
Within the Management, Business, Science and Arts occupations in Odessa, the most male-oriented occupations are Computers & Mathematics (93.4%), Computers, Engineering & Science (88.8%), and Architecture & Engineering (83.7%), while the most female-oriented occupations are Education, Arts & Media (100.0%), Education Instruction & Library (83.5%), and Community & Social Service (62.2%).
| Occupation | Male | Female |
| Management | 512 (56.2%) | 399 (43.8%) |
| Business & Financial | 142 (52.0%) | 131 (48.0%) |
| Computers, Engineering & Science | 382 (88.8%) | 48 (11.2%) |
| Computers & Mathematics | 269 (93.4%) | 19 (6.6%) |
| Architecture & Engineering | 82 (83.7%) | 16 (16.3%) |
| Life, Physical & Social Science | 31 (70.5%) | 13 (29.5%) |
| Community & Social Service | 88 (37.8%) | 145 (62.2%) |
| Education, Arts & Media | 0 (0.0%) | 23 (100.0%) |
| Legal Services & Support | 0 (0.0%) | 0 (0.0%) |
| Education Instruction & Library | 21 (16.5%) | 106 (83.5%) |
| Arts, Media & Entertainment | 67 (80.7%) | 16 (19.3%) |
| Health Diagnosing & Treating | 119 (48.2%) | 128 (51.8%) |
| Health Technologists | 119 (52.4%) | 108 (47.6%) |
| Total (Category) | 1,243 (59.4%) | 851 (40.6%) |
| Total (Overall) | 2,023 (54.4%) | 1,692 (45.6%) |
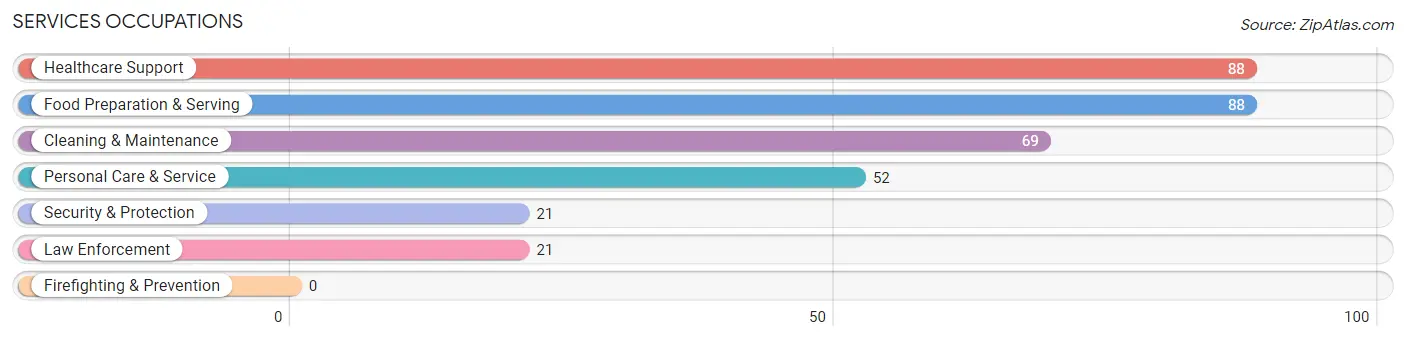
Services Occupations
The most common Services occupations in Odessa are Healthcare Support (88 | 2.4%), Food Preparation & Serving (88 | 2.4%), Cleaning & Maintenance (69 | 1.9%), Personal Care & Service (52 | 1.4%), and Security & Protection (21 | 0.6%).
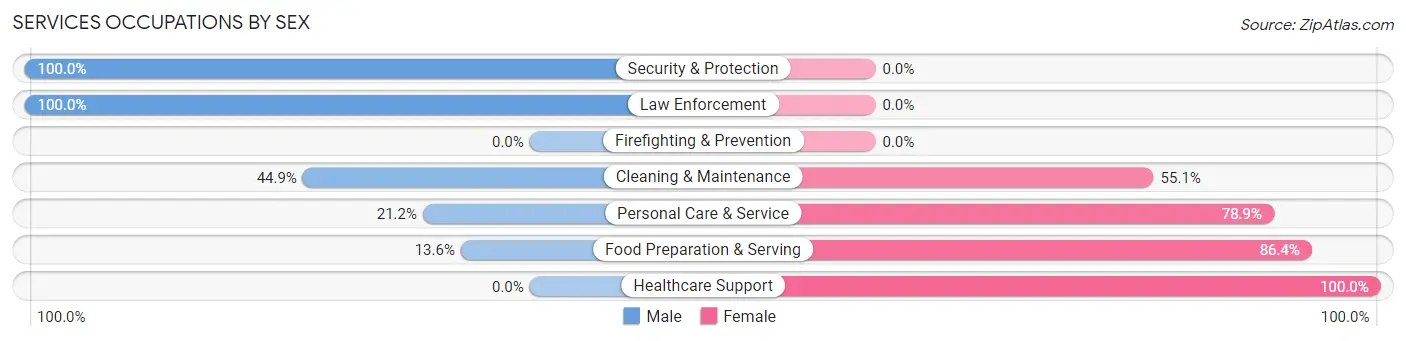
Services Occupations by Sex
Within the Services occupations in Odessa, the most male-oriented occupations are Security & Protection (100.0%), Law Enforcement (100.0%), and Cleaning & Maintenance (44.9%), while the most female-oriented occupations are Healthcare Support (100.0%), Food Preparation & Serving (86.4%), and Personal Care & Service (78.8%).
| Occupation | Male | Female |
| Healthcare Support | 0 (0.0%) | 88 (100.0%) |
| Security & Protection | 21 (100.0%) | 0 (0.0%) |
| Firefighting & Prevention | 0 (0.0%) | 0 (0.0%) |
| Law Enforcement | 21 (100.0%) | 0 (0.0%) |
| Food Preparation & Serving | 12 (13.6%) | 76 (86.4%) |
| Cleaning & Maintenance | 31 (44.9%) | 38 (55.1%) |
| Personal Care & Service | 11 (21.1%) | 41 (78.8%) |
| Total (Category) | 75 (23.6%) | 243 (76.4%) |
| Total (Overall) | 2,023 (54.4%) | 1,692 (45.6%) |
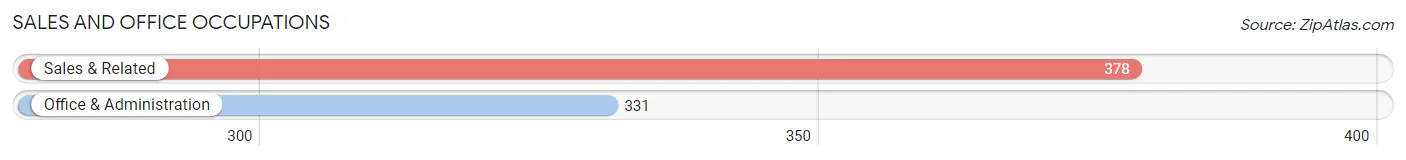
Sales and Office Occupations
The most common Sales and Office occupations in Odessa are Sales & Related (378 | 10.2%), and Office & Administration (331 | 8.9%).
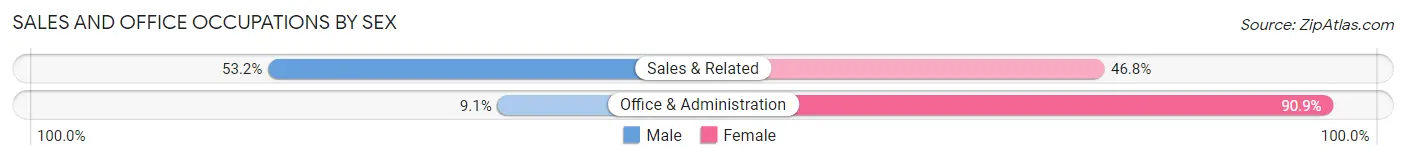
Sales and Office Occupations by Sex
| Occupation | Male | Female |
| Sales & Related | 201 (53.2%) | 177 (46.8%) |
| Office & Administration | 30 (9.1%) | 301 (90.9%) |
| Total (Category) | 231 (32.6%) | 478 (67.4%) |
| Total (Overall) | 2,023 (54.4%) | 1,692 (45.6%) |
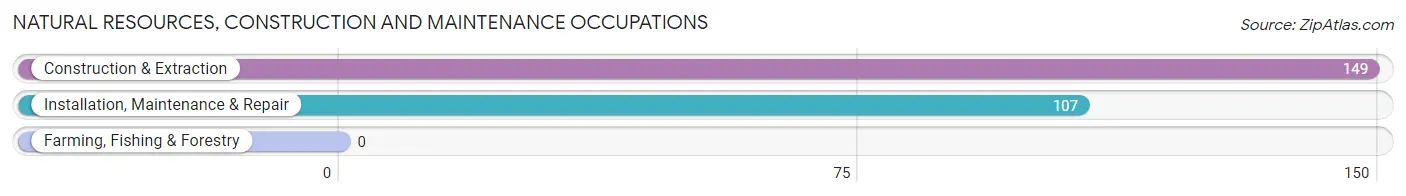
Natural Resources, Construction and Maintenance Occupations
The most common Natural Resources, Construction and Maintenance occupations in Odessa are Construction & Extraction (149 | 4.0%), and Installation, Maintenance & Repair (107 | 2.9%).
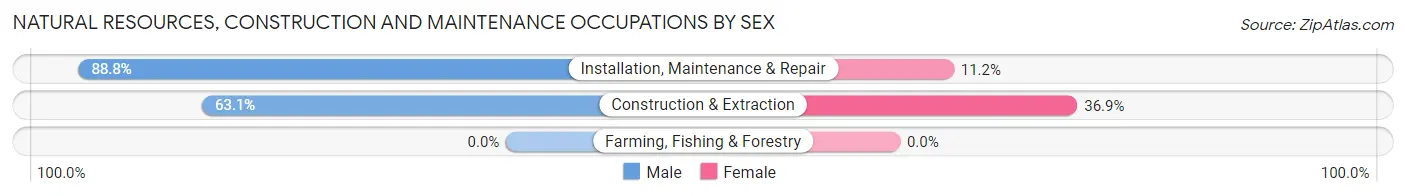
Natural Resources, Construction and Maintenance Occupations by Sex
| Occupation | Male | Female |
| Farming, Fishing & Forestry | 0 (0.0%) | 0 (0.0%) |
| Construction & Extraction | 94 (63.1%) | 55 (36.9%) |
| Installation, Maintenance & Repair | 95 (88.8%) | 12 (11.2%) |
| Total (Category) | 189 (73.8%) | 67 (26.2%) |
| Total (Overall) | 2,023 (54.4%) | 1,692 (45.6%) |
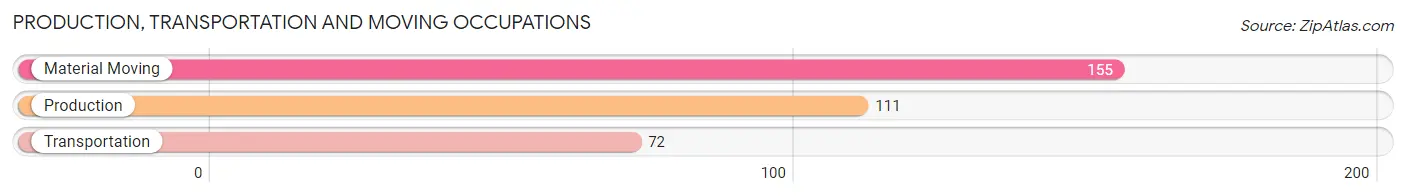
Production, Transportation and Moving Occupations
The most common Production, Transportation and Moving occupations in Odessa are Material Moving (155 | 4.2%), Production (111 | 3.0%), and Transportation (72 | 1.9%).
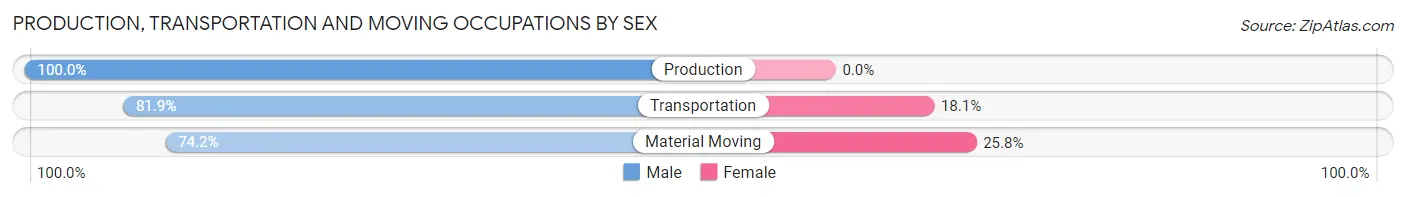
Production, Transportation and Moving Occupations by Sex
| Occupation | Male | Female |
| Production | 111 (100.0%) | 0 (0.0%) |
| Transportation | 59 (81.9%) | 13 (18.1%) |
| Material Moving | 115 (74.2%) | 40 (25.8%) |
| Total (Category) | 285 (84.3%) | 53 (15.7%) |
| Total (Overall) | 2,023 (54.4%) | 1,692 (45.6%) |
Employment Industries by Sex in Odessa
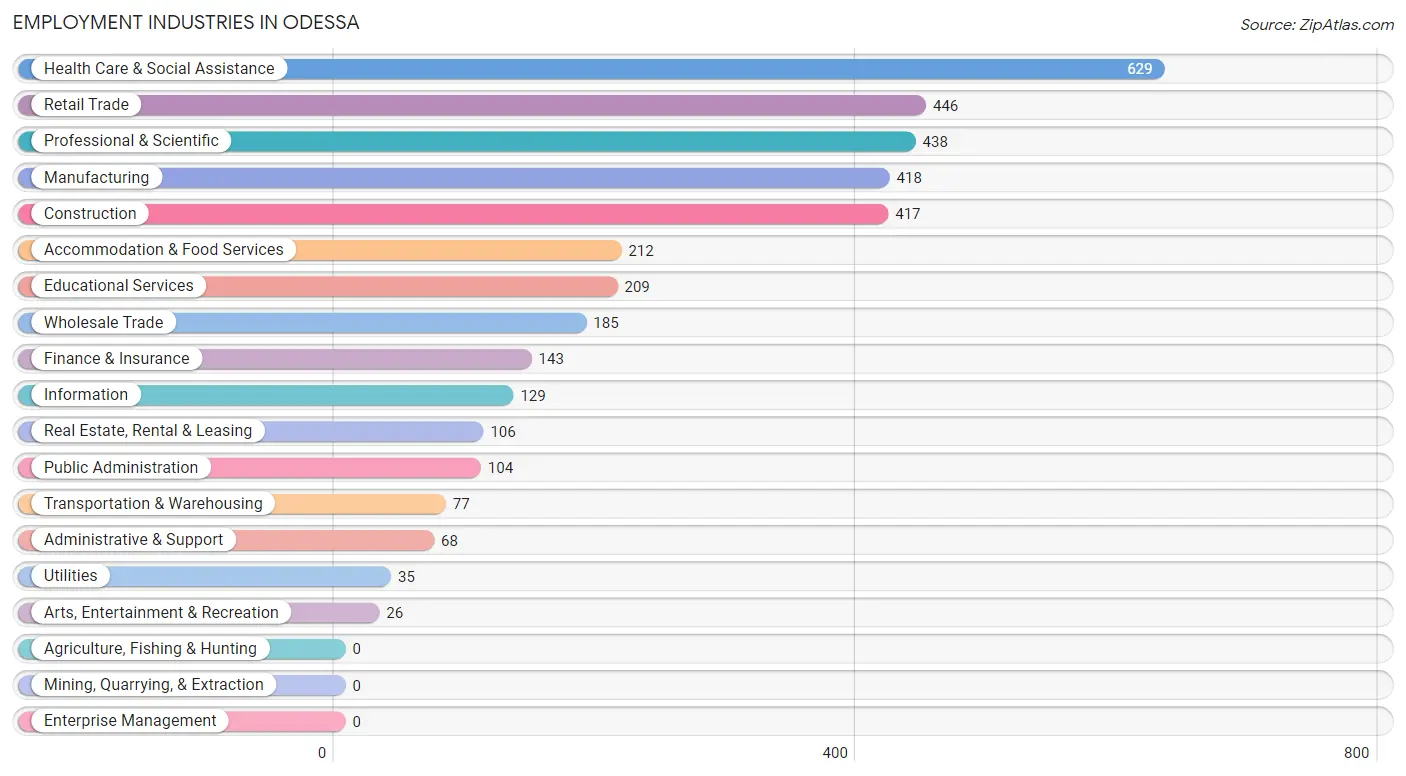
Employment Industries in Odessa
The major employment industries in Odessa include Health Care & Social Assistance (629 | 16.9%), Retail Trade (446 | 12.0%), Professional & Scientific (438 | 11.8%), Manufacturing (418 | 11.3%), and Construction (417 | 11.2%).
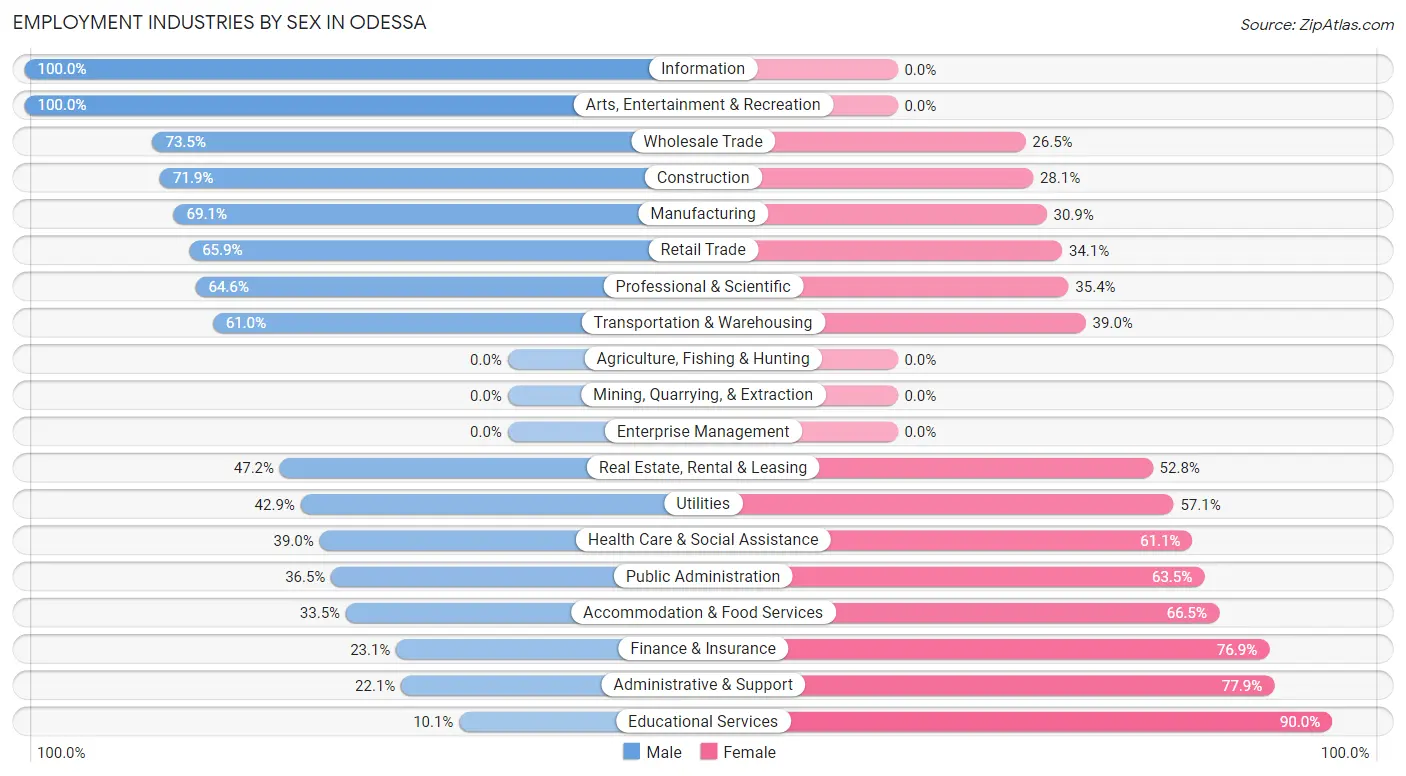
Employment Industries by Sex in Odessa
The Odessa industries that see more men than women are Information (100.0%), Arts, Entertainment & Recreation (100.0%), and Wholesale Trade (73.5%), whereas the industries that tend to have a higher number of women are Educational Services (89.9%), Administrative & Support (77.9%), and Finance & Insurance (76.9%).
| Industry | Male | Female |
| Agriculture, Fishing & Hunting | 0 (0.0%) | 0 (0.0%) |
| Mining, Quarrying, & Extraction | 0 (0.0%) | 0 (0.0%) |
| Construction | 300 (71.9%) | 117 (28.1%) |
| Manufacturing | 289 (69.1%) | 129 (30.9%) |
| Wholesale Trade | 136 (73.5%) | 49 (26.5%) |
| Retail Trade | 294 (65.9%) | 152 (34.1%) |
| Transportation & Warehousing | 47 (61.0%) | 30 (39.0%) |
| Utilities | 15 (42.9%) | 20 (57.1%) |
| Information | 129 (100.0%) | 0 (0.0%) |
| Finance & Insurance | 33 (23.1%) | 110 (76.9%) |
| Real Estate, Rental & Leasing | 50 (47.2%) | 56 (52.8%) |
| Professional & Scientific | 283 (64.6%) | 155 (35.4%) |
| Enterprise Management | 0 (0.0%) | 0 (0.0%) |
| Administrative & Support | 15 (22.1%) | 53 (77.9%) |
| Educational Services | 21 (10.1%) | 188 (89.9%) |
| Health Care & Social Assistance | 245 (39.0%) | 384 (61.1%) |
| Arts, Entertainment & Recreation | 26 (100.0%) | 0 (0.0%) |
| Accommodation & Food Services | 71 (33.5%) | 141 (66.5%) |
| Public Administration | 38 (36.5%) | 66 (63.5%) |
| Total | 2,023 (54.4%) | 1,692 (45.6%) |
Education in Odessa
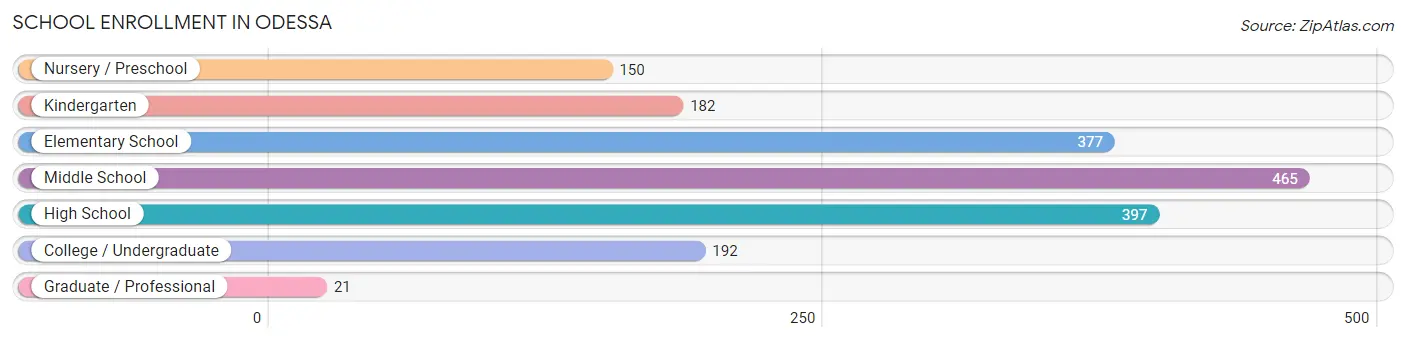
School Enrollment in Odessa
The most common levels of schooling among the 1,784 students in Odessa are middle school (465 | 26.1%), high school (397 | 22.3%), and elementary school (377 | 21.1%).
| School Level | # Students | % Students |
| Nursery / Preschool | 150 | 8.4% |
| Kindergarten | 182 | 10.2% |
| Elementary School | 377 | 21.1% |
| Middle School | 465 | 26.1% |
| High School | 397 | 22.3% |
| College / Undergraduate | 192 | 10.8% |
| Graduate / Professional | 21 | 1.2% |
| Total | 1,784 | 100.0% |
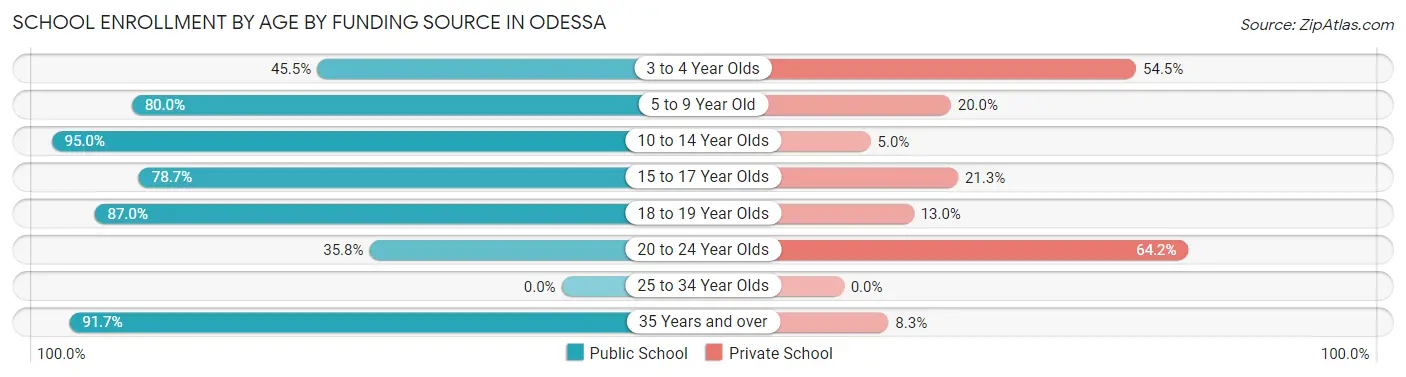
School Enrollment by Age by Funding Source in Odessa
Out of a total of 1,784 students who are enrolled in schools in Odessa, 335 (18.8%) attend a private institution, while the remaining 1,449 (81.2%) are enrolled in public schools. The age group of 20 to 24 year olds has the highest likelihood of being enrolled in private schools, with 52 (64.2% in the age bracket) enrolled. Conversely, the age group of 10 to 14 year olds has the lowest likelihood of being enrolled in a private school, with 549 (95.0% in the age bracket) attending a public institution.
| Age Bracket | Public School | Private School |
| 3 to 4 Year Olds | 56 (45.5%) | 67 (54.5%) |
| 5 to 9 Year Old | 433 (80.0%) | 108 (20.0%) |
| 10 to 14 Year Olds | 549 (95.0%) | 29 (5.0%) |
| 15 to 17 Year Olds | 207 (78.7%) | 56 (21.3%) |
| 18 to 19 Year Olds | 120 (87.0%) | 18 (13.0%) |
| 20 to 24 Year Olds | 29 (35.8%) | 52 (64.2%) |
| 25 to 34 Year Olds | 0 (0.0%) | 0 (0.0%) |
| 35 Years and over | 55 (91.7%) | 5 (8.3%) |
| Total | 1,449 (81.2%) | 335 (18.8%) |
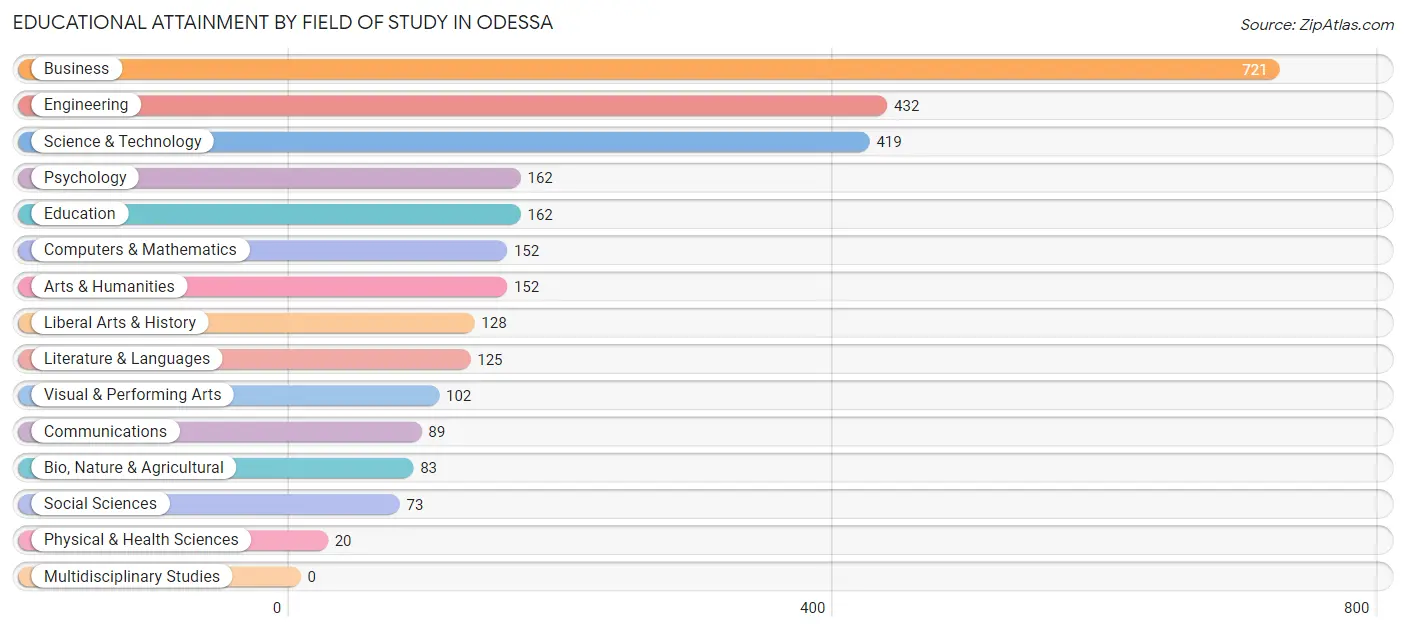
Educational Attainment by Field of Study in Odessa
Business (721 | 25.6%), engineering (432 | 15.3%), science & technology (419 | 14.9%), psychology (162 | 5.7%), and education (162 | 5.7%) are the most common fields of study among 2,820 individuals in Odessa who have obtained a bachelor's degree or higher.
| Field of Study | # Graduates | % Graduates |
| Computers & Mathematics | 152 | 5.4% |
| Bio, Nature & Agricultural | 83 | 2.9% |
| Physical & Health Sciences | 20 | 0.7% |
| Psychology | 162 | 5.7% |
| Social Sciences | 73 | 2.6% |
| Engineering | 432 | 15.3% |
| Multidisciplinary Studies | 0 | 0.0% |
| Science & Technology | 419 | 14.9% |
| Business | 721 | 25.6% |
| Education | 162 | 5.7% |
| Literature & Languages | 125 | 4.4% |
| Liberal Arts & History | 128 | 4.5% |
| Visual & Performing Arts | 102 | 3.6% |
| Communications | 89 | 3.2% |
| Arts & Humanities | 152 | 5.4% |
| Total | 2,820 | 100.0% |
Transportation & Commute in Odessa
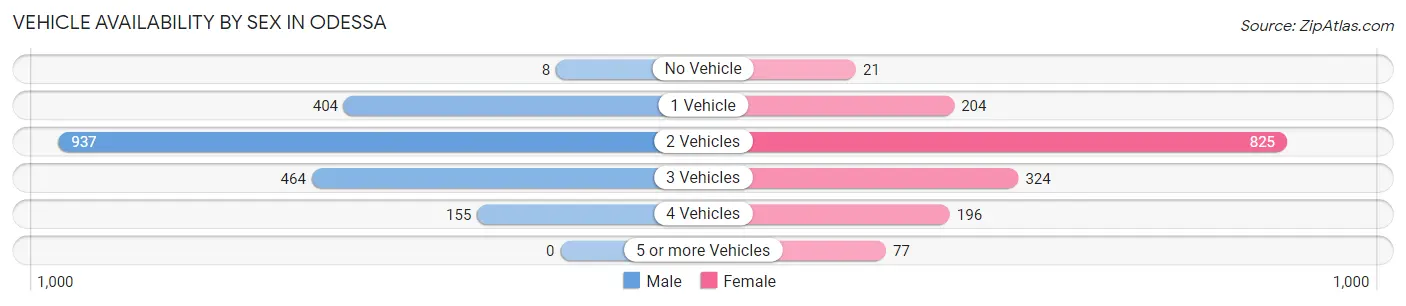
Vehicle Availability by Sex in Odessa
The most prevalent vehicle ownership categories in Odessa are males with 2 vehicles (937, accounting for 47.6%) and females with 2 vehicles (825, making up 56.9%).
| Vehicles Available | Male | Female |
| No Vehicle | 8 (0.4%) | 21 (1.3%) |
| 1 Vehicle | 404 (20.5%) | 204 (12.4%) |
| 2 Vehicles | 937 (47.6%) | 825 (50.1%) |
| 3 Vehicles | 464 (23.6%) | 324 (19.7%) |
| 4 Vehicles | 155 (7.9%) | 196 (11.9%) |
| 5 or more Vehicles | 0 (0.0%) | 77 (4.7%) |
| Total | 1,968 (100.0%) | 1,647 (100.0%) |
Commute Time in Odessa
The most frequently occuring commute durations in Odessa are 30 to 34 minutes (564 commuters, 19.6%), 45 to 59 minutes (425 commuters, 14.8%), and 20 to 24 minutes (385 commuters, 13.4%).
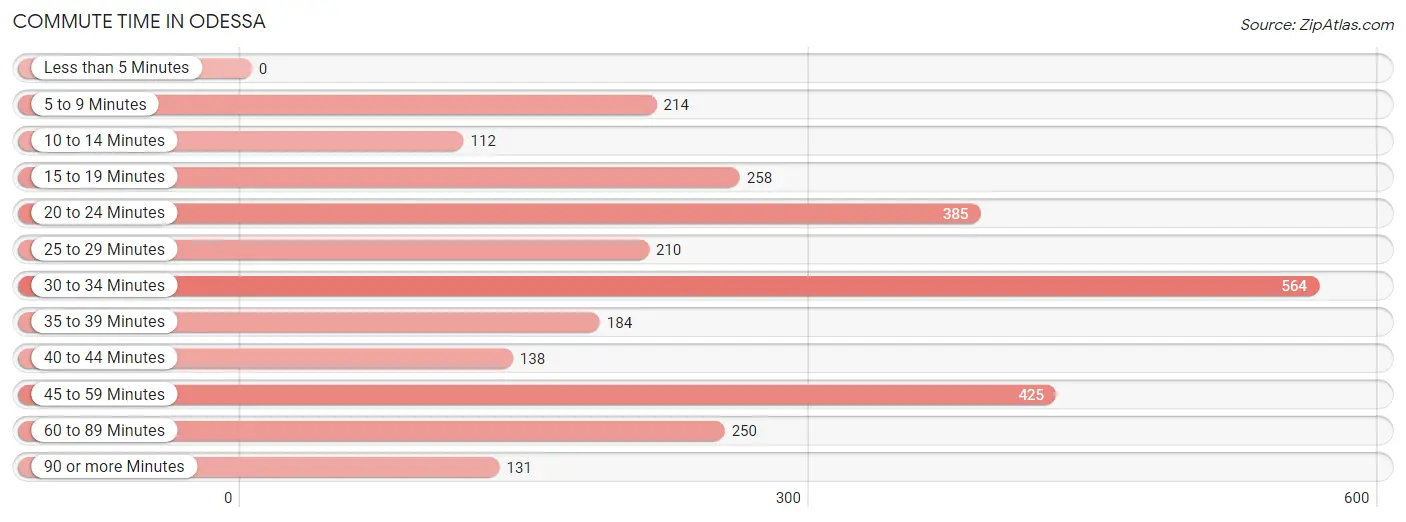
| Commute Time | # Commuters | % Commuters |
| Less than 5 Minutes | 0 | 0.0% |
| 5 to 9 Minutes | 214 | 7.4% |
| 10 to 14 Minutes | 112 | 3.9% |
| 15 to 19 Minutes | 258 | 9.0% |
| 20 to 24 Minutes | 385 | 13.4% |
| 25 to 29 Minutes | 210 | 7.3% |
| 30 to 34 Minutes | 564 | 19.6% |
| 35 to 39 Minutes | 184 | 6.4% |
| 40 to 44 Minutes | 138 | 4.8% |
| 45 to 59 Minutes | 425 | 14.8% |
| 60 to 89 Minutes | 250 | 8.7% |
| 90 or more Minutes | 131 | 4.6% |
Commute Time by Sex in Odessa
The most common commute times in Odessa are 30 to 34 minutes (316 commuters, 19.4%) for males and 30 to 34 minutes (248 commuters, 19.9%) for females.
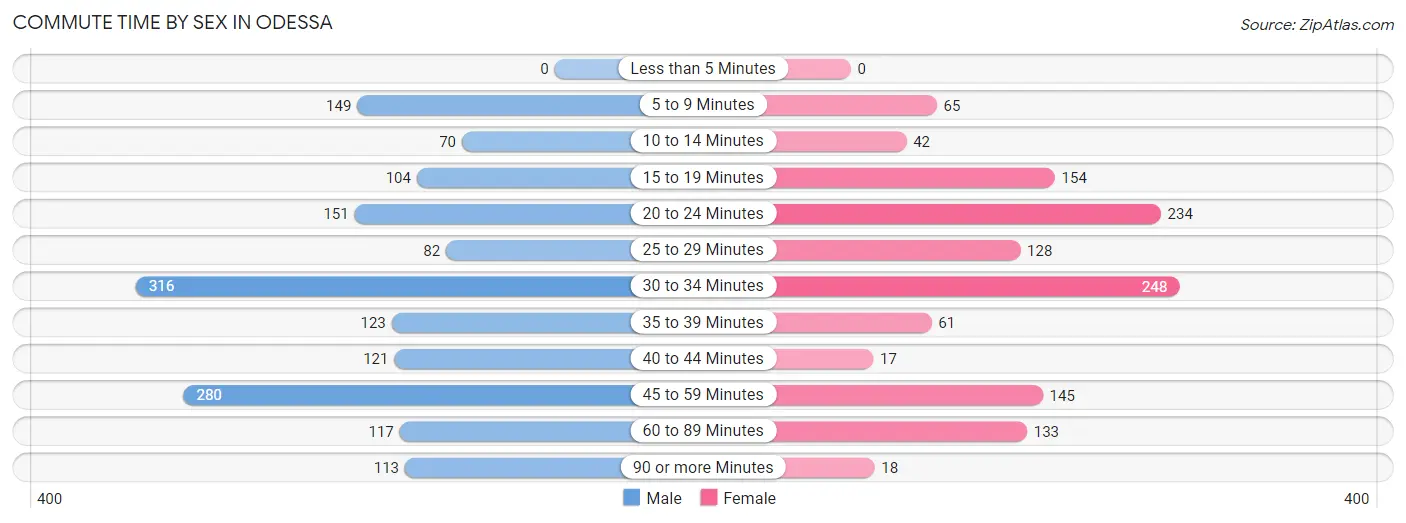
| Commute Time | Male | Female |
| Less than 5 Minutes | 0 (0.0%) | 0 (0.0%) |
| 5 to 9 Minutes | 149 (9.2%) | 65 (5.2%) |
| 10 to 14 Minutes | 70 (4.3%) | 42 (3.4%) |
| 15 to 19 Minutes | 104 (6.4%) | 154 (12.4%) |
| 20 to 24 Minutes | 151 (9.3%) | 234 (18.8%) |
| 25 to 29 Minutes | 82 (5.0%) | 128 (10.3%) |
| 30 to 34 Minutes | 316 (19.4%) | 248 (19.9%) |
| 35 to 39 Minutes | 123 (7.6%) | 61 (4.9%) |
| 40 to 44 Minutes | 121 (7.4%) | 17 (1.4%) |
| 45 to 59 Minutes | 280 (17.2%) | 145 (11.7%) |
| 60 to 89 Minutes | 117 (7.2%) | 133 (10.7%) |
| 90 or more Minutes | 113 (7.0%) | 18 (1.5%) |
Time of Departure to Work by Sex in Odessa
The most frequent times of departure to work in Odessa are 6:30 AM to 6:59 AM (330, 20.3%) for males and 6:30 AM to 6:59 AM (263, 21.1%) for females.
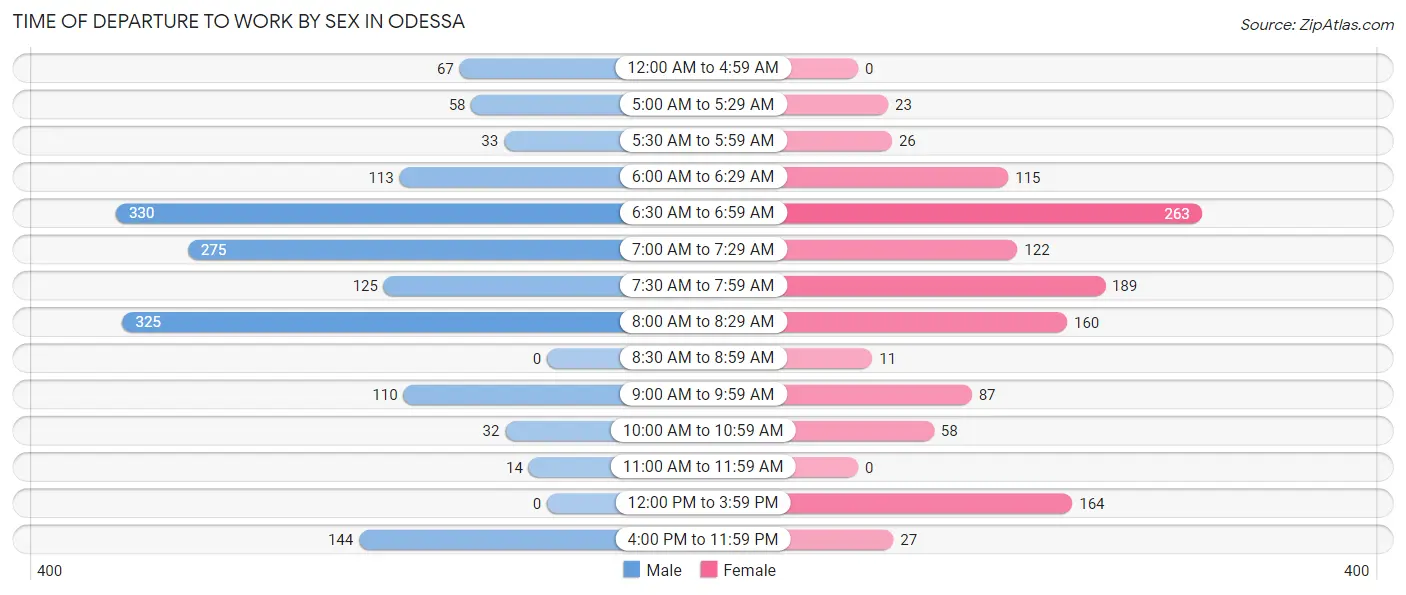
| Time of Departure | Male | Female |
| 12:00 AM to 4:59 AM | 67 (4.1%) | 0 (0.0%) |
| 5:00 AM to 5:29 AM | 58 (3.6%) | 23 (1.8%) |
| 5:30 AM to 5:59 AM | 33 (2.0%) | 26 (2.1%) |
| 6:00 AM to 6:29 AM | 113 (7.0%) | 115 (9.2%) |
| 6:30 AM to 6:59 AM | 330 (20.3%) | 263 (21.1%) |
| 7:00 AM to 7:29 AM | 275 (16.9%) | 122 (9.8%) |
| 7:30 AM to 7:59 AM | 125 (7.7%) | 189 (15.2%) |
| 8:00 AM to 8:29 AM | 325 (20.0%) | 160 (12.9%) |
| 8:30 AM to 8:59 AM | 0 (0.0%) | 11 (0.9%) |
| 9:00 AM to 9:59 AM | 110 (6.8%) | 87 (7.0%) |
| 10:00 AM to 10:59 AM | 32 (2.0%) | 58 (4.7%) |
| 11:00 AM to 11:59 AM | 14 (0.9%) | 0 (0.0%) |
| 12:00 PM to 3:59 PM | 0 (0.0%) | 164 (13.2%) |
| 4:00 PM to 11:59 PM | 144 (8.9%) | 27 (2.2%) |
| Total | 1,626 (100.0%) | 1,245 (100.0%) |
Housing Occupancy in Odessa
Occupancy by Ownership in Odessa
Of the total 2,622 dwellings in Odessa, owner-occupied units account for 1,978 (75.4%), while renter-occupied units make up 644 (24.6%).
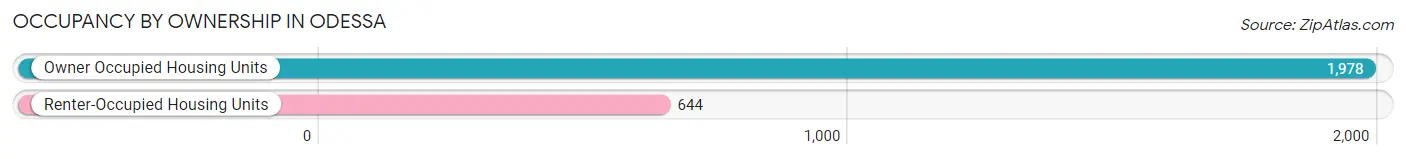
| Occupancy | # Housing Units | % Housing Units |
| Owner Occupied Housing Units | 1,978 | 75.4% |
| Renter-Occupied Housing Units | 644 | 24.6% |
| Total Occupied Housing Units | 2,622 | 100.0% |
Occupancy by Household Size in Odessa
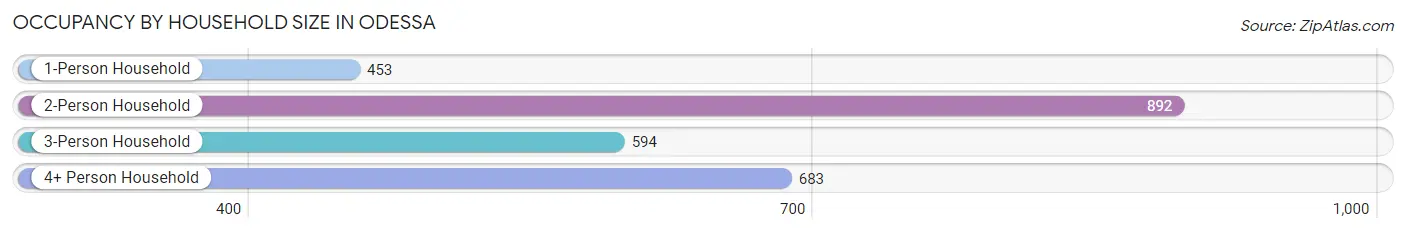
| Household Size | # Housing Units | % Housing Units |
| 1-Person Household | 453 | 17.3% |
| 2-Person Household | 892 | 34.0% |
| 3-Person Household | 594 | 22.7% |
| 4+ Person Household | 683 | 26.1% |
| Total Housing Units | 2,622 | 100.0% |
Occupancy by Ownership by Household Size in Odessa
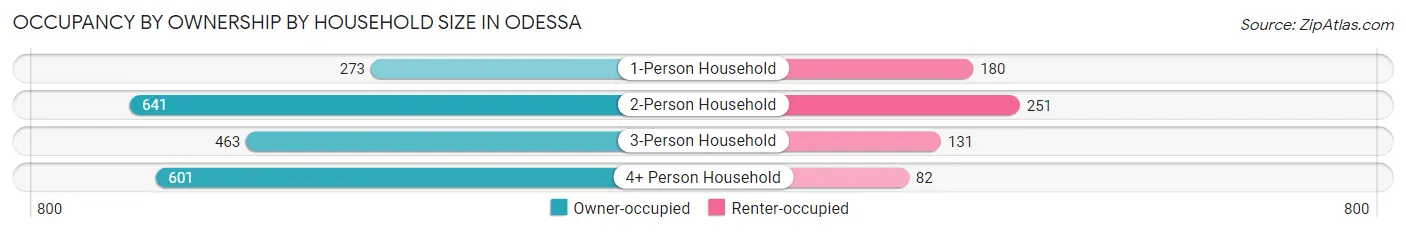
| Household Size | Owner-occupied | Renter-occupied |
| 1-Person Household | 273 (60.3%) | 180 (39.7%) |
| 2-Person Household | 641 (71.9%) | 251 (28.1%) |
| 3-Person Household | 463 (77.9%) | 131 (22.1%) |
| 4+ Person Household | 601 (88.0%) | 82 (12.0%) |
| Total Housing Units | 1,978 (75.4%) | 644 (24.6%) |
Occupancy by Educational Attainment in Odessa
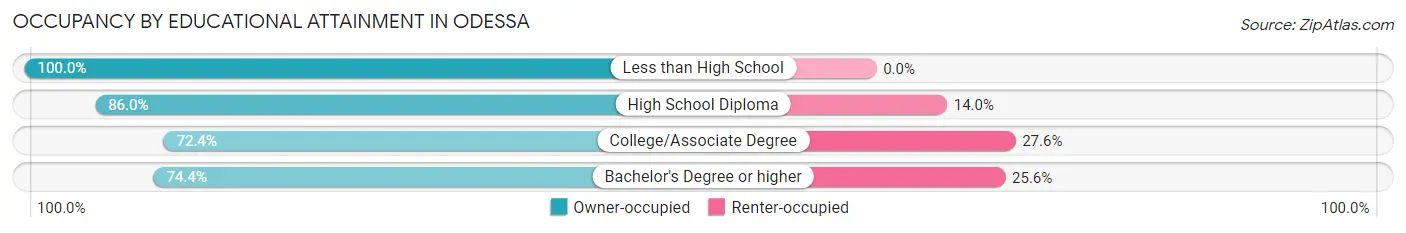
| Household Size | Owner-occupied | Renter-occupied |
| Less than High School | 39 (100.0%) | 0 (0.0%) |
| High School Diploma | 221 (86.0%) | 36 (14.0%) |
| College/Associate Degree | 486 (72.4%) | 185 (27.6%) |
| Bachelor's Degree or higher | 1,232 (74.4%) | 423 (25.6%) |
Occupancy by Age of Householder in Odessa
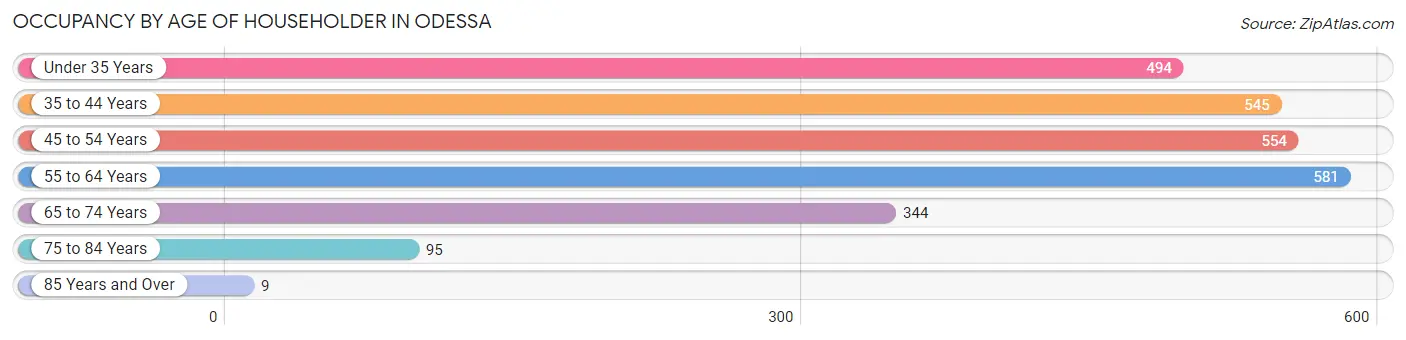
| Age Bracket | # Households | % Households |
| Under 35 Years | 494 | 18.8% |
| 35 to 44 Years | 545 | 20.8% |
| 45 to 54 Years | 554 | 21.1% |
| 55 to 64 Years | 581 | 22.2% |
| 65 to 74 Years | 344 | 13.1% |
| 75 to 84 Years | 95 | 3.6% |
| 85 Years and Over | 9 | 0.3% |
| Total | 2,622 | 100.0% |
Housing Finances in Odessa
Median Income by Occupancy in Odessa
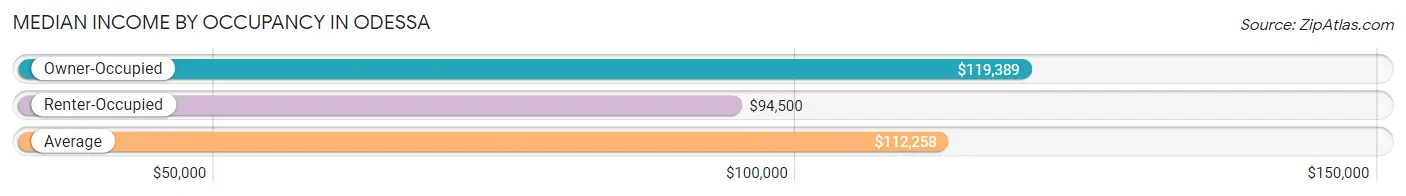
| Occupancy Type | # Households | Median Income |
| Owner-Occupied | 1,978 (75.4%) | $119,389 |
| Renter-Occupied | 644 (24.6%) | $94,500 |
| Average | 2,622 (100.0%) | $112,258 |
Occupancy by Householder Income Bracket in Odessa
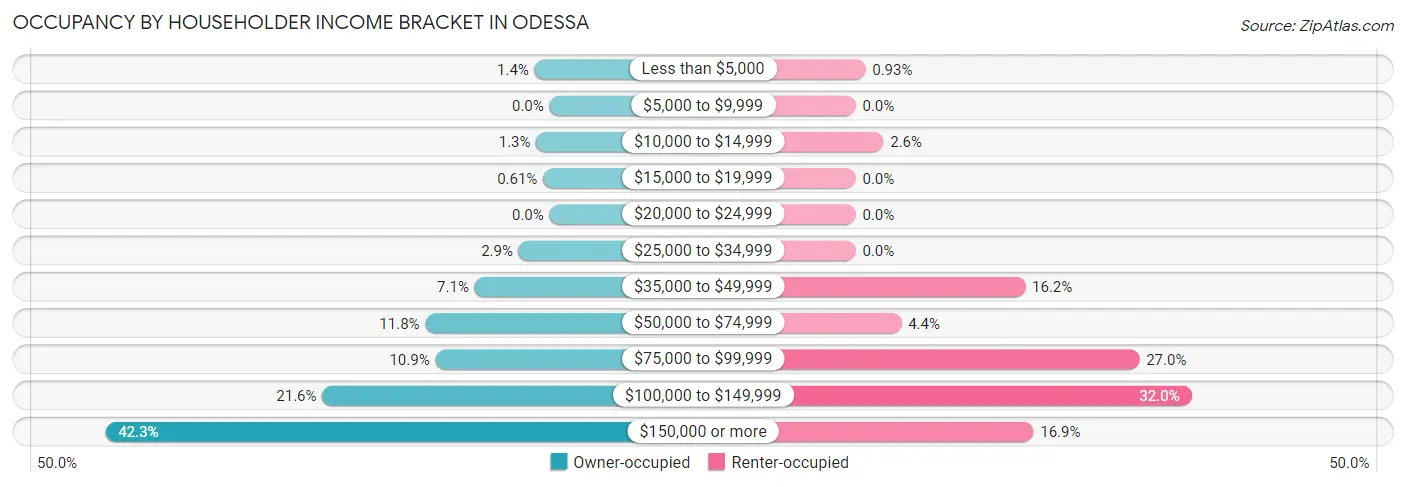
| Income Bracket | Owner-occupied | Renter-occupied |
| Less than $5,000 | 28 (1.4%) | 6 (0.9%) |
| $5,000 to $9,999 | 0 (0.0%) | 0 (0.0%) |
| $10,000 to $14,999 | 25 (1.3%) | 17 (2.6%) |
| $15,000 to $19,999 | 12 (0.6%) | 0 (0.0%) |
| $20,000 to $24,999 | 0 (0.0%) | 0 (0.0%) |
| $25,000 to $34,999 | 58 (2.9%) | 0 (0.0%) |
| $35,000 to $49,999 | 141 (7.1%) | 104 (16.2%) |
| $50,000 to $74,999 | 234 (11.8%) | 28 (4.3%) |
| $75,000 to $99,999 | 215 (10.9%) | 174 (27.0%) |
| $100,000 to $149,999 | 428 (21.6%) | 206 (32.0%) |
| $150,000 or more | 837 (42.3%) | 109 (16.9%) |
| Total | 1,978 (100.0%) | 644 (100.0%) |
Monthly Housing Cost Tiers in Odessa
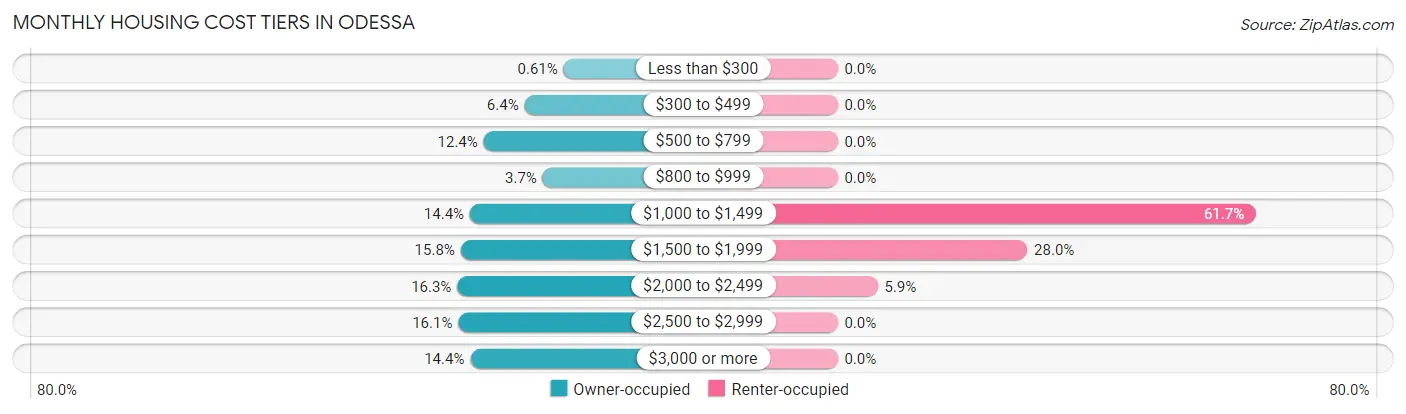
| Monthly Cost | Owner-occupied | Renter-occupied |
| Less than $300 | 12 (0.6%) | 0 (0.0%) |
| $300 to $499 | 126 (6.4%) | 0 (0.0%) |
| $500 to $799 | 245 (12.4%) | 0 (0.0%) |
| $800 to $999 | 73 (3.7%) | 0 (0.0%) |
| $1,000 to $1,499 | 285 (14.4%) | 397 (61.7%) |
| $1,500 to $1,999 | 312 (15.8%) | 180 (28.0%) |
| $2,000 to $2,499 | 322 (16.3%) | 38 (5.9%) |
| $2,500 to $2,999 | 319 (16.1%) | 0 (0.0%) |
| $3,000 or more | 284 (14.4%) | 0 (0.0%) |
| Total | 1,978 (100.0%) | 644 (100.0%) |
Physical Housing Characteristics in Odessa
Housing Structures in Odessa
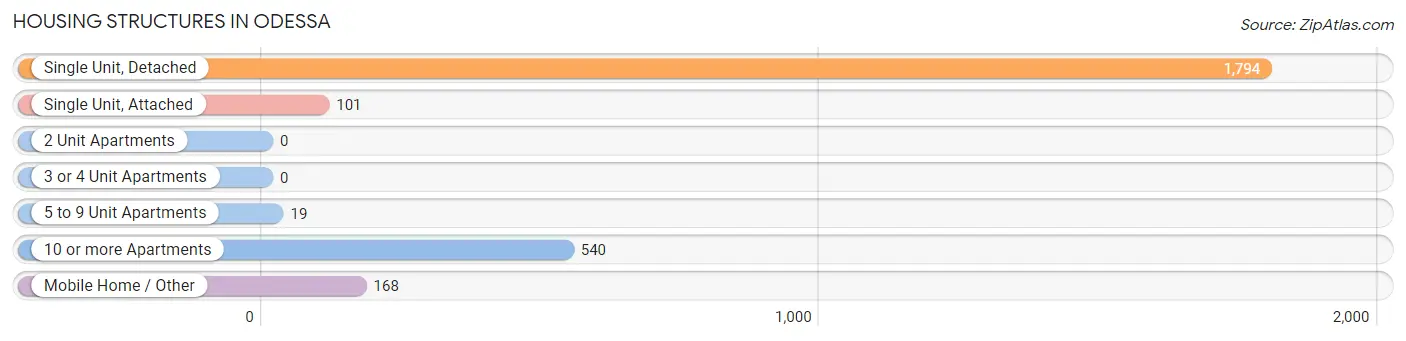
| Structure Type | # Housing Units | % Housing Units |
| Single Unit, Detached | 1,794 | 68.4% |
| Single Unit, Attached | 101 | 3.8% |
| 2 Unit Apartments | 0 | 0.0% |
| 3 or 4 Unit Apartments | 0 | 0.0% |
| 5 to 9 Unit Apartments | 19 | 0.7% |
| 10 or more Apartments | 540 | 20.6% |
| Mobile Home / Other | 168 | 6.4% |
| Total | 2,622 | 100.0% |
Housing Structures by Occupancy in Odessa
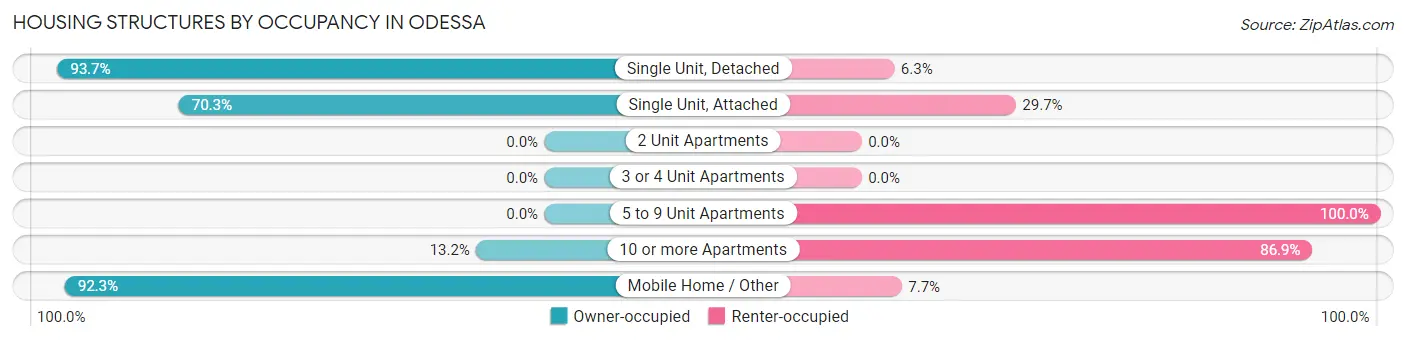
| Structure Type | Owner-occupied | Renter-occupied |
| Single Unit, Detached | 1,681 (93.7%) | 113 (6.3%) |
| Single Unit, Attached | 71 (70.3%) | 30 (29.7%) |
| 2 Unit Apartments | 0 (0.0%) | 0 (0.0%) |
| 3 or 4 Unit Apartments | 0 (0.0%) | 0 (0.0%) |
| 5 to 9 Unit Apartments | 0 (0.0%) | 19 (100.0%) |
| 10 or more Apartments | 71 (13.2%) | 469 (86.9%) |
| Mobile Home / Other | 155 (92.3%) | 13 (7.7%) |
| Total | 1,978 (75.4%) | 644 (24.6%) |
Housing Structures by Number of Rooms in Odessa
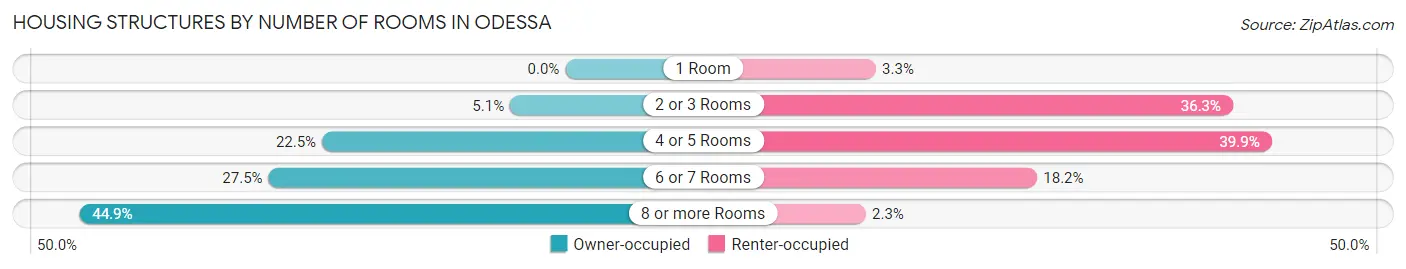
| Number of Rooms | Owner-occupied | Renter-occupied |
| 1 Room | 0 (0.0%) | 21 (3.3%) |
| 2 or 3 Rooms | 101 (5.1%) | 234 (36.3%) |
| 4 or 5 Rooms | 445 (22.5%) | 257 (39.9%) |
| 6 or 7 Rooms | 543 (27.5%) | 117 (18.2%) |
| 8 or more Rooms | 889 (44.9%) | 15 (2.3%) |
| Total | 1,978 (100.0%) | 644 (100.0%) |
Housing Structure by Heating Type in Odessa
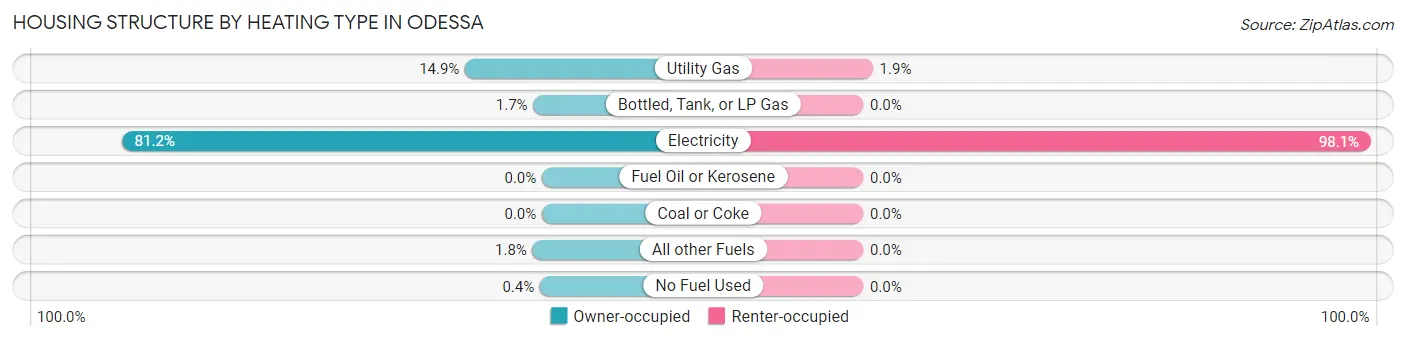
| Heating Type | Owner-occupied | Renter-occupied |
| Utility Gas | 294 (14.9%) | 12 (1.9%) |
| Bottled, Tank, or LP Gas | 33 (1.7%) | 0 (0.0%) |
| Electricity | 1,607 (81.2%) | 632 (98.1%) |
| Fuel Oil or Kerosene | 0 (0.0%) | 0 (0.0%) |
| Coal or Coke | 0 (0.0%) | 0 (0.0%) |
| All other Fuels | 36 (1.8%) | 0 (0.0%) |
| No Fuel Used | 8 (0.4%) | 0 (0.0%) |
| Total | 1,978 (100.0%) | 644 (100.0%) |
Household Vehicle Usage in Odessa
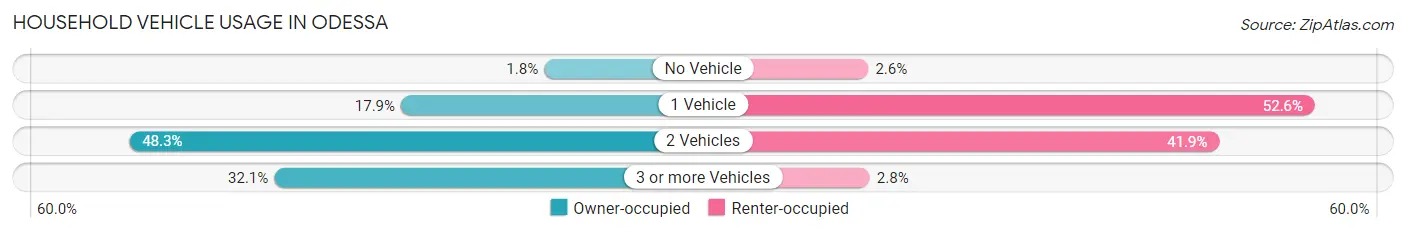
| Vehicles per Household | Owner-occupied | Renter-occupied |
| No Vehicle | 36 (1.8%) | 17 (2.6%) |
| 1 Vehicle | 353 (17.8%) | 339 (52.6%) |
| 2 Vehicles | 955 (48.3%) | 270 (41.9%) |
| 3 or more Vehicles | 634 (32.1%) | 18 (2.8%) |
| Total | 1,978 (100.0%) | 644 (100.0%) |
Real Estate & Mortgages in Odessa
Real Estate and Mortgage Overview in Odessa
| Characteristic | Without Mortgage | With Mortgage |
| Housing Units | 468 | 1,510 |
| Median Property Value | $509,600 | $426,100 |
| Median Household Income | $95,370 | $758 |
| Monthly Housing Costs | $704 | $284 |
| Real Estate Taxes | $3,326 | $99 |
Property Value by Mortgage Status in Odessa
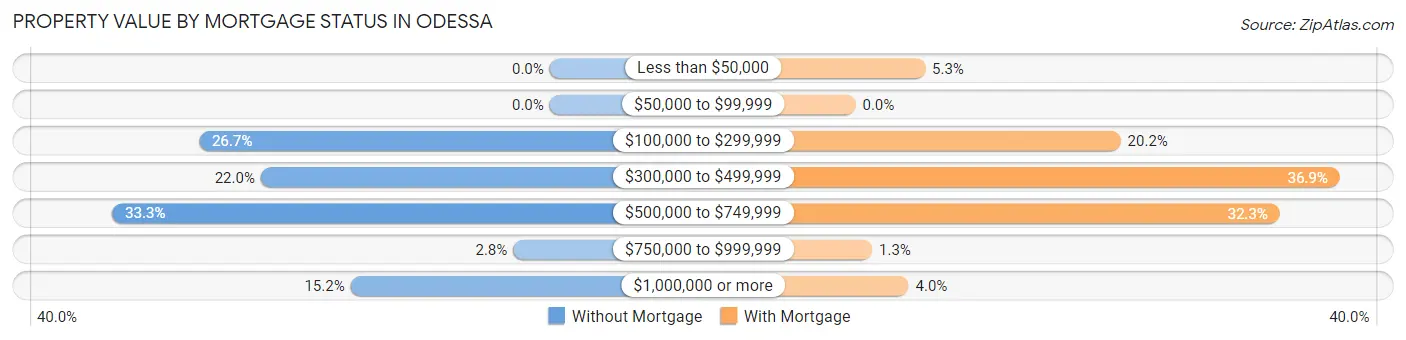
| Property Value | Without Mortgage | With Mortgage |
| Less than $50,000 | 0 (0.0%) | 80 (5.3%) |
| $50,000 to $99,999 | 0 (0.0%) | 0 (0.0%) |
| $100,000 to $299,999 | 125 (26.7%) | 305 (20.2%) |
| $300,000 to $499,999 | 103 (22.0%) | 557 (36.9%) |
| $500,000 to $749,999 | 156 (33.3%) | 488 (32.3%) |
| $750,000 to $999,999 | 13 (2.8%) | 19 (1.3%) |
| $1,000,000 or more | 71 (15.2%) | 61 (4.0%) |
| Total | 468 (100.0%) | 1,510 (100.0%) |
Household Income by Mortgage Status in Odessa
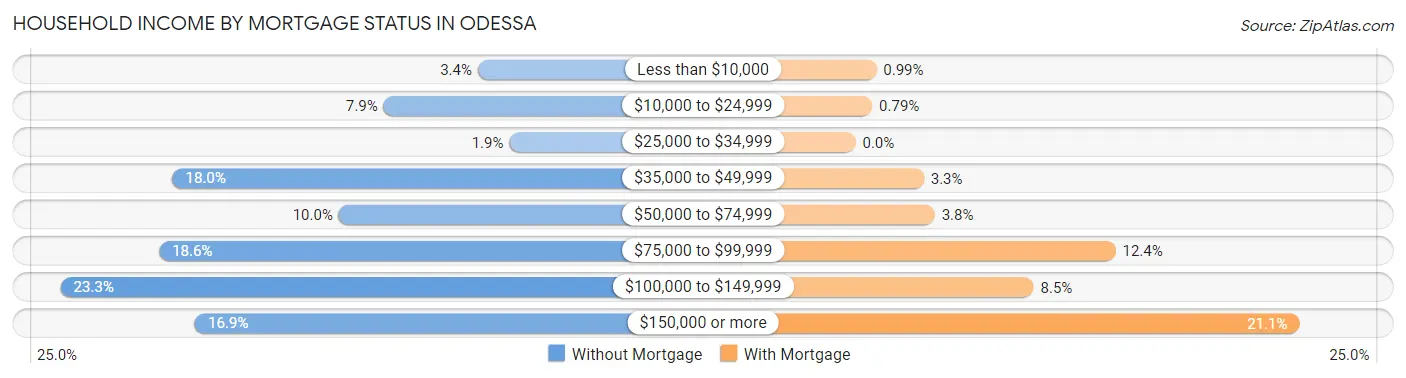
| Household Income | Without Mortgage | With Mortgage |
| Less than $10,000 | 16 (3.4%) | 15 (1.0%) |
| $10,000 to $24,999 | 37 (7.9%) | 12 (0.8%) |
| $25,000 to $34,999 | 9 (1.9%) | 0 (0.0%) |
| $35,000 to $49,999 | 84 (17.9%) | 49 (3.3%) |
| $50,000 to $74,999 | 47 (10.0%) | 57 (3.8%) |
| $75,000 to $99,999 | 87 (18.6%) | 187 (12.4%) |
| $100,000 to $149,999 | 109 (23.3%) | 128 (8.5%) |
| $150,000 or more | 79 (16.9%) | 319 (21.1%) |
| Total | 468 (100.0%) | 1,510 (100.0%) |
Property Value to Household Income Ratio in Odessa
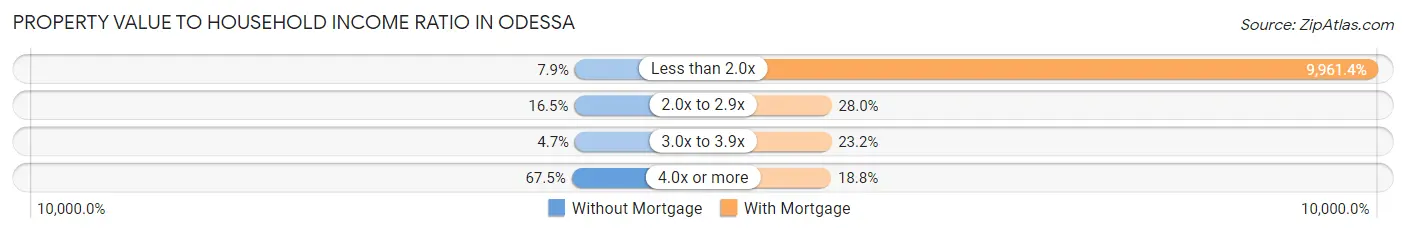
| Value-to-Income Ratio | Without Mortgage | With Mortgage |
| Less than 2.0x | 37 (7.9%) | 150,417 (9,961.4%) |
| 2.0x to 2.9x | 77 (16.5%) | 423 (28.0%) |
| 3.0x to 3.9x | 22 (4.7%) | 350 (23.2%) |
| 4.0x or more | 316 (67.5%) | 284 (18.8%) |
| Total | 468 (100.0%) | 1,510 (100.0%) |
Real Estate Taxes by Mortgage Status in Odessa
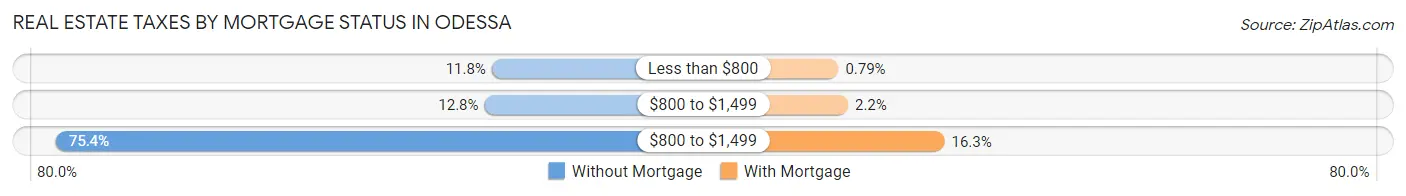
| Property Taxes | Without Mortgage | With Mortgage |
| Less than $800 | 55 (11.7%) | 12 (0.8%) |
| $800 to $1,499 | 60 (12.8%) | 33 (2.2%) |
| $800 to $1,499 | 353 (75.4%) | 246 (16.3%) |
| Total | 468 (100.0%) | 1,510 (100.0%) |
Health & Disability in Odessa
Health Insurance Coverage by Age in Odessa
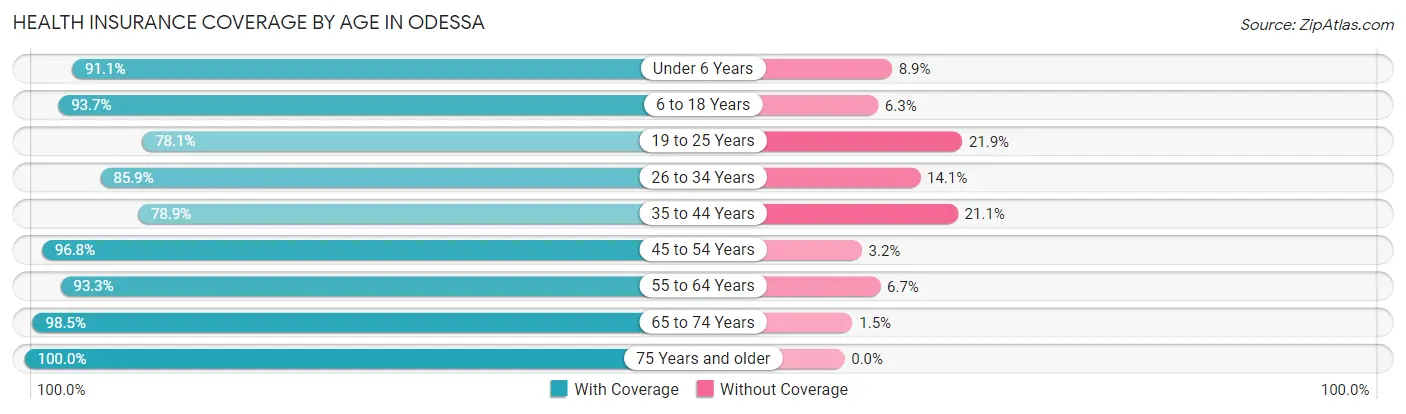
| Age Bracket | With Coverage | Without Coverage |
| Under 6 Years | 576 (91.1%) | 56 (8.9%) |
| 6 to 18 Years | 1,255 (93.7%) | 84 (6.3%) |
| 19 to 25 Years | 434 (78.1%) | 122 (21.9%) |
| 26 to 34 Years | 796 (85.9%) | 131 (14.1%) |
| 35 to 44 Years | 817 (78.9%) | 219 (21.1%) |
| 45 to 54 Years | 839 (96.8%) | 28 (3.2%) |
| 55 to 64 Years | 1,007 (93.3%) | 72 (6.7%) |
| 65 to 74 Years | 787 (98.5%) | 12 (1.5%) |
| 75 Years and older | 303 (100.0%) | 0 (0.0%) |
| Total | 6,814 (90.4%) | 724 (9.6%) |
Health Insurance Coverage by Citizenship Status in Odessa
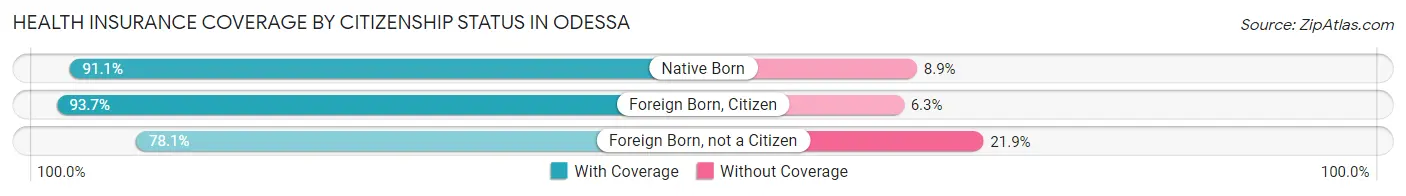
| Citizenship Status | With Coverage | Without Coverage |
| Native Born | 576 (91.1%) | 56 (8.9%) |
| Foreign Born, Citizen | 1,255 (93.7%) | 84 (6.3%) |
| Foreign Born, not a Citizen | 434 (78.1%) | 122 (21.9%) |
Health Insurance Coverage by Household Income in Odessa
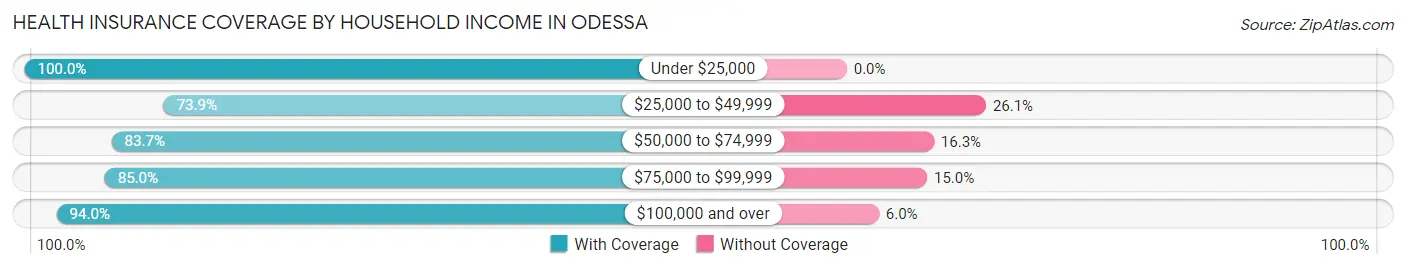
| Household Income | With Coverage | Without Coverage |
| Under $25,000 | 215 (100.0%) | 0 (0.0%) |
| $25,000 to $49,999 | 482 (73.9%) | 170 (26.1%) |
| $50,000 to $74,999 | 564 (83.7%) | 110 (16.3%) |
| $75,000 to $99,999 | 786 (85.0%) | 139 (15.0%) |
| $100,000 and over | 4,767 (94.0%) | 305 (6.0%) |
Public vs Private Health Insurance Coverage by Age in Odessa
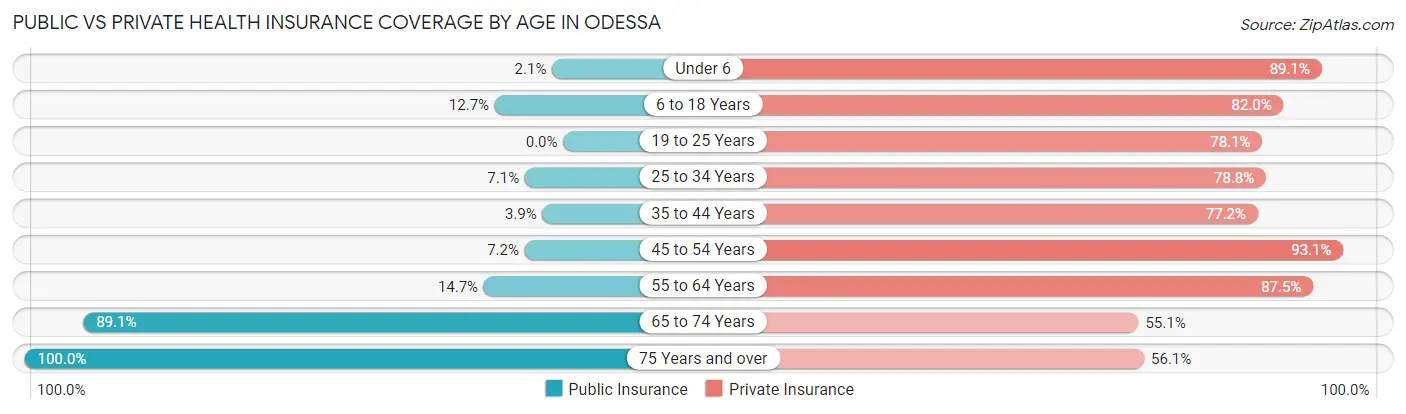
| Age Bracket | Public Insurance | Private Insurance |
| Under 6 | 13 (2.1%) | 563 (89.1%) |
| 6 to 18 Years | 170 (12.7%) | 1,098 (82.0%) |
| 19 to 25 Years | 0 (0.0%) | 434 (78.1%) |
| 25 to 34 Years | 66 (7.1%) | 730 (78.7%) |
| 35 to 44 Years | 40 (3.9%) | 800 (77.2%) |
| 45 to 54 Years | 62 (7.1%) | 807 (93.1%) |
| 55 to 64 Years | 159 (14.7%) | 944 (87.5%) |
| 65 to 74 Years | 712 (89.1%) | 440 (55.1%) |
| 75 Years and over | 303 (100.0%) | 170 (56.1%) |
| Total | 1,525 (20.2%) | 5,986 (79.4%) |
Disability Status by Sex by Age in Odessa
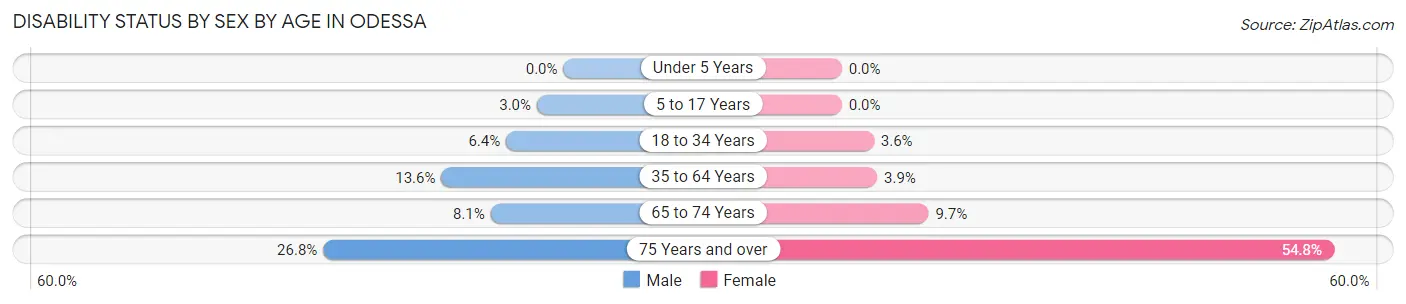
| Age Bracket | Male | Female |
| Under 5 Years | 0 (0.0%) | 0 (0.0%) |
| 5 to 17 Years | 23 (2.9%) | 0 (0.0%) |
| 18 to 34 Years | 50 (6.4%) | 28 (3.6%) |
| 35 to 64 Years | 205 (13.6%) | 58 (3.9%) |
| 65 to 74 Years | 32 (8.1%) | 39 (9.7%) |
| 75 Years and over | 42 (26.8%) | 80 (54.8%) |
Disability Class by Sex by Age in Odessa
Disability Class: Hearing Difficulty
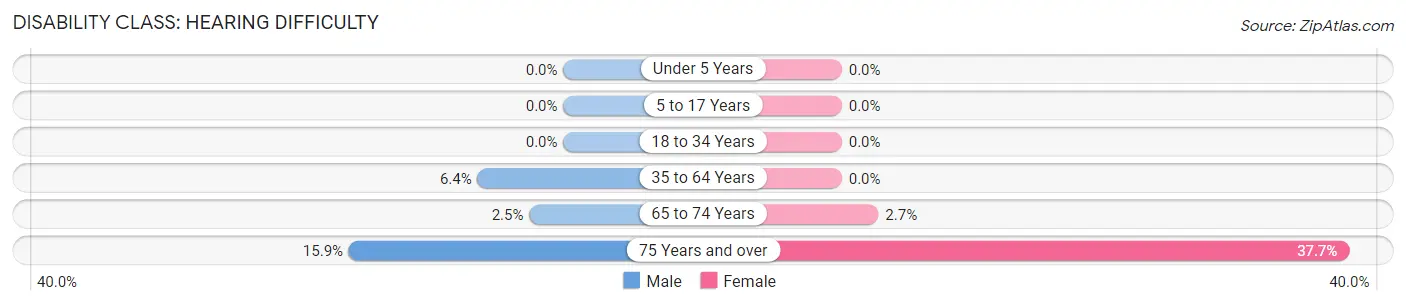
| Age Bracket | Male | Female |
| Under 5 Years | 0 (0.0%) | 0 (0.0%) |
| 5 to 17 Years | 0 (0.0%) | 0 (0.0%) |
| 18 to 34 Years | 0 (0.0%) | 0 (0.0%) |
| 35 to 64 Years | 96 (6.4%) | 0 (0.0%) |
| 65 to 74 Years | 10 (2.5%) | 11 (2.7%) |
| 75 Years and over | 25 (15.9%) | 55 (37.7%) |
Disability Class: Vision Difficulty
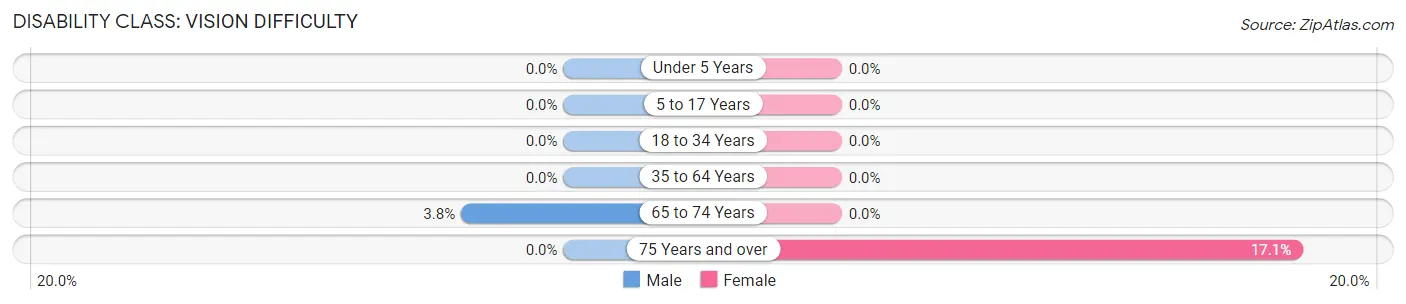
| Age Bracket | Male | Female |
| Under 5 Years | 0 (0.0%) | 0 (0.0%) |
| 5 to 17 Years | 0 (0.0%) | 0 (0.0%) |
| 18 to 34 Years | 0 (0.0%) | 0 (0.0%) |
| 35 to 64 Years | 0 (0.0%) | 0 (0.0%) |
| 65 to 74 Years | 15 (3.8%) | 0 (0.0%) |
| 75 Years and over | 0 (0.0%) | 25 (17.1%) |
Disability Class: Cognitive Difficulty
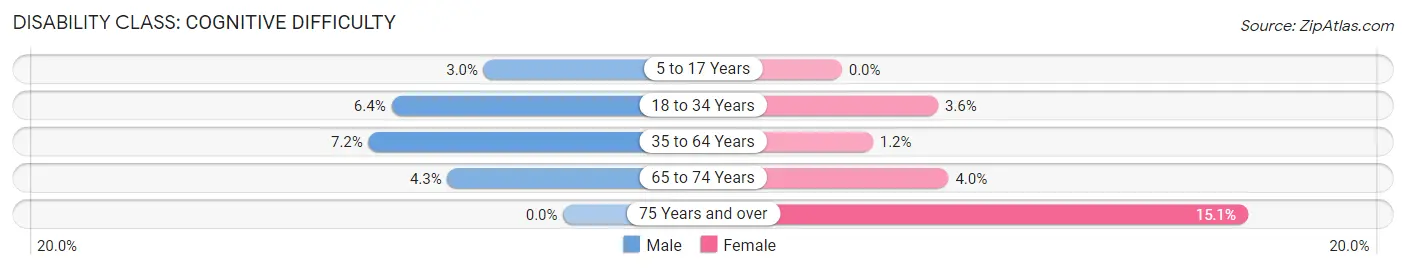
| Age Bracket | Male | Female |
| 5 to 17 Years | 23 (2.9%) | 0 (0.0%) |
| 18 to 34 Years | 50 (6.4%) | 28 (3.6%) |
| 35 to 64 Years | 109 (7.2%) | 17 (1.1%) |
| 65 to 74 Years | 17 (4.3%) | 16 (4.0%) |
| 75 Years and over | 0 (0.0%) | 22 (15.1%) |
Disability Class: Ambulatory Difficulty
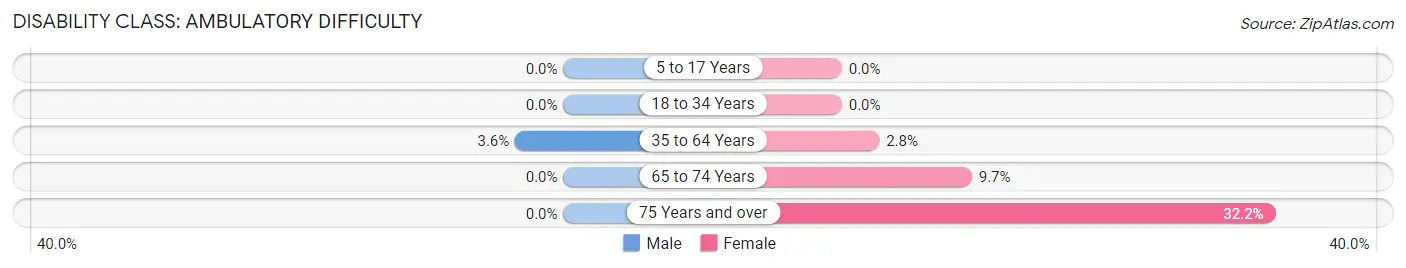
| Age Bracket | Male | Female |
| 5 to 17 Years | 0 (0.0%) | 0 (0.0%) |
| 18 to 34 Years | 0 (0.0%) | 0 (0.0%) |
| 35 to 64 Years | 54 (3.6%) | 41 (2.8%) |
| 65 to 74 Years | 0 (0.0%) | 39 (9.7%) |
| 75 Years and over | 0 (0.0%) | 47 (32.2%) |
Disability Class: Self-Care Difficulty
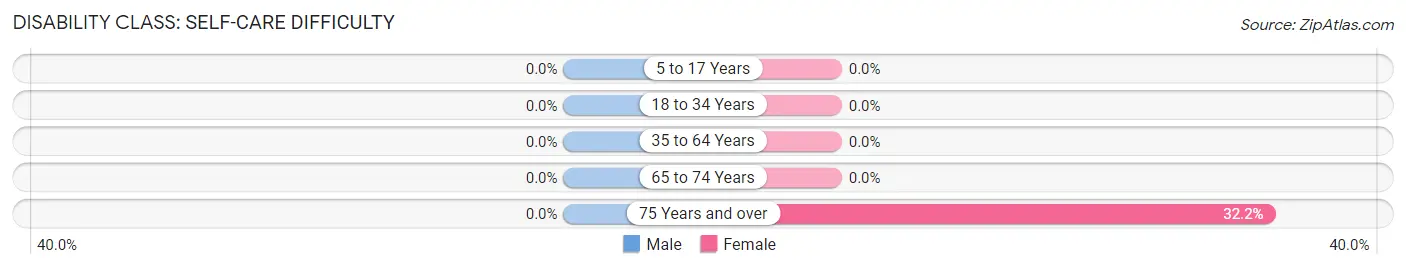
| Age Bracket | Male | Female |
| 5 to 17 Years | 0 (0.0%) | 0 (0.0%) |
| 18 to 34 Years | 0 (0.0%) | 0 (0.0%) |
| 35 to 64 Years | 0 (0.0%) | 0 (0.0%) |
| 65 to 74 Years | 0 (0.0%) | 0 (0.0%) |
| 75 Years and over | 0 (0.0%) | 47 (32.2%) |
Technology Access in Odessa
Computing Device Access in Odessa
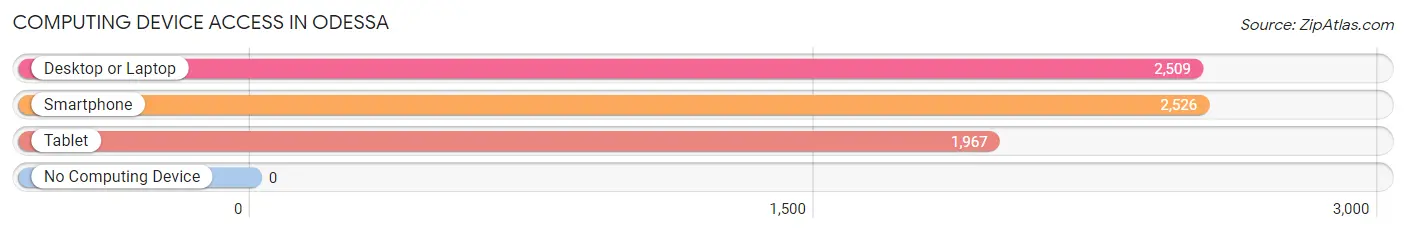
| Device Type | # Households | % Households |
| Desktop or Laptop | 2,509 | 95.7% |
| Smartphone | 2,526 | 96.3% |
| Tablet | 1,967 | 75.0% |
| No Computing Device | 0 | 0.0% |
| Total | 2,622 | 100.0% |
Internet Access in Odessa
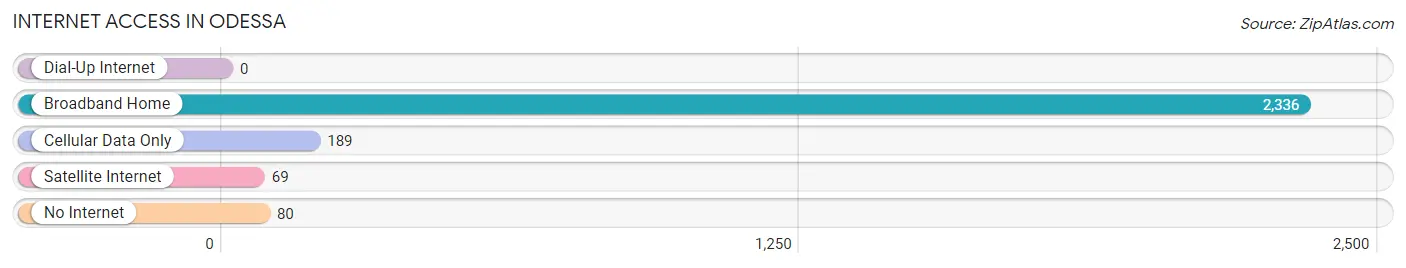
| Internet Type | # Households | % Households |
| Dial-Up Internet | 0 | 0.0% |
| Broadband Home | 2,336 | 89.1% |
| Cellular Data Only | 189 | 7.2% |
| Satellite Internet | 69 | 2.6% |
| No Internet | 80 | 3.0% |
| Total | 2,622 | 100.0% |
Odessa Summary
Odessa is a census-designated place (CDP) located in Pasco County, Florida, United States. It is part of the Tampa-St. Petersburg-Clearwater Metropolitan Statistical Area. The population was 2,890 at the 2000 census.
History
Odessa was first settled in the late 1800s by a group of settlers from Odessa, Ukraine. The settlers were attracted to the area by the abundance of natural resources, including timber and phosphate. The town was officially incorporated in 1887 and was named after the Ukrainian city.
In the early 1900s, the town was a thriving agricultural community, with citrus groves, vegetable farms, and cattle ranches. The town also had a sawmill and a phosphate mine.
In the 1950s, the town began to experience rapid growth due to the influx of new residents from the Tampa Bay area. The population increased from 1,000 in 1950 to over 5,000 in 1960.
Geography
Odessa is located at 28°14'N 82°31'W (28.23, -82.52). According to the United States Census Bureau, the CDP has a total area of 8.3 square miles (21.5 km2), of which 8.2 square miles (21.3 km2) is land and 0.1 square miles (0.2 km2) (1.17%) is water.
Economy
Odessa’s economy is largely based on agriculture and tourism. The town is home to several citrus groves, vegetable farms, and cattle ranches. The town also has a sawmill and a phosphate mine.
Tourism is also an important part of the local economy. The town is home to several popular attractions, including the Odessa National Wildlife Refuge, the Odessa Historic District, and the Odessa Aquarium.
Demographics
As of the census of 2000, there were 2,890 people, 1,072 households, and 809 families residing in the CDP. The population density was 352.2 people per square mile (136.1/km2). There were 1,150 housing units at an average density of 140.3/sq mi (54.1/km2). The racial makeup of the CDP was 94.45% White, 1.90% African American, 0.17% Native American, 1.90% Asian, 0.03% Pacific Islander, 0.86% from other races, and 1.59% from two or more races. Hispanic or Latino of any race were 3.45% of the population.
There were 1,072 households, out of which 33.2% had children under the age of 18 living with them, 61.2% were married couples living together, 9.2% had a female householder with no husband present, and 25.7% were non-families. 20.2% of all households were made up of individuals, and 8.2% had someone living alone who was 65 years of age or older. The average household size was 2.70 and the average family size was 3.12.
In the CDP, the population was spread out, with 25.2% under the age of 18, 6.7% from 18 to 24, 28.2% from 25 to 44, 25.2% from 45 to 64, and 14.7% who were 65 years of age or older. The median age was 39 years. For every 100 females, there were 97.2 males. For every 100 females age 18 and over, there were 94.2 males.
The median income for a household in the CDP was $45,938, and the median income for a family was $50,938. Males had a median income of $35,000 versus $25,000 for females. The per capita income for the CDP was $20,938. About 4.2% of families and 5.7% of the population were below the poverty line, including 6.7% of those under age 18 and 4.2% of those age 65 or over.
Common Questions
What is Per Capita Income in Odessa?
Per Capita income in Odessa is $46,880.
What is the Median Family Income in Odessa?
Median Family Income in Odessa is $128,654.
What is the Median Household income in Odessa?
Median Household Income in Odessa is $112,258.
What is Income or Wage Gap in Odessa?
Income or Wage Gap in Odessa is 43.5%.
Women in Odessa earn 56.5 cents for every dollar earned by a man.
What is Inequality or Gini Index in Odessa?
Inequality or Gini Index in Odessa is 0.34.
What is the Total Population of Odessa?
Total Population of Odessa is 7,538.
What is the Total Male Population of Odessa?
Total Male Population of Odessa is 3,905.
What is the Total Female Population of Odessa?
Total Female Population of Odessa is 3,633.
What is the Ratio of Males per 100 Females in Odessa?
There are 107.49 Males per 100 Females in Odessa.
What is the Ratio of Females per 100 Males in Odessa?
There are 93.03 Females per 100 Males in Odessa.
What is the Median Population Age in Odessa?
Median Population Age in Odessa is 39.5 Years.
What is the Average Family Size in Odessa
Average Family Size in Odessa is 3.4 People.
What is the Average Household Size in Odessa
Average Household Size in Odessa is 2.9 People.
How Large is the Labor Force in Odessa?
There are 3,813 People in the Labor Forcein in Odessa.
What is the Percentage of People in the Labor Force in Odessa?
65.8% of People are in the Labor Force in Odessa.
What is the Unemployment Rate in Odessa?
Unemployment Rate in Odessa is 2.6%.