Virginia Gardens, FL Map & Demographics
Virginia Gardens Map
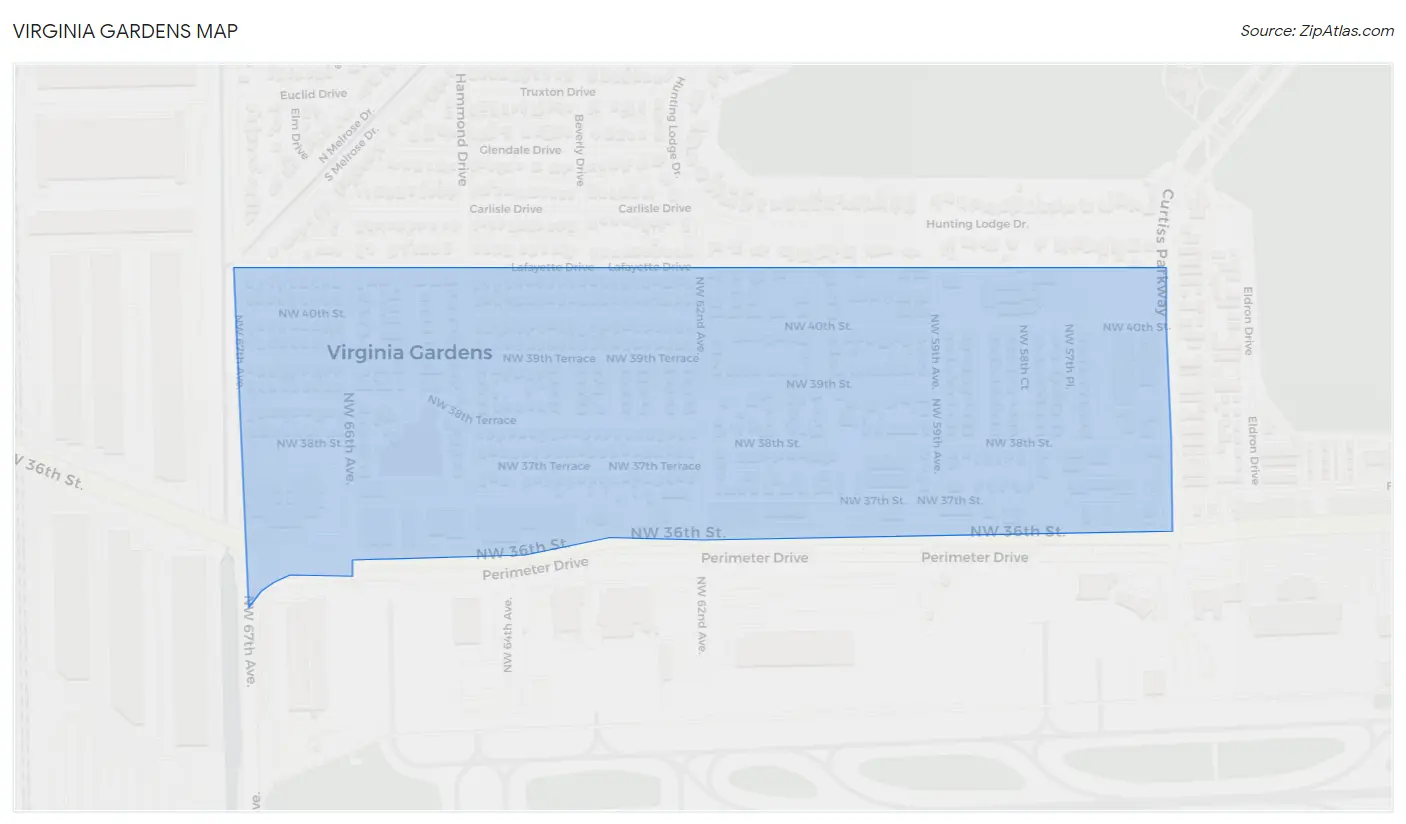
Virginia Gardens Overview
$30,385
PER CAPITA INCOME
$82,973
AVG FAMILY INCOME
$75,455
AVG HOUSEHOLD INCOME
23.6%
WAGE / INCOME GAP [ % ]
76.4¢/ $1
WAGE / INCOME GAP [ $ ]
0.40
INEQUALITY / GINI INDEX
2,419
TOTAL POPULATION
1,213
MALE POPULATION
1,206
FEMALE POPULATION
100.58
MALES / 100 FEMALES
99.42
FEMALES / 100 MALES
41.5
MEDIAN AGE
3.2
AVG FAMILY SIZE
3.0
AVG HOUSEHOLD SIZE
1,543
LABOR FORCE [ PEOPLE ]
74.6%
PERCENT IN LABOR FORCE
3.8%
UNEMPLOYMENT RATE
Income in Virginia Gardens
Income Overview in Virginia Gardens
Per Capita Income in Virginia Gardens is $30,385, while median incomes of families and households are $82,973 and $75,455 respectively.
| Characteristic | Number | Measure |
| Per Capita Income | 2,419 | $30,385 |
| Median Family Income | 662 | $82,973 |
| Mean Family Income | 662 | $90,160 |
| Median Household Income | 802 | $75,455 |
| Mean Household Income | 802 | $87,270 |
| Income Deficit | 662 | $0 |
| Wage / Income Gap (%) | 2,419 | 23.60% |
| Wage / Income Gap ($) | 2,419 | 76.40¢ per $1 |
| Gini / Inequality Index | 2,419 | 0.40 |
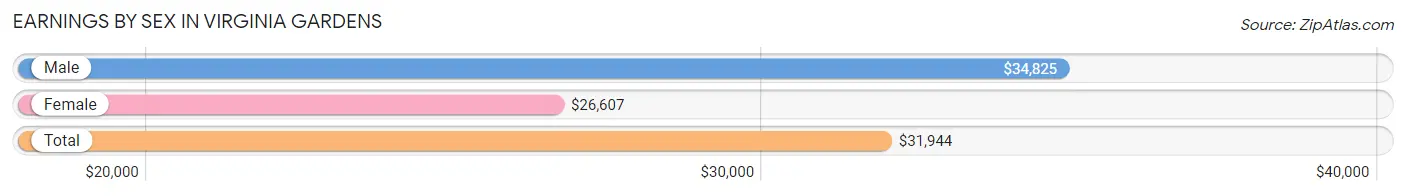
Earnings by Sex in Virginia Gardens
Average Earnings in Virginia Gardens are $31,944, $34,825 for men and $26,607 for women, a difference of 23.6%.
| Sex | Number | Average Earnings |
| Male | 855 (55.0%) | $34,825 |
| Female | 699 (45.0%) | $26,607 |
| Total | 1,554 (100.0%) | $31,944 |
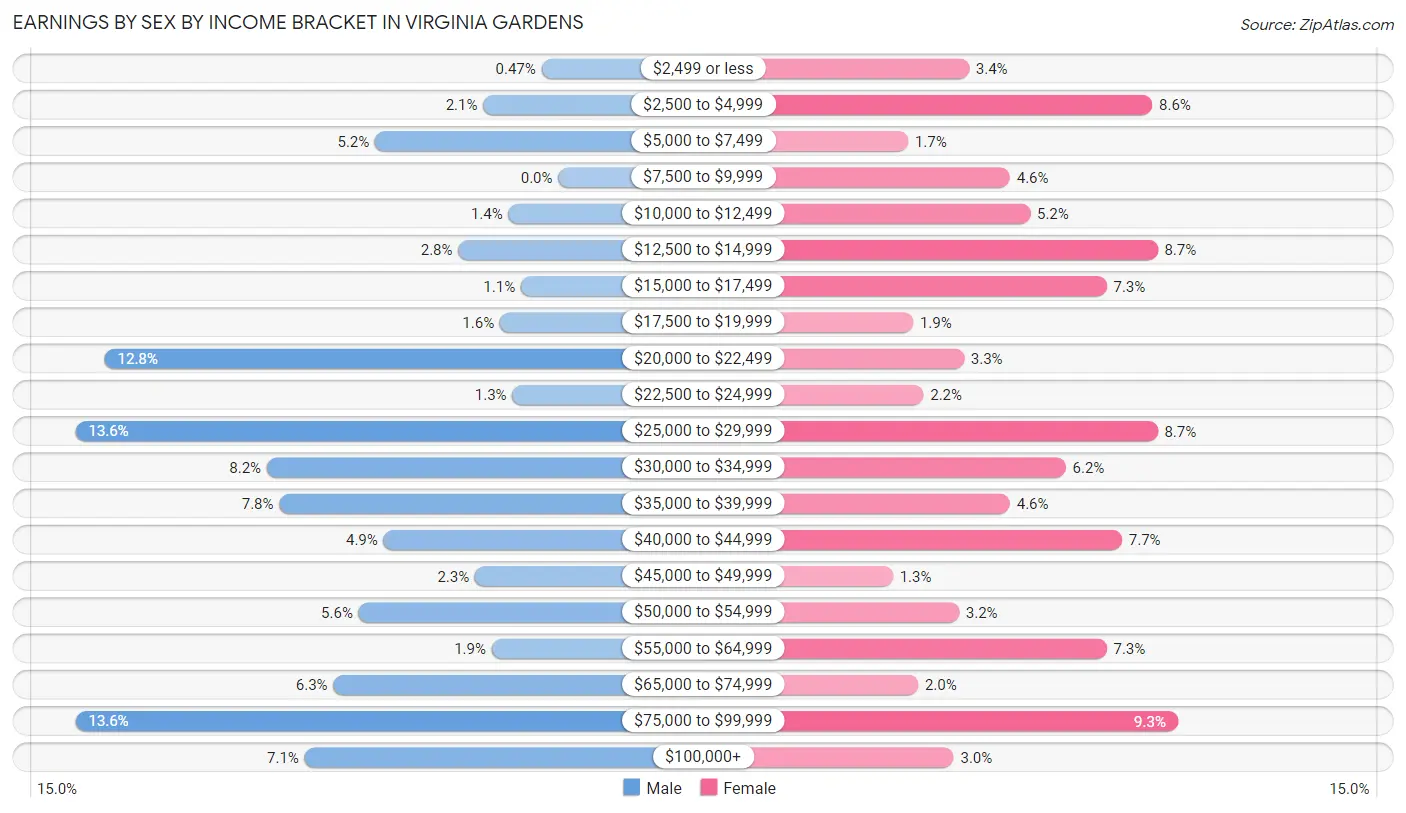
Earnings by Sex by Income Bracket in Virginia Gardens
The most common earnings brackets in Virginia Gardens are $25,000 to $29,999 for men (116 | 13.6%) and $75,000 to $99,999 for women (65 | 9.3%).
| Income | Male | Female |
| $2,499 or less | 4 (0.5%) | 24 (3.4%) |
| $2,500 to $4,999 | 18 (2.1%) | 60 (8.6%) |
| $5,000 to $7,499 | 44 (5.1%) | 12 (1.7%) |
| $7,500 to $9,999 | 0 (0.0%) | 32 (4.6%) |
| $10,000 to $12,499 | 12 (1.4%) | 36 (5.1%) |
| $12,500 to $14,999 | 24 (2.8%) | 61 (8.7%) |
| $15,000 to $17,499 | 9 (1.1%) | 51 (7.3%) |
| $17,500 to $19,999 | 14 (1.6%) | 13 (1.9%) |
| $20,000 to $22,499 | 109 (12.8%) | 23 (3.3%) |
| $22,500 to $24,999 | 11 (1.3%) | 15 (2.1%) |
| $25,000 to $29,999 | 116 (13.6%) | 61 (8.7%) |
| $30,000 to $34,999 | 70 (8.2%) | 43 (6.1%) |
| $35,000 to $39,999 | 67 (7.8%) | 32 (4.6%) |
| $40,000 to $44,999 | 42 (4.9%) | 54 (7.7%) |
| $45,000 to $49,999 | 20 (2.3%) | 9 (1.3%) |
| $50,000 to $54,999 | 48 (5.6%) | 22 (3.2%) |
| $55,000 to $64,999 | 16 (1.9%) | 51 (7.3%) |
| $65,000 to $74,999 | 54 (6.3%) | 14 (2.0%) |
| $75,000 to $99,999 | 116 (13.6%) | 65 (9.3%) |
| $100,000+ | 61 (7.1%) | 21 (3.0%) |
| Total | 855 (100.0%) | 699 (100.0%) |
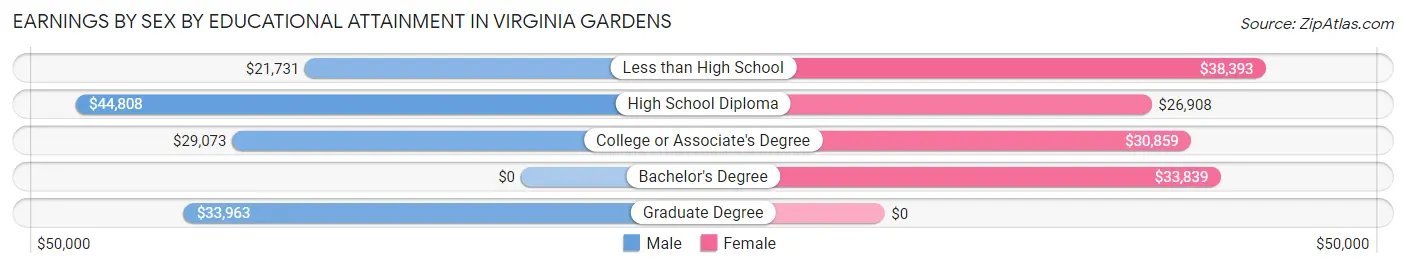
Earnings by Sex by Educational Attainment in Virginia Gardens
Average earnings in Virginia Gardens are $38,162 for men and $29,856 for women, a difference of 21.8%. Men with an educational attainment of high school diploma enjoy the highest average annual earnings of $44,808, while those with less than high school education earn the least with $21,731. Women with an educational attainment of less than high school earn the most with the average annual earnings of $38,393, while those with high school diploma education have the smallest earnings of $26,908.
| Educational Attainment | Male Income | Female Income |
| Less than High School | $21,731 | $38,393 |
| High School Diploma | $44,808 | $26,908 |
| College or Associate's Degree | $29,073 | $30,859 |
| Bachelor's Degree | - | - |
| Graduate Degree | $33,963 | $0 |
| Total | $38,162 | $29,856 |
Family Income in Virginia Gardens
Family Income Brackets in Virginia Gardens
According to the Virginia Gardens family income data, there are 142 families falling into the $75,000 to $99,999 income range, which is the most common income bracket and makes up 21.4% of all families. Conversely, the less than $10,000 income bracket is the least frequent group with only 4 families (0.6%) belonging to this category.
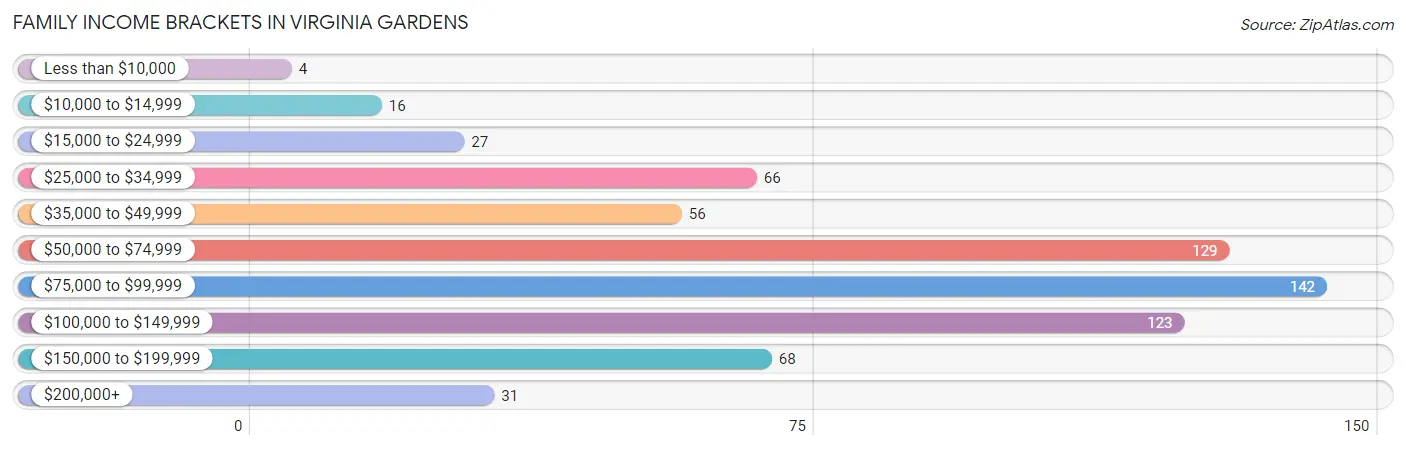
| Income Bracket | # Families | % Families |
| Less than $10,000 | 4 | 0.6% |
| $10,000 to $14,999 | 16 | 2.4% |
| $15,000 to $24,999 | 27 | 4.1% |
| $25,000 to $34,999 | 66 | 10.0% |
| $35,000 to $49,999 | 56 | 8.5% |
| $50,000 to $74,999 | 129 | 19.5% |
| $75,000 to $99,999 | 142 | 21.5% |
| $100,000 to $149,999 | 123 | 18.6% |
| $150,000 to $199,999 | 68 | 10.3% |
| $200,000+ | 31 | 4.7% |
Family Income by Famaliy Size in Virginia Gardens
4-person families (56 | 8.5%) account for the highest median family income in Virginia Gardens with $125,938 per family, while 4-person families (56 | 8.5%) have the highest median income of $31,484 per family member.
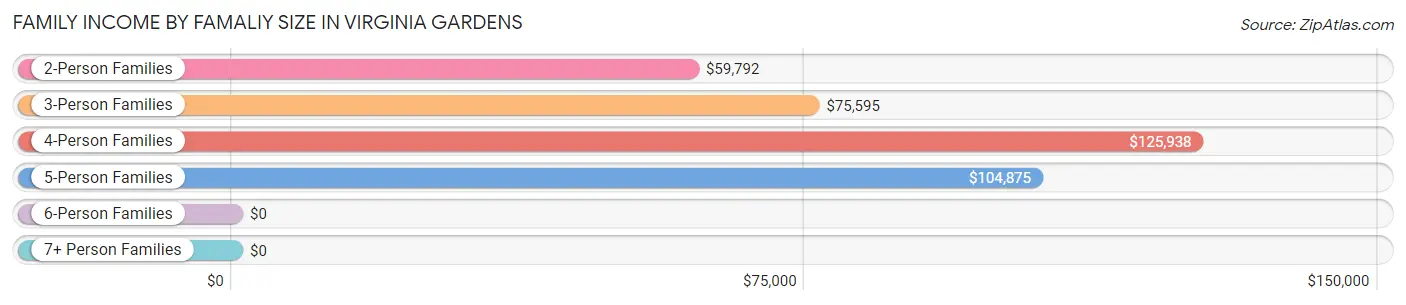
| Income Bracket | # Families | Median Income |
| 2-Person Families | 328 (49.5%) | $59,792 |
| 3-Person Families | 184 (27.8%) | $75,595 |
| 4-Person Families | 56 (8.5%) | $125,938 |
| 5-Person Families | 87 (13.1%) | $104,875 |
| 6-Person Families | 7 (1.1%) | $0 |
| 7+ Person Families | 0 (0.0%) | $0 |
| Total | 662 (100.0%) | $82,973 |
Family Income by Number of Earners in Virginia Gardens
The median family income in Virginia Gardens is $82,973, with families comprising 3+ earners (146) having the highest median family income of $105,500, while families with no earners (53) have the lowest median family income of $29,750, accounting for 22.1% and 8.0% of families, respectively.
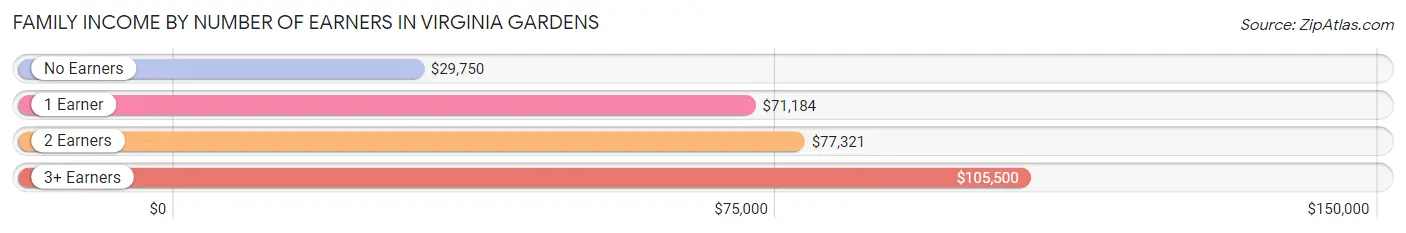
| Number of Earners | # Families | Median Income |
| No Earners | 53 (8.0%) | $29,750 |
| 1 Earner | 156 (23.6%) | $71,184 |
| 2 Earners | 307 (46.4%) | $77,321 |
| 3+ Earners | 146 (22.1%) | $105,500 |
| Total | 662 (100.0%) | $82,973 |
Household Income in Virginia Gardens
Household Income Brackets in Virginia Gardens
With 147 households falling in the category, the $100,000 to $149,999 income range is the most frequent in Virginia Gardens, accounting for 18.3% of all households. In contrast, only 28 households (3.5%) fall into the less than $10,000 income bracket, making it the least populous group.
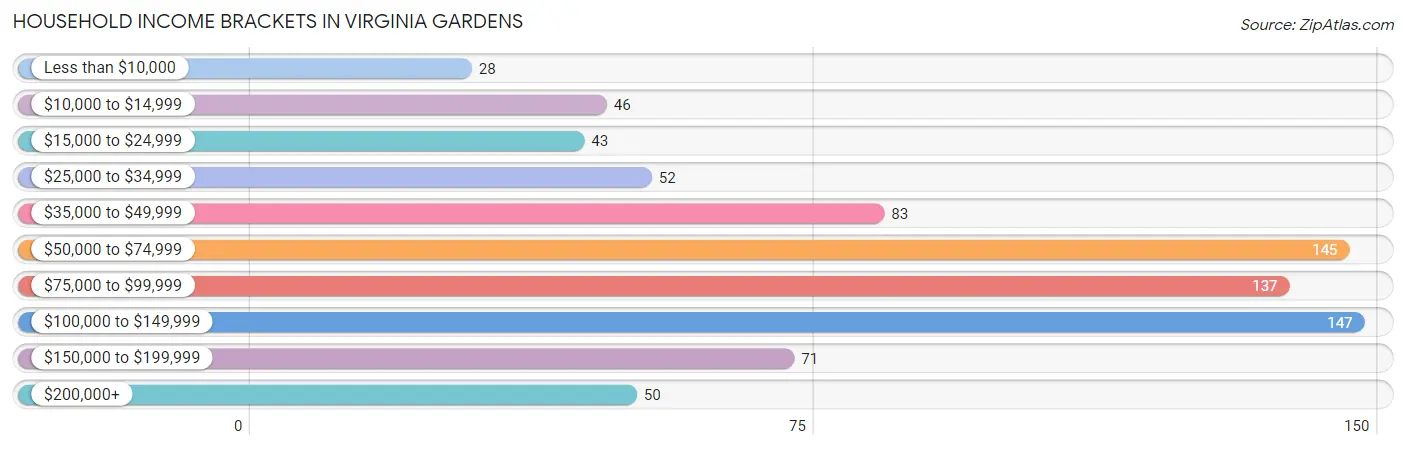
| Income Bracket | # Households | % Households |
| Less than $10,000 | 28 | 3.5% |
| $10,000 to $14,999 | 46 | 5.7% |
| $15,000 to $24,999 | 43 | 5.4% |
| $25,000 to $34,999 | 52 | 6.5% |
| $35,000 to $49,999 | 83 | 10.3% |
| $50,000 to $74,999 | 145 | 18.1% |
| $75,000 to $99,999 | 137 | 17.1% |
| $100,000 to $149,999 | 147 | 18.3% |
| $150,000 to $199,999 | 71 | 8.9% |
| $200,000+ | 50 | 6.2% |
Household Income by Householder Age in Virginia Gardens
The median household income in Virginia Gardens is $75,455, with the highest median household income of $95,735 found in the 25 to 44 years age bracket for the primary householder. A total of 280 households (34.9%) fall into this category.
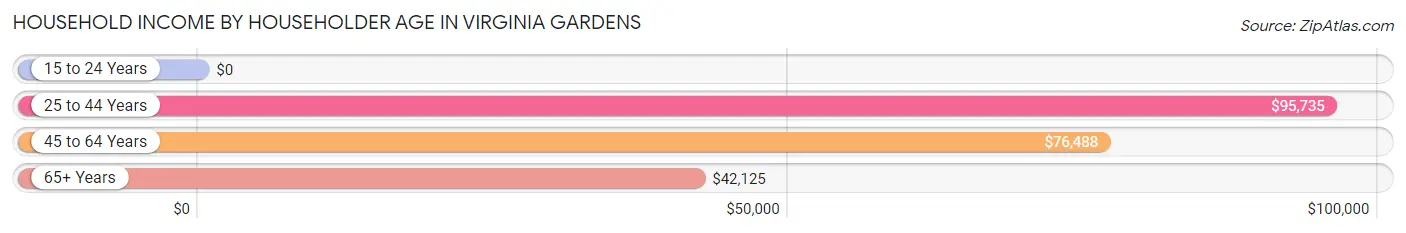
| Income Bracket | # Households | Median Income |
| 15 to 24 Years | 0 (0.0%) | $0 |
| 25 to 44 Years | 280 (34.9%) | $95,735 |
| 45 to 64 Years | 323 (40.3%) | $76,488 |
| 65+ Years | 199 (24.8%) | $42,125 |
| Total | 802 (100.0%) | $75,455 |
Poverty in Virginia Gardens
Income Below Poverty by Sex and Age in Virginia Gardens
With 4.7% poverty level for males and 10.4% for females among the residents of Virginia Gardens, 25 to 34 year old males and 55 to 64 year old females are the most vulnerable to poverty, with 24 males (13.0%) and 60 females (30.3%) in their respective age groups living below the poverty level.
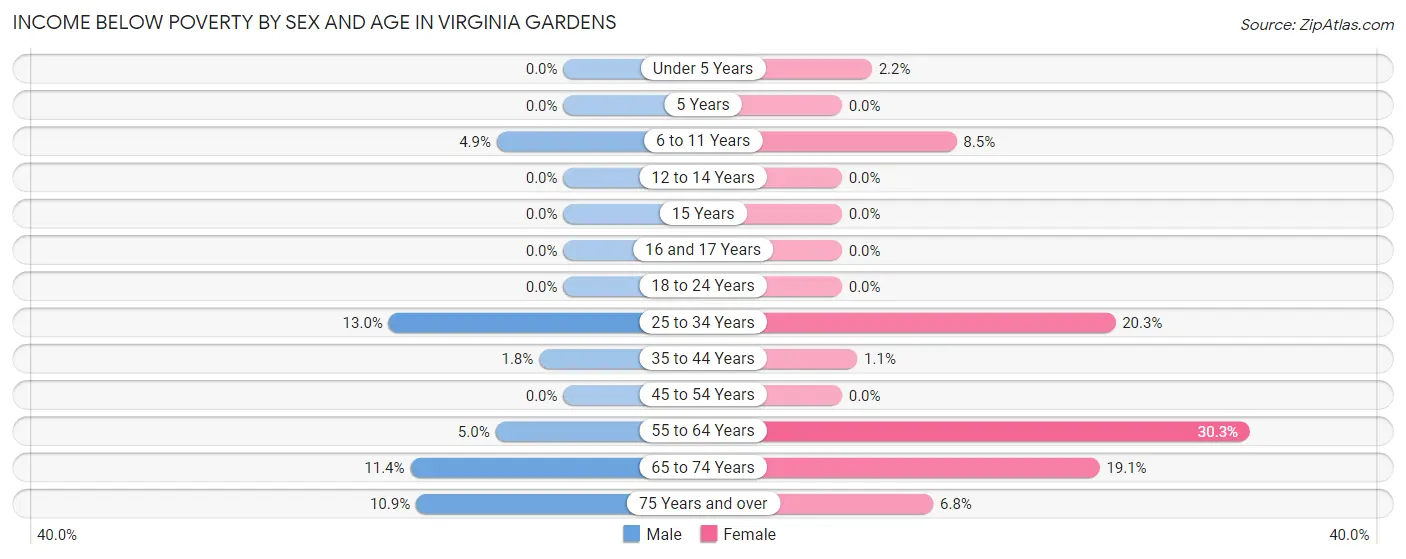
| Age Bracket | Male | Female |
| Under 5 Years | 0 (0.0%) | 2 (2.2%) |
| 5 Years | 0 (0.0%) | 0 (0.0%) |
| 6 to 11 Years | 4 (4.9%) | 4 (8.5%) |
| 12 to 14 Years | 0 (0.0%) | 0 (0.0%) |
| 15 Years | 0 (0.0%) | 0 (0.0%) |
| 16 and 17 Years | 0 (0.0%) | 0 (0.0%) |
| 18 to 24 Years | 0 (0.0%) | 0 (0.0%) |
| 25 to 34 Years | 24 (13.0%) | 27 (20.3%) |
| 35 to 44 Years | 4 (1.8%) | 2 (1.1%) |
| 45 to 54 Years | 0 (0.0%) | 0 (0.0%) |
| 55 to 64 Years | 7 (5.0%) | 60 (30.3%) |
| 65 to 74 Years | 10 (11.4%) | 22 (19.1%) |
| 75 Years and over | 7 (10.9%) | 8 (6.8%) |
| Total | 56 (4.7%) | 125 (10.4%) |
Income Above Poverty by Sex and Age in Virginia Gardens
According to the poverty statistics in Virginia Gardens, males aged under 5 years and females aged 12 to 14 years are the age groups that are most secure financially, with 100.0% of males and 100.0% of females in these age groups living above the poverty line.
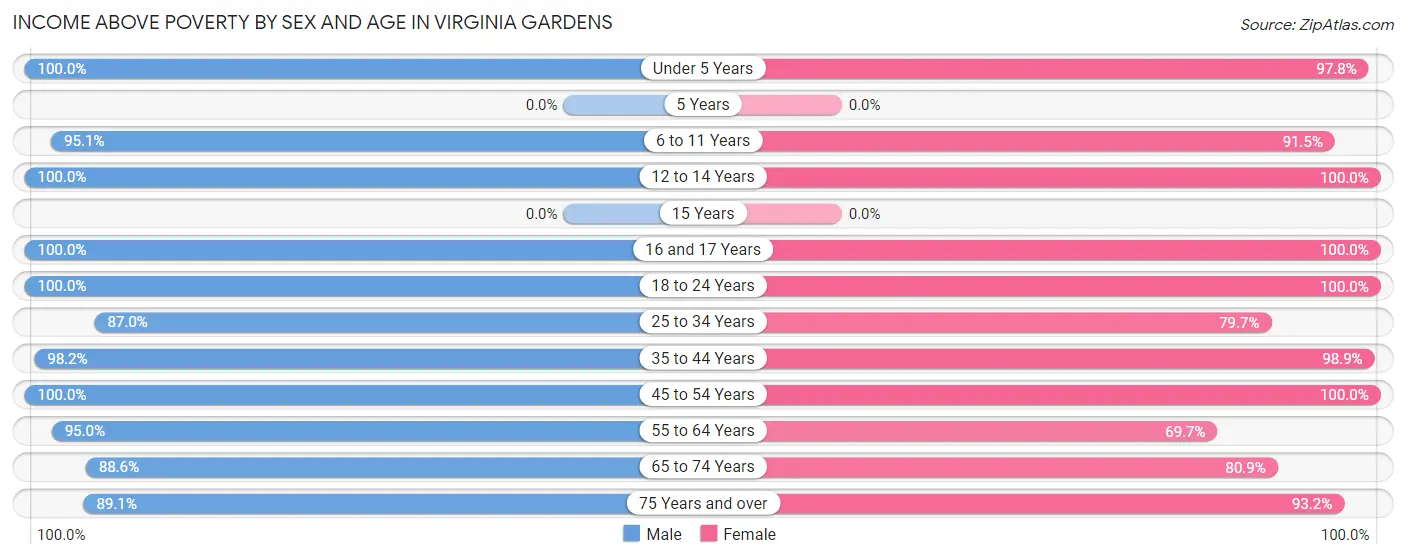
| Age Bracket | Male | Female |
| Under 5 Years | 35 (100.0%) | 88 (97.8%) |
| 5 Years | 0 (0.0%) | 0 (0.0%) |
| 6 to 11 Years | 77 (95.1%) | 43 (91.5%) |
| 12 to 14 Years | 51 (100.0%) | 29 (100.0%) |
| 15 Years | 0 (0.0%) | 0 (0.0%) |
| 16 and 17 Years | 55 (100.0%) | 28 (100.0%) |
| 18 to 24 Years | 91 (100.0%) | 153 (100.0%) |
| 25 to 34 Years | 161 (87.0%) | 106 (79.7%) |
| 35 to 44 Years | 218 (98.2%) | 174 (98.9%) |
| 45 to 54 Years | 184 (100.0%) | 119 (100.0%) |
| 55 to 64 Years | 132 (95.0%) | 138 (69.7%) |
| 65 to 74 Years | 78 (88.6%) | 93 (80.9%) |
| 75 Years and over | 57 (89.1%) | 110 (93.2%) |
| Total | 1,139 (95.3%) | 1,081 (89.6%) |
Income Below Poverty Among Married-Couple Families in Virginia Gardens
The poverty statistics for married-couple families in Virginia Gardens show that 5.4% or 20 of the total 372 families live below the poverty line. Families with no children have the highest poverty rate of 8.3%, comprising of 20 families. On the other hand, families with 1 or 2 children have the lowest poverty rate of 0.0%, which includes 0 families.
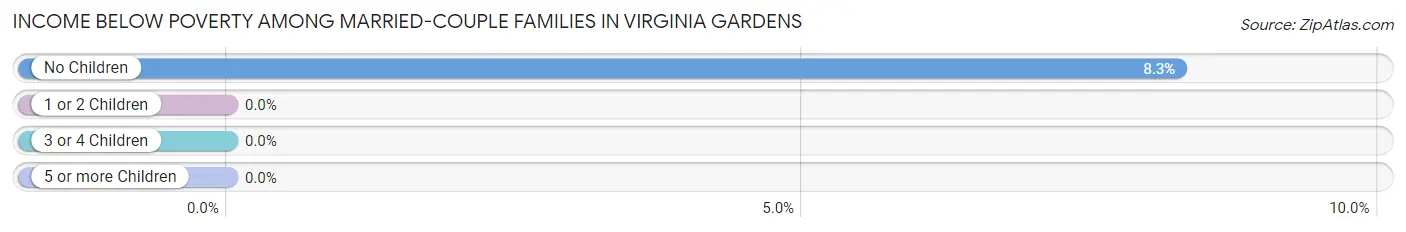
| Children | Above Poverty | Below Poverty |
| No Children | 222 (91.7%) | 20 (8.3%) |
| 1 or 2 Children | 107 (100.0%) | 0 (0.0%) |
| 3 or 4 Children | 23 (100.0%) | 0 (0.0%) |
| 5 or more Children | 0 (0.0%) | 0 (0.0%) |
| Total | 352 (94.6%) | 20 (5.4%) |
Income Below Poverty Among Single-Parent Households in Virginia Gardens
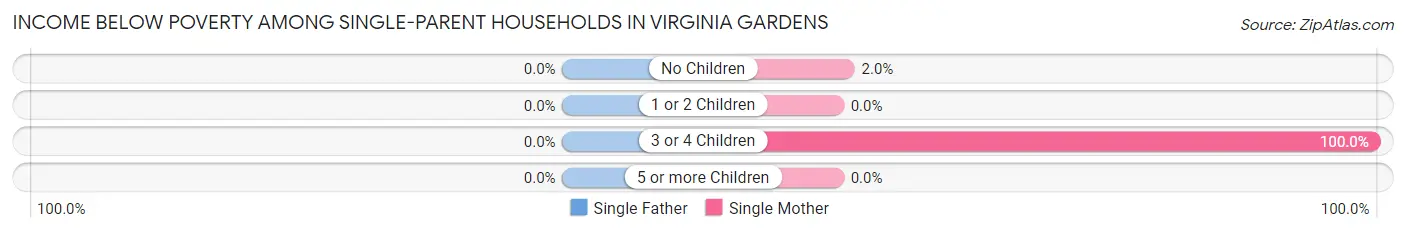
| Children | Single Father | Single Mother |
| No Children | 0 (0.0%) | 3 (2.0%) |
| 1 or 2 Children | 0 (0.0%) | 0 (0.0%) |
| 3 or 4 Children | 0 (0.0%) | 2 (100.0%) |
| 5 or more Children | 0 (0.0%) | 0 (0.0%) |
| Total | 0 (0.0%) | 5 (2.6%) |
Income Below Poverty Among Married-Couple vs Single-Parent Households in Virginia Gardens
The poverty data for Virginia Gardens shows that 20 of the married-couple family households (5.4%) and 5 of the single-parent households (1.7%) are living below the poverty level. Within the married-couple family households, those with no children have the highest poverty rate, with 20 households (8.3%) falling below the poverty line. Among the single-parent households, those with 3 or 4 children have the highest poverty rate, with 2 household (100.0%) living below poverty.
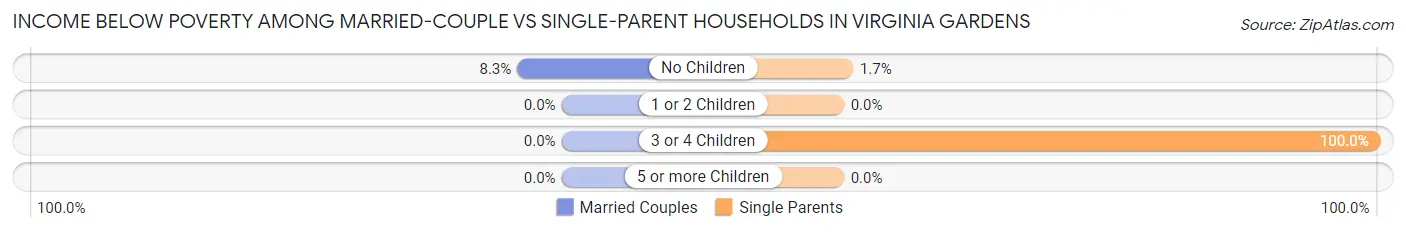
| Children | Married-Couple Families | Single-Parent Households |
| No Children | 20 (8.3%) | 3 (1.7%) |
| 1 or 2 Children | 0 (0.0%) | 0 (0.0%) |
| 3 or 4 Children | 0 (0.0%) | 2 (100.0%) |
| 5 or more Children | 0 (0.0%) | 0 (0.0%) |
| Total | 20 (5.4%) | 5 (1.7%) |
Race in Virginia Gardens
The most populous races in Virginia Gardens are Hispanic or Latino (1,846 | 76.3%), White / Caucasian (1,509 | 62.4%), and Two or more Races (629 | 26.0%).
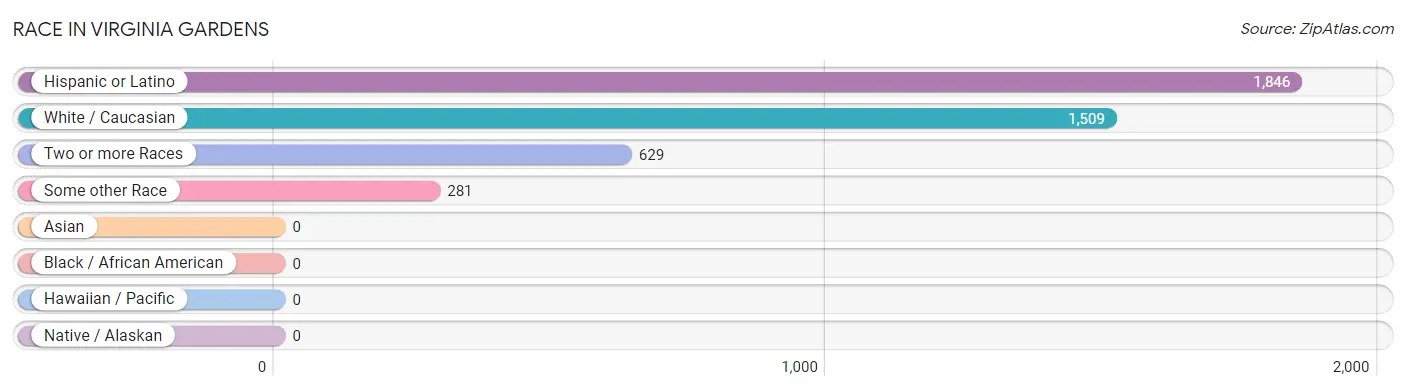
| Race | # Population | % Population |
| Asian | 0 | 0.0% |
| Black / African American | 0 | 0.0% |
| Hawaiian / Pacific | 0 | 0.0% |
| Hispanic or Latino | 1,846 | 76.3% |
| Native / Alaskan | 0 | 0.0% |
| White / Caucasian | 1,509 | 62.4% |
| Two or more Races | 629 | 26.0% |
| Some other Race | 281 | 11.6% |
| Total | 2,419 | 100.0% |
Ancestry in Virginia Gardens
The most populous ancestries reported in Virginia Gardens are Cuban (917 | 37.9%), South American (584 | 24.1%), American (224 | 9.3%), Colombian (223 | 9.2%), and Venezuelan (176 | 7.3%), together accounting for 87.8% of all Virginia Gardens residents.
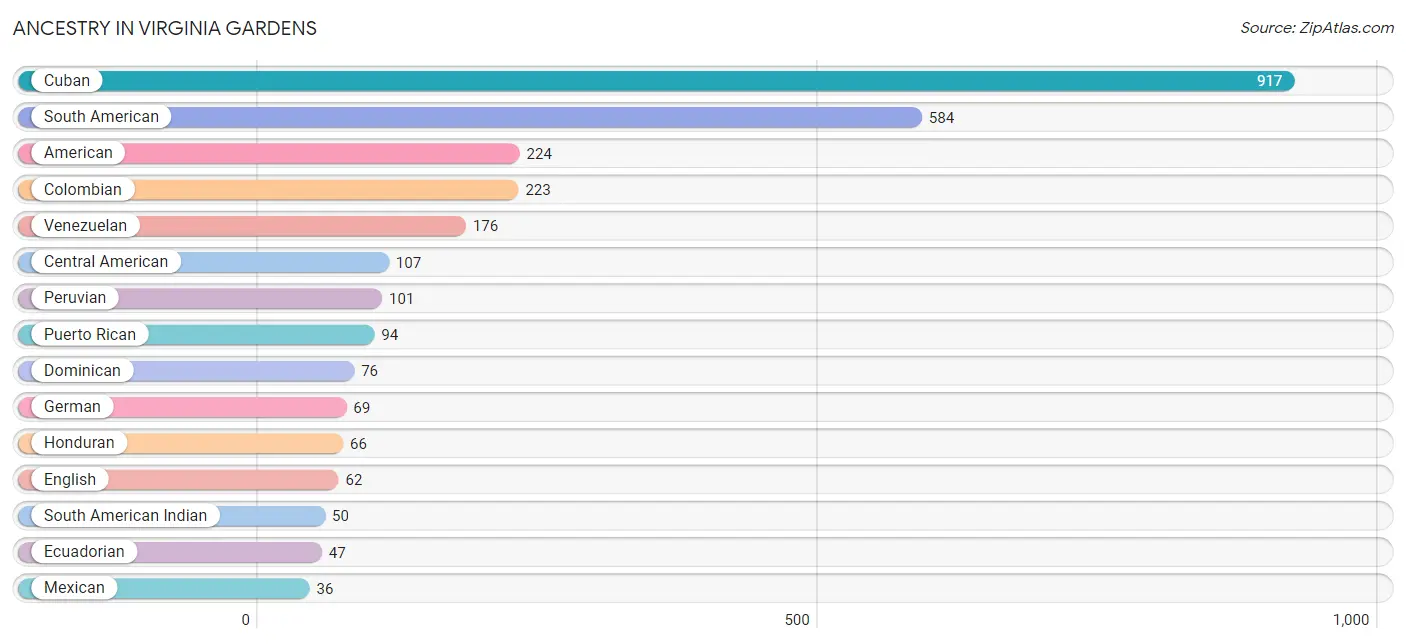
| Ancestry | # Population | % Population |
| African | 32 | 1.3% |
| American | 224 | 9.3% |
| Argentinean | 14 | 0.6% |
| Bolivian | 6 | 0.3% |
| British | 9 | 0.4% |
| Central American | 107 | 4.4% |
| Central American Indian | 20 | 0.8% |
| Chilean | 17 | 0.7% |
| Colombian | 223 | 9.2% |
| Cuban | 917 | 37.9% |
| Dominican | 76 | 3.1% |
| Ecuadorian | 47 | 1.9% |
| English | 62 | 2.6% |
| European | 9 | 0.4% |
| Finnish | 15 | 0.6% |
| French | 10 | 0.4% |
| German | 69 | 2.9% |
| Guatemalan | 25 | 1.0% |
| Honduran | 66 | 2.7% |
| Indian (Asian) | 21 | 0.9% |
| Irish | 23 | 0.9% |
| Italian | 16 | 0.7% |
| Jamaican | 7 | 0.3% |
| Mexican | 36 | 1.5% |
| Mexican American Indian | 20 | 0.8% |
| Nicaraguan | 10 | 0.4% |
| Peruvian | 101 | 4.2% |
| Polish | 15 | 0.6% |
| Puerto Rican | 94 | 3.9% |
| Salvadoran | 6 | 0.3% |
| Scottish | 10 | 0.4% |
| South American | 584 | 24.1% |
| South American Indian | 50 | 2.1% |
| Subsaharan African | 32 | 1.3% |
| Venezuelan | 176 | 7.3% | View All 35 Rows |
Immigrants in Virginia Gardens
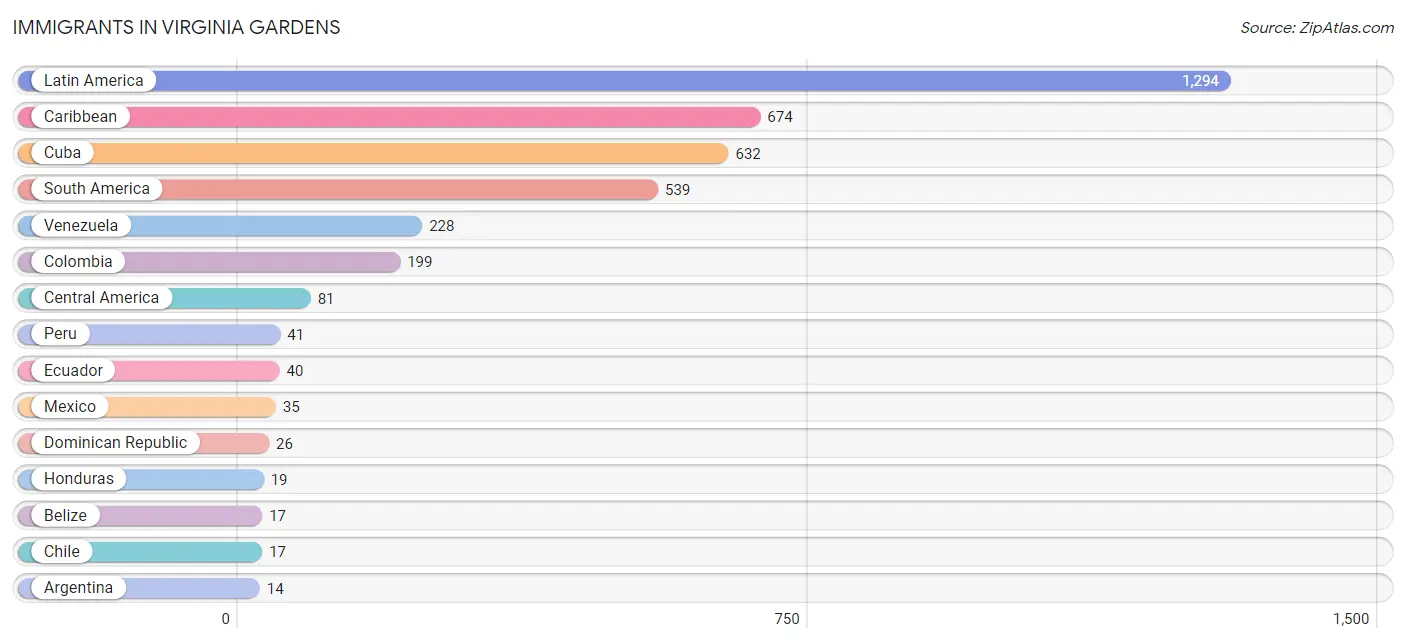
The most numerous immigrant groups reported in Virginia Gardens came from Latin America (1,294 | 53.5%), Caribbean (674 | 27.9%), Cuba (632 | 26.1%), South America (539 | 22.3%), and Venezuela (228 | 9.4%), together accounting for 139.2% of all Virginia Gardens residents.
| Immigration Origin | # Population | % Population |
| Argentina | 14 | 0.6% |
| Belize | 17 | 0.7% |
| Caribbean | 674 | 27.9% |
| Central America | 81 | 3.4% |
| Chile | 17 | 0.7% |
| Colombia | 199 | 8.2% |
| Cuba | 632 | 26.1% |
| Dominican Republic | 26 | 1.1% |
| Ecuador | 40 | 1.7% |
| Europe | 6 | 0.3% |
| Honduras | 19 | 0.8% |
| Latin America | 1,294 | 53.5% |
| Mexico | 35 | 1.5% |
| Nicaragua | 10 | 0.4% |
| Northern Europe | 6 | 0.3% |
| Peru | 41 | 1.7% |
| South America | 539 | 22.3% |
| Venezuela | 228 | 9.4% | View All 18 Rows |
Sex and Age in Virginia Gardens
Sex and Age in Virginia Gardens
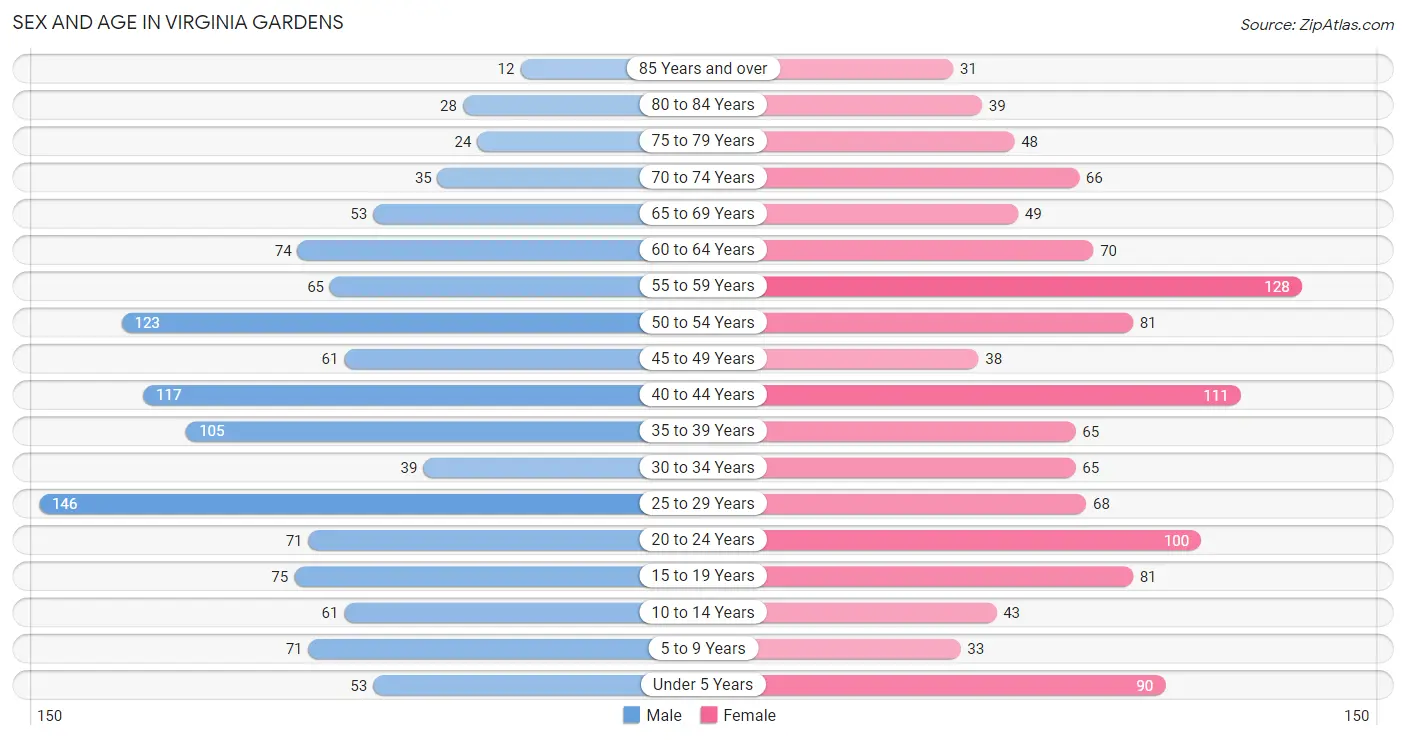
The most populous age groups in Virginia Gardens are 25 to 29 Years (146 | 12.0%) for men and 55 to 59 Years (128 | 10.6%) for women.
| Age Bracket | Male | Female |
| Under 5 Years | 53 (4.4%) | 90 (7.5%) |
| 5 to 9 Years | 71 (5.9%) | 33 (2.7%) |
| 10 to 14 Years | 61 (5.0%) | 43 (3.6%) |
| 15 to 19 Years | 75 (6.2%) | 81 (6.7%) |
| 20 to 24 Years | 71 (5.9%) | 100 (8.3%) |
| 25 to 29 Years | 146 (12.0%) | 68 (5.6%) |
| 30 to 34 Years | 39 (3.2%) | 65 (5.4%) |
| 35 to 39 Years | 105 (8.7%) | 65 (5.4%) |
| 40 to 44 Years | 117 (9.7%) | 111 (9.2%) |
| 45 to 49 Years | 61 (5.0%) | 38 (3.2%) |
| 50 to 54 Years | 123 (10.1%) | 81 (6.7%) |
| 55 to 59 Years | 65 (5.4%) | 128 (10.6%) |
| 60 to 64 Years | 74 (6.1%) | 70 (5.8%) |
| 65 to 69 Years | 53 (4.4%) | 49 (4.1%) |
| 70 to 74 Years | 35 (2.9%) | 66 (5.5%) |
| 75 to 79 Years | 24 (2.0%) | 48 (4.0%) |
| 80 to 84 Years | 28 (2.3%) | 39 (3.2%) |
| 85 Years and over | 12 (1.0%) | 31 (2.6%) |
| Total | 1,213 (100.0%) | 1,206 (100.0%) |
Families and Households in Virginia Gardens
Median Family Size in Virginia Gardens
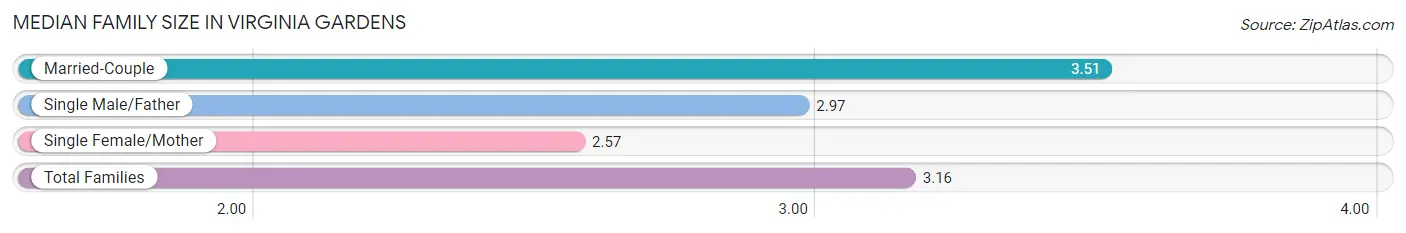
The median family size in Virginia Gardens is 3.16 persons per family, with married-couple families (372 | 56.2%) accounting for the largest median family size of 3.51 persons per family. On the other hand, single female/mother families (190 | 28.7%) represent the smallest median family size with 2.57 persons per family.
| Family Type | # Families | Family Size |
| Married-Couple | 372 (56.2%) | 3.51 |
| Single Male/Father | 100 (15.1%) | 2.97 |
| Single Female/Mother | 190 (28.7%) | 2.57 |
| Total Families | 662 (100.0%) | 3.16 |
Median Household Size in Virginia Gardens
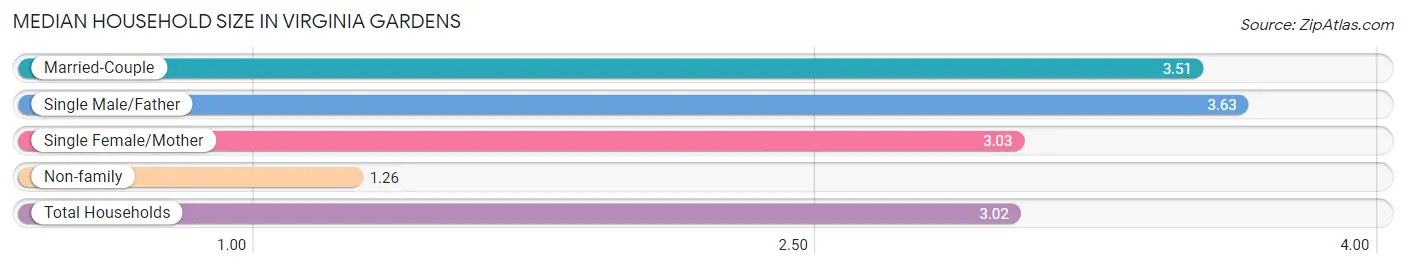
The median household size in Virginia Gardens is 3.02 persons per household, with single male/father households (100 | 12.5%) accounting for the largest median household size of 3.63 persons per household. non-family households (140 | 17.5%) represent the smallest median household size with 1.26 persons per household.
| Household Type | # Households | Household Size |
| Married-Couple | 372 (46.4%) | 3.51 |
| Single Male/Father | 100 (12.5%) | 3.63 |
| Single Female/Mother | 190 (23.7%) | 3.03 |
| Non-family | 140 (17.5%) | 1.26 |
| Total Households | 802 (100.0%) | 3.02 |
Household Size by Marriage Status in Virginia Gardens
Out of a total of 802 households in Virginia Gardens, 662 (82.5%) are family households, while 140 (17.5%) are nonfamily households. The most numerous type of family households are 2-person households, comprising 271, and the most common type of nonfamily households are 1-person households, comprising 108.
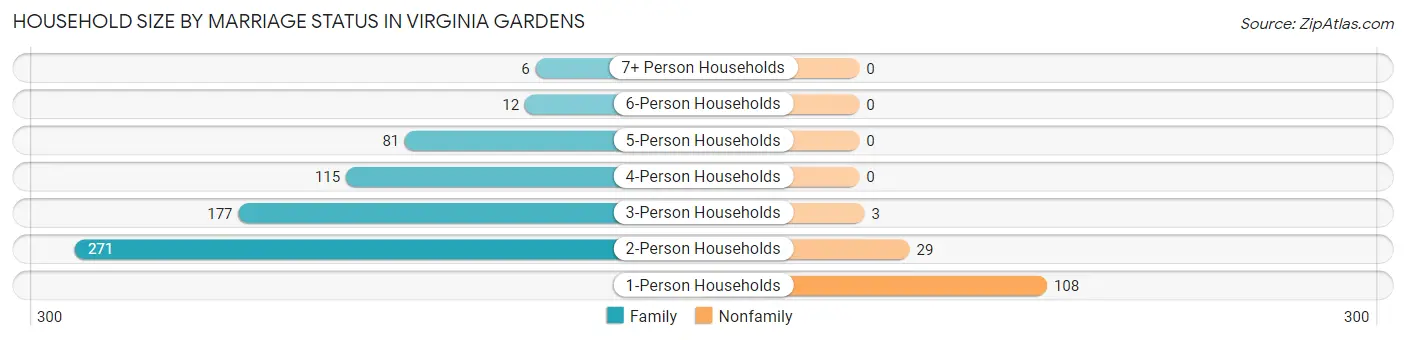
| Household Size | Family Households | Nonfamily Households |
| 1-Person Households | - | 108 (13.5%) |
| 2-Person Households | 271 (33.8%) | 29 (3.6%) |
| 3-Person Households | 177 (22.1%) | 3 (0.4%) |
| 4-Person Households | 115 (14.3%) | 0 (0.0%) |
| 5-Person Households | 81 (10.1%) | 0 (0.0%) |
| 6-Person Households | 12 (1.5%) | 0 (0.0%) |
| 7+ Person Households | 6 (0.7%) | 0 (0.0%) |
| Total | 662 (82.5%) | 140 (17.5%) |
Female Fertility in Virginia Gardens
Fertility by Age in Virginia Gardens
Average fertility rate in Virginia Gardens is 17.0 births per 1,000 women. Women in the age bracket of 20 to 34 years have the highest fertility rate with 30.0 births per 1,000 women. Women in the age bracket of 20 to 34 years acount for 77.8% of all women with births.
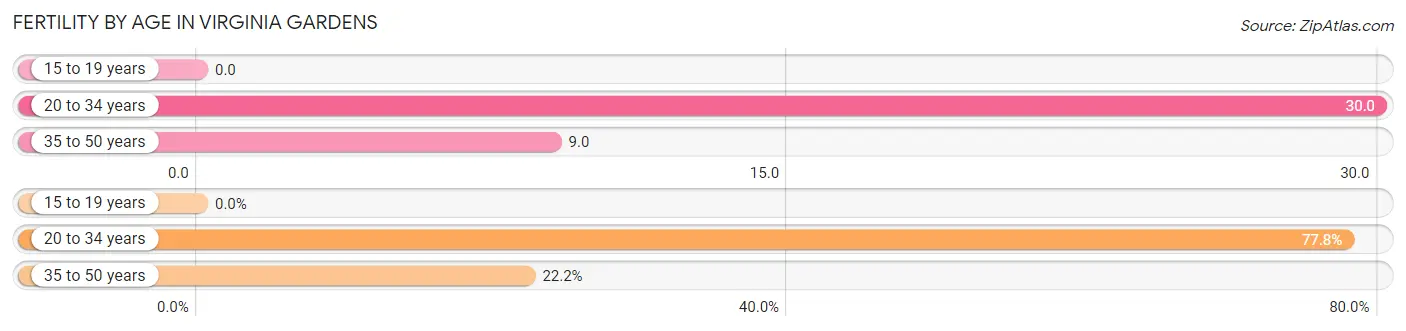
| Age Bracket | Women with Births | Births / 1,000 Women |
| 15 to 19 years | 0 (0.0%) | 0.0 |
| 20 to 34 years | 7 (77.8%) | 30.0 |
| 35 to 50 years | 2 (22.2%) | 9.0 |
| Total | 9 (100.0%) | 17.0 |
Fertility by Age by Marriage Status in Virginia Gardens
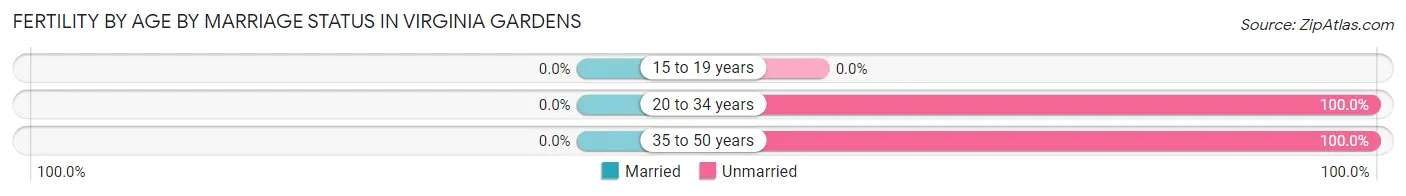
| Age Bracket | Married | Unmarried |
| 15 to 19 years | 0 (0.0%) | 0 (0.0%) |
| 20 to 34 years | 0 (0.0%) | 7 (100.0%) |
| 35 to 50 years | 0 (0.0%) | 2 (100.0%) |
| Total | 0 (0.0%) | 9 (100.0%) |
Fertility by Education in Virginia Gardens
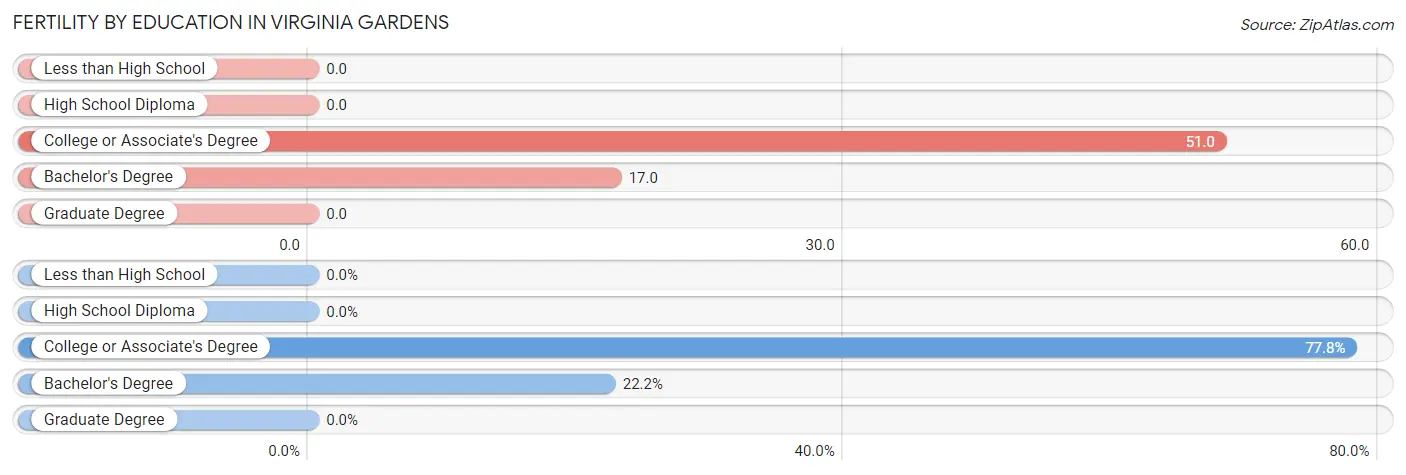
| Educational Attainment | Women with Births | Births / 1,000 Women |
| Less than High School | 0 (0.0%) | 0.0 |
| High School Diploma | 0 (0.0%) | 0.0 |
| College or Associate's Degree | 7 (77.8%) | 51.0 |
| Bachelor's Degree | 2 (22.2%) | 17.0 |
| Graduate Degree | 0 (0.0%) | 0.0 |
| Total | 9 (100.0%) | 17.0 |
Fertility by Education by Marriage Status in Virginia Gardens
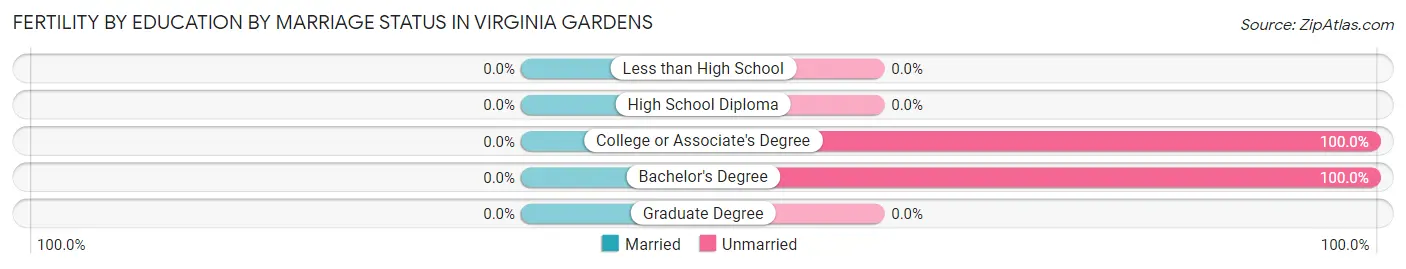
| Educational Attainment | Married | Unmarried |
| Less than High School | 0 (0.0%) | 0 (0.0%) |
| High School Diploma | 0 (0.0%) | 0 (0.0%) |
| College or Associate's Degree | 0 (0.0%) | 7 (100.0%) |
| Bachelor's Degree | 0 (0.0%) | 2 (100.0%) |
| Graduate Degree | 0 (0.0%) | 0 (0.0%) |
| Total | 0 (0.0%) | 9 (100.0%) |
Employment Characteristics in Virginia Gardens
Employment by Class of Employer in Virginia Gardens
Among the 1,476 employed individuals in Virginia Gardens, private company employees (1,051 | 71.2%), self-employed (not incorporated) (176 | 11.9%), and local government employees (118 | 8.0%) make up the most common classes of employment.
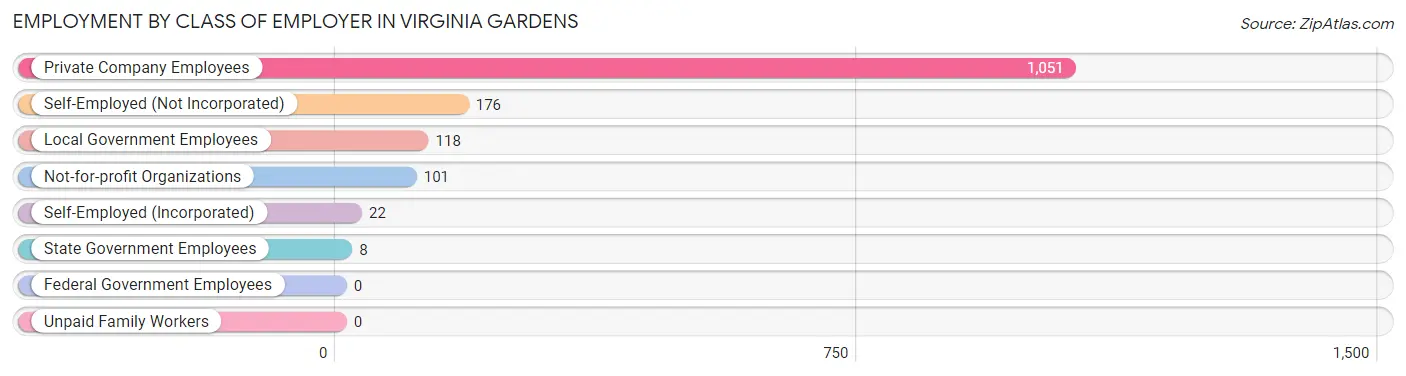
| Employer Class | # Employees | % Employees |
| Private Company Employees | 1,051 | 71.2% |
| Self-Employed (Incorporated) | 22 | 1.5% |
| Self-Employed (Not Incorporated) | 176 | 11.9% |
| Not-for-profit Organizations | 101 | 6.8% |
| Local Government Employees | 118 | 8.0% |
| State Government Employees | 8 | 0.5% |
| Federal Government Employees | 0 | 0.0% |
| Unpaid Family Workers | 0 | 0.0% |
| Total | 1,476 | 100.0% |
Employment Status by Age in Virginia Gardens
According to the labor force statistics for Virginia Gardens, out of the total population over 16 years of age (2,068), 74.6% or 1,543 individuals are in the labor force, with 3.8% or 59 of them unemployed. The age group with the highest labor force participation rate is 30 to 34 years, with 100.0% or 104 individuals in the labor force. Within the labor force, the 30 to 34 years age range has the highest percentage of unemployed individuals, with 15.4% or 16 of them being unemployed.
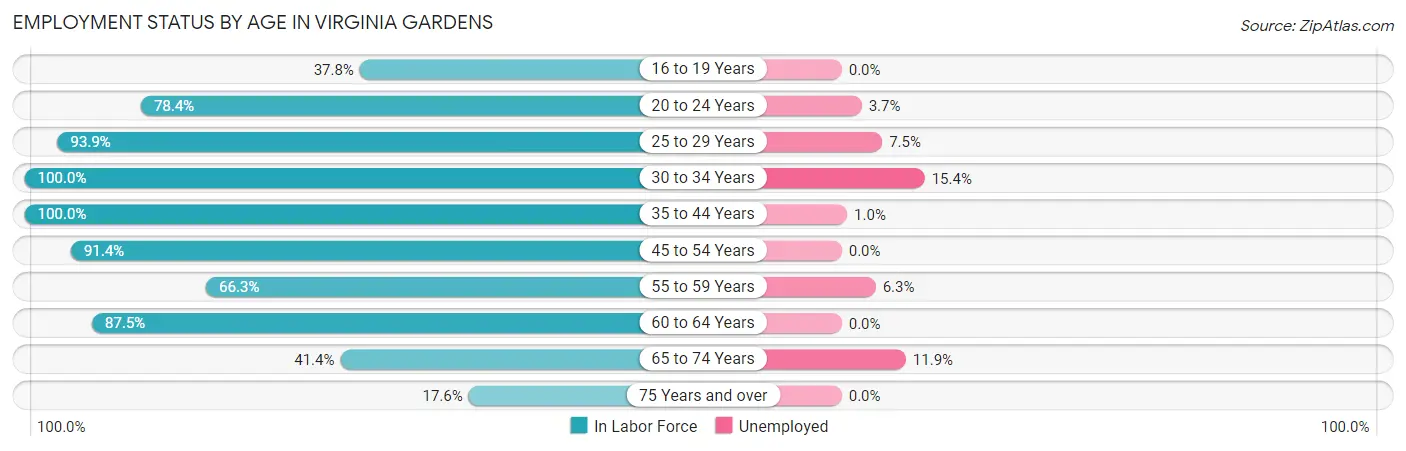
| Age Bracket | In Labor Force | Unemployed |
| 16 to 19 Years | 59 (37.8%) | 0 (0.0%) |
| 20 to 24 Years | 134 (78.4%) | 5 (3.7%) |
| 25 to 29 Years | 201 (93.9%) | 15 (7.5%) |
| 30 to 34 Years | 104 (100.0%) | 16 (15.4%) |
| 35 to 44 Years | 398 (100.0%) | 4 (1.0%) |
| 45 to 54 Years | 277 (91.4%) | 0 (0.0%) |
| 55 to 59 Years | 128 (66.3%) | 8 (6.3%) |
| 60 to 64 Years | 126 (87.5%) | 0 (0.0%) |
| 65 to 74 Years | 84 (41.4%) | 10 (11.9%) |
| 75 Years and over | 32 (17.6%) | 0 (0.0%) |
| Total | 1,543 (74.6%) | 59 (3.8%) |
Employment Status by Educational Attainment in Virginia Gardens
According to labor force statistics for Virginia Gardens, 91.0% of individuals (1,234) out of the total population between 25 and 64 years of age (1,356) are in the labor force, with 3.5% or 43 of them being unemployed. The group with the highest labor force participation rate are those with the educational attainment of bachelor's degree or higher, with 93.1% or 431 individuals in the labor force. Within the labor force, individuals with college / associate degree education have the highest percentage of unemployment, with 7.5% or 27 of them being unemployed.
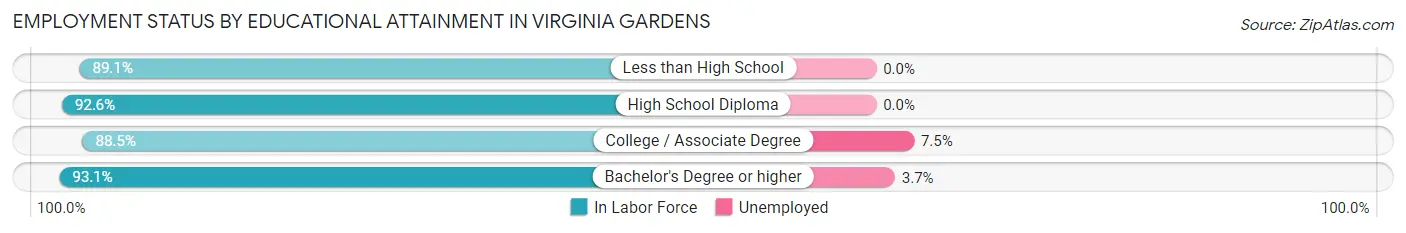
| Educational Attainment | In Labor Force | Unemployed |
| Less than High School | 180 (89.1%) | 0 (0.0%) |
| High School Diploma | 262 (92.6%) | 0 (0.0%) |
| College / Associate Degree | 361 (88.5%) | 31 (7.5%) |
| Bachelor's Degree or higher | 431 (93.1%) | 17 (3.7%) |
| Total | 1,234 (91.0%) | 47 (3.5%) |
Employment Occupations by Sex in Virginia Gardens
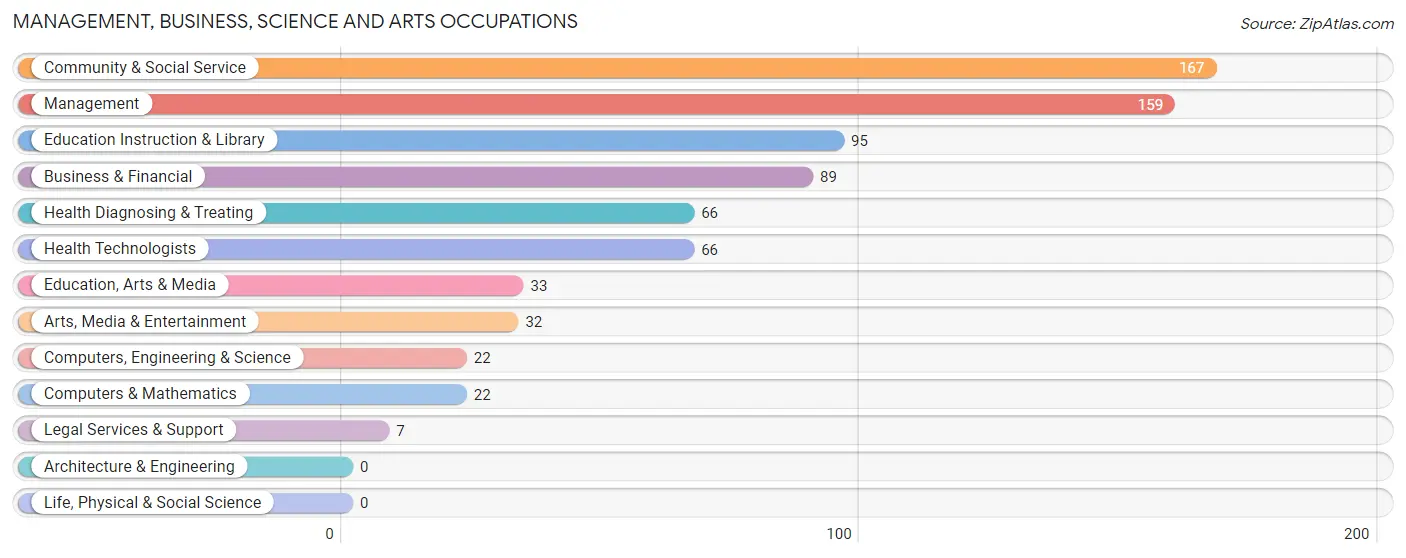
Management, Business, Science and Arts Occupations
The most common Management, Business, Science and Arts occupations in Virginia Gardens are Community & Social Service (167 | 11.3%), Management (159 | 10.7%), Education Instruction & Library (95 | 6.4%), Business & Financial (89 | 6.0%), and Health Diagnosing & Treating (66 | 4.4%).
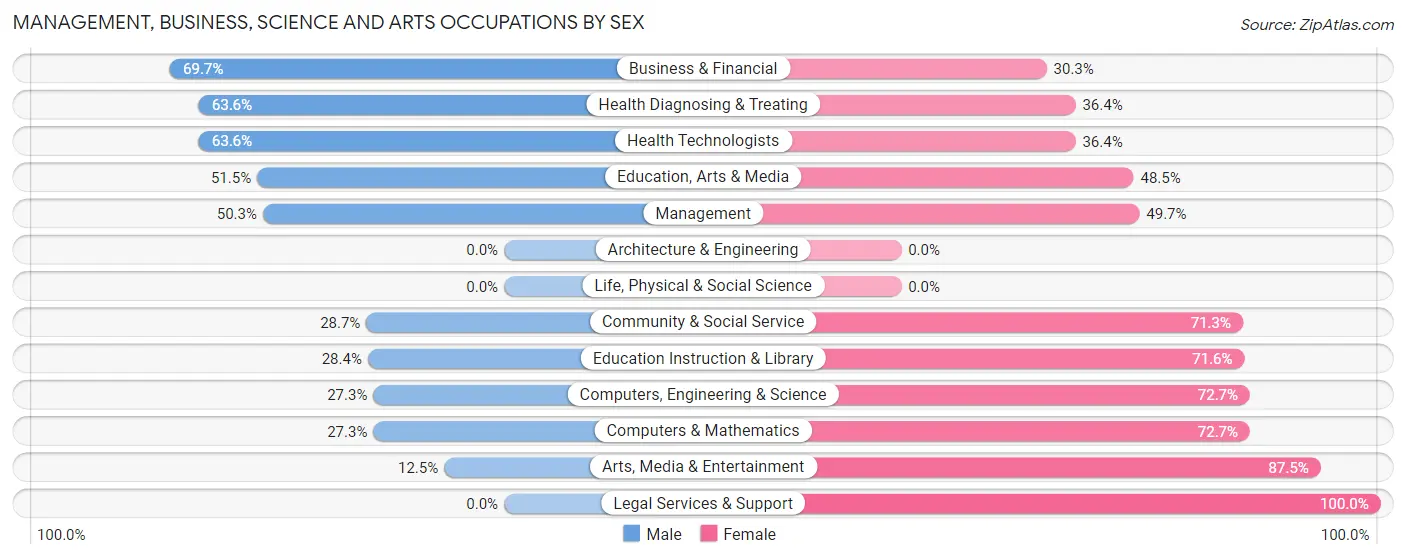
Management, Business, Science and Arts Occupations by Sex
Within the Management, Business, Science and Arts occupations in Virginia Gardens, the most male-oriented occupations are Business & Financial (69.7%), Health Diagnosing & Treating (63.6%), and Health Technologists (63.6%), while the most female-oriented occupations are Legal Services & Support (100.0%), Arts, Media & Entertainment (87.5%), and Computers, Engineering & Science (72.7%).
| Occupation | Male | Female |
| Management | 80 (50.3%) | 79 (49.7%) |
| Business & Financial | 62 (69.7%) | 27 (30.3%) |
| Computers, Engineering & Science | 6 (27.3%) | 16 (72.7%) |
| Computers & Mathematics | 6 (27.3%) | 16 (72.7%) |
| Architecture & Engineering | 0 (0.0%) | 0 (0.0%) |
| Life, Physical & Social Science | 0 (0.0%) | 0 (0.0%) |
| Community & Social Service | 48 (28.7%) | 119 (71.3%) |
| Education, Arts & Media | 17 (51.5%) | 16 (48.5%) |
| Legal Services & Support | 0 (0.0%) | 7 (100.0%) |
| Education Instruction & Library | 27 (28.4%) | 68 (71.6%) |
| Arts, Media & Entertainment | 4 (12.5%) | 28 (87.5%) |
| Health Diagnosing & Treating | 42 (63.6%) | 24 (36.4%) |
| Health Technologists | 42 (63.6%) | 24 (36.4%) |
| Total (Category) | 238 (47.3%) | 265 (52.7%) |
| Total (Overall) | 827 (55.7%) | 658 (44.3%) |
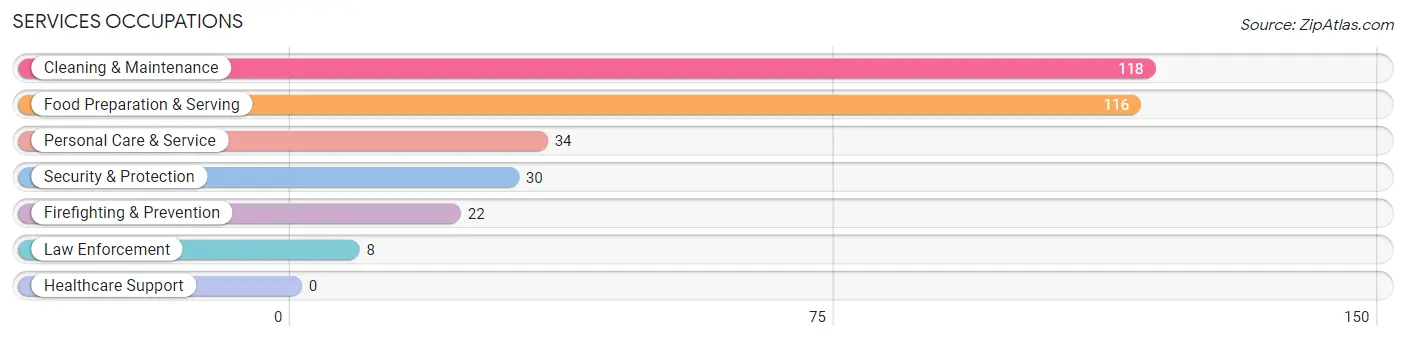
Services Occupations
The most common Services occupations in Virginia Gardens are Cleaning & Maintenance (118 | 8.0%), Food Preparation & Serving (116 | 7.8%), Personal Care & Service (34 | 2.3%), Security & Protection (30 | 2.0%), and Firefighting & Prevention (22 | 1.5%).
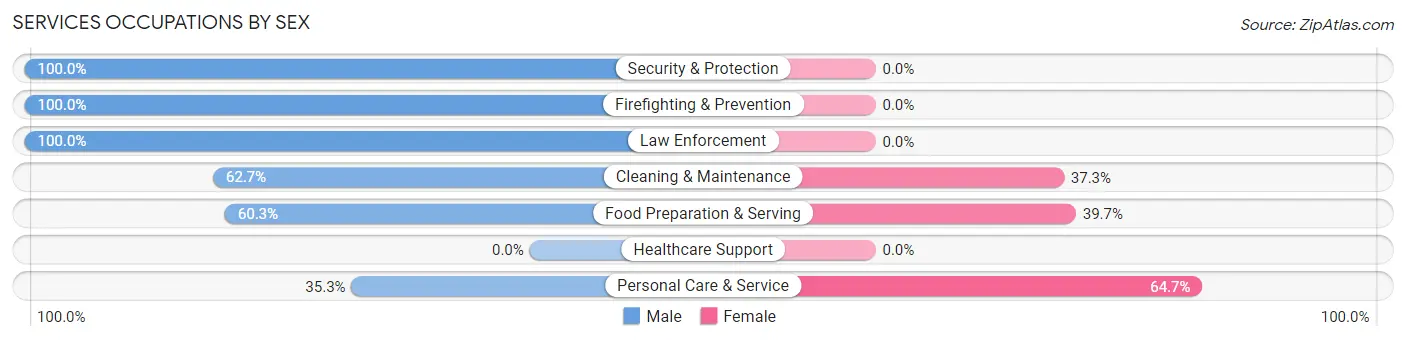
Services Occupations by Sex
Within the Services occupations in Virginia Gardens, the most male-oriented occupations are Security & Protection (100.0%), Firefighting & Prevention (100.0%), and Law Enforcement (100.0%), while the most female-oriented occupations are Personal Care & Service (64.7%), Food Preparation & Serving (39.7%), and Cleaning & Maintenance (37.3%).
| Occupation | Male | Female |
| Healthcare Support | 0 (0.0%) | 0 (0.0%) |
| Security & Protection | 30 (100.0%) | 0 (0.0%) |
| Firefighting & Prevention | 22 (100.0%) | 0 (0.0%) |
| Law Enforcement | 8 (100.0%) | 0 (0.0%) |
| Food Preparation & Serving | 70 (60.3%) | 46 (39.7%) |
| Cleaning & Maintenance | 74 (62.7%) | 44 (37.3%) |
| Personal Care & Service | 12 (35.3%) | 22 (64.7%) |
| Total (Category) | 186 (62.4%) | 112 (37.6%) |
| Total (Overall) | 827 (55.7%) | 658 (44.3%) |
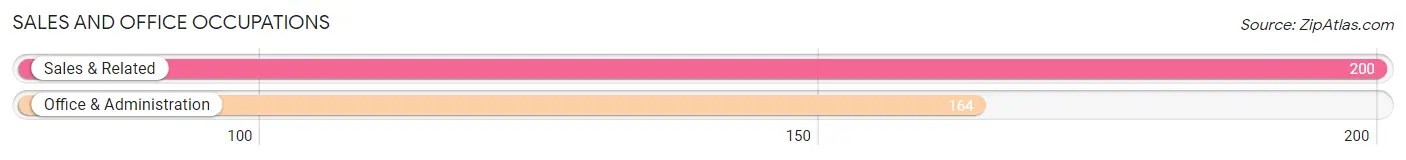
Sales and Office Occupations
The most common Sales and Office occupations in Virginia Gardens are Sales & Related (200 | 13.5%), and Office & Administration (164 | 11.0%).
Sales and Office Occupations by Sex
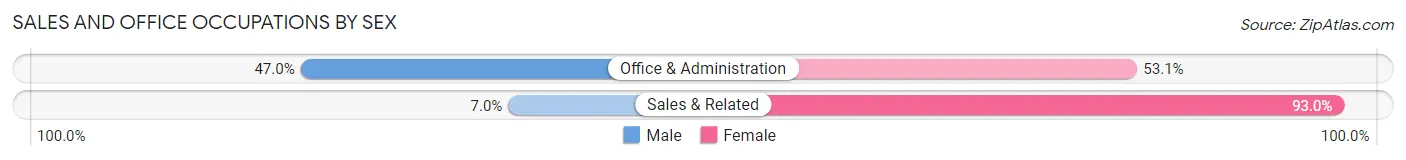
| Occupation | Male | Female |
| Sales & Related | 14 (7.0%) | 186 (93.0%) |
| Office & Administration | 77 (46.9%) | 87 (53.0%) |
| Total (Category) | 91 (25.0%) | 273 (75.0%) |
| Total (Overall) | 827 (55.7%) | 658 (44.3%) |
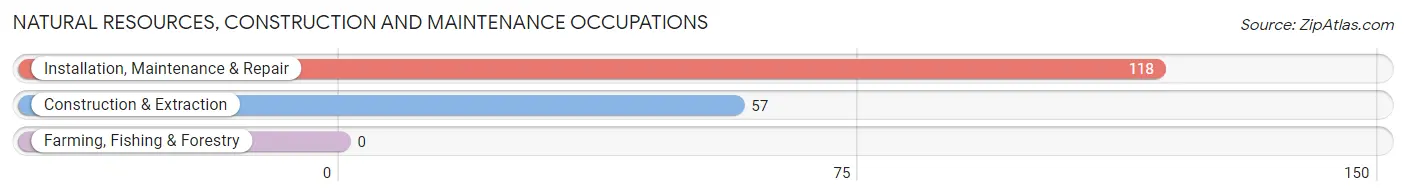
Natural Resources, Construction and Maintenance Occupations
The most common Natural Resources, Construction and Maintenance occupations in Virginia Gardens are Installation, Maintenance & Repair (118 | 8.0%), and Construction & Extraction (57 | 3.8%).
Natural Resources, Construction and Maintenance Occupations by Sex
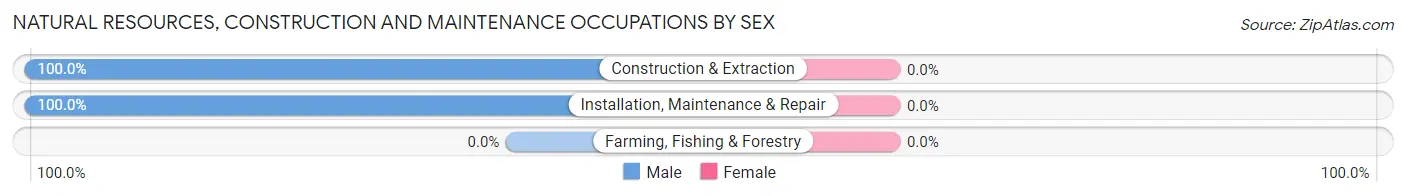
| Occupation | Male | Female |
| Farming, Fishing & Forestry | 0 (0.0%) | 0 (0.0%) |
| Construction & Extraction | 57 (100.0%) | 0 (0.0%) |
| Installation, Maintenance & Repair | 118 (100.0%) | 0 (0.0%) |
| Total (Category) | 175 (100.0%) | 0 (0.0%) |
| Total (Overall) | 827 (55.7%) | 658 (44.3%) |
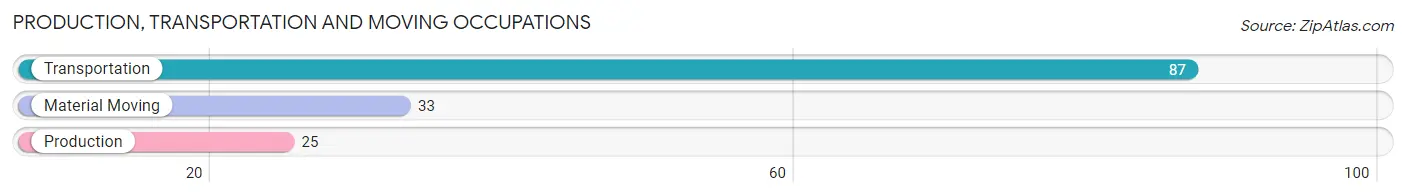
Production, Transportation and Moving Occupations
The most common Production, Transportation and Moving occupations in Virginia Gardens are Transportation (87 | 5.9%), Material Moving (33 | 2.2%), and Production (25 | 1.7%).
Production, Transportation and Moving Occupations by Sex

| Occupation | Male | Female |
| Production | 24 (96.0%) | 1 (4.0%) |
| Transportation | 80 (91.9%) | 7 (8.1%) |
| Material Moving | 33 (100.0%) | 0 (0.0%) |
| Total (Category) | 137 (94.5%) | 8 (5.5%) |
| Total (Overall) | 827 (55.7%) | 658 (44.3%) |
Employment Industries by Sex in Virginia Gardens
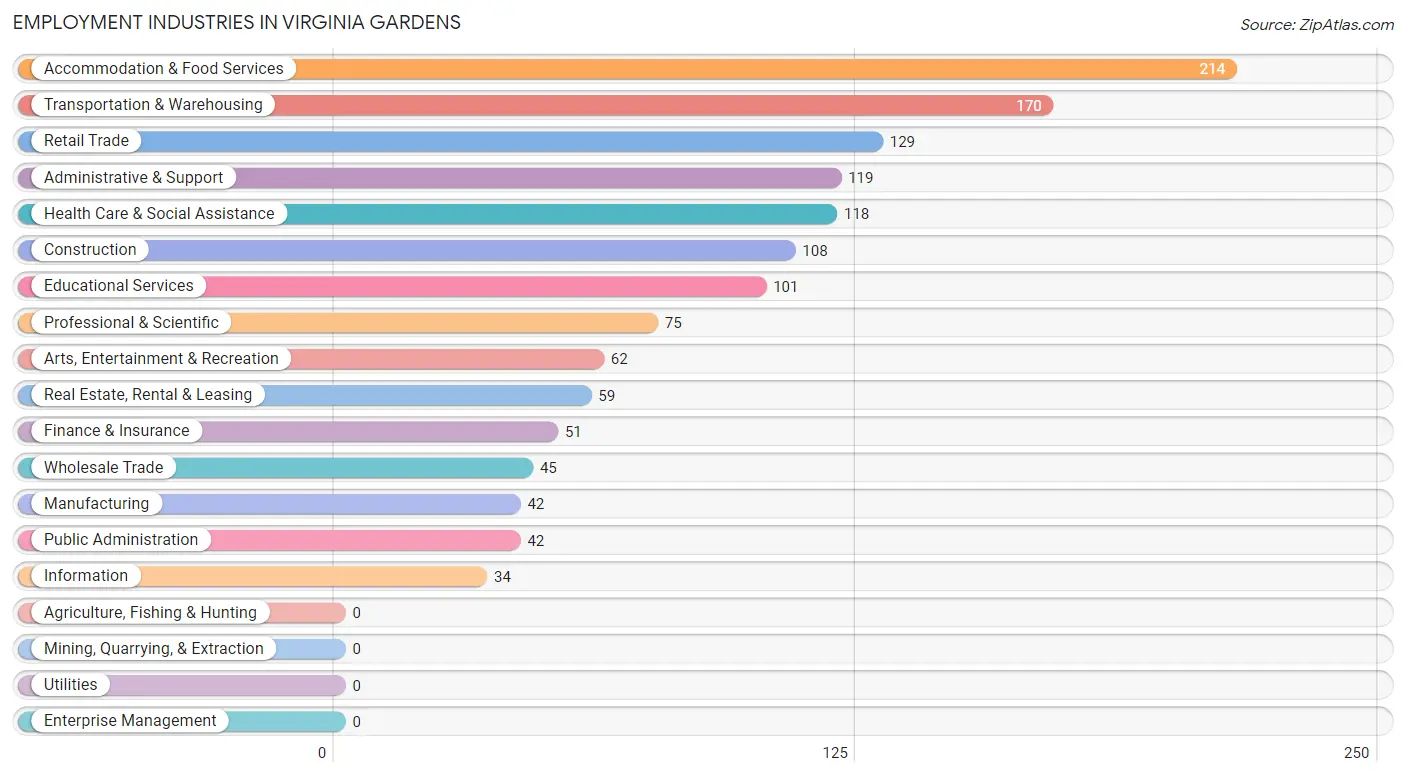
Employment Industries in Virginia Gardens
The major employment industries in Virginia Gardens include Accommodation & Food Services (214 | 14.4%), Transportation & Warehousing (170 | 11.5%), Retail Trade (129 | 8.7%), Administrative & Support (119 | 8.0%), and Health Care & Social Assistance (118 | 8.0%).
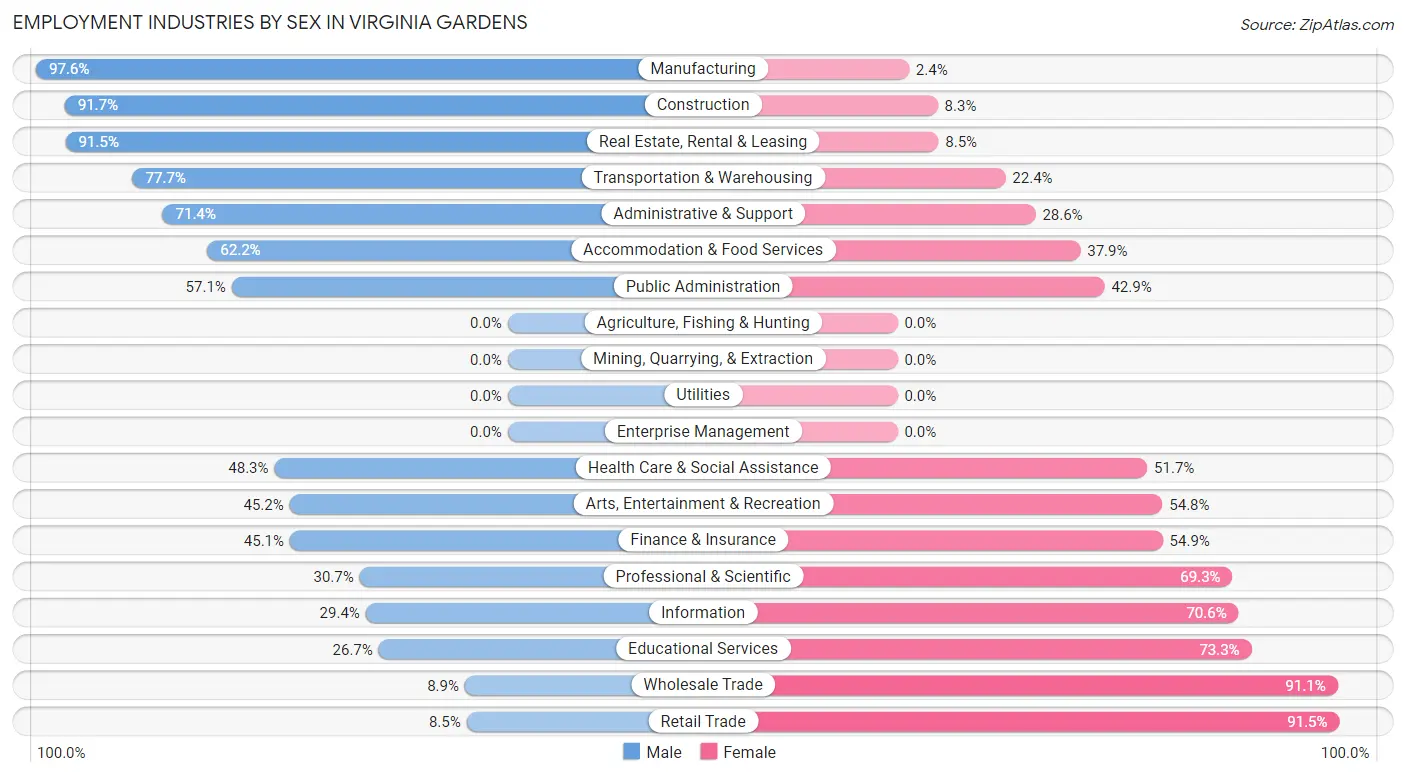
Employment Industries by Sex in Virginia Gardens
The Virginia Gardens industries that see more men than women are Manufacturing (97.6%), Construction (91.7%), and Real Estate, Rental & Leasing (91.5%), whereas the industries that tend to have a higher number of women are Retail Trade (91.5%), Wholesale Trade (91.1%), and Educational Services (73.3%).
| Industry | Male | Female |
| Agriculture, Fishing & Hunting | 0 (0.0%) | 0 (0.0%) |
| Mining, Quarrying, & Extraction | 0 (0.0%) | 0 (0.0%) |
| Construction | 99 (91.7%) | 9 (8.3%) |
| Manufacturing | 41 (97.6%) | 1 (2.4%) |
| Wholesale Trade | 4 (8.9%) | 41 (91.1%) |
| Retail Trade | 11 (8.5%) | 118 (91.5%) |
| Transportation & Warehousing | 132 (77.6%) | 38 (22.4%) |
| Utilities | 0 (0.0%) | 0 (0.0%) |
| Information | 10 (29.4%) | 24 (70.6%) |
| Finance & Insurance | 23 (45.1%) | 28 (54.9%) |
| Real Estate, Rental & Leasing | 54 (91.5%) | 5 (8.5%) |
| Professional & Scientific | 23 (30.7%) | 52 (69.3%) |
| Enterprise Management | 0 (0.0%) | 0 (0.0%) |
| Administrative & Support | 85 (71.4%) | 34 (28.6%) |
| Educational Services | 27 (26.7%) | 74 (73.3%) |
| Health Care & Social Assistance | 57 (48.3%) | 61 (51.7%) |
| Arts, Entertainment & Recreation | 28 (45.2%) | 34 (54.8%) |
| Accommodation & Food Services | 133 (62.2%) | 81 (37.9%) |
| Public Administration | 24 (57.1%) | 18 (42.9%) |
| Total | 827 (55.7%) | 658 (44.3%) |
Education in Virginia Gardens
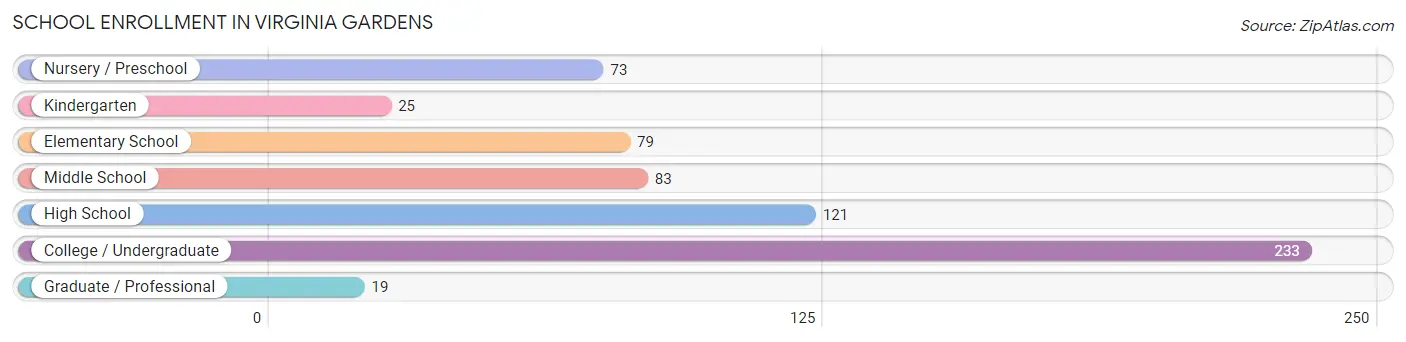
School Enrollment in Virginia Gardens
The most common levels of schooling among the 633 students in Virginia Gardens are college / undergraduate (233 | 36.8%), high school (121 | 19.1%), and middle school (83 | 13.1%).
| School Level | # Students | % Students |
| Nursery / Preschool | 73 | 11.5% |
| Kindergarten | 25 | 4.0% |
| Elementary School | 79 | 12.5% |
| Middle School | 83 | 13.1% |
| High School | 121 | 19.1% |
| College / Undergraduate | 233 | 36.8% |
| Graduate / Professional | 19 | 3.0% |
| Total | 633 | 100.0% |
School Enrollment by Age by Funding Source in Virginia Gardens
Out of a total of 633 students who are enrolled in schools in Virginia Gardens, 173 (27.3%) attend a private institution, while the remaining 460 (72.7%) are enrolled in public schools. The age group of 35 years and over has the highest likelihood of being enrolled in private schools, with 10 (66.7% in the age bracket) enrolled. Conversely, the age group of 10 to 14 year olds has the lowest likelihood of being enrolled in a private school, with 83 (100.0% in the age bracket) attending a public institution.
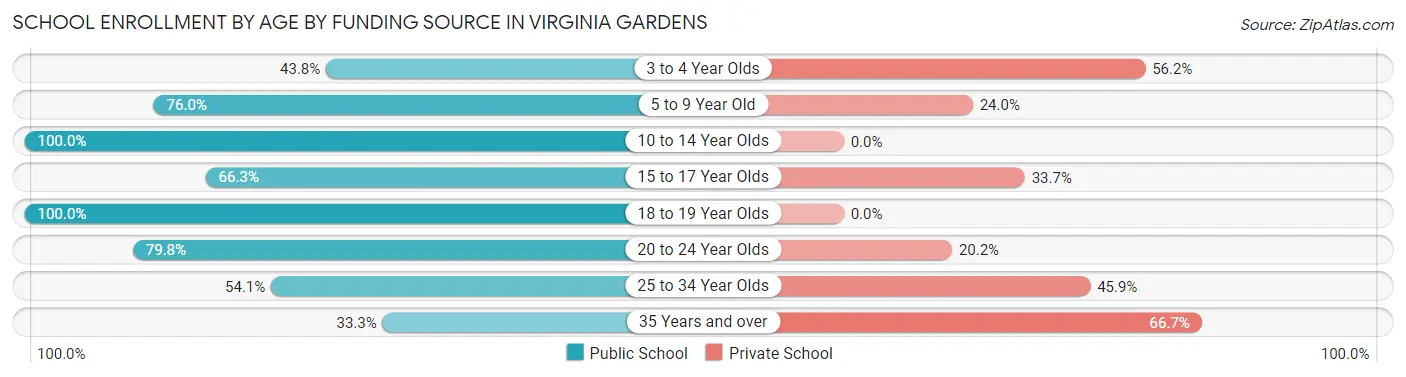
| Age Bracket | Public School | Private School |
| 3 to 4 Year Olds | 32 (43.8%) | 41 (56.2%) |
| 5 to 9 Year Old | 79 (76.0%) | 25 (24.0%) |
| 10 to 14 Year Olds | 83 (100.0%) | 0 (0.0%) |
| 15 to 17 Year Olds | 55 (66.3%) | 28 (33.7%) |
| 18 to 19 Year Olds | 58 (100.0%) | 0 (0.0%) |
| 20 to 24 Year Olds | 95 (79.8%) | 24 (20.2%) |
| 25 to 34 Year Olds | 53 (54.1%) | 45 (45.9%) |
| 35 Years and over | 5 (33.3%) | 10 (66.7%) |
| Total | 460 (72.7%) | 173 (27.3%) |
Educational Attainment by Field of Study in Virginia Gardens
Business (182 | 33.1%), education (96 | 17.4%), science & technology (64 | 11.6%), engineering (42 | 7.6%), and bio, nature & agricultural (29 | 5.3%) are the most common fields of study among 550 individuals in Virginia Gardens who have obtained a bachelor's degree or higher.
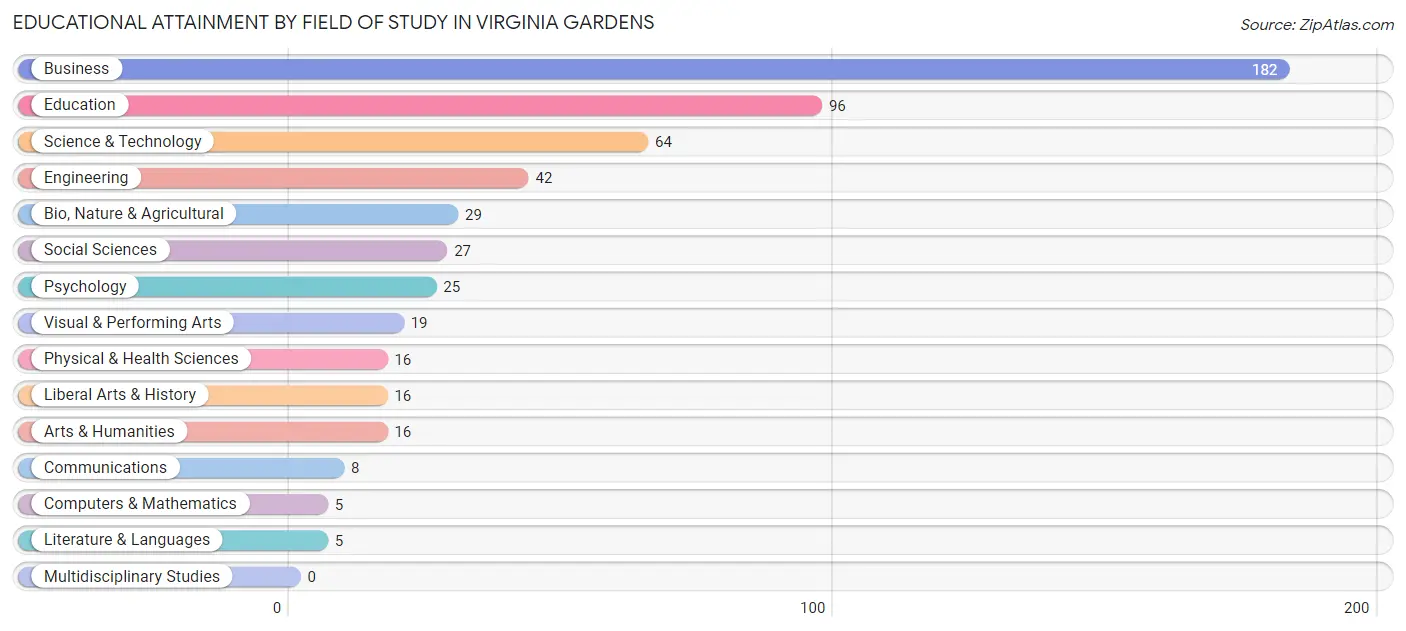
| Field of Study | # Graduates | % Graduates |
| Computers & Mathematics | 5 | 0.9% |
| Bio, Nature & Agricultural | 29 | 5.3% |
| Physical & Health Sciences | 16 | 2.9% |
| Psychology | 25 | 4.5% |
| Social Sciences | 27 | 4.9% |
| Engineering | 42 | 7.6% |
| Multidisciplinary Studies | 0 | 0.0% |
| Science & Technology | 64 | 11.6% |
| Business | 182 | 33.1% |
| Education | 96 | 17.4% |
| Literature & Languages | 5 | 0.9% |
| Liberal Arts & History | 16 | 2.9% |
| Visual & Performing Arts | 19 | 3.5% |
| Communications | 8 | 1.5% |
| Arts & Humanities | 16 | 2.9% |
| Total | 550 | 100.0% |
Transportation & Commute in Virginia Gardens
Vehicle Availability by Sex in Virginia Gardens
The most prevalent vehicle ownership categories in Virginia Gardens are males with 2 vehicles (286, accounting for 34.6%) and females with 2 vehicles (344, making up 44.1%).
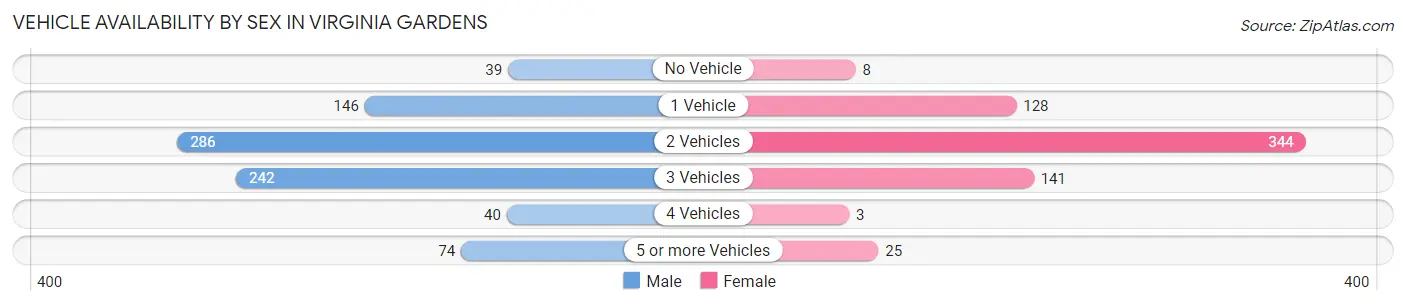
| Vehicles Available | Male | Female |
| No Vehicle | 39 (4.7%) | 8 (1.2%) |
| 1 Vehicle | 146 (17.6%) | 128 (19.7%) |
| 2 Vehicles | 286 (34.6%) | 344 (53.0%) |
| 3 Vehicles | 242 (29.3%) | 141 (21.7%) |
| 4 Vehicles | 40 (4.8%) | 3 (0.5%) |
| 5 or more Vehicles | 74 (8.9%) | 25 (3.8%) |
| Total | 827 (100.0%) | 649 (100.0%) |
Commute Time in Virginia Gardens
The most frequently occuring commute durations in Virginia Gardens are 10 to 14 minutes (324 commuters, 23.3%), 15 to 19 minutes (231 commuters, 16.6%), and 20 to 24 minutes (208 commuters, 14.9%).
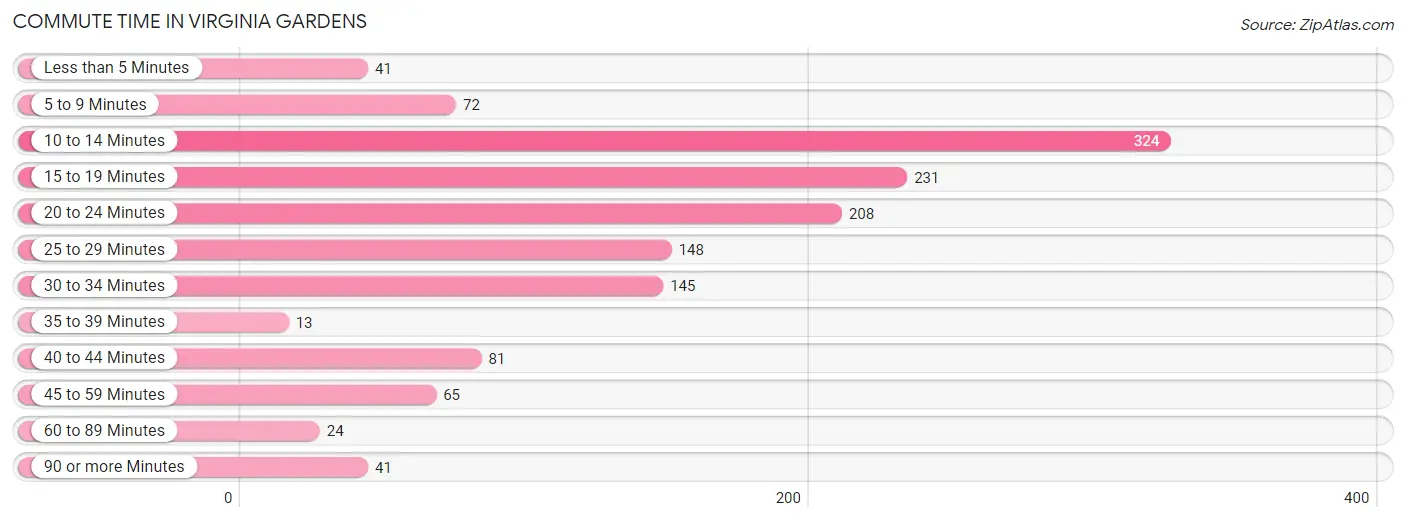
| Commute Time | # Commuters | % Commuters |
| Less than 5 Minutes | 41 | 2.9% |
| 5 to 9 Minutes | 72 | 5.2% |
| 10 to 14 Minutes | 324 | 23.3% |
| 15 to 19 Minutes | 231 | 16.6% |
| 20 to 24 Minutes | 208 | 14.9% |
| 25 to 29 Minutes | 148 | 10.6% |
| 30 to 34 Minutes | 145 | 10.4% |
| 35 to 39 Minutes | 13 | 0.9% |
| 40 to 44 Minutes | 81 | 5.8% |
| 45 to 59 Minutes | 65 | 4.7% |
| 60 to 89 Minutes | 24 | 1.7% |
| 90 or more Minutes | 41 | 2.9% |
Commute Time by Sex in Virginia Gardens
The most common commute times in Virginia Gardens are 10 to 14 minutes (231 commuters, 29.5%) for males and 20 to 24 minutes (136 commuters, 22.3%) for females.
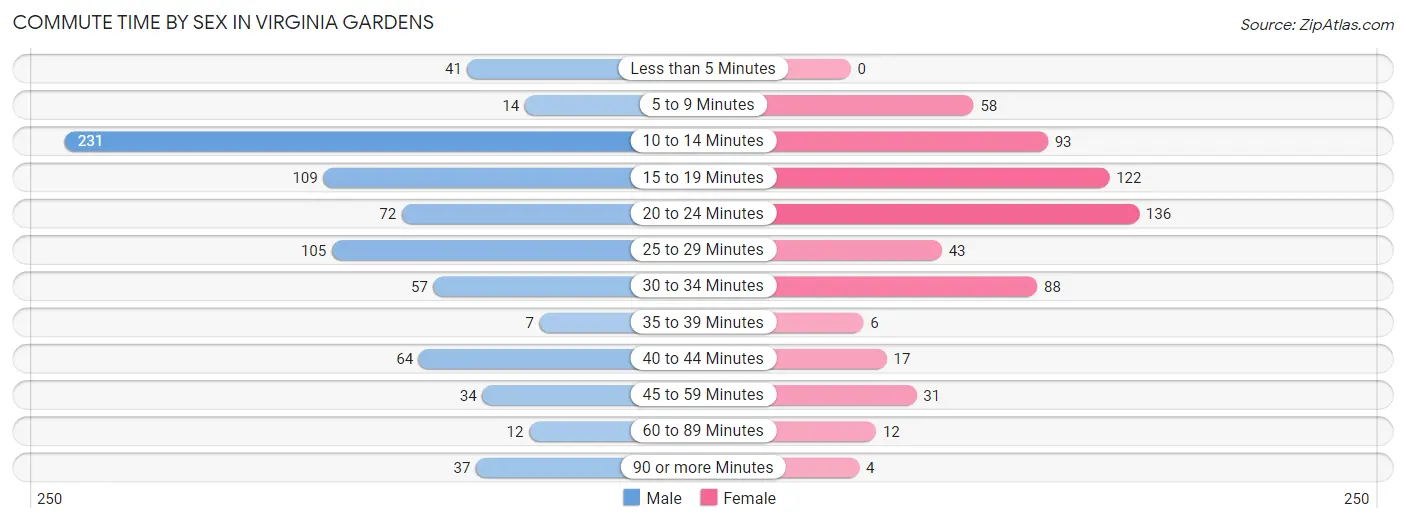
| Commute Time | Male | Female |
| Less than 5 Minutes | 41 (5.2%) | 0 (0.0%) |
| 5 to 9 Minutes | 14 (1.8%) | 58 (9.5%) |
| 10 to 14 Minutes | 231 (29.5%) | 93 (15.2%) |
| 15 to 19 Minutes | 109 (13.9%) | 122 (20.0%) |
| 20 to 24 Minutes | 72 (9.2%) | 136 (22.3%) |
| 25 to 29 Minutes | 105 (13.4%) | 43 (7.0%) |
| 30 to 34 Minutes | 57 (7.3%) | 88 (14.4%) |
| 35 to 39 Minutes | 7 (0.9%) | 6 (1.0%) |
| 40 to 44 Minutes | 64 (8.2%) | 17 (2.8%) |
| 45 to 59 Minutes | 34 (4.3%) | 31 (5.1%) |
| 60 to 89 Minutes | 12 (1.5%) | 12 (2.0%) |
| 90 or more Minutes | 37 (4.7%) | 4 (0.7%) |
Time of Departure to Work by Sex in Virginia Gardens
The most frequent times of departure to work in Virginia Gardens are 8:00 AM to 8:29 AM (145, 18.5%) for males and 8:00 AM to 8:29 AM (103, 16.9%) for females.
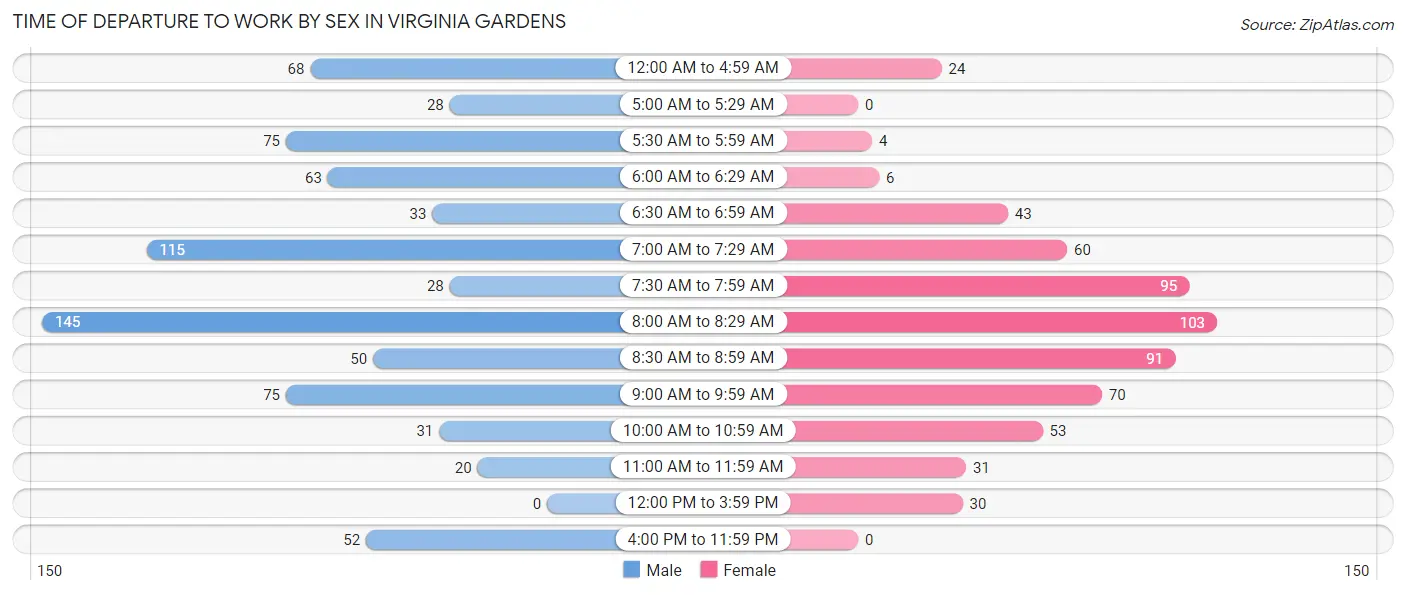
| Time of Departure | Male | Female |
| 12:00 AM to 4:59 AM | 68 (8.7%) | 24 (3.9%) |
| 5:00 AM to 5:29 AM | 28 (3.6%) | 0 (0.0%) |
| 5:30 AM to 5:59 AM | 75 (9.6%) | 4 (0.7%) |
| 6:00 AM to 6:29 AM | 63 (8.1%) | 6 (1.0%) |
| 6:30 AM to 6:59 AM | 33 (4.2%) | 43 (7.0%) |
| 7:00 AM to 7:29 AM | 115 (14.7%) | 60 (9.8%) |
| 7:30 AM to 7:59 AM | 28 (3.6%) | 95 (15.6%) |
| 8:00 AM to 8:29 AM | 145 (18.5%) | 103 (16.9%) |
| 8:30 AM to 8:59 AM | 50 (6.4%) | 91 (14.9%) |
| 9:00 AM to 9:59 AM | 75 (9.6%) | 70 (11.5%) |
| 10:00 AM to 10:59 AM | 31 (4.0%) | 53 (8.7%) |
| 11:00 AM to 11:59 AM | 20 (2.5%) | 31 (5.1%) |
| 12:00 PM to 3:59 PM | 0 (0.0%) | 30 (4.9%) |
| 4:00 PM to 11:59 PM | 52 (6.6%) | 0 (0.0%) |
| Total | 783 (100.0%) | 610 (100.0%) |
Housing Occupancy in Virginia Gardens
Occupancy by Ownership in Virginia Gardens
Of the total 802 dwellings in Virginia Gardens, owner-occupied units account for 438 (54.6%), while renter-occupied units make up 364 (45.4%).
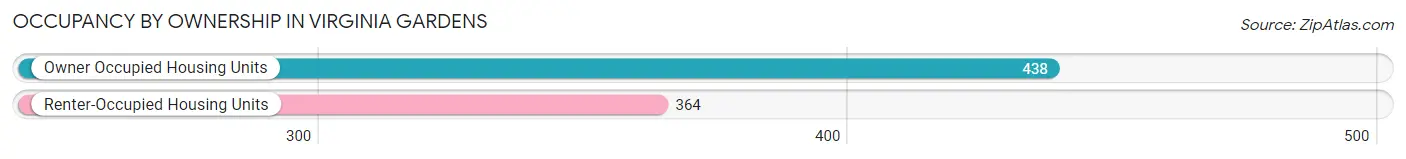
| Occupancy | # Housing Units | % Housing Units |
| Owner Occupied Housing Units | 438 | 54.6% |
| Renter-Occupied Housing Units | 364 | 45.4% |
| Total Occupied Housing Units | 802 | 100.0% |
Occupancy by Household Size in Virginia Gardens
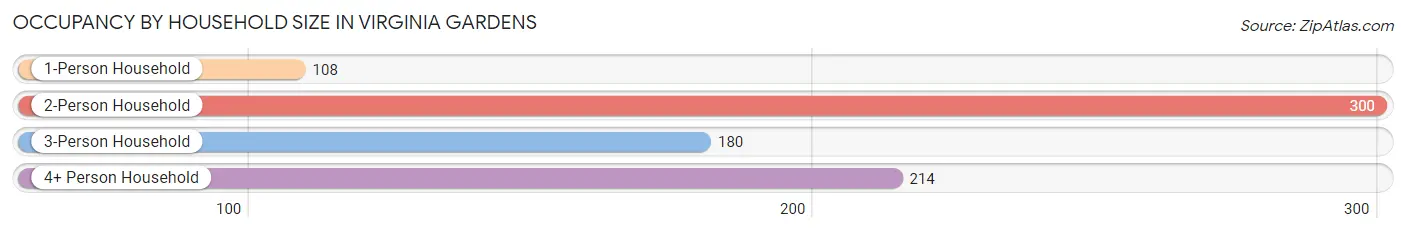
| Household Size | # Housing Units | % Housing Units |
| 1-Person Household | 108 | 13.5% |
| 2-Person Household | 300 | 37.4% |
| 3-Person Household | 180 | 22.4% |
| 4+ Person Household | 214 | 26.7% |
| Total Housing Units | 802 | 100.0% |
Occupancy by Ownership by Household Size in Virginia Gardens
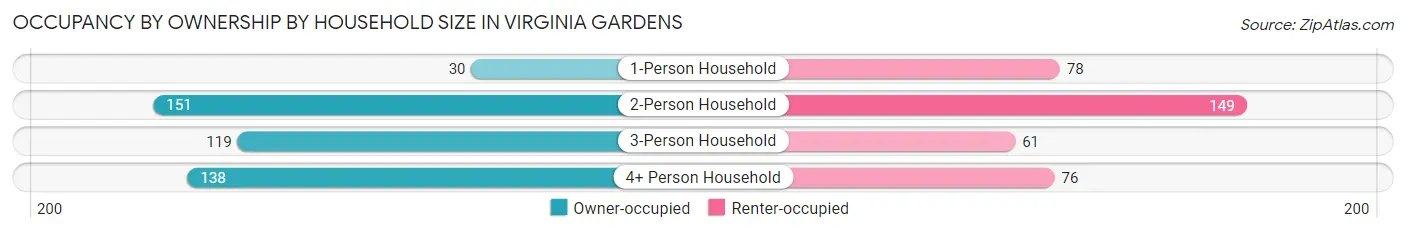
| Household Size | Owner-occupied | Renter-occupied |
| 1-Person Household | 30 (27.8%) | 78 (72.2%) |
| 2-Person Household | 151 (50.3%) | 149 (49.7%) |
| 3-Person Household | 119 (66.1%) | 61 (33.9%) |
| 4+ Person Household | 138 (64.5%) | 76 (35.5%) |
| Total Housing Units | 438 (54.6%) | 364 (45.4%) |
Occupancy by Educational Attainment in Virginia Gardens
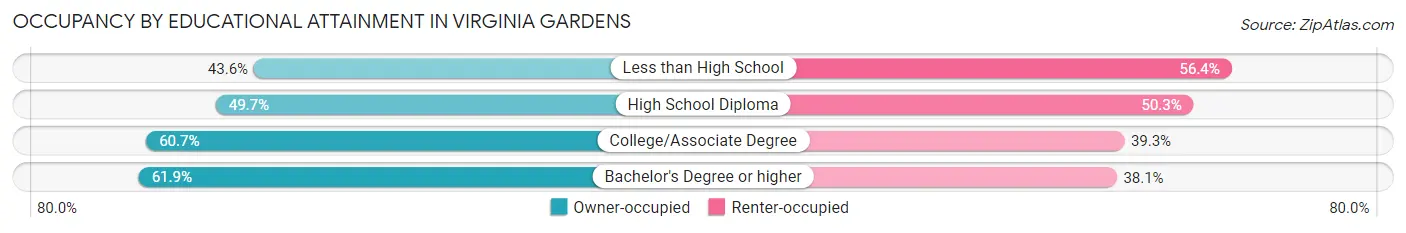
| Household Size | Owner-occupied | Renter-occupied |
| Less than High School | 89 (43.6%) | 115 (56.4%) |
| High School Diploma | 76 (49.7%) | 77 (50.3%) |
| College/Associate Degree | 122 (60.7%) | 79 (39.3%) |
| Bachelor's Degree or higher | 151 (61.9%) | 93 (38.1%) |
Occupancy by Age of Householder in Virginia Gardens
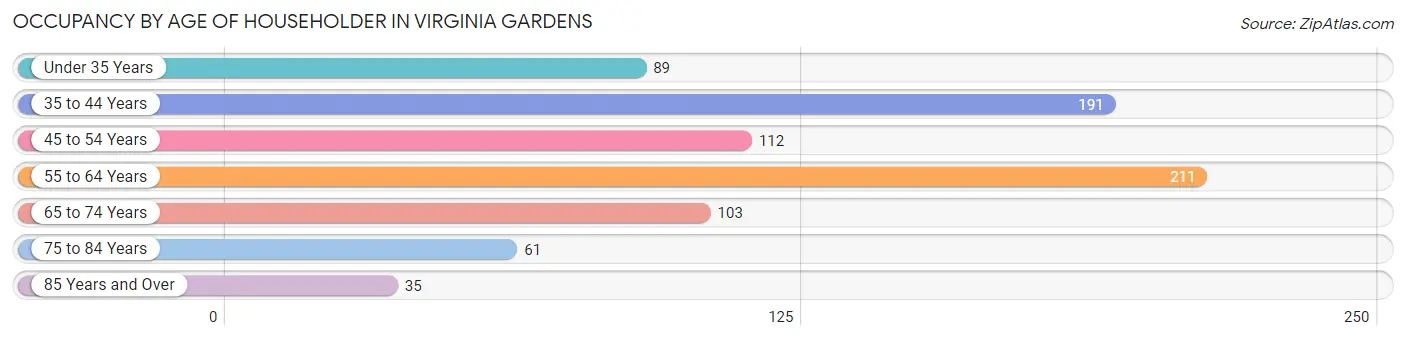
| Age Bracket | # Households | % Households |
| Under 35 Years | 89 | 11.1% |
| 35 to 44 Years | 191 | 23.8% |
| 45 to 54 Years | 112 | 14.0% |
| 55 to 64 Years | 211 | 26.3% |
| 65 to 74 Years | 103 | 12.8% |
| 75 to 84 Years | 61 | 7.6% |
| 85 Years and Over | 35 | 4.4% |
| Total | 802 | 100.0% |
Housing Finances in Virginia Gardens
Median Income by Occupancy in Virginia Gardens
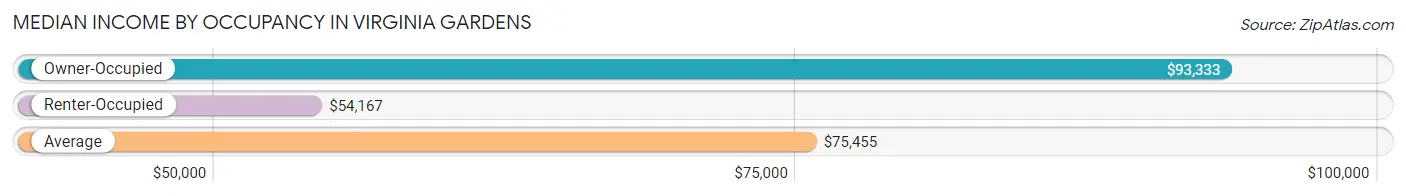
| Occupancy Type | # Households | Median Income |
| Owner-Occupied | 438 (54.6%) | $93,333 |
| Renter-Occupied | 364 (45.4%) | $54,167 |
| Average | 802 (100.0%) | $75,455 |
Occupancy by Householder Income Bracket in Virginia Gardens
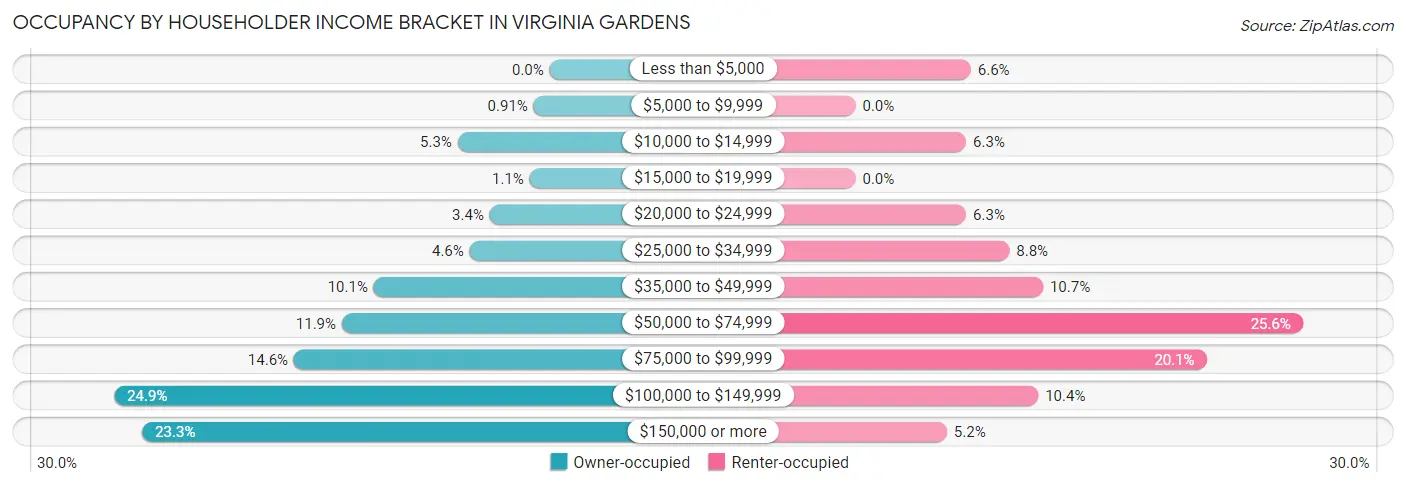
| Income Bracket | Owner-occupied | Renter-occupied |
| Less than $5,000 | 0 (0.0%) | 24 (6.6%) |
| $5,000 to $9,999 | 4 (0.9%) | 0 (0.0%) |
| $10,000 to $14,999 | 23 (5.2%) | 23 (6.3%) |
| $15,000 to $19,999 | 5 (1.1%) | 0 (0.0%) |
| $20,000 to $24,999 | 15 (3.4%) | 23 (6.3%) |
| $25,000 to $34,999 | 20 (4.6%) | 32 (8.8%) |
| $35,000 to $49,999 | 44 (10.1%) | 39 (10.7%) |
| $50,000 to $74,999 | 52 (11.9%) | 93 (25.6%) |
| $75,000 to $99,999 | 64 (14.6%) | 73 (20.1%) |
| $100,000 to $149,999 | 109 (24.9%) | 38 (10.4%) |
| $150,000 or more | 102 (23.3%) | 19 (5.2%) |
| Total | 438 (100.0%) | 364 (100.0%) |
Monthly Housing Cost Tiers in Virginia Gardens
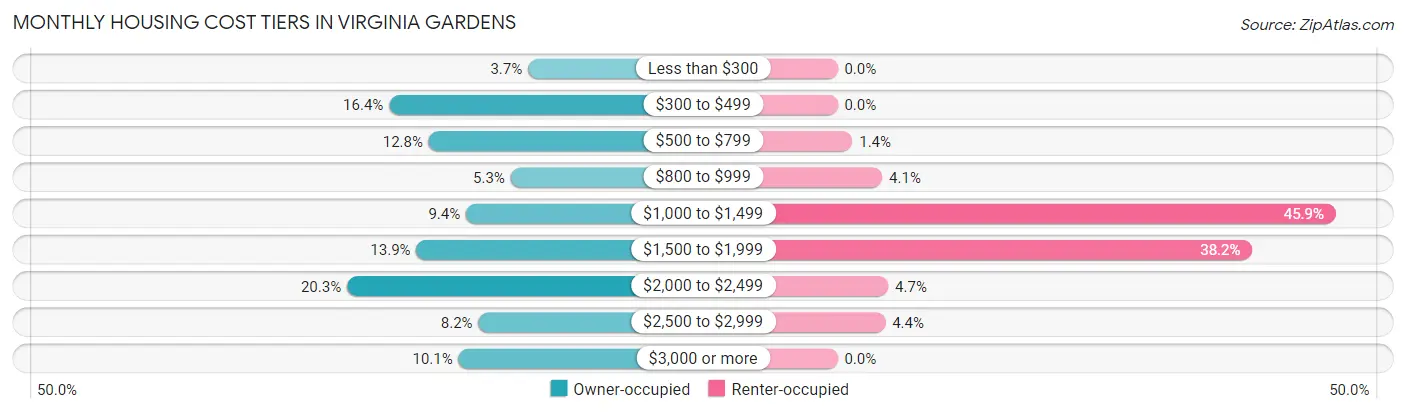
| Monthly Cost | Owner-occupied | Renter-occupied |
| Less than $300 | 16 (3.6%) | 0 (0.0%) |
| $300 to $499 | 72 (16.4%) | 0 (0.0%) |
| $500 to $799 | 56 (12.8%) | 5 (1.4%) |
| $800 to $999 | 23 (5.2%) | 15 (4.1%) |
| $1,000 to $1,499 | 41 (9.4%) | 167 (45.9%) |
| $1,500 to $1,999 | 61 (13.9%) | 139 (38.2%) |
| $2,000 to $2,499 | 89 (20.3%) | 17 (4.7%) |
| $2,500 to $2,999 | 36 (8.2%) | 16 (4.4%) |
| $3,000 or more | 44 (10.1%) | 0 (0.0%) |
| Total | 438 (100.0%) | 364 (100.0%) |
Physical Housing Characteristics in Virginia Gardens
Housing Structures in Virginia Gardens
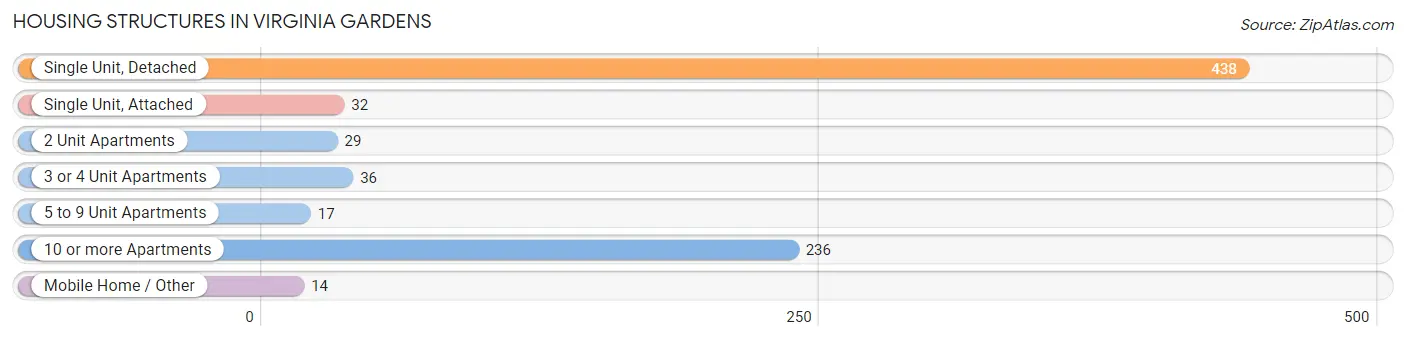
| Structure Type | # Housing Units | % Housing Units |
| Single Unit, Detached | 438 | 54.6% |
| Single Unit, Attached | 32 | 4.0% |
| 2 Unit Apartments | 29 | 3.6% |
| 3 or 4 Unit Apartments | 36 | 4.5% |
| 5 to 9 Unit Apartments | 17 | 2.1% |
| 10 or more Apartments | 236 | 29.4% |
| Mobile Home / Other | 14 | 1.8% |
| Total | 802 | 100.0% |
Housing Structures by Occupancy in Virginia Gardens
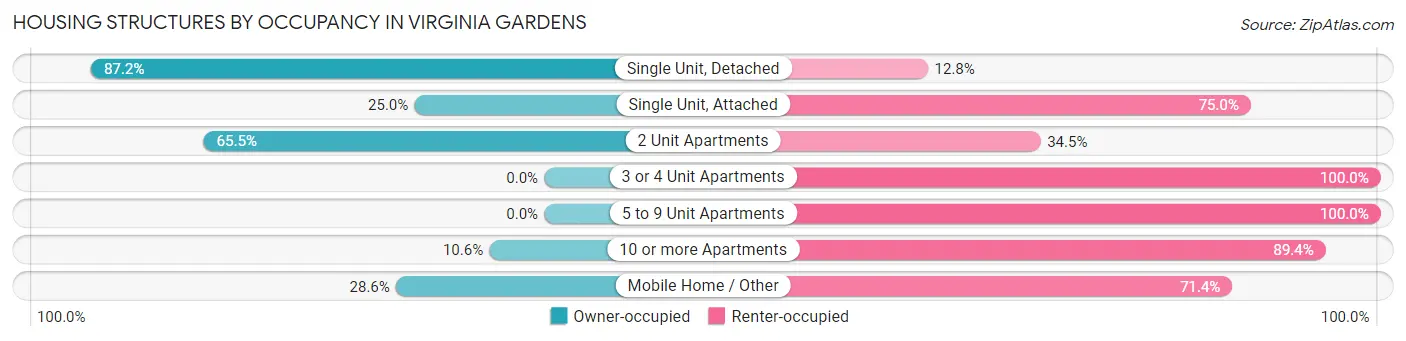
| Structure Type | Owner-occupied | Renter-occupied |
| Single Unit, Detached | 382 (87.2%) | 56 (12.8%) |
| Single Unit, Attached | 8 (25.0%) | 24 (75.0%) |
| 2 Unit Apartments | 19 (65.5%) | 10 (34.5%) |
| 3 or 4 Unit Apartments | 0 (0.0%) | 36 (100.0%) |
| 5 to 9 Unit Apartments | 0 (0.0%) | 17 (100.0%) |
| 10 or more Apartments | 25 (10.6%) | 211 (89.4%) |
| Mobile Home / Other | 4 (28.6%) | 10 (71.4%) |
| Total | 438 (54.6%) | 364 (45.4%) |
Housing Structures by Number of Rooms in Virginia Gardens
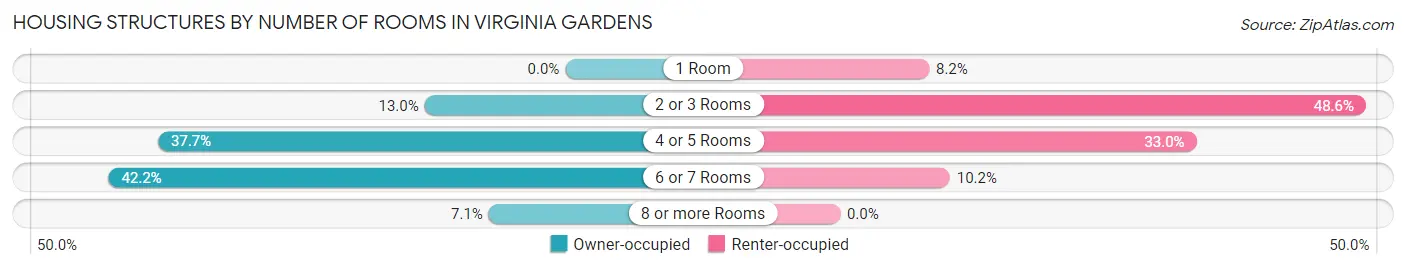
| Number of Rooms | Owner-occupied | Renter-occupied |
| 1 Room | 0 (0.0%) | 30 (8.2%) |
| 2 or 3 Rooms | 57 (13.0%) | 177 (48.6%) |
| 4 or 5 Rooms | 165 (37.7%) | 120 (33.0%) |
| 6 or 7 Rooms | 185 (42.2%) | 37 (10.2%) |
| 8 or more Rooms | 31 (7.1%) | 0 (0.0%) |
| Total | 438 (100.0%) | 364 (100.0%) |
Housing Structure by Heating Type in Virginia Gardens
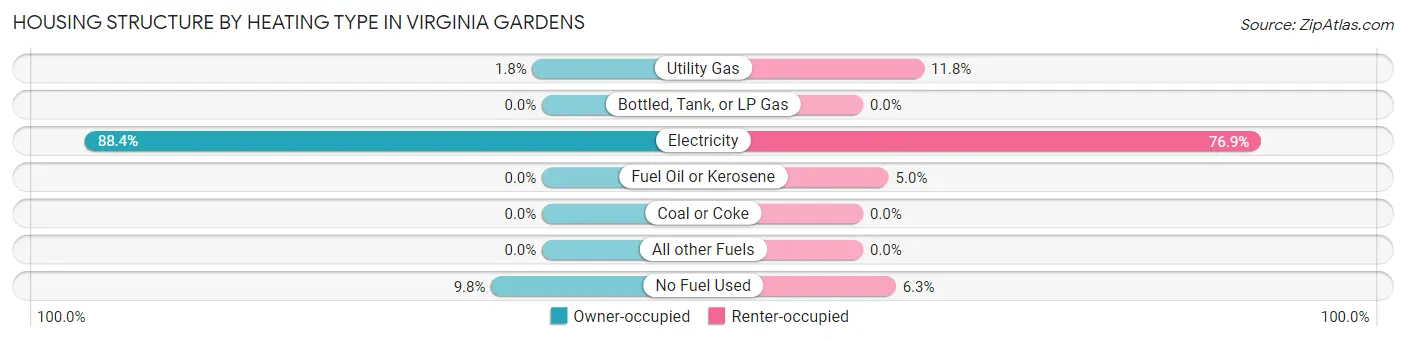
| Heating Type | Owner-occupied | Renter-occupied |
| Utility Gas | 8 (1.8%) | 43 (11.8%) |
| Bottled, Tank, or LP Gas | 0 (0.0%) | 0 (0.0%) |
| Electricity | 387 (88.4%) | 280 (76.9%) |
| Fuel Oil or Kerosene | 0 (0.0%) | 18 (5.0%) |
| Coal or Coke | 0 (0.0%) | 0 (0.0%) |
| All other Fuels | 0 (0.0%) | 0 (0.0%) |
| No Fuel Used | 43 (9.8%) | 23 (6.3%) |
| Total | 438 (100.0%) | 364 (100.0%) |
Household Vehicle Usage in Virginia Gardens
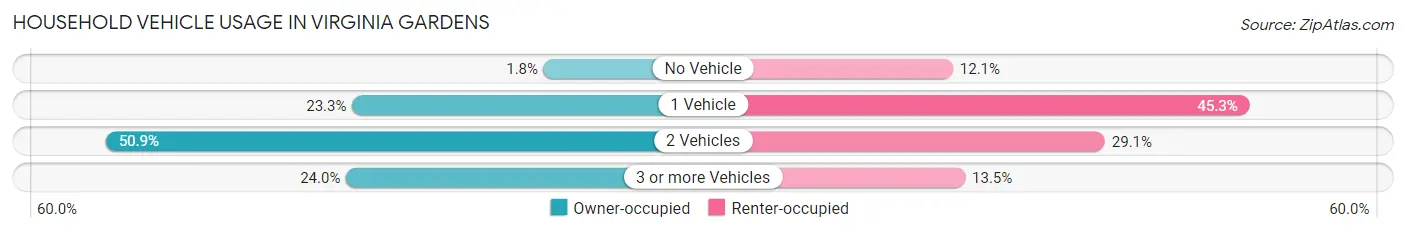
| Vehicles per Household | Owner-occupied | Renter-occupied |
| No Vehicle | 8 (1.8%) | 44 (12.1%) |
| 1 Vehicle | 102 (23.3%) | 165 (45.3%) |
| 2 Vehicles | 223 (50.9%) | 106 (29.1%) |
| 3 or more Vehicles | 105 (24.0%) | 49 (13.5%) |
| Total | 438 (100.0%) | 364 (100.0%) |
Real Estate & Mortgages in Virginia Gardens
Real Estate and Mortgage Overview in Virginia Gardens
| Characteristic | Without Mortgage | With Mortgage |
| Housing Units | 187 | 251 |
| Median Property Value | $415,200 | $441,300 |
| Median Household Income | $52,321 | $59 |
| Monthly Housing Costs | $532 | $44 |
| Real Estate Taxes | $2,299 | $4 |
Property Value by Mortgage Status in Virginia Gardens
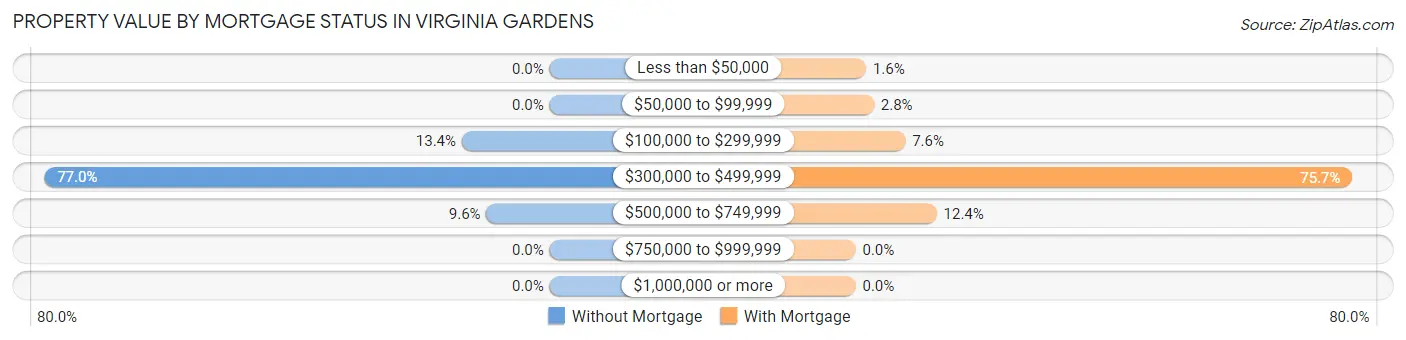
| Property Value | Without Mortgage | With Mortgage |
| Less than $50,000 | 0 (0.0%) | 4 (1.6%) |
| $50,000 to $99,999 | 0 (0.0%) | 7 (2.8%) |
| $100,000 to $299,999 | 25 (13.4%) | 19 (7.6%) |
| $300,000 to $499,999 | 144 (77.0%) | 190 (75.7%) |
| $500,000 to $749,999 | 18 (9.6%) | 31 (12.3%) |
| $750,000 to $999,999 | 0 (0.0%) | 0 (0.0%) |
| $1,000,000 or more | 0 (0.0%) | 0 (0.0%) |
| Total | 187 (100.0%) | 251 (100.0%) |
Household Income by Mortgage Status in Virginia Gardens
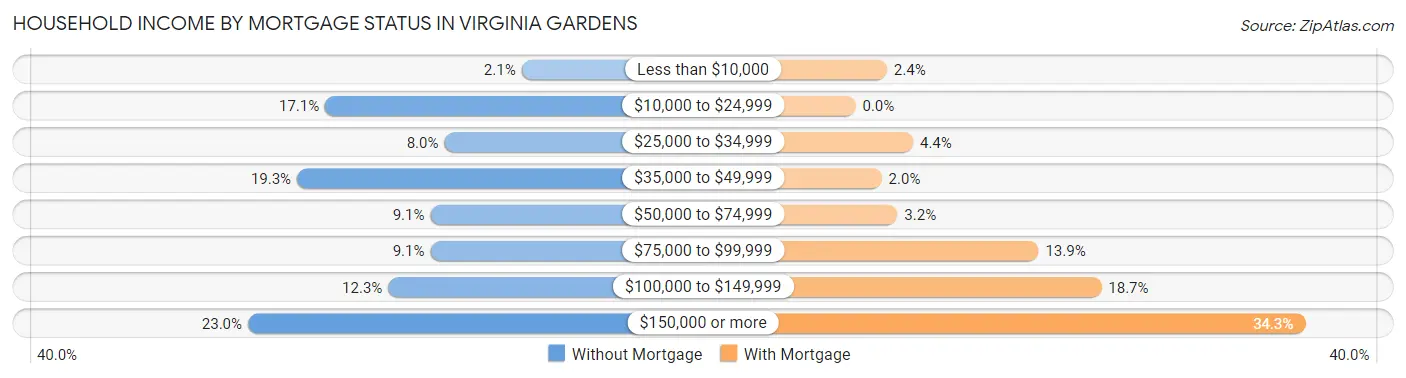
| Household Income | Without Mortgage | With Mortgage |
| Less than $10,000 | 4 (2.1%) | 6 (2.4%) |
| $10,000 to $24,999 | 32 (17.1%) | 0 (0.0%) |
| $25,000 to $34,999 | 15 (8.0%) | 11 (4.4%) |
| $35,000 to $49,999 | 36 (19.3%) | 5 (2.0%) |
| $50,000 to $74,999 | 17 (9.1%) | 8 (3.2%) |
| $75,000 to $99,999 | 17 (9.1%) | 35 (13.9%) |
| $100,000 to $149,999 | 23 (12.3%) | 47 (18.7%) |
| $150,000 or more | 43 (23.0%) | 86 (34.3%) |
| Total | 187 (100.0%) | 251 (100.0%) |
Property Value to Household Income Ratio in Virginia Gardens
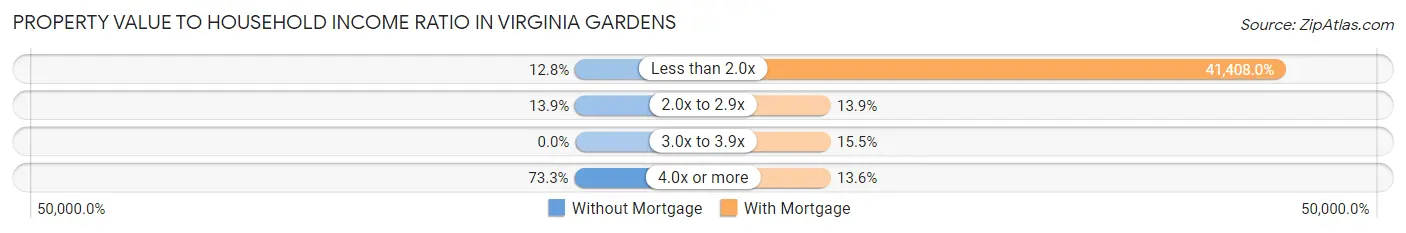
| Value-to-Income Ratio | Without Mortgage | With Mortgage |
| Less than 2.0x | 24 (12.8%) | 103,934 (41,408.0%) |
| 2.0x to 2.9x | 26 (13.9%) | 35 (13.9%) |
| 3.0x to 3.9x | 0 (0.0%) | 39 (15.5%) |
| 4.0x or more | 137 (73.3%) | 34 (13.6%) |
| Total | 187 (100.0%) | 251 (100.0%) |
Real Estate Taxes by Mortgage Status in Virginia Gardens
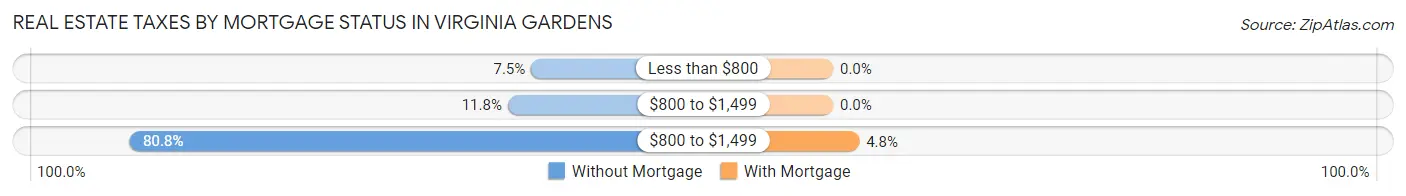
| Property Taxes | Without Mortgage | With Mortgage |
| Less than $800 | 14 (7.5%) | 0 (0.0%) |
| $800 to $1,499 | 22 (11.8%) | 0 (0.0%) |
| $800 to $1,499 | 151 (80.7%) | 12 (4.8%) |
| Total | 187 (100.0%) | 251 (100.0%) |
Health & Disability in Virginia Gardens
Health Insurance Coverage by Age in Virginia Gardens
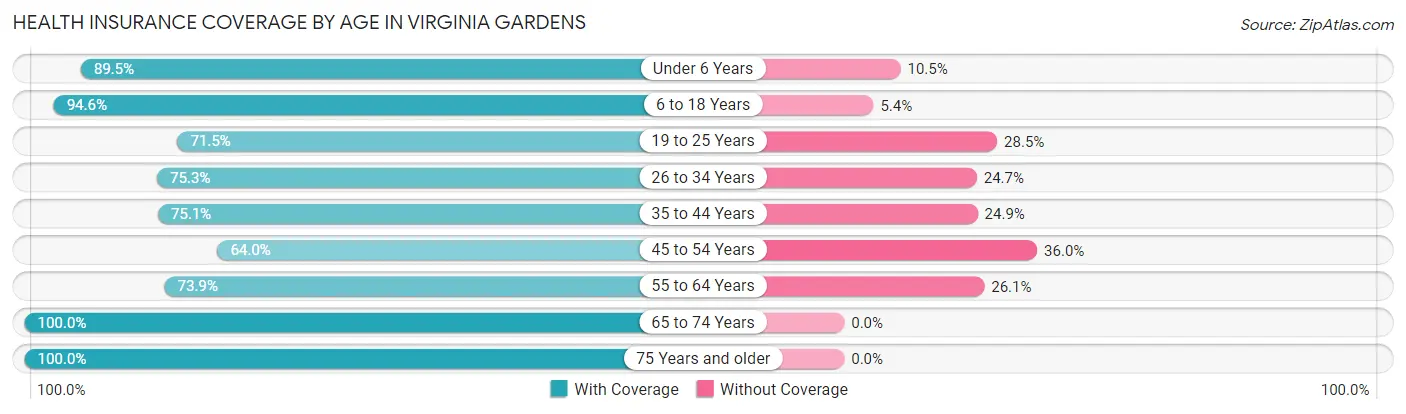
| Age Bracket | With Coverage | Without Coverage |
| Under 6 Years | 128 (89.5%) | 15 (10.5%) |
| 6 to 18 Years | 330 (94.6%) | 19 (5.4%) |
| 19 to 25 Years | 178 (71.5%) | 71 (28.5%) |
| 26 to 34 Years | 192 (75.3%) | 63 (24.7%) |
| 35 to 44 Years | 299 (75.1%) | 99 (24.9%) |
| 45 to 54 Years | 194 (64.0%) | 109 (36.0%) |
| 55 to 64 Years | 249 (73.9%) | 88 (26.1%) |
| 65 to 74 Years | 203 (100.0%) | 0 (0.0%) |
| 75 Years and older | 182 (100.0%) | 0 (0.0%) |
| Total | 1,955 (80.8%) | 464 (19.2%) |
Health Insurance Coverage by Citizenship Status in Virginia Gardens
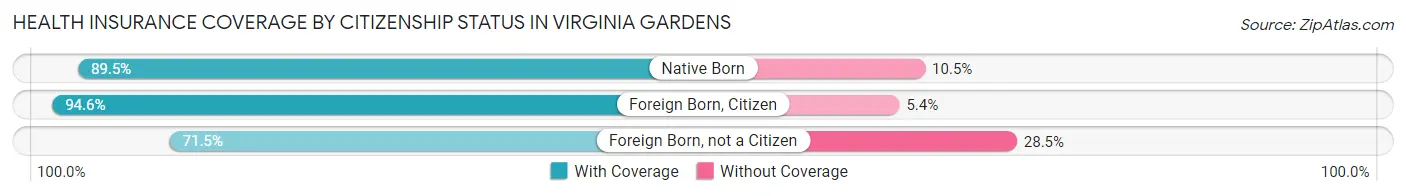
| Citizenship Status | With Coverage | Without Coverage |
| Native Born | 128 (89.5%) | 15 (10.5%) |
| Foreign Born, Citizen | 330 (94.6%) | 19 (5.4%) |
| Foreign Born, not a Citizen | 178 (71.5%) | 71 (28.5%) |
Health Insurance Coverage by Household Income in Virginia Gardens
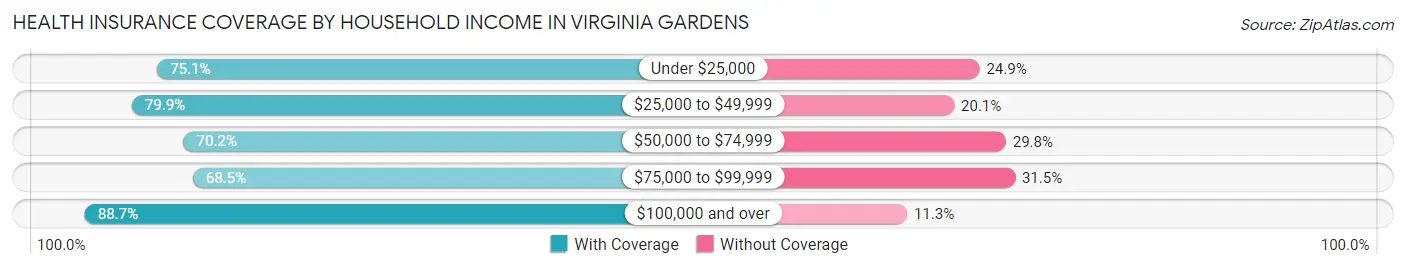
| Household Income | With Coverage | Without Coverage |
| Under $25,000 | 130 (75.1%) | 43 (24.9%) |
| $25,000 to $49,999 | 298 (79.9%) | 75 (20.1%) |
| $50,000 to $74,999 | 231 (70.2%) | 98 (29.8%) |
| $75,000 to $99,999 | 250 (68.5%) | 115 (31.5%) |
| $100,000 and over | 1,046 (88.7%) | 133 (11.3%) |
Public vs Private Health Insurance Coverage by Age in Virginia Gardens
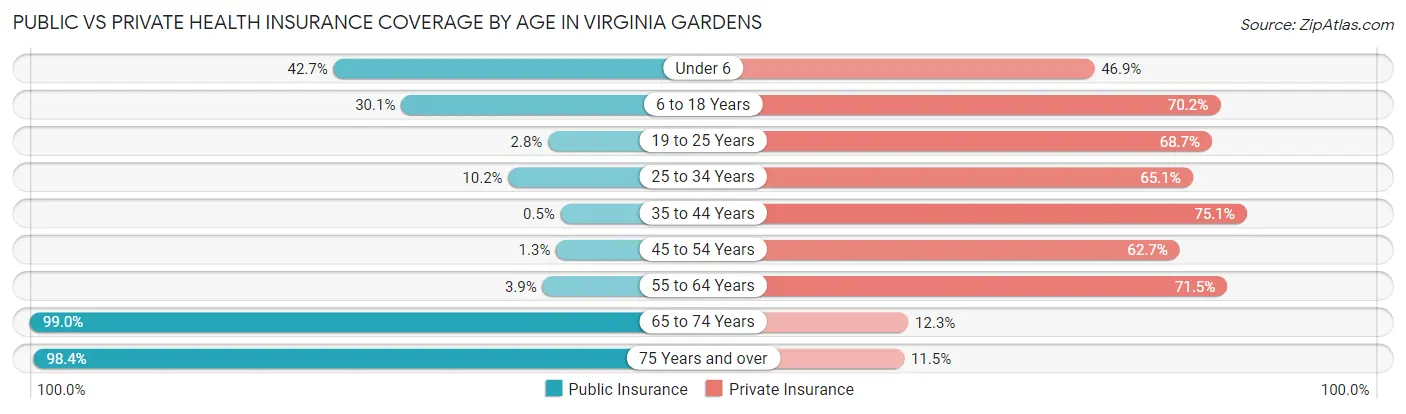
| Age Bracket | Public Insurance | Private Insurance |
| Under 6 | 61 (42.7%) | 67 (46.9%) |
| 6 to 18 Years | 105 (30.1%) | 245 (70.2%) |
| 19 to 25 Years | 7 (2.8%) | 171 (68.7%) |
| 25 to 34 Years | 26 (10.2%) | 166 (65.1%) |
| 35 to 44 Years | 2 (0.5%) | 299 (75.1%) |
| 45 to 54 Years | 4 (1.3%) | 190 (62.7%) |
| 55 to 64 Years | 13 (3.9%) | 241 (71.5%) |
| 65 to 74 Years | 201 (99.0%) | 25 (12.3%) |
| 75 Years and over | 179 (98.4%) | 21 (11.5%) |
| Total | 598 (24.7%) | 1,425 (58.9%) |
Disability Status by Sex by Age in Virginia Gardens
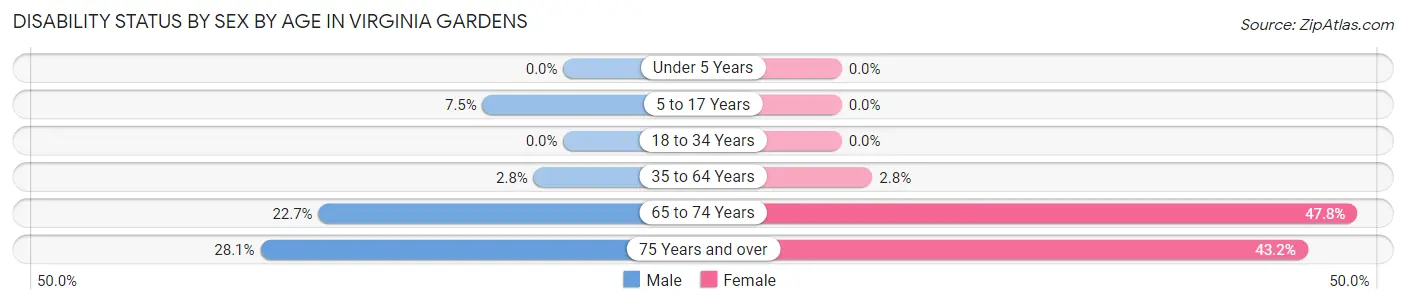
| Age Bracket | Male | Female |
| Under 5 Years | 0 (0.0%) | 0 (0.0%) |
| 5 to 17 Years | 14 (7.5%) | 0 (0.0%) |
| 18 to 34 Years | 0 (0.0%) | 0 (0.0%) |
| 35 to 64 Years | 15 (2.8%) | 14 (2.8%) |
| 65 to 74 Years | 20 (22.7%) | 55 (47.8%) |
| 75 Years and over | 18 (28.1%) | 51 (43.2%) |
Disability Class by Sex by Age in Virginia Gardens
Disability Class: Hearing Difficulty
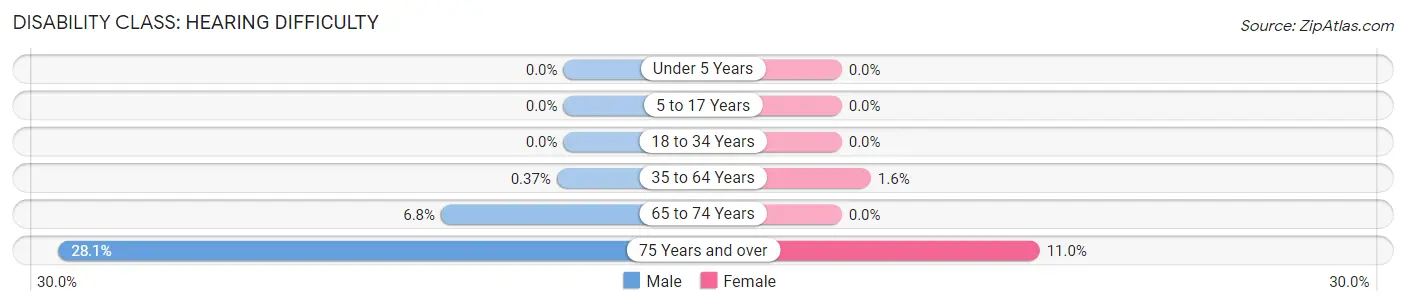
| Age Bracket | Male | Female |
| Under 5 Years | 0 (0.0%) | 0 (0.0%) |
| 5 to 17 Years | 0 (0.0%) | 0 (0.0%) |
| 18 to 34 Years | 0 (0.0%) | 0 (0.0%) |
| 35 to 64 Years | 2 (0.4%) | 8 (1.6%) |
| 65 to 74 Years | 6 (6.8%) | 0 (0.0%) |
| 75 Years and over | 18 (28.1%) | 13 (11.0%) |
Disability Class: Vision Difficulty
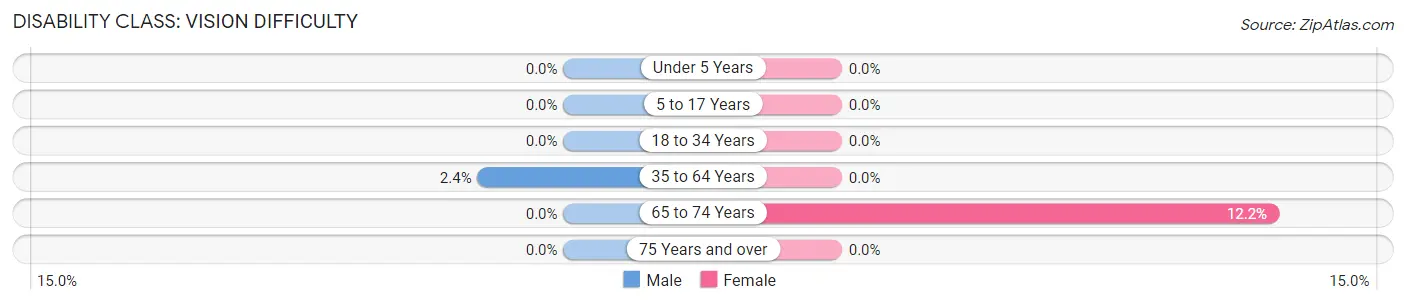
| Age Bracket | Male | Female |
| Under 5 Years | 0 (0.0%) | 0 (0.0%) |
| 5 to 17 Years | 0 (0.0%) | 0 (0.0%) |
| 18 to 34 Years | 0 (0.0%) | 0 (0.0%) |
| 35 to 64 Years | 13 (2.4%) | 0 (0.0%) |
| 65 to 74 Years | 0 (0.0%) | 14 (12.2%) |
| 75 Years and over | 0 (0.0%) | 0 (0.0%) |
Disability Class: Cognitive Difficulty
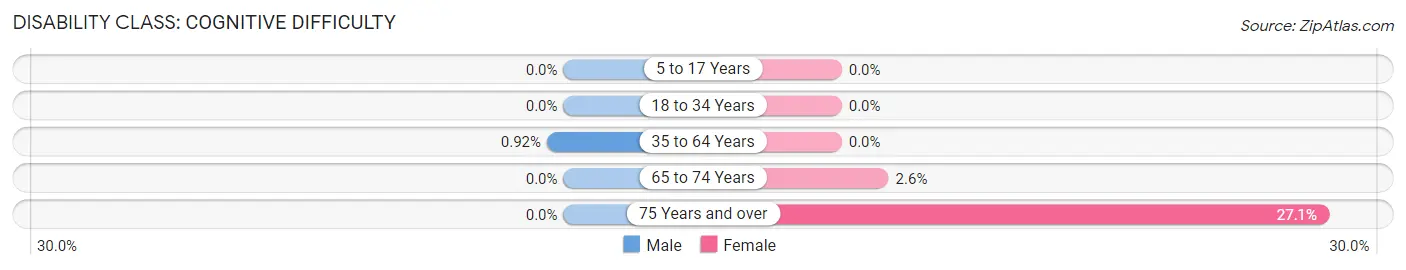
| Age Bracket | Male | Female |
| 5 to 17 Years | 0 (0.0%) | 0 (0.0%) |
| 18 to 34 Years | 0 (0.0%) | 0 (0.0%) |
| 35 to 64 Years | 5 (0.9%) | 0 (0.0%) |
| 65 to 74 Years | 0 (0.0%) | 3 (2.6%) |
| 75 Years and over | 0 (0.0%) | 32 (27.1%) |
Disability Class: Ambulatory Difficulty
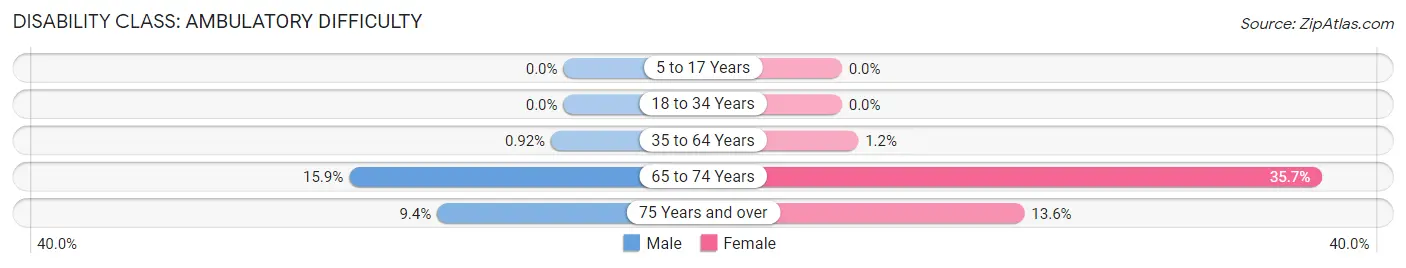
| Age Bracket | Male | Female |
| 5 to 17 Years | 0 (0.0%) | 0 (0.0%) |
| 18 to 34 Years | 0 (0.0%) | 0 (0.0%) |
| 35 to 64 Years | 5 (0.9%) | 6 (1.2%) |
| 65 to 74 Years | 14 (15.9%) | 41 (35.6%) |
| 75 Years and over | 6 (9.4%) | 16 (13.6%) |
Disability Class: Self-Care Difficulty
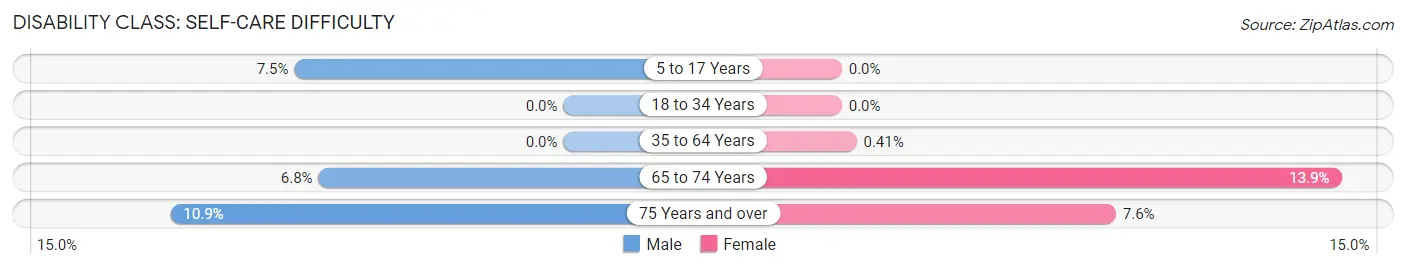
| Age Bracket | Male | Female |
| 5 to 17 Years | 14 (7.5%) | 0 (0.0%) |
| 18 to 34 Years | 0 (0.0%) | 0 (0.0%) |
| 35 to 64 Years | 0 (0.0%) | 2 (0.4%) |
| 65 to 74 Years | 6 (6.8%) | 16 (13.9%) |
| 75 Years and over | 7 (10.9%) | 9 (7.6%) |
Technology Access in Virginia Gardens
Computing Device Access in Virginia Gardens
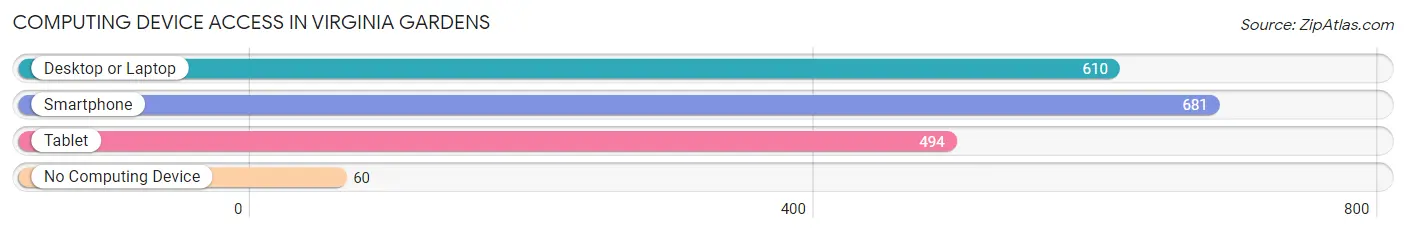
| Device Type | # Households | % Households |
| Desktop or Laptop | 610 | 76.1% |
| Smartphone | 681 | 84.9% |
| Tablet | 494 | 61.6% |
| No Computing Device | 60 | 7.5% |
| Total | 802 | 100.0% |
Internet Access in Virginia Gardens
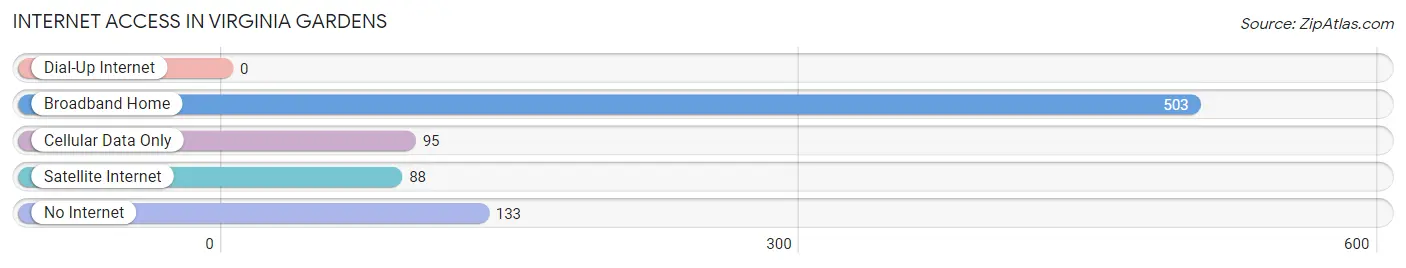
| Internet Type | # Households | % Households |
| Dial-Up Internet | 0 | 0.0% |
| Broadband Home | 503 | 62.7% |
| Cellular Data Only | 95 | 11.8% |
| Satellite Internet | 88 | 11.0% |
| No Internet | 133 | 16.6% |
| Total | 802 | 100.0% |
Virginia Gardens Summary
History
The village of Virginia Gardens, Florida is located in Miami-Dade County, just north of Miami International Airport. The village was incorporated in 1947 and is one of the oldest incorporated villages in Miami-Dade County. The village was named after the daughter of the original developer, who was a prominent Miami businessman.
The village of Virginia Gardens was originally developed as a residential community for middle-class families. The village was designed to be a self-contained community with its own schools, churches, stores, and other amenities. The village was also designed to be a safe and secure place to live, with its own police and fire departments.
The village of Virginia Gardens has a rich history of community involvement and civic pride. The village has been home to many civic organizations, including the Virginia Gardens Civic Association, the Virginia Gardens Lions Club, and the Virginia Gardens Historical Society. The village has also been home to many prominent figures, including former Miami Mayor Maurice Ferre and former Miami-Dade County Commissioner Joe Martinez.
Geography
The village of Virginia Gardens is located in Miami-Dade County, just north of Miami International Airport. The village is bordered by the cities of Miami Springs to the east, Hialeah to the west, and Miami Lakes to the south. The village is located in the Miami metropolitan area and is part of the Miami-Fort Lauderdale-West Palm Beach Combined Statistical Area.
The village of Virginia Gardens covers an area of 1.2 square miles and has a population of approximately 5,000 people. The village is located at an elevation of 8 feet above sea level and has a humid subtropical climate. The average temperature in the village is 78 degrees Fahrenheit and the average annual rainfall is 59 inches.
Economy
The village of Virginia Gardens has a strong economy that is driven by tourism, retail, and manufacturing. The village is home to several major employers, including the Miami International Airport, the Miami-Dade County Public Schools, and the Miami-Dade County Government. The village is also home to several major retail stores, including Walmart, Target, and Home Depot.
The village of Virginia Gardens is also home to several manufacturing companies, including the Miami-Dade County Aviation Department, the Miami-Dade County Public Works Department, and the Miami-Dade County Water and Sewer Department. The village is also home to several small businesses, including restaurants, bars, and shops.
Demographics
The village of Virginia Gardens has a population of approximately 5,000 people. The village has a diverse population, with a majority of the population being of Hispanic or Latino origin. The village also has a significant African American population, as well as a small population of Asian Americans.
The median household income in the village is $41,000 and the median home value is $220,000. The village has a high rate of homeownership, with approximately 70% of the population owning their own homes. The village also has a high rate of educational attainment, with approximately 80% of the population having a high school diploma or higher.
Common Questions
What is Per Capita Income in Virginia Gardens?
Per Capita income in Virginia Gardens is $30,385.
What is the Median Family Income in Virginia Gardens?
Median Family Income in Virginia Gardens is $82,973.
What is the Median Household income in Virginia Gardens?
Median Household Income in Virginia Gardens is $75,455.
What is Income or Wage Gap in Virginia Gardens?
Income or Wage Gap in Virginia Gardens is 23.6%.
Women in Virginia Gardens earn 76.4 cents for every dollar earned by a man.
What is Inequality or Gini Index in Virginia Gardens?
Inequality or Gini Index in Virginia Gardens is 0.40.
What is the Total Population of Virginia Gardens?
Total Population of Virginia Gardens is 2,419.
What is the Total Male Population of Virginia Gardens?
Total Male Population of Virginia Gardens is 1,213.
What is the Total Female Population of Virginia Gardens?
Total Female Population of Virginia Gardens is 1,206.
What is the Ratio of Males per 100 Females in Virginia Gardens?
There are 100.58 Males per 100 Females in Virginia Gardens.
What is the Ratio of Females per 100 Males in Virginia Gardens?
There are 99.42 Females per 100 Males in Virginia Gardens.
What is the Median Population Age in Virginia Gardens?
Median Population Age in Virginia Gardens is 41.5 Years.
What is the Average Family Size in Virginia Gardens
Average Family Size in Virginia Gardens is 3.2 People.
What is the Average Household Size in Virginia Gardens
Average Household Size in Virginia Gardens is 3.0 People.
How Large is the Labor Force in Virginia Gardens?
There are 1,543 People in the Labor Forcein in Virginia Gardens.
What is the Percentage of People in the Labor Force in Virginia Gardens?
74.6% of People are in the Labor Force in Virginia Gardens.
What is the Unemployment Rate in Virginia Gardens?
Unemployment Rate in Virginia Gardens is 3.8%.