Lake Placid, FL Map & Demographics
Lake Placid Map
Lake Placid Overview
$26,238
PER CAPITA INCOME
$42,092
AVG FAMILY INCOME
$45,019
AVG HOUSEHOLD INCOME
34.1%
WAGE / INCOME GAP [ % ]
65.9¢/ $1
WAGE / INCOME GAP [ $ ]
$19,153
FAMILY INCOME DEFICIT
0.49
INEQUALITY / GINI INDEX
2,349
TOTAL POPULATION
1,187
MALE POPULATION
1,162
FEMALE POPULATION
102.15
MALES / 100 FEMALES
97.89
FEMALES / 100 MALES
35.4
MEDIAN AGE
3.3
AVG FAMILY SIZE
2.5
AVG HOUSEHOLD SIZE
875
LABOR FORCE [ PEOPLE ]
50.2%
PERCENT IN LABOR FORCE
9.8%
UNEMPLOYMENT RATE
Lake Placid Zip Codes
Lake Placid Area Codes
Income in Lake Placid
Income Overview in Lake Placid
Per Capita Income in Lake Placid is $26,238, while median incomes of families and households are $42,092 and $45,019 respectively.
| Characteristic | Number | Measure |
| Per Capita Income | 2,349 | $26,238 |
| Median Family Income | 540 | $42,092 |
| Mean Family Income | 540 | $61,313 |
| Median Household Income | 943 | $45,019 |
| Mean Household Income | 943 | $63,044 |
| Income Deficit | 540 | $19,153 |
| Wage / Income Gap (%) | 2,349 | 34.13% |
| Wage / Income Gap ($) | 2,349 | 65.87¢ per $1 |
| Gini / Inequality Index | 2,349 | 0.49 |
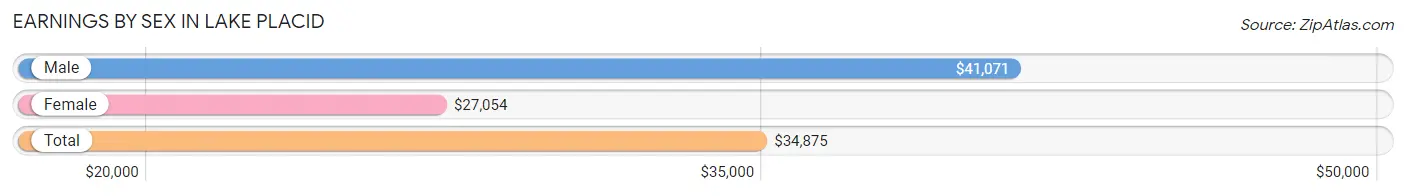
Earnings by Sex in Lake Placid
Average Earnings in Lake Placid are $34,875, $41,071 for men and $27,054 for women, a difference of 34.1%.
| Sex | Number | Average Earnings |
| Male | 476 (60.3%) | $41,071 |
| Female | 313 (39.7%) | $27,054 |
| Total | 789 (100.0%) | $34,875 |
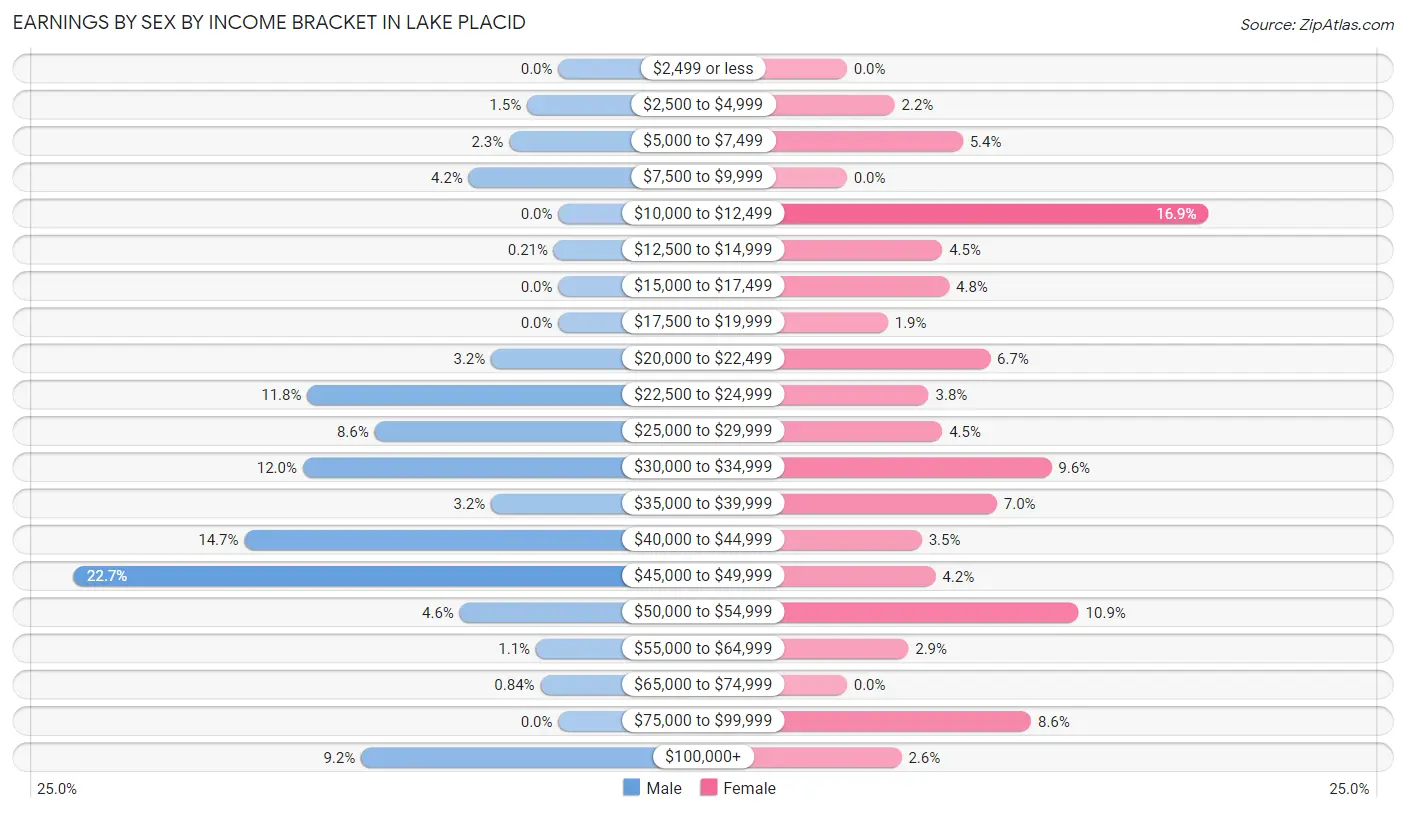
Earnings by Sex by Income Bracket in Lake Placid
The most common earnings brackets in Lake Placid are $45,000 to $49,999 for men (108 | 22.7%) and $10,000 to $12,499 for women (53 | 16.9%).
| Income | Male | Female |
| $2,499 or less | 0 (0.0%) | 0 (0.0%) |
| $2,500 to $4,999 | 7 (1.5%) | 7 (2.2%) |
| $5,000 to $7,499 | 11 (2.3%) | 17 (5.4%) |
| $7,500 to $9,999 | 20 (4.2%) | 0 (0.0%) |
| $10,000 to $12,499 | 0 (0.0%) | 53 (16.9%) |
| $12,500 to $14,999 | 1 (0.2%) | 14 (4.5%) |
| $15,000 to $17,499 | 0 (0.0%) | 15 (4.8%) |
| $17,500 to $19,999 | 0 (0.0%) | 6 (1.9%) |
| $20,000 to $22,499 | 15 (3.2%) | 21 (6.7%) |
| $22,500 to $24,999 | 56 (11.8%) | 12 (3.8%) |
| $25,000 to $29,999 | 41 (8.6%) | 14 (4.5%) |
| $30,000 to $34,999 | 57 (12.0%) | 30 (9.6%) |
| $35,000 to $39,999 | 15 (3.2%) | 22 (7.0%) |
| $40,000 to $44,999 | 70 (14.7%) | 11 (3.5%) |
| $45,000 to $49,999 | 108 (22.7%) | 13 (4.2%) |
| $50,000 to $54,999 | 22 (4.6%) | 34 (10.9%) |
| $55,000 to $64,999 | 5 (1.1%) | 9 (2.9%) |
| $65,000 to $74,999 | 4 (0.8%) | 0 (0.0%) |
| $75,000 to $99,999 | 0 (0.0%) | 27 (8.6%) |
| $100,000+ | 44 (9.2%) | 8 (2.6%) |
| Total | 476 (100.0%) | 313 (100.0%) |
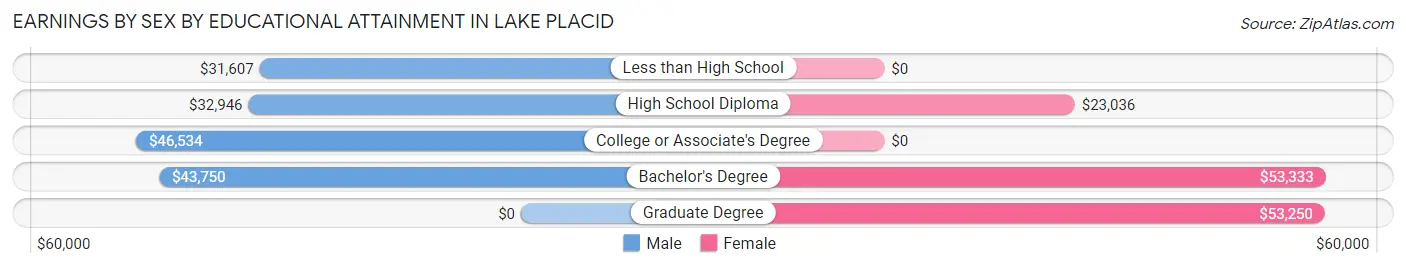
Earnings by Sex by Educational Attainment in Lake Placid
Average earnings in Lake Placid are $41,357 for men and $27,143 for women, a difference of 34.4%. Men with an educational attainment of college or associate's degree enjoy the highest average annual earnings of $46,534, while those with less than high school education earn the least with $31,607. Women with an educational attainment of bachelor's degree earn the most with the average annual earnings of $53,333, while those with high school diploma education have the smallest earnings of $23,036.
| Educational Attainment | Male Income | Female Income |
| Less than High School | $31,607 | $0 |
| High School Diploma | $32,946 | $23,036 |
| College or Associate's Degree | $46,534 | $0 |
| Bachelor's Degree | $43,750 | $53,333 |
| Graduate Degree | - | - |
| Total | $41,357 | $27,143 |
Family Income in Lake Placid
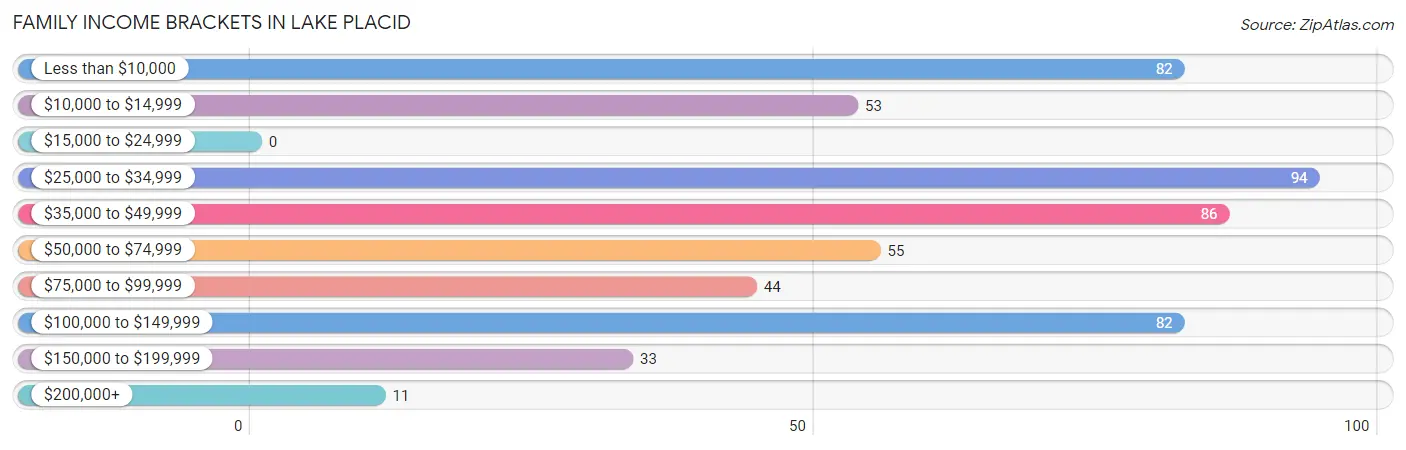
Family Income Brackets in Lake Placid
According to the Lake Placid family income data, there are 94 families falling into the $25,000 to $34,999 income range, which is the most common income bracket and makes up 17.4% of all families.
| Income Bracket | # Families | % Families |
| Less than $10,000 | 82 | 15.2% |
| $10,000 to $14,999 | 53 | 9.8% |
| $15,000 to $24,999 | 0 | 0.0% |
| $25,000 to $34,999 | 94 | 17.4% |
| $35,000 to $49,999 | 86 | 15.9% |
| $50,000 to $74,999 | 55 | 10.2% |
| $75,000 to $99,999 | 44 | 8.1% |
| $100,000 to $149,999 | 82 | 15.2% |
| $150,000 to $199,999 | 33 | 6.1% |
| $200,000+ | 11 | 2.0% |
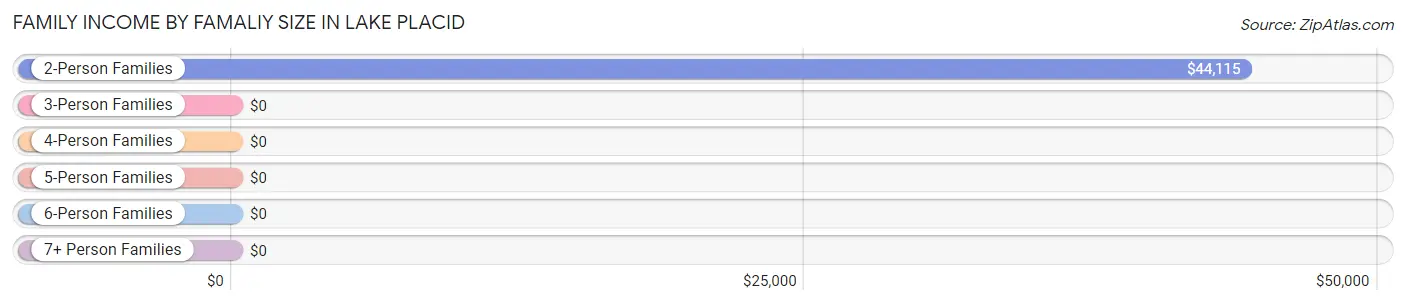
Family Income by Famaliy Size in Lake Placid
2-person families (213 | 39.4%) account for the highest median family income in Lake Placid with $44,115 per family, while 2-person families (213 | 39.4%) have the highest median income of $22,058 per family member.
| Income Bracket | # Families | Median Income |
| 2-Person Families | 213 (39.4%) | $44,115 |
| 3-Person Families | 142 (26.3%) | $0 |
| 4-Person Families | 89 (16.5%) | $0 |
| 5-Person Families | 82 (15.2%) | $0 |
| 6-Person Families | 14 (2.6%) | $0 |
| 7+ Person Families | 0 (0.0%) | $0 |
| Total | 540 (100.0%) | $42,092 |
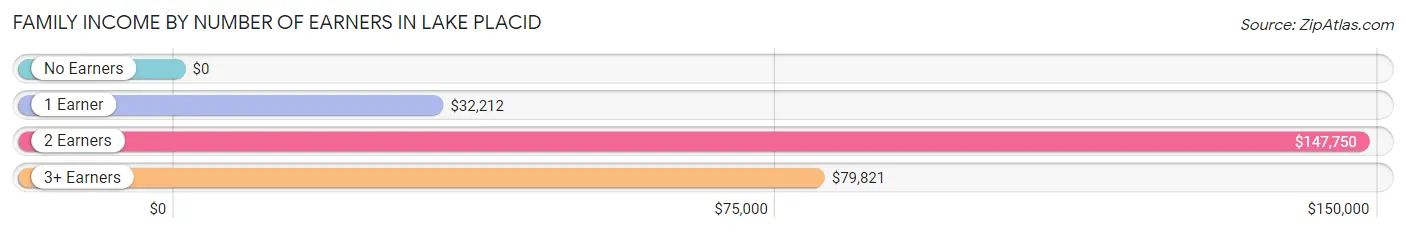
Family Income by Number of Earners in Lake Placid
| Number of Earners | # Families | Median Income |
| No Earners | 189 (35.0%) | $0 |
| 1 Earner | 198 (36.7%) | $32,212 |
| 2 Earners | 110 (20.4%) | $147,750 |
| 3+ Earners | 43 (8.0%) | $79,821 |
| Total | 540 (100.0%) | $42,092 |
Household Income in Lake Placid
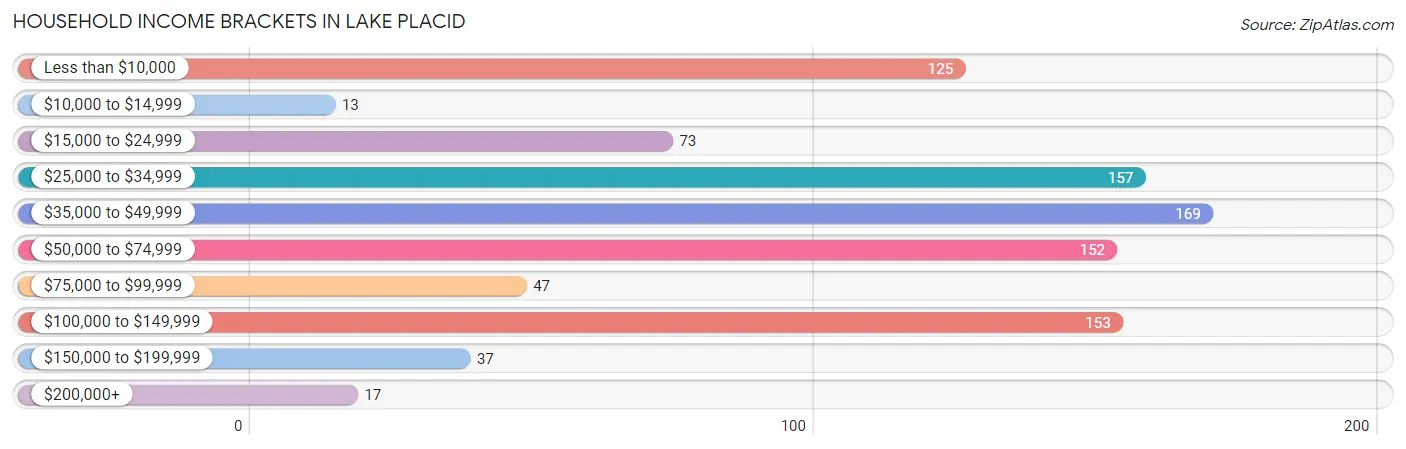
Household Income Brackets in Lake Placid
With 169 households falling in the category, the $35,000 to $49,999 income range is the most frequent in Lake Placid, accounting for 17.9% of all households. In contrast, only 13 households (1.4%) fall into the $10,000 to $14,999 income bracket, making it the least populous group.
| Income Bracket | # Households | % Households |
| Less than $10,000 | 125 | 13.3% |
| $10,000 to $14,999 | 13 | 1.4% |
| $15,000 to $24,999 | 73 | 7.7% |
| $25,000 to $34,999 | 157 | 16.6% |
| $35,000 to $49,999 | 169 | 17.9% |
| $50,000 to $74,999 | 152 | 16.1% |
| $75,000 to $99,999 | 47 | 5.0% |
| $100,000 to $149,999 | 153 | 16.2% |
| $150,000 to $199,999 | 37 | 3.9% |
| $200,000+ | 17 | 1.8% |
Household Income by Householder Age in Lake Placid
The median household income in Lake Placid is $45,019, with the highest median household income of $46,806 found in the 25 to 44 years age bracket for the primary householder. A total of 253 households (26.8%) fall into this category. Meanwhile, the 15 to 24 years age bracket for the primary householder has the lowest median household income of $0, with 14 households (1.5%) in this group.
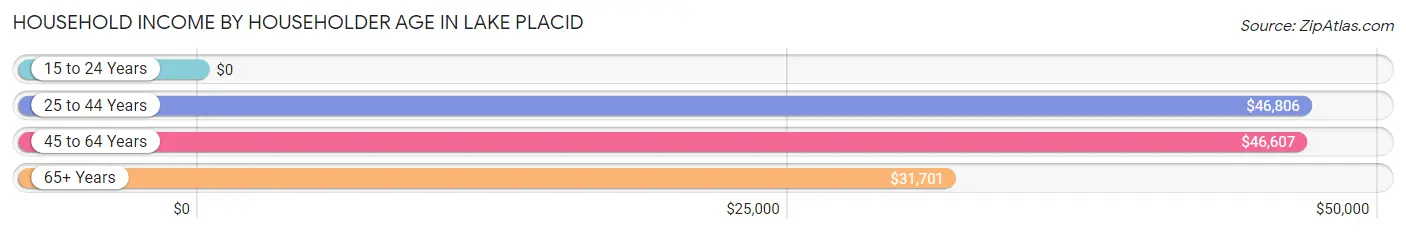
| Income Bracket | # Households | Median Income |
| 15 to 24 Years | 14 (1.5%) | $0 |
| 25 to 44 Years | 253 (26.8%) | $46,806 |
| 45 to 64 Years | 269 (28.5%) | $46,607 |
| 65+ Years | 407 (43.2%) | $31,701 |
| Total | 943 (100.0%) | $45,019 |
Poverty in Lake Placid
Income Below Poverty by Sex and Age in Lake Placid
With 20.1% poverty level for males and 36.2% for females among the residents of Lake Placid, 5 year old males and under 5 year old females are the most vulnerable to poverty, with 79 males (89.8%) and 49 females (100.0%) in their respective age groups living below the poverty level.
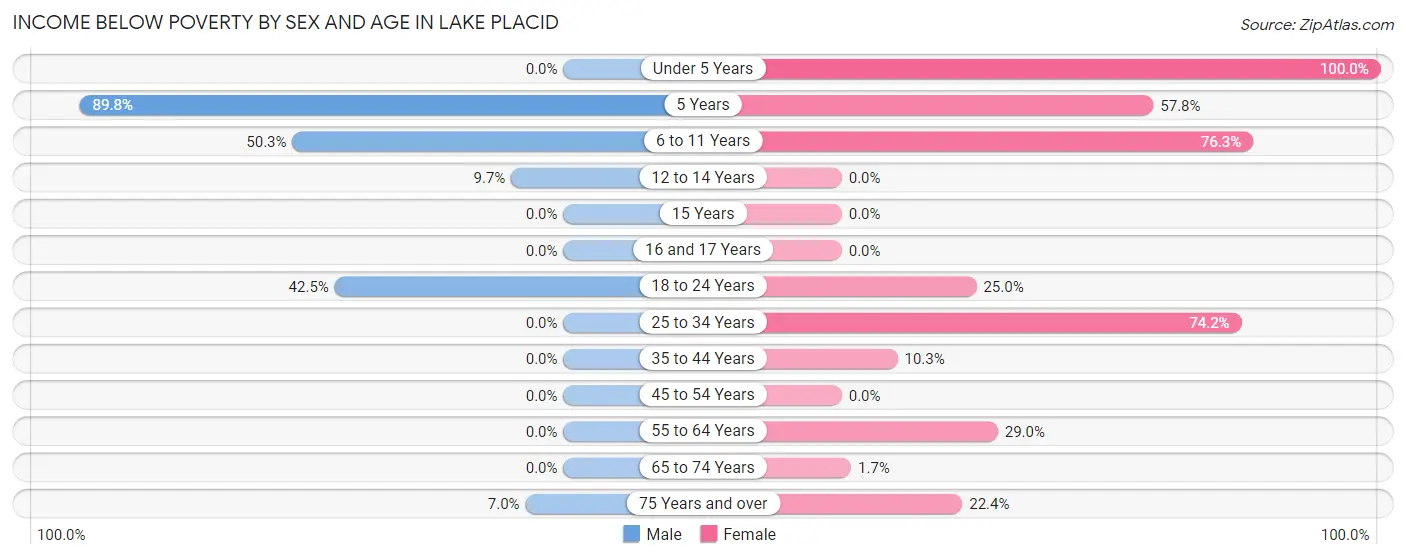
| Age Bracket | Male | Female |
| Under 5 Years | 0 (0.0%) | 49 (100.0%) |
| 5 Years | 79 (89.8%) | 48 (57.8%) |
| 6 to 11 Years | 85 (50.3%) | 29 (76.3%) |
| 12 to 14 Years | 6 (9.7%) | 0 (0.0%) |
| 15 Years | 0 (0.0%) | 0 (0.0%) |
| 16 and 17 Years | 0 (0.0%) | 0 (0.0%) |
| 18 to 24 Years | 59 (42.4%) | 7 (25.0%) |
| 25 to 34 Years | 0 (0.0%) | 201 (74.2%) |
| 35 to 44 Years | 0 (0.0%) | 6 (10.3%) |
| 45 to 54 Years | 0 (0.0%) | 0 (0.0%) |
| 55 to 64 Years | 0 (0.0%) | 44 (28.9%) |
| 65 to 74 Years | 0 (0.0%) | 3 (1.7%) |
| 75 Years and over | 10 (7.0%) | 34 (22.4%) |
| Total | 239 (20.1%) | 421 (36.2%) |
Income Above Poverty by Sex and Age in Lake Placid
According to the poverty statistics in Lake Placid, males aged under 5 years and females aged 12 to 14 years are the age groups that are most secure financially, with 100.0% of males and 100.0% of females in these age groups living above the poverty line.
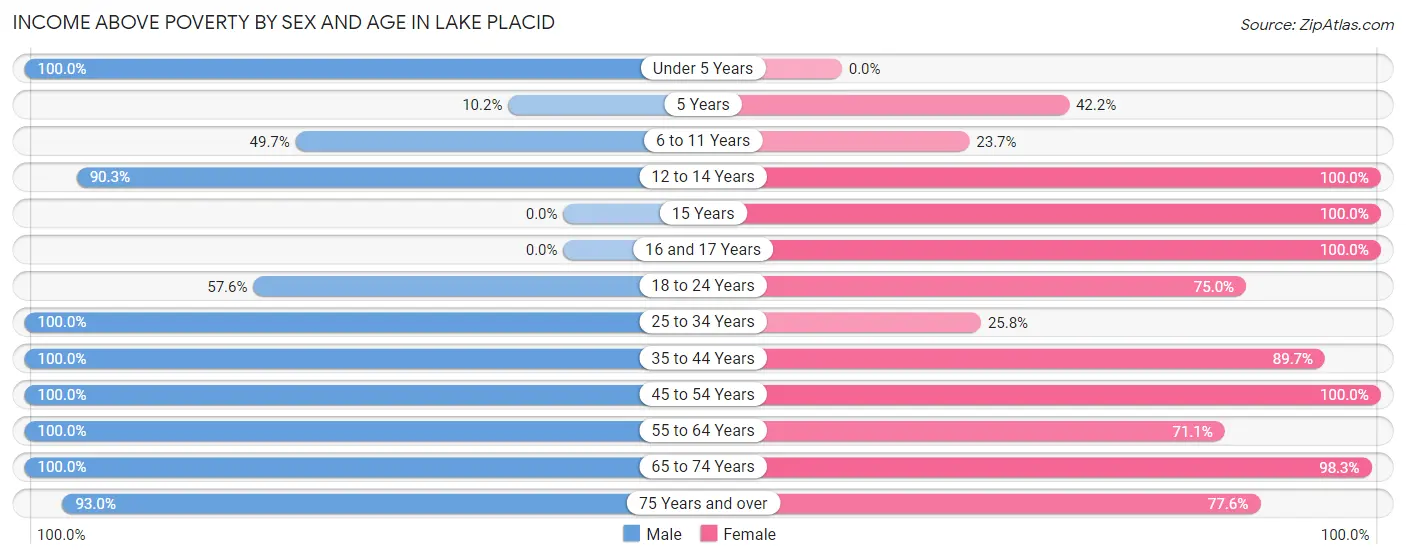
| Age Bracket | Male | Female |
| Under 5 Years | 42 (100.0%) | 0 (0.0%) |
| 5 Years | 9 (10.2%) | 35 (42.2%) |
| 6 to 11 Years | 84 (49.7%) | 9 (23.7%) |
| 12 to 14 Years | 56 (90.3%) | 69 (100.0%) |
| 15 Years | 0 (0.0%) | 5 (100.0%) |
| 16 and 17 Years | 0 (0.0%) | 7 (100.0%) |
| 18 to 24 Years | 80 (57.6%) | 21 (75.0%) |
| 25 to 34 Years | 122 (100.0%) | 70 (25.8%) |
| 35 to 44 Years | 133 (100.0%) | 52 (89.7%) |
| 45 to 54 Years | 88 (100.0%) | 76 (100.0%) |
| 55 to 64 Years | 94 (100.0%) | 108 (71.1%) |
| 65 to 74 Years | 108 (100.0%) | 171 (98.3%) |
| 75 Years and over | 132 (93.0%) | 118 (77.6%) |
| Total | 948 (79.9%) | 741 (63.8%) |
Income Below Poverty Among Married-Couple Families in Lake Placid
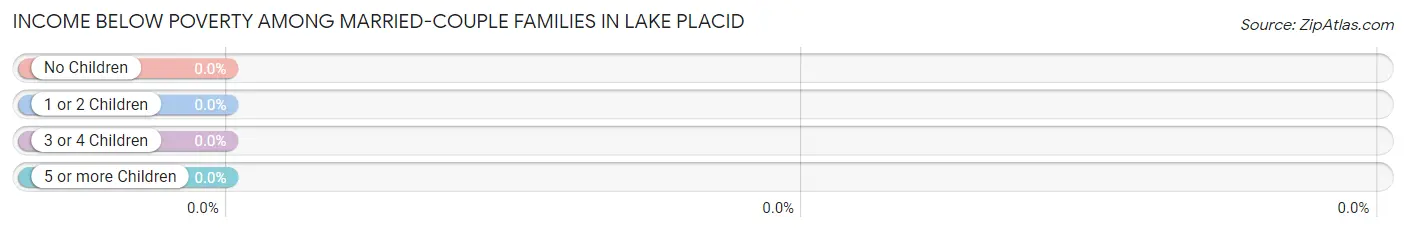
| Children | Above Poverty | Below Poverty |
| No Children | 228 (100.0%) | 0 (0.0%) |
| 1 or 2 Children | 76 (100.0%) | 0 (0.0%) |
| 3 or 4 Children | 36 (100.0%) | 0 (0.0%) |
| 5 or more Children | 0 (0.0%) | 0 (0.0%) |
| Total | 340 (100.0%) | 0 (0.0%) |
Income Below Poverty Among Single-Parent Households in Lake Placid
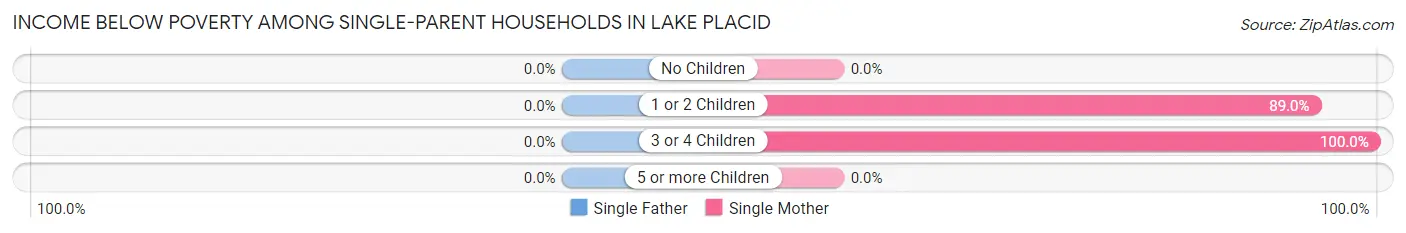
| Children | Single Father | Single Mother |
| No Children | 0 (0.0%) | 0 (0.0%) |
| 1 or 2 Children | 0 (0.0%) | 129 (89.0%) |
| 3 or 4 Children | 0 (0.0%) | 6 (100.0%) |
| 5 or more Children | 0 (0.0%) | 0 (0.0%) |
| Total | 0 (0.0%) | 135 (82.8%) |
Income Below Poverty Among Married-Couple vs Single-Parent Households in Lake Placid
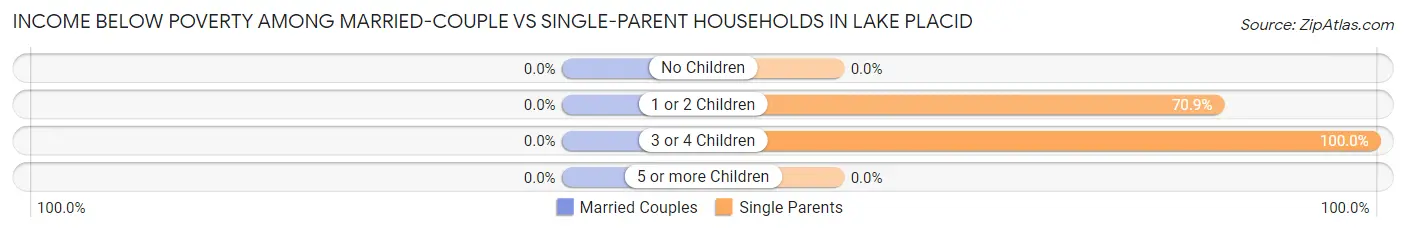
| Children | Married-Couple Families | Single-Parent Households |
| No Children | 0 (0.0%) | 0 (0.0%) |
| 1 or 2 Children | 0 (0.0%) | 129 (70.9%) |
| 3 or 4 Children | 0 (0.0%) | 6 (100.0%) |
| 5 or more Children | 0 (0.0%) | 0 (0.0%) |
| Total | 0 (0.0%) | 135 (67.5%) |
Race in Lake Placid
The most populous races in Lake Placid are White / Caucasian (1,446 | 61.6%), Hispanic or Latino (1,000 | 42.6%), and Black / African American (328 | 14.0%).
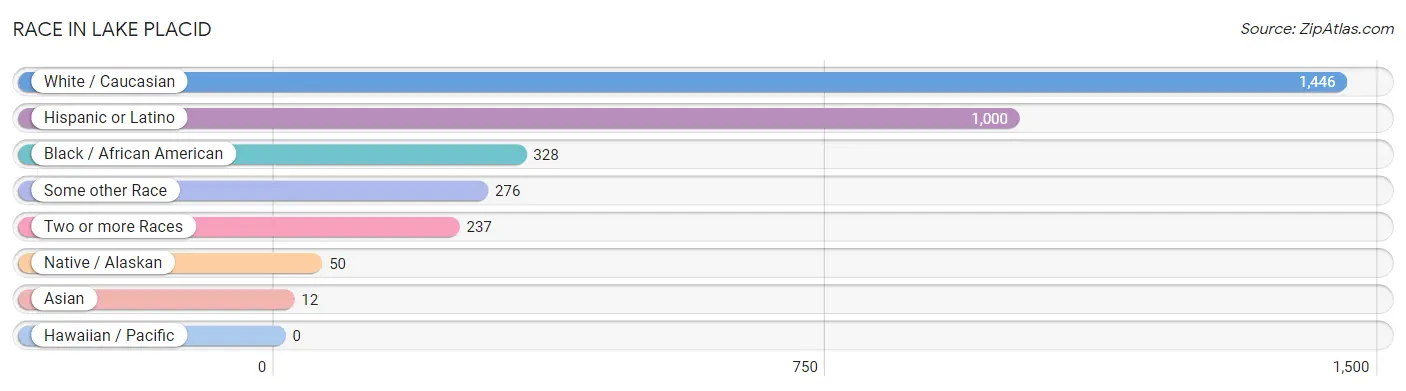
| Race | # Population | % Population |
| Asian | 12 | 0.5% |
| Black / African American | 328 | 14.0% |
| Hawaiian / Pacific | 0 | 0.0% |
| Hispanic or Latino | 1,000 | 42.6% |
| Native / Alaskan | 50 | 2.1% |
| White / Caucasian | 1,446 | 61.6% |
| Two or more Races | 237 | 10.1% |
| Some other Race | 276 | 11.7% |
| Total | 2,349 | 100.0% |
Ancestry in Lake Placid
The most populous ancestries reported in Lake Placid are Mexican (500 | 21.3%), English (279 | 11.9%), German (237 | 10.1%), Colombian (199 | 8.5%), and South American (199 | 8.5%), together accounting for 60.2% of all Lake Placid residents.
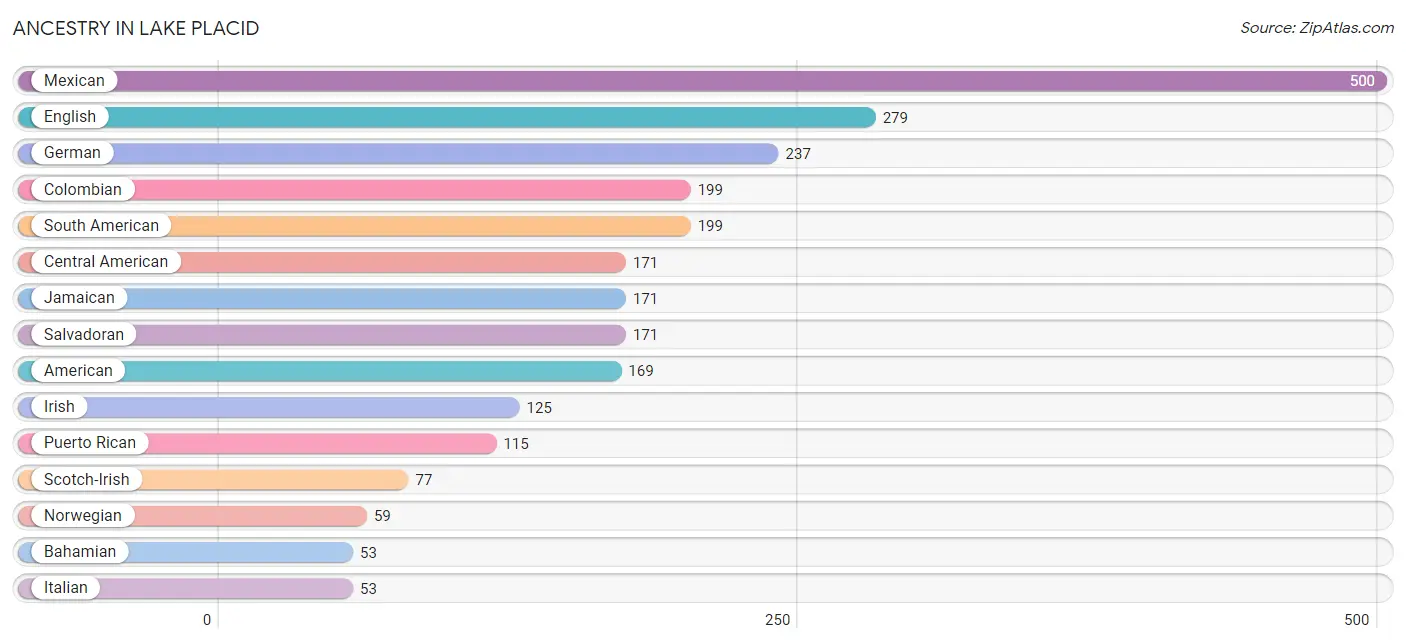
| Ancestry | # Population | % Population |
| American | 169 | 7.2% |
| Arab | 18 | 0.8% |
| Austrian | 6 | 0.3% |
| Bahamian | 53 | 2.3% |
| Burmese | 12 | 0.5% |
| Cajun | 12 | 0.5% |
| Cape Verdean | 8 | 0.3% |
| Central American | 171 | 7.3% |
| Choctaw | 2 | 0.1% |
| Colombian | 199 | 8.5% |
| Cuban | 15 | 0.6% |
| Dutch | 33 | 1.4% |
| English | 279 | 11.9% |
| European | 33 | 1.4% |
| French | 10 | 0.4% |
| French Canadian | 5 | 0.2% |
| German | 237 | 10.1% |
| Haitian | 46 | 2.0% |
| Irish | 125 | 5.3% |
| Italian | 53 | 2.3% |
| Jamaican | 171 | 7.3% |
| Lebanese | 11 | 0.5% |
| Lumbee | 3 | 0.1% |
| Mexican | 500 | 21.3% |
| Norwegian | 59 | 2.5% |
| Polish | 8 | 0.3% |
| Portuguese | 8 | 0.3% |
| Puerto Rican | 115 | 4.9% |
| Salvadoran | 171 | 7.3% |
| Scotch-Irish | 77 | 3.3% |
| Scottish | 6 | 0.3% |
| South American | 199 | 8.5% |
| Subsaharan African | 8 | 0.3% |
| Swedish | 9 | 0.4% | View All 34 Rows |
Immigrants in Lake Placid
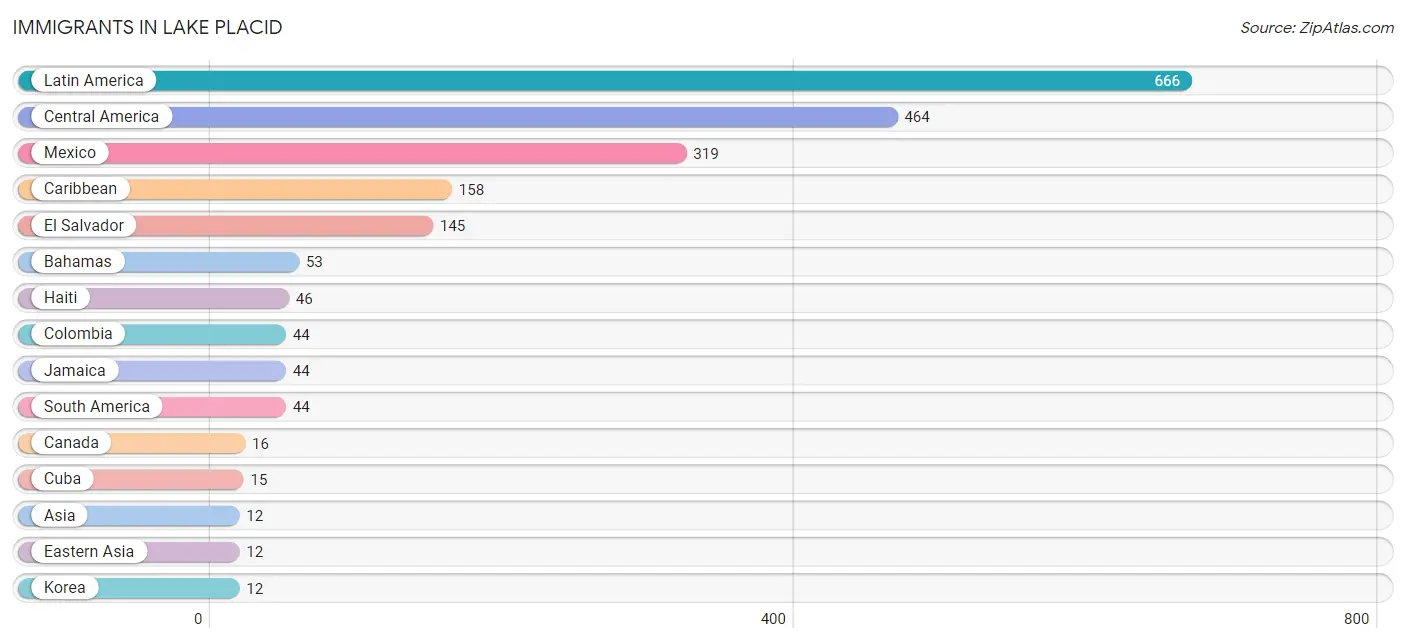
The most numerous immigrant groups reported in Lake Placid came from Latin America (666 | 28.3%), Central America (464 | 19.8%), Mexico (319 | 13.6%), Caribbean (158 | 6.7%), and El Salvador (145 | 6.2%), together accounting for 74.6% of all Lake Placid residents.
| Immigration Origin | # Population | % Population |
| Asia | 12 | 0.5% |
| Bahamas | 53 | 2.3% |
| Canada | 16 | 0.7% |
| Caribbean | 158 | 6.7% |
| Central America | 464 | 19.8% |
| Colombia | 44 | 1.9% |
| Cuba | 15 | 0.6% |
| Eastern Asia | 12 | 0.5% |
| El Salvador | 145 | 6.2% |
| Haiti | 46 | 2.0% |
| Jamaica | 44 | 1.9% |
| Korea | 12 | 0.5% |
| Latin America | 666 | 28.3% |
| Mexico | 319 | 13.6% |
| South America | 44 | 1.9% | View All 15 Rows |
Sex and Age in Lake Placid
Sex and Age in Lake Placid
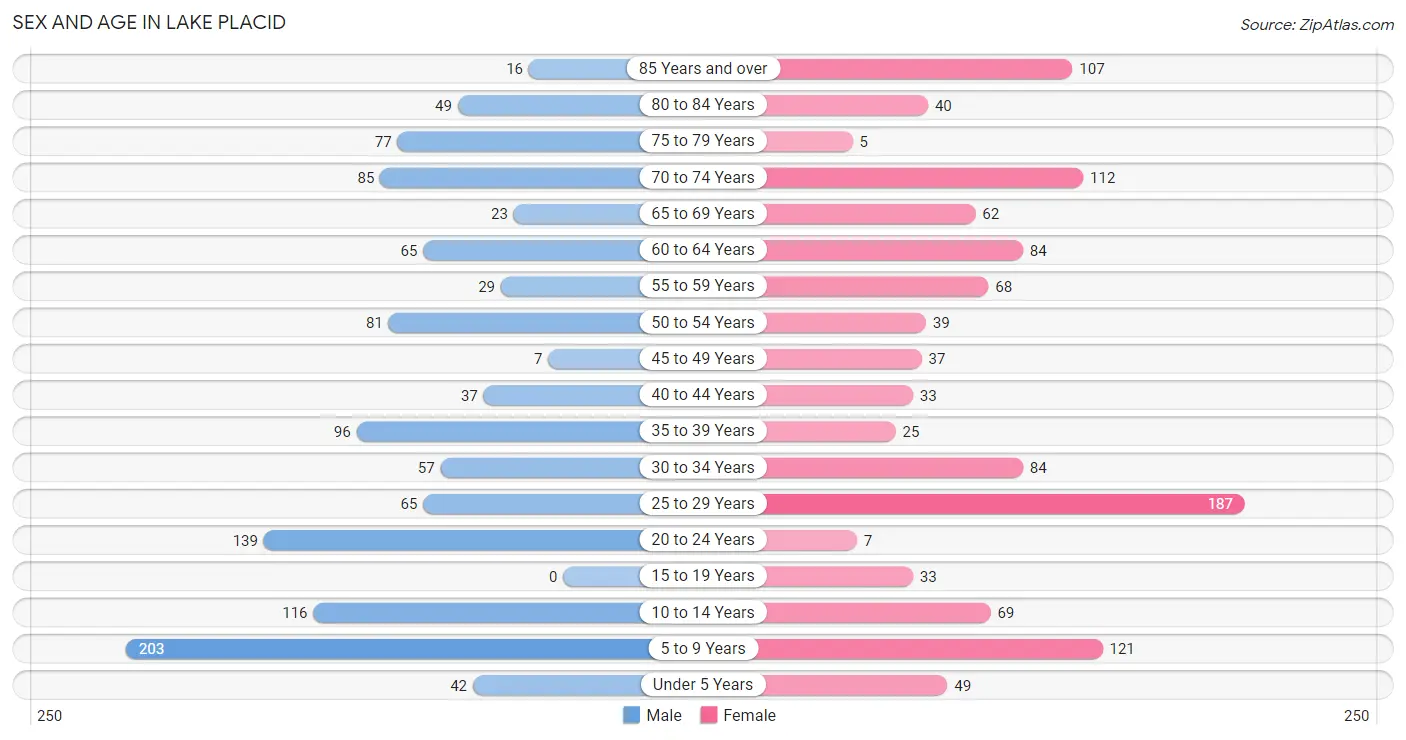
The most populous age groups in Lake Placid are 5 to 9 Years (203 | 17.1%) for men and 25 to 29 Years (187 | 16.1%) for women.
| Age Bracket | Male | Female |
| Under 5 Years | 42 (3.5%) | 49 (4.2%) |
| 5 to 9 Years | 203 (17.1%) | 121 (10.4%) |
| 10 to 14 Years | 116 (9.8%) | 69 (5.9%) |
| 15 to 19 Years | 0 (0.0%) | 33 (2.8%) |
| 20 to 24 Years | 139 (11.7%) | 7 (0.6%) |
| 25 to 29 Years | 65 (5.5%) | 187 (16.1%) |
| 30 to 34 Years | 57 (4.8%) | 84 (7.2%) |
| 35 to 39 Years | 96 (8.1%) | 25 (2.1%) |
| 40 to 44 Years | 37 (3.1%) | 33 (2.8%) |
| 45 to 49 Years | 7 (0.6%) | 37 (3.2%) |
| 50 to 54 Years | 81 (6.8%) | 39 (3.4%) |
| 55 to 59 Years | 29 (2.4%) | 68 (5.9%) |
| 60 to 64 Years | 65 (5.5%) | 84 (7.2%) |
| 65 to 69 Years | 23 (1.9%) | 62 (5.3%) |
| 70 to 74 Years | 85 (7.2%) | 112 (9.6%) |
| 75 to 79 Years | 77 (6.5%) | 5 (0.4%) |
| 80 to 84 Years | 49 (4.1%) | 40 (3.4%) |
| 85 Years and over | 16 (1.3%) | 107 (9.2%) |
| Total | 1,187 (100.0%) | 1,162 (100.0%) |
Families and Households in Lake Placid
Median Family Size in Lake Placid
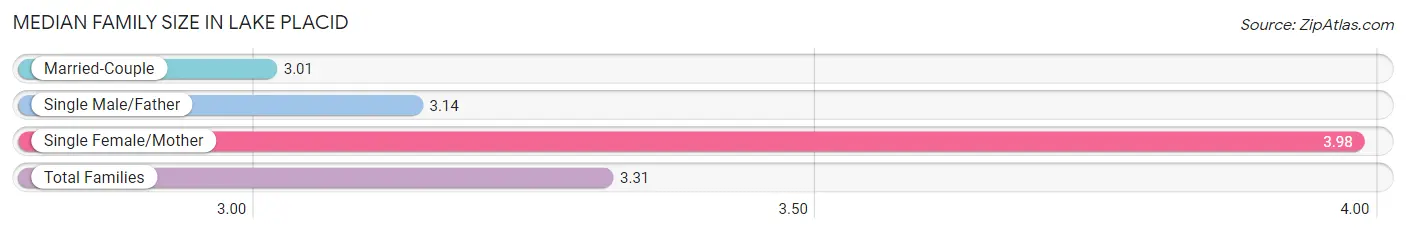
The median family size in Lake Placid is 3.31 persons per family, with single female/mother families (163 | 30.2%) accounting for the largest median family size of 3.98 persons per family. On the other hand, married-couple families (340 | 63.0%) represent the smallest median family size with 3.01 persons per family.
| Family Type | # Families | Family Size |
| Married-Couple | 340 (63.0%) | 3.01 |
| Single Male/Father | 37 (6.9%) | 3.14 |
| Single Female/Mother | 163 (30.2%) | 3.98 |
| Total Families | 540 (100.0%) | 3.31 |
Median Household Size in Lake Placid
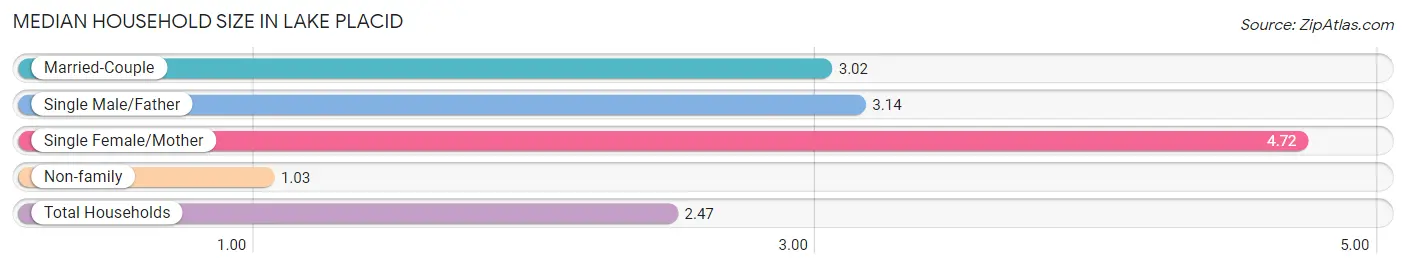
The median household size in Lake Placid is 2.47 persons per household, with single female/mother households (163 | 17.3%) accounting for the largest median household size of 4.72 persons per household. non-family households (403 | 42.7%) represent the smallest median household size with 1.03 persons per household.
| Household Type | # Households | Household Size |
| Married-Couple | 340 (36.1%) | 3.02 |
| Single Male/Father | 37 (3.9%) | 3.14 |
| Single Female/Mother | 163 (17.3%) | 4.72 |
| Non-family | 403 (42.7%) | 1.03 |
| Total Households | 943 (100.0%) | 2.47 |
Household Size by Marriage Status in Lake Placid
Out of a total of 943 households in Lake Placid, 540 (57.3%) are family households, while 403 (42.7%) are nonfamily households. The most numerous type of family households are 2-person households, comprising 187, and the most common type of nonfamily households are 1-person households, comprising 390.
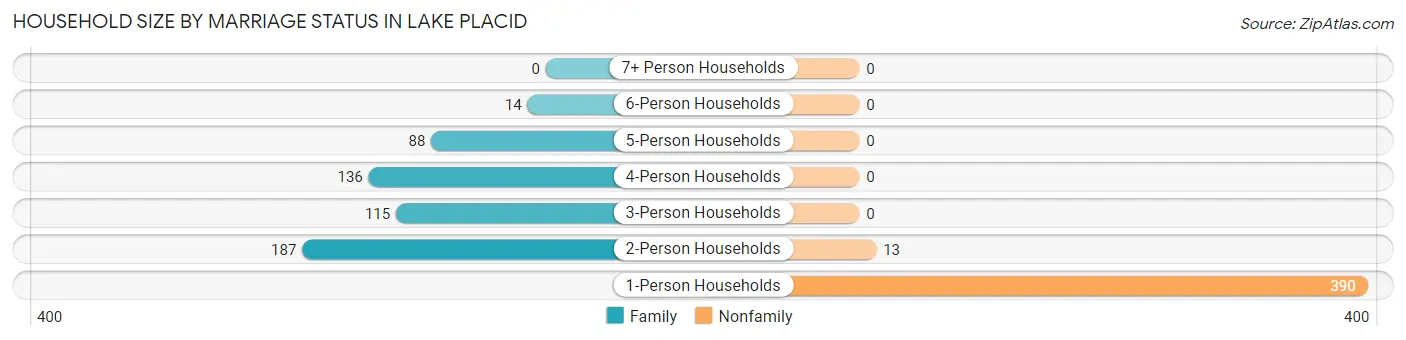
| Household Size | Family Households | Nonfamily Households |
| 1-Person Households | - | 390 (41.4%) |
| 2-Person Households | 187 (19.8%) | 13 (1.4%) |
| 3-Person Households | 115 (12.2%) | 0 (0.0%) |
| 4-Person Households | 136 (14.4%) | 0 (0.0%) |
| 5-Person Households | 88 (9.3%) | 0 (0.0%) |
| 6-Person Households | 14 (1.5%) | 0 (0.0%) |
| 7+ Person Households | 0 (0.0%) | 0 (0.0%) |
| Total | 540 (57.3%) | 403 (42.7%) |
Female Fertility in Lake Placid
Fertility by Age in Lake Placid
| Age Bracket | Women with Births | Births / 1,000 Women |
| 15 to 19 years | 0 (0.0%) | 0.0 |
| 20 to 34 years | 0 (0.0%) | 0.0 |
| 35 to 50 years | 0 (0.0%) | 0.0 |
| Total | 0 (0.0%) | 0.0 |
Fertility by Age by Marriage Status in Lake Placid
| Age Bracket | Married | Unmarried |
| 15 to 19 years | 0 (0.0%) | 0 (0.0%) |
| 20 to 34 years | 0 (0.0%) | 0 (0.0%) |
| 35 to 50 years | 0 (0.0%) | 0 (0.0%) |
| Total | 0 (0.0%) | 0 (0.0%) |
Fertility by Education in Lake Placid
| Educational Attainment | Women with Births | Births / 1,000 Women |
| Less than High School | 0 (0.0%) | 0.0 |
| High School Diploma | 0 (0.0%) | 0.0 |
| College or Associate's Degree | 0 (0.0%) | 0.0 |
| Bachelor's Degree | 0 (0.0%) | 0.0 |
| Graduate Degree | 0 (0.0%) | 0.0 |
| Total | 0 (0.0%) | 0.0 |
Fertility by Education by Marriage Status in Lake Placid
| Educational Attainment | Married | Unmarried |
| Less than High School | 0 (0.0%) | 0 (0.0%) |
| High School Diploma | 0 (0.0%) | 0 (0.0%) |
| College or Associate's Degree | 0 (0.0%) | 0 (0.0%) |
| Bachelor's Degree | 0 (0.0%) | 0 (0.0%) |
| Graduate Degree | 0 (0.0%) | 0 (0.0%) |
| Total | 0 (0.0%) | 0 (0.0%) |
Employment Characteristics in Lake Placid
Employment by Class of Employer in Lake Placid
Among the 789 employed individuals in Lake Placid, private company employees (459 | 58.2%), local government employees (110 | 13.9%), and state government employees (64 | 8.1%) make up the most common classes of employment.
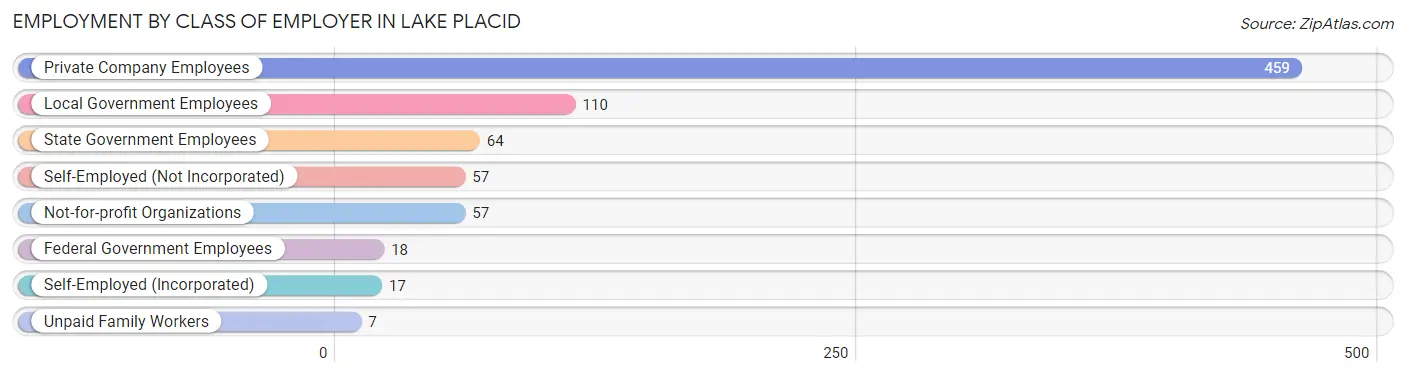
| Employer Class | # Employees | % Employees |
| Private Company Employees | 459 | 58.2% |
| Self-Employed (Incorporated) | 17 | 2.1% |
| Self-Employed (Not Incorporated) | 57 | 7.2% |
| Not-for-profit Organizations | 57 | 7.2% |
| Local Government Employees | 110 | 13.9% |
| State Government Employees | 64 | 8.1% |
| Federal Government Employees | 18 | 2.3% |
| Unpaid Family Workers | 7 | 0.9% |
| Total | 789 | 100.0% |
Employment Status by Age in Lake Placid
According to the labor force statistics for Lake Placid, out of the total population over 16 years of age (1,744), 50.2% or 875 individuals are in the labor force, with 9.8% or 86 of them unemployed. The age group with the highest labor force participation rate is 35 to 44 years, with 92.1% or 176 individuals in the labor force. Within the labor force, the 16 to 19 years age range has the highest percentage of unemployed individuals, with 46.7% or 7 of them being unemployed.
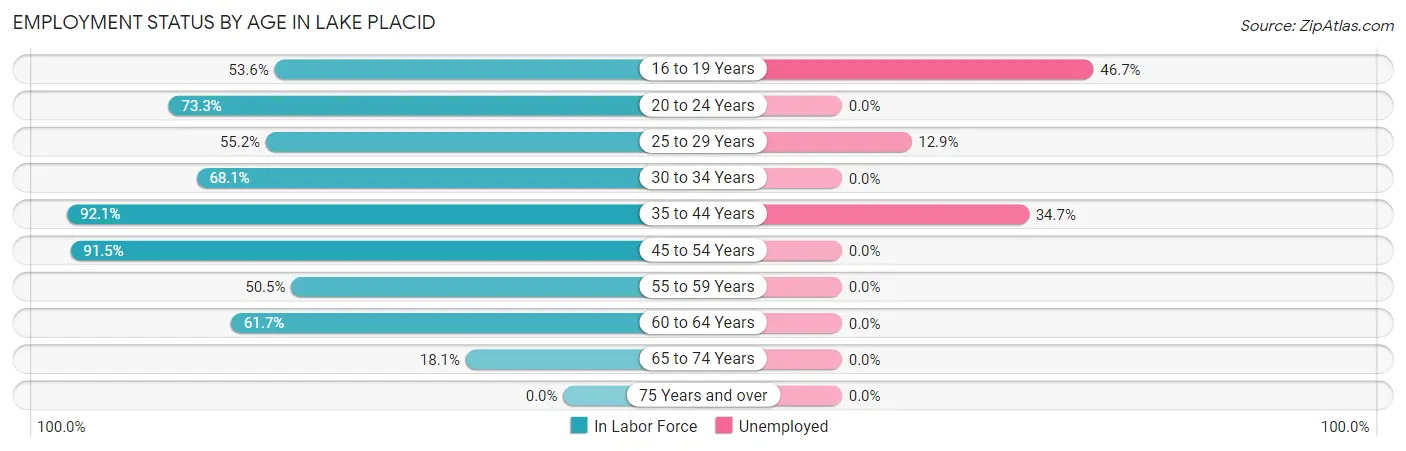
| Age Bracket | In Labor Force | Unemployed |
| 16 to 19 Years | 15 (53.6%) | 7 (46.7%) |
| 20 to 24 Years | 107 (73.3%) | 0 (0.0%) |
| 25 to 29 Years | 139 (55.2%) | 18 (12.9%) |
| 30 to 34 Years | 96 (68.1%) | 0 (0.0%) |
| 35 to 44 Years | 176 (92.1%) | 61 (34.7%) |
| 45 to 54 Years | 150 (91.5%) | 0 (0.0%) |
| 55 to 59 Years | 49 (50.5%) | 0 (0.0%) |
| 60 to 64 Years | 92 (61.7%) | 0 (0.0%) |
| 65 to 74 Years | 51 (18.1%) | 0 (0.0%) |
| 75 Years and over | 0 (0.0%) | 0 (0.0%) |
| Total | 875 (50.2%) | 86 (9.8%) |
Employment Status by Educational Attainment in Lake Placid
According to labor force statistics for Lake Placid, 70.6% of individuals (702) out of the total population between 25 and 64 years of age (994) are in the labor force, with 11.3% or 79 of them being unemployed. The group with the highest labor force participation rate are those with the educational attainment of bachelor's degree or higher, with 100.0% or 124 individuals in the labor force. Within the labor force, individuals with high school diploma education have the highest percentage of unemployment, with 25.3% or 61 of them being unemployed.
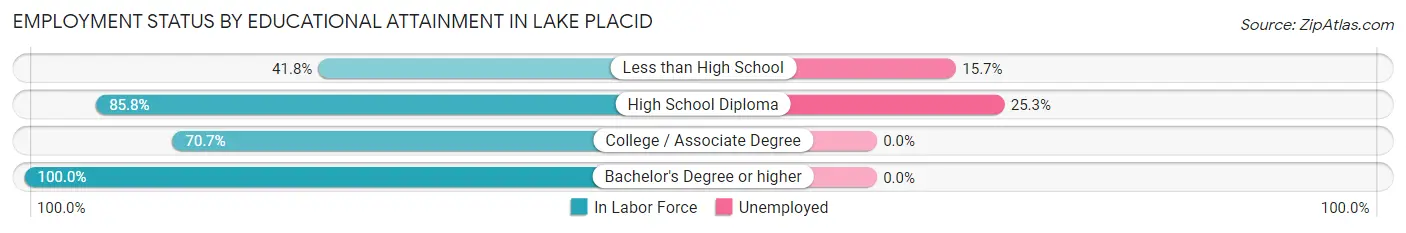
| Educational Attainment | In Labor Force | Unemployed |
| Less than High School | 115 (41.8%) | 43 (15.7%) |
| High School Diploma | 241 (85.8%) | 71 (25.3%) |
| College / Associate Degree | 222 (70.7%) | 0 (0.0%) |
| Bachelor's Degree or higher | 124 (100.0%) | 0 (0.0%) |
| Total | 702 (70.6%) | 112 (11.3%) |
Employment Occupations by Sex in Lake Placid
Management, Business, Science and Arts Occupations
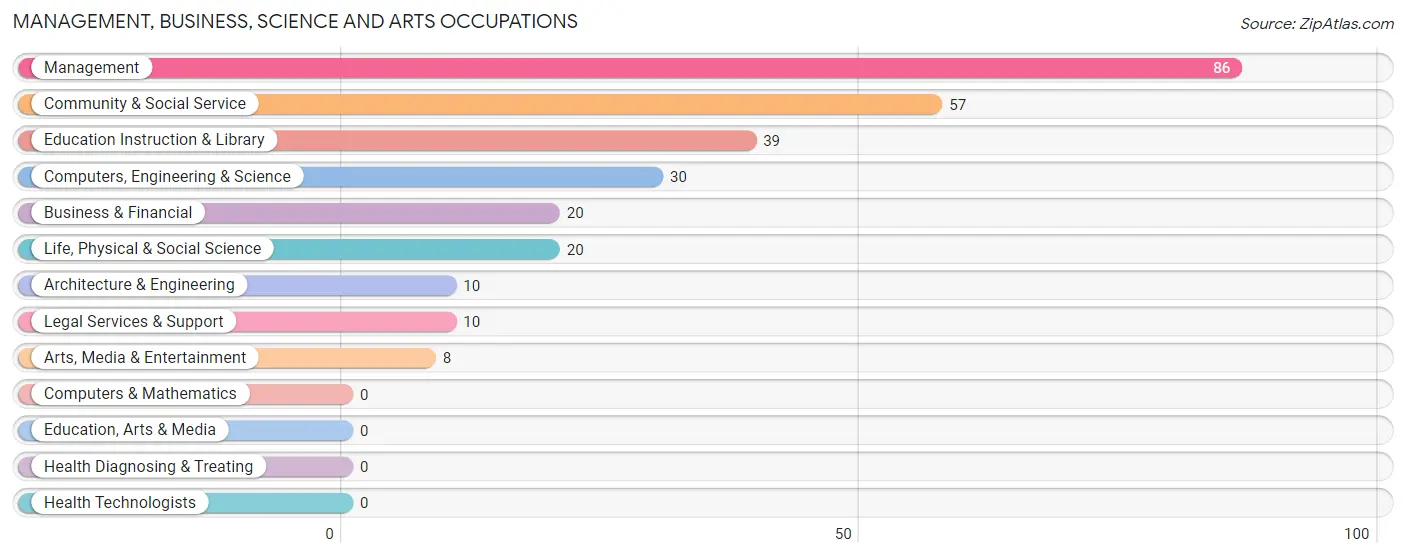
The most common Management, Business, Science and Arts occupations in Lake Placid are Management (86 | 10.9%), Community & Social Service (57 | 7.2%), Education Instruction & Library (39 | 4.9%), Computers, Engineering & Science (30 | 3.8%), and Business & Financial (20 | 2.5%).
Management, Business, Science and Arts Occupations by Sex
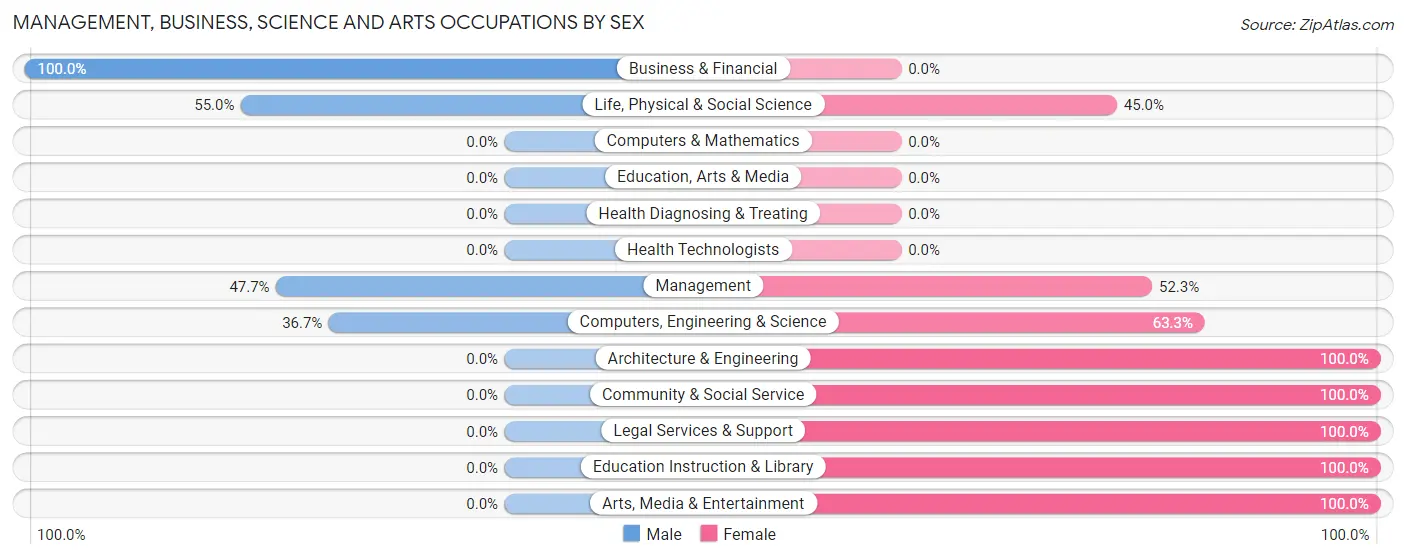
Within the Management, Business, Science and Arts occupations in Lake Placid, the most male-oriented occupations are Business & Financial (100.0%), Life, Physical & Social Science (55.0%), and Management (47.7%), while the most female-oriented occupations are Architecture & Engineering (100.0%), Community & Social Service (100.0%), and Legal Services & Support (100.0%).
| Occupation | Male | Female |
| Management | 41 (47.7%) | 45 (52.3%) |
| Business & Financial | 20 (100.0%) | 0 (0.0%) |
| Computers, Engineering & Science | 11 (36.7%) | 19 (63.3%) |
| Computers & Mathematics | 0 (0.0%) | 0 (0.0%) |
| Architecture & Engineering | 0 (0.0%) | 10 (100.0%) |
| Life, Physical & Social Science | 11 (55.0%) | 9 (45.0%) |
| Community & Social Service | 0 (0.0%) | 57 (100.0%) |
| Education, Arts & Media | 0 (0.0%) | 0 (0.0%) |
| Legal Services & Support | 0 (0.0%) | 10 (100.0%) |
| Education Instruction & Library | 0 (0.0%) | 39 (100.0%) |
| Arts, Media & Entertainment | 0 (0.0%) | 8 (100.0%) |
| Health Diagnosing & Treating | 0 (0.0%) | 0 (0.0%) |
| Health Technologists | 0 (0.0%) | 0 (0.0%) |
| Total (Category) | 72 (37.3%) | 121 (62.7%) |
| Total (Overall) | 476 (60.3%) | 313 (39.7%) |
Services Occupations
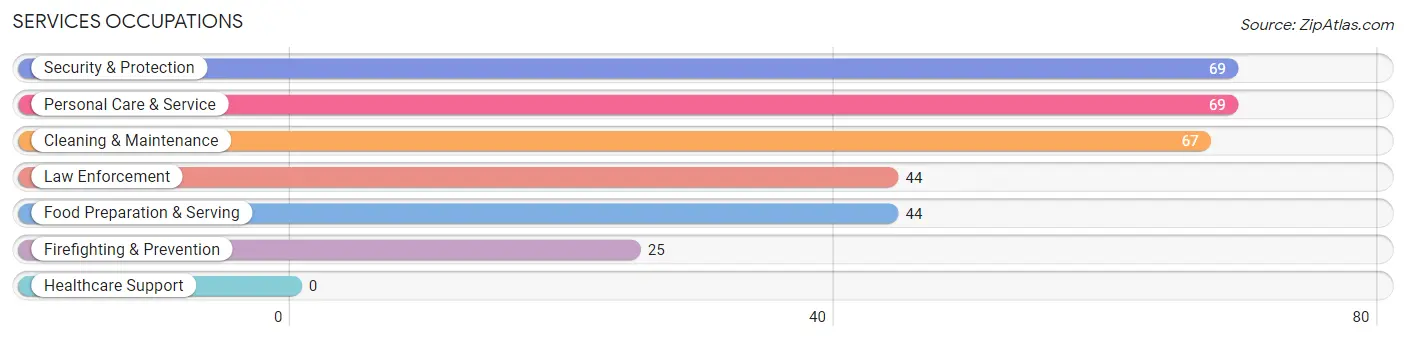
The most common Services occupations in Lake Placid are Security & Protection (69 | 8.7%), Personal Care & Service (69 | 8.7%), Cleaning & Maintenance (67 | 8.5%), Law Enforcement (44 | 5.6%), and Food Preparation & Serving (44 | 5.6%).
Services Occupations by Sex
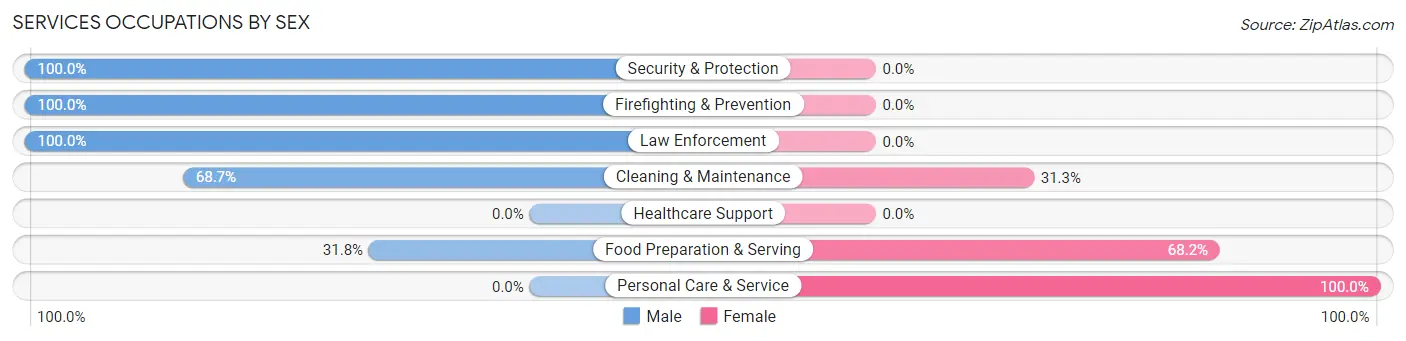
Within the Services occupations in Lake Placid, the most male-oriented occupations are Security & Protection (100.0%), Firefighting & Prevention (100.0%), and Law Enforcement (100.0%), while the most female-oriented occupations are Personal Care & Service (100.0%), Food Preparation & Serving (68.2%), and Cleaning & Maintenance (31.3%).
| Occupation | Male | Female |
| Healthcare Support | 0 (0.0%) | 0 (0.0%) |
| Security & Protection | 69 (100.0%) | 0 (0.0%) |
| Firefighting & Prevention | 25 (100.0%) | 0 (0.0%) |
| Law Enforcement | 44 (100.0%) | 0 (0.0%) |
| Food Preparation & Serving | 14 (31.8%) | 30 (68.2%) |
| Cleaning & Maintenance | 46 (68.7%) | 21 (31.3%) |
| Personal Care & Service | 0 (0.0%) | 69 (100.0%) |
| Total (Category) | 129 (51.8%) | 120 (48.2%) |
| Total (Overall) | 476 (60.3%) | 313 (39.7%) |
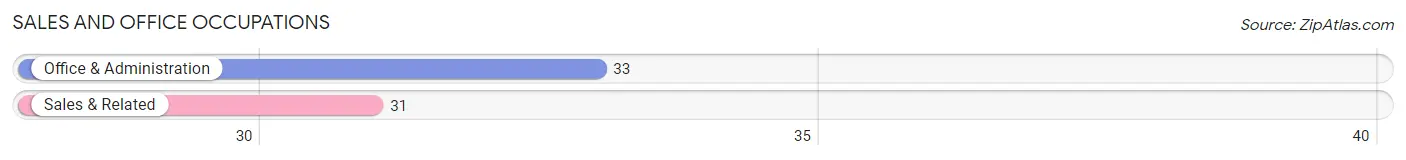
Sales and Office Occupations
The most common Sales and Office occupations in Lake Placid are Office & Administration (33 | 4.2%), and Sales & Related (31 | 3.9%).
Sales and Office Occupations by Sex
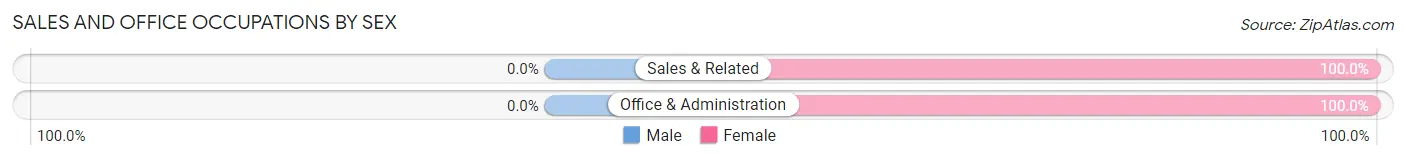
| Occupation | Male | Female |
| Sales & Related | 0 (0.0%) | 31 (100.0%) |
| Office & Administration | 0 (0.0%) | 33 (100.0%) |
| Total (Category) | 0 (0.0%) | 64 (100.0%) |
| Total (Overall) | 476 (60.3%) | 313 (39.7%) |
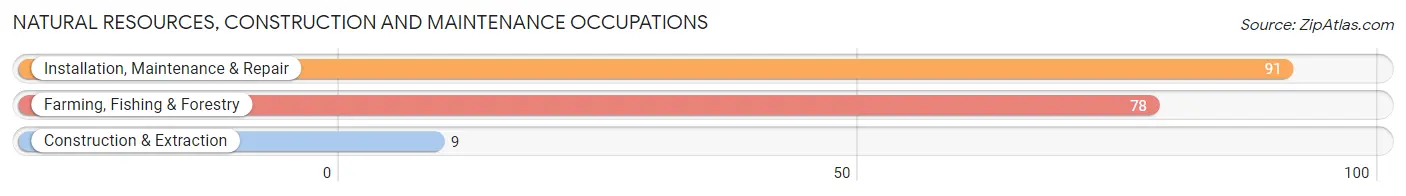
Natural Resources, Construction and Maintenance Occupations
The most common Natural Resources, Construction and Maintenance occupations in Lake Placid are Installation, Maintenance & Repair (91 | 11.5%), Farming, Fishing & Forestry (78 | 9.9%), and Construction & Extraction (9 | 1.1%).
Natural Resources, Construction and Maintenance Occupations by Sex
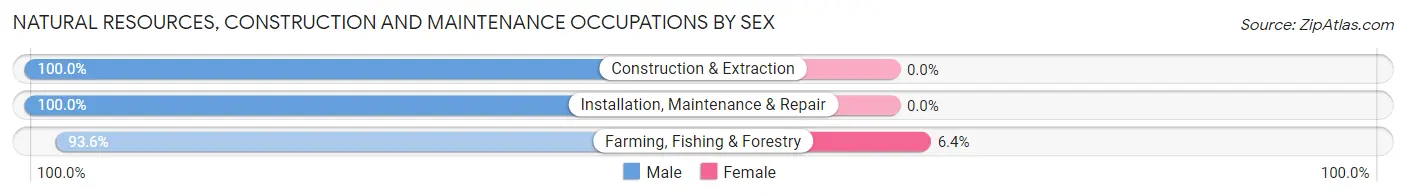
| Occupation | Male | Female |
| Farming, Fishing & Forestry | 73 (93.6%) | 5 (6.4%) |
| Construction & Extraction | 9 (100.0%) | 0 (0.0%) |
| Installation, Maintenance & Repair | 91 (100.0%) | 0 (0.0%) |
| Total (Category) | 173 (97.2%) | 5 (2.8%) |
| Total (Overall) | 476 (60.3%) | 313 (39.7%) |
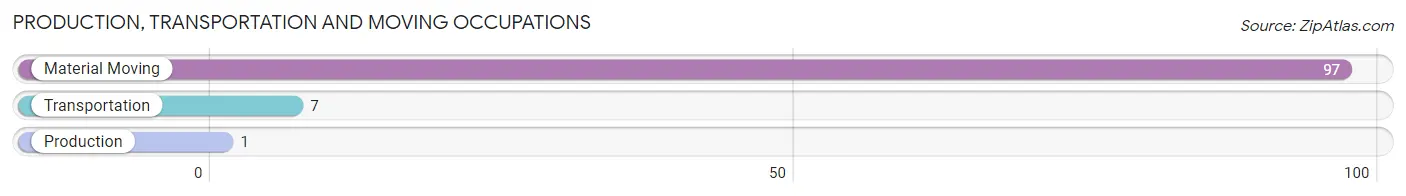
Production, Transportation and Moving Occupations
The most common Production, Transportation and Moving occupations in Lake Placid are Material Moving (97 | 12.3%), Transportation (7 | 0.9%), and Production (1 | 0.1%).
Production, Transportation and Moving Occupations by Sex
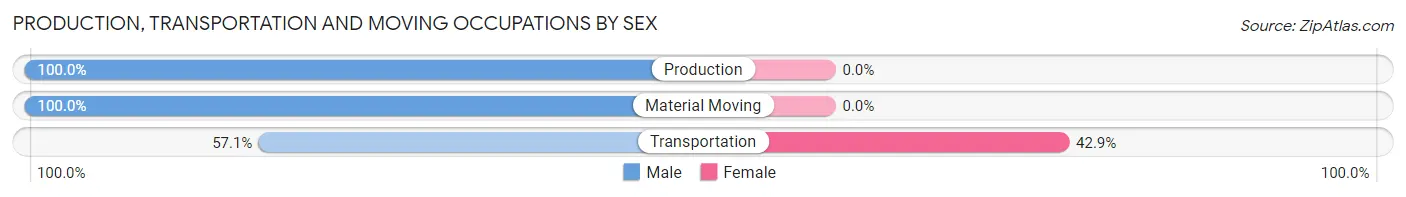
| Occupation | Male | Female |
| Production | 1 (100.0%) | 0 (0.0%) |
| Transportation | 4 (57.1%) | 3 (42.9%) |
| Material Moving | 97 (100.0%) | 0 (0.0%) |
| Total (Category) | 102 (97.1%) | 3 (2.9%) |
| Total (Overall) | 476 (60.3%) | 313 (39.7%) |
Employment Industries by Sex in Lake Placid
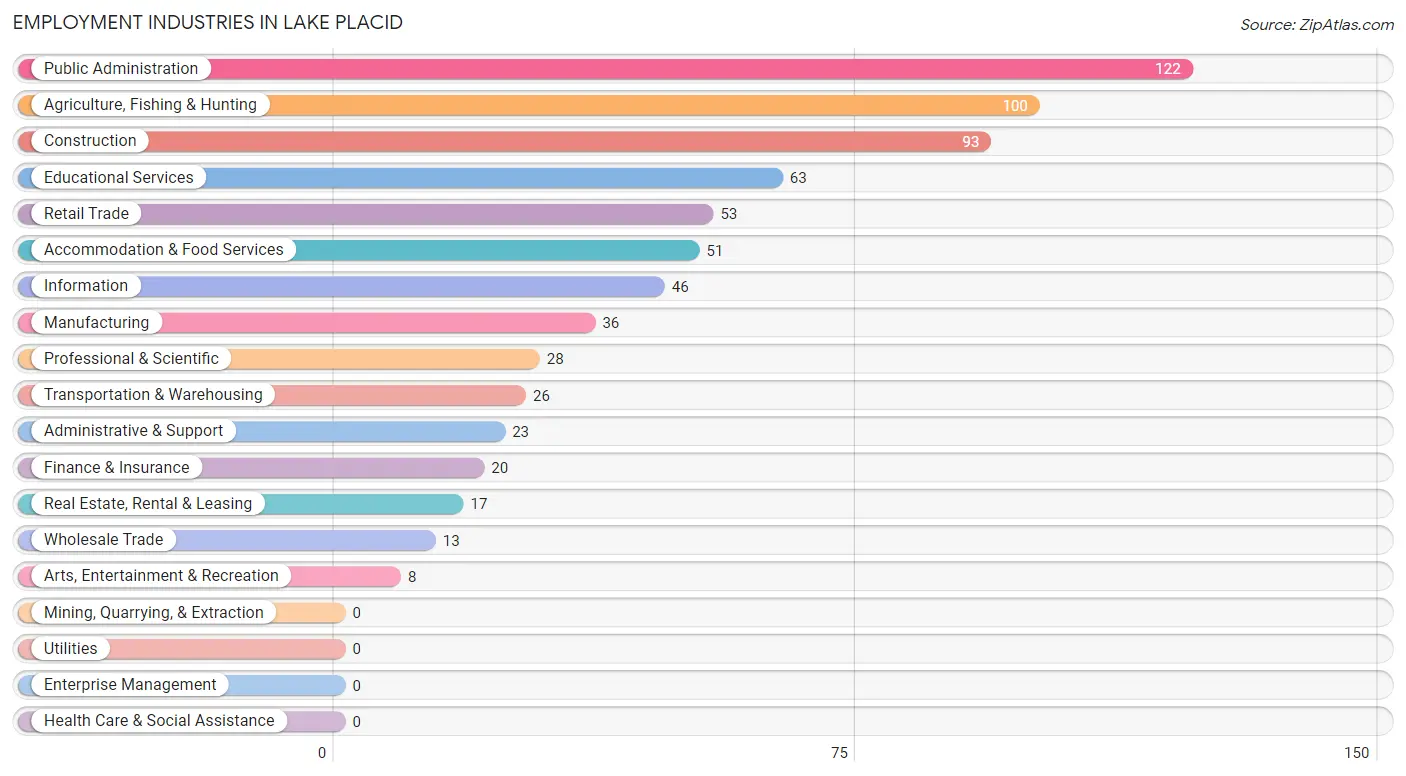
Employment Industries in Lake Placid
The major employment industries in Lake Placid include Public Administration (122 | 15.5%), Agriculture, Fishing & Hunting (100 | 12.7%), Construction (93 | 11.8%), Educational Services (63 | 8.0%), and Retail Trade (53 | 6.7%).
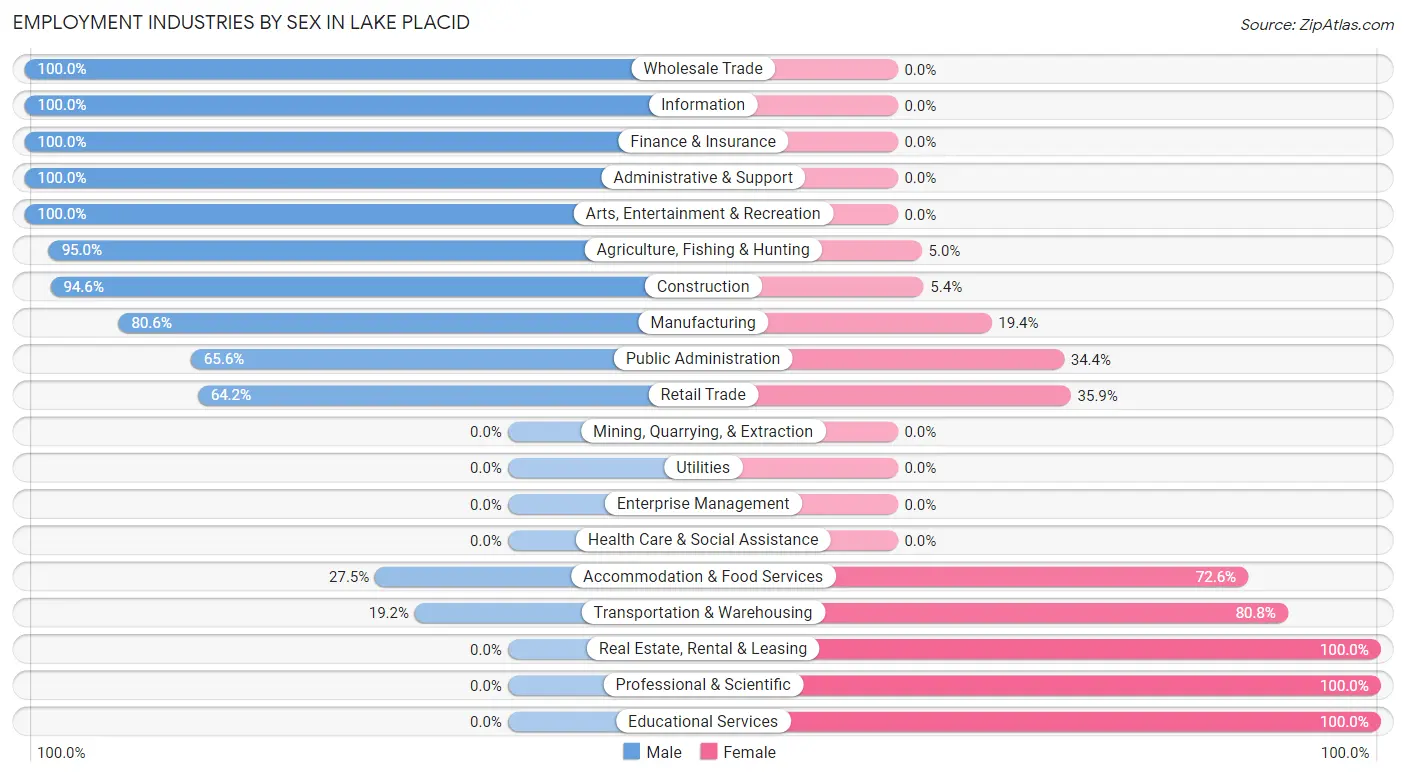
Employment Industries by Sex in Lake Placid
The Lake Placid industries that see more men than women are Wholesale Trade (100.0%), Information (100.0%), and Finance & Insurance (100.0%), whereas the industries that tend to have a higher number of women are Real Estate, Rental & Leasing (100.0%), Professional & Scientific (100.0%), and Educational Services (100.0%).
| Industry | Male | Female |
| Agriculture, Fishing & Hunting | 95 (95.0%) | 5 (5.0%) |
| Mining, Quarrying, & Extraction | 0 (0.0%) | 0 (0.0%) |
| Construction | 88 (94.6%) | 5 (5.4%) |
| Manufacturing | 29 (80.6%) | 7 (19.4%) |
| Wholesale Trade | 13 (100.0%) | 0 (0.0%) |
| Retail Trade | 34 (64.1%) | 19 (35.8%) |
| Transportation & Warehousing | 5 (19.2%) | 21 (80.8%) |
| Utilities | 0 (0.0%) | 0 (0.0%) |
| Information | 46 (100.0%) | 0 (0.0%) |
| Finance & Insurance | 20 (100.0%) | 0 (0.0%) |
| Real Estate, Rental & Leasing | 0 (0.0%) | 17 (100.0%) |
| Professional & Scientific | 0 (0.0%) | 28 (100.0%) |
| Enterprise Management | 0 (0.0%) | 0 (0.0%) |
| Administrative & Support | 23 (100.0%) | 0 (0.0%) |
| Educational Services | 0 (0.0%) | 63 (100.0%) |
| Health Care & Social Assistance | 0 (0.0%) | 0 (0.0%) |
| Arts, Entertainment & Recreation | 8 (100.0%) | 0 (0.0%) |
| Accommodation & Food Services | 14 (27.5%) | 37 (72.6%) |
| Public Administration | 80 (65.6%) | 42 (34.4%) |
| Total | 476 (60.3%) | 313 (39.7%) |
Education in Lake Placid
School Enrollment in Lake Placid
The most common levels of schooling among the 691 students in Lake Placid are kindergarten (192 | 27.8%), elementary school (169 | 24.5%), and college / undergraduate (146 | 21.1%).
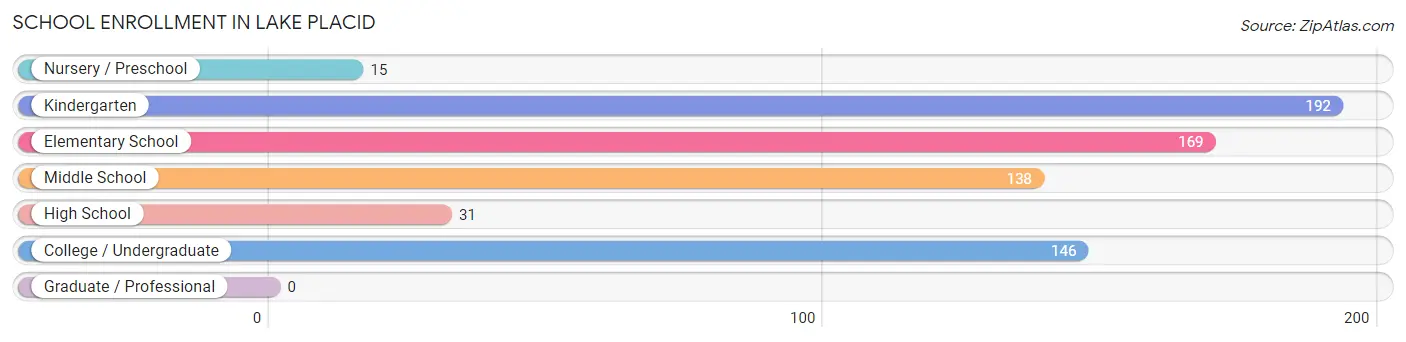
| School Level | # Students | % Students |
| Nursery / Preschool | 15 | 2.2% |
| Kindergarten | 192 | 27.8% |
| Elementary School | 169 | 24.5% |
| Middle School | 138 | 20.0% |
| High School | 31 | 4.5% |
| College / Undergraduate | 146 | 21.1% |
| Graduate / Professional | 0 | 0.0% |
| Total | 691 | 100.0% |
School Enrollment by Age by Funding Source in Lake Placid
Out of a total of 691 students who are enrolled in schools in Lake Placid, 62 (9.0%) attend a private institution, while the remaining 629 (91.0%) are enrolled in public schools. The age group of 18 to 19 year olds has the highest likelihood of being enrolled in private schools, with 9 (69.2% in the age bracket) enrolled. Conversely, the age group of 3 to 4 year olds has the lowest likelihood of being enrolled in a private school, with 15 (100.0% in the age bracket) attending a public institution.
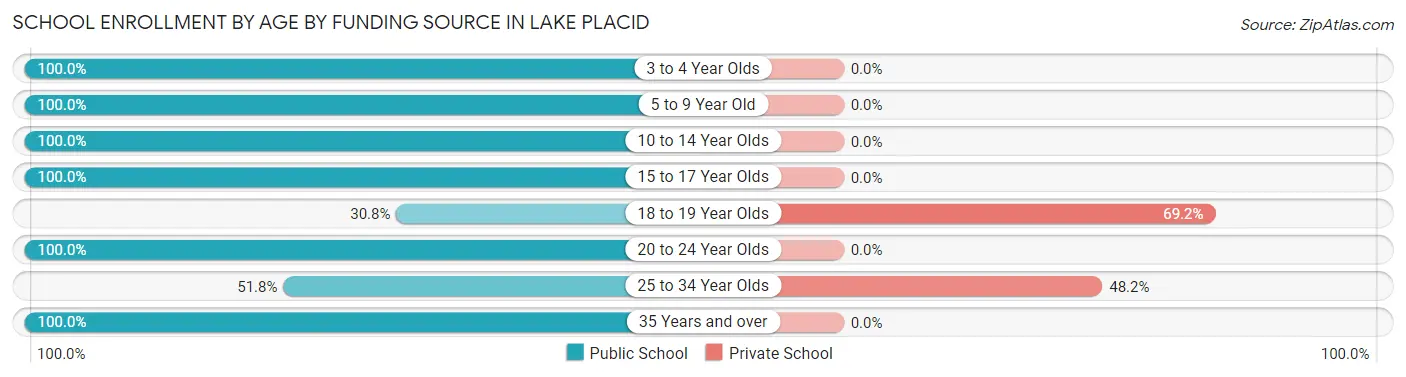
| Age Bracket | Public School | Private School |
| 3 to 4 Year Olds | 15 (100.0%) | 0 (0.0%) |
| 5 to 9 Year Old | 324 (100.0%) | 0 (0.0%) |
| 10 to 14 Year Olds | 185 (100.0%) | 0 (0.0%) |
| 15 to 17 Year Olds | 12 (100.0%) | 0 (0.0%) |
| 18 to 19 Year Olds | 4 (30.8%) | 9 (69.2%) |
| 20 to 24 Year Olds | 7 (100.0%) | 0 (0.0%) |
| 25 to 34 Year Olds | 57 (51.8%) | 53 (48.2%) |
| 35 Years and over | 25 (100.0%) | 0 (0.0%) |
| Total | 629 (91.0%) | 62 (9.0%) |
Educational Attainment by Field of Study in Lake Placid
Education (65 | 19.2%), social sciences (55 | 16.2%), literature & languages (47 | 13.9%), science & technology (43 | 12.7%), and engineering (40 | 11.8%) are the most common fields of study among 339 individuals in Lake Placid who have obtained a bachelor's degree or higher.
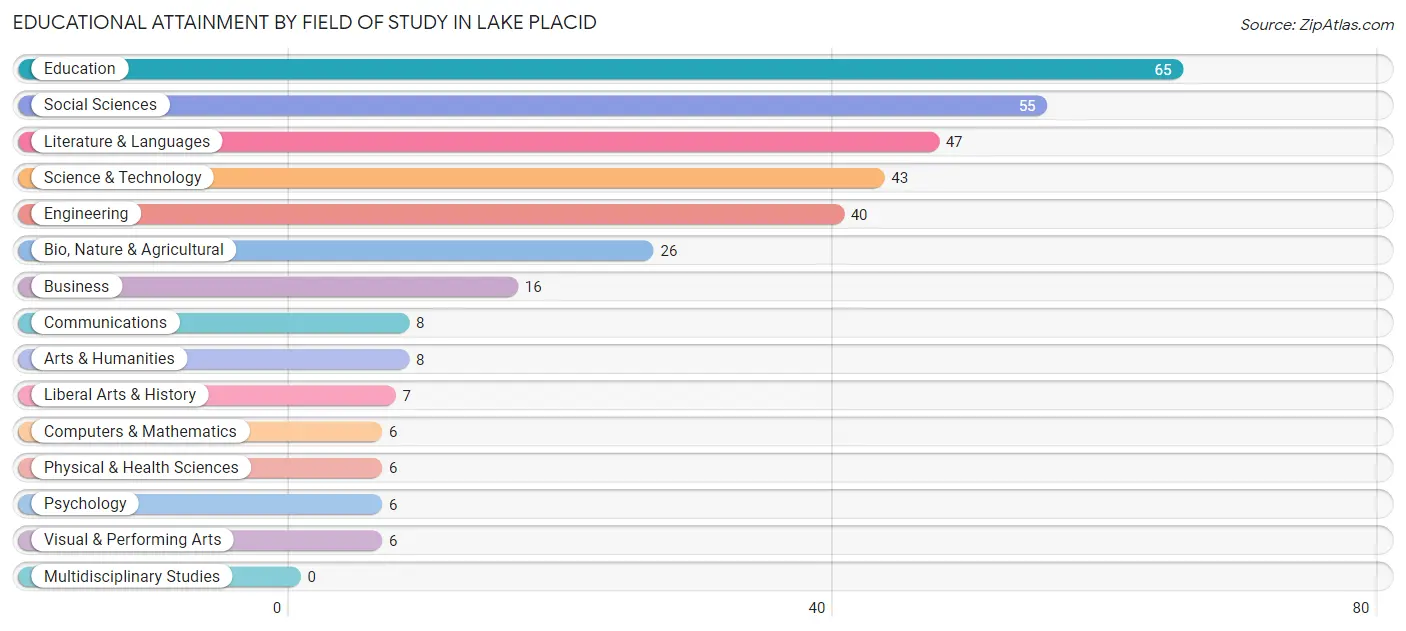
| Field of Study | # Graduates | % Graduates |
| Computers & Mathematics | 6 | 1.8% |
| Bio, Nature & Agricultural | 26 | 7.7% |
| Physical & Health Sciences | 6 | 1.8% |
| Psychology | 6 | 1.8% |
| Social Sciences | 55 | 16.2% |
| Engineering | 40 | 11.8% |
| Multidisciplinary Studies | 0 | 0.0% |
| Science & Technology | 43 | 12.7% |
| Business | 16 | 4.7% |
| Education | 65 | 19.2% |
| Literature & Languages | 47 | 13.9% |
| Liberal Arts & History | 7 | 2.1% |
| Visual & Performing Arts | 6 | 1.8% |
| Communications | 8 | 2.4% |
| Arts & Humanities | 8 | 2.4% |
| Total | 339 | 100.0% |
Transportation & Commute in Lake Placid
Vehicle Availability by Sex in Lake Placid
The most prevalent vehicle ownership categories in Lake Placid are males with 3 vehicles (157, accounting for 34.4%) and females with 3 vehicles (49, making up 50.2%).
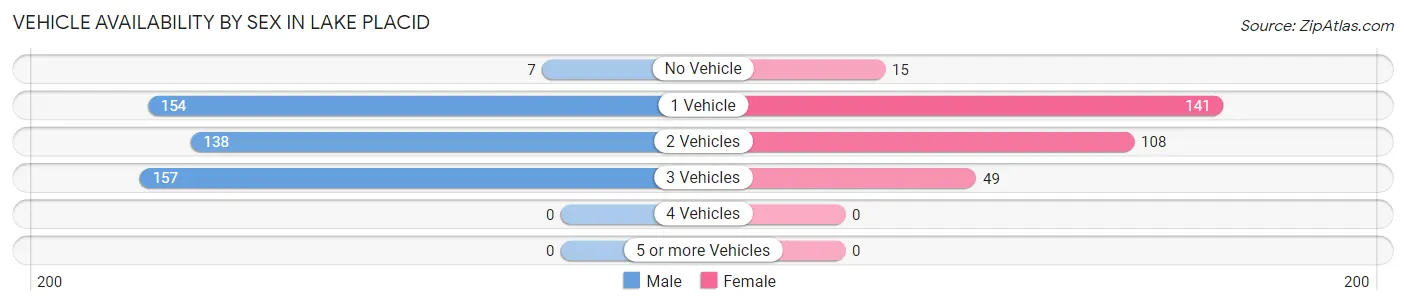
| Vehicles Available | Male | Female |
| No Vehicle | 7 (1.5%) | 15 (4.8%) |
| 1 Vehicle | 154 (33.8%) | 141 (45.1%) |
| 2 Vehicles | 138 (30.3%) | 108 (34.5%) |
| 3 Vehicles | 157 (34.4%) | 49 (15.7%) |
| 4 Vehicles | 0 (0.0%) | 0 (0.0%) |
| 5 or more Vehicles | 0 (0.0%) | 0 (0.0%) |
| Total | 456 (100.0%) | 313 (100.0%) |
Commute Time in Lake Placid
The most frequently occuring commute durations in Lake Placid are 45 to 59 minutes (153 commuters, 21.5%), 30 to 34 minutes (117 commuters, 16.4%), and 5 to 9 minutes (71 commuters, 10.0%).
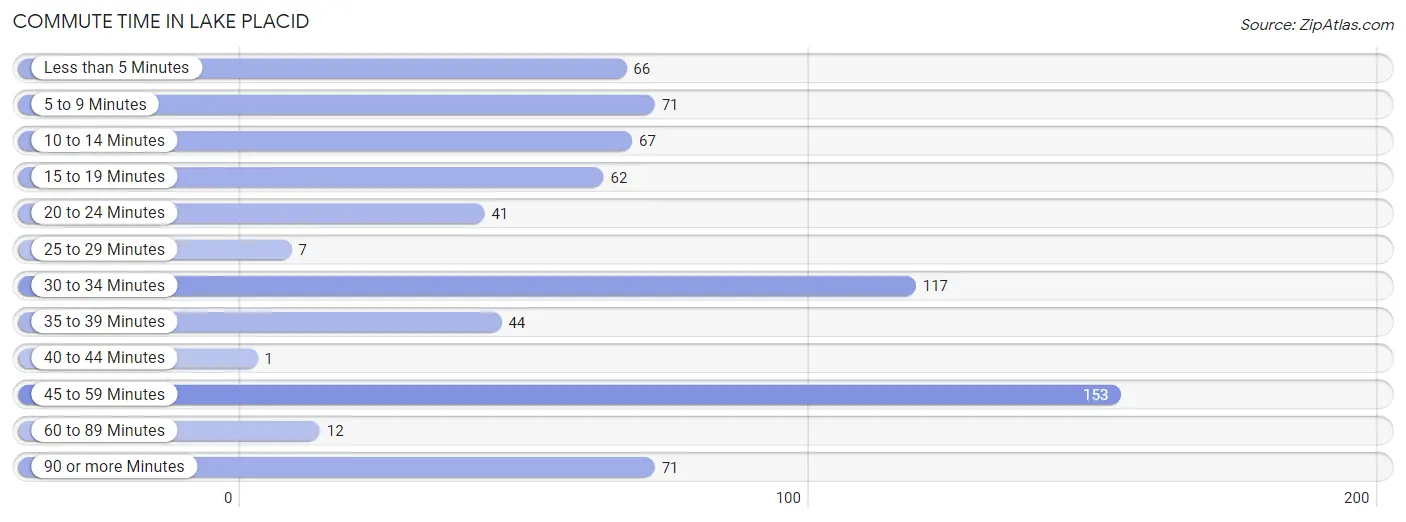
| Commute Time | # Commuters | % Commuters |
| Less than 5 Minutes | 66 | 9.3% |
| 5 to 9 Minutes | 71 | 10.0% |
| 10 to 14 Minutes | 67 | 9.4% |
| 15 to 19 Minutes | 62 | 8.7% |
| 20 to 24 Minutes | 41 | 5.8% |
| 25 to 29 Minutes | 7 | 1.0% |
| 30 to 34 Minutes | 117 | 16.4% |
| 35 to 39 Minutes | 44 | 6.2% |
| 40 to 44 Minutes | 1 | 0.1% |
| 45 to 59 Minutes | 153 | 21.5% |
| 60 to 89 Minutes | 12 | 1.7% |
| 90 or more Minutes | 71 | 10.0% |
Commute Time by Sex in Lake Placid
The most common commute times in Lake Placid are 45 to 59 minutes (129 commuters, 27.1%) for males and less than 5 minutes (61 commuters, 25.9%) for females.
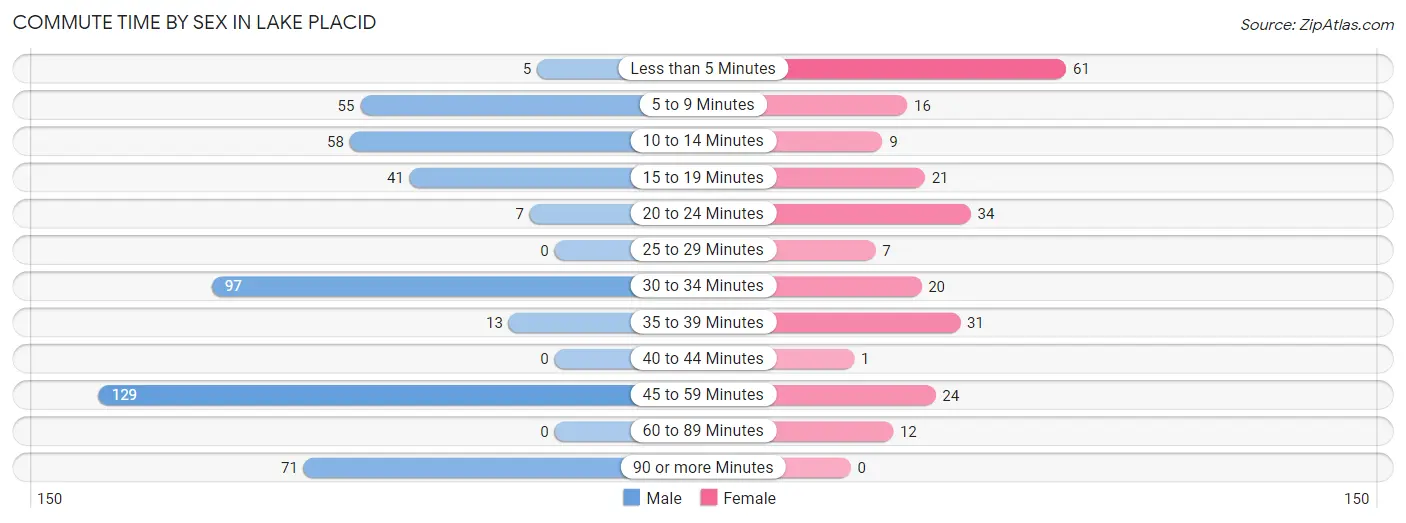
| Commute Time | Male | Female |
| Less than 5 Minutes | 5 (1.1%) | 61 (25.9%) |
| 5 to 9 Minutes | 55 (11.6%) | 16 (6.8%) |
| 10 to 14 Minutes | 58 (12.2%) | 9 (3.8%) |
| 15 to 19 Minutes | 41 (8.6%) | 21 (8.9%) |
| 20 to 24 Minutes | 7 (1.5%) | 34 (14.4%) |
| 25 to 29 Minutes | 0 (0.0%) | 7 (3.0%) |
| 30 to 34 Minutes | 97 (20.4%) | 20 (8.5%) |
| 35 to 39 Minutes | 13 (2.7%) | 31 (13.1%) |
| 40 to 44 Minutes | 0 (0.0%) | 1 (0.4%) |
| 45 to 59 Minutes | 129 (27.1%) | 24 (10.2%) |
| 60 to 89 Minutes | 0 (0.0%) | 12 (5.1%) |
| 90 or more Minutes | 71 (14.9%) | 0 (0.0%) |
Time of Departure to Work by Sex in Lake Placid
The most frequent times of departure to work in Lake Placid are 6:00 AM to 6:29 AM (122, 25.6%) for males and 7:00 AM to 7:29 AM (88, 37.3%) for females.
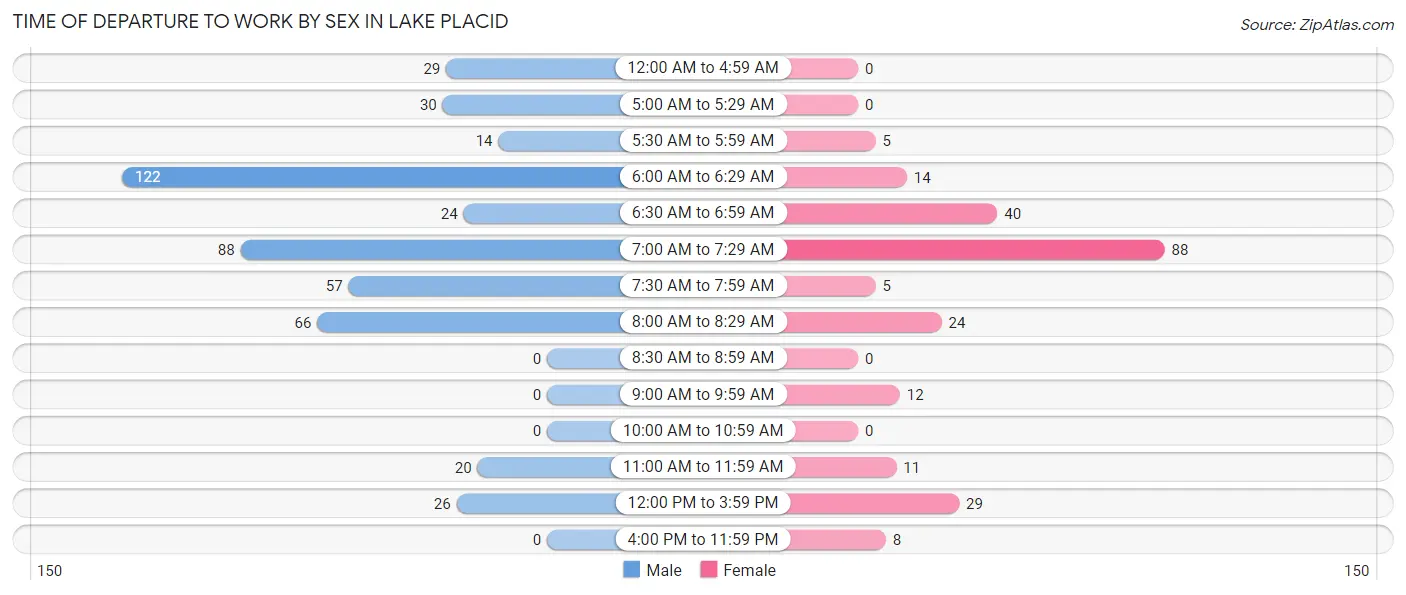
| Time of Departure | Male | Female |
| 12:00 AM to 4:59 AM | 29 (6.1%) | 0 (0.0%) |
| 5:00 AM to 5:29 AM | 30 (6.3%) | 0 (0.0%) |
| 5:30 AM to 5:59 AM | 14 (2.9%) | 5 (2.1%) |
| 6:00 AM to 6:29 AM | 122 (25.6%) | 14 (5.9%) |
| 6:30 AM to 6:59 AM | 24 (5.0%) | 40 (17.0%) |
| 7:00 AM to 7:29 AM | 88 (18.5%) | 88 (37.3%) |
| 7:30 AM to 7:59 AM | 57 (12.0%) | 5 (2.1%) |
| 8:00 AM to 8:29 AM | 66 (13.9%) | 24 (10.2%) |
| 8:30 AM to 8:59 AM | 0 (0.0%) | 0 (0.0%) |
| 9:00 AM to 9:59 AM | 0 (0.0%) | 12 (5.1%) |
| 10:00 AM to 10:59 AM | 0 (0.0%) | 0 (0.0%) |
| 11:00 AM to 11:59 AM | 20 (4.2%) | 11 (4.7%) |
| 12:00 PM to 3:59 PM | 26 (5.5%) | 29 (12.3%) |
| 4:00 PM to 11:59 PM | 0 (0.0%) | 8 (3.4%) |
| Total | 476 (100.0%) | 236 (100.0%) |
Housing Occupancy in Lake Placid
Occupancy by Ownership in Lake Placid
Of the total 943 dwellings in Lake Placid, owner-occupied units account for 485 (51.4%), while renter-occupied units make up 458 (48.6%).
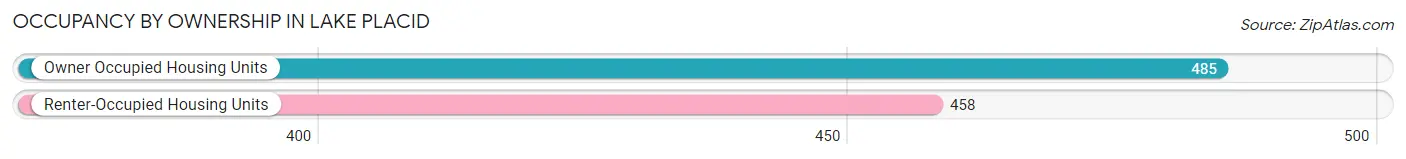
| Occupancy | # Housing Units | % Housing Units |
| Owner Occupied Housing Units | 485 | 51.4% |
| Renter-Occupied Housing Units | 458 | 48.6% |
| Total Occupied Housing Units | 943 | 100.0% |
Occupancy by Household Size in Lake Placid
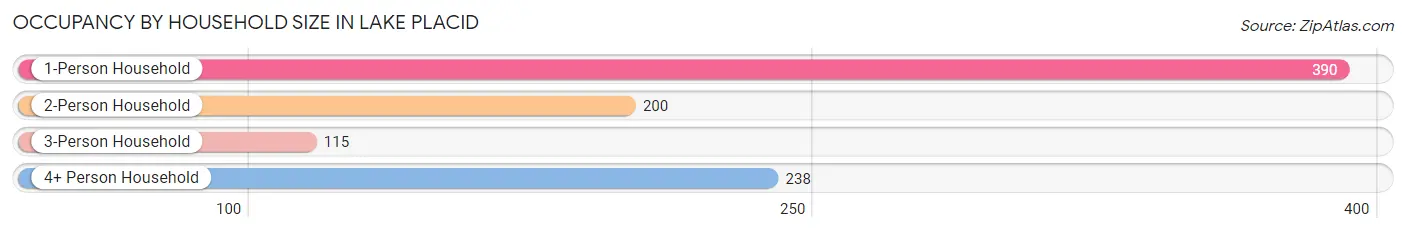
| Household Size | # Housing Units | % Housing Units |
| 1-Person Household | 390 | 41.4% |
| 2-Person Household | 200 | 21.2% |
| 3-Person Household | 115 | 12.2% |
| 4+ Person Household | 238 | 25.2% |
| Total Housing Units | 943 | 100.0% |
Occupancy by Ownership by Household Size in Lake Placid
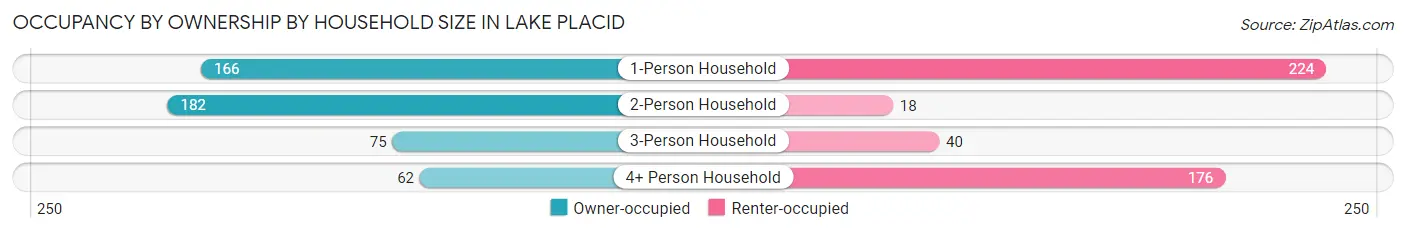
| Household Size | Owner-occupied | Renter-occupied |
| 1-Person Household | 166 (42.6%) | 224 (57.4%) |
| 2-Person Household | 182 (91.0%) | 18 (9.0%) |
| 3-Person Household | 75 (65.2%) | 40 (34.8%) |
| 4+ Person Household | 62 (26.1%) | 176 (74.0%) |
| Total Housing Units | 485 (51.4%) | 458 (48.6%) |
Occupancy by Educational Attainment in Lake Placid
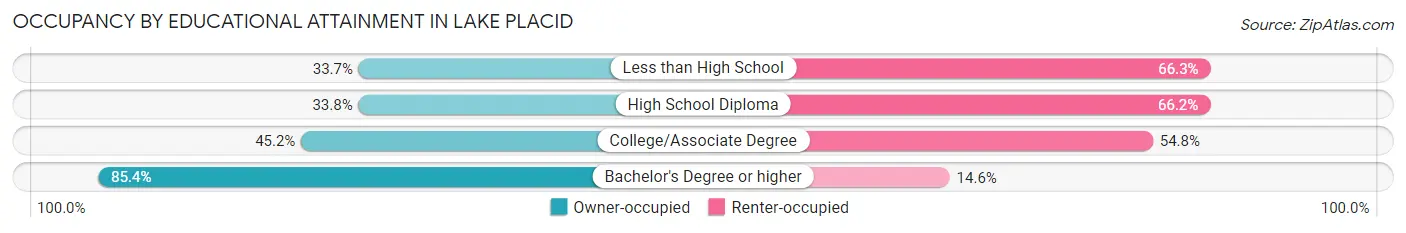
| Household Size | Owner-occupied | Renter-occupied |
| Less than High School | 55 (33.7%) | 108 (66.3%) |
| High School Diploma | 73 (33.8%) | 143 (66.2%) |
| College/Associate Degree | 140 (45.2%) | 170 (54.8%) |
| Bachelor's Degree or higher | 217 (85.4%) | 37 (14.6%) |
Occupancy by Age of Householder in Lake Placid
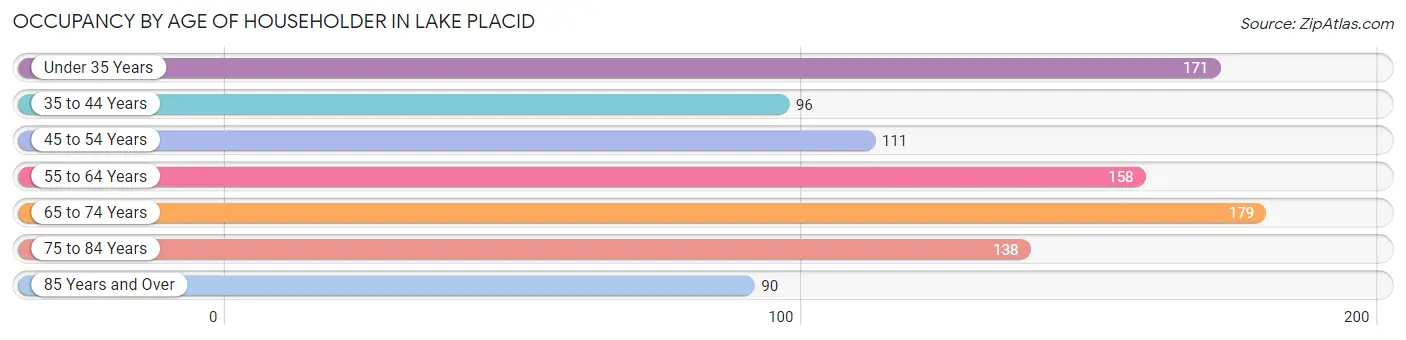
| Age Bracket | # Households | % Households |
| Under 35 Years | 171 | 18.1% |
| 35 to 44 Years | 96 | 10.2% |
| 45 to 54 Years | 111 | 11.8% |
| 55 to 64 Years | 158 | 16.8% |
| 65 to 74 Years | 179 | 19.0% |
| 75 to 84 Years | 138 | 14.6% |
| 85 Years and Over | 90 | 9.5% |
| Total | 943 | 100.0% |
Housing Finances in Lake Placid
Median Income by Occupancy in Lake Placid
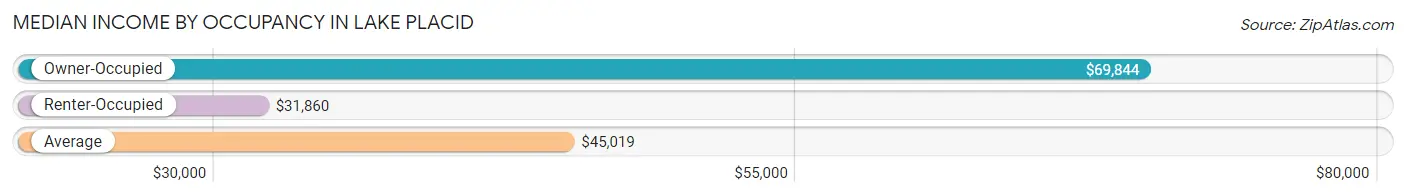
| Occupancy Type | # Households | Median Income |
| Owner-Occupied | 485 (51.4%) | $69,844 |
| Renter-Occupied | 458 (48.6%) | $31,860 |
| Average | 943 (100.0%) | $45,019 |
Occupancy by Householder Income Bracket in Lake Placid
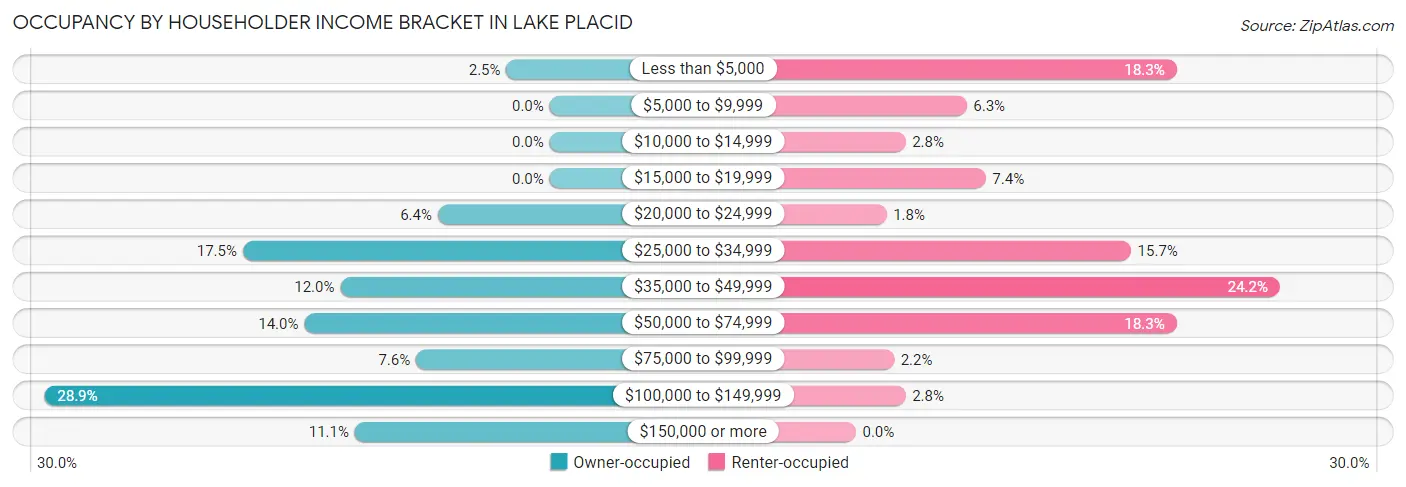
| Income Bracket | Owner-occupied | Renter-occupied |
| Less than $5,000 | 12 (2.5%) | 84 (18.3%) |
| $5,000 to $9,999 | 0 (0.0%) | 29 (6.3%) |
| $10,000 to $14,999 | 0 (0.0%) | 13 (2.8%) |
| $15,000 to $19,999 | 0 (0.0%) | 34 (7.4%) |
| $20,000 to $24,999 | 31 (6.4%) | 8 (1.8%) |
| $25,000 to $34,999 | 85 (17.5%) | 72 (15.7%) |
| $35,000 to $49,999 | 58 (12.0%) | 111 (24.2%) |
| $50,000 to $74,999 | 68 (14.0%) | 84 (18.3%) |
| $75,000 to $99,999 | 37 (7.6%) | 10 (2.2%) |
| $100,000 to $149,999 | 140 (28.9%) | 13 (2.8%) |
| $150,000 or more | 54 (11.1%) | 0 (0.0%) |
| Total | 485 (100.0%) | 458 (100.0%) |
Monthly Housing Cost Tiers in Lake Placid
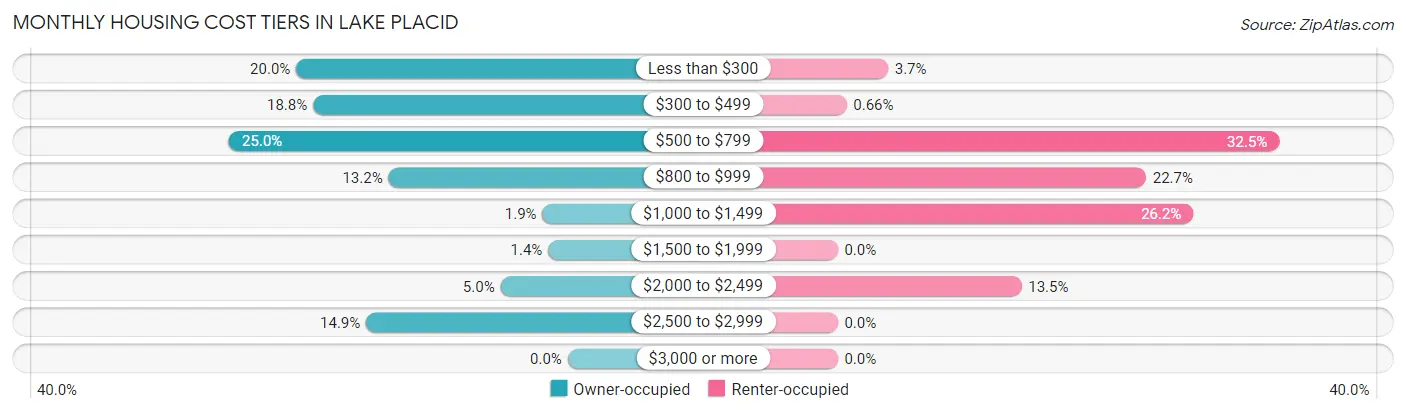
| Monthly Cost | Owner-occupied | Renter-occupied |
| Less than $300 | 97 (20.0%) | 17 (3.7%) |
| $300 to $499 | 91 (18.8%) | 3 (0.7%) |
| $500 to $799 | 121 (24.9%) | 149 (32.5%) |
| $800 to $999 | 64 (13.2%) | 104 (22.7%) |
| $1,000 to $1,499 | 9 (1.9%) | 120 (26.2%) |
| $1,500 to $1,999 | 7 (1.4%) | 0 (0.0%) |
| $2,000 to $2,499 | 24 (5.0%) | 62 (13.5%) |
| $2,500 to $2,999 | 72 (14.8%) | 0 (0.0%) |
| $3,000 or more | 0 (0.0%) | 0 (0.0%) |
| Total | 485 (100.0%) | 458 (100.0%) |
Physical Housing Characteristics in Lake Placid
Housing Structures in Lake Placid
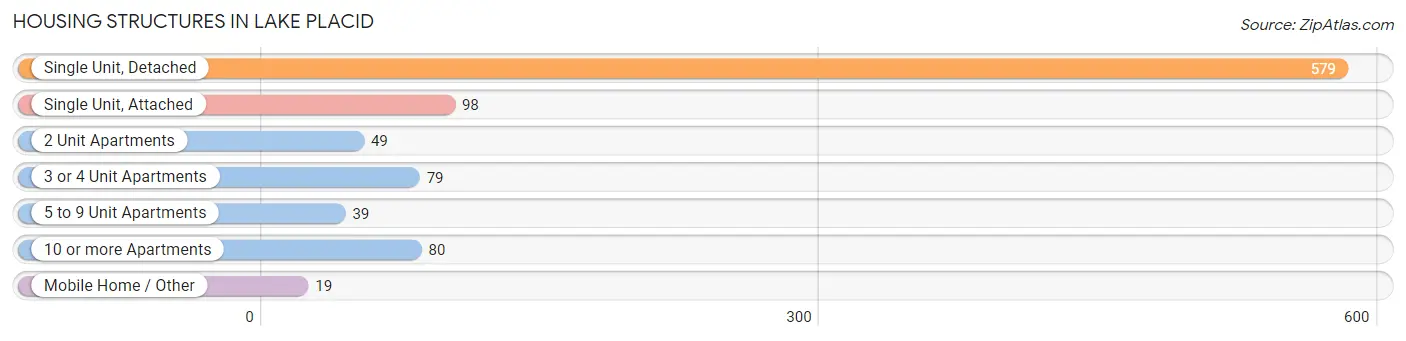
| Structure Type | # Housing Units | % Housing Units |
| Single Unit, Detached | 579 | 61.4% |
| Single Unit, Attached | 98 | 10.4% |
| 2 Unit Apartments | 49 | 5.2% |
| 3 or 4 Unit Apartments | 79 | 8.4% |
| 5 to 9 Unit Apartments | 39 | 4.1% |
| 10 or more Apartments | 80 | 8.5% |
| Mobile Home / Other | 19 | 2.0% |
| Total | 943 | 100.0% |
Housing Structures by Occupancy in Lake Placid
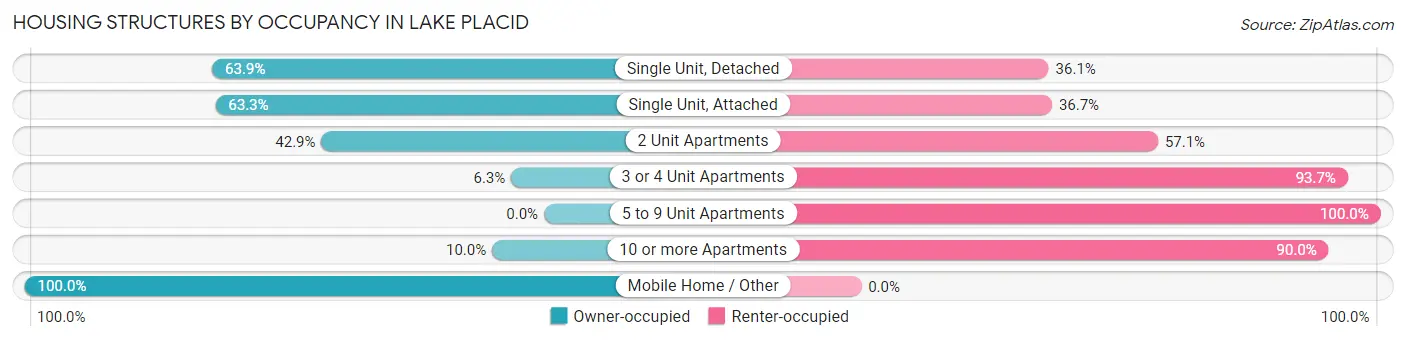
| Structure Type | Owner-occupied | Renter-occupied |
| Single Unit, Detached | 370 (63.9%) | 209 (36.1%) |
| Single Unit, Attached | 62 (63.3%) | 36 (36.7%) |
| 2 Unit Apartments | 21 (42.9%) | 28 (57.1%) |
| 3 or 4 Unit Apartments | 5 (6.3%) | 74 (93.7%) |
| 5 to 9 Unit Apartments | 0 (0.0%) | 39 (100.0%) |
| 10 or more Apartments | 8 (10.0%) | 72 (90.0%) |
| Mobile Home / Other | 19 (100.0%) | 0 (0.0%) |
| Total | 485 (51.4%) | 458 (48.6%) |
Housing Structures by Number of Rooms in Lake Placid
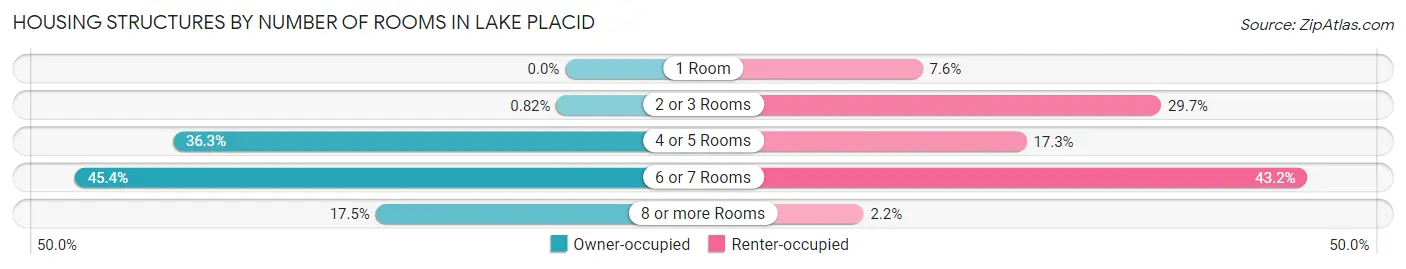
| Number of Rooms | Owner-occupied | Renter-occupied |
| 1 Room | 0 (0.0%) | 35 (7.6%) |
| 2 or 3 Rooms | 4 (0.8%) | 136 (29.7%) |
| 4 or 5 Rooms | 176 (36.3%) | 79 (17.2%) |
| 6 or 7 Rooms | 220 (45.4%) | 198 (43.2%) |
| 8 or more Rooms | 85 (17.5%) | 10 (2.2%) |
| Total | 485 (100.0%) | 458 (100.0%) |
Housing Structure by Heating Type in Lake Placid
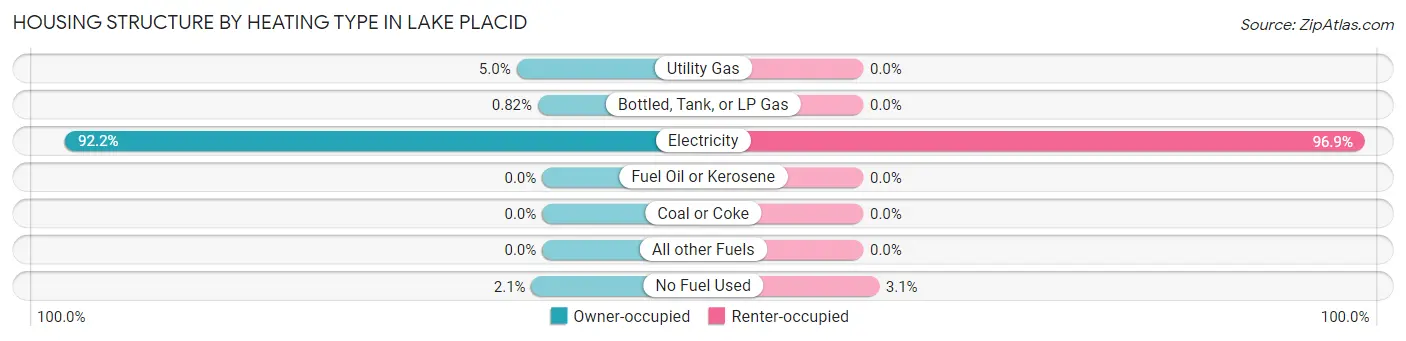
| Heating Type | Owner-occupied | Renter-occupied |
| Utility Gas | 24 (5.0%) | 0 (0.0%) |
| Bottled, Tank, or LP Gas | 4 (0.8%) | 0 (0.0%) |
| Electricity | 447 (92.2%) | 444 (96.9%) |
| Fuel Oil or Kerosene | 0 (0.0%) | 0 (0.0%) |
| Coal or Coke | 0 (0.0%) | 0 (0.0%) |
| All other Fuels | 0 (0.0%) | 0 (0.0%) |
| No Fuel Used | 10 (2.1%) | 14 (3.1%) |
| Total | 485 (100.0%) | 458 (100.0%) |
Household Vehicle Usage in Lake Placid
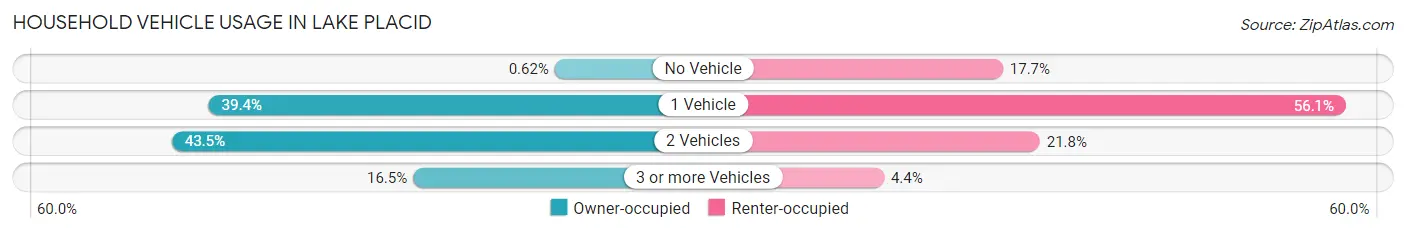
| Vehicles per Household | Owner-occupied | Renter-occupied |
| No Vehicle | 3 (0.6%) | 81 (17.7%) |
| 1 Vehicle | 191 (39.4%) | 257 (56.1%) |
| 2 Vehicles | 211 (43.5%) | 100 (21.8%) |
| 3 or more Vehicles | 80 (16.5%) | 20 (4.4%) |
| Total | 485 (100.0%) | 458 (100.0%) |
Real Estate & Mortgages in Lake Placid
Real Estate and Mortgage Overview in Lake Placid
| Characteristic | Without Mortgage | With Mortgage |
| Housing Units | 357 | 128 |
| Median Property Value | $252,700 | $500,000 |
| Median Household Income | $56,875 | $25 |
| Monthly Housing Costs | $475 | $0 |
| Real Estate Taxes | $1,169 | $0 |
Property Value by Mortgage Status in Lake Placid
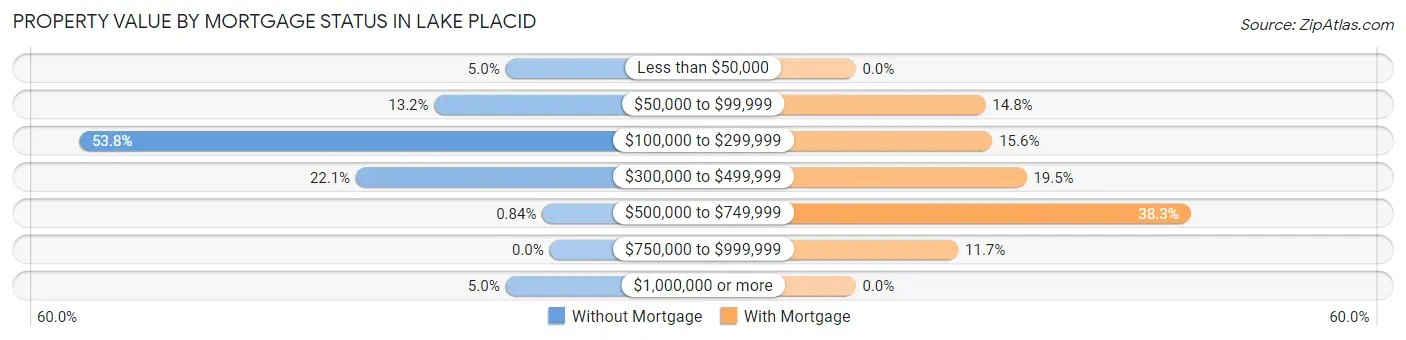
| Property Value | Without Mortgage | With Mortgage |
| Less than $50,000 | 18 (5.0%) | 0 (0.0%) |
| $50,000 to $99,999 | 47 (13.2%) | 19 (14.8%) |
| $100,000 to $299,999 | 192 (53.8%) | 20 (15.6%) |
| $300,000 to $499,999 | 79 (22.1%) | 25 (19.5%) |
| $500,000 to $749,999 | 3 (0.8%) | 49 (38.3%) |
| $750,000 to $999,999 | 0 (0.0%) | 15 (11.7%) |
| $1,000,000 or more | 18 (5.0%) | 0 (0.0%) |
| Total | 357 (100.0%) | 128 (100.0%) |
Household Income by Mortgage Status in Lake Placid
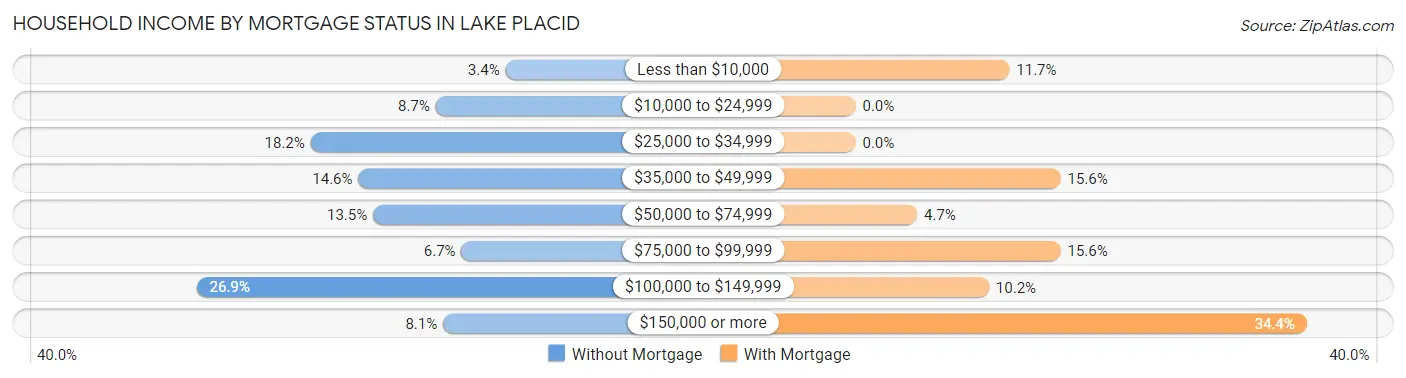
| Household Income | Without Mortgage | With Mortgage |
| Less than $10,000 | 12 (3.4%) | 15 (11.7%) |
| $10,000 to $24,999 | 31 (8.7%) | 0 (0.0%) |
| $25,000 to $34,999 | 65 (18.2%) | 0 (0.0%) |
| $35,000 to $49,999 | 52 (14.6%) | 20 (15.6%) |
| $50,000 to $74,999 | 48 (13.5%) | 6 (4.7%) |
| $75,000 to $99,999 | 24 (6.7%) | 20 (15.6%) |
| $100,000 to $149,999 | 96 (26.9%) | 13 (10.2%) |
| $150,000 or more | 29 (8.1%) | 44 (34.4%) |
| Total | 357 (100.0%) | 128 (100.0%) |
Property Value to Household Income Ratio in Lake Placid
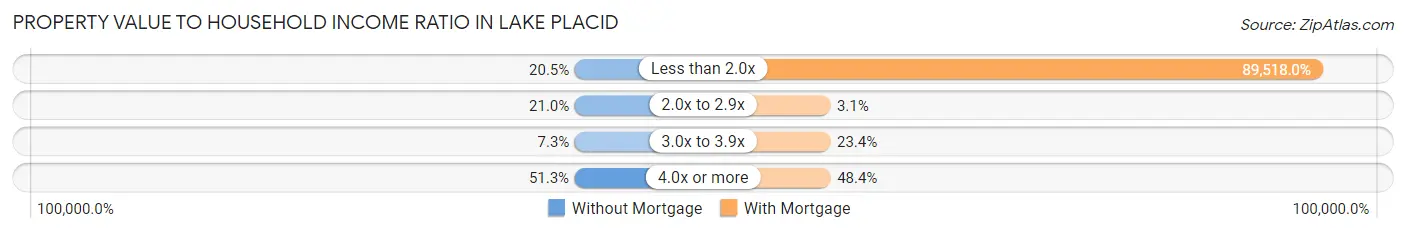
| Value-to-Income Ratio | Without Mortgage | With Mortgage |
| Less than 2.0x | 73 (20.4%) | 114,583 (89,518.0%) |
| 2.0x to 2.9x | 75 (21.0%) | 4 (3.1%) |
| 3.0x to 3.9x | 26 (7.3%) | 30 (23.4%) |
| 4.0x or more | 183 (51.3%) | 62 (48.4%) |
| Total | 357 (100.0%) | 128 (100.0%) |
Real Estate Taxes by Mortgage Status in Lake Placid
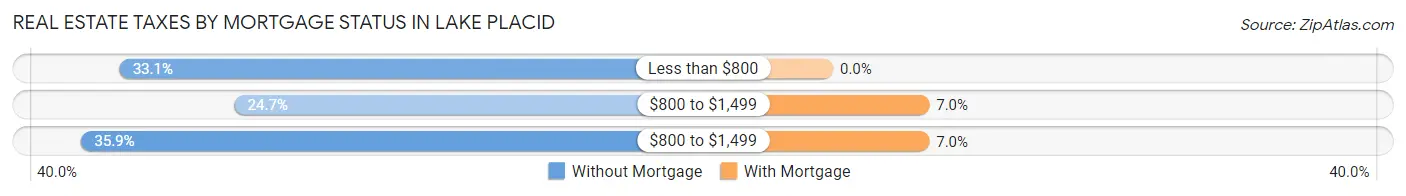
| Property Taxes | Without Mortgage | With Mortgage |
| Less than $800 | 118 (33.1%) | 0 (0.0%) |
| $800 to $1,499 | 88 (24.6%) | 9 (7.0%) |
| $800 to $1,499 | 128 (35.8%) | 9 (7.0%) |
| Total | 357 (100.0%) | 128 (100.0%) |
Health & Disability in Lake Placid
Health Insurance Coverage by Age in Lake Placid
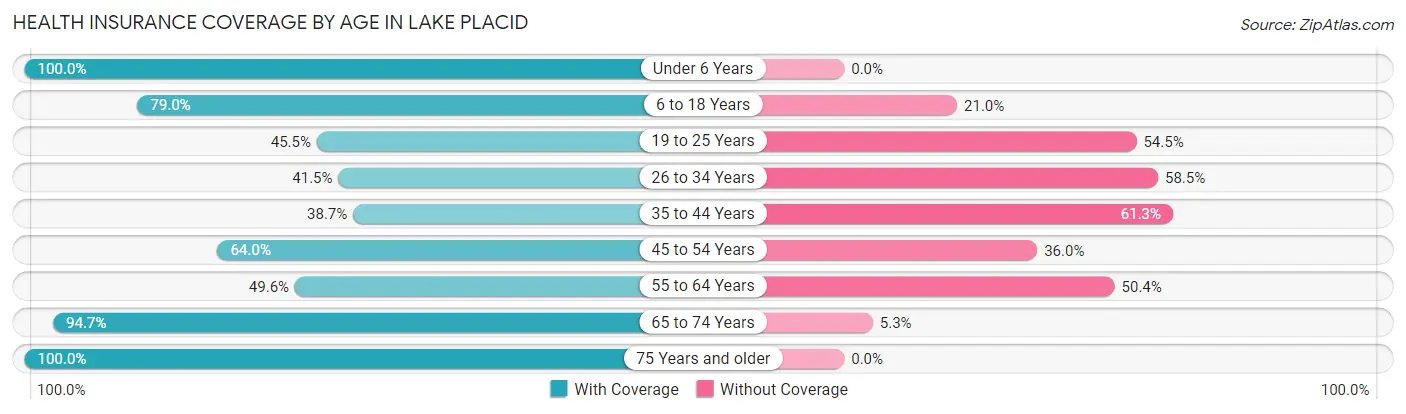
| Age Bracket | With Coverage | Without Coverage |
| Under 6 Years | 262 (100.0%) | 0 (0.0%) |
| 6 to 18 Years | 289 (79.0%) | 77 (21.0%) |
| 19 to 25 Years | 71 (45.5%) | 85 (54.5%) |
| 26 to 34 Years | 161 (41.5%) | 227 (58.5%) |
| 35 to 44 Years | 74 (38.7%) | 117 (61.3%) |
| 45 to 54 Years | 105 (64.0%) | 59 (36.0%) |
| 55 to 64 Years | 122 (49.6%) | 124 (50.4%) |
| 65 to 74 Years | 267 (94.7%) | 15 (5.3%) |
| 75 Years and older | 294 (100.0%) | 0 (0.0%) |
| Total | 1,645 (70.0%) | 704 (30.0%) |
Health Insurance Coverage by Citizenship Status in Lake Placid
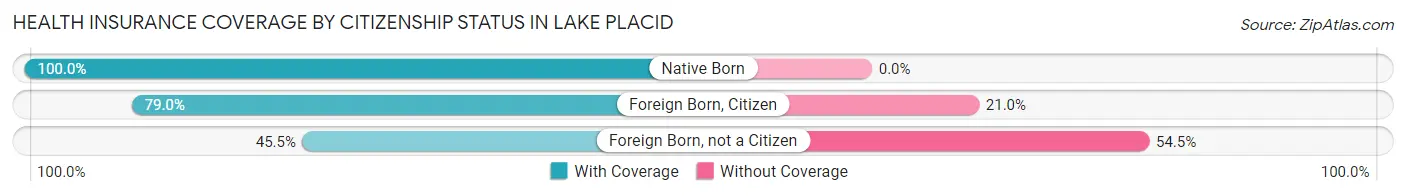
| Citizenship Status | With Coverage | Without Coverage |
| Native Born | 262 (100.0%) | 0 (0.0%) |
| Foreign Born, Citizen | 289 (79.0%) | 77 (21.0%) |
| Foreign Born, not a Citizen | 71 (45.5%) | 85 (54.5%) |
Health Insurance Coverage by Household Income in Lake Placid
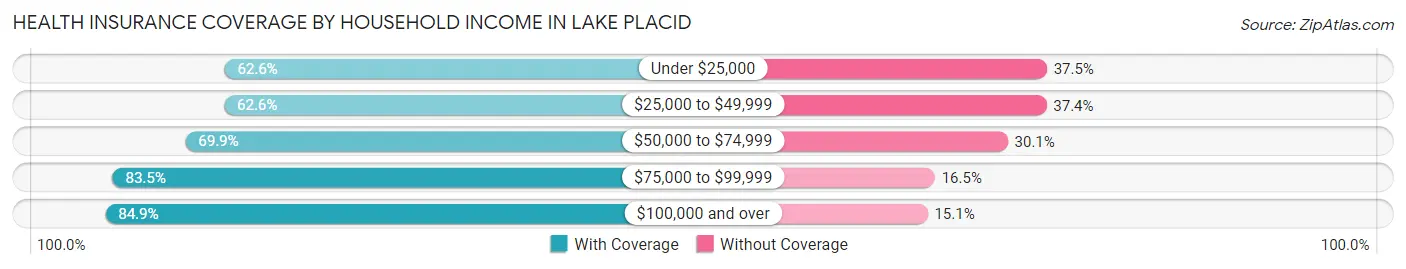
| Household Income | With Coverage | Without Coverage |
| Under $25,000 | 319 (62.5%) | 191 (37.4%) |
| $25,000 to $49,999 | 417 (62.6%) | 249 (37.4%) |
| $50,000 to $74,999 | 313 (69.9%) | 135 (30.1%) |
| $75,000 to $99,999 | 147 (83.5%) | 29 (16.5%) |
| $100,000 and over | 449 (84.9%) | 80 (15.1%) |
Public vs Private Health Insurance Coverage by Age in Lake Placid
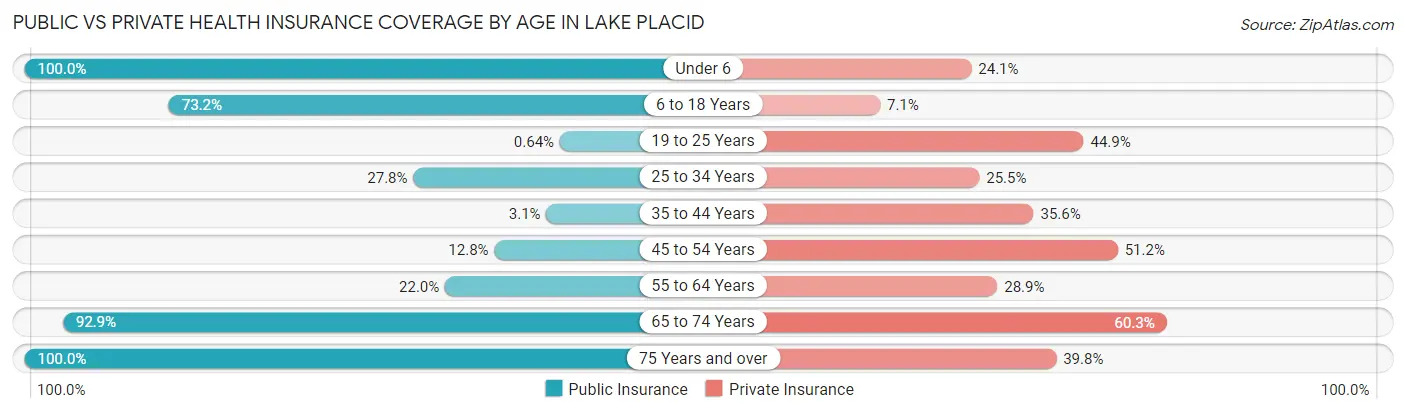
| Age Bracket | Public Insurance | Private Insurance |
| Under 6 | 262 (100.0%) | 63 (24.0%) |
| 6 to 18 Years | 268 (73.2%) | 26 (7.1%) |
| 19 to 25 Years | 1 (0.6%) | 70 (44.9%) |
| 25 to 34 Years | 108 (27.8%) | 99 (25.5%) |
| 35 to 44 Years | 6 (3.1%) | 68 (35.6%) |
| 45 to 54 Years | 21 (12.8%) | 84 (51.2%) |
| 55 to 64 Years | 54 (22.0%) | 71 (28.9%) |
| 65 to 74 Years | 262 (92.9%) | 170 (60.3%) |
| 75 Years and over | 294 (100.0%) | 117 (39.8%) |
| Total | 1,276 (54.3%) | 768 (32.7%) |
Disability Status by Sex by Age in Lake Placid
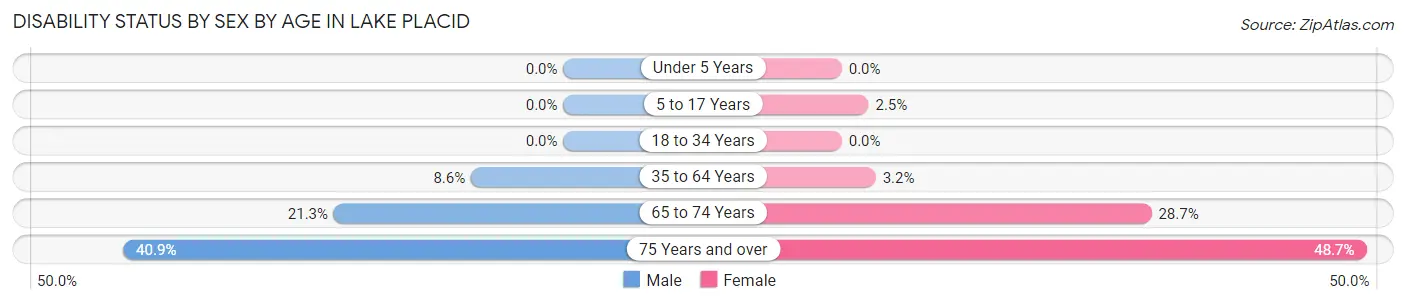
| Age Bracket | Male | Female |
| Under 5 Years | 0 (0.0%) | 0 (0.0%) |
| 5 to 17 Years | 0 (0.0%) | 5 (2.5%) |
| 18 to 34 Years | 0 (0.0%) | 0 (0.0%) |
| 35 to 64 Years | 27 (8.6%) | 9 (3.2%) |
| 65 to 74 Years | 23 (21.3%) | 50 (28.7%) |
| 75 Years and over | 58 (40.8%) | 74 (48.7%) |
Disability Class by Sex by Age in Lake Placid
Disability Class: Hearing Difficulty
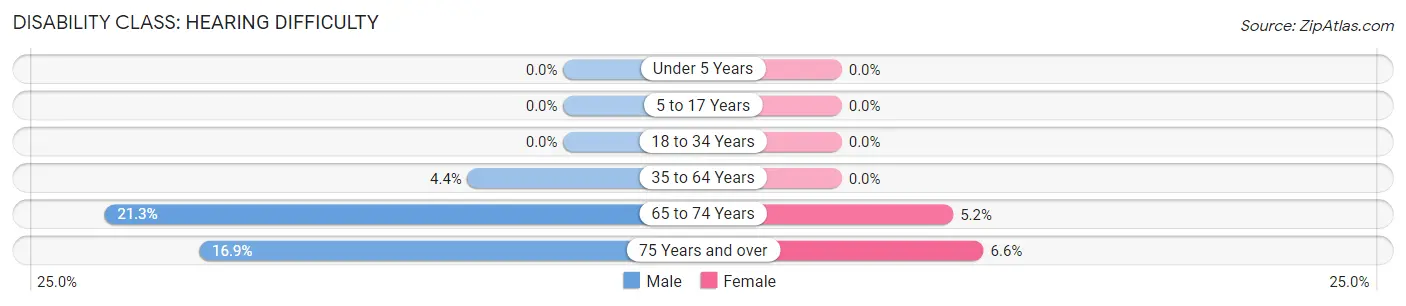
| Age Bracket | Male | Female |
| Under 5 Years | 0 (0.0%) | 0 (0.0%) |
| 5 to 17 Years | 0 (0.0%) | 0 (0.0%) |
| 18 to 34 Years | 0 (0.0%) | 0 (0.0%) |
| 35 to 64 Years | 14 (4.4%) | 0 (0.0%) |
| 65 to 74 Years | 23 (21.3%) | 9 (5.2%) |
| 75 Years and over | 24 (16.9%) | 10 (6.6%) |
Disability Class: Vision Difficulty
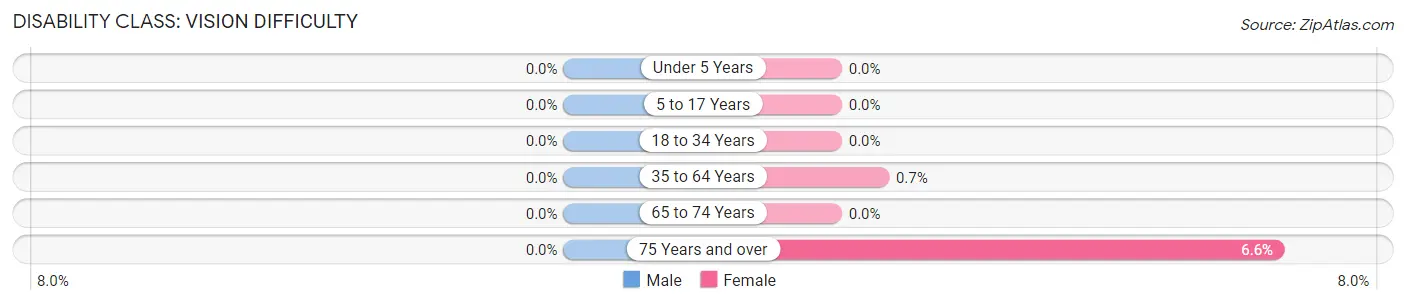
| Age Bracket | Male | Female |
| Under 5 Years | 0 (0.0%) | 0 (0.0%) |
| 5 to 17 Years | 0 (0.0%) | 0 (0.0%) |
| 18 to 34 Years | 0 (0.0%) | 0 (0.0%) |
| 35 to 64 Years | 0 (0.0%) | 2 (0.7%) |
| 65 to 74 Years | 0 (0.0%) | 0 (0.0%) |
| 75 Years and over | 0 (0.0%) | 10 (6.6%) |
Disability Class: Cognitive Difficulty
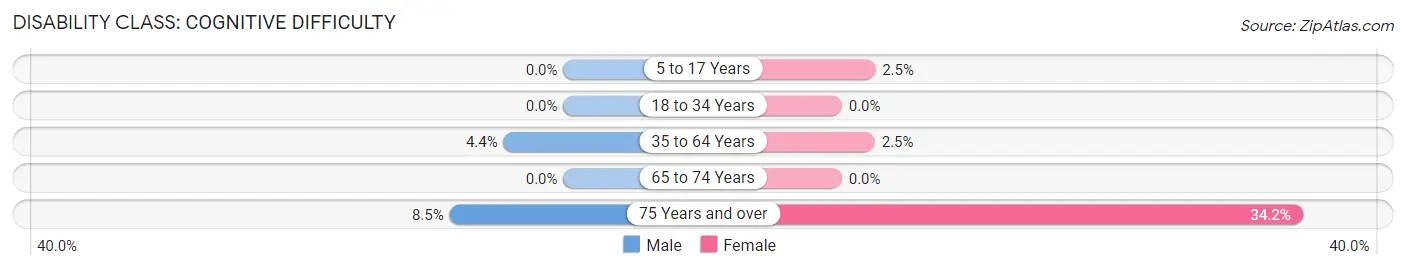
| Age Bracket | Male | Female |
| 5 to 17 Years | 0 (0.0%) | 5 (2.5%) |
| 18 to 34 Years | 0 (0.0%) | 0 (0.0%) |
| 35 to 64 Years | 14 (4.4%) | 7 (2.5%) |
| 65 to 74 Years | 0 (0.0%) | 0 (0.0%) |
| 75 Years and over | 12 (8.5%) | 52 (34.2%) |
Disability Class: Ambulatory Difficulty
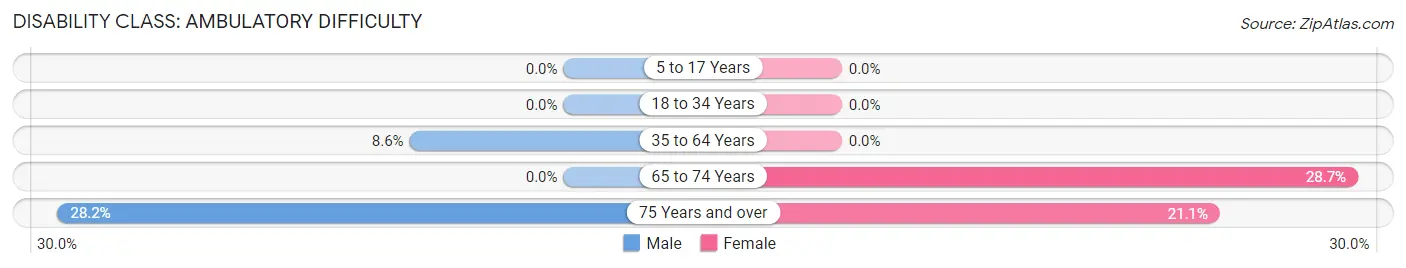
| Age Bracket | Male | Female |
| 5 to 17 Years | 0 (0.0%) | 0 (0.0%) |
| 18 to 34 Years | 0 (0.0%) | 0 (0.0%) |
| 35 to 64 Years | 27 (8.6%) | 0 (0.0%) |
| 65 to 74 Years | 0 (0.0%) | 50 (28.7%) |
| 75 Years and over | 40 (28.2%) | 32 (21.0%) |
Disability Class: Self-Care Difficulty
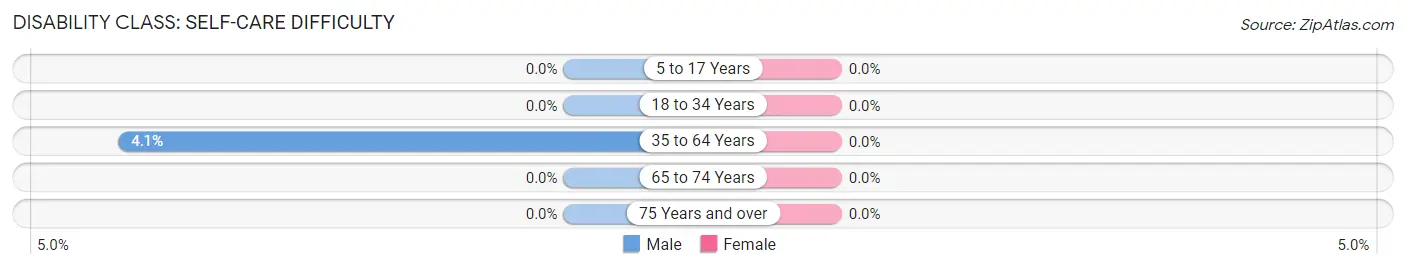
| Age Bracket | Male | Female |
| 5 to 17 Years | 0 (0.0%) | 0 (0.0%) |
| 18 to 34 Years | 0 (0.0%) | 0 (0.0%) |
| 35 to 64 Years | 13 (4.1%) | 0 (0.0%) |
| 65 to 74 Years | 0 (0.0%) | 0 (0.0%) |
| 75 Years and over | 0 (0.0%) | 0 (0.0%) |
Technology Access in Lake Placid
Computing Device Access in Lake Placid
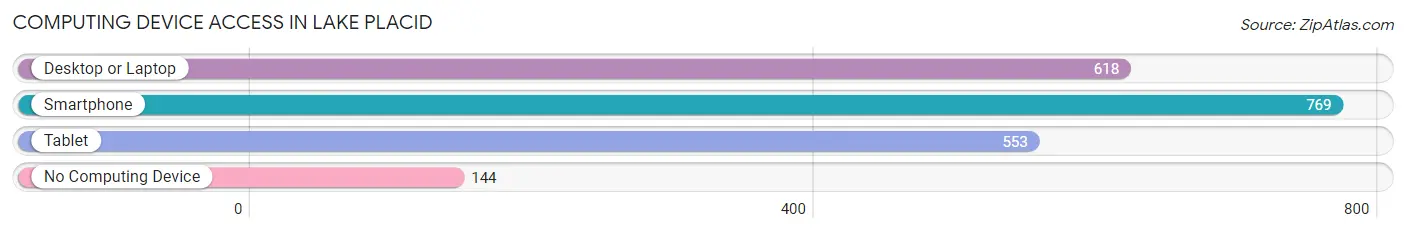
| Device Type | # Households | % Households |
| Desktop or Laptop | 618 | 65.5% |
| Smartphone | 769 | 81.6% |
| Tablet | 553 | 58.6% |
| No Computing Device | 144 | 15.3% |
| Total | 943 | 100.0% |
Internet Access in Lake Placid
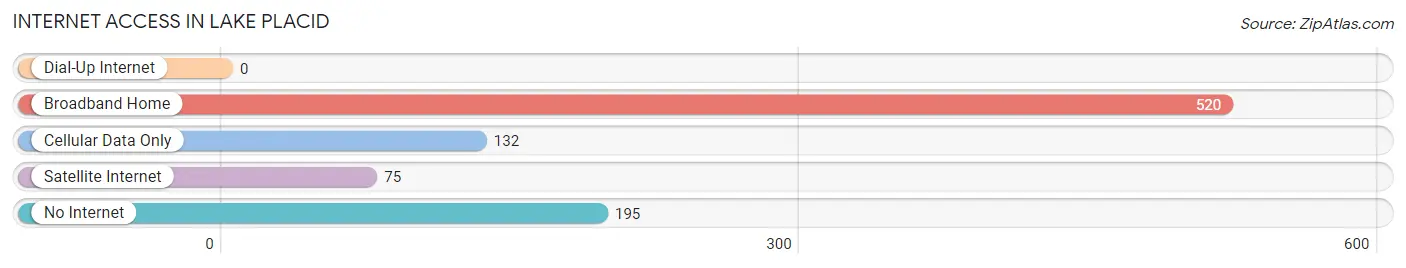
| Internet Type | # Households | % Households |
| Dial-Up Internet | 0 | 0.0% |
| Broadband Home | 520 | 55.1% |
| Cellular Data Only | 132 | 14.0% |
| Satellite Internet | 75 | 8.0% |
| No Internet | 195 | 20.7% |
| Total | 943 | 100.0% |
Lake Placid Summary
History
The history of Lake Placid, Florida dates back to the early 1900s when the area was first settled by a group of settlers from Michigan. The settlers were attracted to the area due to its natural beauty and abundance of fish and game. The first settlers built a small village on the shores of Lake Placid, which was then known as Lake Stearns. The village was named after the lake, which was named after the nearby Stearns family.
The village grew slowly over the years, and by the 1920s, it had become a popular tourist destination. The town was known for its fishing, hunting, and camping opportunities. It was also home to a number of resorts and hotels.
In the 1930s, the town was incorporated as the Town of Lake Placid. The town was named after the lake, which was named after the nearby Placid family. The town was also home to a number of businesses, including a sawmill, a general store, and a post office.
In the 1950s, the town began to experience a period of growth and development. The town was home to a number of new businesses, including a bank, a hospital, and a movie theater. The town also saw the construction of a number of new homes and businesses.
In the 1960s, the town experienced a period of decline. The town was hit hard by the Great Depression and the decline of the local economy. The town was also hit hard by the construction of the Cross Florida Barge Canal, which caused the lake to become polluted.
In the 1970s, the town began to experience a period of revitalization. The town was home to a number of new businesses, including a shopping center, a golf course, and a number of restaurants. The town also saw the construction of a number of new homes and businesses.
In the 1980s, the town experienced a period of growth and development. The town was home to a number of new businesses, including a hospital, a library, and a number of restaurants. The town also saw the construction of a number of new homes and businesses.
In the 1990s, the town experienced a period of growth and development. The town was home to a number of new businesses, including a shopping center, a golf course, and a number of restaurants. The town also saw the construction of a number of new homes and businesses.
Geography
Lake Placid is located in Highlands County, Florida. The town is situated on the shores of Lake Placid, which is a natural freshwater lake. The lake is approximately 2,000 acres in size and is the second largest lake in the state of Florida. The lake is surrounded by a number of small islands, which are home to a variety of wildlife.
The town is located in a region of Florida known as the Ridge and Valley region. The region is characterized by rolling hills and valleys, which are covered in a variety of vegetation. The town is located in a region of Florida known as the Central Highlands, which is characterized by a number of small lakes and rivers.
Economy
The economy of Lake Placid is largely based on tourism. The town is home to a number of resorts and hotels, which attract visitors from all over the world. The town is also home to a number of restaurants, which serve a variety of local and international cuisine.
The town is also home to a number of businesses, including a bank, a hospital, and a number of retail stores. The town is also home to a number of manufacturing businesses, which produce a variety of products, including furniture, clothing, and electronics.
Demographics
As of the 2010 census, the population of Lake Placid was 2,223. The population is largely composed of white (90.2%) and Hispanic (7.2%) individuals. The median age of the population is 44.7 years. The median household income is $37,941.
Conclusion
Lake Placid, Florida is a small town located in Highlands County, Florida. The town has a rich history, dating back to the early 1900s when it was first settled by a group of settlers from Michigan. The town is home to a number of businesses, including a bank, a hospital, and a number of retail stores. The town is also home to a number of resorts and hotels, which attract visitors from all over the world. The town has a population of 2,223, which is largely composed of white (90.2%) and Hispanic (7.2%) individuals. The median age of the population is 44.7 years and the median household income is $37,941.
Common Questions
What is Per Capita Income in Lake Placid?
Per Capita income in Lake Placid is $26,238.
What is the Median Family Income in Lake Placid?
Median Family Income in Lake Placid is $42,092.
What is the Median Household income in Lake Placid?
Median Household Income in Lake Placid is $45,019.
What is Income or Wage Gap in Lake Placid?
Income or Wage Gap in Lake Placid is 34.1%.
Women in Lake Placid earn 65.9 cents for every dollar earned by a man.
What is Family Income Deficit in Lake Placid?
Family Income Deficit in Lake Placid is $19,153.
Families that are below poverty line in Lake Placid earn $19,153 less on average than the poverty threshold level.
What is Inequality or Gini Index in Lake Placid?
Inequality or Gini Index in Lake Placid is 0.49.
What is the Total Population of Lake Placid?
Total Population of Lake Placid is 2,349.
What is the Total Male Population of Lake Placid?
Total Male Population of Lake Placid is 1,187.
What is the Total Female Population of Lake Placid?
Total Female Population of Lake Placid is 1,162.
What is the Ratio of Males per 100 Females in Lake Placid?
There are 102.15 Males per 100 Females in Lake Placid.
What is the Ratio of Females per 100 Males in Lake Placid?
There are 97.89 Females per 100 Males in Lake Placid.
What is the Median Population Age in Lake Placid?
Median Population Age in Lake Placid is 35.4 Years.
What is the Average Family Size in Lake Placid
Average Family Size in Lake Placid is 3.3 People.
What is the Average Household Size in Lake Placid
Average Household Size in Lake Placid is 2.5 People.
How Large is the Labor Force in Lake Placid?
There are 875 People in the Labor Forcein in Lake Placid.
What is the Percentage of People in the Labor Force in Lake Placid?
50.2% of People are in the Labor Force in Lake Placid.
What is the Unemployment Rate in Lake Placid?
Unemployment Rate in Lake Placid is 9.8%.