McNeal, AZ Map & Demographics
McNeal Map
McNeal Overview
$31,638
PER CAPITA INCOME
$78,594
AVG FAMILY INCOME
$74,063
AVG HOUSEHOLD INCOME
21.0%
WAGE / INCOME GAP [ % ]
79.0¢/ $1
WAGE / INCOME GAP [ $ ]
0.30
INEQUALITY / GINI INDEX
180
TOTAL POPULATION
87
MALE POPULATION
93
FEMALE POPULATION
93.55
MALES / 100 FEMALES
106.90
FEMALES / 100 MALES
43.0
MEDIAN AGE
2.1
AVG FAMILY SIZE
1.7
AVG HOUSEHOLD SIZE
51
LABOR FORCE [ PEOPLE ]
30.5%
PERCENT IN LABOR FORCE
3.9%
UNEMPLOYMENT RATE
Income in McNeal
Income Overview in McNeal
Per Capita Income in McNeal is $31,638, while median incomes of families and households are $78,594 and $74,063 respectively.
| Characteristic | Number | Measure |
| Per Capita Income | 180 | $31,638 |
| Median Family Income | 67 | $78,594 |
| Mean Family Income | 67 | $72,667 |
| Median Household Income | 105 | $74,063 |
| Mean Household Income | 105 | $56,934 |
| Income Deficit | 67 | $0 |
| Wage / Income Gap (%) | 180 | 21.03% |
| Wage / Income Gap ($) | 180 | 78.97¢ per $1 |
| Gini / Inequality Index | 180 | 0.30 |
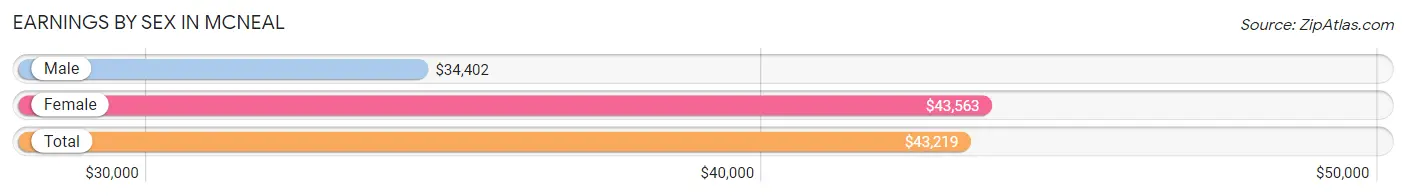
Earnings by Sex in McNeal
Average Earnings in McNeal are $43,219, $34,402 for men and $43,563 for women, a difference of 21.0%.
| Sex | Number | Average Earnings |
| Male | 41 (46.1%) | $34,402 |
| Female | 48 (53.9%) | $43,563 |
| Total | 89 (100.0%) | $43,219 |
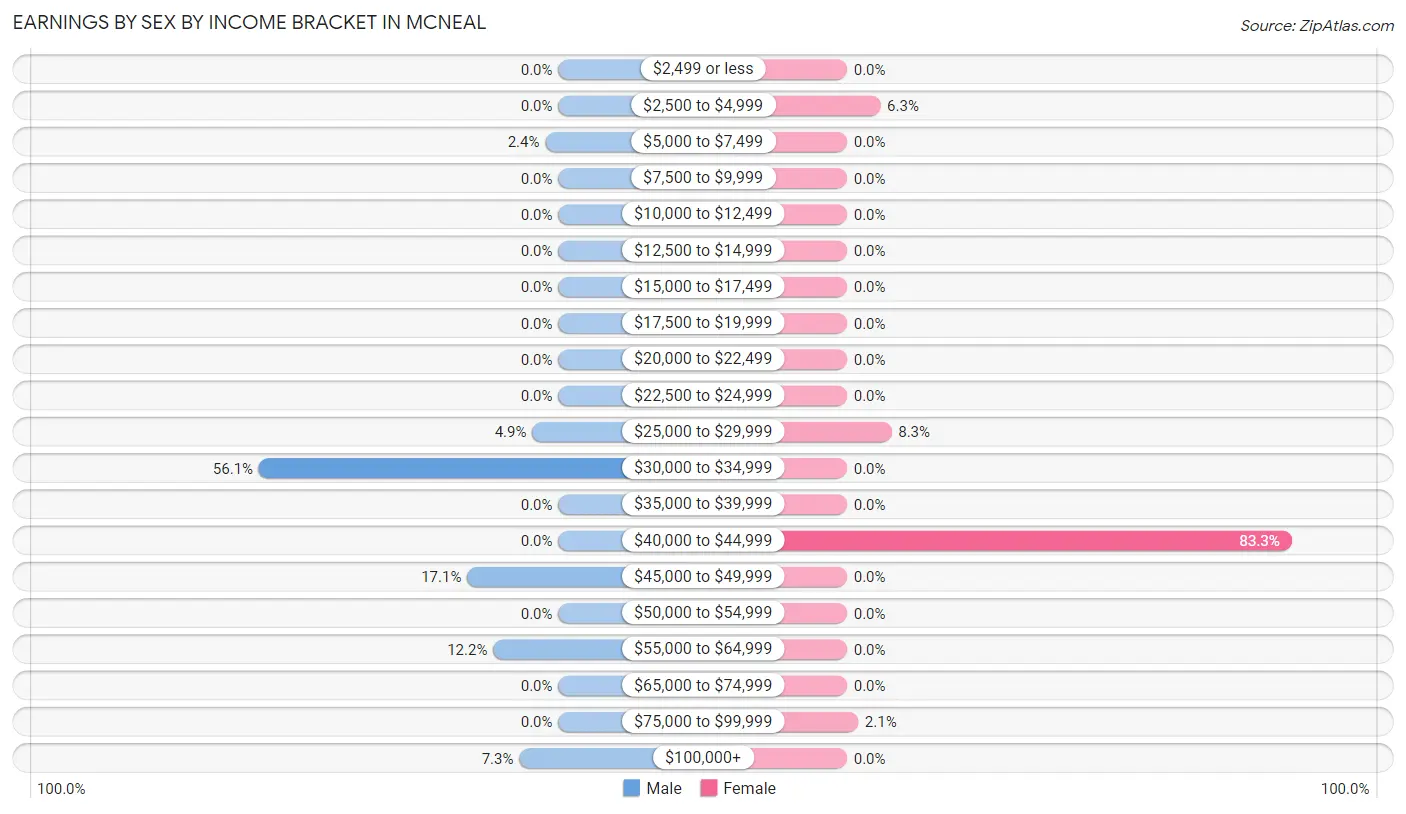
Earnings by Sex by Income Bracket in McNeal
The most common earnings brackets in McNeal are $30,000 to $34,999 for men (23 | 56.1%) and $40,000 to $44,999 for women (40 | 83.3%).
| Income | Male | Female |
| $2,499 or less | 0 (0.0%) | 0 (0.0%) |
| $2,500 to $4,999 | 0 (0.0%) | 3 (6.2%) |
| $5,000 to $7,499 | 1 (2.4%) | 0 (0.0%) |
| $7,500 to $9,999 | 0 (0.0%) | 0 (0.0%) |
| $10,000 to $12,499 | 0 (0.0%) | 0 (0.0%) |
| $12,500 to $14,999 | 0 (0.0%) | 0 (0.0%) |
| $15,000 to $17,499 | 0 (0.0%) | 0 (0.0%) |
| $17,500 to $19,999 | 0 (0.0%) | 0 (0.0%) |
| $20,000 to $22,499 | 0 (0.0%) | 0 (0.0%) |
| $22,500 to $24,999 | 0 (0.0%) | 0 (0.0%) |
| $25,000 to $29,999 | 2 (4.9%) | 4 (8.3%) |
| $30,000 to $34,999 | 23 (56.1%) | 0 (0.0%) |
| $35,000 to $39,999 | 0 (0.0%) | 0 (0.0%) |
| $40,000 to $44,999 | 0 (0.0%) | 40 (83.3%) |
| $45,000 to $49,999 | 7 (17.1%) | 0 (0.0%) |
| $50,000 to $54,999 | 0 (0.0%) | 0 (0.0%) |
| $55,000 to $64,999 | 5 (12.2%) | 0 (0.0%) |
| $65,000 to $74,999 | 0 (0.0%) | 0 (0.0%) |
| $75,000 to $99,999 | 0 (0.0%) | 1 (2.1%) |
| $100,000+ | 3 (7.3%) | 0 (0.0%) |
| Total | 41 (100.0%) | 48 (100.0%) |
Earnings by Sex by Educational Attainment in McNeal
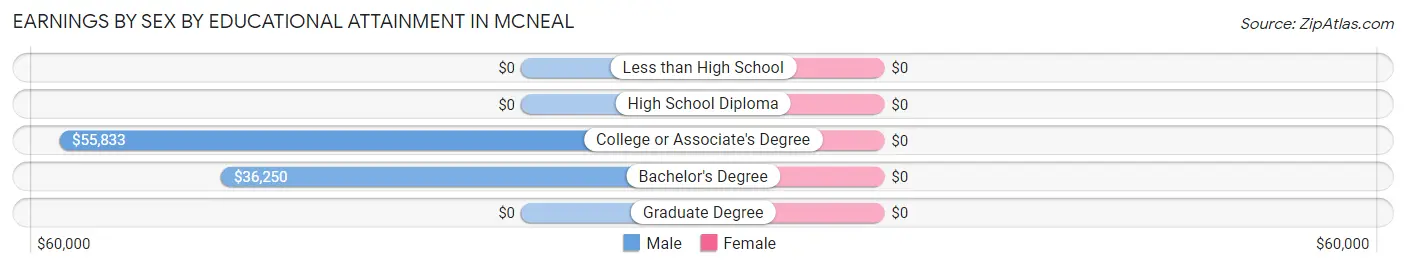
| Educational Attainment | Male Income | Female Income |
| Less than High School | - | - |
| High School Diploma | - | - |
| College or Associate's Degree | $55,833 | $0 |
| Bachelor's Degree | $36,250 | $0 |
| Graduate Degree | - | - |
| Total | $49,375 | $0 |
Family Income in McNeal
Family Income Brackets in McNeal
According to the McNeal family income data, there are 44 families falling into the $75,000 to $99,999 income range, which is the most common income bracket and makes up 65.7% of all families.
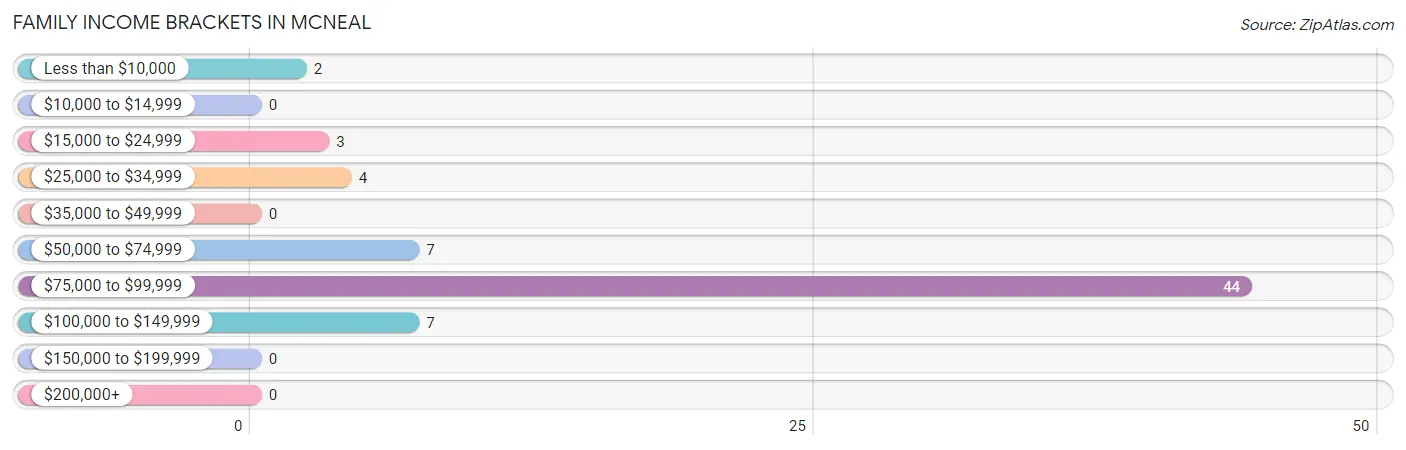
| Income Bracket | # Families | % Families |
| Less than $10,000 | 2 | 3.0% |
| $10,000 to $14,999 | 0 | 0.0% |
| $15,000 to $24,999 | 3 | 4.5% |
| $25,000 to $34,999 | 4 | 6.0% |
| $35,000 to $49,999 | 0 | 0.0% |
| $50,000 to $74,999 | 7 | 10.4% |
| $75,000 to $99,999 | 44 | 65.7% |
| $100,000 to $149,999 | 7 | 10.4% |
| $150,000 to $199,999 | 0 | 0.0% |
| $200,000+ | 0 | 0.0% |
Family Income by Famaliy Size in McNeal
2-person families (55 | 82.1%) account for the highest median family income in McNeal with $78,531 per family, while 2-person families (55 | 82.1%) have the highest median income of $39,266 per family member.
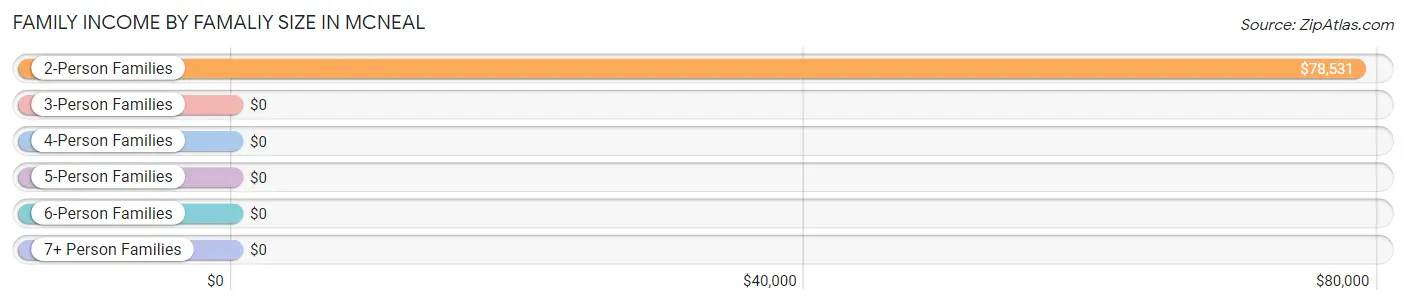
| Income Bracket | # Families | Median Income |
| 2-Person Families | 55 (82.1%) | $78,531 |
| 3-Person Families | 3 (4.5%) | $0 |
| 4-Person Families | 7 (10.4%) | $0 |
| 5-Person Families | 2 (3.0%) | $0 |
| 6-Person Families | 0 (0.0%) | $0 |
| 7+ Person Families | 0 (0.0%) | $0 |
| Total | 67 (100.0%) | $78,594 |
Family Income by Number of Earners in McNeal
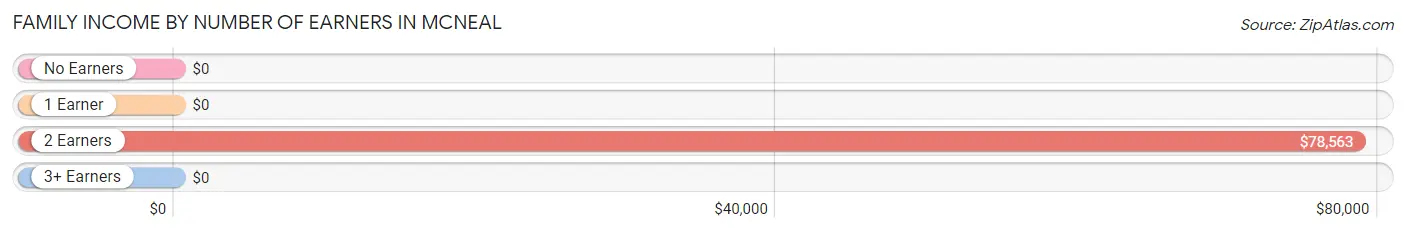
| Number of Earners | # Families | Median Income |
| No Earners | 12 (17.9%) | $0 |
| 1 Earner | 7 (10.4%) | $0 |
| 2 Earners | 48 (71.6%) | $78,563 |
| 3+ Earners | 0 (0.0%) | $0 |
| Total | 67 (100.0%) | $78,594 |
Household Income in McNeal
Household Income Brackets in McNeal
With 44 households falling in the category, the $75,000 to $99,999 income range is the most frequent in McNeal, accounting for 41.9% of all households.
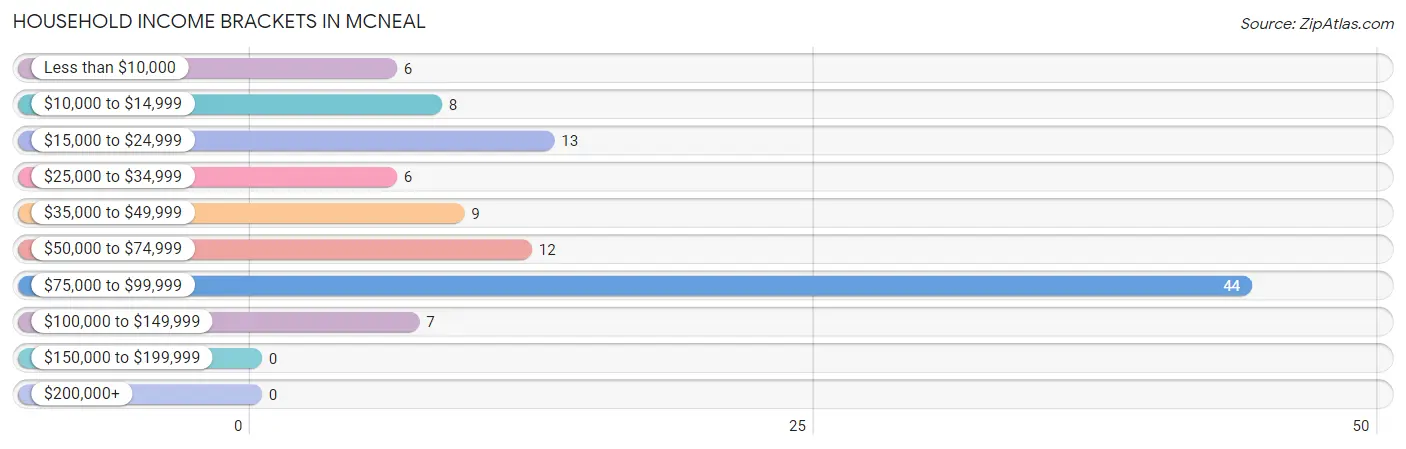
| Income Bracket | # Households | % Households |
| Less than $10,000 | 6 | 5.7% |
| $10,000 to $14,999 | 8 | 7.6% |
| $15,000 to $24,999 | 13 | 12.4% |
| $25,000 to $34,999 | 6 | 5.7% |
| $35,000 to $49,999 | 9 | 8.6% |
| $50,000 to $74,999 | 12 | 11.4% |
| $75,000 to $99,999 | 44 | 41.9% |
| $100,000 to $149,999 | 7 | 6.7% |
| $150,000 to $199,999 | 0 | 0.0% |
| $200,000+ | 0 | 0.0% |
Household Income by Householder Age in McNeal
The median household income in McNeal is $74,063, with the highest median household income of $65,000 found in the 45 to 64 years age bracket for the primary householder. A total of 16 households (15.2%) fall into this category. Meanwhile, the 15 to 24 years age bracket for the primary householder has the lowest median household income of $0, with 40 households (38.1%) in this group.
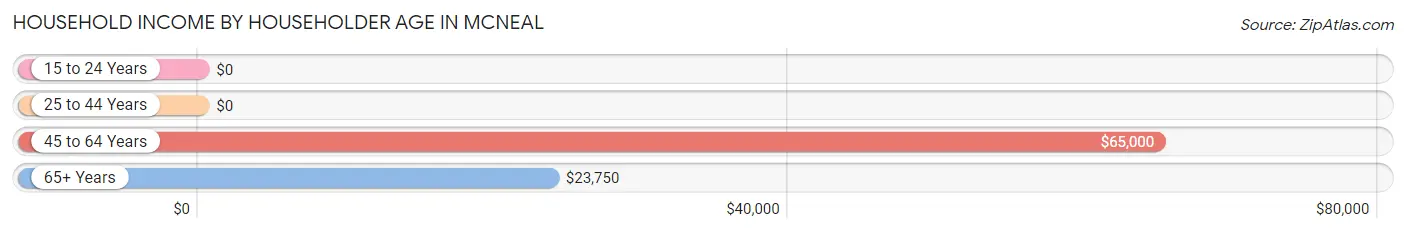
| Income Bracket | # Households | Median Income |
| 15 to 24 Years | 40 (38.1%) | $0 |
| 25 to 44 Years | 3 (2.9%) | $0 |
| 45 to 64 Years | 16 (15.2%) | $65,000 |
| 65+ Years | 46 (43.8%) | $23,750 |
| Total | 105 (100.0%) | $74,063 |
Poverty in McNeal
Income Below Poverty by Sex and Age in McNeal
With 8.1% poverty level for males and 17.2% for females among the residents of McNeal, 5 year old males and 6 to 11 year old females are the most vulnerable to poverty, with 2 males (100.0%) and 1 females (100.0%) in their respective age groups living below the poverty level.
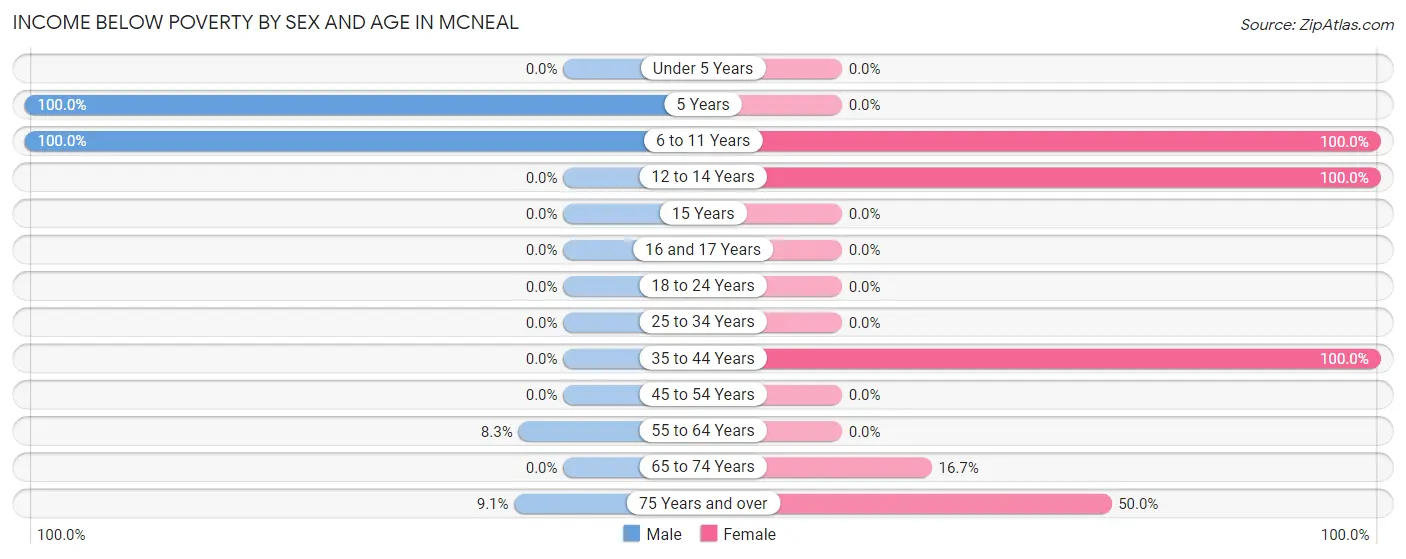
| Age Bracket | Male | Female |
| Under 5 Years | 0 (0.0%) | 0 (0.0%) |
| 5 Years | 2 (100.0%) | 0 (0.0%) |
| 6 to 11 Years | 2 (100.0%) | 1 (100.0%) |
| 12 to 14 Years | 0 (0.0%) | 2 (100.0%) |
| 15 Years | 0 (0.0%) | 0 (0.0%) |
| 16 and 17 Years | 0 (0.0%) | 0 (0.0%) |
| 18 to 24 Years | 0 (0.0%) | 0 (0.0%) |
| 25 to 34 Years | 0 (0.0%) | 0 (0.0%) |
| 35 to 44 Years | 0 (0.0%) | 2 (100.0%) |
| 45 to 54 Years | 0 (0.0%) | 0 (0.0%) |
| 55 to 64 Years | 1 (8.3%) | 0 (0.0%) |
| 65 to 74 Years | 0 (0.0%) | 3 (16.7%) |
| 75 Years and over | 2 (9.1%) | 8 (50.0%) |
| Total | 7 (8.1%) | 16 (17.2%) |
Income Above Poverty by Sex and Age in McNeal
According to the poverty statistics in McNeal, males aged under 5 years and females aged under 5 years are the age groups that are most secure financially, with 100.0% of males and 100.0% of females in these age groups living above the poverty line.
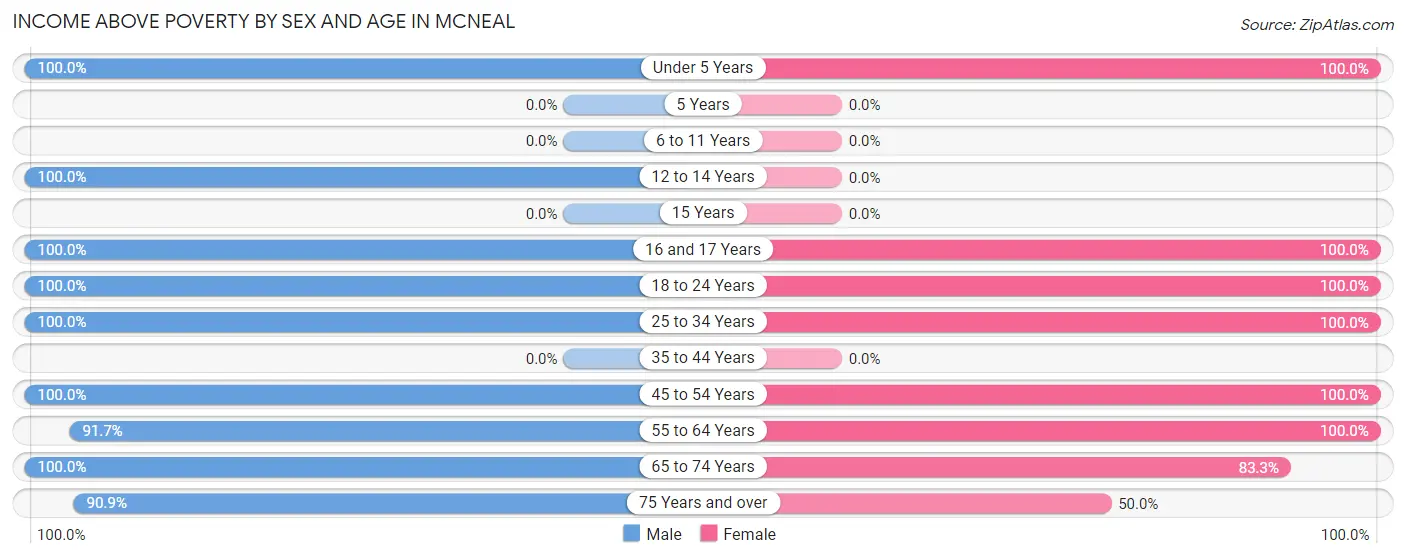
| Age Bracket | Male | Female |
| Under 5 Years | 2 (100.0%) | 1 (100.0%) |
| 5 Years | 0 (0.0%) | 0 (0.0%) |
| 6 to 11 Years | 0 (0.0%) | 0 (0.0%) |
| 12 to 14 Years | 3 (100.0%) | 0 (0.0%) |
| 15 Years | 0 (0.0%) | 0 (0.0%) |
| 16 and 17 Years | 3 (100.0%) | 2 (100.0%) |
| 18 to 24 Years | 26 (100.0%) | 40 (100.0%) |
| 25 to 34 Years | 3 (100.0%) | 1 (100.0%) |
| 35 to 44 Years | 0 (0.0%) | 0 (0.0%) |
| 45 to 54 Years | 3 (100.0%) | 6 (100.0%) |
| 55 to 64 Years | 11 (91.7%) | 4 (100.0%) |
| 65 to 74 Years | 9 (100.0%) | 15 (83.3%) |
| 75 Years and over | 20 (90.9%) | 8 (50.0%) |
| Total | 80 (91.9%) | 77 (82.8%) |
Income Below Poverty Among Married-Couple Families in McNeal
The poverty statistics for married-couple families in McNeal show that 1.5% or 1 of the total 65 families live below the poverty line. Families with no children have the highest poverty rate of 1.7%, comprising of 1 families. On the other hand, families with 1 or 2 children have the lowest poverty rate of 0.0%, which includes 0 families.
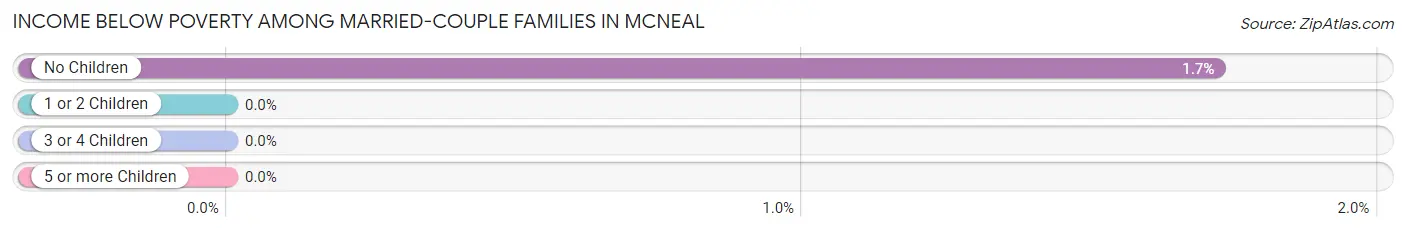
| Children | Above Poverty | Below Poverty |
| No Children | 57 (98.3%) | 1 (1.7%) |
| 1 or 2 Children | 7 (100.0%) | 0 (0.0%) |
| 3 or 4 Children | 0 (0.0%) | 0 (0.0%) |
| 5 or more Children | 0 (0.0%) | 0 (0.0%) |
| Total | 64 (98.5%) | 1 (1.5%) |
Income Below Poverty Among Single-Parent Households in McNeal
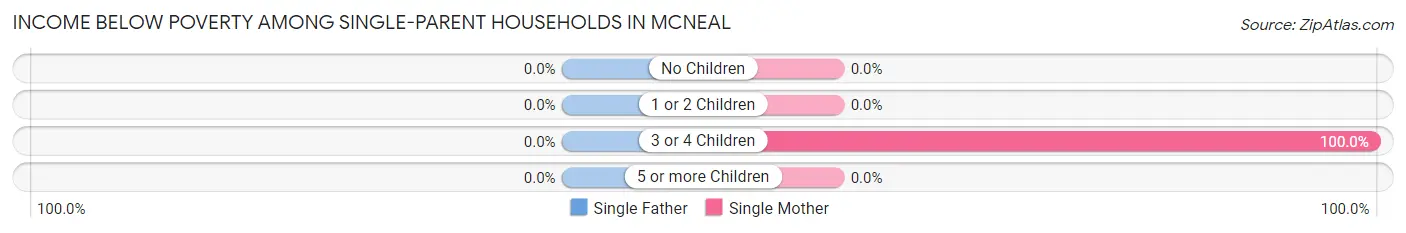
| Children | Single Father | Single Mother |
| No Children | 0 (0.0%) | 0 (0.0%) |
| 1 or 2 Children | 0 (0.0%) | 0 (0.0%) |
| 3 or 4 Children | 0 (0.0%) | 2 (100.0%) |
| 5 or more Children | 0 (0.0%) | 0 (0.0%) |
| Total | 0 (0.0%) | 2 (100.0%) |
Income Below Poverty Among Married-Couple vs Single-Parent Households in McNeal
The poverty data for McNeal shows that 1 of the married-couple family households (1.5%) and 2 of the single-parent households (100.0%) are living below the poverty level. Within the married-couple family households, those with no children have the highest poverty rate, with 1 households (1.7%) falling below the poverty line. Among the single-parent households, those with 3 or 4 children have the highest poverty rate, with 2 household (100.0%) living below poverty.
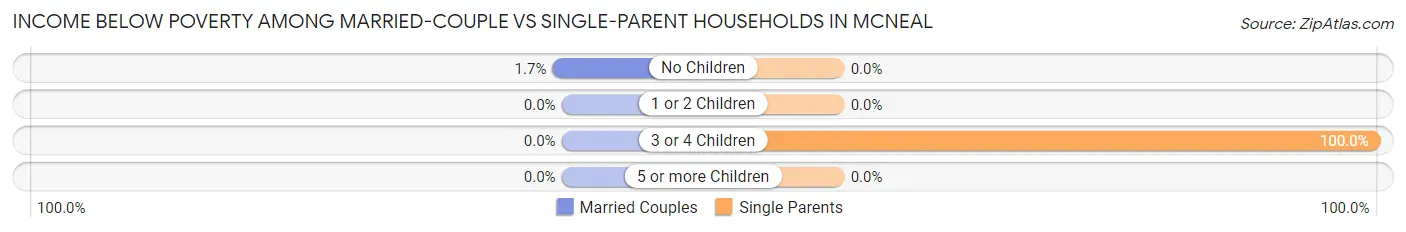
| Children | Married-Couple Families | Single-Parent Households |
| No Children | 1 (1.7%) | 0 (0.0%) |
| 1 or 2 Children | 0 (0.0%) | 0 (0.0%) |
| 3 or 4 Children | 0 (0.0%) | 2 (100.0%) |
| 5 or more Children | 0 (0.0%) | 0 (0.0%) |
| Total | 1 (1.5%) | 2 (100.0%) |
Race in McNeal
The most populous races in McNeal are White / Caucasian (112 | 62.2%), Hispanic or Latino (70 | 38.9%), and Two or more Races (67 | 37.2%).
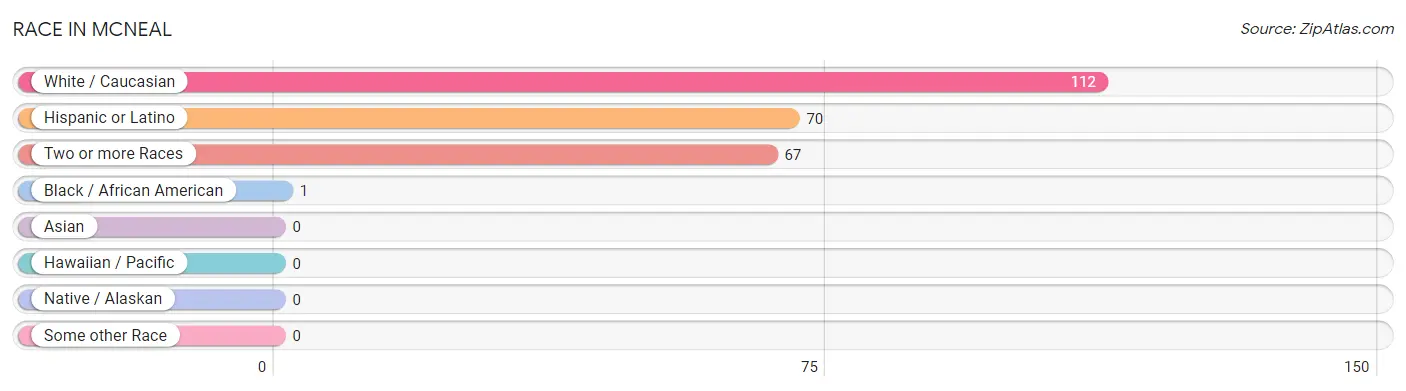
| Race | # Population | % Population |
| Asian | 0 | 0.0% |
| Black / African American | 1 | 0.6% |
| Hawaiian / Pacific | 0 | 0.0% |
| Hispanic or Latino | 70 | 38.9% |
| Native / Alaskan | 0 | 0.0% |
| White / Caucasian | 112 | 62.2% |
| Two or more Races | 67 | 37.2% |
| Some other Race | 0 | 0.0% |
| Total | 180 | 100.0% |
Ancestry in McNeal
The most populous ancestries reported in McNeal are English (45 | 25.0%), Colombian (40 | 22.2%), South American (40 | 22.2%), Mexican (30 | 16.7%), and American (23 | 12.8%), together accounting for 98.9% of all McNeal residents.
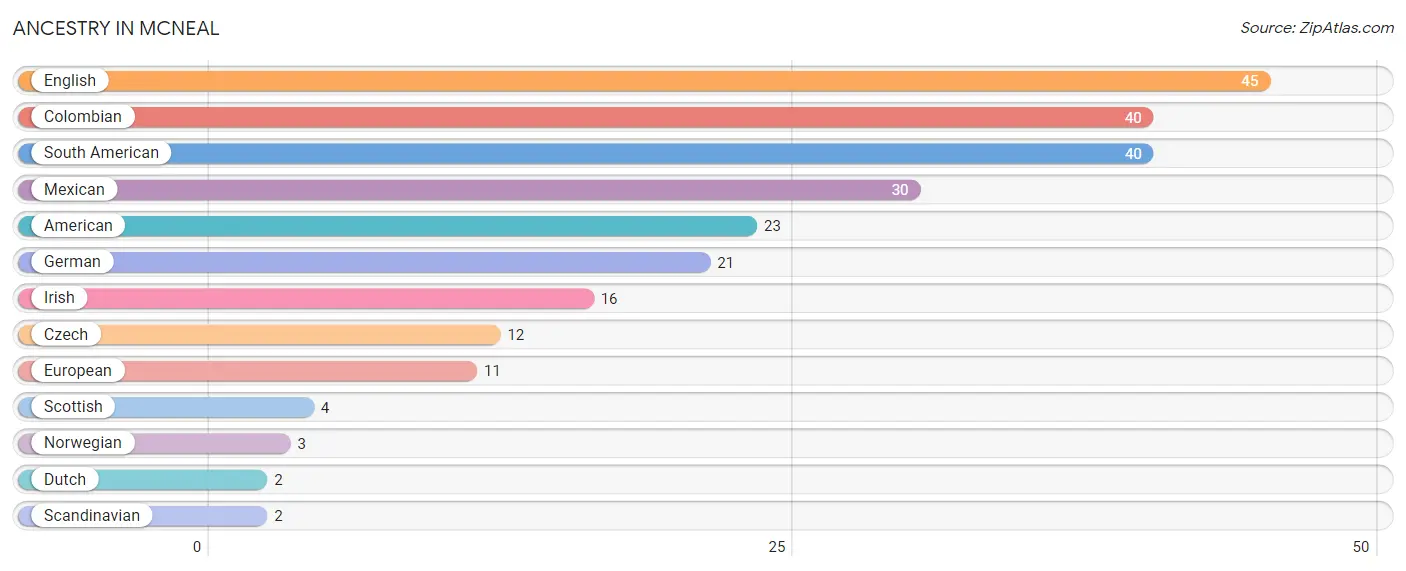
| Ancestry | # Population | % Population |
| American | 23 | 12.8% |
| Colombian | 40 | 22.2% |
| Czech | 12 | 6.7% |
| Dutch | 2 | 1.1% |
| English | 45 | 25.0% |
| European | 11 | 6.1% |
| German | 21 | 11.7% |
| Irish | 16 | 8.9% |
| Mexican | 30 | 16.7% |
| Norwegian | 3 | 1.7% |
| Scandinavian | 2 | 1.1% |
| Scottish | 4 | 2.2% |
| South American | 40 | 22.2% | View All 13 Rows |
Immigrants in McNeal
The most numerous immigrant groups reported in McNeal came from Latin America (44 | 24.4%), Colombia (40 | 22.2%), South America (40 | 22.2%), Central America (4 | 2.2%), and Mexico (4 | 2.2%), together accounting for 73.3% of all McNeal residents.
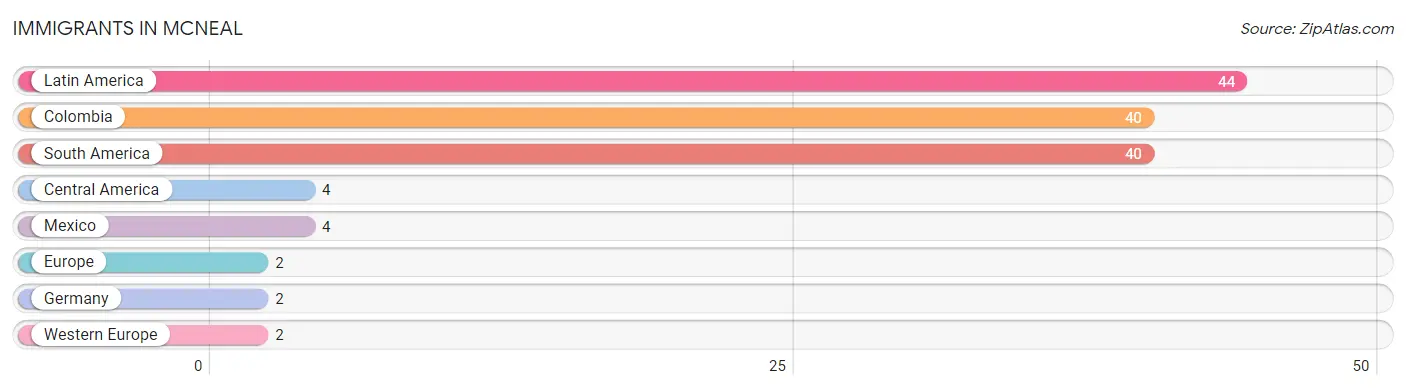
| Immigration Origin | # Population | % Population |
| Central America | 4 | 2.2% |
| Colombia | 40 | 22.2% |
| Europe | 2 | 1.1% |
| Germany | 2 | 1.1% |
| Latin America | 44 | 24.4% |
| Mexico | 4 | 2.2% |
| South America | 40 | 22.2% |
| Western Europe | 2 | 1.1% | View All 8 Rows |
Sex and Age in McNeal
Sex and Age in McNeal
The most populous age groups in McNeal are 20 to 24 Years (26 | 29.9%) for men and 20 to 24 Years (40 | 43.0%) for women.
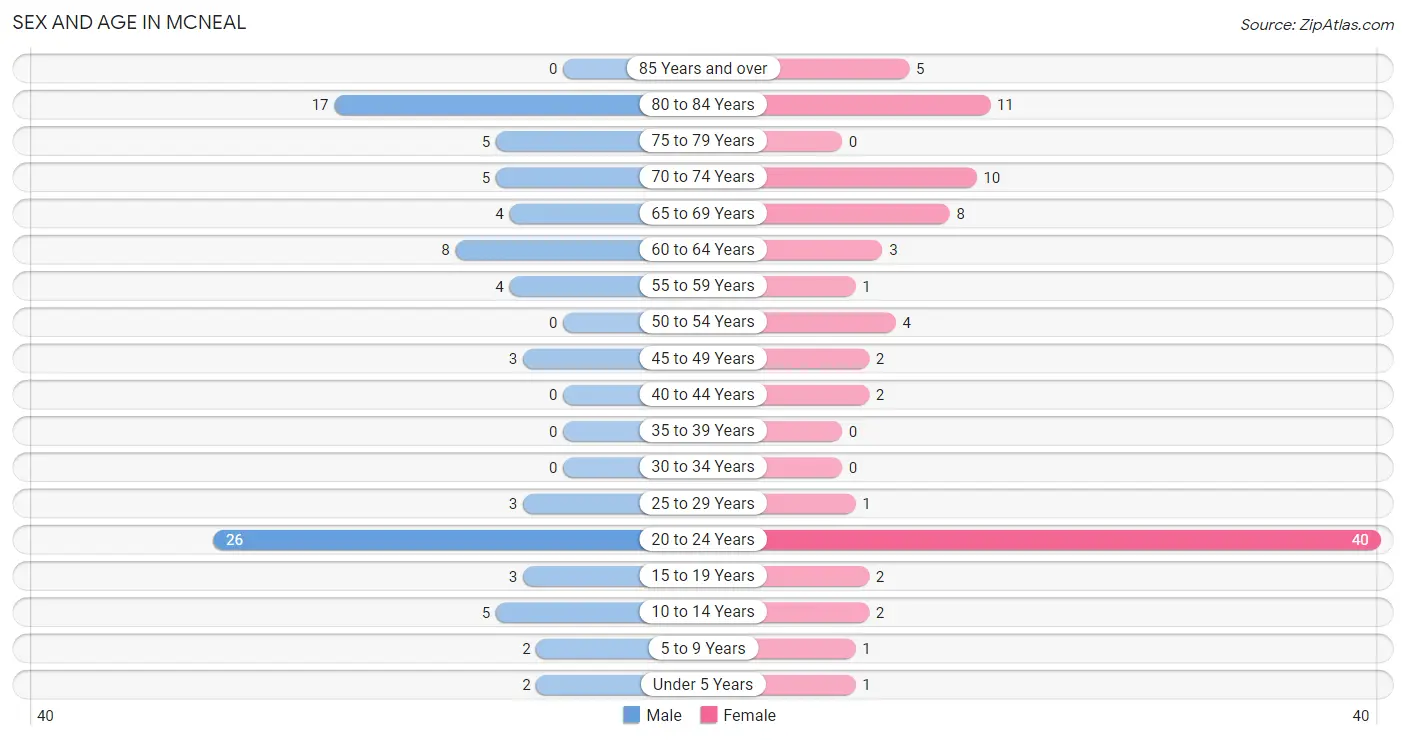
| Age Bracket | Male | Female |
| Under 5 Years | 2 (2.3%) | 1 (1.1%) |
| 5 to 9 Years | 2 (2.3%) | 1 (1.1%) |
| 10 to 14 Years | 5 (5.8%) | 2 (2.1%) |
| 15 to 19 Years | 3 (3.5%) | 2 (2.1%) |
| 20 to 24 Years | 26 (29.9%) | 40 (43.0%) |
| 25 to 29 Years | 3 (3.5%) | 1 (1.1%) |
| 30 to 34 Years | 0 (0.0%) | 0 (0.0%) |
| 35 to 39 Years | 0 (0.0%) | 0 (0.0%) |
| 40 to 44 Years | 0 (0.0%) | 2 (2.1%) |
| 45 to 49 Years | 3 (3.5%) | 2 (2.1%) |
| 50 to 54 Years | 0 (0.0%) | 4 (4.3%) |
| 55 to 59 Years | 4 (4.6%) | 1 (1.1%) |
| 60 to 64 Years | 8 (9.2%) | 3 (3.2%) |
| 65 to 69 Years | 4 (4.6%) | 8 (8.6%) |
| 70 to 74 Years | 5 (5.8%) | 10 (10.7%) |
| 75 to 79 Years | 5 (5.8%) | 0 (0.0%) |
| 80 to 84 Years | 17 (19.5%) | 11 (11.8%) |
| 85 Years and over | 0 (0.0%) | 5 (5.4%) |
| Total | 87 (100.0%) | 93 (100.0%) |
Families and Households in McNeal
Median Family Size in McNeal
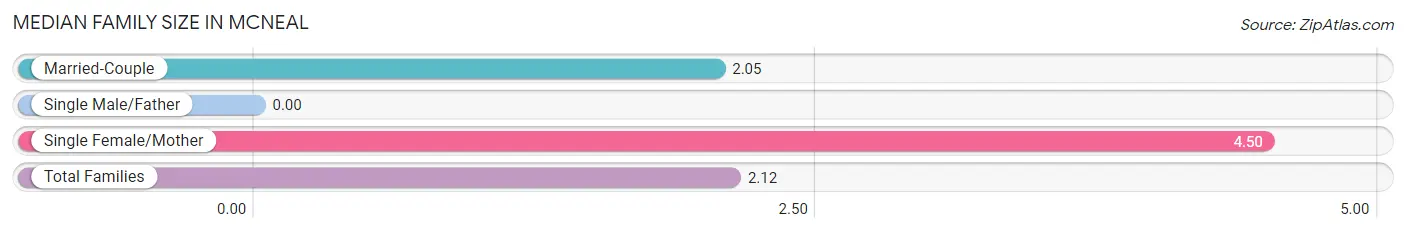
| Family Type | # Families | Family Size |
| Married-Couple | 65 (97.0%) | 2.05 |
| Single Male/Father | 0 (0.0%) | - |
| Single Female/Mother | 2 (3.0%) | 4.50 |
| Total Families | 67 (100.0%) | 2.12 |
Median Household Size in McNeal
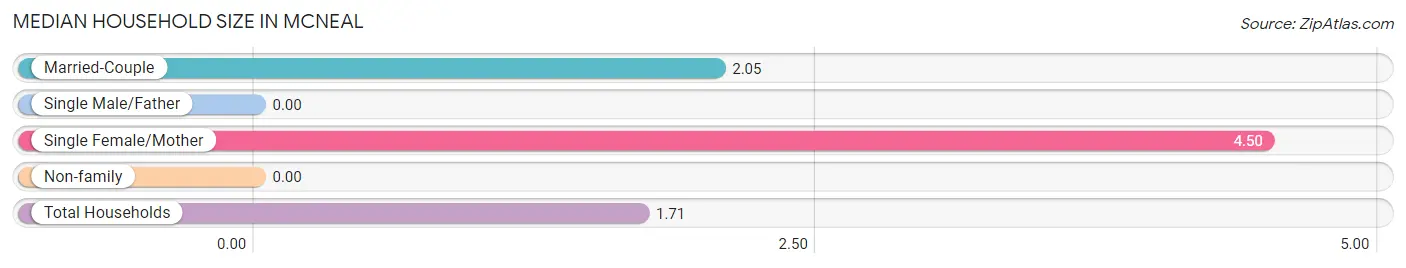
| Household Type | # Households | Household Size |
| Married-Couple | 65 (61.9%) | 2.05 |
| Single Male/Father | 0 (0.0%) | - |
| Single Female/Mother | 2 (1.9%) | 4.50 |
| Non-family | 38 (36.2%) | - |
| Total Households | 105 (100.0%) | 1.71 |
Household Size by Marriage Status in McNeal
Out of a total of 105 households in McNeal, 67 (63.8%) are family households, while 38 (36.2%) are nonfamily households. The most numerous type of family households are 2-person households, comprising 55, and the most common type of nonfamily households are 1-person households, comprising 38.
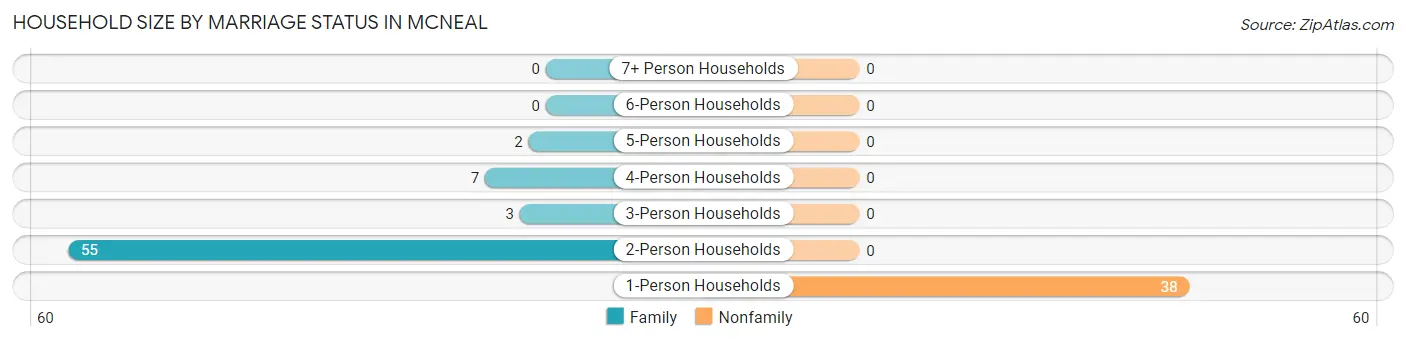
| Household Size | Family Households | Nonfamily Households |
| 1-Person Households | - | 38 (36.2%) |
| 2-Person Households | 55 (52.4%) | 0 (0.0%) |
| 3-Person Households | 3 (2.9%) | 0 (0.0%) |
| 4-Person Households | 7 (6.7%) | 0 (0.0%) |
| 5-Person Households | 2 (1.9%) | 0 (0.0%) |
| 6-Person Households | 0 (0.0%) | 0 (0.0%) |
| 7+ Person Households | 0 (0.0%) | 0 (0.0%) |
| Total | 67 (63.8%) | 38 (36.2%) |
Female Fertility in McNeal
Fertility by Age in McNeal
| Age Bracket | Women with Births | Births / 1,000 Women |
| 15 to 19 years | 0 (0.0%) | 0.0 |
| 20 to 34 years | 0 (0.0%) | 0.0 |
| 35 to 50 years | 0 (0.0%) | 0.0 |
| Total | 0 (0.0%) | 0.0 |
Fertility by Age by Marriage Status in McNeal
| Age Bracket | Married | Unmarried |
| 15 to 19 years | 0 (0.0%) | 0 (0.0%) |
| 20 to 34 years | 0 (0.0%) | 0 (0.0%) |
| 35 to 50 years | 0 (0.0%) | 0 (0.0%) |
| Total | 0 (0.0%) | 0 (0.0%) |
Fertility by Education in McNeal
| Educational Attainment | Women with Births | Births / 1,000 Women |
| Less than High School | 0 (0.0%) | 0.0 |
| High School Diploma | 0 (0.0%) | 0.0 |
| College or Associate's Degree | 0 (0.0%) | 0.0 |
| Bachelor's Degree | 0 (0.0%) | 0.0 |
| Graduate Degree | 0 (0.0%) | 0.0 |
| Total | 0 (0.0%) | 0.0 |
Fertility by Education by Marriage Status in McNeal
| Educational Attainment | Married | Unmarried |
| Less than High School | 0 (0.0%) | 0 (0.0%) |
| High School Diploma | 0 (0.0%) | 0 (0.0%) |
| College or Associate's Degree | 0 (0.0%) | 0 (0.0%) |
| Bachelor's Degree | 0 (0.0%) | 0 (0.0%) |
| Graduate Degree | 0 (0.0%) | 0 (0.0%) |
| Total | 0 (0.0%) | 0 (0.0%) |
Employment Characteristics in McNeal
Employment by Class of Employer in McNeal
Among the 49 employed individuals in McNeal, private company employees (36 | 73.5%), not-for-profit organizations (9 | 18.4%), and local government employees (3 | 6.1%) make up the most common classes of employment.
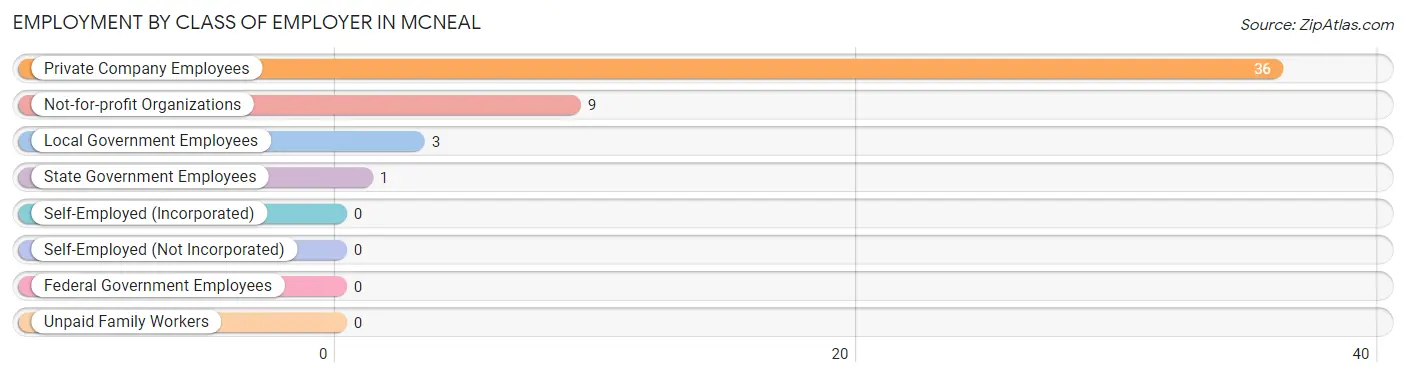
| Employer Class | # Employees | % Employees |
| Private Company Employees | 36 | 73.5% |
| Self-Employed (Incorporated) | 0 | 0.0% |
| Self-Employed (Not Incorporated) | 0 | 0.0% |
| Not-for-profit Organizations | 9 | 18.4% |
| Local Government Employees | 3 | 6.1% |
| State Government Employees | 1 | 2.0% |
| Federal Government Employees | 0 | 0.0% |
| Unpaid Family Workers | 0 | 0.0% |
| Total | 49 | 100.0% |
Employment Status by Age in McNeal
According to the labor force statistics for McNeal, out of the total population over 16 years of age (167), 30.5% or 51 individuals are in the labor force, with 3.9% or 2 of them unemployed. The age group with the highest labor force participation rate is 25 to 29 years, with 100.0% or 4 individuals in the labor force. Within the labor force, the 65 to 74 years age range has the highest percentage of unemployed individuals, with 100.0% or 2 of them being unemployed.
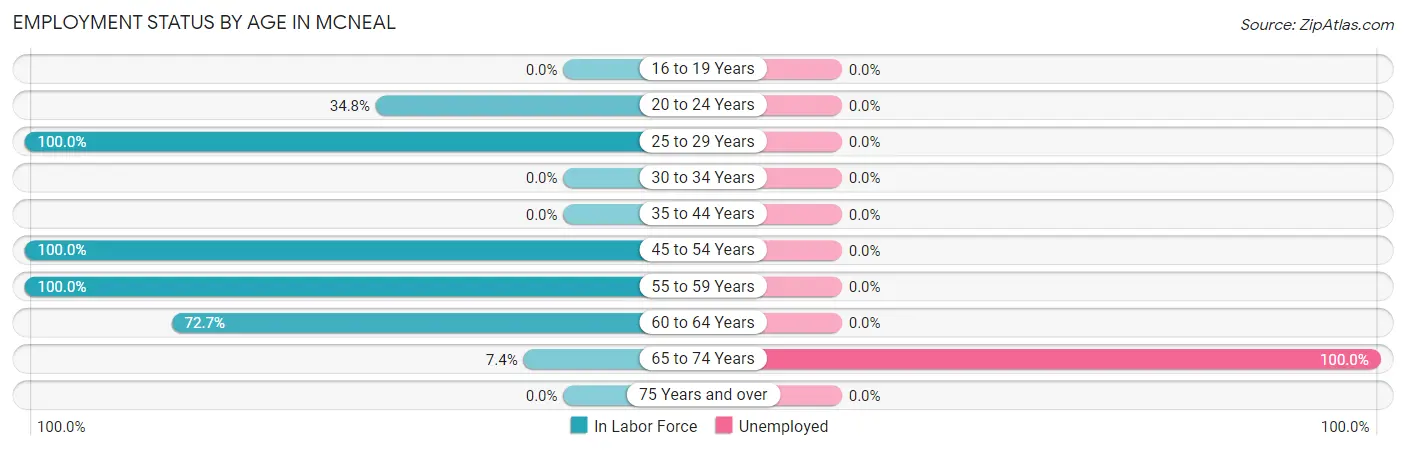
| Age Bracket | In Labor Force | Unemployed |
| 16 to 19 Years | 0 (0.0%) | 0 (0.0%) |
| 20 to 24 Years | 23 (34.8%) | 0 (0.0%) |
| 25 to 29 Years | 4 (100.0%) | 0 (0.0%) |
| 30 to 34 Years | 0 (0.0%) | 0 (0.0%) |
| 35 to 44 Years | 0 (0.0%) | 0 (0.0%) |
| 45 to 54 Years | 9 (100.0%) | 0 (0.0%) |
| 55 to 59 Years | 5 (100.0%) | 0 (0.0%) |
| 60 to 64 Years | 8 (72.7%) | 0 (0.0%) |
| 65 to 74 Years | 2 (7.4%) | 2 (100.0%) |
| 75 Years and over | 0 (0.0%) | 0 (0.0%) |
| Total | 51 (30.5%) | 2 (3.9%) |
Employment Status by Educational Attainment in McNeal
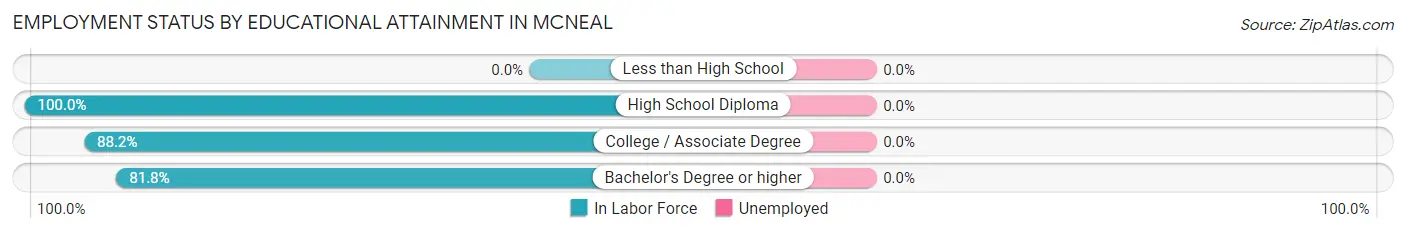
| Educational Attainment | In Labor Force | Unemployed |
| Less than High School | 0 (0.0%) | 0 (0.0%) |
| High School Diploma | 2 (100.0%) | 0 (0.0%) |
| College / Associate Degree | 15 (88.2%) | 0 (0.0%) |
| Bachelor's Degree or higher | 9 (81.8%) | 0 (0.0%) |
| Total | 26 (83.9%) | 0 (0.0%) |
Employment Occupations by Sex in McNeal
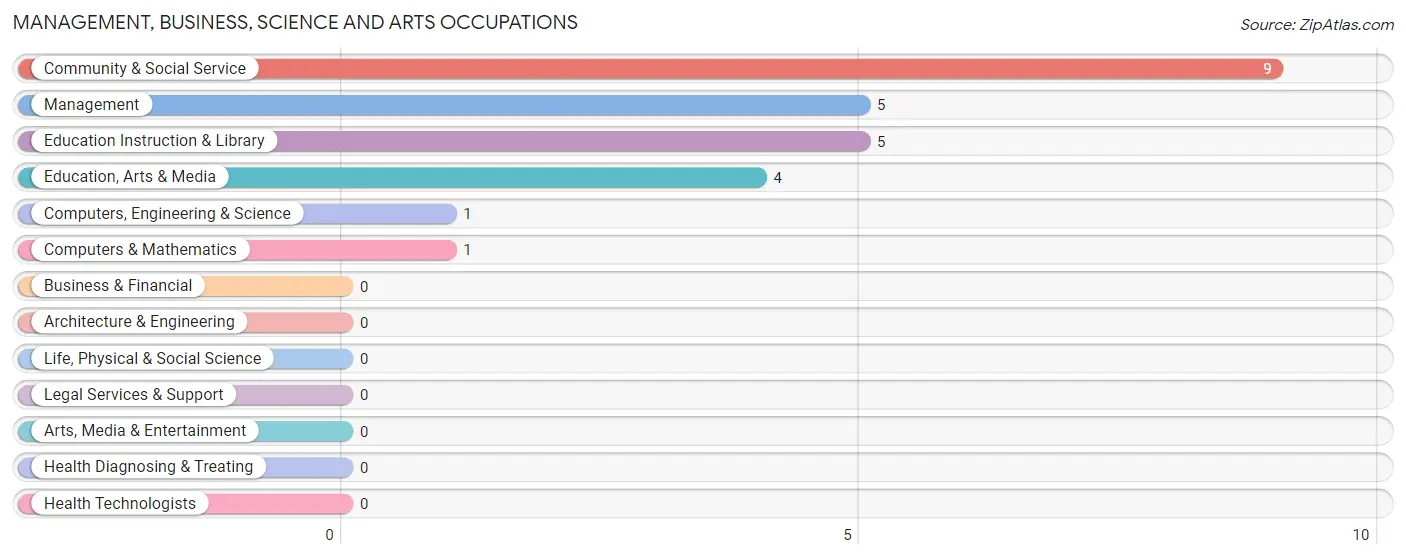
Management, Business, Science and Arts Occupations
The most common Management, Business, Science and Arts occupations in McNeal are Community & Social Service (9 | 18.4%), Management (5 | 10.2%), Education Instruction & Library (5 | 10.2%), Education, Arts & Media (4 | 8.2%), and Computers, Engineering & Science (1 | 2.0%).
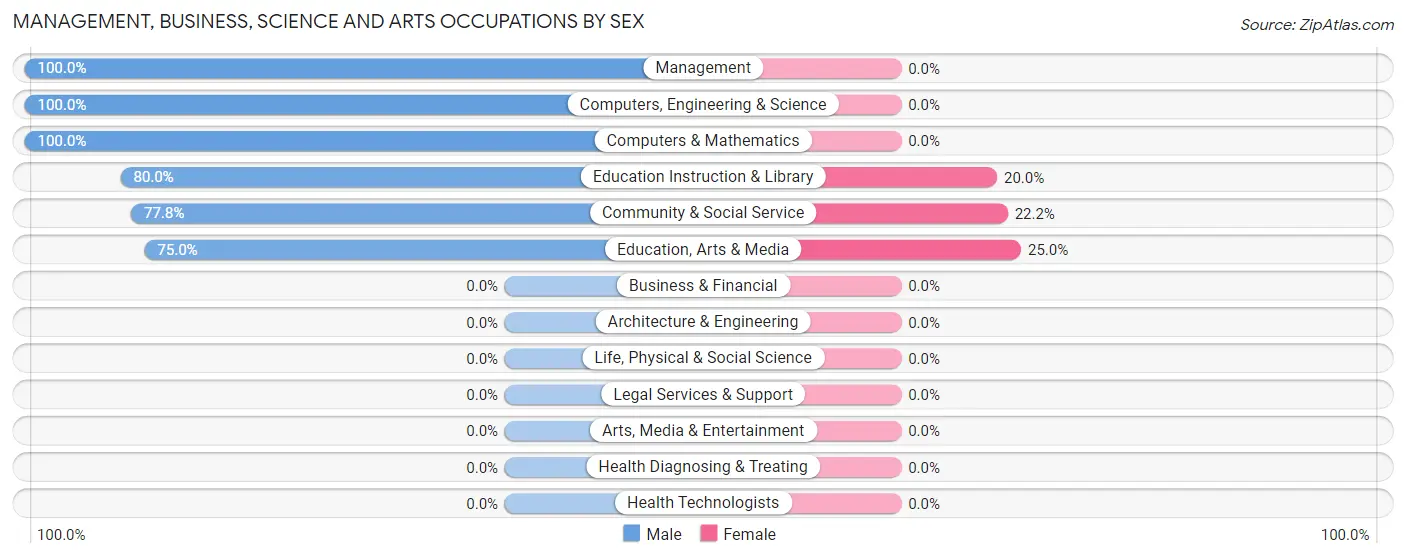
Management, Business, Science and Arts Occupations by Sex
Within the Management, Business, Science and Arts occupations in McNeal, the most male-oriented occupations are Management (100.0%), Computers, Engineering & Science (100.0%), and Computers & Mathematics (100.0%), while the most female-oriented occupations are Education, Arts & Media (25.0%), Community & Social Service (22.2%), and Education Instruction & Library (20.0%).
| Occupation | Male | Female |
| Management | 5 (100.0%) | 0 (0.0%) |
| Business & Financial | 0 (0.0%) | 0 (0.0%) |
| Computers, Engineering & Science | 1 (100.0%) | 0 (0.0%) |
| Computers & Mathematics | 1 (100.0%) | 0 (0.0%) |
| Architecture & Engineering | 0 (0.0%) | 0 (0.0%) |
| Life, Physical & Social Science | 0 (0.0%) | 0 (0.0%) |
| Community & Social Service | 7 (77.8%) | 2 (22.2%) |
| Education, Arts & Media | 3 (75.0%) | 1 (25.0%) |
| Legal Services & Support | 0 (0.0%) | 0 (0.0%) |
| Education Instruction & Library | 4 (80.0%) | 1 (20.0%) |
| Arts, Media & Entertainment | 0 (0.0%) | 0 (0.0%) |
| Health Diagnosing & Treating | 0 (0.0%) | 0 (0.0%) |
| Health Technologists | 0 (0.0%) | 0 (0.0%) |
| Total (Category) | 13 (86.7%) | 2 (13.3%) |
| Total (Overall) | 41 (83.7%) | 8 (16.3%) |
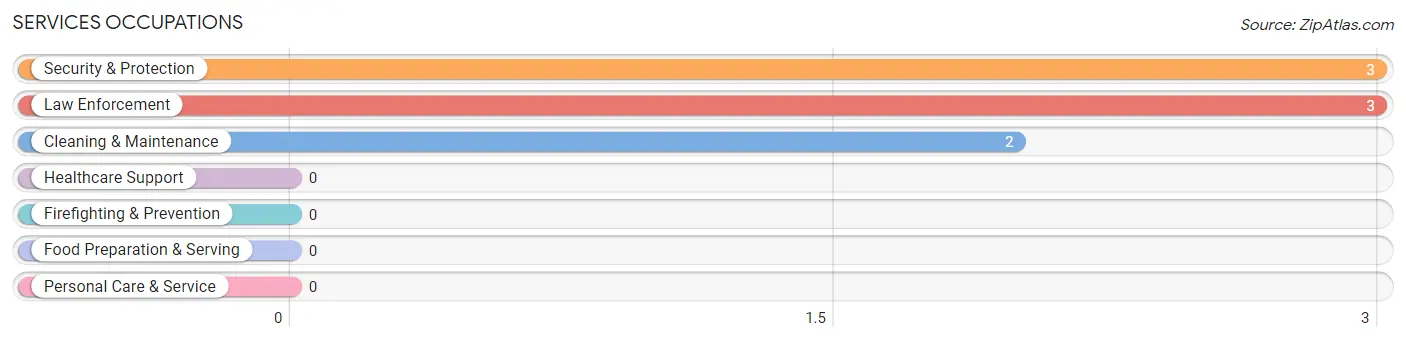
Services Occupations
The most common Services occupations in McNeal are Security & Protection (3 | 6.1%), Law Enforcement (3 | 6.1%), and Cleaning & Maintenance (2 | 4.1%).
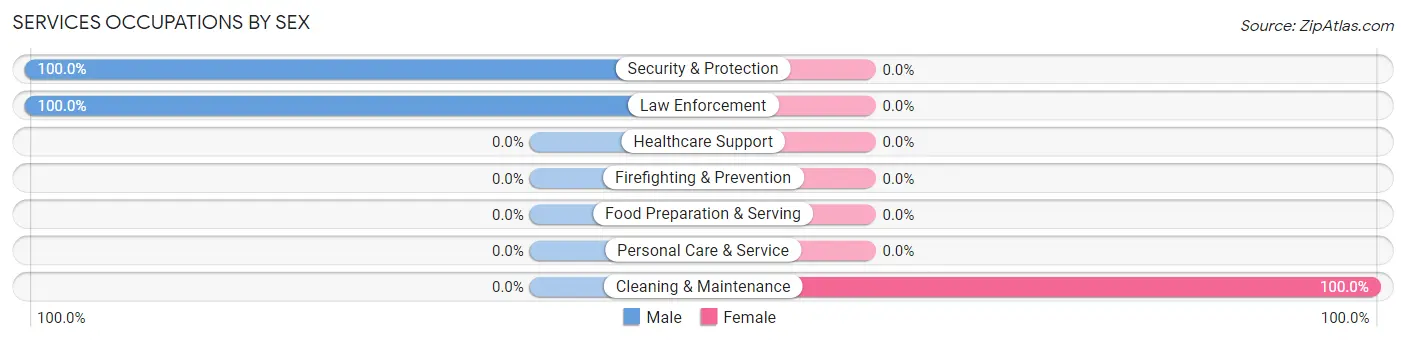
Services Occupations by Sex
| Occupation | Male | Female |
| Healthcare Support | 0 (0.0%) | 0 (0.0%) |
| Security & Protection | 3 (100.0%) | 0 (0.0%) |
| Firefighting & Prevention | 0 (0.0%) | 0 (0.0%) |
| Law Enforcement | 3 (100.0%) | 0 (0.0%) |
| Food Preparation & Serving | 0 (0.0%) | 0 (0.0%) |
| Cleaning & Maintenance | 0 (0.0%) | 2 (100.0%) |
| Personal Care & Service | 0 (0.0%) | 0 (0.0%) |
| Total (Category) | 3 (60.0%) | 2 (40.0%) |
| Total (Overall) | 41 (83.7%) | 8 (16.3%) |
Sales and Office Occupations
The most common Sales and Office occupations in McNeal are , and Office & Administration (4 | 8.2%).
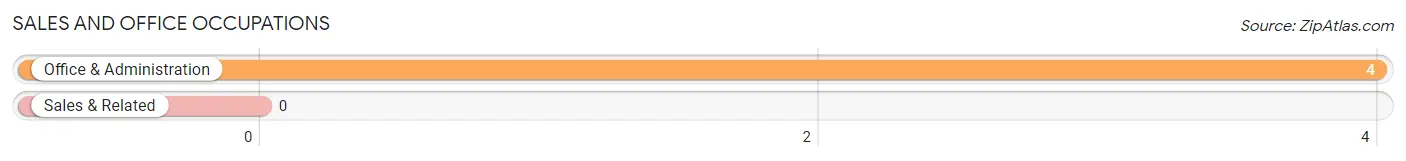
Sales and Office Occupations by Sex
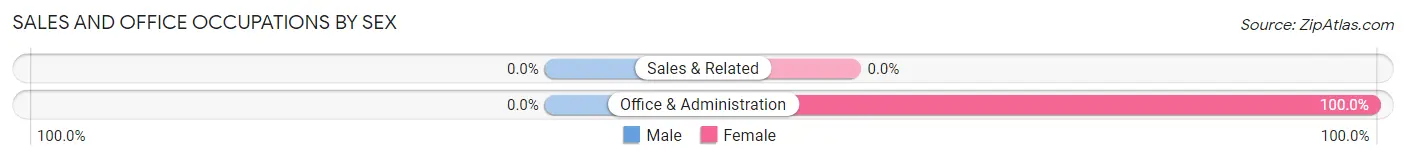
| Occupation | Male | Female |
| Sales & Related | 0 (0.0%) | 0 (0.0%) |
| Office & Administration | 0 (0.0%) | 4 (100.0%) |
| Total (Category) | 0 (0.0%) | 4 (100.0%) |
| Total (Overall) | 41 (83.7%) | 8 (16.3%) |
Natural Resources, Construction and Maintenance Occupations
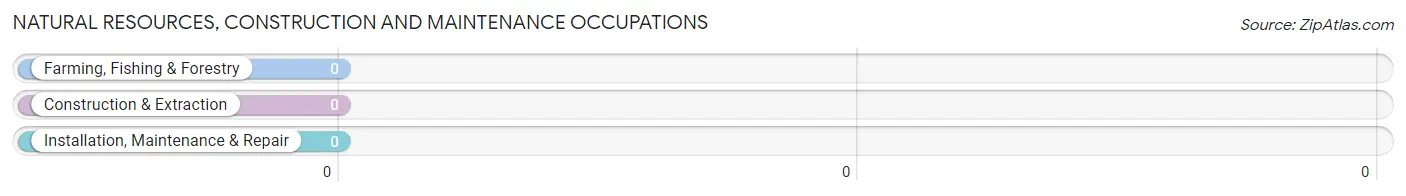
Natural Resources, Construction and Maintenance Occupations by Sex
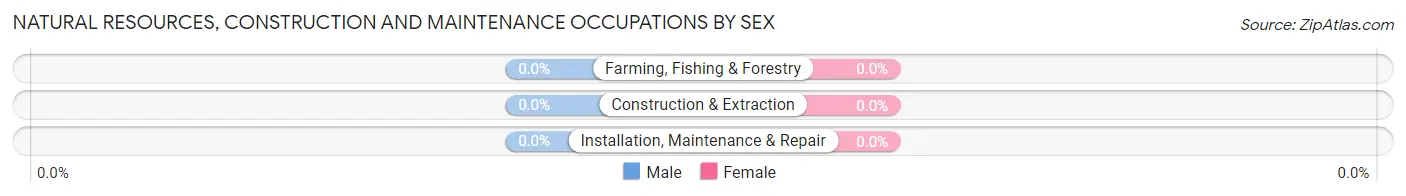
| Occupation | Male | Female |
| Farming, Fishing & Forestry | 0 (0.0%) | 0 (0.0%) |
| Construction & Extraction | 0 (0.0%) | 0 (0.0%) |
| Installation, Maintenance & Repair | 0 (0.0%) | 0 (0.0%) |
| Total (Category) | 0 (0.0%) | 0 (0.0%) |
| Total (Overall) | 41 (83.7%) | 8 (16.3%) |
Production, Transportation and Moving Occupations
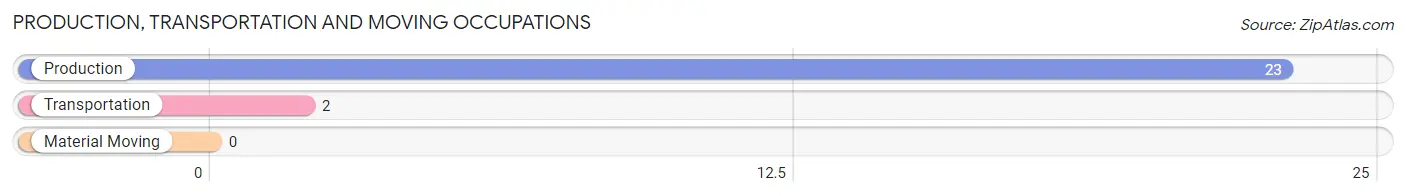
The most common Production, Transportation and Moving occupations in McNeal are Production (23 | 46.9%), and Transportation (2 | 4.1%).
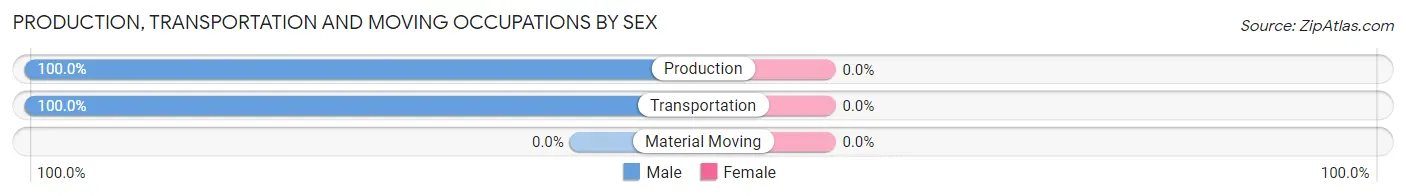
Production, Transportation and Moving Occupations by Sex
| Occupation | Male | Female |
| Production | 23 (100.0%) | 0 (0.0%) |
| Transportation | 2 (100.0%) | 0 (0.0%) |
| Material Moving | 0 (0.0%) | 0 (0.0%) |
| Total (Category) | 25 (100.0%) | 0 (0.0%) |
| Total (Overall) | 41 (83.7%) | 8 (16.3%) |
Employment Industries by Sex in McNeal
Employment Industries in McNeal
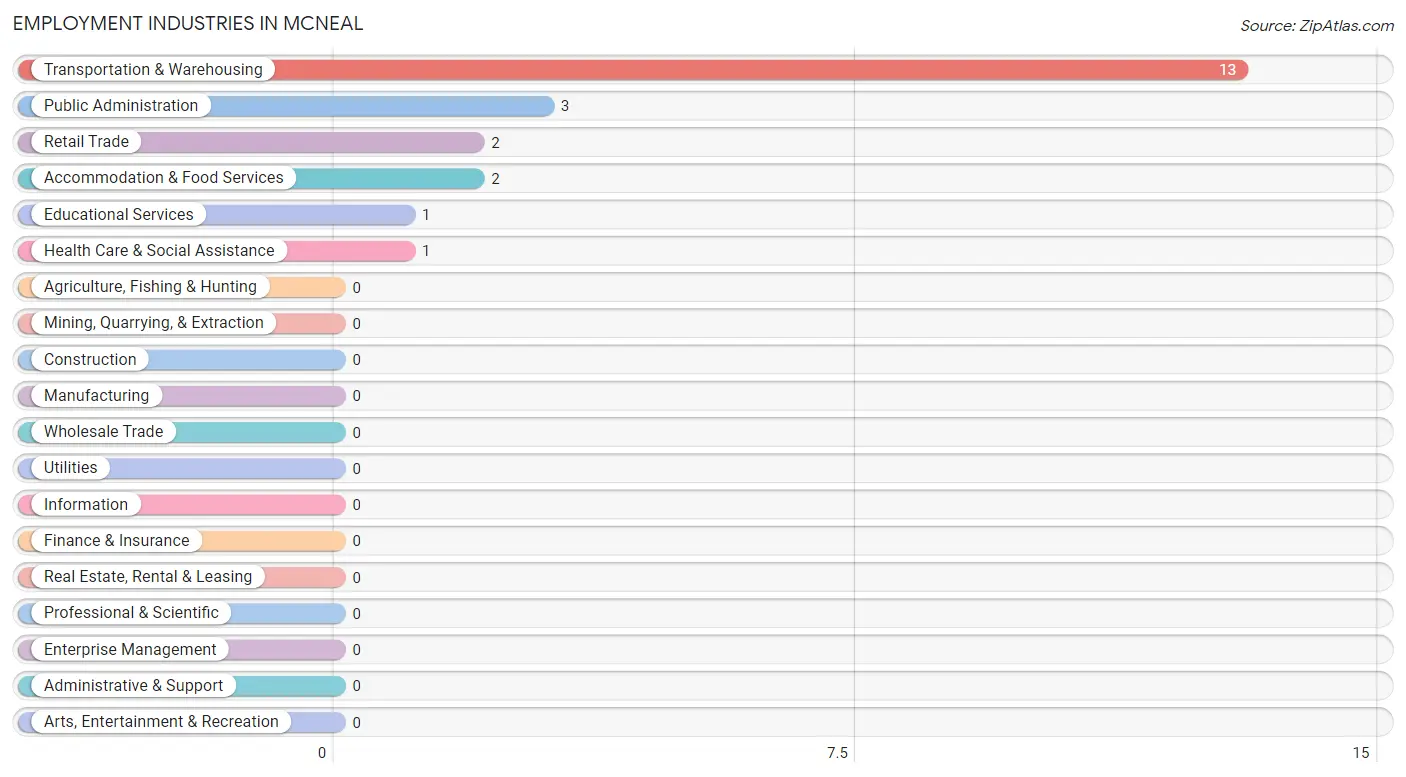
The major employment industries in McNeal include Transportation & Warehousing (13 | 26.5%), Public Administration (3 | 6.1%), Retail Trade (2 | 4.1%), Accommodation & Food Services (2 | 4.1%), and Educational Services (1 | 2.0%).
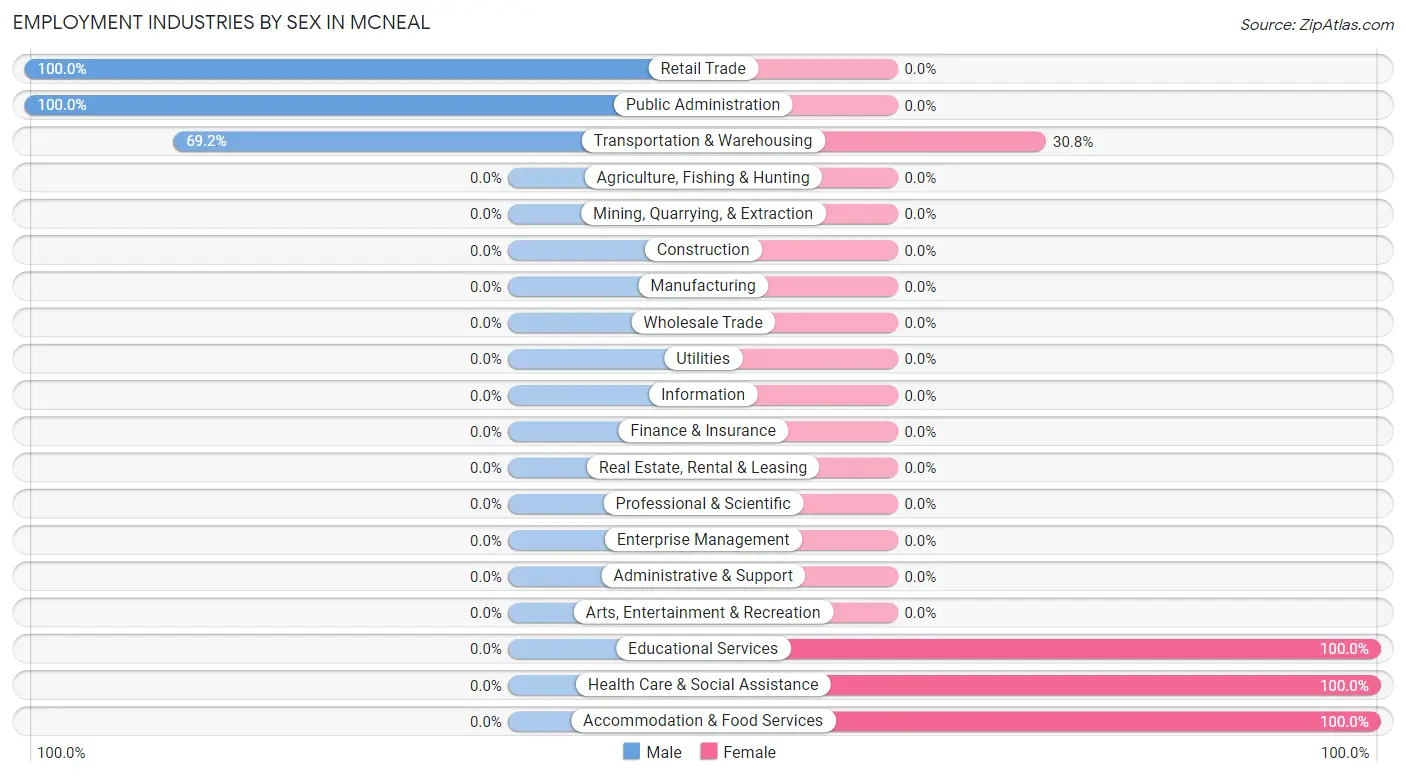
Employment Industries by Sex in McNeal
The McNeal industries that see more men than women are Retail Trade (100.0%), Public Administration (100.0%), and Transportation & Warehousing (69.2%), whereas the industries that tend to have a higher number of women are Educational Services (100.0%), Health Care & Social Assistance (100.0%), and Accommodation & Food Services (100.0%).
| Industry | Male | Female |
| Agriculture, Fishing & Hunting | 0 (0.0%) | 0 (0.0%) |
| Mining, Quarrying, & Extraction | 0 (0.0%) | 0 (0.0%) |
| Construction | 0 (0.0%) | 0 (0.0%) |
| Manufacturing | 0 (0.0%) | 0 (0.0%) |
| Wholesale Trade | 0 (0.0%) | 0 (0.0%) |
| Retail Trade | 2 (100.0%) | 0 (0.0%) |
| Transportation & Warehousing | 9 (69.2%) | 4 (30.8%) |
| Utilities | 0 (0.0%) | 0 (0.0%) |
| Information | 0 (0.0%) | 0 (0.0%) |
| Finance & Insurance | 0 (0.0%) | 0 (0.0%) |
| Real Estate, Rental & Leasing | 0 (0.0%) | 0 (0.0%) |
| Professional & Scientific | 0 (0.0%) | 0 (0.0%) |
| Enterprise Management | 0 (0.0%) | 0 (0.0%) |
| Administrative & Support | 0 (0.0%) | 0 (0.0%) |
| Educational Services | 0 (0.0%) | 1 (100.0%) |
| Health Care & Social Assistance | 0 (0.0%) | 1 (100.0%) |
| Arts, Entertainment & Recreation | 0 (0.0%) | 0 (0.0%) |
| Accommodation & Food Services | 0 (0.0%) | 2 (100.0%) |
| Public Administration | 3 (100.0%) | 0 (0.0%) |
| Total | 41 (83.7%) | 8 (16.3%) |
Education in McNeal
School Enrollment in McNeal
The most common levels of schooling among the 14 students in McNeal are middle school (7 | 50.0%), high school (5 | 35.7%), and kindergarten (1 | 7.1%).
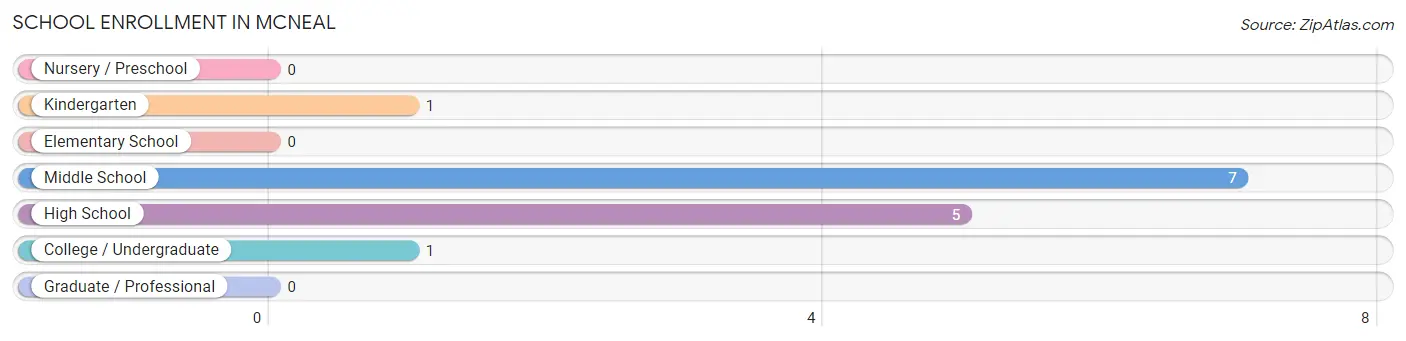
| School Level | # Students | % Students |
| Nursery / Preschool | 0 | 0.0% |
| Kindergarten | 1 | 7.1% |
| Elementary School | 0 | 0.0% |
| Middle School | 7 | 50.0% |
| High School | 5 | 35.7% |
| College / Undergraduate | 1 | 7.1% |
| Graduate / Professional | 0 | 0.0% |
| Total | 14 | 100.0% |
School Enrollment by Age by Funding Source in McNeal
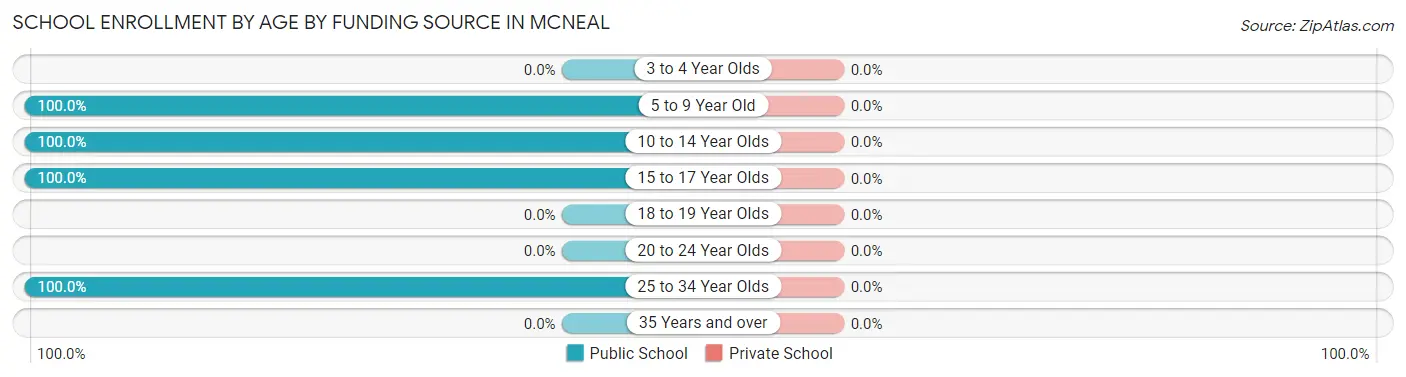
| Age Bracket | Public School | Private School |
| 3 to 4 Year Olds | 0 (0.0%) | 0 (0.0%) |
| 5 to 9 Year Old | 1 (100.0%) | 0 (0.0%) |
| 10 to 14 Year Olds | 7 (100.0%) | 0 (0.0%) |
| 15 to 17 Year Olds | 5 (100.0%) | 0 (0.0%) |
| 18 to 19 Year Olds | 0 (0.0%) | 0 (0.0%) |
| 20 to 24 Year Olds | 0 (0.0%) | 0 (0.0%) |
| 25 to 34 Year Olds | 1 (100.0%) | 0 (0.0%) |
| 35 Years and over | 0 (0.0%) | 0 (0.0%) |
| Total | 14 (100.0%) | 0 (0.0%) |
Educational Attainment by Field of Study in McNeal
Visual & performing arts (9 | 25.7%), liberal arts & history (8 | 22.9%), education (4 | 11.4%), arts & humanities (4 | 11.4%), and computers & mathematics (3 | 8.6%) are the most common fields of study among 35 individuals in McNeal who have obtained a bachelor's degree or higher.
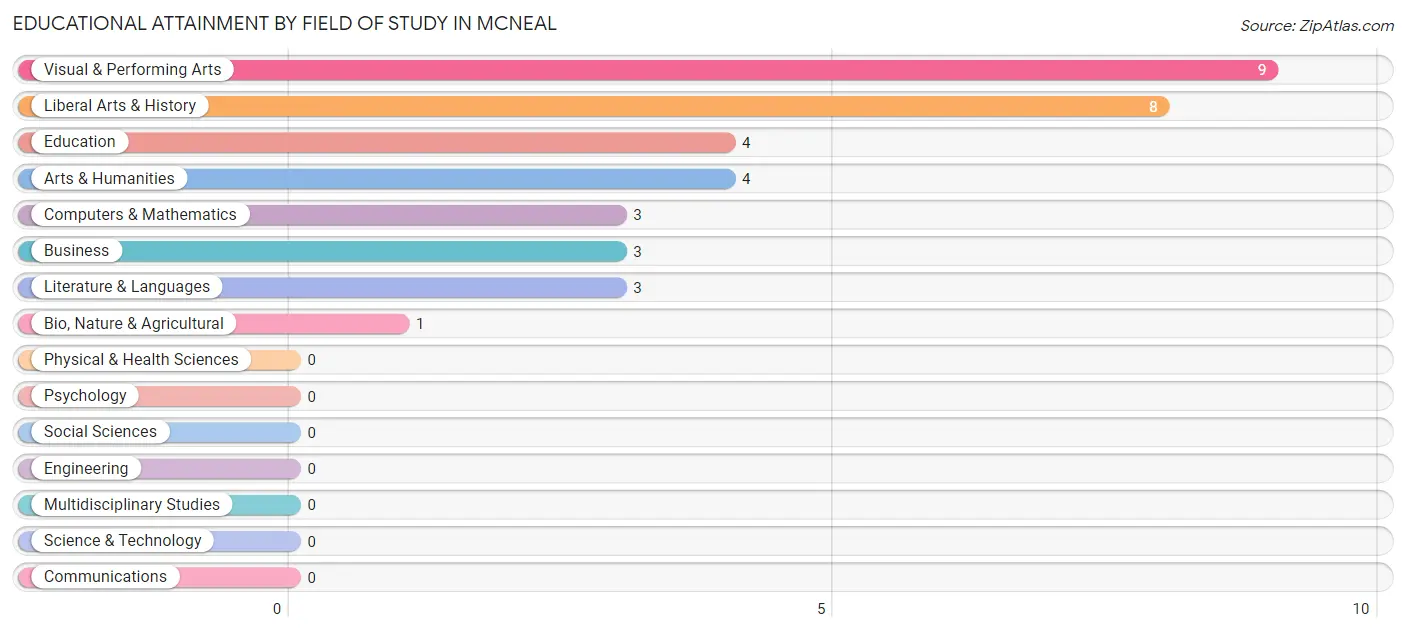
| Field of Study | # Graduates | % Graduates |
| Computers & Mathematics | 3 | 8.6% |
| Bio, Nature & Agricultural | 1 | 2.9% |
| Physical & Health Sciences | 0 | 0.0% |
| Psychology | 0 | 0.0% |
| Social Sciences | 0 | 0.0% |
| Engineering | 0 | 0.0% |
| Multidisciplinary Studies | 0 | 0.0% |
| Science & Technology | 0 | 0.0% |
| Business | 3 | 8.6% |
| Education | 4 | 11.4% |
| Literature & Languages | 3 | 8.6% |
| Liberal Arts & History | 8 | 22.9% |
| Visual & Performing Arts | 9 | 25.7% |
| Communications | 0 | 0.0% |
| Arts & Humanities | 4 | 11.4% |
| Total | 35 | 100.0% |
Transportation & Commute in McNeal
Vehicle Availability by Sex in McNeal
The most prevalent vehicle ownership categories in McNeal are males with 2 vehicles (31, accounting for 75.6%) and females with 2 vehicles (2, making up 387.5%).
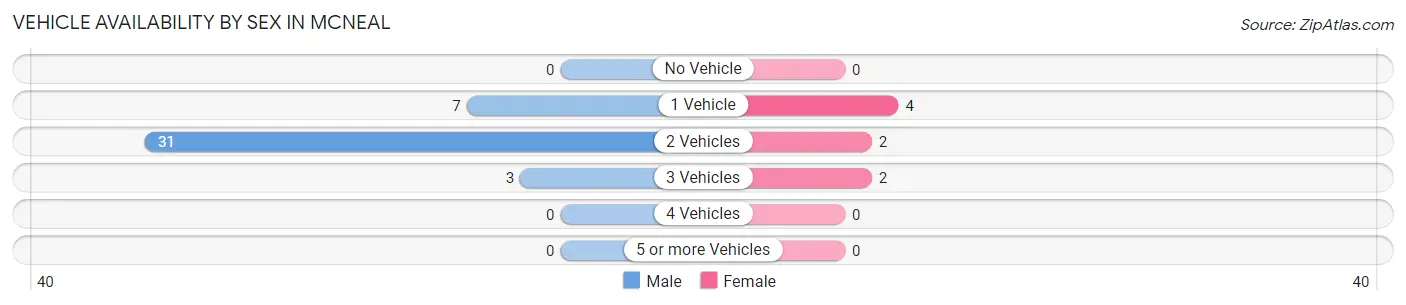
| Vehicles Available | Male | Female |
| No Vehicle | 0 (0.0%) | 0 (0.0%) |
| 1 Vehicle | 7 (17.1%) | 4 (50.0%) |
| 2 Vehicles | 31 (75.6%) | 2 (25.0%) |
| 3 Vehicles | 3 (7.3%) | 2 (25.0%) |
| 4 Vehicles | 0 (0.0%) | 0 (0.0%) |
| 5 or more Vehicles | 0 (0.0%) | 0 (0.0%) |
| Total | 41 (100.0%) | 8 (100.0%) |
Commute Time in McNeal
The most frequently occuring commute durations in McNeal are 40 to 44 minutes (23 commuters, 46.9%), 5 to 9 minutes (10 commuters, 20.4%), and less than 5 minutes (7 commuters, 14.3%).
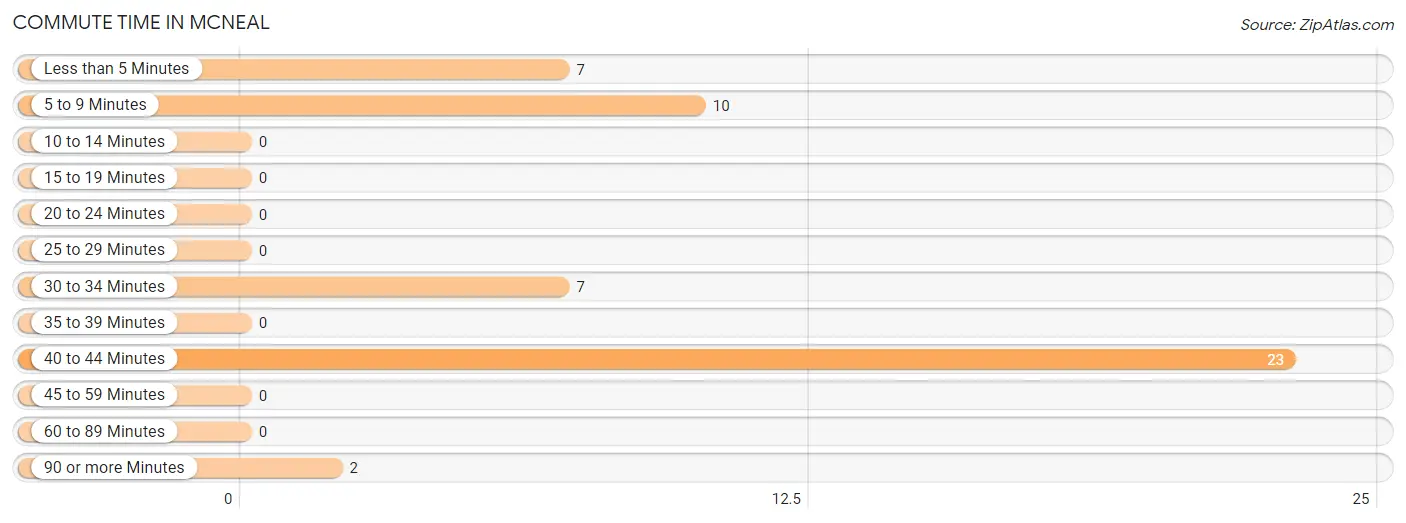
| Commute Time | # Commuters | % Commuters |
| Less than 5 Minutes | 7 | 14.3% |
| 5 to 9 Minutes | 10 | 20.4% |
| 10 to 14 Minutes | 0 | 0.0% |
| 15 to 19 Minutes | 0 | 0.0% |
| 20 to 24 Minutes | 0 | 0.0% |
| 25 to 29 Minutes | 0 | 0.0% |
| 30 to 34 Minutes | 7 | 14.3% |
| 35 to 39 Minutes | 0 | 0.0% |
| 40 to 44 Minutes | 23 | 46.9% |
| 45 to 59 Minutes | 0 | 0.0% |
| 60 to 89 Minutes | 0 | 0.0% |
| 90 or more Minutes | 2 | 4.1% |
Commute Time by Sex in McNeal
The most common commute times in McNeal are 40 to 44 minutes (23 commuters, 56.1%) for males and 5 to 9 minutes (4 commuters, 50.0%) for females.
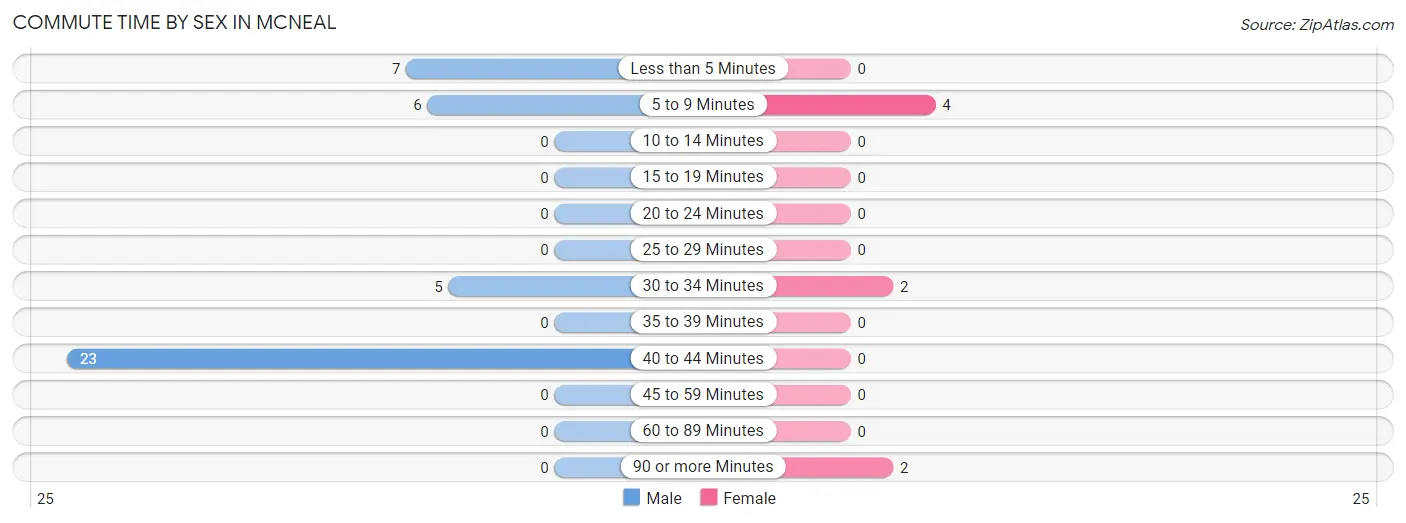
| Commute Time | Male | Female |
| Less than 5 Minutes | 7 (17.1%) | 0 (0.0%) |
| 5 to 9 Minutes | 6 (14.6%) | 4 (50.0%) |
| 10 to 14 Minutes | 0 (0.0%) | 0 (0.0%) |
| 15 to 19 Minutes | 0 (0.0%) | 0 (0.0%) |
| 20 to 24 Minutes | 0 (0.0%) | 0 (0.0%) |
| 25 to 29 Minutes | 0 (0.0%) | 0 (0.0%) |
| 30 to 34 Minutes | 5 (12.2%) | 2 (25.0%) |
| 35 to 39 Minutes | 0 (0.0%) | 0 (0.0%) |
| 40 to 44 Minutes | 23 (56.1%) | 0 (0.0%) |
| 45 to 59 Minutes | 0 (0.0%) | 0 (0.0%) |
| 60 to 89 Minutes | 0 (0.0%) | 0 (0.0%) |
| 90 or more Minutes | 0 (0.0%) | 2 (25.0%) |
Time of Departure to Work by Sex in McNeal
The most frequent times of departure to work in McNeal are 5:30 AM to 5:59 AM (23, 56.1%) for males and 7:30 AM to 7:59 AM (4, 50.0%) for females.
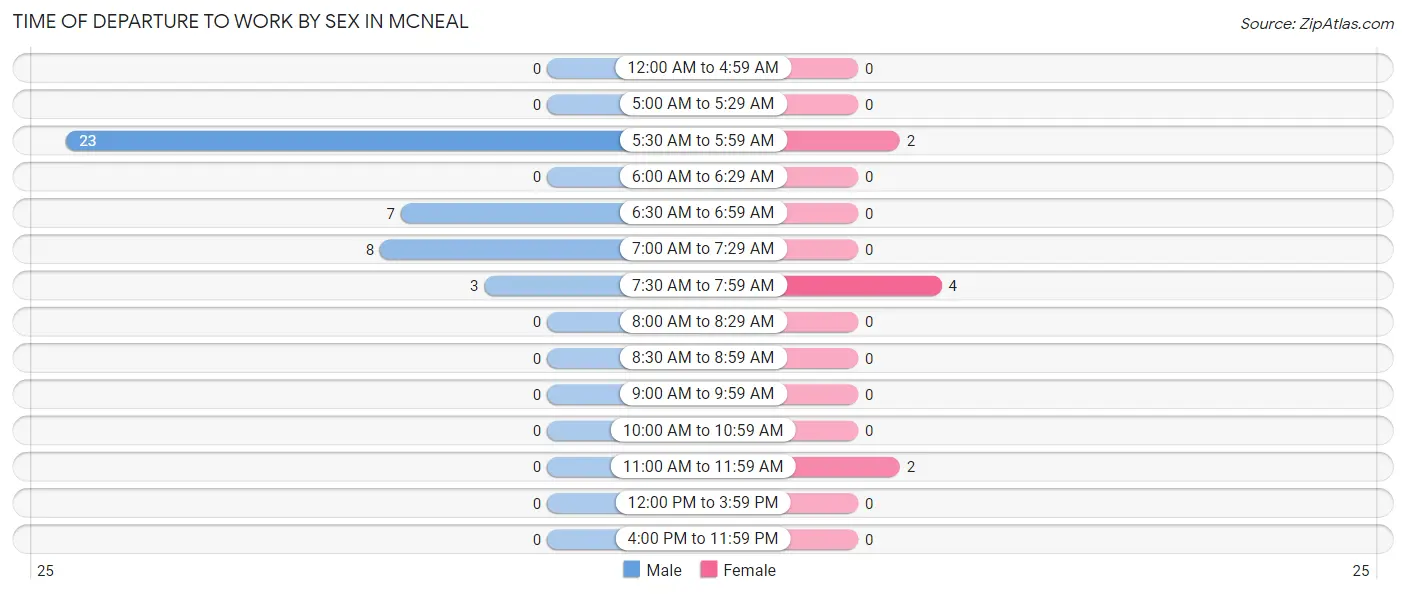
| Time of Departure | Male | Female |
| 12:00 AM to 4:59 AM | 0 (0.0%) | 0 (0.0%) |
| 5:00 AM to 5:29 AM | 0 (0.0%) | 0 (0.0%) |
| 5:30 AM to 5:59 AM | 23 (56.1%) | 2 (25.0%) |
| 6:00 AM to 6:29 AM | 0 (0.0%) | 0 (0.0%) |
| 6:30 AM to 6:59 AM | 7 (17.1%) | 0 (0.0%) |
| 7:00 AM to 7:29 AM | 8 (19.5%) | 0 (0.0%) |
| 7:30 AM to 7:59 AM | 3 (7.3%) | 4 (50.0%) |
| 8:00 AM to 8:29 AM | 0 (0.0%) | 0 (0.0%) |
| 8:30 AM to 8:59 AM | 0 (0.0%) | 0 (0.0%) |
| 9:00 AM to 9:59 AM | 0 (0.0%) | 0 (0.0%) |
| 10:00 AM to 10:59 AM | 0 (0.0%) | 0 (0.0%) |
| 11:00 AM to 11:59 AM | 0 (0.0%) | 2 (25.0%) |
| 12:00 PM to 3:59 PM | 0 (0.0%) | 0 (0.0%) |
| 4:00 PM to 11:59 PM | 0 (0.0%) | 0 (0.0%) |
| Total | 41 (100.0%) | 8 (100.0%) |
Housing Occupancy in McNeal
Occupancy by Ownership in McNeal
Of the total 105 dwellings in McNeal, owner-occupied units account for 88 (83.8%), while renter-occupied units make up 17 (16.2%).
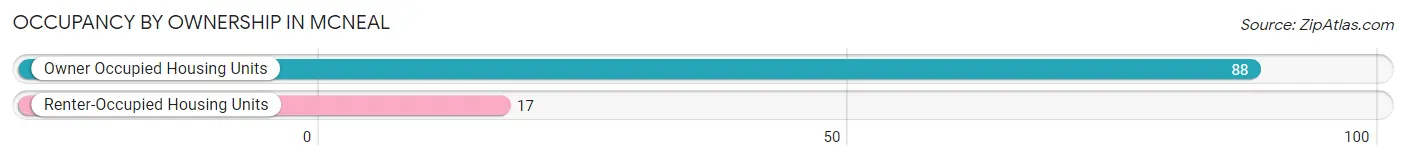
| Occupancy | # Housing Units | % Housing Units |
| Owner Occupied Housing Units | 88 | 83.8% |
| Renter-Occupied Housing Units | 17 | 16.2% |
| Total Occupied Housing Units | 105 | 100.0% |
Occupancy by Household Size in McNeal
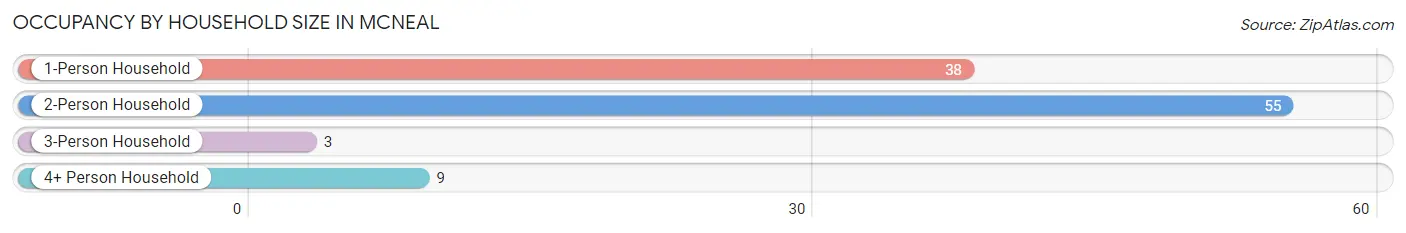
| Household Size | # Housing Units | % Housing Units |
| 1-Person Household | 38 | 36.2% |
| 2-Person Household | 55 | 52.4% |
| 3-Person Household | 3 | 2.9% |
| 4+ Person Household | 9 | 8.6% |
| Total Housing Units | 105 | 100.0% |
Occupancy by Ownership by Household Size in McNeal
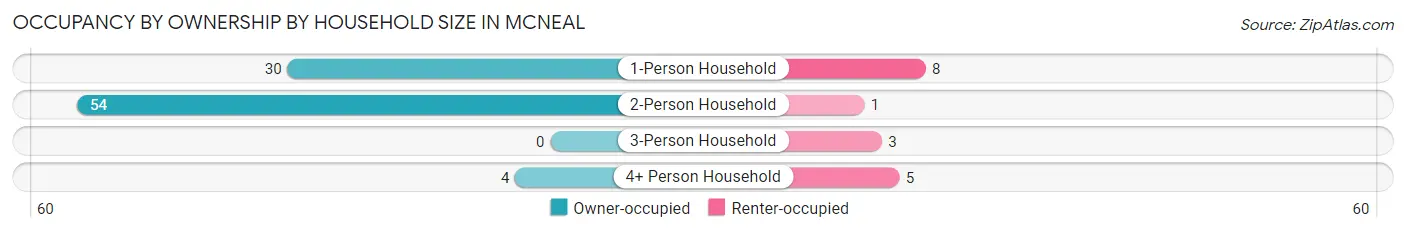
| Household Size | Owner-occupied | Renter-occupied |
| 1-Person Household | 30 (78.9%) | 8 (21.0%) |
| 2-Person Household | 54 (98.2%) | 1 (1.8%) |
| 3-Person Household | 0 (0.0%) | 3 (100.0%) |
| 4+ Person Household | 4 (44.4%) | 5 (55.6%) |
| Total Housing Units | 88 (83.8%) | 17 (16.2%) |
Occupancy by Educational Attainment in McNeal
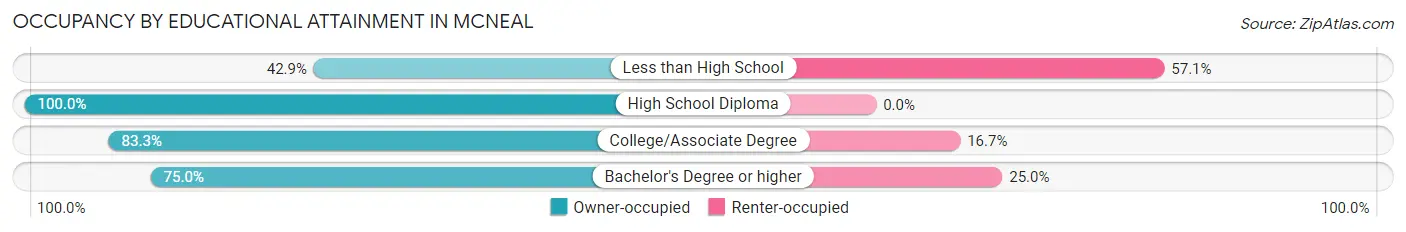
| Household Size | Owner-occupied | Renter-occupied |
| Less than High School | 6 (42.9%) | 8 (57.1%) |
| High School Diploma | 49 (100.0%) | 0 (0.0%) |
| College/Associate Degree | 15 (83.3%) | 3 (16.7%) |
| Bachelor's Degree or higher | 18 (75.0%) | 6 (25.0%) |
Occupancy by Age of Householder in McNeal
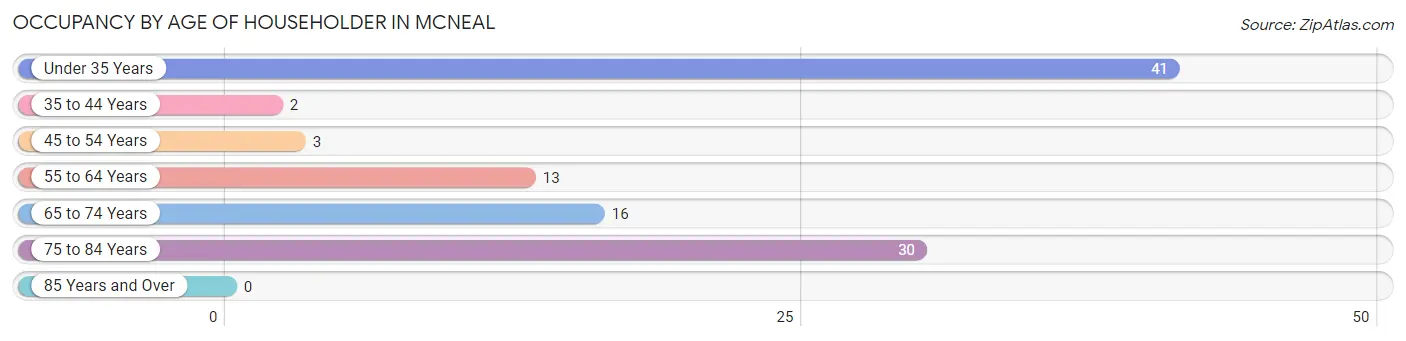
| Age Bracket | # Households | % Households |
| Under 35 Years | 41 | 39.1% |
| 35 to 44 Years | 2 | 1.9% |
| 45 to 54 Years | 3 | 2.9% |
| 55 to 64 Years | 13 | 12.4% |
| 65 to 74 Years | 16 | 15.2% |
| 75 to 84 Years | 30 | 28.6% |
| 85 Years and Over | 0 | 0.0% |
| Total | 105 | 100.0% |
Housing Finances in McNeal
Median Income by Occupancy in McNeal
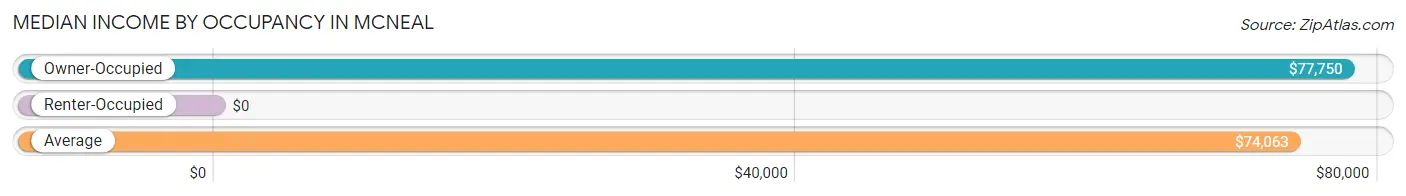
| Occupancy Type | # Households | Median Income |
| Owner-Occupied | 88 (83.8%) | $77,750 |
| Renter-Occupied | 17 (16.2%) | $0 |
| Average | 105 (100.0%) | $74,063 |
Occupancy by Householder Income Bracket in McNeal
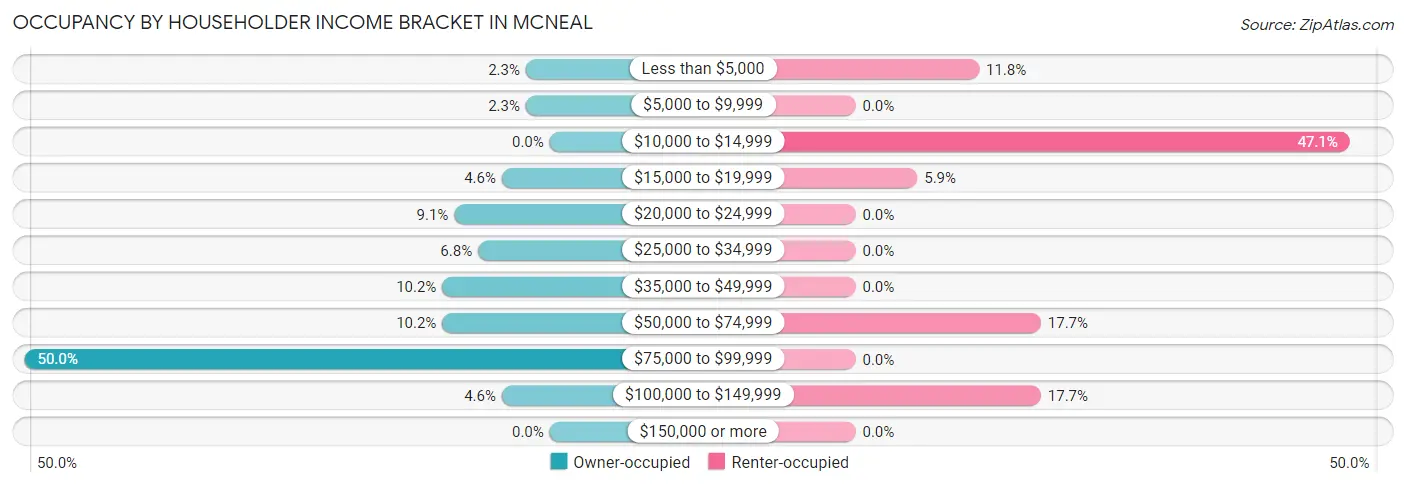
| Income Bracket | Owner-occupied | Renter-occupied |
| Less than $5,000 | 2 (2.3%) | 2 (11.8%) |
| $5,000 to $9,999 | 2 (2.3%) | 0 (0.0%) |
| $10,000 to $14,999 | 0 (0.0%) | 8 (47.1%) |
| $15,000 to $19,999 | 4 (4.5%) | 1 (5.9%) |
| $20,000 to $24,999 | 8 (9.1%) | 0 (0.0%) |
| $25,000 to $34,999 | 6 (6.8%) | 0 (0.0%) |
| $35,000 to $49,999 | 9 (10.2%) | 0 (0.0%) |
| $50,000 to $74,999 | 9 (10.2%) | 3 (17.6%) |
| $75,000 to $99,999 | 44 (50.0%) | 0 (0.0%) |
| $100,000 to $149,999 | 4 (4.5%) | 3 (17.6%) |
| $150,000 or more | 0 (0.0%) | 0 (0.0%) |
| Total | 88 (100.0%) | 17 (100.0%) |
Monthly Housing Cost Tiers in McNeal
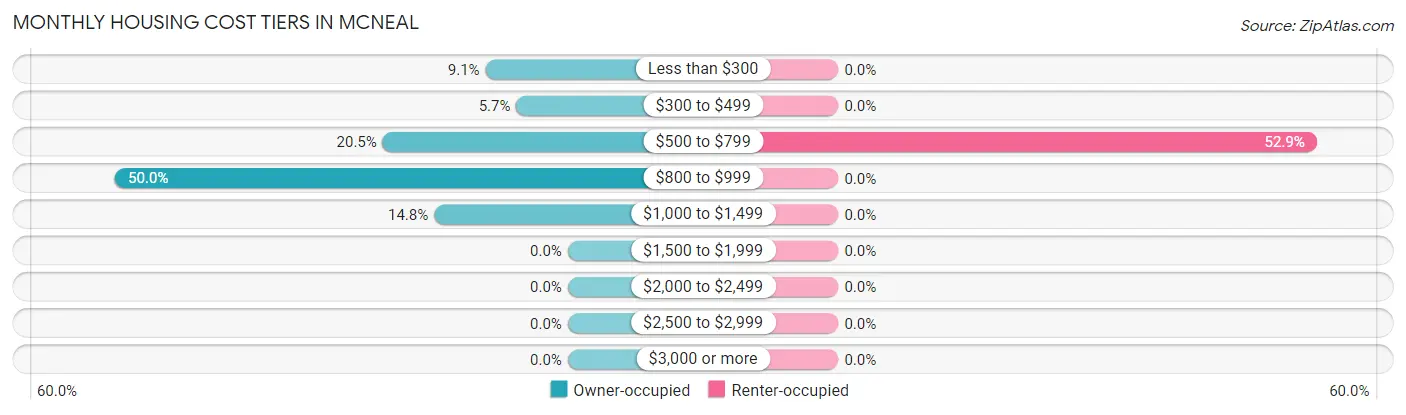
| Monthly Cost | Owner-occupied | Renter-occupied |
| Less than $300 | 8 (9.1%) | 0 (0.0%) |
| $300 to $499 | 5 (5.7%) | 0 (0.0%) |
| $500 to $799 | 18 (20.4%) | 9 (52.9%) |
| $800 to $999 | 44 (50.0%) | 0 (0.0%) |
| $1,000 to $1,499 | 13 (14.8%) | 0 (0.0%) |
| $1,500 to $1,999 | 0 (0.0%) | 0 (0.0%) |
| $2,000 to $2,499 | 0 (0.0%) | 0 (0.0%) |
| $2,500 to $2,999 | 0 (0.0%) | 0 (0.0%) |
| $3,000 or more | 0 (0.0%) | 0 (0.0%) |
| Total | 88 (100.0%) | 17 (100.0%) |
Physical Housing Characteristics in McNeal
Housing Structures in McNeal
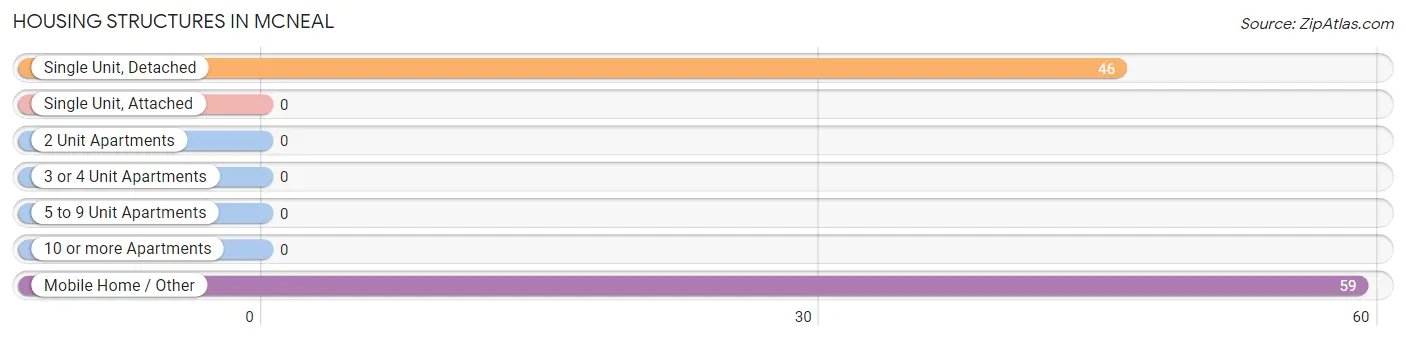
| Structure Type | # Housing Units | % Housing Units |
| Single Unit, Detached | 46 | 43.8% |
| Single Unit, Attached | 0 | 0.0% |
| 2 Unit Apartments | 0 | 0.0% |
| 3 or 4 Unit Apartments | 0 | 0.0% |
| 5 to 9 Unit Apartments | 0 | 0.0% |
| 10 or more Apartments | 0 | 0.0% |
| Mobile Home / Other | 59 | 56.2% |
| Total | 105 | 100.0% |
Housing Structures by Occupancy in McNeal
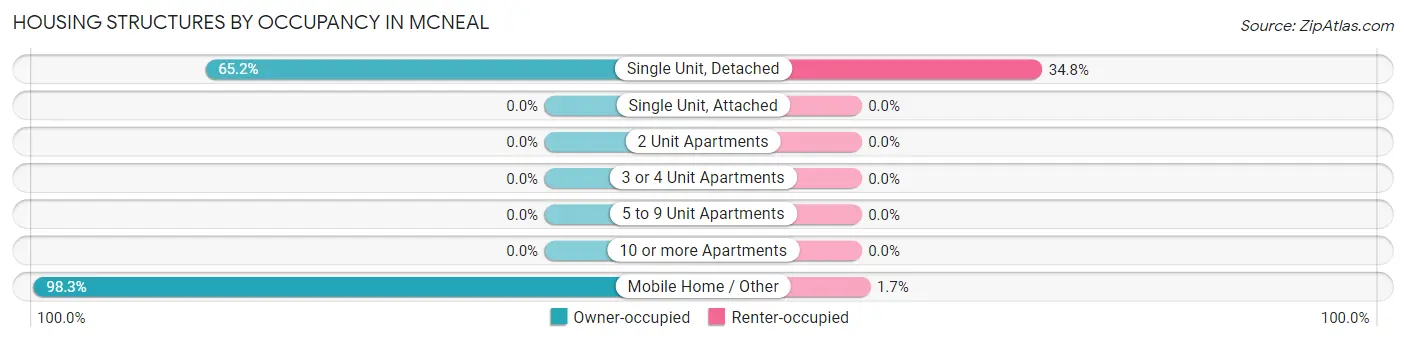
| Structure Type | Owner-occupied | Renter-occupied |
| Single Unit, Detached | 30 (65.2%) | 16 (34.8%) |
| Single Unit, Attached | 0 (0.0%) | 0 (0.0%) |
| 2 Unit Apartments | 0 (0.0%) | 0 (0.0%) |
| 3 or 4 Unit Apartments | 0 (0.0%) | 0 (0.0%) |
| 5 to 9 Unit Apartments | 0 (0.0%) | 0 (0.0%) |
| 10 or more Apartments | 0 (0.0%) | 0 (0.0%) |
| Mobile Home / Other | 58 (98.3%) | 1 (1.7%) |
| Total | 88 (83.8%) | 17 (16.2%) |
Housing Structures by Number of Rooms in McNeal
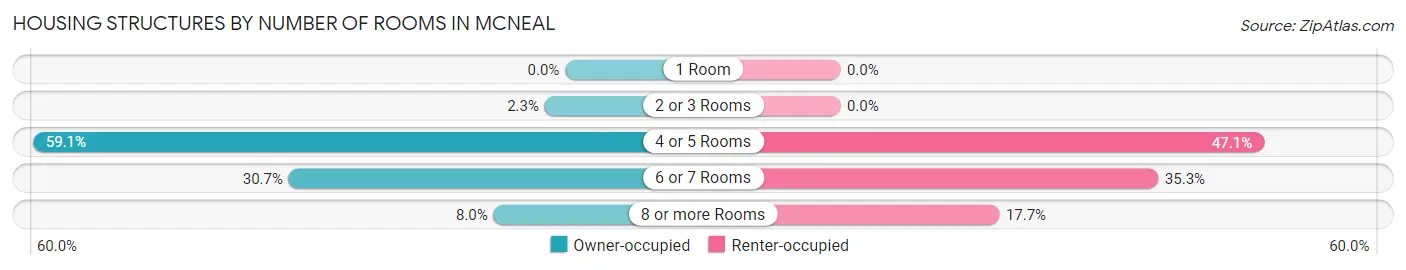
| Number of Rooms | Owner-occupied | Renter-occupied |
| 1 Room | 0 (0.0%) | 0 (0.0%) |
| 2 or 3 Rooms | 2 (2.3%) | 0 (0.0%) |
| 4 or 5 Rooms | 52 (59.1%) | 8 (47.1%) |
| 6 or 7 Rooms | 27 (30.7%) | 6 (35.3%) |
| 8 or more Rooms | 7 (8.0%) | 3 (17.6%) |
| Total | 88 (100.0%) | 17 (100.0%) |
Housing Structure by Heating Type in McNeal
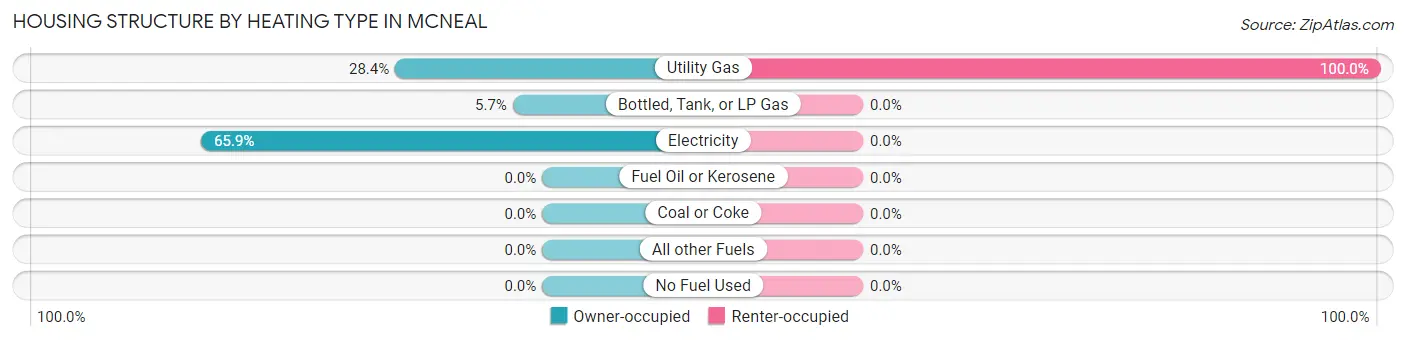
| Heating Type | Owner-occupied | Renter-occupied |
| Utility Gas | 25 (28.4%) | 17 (100.0%) |
| Bottled, Tank, or LP Gas | 5 (5.7%) | 0 (0.0%) |
| Electricity | 58 (65.9%) | 0 (0.0%) |
| Fuel Oil or Kerosene | 0 (0.0%) | 0 (0.0%) |
| Coal or Coke | 0 (0.0%) | 0 (0.0%) |
| All other Fuels | 0 (0.0%) | 0 (0.0%) |
| No Fuel Used | 0 (0.0%) | 0 (0.0%) |
| Total | 88 (100.0%) | 17 (100.0%) |
Household Vehicle Usage in McNeal
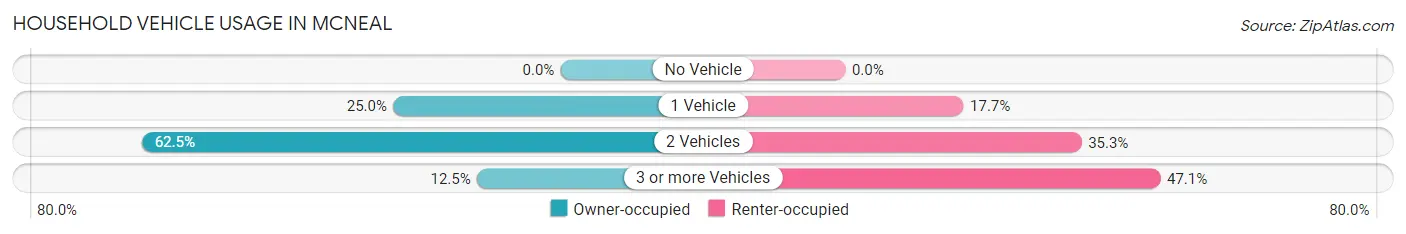
| Vehicles per Household | Owner-occupied | Renter-occupied |
| No Vehicle | 0 (0.0%) | 0 (0.0%) |
| 1 Vehicle | 22 (25.0%) | 3 (17.6%) |
| 2 Vehicles | 55 (62.5%) | 6 (35.3%) |
| 3 or more Vehicles | 11 (12.5%) | 8 (47.1%) |
| Total | 88 (100.0%) | 17 (100.0%) |
Real Estate & Mortgages in McNeal
Real Estate and Mortgage Overview in McNeal
| Characteristic | Without Mortgage | With Mortgage |
| Housing Units | 19 | 69 |
| Median Property Value | $122,500 | $95,500 |
| Median Household Income | - | - |
| Monthly Housing Costs | $325 | $0 |
| Real Estate Taxes | - | - |
Property Value by Mortgage Status in McNeal
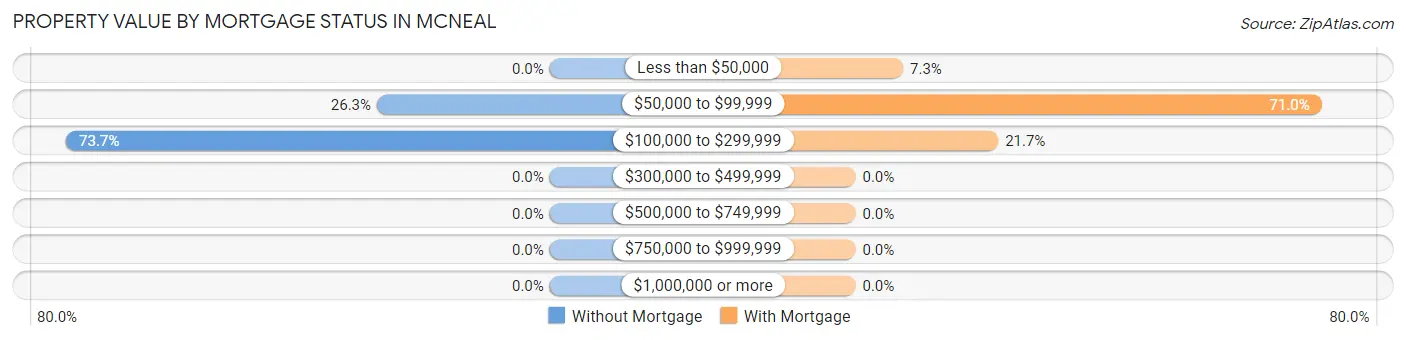
| Property Value | Without Mortgage | With Mortgage |
| Less than $50,000 | 0 (0.0%) | 5 (7.2%) |
| $50,000 to $99,999 | 5 (26.3%) | 49 (71.0%) |
| $100,000 to $299,999 | 14 (73.7%) | 15 (21.7%) |
| $300,000 to $499,999 | 0 (0.0%) | 0 (0.0%) |
| $500,000 to $749,999 | 0 (0.0%) | 0 (0.0%) |
| $750,000 to $999,999 | 0 (0.0%) | 0 (0.0%) |
| $1,000,000 or more | 0 (0.0%) | 0 (0.0%) |
| Total | 19 (100.0%) | 69 (100.0%) |
Household Income by Mortgage Status in McNeal
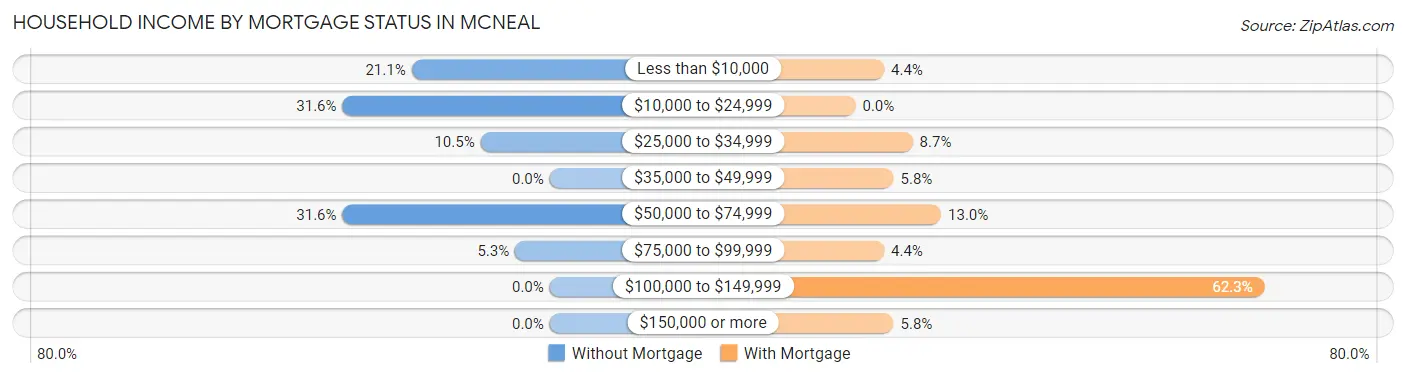
| Household Income | Without Mortgage | With Mortgage |
| Less than $10,000 | 4 (21.0%) | 3 (4.3%) |
| $10,000 to $24,999 | 6 (31.6%) | 0 (0.0%) |
| $25,000 to $34,999 | 2 (10.5%) | 6 (8.7%) |
| $35,000 to $49,999 | 0 (0.0%) | 4 (5.8%) |
| $50,000 to $74,999 | 6 (31.6%) | 9 (13.0%) |
| $75,000 to $99,999 | 1 (5.3%) | 3 (4.3%) |
| $100,000 to $149,999 | 0 (0.0%) | 43 (62.3%) |
| $150,000 or more | 0 (0.0%) | 4 (5.8%) |
| Total | 19 (100.0%) | 69 (100.0%) |
Property Value to Household Income Ratio in McNeal
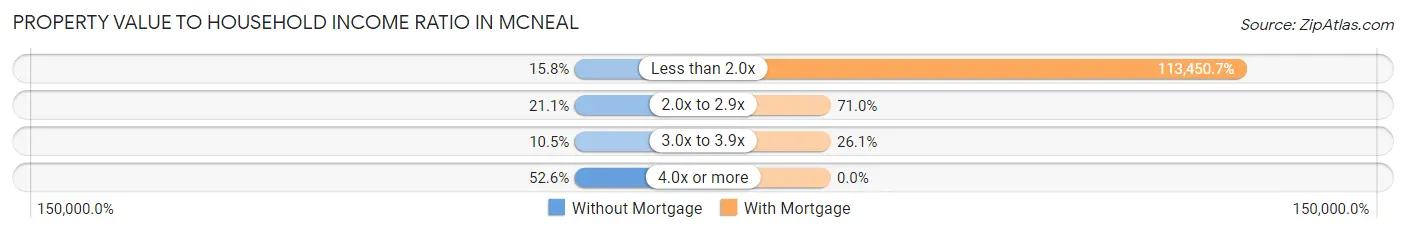
| Value-to-Income Ratio | Without Mortgage | With Mortgage |
| Less than 2.0x | 3 (15.8%) | 78,281 (113,450.7%) |
| 2.0x to 2.9x | 4 (21.0%) | 49 (71.0%) |
| 3.0x to 3.9x | 2 (10.5%) | 18 (26.1%) |
| 4.0x or more | 10 (52.6%) | 0 (0.0%) |
| Total | 19 (100.0%) | 69 (100.0%) |
Real Estate Taxes by Mortgage Status in McNeal
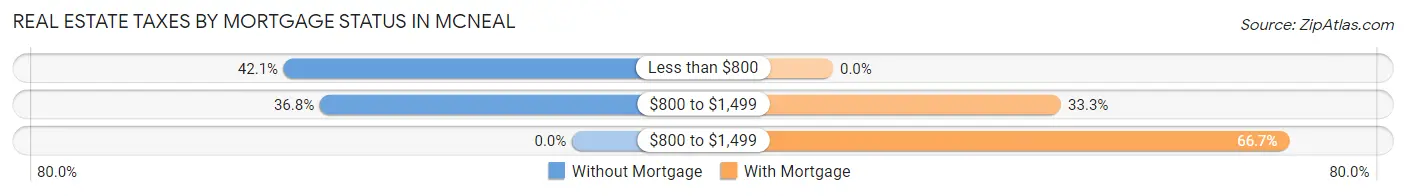
| Property Taxes | Without Mortgage | With Mortgage |
| Less than $800 | 8 (42.1%) | 0 (0.0%) |
| $800 to $1,499 | 7 (36.8%) | 23 (33.3%) |
| $800 to $1,499 | 0 (0.0%) | 46 (66.7%) |
| Total | 19 (100.0%) | 69 (100.0%) |
Health & Disability in McNeal
Health Insurance Coverage by Age in McNeal
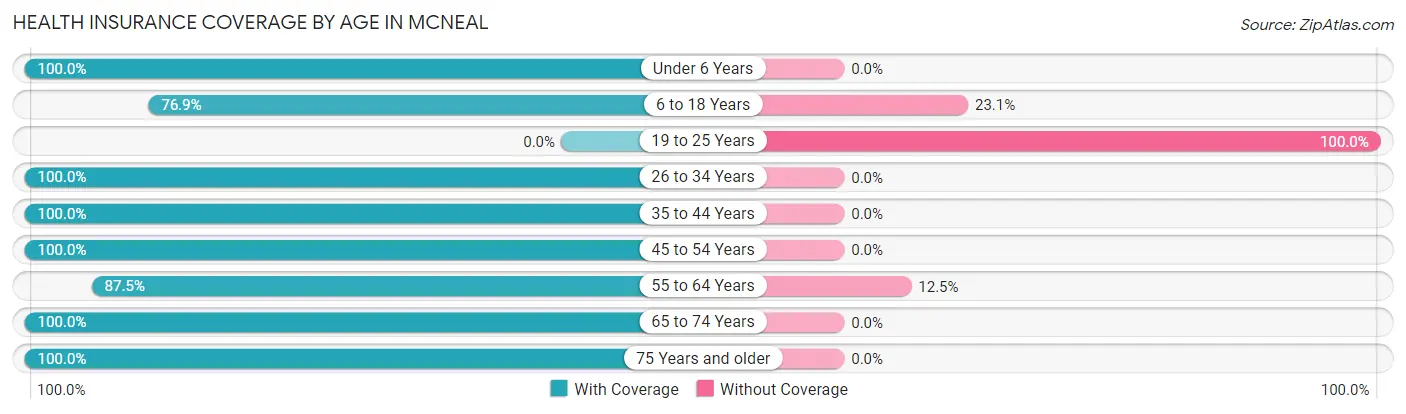
| Age Bracket | With Coverage | Without Coverage |
| Under 6 Years | 5 (100.0%) | 0 (0.0%) |
| 6 to 18 Years | 10 (76.9%) | 3 (23.1%) |
| 19 to 25 Years | 0 (0.0%) | 66 (100.0%) |
| 26 to 34 Years | 4 (100.0%) | 0 (0.0%) |
| 35 to 44 Years | 2 (100.0%) | 0 (0.0%) |
| 45 to 54 Years | 9 (100.0%) | 0 (0.0%) |
| 55 to 64 Years | 14 (87.5%) | 2 (12.5%) |
| 65 to 74 Years | 27 (100.0%) | 0 (0.0%) |
| 75 Years and older | 38 (100.0%) | 0 (0.0%) |
| Total | 109 (60.6%) | 71 (39.4%) |
Health Insurance Coverage by Citizenship Status in McNeal
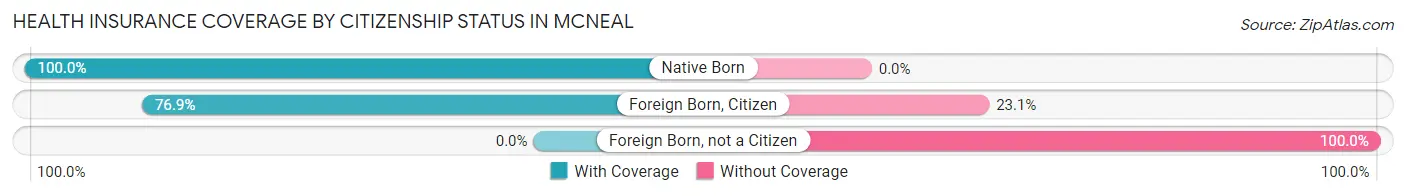
| Citizenship Status | With Coverage | Without Coverage |
| Native Born | 5 (100.0%) | 0 (0.0%) |
| Foreign Born, Citizen | 10 (76.9%) | 3 (23.1%) |
| Foreign Born, not a Citizen | 0 (0.0%) | 66 (100.0%) |
Health Insurance Coverage by Household Income in McNeal
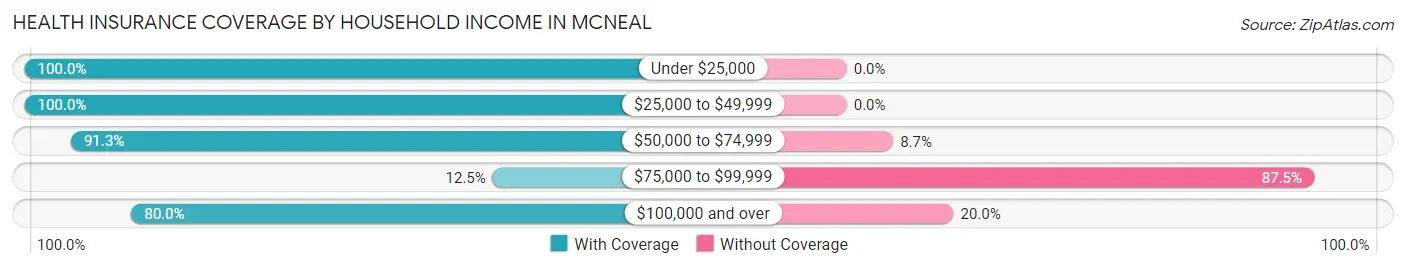
| Household Income | With Coverage | Without Coverage |
| Under $25,000 | 36 (100.0%) | 0 (0.0%) |
| $25,000 to $49,999 | 19 (100.0%) | 0 (0.0%) |
| $50,000 to $74,999 | 21 (91.3%) | 2 (8.7%) |
| $75,000 to $99,999 | 9 (12.5%) | 63 (87.5%) |
| $100,000 and over | 24 (80.0%) | 6 (20.0%) |
Public vs Private Health Insurance Coverage by Age in McNeal
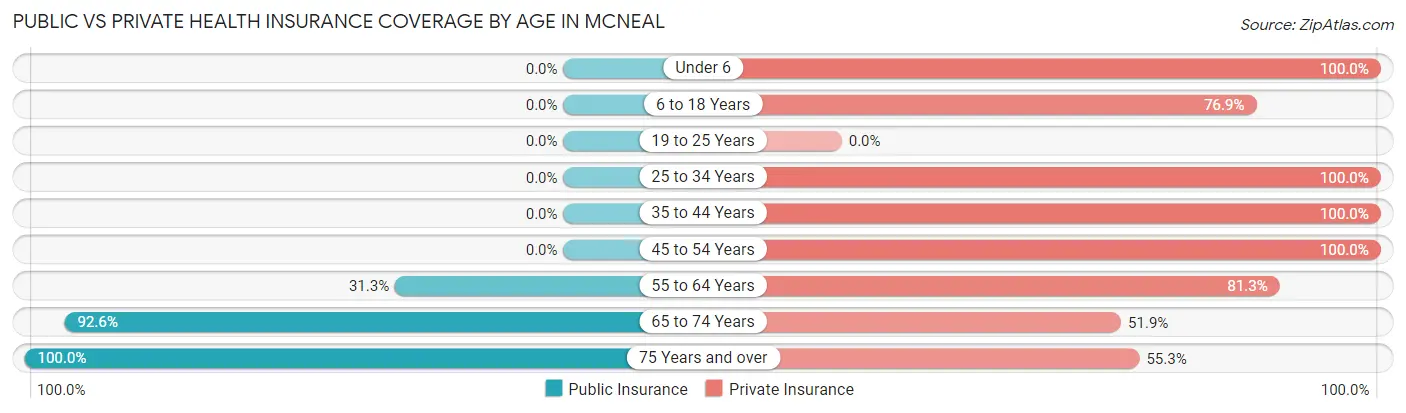
| Age Bracket | Public Insurance | Private Insurance |
| Under 6 | 0 (0.0%) | 5 (100.0%) |
| 6 to 18 Years | 0 (0.0%) | 10 (76.9%) |
| 19 to 25 Years | 0 (0.0%) | 0 (0.0%) |
| 25 to 34 Years | 0 (0.0%) | 4 (100.0%) |
| 35 to 44 Years | 0 (0.0%) | 2 (100.0%) |
| 45 to 54 Years | 0 (0.0%) | 9 (100.0%) |
| 55 to 64 Years | 5 (31.2%) | 13 (81.2%) |
| 65 to 74 Years | 25 (92.6%) | 14 (51.8%) |
| 75 Years and over | 38 (100.0%) | 21 (55.3%) |
| Total | 68 (37.8%) | 78 (43.3%) |
Disability Status by Sex by Age in McNeal
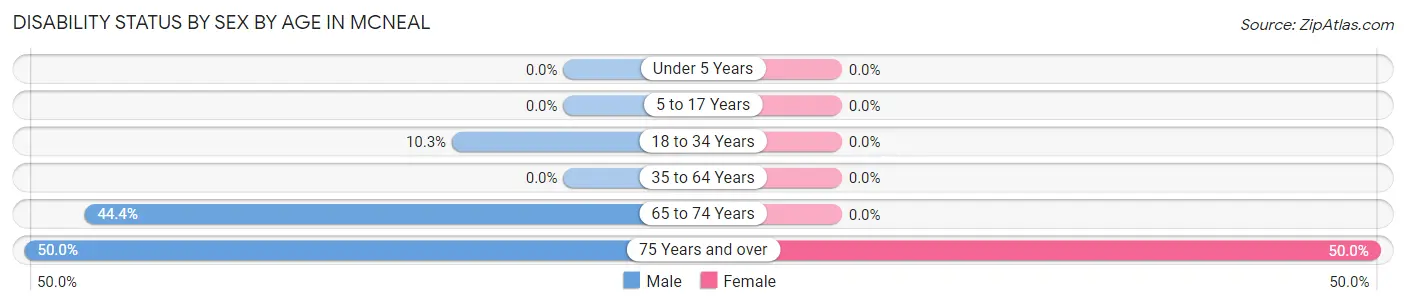
| Age Bracket | Male | Female |
| Under 5 Years | 0 (0.0%) | 0 (0.0%) |
| 5 to 17 Years | 0 (0.0%) | 0 (0.0%) |
| 18 to 34 Years | 3 (10.3%) | 0 (0.0%) |
| 35 to 64 Years | 0 (0.0%) | 0 (0.0%) |
| 65 to 74 Years | 4 (44.4%) | 0 (0.0%) |
| 75 Years and over | 11 (50.0%) | 8 (50.0%) |
Disability Class by Sex by Age in McNeal
Disability Class: Hearing Difficulty
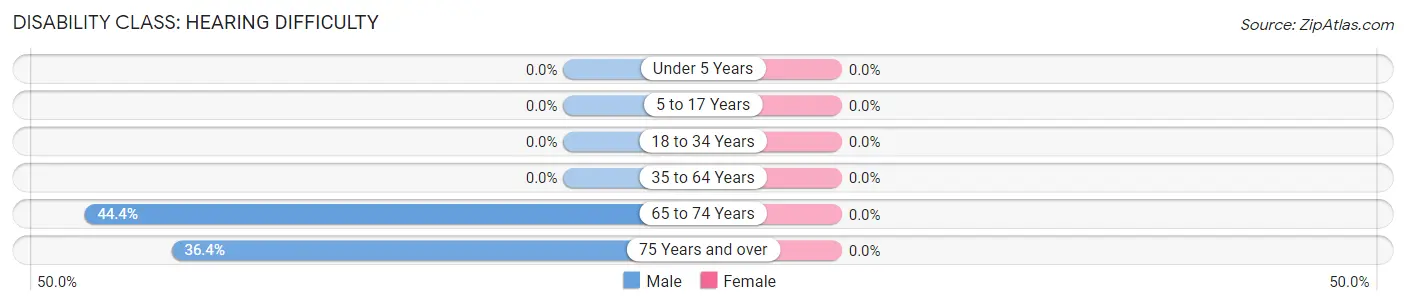
| Age Bracket | Male | Female |
| Under 5 Years | 0 (0.0%) | 0 (0.0%) |
| 5 to 17 Years | 0 (0.0%) | 0 (0.0%) |
| 18 to 34 Years | 0 (0.0%) | 0 (0.0%) |
| 35 to 64 Years | 0 (0.0%) | 0 (0.0%) |
| 65 to 74 Years | 4 (44.4%) | 0 (0.0%) |
| 75 Years and over | 8 (36.4%) | 0 (0.0%) |
Disability Class: Vision Difficulty
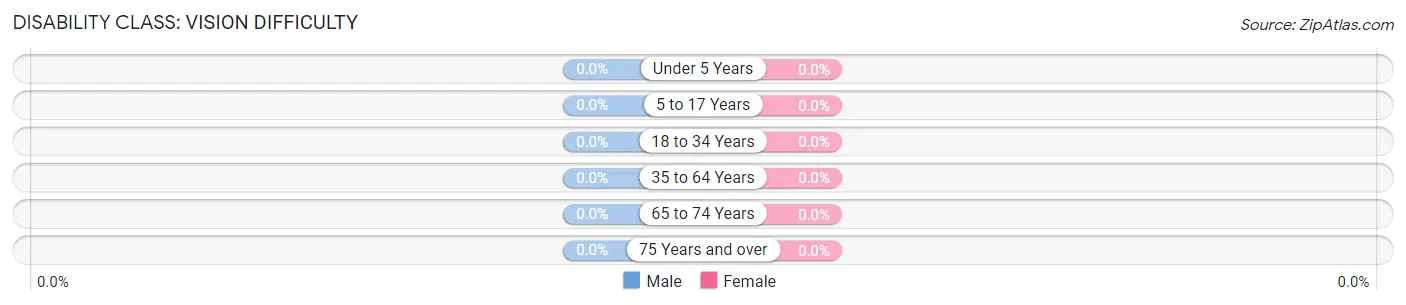
| Age Bracket | Male | Female |
| Under 5 Years | 0 (0.0%) | 0 (0.0%) |
| 5 to 17 Years | 0 (0.0%) | 0 (0.0%) |
| 18 to 34 Years | 0 (0.0%) | 0 (0.0%) |
| 35 to 64 Years | 0 (0.0%) | 0 (0.0%) |
| 65 to 74 Years | 0 (0.0%) | 0 (0.0%) |
| 75 Years and over | 0 (0.0%) | 0 (0.0%) |
Disability Class: Cognitive Difficulty
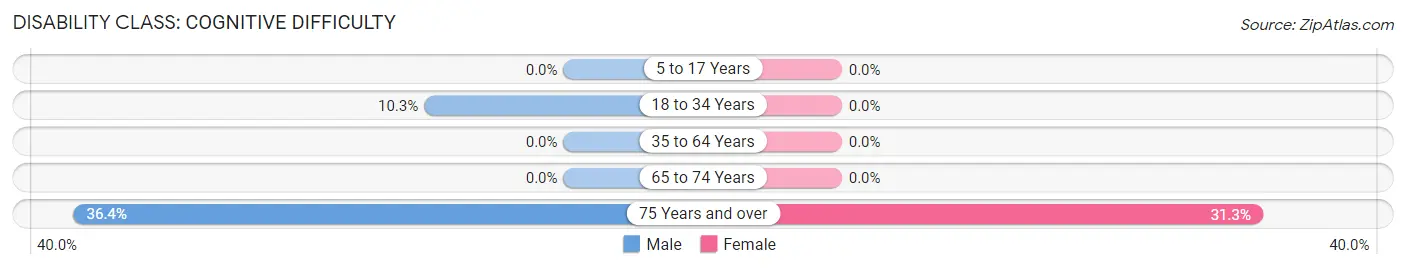
| Age Bracket | Male | Female |
| 5 to 17 Years | 0 (0.0%) | 0 (0.0%) |
| 18 to 34 Years | 3 (10.3%) | 0 (0.0%) |
| 35 to 64 Years | 0 (0.0%) | 0 (0.0%) |
| 65 to 74 Years | 0 (0.0%) | 0 (0.0%) |
| 75 Years and over | 8 (36.4%) | 5 (31.2%) |
Disability Class: Ambulatory Difficulty
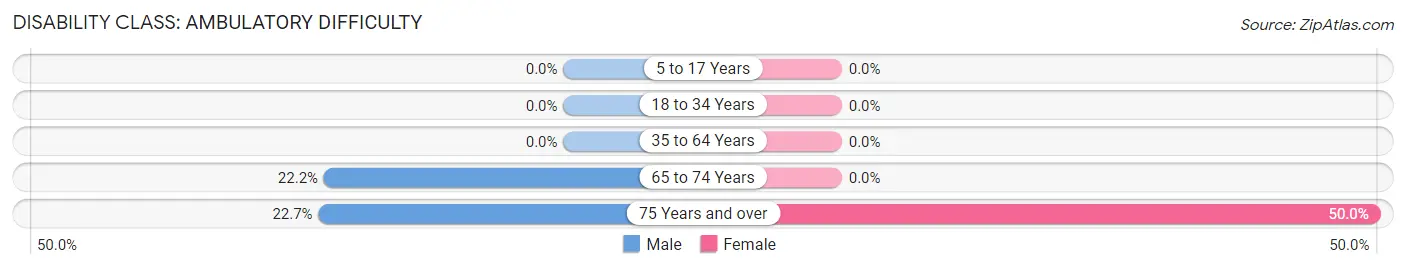
| Age Bracket | Male | Female |
| 5 to 17 Years | 0 (0.0%) | 0 (0.0%) |
| 18 to 34 Years | 0 (0.0%) | 0 (0.0%) |
| 35 to 64 Years | 0 (0.0%) | 0 (0.0%) |
| 65 to 74 Years | 2 (22.2%) | 0 (0.0%) |
| 75 Years and over | 5 (22.7%) | 8 (50.0%) |
Disability Class: Self-Care Difficulty
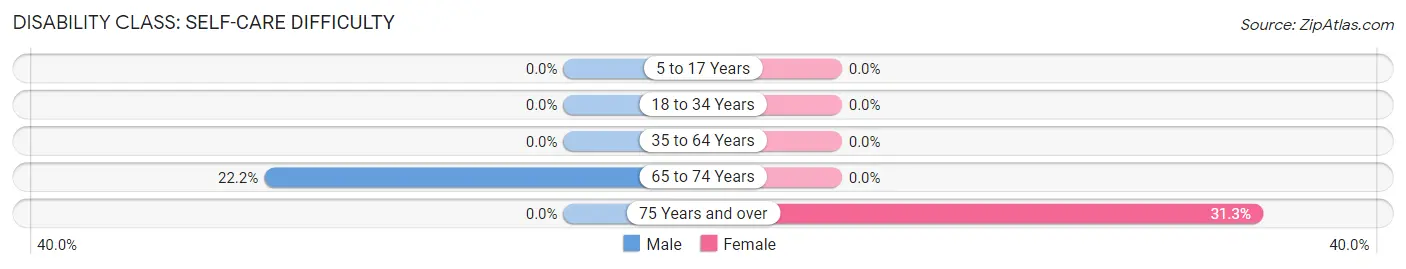
| Age Bracket | Male | Female |
| 5 to 17 Years | 0 (0.0%) | 0 (0.0%) |
| 18 to 34 Years | 0 (0.0%) | 0 (0.0%) |
| 35 to 64 Years | 0 (0.0%) | 0 (0.0%) |
| 65 to 74 Years | 2 (22.2%) | 0 (0.0%) |
| 75 Years and over | 0 (0.0%) | 5 (31.2%) |
Technology Access in McNeal
Computing Device Access in McNeal
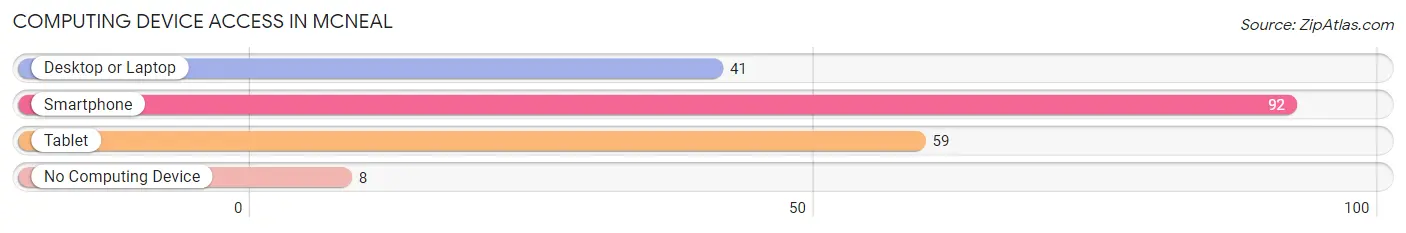
| Device Type | # Households | % Households |
| Desktop or Laptop | 41 | 39.1% |
| Smartphone | 92 | 87.6% |
| Tablet | 59 | 56.2% |
| No Computing Device | 8 | 7.6% |
| Total | 105 | 100.0% |
Internet Access in McNeal
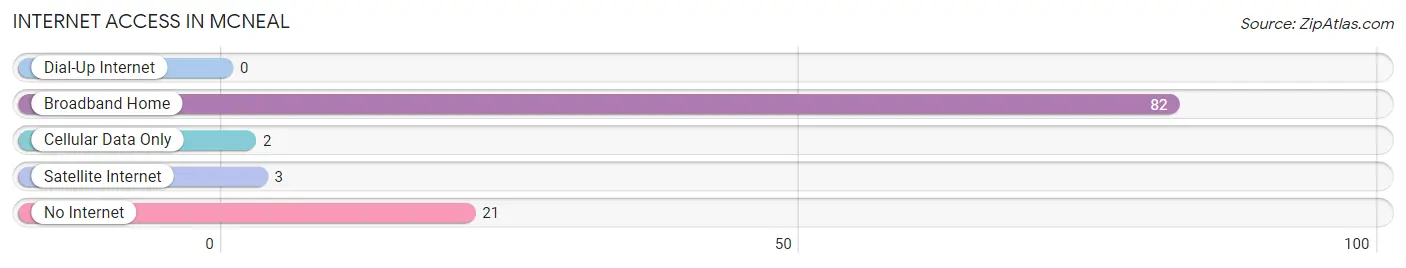
| Internet Type | # Households | % Households |
| Dial-Up Internet | 0 | 0.0% |
| Broadband Home | 82 | 78.1% |
| Cellular Data Only | 2 | 1.9% |
| Satellite Internet | 3 | 2.9% |
| No Internet | 21 | 20.0% |
| Total | 105 | 100.0% |
McNeal Summary
Mcneal, Arizona is a small unincorporated community located in Cochise County, Arizona. It is situated in the San Pedro Valley, approximately 25 miles east of the city of Sierra Vista. The population of Mcneal was estimated to be around 1,000 in 2020.
History
Mcneal was founded in 1881 by a group of settlers from Missouri. The town was named after the Mcneal family, who were among the first settlers. The town was originally a farming community, but it soon became a mining town when silver and copper were discovered in the area. The town grew rapidly and by the early 1900s, it had a population of over 1,000 people.
The town was also home to a number of businesses, including a hotel, a general store, a saloon, and a post office. The town also had a school, which was built in 1883.
Geography
Mcneal is located in the San Pedro Valley, which is part of the Sonoran Desert. The town is situated at an elevation of 4,000 feet above sea level. The climate in Mcneal is arid and hot, with temperatures reaching up to 100 degrees Fahrenheit in the summer months.
The town is surrounded by the Coronado National Forest, which is home to a variety of wildlife, including deer, javelina, and coyotes. The area is also home to a variety of plants, including cacti, mesquite, and creosote bush.
Economy
The economy of Mcneal is largely based on agriculture and mining. The town is home to a number of farms, which produce a variety of crops, including alfalfa, cotton, and wheat. The town is also home to a number of mining operations, which produce copper, silver, and other minerals.
The town is also home to a number of businesses, including a general store, a hotel, and a post office. The town also has a number of restaurants, which serve a variety of local and international cuisine.
Demographics
The population of Mcneal was estimated to be around 1,000 in 2020. The town is predominantly white, with a small Hispanic population. The median household income in Mcneal is $35,000, which is lower than the national average. The town has a high poverty rate, with over 25% of the population living below the poverty line.
Mcneal is a small, rural community with a rich history and a unique culture. The town is home to a variety of businesses and attractions, which make it an ideal destination for visitors looking to explore the area. The town is also home to a number of farms and mining operations, which provide employment opportunities for the local population.
Common Questions
What is Per Capita Income in McNeal?
Per Capita income in McNeal is $31,638.
What is the Median Family Income in McNeal?
Median Family Income in McNeal is $78,594.
What is the Median Household income in McNeal?
Median Household Income in McNeal is $74,063.
What is Income or Wage Gap in McNeal?
Income or Wage Gap in McNeal is 21.0%.
Women in McNeal earn 79.0 cents for every dollar earned by a man.
What is Inequality or Gini Index in McNeal?
Inequality or Gini Index in McNeal is 0.30.
What is the Total Population of McNeal?
Total Population of McNeal is 180.
What is the Total Male Population of McNeal?
Total Male Population of McNeal is 87.
What is the Total Female Population of McNeal?
Total Female Population of McNeal is 93.
What is the Ratio of Males per 100 Females in McNeal?
There are 93.55 Males per 100 Females in McNeal.
What is the Ratio of Females per 100 Males in McNeal?
There are 106.90 Females per 100 Males in McNeal.
What is the Median Population Age in McNeal?
Median Population Age in McNeal is 43.0 Years.
What is the Average Family Size in McNeal
Average Family Size in McNeal is 2.1 People.
What is the Average Household Size in McNeal
Average Household Size in McNeal is 1.7 People.
How Large is the Labor Force in McNeal?
There are 51 People in the Labor Forcein in McNeal.
What is the Percentage of People in the Labor Force in McNeal?
30.5% of People are in the Labor Force in McNeal.
What is the Unemployment Rate in McNeal?
Unemployment Rate in McNeal is 3.9%.