Weston, FL Map & Demographics
Weston Map
Weston Overview
$54,943
PER CAPITA INCOME
$137,145
AVG FAMILY INCOME
$132,832
AVG HOUSEHOLD INCOME
46.0%
WAGE / INCOME GAP [ % ]
54.0¢/ $1
WAGE / INCOME GAP [ $ ]
$9,874
FAMILY INCOME DEFICIT
0.44
INEQUALITY / GINI INDEX
68,029
TOTAL POPULATION
33,361
MALE POPULATION
34,668
FEMALE POPULATION
96.23
MALES / 100 FEMALES
103.92
FEMALES / 100 MALES
41.1
MEDIAN AGE
3.4
AVG FAMILY SIZE
3.2
AVG HOUSEHOLD SIZE
33,551
LABOR FORCE [ PEOPLE ]
64.9%
PERCENT IN LABOR FORCE
3.6%
UNEMPLOYMENT RATE
Income in Weston
Income Overview in Weston
Per Capita Income in Weston is $54,943, while median incomes of families and households are $137,145 and $132,832 respectively.
| Characteristic | Number | Measure |
| Per Capita Income | 68,029 | $54,943 |
| Median Family Income | 18,903 | $137,145 |
| Mean Family Income | 18,903 | $183,214 |
| Median Household Income | 21,085 | $132,832 |
| Mean Household Income | 21,085 | $174,486 |
| Income Deficit | 18,903 | $9,874 |
| Wage / Income Gap (%) | 68,029 | 46.03% |
| Wage / Income Gap ($) | 68,029 | 53.97¢ per $1 |
| Gini / Inequality Index | 68,029 | 0.44 |
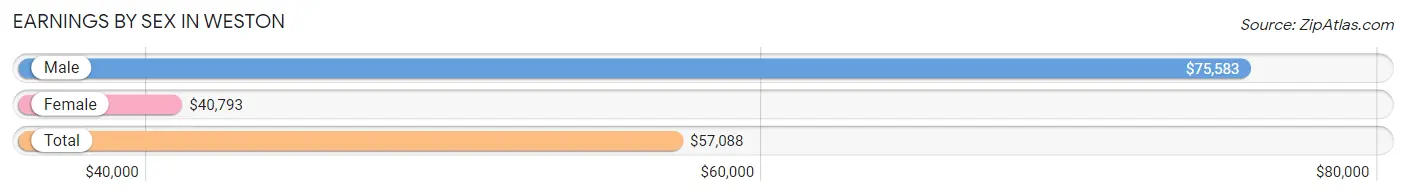
Earnings by Sex in Weston
Average Earnings in Weston are $57,088, $75,583 for men and $40,793 for women, a difference of 46.0%.
| Sex | Number | Average Earnings |
| Male | 19,075 (54.9%) | $75,583 |
| Female | 15,661 (45.1%) | $40,793 |
| Total | 34,736 (100.0%) | $57,088 |
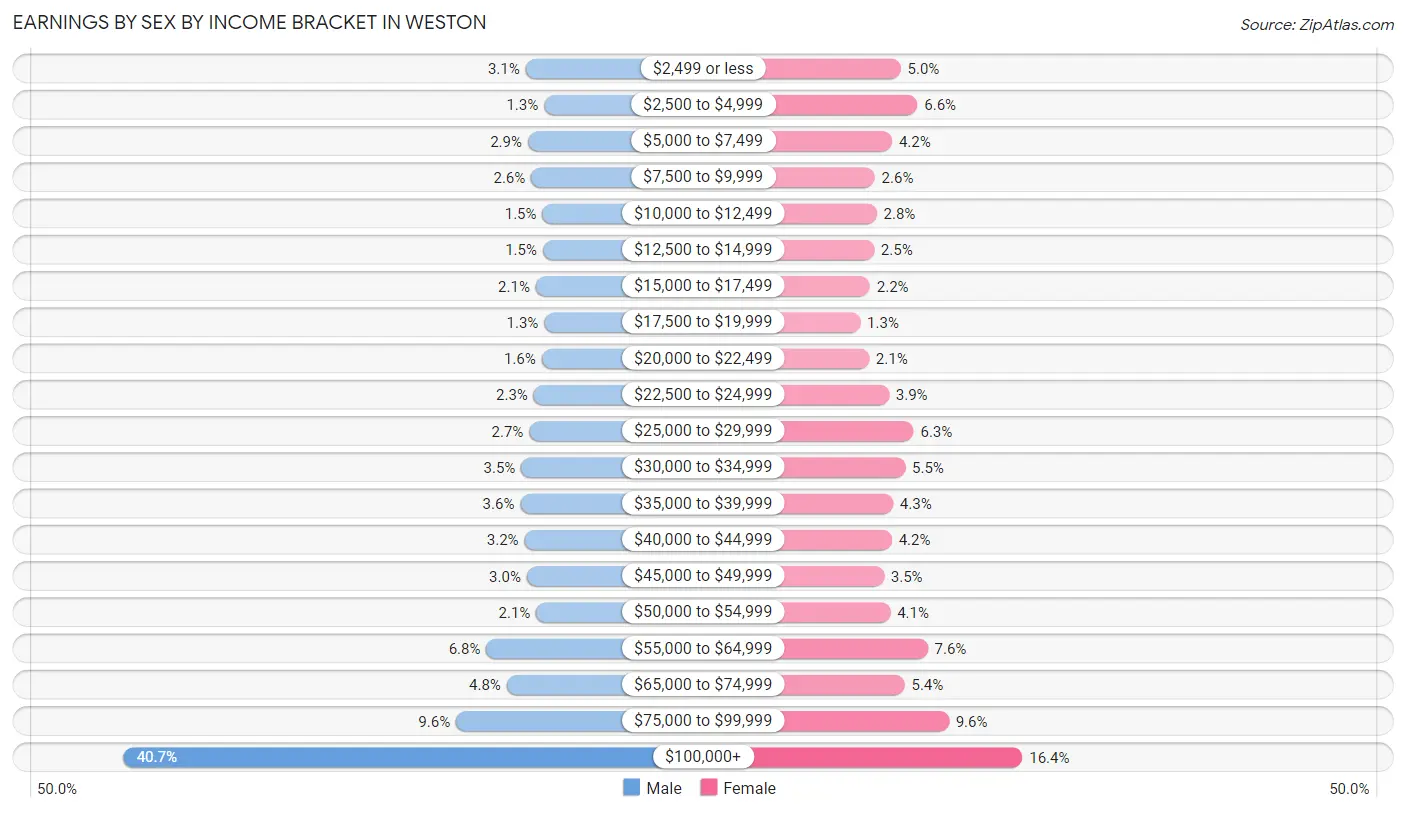
Earnings by Sex by Income Bracket in Weston
The most common earnings brackets in Weston are $100,000+ for men (7,766 | 40.7%) and $100,000+ for women (2,574 | 16.4%).
| Income | Male | Female |
| $2,499 or less | 585 (3.1%) | 789 (5.0%) |
| $2,500 to $4,999 | 255 (1.3%) | 1,035 (6.6%) |
| $5,000 to $7,499 | 545 (2.9%) | 662 (4.2%) |
| $7,500 to $9,999 | 487 (2.5%) | 408 (2.6%) |
| $10,000 to $12,499 | 286 (1.5%) | 437 (2.8%) |
| $12,500 to $14,999 | 278 (1.5%) | 398 (2.5%) |
| $15,000 to $17,499 | 404 (2.1%) | 339 (2.2%) |
| $17,500 to $19,999 | 254 (1.3%) | 196 (1.3%) |
| $20,000 to $22,499 | 299 (1.6%) | 324 (2.1%) |
| $22,500 to $24,999 | 441 (2.3%) | 617 (3.9%) |
| $25,000 to $29,999 | 521 (2.7%) | 979 (6.2%) |
| $30,000 to $34,999 | 663 (3.5%) | 855 (5.5%) |
| $35,000 to $39,999 | 681 (3.6%) | 677 (4.3%) |
| $40,000 to $44,999 | 607 (3.2%) | 660 (4.2%) |
| $45,000 to $49,999 | 565 (3.0%) | 543 (3.5%) |
| $50,000 to $54,999 | 397 (2.1%) | 638 (4.1%) |
| $55,000 to $64,999 | 1,288 (6.8%) | 1,186 (7.6%) |
| $65,000 to $74,999 | 923 (4.8%) | 848 (5.4%) |
| $75,000 to $99,999 | 1,830 (9.6%) | 1,496 (9.6%) |
| $100,000+ | 7,766 (40.7%) | 2,574 (16.4%) |
| Total | 19,075 (100.0%) | 15,661 (100.0%) |
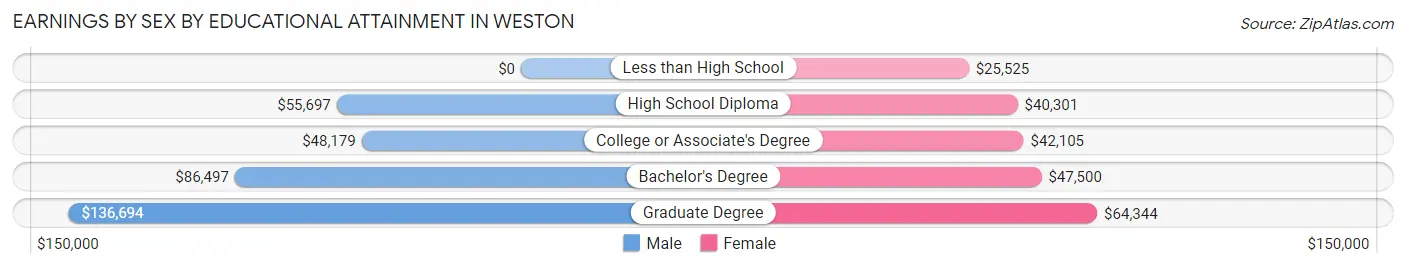
Earnings by Sex by Educational Attainment in Weston
Average earnings in Weston are $88,174 for men and $49,410 for women, a difference of 44.0%. Men with an educational attainment of graduate degree enjoy the highest average annual earnings of $136,694, while those with college or associate's degree education earn the least with $48,179. Women with an educational attainment of graduate degree earn the most with the average annual earnings of $64,344, while those with less than high school education have the smallest earnings of $25,525.
| Educational Attainment | Male Income | Female Income |
| Less than High School | - | - |
| High School Diploma | $55,697 | $40,301 |
| College or Associate's Degree | $48,179 | $42,105 |
| Bachelor's Degree | $86,497 | $47,500 |
| Graduate Degree | $136,694 | $64,344 |
| Total | $88,174 | $49,410 |
Family Income in Weston
Family Income Brackets in Weston
According to the Weston family income data, there are 6,049 families falling into the $200,000+ income range, which is the most common income bracket and makes up 32.0% of all families. Conversely, the $10,000 to $14,999 income bracket is the least frequent group with only 208 families (1.1%) belonging to this category.
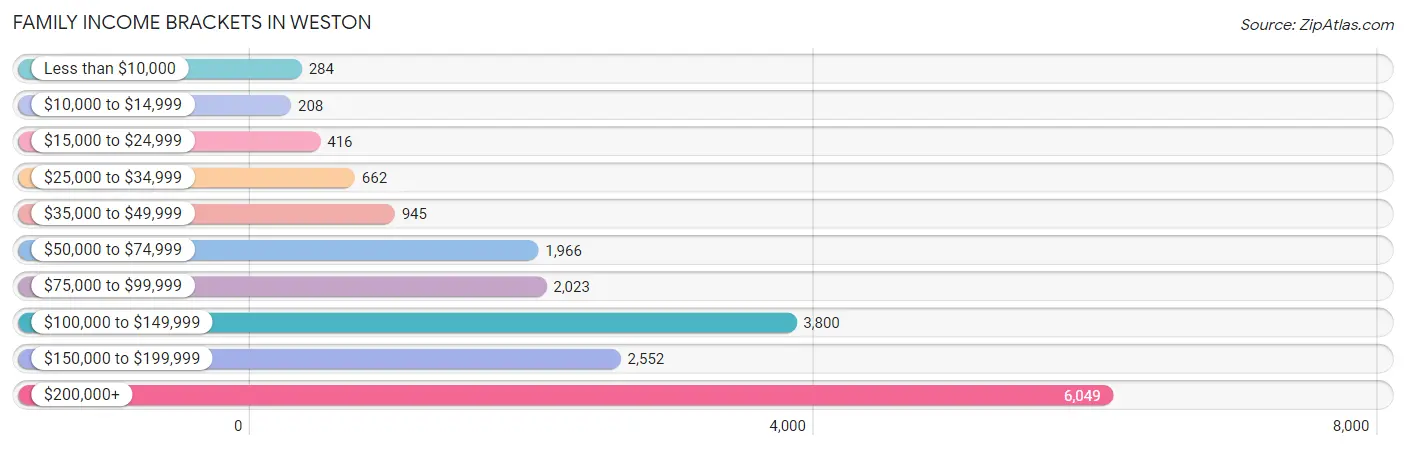
| Income Bracket | # Families | % Families |
| Less than $10,000 | 284 | 1.5% |
| $10,000 to $14,999 | 208 | 1.1% |
| $15,000 to $24,999 | 416 | 2.2% |
| $25,000 to $34,999 | 662 | 3.5% |
| $35,000 to $49,999 | 945 | 5.0% |
| $50,000 to $74,999 | 1,966 | 10.4% |
| $75,000 to $99,999 | 2,023 | 10.7% |
| $100,000 to $149,999 | 3,800 | 20.1% |
| $150,000 to $199,999 | 2,552 | 13.5% |
| $200,000+ | 6,049 | 32.0% |
Family Income by Famaliy Size in Weston
7+ person families (215 | 1.1%) account for the highest median family income in Weston with $250,001 per family, while 2-person families (5,676 | 30.0%) have the highest median income of $61,955 per family member.
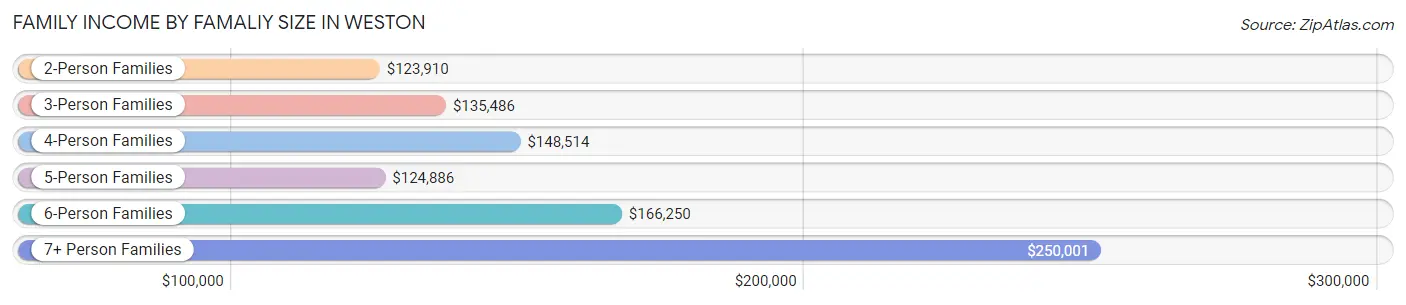
| Income Bracket | # Families | Median Income |
| 2-Person Families | 5,676 (30.0%) | $123,910 |
| 3-Person Families | 4,485 (23.7%) | $135,486 |
| 4-Person Families | 5,990 (31.7%) | $148,514 |
| 5-Person Families | 2,172 (11.5%) | $124,886 |
| 6-Person Families | 365 (1.9%) | $166,250 |
| 7+ Person Families | 215 (1.1%) | $250,001 |
| Total | 18,903 (100.0%) | $137,145 |
Family Income by Number of Earners in Weston
The median family income in Weston is $137,145, with families comprising 2 earners (8,190) having the highest median family income of $153,420, while families with no earners (1,813) have the lowest median family income of $61,450, accounting for 43.3% and 9.6% of families, respectively.
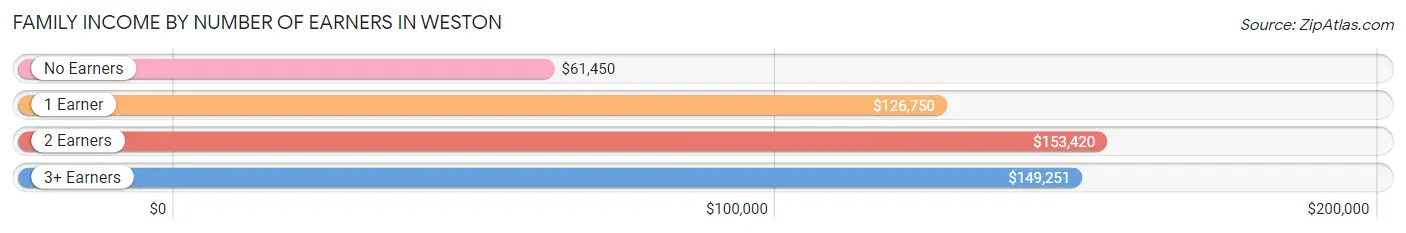
| Number of Earners | # Families | Median Income |
| No Earners | 1,813 (9.6%) | $61,450 |
| 1 Earner | 6,070 (32.1%) | $126,750 |
| 2 Earners | 8,190 (43.3%) | $153,420 |
| 3+ Earners | 2,830 (15.0%) | $149,251 |
| Total | 18,903 (100.0%) | $137,145 |
Household Income in Weston
Household Income Brackets in Weston
With 6,262 households falling in the category, the $200,000+ income range is the most frequent in Weston, accounting for 29.7% of all households. In contrast, only 295 households (1.4%) fall into the $10,000 to $14,999 income bracket, making it the least populous group.
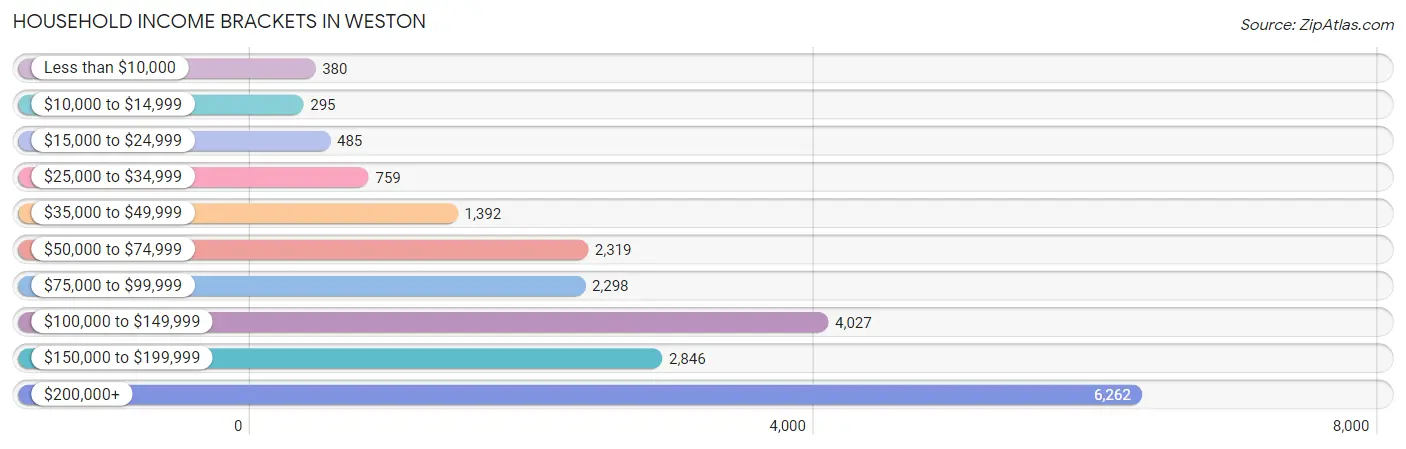
| Income Bracket | # Households | % Households |
| Less than $10,000 | 380 | 1.8% |
| $10,000 to $14,999 | 295 | 1.4% |
| $15,000 to $24,999 | 485 | 2.3% |
| $25,000 to $34,999 | 759 | 3.6% |
| $35,000 to $49,999 | 1,392 | 6.6% |
| $50,000 to $74,999 | 2,319 | 11.0% |
| $75,000 to $99,999 | 2,298 | 10.9% |
| $100,000 to $149,999 | 4,027 | 19.1% |
| $150,000 to $199,999 | 2,846 | 13.5% |
| $200,000+ | 6,262 | 29.7% |
Household Income by Householder Age in Weston
The median household income in Weston is $132,832, with the highest median household income of $147,688 found in the 45 to 64 years age bracket for the primary householder. A total of 11,916 households (56.5%) fall into this category. Meanwhile, the 15 to 24 years age bracket for the primary householder has the lowest median household income of $0, with 131 households (0.6%) in this group.
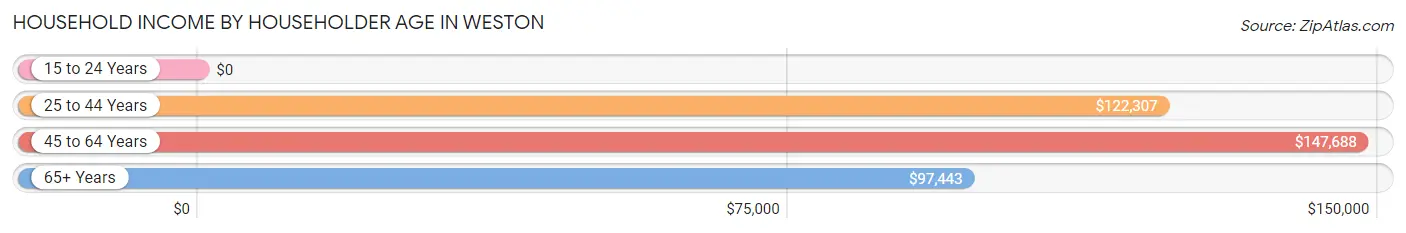
| Income Bracket | # Households | Median Income |
| 15 to 24 Years | 131 (0.6%) | $0 |
| 25 to 44 Years | 5,557 (26.4%) | $122,307 |
| 45 to 64 Years | 11,916 (56.5%) | $147,688 |
| 65+ Years | 3,481 (16.5%) | $97,443 |
| Total | 21,085 (100.0%) | $132,832 |
Poverty in Weston
Income Below Poverty by Sex and Age in Weston
With 6.0% poverty level for males and 5.6% for females among the residents of Weston, 75 year old and over males and 16 and 17 year old females are the most vulnerable to poverty, with 225 males (15.7%) and 177 females (12.3%) in their respective age groups living below the poverty level.
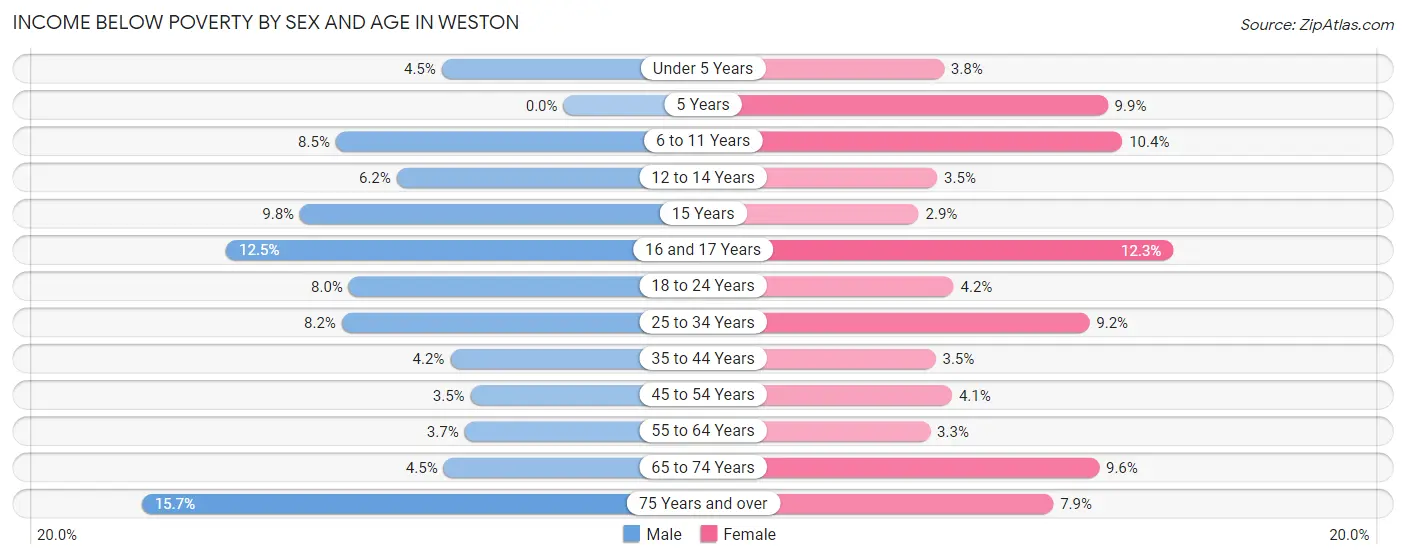
| Age Bracket | Male | Female |
| Under 5 Years | 81 (4.5%) | 68 (3.8%) |
| 5 Years | 0 (0.0%) | 54 (9.9%) |
| 6 to 11 Years | 255 (8.5%) | 270 (10.4%) |
| 12 to 14 Years | 150 (6.2%) | 86 (3.5%) |
| 15 Years | 75 (9.8%) | 18 (2.9%) |
| 16 and 17 Years | 193 (12.5%) | 177 (12.3%) |
| 18 to 24 Years | 210 (8.0%) | 131 (4.2%) |
| 25 to 34 Years | 139 (8.2%) | 222 (9.2%) |
| 35 to 44 Years | 189 (4.2%) | 162 (3.5%) |
| 45 to 54 Years | 223 (3.5%) | 284 (4.1%) |
| 55 to 64 Years | 173 (3.7%) | 136 (3.3%) |
| 65 to 74 Years | 91 (4.4%) | 213 (9.6%) |
| 75 Years and over | 225 (15.7%) | 131 (7.9%) |
| Total | 2,004 (6.0%) | 1,952 (5.6%) |
Income Above Poverty by Sex and Age in Weston
According to the poverty statistics in Weston, males aged 5 years and females aged 15 years are the age groups that are most secure financially, with 100.0% of males and 97.2% of females in these age groups living above the poverty line.
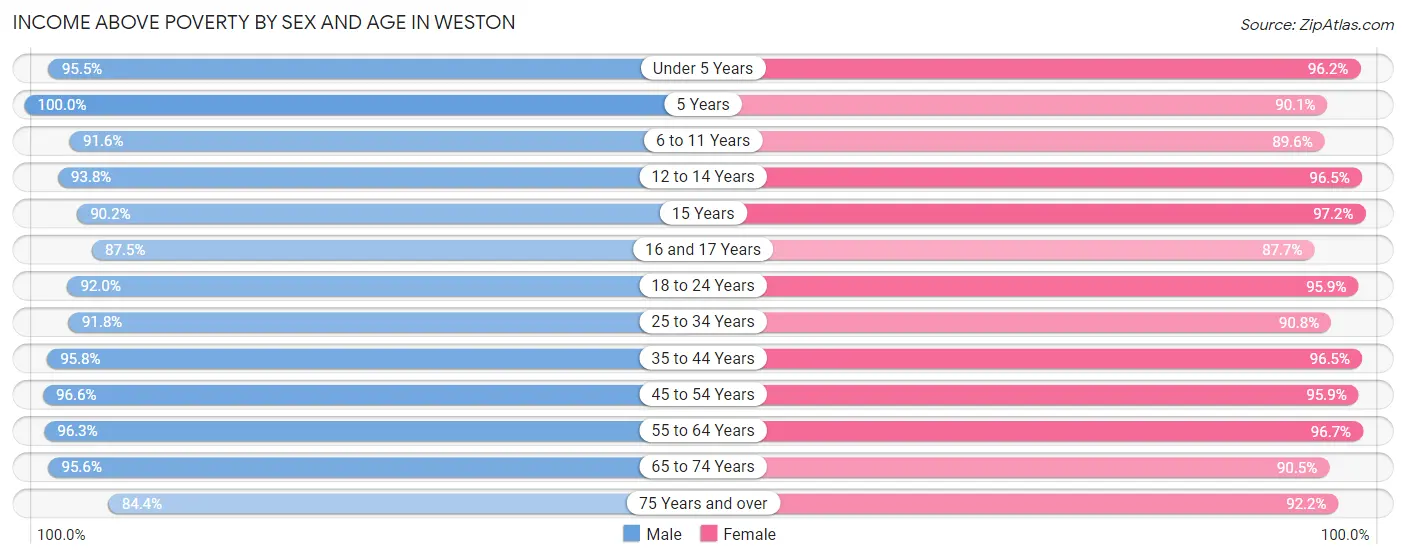
| Age Bracket | Male | Female |
| Under 5 Years | 1,712 (95.5%) | 1,727 (96.2%) |
| 5 Years | 306 (100.0%) | 493 (90.1%) |
| 6 to 11 Years | 2,763 (91.5%) | 2,323 (89.6%) |
| 12 to 14 Years | 2,275 (93.8%) | 2,340 (96.5%) |
| 15 Years | 692 (90.2%) | 614 (97.2%) |
| 16 and 17 Years | 1,348 (87.5%) | 1,262 (87.7%) |
| 18 to 24 Years | 2,425 (92.0%) | 3,029 (95.9%) |
| 25 to 34 Years | 1,549 (91.8%) | 2,193 (90.8%) |
| 35 to 44 Years | 4,312 (95.8%) | 4,499 (96.5%) |
| 45 to 54 Years | 6,240 (96.6%) | 6,665 (95.9%) |
| 55 to 64 Years | 4,537 (96.3%) | 4,016 (96.7%) |
| 65 to 74 Years | 1,954 (95.6%) | 2,017 (90.4%) |
| 75 Years and over | 1,213 (84.4%) | 1,538 (92.1%) |
| Total | 31,326 (94.0%) | 32,716 (94.4%) |
Income Below Poverty Among Married-Couple Families in Weston
The poverty statistics for married-couple families in Weston show that 4.2% or 673 of the total 16,104 families live below the poverty line. Families with 3 or 4 children have the highest poverty rate of 8.4%, comprising of 126 families. On the other hand, families with 5 or more children have the lowest poverty rate of 0.0%, which includes 0 families.
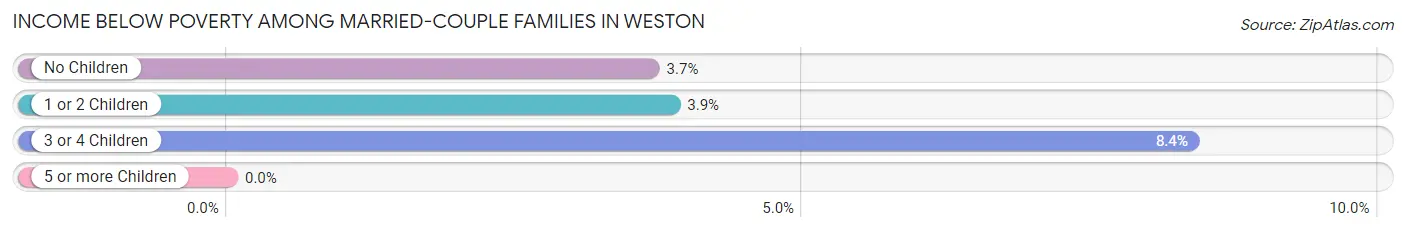
| Children | Above Poverty | Below Poverty |
| No Children | 6,770 (96.3%) | 258 (3.7%) |
| 1 or 2 Children | 7,209 (96.2%) | 289 (3.8%) |
| 3 or 4 Children | 1,379 (91.6%) | 126 (8.4%) |
| 5 or more Children | 73 (100.0%) | 0 (0.0%) |
| Total | 15,431 (95.8%) | 673 (4.2%) |
Income Below Poverty Among Single-Parent Households in Weston
According to the poverty data in Weston, 9.1% or 74 single-father households and 11.9% or 236 single-mother households are living below the poverty line. Among single-father households, those with 1 or 2 children have the highest poverty rate, with 54 households (10.8%) experiencing poverty. Likewise, among single-mother households, those with 3 or 4 children have the highest poverty rate, with 7 households (16.3%) falling below the poverty line.
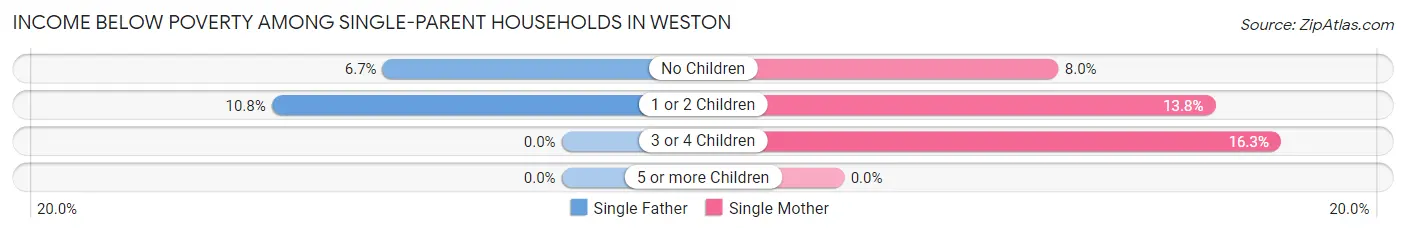
| Children | Single Father | Single Mother |
| No Children | 20 (6.7%) | 55 (8.0%) |
| 1 or 2 Children | 54 (10.8%) | 174 (13.8%) |
| 3 or 4 Children | 0 (0.0%) | 7 (16.3%) |
| 5 or more Children | 0 (0.0%) | 0 (0.0%) |
| Total | 74 (9.1%) | 236 (11.9%) |
Income Below Poverty Among Married-Couple vs Single-Parent Households in Weston
The poverty data for Weston shows that 673 of the married-couple family households (4.2%) and 310 of the single-parent households (11.1%) are living below the poverty level. Within the married-couple family households, those with 3 or 4 children have the highest poverty rate, with 126 households (8.4%) falling below the poverty line. Among the single-parent households, those with 3 or 4 children have the highest poverty rate, with 7 household (13.2%) living below poverty.
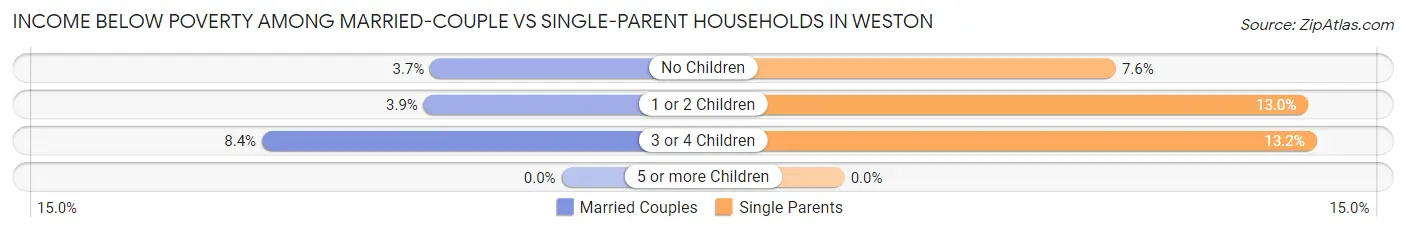
| Children | Married-Couple Families | Single-Parent Households |
| No Children | 258 (3.7%) | 75 (7.6%) |
| 1 or 2 Children | 289 (3.8%) | 228 (13.0%) |
| 3 or 4 Children | 126 (8.4%) | 7 (13.2%) |
| 5 or more Children | 0 (0.0%) | 0 (0.0%) |
| Total | 673 (4.2%) | 310 (11.1%) |
Race in Weston
The most populous races in Weston are White / Caucasian (37,407 | 55.0%), Hispanic or Latino (37,161 | 54.6%), and Two or more Races (19,930 | 29.3%).
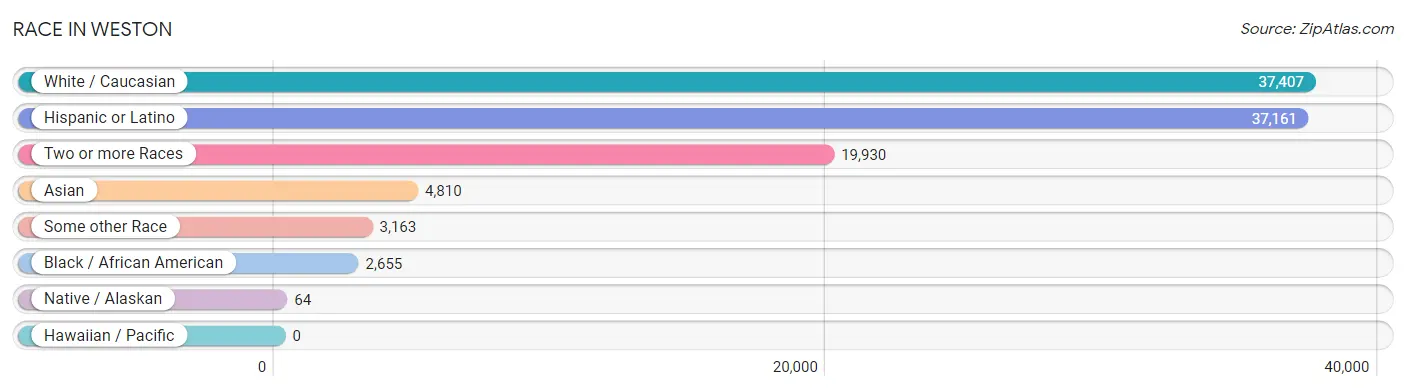
| Race | # Population | % Population |
| Asian | 4,810 | 7.1% |
| Black / African American | 2,655 | 3.9% |
| Hawaiian / Pacific | 0 | 0.0% |
| Hispanic or Latino | 37,161 | 54.6% |
| Native / Alaskan | 64 | 0.1% |
| White / Caucasian | 37,407 | 55.0% |
| Two or more Races | 19,930 | 29.3% |
| Some other Race | 3,163 | 4.6% |
| Total | 68,029 | 100.0% |
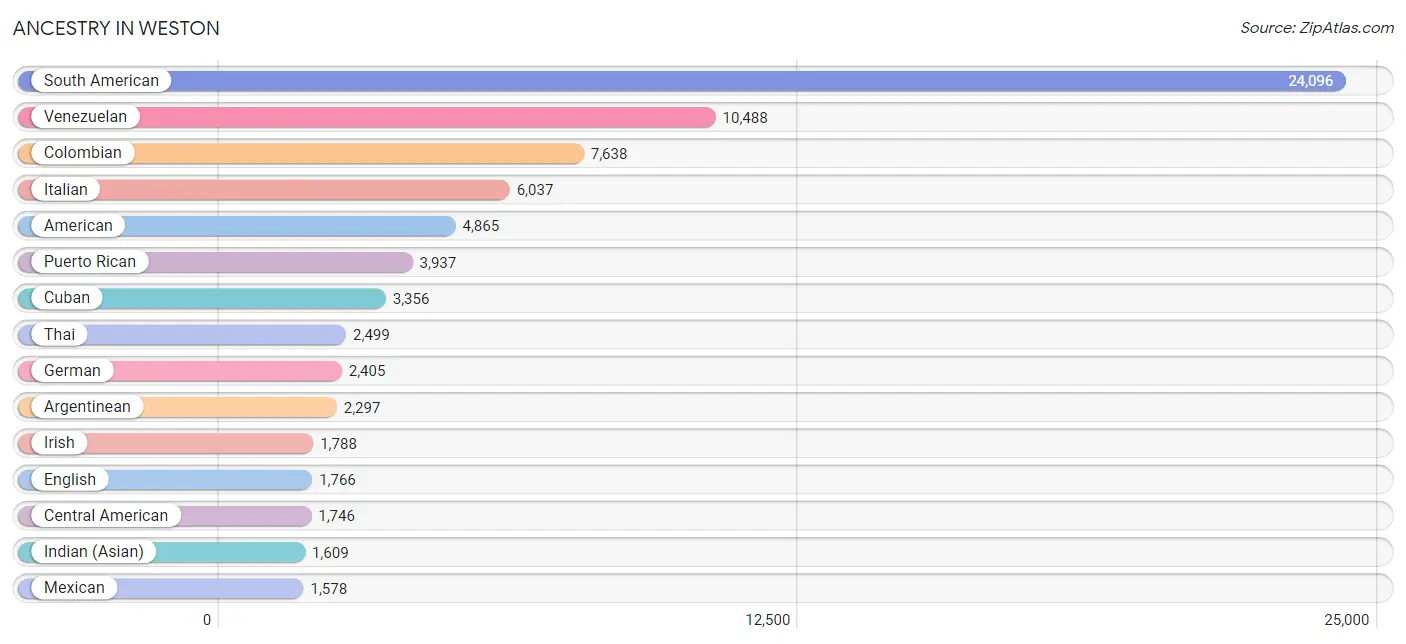
Ancestry in Weston
The most populous ancestries reported in Weston are South American (24,096 | 35.4%), Venezuelan (10,488 | 15.4%), Colombian (7,638 | 11.2%), Italian (6,037 | 8.9%), and American (4,865 | 7.1%), together accounting for 78.1% of all Weston residents.
| Ancestry | # Population | % Population |
| African | 105 | 0.2% |
| American | 4,865 | 7.1% |
| Arab | 530 | 0.8% |
| Argentinean | 2,297 | 3.4% |
| Armenian | 77 | 0.1% |
| Austrian | 264 | 0.4% |
| Bahamian | 17 | 0.0% |
| Basque | 8 | 0.0% |
| Belgian | 72 | 0.1% |
| Bhutanese | 66 | 0.1% |
| Bolivian | 150 | 0.2% |
| Brazilian | 705 | 1.0% |
| British | 499 | 0.7% |
| Bulgarian | 52 | 0.1% |
| Burmese | 289 | 0.4% |
| Canadian | 104 | 0.2% |
| Central American | 1,746 | 2.6% |
| Central American Indian | 24 | 0.0% |
| Cherokee | 15 | 0.0% |
| Chilean | 756 | 1.1% |
| Colombian | 7,638 | 11.2% |
| Costa Rican | 407 | 0.6% |
| Croatian | 9 | 0.0% |
| Cuban | 3,356 | 4.9% |
| Czech | 123 | 0.2% |
| Danish | 5 | 0.0% |
| Dominican | 935 | 1.4% |
| Dutch | 190 | 0.3% |
| Eastern European | 601 | 0.9% |
| Ecuadorian | 674 | 1.0% |
| Egyptian | 13 | 0.0% |
| English | 1,766 | 2.6% |
| European | 896 | 1.3% |
| Filipino | 103 | 0.2% |
| Finnish | 27 | 0.0% |
| French | 793 | 1.2% |
| French Canadian | 86 | 0.1% |
| German | 2,405 | 3.5% |
| Greek | 369 | 0.5% |
| Guatemalan | 176 | 0.3% |
| Guyanese | 34 | 0.1% |
| Haitian | 230 | 0.3% |
| Honduran | 449 | 0.7% |
| Hungarian | 323 | 0.5% |
| Indian (Asian) | 1,609 | 2.4% |
| Iranian | 99 | 0.2% |
| Irish | 1,788 | 2.6% |
| Israeli | 187 | 0.3% |
| Italian | 6,037 | 8.9% |
| Jamaican | 578 | 0.9% |
| Korean | 125 | 0.2% |
| Laotian | 89 | 0.1% |
| Lebanese | 299 | 0.4% |
| Lithuanian | 139 | 0.2% |
| Macedonian | 11 | 0.0% |
| Mexican | 1,578 | 2.3% |
| Mongolian | 49 | 0.1% |
| Moroccan | 21 | 0.0% |
| Nicaraguan | 248 | 0.4% |
| Nigerian | 35 | 0.1% |
| Norwegian | 111 | 0.2% |
| Pakistani | 81 | 0.1% |
| Palestinian | 63 | 0.1% |
| Panamanian | 88 | 0.1% |
| Paraguayan | 453 | 0.7% |
| Peruvian | 1,376 | 2.0% |
| Polish | 1,092 | 1.6% |
| Portuguese | 902 | 1.3% |
| Potawatomi | 218 | 0.3% |
| Puerto Rican | 3,937 | 5.8% |
| Romanian | 213 | 0.3% |
| Russian | 1,152 | 1.7% |
| Salvadoran | 378 | 0.6% |
| Scandinavian | 41 | 0.1% |
| Scotch-Irish | 125 | 0.2% |
| Scottish | 321 | 0.5% |
| Serbian | 14 | 0.0% |
| Sierra Leonean | 17 | 0.0% |
| Slavic | 10 | 0.0% |
| Slovak | 18 | 0.0% |
| South American | 24,096 | 35.4% |
| South American Indian | 32 | 0.1% |
| Spaniard | 565 | 0.8% |
| Spanish | 187 | 0.3% |
| Sri Lankan | 53 | 0.1% |
| Subsaharan African | 157 | 0.2% |
| Swedish | 253 | 0.4% |
| Swiss | 4 | 0.0% |
| Syrian | 34 | 0.1% |
| Thai | 2,499 | 3.7% |
| Trinidadian and Tobagonian | 33 | 0.1% |
| Turkish | 205 | 0.3% |
| Ukrainian | 137 | 0.2% |
| Uruguayan | 176 | 0.3% |
| Venezuelan | 10,488 | 15.4% |
| Welsh | 151 | 0.2% |
| West Indian | 59 | 0.1% |
| Yugoslavian | 8 | 0.0% | View All 98 Rows |
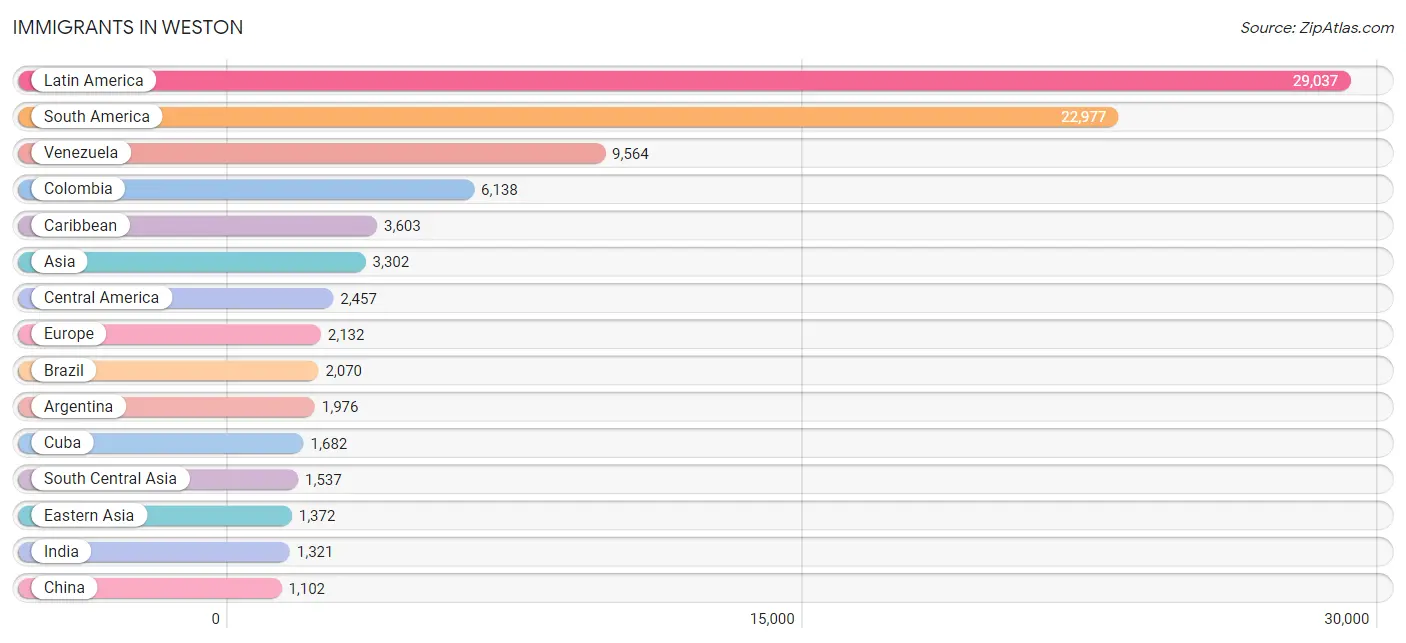
Immigrants in Weston
The most numerous immigrant groups reported in Weston came from Latin America (29,037 | 42.7%), South America (22,977 | 33.8%), Venezuela (9,564 | 14.1%), Colombia (6,138 | 9.0%), and Caribbean (3,603 | 5.3%), together accounting for 104.8% of all Weston residents.
| Immigration Origin | # Population | % Population |
| Africa | 63 | 0.1% |
| Argentina | 1,976 | 2.9% |
| Asia | 3,302 | 4.9% |
| Australia | 64 | 0.1% |
| Austria | 41 | 0.1% |
| Bahamas | 217 | 0.3% |
| Bolivia | 150 | 0.2% |
| Brazil | 2,070 | 3.0% |
| Bulgaria | 52 | 0.1% |
| Cameroon | 19 | 0.0% |
| Canada | 437 | 0.6% |
| Caribbean | 3,603 | 5.3% |
| Central America | 2,457 | 3.6% |
| Chile | 816 | 1.2% |
| China | 1,102 | 1.6% |
| Colombia | 6,138 | 9.0% |
| Congo | 10 | 0.0% |
| Costa Rica | 340 | 0.5% |
| Cuba | 1,682 | 2.5% |
| Dominican Republic | 733 | 1.1% |
| Eastern Asia | 1,372 | 2.0% |
| Eastern Europe | 244 | 0.4% |
| Ecuador | 442 | 0.6% |
| Egypt | 13 | 0.0% |
| El Salvador | 237 | 0.4% |
| England | 71 | 0.1% |
| Europe | 2,132 | 3.1% |
| France | 105 | 0.2% |
| Germany | 154 | 0.2% |
| Greece | 21 | 0.0% |
| Guatemala | 158 | 0.2% |
| Guyana | 92 | 0.1% |
| Haiti | 231 | 0.3% |
| Honduras | 444 | 0.6% |
| Hong Kong | 51 | 0.1% |
| Hungary | 28 | 0.0% |
| India | 1,321 | 1.9% |
| Iran | 52 | 0.1% |
| Ireland | 46 | 0.1% |
| Israel | 113 | 0.2% |
| Italy | 471 | 0.7% |
| Jamaica | 627 | 0.9% |
| Korea | 270 | 0.4% |
| Latin America | 29,037 | 42.7% |
| Lebanon | 52 | 0.1% |
| Malaysia | 24 | 0.0% |
| Mexico | 1,047 | 1.5% |
| Middle Africa | 29 | 0.0% |
| Morocco | 21 | 0.0% |
| Netherlands | 73 | 0.1% |
| Nicaragua | 178 | 0.3% |
| North Macedonia | 7 | 0.0% |
| Northern Africa | 34 | 0.1% |
| Northern Europe | 533 | 0.8% |
| Norway | 15 | 0.0% |
| Oceania | 64 | 0.1% |
| Pakistan | 106 | 0.2% |
| Panama | 53 | 0.1% |
| Peru | 1,048 | 1.5% |
| Philippines | 38 | 0.1% |
| Poland | 76 | 0.1% |
| Portugal | 47 | 0.1% |
| Romania | 19 | 0.0% |
| Russia | 8 | 0.0% |
| Saudi Arabia | 8 | 0.0% |
| South America | 22,977 | 33.8% |
| South Central Asia | 1,537 | 2.3% |
| South Eastern Asia | 149 | 0.2% |
| Southern Europe | 760 | 1.1% |
| Spain | 221 | 0.3% |
| Sweden | 8 | 0.0% |
| Switzerland | 15 | 0.0% |
| Taiwan | 187 | 0.3% |
| Thailand | 54 | 0.1% |
| Trinidad and Tobago | 73 | 0.1% |
| Turkey | 25 | 0.0% |
| Ukraine | 24 | 0.0% |
| Uruguay | 161 | 0.2% |
| Venezuela | 9,564 | 14.1% |
| Vietnam | 33 | 0.1% |
| West Indies | 40 | 0.1% |
| Western Asia | 244 | 0.4% |
| Western Europe | 388 | 0.6% | View All 83 Rows |
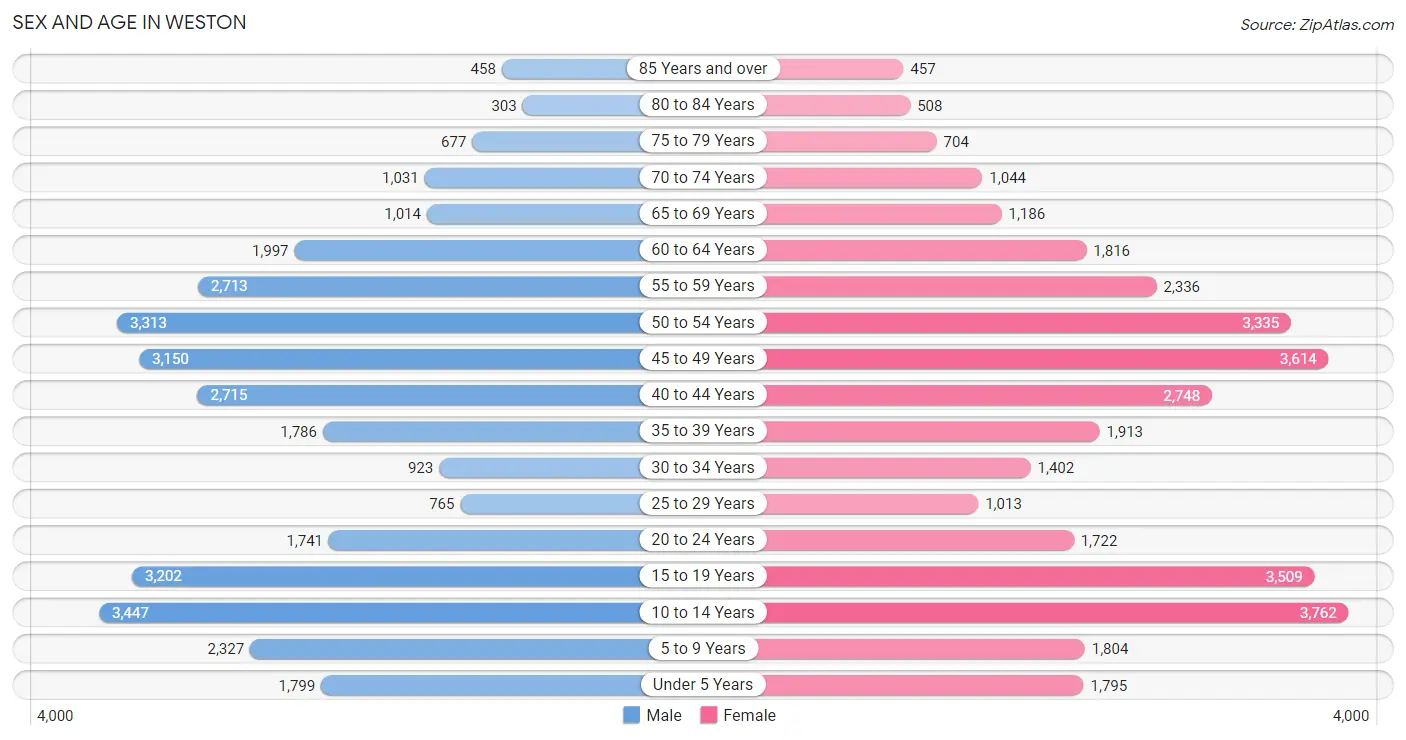
Sex and Age in Weston
Sex and Age in Weston
The most populous age groups in Weston are 10 to 14 Years (3,447 | 10.3%) for men and 10 to 14 Years (3,762 | 10.8%) for women.
| Age Bracket | Male | Female |
| Under 5 Years | 1,799 (5.4%) | 1,795 (5.2%) |
| 5 to 9 Years | 2,327 (7.0%) | 1,804 (5.2%) |
| 10 to 14 Years | 3,447 (10.3%) | 3,762 (10.8%) |
| 15 to 19 Years | 3,202 (9.6%) | 3,509 (10.1%) |
| 20 to 24 Years | 1,741 (5.2%) | 1,722 (5.0%) |
| 25 to 29 Years | 765 (2.3%) | 1,013 (2.9%) |
| 30 to 34 Years | 923 (2.8%) | 1,402 (4.0%) |
| 35 to 39 Years | 1,786 (5.3%) | 1,913 (5.5%) |
| 40 to 44 Years | 2,715 (8.1%) | 2,748 (7.9%) |
| 45 to 49 Years | 3,150 (9.4%) | 3,614 (10.4%) |
| 50 to 54 Years | 3,313 (9.9%) | 3,335 (9.6%) |
| 55 to 59 Years | 2,713 (8.1%) | 2,336 (6.7%) |
| 60 to 64 Years | 1,997 (6.0%) | 1,816 (5.2%) |
| 65 to 69 Years | 1,014 (3.0%) | 1,186 (3.4%) |
| 70 to 74 Years | 1,031 (3.1%) | 1,044 (3.0%) |
| 75 to 79 Years | 677 (2.0%) | 704 (2.0%) |
| 80 to 84 Years | 303 (0.9%) | 508 (1.5%) |
| 85 Years and over | 458 (1.4%) | 457 (1.3%) |
| Total | 33,361 (100.0%) | 34,668 (100.0%) |
Families and Households in Weston
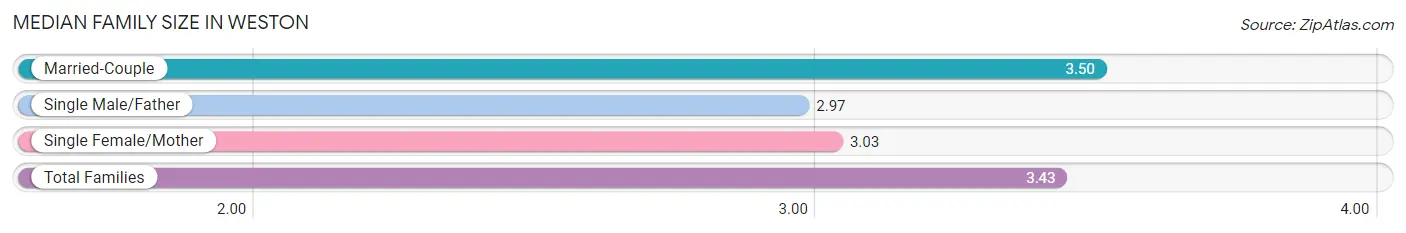
Median Family Size in Weston
The median family size in Weston is 3.43 persons per family, with married-couple families (16,104 | 85.2%) accounting for the largest median family size of 3.5 persons per family. On the other hand, single male/father families (810 | 4.3%) represent the smallest median family size with 2.97 persons per family.
| Family Type | # Families | Family Size |
| Married-Couple | 16,104 (85.2%) | 3.50 |
| Single Male/Father | 810 (4.3%) | 2.97 |
| Single Female/Mother | 1,989 (10.5%) | 3.03 |
| Total Families | 18,903 (100.0%) | 3.43 |
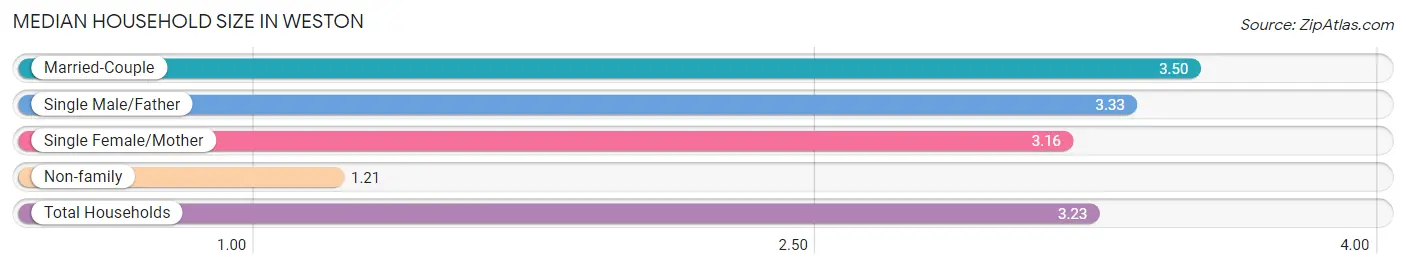
Median Household Size in Weston
The median household size in Weston is 3.23 persons per household, with married-couple households (16,104 | 76.4%) accounting for the largest median household size of 3.5 persons per household. non-family households (2,182 | 10.3%) represent the smallest median household size with 1.21 persons per household.
| Household Type | # Households | Household Size |
| Married-Couple | 16,104 (76.4%) | 3.50 |
| Single Male/Father | 810 (3.8%) | 3.33 |
| Single Female/Mother | 1,989 (9.4%) | 3.16 |
| Non-family | 2,182 (10.3%) | 1.21 |
| Total Households | 21,085 (100.0%) | 3.23 |
Household Size by Marriage Status in Weston
Out of a total of 21,085 households in Weston, 18,903 (89.6%) are family households, while 2,182 (10.3%) are nonfamily households. The most numerous type of family households are 4-person households, comprising 6,179, and the most common type of nonfamily households are 1-person households, comprising 1,812.
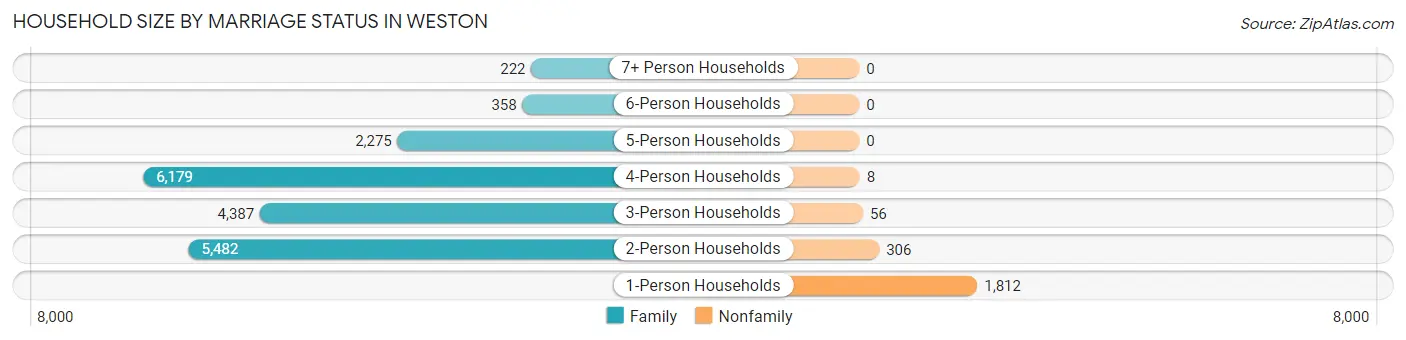
| Household Size | Family Households | Nonfamily Households |
| 1-Person Households | - | 1,812 (8.6%) |
| 2-Person Households | 5,482 (26.0%) | 306 (1.5%) |
| 3-Person Households | 4,387 (20.8%) | 56 (0.3%) |
| 4-Person Households | 6,179 (29.3%) | 8 (0.0%) |
| 5-Person Households | 2,275 (10.8%) | 0 (0.0%) |
| 6-Person Households | 358 (1.7%) | 0 (0.0%) |
| 7+ Person Households | 222 (1.1%) | 0 (0.0%) |
| Total | 18,903 (89.6%) | 2,182 (10.3%) |
Female Fertility in Weston
Fertility by Age in Weston
Average fertility rate in Weston is 33.0 births per 1,000 women. Women in the age bracket of 20 to 34 years have the highest fertility rate with 80.0 births per 1,000 women. Women in the age bracket of 20 to 34 years acount for 61.0% of all women with births.
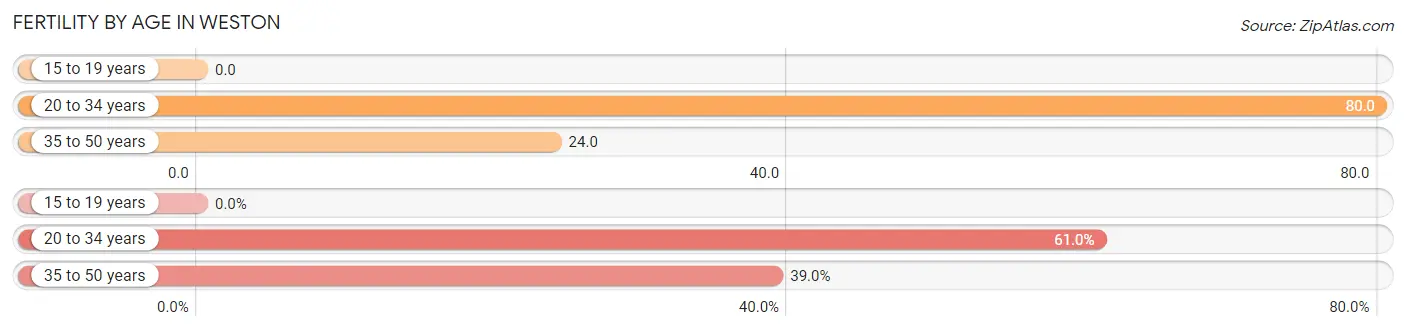
| Age Bracket | Women with Births | Births / 1,000 Women |
| 15 to 19 years | 0 (0.0%) | 0.0 |
| 20 to 34 years | 331 (61.0%) | 80.0 |
| 35 to 50 years | 212 (39.0%) | 24.0 |
| Total | 543 (100.0%) | 33.0 |
Fertility by Age by Marriage Status in Weston
89.3% of women with births (543) in Weston are married. The highest percentage of unmarried women with births falls into 20 to 34 years age bracket with 17.5% of them unmarried at the time of birth, while the lowest percentage of unmarried women with births belong to 35 to 50 years age bracket with 0.0% of them unmarried.
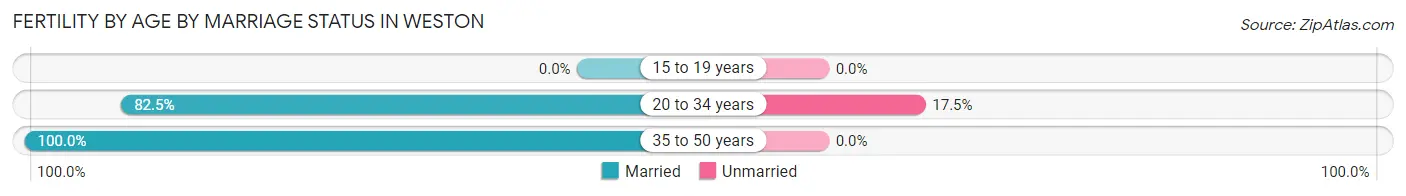
| Age Bracket | Married | Unmarried |
| 15 to 19 years | 0 (0.0%) | 0 (0.0%) |
| 20 to 34 years | 273 (82.5%) | 58 (17.5%) |
| 35 to 50 years | 212 (100.0%) | 0 (0.0%) |
| Total | 485 (89.3%) | 58 (10.7%) |
Fertility by Education in Weston
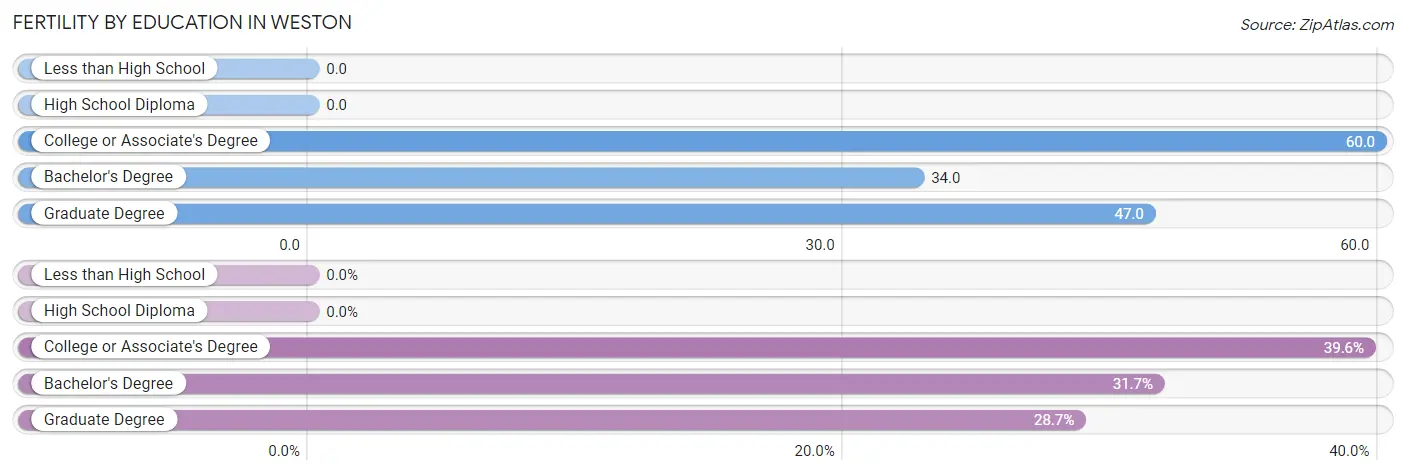
| Educational Attainment | Women with Births | Births / 1,000 Women |
| Less than High School | 0 (0.0%) | 0.0 |
| High School Diploma | 0 (0.0%) | 0.0 |
| College or Associate's Degree | 215 (39.6%) | 60.0 |
| Bachelor's Degree | 172 (31.7%) | 34.0 |
| Graduate Degree | 156 (28.7%) | 47.0 |
| Total | 543 (100.0%) | 33.0 |
Fertility by Education by Marriage Status in Weston
10.7% of women with births in Weston are unmarried. Women with the educational attainment of graduate degree are most likely to be married with 100.0% of them married at childbirth, while women with the educational attainment of college or associate's degree are least likely to be married with 21.9% of them unmarried at childbirth.
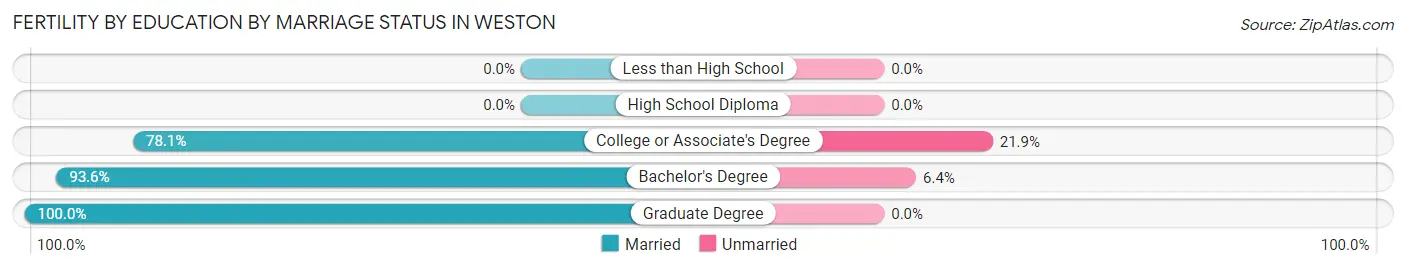
| Educational Attainment | Married | Unmarried |
| Less than High School | 0 (0.0%) | 0 (0.0%) |
| High School Diploma | 0 (0.0%) | 0 (0.0%) |
| College or Associate's Degree | 168 (78.1%) | 47 (21.9%) |
| Bachelor's Degree | 161 (93.6%) | 11 (6.4%) |
| Graduate Degree | 156 (100.0%) | 0 (0.0%) |
| Total | 485 (89.3%) | 58 (10.7%) |
Employment Characteristics in Weston
Employment by Class of Employer in Weston
Among the 31,808 employed individuals in Weston, private company employees (21,777 | 68.5%), self-employed (incorporated) (4,653 | 14.6%), and not-for-profit organizations (1,480 | 4.6%) make up the most common classes of employment.
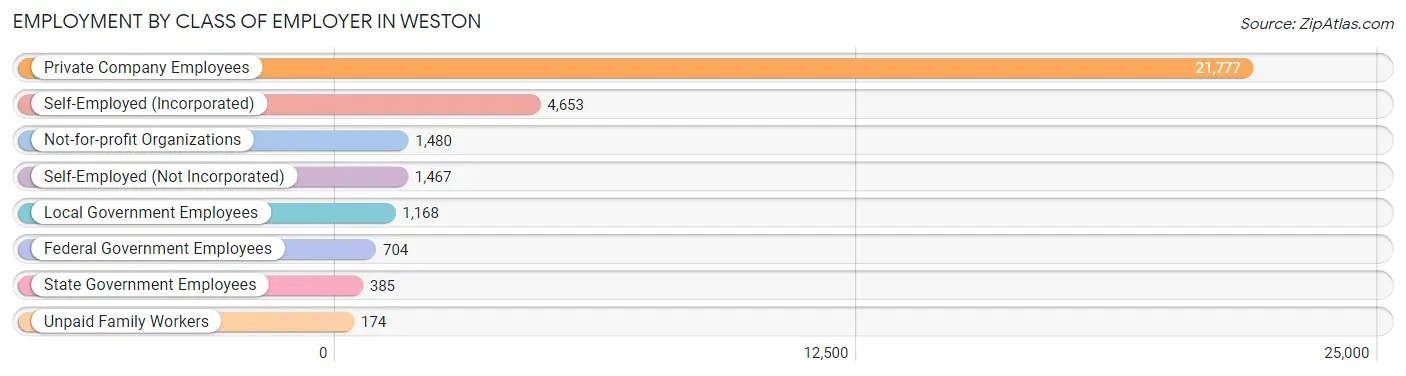
| Employer Class | # Employees | % Employees |
| Private Company Employees | 21,777 | 68.5% |
| Self-Employed (Incorporated) | 4,653 | 14.6% |
| Self-Employed (Not Incorporated) | 1,467 | 4.6% |
| Not-for-profit Organizations | 1,480 | 4.6% |
| Local Government Employees | 1,168 | 3.7% |
| State Government Employees | 385 | 1.2% |
| Federal Government Employees | 704 | 2.2% |
| Unpaid Family Workers | 174 | 0.5% |
| Total | 31,808 | 100.0% |
Employment Status by Age in Weston
According to the labor force statistics for Weston, out of the total population over 16 years of age (51,696), 64.9% or 33,551 individuals are in the labor force, with 3.6% or 1,208 of them unemployed. The age group with the highest labor force participation rate is 25 to 29 years, with 92.7% or 1,648 individuals in the labor force. Within the labor force, the 16 to 19 years age range has the highest percentage of unemployed individuals, with 12.8% or 195 of them being unemployed.
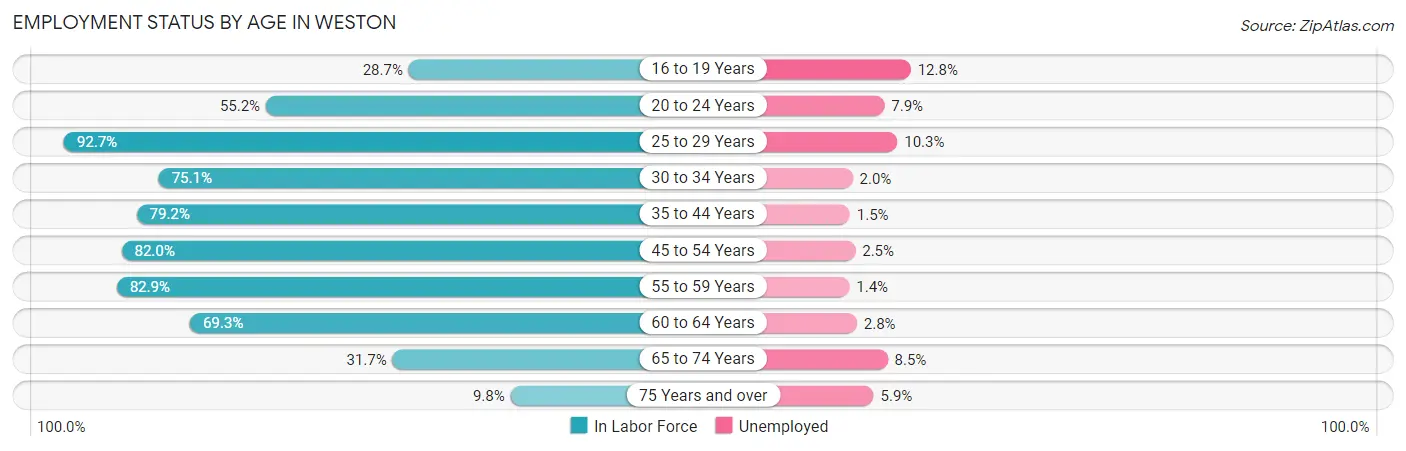
| Age Bracket | In Labor Force | Unemployed |
| 16 to 19 Years | 1,525 (28.7%) | 195 (12.8%) |
| 20 to 24 Years | 1,912 (55.2%) | 151 (7.9%) |
| 25 to 29 Years | 1,648 (92.7%) | 170 (10.3%) |
| 30 to 34 Years | 1,746 (75.1%) | 35 (2.0%) |
| 35 to 44 Years | 7,256 (79.2%) | 109 (1.5%) |
| 45 to 54 Years | 10,998 (82.0%) | 275 (2.5%) |
| 55 to 59 Years | 4,186 (82.9%) | 59 (1.4%) |
| 60 to 64 Years | 2,642 (69.3%) | 74 (2.8%) |
| 65 to 74 Years | 1,355 (31.7%) | 115 (8.5%) |
| 75 Years and over | 304 (9.8%) | 18 (5.9%) |
| Total | 33,551 (64.9%) | 1,208 (3.6%) |
Employment Status by Educational Attainment in Weston
According to labor force statistics for Weston, 80.1% of individuals (28,467) out of the total population between 25 and 64 years of age (35,539) are in the labor force, with 2.5% or 712 of them being unemployed. The group with the highest labor force participation rate are those with the educational attainment of bachelor's degree or higher, with 81.5% or 20,168 individuals in the labor force. Within the labor force, individuals with college / associate degree education have the highest percentage of unemployment, with 5.0% or 275 of them being unemployed.
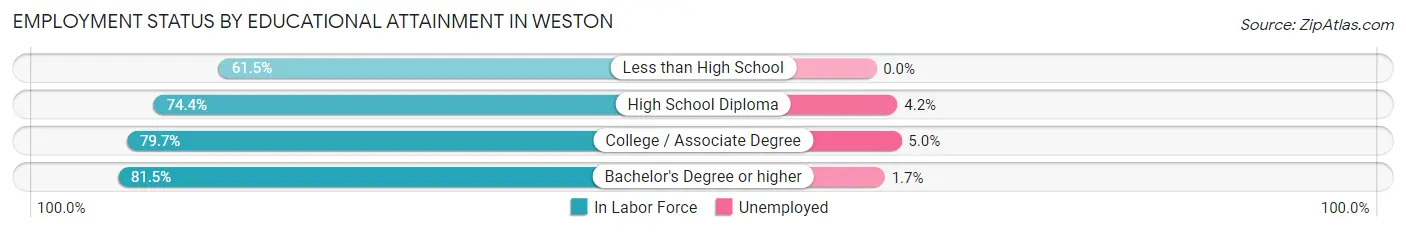
| Educational Attainment | In Labor Force | Unemployed |
| Less than High School | 403 (61.5%) | 0 (0.0%) |
| High School Diploma | 2,411 (74.4%) | 136 (4.2%) |
| College / Associate Degree | 5,498 (79.7%) | 345 (5.0%) |
| Bachelor's Degree or higher | 20,168 (81.5%) | 421 (1.7%) |
| Total | 28,467 (80.1%) | 888 (2.5%) |
Employment Occupations by Sex in Weston
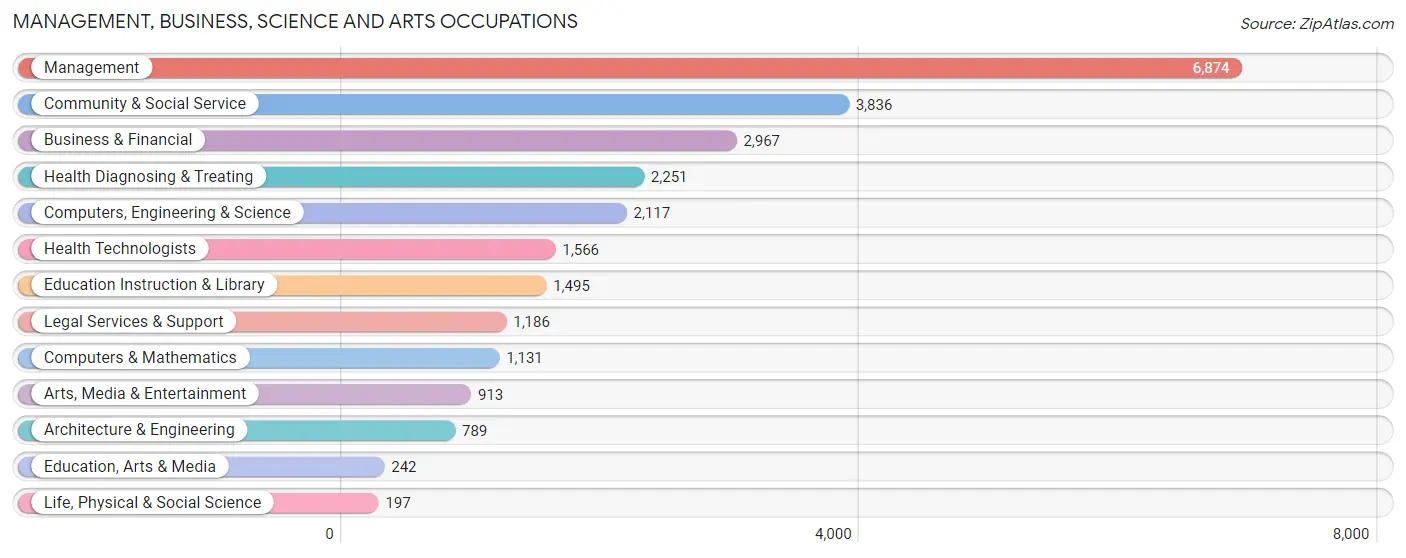
Management, Business, Science and Arts Occupations
The most common Management, Business, Science and Arts occupations in Weston are Management (6,874 | 21.3%), Community & Social Service (3,836 | 11.9%), Business & Financial (2,967 | 9.2%), Health Diagnosing & Treating (2,251 | 7.0%), and Computers, Engineering & Science (2,117 | 6.6%).
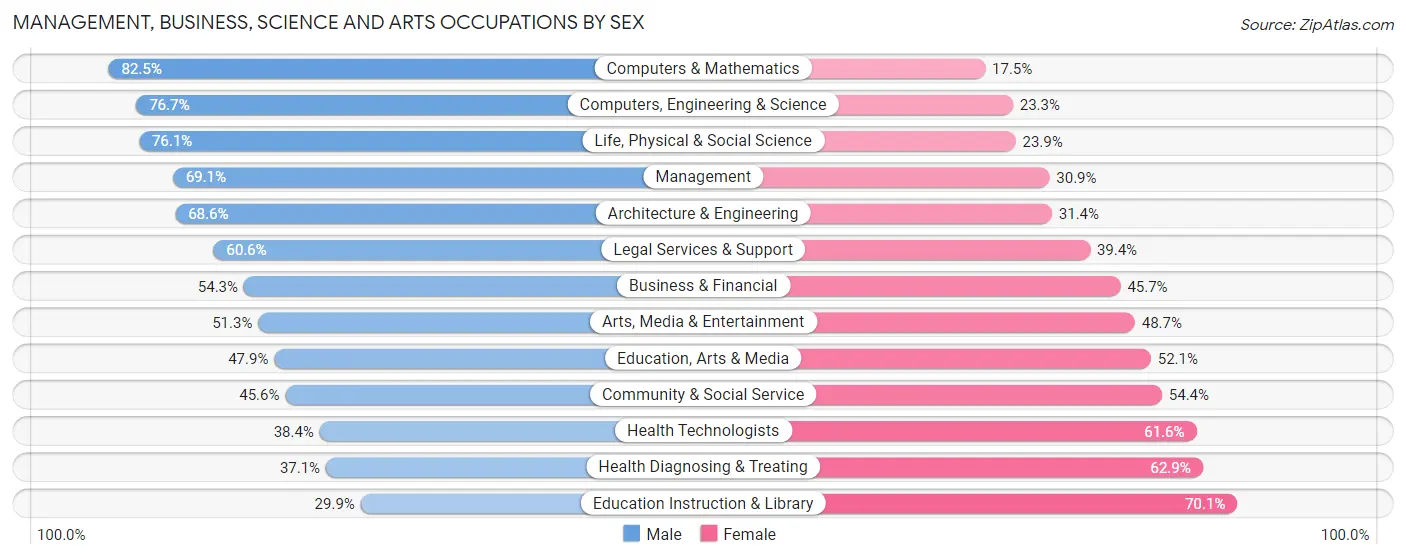
Management, Business, Science and Arts Occupations by Sex
Within the Management, Business, Science and Arts occupations in Weston, the most male-oriented occupations are Computers & Mathematics (82.5%), Computers, Engineering & Science (76.7%), and Life, Physical & Social Science (76.1%), while the most female-oriented occupations are Education Instruction & Library (70.1%), Health Diagnosing & Treating (62.9%), and Health Technologists (61.6%).
| Occupation | Male | Female |
| Management | 4,749 (69.1%) | 2,125 (30.9%) |
| Business & Financial | 1,610 (54.3%) | 1,357 (45.7%) |
| Computers, Engineering & Science | 1,624 (76.7%) | 493 (23.3%) |
| Computers & Mathematics | 933 (82.5%) | 198 (17.5%) |
| Architecture & Engineering | 541 (68.6%) | 248 (31.4%) |
| Life, Physical & Social Science | 150 (76.1%) | 47 (23.9%) |
| Community & Social Service | 1,750 (45.6%) | 2,086 (54.4%) |
| Education, Arts & Media | 116 (47.9%) | 126 (52.1%) |
| Legal Services & Support | 719 (60.6%) | 467 (39.4%) |
| Education Instruction & Library | 447 (29.9%) | 1,048 (70.1%) |
| Arts, Media & Entertainment | 468 (51.3%) | 445 (48.7%) |
| Health Diagnosing & Treating | 836 (37.1%) | 1,415 (62.9%) |
| Health Technologists | 602 (38.4%) | 964 (61.6%) |
| Total (Category) | 10,569 (58.6%) | 7,476 (41.4%) |
| Total (Overall) | 17,954 (55.6%) | 14,332 (44.4%) |
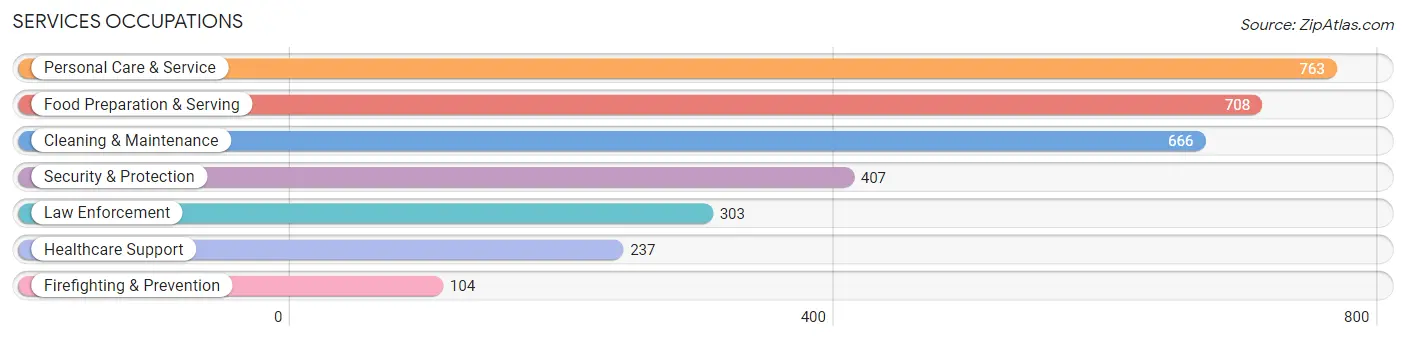
Services Occupations
The most common Services occupations in Weston are Personal Care & Service (763 | 2.4%), Food Preparation & Serving (708 | 2.2%), Cleaning & Maintenance (666 | 2.1%), Security & Protection (407 | 1.3%), and Law Enforcement (303 | 0.9%).
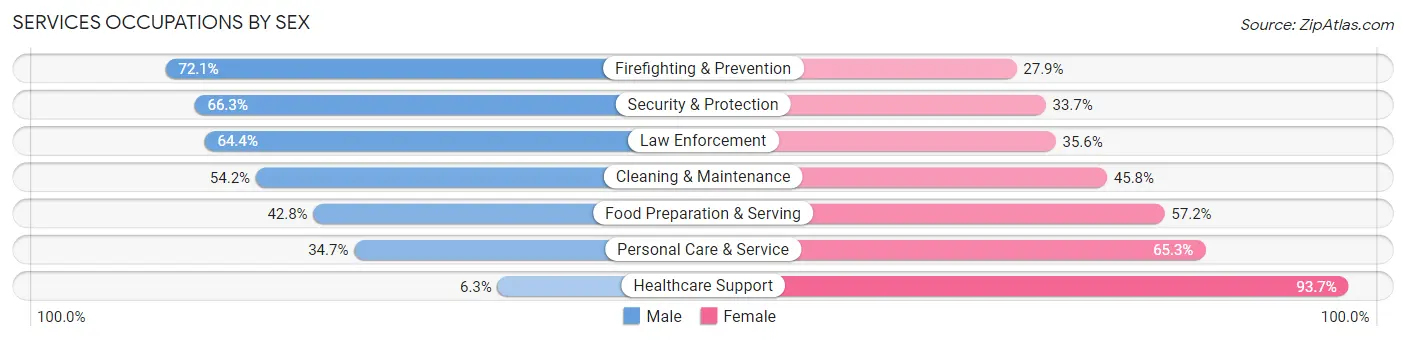
Services Occupations by Sex
Within the Services occupations in Weston, the most male-oriented occupations are Firefighting & Prevention (72.1%), Security & Protection (66.3%), and Law Enforcement (64.4%), while the most female-oriented occupations are Healthcare Support (93.7%), Personal Care & Service (65.3%), and Food Preparation & Serving (57.2%).
| Occupation | Male | Female |
| Healthcare Support | 15 (6.3%) | 222 (93.7%) |
| Security & Protection | 270 (66.3%) | 137 (33.7%) |
| Firefighting & Prevention | 75 (72.1%) | 29 (27.9%) |
| Law Enforcement | 195 (64.4%) | 108 (35.6%) |
| Food Preparation & Serving | 303 (42.8%) | 405 (57.2%) |
| Cleaning & Maintenance | 361 (54.2%) | 305 (45.8%) |
| Personal Care & Service | 265 (34.7%) | 498 (65.3%) |
| Total (Category) | 1,214 (43.6%) | 1,567 (56.4%) |
| Total (Overall) | 17,954 (55.6%) | 14,332 (44.4%) |
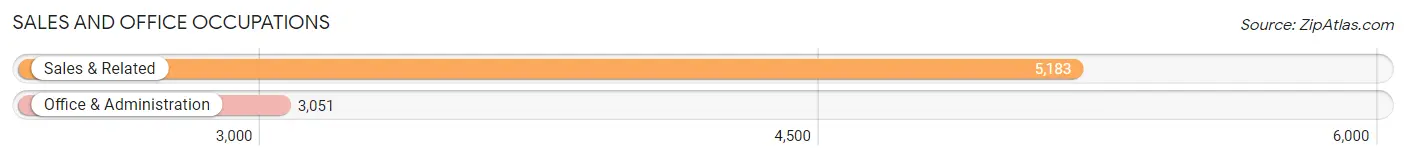
Sales and Office Occupations
The most common Sales and Office occupations in Weston are Sales & Related (5,183 | 16.1%), and Office & Administration (3,051 | 9.5%).
Sales and Office Occupations by Sex
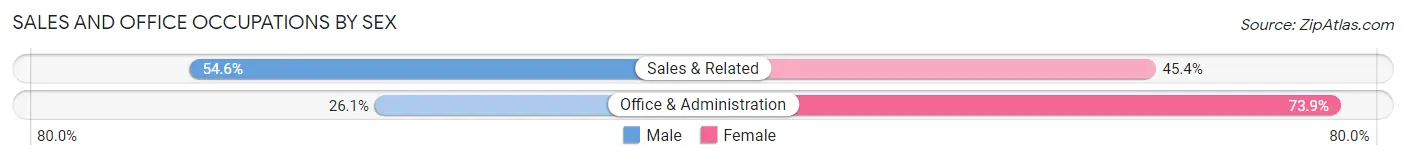
| Occupation | Male | Female |
| Sales & Related | 2,831 (54.6%) | 2,352 (45.4%) |
| Office & Administration | 797 (26.1%) | 2,254 (73.9%) |
| Total (Category) | 3,628 (44.1%) | 4,606 (55.9%) |
| Total (Overall) | 17,954 (55.6%) | 14,332 (44.4%) |
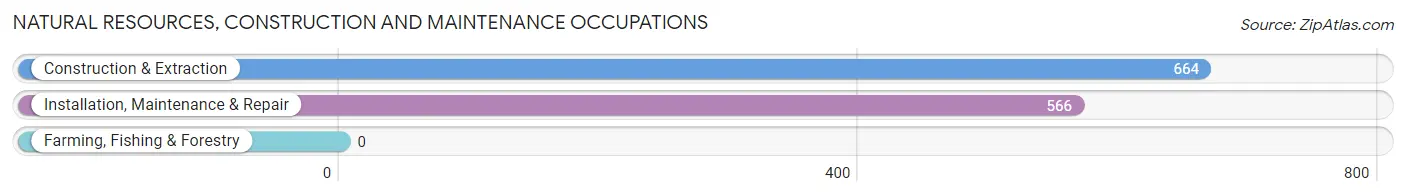
Natural Resources, Construction and Maintenance Occupations
The most common Natural Resources, Construction and Maintenance occupations in Weston are Construction & Extraction (664 | 2.1%), and Installation, Maintenance & Repair (566 | 1.8%).
Natural Resources, Construction and Maintenance Occupations by Sex
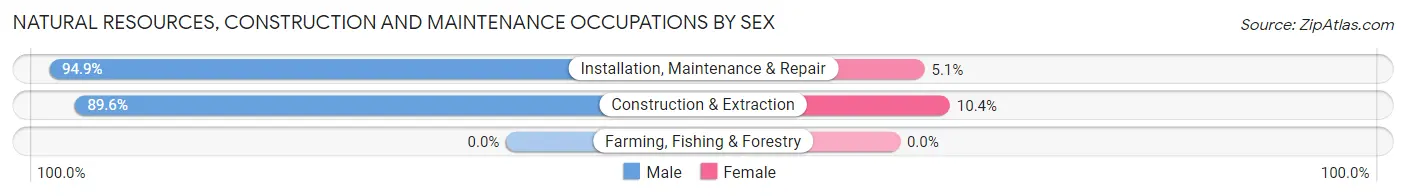
| Occupation | Male | Female |
| Farming, Fishing & Forestry | 0 (0.0%) | 0 (0.0%) |
| Construction & Extraction | 595 (89.6%) | 69 (10.4%) |
| Installation, Maintenance & Repair | 537 (94.9%) | 29 (5.1%) |
| Total (Category) | 1,132 (92.0%) | 98 (8.0%) |
| Total (Overall) | 17,954 (55.6%) | 14,332 (44.4%) |
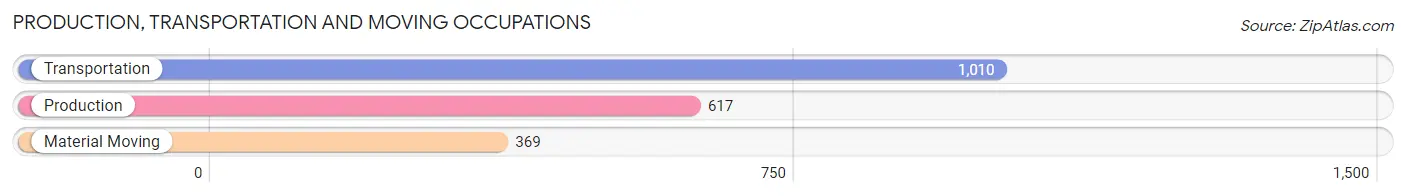
Production, Transportation and Moving Occupations
The most common Production, Transportation and Moving occupations in Weston are Transportation (1,010 | 3.1%), Production (617 | 1.9%), and Material Moving (369 | 1.1%).
Production, Transportation and Moving Occupations by Sex
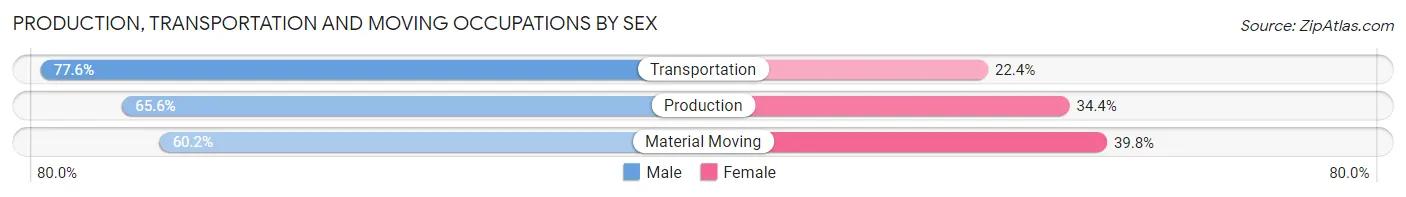
| Occupation | Male | Female |
| Production | 405 (65.6%) | 212 (34.4%) |
| Transportation | 784 (77.6%) | 226 (22.4%) |
| Material Moving | 222 (60.2%) | 147 (39.8%) |
| Total (Category) | 1,411 (70.7%) | 585 (29.3%) |
| Total (Overall) | 17,954 (55.6%) | 14,332 (44.4%) |
Employment Industries by Sex in Weston
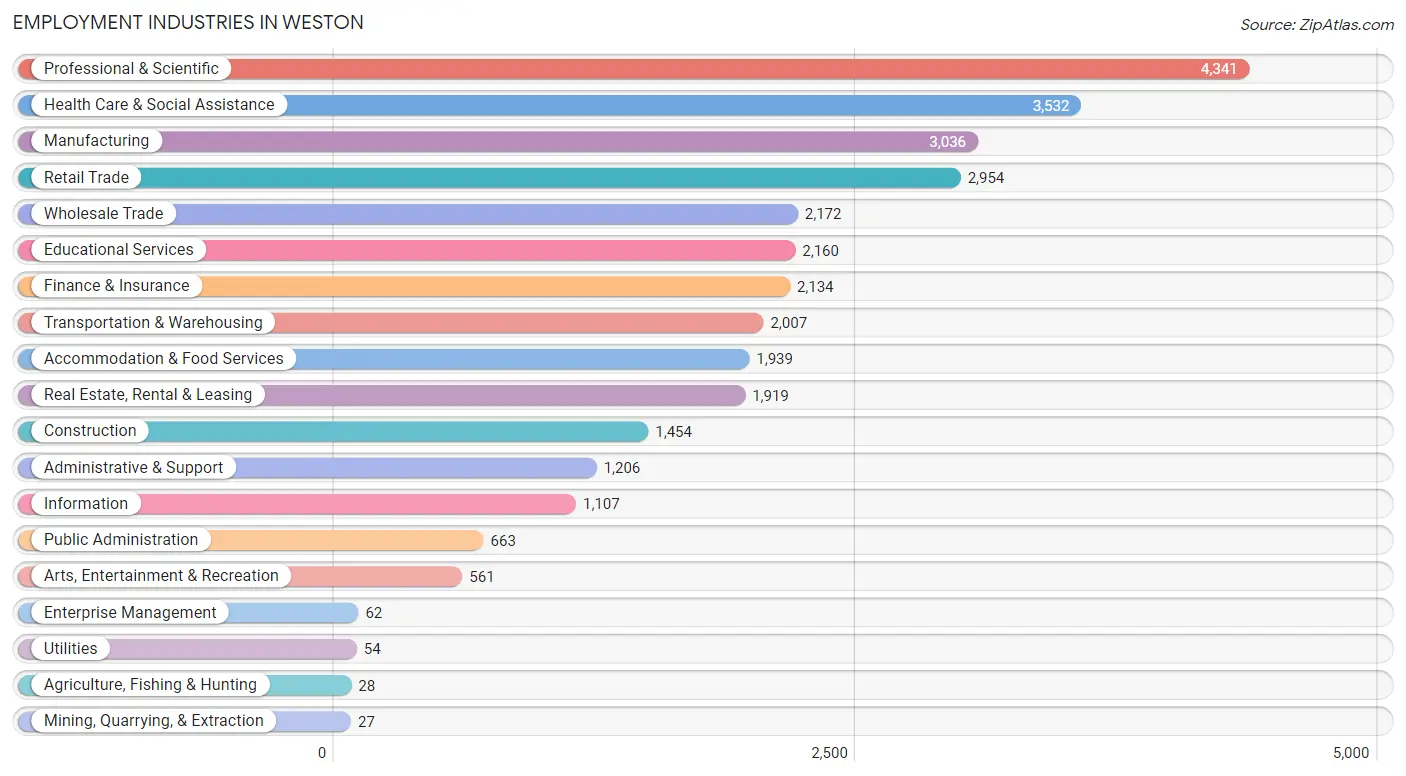
Employment Industries in Weston
The major employment industries in Weston include Professional & Scientific (4,341 | 13.5%), Health Care & Social Assistance (3,532 | 10.9%), Manufacturing (3,036 | 9.4%), Retail Trade (2,954 | 9.1%), and Wholesale Trade (2,172 | 6.7%).
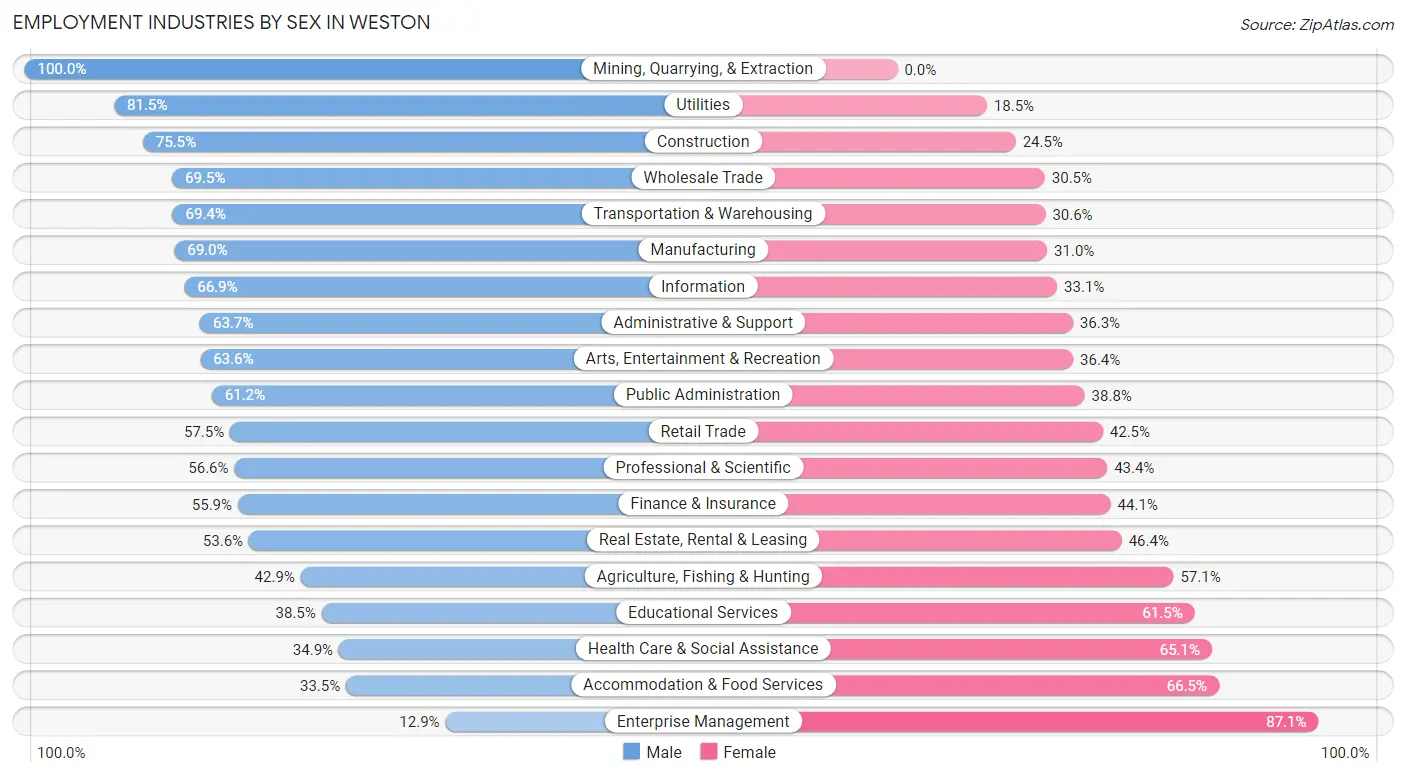
Employment Industries by Sex in Weston
The Weston industries that see more men than women are Mining, Quarrying, & Extraction (100.0%), Utilities (81.5%), and Construction (75.5%), whereas the industries that tend to have a higher number of women are Enterprise Management (87.1%), Accommodation & Food Services (66.5%), and Health Care & Social Assistance (65.1%).
| Industry | Male | Female |
| Agriculture, Fishing & Hunting | 12 (42.9%) | 16 (57.1%) |
| Mining, Quarrying, & Extraction | 27 (100.0%) | 0 (0.0%) |
| Construction | 1,098 (75.5%) | 356 (24.5%) |
| Manufacturing | 2,095 (69.0%) | 941 (31.0%) |
| Wholesale Trade | 1,509 (69.5%) | 663 (30.5%) |
| Retail Trade | 1,698 (57.5%) | 1,256 (42.5%) |
| Transportation & Warehousing | 1,392 (69.4%) | 615 (30.6%) |
| Utilities | 44 (81.5%) | 10 (18.5%) |
| Information | 741 (66.9%) | 366 (33.1%) |
| Finance & Insurance | 1,192 (55.9%) | 942 (44.1%) |
| Real Estate, Rental & Leasing | 1,028 (53.6%) | 891 (46.4%) |
| Professional & Scientific | 2,456 (56.6%) | 1,885 (43.4%) |
| Enterprise Management | 8 (12.9%) | 54 (87.1%) |
| Administrative & Support | 768 (63.7%) | 438 (36.3%) |
| Educational Services | 832 (38.5%) | 1,328 (61.5%) |
| Health Care & Social Assistance | 1,234 (34.9%) | 2,298 (65.1%) |
| Arts, Entertainment & Recreation | 357 (63.6%) | 204 (36.4%) |
| Accommodation & Food Services | 649 (33.5%) | 1,290 (66.5%) |
| Public Administration | 406 (61.2%) | 257 (38.8%) |
| Total | 17,954 (55.6%) | 14,332 (44.4%) |
Education in Weston
School Enrollment in Weston
The most common levels of schooling among the 22,302 students in Weston are high school (6,553 | 29.4%), middle school (5,419 | 24.3%), and college / undergraduate (3,769 | 16.9%).
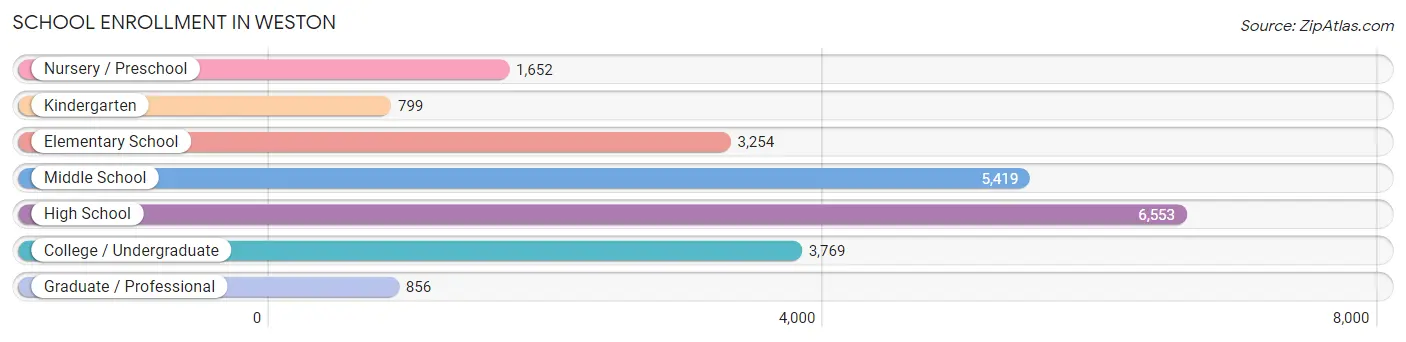
| School Level | # Students | % Students |
| Nursery / Preschool | 1,652 | 7.4% |
| Kindergarten | 799 | 3.6% |
| Elementary School | 3,254 | 14.6% |
| Middle School | 5,419 | 24.3% |
| High School | 6,553 | 29.4% |
| College / Undergraduate | 3,769 | 16.9% |
| Graduate / Professional | 856 | 3.8% |
| Total | 22,302 | 100.0% |
School Enrollment by Age by Funding Source in Weston
Out of a total of 22,302 students who are enrolled in schools in Weston, 3,613 (16.2%) attend a private institution, while the remaining 18,689 (83.8%) are enrolled in public schools. The age group of 3 to 4 year olds has the highest likelihood of being enrolled in private schools, with 723 (60.2% in the age bracket) enrolled. Conversely, the age group of 10 to 14 year olds has the lowest likelihood of being enrolled in a private school, with 6,524 (92.8% in the age bracket) attending a public institution.
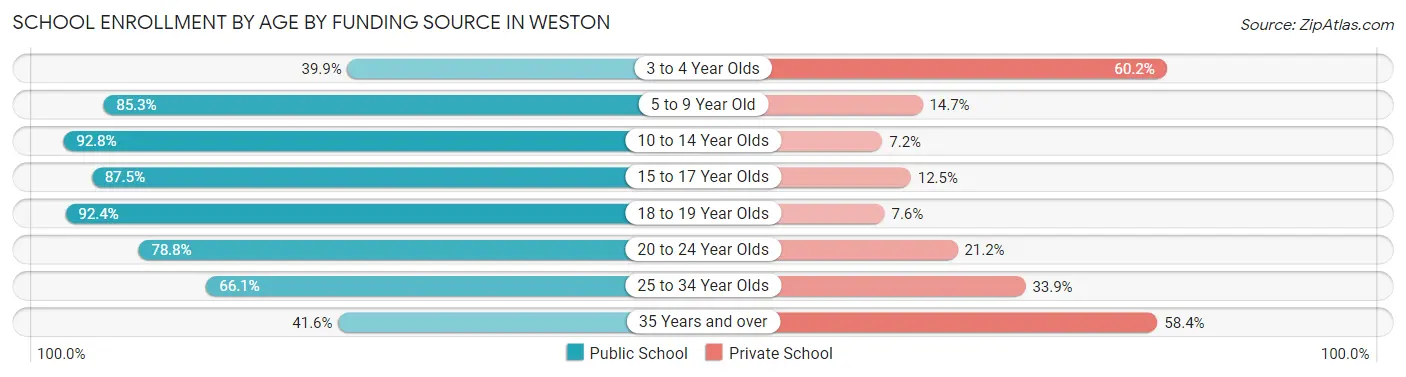
| Age Bracket | Public School | Private School |
| 3 to 4 Year Olds | 479 (39.9%) | 723 (60.2%) |
| 5 to 9 Year Old | 3,339 (85.3%) | 574 (14.7%) |
| 10 to 14 Year Olds | 6,524 (92.8%) | 507 (7.2%) |
| 15 to 17 Year Olds | 3,770 (87.5%) | 539 (12.5%) |
| 18 to 19 Year Olds | 2,065 (92.4%) | 170 (7.6%) |
| 20 to 24 Year Olds | 1,863 (78.8%) | 501 (21.2%) |
| 25 to 34 Year Olds | 375 (66.1%) | 192 (33.9%) |
| 35 Years and over | 283 (41.6%) | 398 (58.4%) |
| Total | 18,689 (83.8%) | 3,613 (16.2%) |
Educational Attainment by Field of Study in Weston
Business (10,367 | 34.7%), engineering (4,924 | 16.5%), science & technology (1,957 | 6.6%), social sciences (1,942 | 6.5%), and education (1,699 | 5.7%) are the most common fields of study among 29,868 individuals in Weston who have obtained a bachelor's degree or higher.
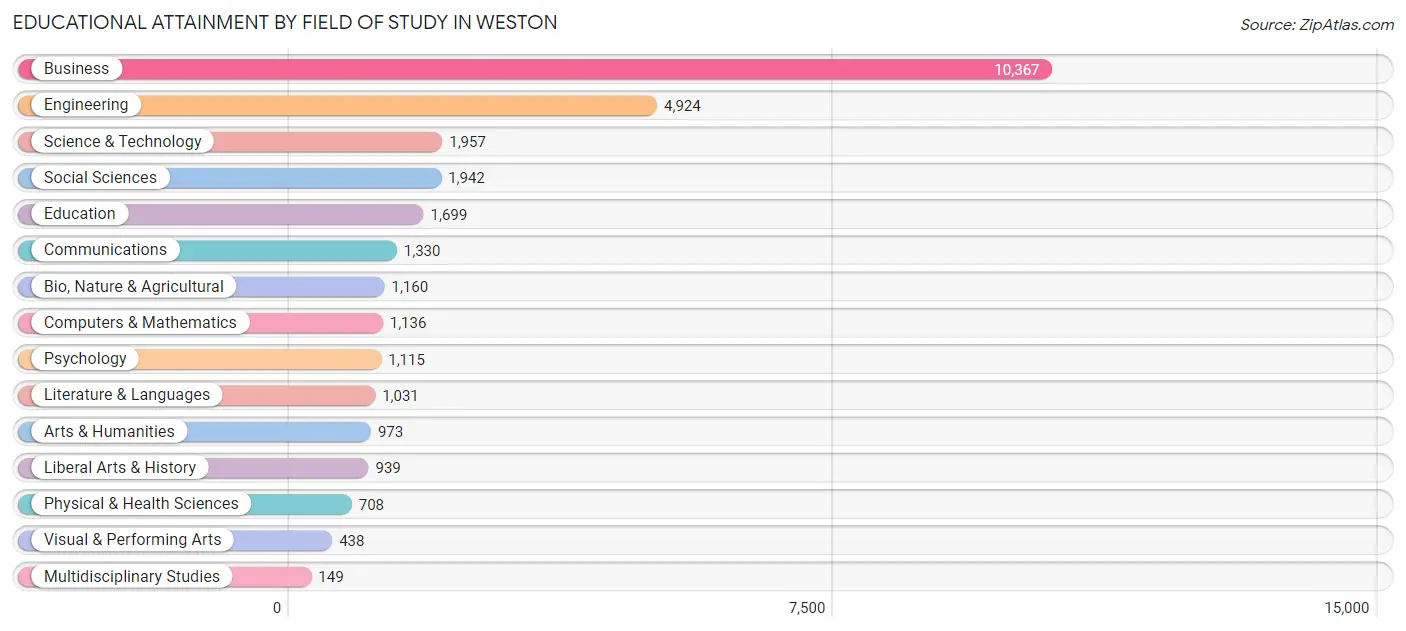
| Field of Study | # Graduates | % Graduates |
| Computers & Mathematics | 1,136 | 3.8% |
| Bio, Nature & Agricultural | 1,160 | 3.9% |
| Physical & Health Sciences | 708 | 2.4% |
| Psychology | 1,115 | 3.7% |
| Social Sciences | 1,942 | 6.5% |
| Engineering | 4,924 | 16.5% |
| Multidisciplinary Studies | 149 | 0.5% |
| Science & Technology | 1,957 | 6.6% |
| Business | 10,367 | 34.7% |
| Education | 1,699 | 5.7% |
| Literature & Languages | 1,031 | 3.5% |
| Liberal Arts & History | 939 | 3.1% |
| Visual & Performing Arts | 438 | 1.5% |
| Communications | 1,330 | 4.4% |
| Arts & Humanities | 973 | 3.3% |
| Total | 29,868 | 100.0% |
Transportation & Commute in Weston
Vehicle Availability by Sex in Weston
The most prevalent vehicle ownership categories in Weston are males with 2 vehicles (9,457, accounting for 53.2%) and females with 2 vehicles (7,019, making up 67.3%).
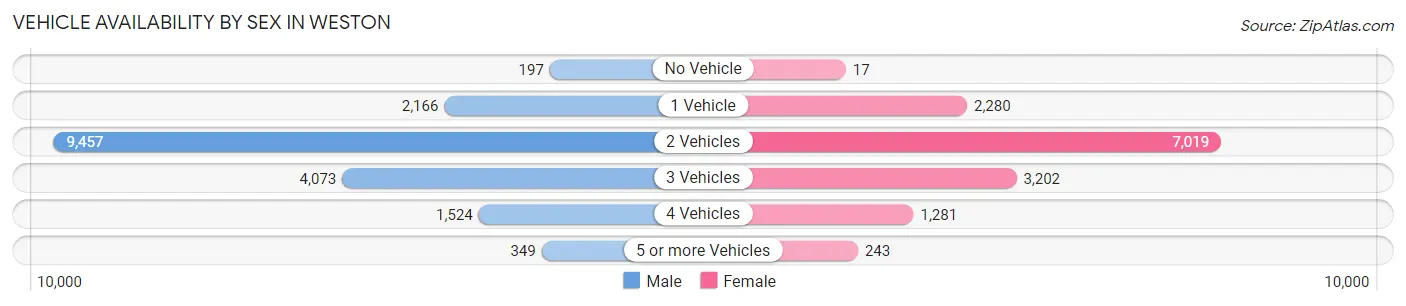
| Vehicles Available | Male | Female |
| No Vehicle | 197 (1.1%) | 17 (0.1%) |
| 1 Vehicle | 2,166 (12.2%) | 2,280 (16.2%) |
| 2 Vehicles | 9,457 (53.2%) | 7,019 (50.0%) |
| 3 Vehicles | 4,073 (22.9%) | 3,202 (22.8%) |
| 4 Vehicles | 1,524 (8.6%) | 1,281 (9.1%) |
| 5 or more Vehicles | 349 (2.0%) | 243 (1.7%) |
| Total | 17,766 (100.0%) | 14,042 (100.0%) |
Commute Time in Weston
The most frequently occuring commute durations in Weston are 30 to 34 minutes (3,695 commuters, 14.7%), 20 to 24 minutes (3,549 commuters, 14.1%), and 15 to 19 minutes (3,227 commuters, 12.8%).
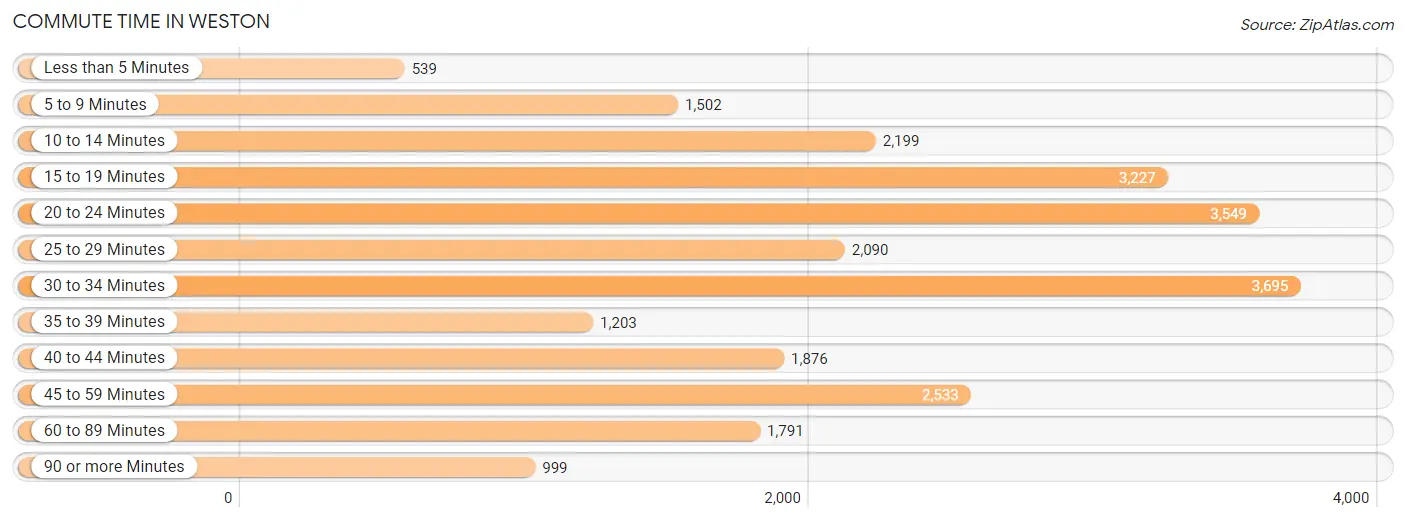
| Commute Time | # Commuters | % Commuters |
| Less than 5 Minutes | 539 | 2.1% |
| 5 to 9 Minutes | 1,502 | 6.0% |
| 10 to 14 Minutes | 2,199 | 8.7% |
| 15 to 19 Minutes | 3,227 | 12.8% |
| 20 to 24 Minutes | 3,549 | 14.1% |
| 25 to 29 Minutes | 2,090 | 8.3% |
| 30 to 34 Minutes | 3,695 | 14.7% |
| 35 to 39 Minutes | 1,203 | 4.8% |
| 40 to 44 Minutes | 1,876 | 7.4% |
| 45 to 59 Minutes | 2,533 | 10.1% |
| 60 to 89 Minutes | 1,791 | 7.1% |
| 90 or more Minutes | 999 | 4.0% |
Commute Time by Sex in Weston
The most common commute times in Weston are 30 to 34 minutes (2,048 commuters, 14.7%) for males and 20 to 24 minutes (1,749 commuters, 15.5%) for females.
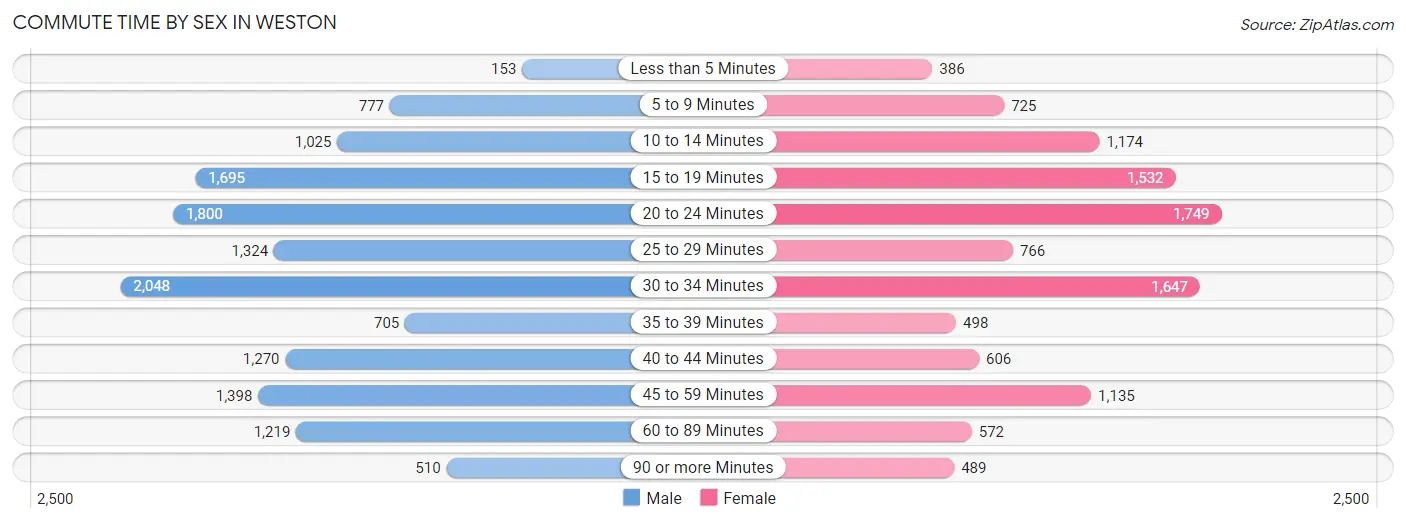
| Commute Time | Male | Female |
| Less than 5 Minutes | 153 (1.1%) | 386 (3.4%) |
| 5 to 9 Minutes | 777 (5.6%) | 725 (6.4%) |
| 10 to 14 Minutes | 1,025 (7.4%) | 1,174 (10.4%) |
| 15 to 19 Minutes | 1,695 (12.2%) | 1,532 (13.6%) |
| 20 to 24 Minutes | 1,800 (12.9%) | 1,749 (15.5%) |
| 25 to 29 Minutes | 1,324 (9.5%) | 766 (6.8%) |
| 30 to 34 Minutes | 2,048 (14.7%) | 1,647 (14.6%) |
| 35 to 39 Minutes | 705 (5.1%) | 498 (4.4%) |
| 40 to 44 Minutes | 1,270 (9.1%) | 606 (5.4%) |
| 45 to 59 Minutes | 1,398 (10.0%) | 1,135 (10.1%) |
| 60 to 89 Minutes | 1,219 (8.7%) | 572 (5.1%) |
| 90 or more Minutes | 510 (3.7%) | 489 (4.3%) |
Time of Departure to Work by Sex in Weston
The most frequent times of departure to work in Weston are 8:00 AM to 8:29 AM (2,622, 18.8%) for males and 8:00 AM to 8:29 AM (2,126, 18.9%) for females.
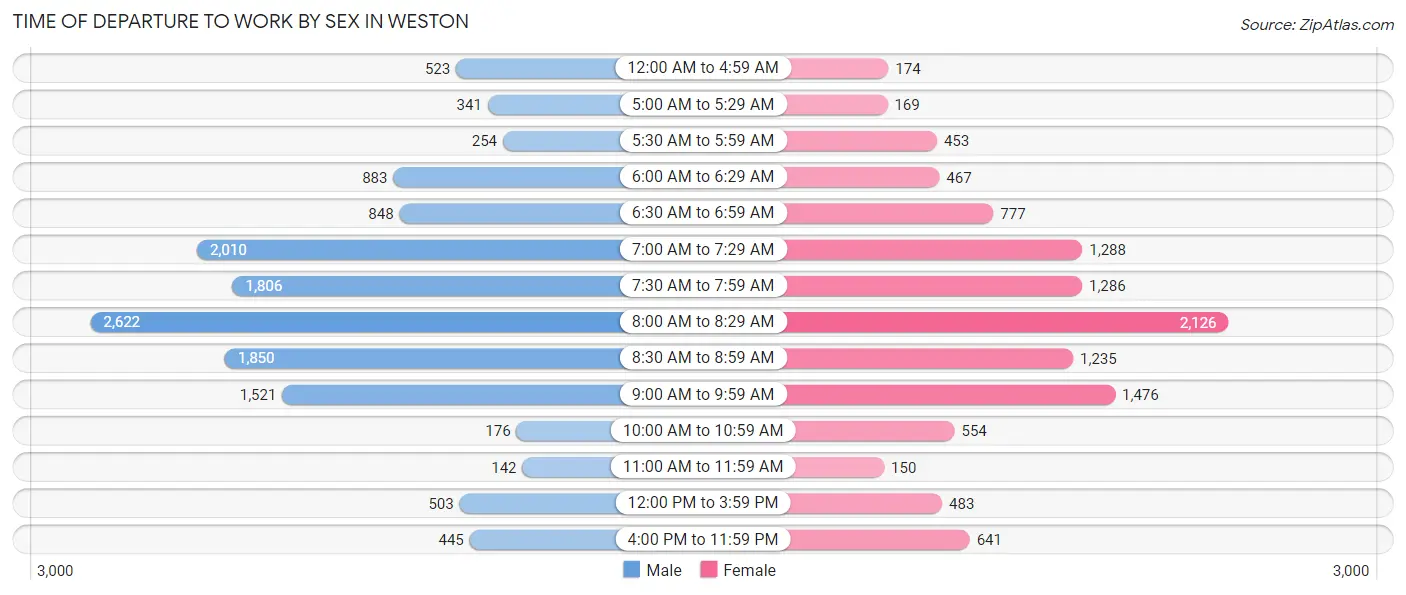
| Time of Departure | Male | Female |
| 12:00 AM to 4:59 AM | 523 (3.8%) | 174 (1.5%) |
| 5:00 AM to 5:29 AM | 341 (2.5%) | 169 (1.5%) |
| 5:30 AM to 5:59 AM | 254 (1.8%) | 453 (4.0%) |
| 6:00 AM to 6:29 AM | 883 (6.3%) | 467 (4.1%) |
| 6:30 AM to 6:59 AM | 848 (6.1%) | 777 (6.9%) |
| 7:00 AM to 7:29 AM | 2,010 (14.4%) | 1,288 (11.4%) |
| 7:30 AM to 7:59 AM | 1,806 (13.0%) | 1,286 (11.4%) |
| 8:00 AM to 8:29 AM | 2,622 (18.8%) | 2,126 (18.9%) |
| 8:30 AM to 8:59 AM | 1,850 (13.3%) | 1,235 (11.0%) |
| 9:00 AM to 9:59 AM | 1,521 (10.9%) | 1,476 (13.1%) |
| 10:00 AM to 10:59 AM | 176 (1.3%) | 554 (4.9%) |
| 11:00 AM to 11:59 AM | 142 (1.0%) | 150 (1.3%) |
| 12:00 PM to 3:59 PM | 503 (3.6%) | 483 (4.3%) |
| 4:00 PM to 11:59 PM | 445 (3.2%) | 641 (5.7%) |
| Total | 13,924 (100.0%) | 11,279 (100.0%) |
Housing Occupancy in Weston
Occupancy by Ownership in Weston
Of the total 21,085 dwellings in Weston, owner-occupied units account for 15,383 (73.0%), while renter-occupied units make up 5,702 (27.0%).
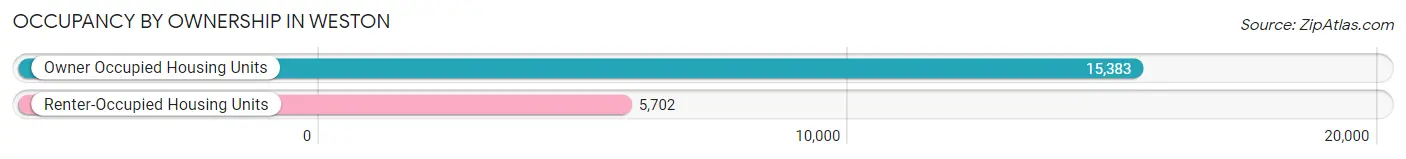
| Occupancy | # Housing Units | % Housing Units |
| Owner Occupied Housing Units | 15,383 | 73.0% |
| Renter-Occupied Housing Units | 5,702 | 27.0% |
| Total Occupied Housing Units | 21,085 | 100.0% |
Occupancy by Household Size in Weston
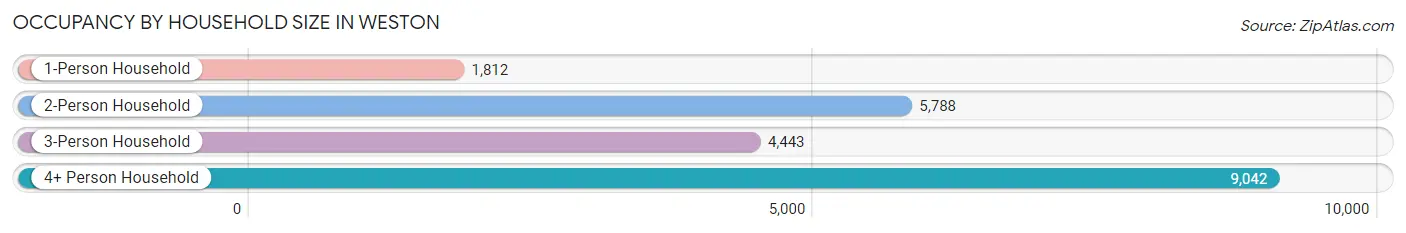
| Household Size | # Housing Units | % Housing Units |
| 1-Person Household | 1,812 | 8.6% |
| 2-Person Household | 5,788 | 27.5% |
| 3-Person Household | 4,443 | 21.1% |
| 4+ Person Household | 9,042 | 42.9% |
| Total Housing Units | 21,085 | 100.0% |
Occupancy by Ownership by Household Size in Weston
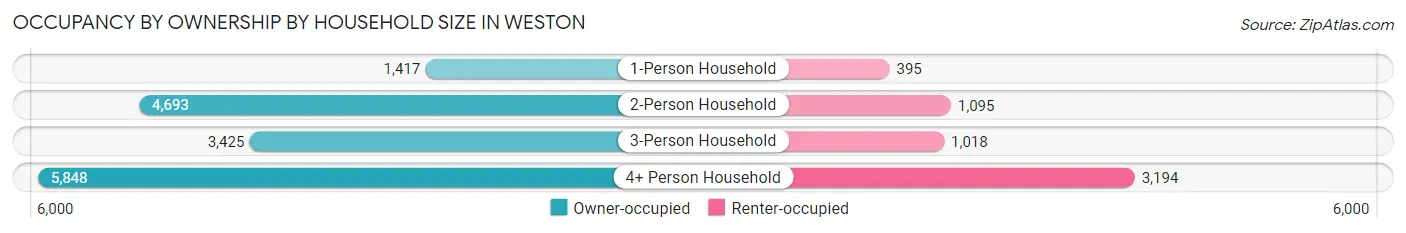
| Household Size | Owner-occupied | Renter-occupied |
| 1-Person Household | 1,417 (78.2%) | 395 (21.8%) |
| 2-Person Household | 4,693 (81.1%) | 1,095 (18.9%) |
| 3-Person Household | 3,425 (77.1%) | 1,018 (22.9%) |
| 4+ Person Household | 5,848 (64.7%) | 3,194 (35.3%) |
| Total Housing Units | 15,383 (73.0%) | 5,702 (27.0%) |
Occupancy by Educational Attainment in Weston
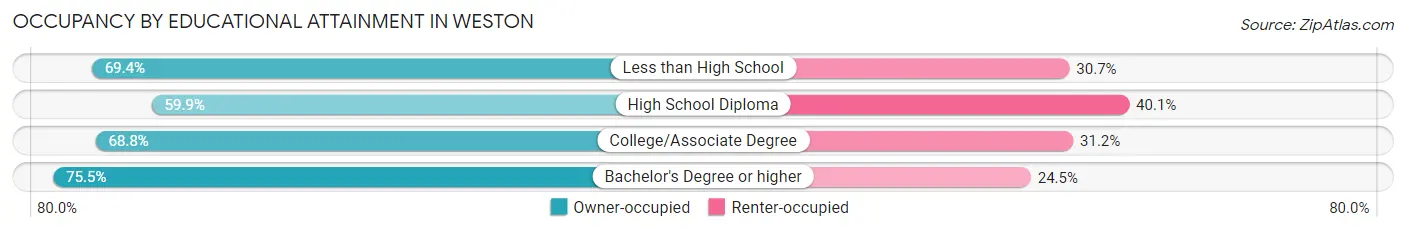
| Household Size | Owner-occupied | Renter-occupied |
| Less than High School | 172 (69.4%) | 76 (30.6%) |
| High School Diploma | 1,077 (59.9%) | 722 (40.1%) |
| College/Associate Degree | 2,419 (68.8%) | 1,099 (31.2%) |
| Bachelor's Degree or higher | 11,715 (75.5%) | 3,805 (24.5%) |
Occupancy by Age of Householder in Weston
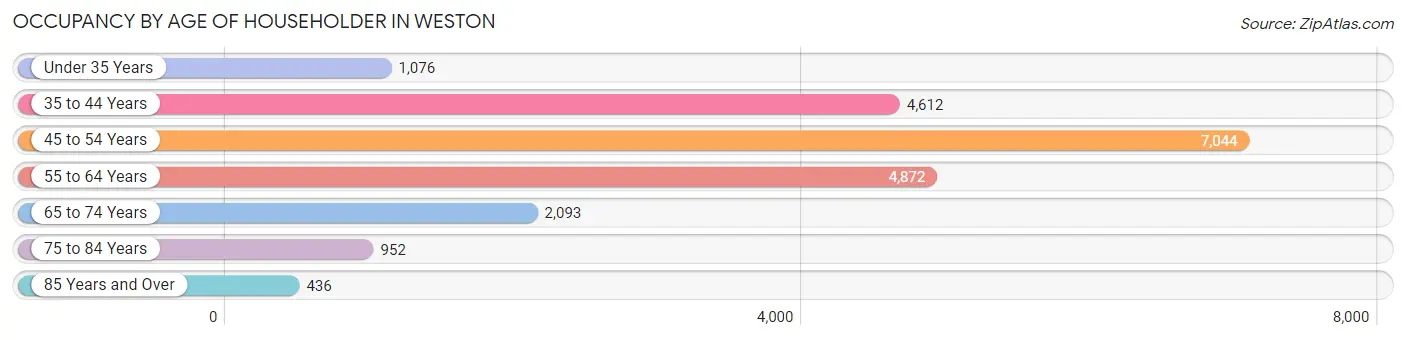
| Age Bracket | # Households | % Households |
| Under 35 Years | 1,076 | 5.1% |
| 35 to 44 Years | 4,612 | 21.9% |
| 45 to 54 Years | 7,044 | 33.4% |
| 55 to 64 Years | 4,872 | 23.1% |
| 65 to 74 Years | 2,093 | 9.9% |
| 75 to 84 Years | 952 | 4.5% |
| 85 Years and Over | 436 | 2.1% |
| Total | 21,085 | 100.0% |
Housing Finances in Weston
Median Income by Occupancy in Weston
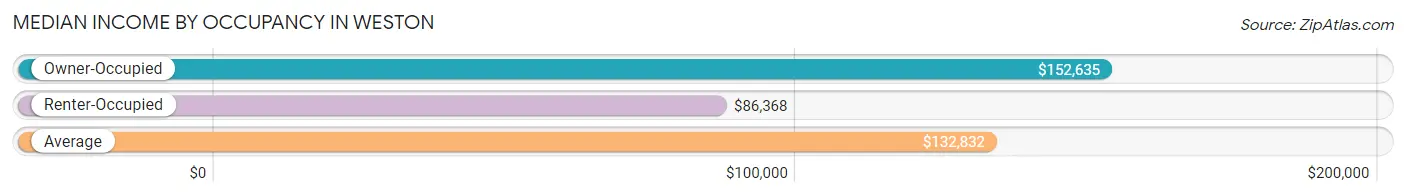
| Occupancy Type | # Households | Median Income |
| Owner-Occupied | 15,383 (73.0%) | $152,635 |
| Renter-Occupied | 5,702 (27.0%) | $86,368 |
| Average | 21,085 (100.0%) | $132,832 |
Occupancy by Householder Income Bracket in Weston
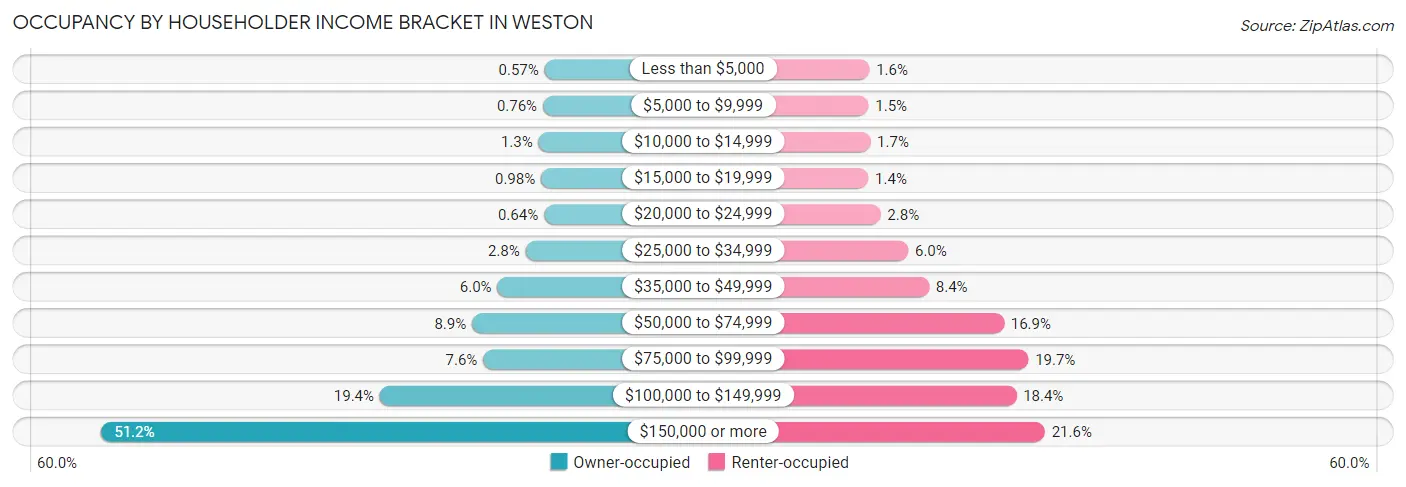
| Income Bracket | Owner-occupied | Renter-occupied |
| Less than $5,000 | 88 (0.6%) | 89 (1.6%) |
| $5,000 to $9,999 | 117 (0.8%) | 83 (1.5%) |
| $10,000 to $14,999 | 194 (1.3%) | 95 (1.7%) |
| $15,000 to $19,999 | 150 (1.0%) | 82 (1.4%) |
| $20,000 to $24,999 | 99 (0.6%) | 162 (2.8%) |
| $25,000 to $34,999 | 423 (2.8%) | 342 (6.0%) |
| $35,000 to $49,999 | 917 (6.0%) | 478 (8.4%) |
| $50,000 to $74,999 | 1,363 (8.9%) | 966 (16.9%) |
| $75,000 to $99,999 | 1,167 (7.6%) | 1,125 (19.7%) |
| $100,000 to $149,999 | 2,984 (19.4%) | 1,047 (18.4%) |
| $150,000 or more | 7,881 (51.2%) | 1,233 (21.6%) |
| Total | 15,383 (100.0%) | 5,702 (100.0%) |
Monthly Housing Cost Tiers in Weston
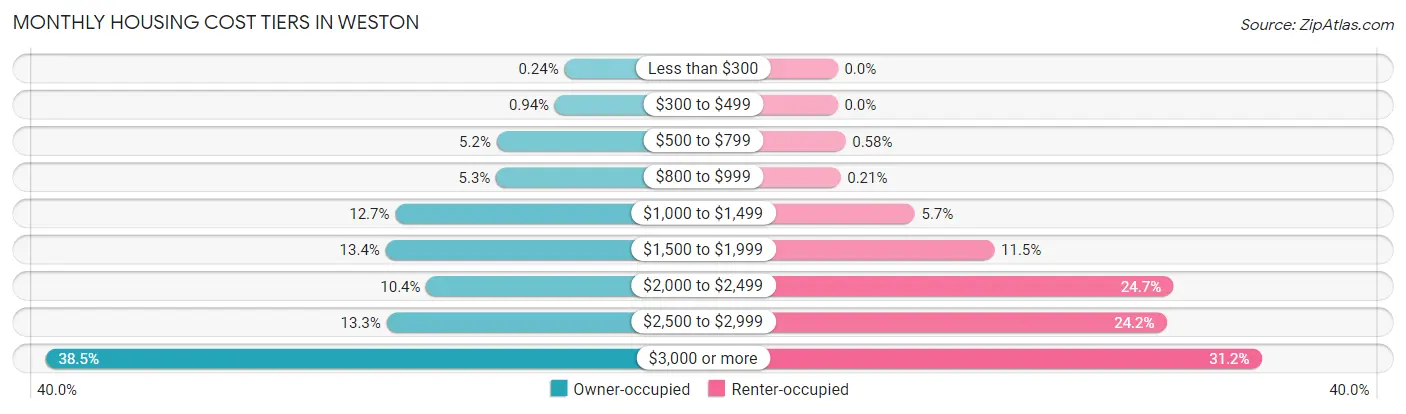
| Monthly Cost | Owner-occupied | Renter-occupied |
| Less than $300 | 37 (0.2%) | 0 (0.0%) |
| $300 to $499 | 145 (0.9%) | 0 (0.0%) |
| $500 to $799 | 805 (5.2%) | 33 (0.6%) |
| $800 to $999 | 810 (5.3%) | 12 (0.2%) |
| $1,000 to $1,499 | 1,954 (12.7%) | 324 (5.7%) |
| $1,500 to $1,999 | 2,063 (13.4%) | 658 (11.5%) |
| $2,000 to $2,499 | 1,601 (10.4%) | 1,409 (24.7%) |
| $2,500 to $2,999 | 2,052 (13.3%) | 1,381 (24.2%) |
| $3,000 or more | 5,916 (38.5%) | 1,780 (31.2%) |
| Total | 15,383 (100.0%) | 5,702 (100.0%) |
Physical Housing Characteristics in Weston
Housing Structures in Weston
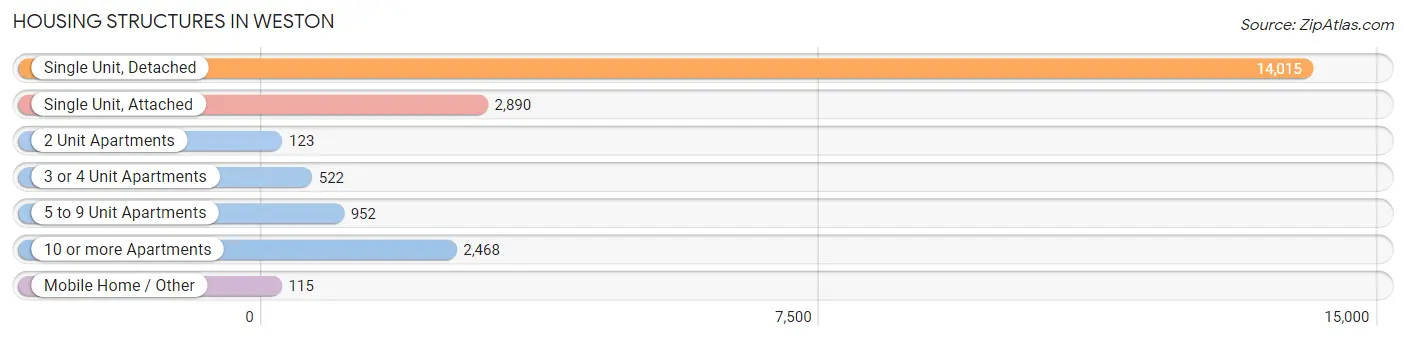
| Structure Type | # Housing Units | % Housing Units |
| Single Unit, Detached | 14,015 | 66.5% |
| Single Unit, Attached | 2,890 | 13.7% |
| 2 Unit Apartments | 123 | 0.6% |
| 3 or 4 Unit Apartments | 522 | 2.5% |
| 5 to 9 Unit Apartments | 952 | 4.5% |
| 10 or more Apartments | 2,468 | 11.7% |
| Mobile Home / Other | 115 | 0.5% |
| Total | 21,085 | 100.0% |
Housing Structures by Occupancy in Weston
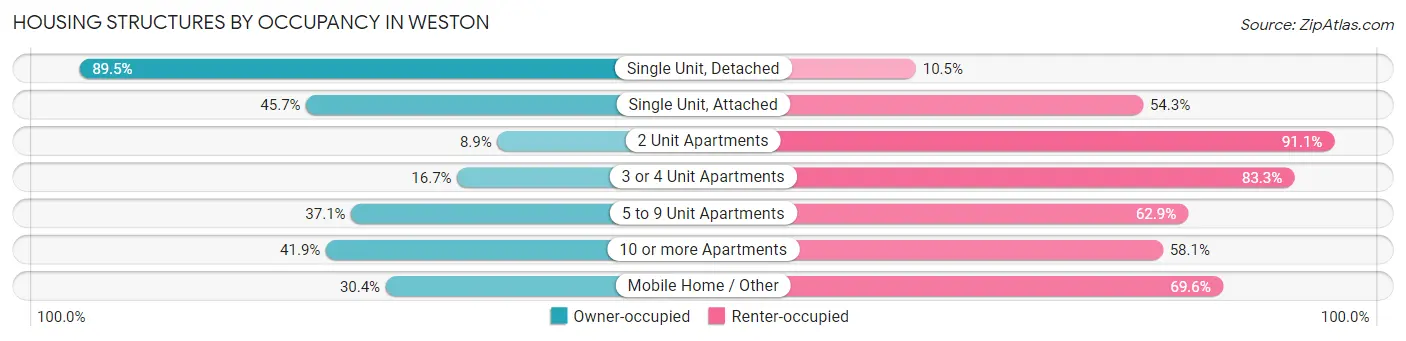
| Structure Type | Owner-occupied | Renter-occupied |
| Single Unit, Detached | 12,540 (89.5%) | 1,475 (10.5%) |
| Single Unit, Attached | 1,322 (45.7%) | 1,568 (54.3%) |
| 2 Unit Apartments | 11 (8.9%) | 112 (91.1%) |
| 3 or 4 Unit Apartments | 87 (16.7%) | 435 (83.3%) |
| 5 to 9 Unit Apartments | 353 (37.1%) | 599 (62.9%) |
| 10 or more Apartments | 1,035 (41.9%) | 1,433 (58.1%) |
| Mobile Home / Other | 35 (30.4%) | 80 (69.6%) |
| Total | 15,383 (73.0%) | 5,702 (27.0%) |
Housing Structures by Number of Rooms in Weston
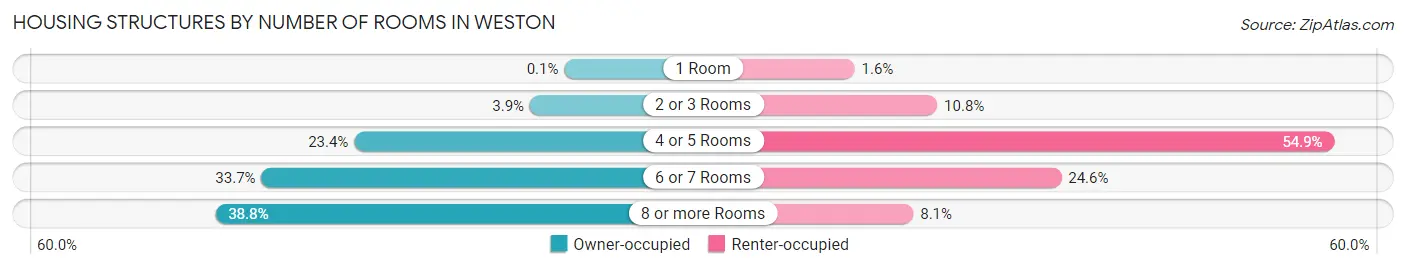
| Number of Rooms | Owner-occupied | Renter-occupied |
| 1 Room | 15 (0.1%) | 93 (1.6%) |
| 2 or 3 Rooms | 603 (3.9%) | 615 (10.8%) |
| 4 or 5 Rooms | 3,603 (23.4%) | 3,129 (54.9%) |
| 6 or 7 Rooms | 5,187 (33.7%) | 1,401 (24.6%) |
| 8 or more Rooms | 5,975 (38.8%) | 464 (8.1%) |
| Total | 15,383 (100.0%) | 5,702 (100.0%) |
Housing Structure by Heating Type in Weston
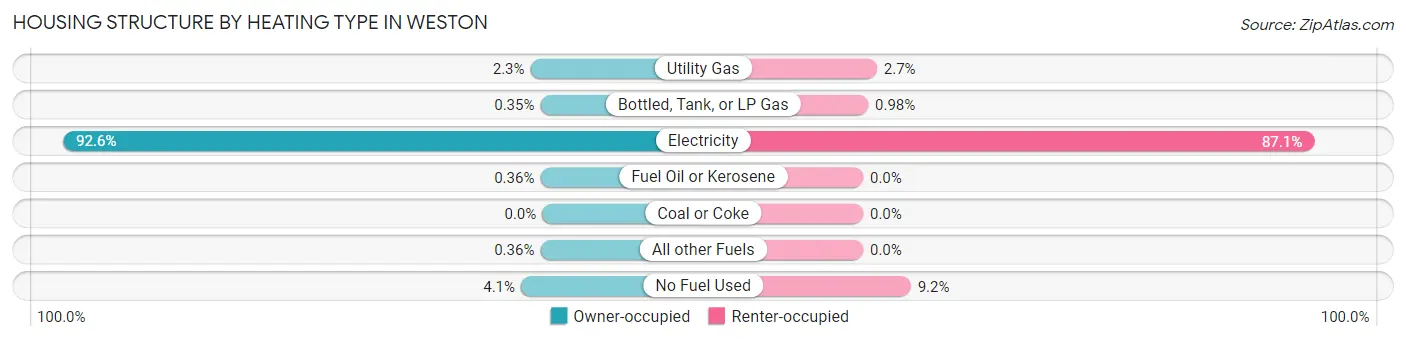
| Heating Type | Owner-occupied | Renter-occupied |
| Utility Gas | 349 (2.3%) | 152 (2.7%) |
| Bottled, Tank, or LP Gas | 54 (0.4%) | 56 (1.0%) |
| Electricity | 14,238 (92.6%) | 4,968 (87.1%) |
| Fuel Oil or Kerosene | 56 (0.4%) | 0 (0.0%) |
| Coal or Coke | 0 (0.0%) | 0 (0.0%) |
| All other Fuels | 56 (0.4%) | 0 (0.0%) |
| No Fuel Used | 630 (4.1%) | 526 (9.2%) |
| Total | 15,383 (100.0%) | 5,702 (100.0%) |
Household Vehicle Usage in Weston
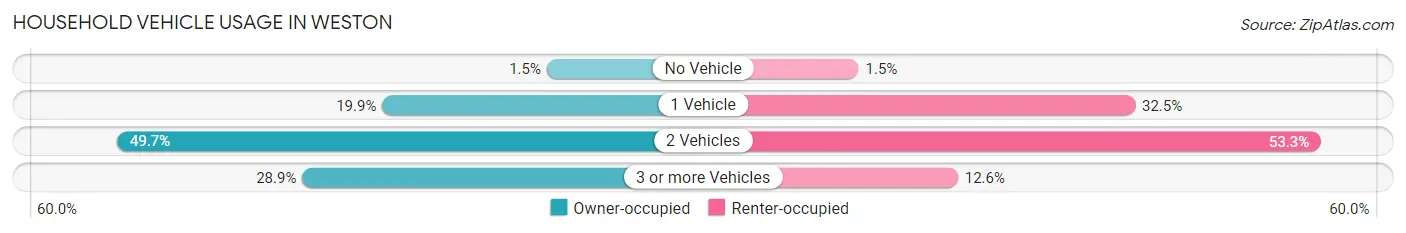
| Vehicles per Household | Owner-occupied | Renter-occupied |
| No Vehicle | 231 (1.5%) | 87 (1.5%) |
| 1 Vehicle | 3,068 (19.9%) | 1,853 (32.5%) |
| 2 Vehicles | 7,639 (49.7%) | 3,041 (53.3%) |
| 3 or more Vehicles | 4,445 (28.9%) | 721 (12.6%) |
| Total | 15,383 (100.0%) | 5,702 (100.0%) |
Real Estate & Mortgages in Weston
Real Estate and Mortgage Overview in Weston
| Characteristic | Without Mortgage | With Mortgage |
| Housing Units | 4,911 | 10,472 |
| Median Property Value | $611,300 | $613,300 |
| Median Household Income | $115,617 | $6,035 |
| Monthly Housing Costs | $1,292 | $5,742 |
| Real Estate Taxes | $6,726 | $37 |
Property Value by Mortgage Status in Weston
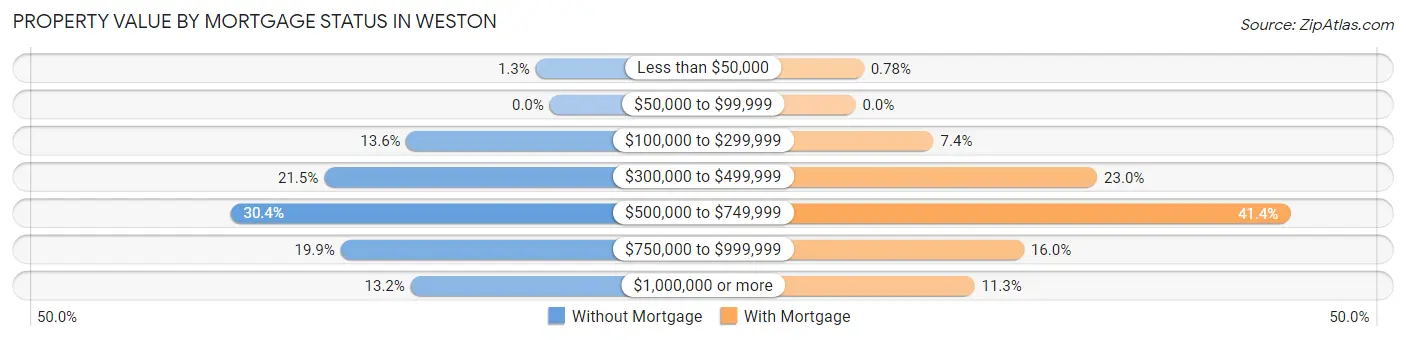
| Property Value | Without Mortgage | With Mortgage |
| Less than $50,000 | 66 (1.3%) | 82 (0.8%) |
| $50,000 to $99,999 | 0 (0.0%) | 0 (0.0%) |
| $100,000 to $299,999 | 670 (13.6%) | 779 (7.4%) |
| $300,000 to $499,999 | 1,055 (21.5%) | 2,410 (23.0%) |
| $500,000 to $749,999 | 1,492 (30.4%) | 4,334 (41.4%) |
| $750,000 to $999,999 | 978 (19.9%) | 1,680 (16.0%) |
| $1,000,000 or more | 650 (13.2%) | 1,187 (11.3%) |
| Total | 4,911 (100.0%) | 10,472 (100.0%) |
Household Income by Mortgage Status in Weston
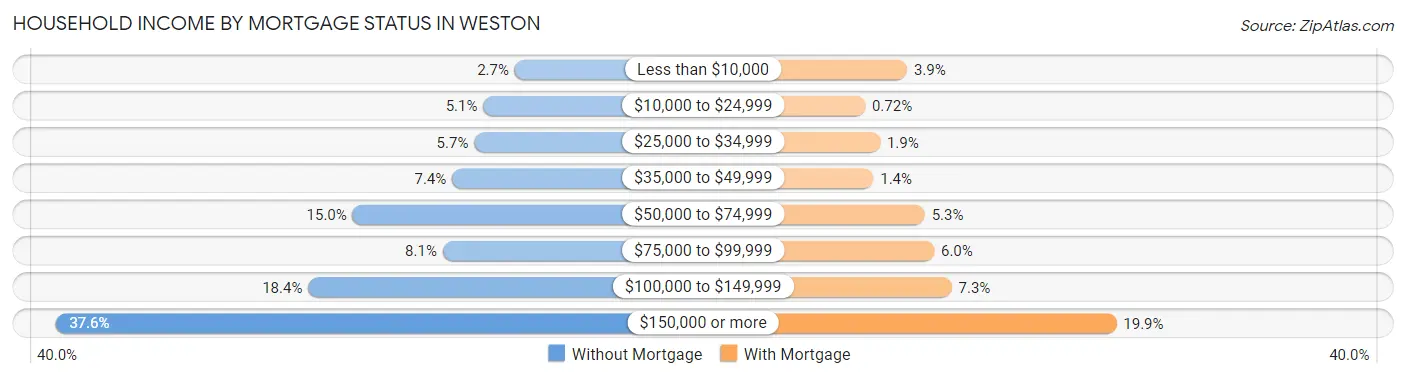
| Household Income | Without Mortgage | With Mortgage |
| Less than $10,000 | 130 (2.6%) | 410 (3.9%) |
| $10,000 to $24,999 | 248 (5.1%) | 75 (0.7%) |
| $25,000 to $34,999 | 282 (5.7%) | 195 (1.9%) |
| $35,000 to $49,999 | 365 (7.4%) | 141 (1.3%) |
| $50,000 to $74,999 | 737 (15.0%) | 552 (5.3%) |
| $75,000 to $99,999 | 400 (8.1%) | 626 (6.0%) |
| $100,000 to $149,999 | 903 (18.4%) | 767 (7.3%) |
| $150,000 or more | 1,846 (37.6%) | 2,081 (19.9%) |
| Total | 4,911 (100.0%) | 10,472 (100.0%) |
Property Value to Household Income Ratio in Weston
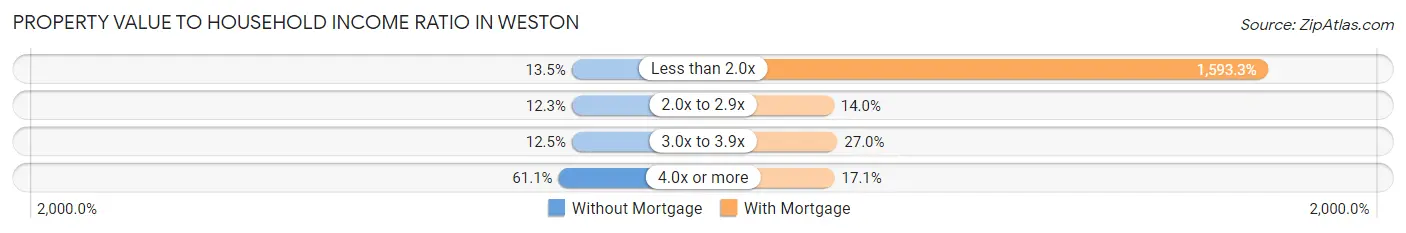
| Value-to-Income Ratio | Without Mortgage | With Mortgage |
| Less than 2.0x | 663 (13.5%) | 166,845 (1,593.2%) |
| 2.0x to 2.9x | 604 (12.3%) | 1,461 (14.0%) |
| 3.0x to 3.9x | 613 (12.5%) | 2,823 (27.0%) |
| 4.0x or more | 3,002 (61.1%) | 1,786 (17.1%) |
| Total | 4,911 (100.0%) | 10,472 (100.0%) |
Real Estate Taxes by Mortgage Status in Weston
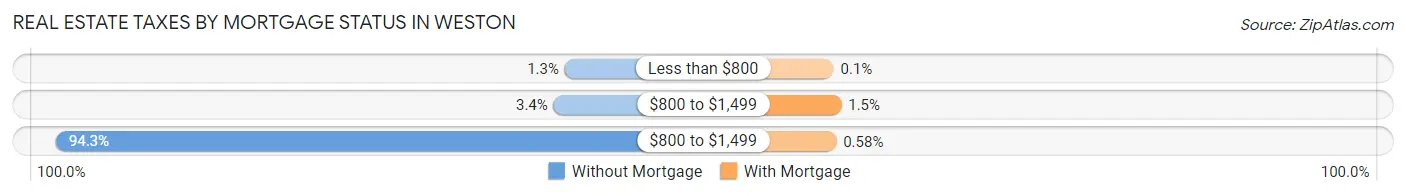
| Property Taxes | Without Mortgage | With Mortgage |
| Less than $800 | 66 (1.3%) | 10 (0.1%) |
| $800 to $1,499 | 166 (3.4%) | 157 (1.5%) |
| $800 to $1,499 | 4,630 (94.3%) | 61 (0.6%) |
| Total | 4,911 (100.0%) | 10,472 (100.0%) |
Health & Disability in Weston
Health Insurance Coverage by Age in Weston
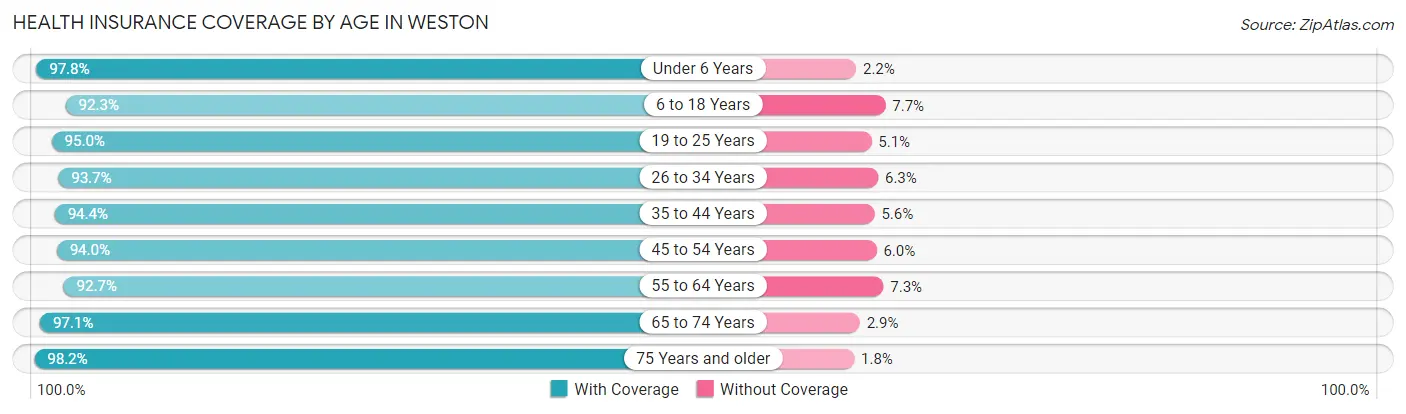
| Age Bracket | With Coverage | Without Coverage |
| Under 6 Years | 4,374 (97.8%) | 98 (2.2%) |
| 6 to 18 Years | 15,090 (92.3%) | 1,252 (7.7%) |
| 19 to 25 Years | 4,546 (95.0%) | 242 (5.1%) |
| 26 to 34 Years | 3,382 (93.7%) | 227 (6.3%) |
| 35 to 44 Years | 8,564 (94.4%) | 510 (5.6%) |
| 45 to 54 Years | 12,607 (94.0%) | 805 (6.0%) |
| 55 to 64 Years | 8,217 (92.7%) | 645 (7.3%) |
| 65 to 74 Years | 4,152 (97.1%) | 123 (2.9%) |
| 75 Years and older | 3,050 (98.2%) | 57 (1.8%) |
| Total | 63,982 (94.2%) | 3,959 (5.8%) |
Health Insurance Coverage by Citizenship Status in Weston
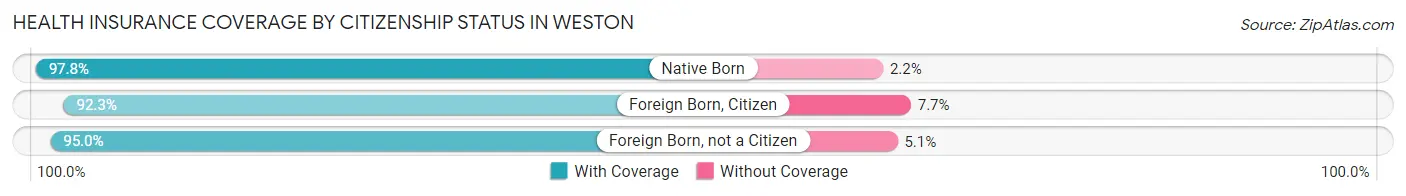
| Citizenship Status | With Coverage | Without Coverage |
| Native Born | 4,374 (97.8%) | 98 (2.2%) |
| Foreign Born, Citizen | 15,090 (92.3%) | 1,252 (7.7%) |
| Foreign Born, not a Citizen | 4,546 (95.0%) | 242 (5.1%) |
Health Insurance Coverage by Household Income in Weston
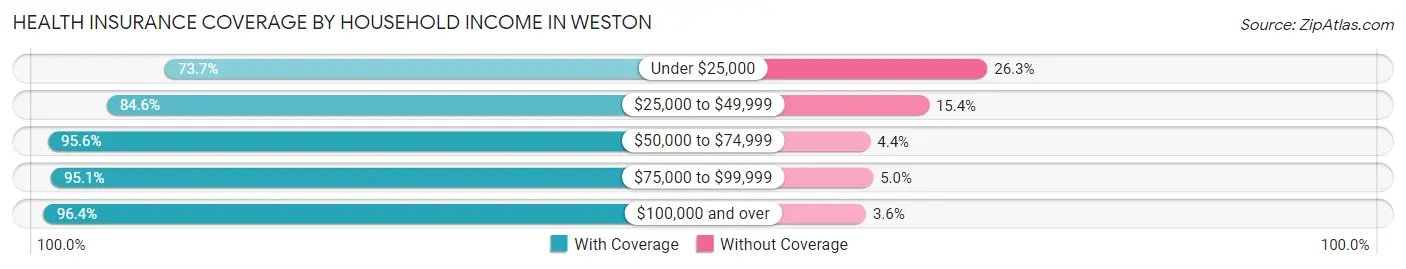
| Household Income | With Coverage | Without Coverage |
| Under $25,000 | 2,224 (73.7%) | 795 (26.3%) |
| $25,000 to $49,999 | 4,838 (84.6%) | 880 (15.4%) |
| $50,000 to $74,999 | 6,609 (95.6%) | 305 (4.4%) |
| $75,000 to $99,999 | 6,861 (95.1%) | 357 (5.0%) |
| $100,000 and over | 43,450 (96.4%) | 1,622 (3.6%) |
Public vs Private Health Insurance Coverage by Age in Weston
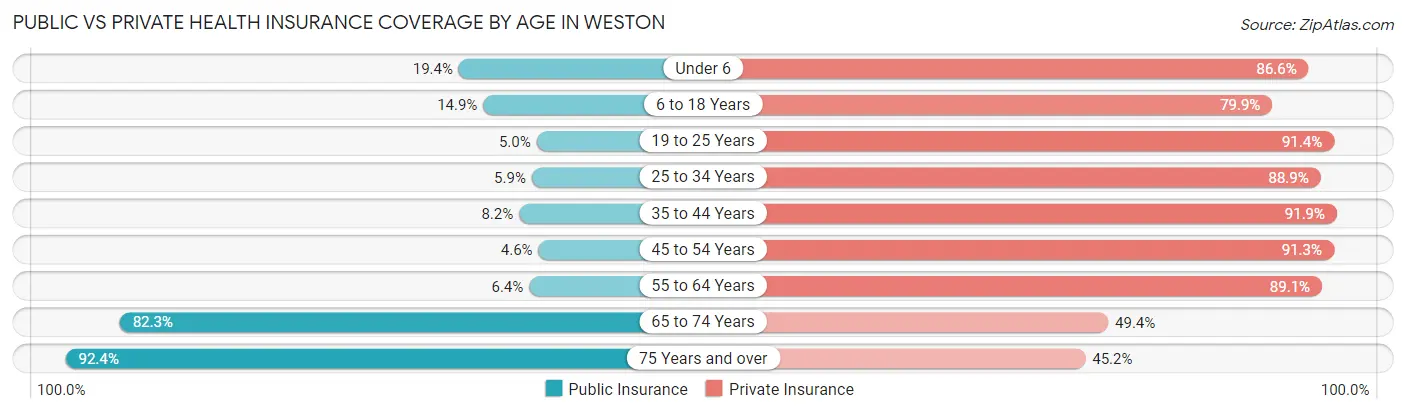
| Age Bracket | Public Insurance | Private Insurance |
| Under 6 | 868 (19.4%) | 3,874 (86.6%) |
| 6 to 18 Years | 2,431 (14.9%) | 13,054 (79.9%) |
| 19 to 25 Years | 238 (5.0%) | 4,374 (91.3%) |
| 25 to 34 Years | 212 (5.9%) | 3,207 (88.9%) |
| 35 to 44 Years | 746 (8.2%) | 8,337 (91.9%) |
| 45 to 54 Years | 621 (4.6%) | 12,248 (91.3%) |
| 55 to 64 Years | 563 (6.4%) | 7,897 (89.1%) |
| 65 to 74 Years | 3,520 (82.3%) | 2,113 (49.4%) |
| 75 Years and over | 2,871 (92.4%) | 1,404 (45.2%) |
| Total | 12,070 (17.8%) | 56,508 (83.2%) |
Disability Status by Sex by Age in Weston
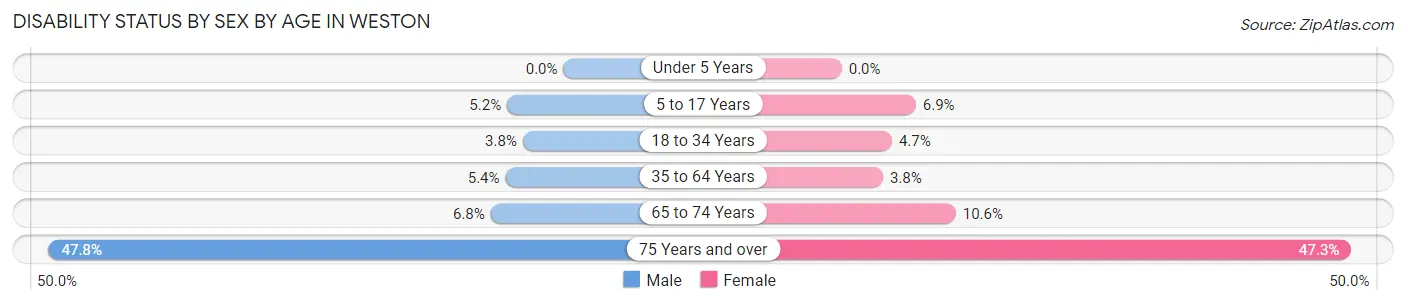
| Age Bracket | Male | Female |
| Under 5 Years | 0 (0.0%) | 0 (0.0%) |
| 5 to 17 Years | 423 (5.2%) | 525 (6.9%) |
| 18 to 34 Years | 163 (3.8%) | 260 (4.7%) |
| 35 to 64 Years | 838 (5.4%) | 602 (3.8%) |
| 65 to 74 Years | 138 (6.8%) | 236 (10.6%) |
| 75 Years and over | 687 (47.8%) | 789 (47.3%) |
Disability Class by Sex by Age in Weston
Disability Class: Hearing Difficulty
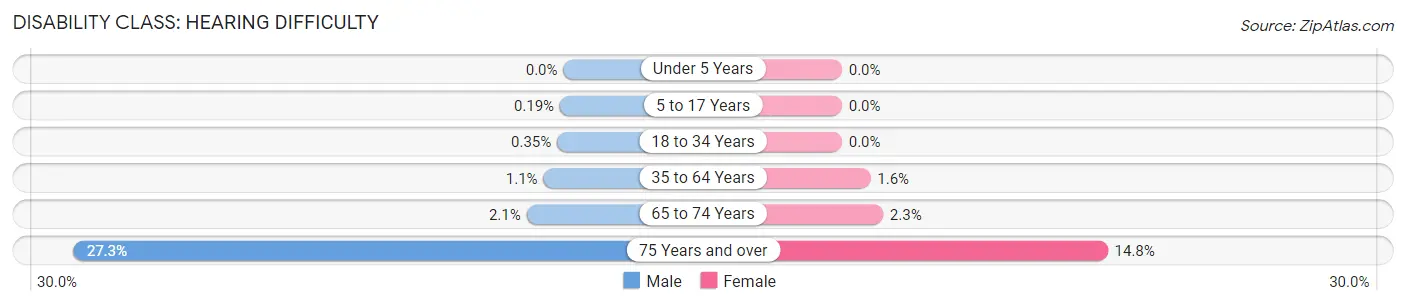
| Age Bracket | Male | Female |
| Under 5 Years | 0 (0.0%) | 0 (0.0%) |
| 5 to 17 Years | 15 (0.2%) | 0 (0.0%) |
| 18 to 34 Years | 15 (0.4%) | 0 (0.0%) |
| 35 to 64 Years | 173 (1.1%) | 251 (1.6%) |
| 65 to 74 Years | 42 (2.1%) | 51 (2.3%) |
| 75 Years and over | 392 (27.3%) | 247 (14.8%) |
Disability Class: Vision Difficulty
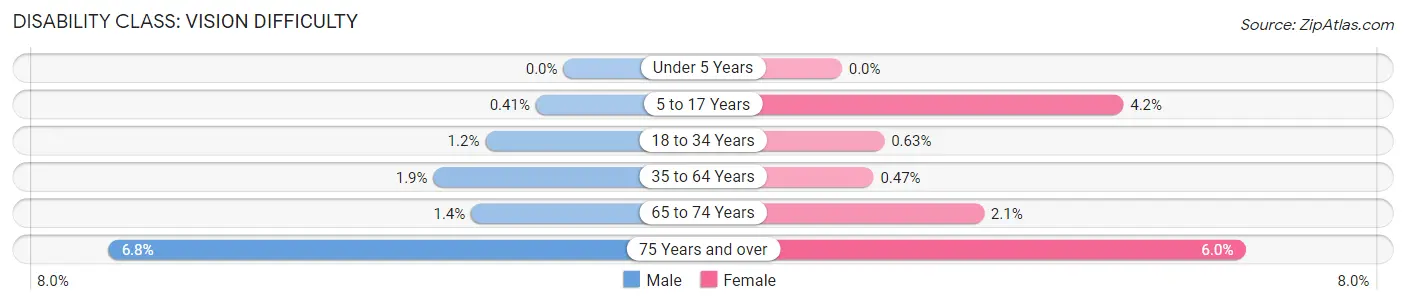
| Age Bracket | Male | Female |
| Under 5 Years | 0 (0.0%) | 0 (0.0%) |
| 5 to 17 Years | 33 (0.4%) | 319 (4.2%) |
| 18 to 34 Years | 50 (1.2%) | 35 (0.6%) |
| 35 to 64 Years | 301 (1.9%) | 74 (0.5%) |
| 65 to 74 Years | 28 (1.4%) | 47 (2.1%) |
| 75 Years and over | 97 (6.8%) | 100 (6.0%) |
Disability Class: Cognitive Difficulty
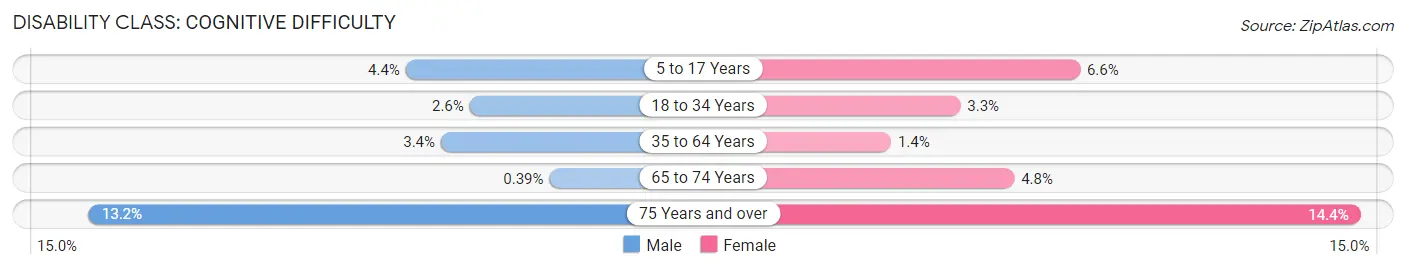
| Age Bracket | Male | Female |
| 5 to 17 Years | 355 (4.4%) | 506 (6.6%) |
| 18 to 34 Years | 113 (2.6%) | 184 (3.3%) |
| 35 to 64 Years | 531 (3.4%) | 216 (1.4%) |
| 65 to 74 Years | 8 (0.4%) | 107 (4.8%) |
| 75 Years and over | 190 (13.2%) | 241 (14.4%) |
Disability Class: Ambulatory Difficulty
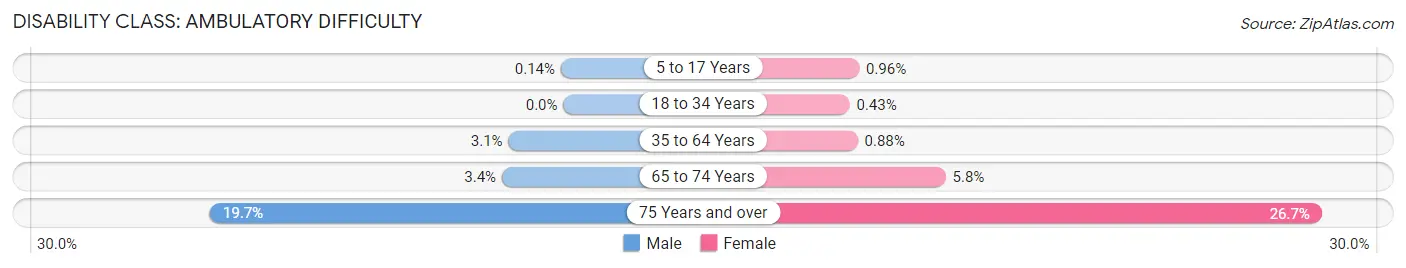
| Age Bracket | Male | Female |
| 5 to 17 Years | 11 (0.1%) | 73 (1.0%) |
| 18 to 34 Years | 0 (0.0%) | 24 (0.4%) |
| 35 to 64 Years | 477 (3.1%) | 138 (0.9%) |
| 65 to 74 Years | 70 (3.4%) | 129 (5.8%) |
| 75 Years and over | 283 (19.7%) | 446 (26.7%) |
Disability Class: Self-Care Difficulty
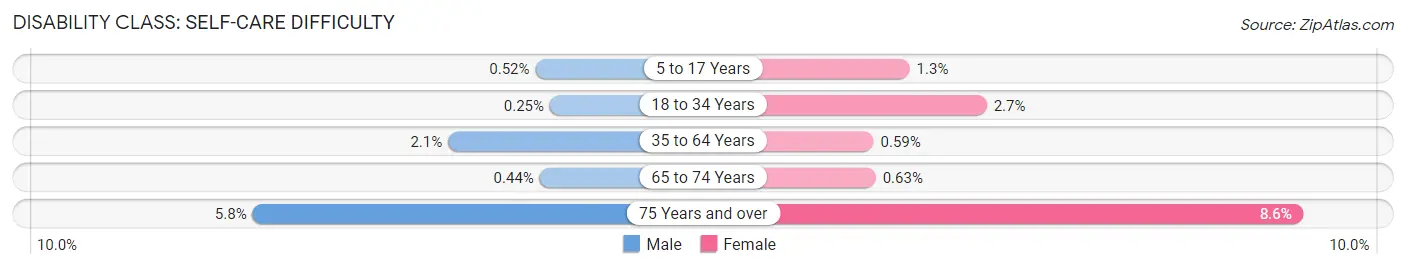
| Age Bracket | Male | Female |
| 5 to 17 Years | 42 (0.5%) | 96 (1.3%) |
| 18 to 34 Years | 11 (0.3%) | 150 (2.7%) |
| 35 to 64 Years | 333 (2.1%) | 93 (0.6%) |
| 65 to 74 Years | 9 (0.4%) | 14 (0.6%) |
| 75 Years and over | 83 (5.8%) | 143 (8.6%) |
Technology Access in Weston
Computing Device Access in Weston
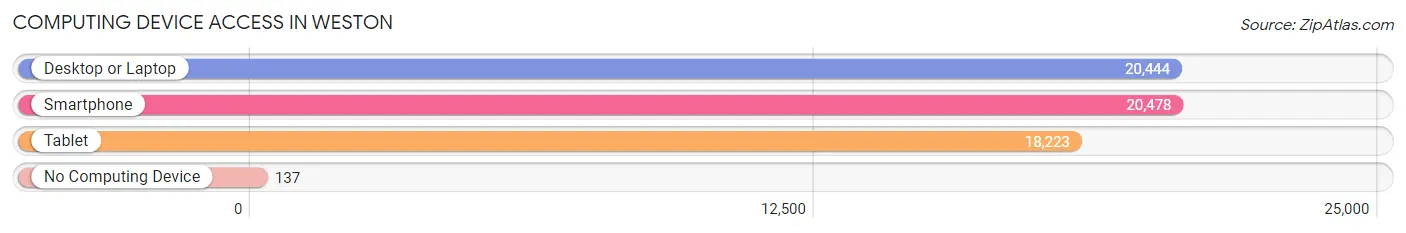
| Device Type | # Households | % Households |
| Desktop or Laptop | 20,444 | 97.0% |
| Smartphone | 20,478 | 97.1% |
| Tablet | 18,223 | 86.4% |
| No Computing Device | 137 | 0.6% |
| Total | 21,085 | 100.0% |
Internet Access in Weston
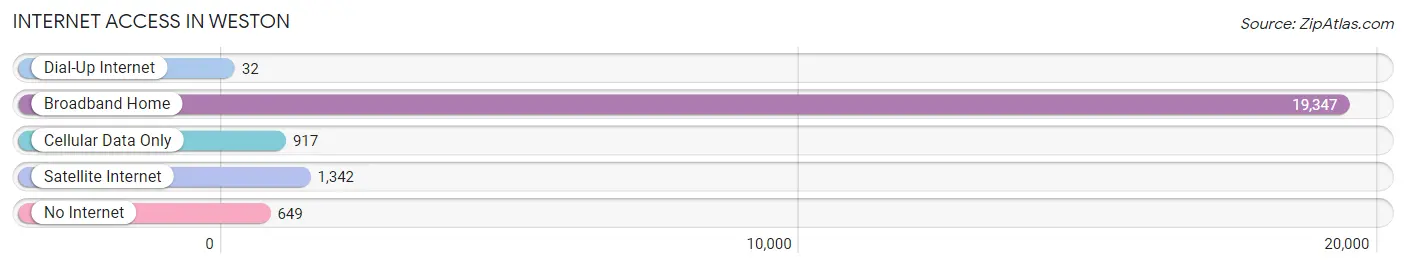
| Internet Type | # Households | % Households |
| Dial-Up Internet | 32 | 0.2% |
| Broadband Home | 19,347 | 91.8% |
| Cellular Data Only | 917 | 4.3% |
| Satellite Internet | 1,342 | 6.4% |
| No Internet | 649 | 3.1% |
| Total | 21,085 | 100.0% |
Weston Summary
Weston is a city located in Broward County, Florida, United States. It is the most western city in Broward County, and its population was 65,333 as of the 2010 census. Weston is part of the South Florida metropolitan area, which was home to 5,564,635 people at the 2010 census.
History
Weston was founded in 1996 by Arvida/JMB Realty (now St. Joe Company), and was named after the founder of Arvida, Arthur Vining Davis. The city was designed as a master-planned community, and was one of the first such communities in the United States. It was designed to have a rural feel, with large lots and winding roads.
Geography
Weston is located in the western part of Broward County, and is bordered by the cities of Davie, Southwest Ranches, Pembroke Pines, and Miramar. It is located about 20 miles (32 km) west of Fort Lauderdale, and about 25 miles (40 km) north of Miami.
The city has a total area of 27.3 square miles (70.7 km2), of which 26.9 square miles (69.6 km2) is land and 0.4 square miles (1.1 km2) is water.
Economy
Weston is a major business center in South Florida, and is home to many corporate headquarters, including Ultimate Software, Citrix Systems, and Ultimate Medical Academy. The city also has a large number of medical and healthcare facilities, including Cleveland Clinic Florida, Memorial Hospital West, and Broward Health Weston.
Demographics
As of the 2010 census, there were 65,333 people, 22,717 households, and 18,845 families residing in the city. The population density was 2,425.3 people per square mile (936.2/km2). There were 24,068 housing units at an average density of 890.2 per square mile (344.3/km2). The racial makeup of the city was 77.2% White (non-Hispanic), 8.3% African American, 0.2% Native American, 8.2% Asian, 0.1% Pacific Islander, 3.2% from other races, and 2.9% from two or more races. Hispanic or Latino of any race were 19.2% of the population.
The median income for a household in the city was $87,811, and the median income for a family was $97,813. Males had a median income of $71,945 versus $45,945 for females. The per capita income for the city was $37,945. About 3.2% of families and 4.3% of the population were below the poverty line, including 5.2% of those under age 18 and 4.2% of those age 65 or over.
Common Questions
What is Per Capita Income in Weston?
Per Capita income in Weston is $54,943.
What is the Median Family Income in Weston?
Median Family Income in Weston is $137,145.
What is the Median Household income in Weston?
Median Household Income in Weston is $132,832.
What is Income or Wage Gap in Weston?
Income or Wage Gap in Weston is 46.0%.
Women in Weston earn 54.0 cents for every dollar earned by a man.
What is Family Income Deficit in Weston?
Family Income Deficit in Weston is $9,874.
Families that are below poverty line in Weston earn $9,874 less on average than the poverty threshold level.
What is Inequality or Gini Index in Weston?
Inequality or Gini Index in Weston is 0.44.
What is the Total Population of Weston?
Total Population of Weston is 68,029.
What is the Total Male Population of Weston?
Total Male Population of Weston is 33,361.
What is the Total Female Population of Weston?
Total Female Population of Weston is 34,668.
What is the Ratio of Males per 100 Females in Weston?
There are 96.23 Males per 100 Females in Weston.
What is the Ratio of Females per 100 Males in Weston?
There are 103.92 Females per 100 Males in Weston.
What is the Median Population Age in Weston?
Median Population Age in Weston is 41.1 Years.
What is the Average Family Size in Weston
Average Family Size in Weston is 3.4 People.
What is the Average Household Size in Weston
Average Household Size in Weston is 3.2 People.
How Large is the Labor Force in Weston?
There are 33,551 People in the Labor Forcein in Weston.
What is the Percentage of People in the Labor Force in Weston?
64.9% of People are in the Labor Force in Weston.
What is the Unemployment Rate in Weston?
Unemployment Rate in Weston is 3.6%.