Kendall West, FL Map & Demographics
Kendall West Map
Kendall West Overview
$29,171
PER CAPITA INCOME
$66,404
AVG FAMILY INCOME
$62,839
AVG HOUSEHOLD INCOME
12.7%
WAGE / INCOME GAP [ % ]
87.3¢/ $1
WAGE / INCOME GAP [ $ ]
$6,737
FAMILY INCOME DEFICIT
0.42
INEQUALITY / GINI INDEX
35,606
TOTAL POPULATION
16,668
MALE POPULATION
18,938
FEMALE POPULATION
88.01
MALES / 100 FEMALES
113.62
FEMALES / 100 MALES
44.4
MEDIAN AGE
3.1
AVG FAMILY SIZE
2.8
AVG HOUSEHOLD SIZE
19,961
LABOR FORCE [ PEOPLE ]
65.1%
PERCENT IN LABOR FORCE
2.9%
UNEMPLOYMENT RATE
Income in Kendall West
Income Overview in Kendall West
Per Capita Income in Kendall West is $29,171, while median incomes of families and households are $66,404 and $62,839 respectively.
| Characteristic | Number | Measure |
| Per Capita Income | 35,606 | $29,171 |
| Median Family Income | 9,696 | $66,404 |
| Mean Family Income | 9,696 | $80,879 |
| Median Household Income | 12,775 | $62,839 |
| Mean Household Income | 12,775 | $77,183 |
| Income Deficit | 9,696 | $6,737 |
| Wage / Income Gap (%) | 35,606 | 12.69% |
| Wage / Income Gap ($) | 35,606 | 87.31¢ per $1 |
| Gini / Inequality Index | 35,606 | 0.42 |
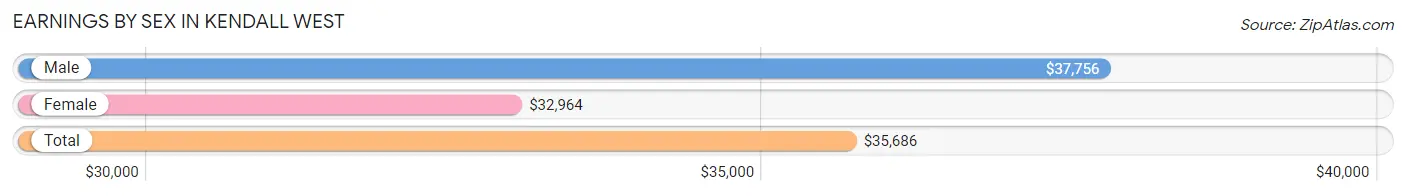
Earnings by Sex in Kendall West
Average Earnings in Kendall West are $35,686, $37,756 for men and $32,964 for women, a difference of 12.7%.
| Sex | Number | Average Earnings |
| Male | 10,019 (50.0%) | $37,756 |
| Female | 10,031 (50.0%) | $32,964 |
| Total | 20,050 (100.0%) | $35,686 |
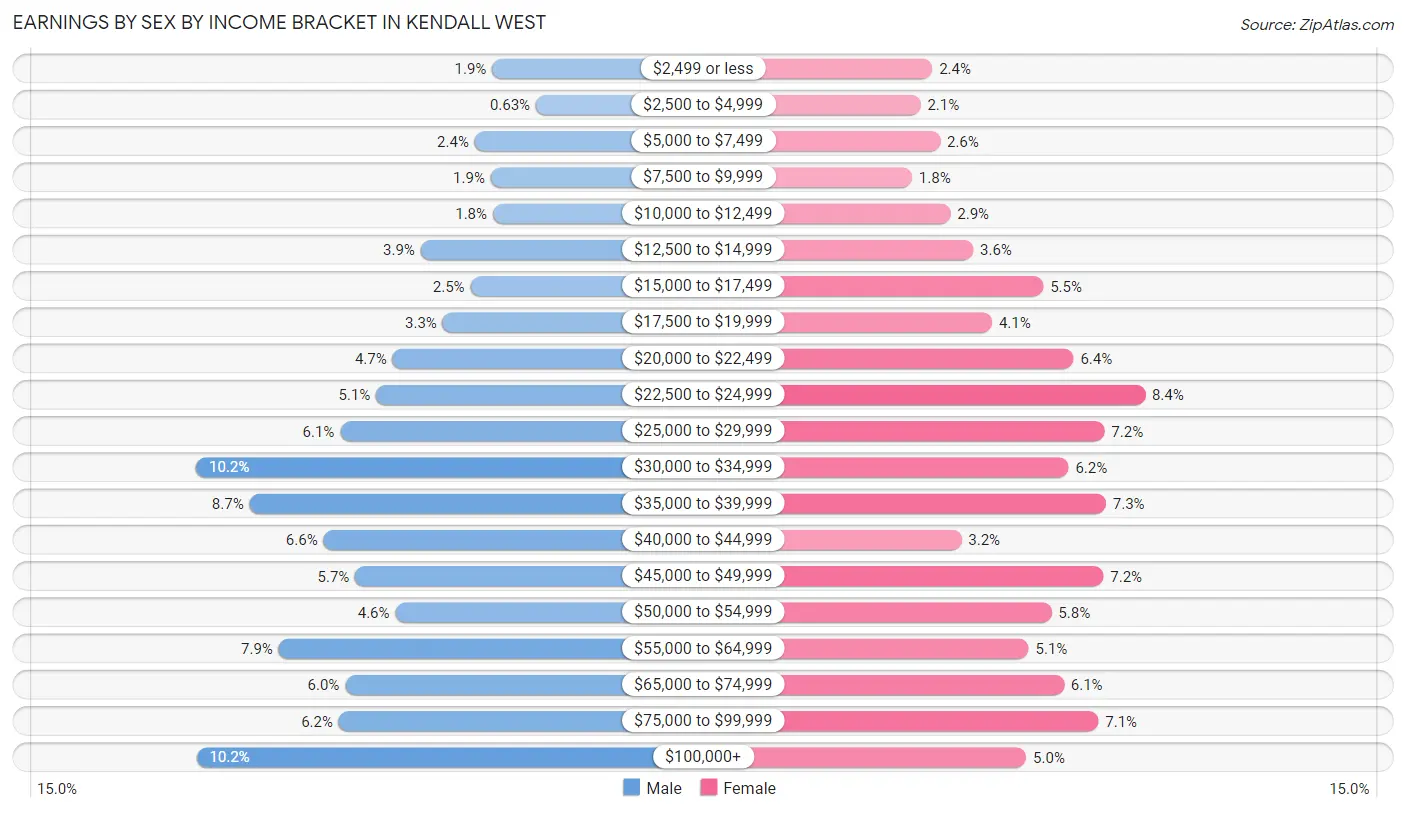
Earnings by Sex by Income Bracket in Kendall West
The most common earnings brackets in Kendall West are $30,000 to $34,999 for men (1,020 | 10.2%) and $22,500 to $24,999 for women (841 | 8.4%).
| Income | Male | Female |
| $2,499 or less | 186 (1.9%) | 241 (2.4%) |
| $2,500 to $4,999 | 63 (0.6%) | 208 (2.1%) |
| $5,000 to $7,499 | 235 (2.4%) | 263 (2.6%) |
| $7,500 to $9,999 | 190 (1.9%) | 184 (1.8%) |
| $10,000 to $12,499 | 184 (1.8%) | 292 (2.9%) |
| $12,500 to $14,999 | 388 (3.9%) | 356 (3.5%) |
| $15,000 to $17,499 | 247 (2.5%) | 554 (5.5%) |
| $17,500 to $19,999 | 326 (3.3%) | 409 (4.1%) |
| $20,000 to $22,499 | 467 (4.7%) | 639 (6.4%) |
| $22,500 to $24,999 | 513 (5.1%) | 841 (8.4%) |
| $25,000 to $29,999 | 614 (6.1%) | 726 (7.2%) |
| $30,000 to $34,999 | 1,020 (10.2%) | 625 (6.2%) |
| $35,000 to $39,999 | 870 (8.7%) | 730 (7.3%) |
| $40,000 to $44,999 | 661 (6.6%) | 323 (3.2%) |
| $45,000 to $49,999 | 572 (5.7%) | 723 (7.2%) |
| $50,000 to $54,999 | 459 (4.6%) | 577 (5.8%) |
| $55,000 to $64,999 | 787 (7.9%) | 513 (5.1%) |
| $65,000 to $74,999 | 600 (6.0%) | 612 (6.1%) |
| $75,000 to $99,999 | 618 (6.2%) | 709 (7.1%) |
| $100,000+ | 1,019 (10.2%) | 506 (5.0%) |
| Total | 10,019 (100.0%) | 10,031 (100.0%) |
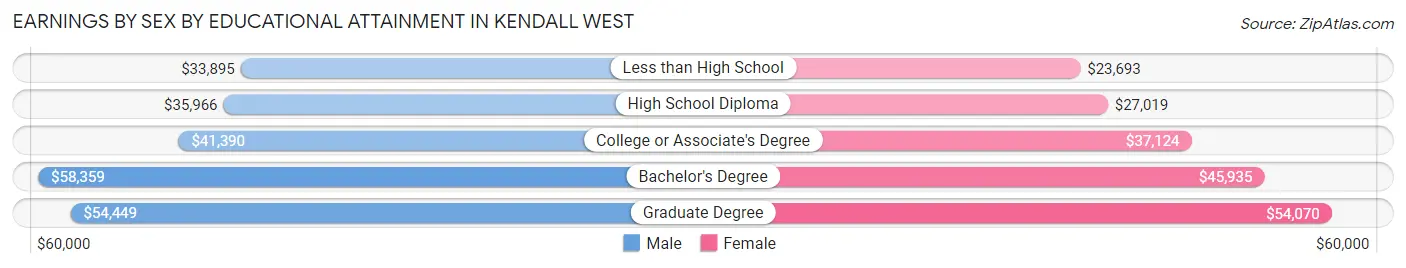
Earnings by Sex by Educational Attainment in Kendall West
Average earnings in Kendall West are $40,513 for men and $34,045 for women, a difference of 16.0%. Men with an educational attainment of bachelor's degree enjoy the highest average annual earnings of $58,359, while those with less than high school education earn the least with $33,895. Women with an educational attainment of graduate degree earn the most with the average annual earnings of $54,070, while those with less than high school education have the smallest earnings of $23,693.
| Educational Attainment | Male Income | Female Income |
| Less than High School | $33,895 | $23,693 |
| High School Diploma | $35,966 | $27,019 |
| College or Associate's Degree | $41,390 | $37,124 |
| Bachelor's Degree | $58,359 | $45,935 |
| Graduate Degree | $54,449 | $54,070 |
| Total | $40,513 | $34,045 |
Family Income in Kendall West
Family Income Brackets in Kendall West
According to the Kendall West family income data, there are 1,978 families falling into the $100,000 to $149,999 income range, which is the most common income bracket and makes up 20.4% of all families. Conversely, the less than $10,000 income bracket is the least frequent group with only 378 families (3.9%) belonging to this category.
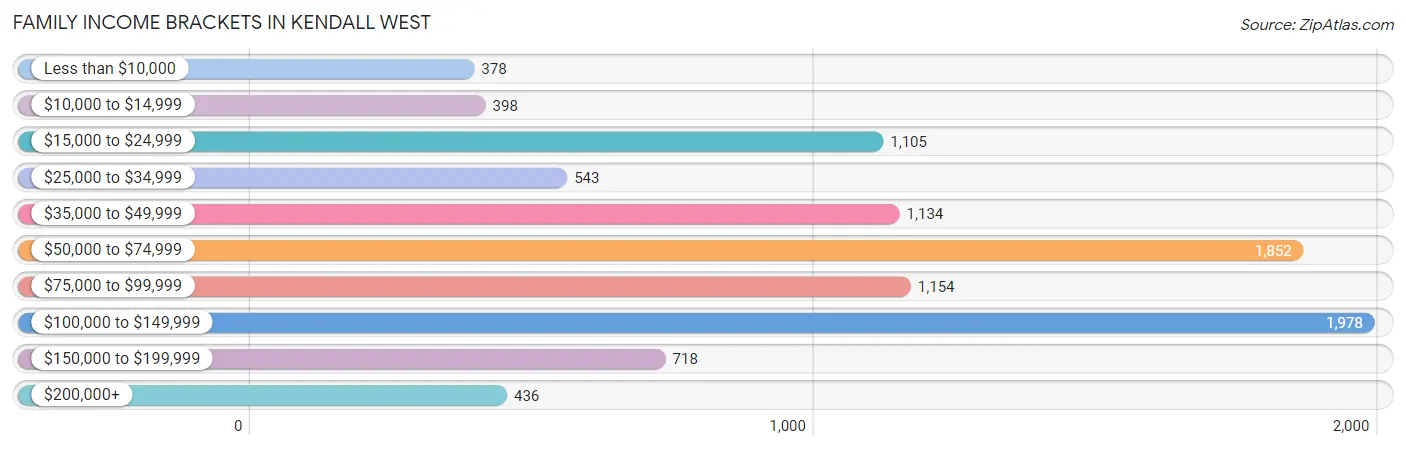
| Income Bracket | # Families | % Families |
| Less than $10,000 | 378 | 3.9% |
| $10,000 to $14,999 | 398 | 4.1% |
| $15,000 to $24,999 | 1,105 | 11.4% |
| $25,000 to $34,999 | 543 | 5.6% |
| $35,000 to $49,999 | 1,134 | 11.7% |
| $50,000 to $74,999 | 1,852 | 19.1% |
| $75,000 to $99,999 | 1,154 | 11.9% |
| $100,000 to $149,999 | 1,978 | 20.4% |
| $150,000 to $199,999 | 718 | 7.4% |
| $200,000+ | 436 | 4.5% |
Family Income by Famaliy Size in Kendall West
7+ person families (78 | 0.8%) account for the highest median family income in Kendall West with $164,167 per family, while 3-person families (2,352 | 24.3%) have the highest median income of $25,144 per family member.
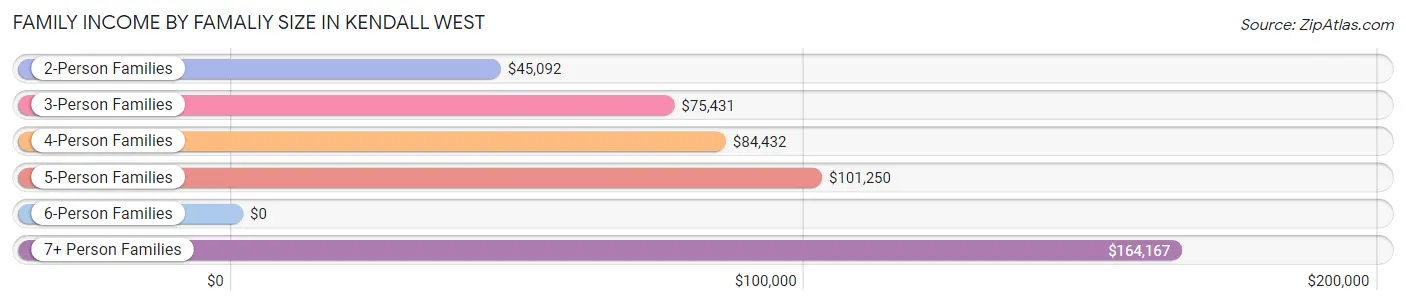
| Income Bracket | # Families | Median Income |
| 2-Person Families | 4,435 (45.7%) | $45,092 |
| 3-Person Families | 2,352 (24.3%) | $75,431 |
| 4-Person Families | 2,319 (23.9%) | $84,432 |
| 5-Person Families | 404 (4.2%) | $101,250 |
| 6-Person Families | 108 (1.1%) | $0 |
| 7+ Person Families | 78 (0.8%) | $164,167 |
| Total | 9,696 (100.0%) | $66,404 |
Family Income by Number of Earners in Kendall West
The median family income in Kendall West is $66,404, with families comprising 3+ earners (1,655) having the highest median family income of $110,671, while families with no earners (1,200) have the lowest median family income of $18,136, accounting for 17.1% and 12.4% of families, respectively.
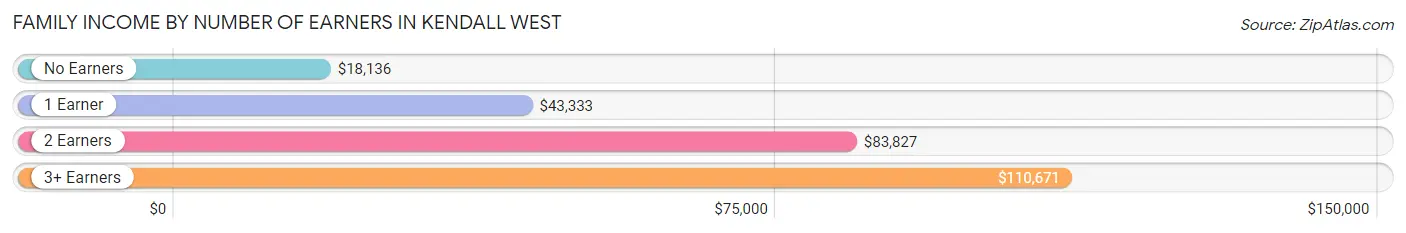
| Number of Earners | # Families | Median Income |
| No Earners | 1,200 (12.4%) | $18,136 |
| 1 Earner | 3,388 (34.9%) | $43,333 |
| 2 Earners | 3,453 (35.6%) | $83,827 |
| 3+ Earners | 1,655 (17.1%) | $110,671 |
| Total | 9,696 (100.0%) | $66,404 |
Household Income in Kendall West
Household Income Brackets in Kendall West
With 2,734 households falling in the category, the $50,000 to $74,999 income range is the most frequent in Kendall West, accounting for 21.4% of all households. In contrast, only 434 households (3.4%) fall into the less than $10,000 income bracket, making it the least populous group.
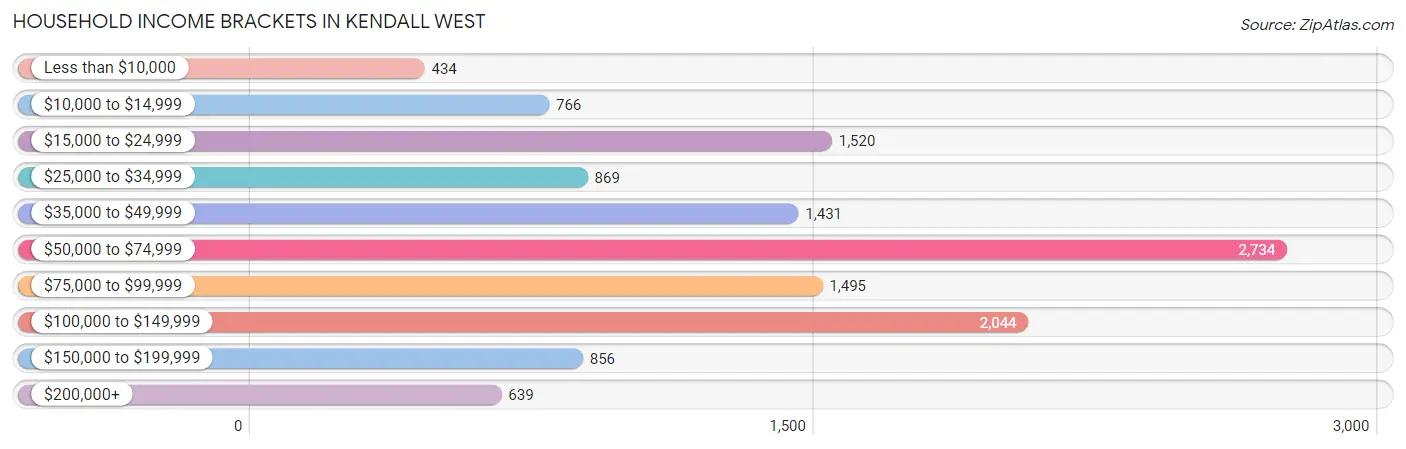
| Income Bracket | # Households | % Households |
| Less than $10,000 | 434 | 3.4% |
| $10,000 to $14,999 | 766 | 6.0% |
| $15,000 to $24,999 | 1,520 | 11.9% |
| $25,000 to $34,999 | 869 | 6.8% |
| $35,000 to $49,999 | 1,431 | 11.2% |
| $50,000 to $74,999 | 2,734 | 21.4% |
| $75,000 to $99,999 | 1,495 | 11.7% |
| $100,000 to $149,999 | 2,044 | 16.0% |
| $150,000 to $199,999 | 856 | 6.7% |
| $200,000+ | 639 | 5.0% |
Household Income by Householder Age in Kendall West
The median household income in Kendall West is $62,839, with the highest median household income of $69,764 found in the 45 to 64 years age bracket for the primary householder. A total of 5,429 households (42.5%) fall into this category. Meanwhile, the 65+ years age bracket for the primary householder has the lowest median household income of $42,547, with 3,628 households (28.4%) in this group.
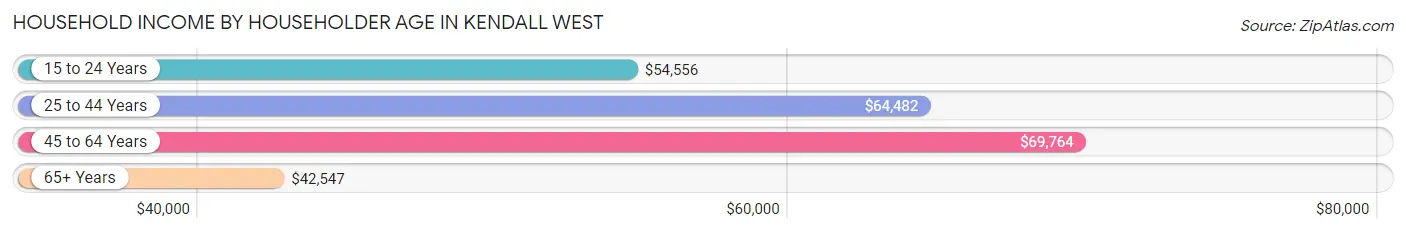
| Income Bracket | # Households | Median Income |
| 15 to 24 Years | 107 (0.8%) | $54,556 |
| 25 to 44 Years | 3,611 (28.3%) | $64,482 |
| 45 to 64 Years | 5,429 (42.5%) | $69,764 |
| 65+ Years | 3,628 (28.4%) | $42,547 |
| Total | 12,775 (100.0%) | $62,839 |
Poverty in Kendall West
Income Below Poverty by Sex and Age in Kendall West
With 14.2% poverty level for males and 15.0% for females among the residents of Kendall West, 75 year old and over males and 5 year old females are the most vulnerable to poverty, with 347 males (33.8%) and 32 females (41.6%) in their respective age groups living below the poverty level.
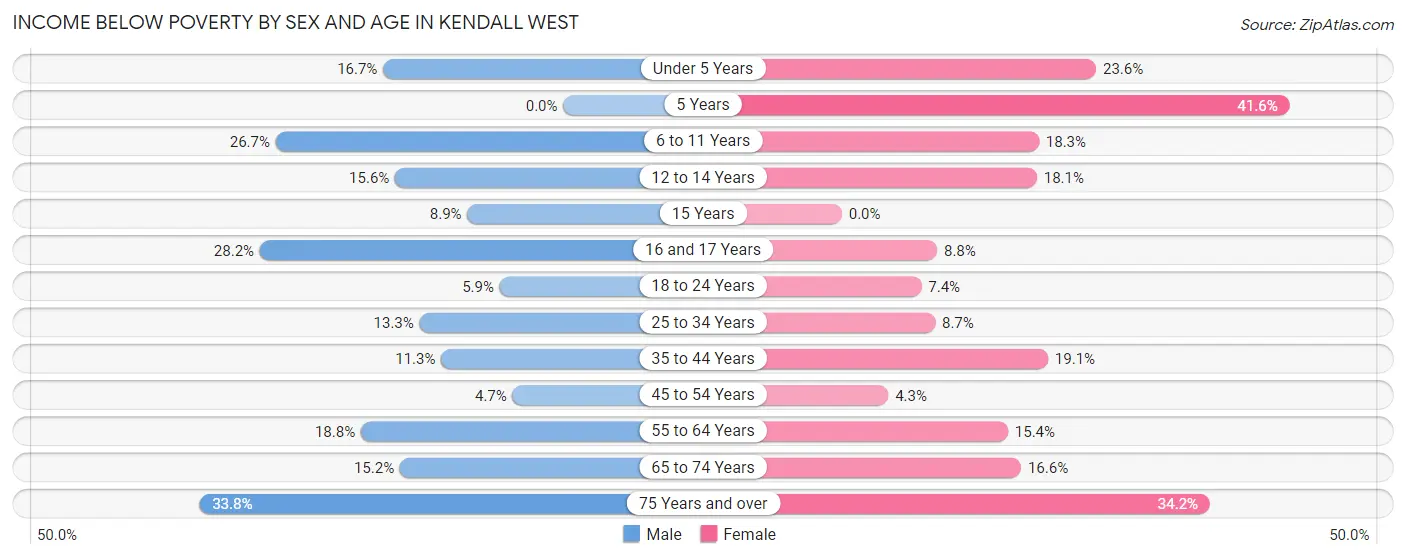
| Age Bracket | Male | Female |
| Under 5 Years | 99 (16.7%) | 147 (23.6%) |
| 5 Years | 0 (0.0%) | 32 (41.6%) |
| 6 to 11 Years | 229 (26.7%) | 124 (18.3%) |
| 12 to 14 Years | 106 (15.6%) | 126 (18.1%) |
| 15 Years | 29 (8.9%) | 0 (0.0%) |
| 16 and 17 Years | 87 (28.2%) | 35 (8.8%) |
| 18 to 24 Years | 96 (5.9%) | 111 (7.4%) |
| 25 to 34 Years | 357 (13.3%) | 207 (8.6%) |
| 35 to 44 Years | 221 (11.3%) | 446 (19.1%) |
| 45 to 54 Years | 125 (4.7%) | 137 (4.3%) |
| 55 to 64 Years | 434 (18.8%) | 393 (15.4%) |
| 65 to 74 Years | 218 (15.2%) | 349 (16.6%) |
| 75 Years and over | 347 (33.8%) | 734 (34.2%) |
| Total | 2,348 (14.2%) | 2,841 (15.0%) |
Income Above Poverty by Sex and Age in Kendall West
According to the poverty statistics in Kendall West, males aged 5 years and females aged 15 years are the age groups that are most secure financially, with 100.0% of males and 100.0% of females in these age groups living above the poverty line.
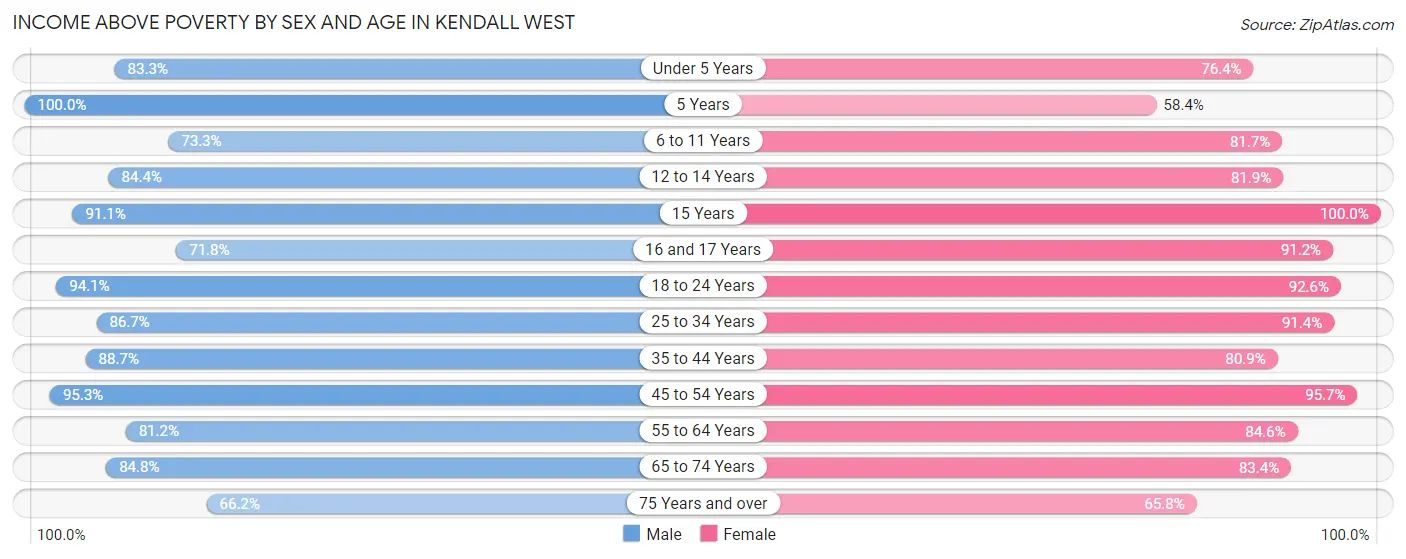
| Age Bracket | Male | Female |
| Under 5 Years | 493 (83.3%) | 476 (76.4%) |
| 5 Years | 132 (100.0%) | 45 (58.4%) |
| 6 to 11 Years | 629 (73.3%) | 554 (81.7%) |
| 12 to 14 Years | 573 (84.4%) | 570 (81.9%) |
| 15 Years | 297 (91.1%) | 197 (100.0%) |
| 16 and 17 Years | 222 (71.8%) | 361 (91.2%) |
| 18 to 24 Years | 1,530 (94.1%) | 1,394 (92.6%) |
| 25 to 34 Years | 2,320 (86.7%) | 2,185 (91.3%) |
| 35 to 44 Years | 1,729 (88.7%) | 1,886 (80.9%) |
| 45 to 54 Years | 2,528 (95.3%) | 3,044 (95.7%) |
| 55 to 64 Years | 1,877 (81.2%) | 2,158 (84.6%) |
| 65 to 74 Years | 1,220 (84.8%) | 1,750 (83.4%) |
| 75 Years and over | 680 (66.2%) | 1,415 (65.8%) |
| Total | 14,230 (85.8%) | 16,035 (85.0%) |
Income Below Poverty Among Married-Couple Families in Kendall West
The poverty statistics for married-couple families in Kendall West show that 11.0% or 667 of the total 6,066 families live below the poverty line. Families with 3 or 4 children have the highest poverty rate of 18.7%, comprising of 26 families. On the other hand, families with 1 or 2 children have the lowest poverty rate of 7.8%, which includes 154 families.
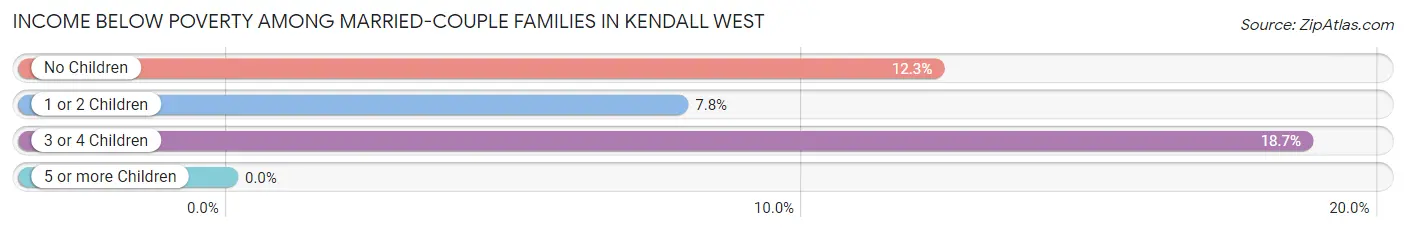
| Children | Above Poverty | Below Poverty |
| No Children | 3,476 (87.7%) | 487 (12.3%) |
| 1 or 2 Children | 1,810 (92.2%) | 154 (7.8%) |
| 3 or 4 Children | 113 (81.3%) | 26 (18.7%) |
| 5 or more Children | 0 (0.0%) | 0 (0.0%) |
| Total | 5,399 (89.0%) | 667 (11.0%) |
Income Below Poverty Among Single-Parent Households in Kendall West
According to the poverty data in Kendall West, 35.8% or 290 single-father households and 16.8% or 474 single-mother households are living below the poverty line. Among single-father households, those with no children have the highest poverty rate, with 233 households (39.1%) experiencing poverty. Likewise, among single-mother households, those with 3 or 4 children have the highest poverty rate, with 57 households (60.6%) falling below the poverty line.
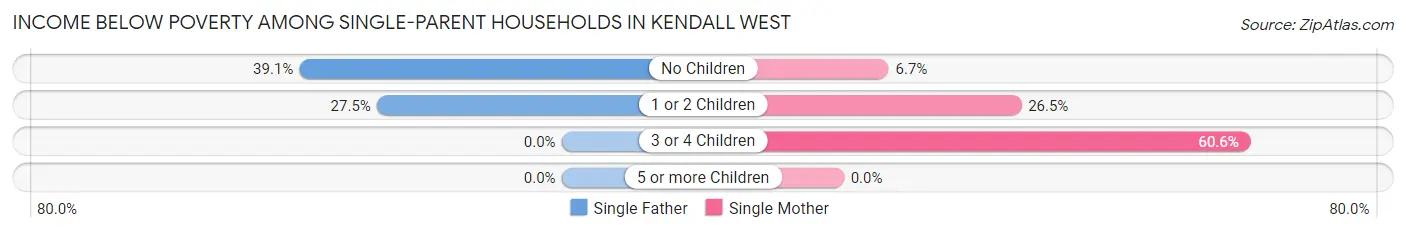
| Children | Single Father | Single Mother |
| No Children | 233 (39.1%) | 103 (6.7%) |
| 1 or 2 Children | 57 (27.5%) | 314 (26.5%) |
| 3 or 4 Children | 0 (0.0%) | 57 (60.6%) |
| 5 or more Children | 0 (0.0%) | 0 (0.0%) |
| Total | 290 (35.8%) | 474 (16.8%) |
Income Below Poverty Among Married-Couple vs Single-Parent Households in Kendall West
The poverty data for Kendall West shows that 667 of the married-couple family households (11.0%) and 764 of the single-parent households (21.0%) are living below the poverty level. Within the married-couple family households, those with 3 or 4 children have the highest poverty rate, with 26 households (18.7%) falling below the poverty line. Among the single-parent households, those with 3 or 4 children have the highest poverty rate, with 57 household (57.0%) living below poverty.
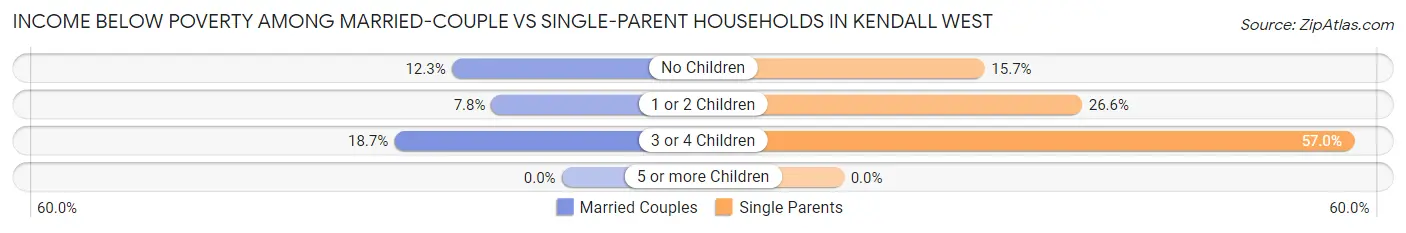
| Children | Married-Couple Families | Single-Parent Households |
| No Children | 487 (12.3%) | 336 (15.7%) |
| 1 or 2 Children | 154 (7.8%) | 371 (26.6%) |
| 3 or 4 Children | 26 (18.7%) | 57 (57.0%) |
| 5 or more Children | 0 (0.0%) | 0 (0.0%) |
| Total | 667 (11.0%) | 764 (21.0%) |
Race in Kendall West
The most populous races in Kendall West are Hispanic or Latino (32,204 | 90.4%), White / Caucasian (17,778 | 49.9%), and Two or more Races (14,904 | 41.9%).
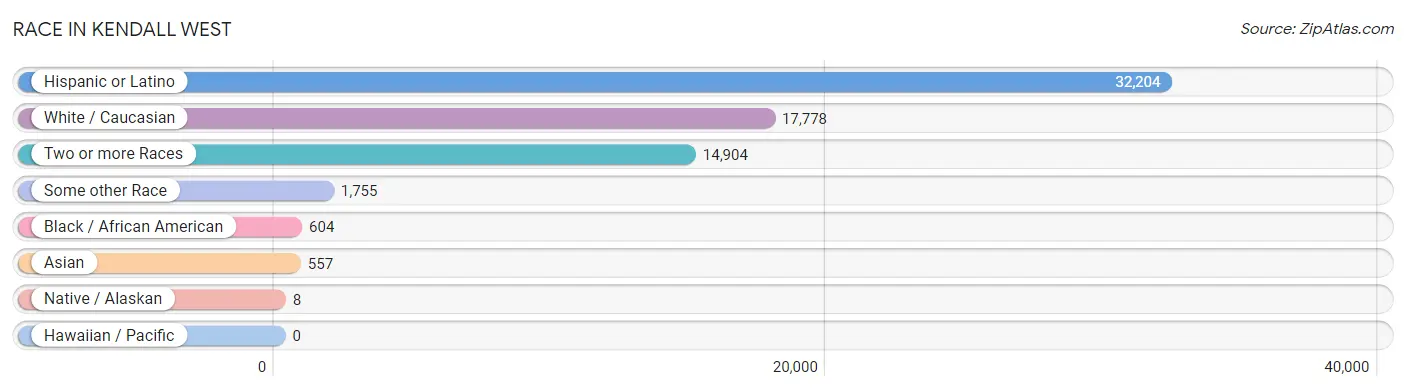
| Race | # Population | % Population |
| Asian | 557 | 1.6% |
| Black / African American | 604 | 1.7% |
| Hawaiian / Pacific | 0 | 0.0% |
| Hispanic or Latino | 32,204 | 90.4% |
| Native / Alaskan | 8 | 0.0% |
| White / Caucasian | 17,778 | 49.9% |
| Two or more Races | 14,904 | 41.9% |
| Some other Race | 1,755 | 4.9% |
| Total | 35,606 | 100.0% |
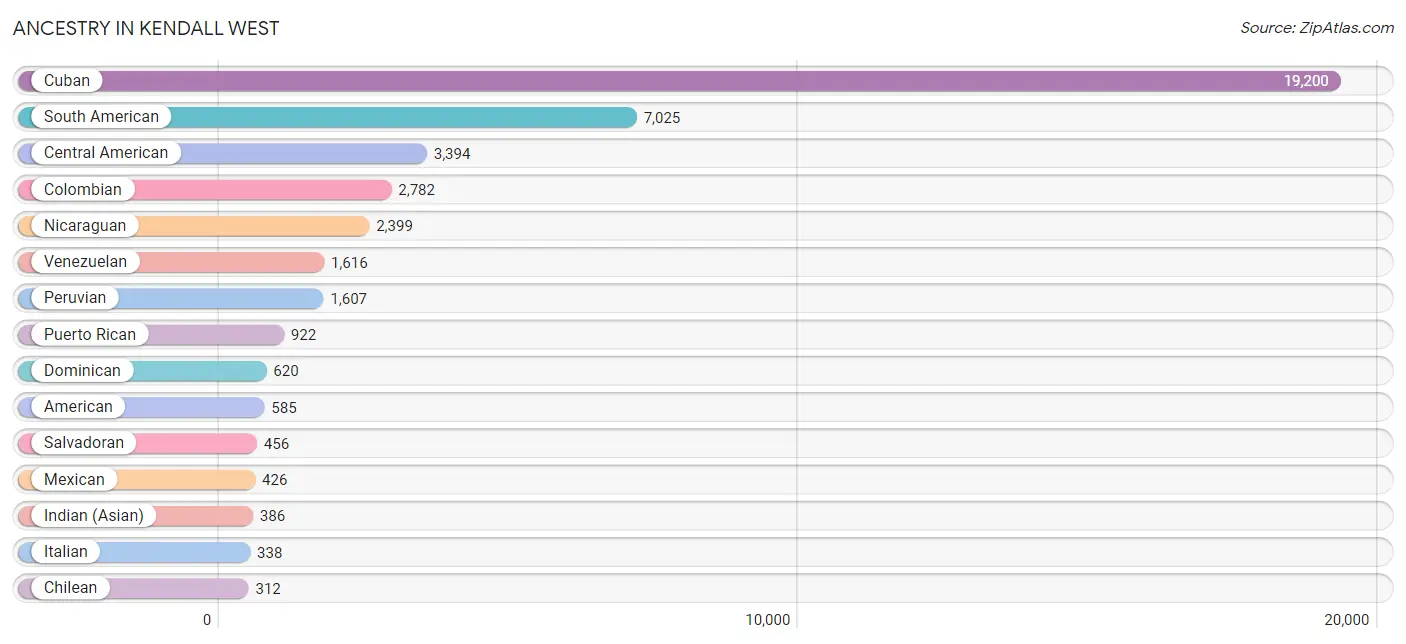
Ancestry in Kendall West
The most populous ancestries reported in Kendall West are Cuban (19,200 | 53.9%), South American (7,025 | 19.7%), Central American (3,394 | 9.5%), Colombian (2,782 | 7.8%), and Nicaraguan (2,399 | 6.7%), together accounting for 97.7% of all Kendall West residents.
| Ancestry | # Population | % Population |
| African | 61 | 0.2% |
| American | 585 | 1.6% |
| Arab | 225 | 0.6% |
| Argentinean | 225 | 0.6% |
| Armenian | 13 | 0.0% |
| Austrian | 15 | 0.0% |
| Basque | 14 | 0.0% |
| Bolivian | 181 | 0.5% |
| Brazilian | 84 | 0.2% |
| British | 46 | 0.1% |
| Bulgarian | 12 | 0.0% |
| Canadian | 8 | 0.0% |
| Central American | 3,394 | 9.5% |
| Cherokee | 3 | 0.0% |
| Chilean | 312 | 0.9% |
| Colombian | 2,782 | 7.8% |
| Costa Rican | 53 | 0.2% |
| Croatian | 5 | 0.0% |
| Cuban | 19,200 | 53.9% |
| Dominican | 620 | 1.7% |
| Dutch | 4 | 0.0% |
| Eastern European | 4 | 0.0% |
| Ecuadorian | 195 | 0.5% |
| English | 84 | 0.2% |
| French | 143 | 0.4% |
| French Canadian | 2 | 0.0% |
| German | 196 | 0.5% |
| Guatemalan | 73 | 0.2% |
| Haitian | 119 | 0.3% |
| Honduran | 215 | 0.6% |
| Hungarian | 23 | 0.1% |
| Indian (Asian) | 386 | 1.1% |
| Iranian | 97 | 0.3% |
| Irish | 57 | 0.2% |
| Israeli | 20 | 0.1% |
| Italian | 338 | 0.9% |
| Jamaican | 28 | 0.1% |
| Jordanian | 58 | 0.2% |
| Korean | 61 | 0.2% |
| Lebanese | 87 | 0.2% |
| Lithuanian | 6 | 0.0% |
| Mexican | 426 | 1.2% |
| Mexican American Indian | 8 | 0.0% |
| Nicaraguan | 2,399 | 6.7% |
| Nigerian | 7 | 0.0% |
| Norwegian | 29 | 0.1% |
| Palestinian | 10 | 0.0% |
| Panamanian | 198 | 0.6% |
| Peruvian | 1,607 | 4.5% |
| Polish | 73 | 0.2% |
| Portuguese | 69 | 0.2% |
| Puerto Rican | 922 | 2.6% |
| Romanian | 10 | 0.0% |
| Russian | 26 | 0.1% |
| Salvadoran | 456 | 1.3% |
| Scottish | 31 | 0.1% |
| Slavic | 17 | 0.1% |
| South American | 7,025 | 19.7% |
| Spaniard | 73 | 0.2% |
| Spanish | 79 | 0.2% |
| Sri Lankan | 26 | 0.1% |
| Subsaharan African | 68 | 0.2% |
| Swedish | 14 | 0.0% |
| Swiss | 7 | 0.0% |
| Syrian | 18 | 0.1% |
| Thai | 120 | 0.3% |
| Turkish | 11 | 0.0% |
| Uruguayan | 107 | 0.3% |
| Venezuelan | 1,616 | 4.5% |
| West Indian | 15 | 0.0% | View All 70 Rows |
Immigrants in Kendall West
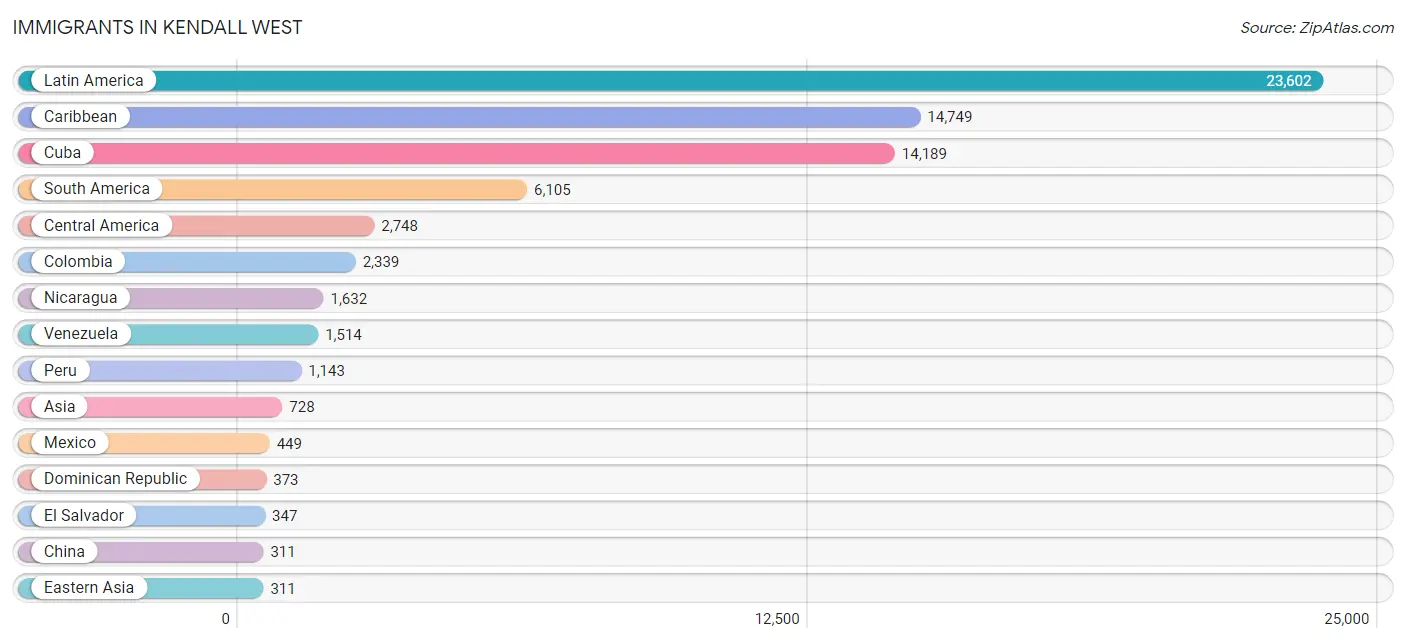
The most numerous immigrant groups reported in Kendall West came from Latin America (23,602 | 66.3%), Caribbean (14,749 | 41.4%), Cuba (14,189 | 39.9%), South America (6,105 | 17.2%), and Central America (2,748 | 7.7%), together accounting for 172.4% of all Kendall West residents.
| Immigration Origin | # Population | % Population |
| Africa | 9 | 0.0% |
| Argentina | 228 | 0.6% |
| Asia | 728 | 2.0% |
| Austria | 8 | 0.0% |
| Belgium | 6 | 0.0% |
| Bolivia | 180 | 0.5% |
| Brazil | 122 | 0.3% |
| Bulgaria | 19 | 0.1% |
| Canada | 102 | 0.3% |
| Caribbean | 14,749 | 41.4% |
| Central America | 2,748 | 7.7% |
| Chile | 215 | 0.6% |
| China | 311 | 0.9% |
| Colombia | 2,339 | 6.6% |
| Costa Rica | 47 | 0.1% |
| Cuba | 14,189 | 39.9% |
| Dominica | 47 | 0.1% |
| Dominican Republic | 373 | 1.1% |
| Eastern Asia | 311 | 0.9% |
| Eastern Europe | 38 | 0.1% |
| Ecuador | 106 | 0.3% |
| Egypt | 9 | 0.0% |
| El Salvador | 347 | 1.0% |
| England | 10 | 0.0% |
| Europe | 177 | 0.5% |
| Guatemala | 26 | 0.1% |
| Haiti | 103 | 0.3% |
| Honduras | 165 | 0.5% |
| India | 26 | 0.1% |
| Iran | 77 | 0.2% |
| Israel | 9 | 0.0% |
| Italy | 25 | 0.1% |
| Jamaica | 30 | 0.1% |
| Jordan | 58 | 0.2% |
| Latin America | 23,602 | 66.3% |
| Lebanon | 13 | 0.0% |
| Lithuania | 6 | 0.0% |
| Mexico | 449 | 1.3% |
| Nicaragua | 1,632 | 4.6% |
| Northern Africa | 9 | 0.0% |
| Northern Europe | 10 | 0.0% |
| Pakistan | 64 | 0.2% |
| Panama | 82 | 0.2% |
| Peru | 1,143 | 3.2% |
| Philippines | 96 | 0.3% |
| Poland | 3 | 0.0% |
| Romania | 10 | 0.0% |
| Saudi Arabia | 52 | 0.2% |
| South America | 6,105 | 17.2% |
| South Central Asia | 167 | 0.5% |
| South Eastern Asia | 105 | 0.3% |
| Southern Europe | 108 | 0.3% |
| Spain | 83 | 0.2% |
| Switzerland | 7 | 0.0% |
| Syria | 13 | 0.0% |
| Trinidad and Tobago | 7 | 0.0% |
| Uruguay | 258 | 0.7% |
| Venezuela | 1,514 | 4.3% |
| Vietnam | 9 | 0.0% |
| Western Asia | 145 | 0.4% |
| Western Europe | 21 | 0.1% | View All 61 Rows |
Sex and Age in Kendall West
Sex and Age in Kendall West
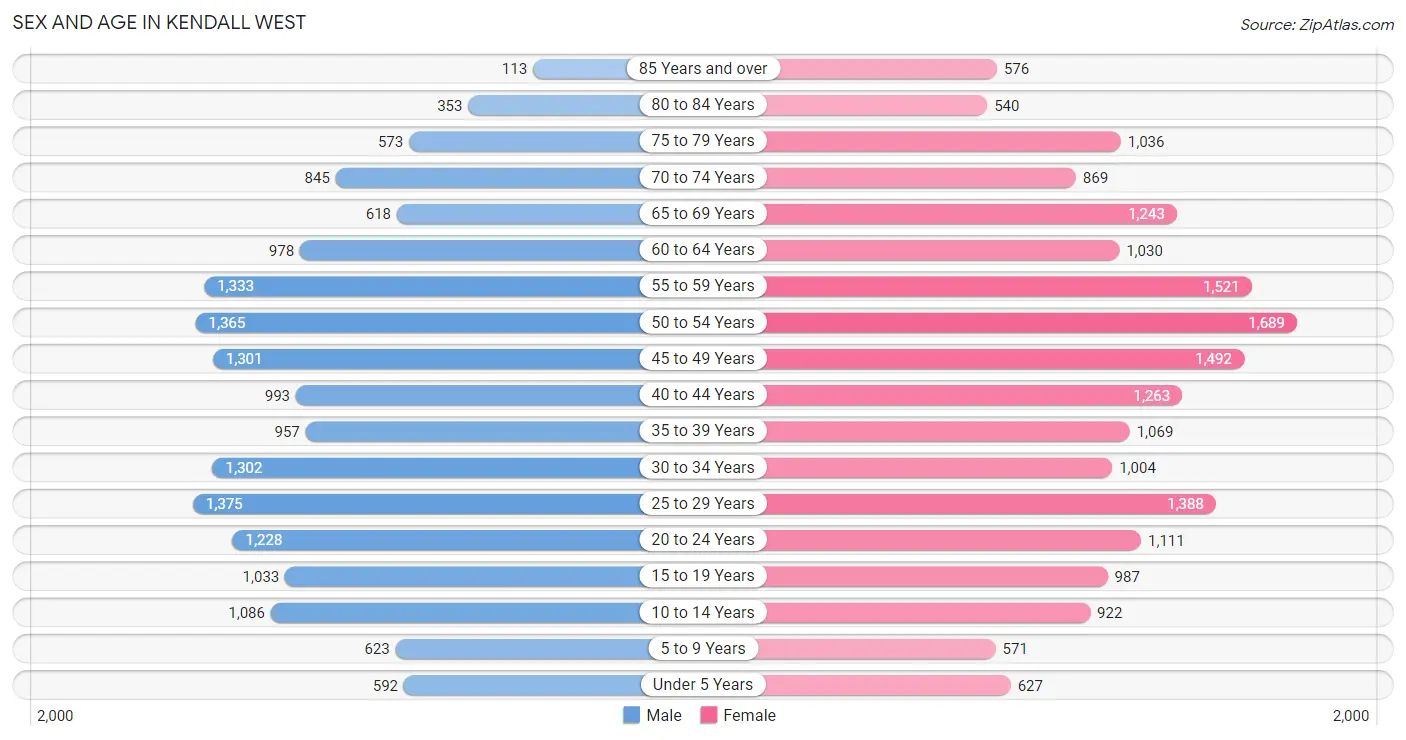
The most populous age groups in Kendall West are 25 to 29 Years (1,375 | 8.3%) for men and 50 to 54 Years (1,689 | 8.9%) for women.
| Age Bracket | Male | Female |
| Under 5 Years | 592 (3.5%) | 627 (3.3%) |
| 5 to 9 Years | 623 (3.7%) | 571 (3.0%) |
| 10 to 14 Years | 1,086 (6.5%) | 922 (4.9%) |
| 15 to 19 Years | 1,033 (6.2%) | 987 (5.2%) |
| 20 to 24 Years | 1,228 (7.4%) | 1,111 (5.9%) |
| 25 to 29 Years | 1,375 (8.3%) | 1,388 (7.3%) |
| 30 to 34 Years | 1,302 (7.8%) | 1,004 (5.3%) |
| 35 to 39 Years | 957 (5.7%) | 1,069 (5.6%) |
| 40 to 44 Years | 993 (6.0%) | 1,263 (6.7%) |
| 45 to 49 Years | 1,301 (7.8%) | 1,492 (7.9%) |
| 50 to 54 Years | 1,365 (8.2%) | 1,689 (8.9%) |
| 55 to 59 Years | 1,333 (8.0%) | 1,521 (8.0%) |
| 60 to 64 Years | 978 (5.9%) | 1,030 (5.4%) |
| 65 to 69 Years | 618 (3.7%) | 1,243 (6.6%) |
| 70 to 74 Years | 845 (5.1%) | 869 (4.6%) |
| 75 to 79 Years | 573 (3.4%) | 1,036 (5.5%) |
| 80 to 84 Years | 353 (2.1%) | 540 (2.9%) |
| 85 Years and over | 113 (0.7%) | 576 (3.0%) |
| Total | 16,668 (100.0%) | 18,938 (100.0%) |
Families and Households in Kendall West
Median Family Size in Kendall West
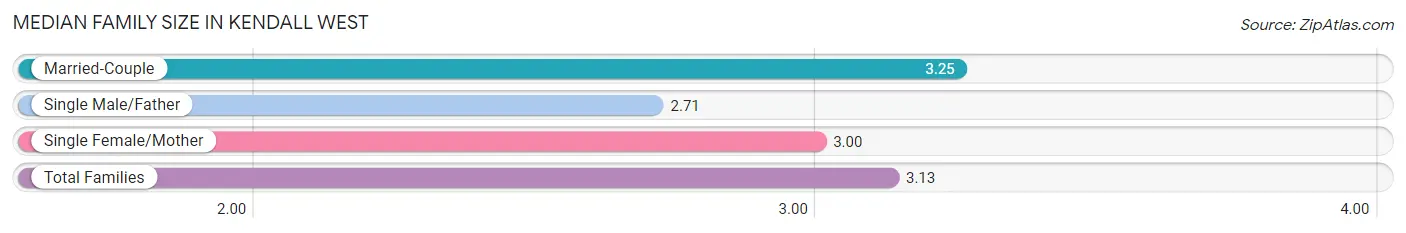
The median family size in Kendall West is 3.13 persons per family, with married-couple families (6,066 | 62.6%) accounting for the largest median family size of 3.25 persons per family. On the other hand, single male/father families (809 | 8.3%) represent the smallest median family size with 2.71 persons per family.
| Family Type | # Families | Family Size |
| Married-Couple | 6,066 (62.6%) | 3.25 |
| Single Male/Father | 809 (8.3%) | 2.71 |
| Single Female/Mother | 2,821 (29.1%) | 3.00 |
| Total Families | 9,696 (100.0%) | 3.13 |
Median Household Size in Kendall West
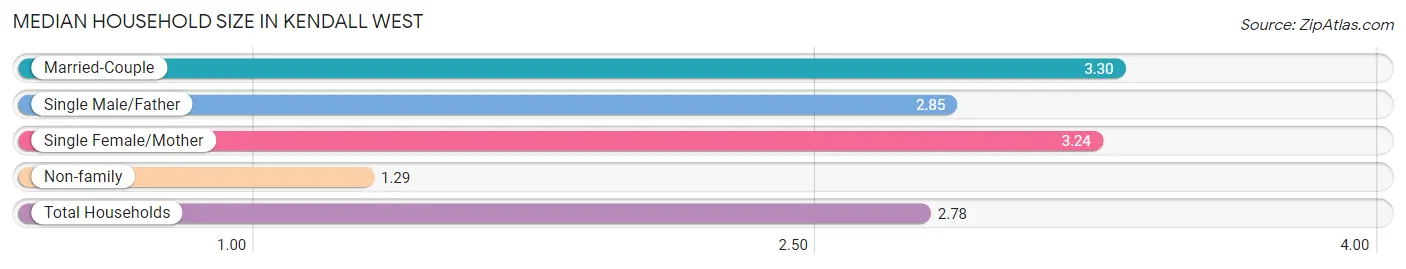
The median household size in Kendall West is 2.78 persons per household, with married-couple households (6,066 | 47.5%) accounting for the largest median household size of 3.3 persons per household. non-family households (3,079 | 24.1%) represent the smallest median household size with 1.29 persons per household.
| Household Type | # Households | Household Size |
| Married-Couple | 6,066 (47.5%) | 3.30 |
| Single Male/Father | 809 (6.3%) | 2.85 |
| Single Female/Mother | 2,821 (22.1%) | 3.24 |
| Non-family | 3,079 (24.1%) | 1.29 |
| Total Households | 12,775 (100.0%) | 2.78 |
Household Size by Marriage Status in Kendall West
Out of a total of 12,775 households in Kendall West, 9,696 (75.9%) are family households, while 3,079 (24.1%) are nonfamily households. The most numerous type of family households are 2-person households, comprising 3,805, and the most common type of nonfamily households are 1-person households, comprising 2,460.
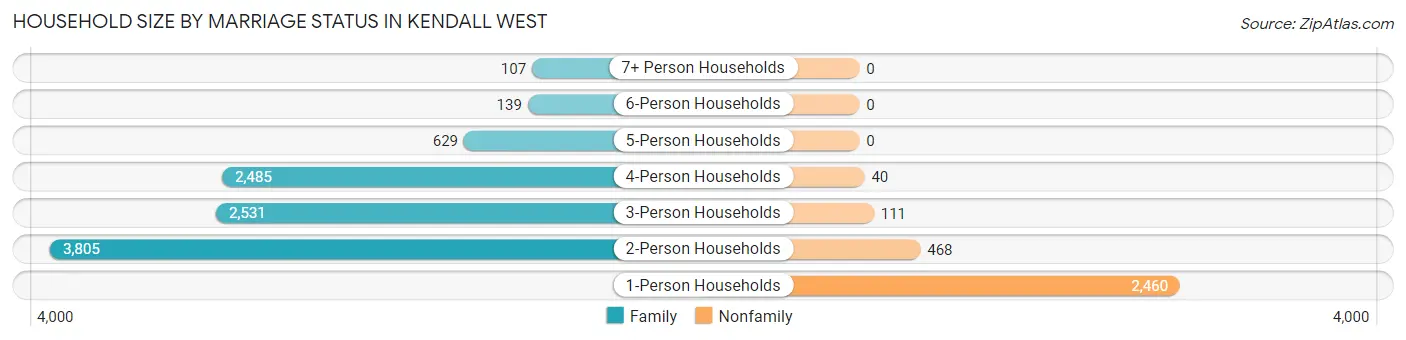
| Household Size | Family Households | Nonfamily Households |
| 1-Person Households | - | 2,460 (19.3%) |
| 2-Person Households | 3,805 (29.8%) | 468 (3.7%) |
| 3-Person Households | 2,531 (19.8%) | 111 (0.9%) |
| 4-Person Households | 2,485 (19.5%) | 40 (0.3%) |
| 5-Person Households | 629 (4.9%) | 0 (0.0%) |
| 6-Person Households | 139 (1.1%) | 0 (0.0%) |
| 7+ Person Households | 107 (0.8%) | 0 (0.0%) |
| Total | 9,696 (75.9%) | 3,079 (24.1%) |
Female Fertility in Kendall West
Fertility by Age in Kendall West
Average fertility rate in Kendall West is 22.0 births per 1,000 women. Women in the age bracket of 20 to 34 years have the highest fertility rate with 30.0 births per 1,000 women. Women in the age bracket of 20 to 34 years acount for 53.9% of all women with births.
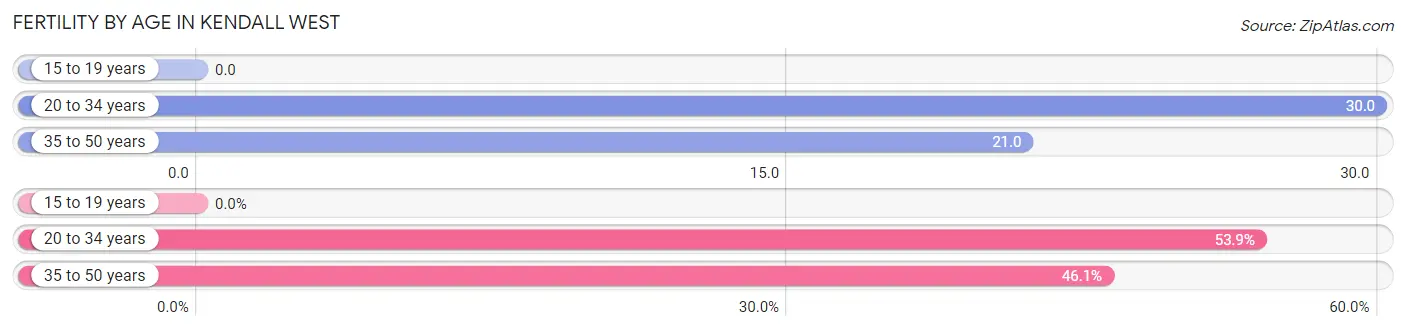
| Age Bracket | Women with Births | Births / 1,000 Women |
| 15 to 19 years | 0 (0.0%) | 0.0 |
| 20 to 34 years | 104 (53.9%) | 30.0 |
| 35 to 50 years | 89 (46.1%) | 21.0 |
| Total | 193 (100.0%) | 22.0 |
Fertility by Age by Marriage Status in Kendall West
40.9% of women with births (193) in Kendall West are married. The highest percentage of unmarried women with births falls into 35 to 50 years age bracket with 75.3% of them unmarried at the time of birth, while the lowest percentage of unmarried women with births belong to 20 to 34 years age bracket with 45.2% of them unmarried.
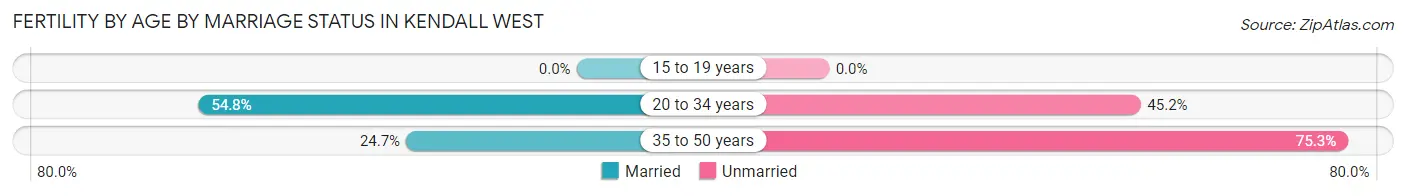
| Age Bracket | Married | Unmarried |
| 15 to 19 years | 0 (0.0%) | 0 (0.0%) |
| 20 to 34 years | 57 (54.8%) | 47 (45.2%) |
| 35 to 50 years | 22 (24.7%) | 67 (75.3%) |
| Total | 79 (40.9%) | 114 (59.1%) |
Fertility by Education in Kendall West
Average fertility rate in Kendall West is 22.0 births per 1,000 women. Women with the education attainment of graduate degree have the highest fertility rate of 72.0 births per 1,000 women, while women with the education attainment of college or associate's degree have the lowest fertility at 3.0 births per 1,000 women. Women with the education attainment of graduate degree represent 35.2% of all women with births.
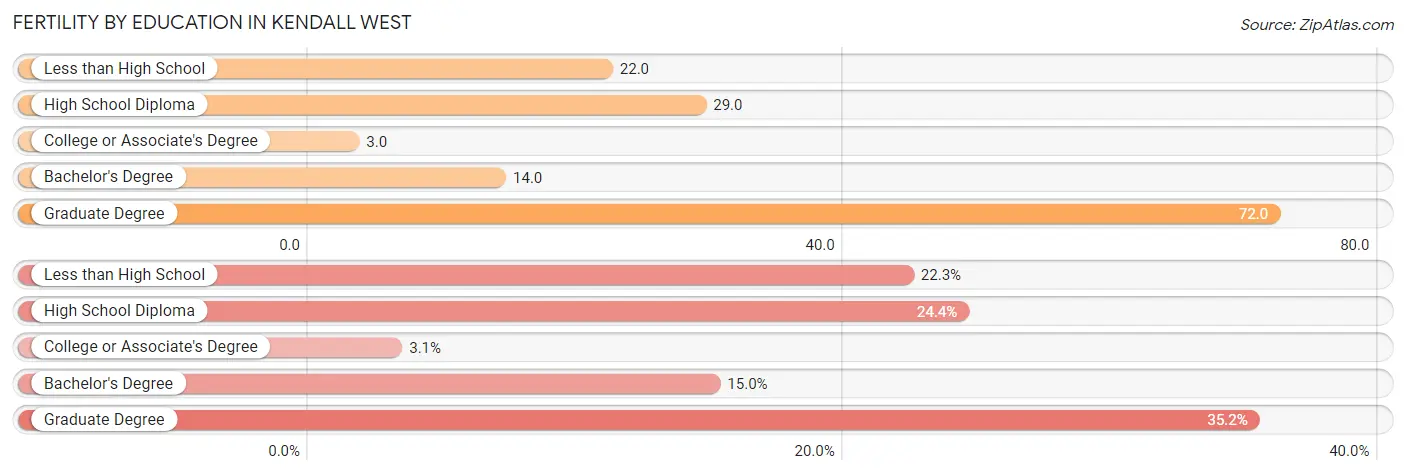
| Educational Attainment | Women with Births | Births / 1,000 Women |
| Less than High School | 43 (22.3%) | 22.0 |
| High School Diploma | 47 (24.3%) | 29.0 |
| College or Associate's Degree | 6 (3.1%) | 3.0 |
| Bachelor's Degree | 29 (15.0%) | 14.0 |
| Graduate Degree | 68 (35.2%) | 72.0 |
| Total | 193 (100.0%) | 22.0 |
Fertility by Education by Marriage Status in Kendall West
59.1% of women with births in Kendall West are unmarried. Women with the educational attainment of college or associate's degree are most likely to be married with 100.0% of them married at childbirth, while women with the educational attainment of less than high school are least likely to be married with 100.0% of them unmarried at childbirth.
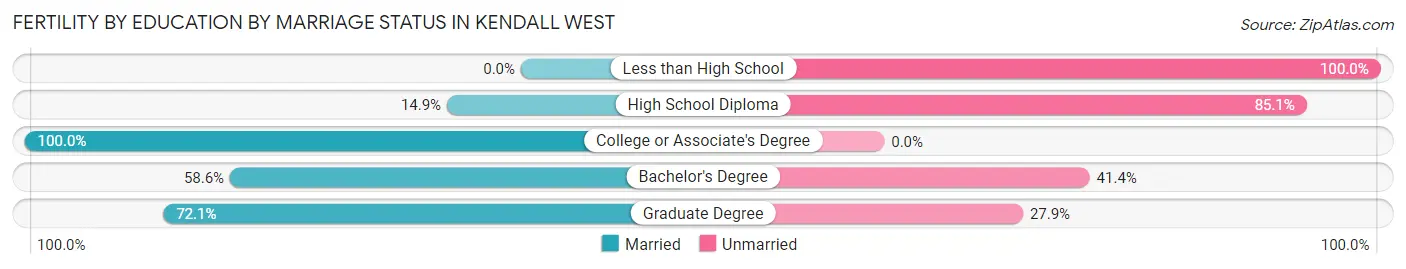
| Educational Attainment | Married | Unmarried |
| Less than High School | 0 (0.0%) | 43 (100.0%) |
| High School Diploma | 7 (14.9%) | 40 (85.1%) |
| College or Associate's Degree | 6 (100.0%) | 0 (0.0%) |
| Bachelor's Degree | 17 (58.6%) | 12 (41.4%) |
| Graduate Degree | 49 (72.1%) | 19 (27.9%) |
| Total | 79 (40.9%) | 114 (59.1%) |
Employment Characteristics in Kendall West
Employment by Class of Employer in Kendall West
Among the 18,977 employed individuals in Kendall West, private company employees (14,486 | 76.3%), self-employed (incorporated) (1,102 | 5.8%), and self-employed (not incorporated) (1,066 | 5.6%) make up the most common classes of employment.
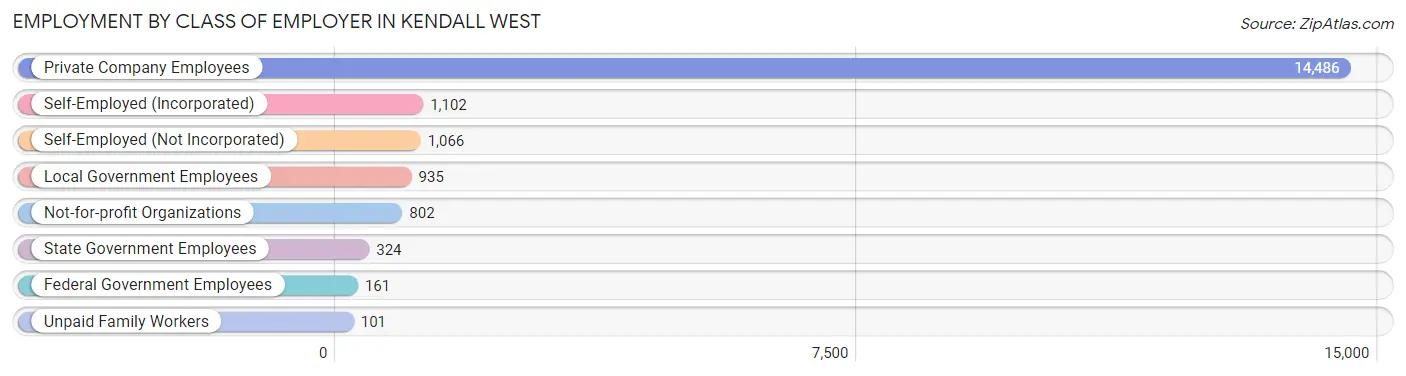
| Employer Class | # Employees | % Employees |
| Private Company Employees | 14,486 | 76.3% |
| Self-Employed (Incorporated) | 1,102 | 5.8% |
| Self-Employed (Not Incorporated) | 1,066 | 5.6% |
| Not-for-profit Organizations | 802 | 4.2% |
| Local Government Employees | 935 | 4.9% |
| State Government Employees | 324 | 1.7% |
| Federal Government Employees | 161 | 0.9% |
| Unpaid Family Workers | 101 | 0.5% |
| Total | 18,977 | 100.0% |
Employment Status by Age in Kendall West
According to the labor force statistics for Kendall West, out of the total population over 16 years of age (30,662), 65.1% or 19,961 individuals are in the labor force, with 2.9% or 579 of them unemployed. The age group with the highest labor force participation rate is 30 to 34 years, with 90.1% or 2,078 individuals in the labor force. Within the labor force, the 75 years and over age range has the highest percentage of unemployed individuals, with 16.5% or 20 of them being unemployed.
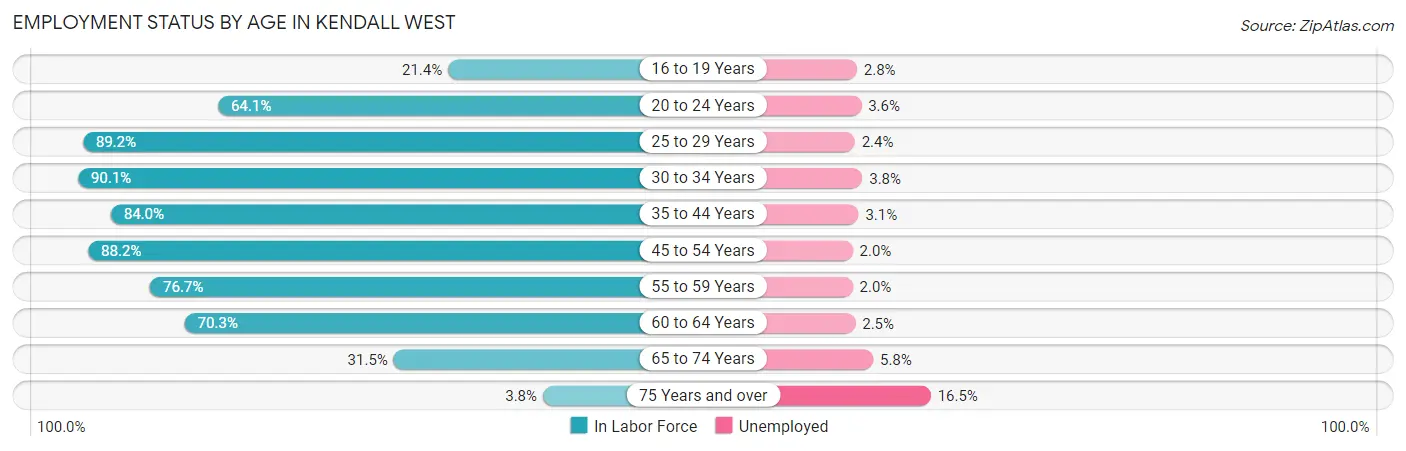
| Age Bracket | In Labor Force | Unemployed |
| 16 to 19 Years | 320 (21.4%) | 9 (2.8%) |
| 20 to 24 Years | 1,499 (64.1%) | 54 (3.6%) |
| 25 to 29 Years | 2,465 (89.2%) | 59 (2.4%) |
| 30 to 34 Years | 2,078 (90.1%) | 79 (3.8%) |
| 35 to 44 Years | 3,597 (84.0%) | 112 (3.1%) |
| 45 to 54 Years | 5,157 (88.2%) | 103 (2.0%) |
| 55 to 59 Years | 2,189 (76.7%) | 44 (2.0%) |
| 60 to 64 Years | 1,412 (70.3%) | 35 (2.5%) |
| 65 to 74 Years | 1,126 (31.5%) | 65 (5.8%) |
| 75 Years and over | 121 (3.8%) | 20 (16.5%) |
| Total | 19,961 (65.1%) | 579 (2.9%) |
Employment Status by Educational Attainment in Kendall West
According to labor force statistics for Kendall West, 84.2% of individuals (16,891) out of the total population between 25 and 64 years of age (20,060) are in the labor force, with 2.5% or 422 of them being unemployed. The group with the highest labor force participation rate are those with the educational attainment of bachelor's degree or higher, with 90.8% or 6,217 individuals in the labor force. Within the labor force, individuals with college / associate degree education have the highest percentage of unemployment, with 5.0% or 179 of them being unemployed.
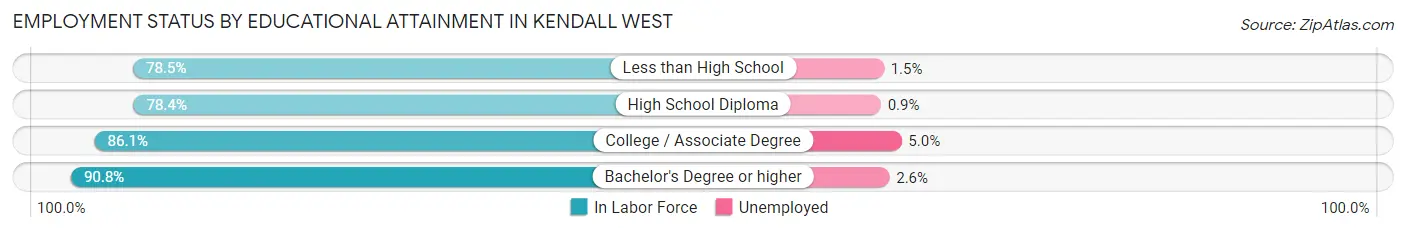
| Educational Attainment | In Labor Force | Unemployed |
| Less than High School | 3,328 (78.5%) | 64 (1.5%) |
| High School Diploma | 3,770 (78.4%) | 43 (0.9%) |
| College / Associate Degree | 3,586 (86.1%) | 208 (5.0%) |
| Bachelor's Degree or higher | 6,217 (90.8%) | 178 (2.6%) |
| Total | 16,891 (84.2%) | 502 (2.5%) |
Employment Occupations by Sex in Kendall West
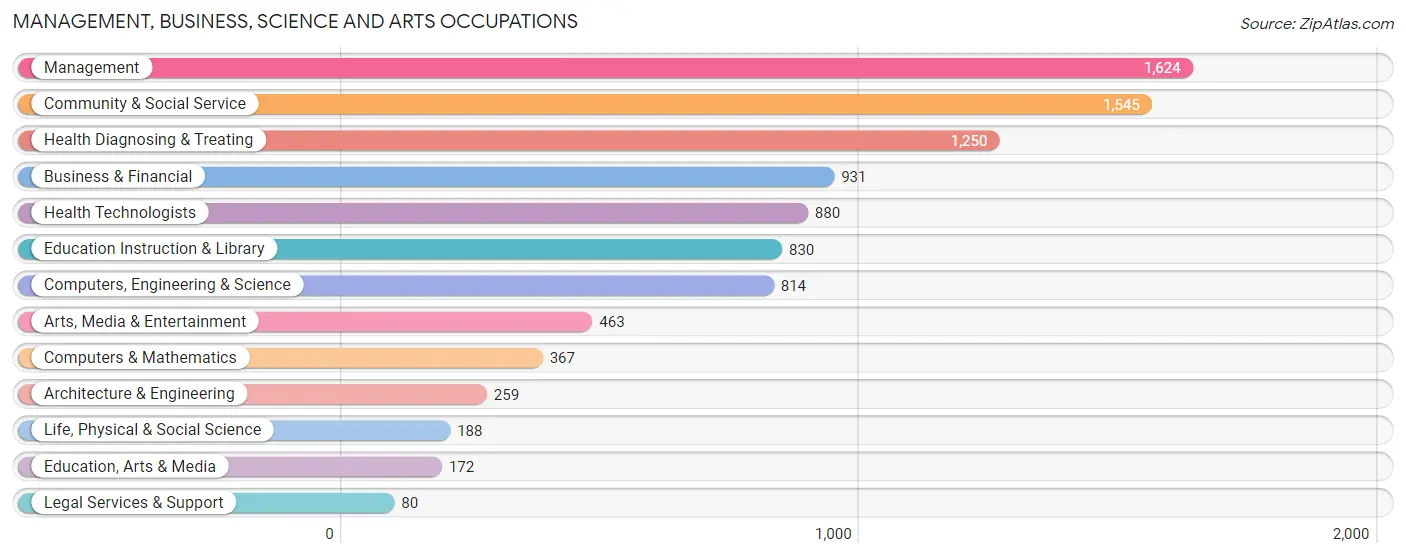
Management, Business, Science and Arts Occupations
The most common Management, Business, Science and Arts occupations in Kendall West are Management (1,624 | 8.4%), Community & Social Service (1,545 | 8.0%), Health Diagnosing & Treating (1,250 | 6.5%), Business & Financial (931 | 4.8%), and Health Technologists (880 | 4.5%).
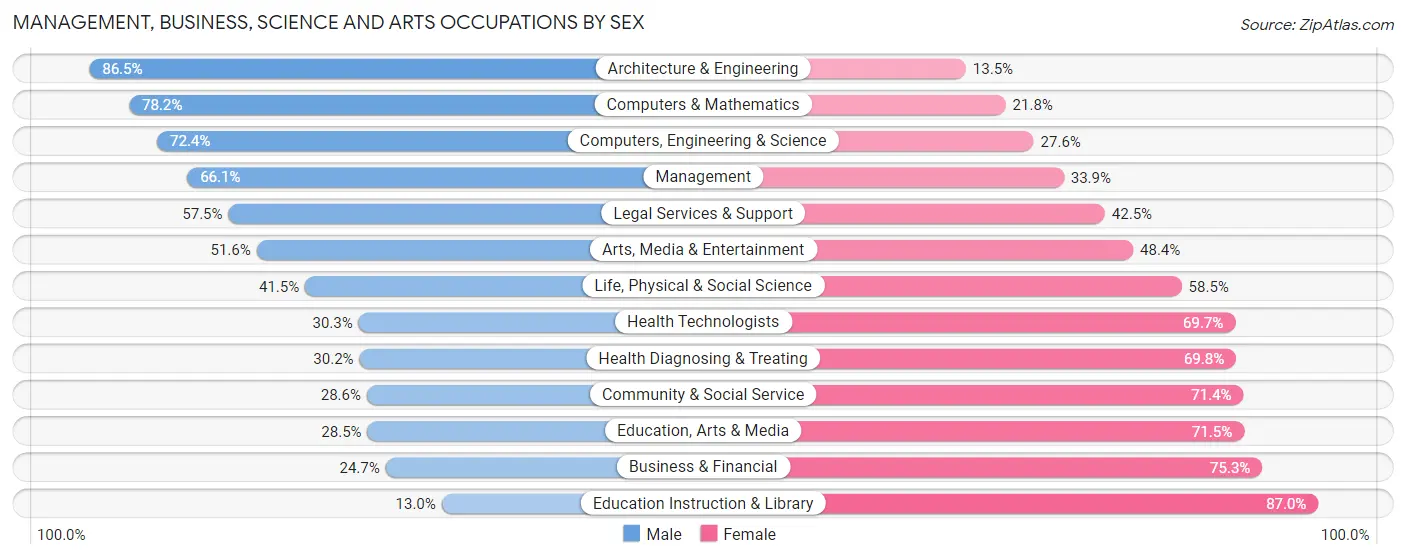
Management, Business, Science and Arts Occupations by Sex
Within the Management, Business, Science and Arts occupations in Kendall West, the most male-oriented occupations are Architecture & Engineering (86.5%), Computers & Mathematics (78.2%), and Computers, Engineering & Science (72.4%), while the most female-oriented occupations are Education Instruction & Library (87.0%), Business & Financial (75.3%), and Education, Arts & Media (71.5%).
| Occupation | Male | Female |
| Management | 1,073 (66.1%) | 551 (33.9%) |
| Business & Financial | 230 (24.7%) | 701 (75.3%) |
| Computers, Engineering & Science | 589 (72.4%) | 225 (27.6%) |
| Computers & Mathematics | 287 (78.2%) | 80 (21.8%) |
| Architecture & Engineering | 224 (86.5%) | 35 (13.5%) |
| Life, Physical & Social Science | 78 (41.5%) | 110 (58.5%) |
| Community & Social Service | 442 (28.6%) | 1,103 (71.4%) |
| Education, Arts & Media | 49 (28.5%) | 123 (71.5%) |
| Legal Services & Support | 46 (57.5%) | 34 (42.5%) |
| Education Instruction & Library | 108 (13.0%) | 722 (87.0%) |
| Arts, Media & Entertainment | 239 (51.6%) | 224 (48.4%) |
| Health Diagnosing & Treating | 377 (30.2%) | 873 (69.8%) |
| Health Technologists | 267 (30.3%) | 613 (69.7%) |
| Total (Category) | 2,711 (44.0%) | 3,453 (56.0%) |
| Total (Overall) | 9,670 (49.9%) | 9,707 (50.1%) |
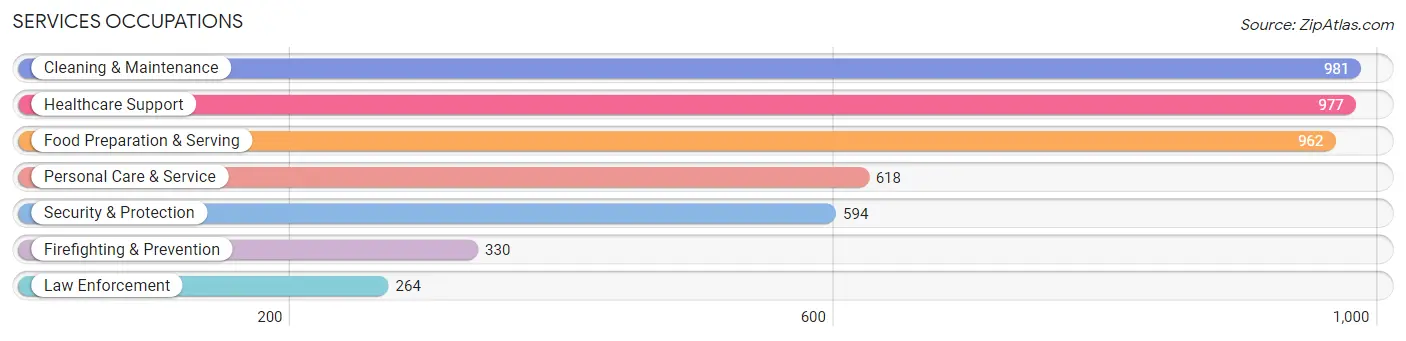
Services Occupations
The most common Services occupations in Kendall West are Cleaning & Maintenance (981 | 5.1%), Healthcare Support (977 | 5.0%), Food Preparation & Serving (962 | 5.0%), Personal Care & Service (618 | 3.2%), and Security & Protection (594 | 3.1%).
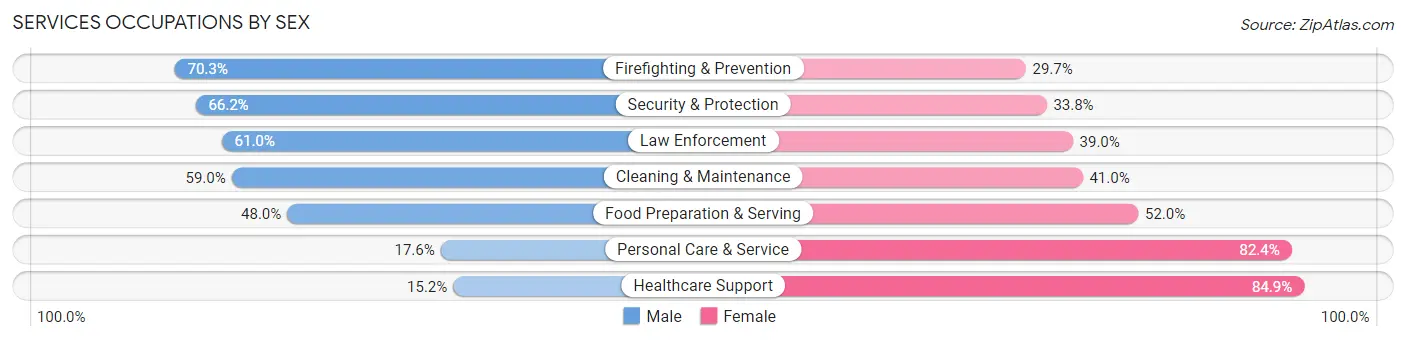
Services Occupations by Sex
Within the Services occupations in Kendall West, the most male-oriented occupations are Firefighting & Prevention (70.3%), Security & Protection (66.2%), and Law Enforcement (61.0%), while the most female-oriented occupations are Healthcare Support (84.9%), Personal Care & Service (82.4%), and Food Preparation & Serving (52.0%).
| Occupation | Male | Female |
| Healthcare Support | 148 (15.1%) | 829 (84.9%) |
| Security & Protection | 393 (66.2%) | 201 (33.8%) |
| Firefighting & Prevention | 232 (70.3%) | 98 (29.7%) |
| Law Enforcement | 161 (61.0%) | 103 (39.0%) |
| Food Preparation & Serving | 462 (48.0%) | 500 (52.0%) |
| Cleaning & Maintenance | 579 (59.0%) | 402 (41.0%) |
| Personal Care & Service | 109 (17.6%) | 509 (82.4%) |
| Total (Category) | 1,691 (40.9%) | 2,441 (59.1%) |
| Total (Overall) | 9,670 (49.9%) | 9,707 (50.1%) |
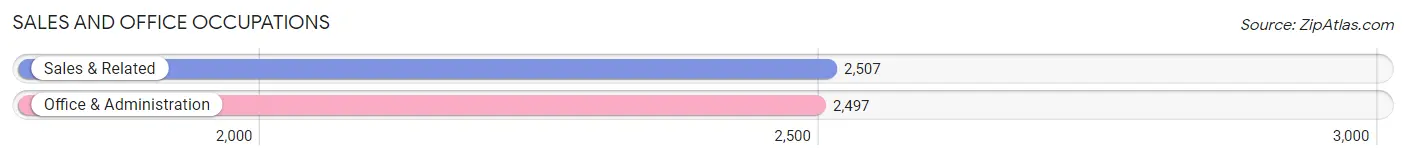
Sales and Office Occupations
The most common Sales and Office occupations in Kendall West are Sales & Related (2,507 | 12.9%), and Office & Administration (2,497 | 12.9%).
Sales and Office Occupations by Sex
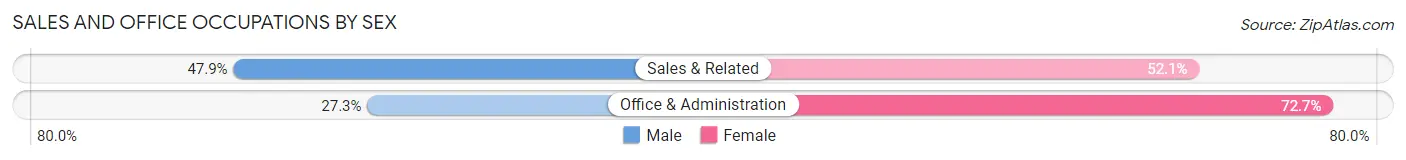
| Occupation | Male | Female |
| Sales & Related | 1,200 (47.9%) | 1,307 (52.1%) |
| Office & Administration | 681 (27.3%) | 1,816 (72.7%) |
| Total (Category) | 1,881 (37.6%) | 3,123 (62.4%) |
| Total (Overall) | 9,670 (49.9%) | 9,707 (50.1%) |
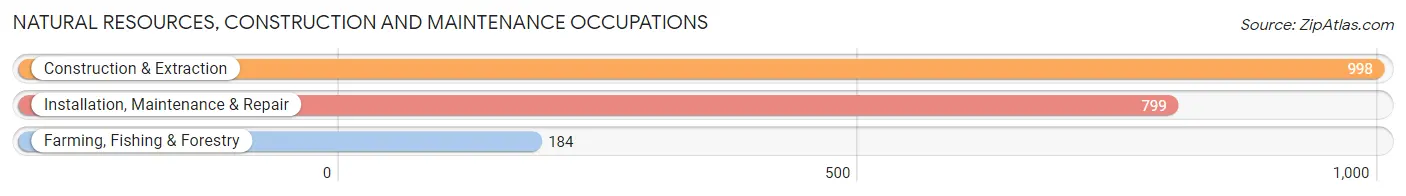
Natural Resources, Construction and Maintenance Occupations
The most common Natural Resources, Construction and Maintenance occupations in Kendall West are Construction & Extraction (998 | 5.1%), Installation, Maintenance & Repair (799 | 4.1%), and Farming, Fishing & Forestry (184 | 0.9%).
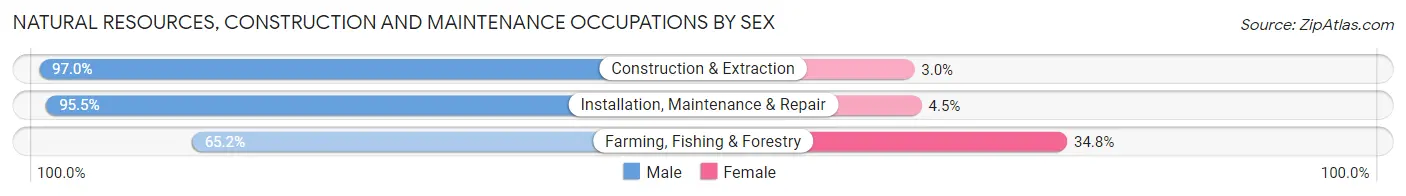
Natural Resources, Construction and Maintenance Occupations by Sex
| Occupation | Male | Female |
| Farming, Fishing & Forestry | 120 (65.2%) | 64 (34.8%) |
| Construction & Extraction | 968 (97.0%) | 30 (3.0%) |
| Installation, Maintenance & Repair | 763 (95.5%) | 36 (4.5%) |
| Total (Category) | 1,851 (93.4%) | 130 (6.6%) |
| Total (Overall) | 9,670 (49.9%) | 9,707 (50.1%) |
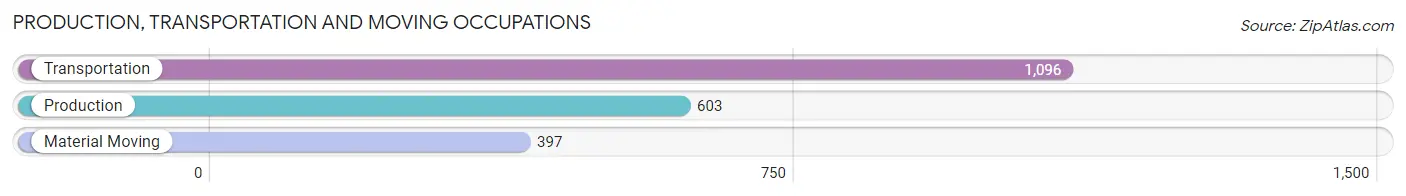
Production, Transportation and Moving Occupations
The most common Production, Transportation and Moving occupations in Kendall West are Transportation (1,096 | 5.7%), Production (603 | 3.1%), and Material Moving (397 | 2.1%).
Production, Transportation and Moving Occupations by Sex
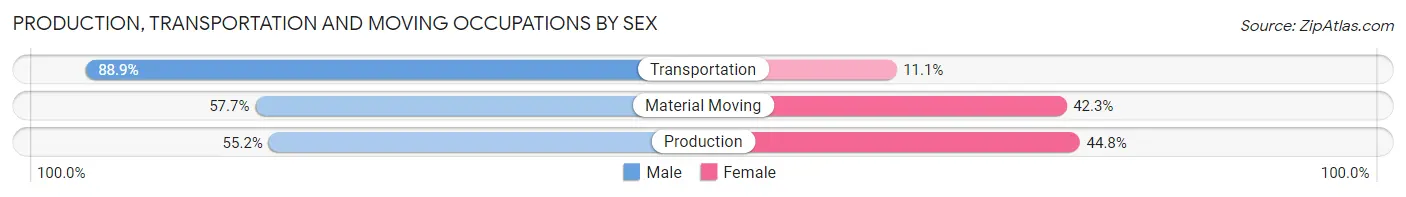
| Occupation | Male | Female |
| Production | 333 (55.2%) | 270 (44.8%) |
| Transportation | 974 (88.9%) | 122 (11.1%) |
| Material Moving | 229 (57.7%) | 168 (42.3%) |
| Total (Category) | 1,536 (73.3%) | 560 (26.7%) |
| Total (Overall) | 9,670 (49.9%) | 9,707 (50.1%) |
Employment Industries by Sex in Kendall West
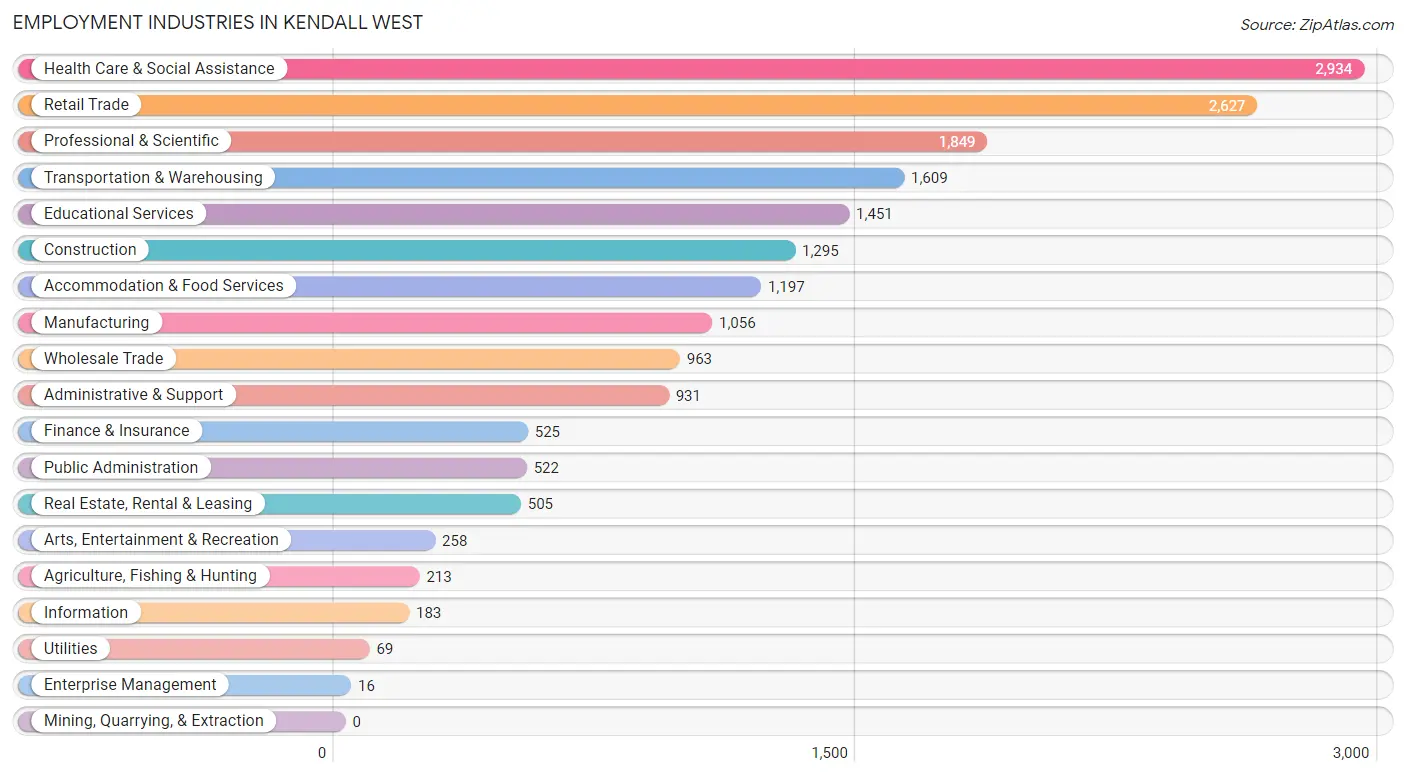
Employment Industries in Kendall West
The major employment industries in Kendall West include Health Care & Social Assistance (2,934 | 15.1%), Retail Trade (2,627 | 13.6%), Professional & Scientific (1,849 | 9.5%), Transportation & Warehousing (1,609 | 8.3%), and Educational Services (1,451 | 7.5%).
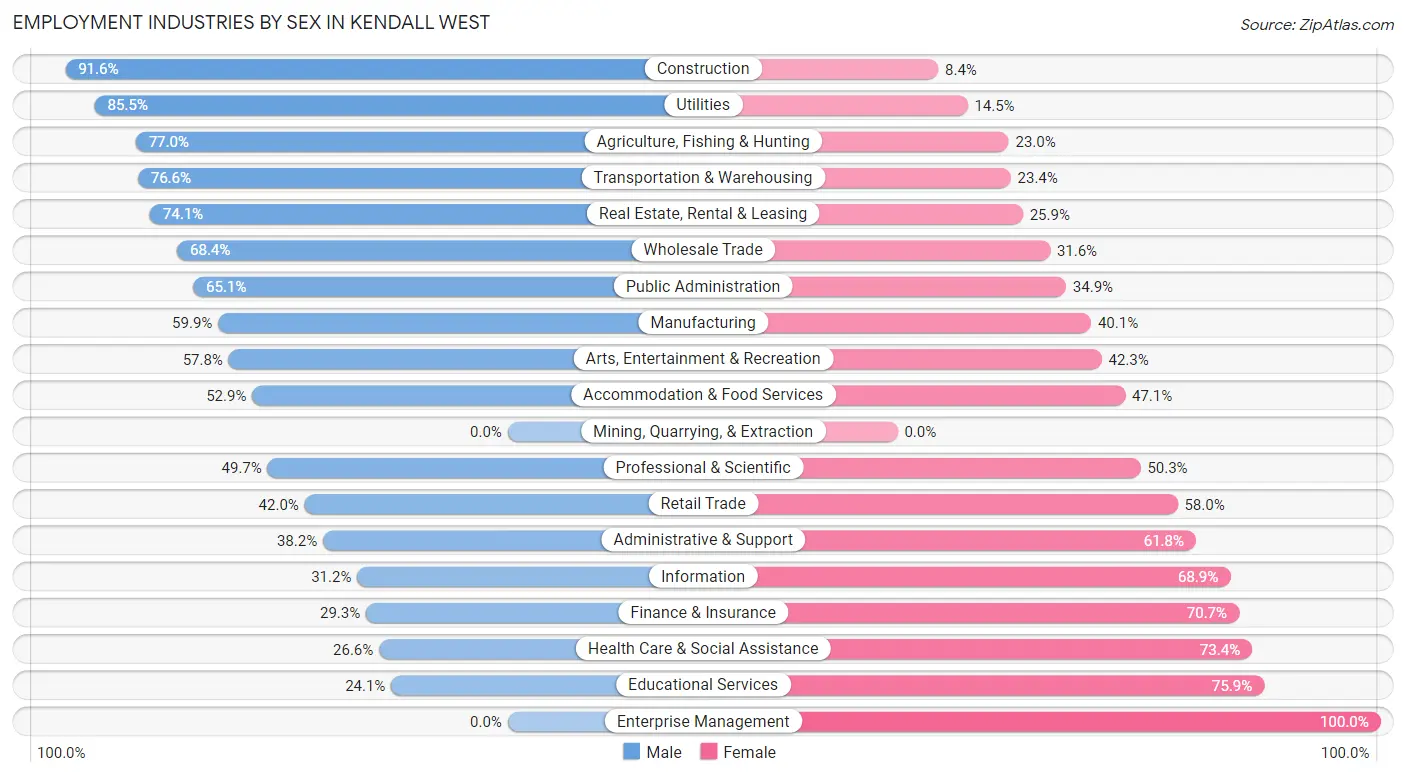
Employment Industries by Sex in Kendall West
The Kendall West industries that see more men than women are Construction (91.6%), Utilities (85.5%), and Agriculture, Fishing & Hunting (77.0%), whereas the industries that tend to have a higher number of women are Enterprise Management (100.0%), Educational Services (75.9%), and Health Care & Social Assistance (73.4%).
| Industry | Male | Female |
| Agriculture, Fishing & Hunting | 164 (77.0%) | 49 (23.0%) |
| Mining, Quarrying, & Extraction | 0 (0.0%) | 0 (0.0%) |
| Construction | 1,186 (91.6%) | 109 (8.4%) |
| Manufacturing | 633 (59.9%) | 423 (40.1%) |
| Wholesale Trade | 659 (68.4%) | 304 (31.6%) |
| Retail Trade | 1,104 (42.0%) | 1,523 (58.0%) |
| Transportation & Warehousing | 1,232 (76.6%) | 377 (23.4%) |
| Utilities | 59 (85.5%) | 10 (14.5%) |
| Information | 57 (31.1%) | 126 (68.9%) |
| Finance & Insurance | 154 (29.3%) | 371 (70.7%) |
| Real Estate, Rental & Leasing | 374 (74.1%) | 131 (25.9%) |
| Professional & Scientific | 919 (49.7%) | 930 (50.3%) |
| Enterprise Management | 0 (0.0%) | 16 (100.0%) |
| Administrative & Support | 356 (38.2%) | 575 (61.8%) |
| Educational Services | 350 (24.1%) | 1,101 (75.9%) |
| Health Care & Social Assistance | 781 (26.6%) | 2,153 (73.4%) |
| Arts, Entertainment & Recreation | 149 (57.8%) | 109 (42.2%) |
| Accommodation & Food Services | 633 (52.9%) | 564 (47.1%) |
| Public Administration | 340 (65.1%) | 182 (34.9%) |
| Total | 9,670 (49.9%) | 9,707 (50.1%) |
Education in Kendall West
School Enrollment in Kendall West
The most common levels of schooling among the 7,654 students in Kendall West are college / undergraduate (2,414 | 31.5%), middle school (1,717 | 22.4%), and high school (1,660 | 21.7%).
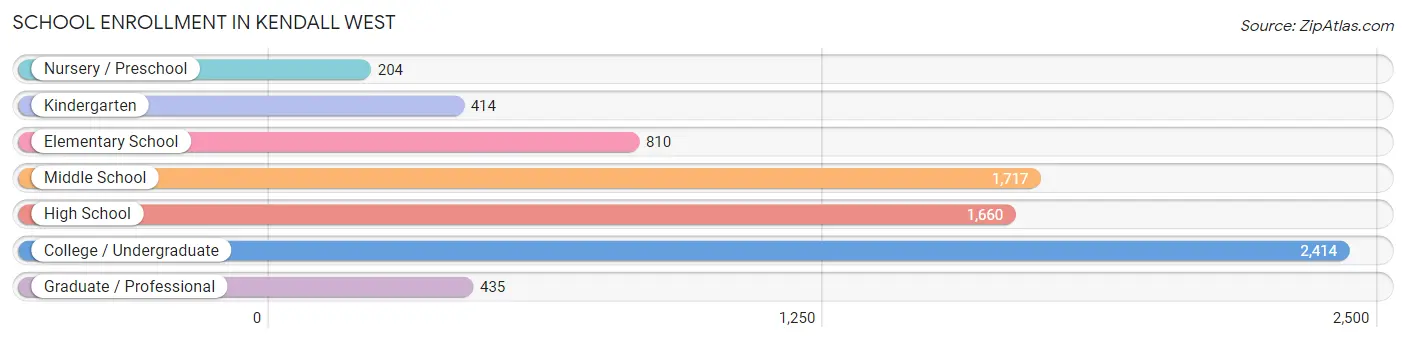
| School Level | # Students | % Students |
| Nursery / Preschool | 204 | 2.7% |
| Kindergarten | 414 | 5.4% |
| Elementary School | 810 | 10.6% |
| Middle School | 1,717 | 22.4% |
| High School | 1,660 | 21.7% |
| College / Undergraduate | 2,414 | 31.5% |
| Graduate / Professional | 435 | 5.7% |
| Total | 7,654 | 100.0% |
School Enrollment by Age by Funding Source in Kendall West
Out of a total of 7,654 students who are enrolled in schools in Kendall West, 888 (11.6%) attend a private institution, while the remaining 6,766 (88.4%) are enrolled in public schools. The age group of 3 to 4 year olds has the highest likelihood of being enrolled in private schools, with 84 (44.9% in the age bracket) enrolled. Conversely, the age group of 5 to 9 year old has the lowest likelihood of being enrolled in a private school, with 1,145 (97.7% in the age bracket) attending a public institution.
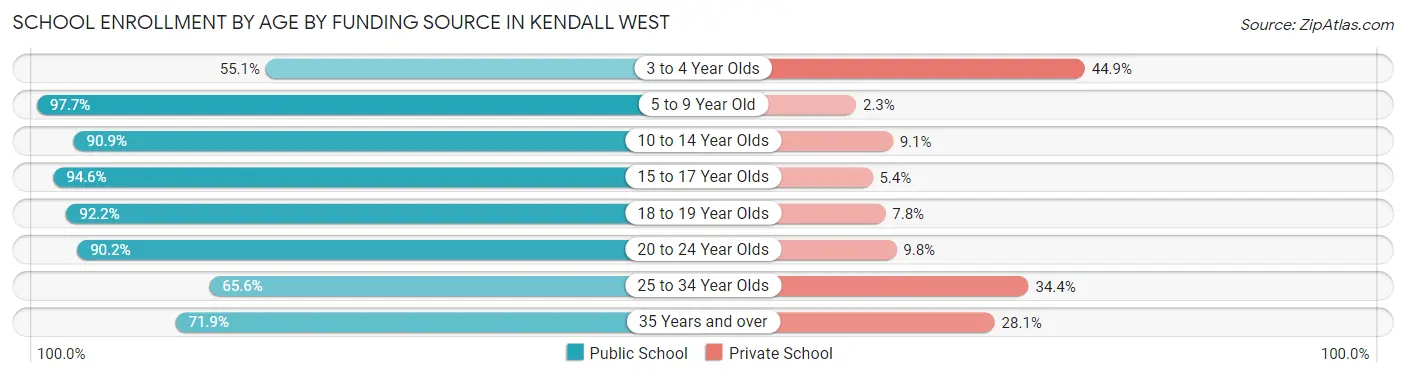
| Age Bracket | Public School | Private School |
| 3 to 4 Year Olds | 103 (55.1%) | 84 (44.9%) |
| 5 to 9 Year Old | 1,145 (97.7%) | 27 (2.3%) |
| 10 to 14 Year Olds | 1,810 (90.9%) | 182 (9.1%) |
| 15 to 17 Year Olds | 1,076 (94.6%) | 61 (5.4%) |
| 18 to 19 Year Olds | 617 (92.2%) | 52 (7.8%) |
| 20 to 24 Year Olds | 1,278 (90.2%) | 139 (9.8%) |
| 25 to 34 Year Olds | 398 (65.6%) | 209 (34.4%) |
| 35 Years and over | 340 (71.9%) | 133 (28.1%) |
| Total | 6,766 (88.4%) | 888 (11.6%) |
Educational Attainment by Field of Study in Kendall West
Business (2,577 | 29.6%), science & technology (1,234 | 14.2%), education (1,120 | 12.9%), engineering (766 | 8.8%), and bio, nature & agricultural (484 | 5.6%) are the most common fields of study among 8,696 individuals in Kendall West who have obtained a bachelor's degree or higher.
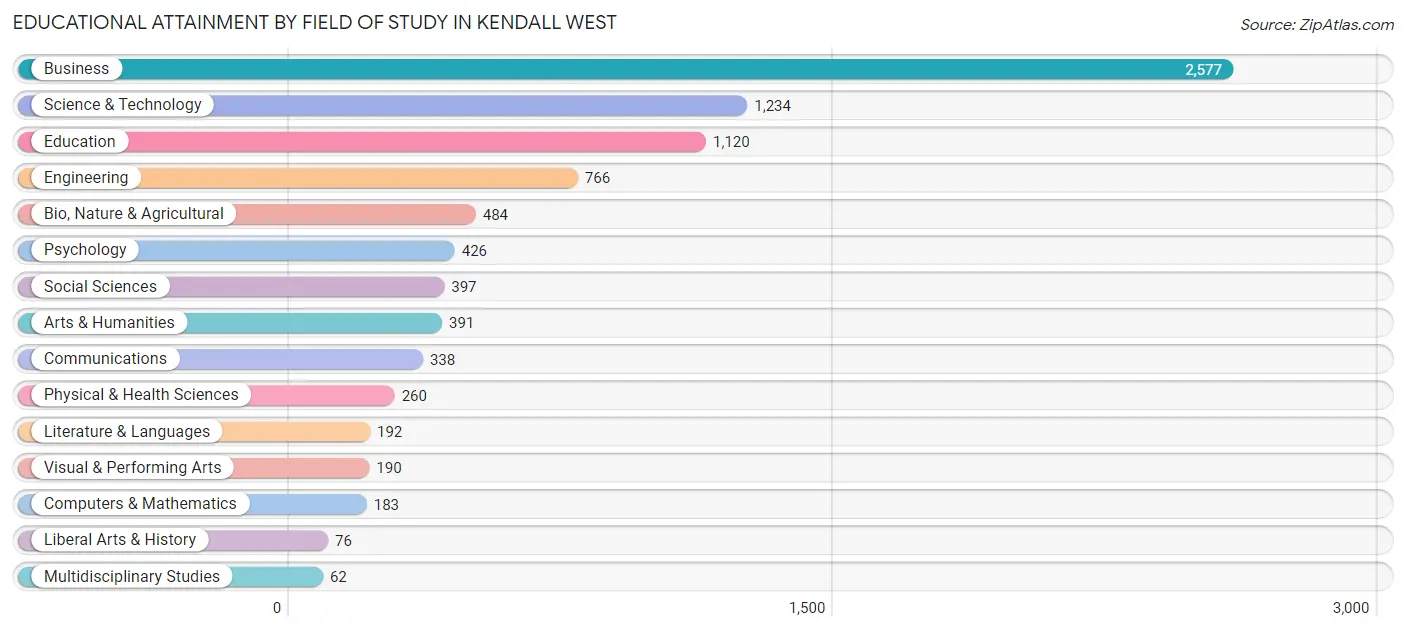
| Field of Study | # Graduates | % Graduates |
| Computers & Mathematics | 183 | 2.1% |
| Bio, Nature & Agricultural | 484 | 5.6% |
| Physical & Health Sciences | 260 | 3.0% |
| Psychology | 426 | 4.9% |
| Social Sciences | 397 | 4.6% |
| Engineering | 766 | 8.8% |
| Multidisciplinary Studies | 62 | 0.7% |
| Science & Technology | 1,234 | 14.2% |
| Business | 2,577 | 29.6% |
| Education | 1,120 | 12.9% |
| Literature & Languages | 192 | 2.2% |
| Liberal Arts & History | 76 | 0.9% |
| Visual & Performing Arts | 190 | 2.2% |
| Communications | 338 | 3.9% |
| Arts & Humanities | 391 | 4.5% |
| Total | 8,696 | 100.0% |
Transportation & Commute in Kendall West
Vehicle Availability by Sex in Kendall West
The most prevalent vehicle ownership categories in Kendall West are males with 2 vehicles (4,883, accounting for 51.9%) and females with 2 vehicles (4,468, making up 51.1%).
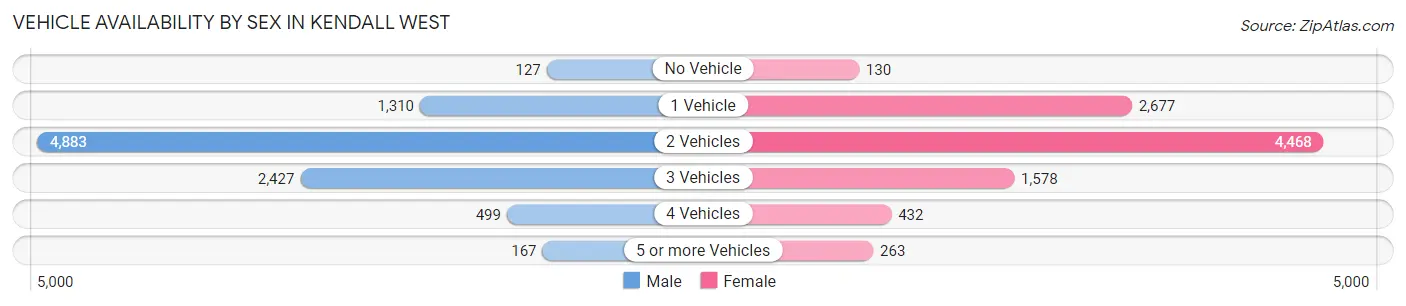
| Vehicles Available | Male | Female |
| No Vehicle | 127 (1.3%) | 130 (1.4%) |
| 1 Vehicle | 1,310 (13.9%) | 2,677 (28.0%) |
| 2 Vehicles | 4,883 (51.9%) | 4,468 (46.8%) |
| 3 Vehicles | 2,427 (25.8%) | 1,578 (16.5%) |
| 4 Vehicles | 499 (5.3%) | 432 (4.5%) |
| 5 or more Vehicles | 167 (1.8%) | 263 (2.8%) |
| Total | 9,413 (100.0%) | 9,548 (100.0%) |
Commute Time in Kendall West
The most frequently occuring commute durations in Kendall West are 30 to 34 minutes (3,486 commuters, 19.5%), 45 to 59 minutes (2,571 commuters, 14.4%), and 60 to 89 minutes (2,361 commuters, 13.2%).
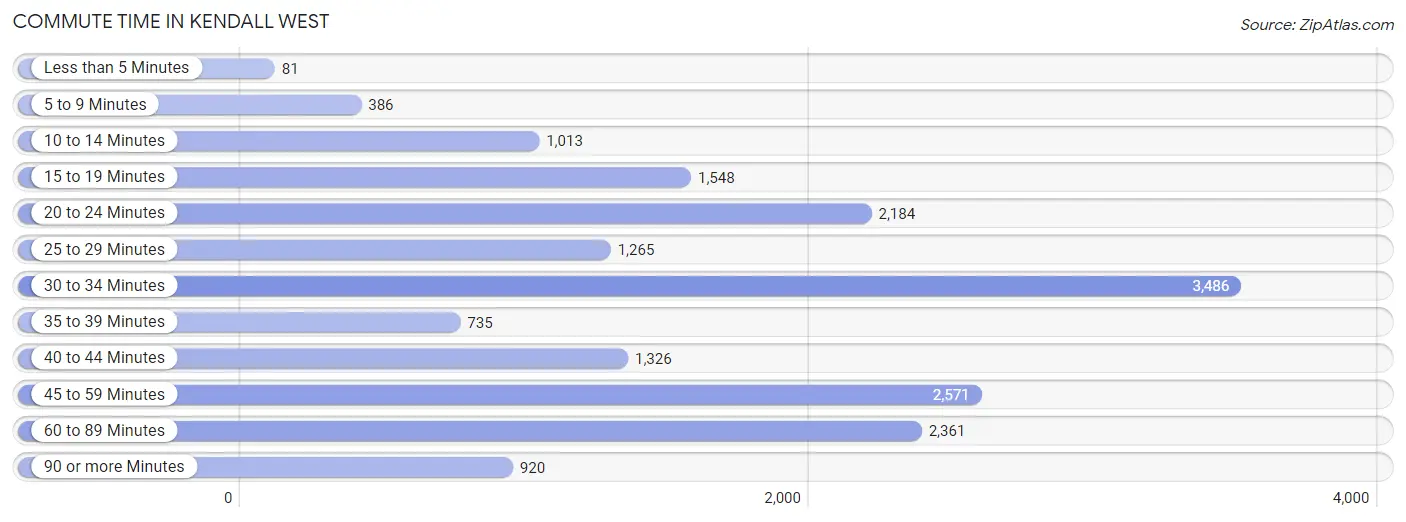
| Commute Time | # Commuters | % Commuters |
| Less than 5 Minutes | 81 | 0.4% |
| 5 to 9 Minutes | 386 | 2.2% |
| 10 to 14 Minutes | 1,013 | 5.7% |
| 15 to 19 Minutes | 1,548 | 8.7% |
| 20 to 24 Minutes | 2,184 | 12.2% |
| 25 to 29 Minutes | 1,265 | 7.1% |
| 30 to 34 Minutes | 3,486 | 19.5% |
| 35 to 39 Minutes | 735 | 4.1% |
| 40 to 44 Minutes | 1,326 | 7.4% |
| 45 to 59 Minutes | 2,571 | 14.4% |
| 60 to 89 Minutes | 2,361 | 13.2% |
| 90 or more Minutes | 920 | 5.1% |
Commute Time by Sex in Kendall West
The most common commute times in Kendall West are 30 to 34 minutes (1,724 commuters, 19.0%) for males and 30 to 34 minutes (1,762 commuters, 20.0%) for females.
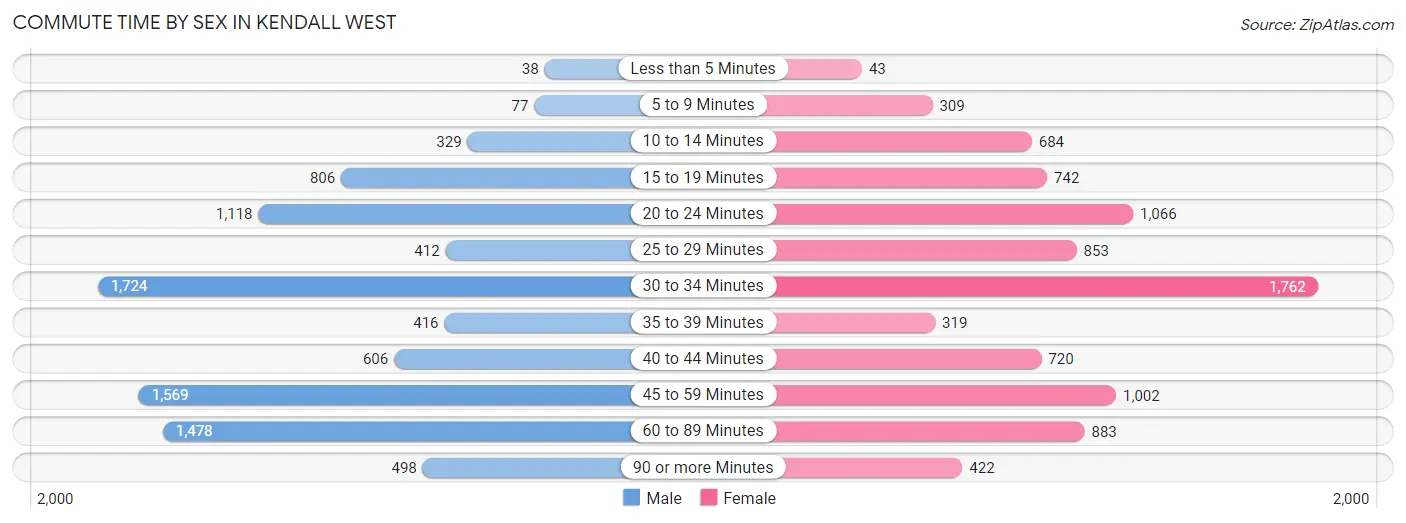
| Commute Time | Male | Female |
| Less than 5 Minutes | 38 (0.4%) | 43 (0.5%) |
| 5 to 9 Minutes | 77 (0.9%) | 309 (3.5%) |
| 10 to 14 Minutes | 329 (3.6%) | 684 (7.8%) |
| 15 to 19 Minutes | 806 (8.9%) | 742 (8.4%) |
| 20 to 24 Minutes | 1,118 (12.3%) | 1,066 (12.1%) |
| 25 to 29 Minutes | 412 (4.5%) | 853 (9.7%) |
| 30 to 34 Minutes | 1,724 (19.0%) | 1,762 (20.0%) |
| 35 to 39 Minutes | 416 (4.6%) | 319 (3.6%) |
| 40 to 44 Minutes | 606 (6.7%) | 720 (8.2%) |
| 45 to 59 Minutes | 1,569 (17.3%) | 1,002 (11.4%) |
| 60 to 89 Minutes | 1,478 (16.3%) | 883 (10.0%) |
| 90 or more Minutes | 498 (5.5%) | 422 (4.8%) |
Time of Departure to Work by Sex in Kendall West
The most frequent times of departure to work in Kendall West are 8:00 AM to 8:29 AM (2,292, 25.3%) for males and 8:00 AM to 8:29 AM (2,033, 23.1%) for females.
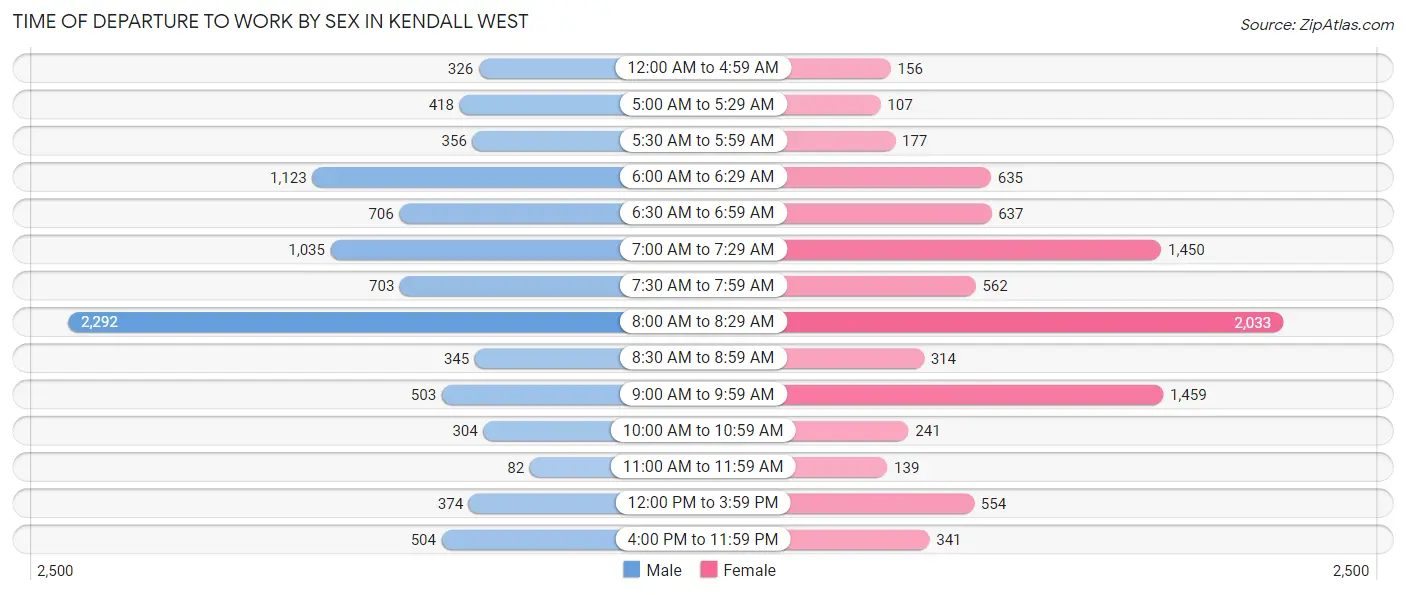
| Time of Departure | Male | Female |
| 12:00 AM to 4:59 AM | 326 (3.6%) | 156 (1.8%) |
| 5:00 AM to 5:29 AM | 418 (4.6%) | 107 (1.2%) |
| 5:30 AM to 5:59 AM | 356 (3.9%) | 177 (2.0%) |
| 6:00 AM to 6:29 AM | 1,123 (12.4%) | 635 (7.2%) |
| 6:30 AM to 6:59 AM | 706 (7.8%) | 637 (7.2%) |
| 7:00 AM to 7:29 AM | 1,035 (11.4%) | 1,450 (16.5%) |
| 7:30 AM to 7:59 AM | 703 (7.7%) | 562 (6.4%) |
| 8:00 AM to 8:29 AM | 2,292 (25.3%) | 2,033 (23.1%) |
| 8:30 AM to 8:59 AM | 345 (3.8%) | 314 (3.6%) |
| 9:00 AM to 9:59 AM | 503 (5.6%) | 1,459 (16.6%) |
| 10:00 AM to 10:59 AM | 304 (3.4%) | 241 (2.7%) |
| 11:00 AM to 11:59 AM | 82 (0.9%) | 139 (1.6%) |
| 12:00 PM to 3:59 PM | 374 (4.1%) | 554 (6.3%) |
| 4:00 PM to 11:59 PM | 504 (5.6%) | 341 (3.9%) |
| Total | 9,071 (100.0%) | 8,805 (100.0%) |
Housing Occupancy in Kendall West
Occupancy by Ownership in Kendall West
Of the total 12,775 dwellings in Kendall West, owner-occupied units account for 6,877 (53.8%), while renter-occupied units make up 5,898 (46.2%).
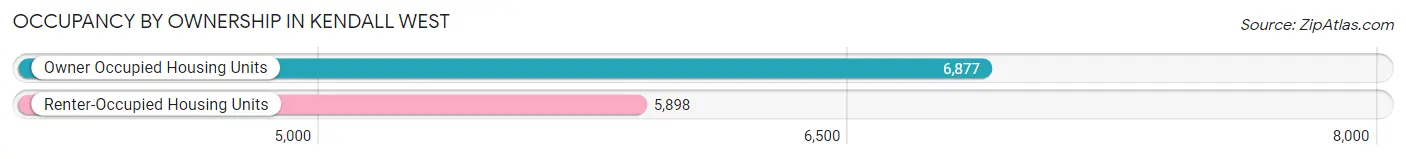
| Occupancy | # Housing Units | % Housing Units |
| Owner Occupied Housing Units | 6,877 | 53.8% |
| Renter-Occupied Housing Units | 5,898 | 46.2% |
| Total Occupied Housing Units | 12,775 | 100.0% |
Occupancy by Household Size in Kendall West
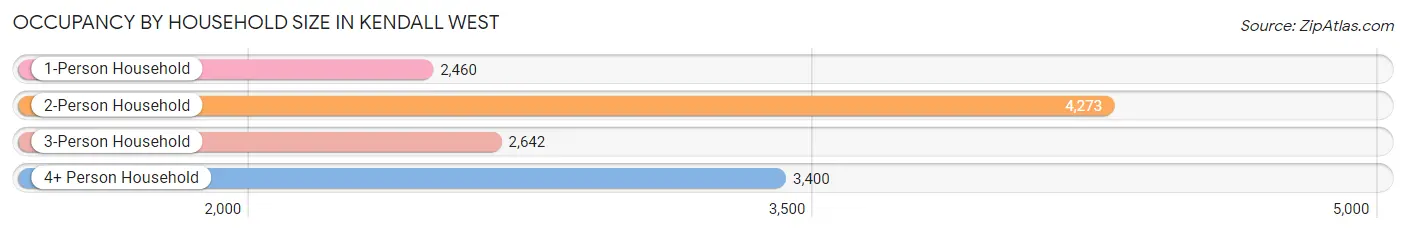
| Household Size | # Housing Units | % Housing Units |
| 1-Person Household | 2,460 | 19.3% |
| 2-Person Household | 4,273 | 33.5% |
| 3-Person Household | 2,642 | 20.7% |
| 4+ Person Household | 3,400 | 26.6% |
| Total Housing Units | 12,775 | 100.0% |
Occupancy by Ownership by Household Size in Kendall West
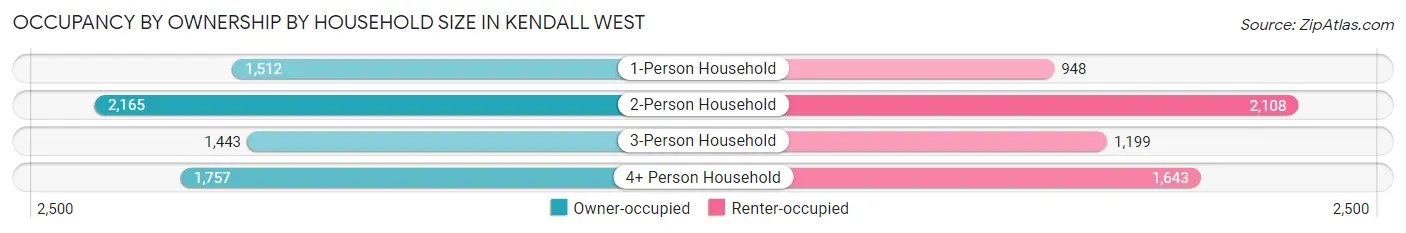
| Household Size | Owner-occupied | Renter-occupied |
| 1-Person Household | 1,512 (61.5%) | 948 (38.5%) |
| 2-Person Household | 2,165 (50.7%) | 2,108 (49.3%) |
| 3-Person Household | 1,443 (54.6%) | 1,199 (45.4%) |
| 4+ Person Household | 1,757 (51.7%) | 1,643 (48.3%) |
| Total Housing Units | 6,877 (53.8%) | 5,898 (46.2%) |
Occupancy by Educational Attainment in Kendall West
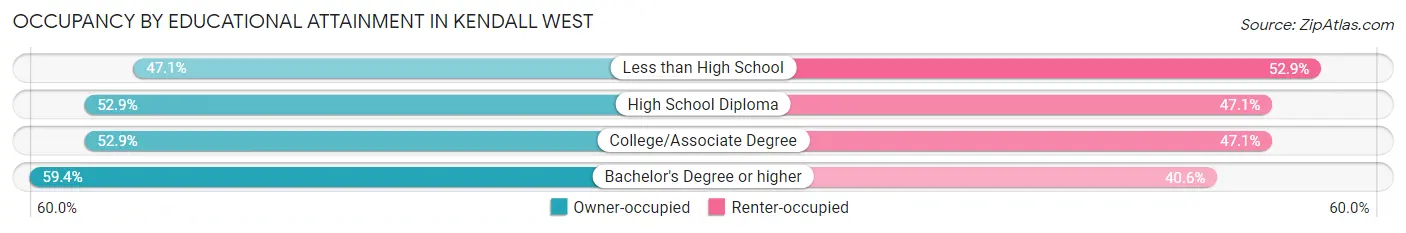
| Household Size | Owner-occupied | Renter-occupied |
| Less than High School | 1,412 (47.1%) | 1,588 (52.9%) |
| High School Diploma | 1,433 (52.9%) | 1,276 (47.1%) |
| College/Associate Degree | 1,351 (52.9%) | 1,204 (47.1%) |
| Bachelor's Degree or higher | 2,681 (59.4%) | 1,830 (40.6%) |
Occupancy by Age of Householder in Kendall West
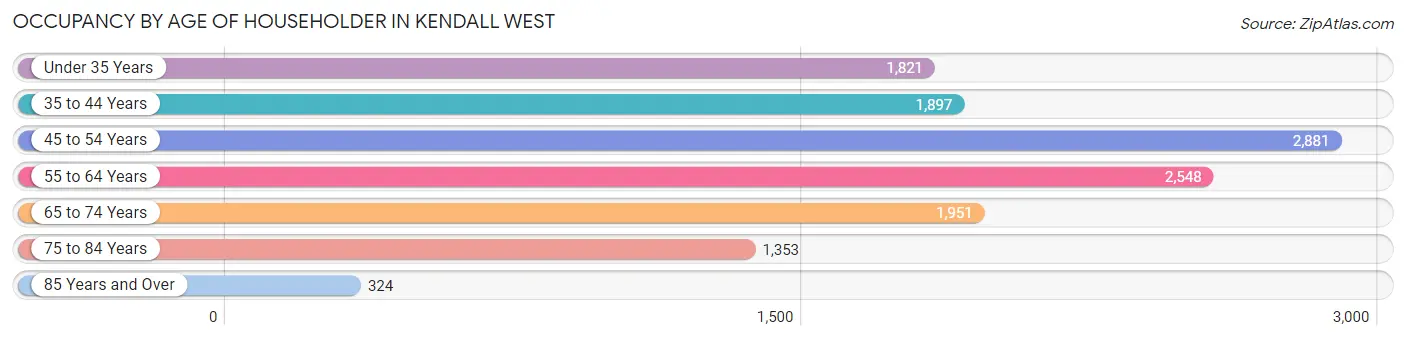
| Age Bracket | # Households | % Households |
| Under 35 Years | 1,821 | 14.2% |
| 35 to 44 Years | 1,897 | 14.8% |
| 45 to 54 Years | 2,881 | 22.6% |
| 55 to 64 Years | 2,548 | 20.0% |
| 65 to 74 Years | 1,951 | 15.3% |
| 75 to 84 Years | 1,353 | 10.6% |
| 85 Years and Over | 324 | 2.5% |
| Total | 12,775 | 100.0% |
Housing Finances in Kendall West
Median Income by Occupancy in Kendall West
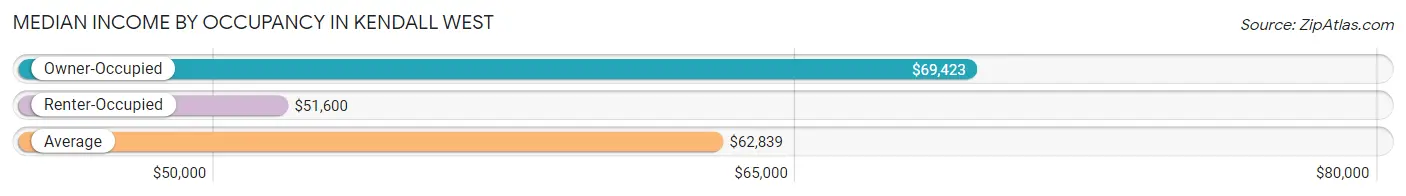
| Occupancy Type | # Households | Median Income |
| Owner-Occupied | 6,877 (53.8%) | $69,423 |
| Renter-Occupied | 5,898 (46.2%) | $51,600 |
| Average | 12,775 (100.0%) | $62,839 |
Occupancy by Householder Income Bracket in Kendall West
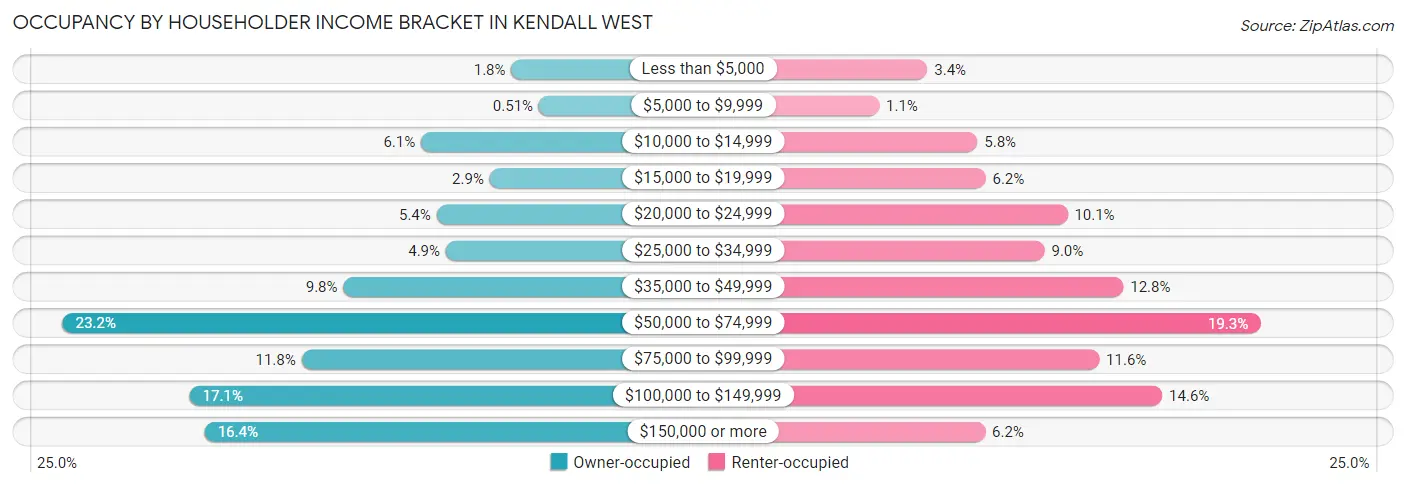
| Income Bracket | Owner-occupied | Renter-occupied |
| Less than $5,000 | 125 (1.8%) | 202 (3.4%) |
| $5,000 to $9,999 | 35 (0.5%) | 66 (1.1%) |
| $10,000 to $14,999 | 421 (6.1%) | 342 (5.8%) |
| $15,000 to $19,999 | 196 (2.9%) | 365 (6.2%) |
| $20,000 to $24,999 | 370 (5.4%) | 595 (10.1%) |
| $25,000 to $34,999 | 340 (4.9%) | 531 (9.0%) |
| $35,000 to $49,999 | 675 (9.8%) | 752 (12.8%) |
| $50,000 to $74,999 | 1,595 (23.2%) | 1,136 (19.3%) |
| $75,000 to $99,999 | 812 (11.8%) | 684 (11.6%) |
| $100,000 to $149,999 | 1,179 (17.1%) | 861 (14.6%) |
| $150,000 or more | 1,129 (16.4%) | 364 (6.2%) |
| Total | 6,877 (100.0%) | 5,898 (100.0%) |
Monthly Housing Cost Tiers in Kendall West
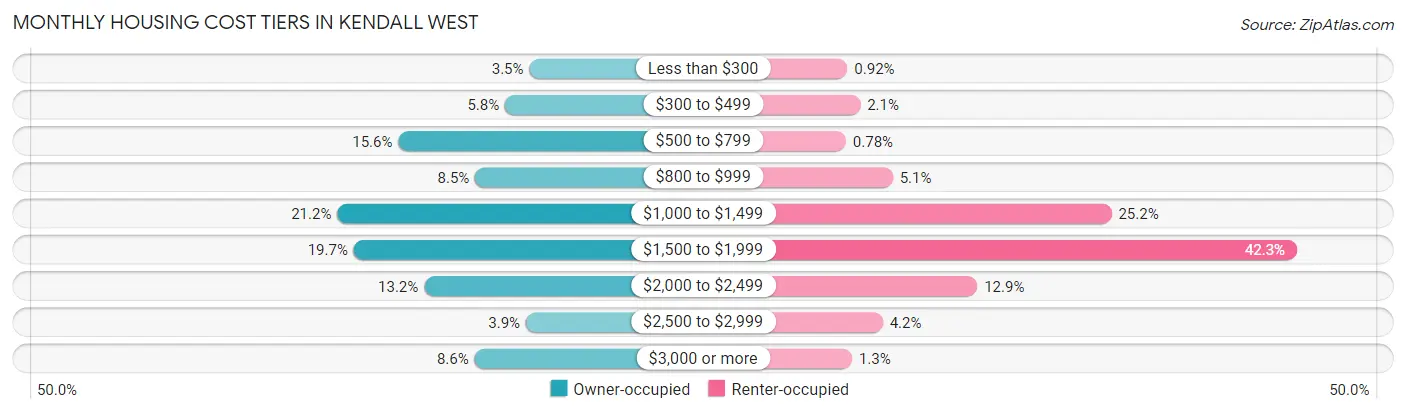
| Monthly Cost | Owner-occupied | Renter-occupied |
| Less than $300 | 243 (3.5%) | 54 (0.9%) |
| $300 to $499 | 397 (5.8%) | 124 (2.1%) |
| $500 to $799 | 1,073 (15.6%) | 46 (0.8%) |
| $800 to $999 | 586 (8.5%) | 300 (5.1%) |
| $1,000 to $1,499 | 1,459 (21.2%) | 1,488 (25.2%) |
| $1,500 to $1,999 | 1,355 (19.7%) | 2,495 (42.3%) |
| $2,000 to $2,499 | 909 (13.2%) | 759 (12.9%) |
| $2,500 to $2,999 | 265 (3.8%) | 246 (4.2%) |
| $3,000 or more | 590 (8.6%) | 79 (1.3%) |
| Total | 6,877 (100.0%) | 5,898 (100.0%) |
Physical Housing Characteristics in Kendall West
Housing Structures in Kendall West
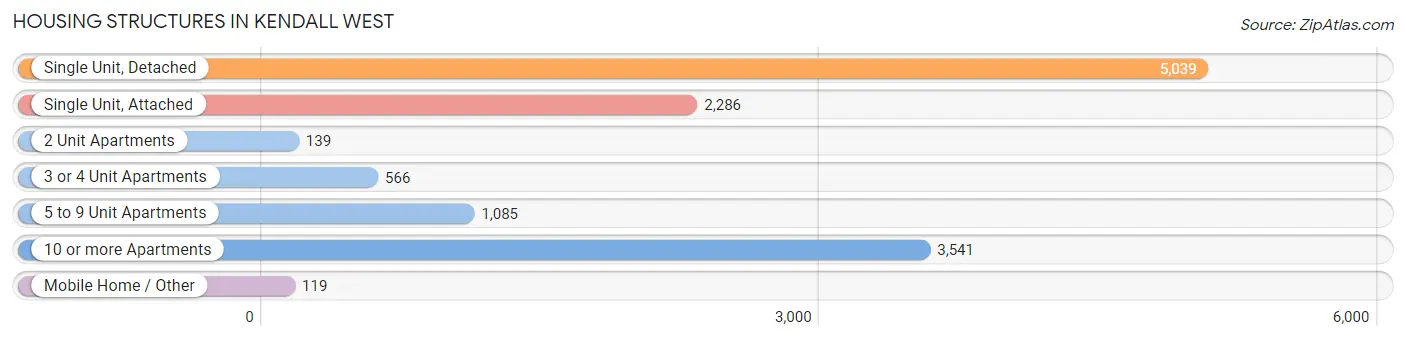
| Structure Type | # Housing Units | % Housing Units |
| Single Unit, Detached | 5,039 | 39.4% |
| Single Unit, Attached | 2,286 | 17.9% |
| 2 Unit Apartments | 139 | 1.1% |
| 3 or 4 Unit Apartments | 566 | 4.4% |
| 5 to 9 Unit Apartments | 1,085 | 8.5% |
| 10 or more Apartments | 3,541 | 27.7% |
| Mobile Home / Other | 119 | 0.9% |
| Total | 12,775 | 100.0% |
Housing Structures by Occupancy in Kendall West
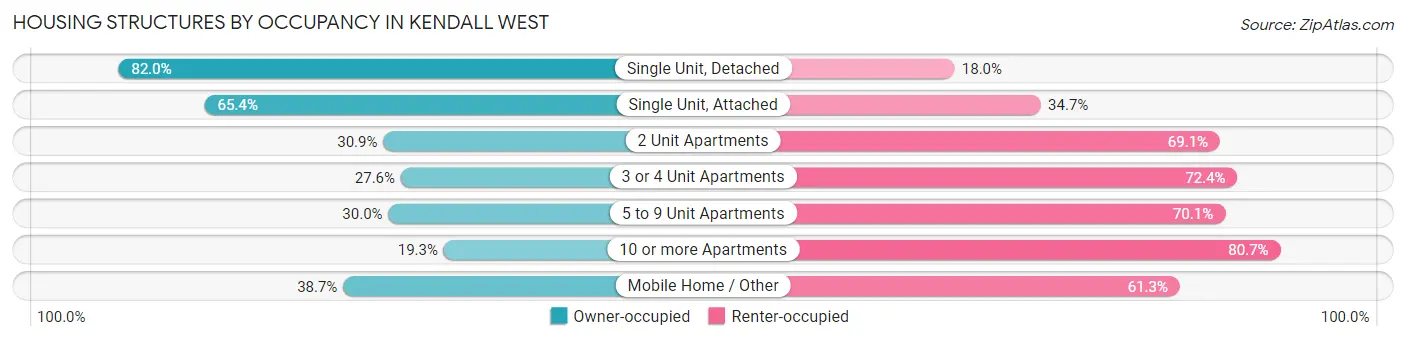
| Structure Type | Owner-occupied | Renter-occupied |
| Single Unit, Detached | 4,130 (82.0%) | 909 (18.0%) |
| Single Unit, Attached | 1,494 (65.3%) | 792 (34.6%) |
| 2 Unit Apartments | 43 (30.9%) | 96 (69.1%) |
| 3 or 4 Unit Apartments | 156 (27.6%) | 410 (72.4%) |
| 5 to 9 Unit Apartments | 325 (29.9%) | 760 (70.1%) |
| 10 or more Apartments | 683 (19.3%) | 2,858 (80.7%) |
| Mobile Home / Other | 46 (38.7%) | 73 (61.3%) |
| Total | 6,877 (53.8%) | 5,898 (46.2%) |
Housing Structures by Number of Rooms in Kendall West
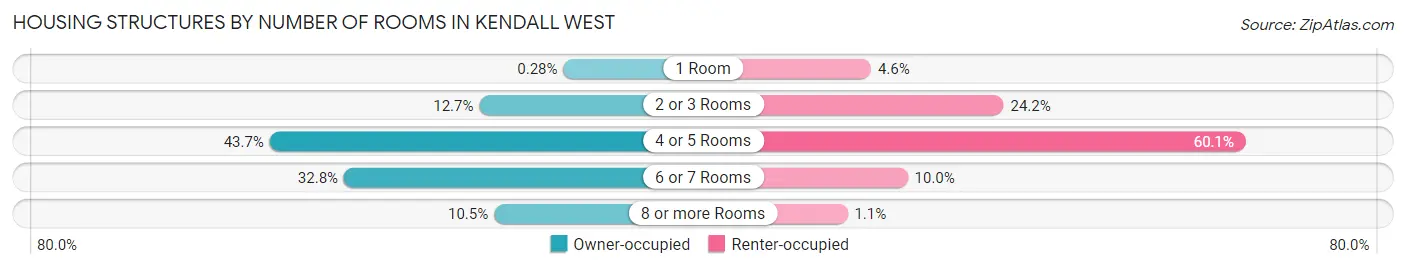
| Number of Rooms | Owner-occupied | Renter-occupied |
| 1 Room | 19 (0.3%) | 271 (4.6%) |
| 2 or 3 Rooms | 875 (12.7%) | 1,428 (24.2%) |
| 4 or 5 Rooms | 3,007 (43.7%) | 3,542 (60.1%) |
| 6 or 7 Rooms | 2,252 (32.8%) | 591 (10.0%) |
| 8 or more Rooms | 724 (10.5%) | 66 (1.1%) |
| Total | 6,877 (100.0%) | 5,898 (100.0%) |
Housing Structure by Heating Type in Kendall West
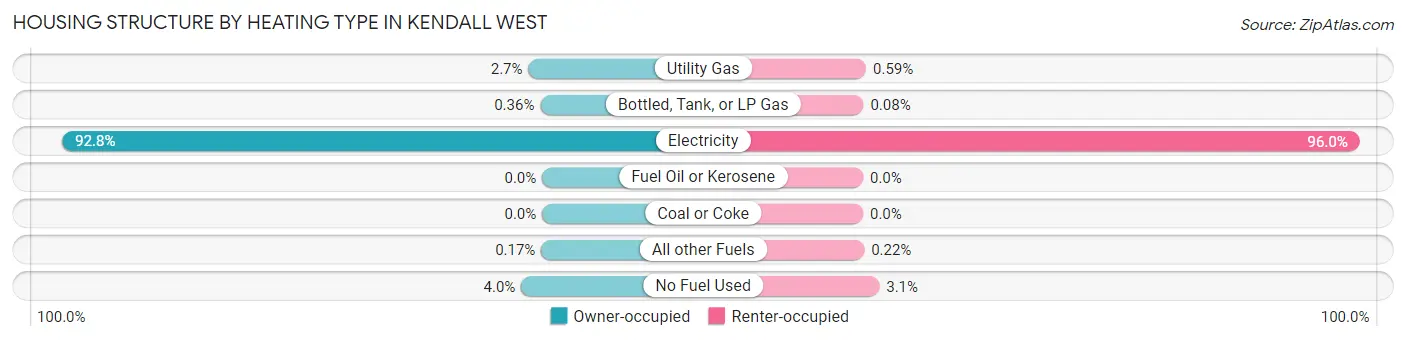
| Heating Type | Owner-occupied | Renter-occupied |
| Utility Gas | 183 (2.7%) | 35 (0.6%) |
| Bottled, Tank, or LP Gas | 25 (0.4%) | 5 (0.1%) |
| Electricity | 6,379 (92.8%) | 5,660 (96.0%) |
| Fuel Oil or Kerosene | 0 (0.0%) | 0 (0.0%) |
| Coal or Coke | 0 (0.0%) | 0 (0.0%) |
| All other Fuels | 12 (0.2%) | 13 (0.2%) |
| No Fuel Used | 278 (4.0%) | 185 (3.1%) |
| Total | 6,877 (100.0%) | 5,898 (100.0%) |
Household Vehicle Usage in Kendall West
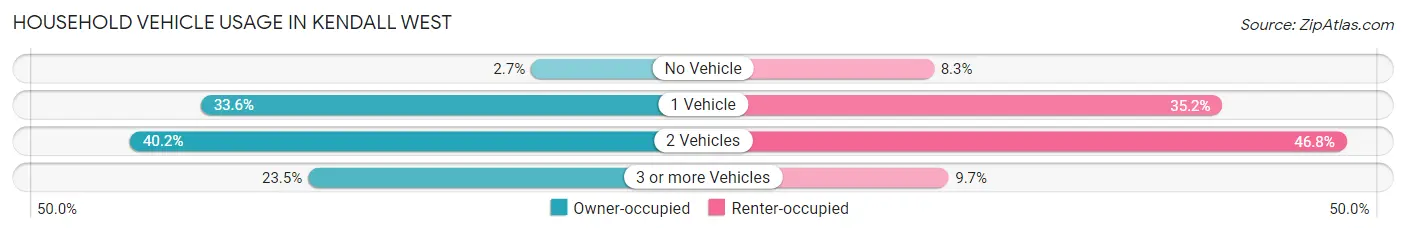
| Vehicles per Household | Owner-occupied | Renter-occupied |
| No Vehicle | 188 (2.7%) | 489 (8.3%) |
| 1 Vehicle | 2,308 (33.6%) | 2,078 (35.2%) |
| 2 Vehicles | 2,762 (40.2%) | 2,762 (46.8%) |
| 3 or more Vehicles | 1,619 (23.5%) | 569 (9.7%) |
| Total | 6,877 (100.0%) | 5,898 (100.0%) |
Real Estate & Mortgages in Kendall West
Real Estate and Mortgage Overview in Kendall West
| Characteristic | Without Mortgage | With Mortgage |
| Housing Units | 2,215 | 4,662 |
| Median Property Value | $347,900 | $322,800 |
| Median Household Income | $51,761 | $897 |
| Monthly Housing Costs | $649 | $590 |
| Real Estate Taxes | $2,363 | $28 |
Property Value by Mortgage Status in Kendall West
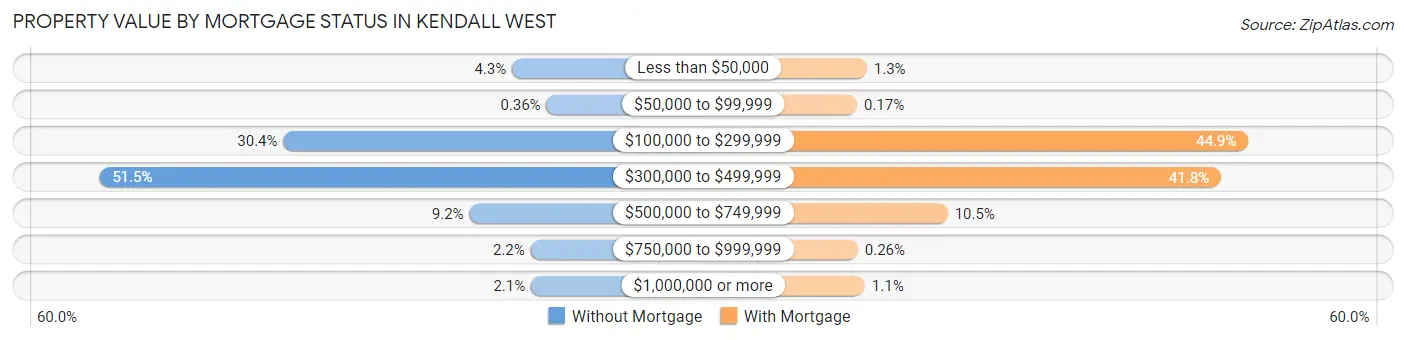
| Property Value | Without Mortgage | With Mortgage |
| Less than $50,000 | 95 (4.3%) | 60 (1.3%) |
| $50,000 to $99,999 | 8 (0.4%) | 8 (0.2%) |
| $100,000 to $299,999 | 674 (30.4%) | 2,093 (44.9%) |
| $300,000 to $499,999 | 1,140 (51.5%) | 1,948 (41.8%) |
| $500,000 to $749,999 | 203 (9.2%) | 491 (10.5%) |
| $750,000 to $999,999 | 48 (2.2%) | 12 (0.3%) |
| $1,000,000 or more | 47 (2.1%) | 50 (1.1%) |
| Total | 2,215 (100.0%) | 4,662 (100.0%) |
Household Income by Mortgage Status in Kendall West
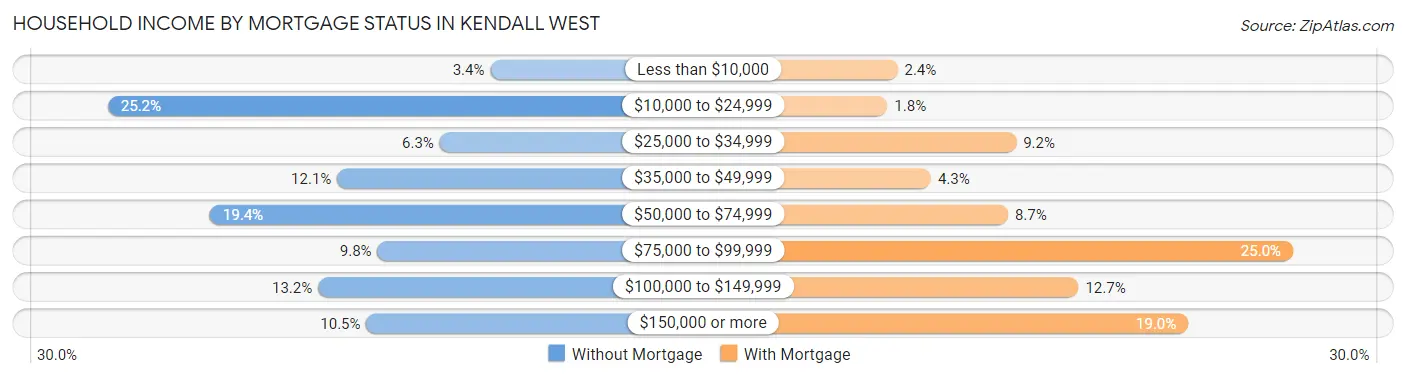
| Household Income | Without Mortgage | With Mortgage |
| Less than $10,000 | 75 (3.4%) | 112 (2.4%) |
| $10,000 to $24,999 | 559 (25.2%) | 85 (1.8%) |
| $25,000 to $34,999 | 139 (6.3%) | 428 (9.2%) |
| $35,000 to $49,999 | 269 (12.1%) | 201 (4.3%) |
| $50,000 to $74,999 | 430 (19.4%) | 406 (8.7%) |
| $75,000 to $99,999 | 218 (9.8%) | 1,165 (25.0%) |
| $100,000 to $149,999 | 293 (13.2%) | 594 (12.7%) |
| $150,000 or more | 232 (10.5%) | 886 (19.0%) |
| Total | 2,215 (100.0%) | 4,662 (100.0%) |
Property Value to Household Income Ratio in Kendall West
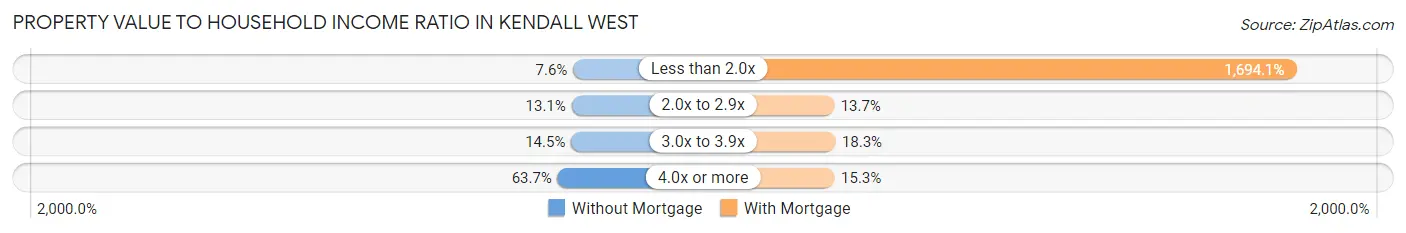
| Value-to-Income Ratio | Without Mortgage | With Mortgage |
| Less than 2.0x | 168 (7.6%) | 78,980 (1,694.1%) |
| 2.0x to 2.9x | 290 (13.1%) | 640 (13.7%) |
| 3.0x to 3.9x | 321 (14.5%) | 852 (18.3%) |
| 4.0x or more | 1,410 (63.7%) | 714 (15.3%) |
| Total | 2,215 (100.0%) | 4,662 (100.0%) |
Real Estate Taxes by Mortgage Status in Kendall West
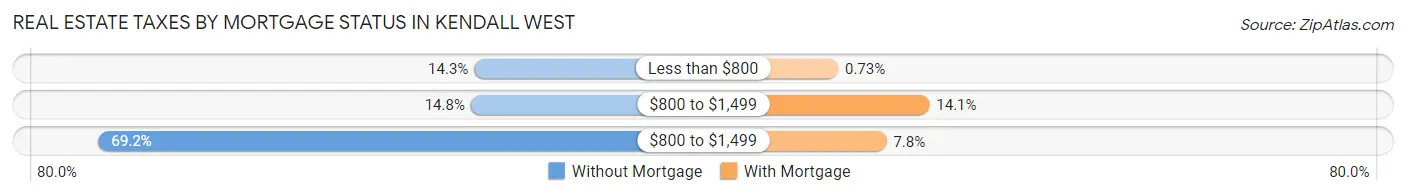
| Property Taxes | Without Mortgage | With Mortgage |
| Less than $800 | 317 (14.3%) | 34 (0.7%) |
| $800 to $1,499 | 328 (14.8%) | 656 (14.1%) |
| $800 to $1,499 | 1,533 (69.2%) | 364 (7.8%) |
| Total | 2,215 (100.0%) | 4,662 (100.0%) |
Health & Disability in Kendall West
Health Insurance Coverage by Age in Kendall West
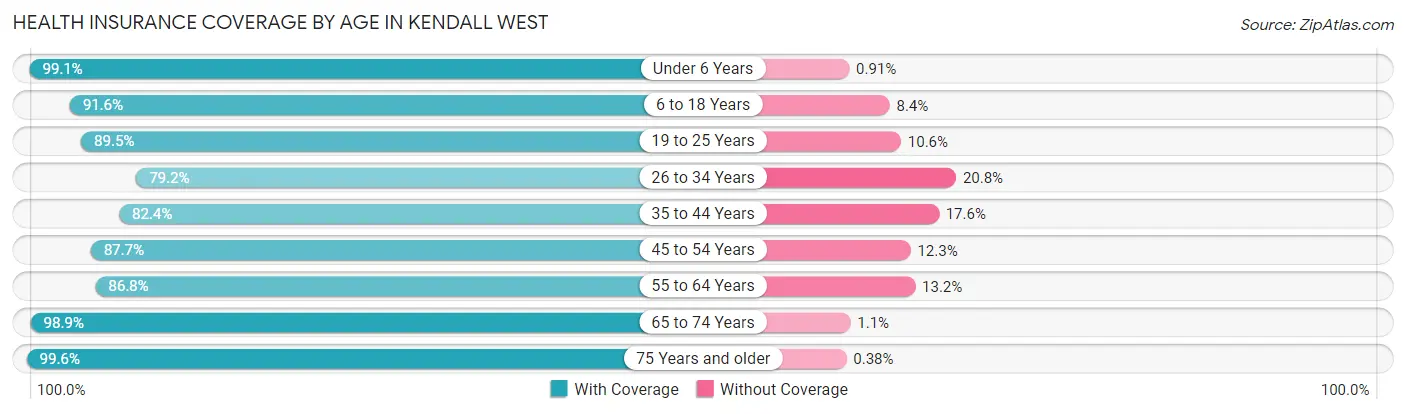
| Age Bracket | With Coverage | Without Coverage |
| Under 6 Years | 1,415 (99.1%) | 13 (0.9%) |
| 6 to 18 Years | 4,266 (91.6%) | 393 (8.4%) |
| 19 to 25 Years | 2,721 (89.4%) | 321 (10.5%) |
| 26 to 34 Years | 3,726 (79.2%) | 980 (20.8%) |
| 35 to 44 Years | 3,528 (82.4%) | 754 (17.6%) |
| 45 to 54 Years | 5,114 (87.7%) | 720 (12.3%) |
| 55 to 64 Years | 4,220 (86.8%) | 642 (13.2%) |
| 65 to 74 Years | 3,497 (98.9%) | 40 (1.1%) |
| 75 Years and older | 3,164 (99.6%) | 12 (0.4%) |
| Total | 31,651 (89.1%) | 3,875 (10.9%) |
Health Insurance Coverage by Citizenship Status in Kendall West
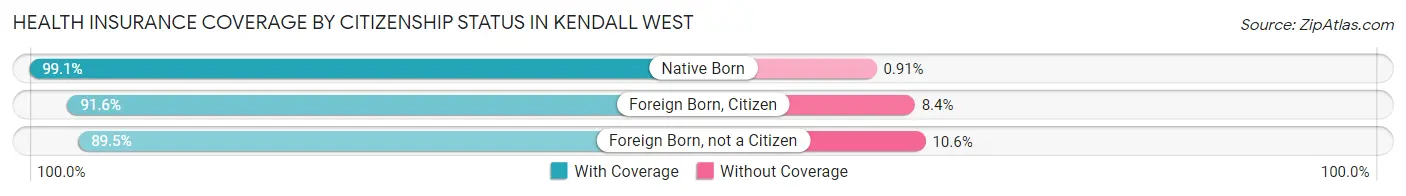
| Citizenship Status | With Coverage | Without Coverage |
| Native Born | 1,415 (99.1%) | 13 (0.9%) |
| Foreign Born, Citizen | 4,266 (91.6%) | 393 (8.4%) |
| Foreign Born, not a Citizen | 2,721 (89.4%) | 321 (10.5%) |
Health Insurance Coverage by Household Income in Kendall West
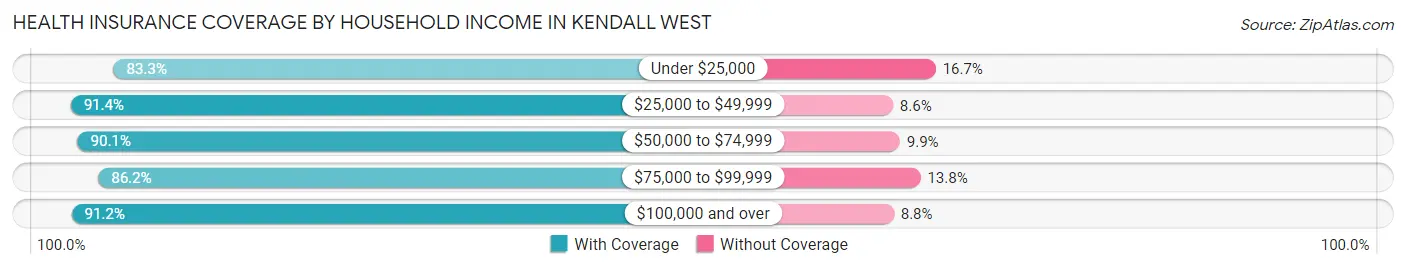
| Household Income | With Coverage | Without Coverage |
| Under $25,000 | 4,172 (83.3%) | 834 (16.7%) |
| $25,000 to $49,999 | 5,213 (91.4%) | 493 (8.6%) |
| $50,000 to $74,999 | 6,697 (90.1%) | 739 (9.9%) |
| $75,000 to $99,999 | 4,363 (86.2%) | 699 (13.8%) |
| $100,000 and over | 11,162 (91.2%) | 1,077 (8.8%) |
Public vs Private Health Insurance Coverage by Age in Kendall West
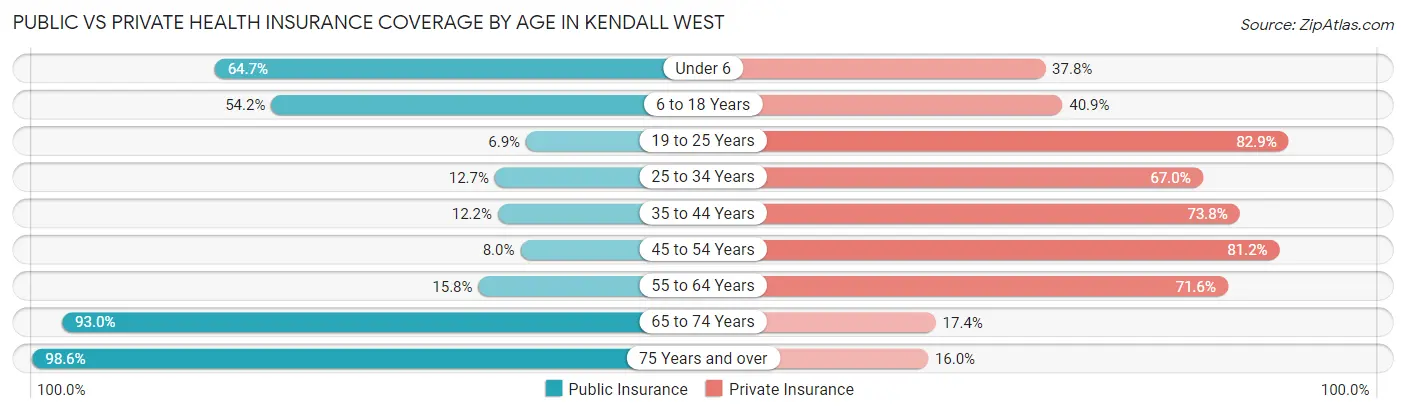
| Age Bracket | Public Insurance | Private Insurance |
| Under 6 | 924 (64.7%) | 539 (37.8%) |
| 6 to 18 Years | 2,526 (54.2%) | 1,907 (40.9%) |
| 19 to 25 Years | 211 (6.9%) | 2,522 (82.9%) |
| 25 to 34 Years | 599 (12.7%) | 3,151 (67.0%) |
| 35 to 44 Years | 521 (12.2%) | 3,161 (73.8%) |
| 45 to 54 Years | 466 (8.0%) | 4,739 (81.2%) |
| 55 to 64 Years | 767 (15.8%) | 3,483 (71.6%) |
| 65 to 74 Years | 3,290 (93.0%) | 616 (17.4%) |
| 75 Years and over | 3,130 (98.6%) | 508 (16.0%) |
| Total | 12,434 (35.0%) | 20,626 (58.1%) |
Disability Status by Sex by Age in Kendall West
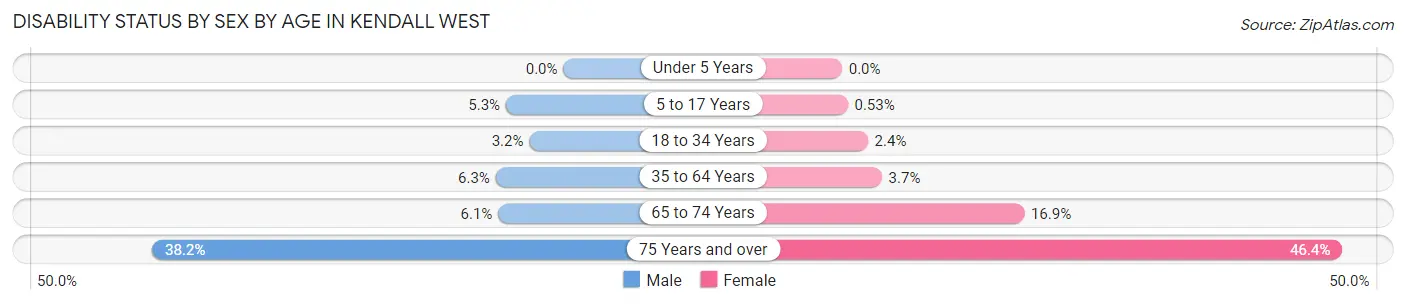
| Age Bracket | Male | Female |
| Under 5 Years | 0 (0.0%) | 0 (0.0%) |
| 5 to 17 Years | 125 (5.3%) | 11 (0.5%) |
| 18 to 34 Years | 136 (3.2%) | 93 (2.4%) |
| 35 to 64 Years | 434 (6.3%) | 298 (3.7%) |
| 65 to 74 Years | 87 (6.0%) | 355 (16.9%) |
| 75 Years and over | 392 (38.2%) | 998 (46.4%) |
Disability Class by Sex by Age in Kendall West
Disability Class: Hearing Difficulty
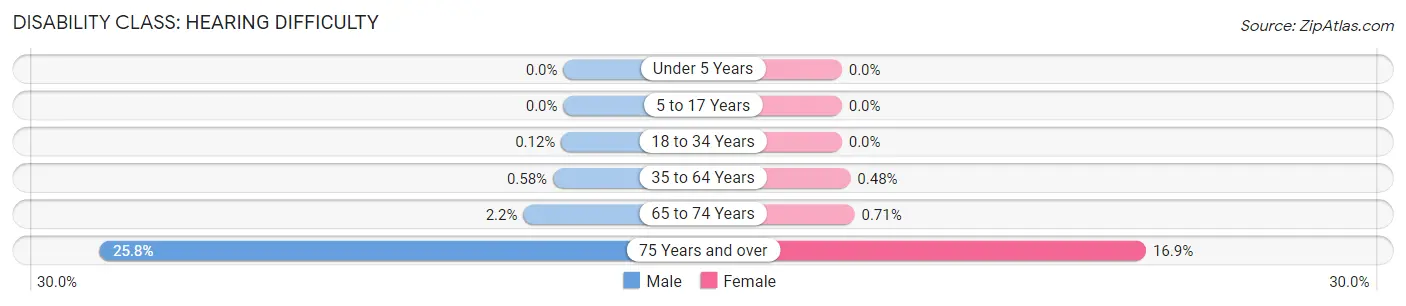
| Age Bracket | Male | Female |
| Under 5 Years | 0 (0.0%) | 0 (0.0%) |
| 5 to 17 Years | 0 (0.0%) | 0 (0.0%) |
| 18 to 34 Years | 5 (0.1%) | 0 (0.0%) |
| 35 to 64 Years | 40 (0.6%) | 39 (0.5%) |
| 65 to 74 Years | 32 (2.2%) | 15 (0.7%) |
| 75 Years and over | 265 (25.8%) | 364 (16.9%) |
Disability Class: Vision Difficulty
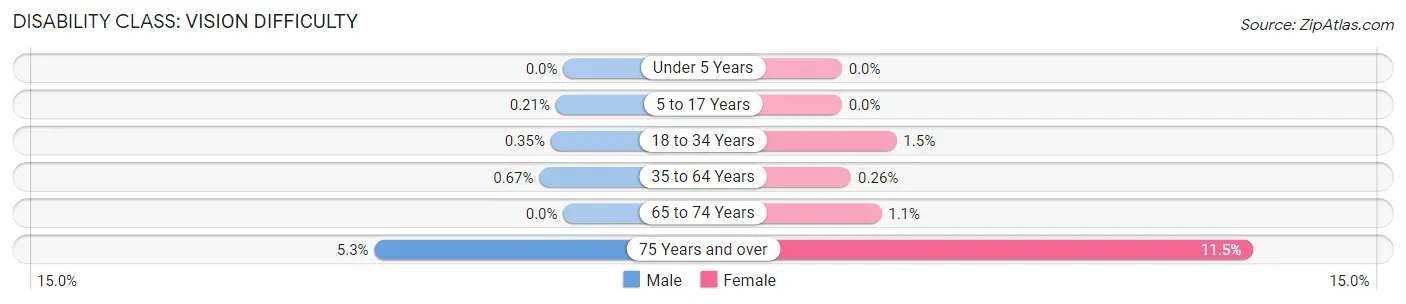
| Age Bracket | Male | Female |
| Under 5 Years | 0 (0.0%) | 0 (0.0%) |
| 5 to 17 Years | 5 (0.2%) | 0 (0.0%) |
| 18 to 34 Years | 15 (0.4%) | 59 (1.5%) |
| 35 to 64 Years | 46 (0.7%) | 21 (0.3%) |
| 65 to 74 Years | 0 (0.0%) | 23 (1.1%) |
| 75 Years and over | 54 (5.3%) | 246 (11.5%) |
Disability Class: Cognitive Difficulty
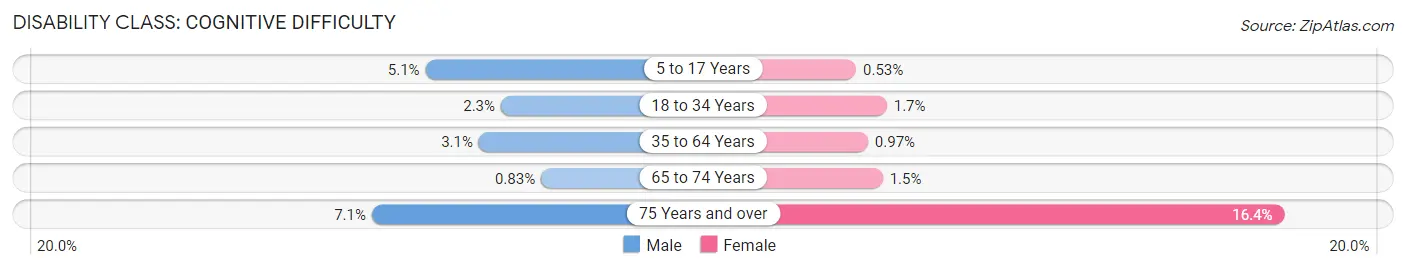
| Age Bracket | Male | Female |
| 5 to 17 Years | 120 (5.1%) | 11 (0.5%) |
| 18 to 34 Years | 100 (2.3%) | 65 (1.7%) |
| 35 to 64 Years | 217 (3.1%) | 78 (1.0%) |
| 65 to 74 Years | 12 (0.8%) | 32 (1.5%) |
| 75 Years and over | 73 (7.1%) | 353 (16.4%) |
Disability Class: Ambulatory Difficulty
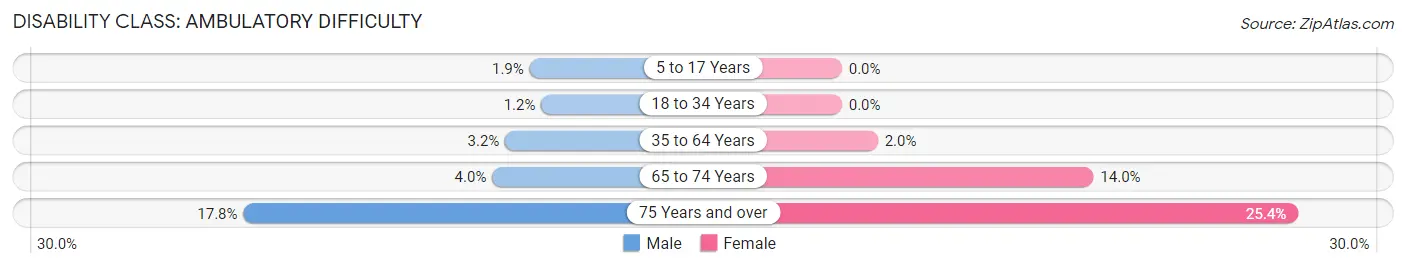
| Age Bracket | Male | Female |
| 5 to 17 Years | 44 (1.9%) | 0 (0.0%) |
| 18 to 34 Years | 53 (1.2%) | 0 (0.0%) |
| 35 to 64 Years | 224 (3.2%) | 161 (2.0%) |
| 65 to 74 Years | 57 (4.0%) | 294 (14.0%) |
| 75 Years and over | 183 (17.8%) | 546 (25.4%) |
Disability Class: Self-Care Difficulty
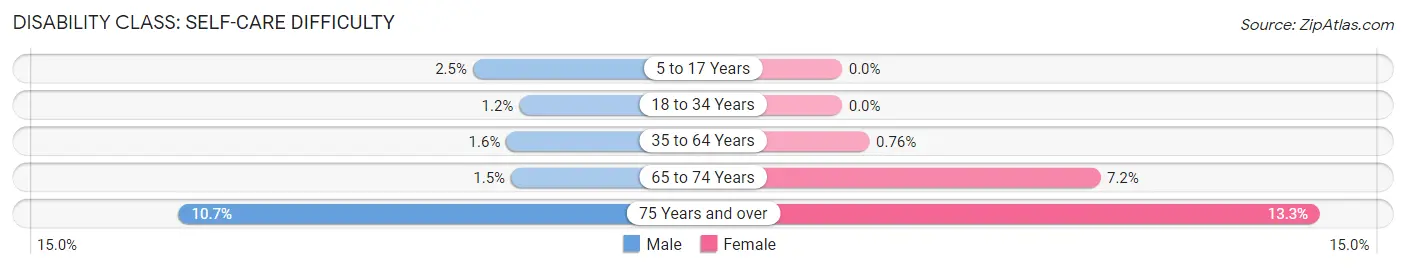
| Age Bracket | Male | Female |
| 5 to 17 Years | 59 (2.5%) | 0 (0.0%) |
| 18 to 34 Years | 53 (1.2%) | 0 (0.0%) |
| 35 to 64 Years | 110 (1.6%) | 61 (0.8%) |
| 65 to 74 Years | 21 (1.5%) | 151 (7.2%) |
| 75 Years and over | 110 (10.7%) | 286 (13.3%) |
Technology Access in Kendall West
Computing Device Access in Kendall West
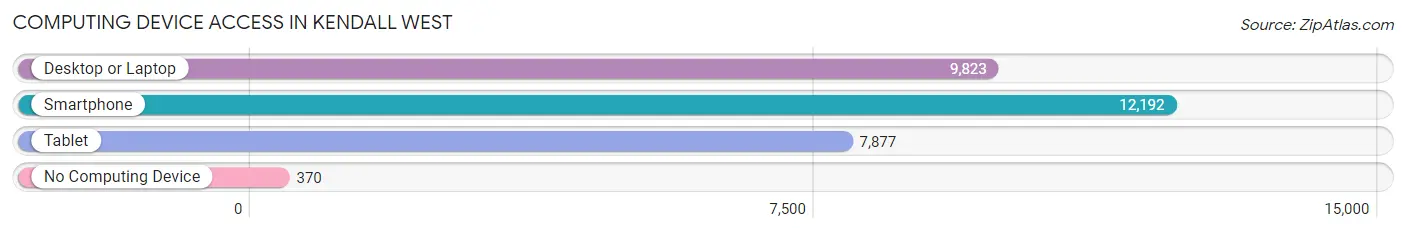
| Device Type | # Households | % Households |
| Desktop or Laptop | 9,823 | 76.9% |
| Smartphone | 12,192 | 95.4% |
| Tablet | 7,877 | 61.7% |
| No Computing Device | 370 | 2.9% |
| Total | 12,775 | 100.0% |
Internet Access in Kendall West
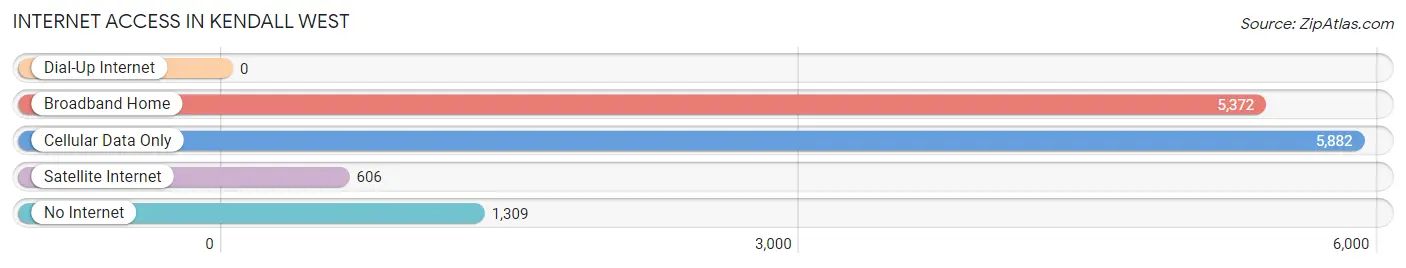
| Internet Type | # Households | % Households |
| Dial-Up Internet | 0 | 0.0% |
| Broadband Home | 5,372 | 42.0% |
| Cellular Data Only | 5,882 | 46.0% |
| Satellite Internet | 606 | 4.7% |
| No Internet | 1,309 | 10.2% |
| Total | 12,775 | 100.0% |
Kendall West Summary
Kendall West is a census-designated place (CDP) located in Miami-Dade County, Florida. It is located in the western part of the county, just south of the city of Miami. The population of Kendall West was estimated to be 24,837 in 2019.
Geography
Kendall West is located at 25°41'25" North, 80°22'45" West (25.690278, -80.379167). It is bordered by the cities of Miami and Doral to the north, the CDP of West Kendall to the east, the CDP of The Crossings to the south, and the CDP of Country Walk to the west. The total area of Kendall West is 8.3 square miles, of which 8.2 square miles is land and 0.1 square miles is water.
Kendall West is located in the Miami metropolitan area, which is the seventh-largest metropolitan area in the United States. The Miami metropolitan area is home to over 6 million people.
History
Kendall West was originally part of the Everglades, and was settled by Native Americans. The area was later settled by European settlers in the late 19th century. The area was originally known as West Kendall, and was incorporated as a town in 1925. The town was later annexed by the city of Miami in 1926.
In the 1950s, Kendall West began to experience rapid population growth due to the construction of the Tamiami Trail, which connected Miami to Naples. The area was also home to a number of new housing developments, which attracted many new residents.
In the 1970s, Kendall West experienced a period of decline due to the construction of the Palmetto Expressway, which cut through the area. The area also experienced a decrease in population due to the construction of the Miami International Airport.
Economy
Kendall West is home to a number of businesses and industries. The area is home to a number of retail stores, restaurants, and other businesses. The area is also home to a number of medical centers, including the Miami Children's Hospital and the Kendall Regional Medical Center.
Kendall West is also home to a number of corporate headquarters, including Burger King, Ryder Systems, and Ryder Logistics. The area is also home to a number of technology companies, including Microsoft, Oracle, and IBM.
Demographics
Kendall West is a diverse community, with a population that is composed of a variety of ethnic and racial backgrounds. The population of Kendall West is estimated to be 24,837 in 2019. The racial makeup of the population is 57.3% White, 22.2% Hispanic or Latino, 15.2% Black or African American, 3.2% Asian, and 2.1% other.
The median household income in Kendall West is $50,945, and the median home value is $272,400. The median age of the population is 38.7 years.
Conclusion
Kendall West is a census-designated place located in Miami-Dade County, Florida. It is located in the western part of the county, just south of the city of Miami. The population of Kendall West was estimated to be 24,837 in 2019. The area is home to a number of businesses and industries, and is a diverse community with a population that is composed of a variety of ethnic and racial backgrounds. The median household income in Kendall West is $50,945, and the median home value is $272,400.
Common Questions
What is Per Capita Income in Kendall West?
Per Capita income in Kendall West is $29,171.
What is the Median Family Income in Kendall West?
Median Family Income in Kendall West is $66,404.
What is the Median Household income in Kendall West?
Median Household Income in Kendall West is $62,839.
What is Income or Wage Gap in Kendall West?
Income or Wage Gap in Kendall West is 12.7%.
Women in Kendall West earn 87.3 cents for every dollar earned by a man.
What is Family Income Deficit in Kendall West?
Family Income Deficit in Kendall West is $6,737.
Families that are below poverty line in Kendall West earn $6,737 less on average than the poverty threshold level.
What is Inequality or Gini Index in Kendall West?
Inequality or Gini Index in Kendall West is 0.42.
What is the Total Population of Kendall West?
Total Population of Kendall West is 35,606.
What is the Total Male Population of Kendall West?
Total Male Population of Kendall West is 16,668.
What is the Total Female Population of Kendall West?
Total Female Population of Kendall West is 18,938.
What is the Ratio of Males per 100 Females in Kendall West?
There are 88.01 Males per 100 Females in Kendall West.
What is the Ratio of Females per 100 Males in Kendall West?
There are 113.62 Females per 100 Males in Kendall West.
What is the Median Population Age in Kendall West?
Median Population Age in Kendall West is 44.4 Years.
What is the Average Family Size in Kendall West
Average Family Size in Kendall West is 3.1 People.
What is the Average Household Size in Kendall West
Average Household Size in Kendall West is 2.8 People.
How Large is the Labor Force in Kendall West?
There are 19,961 People in the Labor Forcein in Kendall West.
What is the Percentage of People in the Labor Force in Kendall West?
65.1% of People are in the Labor Force in Kendall West.
What is the Unemployment Rate in Kendall West?
Unemployment Rate in Kendall West is 2.9%.