Lauderdale by the Sea, FL Map & Demographics
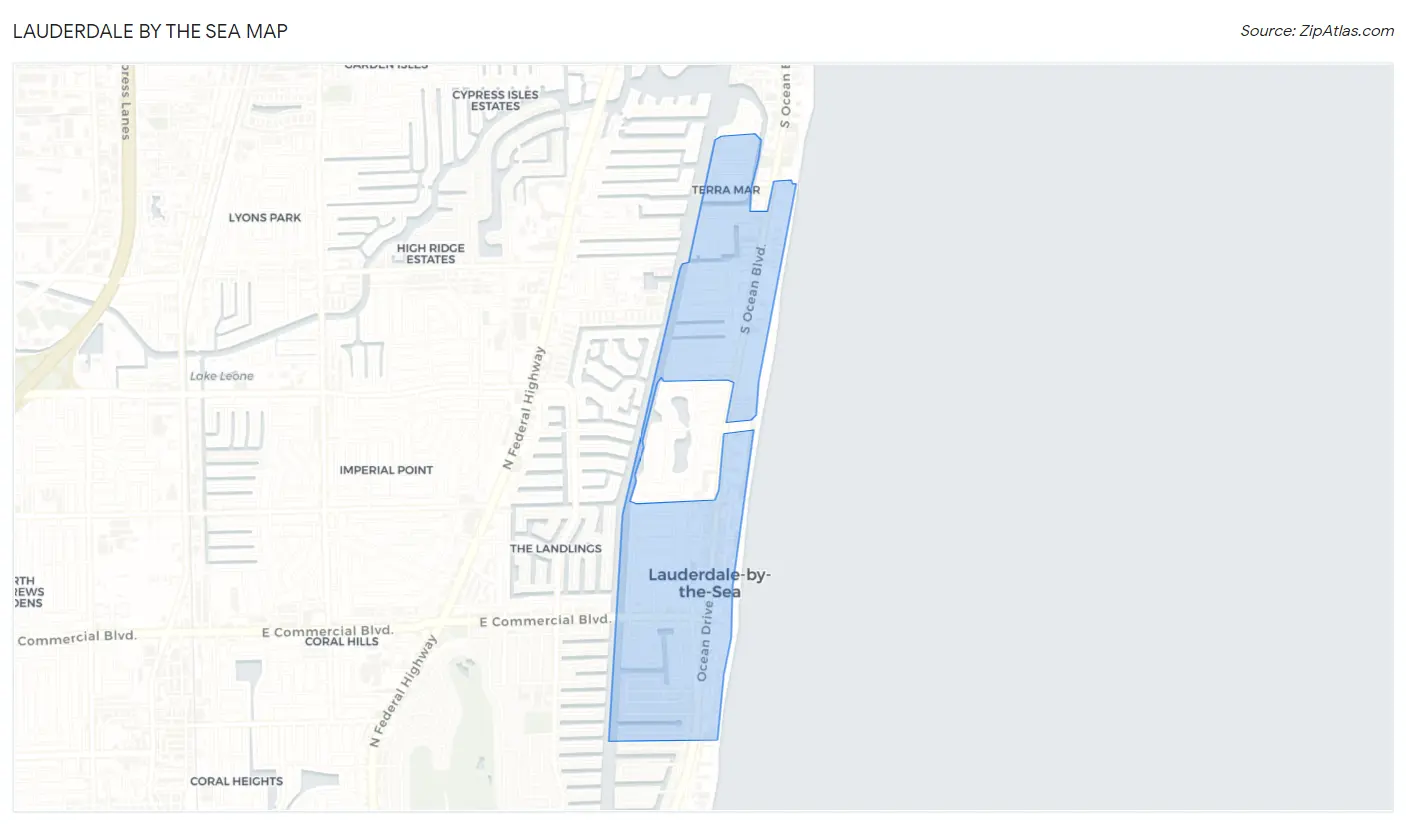
Lauderdale by the Sea Map
Lauderdale by the Sea Overview
$67,569
PER CAPITA INCOME
$104,193
AVG FAMILY INCOME
$76,855
AVG HOUSEHOLD INCOME
45.3%
WAGE / INCOME GAP [ % ]
54.7¢/ $1
WAGE / INCOME GAP [ $ ]
0.54
INEQUALITY / GINI INDEX
6,202
TOTAL POPULATION
2,635
MALE POPULATION
3,567
FEMALE POPULATION
73.87
MALES / 100 FEMALES
135.37
FEMALES / 100 MALES
60.0
MEDIAN AGE
2.6
AVG FAMILY SIZE
1.9
AVG HOUSEHOLD SIZE
2,673
LABOR FORCE [ PEOPLE ]
46.5%
PERCENT IN LABOR FORCE
3.0%
UNEMPLOYMENT RATE
Lauderdale by the Sea Area Codes
Income in Lauderdale by the Sea
Income Overview in Lauderdale by the Sea
Per Capita Income in Lauderdale by the Sea is $67,569, while median incomes of families and households are $104,193 and $76,855 respectively.
| Characteristic | Number | Measure |
| Per Capita Income | 6,202 | $67,569 |
| Median Family Income | 1,673 | $104,193 |
| Mean Family Income | 1,673 | $175,035 |
| Median Household Income | 3,243 | $76,855 |
| Mean Household Income | 3,243 | $128,672 |
| Income Deficit | 1,673 | $0 |
| Wage / Income Gap (%) | 6,202 | 45.32% |
| Wage / Income Gap ($) | 6,202 | 54.68¢ per $1 |
| Gini / Inequality Index | 6,202 | 0.54 |
Earnings by Sex in Lauderdale by the Sea
Average Earnings in Lauderdale by the Sea are $42,512, $56,333 for men and $30,803 for women, a difference of 45.3%.
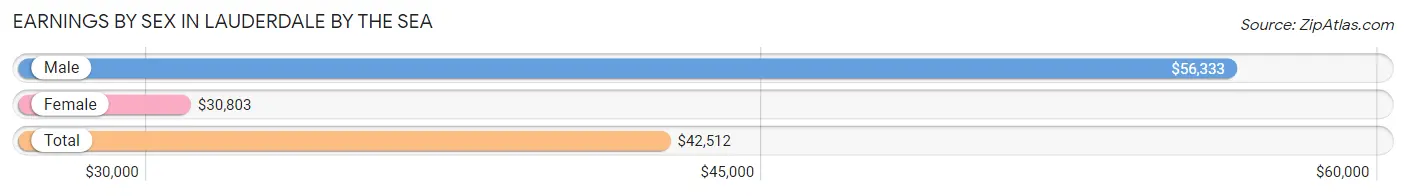
| Sex | Number | Average Earnings |
| Male | 1,478 (49.0%) | $56,333 |
| Female | 1,535 (50.9%) | $30,803 |
| Total | 3,013 (100.0%) | $42,512 |
Earnings by Sex by Income Bracket in Lauderdale by the Sea
The most common earnings brackets in Lauderdale by the Sea are $100,000+ for men (467 | 31.6%) and $100,000+ for women (280 | 18.2%).
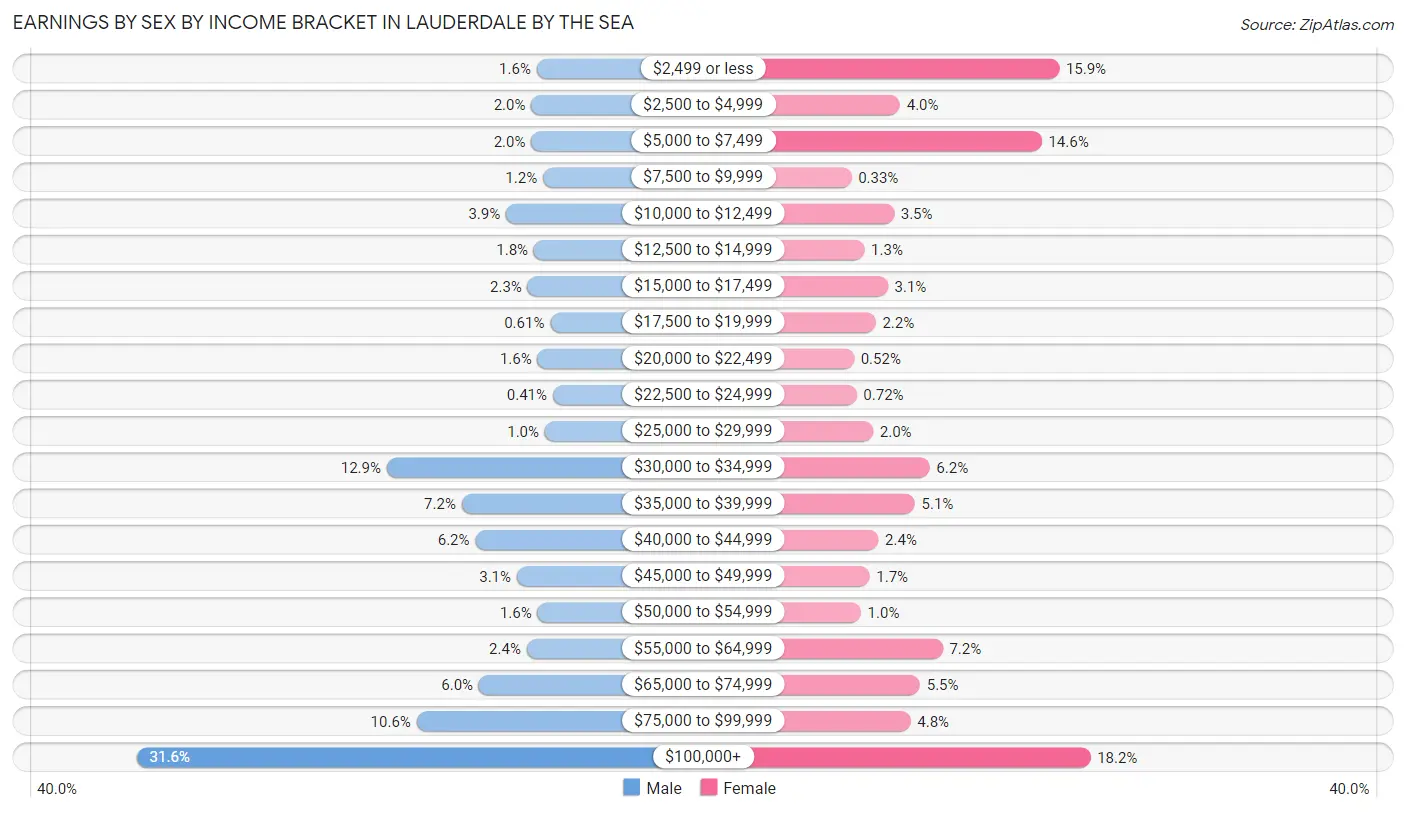
| Income | Male | Female |
| $2,499 or less | 24 (1.6%) | 244 (15.9%) |
| $2,500 to $4,999 | 30 (2.0%) | 61 (4.0%) |
| $5,000 to $7,499 | 30 (2.0%) | 224 (14.6%) |
| $7,500 to $9,999 | 17 (1.1%) | 5 (0.3%) |
| $10,000 to $12,499 | 58 (3.9%) | 54 (3.5%) |
| $12,500 to $14,999 | 27 (1.8%) | 20 (1.3%) |
| $15,000 to $17,499 | 34 (2.3%) | 47 (3.1%) |
| $17,500 to $19,999 | 9 (0.6%) | 33 (2.1%) |
| $20,000 to $22,499 | 23 (1.6%) | 8 (0.5%) |
| $22,500 to $24,999 | 6 (0.4%) | 11 (0.7%) |
| $25,000 to $29,999 | 15 (1.0%) | 30 (1.9%) |
| $30,000 to $34,999 | 190 (12.9%) | 95 (6.2%) |
| $35,000 to $39,999 | 107 (7.2%) | 78 (5.1%) |
| $40,000 to $44,999 | 92 (6.2%) | 36 (2.4%) |
| $45,000 to $49,999 | 46 (3.1%) | 26 (1.7%) |
| $50,000 to $54,999 | 23 (1.6%) | 16 (1.0%) |
| $55,000 to $64,999 | 35 (2.4%) | 110 (7.2%) |
| $65,000 to $74,999 | 88 (5.9%) | 84 (5.5%) |
| $75,000 to $99,999 | 157 (10.6%) | 73 (4.8%) |
| $100,000+ | 467 (31.6%) | 280 (18.2%) |
| Total | 1,478 (100.0%) | 1,535 (100.0%) |
Earnings by Sex by Educational Attainment in Lauderdale by the Sea
Average earnings in Lauderdale by the Sea are $58,875 for men and $42,888 for women, a difference of 27.2%. Men with an educational attainment of graduate degree enjoy the highest average annual earnings of $108,333, while those with high school diploma education earn the least with $43,443. Women with an educational attainment of graduate degree earn the most with the average annual earnings of $99,659, while those with college or associate's degree education have the smallest earnings of $30,000.
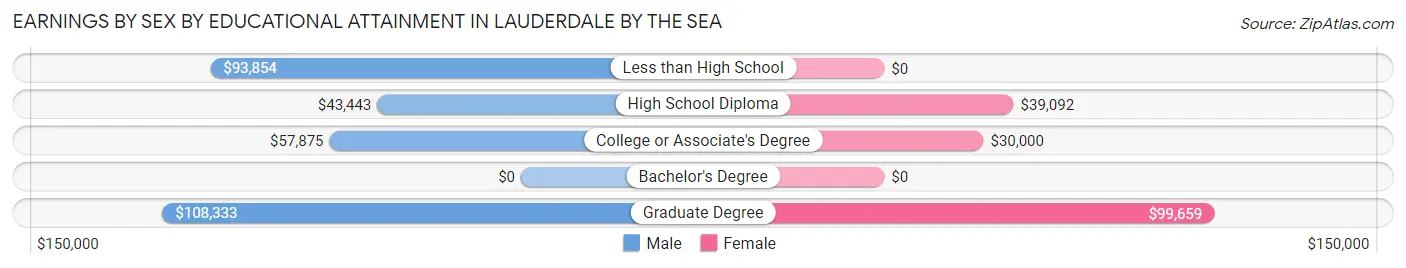
| Educational Attainment | Male Income | Female Income |
| Less than High School | $93,854 | $0 |
| High School Diploma | $43,443 | $39,092 |
| College or Associate's Degree | $57,875 | $30,000 |
| Bachelor's Degree | - | - |
| Graduate Degree | $108,333 | $99,659 |
| Total | $58,875 | $42,888 |
Family Income in Lauderdale by the Sea
Family Income Brackets in Lauderdale by the Sea
According to the Lauderdale by the Sea family income data, there are 376 families falling into the $200,000+ income range, which is the most common income bracket and makes up 22.5% of all families.
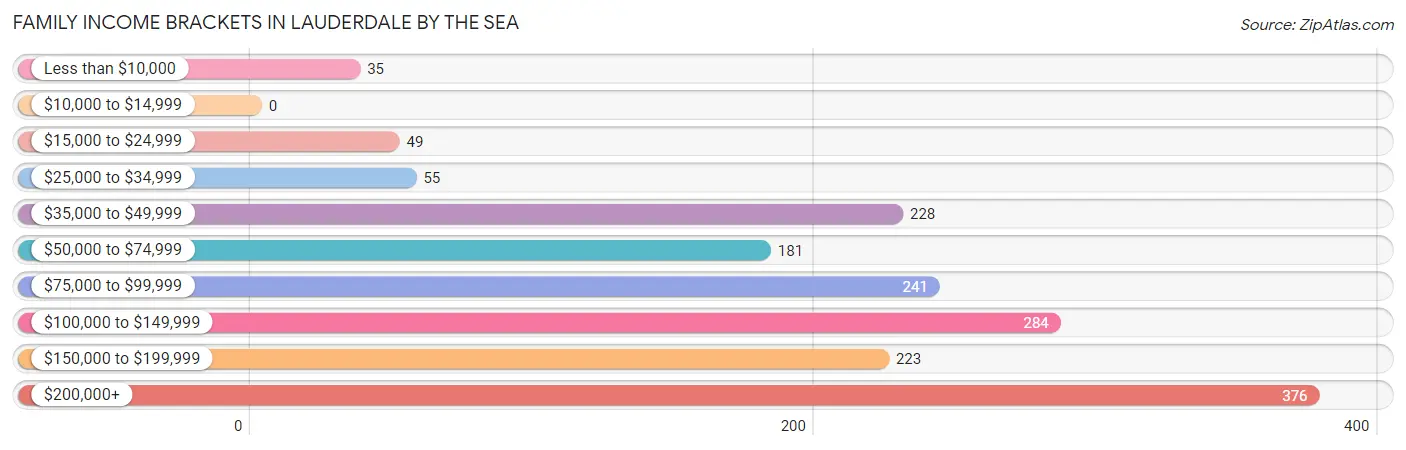
| Income Bracket | # Families | % Families |
| Less than $10,000 | 35 | 2.1% |
| $10,000 to $14,999 | 0 | 0.0% |
| $15,000 to $24,999 | 49 | 2.9% |
| $25,000 to $34,999 | 55 | 3.3% |
| $35,000 to $49,999 | 228 | 13.6% |
| $50,000 to $74,999 | 181 | 10.8% |
| $75,000 to $99,999 | 241 | 14.4% |
| $100,000 to $149,999 | 284 | 17.0% |
| $150,000 to $199,999 | 223 | 13.3% |
| $200,000+ | 376 | 22.5% |
Family Income by Famaliy Size in Lauderdale by the Sea
2-person families (1,210 | 72.3%) account for the highest median family income in Lauderdale by the Sea with $104,056 per family, while 2-person families (1,210 | 72.3%) have the highest median income of $52,028 per family member.
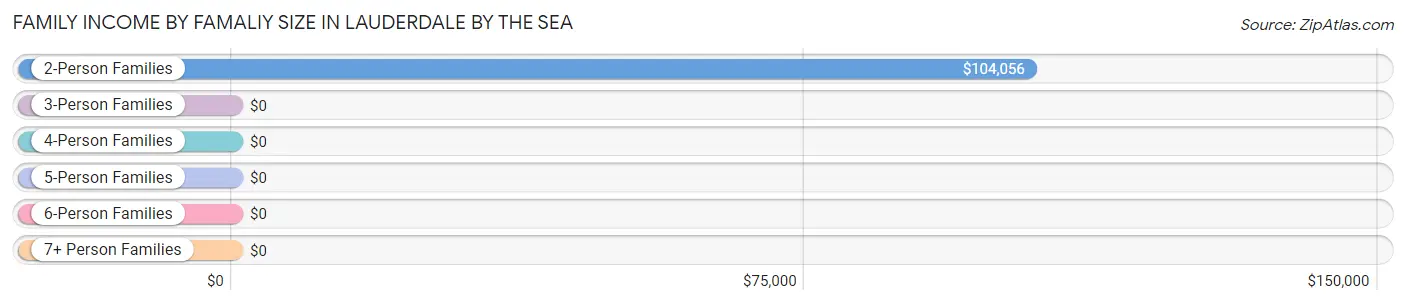
| Income Bracket | # Families | Median Income |
| 2-Person Families | 1,210 (72.3%) | $104,056 |
| 3-Person Families | 257 (15.4%) | $0 |
| 4-Person Families | 190 (11.4%) | $0 |
| 5-Person Families | 9 (0.5%) | $0 |
| 6-Person Families | 7 (0.4%) | $0 |
| 7+ Person Families | 0 (0.0%) | $0 |
| Total | 1,673 (100.0%) | $104,193 |
Family Income by Number of Earners in Lauderdale by the Sea
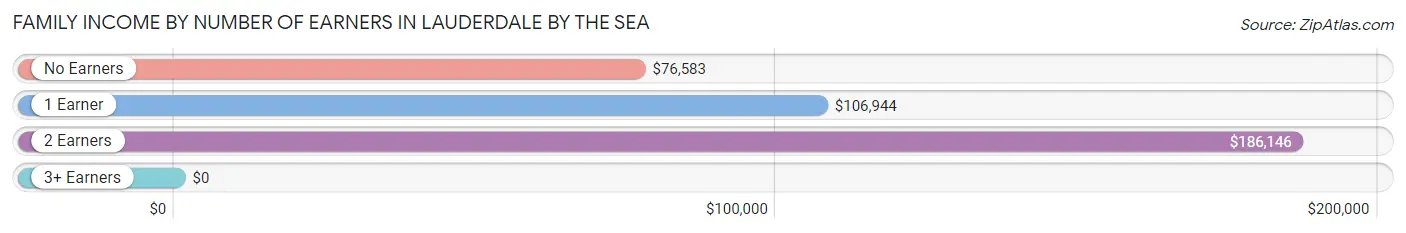
| Number of Earners | # Families | Median Income |
| No Earners | 661 (39.5%) | $76,583 |
| 1 Earner | 374 (22.4%) | $106,944 |
| 2 Earners | 389 (23.3%) | $186,146 |
| 3+ Earners | 249 (14.9%) | $0 |
| Total | 1,673 (100.0%) | $104,193 |
Household Income in Lauderdale by the Sea
Household Income Brackets in Lauderdale by the Sea
With 535 households falling in the category, the $100,000 to $149,999 income range is the most frequent in Lauderdale by the Sea, accounting for 16.5% of all households. In contrast, only 107 households (3.3%) fall into the $10,000 to $14,999 income bracket, making it the least populous group.
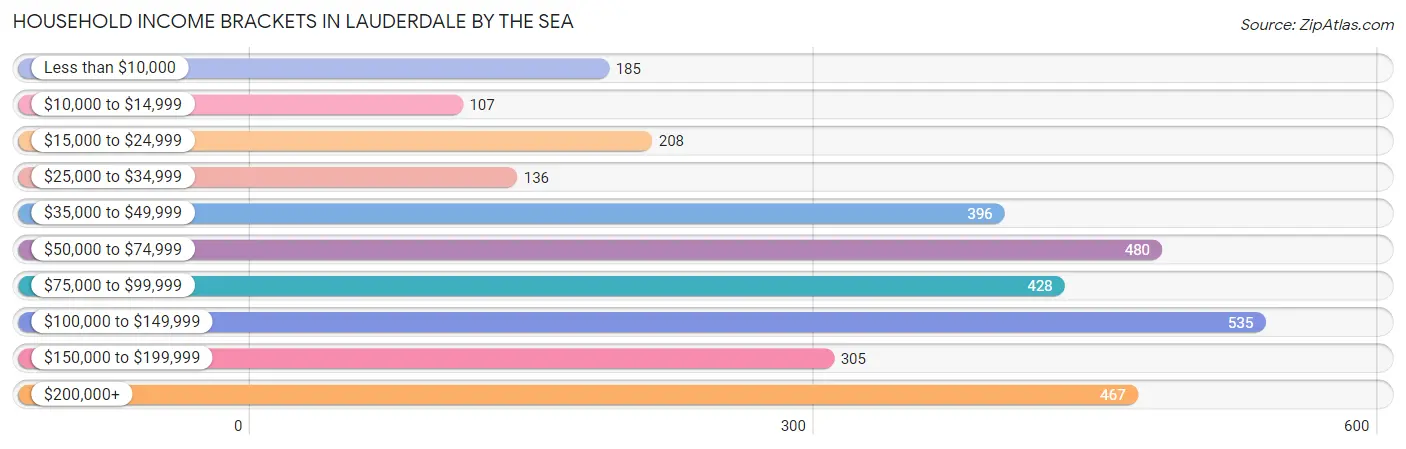
| Income Bracket | # Households | % Households |
| Less than $10,000 | 185 | 5.7% |
| $10,000 to $14,999 | 107 | 3.3% |
| $15,000 to $24,999 | 208 | 6.4% |
| $25,000 to $34,999 | 136 | 4.2% |
| $35,000 to $49,999 | 396 | 12.2% |
| $50,000 to $74,999 | 480 | 14.8% |
| $75,000 to $99,999 | 428 | 13.2% |
| $100,000 to $149,999 | 535 | 16.5% |
| $150,000 to $199,999 | 305 | 9.4% |
| $200,000+ | 467 | 14.4% |
Household Income by Householder Age in Lauderdale by the Sea
The median household income in Lauderdale by the Sea is $76,855, with the highest median household income of $92,961 found in the 45 to 64 years age bracket for the primary householder. A total of 1,336 households (41.2%) fall into this category.
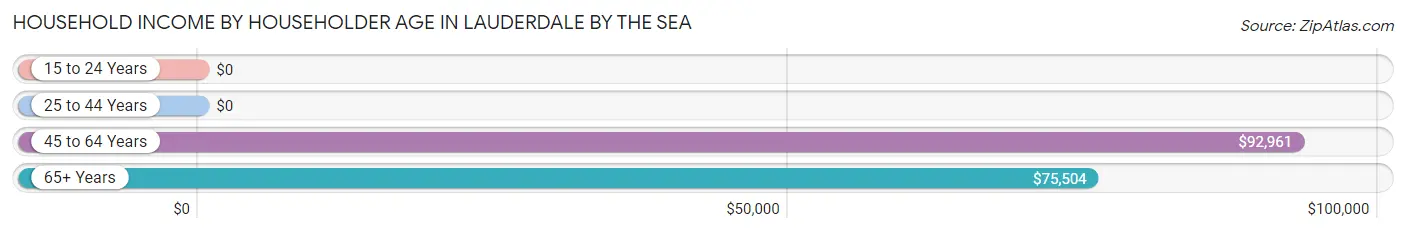
| Income Bracket | # Households | Median Income |
| 15 to 24 Years | 0 (0.0%) | $0 |
| 25 to 44 Years | 239 (7.4%) | $0 |
| 45 to 64 Years | 1,336 (41.2%) | $92,961 |
| 65+ Years | 1,668 (51.4%) | $75,504 |
| Total | 3,243 (100.0%) | $76,855 |
Poverty in Lauderdale by the Sea
Income Below Poverty by Sex and Age in Lauderdale by the Sea
With 5.1% poverty level for males and 9.2% for females among the residents of Lauderdale by the Sea, 35 to 44 year old males and 25 to 34 year old females are the most vulnerable to poverty, with 49 males (35.0%) and 91 females (56.5%) in their respective age groups living below the poverty level.
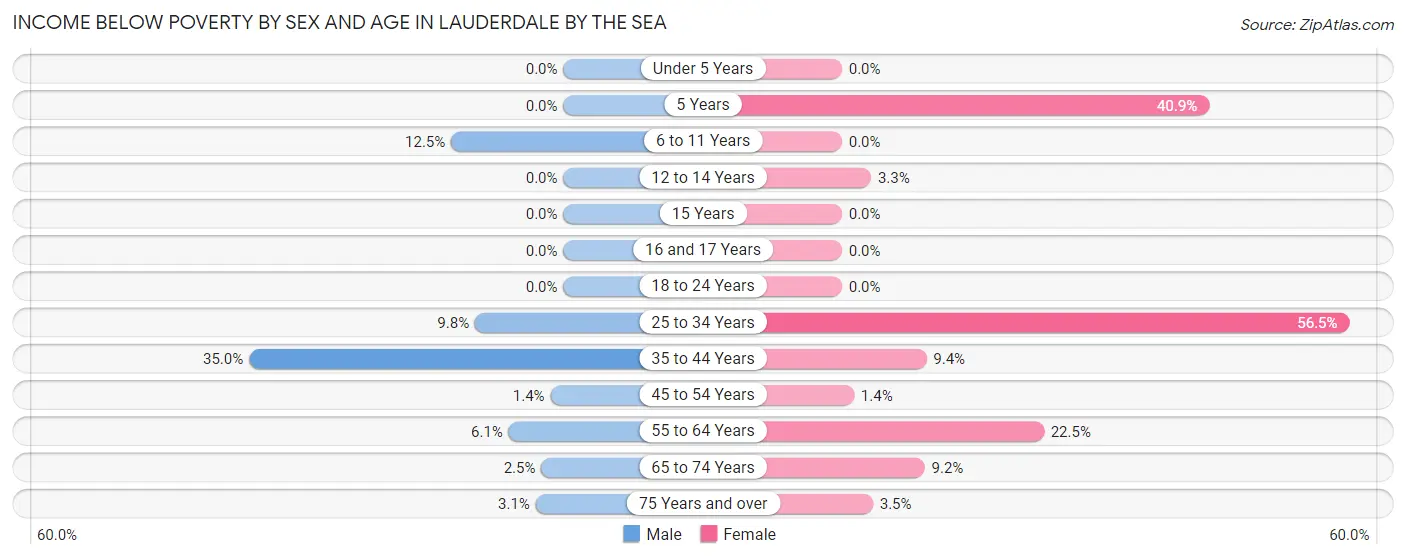
| Age Bracket | Male | Female |
| Under 5 Years | 0 (0.0%) | 0 (0.0%) |
| 5 Years | 0 (0.0%) | 9 (40.9%) |
| 6 to 11 Years | 5 (12.5%) | 0 (0.0%) |
| 12 to 14 Years | 0 (0.0%) | 5 (3.3%) |
| 15 Years | 0 (0.0%) | 0 (0.0%) |
| 16 and 17 Years | 0 (0.0%) | 0 (0.0%) |
| 18 to 24 Years | 0 (0.0%) | 0 (0.0%) |
| 25 to 34 Years | 6 (9.8%) | 91 (56.5%) |
| 35 to 44 Years | 49 (35.0%) | 13 (9.4%) |
| 45 to 54 Years | 8 (1.4%) | 9 (1.3%) |
| 55 to 64 Years | 33 (6.1%) | 123 (22.5%) |
| 65 to 74 Years | 12 (2.5%) | 45 (9.2%) |
| 75 Years and over | 20 (3.1%) | 32 (3.5%) |
| Total | 133 (5.1%) | 327 (9.2%) |
Income Above Poverty by Sex and Age in Lauderdale by the Sea
According to the poverty statistics in Lauderdale by the Sea, males aged under 5 years and females aged under 5 years are the age groups that are most secure financially, with 100.0% of males and 100.0% of females in these age groups living above the poverty line.
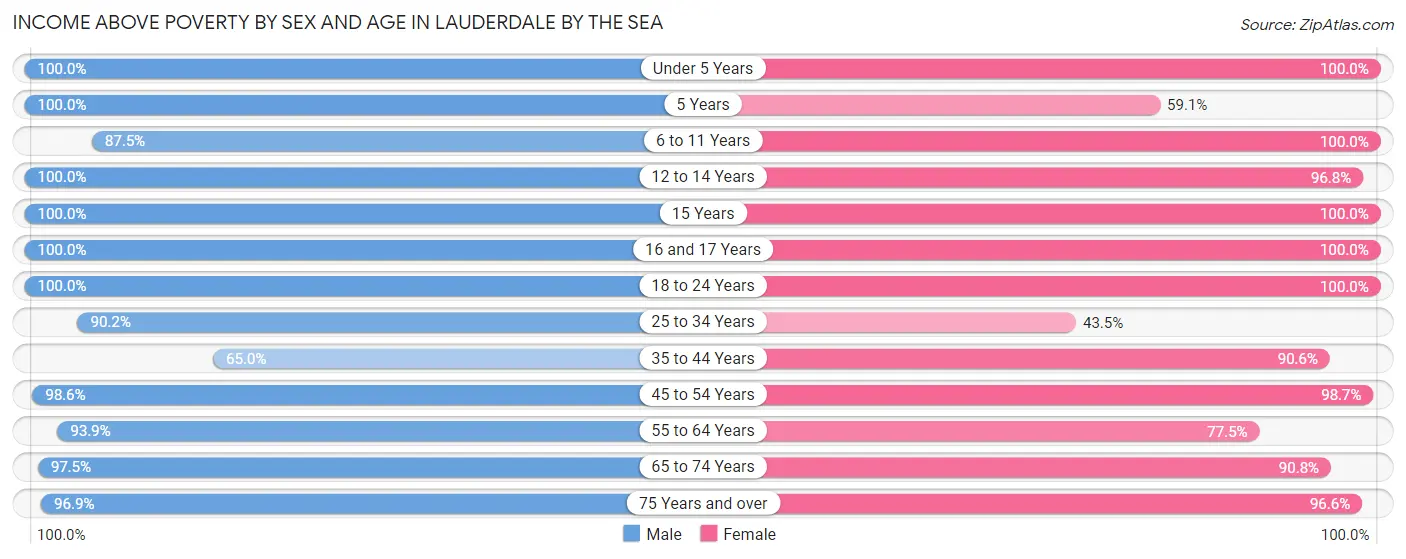
| Age Bracket | Male | Female |
| Under 5 Years | 16 (100.0%) | 42 (100.0%) |
| 5 Years | 51 (100.0%) | 13 (59.1%) |
| 6 to 11 Years | 35 (87.5%) | 79 (100.0%) |
| 12 to 14 Years | 15 (100.0%) | 149 (96.8%) |
| 15 Years | 20 (100.0%) | 8 (100.0%) |
| 16 and 17 Years | 11 (100.0%) | 97 (100.0%) |
| 18 to 24 Years | 45 (100.0%) | 228 (100.0%) |
| 25 to 34 Years | 55 (90.2%) | 70 (43.5%) |
| 35 to 44 Years | 91 (65.0%) | 125 (90.6%) |
| 45 to 54 Years | 549 (98.6%) | 660 (98.7%) |
| 55 to 64 Years | 509 (93.9%) | 424 (77.5%) |
| 65 to 74 Years | 476 (97.5%) | 443 (90.8%) |
| 75 Years and over | 629 (96.9%) | 895 (96.6%) |
| Total | 2,502 (95.0%) | 3,233 (90.8%) |
Income Below Poverty Among Married-Couple Families in Lauderdale by the Sea
The poverty statistics for married-couple families in Lauderdale by the Sea show that 2.0% or 30 of the total 1,484 families live below the poverty line. Families with 1 or 2 children have the highest poverty rate of 4.1%, comprising of 8 families. On the other hand, families with 3 or 4 children have the lowest poverty rate of 0.0%, which includes 0 families.
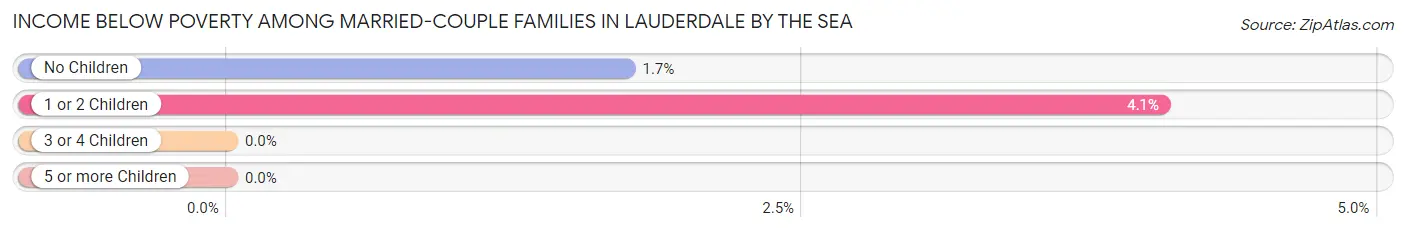
| Children | Above Poverty | Below Poverty |
| No Children | 1,249 (98.3%) | 22 (1.7%) |
| 1 or 2 Children | 189 (95.9%) | 8 (4.1%) |
| 3 or 4 Children | 16 (100.0%) | 0 (0.0%) |
| 5 or more Children | 0 (0.0%) | 0 (0.0%) |
| Total | 1,454 (98.0%) | 30 (2.0%) |
Income Below Poverty Among Single-Parent Households in Lauderdale by the Sea
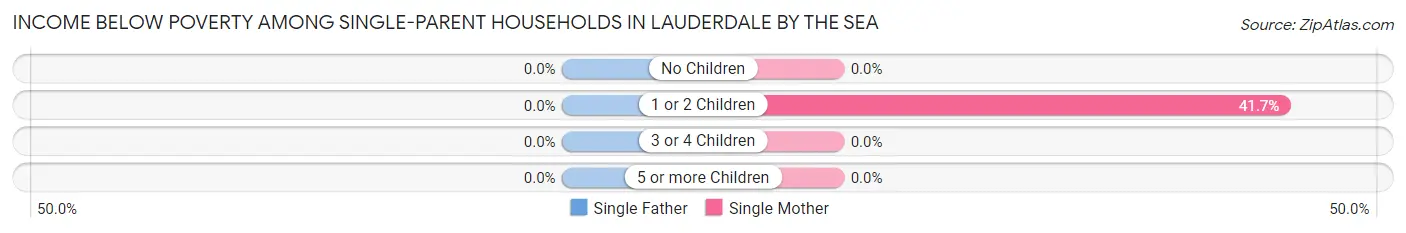
| Children | Single Father | Single Mother |
| No Children | 0 (0.0%) | 0 (0.0%) |
| 1 or 2 Children | 0 (0.0%) | 5 (41.7%) |
| 3 or 4 Children | 0 (0.0%) | 0 (0.0%) |
| 5 or more Children | 0 (0.0%) | 0 (0.0%) |
| Total | 0 (0.0%) | 5 (3.5%) |
Income Below Poverty Among Married-Couple vs Single-Parent Households in Lauderdale by the Sea
The poverty data for Lauderdale by the Sea shows that 30 of the married-couple family households (2.0%) and 5 of the single-parent households (2.6%) are living below the poverty level. Within the married-couple family households, those with 1 or 2 children have the highest poverty rate, with 8 households (4.1%) falling below the poverty line. Among the single-parent households, those with 1 or 2 children have the highest poverty rate, with 5 household (10.9%) living below poverty.
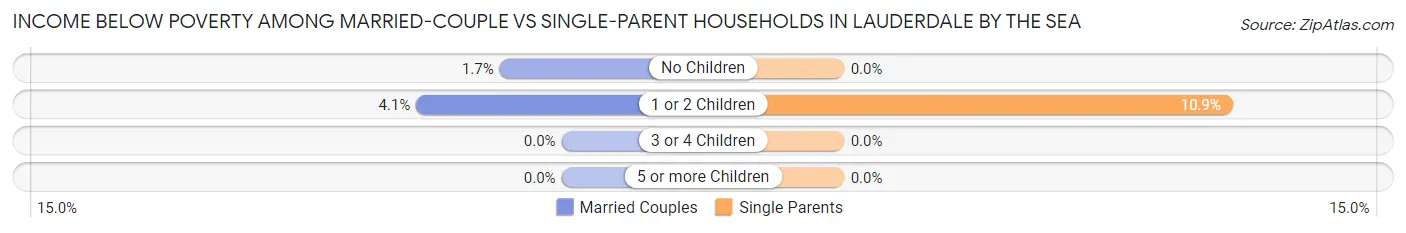
| Children | Married-Couple Families | Single-Parent Households |
| No Children | 22 (1.7%) | 0 (0.0%) |
| 1 or 2 Children | 8 (4.1%) | 5 (10.9%) |
| 3 or 4 Children | 0 (0.0%) | 0 (0.0%) |
| 5 or more Children | 0 (0.0%) | 0 (0.0%) |
| Total | 30 (2.0%) | 5 (2.6%) |
Race in Lauderdale by the Sea
The most populous races in Lauderdale by the Sea are White / Caucasian (4,950 | 79.8%), Two or more Races (1,127 | 18.2%), and Hispanic or Latino (985 | 15.9%).
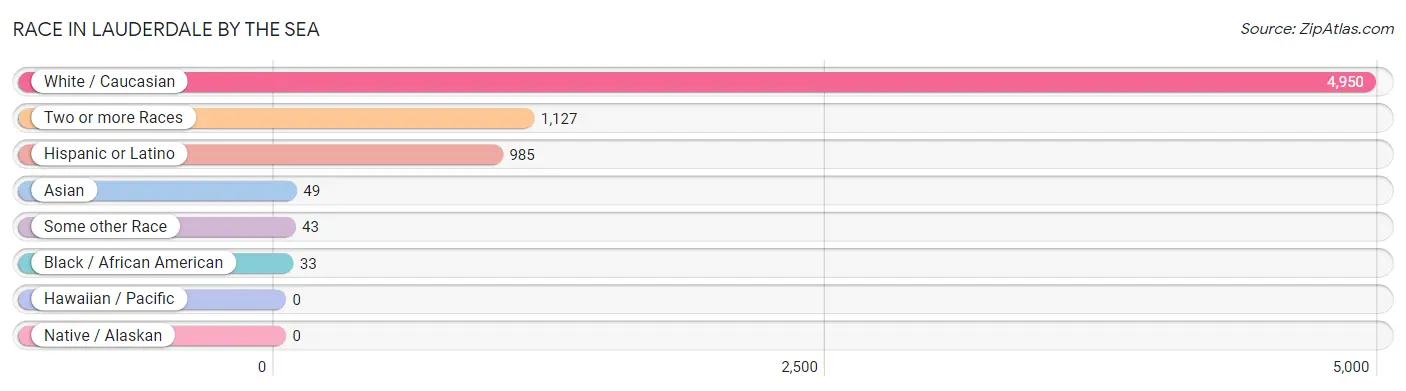
| Race | # Population | % Population |
| Asian | 49 | 0.8% |
| Black / African American | 33 | 0.5% |
| Hawaiian / Pacific | 0 | 0.0% |
| Hispanic or Latino | 985 | 15.9% |
| Native / Alaskan | 0 | 0.0% |
| White / Caucasian | 4,950 | 79.8% |
| Two or more Races | 1,127 | 18.2% |
| Some other Race | 43 | 0.7% |
| Total | 6,202 | 100.0% |
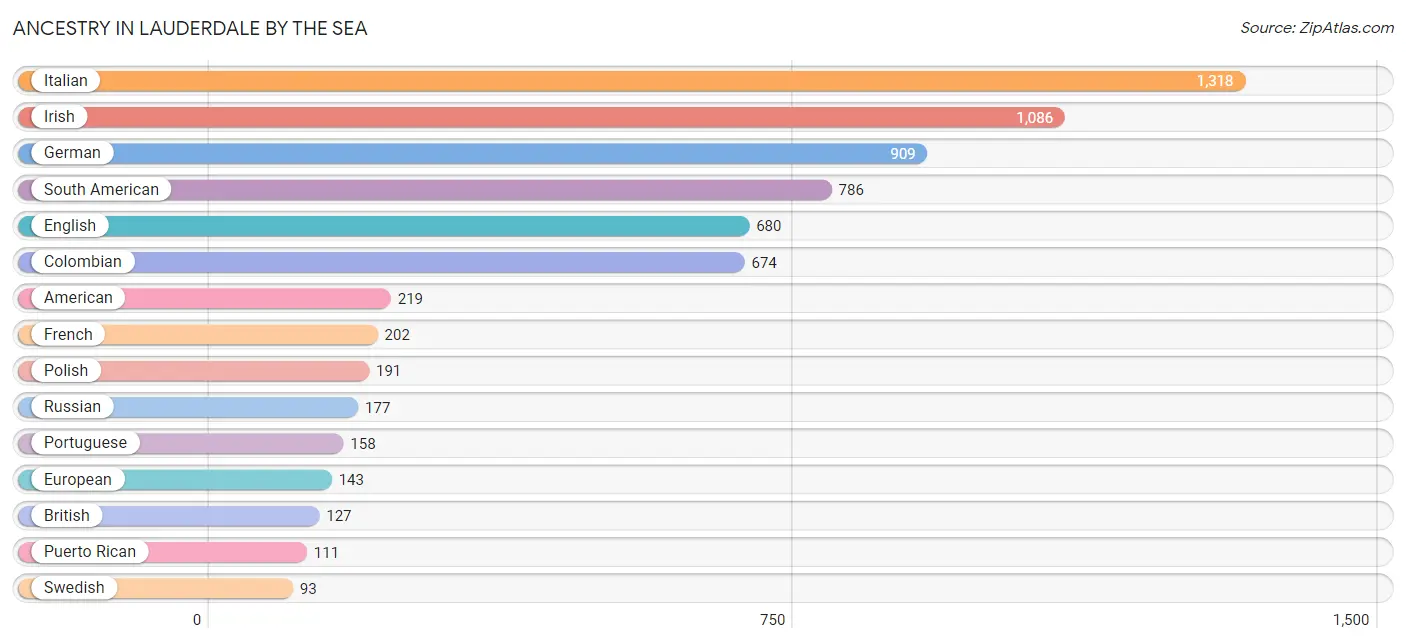
Ancestry in Lauderdale by the Sea
The most populous ancestries reported in Lauderdale by the Sea are Italian (1,318 | 21.2%), Irish (1,086 | 17.5%), German (909 | 14.7%), South American (786 | 12.7%), and English (680 | 11.0%), together accounting for 77.1% of all Lauderdale by the Sea residents.
| Ancestry | # Population | % Population |
| American | 219 | 3.5% |
| Arab | 46 | 0.7% |
| Armenian | 8 | 0.1% |
| Austrian | 63 | 1.0% |
| Brazilian | 48 | 0.8% |
| British | 127 | 2.1% |
| Canadian | 17 | 0.3% |
| Cherokee | 15 | 0.2% |
| Colombian | 674 | 10.9% |
| Cuban | 34 | 0.5% |
| Czech | 78 | 1.3% |
| Danish | 29 | 0.5% |
| Dutch | 43 | 0.7% |
| Eastern European | 7 | 0.1% |
| English | 680 | 11.0% |
| European | 143 | 2.3% |
| Finnish | 25 | 0.4% |
| French | 202 | 3.3% |
| French Canadian | 72 | 1.2% |
| German | 909 | 14.7% |
| Greek | 59 | 0.9% |
| Hungarian | 30 | 0.5% |
| Indian (Asian) | 14 | 0.2% |
| Iranian | 11 | 0.2% |
| Irish | 1,086 | 17.5% |
| Israeli | 6 | 0.1% |
| Italian | 1,318 | 21.2% |
| Lebanese | 32 | 0.5% |
| Lithuanian | 61 | 1.0% |
| Mexican | 37 | 0.6% |
| Moroccan | 7 | 0.1% |
| Norwegian | 48 | 0.8% |
| Palestinian | 7 | 0.1% |
| Peruvian | 73 | 1.2% |
| Polish | 191 | 3.1% |
| Portuguese | 158 | 2.5% |
| Puerto Rican | 111 | 1.8% |
| Romanian | 28 | 0.4% |
| Russian | 177 | 2.9% |
| Scandinavian | 3 | 0.1% |
| Scotch-Irish | 29 | 0.5% |
| Scottish | 51 | 0.8% |
| Slovak | 9 | 0.2% |
| South American | 786 | 12.7% |
| Spaniard | 17 | 0.3% |
| Swedish | 93 | 1.5% |
| Thai | 35 | 0.6% |
| Turkish | 33 | 0.5% |
| Ukrainian | 9 | 0.2% |
| Uruguayan | 13 | 0.2% |
| Venezuelan | 26 | 0.4% |
| Welsh | 29 | 0.5% | View All 52 Rows |
Immigrants in Lauderdale by the Sea
The most numerous immigrant groups reported in Lauderdale by the Sea came from Latin America (1,018 | 16.4%), South America (985 | 15.9%), Colombia (641 | 10.3%), Europe (504 | 8.1%), and Brazil (227 | 3.7%), together accounting for 54.4% of all Lauderdale by the Sea residents.
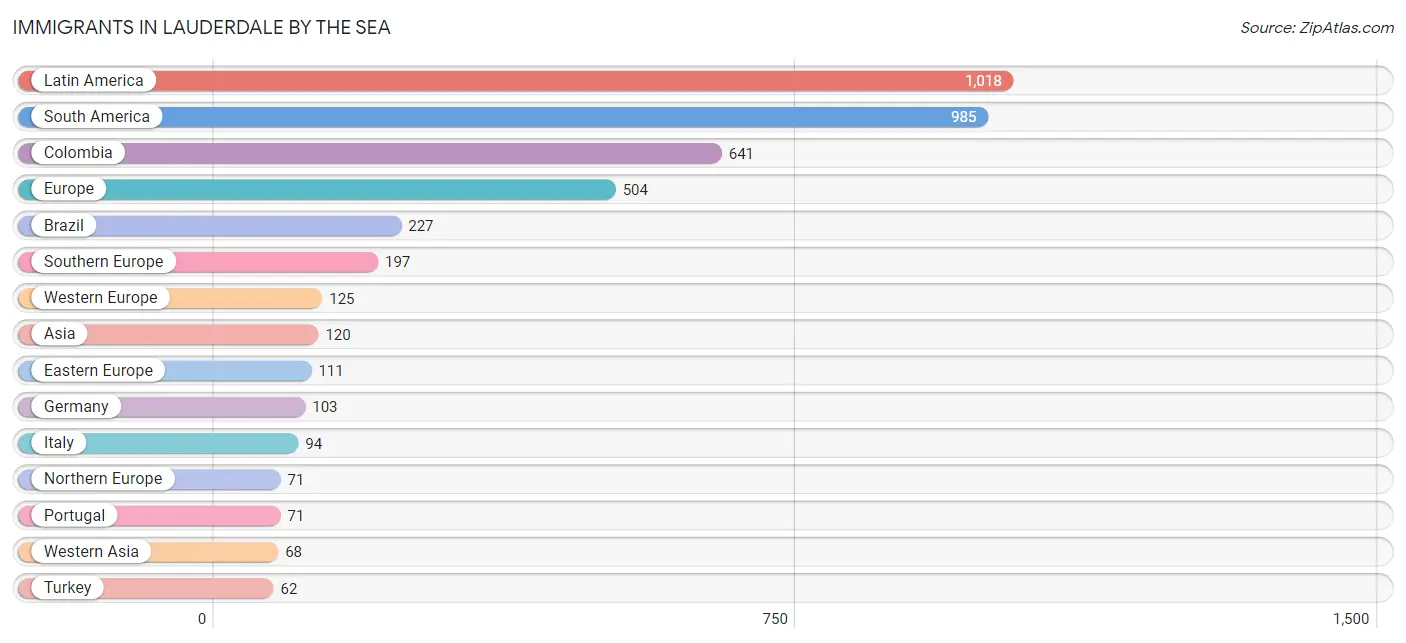
| Immigration Origin | # Population | % Population |
| Africa | 15 | 0.2% |
| Asia | 120 | 1.9% |
| Austria | 9 | 0.2% |
| Brazil | 227 | 3.7% |
| Canada | 54 | 0.9% |
| Caribbean | 33 | 0.5% |
| China | 6 | 0.1% |
| Colombia | 641 | 10.3% |
| Cuba | 33 | 0.5% |
| Czechoslovakia | 23 | 0.4% |
| Eastern Asia | 6 | 0.1% |
| Eastern Europe | 111 | 1.8% |
| Europe | 504 | 8.1% |
| France | 13 | 0.2% |
| Germany | 103 | 1.7% |
| Greece | 15 | 0.2% |
| India | 35 | 0.6% |
| Iran | 11 | 0.2% |
| Israel | 6 | 0.1% |
| Italy | 94 | 1.5% |
| Latin America | 1,018 | 16.4% |
| Lithuania | 11 | 0.2% |
| Morocco | 15 | 0.2% |
| Northern Africa | 15 | 0.2% |
| Northern Europe | 71 | 1.1% |
| Peru | 60 | 1.0% |
| Poland | 23 | 0.4% |
| Portugal | 71 | 1.1% |
| Russia | 9 | 0.2% |
| Scotland | 5 | 0.1% |
| South America | 985 | 15.9% |
| South Central Asia | 46 | 0.7% |
| Southern Europe | 197 | 3.2% |
| Spain | 17 | 0.3% |
| Sweden | 24 | 0.4% |
| Turkey | 62 | 1.0% |
| Ukraine | 45 | 0.7% |
| Uruguay | 19 | 0.3% |
| Venezuela | 38 | 0.6% |
| Western Asia | 68 | 1.1% |
| Western Europe | 125 | 2.0% | View All 41 Rows |
Sex and Age in Lauderdale by the Sea
Sex and Age in Lauderdale by the Sea
The most populous age groups in Lauderdale by the Sea are 55 to 59 Years (340 | 12.9%) for men and 50 to 54 Years (474 | 13.3%) for women.
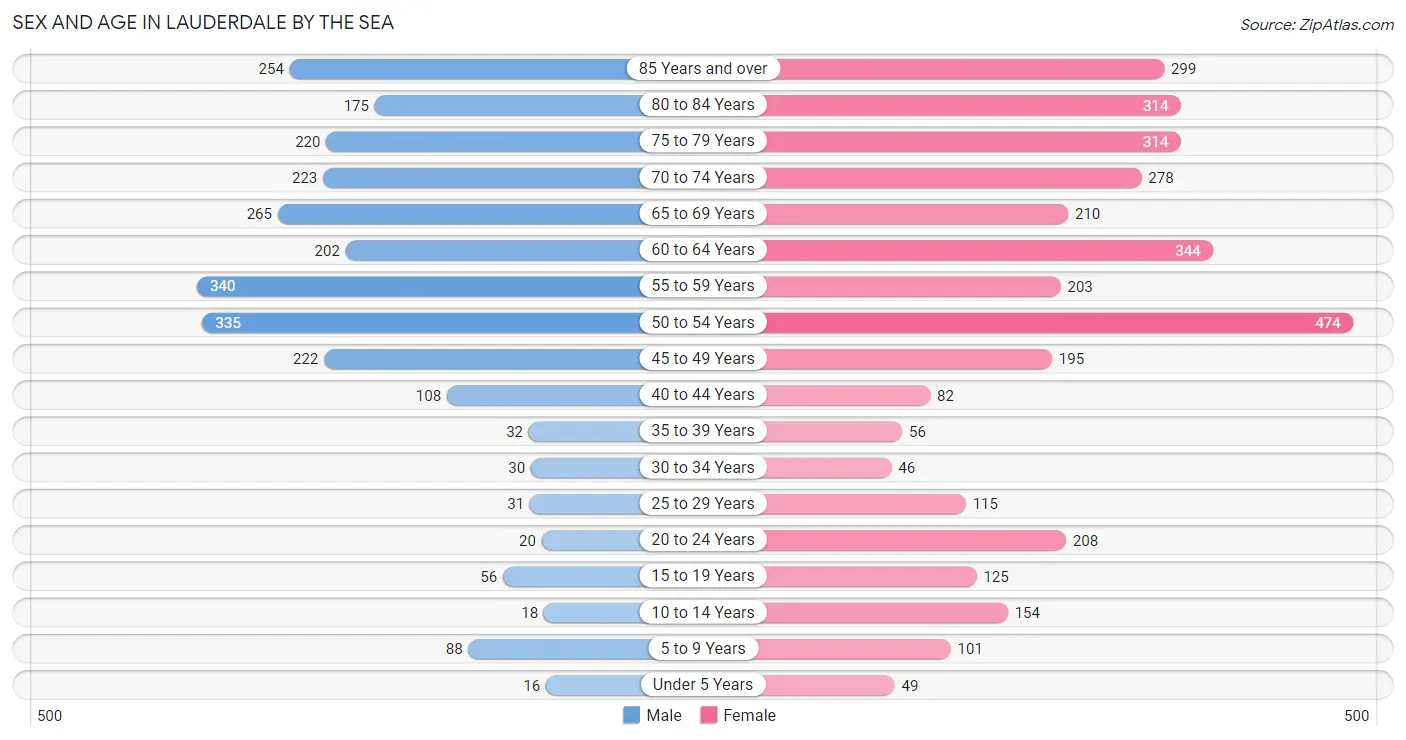
| Age Bracket | Male | Female |
| Under 5 Years | 16 (0.6%) | 49 (1.4%) |
| 5 to 9 Years | 88 (3.3%) | 101 (2.8%) |
| 10 to 14 Years | 18 (0.7%) | 154 (4.3%) |
| 15 to 19 Years | 56 (2.1%) | 125 (3.5%) |
| 20 to 24 Years | 20 (0.8%) | 208 (5.8%) |
| 25 to 29 Years | 31 (1.2%) | 115 (3.2%) |
| 30 to 34 Years | 30 (1.1%) | 46 (1.3%) |
| 35 to 39 Years | 32 (1.2%) | 56 (1.6%) |
| 40 to 44 Years | 108 (4.1%) | 82 (2.3%) |
| 45 to 49 Years | 222 (8.4%) | 195 (5.5%) |
| 50 to 54 Years | 335 (12.7%) | 474 (13.3%) |
| 55 to 59 Years | 340 (12.9%) | 203 (5.7%) |
| 60 to 64 Years | 202 (7.7%) | 344 (9.6%) |
| 65 to 69 Years | 265 (10.1%) | 210 (5.9%) |
| 70 to 74 Years | 223 (8.5%) | 278 (7.8%) |
| 75 to 79 Years | 220 (8.4%) | 314 (8.8%) |
| 80 to 84 Years | 175 (6.6%) | 314 (8.8%) |
| 85 Years and over | 254 (9.6%) | 299 (8.4%) |
| Total | 2,635 (100.0%) | 3,567 (100.0%) |
Families and Households in Lauderdale by the Sea
Median Family Size in Lauderdale by the Sea
The median family size in Lauderdale by the Sea is 2.56 persons per family, with single male/father families (47 | 2.8%) accounting for the largest median family size of 3.02 persons per family. On the other hand, single female/mother families (142 | 8.5%) represent the smallest median family size with 2.35 persons per family.
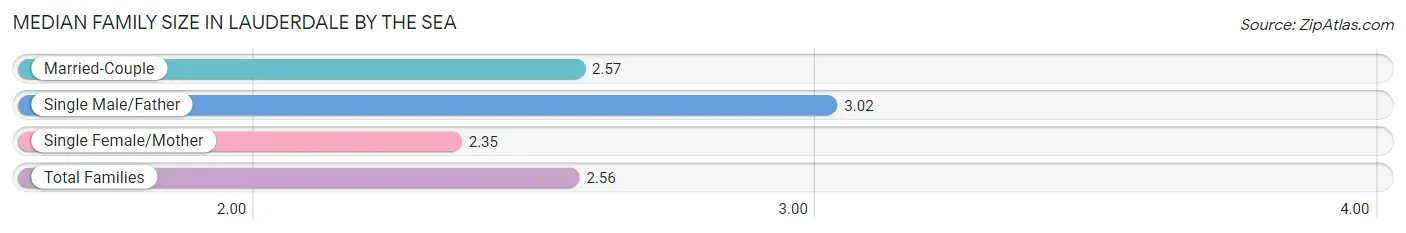
| Family Type | # Families | Family Size |
| Married-Couple | 1,484 (88.7%) | 2.57 |
| Single Male/Father | 47 (2.8%) | 3.02 |
| Single Female/Mother | 142 (8.5%) | 2.35 |
| Total Families | 1,673 (100.0%) | 2.56 |
Median Household Size in Lauderdale by the Sea
The median household size in Lauderdale by the Sea is 1.91 persons per household, with single male/father households (47 | 1.5%) accounting for the largest median household size of 3.11 persons per household. non-family households (1,570 | 48.4%) represent the smallest median household size with 1.19 persons per household.
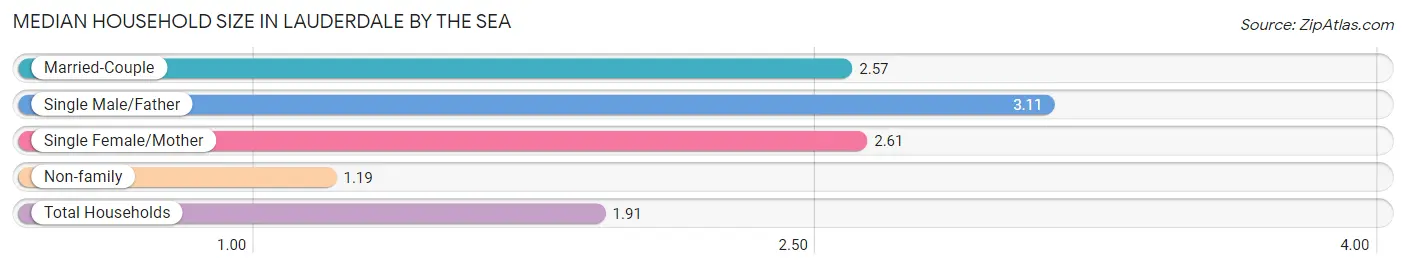
| Household Type | # Households | Household Size |
| Married-Couple | 1,484 (45.8%) | 2.57 |
| Single Male/Father | 47 (1.5%) | 3.11 |
| Single Female/Mother | 142 (4.4%) | 2.61 |
| Non-family | 1,570 (48.4%) | 1.19 |
| Total Households | 3,243 (100.0%) | 1.91 |
Household Size by Marriage Status in Lauderdale by the Sea
Out of a total of 3,243 households in Lauderdale by the Sea, 1,673 (51.6%) are family households, while 1,570 (48.4%) are nonfamily households. The most numerous type of family households are 2-person households, comprising 1,177, and the most common type of nonfamily households are 1-person households, comprising 1,259.
| Household Size | Family Households | Nonfamily Households |
| 1-Person Households | - | 1,259 (38.8%) |
| 2-Person Households | 1,177 (36.3%) | 311 (9.6%) |
| 3-Person Households | 290 (8.9%) | 0 (0.0%) |
| 4-Person Households | 187 (5.8%) | 0 (0.0%) |
| 5-Person Households | 12 (0.4%) | 0 (0.0%) |
| 6-Person Households | 7 (0.2%) | 0 (0.0%) |
| 7+ Person Households | 0 (0.0%) | 0 (0.0%) |
| Total | 1,673 (51.6%) | 1,570 (48.4%) |
Female Fertility in Lauderdale by the Sea
Fertility by Age in Lauderdale by the Sea
Average fertility rate in Lauderdale by the Sea is 18.0 births per 1,000 women. Women in the age bracket of 20 to 34 years have the highest fertility rate with 24.0 births per 1,000 women. Women in the age bracket of 35 to 50 years acount for 52.6% of all women with births.
| Age Bracket | Women with Births | Births / 1,000 Women |
| 15 to 19 years | 0 (0.0%) | 0.0 |
| 20 to 34 years | 9 (47.4%) | 24.0 |
| 35 to 50 years | 10 (52.6%) | 18.0 |
| Total | 19 (100.0%) | 18.0 |
Fertility by Age by Marriage Status in Lauderdale by the Sea
| Age Bracket | Married | Unmarried |
| 15 to 19 years | 0 (0.0%) | 0 (0.0%) |
| 20 to 34 years | 9 (100.0%) | 0 (0.0%) |
| 35 to 50 years | 10 (100.0%) | 0 (0.0%) |
| Total | 19 (100.0%) | 0 (0.0%) |
Fertility by Education in Lauderdale by the Sea
| Educational Attainment | Women with Births | Births / 1,000 Women |
| Less than High School | 0 (0.0%) | 0.0 |
| High School Diploma | 0 (0.0%) | 0.0 |
| College or Associate's Degree | 0 (0.0%) | 0.0 |
| Bachelor's Degree | 19 (100.0%) | 33.0 |
| Graduate Degree | 0 (0.0%) | 0.0 |
| Total | 19 (100.0%) | 18.0 |
Fertility by Education by Marriage Status in Lauderdale by the Sea
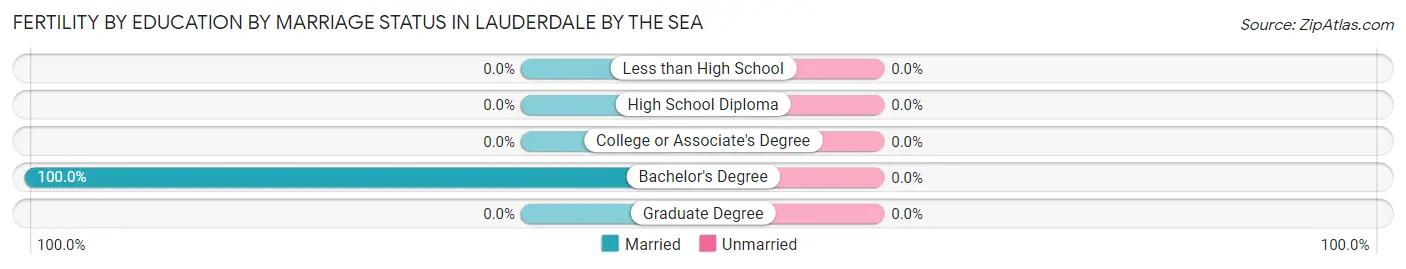
| Educational Attainment | Married | Unmarried |
| Less than High School | 0 (0.0%) | 0 (0.0%) |
| High School Diploma | 0 (0.0%) | 0 (0.0%) |
| College or Associate's Degree | 0 (0.0%) | 0 (0.0%) |
| Bachelor's Degree | 19 (100.0%) | 0 (0.0%) |
| Graduate Degree | 0 (0.0%) | 0 (0.0%) |
| Total | 19 (100.0%) | 0 (0.0%) |
Employment Characteristics in Lauderdale by the Sea
Employment by Class of Employer in Lauderdale by the Sea
Among the 2,415 employed individuals in Lauderdale by the Sea, private company employees (1,417 | 58.7%), self-employed (incorporated) (498 | 20.6%), and not-for-profit organizations (216 | 8.9%) make up the most common classes of employment.
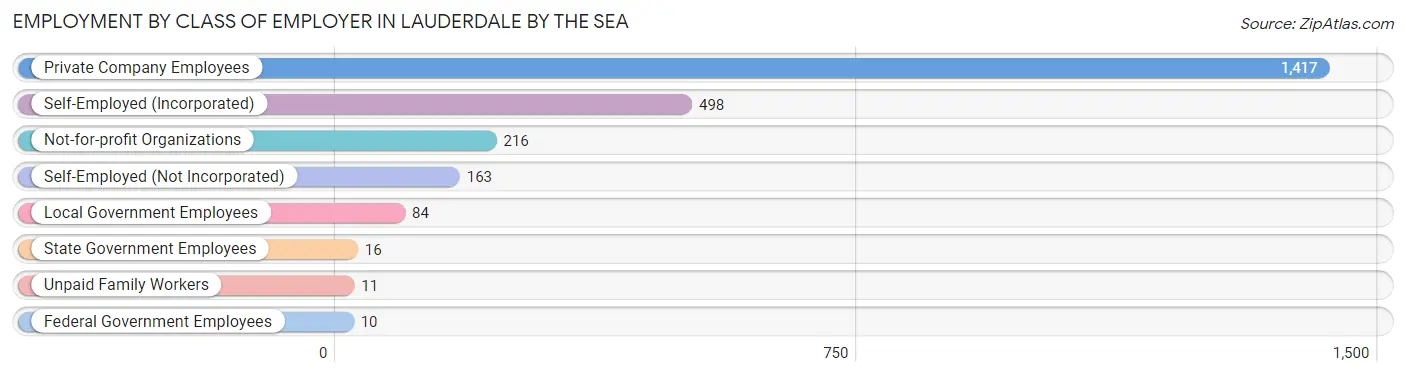
| Employer Class | # Employees | % Employees |
| Private Company Employees | 1,417 | 58.7% |
| Self-Employed (Incorporated) | 498 | 20.6% |
| Self-Employed (Not Incorporated) | 163 | 6.8% |
| Not-for-profit Organizations | 216 | 8.9% |
| Local Government Employees | 84 | 3.5% |
| State Government Employees | 16 | 0.7% |
| Federal Government Employees | 10 | 0.4% |
| Unpaid Family Workers | 11 | 0.5% |
| Total | 2,415 | 100.0% |
Employment Status by Age in Lauderdale by the Sea
According to the labor force statistics for Lauderdale by the Sea, out of the total population over 16 years of age (5,748), 46.5% or 2,673 individuals are in the labor force, with 3.0% or 80 of them unemployed. The age group with the highest labor force participation rate is 30 to 34 years, with 100.0% or 76 individuals in the labor force. Within the labor force, the 60 to 64 years age range has the highest percentage of unemployed individuals, with 13.4% or 44 of them being unemployed.
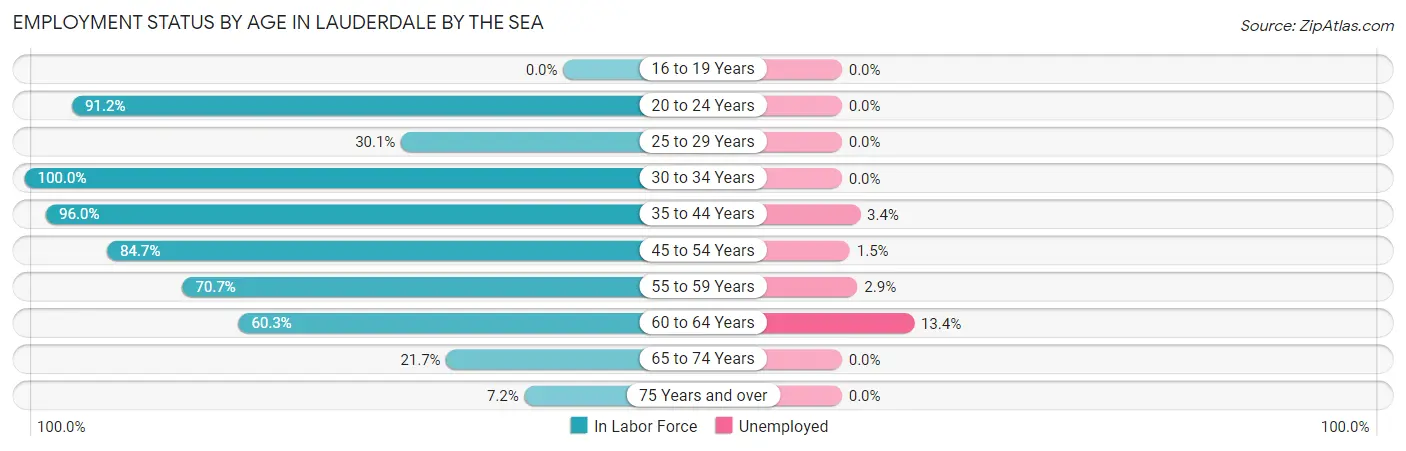
| Age Bracket | In Labor Force | Unemployed |
| 16 to 19 Years | 0 (0.0%) | 0 (0.0%) |
| 20 to 24 Years | 208 (91.2%) | 0 (0.0%) |
| 25 to 29 Years | 44 (30.1%) | 0 (0.0%) |
| 30 to 34 Years | 76 (100.0%) | 0 (0.0%) |
| 35 to 44 Years | 267 (96.0%) | 9 (3.4%) |
| 45 to 54 Years | 1,038 (84.7%) | 16 (1.5%) |
| 55 to 59 Years | 384 (70.7%) | 11 (2.9%) |
| 60 to 64 Years | 329 (60.3%) | 44 (13.4%) |
| 65 to 74 Years | 212 (21.7%) | 0 (0.0%) |
| 75 Years and over | 113 (7.2%) | 0 (0.0%) |
| Total | 2,673 (46.5%) | 80 (3.0%) |
Employment Status by Educational Attainment in Lauderdale by the Sea
According to labor force statistics for Lauderdale by the Sea, 76.0% of individuals (2,139) out of the total population between 25 and 64 years of age (2,815) are in the labor force, with 3.7% or 79 of them being unemployed. The group with the highest labor force participation rate are those with the educational attainment of less than high school, with 87.5% or 42 individuals in the labor force. Within the labor force, individuals with college / associate degree education have the highest percentage of unemployment, with 5.6% or 20 of them being unemployed.
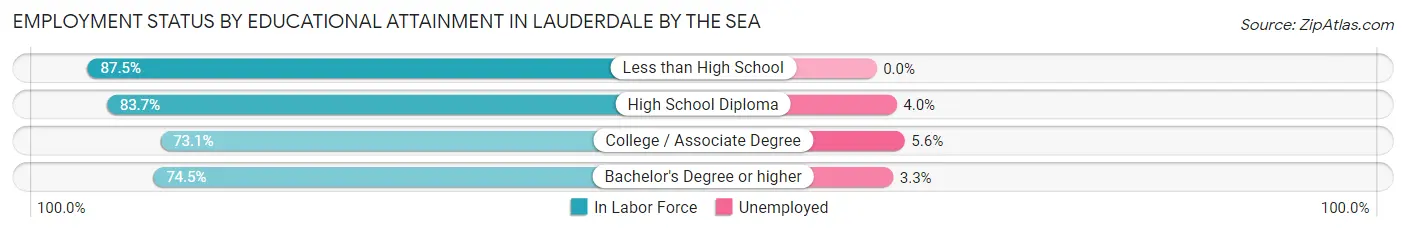
| Educational Attainment | In Labor Force | Unemployed |
| Less than High School | 42 (87.5%) | 0 (0.0%) |
| High School Diploma | 379 (83.7%) | 18 (4.0%) |
| College / Associate Degree | 358 (73.1%) | 27 (5.6%) |
| Bachelor's Degree or higher | 1,359 (74.5%) | 60 (3.3%) |
| Total | 2,139 (76.0%) | 104 (3.7%) |
Employment Occupations by Sex in Lauderdale by the Sea
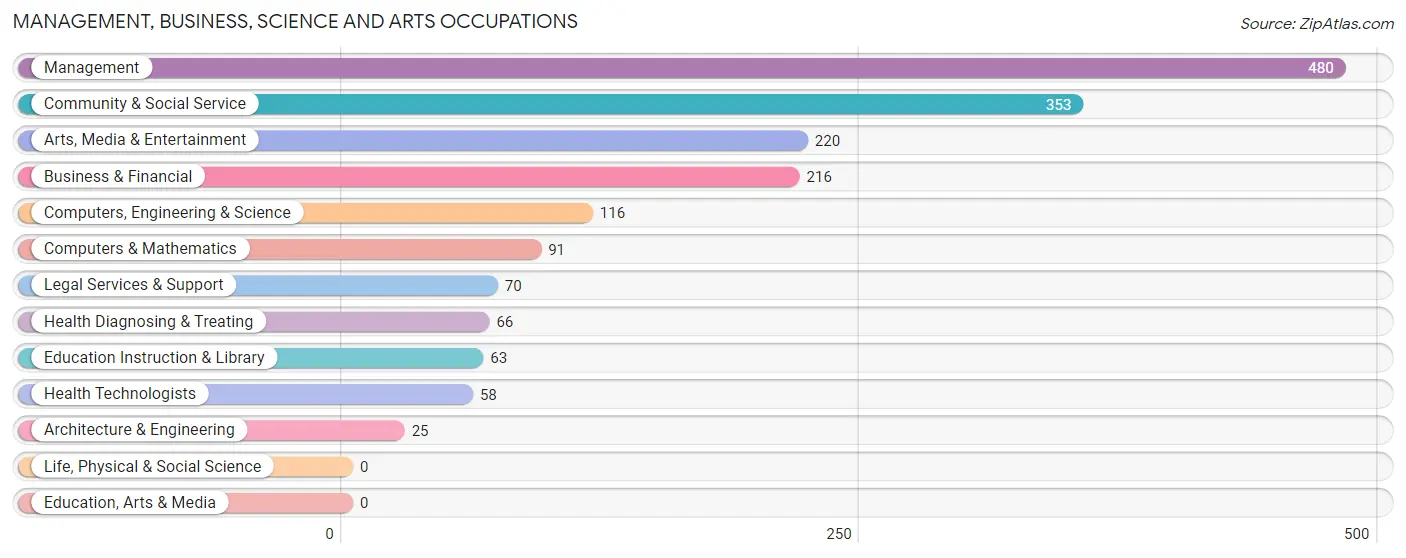
Management, Business, Science and Arts Occupations
The most common Management, Business, Science and Arts occupations in Lauderdale by the Sea are Management (480 | 18.5%), Community & Social Service (353 | 13.6%), Arts, Media & Entertainment (220 | 8.5%), Business & Financial (216 | 8.3%), and Computers, Engineering & Science (116 | 4.5%).
Management, Business, Science and Arts Occupations by Sex
Within the Management, Business, Science and Arts occupations in Lauderdale by the Sea, the most male-oriented occupations are Arts, Media & Entertainment (89.5%), Computers & Mathematics (89.0%), and Business & Financial (87.5%), while the most female-oriented occupations are Legal Services & Support (85.7%), Health Technologists (74.1%), and Health Diagnosing & Treating (65.1%).
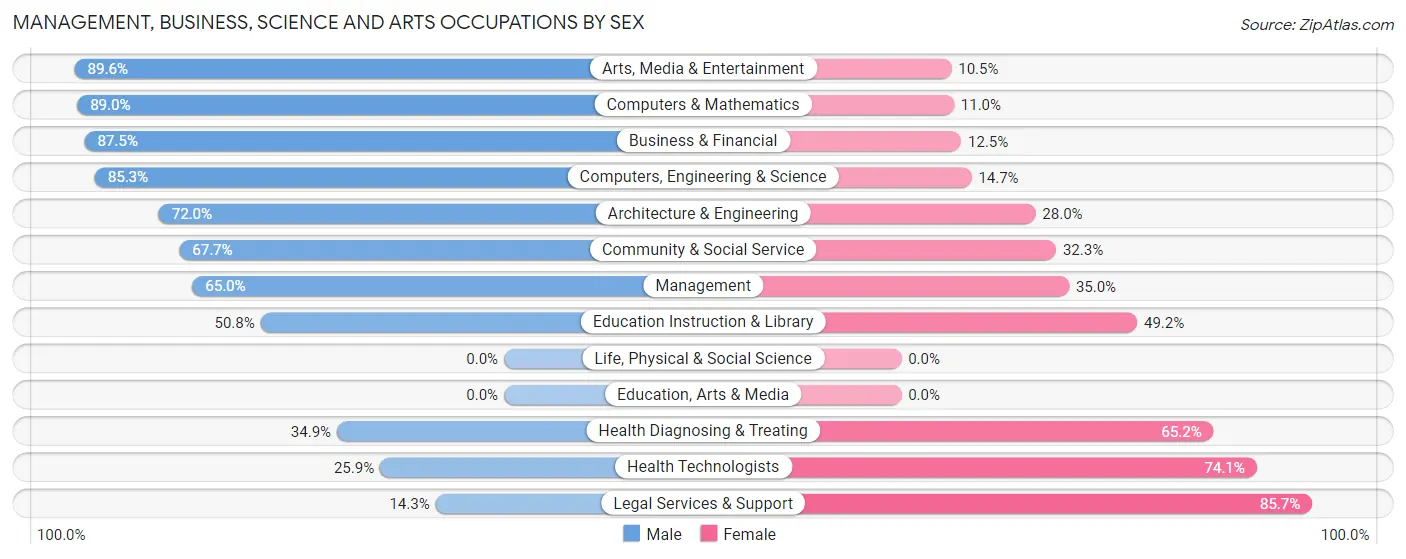
| Occupation | Male | Female |
| Management | 312 (65.0%) | 168 (35.0%) |
| Business & Financial | 189 (87.5%) | 27 (12.5%) |
| Computers, Engineering & Science | 99 (85.3%) | 17 (14.7%) |
| Computers & Mathematics | 81 (89.0%) | 10 (11.0%) |
| Architecture & Engineering | 18 (72.0%) | 7 (28.0%) |
| Life, Physical & Social Science | 0 (0.0%) | 0 (0.0%) |
| Community & Social Service | 239 (67.7%) | 114 (32.3%) |
| Education, Arts & Media | 0 (0.0%) | 0 (0.0%) |
| Legal Services & Support | 10 (14.3%) | 60 (85.7%) |
| Education Instruction & Library | 32 (50.8%) | 31 (49.2%) |
| Arts, Media & Entertainment | 197 (89.5%) | 23 (10.4%) |
| Health Diagnosing & Treating | 23 (34.8%) | 43 (65.1%) |
| Health Technologists | 15 (25.9%) | 43 (74.1%) |
| Total (Category) | 862 (70.0%) | 369 (30.0%) |
| Total (Overall) | 1,283 (49.5%) | 1,308 (50.5%) |
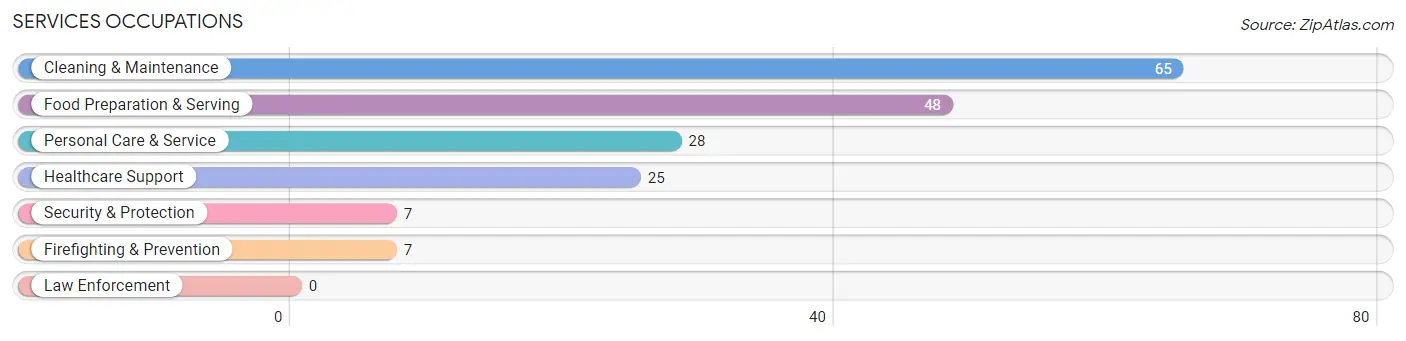
Services Occupations
The most common Services occupations in Lauderdale by the Sea are Cleaning & Maintenance (65 | 2.5%), Food Preparation & Serving (48 | 1.8%), Personal Care & Service (28 | 1.1%), Healthcare Support (25 | 1.0%), and Security & Protection (7 | 0.3%).
Services Occupations by Sex
Within the Services occupations in Lauderdale by the Sea, the most male-oriented occupations are Food Preparation & Serving (39.6%), and Cleaning & Maintenance (35.4%), while the most female-oriented occupations are Healthcare Support (100.0%), Security & Protection (100.0%), and Firefighting & Prevention (100.0%).
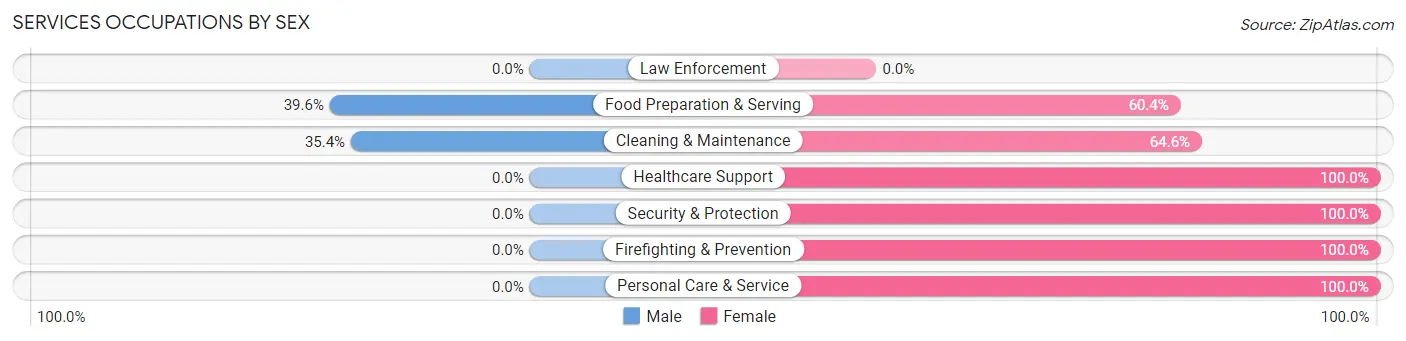
| Occupation | Male | Female |
| Healthcare Support | 0 (0.0%) | 25 (100.0%) |
| Security & Protection | 0 (0.0%) | 7 (100.0%) |
| Firefighting & Prevention | 0 (0.0%) | 7 (100.0%) |
| Law Enforcement | 0 (0.0%) | 0 (0.0%) |
| Food Preparation & Serving | 19 (39.6%) | 29 (60.4%) |
| Cleaning & Maintenance | 23 (35.4%) | 42 (64.6%) |
| Personal Care & Service | 0 (0.0%) | 28 (100.0%) |
| Total (Category) | 42 (24.3%) | 131 (75.7%) |
| Total (Overall) | 1,283 (49.5%) | 1,308 (50.5%) |
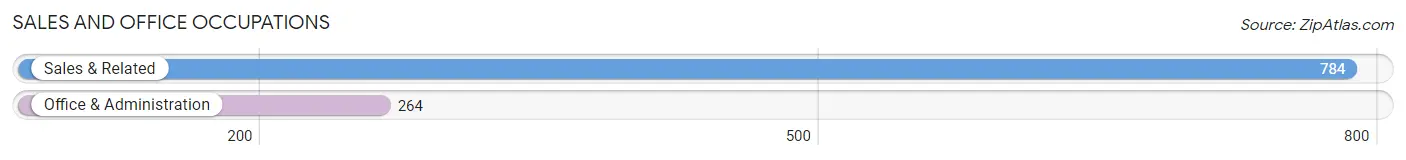
Sales and Office Occupations
The most common Sales and Office occupations in Lauderdale by the Sea are Sales & Related (784 | 30.3%), and Office & Administration (264 | 10.2%).
Sales and Office Occupations by Sex
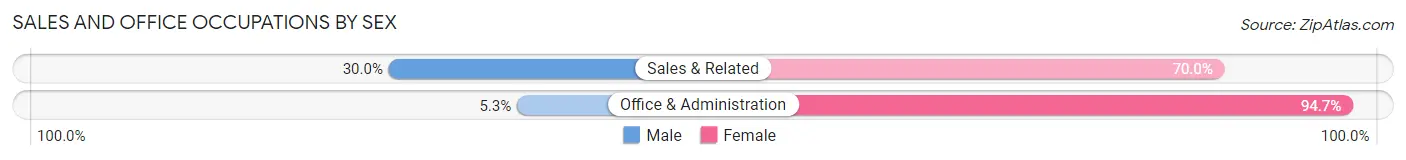
| Occupation | Male | Female |
| Sales & Related | 235 (30.0%) | 549 (70.0%) |
| Office & Administration | 14 (5.3%) | 250 (94.7%) |
| Total (Category) | 249 (23.8%) | 799 (76.2%) |
| Total (Overall) | 1,283 (49.5%) | 1,308 (50.5%) |
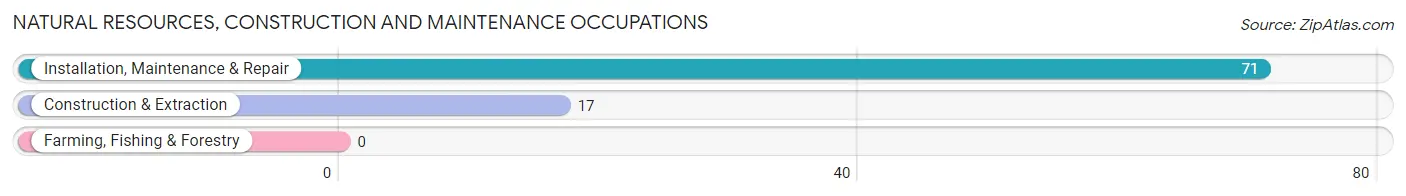
Natural Resources, Construction and Maintenance Occupations
The most common Natural Resources, Construction and Maintenance occupations in Lauderdale by the Sea are Installation, Maintenance & Repair (71 | 2.7%), and Construction & Extraction (17 | 0.7%).
Natural Resources, Construction and Maintenance Occupations by Sex
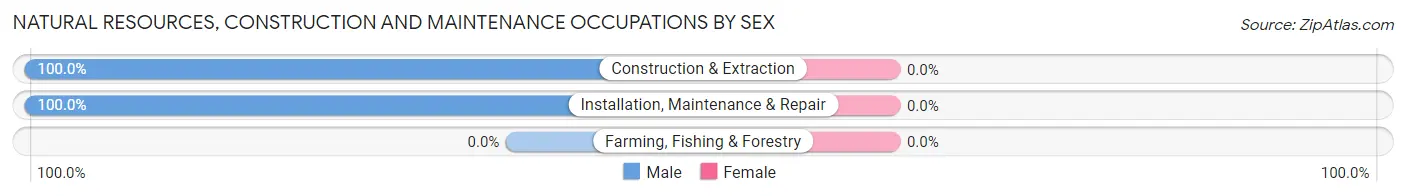
| Occupation | Male | Female |
| Farming, Fishing & Forestry | 0 (0.0%) | 0 (0.0%) |
| Construction & Extraction | 17 (100.0%) | 0 (0.0%) |
| Installation, Maintenance & Repair | 71 (100.0%) | 0 (0.0%) |
| Total (Category) | 88 (100.0%) | 0 (0.0%) |
| Total (Overall) | 1,283 (49.5%) | 1,308 (50.5%) |
Production, Transportation and Moving Occupations
The most common Production, Transportation and Moving occupations in Lauderdale by the Sea are Transportation (22 | 0.9%), Production (20 | 0.8%), and Material Moving (9 | 0.4%).
Production, Transportation and Moving Occupations by Sex
| Occupation | Male | Female |
| Production | 20 (100.0%) | 0 (0.0%) |
| Transportation | 22 (100.0%) | 0 (0.0%) |
| Material Moving | 0 (0.0%) | 9 (100.0%) |
| Total (Category) | 42 (82.4%) | 9 (17.6%) |
| Total (Overall) | 1,283 (49.5%) | 1,308 (50.5%) |
Employment Industries by Sex in Lauderdale by the Sea
Employment Industries in Lauderdale by the Sea
The major employment industries in Lauderdale by the Sea include Retail Trade (392 | 15.1%), Finance & Insurance (340 | 13.1%), Real Estate, Rental & Leasing (332 | 12.8%), Professional & Scientific (330 | 12.7%), and Health Care & Social Assistance (177 | 6.8%).
Employment Industries by Sex in Lauderdale by the Sea
The Lauderdale by the Sea industries that see more men than women are Information (100.0%), Construction (94.2%), and Manufacturing (93.5%), whereas the industries that tend to have a higher number of women are Health Care & Social Assistance (84.8%), Retail Trade (73.5%), and Educational Services (71.2%).
| Industry | Male | Female |
| Agriculture, Fishing & Hunting | 0 (0.0%) | 0 (0.0%) |
| Mining, Quarrying, & Extraction | 0 (0.0%) | 0 (0.0%) |
| Construction | 98 (94.2%) | 6 (5.8%) |
| Manufacturing | 100 (93.5%) | 7 (6.5%) |
| Wholesale Trade | 53 (59.6%) | 36 (40.5%) |
| Retail Trade | 104 (26.5%) | 288 (73.5%) |
| Transportation & Warehousing | 54 (47.8%) | 59 (52.2%) |
| Utilities | 0 (0.0%) | 0 (0.0%) |
| Information | 67 (100.0%) | 0 (0.0%) |
| Finance & Insurance | 203 (59.7%) | 137 (40.3%) |
| Real Estate, Rental & Leasing | 110 (33.1%) | 222 (66.9%) |
| Professional & Scientific | 262 (79.4%) | 68 (20.6%) |
| Enterprise Management | 0 (0.0%) | 0 (0.0%) |
| Administrative & Support | 45 (47.9%) | 49 (52.1%) |
| Educational Services | 32 (28.8%) | 79 (71.2%) |
| Health Care & Social Assistance | 27 (15.2%) | 150 (84.8%) |
| Arts, Entertainment & Recreation | 26 (30.9%) | 58 (69.1%) |
| Accommodation & Food Services | 33 (53.2%) | 29 (46.8%) |
| Public Administration | 16 (38.1%) | 26 (61.9%) |
| Total | 1,283 (49.5%) | 1,308 (50.5%) |
Education in Lauderdale by the Sea
School Enrollment in Lauderdale by the Sea
The most common levels of schooling among the 727 students in Lauderdale by the Sea are high school (244 | 33.6%), graduate / professional (101 | 13.9%), and elementary school (99 | 13.6%).
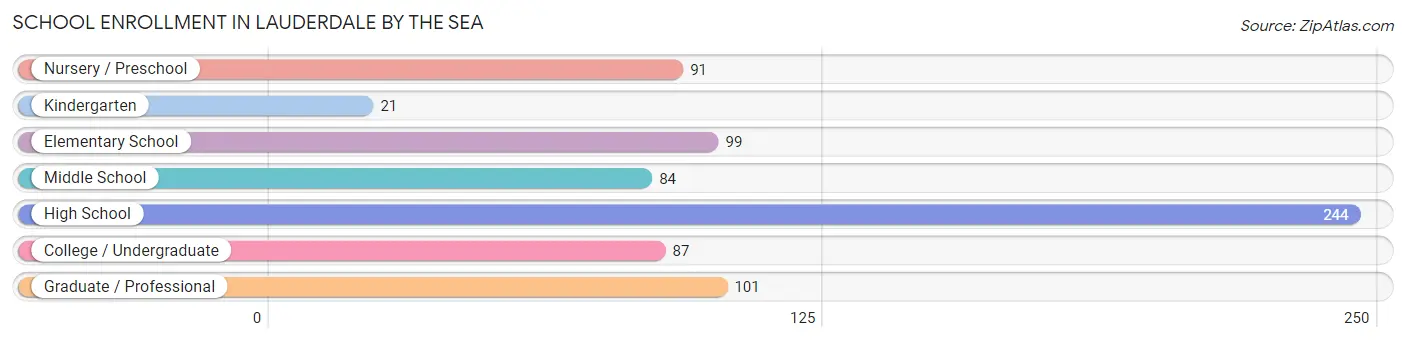
| School Level | # Students | % Students |
| Nursery / Preschool | 91 | 12.5% |
| Kindergarten | 21 | 2.9% |
| Elementary School | 99 | 13.6% |
| Middle School | 84 | 11.6% |
| High School | 244 | 33.6% |
| College / Undergraduate | 87 | 12.0% |
| Graduate / Professional | 101 | 13.9% |
| Total | 727 | 100.0% |
School Enrollment by Age by Funding Source in Lauderdale by the Sea
Out of a total of 727 students who are enrolled in schools in Lauderdale by the Sea, 585 (80.5%) attend a private institution, while the remaining 142 (19.5%) are enrolled in public schools. The age group of 3 to 4 year olds has the highest likelihood of being enrolled in private schools, with 31 (100.0% in the age bracket) enrolled. Conversely, the age group of 18 to 19 year olds has the lowest likelihood of being enrolled in a private school, with 20 (100.0% in the age bracket) attending a public institution.
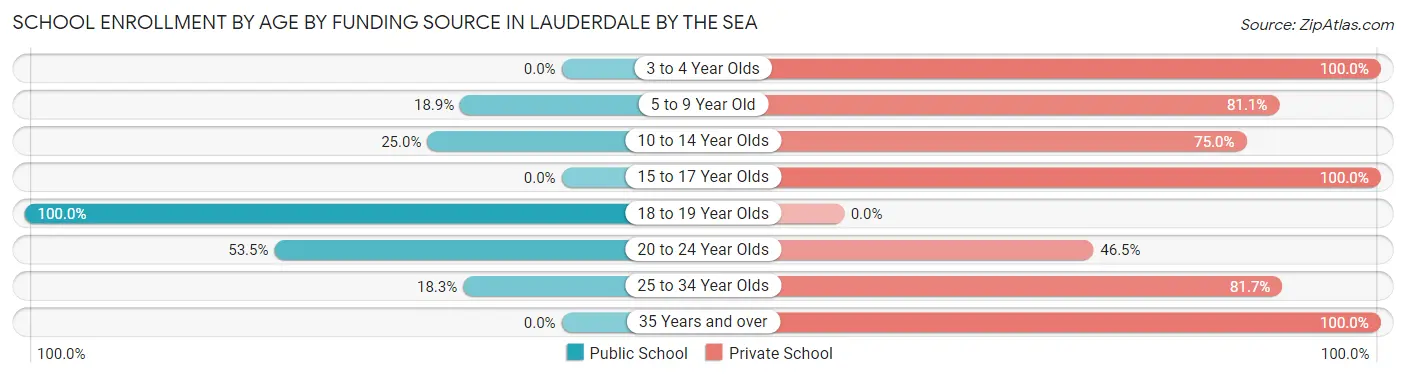
| Age Bracket | Public School | Private School |
| 3 to 4 Year Olds | 0 (0.0%) | 31 (100.0%) |
| 5 to 9 Year Old | 34 (18.9%) | 146 (81.1%) |
| 10 to 14 Year Olds | 43 (25.0%) | 129 (75.0%) |
| 15 to 17 Year Olds | 0 (0.0%) | 136 (100.0%) |
| 18 to 19 Year Olds | 20 (100.0%) | 0 (0.0%) |
| 20 to 24 Year Olds | 23 (53.5%) | 20 (46.5%) |
| 25 to 34 Year Olds | 22 (18.3%) | 98 (81.7%) |
| 35 Years and over | 0 (0.0%) | 25 (100.0%) |
| Total | 142 (19.5%) | 585 (80.5%) |
Educational Attainment by Field of Study in Lauderdale by the Sea
Business (838 | 27.0%), science & technology (392 | 12.6%), communications (345 | 11.1%), education (322 | 10.4%), and social sciences (277 | 8.9%) are the most common fields of study among 3,106 individuals in Lauderdale by the Sea who have obtained a bachelor's degree or higher.
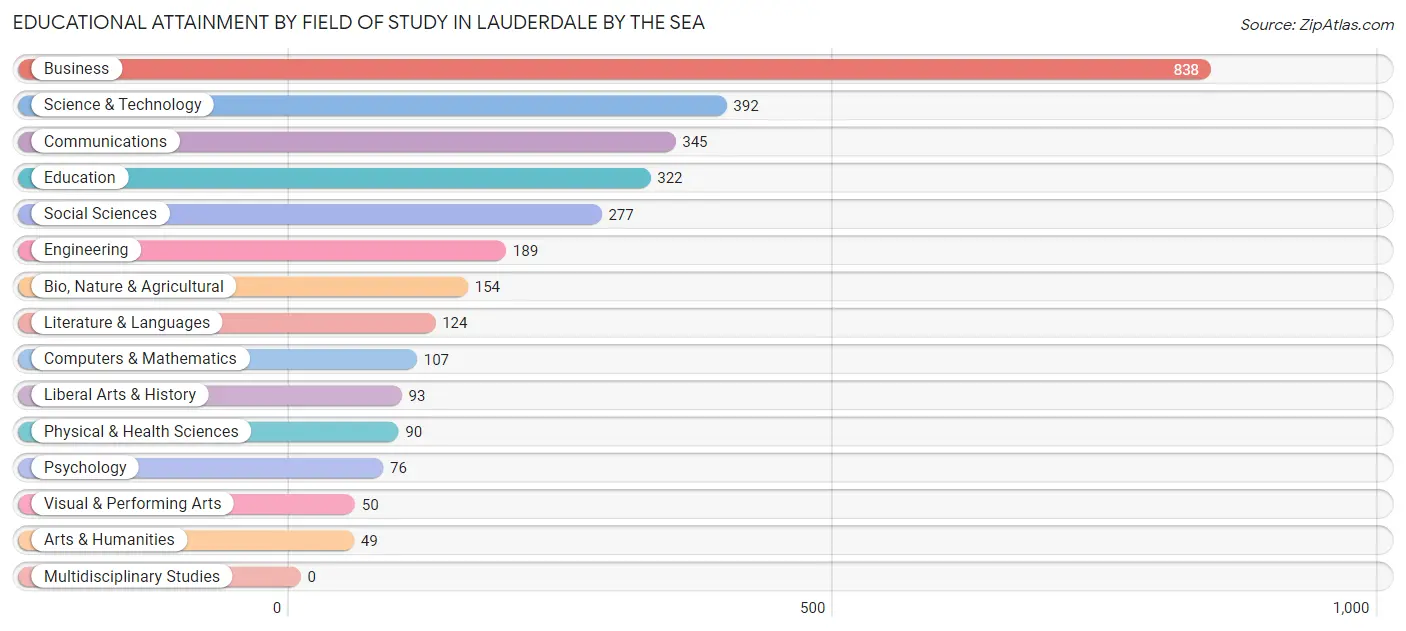
| Field of Study | # Graduates | % Graduates |
| Computers & Mathematics | 107 | 3.4% |
| Bio, Nature & Agricultural | 154 | 5.0% |
| Physical & Health Sciences | 90 | 2.9% |
| Psychology | 76 | 2.5% |
| Social Sciences | 277 | 8.9% |
| Engineering | 189 | 6.1% |
| Multidisciplinary Studies | 0 | 0.0% |
| Science & Technology | 392 | 12.6% |
| Business | 838 | 27.0% |
| Education | 322 | 10.4% |
| Literature & Languages | 124 | 4.0% |
| Liberal Arts & History | 93 | 3.0% |
| Visual & Performing Arts | 50 | 1.6% |
| Communications | 345 | 11.1% |
| Arts & Humanities | 49 | 1.6% |
| Total | 3,106 | 100.0% |
Transportation & Commute in Lauderdale by the Sea
Vehicle Availability by Sex in Lauderdale by the Sea
The most prevalent vehicle ownership categories in Lauderdale by the Sea are males with 2 vehicles (526, accounting for 42.0%) and females with 2 vehicles (380, making up 45.2%).
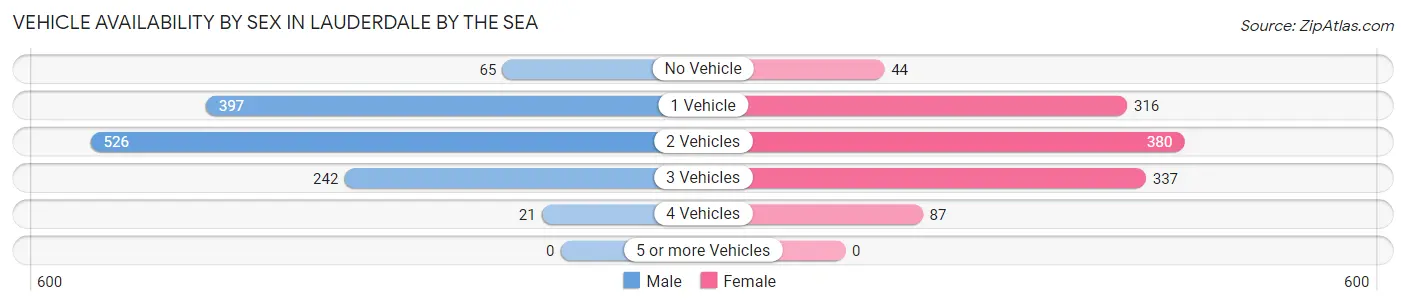
| Vehicles Available | Male | Female |
| No Vehicle | 65 (5.2%) | 44 (3.8%) |
| 1 Vehicle | 397 (31.7%) | 316 (27.2%) |
| 2 Vehicles | 526 (42.0%) | 380 (32.7%) |
| 3 Vehicles | 242 (19.3%) | 337 (28.9%) |
| 4 Vehicles | 21 (1.7%) | 87 (7.5%) |
| 5 or more Vehicles | 0 (0.0%) | 0 (0.0%) |
| Total | 1,251 (100.0%) | 1,164 (100.0%) |
Commute Time in Lauderdale by the Sea
The most frequently occuring commute durations in Lauderdale by the Sea are 30 to 34 minutes (292 commuters, 17.7%), 15 to 19 minutes (265 commuters, 16.1%), and 45 to 59 minutes (178 commuters, 10.8%).
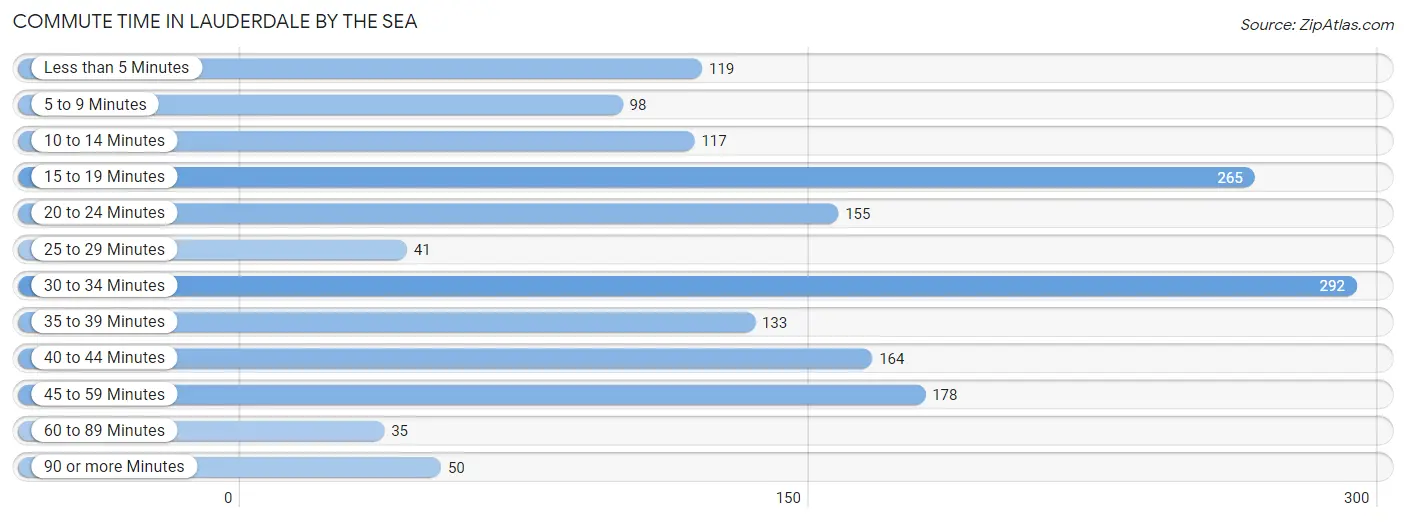
| Commute Time | # Commuters | % Commuters |
| Less than 5 Minutes | 119 | 7.2% |
| 5 to 9 Minutes | 98 | 5.9% |
| 10 to 14 Minutes | 117 | 7.1% |
| 15 to 19 Minutes | 265 | 16.1% |
| 20 to 24 Minutes | 155 | 9.4% |
| 25 to 29 Minutes | 41 | 2.5% |
| 30 to 34 Minutes | 292 | 17.7% |
| 35 to 39 Minutes | 133 | 8.1% |
| 40 to 44 Minutes | 164 | 10.0% |
| 45 to 59 Minutes | 178 | 10.8% |
| 60 to 89 Minutes | 35 | 2.1% |
| 90 or more Minutes | 50 | 3.0% |
Commute Time by Sex in Lauderdale by the Sea
The most common commute times in Lauderdale by the Sea are 15 to 19 minutes (201 commuters, 23.6%) for males and 40 to 44 minutes (155 commuters, 19.5%) for females.
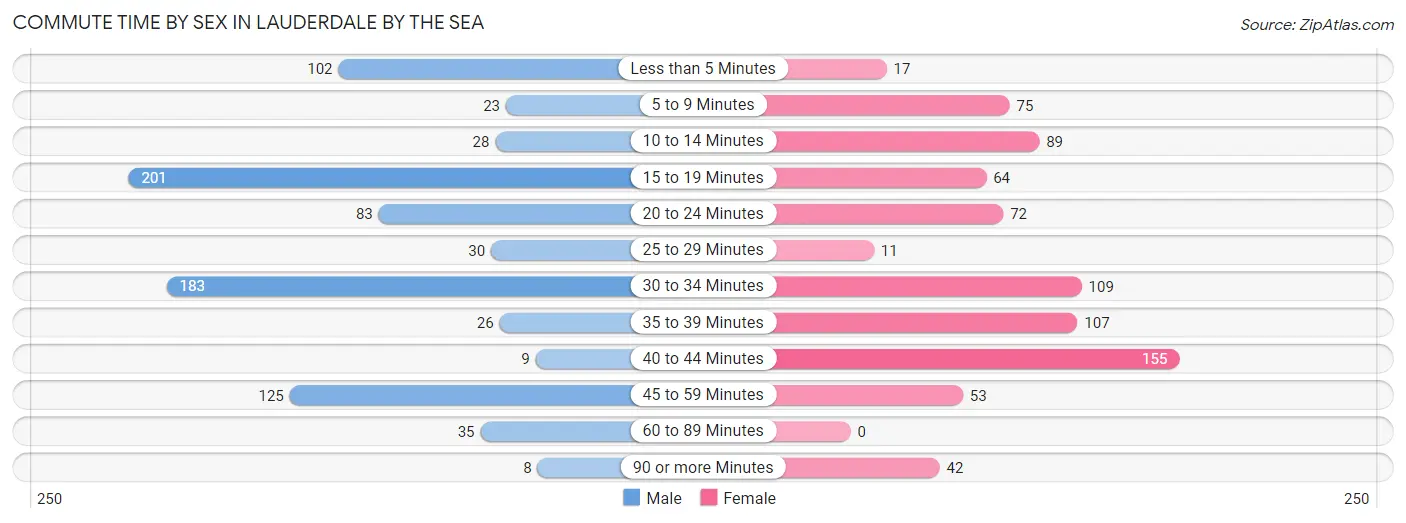
| Commute Time | Male | Female |
| Less than 5 Minutes | 102 (12.0%) | 17 (2.1%) |
| 5 to 9 Minutes | 23 (2.7%) | 75 (9.5%) |
| 10 to 14 Minutes | 28 (3.3%) | 89 (11.2%) |
| 15 to 19 Minutes | 201 (23.6%) | 64 (8.1%) |
| 20 to 24 Minutes | 83 (9.7%) | 72 (9.1%) |
| 25 to 29 Minutes | 30 (3.5%) | 11 (1.4%) |
| 30 to 34 Minutes | 183 (21.4%) | 109 (13.7%) |
| 35 to 39 Minutes | 26 (3.0%) | 107 (13.5%) |
| 40 to 44 Minutes | 9 (1.1%) | 155 (19.5%) |
| 45 to 59 Minutes | 125 (14.6%) | 53 (6.7%) |
| 60 to 89 Minutes | 35 (4.1%) | 0 (0.0%) |
| 90 or more Minutes | 8 (0.9%) | 42 (5.3%) |
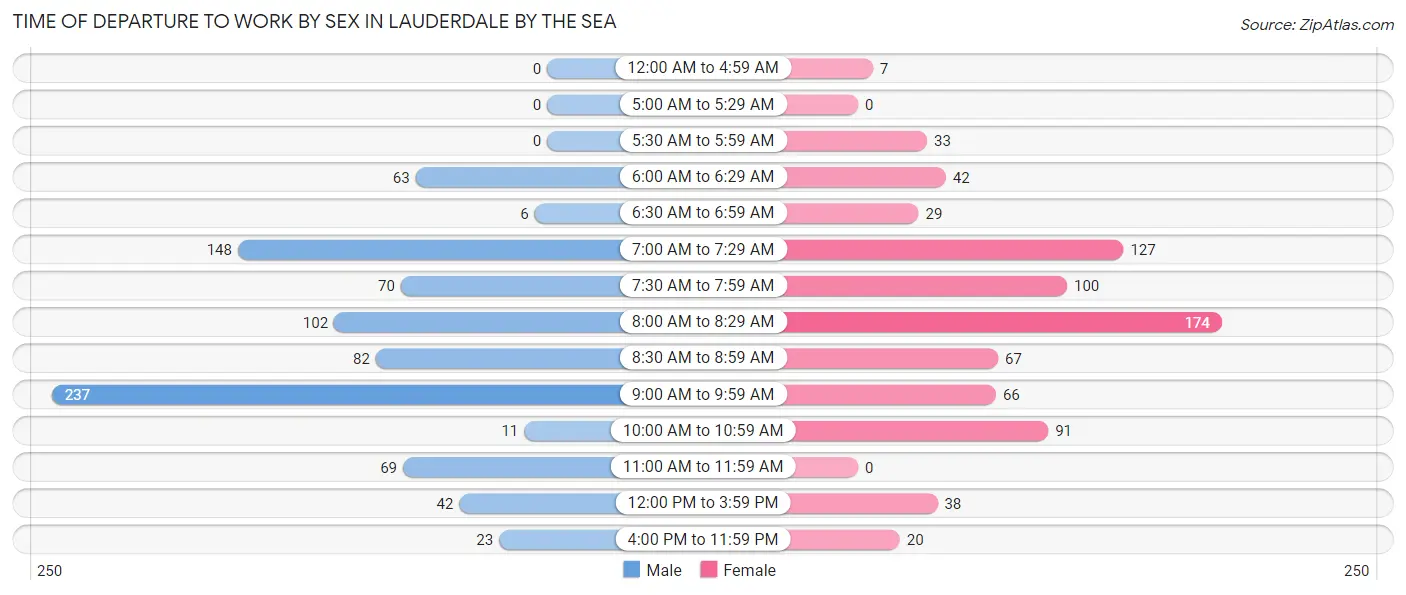
Time of Departure to Work by Sex in Lauderdale by the Sea
The most frequent times of departure to work in Lauderdale by the Sea are 9:00 AM to 9:59 AM (237, 27.8%) for males and 8:00 AM to 8:29 AM (174, 21.9%) for females.
| Time of Departure | Male | Female |
| 12:00 AM to 4:59 AM | 0 (0.0%) | 7 (0.9%) |
| 5:00 AM to 5:29 AM | 0 (0.0%) | 0 (0.0%) |
| 5:30 AM to 5:59 AM | 0 (0.0%) | 33 (4.2%) |
| 6:00 AM to 6:29 AM | 63 (7.4%) | 42 (5.3%) |
| 6:30 AM to 6:59 AM | 6 (0.7%) | 29 (3.6%) |
| 7:00 AM to 7:29 AM | 148 (17.3%) | 127 (16.0%) |
| 7:30 AM to 7:59 AM | 70 (8.2%) | 100 (12.6%) |
| 8:00 AM to 8:29 AM | 102 (12.0%) | 174 (21.9%) |
| 8:30 AM to 8:59 AM | 82 (9.6%) | 67 (8.4%) |
| 9:00 AM to 9:59 AM | 237 (27.8%) | 66 (8.3%) |
| 10:00 AM to 10:59 AM | 11 (1.3%) | 91 (11.5%) |
| 11:00 AM to 11:59 AM | 69 (8.1%) | 0 (0.0%) |
| 12:00 PM to 3:59 PM | 42 (4.9%) | 38 (4.8%) |
| 4:00 PM to 11:59 PM | 23 (2.7%) | 20 (2.5%) |
| Total | 853 (100.0%) | 794 (100.0%) |
Housing Occupancy in Lauderdale by the Sea
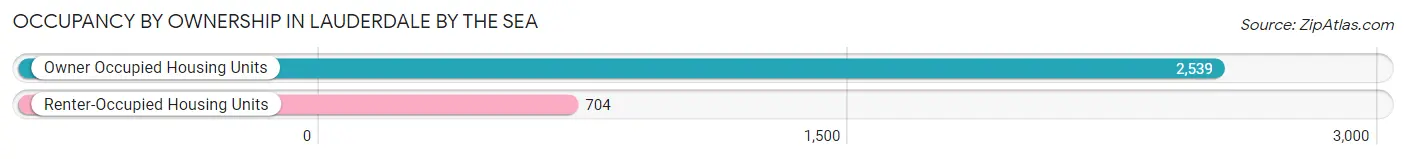
Occupancy by Ownership in Lauderdale by the Sea
Of the total 3,243 dwellings in Lauderdale by the Sea, owner-occupied units account for 2,539 (78.3%), while renter-occupied units make up 704 (21.7%).
| Occupancy | # Housing Units | % Housing Units |
| Owner Occupied Housing Units | 2,539 | 78.3% |
| Renter-Occupied Housing Units | 704 | 21.7% |
| Total Occupied Housing Units | 3,243 | 100.0% |
Occupancy by Household Size in Lauderdale by the Sea
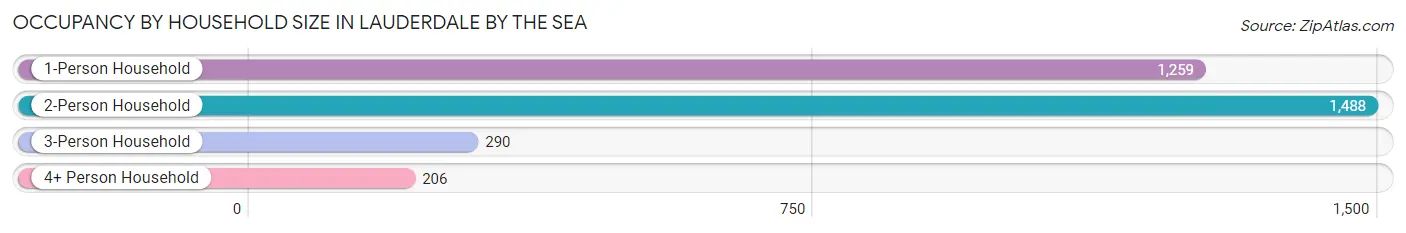
| Household Size | # Housing Units | % Housing Units |
| 1-Person Household | 1,259 | 38.8% |
| 2-Person Household | 1,488 | 45.9% |
| 3-Person Household | 290 | 8.9% |
| 4+ Person Household | 206 | 6.4% |
| Total Housing Units | 3,243 | 100.0% |
Occupancy by Ownership by Household Size in Lauderdale by the Sea
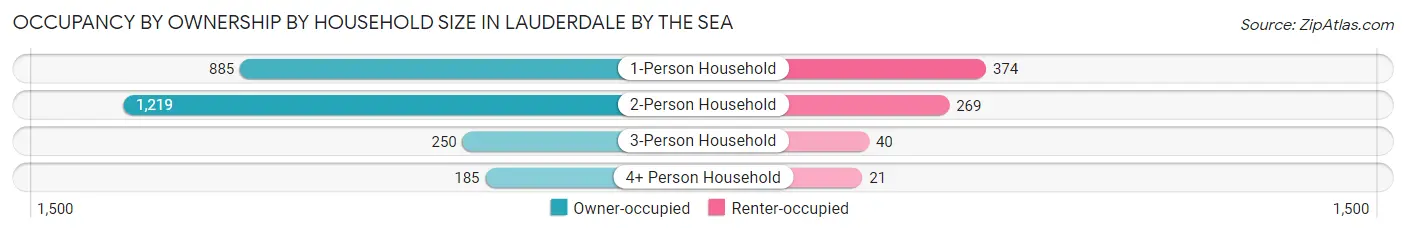
| Household Size | Owner-occupied | Renter-occupied |
| 1-Person Household | 885 (70.3%) | 374 (29.7%) |
| 2-Person Household | 1,219 (81.9%) | 269 (18.1%) |
| 3-Person Household | 250 (86.2%) | 40 (13.8%) |
| 4+ Person Household | 185 (89.8%) | 21 (10.2%) |
| Total Housing Units | 2,539 (78.3%) | 704 (21.7%) |
Occupancy by Educational Attainment in Lauderdale by the Sea
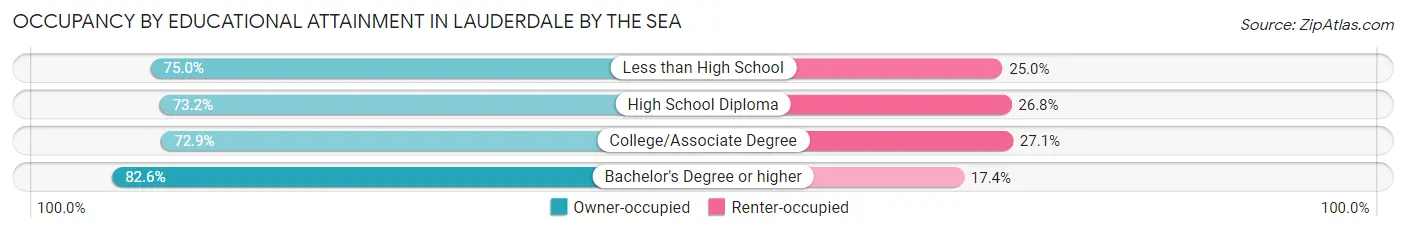
| Household Size | Owner-occupied | Renter-occupied |
| Less than High School | 18 (75.0%) | 6 (25.0%) |
| High School Diploma | 396 (73.2%) | 145 (26.8%) |
| College/Associate Degree | 656 (72.9%) | 244 (27.1%) |
| Bachelor's Degree or higher | 1,469 (82.6%) | 309 (17.4%) |
Occupancy by Age of Householder in Lauderdale by the Sea
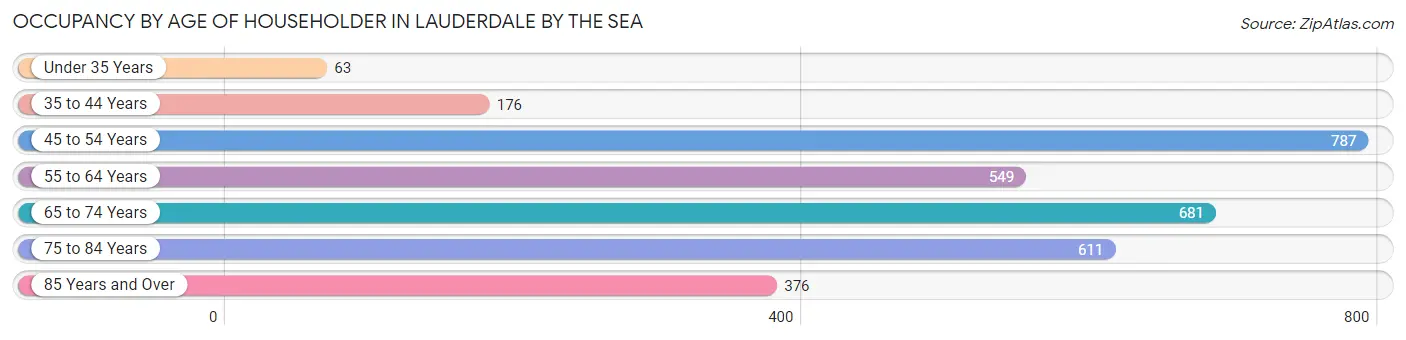
| Age Bracket | # Households | % Households |
| Under 35 Years | 63 | 1.9% |
| 35 to 44 Years | 176 | 5.4% |
| 45 to 54 Years | 787 | 24.3% |
| 55 to 64 Years | 549 | 16.9% |
| 65 to 74 Years | 681 | 21.0% |
| 75 to 84 Years | 611 | 18.8% |
| 85 Years and Over | 376 | 11.6% |
| Total | 3,243 | 100.0% |
Housing Finances in Lauderdale by the Sea
Median Income by Occupancy in Lauderdale by the Sea
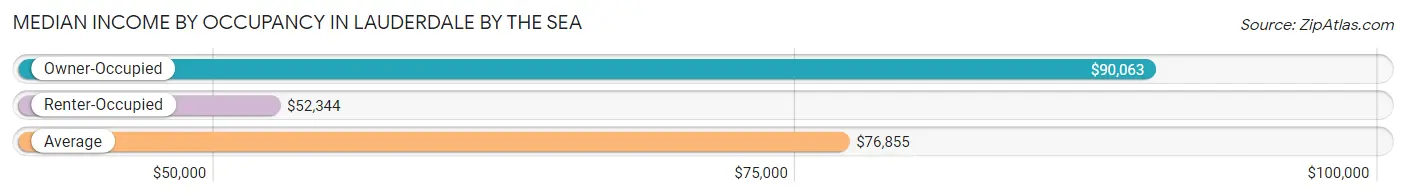
| Occupancy Type | # Households | Median Income |
| Owner-Occupied | 2,539 (78.3%) | $90,063 |
| Renter-Occupied | 704 (21.7%) | $52,344 |
| Average | 3,243 (100.0%) | $76,855 |
Occupancy by Householder Income Bracket in Lauderdale by the Sea
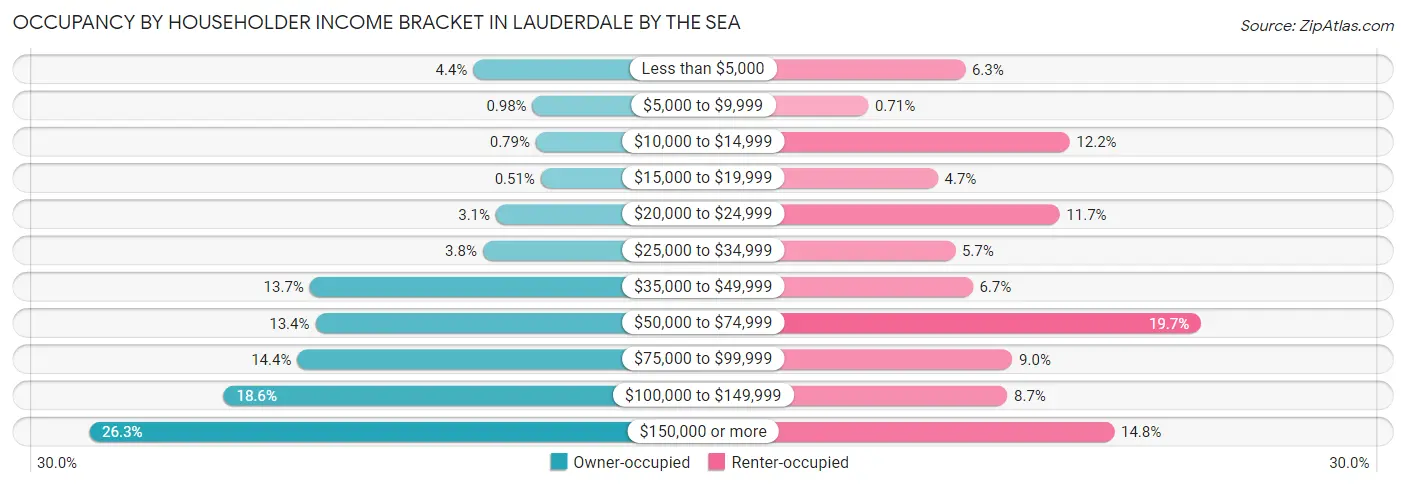
| Income Bracket | Owner-occupied | Renter-occupied |
| Less than $5,000 | 111 (4.4%) | 44 (6.2%) |
| $5,000 to $9,999 | 25 (1.0%) | 5 (0.7%) |
| $10,000 to $14,999 | 20 (0.8%) | 86 (12.2%) |
| $15,000 to $19,999 | 13 (0.5%) | 33 (4.7%) |
| $20,000 to $24,999 | 78 (3.1%) | 82 (11.7%) |
| $25,000 to $34,999 | 97 (3.8%) | 40 (5.7%) |
| $35,000 to $49,999 | 348 (13.7%) | 47 (6.7%) |
| $50,000 to $74,999 | 340 (13.4%) | 139 (19.7%) |
| $75,000 to $99,999 | 366 (14.4%) | 63 (8.9%) |
| $100,000 to $149,999 | 473 (18.6%) | 61 (8.7%) |
| $150,000 or more | 668 (26.3%) | 104 (14.8%) |
| Total | 2,539 (100.0%) | 704 (100.0%) |
Monthly Housing Cost Tiers in Lauderdale by the Sea
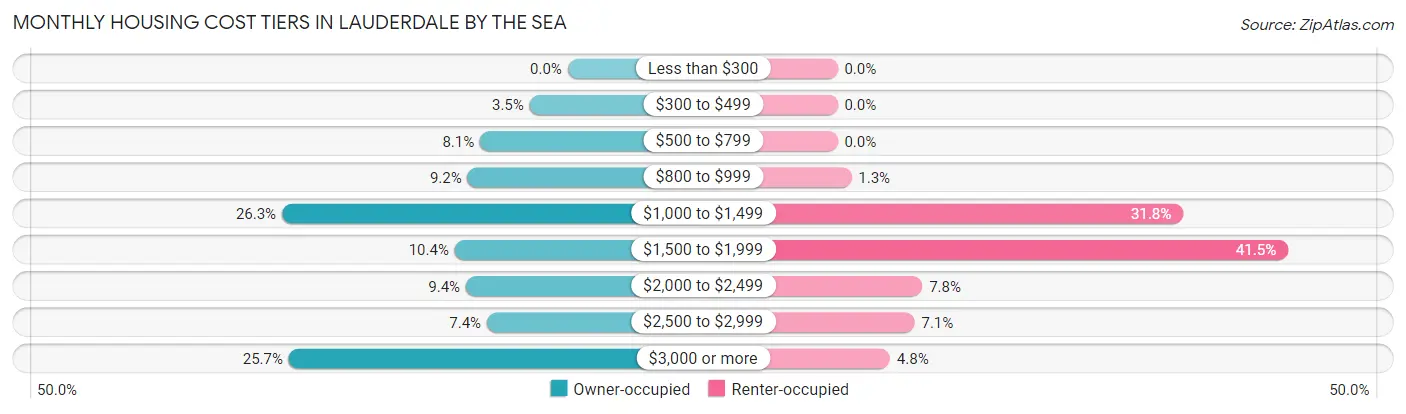
| Monthly Cost | Owner-occupied | Renter-occupied |
| Less than $300 | 0 (0.0%) | 0 (0.0%) |
| $300 to $499 | 89 (3.5%) | 0 (0.0%) |
| $500 to $799 | 205 (8.1%) | 0 (0.0%) |
| $800 to $999 | 234 (9.2%) | 9 (1.3%) |
| $1,000 to $1,499 | 668 (26.3%) | 224 (31.8%) |
| $1,500 to $1,999 | 264 (10.4%) | 292 (41.5%) |
| $2,000 to $2,499 | 238 (9.4%) | 55 (7.8%) |
| $2,500 to $2,999 | 189 (7.4%) | 50 (7.1%) |
| $3,000 or more | 652 (25.7%) | 34 (4.8%) |
| Total | 2,539 (100.0%) | 704 (100.0%) |
Physical Housing Characteristics in Lauderdale by the Sea
Housing Structures in Lauderdale by the Sea
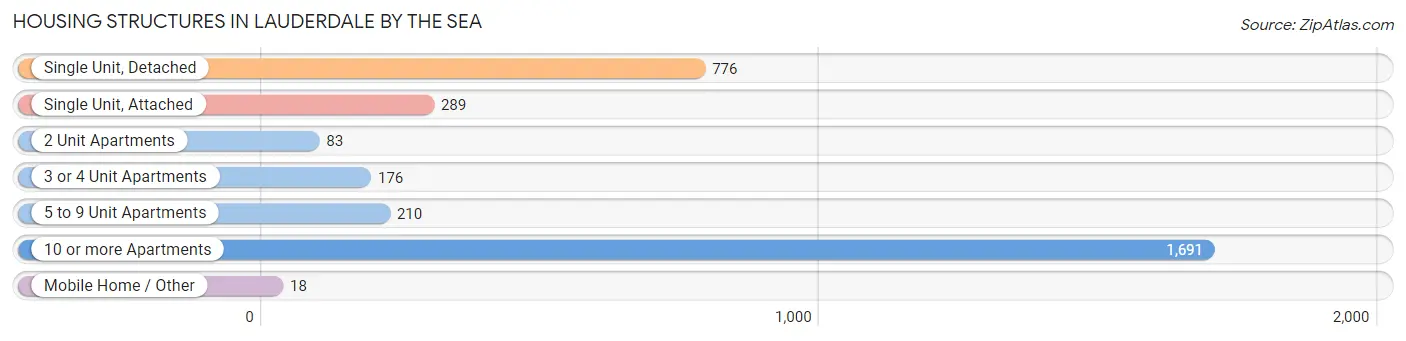
| Structure Type | # Housing Units | % Housing Units |
| Single Unit, Detached | 776 | 23.9% |
| Single Unit, Attached | 289 | 8.9% |
| 2 Unit Apartments | 83 | 2.6% |
| 3 or 4 Unit Apartments | 176 | 5.4% |
| 5 to 9 Unit Apartments | 210 | 6.5% |
| 10 or more Apartments | 1,691 | 52.1% |
| Mobile Home / Other | 18 | 0.6% |
| Total | 3,243 | 100.0% |
Housing Structures by Occupancy in Lauderdale by the Sea
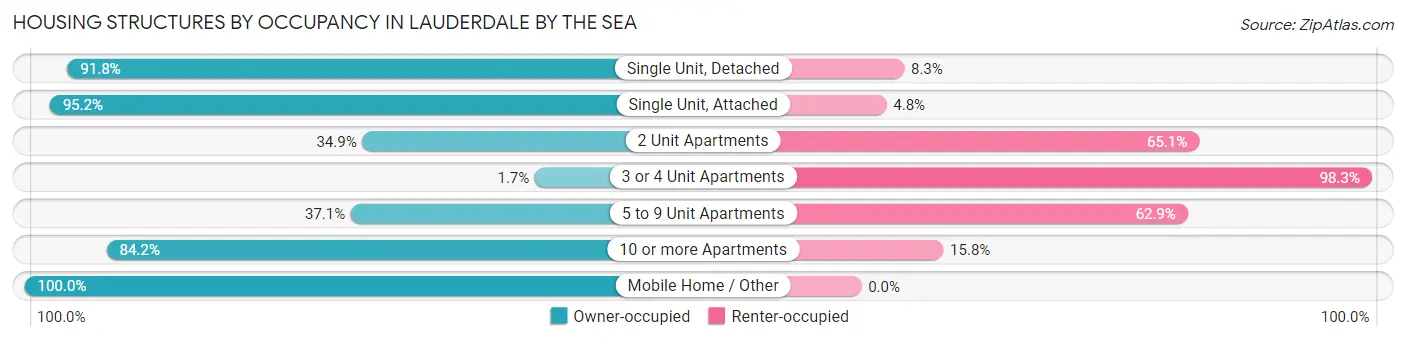
| Structure Type | Owner-occupied | Renter-occupied |
| Single Unit, Detached | 712 (91.7%) | 64 (8.3%) |
| Single Unit, Attached | 275 (95.2%) | 14 (4.8%) |
| 2 Unit Apartments | 29 (34.9%) | 54 (65.1%) |
| 3 or 4 Unit Apartments | 3 (1.7%) | 173 (98.3%) |
| 5 to 9 Unit Apartments | 78 (37.1%) | 132 (62.9%) |
| 10 or more Apartments | 1,424 (84.2%) | 267 (15.8%) |
| Mobile Home / Other | 18 (100.0%) | 0 (0.0%) |
| Total | 2,539 (78.3%) | 704 (21.7%) |
Housing Structures by Number of Rooms in Lauderdale by the Sea
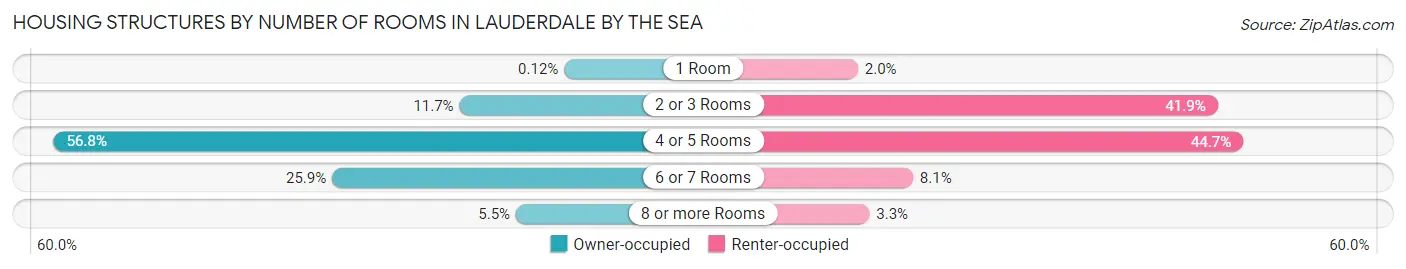
| Number of Rooms | Owner-occupied | Renter-occupied |
| 1 Room | 3 (0.1%) | 14 (2.0%) |
| 2 or 3 Rooms | 298 (11.7%) | 295 (41.9%) |
| 4 or 5 Rooms | 1,442 (56.8%) | 315 (44.7%) |
| 6 or 7 Rooms | 657 (25.9%) | 57 (8.1%) |
| 8 or more Rooms | 139 (5.5%) | 23 (3.3%) |
| Total | 2,539 (100.0%) | 704 (100.0%) |
Housing Structure by Heating Type in Lauderdale by the Sea
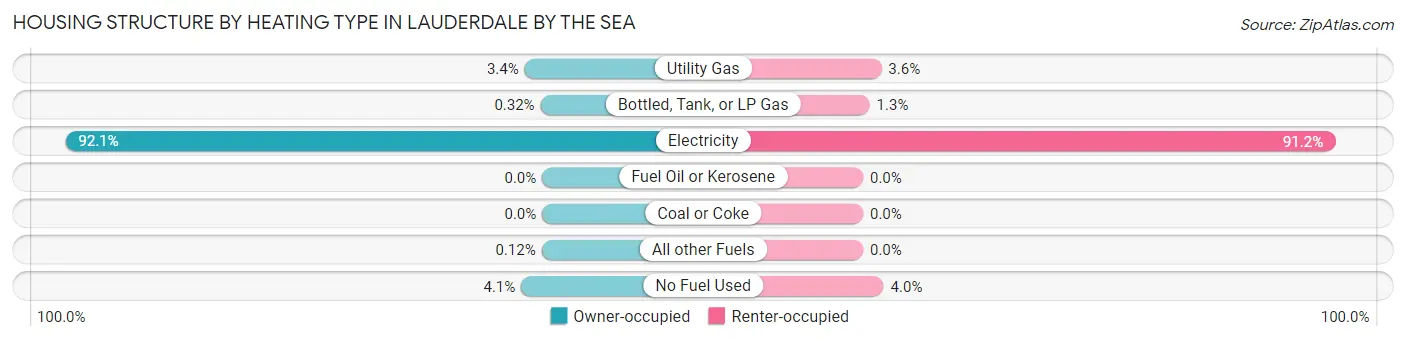
| Heating Type | Owner-occupied | Renter-occupied |
| Utility Gas | 86 (3.4%) | 25 (3.5%) |
| Bottled, Tank, or LP Gas | 8 (0.3%) | 9 (1.3%) |
| Electricity | 2,339 (92.1%) | 642 (91.2%) |
| Fuel Oil or Kerosene | 0 (0.0%) | 0 (0.0%) |
| Coal or Coke | 0 (0.0%) | 0 (0.0%) |
| All other Fuels | 3 (0.1%) | 0 (0.0%) |
| No Fuel Used | 103 (4.1%) | 28 (4.0%) |
| Total | 2,539 (100.0%) | 704 (100.0%) |
Household Vehicle Usage in Lauderdale by the Sea
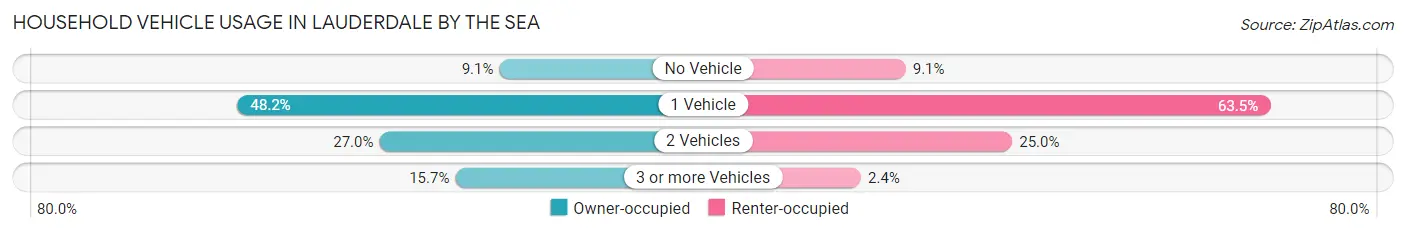
| Vehicles per Household | Owner-occupied | Renter-occupied |
| No Vehicle | 231 (9.1%) | 64 (9.1%) |
| 1 Vehicle | 1,224 (48.2%) | 447 (63.5%) |
| 2 Vehicles | 686 (27.0%) | 176 (25.0%) |
| 3 or more Vehicles | 398 (15.7%) | 17 (2.4%) |
| Total | 2,539 (100.0%) | 704 (100.0%) |
Real Estate & Mortgages in Lauderdale by the Sea
Real Estate and Mortgage Overview in Lauderdale by the Sea
| Characteristic | Without Mortgage | With Mortgage |
| Housing Units | 1,685 | 854 |
| Median Property Value | $517,200 | $629,000 |
| Median Household Income | $76,717 | $277 |
| Monthly Housing Costs | $1,343 | $463 |
| Real Estate Taxes | $5,403 | $14 |
Property Value by Mortgage Status in Lauderdale by the Sea
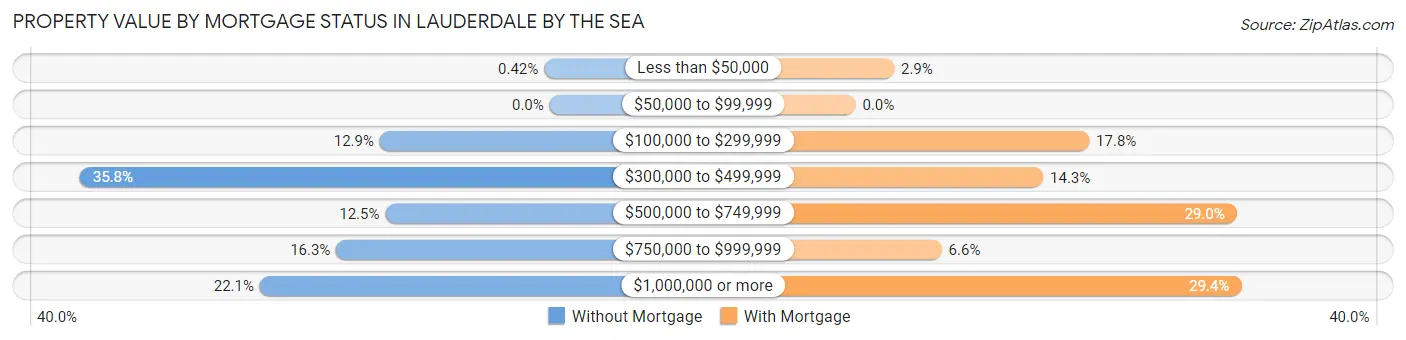
| Property Value | Without Mortgage | With Mortgage |
| Less than $50,000 | 7 (0.4%) | 25 (2.9%) |
| $50,000 to $99,999 | 0 (0.0%) | 0 (0.0%) |
| $100,000 to $299,999 | 218 (12.9%) | 152 (17.8%) |
| $300,000 to $499,999 | 603 (35.8%) | 122 (14.3%) |
| $500,000 to $749,999 | 211 (12.5%) | 248 (29.0%) |
| $750,000 to $999,999 | 274 (16.3%) | 56 (6.6%) |
| $1,000,000 or more | 372 (22.1%) | 251 (29.4%) |
| Total | 1,685 (100.0%) | 854 (100.0%) |
Household Income by Mortgage Status in Lauderdale by the Sea
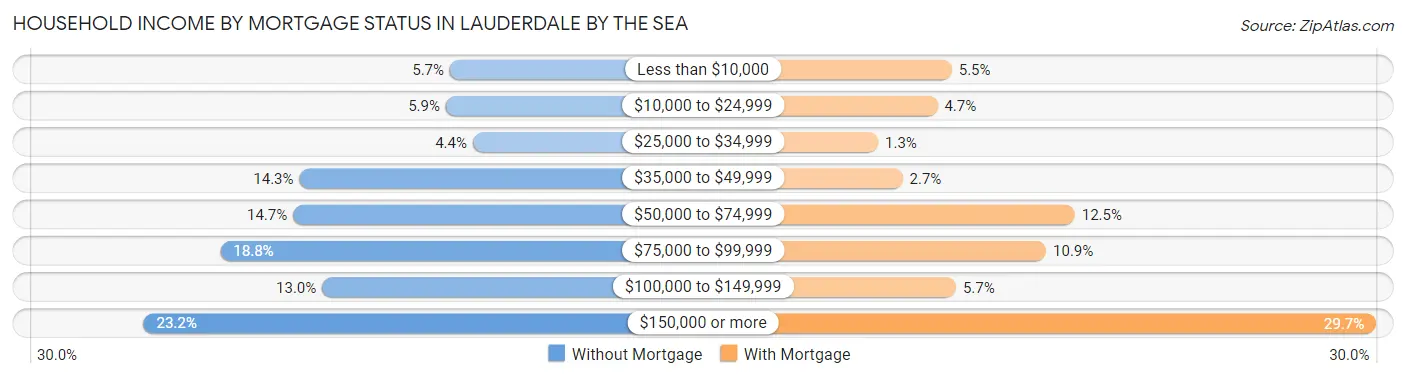
| Household Income | Without Mortgage | With Mortgage |
| Less than $10,000 | 96 (5.7%) | 47 (5.5%) |
| $10,000 to $24,999 | 100 (5.9%) | 40 (4.7%) |
| $25,000 to $34,999 | 74 (4.4%) | 11 (1.3%) |
| $35,000 to $49,999 | 241 (14.3%) | 23 (2.7%) |
| $50,000 to $74,999 | 247 (14.7%) | 107 (12.5%) |
| $75,000 to $99,999 | 317 (18.8%) | 93 (10.9%) |
| $100,000 to $149,999 | 219 (13.0%) | 49 (5.7%) |
| $150,000 or more | 391 (23.2%) | 254 (29.7%) |
| Total | 1,685 (100.0%) | 854 (100.0%) |
Property Value to Household Income Ratio in Lauderdale by the Sea
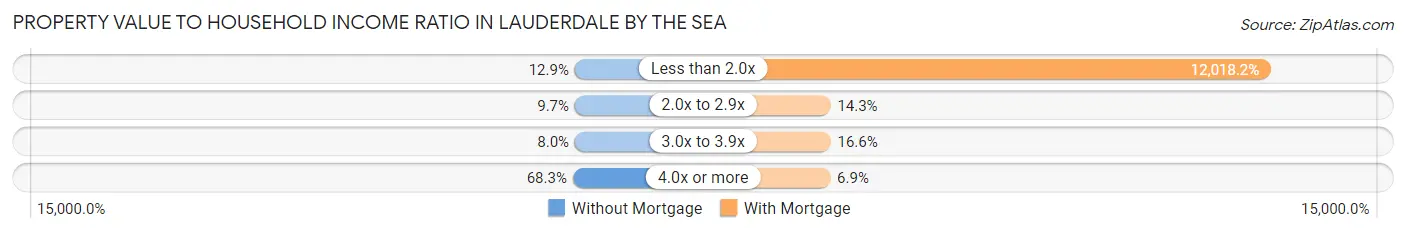
| Value-to-Income Ratio | Without Mortgage | With Mortgage |
| Less than 2.0x | 217 (12.9%) | 102,635 (12,018.1%) |
| 2.0x to 2.9x | 163 (9.7%) | 122 (14.3%) |
| 3.0x to 3.9x | 135 (8.0%) | 142 (16.6%) |
| 4.0x or more | 1,151 (68.3%) | 59 (6.9%) |
| Total | 1,685 (100.0%) | 854 (100.0%) |
Real Estate Taxes by Mortgage Status in Lauderdale by the Sea
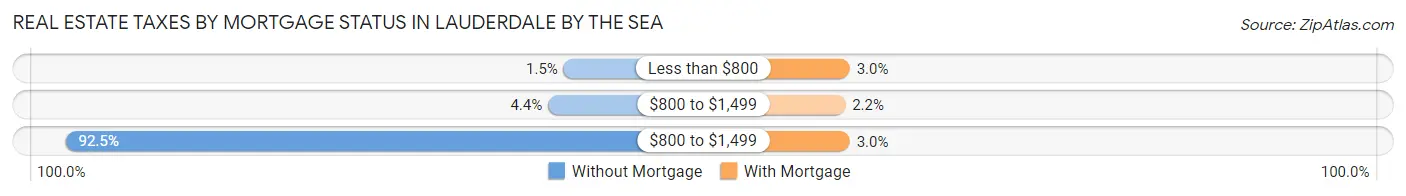
| Property Taxes | Without Mortgage | With Mortgage |
| Less than $800 | 26 (1.5%) | 26 (3.0%) |
| $800 to $1,499 | 74 (4.4%) | 19 (2.2%) |
| $800 to $1,499 | 1,559 (92.5%) | 26 (3.0%) |
| Total | 1,685 (100.0%) | 854 (100.0%) |
Health & Disability in Lauderdale by the Sea
Health Insurance Coverage by Age in Lauderdale by the Sea
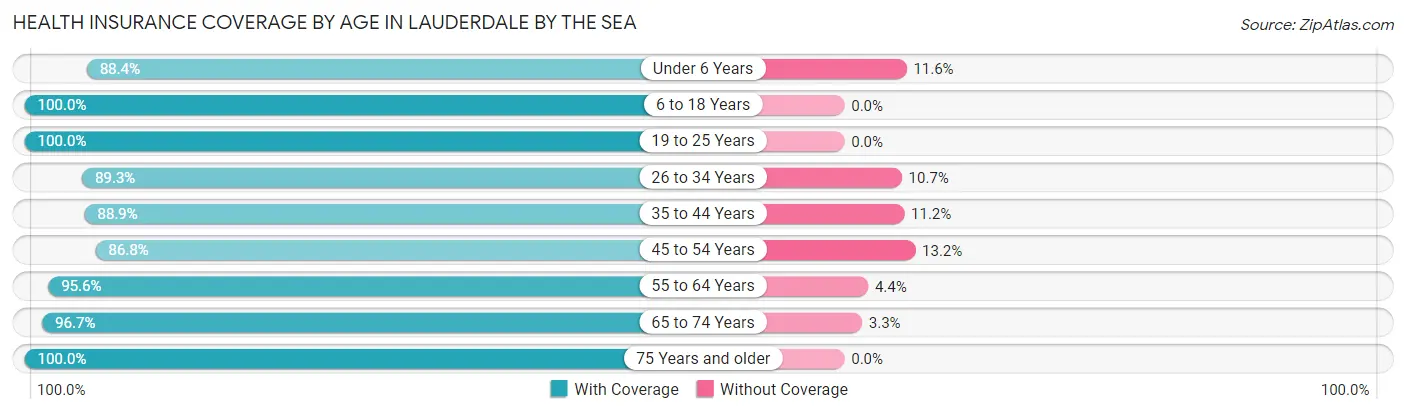
| Age Bracket | With Coverage | Without Coverage |
| Under 6 Years | 122 (88.4%) | 16 (11.6%) |
| 6 to 18 Years | 444 (100.0%) | 0 (0.0%) |
| 19 to 25 Years | 260 (100.0%) | 0 (0.0%) |
| 26 to 34 Years | 192 (89.3%) | 23 (10.7%) |
| 35 to 44 Years | 247 (88.8%) | 31 (11.2%) |
| 45 to 54 Years | 1,064 (86.8%) | 162 (13.2%) |
| 55 to 64 Years | 1,041 (95.6%) | 48 (4.4%) |
| 65 to 74 Years | 944 (96.7%) | 32 (3.3%) |
| 75 Years and older | 1,576 (100.0%) | 0 (0.0%) |
| Total | 5,890 (95.0%) | 312 (5.0%) |
Health Insurance Coverage by Citizenship Status in Lauderdale by the Sea

| Citizenship Status | With Coverage | Without Coverage |
| Native Born | 122 (88.4%) | 16 (11.6%) |
| Foreign Born, Citizen | 444 (100.0%) | 0 (0.0%) |
| Foreign Born, not a Citizen | 260 (100.0%) | 0 (0.0%) |
Health Insurance Coverage by Household Income in Lauderdale by the Sea
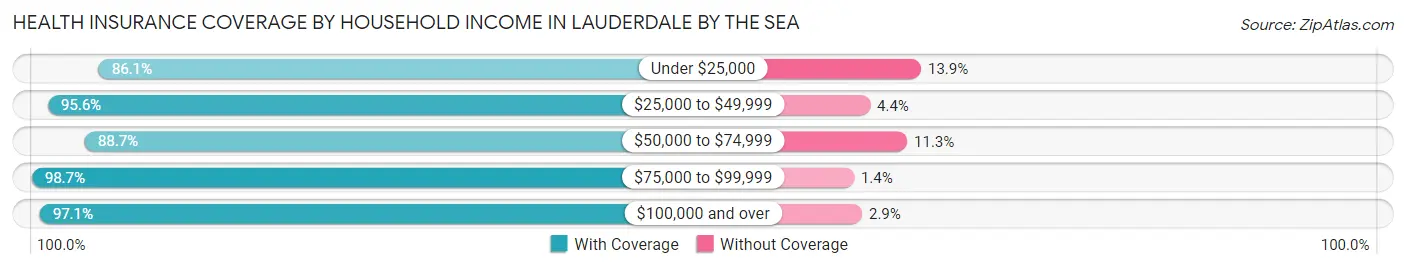
| Household Income | With Coverage | Without Coverage |
| Under $25,000 | 520 (86.1%) | 84 (13.9%) |
| $25,000 to $49,999 | 1,050 (95.6%) | 48 (4.4%) |
| $50,000 to $74,999 | 667 (88.7%) | 85 (11.3%) |
| $75,000 to $99,999 | 804 (98.7%) | 11 (1.3%) |
| $100,000 and over | 2,849 (97.1%) | 84 (2.9%) |
Public vs Private Health Insurance Coverage by Age in Lauderdale by the Sea
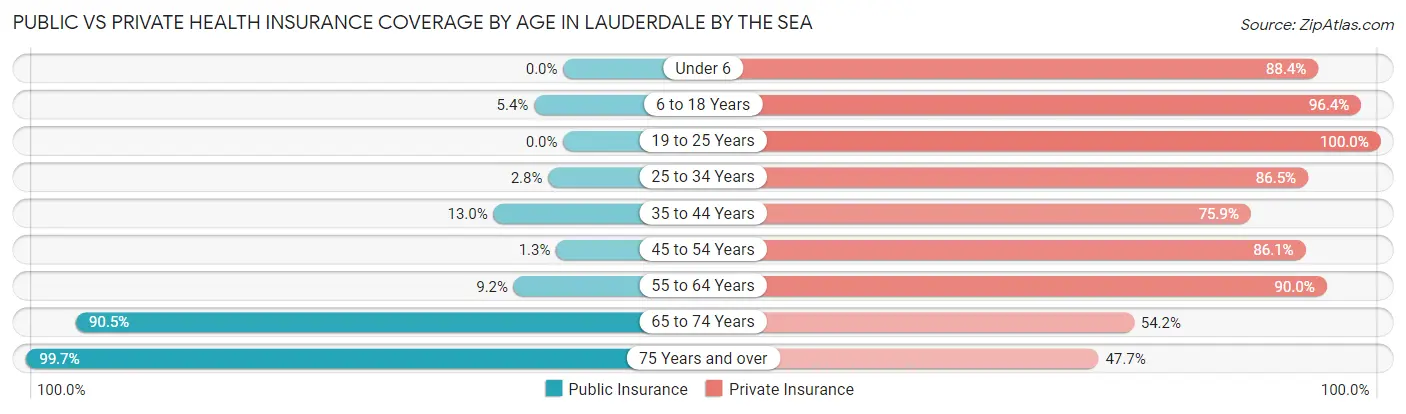
| Age Bracket | Public Insurance | Private Insurance |
| Under 6 | 0 (0.0%) | 122 (88.4%) |
| 6 to 18 Years | 24 (5.4%) | 428 (96.4%) |
| 19 to 25 Years | 0 (0.0%) | 260 (100.0%) |
| 25 to 34 Years | 6 (2.8%) | 186 (86.5%) |
| 35 to 44 Years | 36 (13.0%) | 211 (75.9%) |
| 45 to 54 Years | 16 (1.3%) | 1,055 (86.1%) |
| 55 to 64 Years | 100 (9.2%) | 980 (90.0%) |
| 65 to 74 Years | 883 (90.5%) | 529 (54.2%) |
| 75 Years and over | 1,571 (99.7%) | 751 (47.6%) |
| Total | 2,636 (42.5%) | 4,522 (72.9%) |
Disability Status by Sex by Age in Lauderdale by the Sea
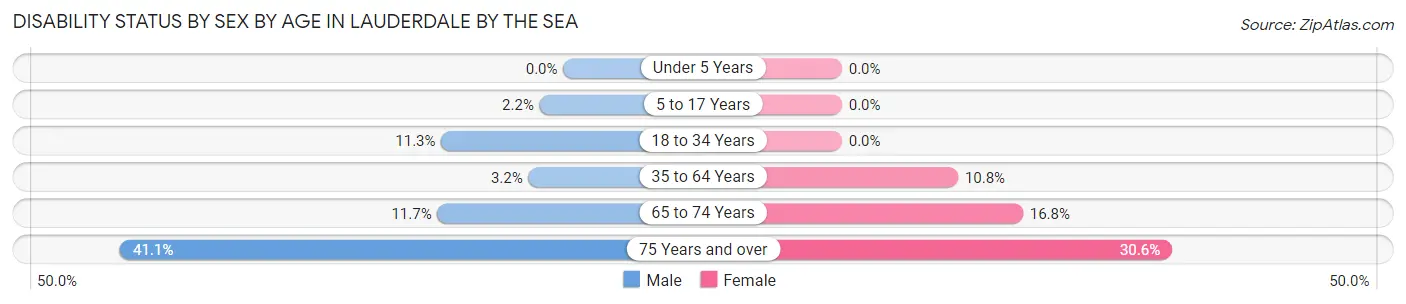
| Age Bracket | Male | Female |
| Under 5 Years | 0 (0.0%) | 0 (0.0%) |
| 5 to 17 Years | 3 (2.2%) | 0 (0.0%) |
| 18 to 34 Years | 12 (11.3%) | 0 (0.0%) |
| 35 to 64 Years | 40 (3.2%) | 146 (10.8%) |
| 65 to 74 Years | 57 (11.7%) | 82 (16.8%) |
| 75 Years and over | 267 (41.1%) | 284 (30.6%) |
Disability Class by Sex by Age in Lauderdale by the Sea
Disability Class: Hearing Difficulty
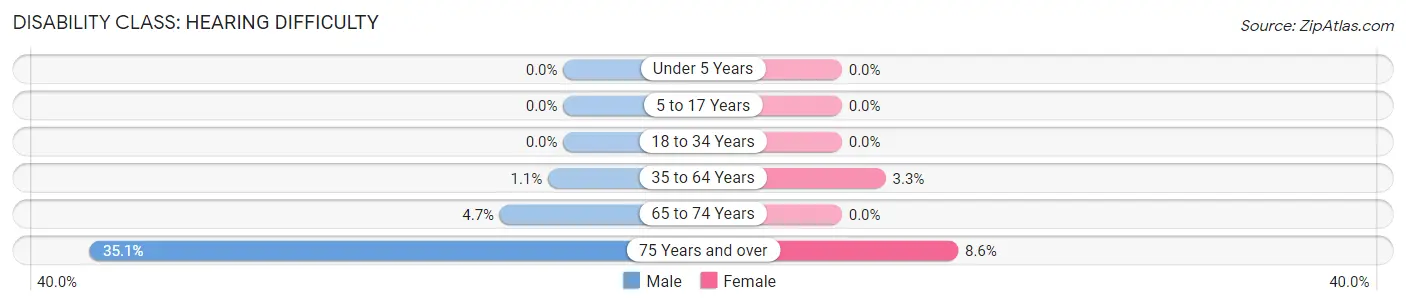
| Age Bracket | Male | Female |
| Under 5 Years | 0 (0.0%) | 0 (0.0%) |
| 5 to 17 Years | 0 (0.0%) | 0 (0.0%) |
| 18 to 34 Years | 0 (0.0%) | 0 (0.0%) |
| 35 to 64 Years | 14 (1.1%) | 44 (3.3%) |
| 65 to 74 Years | 23 (4.7%) | 0 (0.0%) |
| 75 Years and over | 228 (35.1%) | 80 (8.6%) |
Disability Class: Vision Difficulty
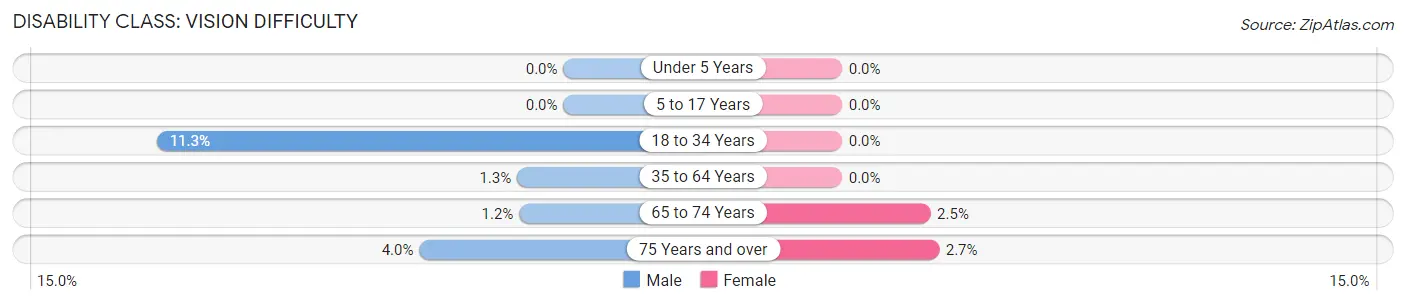
| Age Bracket | Male | Female |
| Under 5 Years | 0 (0.0%) | 0 (0.0%) |
| 5 to 17 Years | 0 (0.0%) | 0 (0.0%) |
| 18 to 34 Years | 12 (11.3%) | 0 (0.0%) |
| 35 to 64 Years | 16 (1.3%) | 0 (0.0%) |
| 65 to 74 Years | 6 (1.2%) | 12 (2.5%) |
| 75 Years and over | 26 (4.0%) | 25 (2.7%) |
Disability Class: Cognitive Difficulty
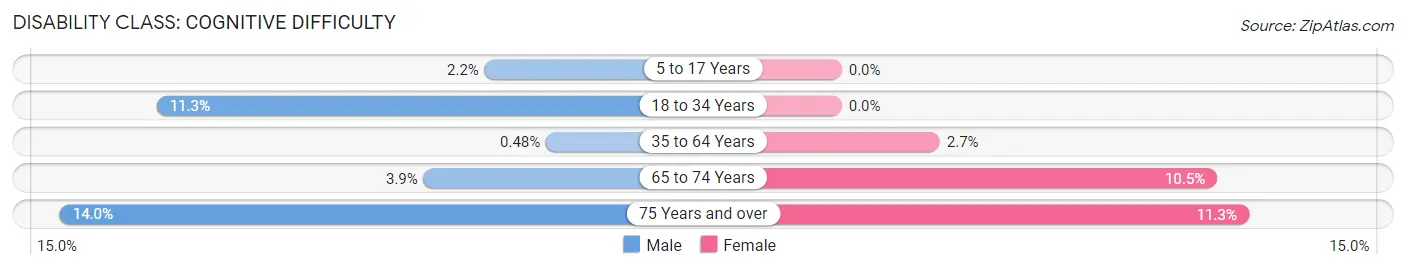
| Age Bracket | Male | Female |
| 5 to 17 Years | 3 (2.2%) | 0 (0.0%) |
| 18 to 34 Years | 12 (11.3%) | 0 (0.0%) |
| 35 to 64 Years | 6 (0.5%) | 37 (2.7%) |
| 65 to 74 Years | 19 (3.9%) | 51 (10.4%) |
| 75 Years and over | 91 (14.0%) | 105 (11.3%) |
Disability Class: Ambulatory Difficulty
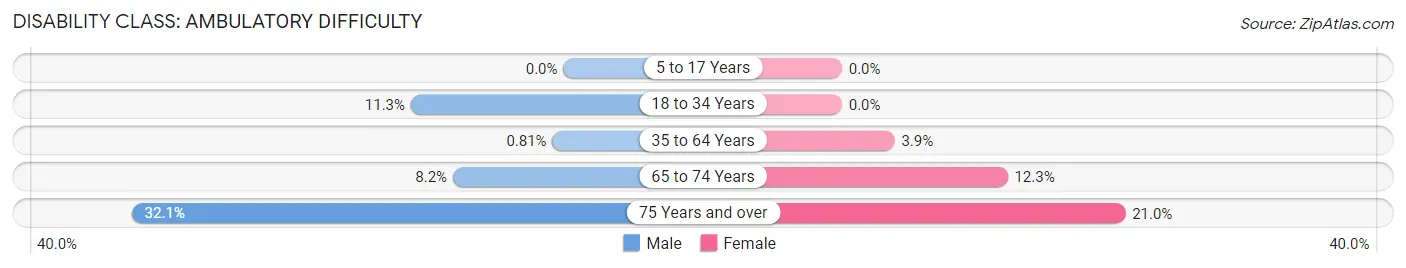
| Age Bracket | Male | Female |
| 5 to 17 Years | 0 (0.0%) | 0 (0.0%) |
| 18 to 34 Years | 12 (11.3%) | 0 (0.0%) |
| 35 to 64 Years | 10 (0.8%) | 53 (3.9%) |
| 65 to 74 Years | 40 (8.2%) | 60 (12.3%) |
| 75 Years and over | 208 (32.1%) | 195 (21.0%) |
Disability Class: Self-Care Difficulty
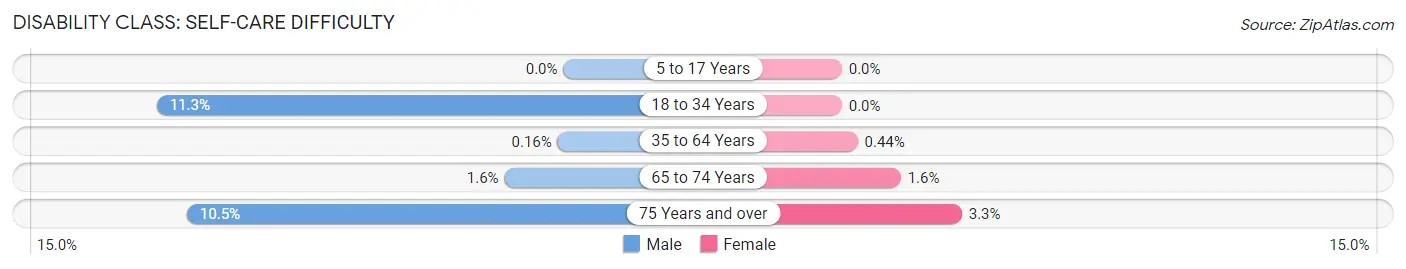
| Age Bracket | Male | Female |
| 5 to 17 Years | 0 (0.0%) | 0 (0.0%) |
| 18 to 34 Years | 12 (11.3%) | 0 (0.0%) |
| 35 to 64 Years | 2 (0.2%) | 6 (0.4%) |
| 65 to 74 Years | 8 (1.6%) | 8 (1.6%) |
| 75 Years and over | 68 (10.5%) | 31 (3.3%) |
Technology Access in Lauderdale by the Sea
Computing Device Access in Lauderdale by the Sea
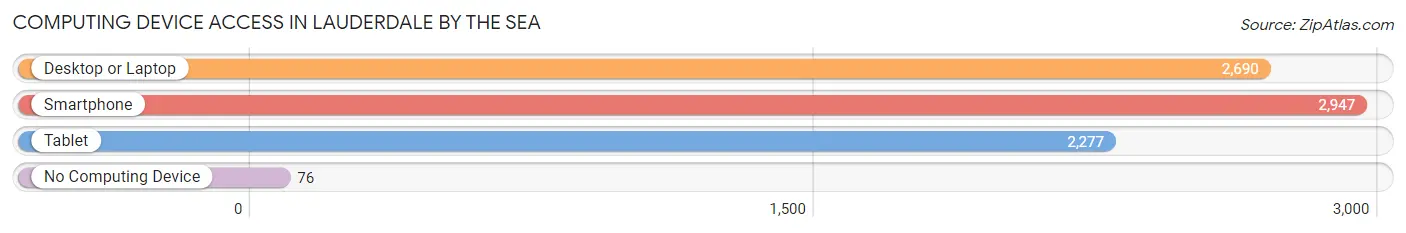
| Device Type | # Households | % Households |
| Desktop or Laptop | 2,690 | 83.0% |
| Smartphone | 2,947 | 90.9% |
| Tablet | 2,277 | 70.2% |
| No Computing Device | 76 | 2.3% |
| Total | 3,243 | 100.0% |
Internet Access in Lauderdale by the Sea
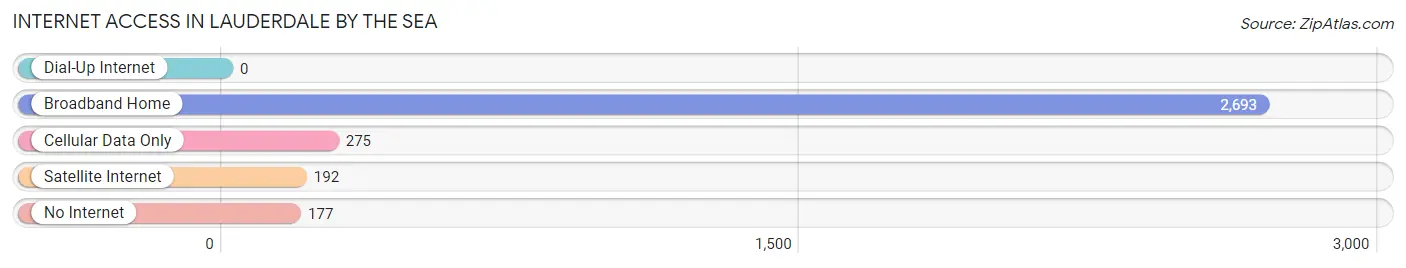
| Internet Type | # Households | % Households |
| Dial-Up Internet | 0 | 0.0% |
| Broadband Home | 2,693 | 83.0% |
| Cellular Data Only | 275 | 8.5% |
| Satellite Internet | 192 | 5.9% |
| No Internet | 177 | 5.5% |
| Total | 3,243 | 100.0% |
Lauderdale by the Sea Summary
Lauderdale by the Sea is a town located in Broward County, Florida, United States. It is situated on the Atlantic Ocean, just north of Fort Lauderdale. The town was incorporated in 1925 and has a population of 6,056 as of the 2010 census.
History
The area that is now Lauderdale by the Sea was originally inhabited by the Tequesta Indians. The first non-native settlers arrived in the area in the late 19th century. The town was originally known as El Mar and was renamed Lauderdale by the Sea in 1925. The town was incorporated in 1925 and was primarily a fishing village.
In the 1950s, the town began to develop as a tourist destination. The town was known for its beaches and fishing. In the 1960s, the town began to develop more as a residential community. The town was also known for its nightlife and was a popular destination for college students.
In the 1970s, the town began to experience a decline in tourism and the economy. The town was hit hard by the recession of the 1980s and many businesses closed. In the 1990s, the town began to experience a resurgence in tourism and the economy. The town has since become a popular destination for tourists and retirees.
Geography
Lauderdale by the Sea is located in Broward County, Florida, United States. It is situated on the Atlantic Ocean, just north of Fort Lauderdale. The town has a total area of 1.3 square miles, all of which is land. The town is bordered by the cities of Pompano Beach to the north, Fort Lauderdale to the south, and Oakland Park to the west.
The town is located on the barrier island of Lauderdale by the Sea. The town is known for its beaches and is a popular destination for swimming, snorkeling, and fishing. The town is also home to several parks, including Anglin’s Pier, El Prado Park, and Sea Ranch Lakes Park.
Economy
The economy of Lauderdale by the Sea is primarily driven by tourism. The town is a popular destination for tourists and retirees. The town is also home to several businesses, including restaurants, hotels, and retail stores. The town is also home to several marinas, which provide services to boaters.
The town is also home to several government offices, including the Broward County Sheriff’s Office, the Broward County Fire Rescue, and the Broward County Public Schools.
Demographics
As of the 2010 census, the population of Lauderdale by the Sea was 6,056. The population is primarily white (90.2%) and Hispanic (7.2%). The median age is 57.7 years and the median household income is $50,945.
The town is home to several religious organizations, including the Church of Jesus Christ of Latter-day Saints, the Episcopal Church, and the United Methodist Church.
Conclusion
Lauderdale by the Sea is a town located in Broward County, Florida, United States. It is situated on the Atlantic Ocean, just north of Fort Lauderdale. The town was incorporated in 1925 and has a population of 6,056 as of the 2010 census. The town is known for its beaches and is a popular destination for tourists and retirees. The economy of the town is primarily driven by tourism and the town is home to several businesses, government offices, and religious organizations.
Common Questions
What is Per Capita Income in Lauderdale by the Sea?
Per Capita income in Lauderdale by the Sea is $67,569.
What is the Median Family Income in Lauderdale by the Sea?
Median Family Income in Lauderdale by the Sea is $104,193.
What is the Median Household income in Lauderdale by the Sea?
Median Household Income in Lauderdale by the Sea is $76,855.
What is Income or Wage Gap in Lauderdale by the Sea?
Income or Wage Gap in Lauderdale by the Sea is 45.3%.
Women in Lauderdale by the Sea earn 54.7 cents for every dollar earned by a man.
What is Inequality or Gini Index in Lauderdale by the Sea?
Inequality or Gini Index in Lauderdale by the Sea is 0.54.
What is the Total Population of Lauderdale by the Sea?
Total Population of Lauderdale by the Sea is 6,202.
What is the Total Male Population of Lauderdale by the Sea?
Total Male Population of Lauderdale by the Sea is 2,635.
What is the Total Female Population of Lauderdale by the Sea?
Total Female Population of Lauderdale by the Sea is 3,567.
What is the Ratio of Males per 100 Females in Lauderdale by the Sea?
There are 73.87 Males per 100 Females in Lauderdale by the Sea.
What is the Ratio of Females per 100 Males in Lauderdale by the Sea?
There are 135.37 Females per 100 Males in Lauderdale by the Sea.
What is the Median Population Age in Lauderdale by the Sea?
Median Population Age in Lauderdale by the Sea is 60.0 Years.
What is the Average Family Size in Lauderdale by the Sea
Average Family Size in Lauderdale by the Sea is 2.6 People.
What is the Average Household Size in Lauderdale by the Sea
Average Household Size in Lauderdale by the Sea is 1.9 People.
How Large is the Labor Force in Lauderdale by the Sea?
There are 2,673 People in the Labor Forcein in Lauderdale by the Sea.
What is the Percentage of People in the Labor Force in Lauderdale by the Sea?
46.5% of People are in the Labor Force in Lauderdale by the Sea.
What is the Unemployment Rate in Lauderdale by the Sea?
Unemployment Rate in Lauderdale by the Sea is 3.0%.