South Miami, FL Map & Demographics
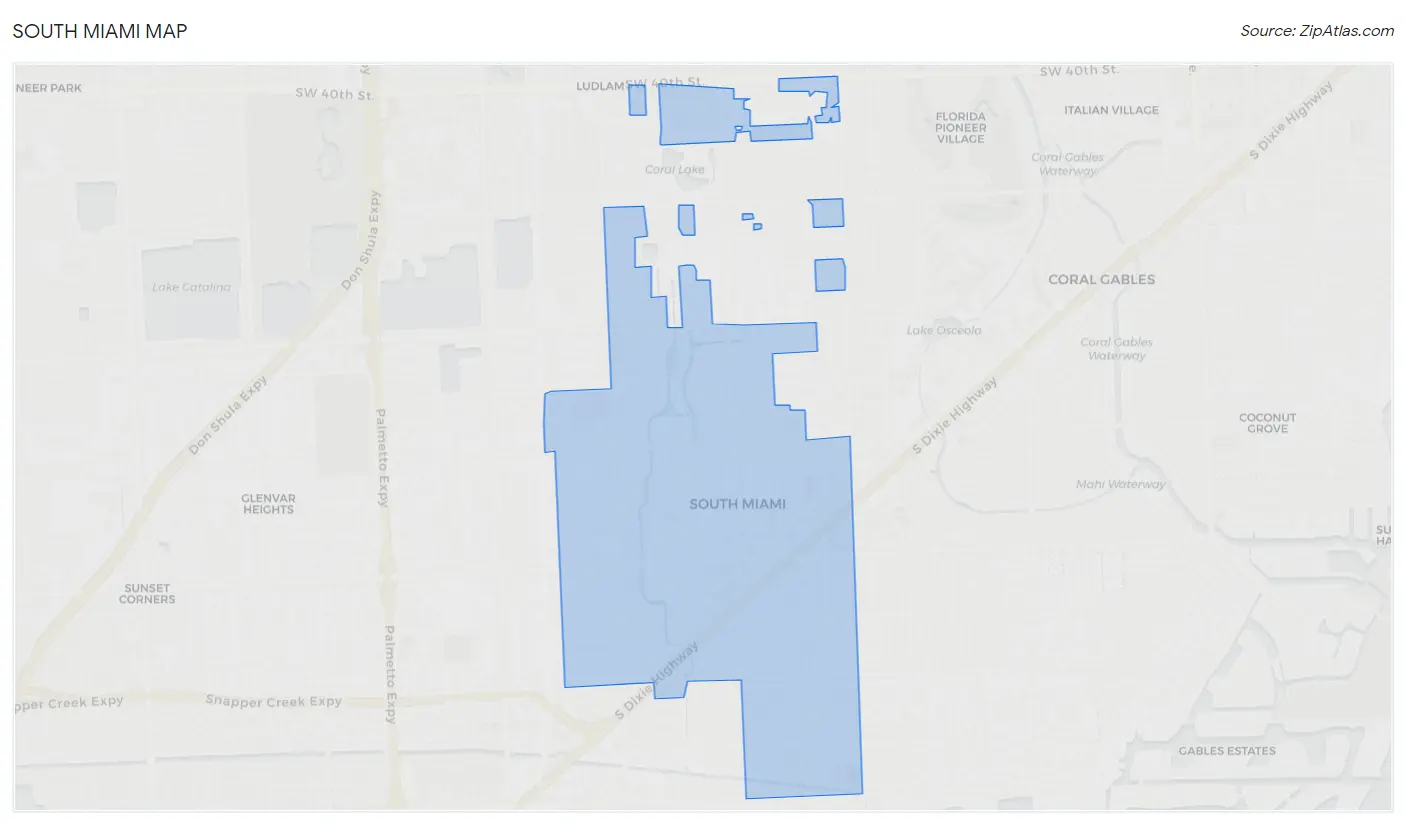
South Miami Map
South Miami Overview
$54,310
PER CAPITA INCOME
$99,719
AVG FAMILY INCOME
$78,830
AVG HOUSEHOLD INCOME
1.7%
WAGE / INCOME GAP [ % ]
98.3¢/ $1
WAGE / INCOME GAP [ $ ]
0.56
INEQUALITY / GINI INDEX
11,944
TOTAL POPULATION
5,883
MALE POPULATION
6,061
FEMALE POPULATION
97.06
MALES / 100 FEMALES
103.03
FEMALES / 100 MALES
39.6
MEDIAN AGE
3.3
AVG FAMILY SIZE
2.5
AVG HOUSEHOLD SIZE
6,527
LABOR FORCE [ PEOPLE ]
66.1%
PERCENT IN LABOR FORCE
3.9%
UNEMPLOYMENT RATE
Income in South Miami
Income Overview in South Miami
Per Capita Income in South Miami is $54,310, while median incomes of families and households are $99,719 and $78,830 respectively.
| Characteristic | Number | Measure |
| Per Capita Income | 11,944 | $54,310 |
| Median Family Income | 2,648 | $99,719 |
| Mean Family Income | 2,648 | $177,719 |
| Median Household Income | 4,736 | $78,830 |
| Mean Household Income | 4,736 | $135,119 |
| Income Deficit | 2,648 | $0 |
| Wage / Income Gap (%) | 11,944 | 1.73% |
| Wage / Income Gap ($) | 11,944 | 98.27¢ per $1 |
| Gini / Inequality Index | 11,944 | 0.56 |
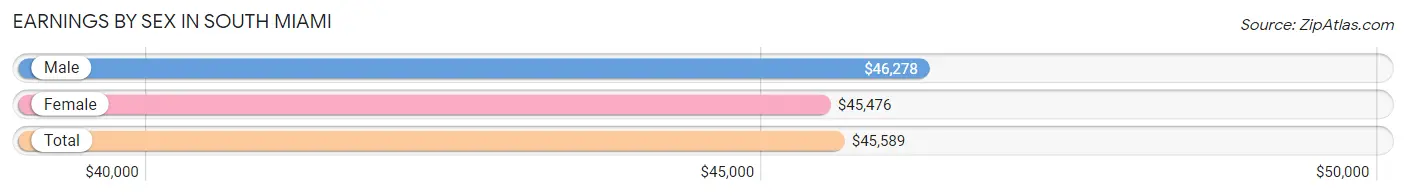
Earnings by Sex in South Miami
Average Earnings in South Miami are $45,589, $46,278 for men and $45,476 for women, a difference of 1.7%.
| Sex | Number | Average Earnings |
| Male | 3,631 (54.6%) | $46,278 |
| Female | 3,024 (45.4%) | $45,476 |
| Total | 6,655 (100.0%) | $45,589 |
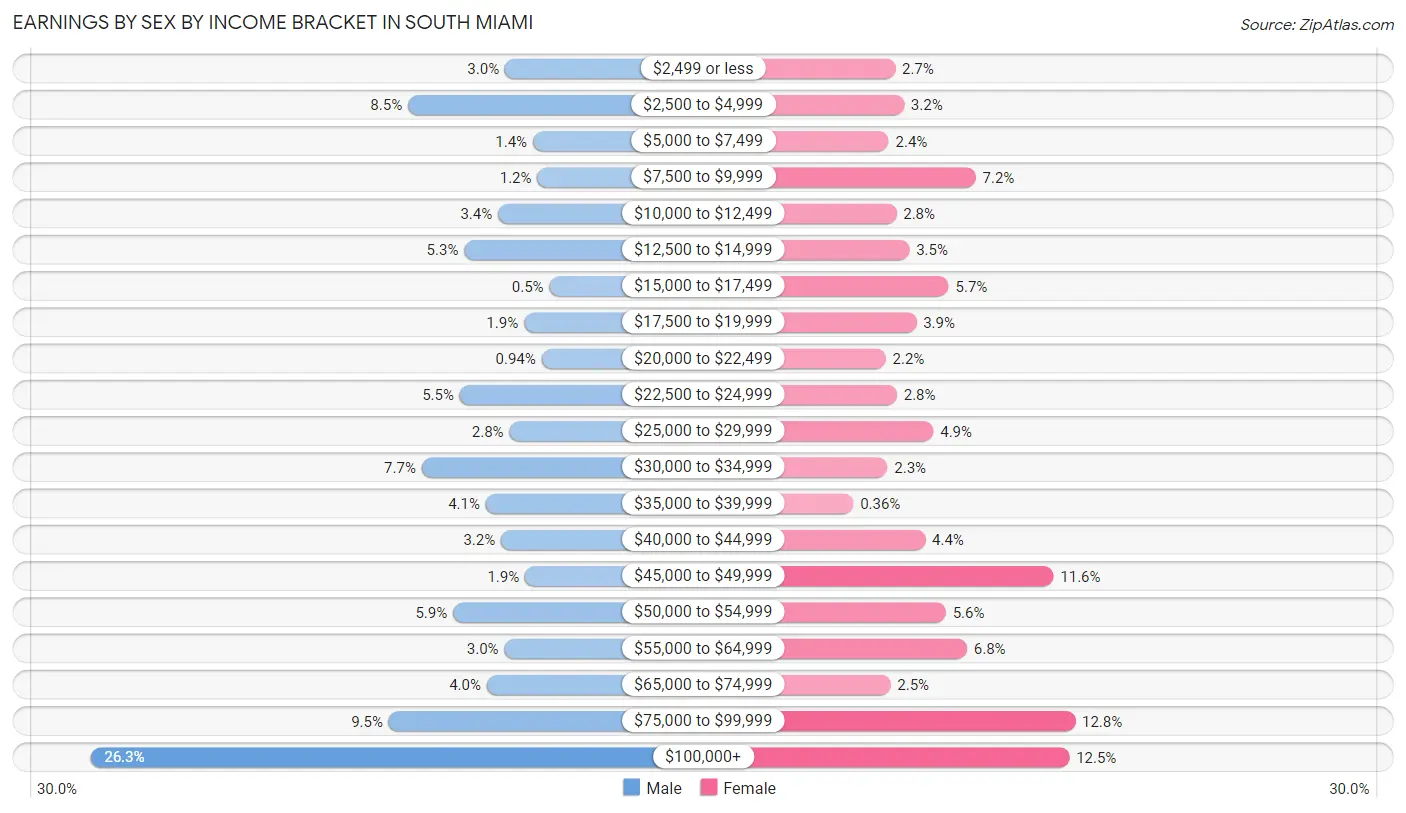
Earnings by Sex by Income Bracket in South Miami
The most common earnings brackets in South Miami are $100,000+ for men (953 | 26.3%) and $75,000 to $99,999 for women (388 | 12.8%).
| Income | Male | Female |
| $2,499 or less | 109 (3.0%) | 82 (2.7%) |
| $2,500 to $4,999 | 307 (8.5%) | 97 (3.2%) |
| $5,000 to $7,499 | 52 (1.4%) | 71 (2.4%) |
| $7,500 to $9,999 | 43 (1.2%) | 219 (7.2%) |
| $10,000 to $12,499 | 123 (3.4%) | 84 (2.8%) |
| $12,500 to $14,999 | 192 (5.3%) | 106 (3.5%) |
| $15,000 to $17,499 | 18 (0.5%) | 173 (5.7%) |
| $17,500 to $19,999 | 70 (1.9%) | 118 (3.9%) |
| $20,000 to $22,499 | 34 (0.9%) | 66 (2.2%) |
| $22,500 to $24,999 | 201 (5.5%) | 85 (2.8%) |
| $25,000 to $29,999 | 100 (2.8%) | 147 (4.9%) |
| $30,000 to $34,999 | 279 (7.7%) | 69 (2.3%) |
| $35,000 to $39,999 | 148 (4.1%) | 11 (0.4%) |
| $40,000 to $44,999 | 117 (3.2%) | 133 (4.4%) |
| $45,000 to $49,999 | 68 (1.9%) | 351 (11.6%) |
| $50,000 to $54,999 | 215 (5.9%) | 168 (5.6%) |
| $55,000 to $64,999 | 110 (3.0%) | 204 (6.8%) |
| $65,000 to $74,999 | 146 (4.0%) | 74 (2.5%) |
| $75,000 to $99,999 | 346 (9.5%) | 388 (12.8%) |
| $100,000+ | 953 (26.3%) | 378 (12.5%) |
| Total | 3,631 (100.0%) | 3,024 (100.0%) |
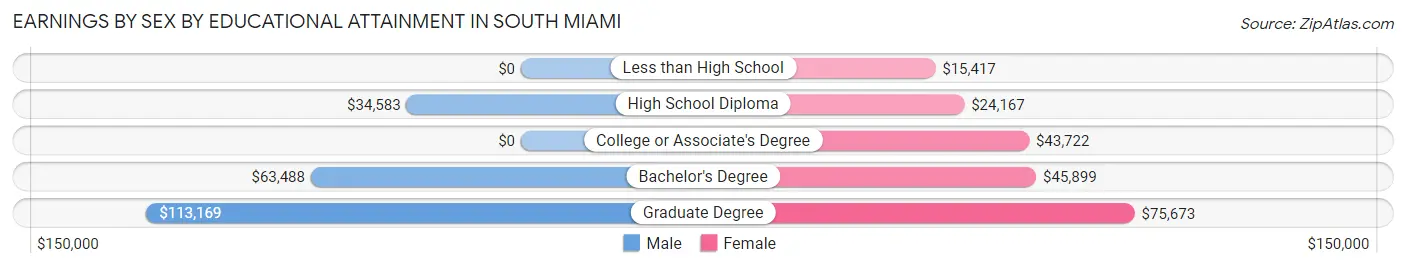
Earnings by Sex by Educational Attainment in South Miami
Average earnings in South Miami are $51,410 for men and $47,094 for women, a difference of 8.4%. Men with an educational attainment of graduate degree enjoy the highest average annual earnings of $113,169, while those with high school diploma education earn the least with $34,583. Women with an educational attainment of graduate degree earn the most with the average annual earnings of $75,673, while those with less than high school education have the smallest earnings of $15,417.
| Educational Attainment | Male Income | Female Income |
| Less than High School | - | - |
| High School Diploma | $34,583 | $24,167 |
| College or Associate's Degree | - | - |
| Bachelor's Degree | $63,488 | $45,899 |
| Graduate Degree | $113,169 | $75,673 |
| Total | $51,410 | $47,094 |
Family Income in South Miami
Family Income Brackets in South Miami
According to the South Miami family income data, there are 786 families falling into the $200,000+ income range, which is the most common income bracket and makes up 29.7% of all families. Conversely, the less than $10,000 income bracket is the least frequent group with only 24 families (0.9%) belonging to this category.
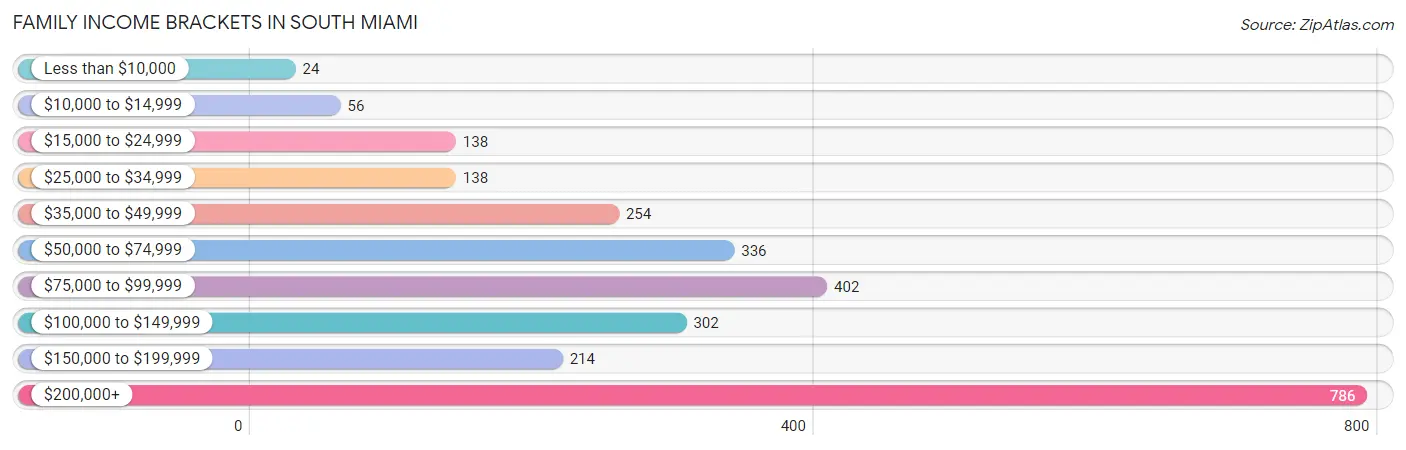
| Income Bracket | # Families | % Families |
| Less than $10,000 | 24 | 0.9% |
| $10,000 to $14,999 | 56 | 2.1% |
| $15,000 to $24,999 | 138 | 5.2% |
| $25,000 to $34,999 | 138 | 5.2% |
| $35,000 to $49,999 | 254 | 9.6% |
| $50,000 to $74,999 | 336 | 12.7% |
| $75,000 to $99,999 | 402 | 15.2% |
| $100,000 to $149,999 | 302 | 11.4% |
| $150,000 to $199,999 | 214 | 8.1% |
| $200,000+ | 786 | 29.7% |
Family Income by Famaliy Size in South Miami
3-person families (476 | 18.0%) account for the highest median family income in South Miami with $182,500 per family, while 3-person families (476 | 18.0%) have the highest median income of $60,833 per family member.
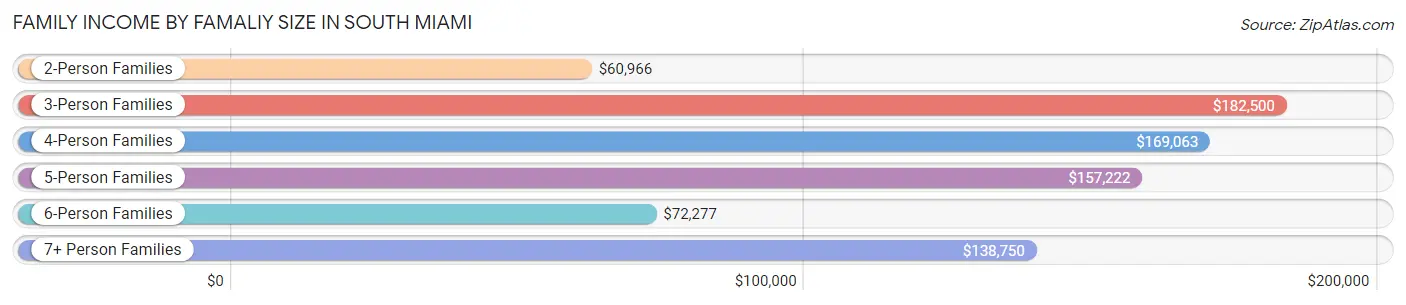
| Income Bracket | # Families | Median Income |
| 2-Person Families | 1,154 (43.6%) | $60,966 |
| 3-Person Families | 476 (18.0%) | $182,500 |
| 4-Person Families | 804 (30.4%) | $169,063 |
| 5-Person Families | 136 (5.1%) | $157,222 |
| 6-Person Families | 51 (1.9%) | $72,277 |
| 7+ Person Families | 27 (1.0%) | $138,750 |
| Total | 2,648 (100.0%) | $99,719 |
Family Income by Number of Earners in South Miami
The median family income in South Miami is $99,719, with families comprising 2 earners (1,102) having the highest median family income of $153,125, while families with no earners (348) have the lowest median family income of $42,533, accounting for 41.6% and 13.1% of families, respectively.
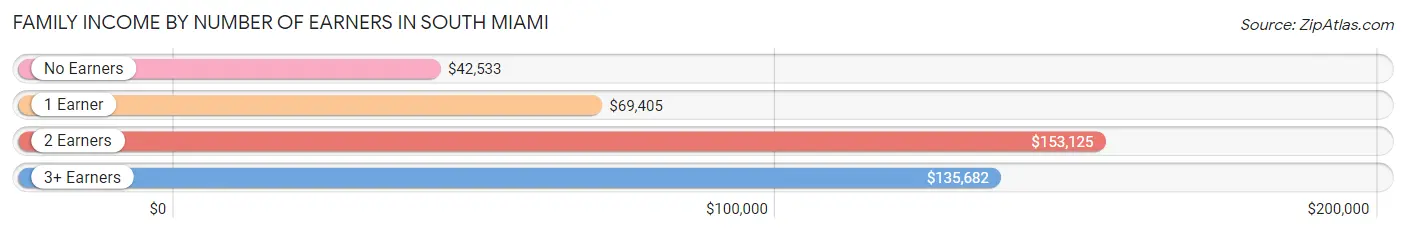
| Number of Earners | # Families | Median Income |
| No Earners | 348 (13.1%) | $42,533 |
| 1 Earner | 752 (28.4%) | $69,405 |
| 2 Earners | 1,102 (41.6%) | $153,125 |
| 3+ Earners | 446 (16.8%) | $135,682 |
| Total | 2,648 (100.0%) | $99,719 |
Household Income in South Miami
Household Income Brackets in South Miami
With 1,099 households falling in the category, the $200,000+ income range is the most frequent in South Miami, accounting for 23.2% of all households. In contrast, only 213 households (4.5%) fall into the $10,000 to $14,999 income bracket, making it the least populous group.
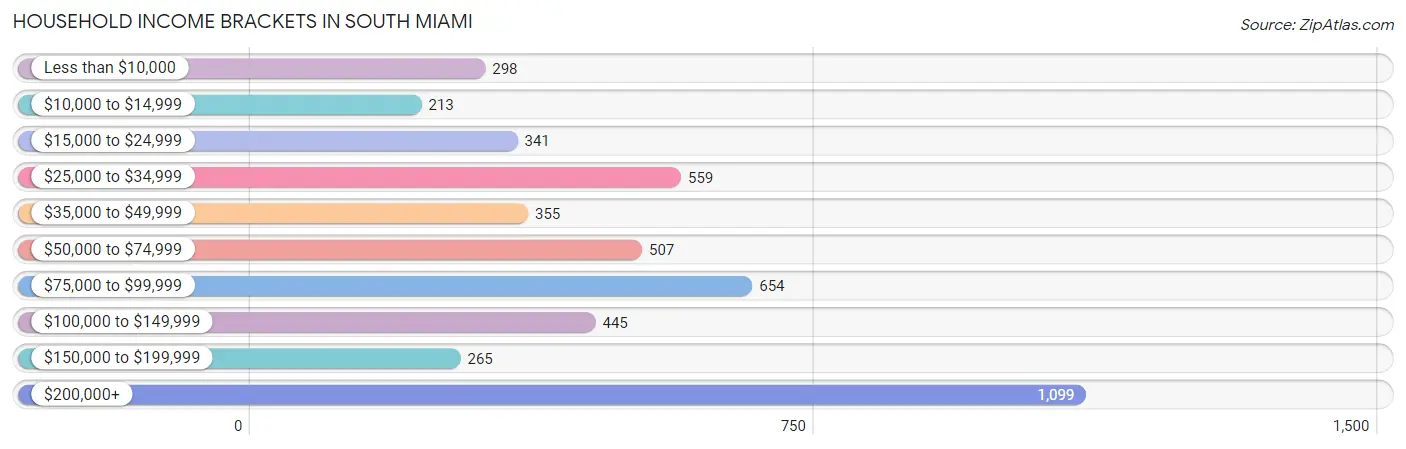
| Income Bracket | # Households | % Households |
| Less than $10,000 | 298 | 6.3% |
| $10,000 to $14,999 | 213 | 4.5% |
| $15,000 to $24,999 | 341 | 7.2% |
| $25,000 to $34,999 | 559 | 11.8% |
| $35,000 to $49,999 | 355 | 7.5% |
| $50,000 to $74,999 | 507 | 10.7% |
| $75,000 to $99,999 | 654 | 13.8% |
| $100,000 to $149,999 | 445 | 9.4% |
| $150,000 to $199,999 | 265 | 5.6% |
| $200,000+ | 1,099 | 23.2% |
Household Income by Householder Age in South Miami
The median household income in South Miami is $78,830, with the highest median household income of $110,032 found in the 45 to 64 years age bracket for the primary householder. A total of 1,819 households (38.4%) fall into this category. Meanwhile, the 15 to 24 years age bracket for the primary householder has the lowest median household income of $20,762, with 449 households (9.5%) in this group.
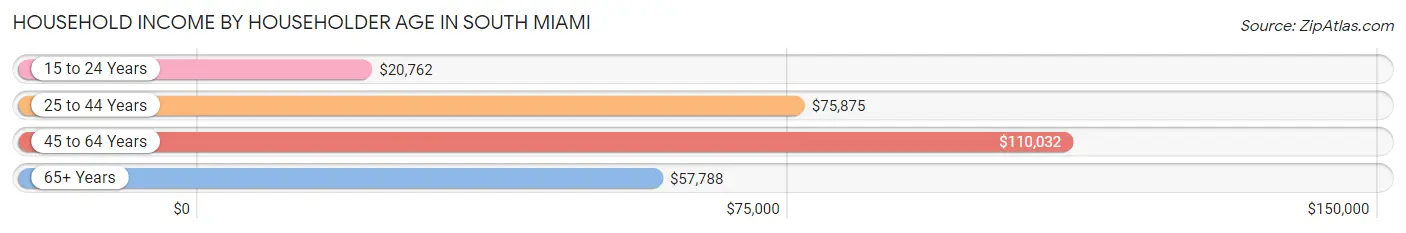
| Income Bracket | # Households | Median Income |
| 15 to 24 Years | 449 (9.5%) | $20,762 |
| 25 to 44 Years | 1,316 (27.8%) | $75,875 |
| 45 to 64 Years | 1,819 (38.4%) | $110,032 |
| 65+ Years | 1,152 (24.3%) | $57,788 |
| Total | 4,736 (100.0%) | $78,830 |
Poverty in South Miami
Income Below Poverty by Sex and Age in South Miami
With 11.8% poverty level for males and 14.8% for females among the residents of South Miami, 18 to 24 year old males and 18 to 24 year old females are the most vulnerable to poverty, with 216 males (36.9%) and 278 females (39.0%) in their respective age groups living below the poverty level.
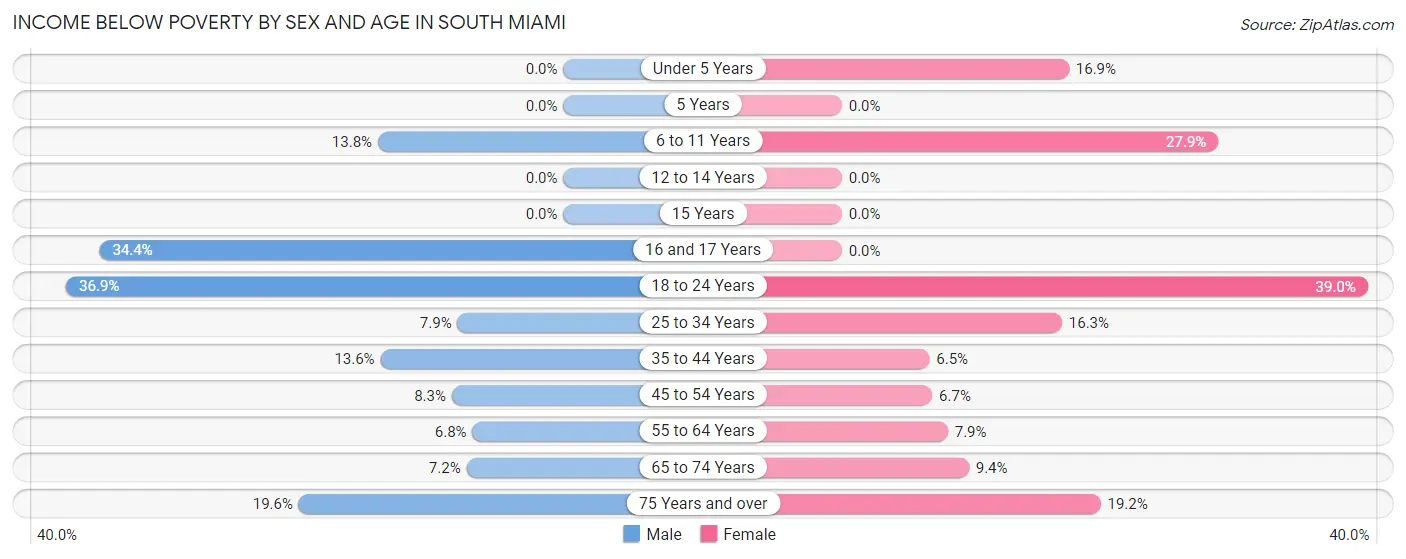
| Age Bracket | Male | Female |
| Under 5 Years | 0 (0.0%) | 44 (16.9%) |
| 5 Years | 0 (0.0%) | 0 (0.0%) |
| 6 to 11 Years | 65 (13.8%) | 121 (27.9%) |
| 12 to 14 Years | 0 (0.0%) | 0 (0.0%) |
| 15 Years | 0 (0.0%) | 0 (0.0%) |
| 16 and 17 Years | 31 (34.4%) | 0 (0.0%) |
| 18 to 24 Years | 216 (36.9%) | 278 (39.0%) |
| 25 to 34 Years | 84 (7.9%) | 133 (16.3%) |
| 35 to 44 Years | 108 (13.6%) | 41 (6.5%) |
| 45 to 54 Years | 42 (8.3%) | 52 (6.7%) |
| 55 to 64 Years | 64 (6.8%) | 72 (7.9%) |
| 65 to 74 Years | 35 (7.2%) | 82 (9.4%) |
| 75 Years and over | 44 (19.6%) | 68 (19.2%) |
| Total | 689 (11.8%) | 891 (14.8%) |
Income Above Poverty by Sex and Age in South Miami
According to the poverty statistics in South Miami, males aged under 5 years and females aged 5 years are the age groups that are most secure financially, with 100.0% of males and 100.0% of females in these age groups living above the poverty line.
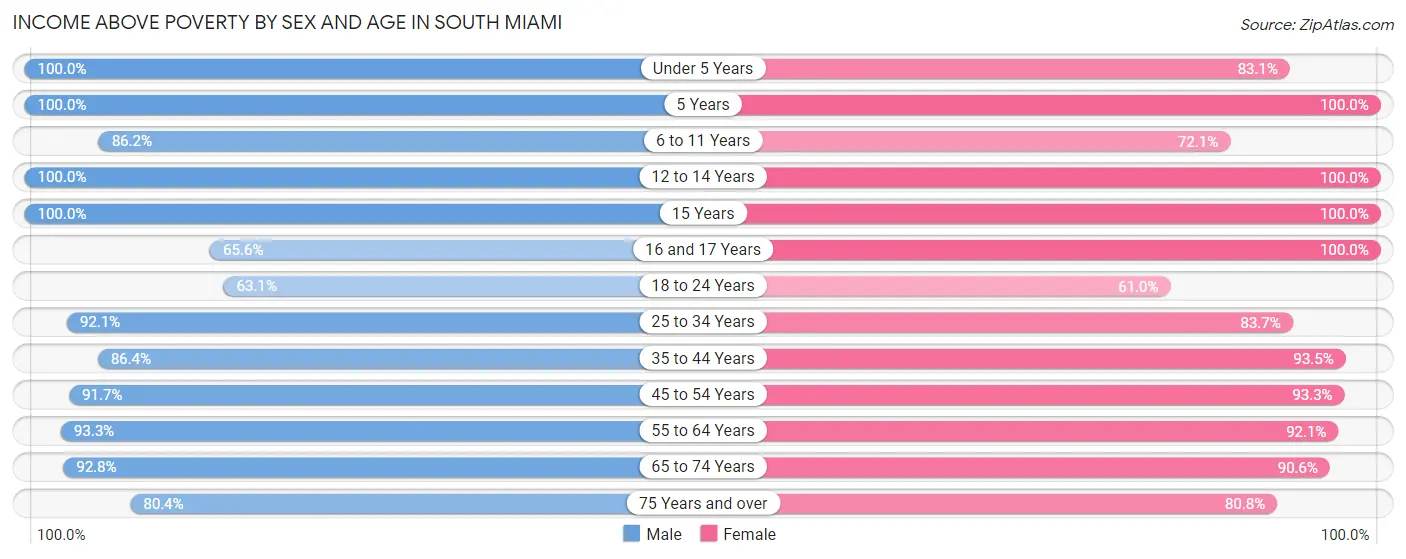
| Age Bracket | Male | Female |
| Under 5 Years | 545 (100.0%) | 217 (83.1%) |
| 5 Years | 16 (100.0%) | 19 (100.0%) |
| 6 to 11 Years | 407 (86.2%) | 312 (72.1%) |
| 12 to 14 Years | 67 (100.0%) | 197 (100.0%) |
| 15 Years | 43 (100.0%) | 17 (100.0%) |
| 16 and 17 Years | 59 (65.6%) | 21 (100.0%) |
| 18 to 24 Years | 369 (63.1%) | 434 (61.0%) |
| 25 to 34 Years | 985 (92.1%) | 681 (83.7%) |
| 35 to 44 Years | 687 (86.4%) | 590 (93.5%) |
| 45 to 54 Years | 465 (91.7%) | 723 (93.3%) |
| 55 to 64 Years | 884 (93.2%) | 843 (92.1%) |
| 65 to 74 Years | 452 (92.8%) | 788 (90.6%) |
| 75 Years and over | 180 (80.4%) | 286 (80.8%) |
| Total | 5,159 (88.2%) | 5,128 (85.2%) |
Income Below Poverty Among Married-Couple Families in South Miami
The poverty statistics for married-couple families in South Miami show that 7.8% or 159 of the total 2,042 families live below the poverty line. Families with 3 or 4 children have the highest poverty rate of 33.0%, comprising of 30 families. On the other hand, families with 5 or more children have the lowest poverty rate of 0.0%, which includes 0 families.
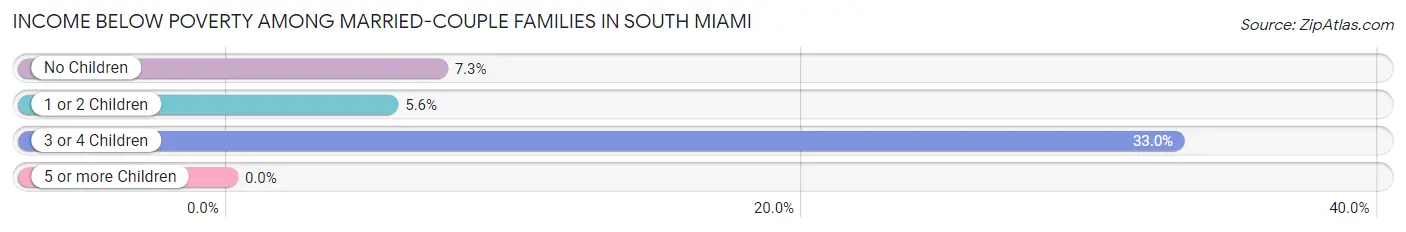
| Children | Above Poverty | Below Poverty |
| No Children | 1,117 (92.7%) | 88 (7.3%) |
| 1 or 2 Children | 694 (94.4%) | 41 (5.6%) |
| 3 or 4 Children | 61 (67.0%) | 30 (33.0%) |
| 5 or more Children | 11 (100.0%) | 0 (0.0%) |
| Total | 1,883 (92.2%) | 159 (7.8%) |
Income Below Poverty Among Single-Parent Households in South Miami
According to the poverty data in South Miami, 33.6% or 39 single-father households and 6.3% or 31 single-mother households are living below the poverty line. Among single-father households, those with 1 or 2 children have the highest poverty rate, with 39 households (62.9%) experiencing poverty. Likewise, among single-mother households, those with 1 or 2 children have the highest poverty rate, with 31 households (14.5%) falling below the poverty line.
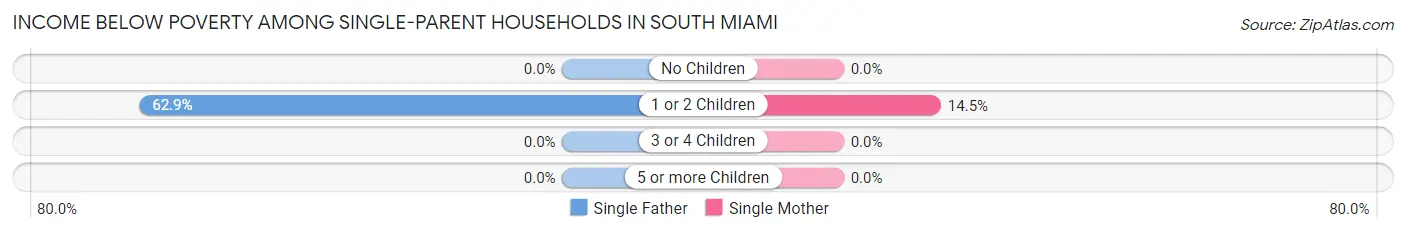
| Children | Single Father | Single Mother |
| No Children | 0 (0.0%) | 0 (0.0%) |
| 1 or 2 Children | 39 (62.9%) | 31 (14.5%) |
| 3 or 4 Children | 0 (0.0%) | 0 (0.0%) |
| 5 or more Children | 0 (0.0%) | 0 (0.0%) |
| Total | 39 (33.6%) | 31 (6.3%) |
Income Below Poverty Among Married-Couple vs Single-Parent Households in South Miami
The poverty data for South Miami shows that 159 of the married-couple family households (7.8%) and 70 of the single-parent households (11.6%) are living below the poverty level. Within the married-couple family households, those with 3 or 4 children have the highest poverty rate, with 30 households (33.0%) falling below the poverty line. Among the single-parent households, those with 1 or 2 children have the highest poverty rate, with 70 household (25.4%) living below poverty.
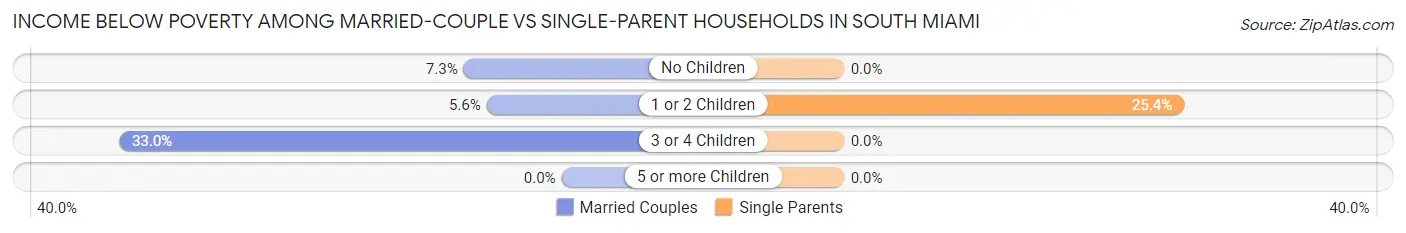
| Children | Married-Couple Families | Single-Parent Households |
| No Children | 88 (7.3%) | 0 (0.0%) |
| 1 or 2 Children | 41 (5.6%) | 70 (25.4%) |
| 3 or 4 Children | 30 (33.0%) | 0 (0.0%) |
| 5 or more Children | 0 (0.0%) | 0 (0.0%) |
| Total | 159 (7.8%) | 70 (11.6%) |
Race in South Miami
The most populous races in South Miami are Hispanic or Latino (6,611 | 55.3%), White / Caucasian (6,175 | 51.7%), and Two or more Races (3,868 | 32.4%).
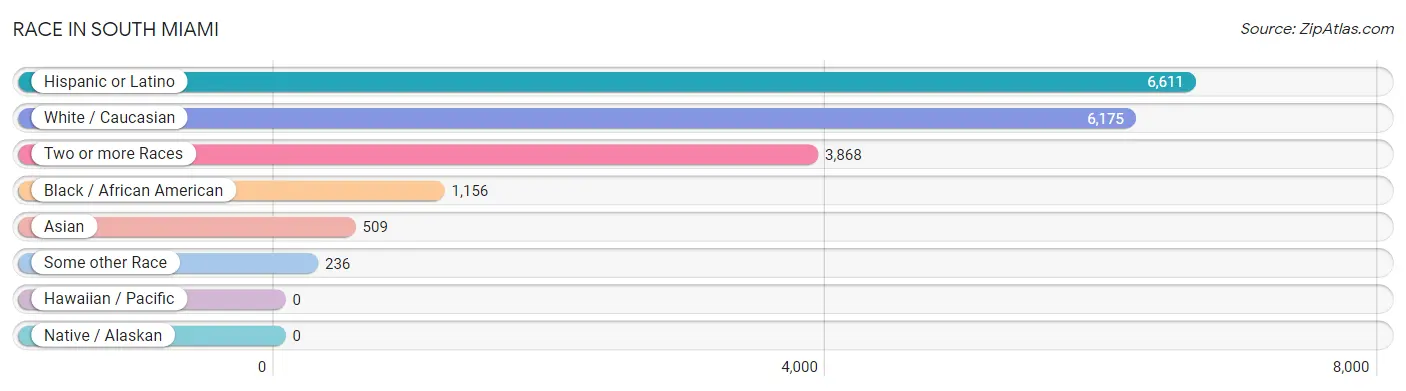
| Race | # Population | % Population |
| Asian | 509 | 4.3% |
| Black / African American | 1,156 | 9.7% |
| Hawaiian / Pacific | 0 | 0.0% |
| Hispanic or Latino | 6,611 | 55.3% |
| Native / Alaskan | 0 | 0.0% |
| White / Caucasian | 6,175 | 51.7% |
| Two or more Races | 3,868 | 32.4% |
| Some other Race | 236 | 2.0% |
| Total | 11,944 | 100.0% |
Ancestry in South Miami
The most populous ancestries reported in South Miami are Cuban (3,174 | 26.6%), South American (1,886 | 15.8%), American (1,090 | 9.1%), Colombian (871 | 7.3%), and Central American (568 | 4.8%), together accounting for 63.5% of all South Miami residents.
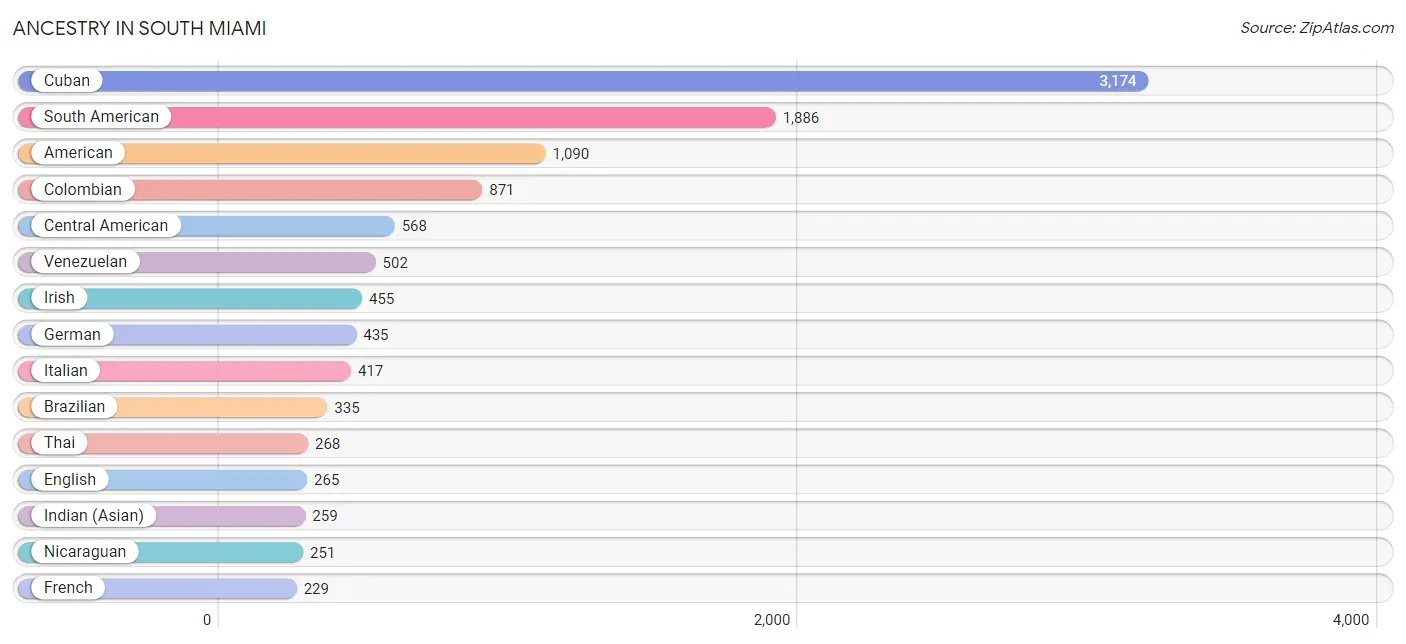
| Ancestry | # Population | % Population |
| African | 22 | 0.2% |
| Alsatian | 4 | 0.0% |
| American | 1,090 | 9.1% |
| Arab | 46 | 0.4% |
| Argentinean | 196 | 1.6% |
| Armenian | 10 | 0.1% |
| Austrian | 19 | 0.2% |
| Barbadian | 9 | 0.1% |
| Basque | 12 | 0.1% |
| Bhutanese | 14 | 0.1% |
| Bolivian | 55 | 0.5% |
| Brazilian | 335 | 2.8% |
| British | 128 | 1.1% |
| British West Indian | 8 | 0.1% |
| Burmese | 43 | 0.4% |
| Canadian | 37 | 0.3% |
| Central American | 568 | 4.8% |
| Cherokee | 14 | 0.1% |
| Chilean | 124 | 1.0% |
| Colombian | 871 | 7.3% |
| Costa Rican | 130 | 1.1% |
| Croatian | 10 | 0.1% |
| Cuban | 3,174 | 26.6% |
| Czech | 6 | 0.1% |
| Danish | 33 | 0.3% |
| Dominican | 228 | 1.9% |
| Eastern European | 60 | 0.5% |
| Ecuadorian | 66 | 0.5% |
| Egyptian | 20 | 0.2% |
| English | 265 | 2.2% |
| European | 50 | 0.4% |
| French | 229 | 1.9% |
| German | 435 | 3.6% |
| Greek | 8 | 0.1% |
| Guatemalan | 137 | 1.1% |
| Haitian | 147 | 1.2% |
| Honduran | 13 | 0.1% |
| Hungarian | 50 | 0.4% |
| Indian (Asian) | 259 | 2.2% |
| Iranian | 45 | 0.4% |
| Irish | 455 | 3.8% |
| Israeli | 27 | 0.2% |
| Italian | 417 | 3.5% |
| Jamaican | 133 | 1.1% |
| Korean | 79 | 0.7% |
| Lebanese | 26 | 0.2% |
| Mexican | 177 | 1.5% |
| Nicaraguan | 251 | 2.1% |
| Norwegian | 57 | 0.5% |
| Panamanian | 25 | 0.2% |
| Peruvian | 72 | 0.6% |
| Polish | 197 | 1.7% |
| Portuguese | 46 | 0.4% |
| Puerto Rican | 209 | 1.8% |
| Romanian | 6 | 0.1% |
| Russian | 21 | 0.2% |
| Salvadoran | 12 | 0.1% |
| Scandinavian | 57 | 0.5% |
| Scotch-Irish | 18 | 0.2% |
| Scottish | 38 | 0.3% |
| Slovak | 4 | 0.0% |
| South American | 1,886 | 15.8% |
| South American Indian | 11 | 0.1% |
| Spaniard | 227 | 1.9% |
| Spanish | 69 | 0.6% |
| Sri Lankan | 20 | 0.2% |
| Subsaharan African | 22 | 0.2% |
| Swedish | 96 | 0.8% |
| Swiss | 8 | 0.1% |
| Thai | 268 | 2.2% |
| Trinidadian and Tobagonian | 8 | 0.1% |
| U.S. Virgin Islander | 14 | 0.1% |
| Ukrainian | 20 | 0.2% |
| Venezuelan | 502 | 4.2% |
| Vietnamese | 9 | 0.1% |
| Welsh | 8 | 0.1% | View All 76 Rows |
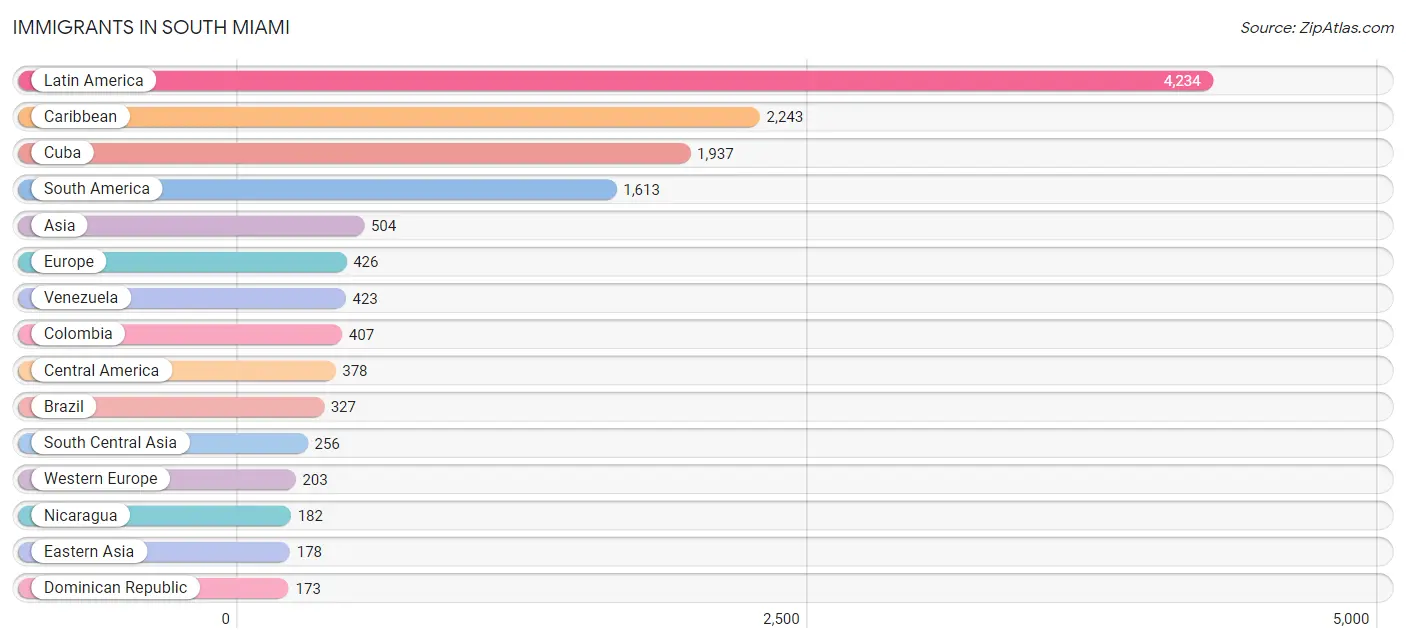
Immigrants in South Miami
The most numerous immigrant groups reported in South Miami came from Latin America (4,234 | 35.4%), Caribbean (2,243 | 18.8%), Cuba (1,937 | 16.2%), South America (1,613 | 13.5%), and Asia (504 | 4.2%), together accounting for 88.2% of all South Miami residents.
| Immigration Origin | # Population | % Population |
| Africa | 58 | 0.5% |
| Argentina | 141 | 1.2% |
| Asia | 504 | 4.2% |
| Bahamas | 7 | 0.1% |
| Bangladesh | 9 | 0.1% |
| Barbados | 9 | 0.1% |
| Bolivia | 55 | 0.5% |
| Brazil | 327 | 2.7% |
| Cameroon | 38 | 0.3% |
| Canada | 55 | 0.5% |
| Caribbean | 2,243 | 18.8% |
| Central America | 378 | 3.2% |
| Chile | 167 | 1.4% |
| China | 136 | 1.1% |
| Colombia | 407 | 3.4% |
| Cuba | 1,937 | 16.2% |
| Dominican Republic | 173 | 1.5% |
| Eastern Asia | 178 | 1.5% |
| Eastern Europe | 64 | 0.5% |
| Ecuador | 23 | 0.2% |
| Egypt | 20 | 0.2% |
| El Salvador | 12 | 0.1% |
| England | 50 | 0.4% |
| Europe | 426 | 3.6% |
| France | 125 | 1.1% |
| Germany | 39 | 0.3% |
| Guatemala | 54 | 0.4% |
| Guyana | 14 | 0.1% |
| Haiti | 71 | 0.6% |
| India | 173 | 1.5% |
| Iran | 45 | 0.4% |
| Israel | 8 | 0.1% |
| Italy | 60 | 0.5% |
| Jamaica | 36 | 0.3% |
| Korea | 42 | 0.4% |
| Latin America | 4,234 | 35.4% |
| Lithuania | 27 | 0.2% |
| Mexico | 105 | 0.9% |
| Middle Africa | 38 | 0.3% |
| Netherlands | 11 | 0.1% |
| Nicaragua | 182 | 1.5% |
| Northern Africa | 20 | 0.2% |
| Northern Europe | 74 | 0.6% |
| Panama | 25 | 0.2% |
| Peru | 56 | 0.5% |
| Philippines | 35 | 0.3% |
| Poland | 25 | 0.2% |
| Portugal | 7 | 0.1% |
| Romania | 12 | 0.1% |
| Scotland | 9 | 0.1% |
| Singapore | 9 | 0.1% |
| South America | 1,613 | 13.5% |
| South Central Asia | 256 | 2.1% |
| South Eastern Asia | 55 | 0.5% |
| Southern Europe | 85 | 0.7% |
| Spain | 18 | 0.2% |
| Sri Lanka | 29 | 0.2% |
| Sweden | 3 | 0.0% |
| Switzerland | 28 | 0.2% |
| Taiwan | 7 | 0.1% |
| Trinidad and Tobago | 10 | 0.1% |
| Venezuela | 423 | 3.5% |
| Vietnam | 11 | 0.1% |
| Western Asia | 8 | 0.1% |
| Western Europe | 203 | 1.7% | View All 65 Rows |
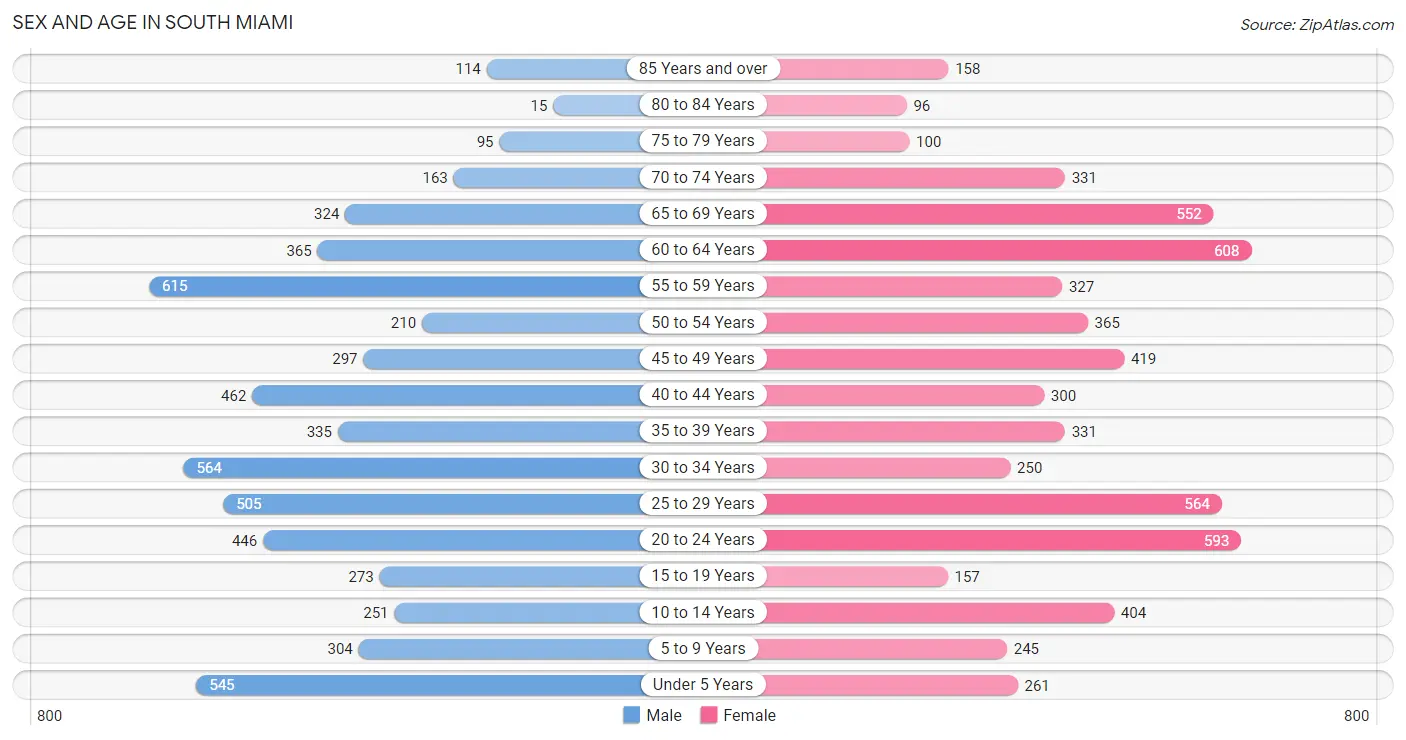
Sex and Age in South Miami
Sex and Age in South Miami
The most populous age groups in South Miami are 55 to 59 Years (615 | 10.4%) for men and 60 to 64 Years (608 | 10.0%) for women.
| Age Bracket | Male | Female |
| Under 5 Years | 545 (9.3%) | 261 (4.3%) |
| 5 to 9 Years | 304 (5.2%) | 245 (4.0%) |
| 10 to 14 Years | 251 (4.3%) | 404 (6.7%) |
| 15 to 19 Years | 273 (4.6%) | 157 (2.6%) |
| 20 to 24 Years | 446 (7.6%) | 593 (9.8%) |
| 25 to 29 Years | 505 (8.6%) | 564 (9.3%) |
| 30 to 34 Years | 564 (9.6%) | 250 (4.1%) |
| 35 to 39 Years | 335 (5.7%) | 331 (5.5%) |
| 40 to 44 Years | 462 (7.9%) | 300 (5.0%) |
| 45 to 49 Years | 297 (5.1%) | 419 (6.9%) |
| 50 to 54 Years | 210 (3.6%) | 365 (6.0%) |
| 55 to 59 Years | 615 (10.4%) | 327 (5.4%) |
| 60 to 64 Years | 365 (6.2%) | 608 (10.0%) |
| 65 to 69 Years | 324 (5.5%) | 552 (9.1%) |
| 70 to 74 Years | 163 (2.8%) | 331 (5.5%) |
| 75 to 79 Years | 95 (1.6%) | 100 (1.7%) |
| 80 to 84 Years | 15 (0.3%) | 96 (1.6%) |
| 85 Years and over | 114 (1.9%) | 158 (2.6%) |
| Total | 5,883 (100.0%) | 6,061 (100.0%) |
Families and Households in South Miami
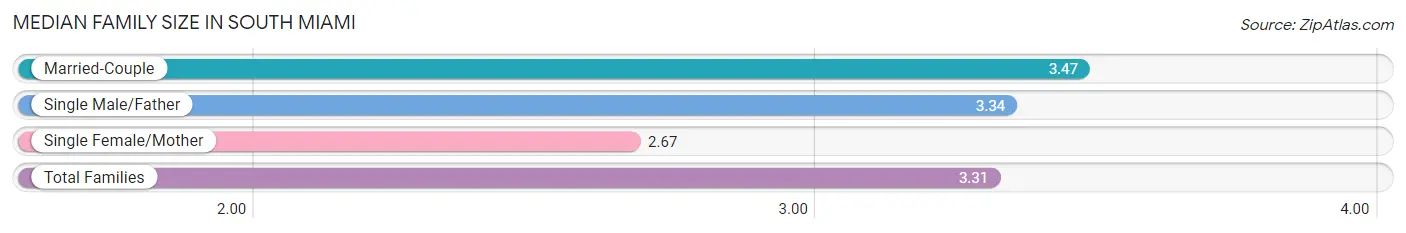
Median Family Size in South Miami
The median family size in South Miami is 3.31 persons per family, with married-couple families (2,042 | 77.1%) accounting for the largest median family size of 3.47 persons per family. On the other hand, single female/mother families (490 | 18.5%) represent the smallest median family size with 2.67 persons per family.
| Family Type | # Families | Family Size |
| Married-Couple | 2,042 (77.1%) | 3.47 |
| Single Male/Father | 116 (4.4%) | 3.34 |
| Single Female/Mother | 490 (18.5%) | 2.67 |
| Total Families | 2,648 (100.0%) | 3.31 |
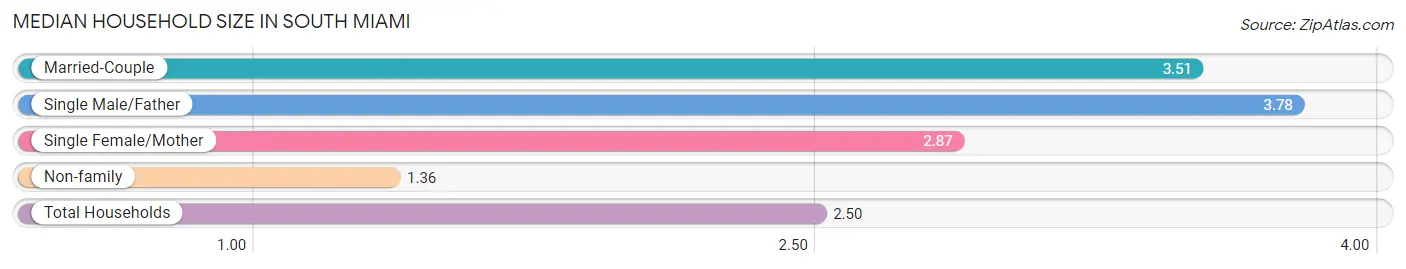
Median Household Size in South Miami
The median household size in South Miami is 2.50 persons per household, with single male/father households (116 | 2.5%) accounting for the largest median household size of 3.78 persons per household. non-family households (2,088 | 44.1%) represent the smallest median household size with 1.36 persons per household.
| Household Type | # Households | Household Size |
| Married-Couple | 2,042 (43.1%) | 3.51 |
| Single Male/Father | 116 (2.5%) | 3.78 |
| Single Female/Mother | 490 (10.3%) | 2.87 |
| Non-family | 2,088 (44.1%) | 1.36 |
| Total Households | 4,736 (100.0%) | 2.50 |
Household Size by Marriage Status in South Miami
Out of a total of 4,736 households in South Miami, 2,648 (55.9%) are family households, while 2,088 (44.1%) are nonfamily households. The most numerous type of family households are 2-person households, comprising 1,051, and the most common type of nonfamily households are 1-person households, comprising 1,461.
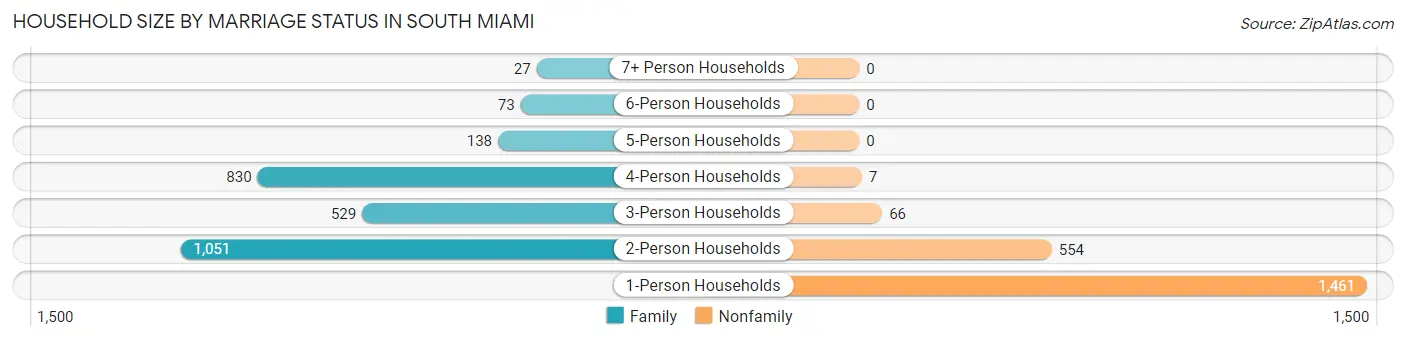
| Household Size | Family Households | Nonfamily Households |
| 1-Person Households | - | 1,461 (30.8%) |
| 2-Person Households | 1,051 (22.2%) | 554 (11.7%) |
| 3-Person Households | 529 (11.2%) | 66 (1.4%) |
| 4-Person Households | 830 (17.5%) | 7 (0.2%) |
| 5-Person Households | 138 (2.9%) | 0 (0.0%) |
| 6-Person Households | 73 (1.5%) | 0 (0.0%) |
| 7+ Person Households | 27 (0.6%) | 0 (0.0%) |
| Total | 2,648 (55.9%) | 2,088 (44.1%) |
Female Fertility in South Miami
Fertility by Age in South Miami
Average fertility rate in South Miami is 61.0 births per 1,000 women. Women in the age bracket of 20 to 34 years have the highest fertility rate with 87.0 births per 1,000 women. Women in the age bracket of 20 to 34 years acount for 76.2% of all women with births.
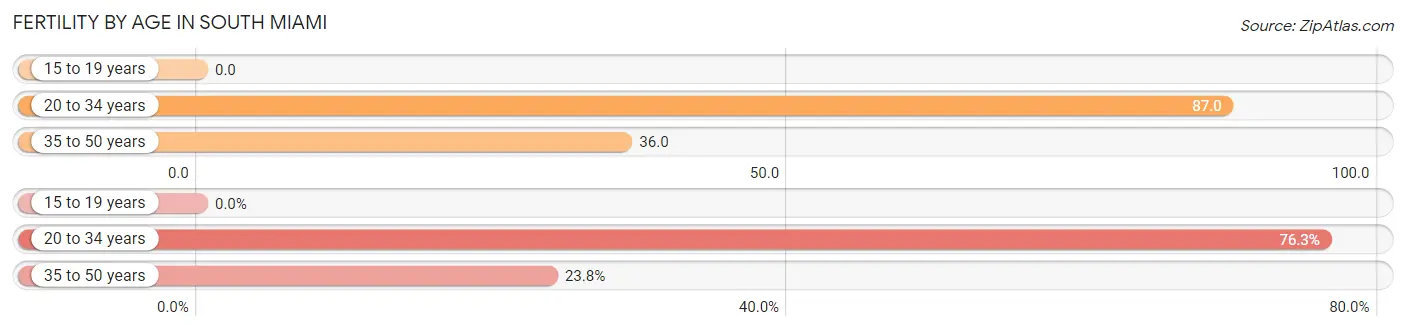
| Age Bracket | Women with Births | Births / 1,000 Women |
| 15 to 19 years | 0 (0.0%) | 0.0 |
| 20 to 34 years | 122 (76.2%) | 87.0 |
| 35 to 50 years | 38 (23.7%) | 36.0 |
| Total | 160 (100.0%) | 61.0 |
Fertility by Age by Marriage Status in South Miami
67.5% of women with births (160) in South Miami are married. The highest percentage of unmarried women with births falls into 20 to 34 years age bracket with 42.6% of them unmarried at the time of birth, while the lowest percentage of unmarried women with births belong to 35 to 50 years age bracket with 0.0% of them unmarried.
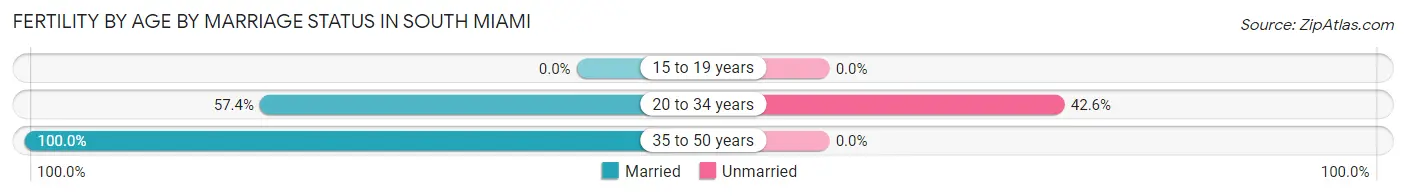
| Age Bracket | Married | Unmarried |
| 15 to 19 years | 0 (0.0%) | 0 (0.0%) |
| 20 to 34 years | 70 (57.4%) | 52 (42.6%) |
| 35 to 50 years | 38 (100.0%) | 0 (0.0%) |
| Total | 108 (67.5%) | 52 (32.5%) |
Fertility by Education in South Miami
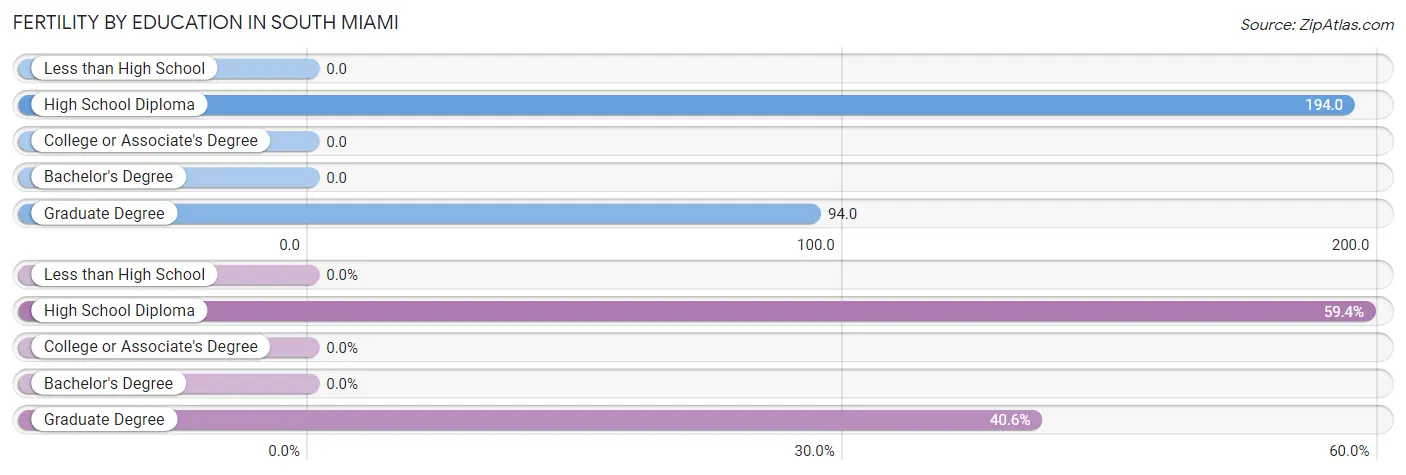
| Educational Attainment | Women with Births | Births / 1,000 Women |
| Less than High School | 0 (0.0%) | 0.0 |
| High School Diploma | 95 (59.4%) | 194.0 |
| College or Associate's Degree | 0 (0.0%) | 0.0 |
| Bachelor's Degree | 0 (0.0%) | 0.0 |
| Graduate Degree | 65 (40.6%) | 94.0 |
| Total | 160 (100.0%) | 61.0 |
Fertility by Education by Marriage Status in South Miami
32.5% of women with births in South Miami are unmarried. Women with the educational attainment of graduate degree are most likely to be married with 100.0% of them married at childbirth, while women with the educational attainment of high school diploma are least likely to be married with 54.7% of them unmarried at childbirth.
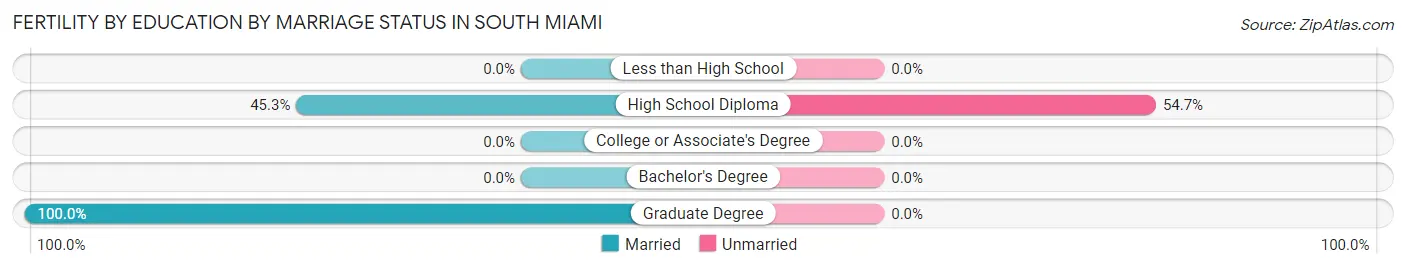
| Educational Attainment | Married | Unmarried |
| Less than High School | 0 (0.0%) | 0 (0.0%) |
| High School Diploma | 43 (45.3%) | 52 (54.7%) |
| College or Associate's Degree | 0 (0.0%) | 0 (0.0%) |
| Bachelor's Degree | 0 (0.0%) | 0 (0.0%) |
| Graduate Degree | 65 (100.0%) | 0 (0.0%) |
| Total | 108 (67.5%) | 52 (32.5%) |
Employment Characteristics in South Miami
Employment by Class of Employer in South Miami
Among the 5,742 employed individuals in South Miami, private company employees (3,582 | 62.4%), self-employed (incorporated) (659 | 11.5%), and self-employed (not incorporated) (452 | 7.9%) make up the most common classes of employment.
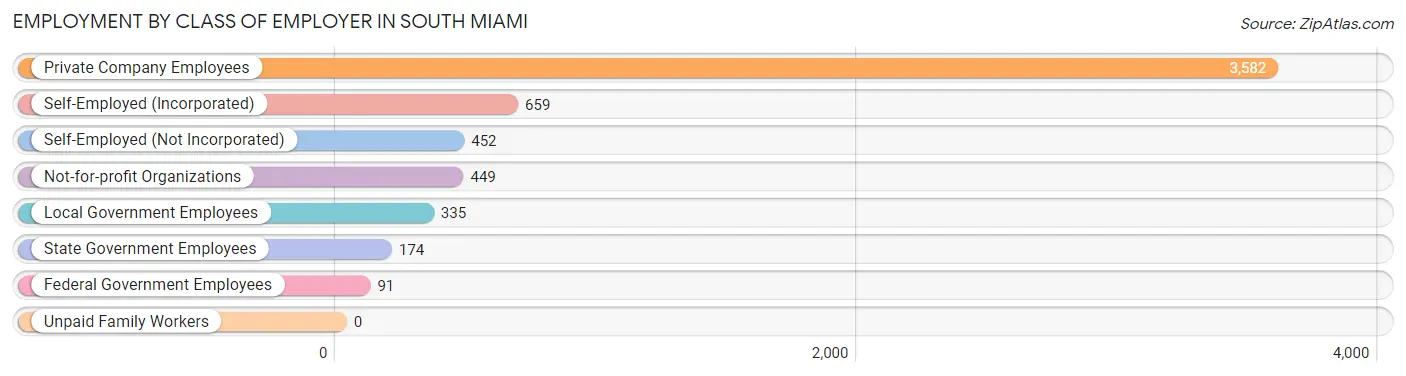
| Employer Class | # Employees | % Employees |
| Private Company Employees | 3,582 | 62.4% |
| Self-Employed (Incorporated) | 659 | 11.5% |
| Self-Employed (Not Incorporated) | 452 | 7.9% |
| Not-for-profit Organizations | 449 | 7.8% |
| Local Government Employees | 335 | 5.8% |
| State Government Employees | 174 | 3.0% |
| Federal Government Employees | 91 | 1.6% |
| Unpaid Family Workers | 0 | 0.0% |
| Total | 5,742 | 100.0% |
Employment Status by Age in South Miami
According to the labor force statistics for South Miami, out of the total population over 16 years of age (9,874), 66.1% or 6,527 individuals are in the labor force, with 3.9% or 255 of them unemployed. The age group with the highest labor force participation rate is 55 to 59 years, with 91.2% or 859 individuals in the labor force. Within the labor force, the 30 to 34 years age range has the highest percentage of unemployed individuals, with 11.4% or 81 of them being unemployed.
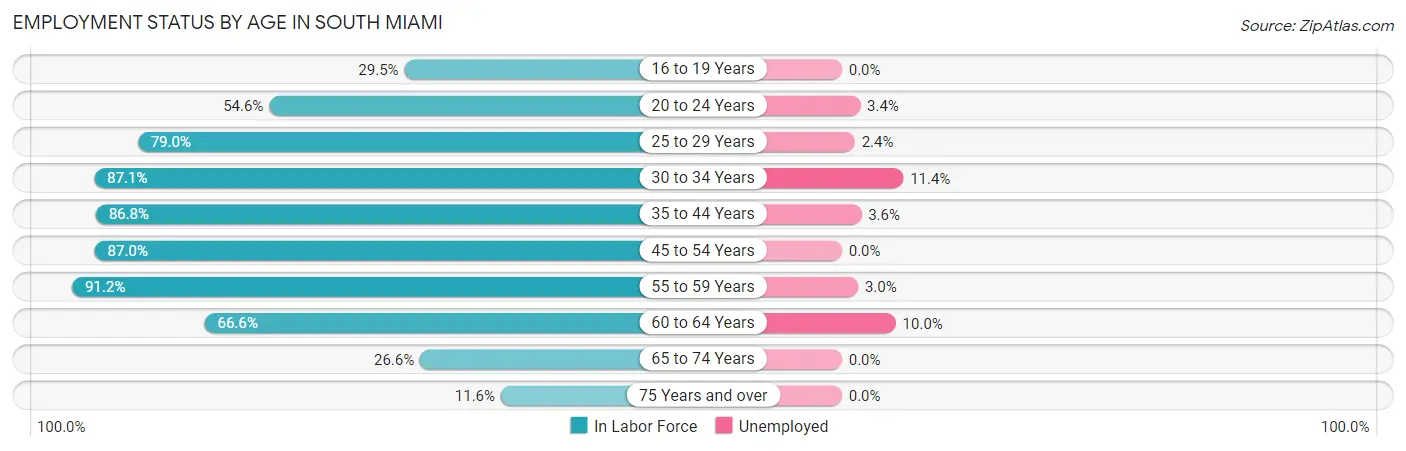
| Age Bracket | In Labor Force | Unemployed |
| 16 to 19 Years | 109 (29.5%) | 0 (0.0%) |
| 20 to 24 Years | 567 (54.6%) | 19 (3.4%) |
| 25 to 29 Years | 845 (79.0%) | 20 (2.4%) |
| 30 to 34 Years | 709 (87.1%) | 81 (11.4%) |
| 35 to 44 Years | 1,240 (86.8%) | 45 (3.6%) |
| 45 to 54 Years | 1,123 (87.0%) | 0 (0.0%) |
| 55 to 59 Years | 859 (91.2%) | 26 (3.0%) |
| 60 to 64 Years | 648 (66.6%) | 65 (10.0%) |
| 65 to 74 Years | 364 (26.6%) | 0 (0.0%) |
| 75 Years and over | 67 (11.6%) | 0 (0.0%) |
| Total | 6,527 (66.1%) | 255 (3.9%) |
Employment Status by Educational Attainment in South Miami
According to labor force statistics for South Miami, 83.2% of individuals (5,422) out of the total population between 25 and 64 years of age (6,517) are in the labor force, with 4.4% or 239 of them being unemployed. The group with the highest labor force participation rate are those with the educational attainment of bachelor's degree or higher, with 87.9% or 3,421 individuals in the labor force. Within the labor force, individuals with high school diploma education have the highest percentage of unemployment, with 7.6% or 60 of them being unemployed.
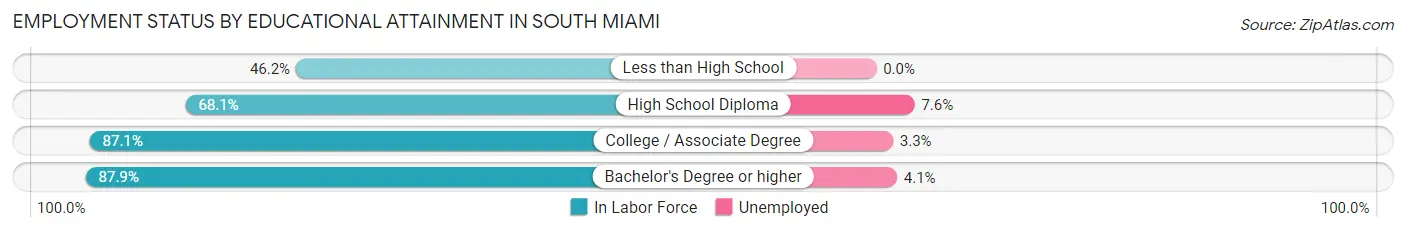
| Educational Attainment | In Labor Force | Unemployed |
| Less than High School | 73 (46.2%) | 0 (0.0%) |
| High School Diploma | 791 (68.1%) | 88 (7.6%) |
| College / Associate Degree | 1,137 (87.1%) | 43 (3.3%) |
| Bachelor's Degree or higher | 3,421 (87.9%) | 160 (4.1%) |
| Total | 5,422 (83.2%) | 287 (4.4%) |
Employment Occupations by Sex in South Miami
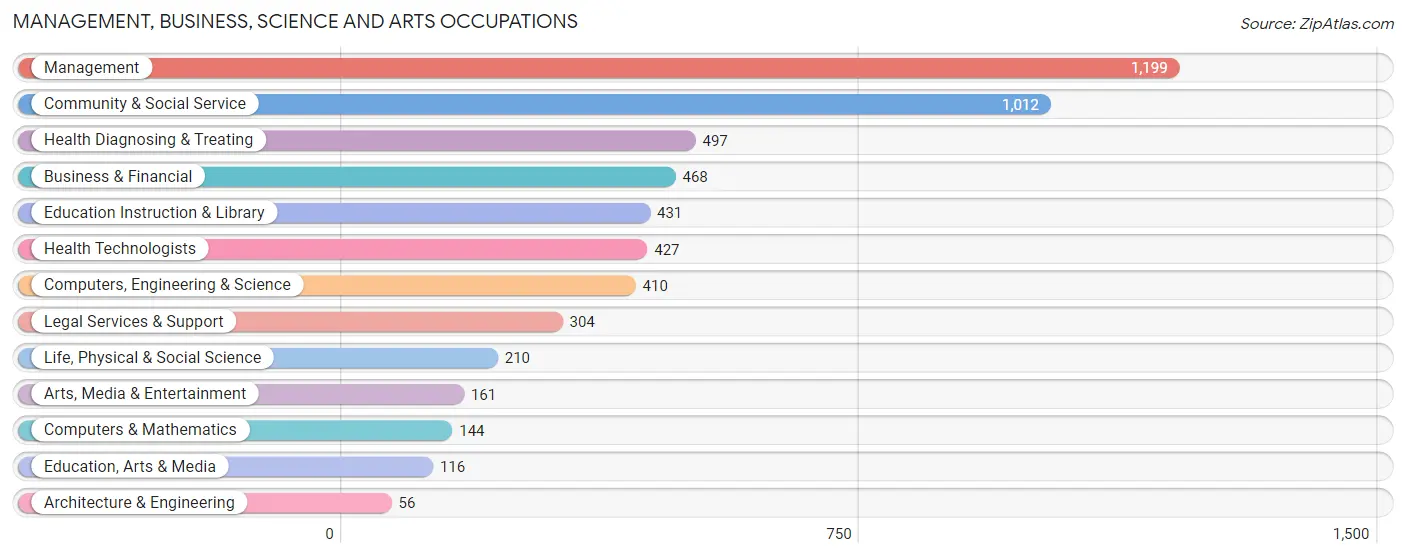
Management, Business, Science and Arts Occupations
The most common Management, Business, Science and Arts occupations in South Miami are Management (1,199 | 19.1%), Community & Social Service (1,012 | 16.1%), Health Diagnosing & Treating (497 | 7.9%), Business & Financial (468 | 7.5%), and Education Instruction & Library (431 | 6.9%).
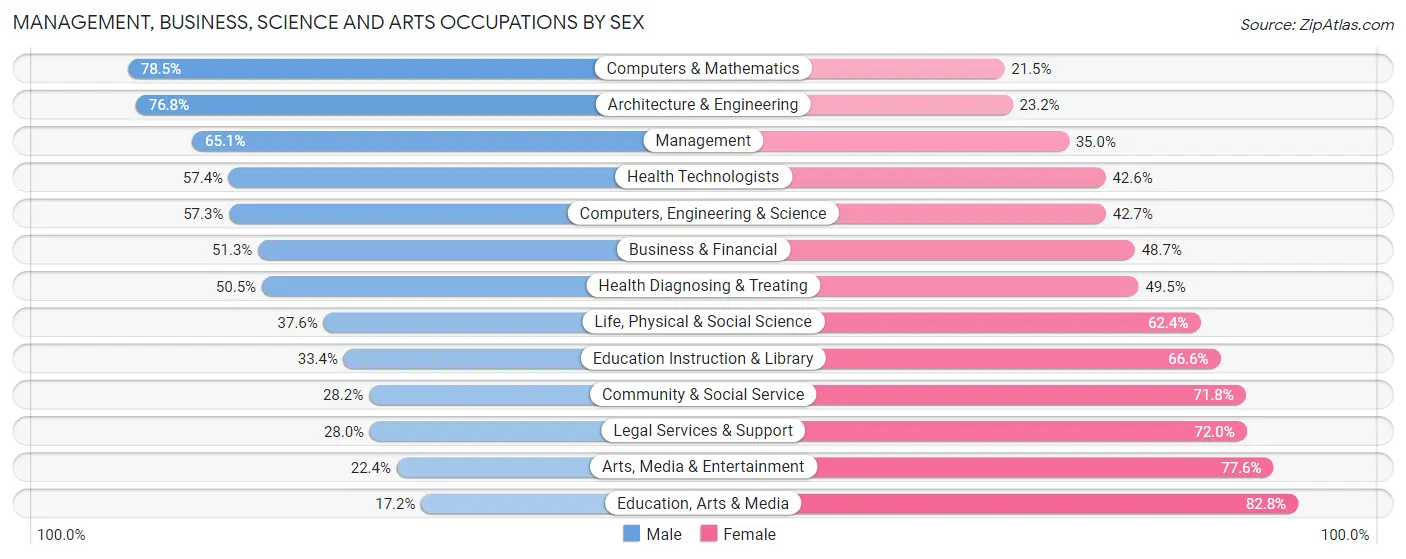
Management, Business, Science and Arts Occupations by Sex
Within the Management, Business, Science and Arts occupations in South Miami, the most male-oriented occupations are Computers & Mathematics (78.5%), Architecture & Engineering (76.8%), and Management (65.0%), while the most female-oriented occupations are Education, Arts & Media (82.8%), Arts, Media & Entertainment (77.6%), and Legal Services & Support (72.0%).
| Occupation | Male | Female |
| Management | 780 (65.0%) | 419 (34.9%) |
| Business & Financial | 240 (51.3%) | 228 (48.7%) |
| Computers, Engineering & Science | 235 (57.3%) | 175 (42.7%) |
| Computers & Mathematics | 113 (78.5%) | 31 (21.5%) |
| Architecture & Engineering | 43 (76.8%) | 13 (23.2%) |
| Life, Physical & Social Science | 79 (37.6%) | 131 (62.4%) |
| Community & Social Service | 285 (28.2%) | 727 (71.8%) |
| Education, Arts & Media | 20 (17.2%) | 96 (82.8%) |
| Legal Services & Support | 85 (28.0%) | 219 (72.0%) |
| Education Instruction & Library | 144 (33.4%) | 287 (66.6%) |
| Arts, Media & Entertainment | 36 (22.4%) | 125 (77.6%) |
| Health Diagnosing & Treating | 251 (50.5%) | 246 (49.5%) |
| Health Technologists | 245 (57.4%) | 182 (42.6%) |
| Total (Category) | 1,791 (49.9%) | 1,795 (50.1%) |
| Total (Overall) | 3,391 (54.0%) | 2,883 (46.0%) |
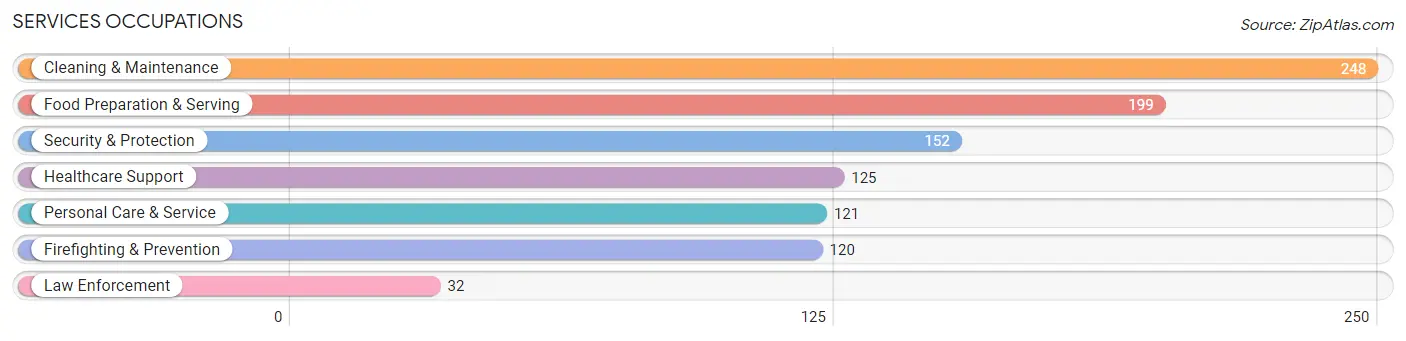
Services Occupations
The most common Services occupations in South Miami are Cleaning & Maintenance (248 | 4.0%), Food Preparation & Serving (199 | 3.2%), Security & Protection (152 | 2.4%), Healthcare Support (125 | 2.0%), and Personal Care & Service (121 | 1.9%).
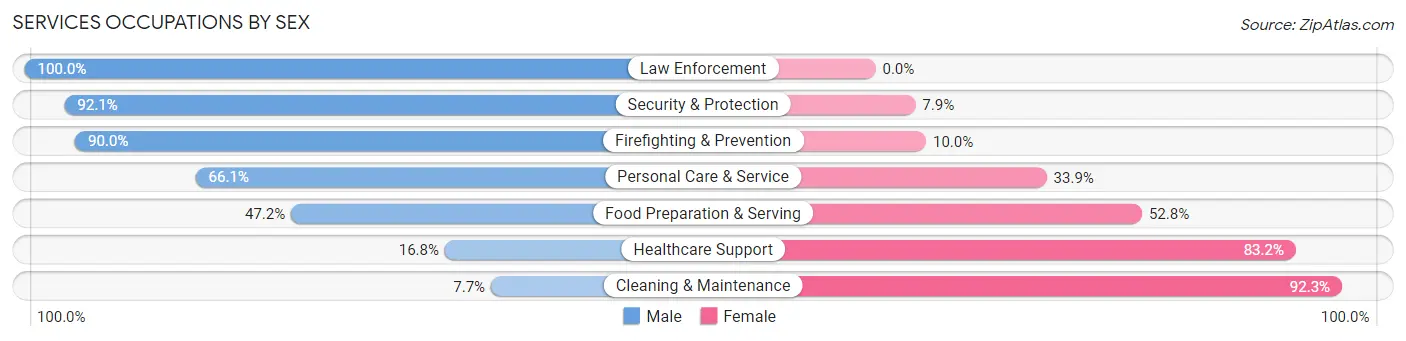
Services Occupations by Sex
Within the Services occupations in South Miami, the most male-oriented occupations are Law Enforcement (100.0%), Security & Protection (92.1%), and Firefighting & Prevention (90.0%), while the most female-oriented occupations are Cleaning & Maintenance (92.3%), Healthcare Support (83.2%), and Food Preparation & Serving (52.8%).
| Occupation | Male | Female |
| Healthcare Support | 21 (16.8%) | 104 (83.2%) |
| Security & Protection | 140 (92.1%) | 12 (7.9%) |
| Firefighting & Prevention | 108 (90.0%) | 12 (10.0%) |
| Law Enforcement | 32 (100.0%) | 0 (0.0%) |
| Food Preparation & Serving | 94 (47.2%) | 105 (52.8%) |
| Cleaning & Maintenance | 19 (7.7%) | 229 (92.3%) |
| Personal Care & Service | 80 (66.1%) | 41 (33.9%) |
| Total (Category) | 354 (41.9%) | 491 (58.1%) |
| Total (Overall) | 3,391 (54.0%) | 2,883 (46.0%) |
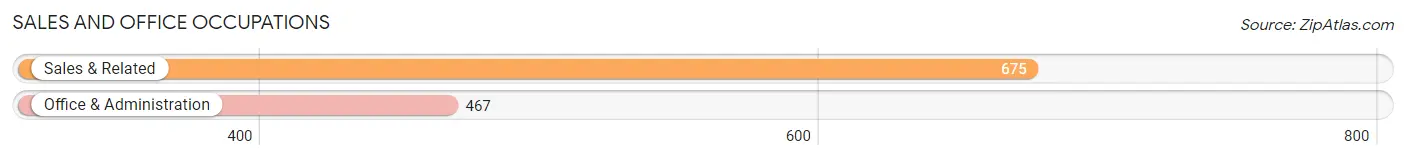
Sales and Office Occupations
The most common Sales and Office occupations in South Miami are Sales & Related (675 | 10.8%), and Office & Administration (467 | 7.4%).
Sales and Office Occupations by Sex
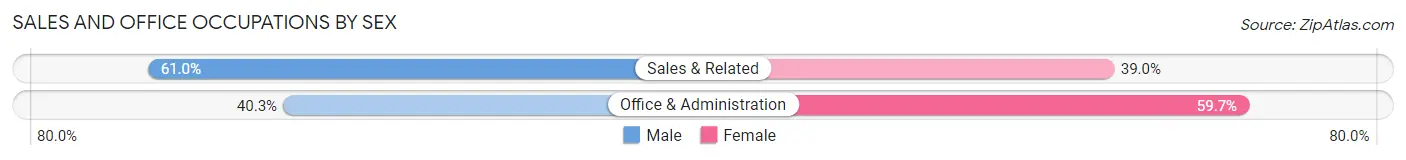
| Occupation | Male | Female |
| Sales & Related | 412 (61.0%) | 263 (39.0%) |
| Office & Administration | 188 (40.3%) | 279 (59.7%) |
| Total (Category) | 600 (52.5%) | 542 (47.5%) |
| Total (Overall) | 3,391 (54.0%) | 2,883 (46.0%) |
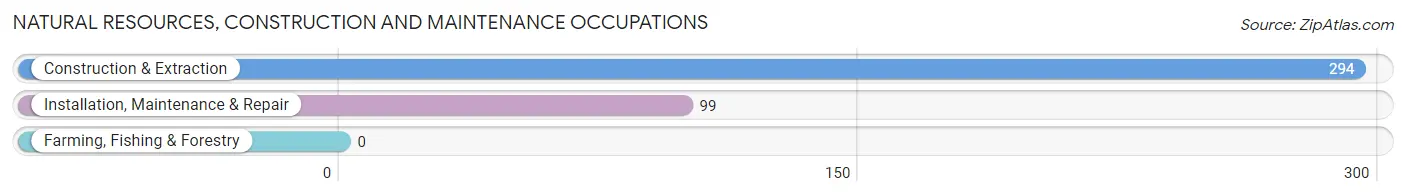
Natural Resources, Construction and Maintenance Occupations
The most common Natural Resources, Construction and Maintenance occupations in South Miami are Construction & Extraction (294 | 4.7%), and Installation, Maintenance & Repair (99 | 1.6%).
Natural Resources, Construction and Maintenance Occupations by Sex
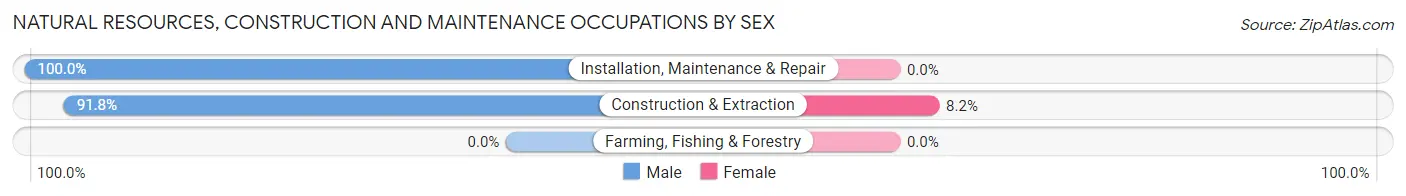
| Occupation | Male | Female |
| Farming, Fishing & Forestry | 0 (0.0%) | 0 (0.0%) |
| Construction & Extraction | 270 (91.8%) | 24 (8.2%) |
| Installation, Maintenance & Repair | 99 (100.0%) | 0 (0.0%) |
| Total (Category) | 369 (93.9%) | 24 (6.1%) |
| Total (Overall) | 3,391 (54.0%) | 2,883 (46.0%) |
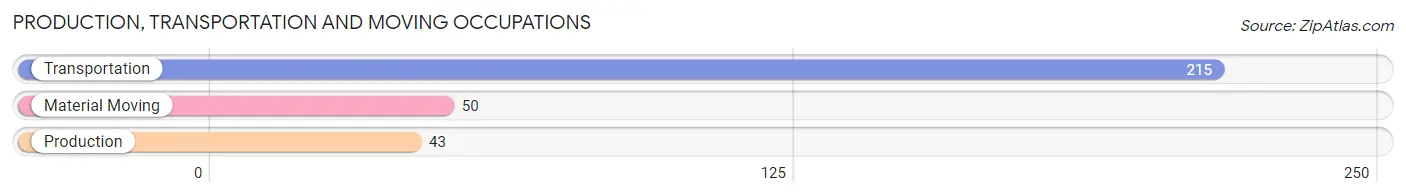
Production, Transportation and Moving Occupations
The most common Production, Transportation and Moving occupations in South Miami are Transportation (215 | 3.4%), Material Moving (50 | 0.8%), and Production (43 | 0.7%).
Production, Transportation and Moving Occupations by Sex
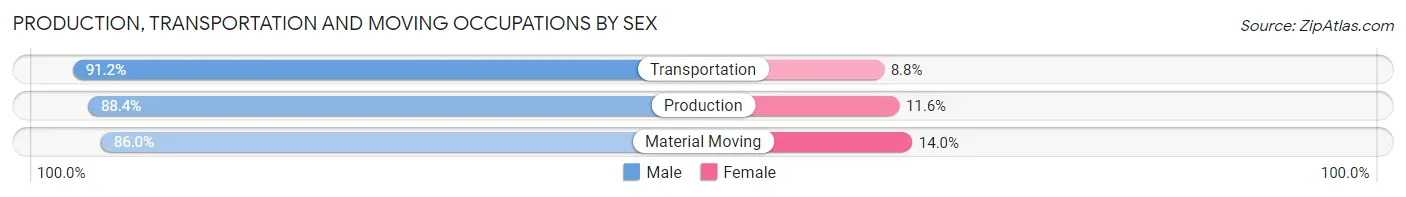
| Occupation | Male | Female |
| Production | 38 (88.4%) | 5 (11.6%) |
| Transportation | 196 (91.2%) | 19 (8.8%) |
| Material Moving | 43 (86.0%) | 7 (14.0%) |
| Total (Category) | 277 (89.9%) | 31 (10.1%) |
| Total (Overall) | 3,391 (54.0%) | 2,883 (46.0%) |
Employment Industries by Sex in South Miami
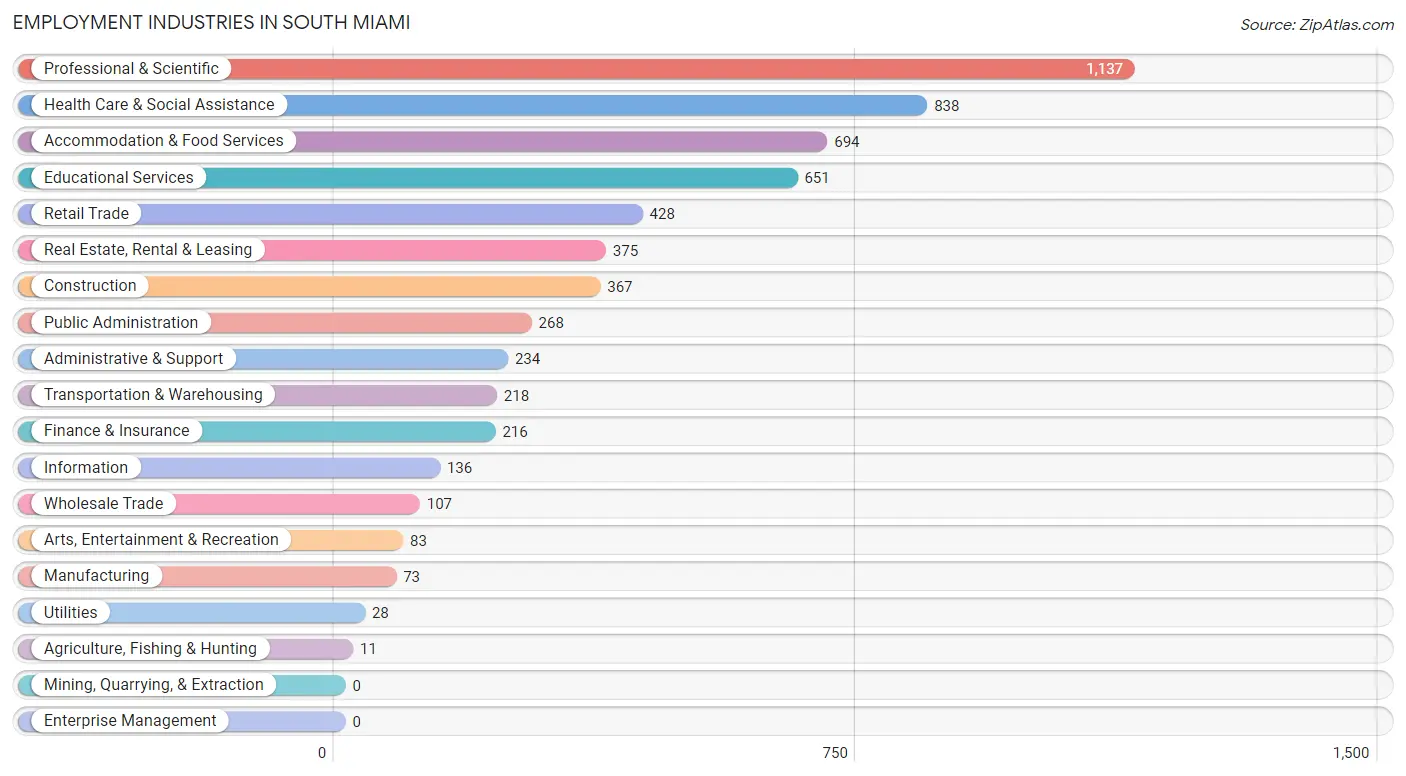
Employment Industries in South Miami
The major employment industries in South Miami include Professional & Scientific (1,137 | 18.1%), Health Care & Social Assistance (838 | 13.4%), Accommodation & Food Services (694 | 11.1%), Educational Services (651 | 10.4%), and Retail Trade (428 | 6.8%).
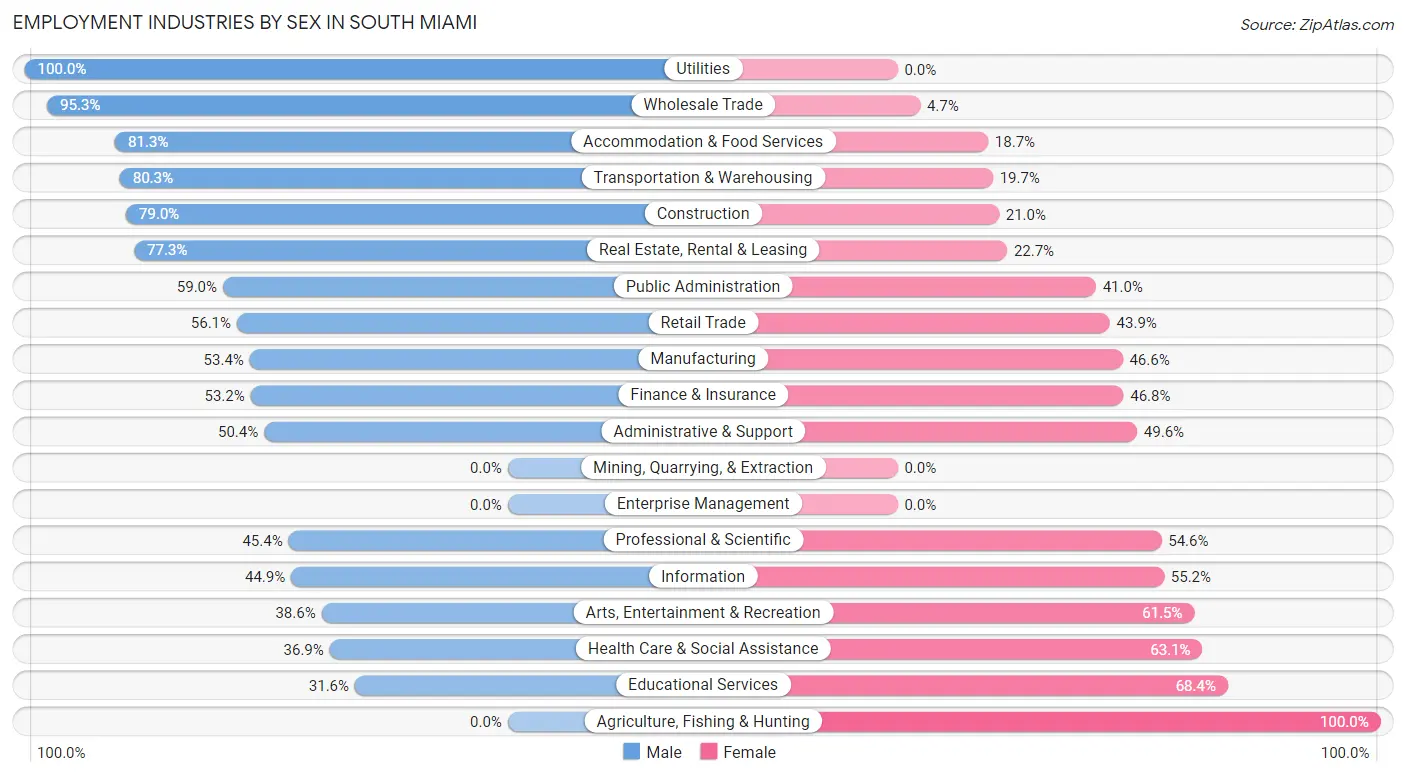
Employment Industries by Sex in South Miami
The South Miami industries that see more men than women are Utilities (100.0%), Wholesale Trade (95.3%), and Accommodation & Food Services (81.3%), whereas the industries that tend to have a higher number of women are Agriculture, Fishing & Hunting (100.0%), Educational Services (68.4%), and Health Care & Social Assistance (63.1%).
| Industry | Male | Female |
| Agriculture, Fishing & Hunting | 0 (0.0%) | 11 (100.0%) |
| Mining, Quarrying, & Extraction | 0 (0.0%) | 0 (0.0%) |
| Construction | 290 (79.0%) | 77 (21.0%) |
| Manufacturing | 39 (53.4%) | 34 (46.6%) |
| Wholesale Trade | 102 (95.3%) | 5 (4.7%) |
| Retail Trade | 240 (56.1%) | 188 (43.9%) |
| Transportation & Warehousing | 175 (80.3%) | 43 (19.7%) |
| Utilities | 28 (100.0%) | 0 (0.0%) |
| Information | 61 (44.9%) | 75 (55.1%) |
| Finance & Insurance | 115 (53.2%) | 101 (46.8%) |
| Real Estate, Rental & Leasing | 290 (77.3%) | 85 (22.7%) |
| Professional & Scientific | 516 (45.4%) | 621 (54.6%) |
| Enterprise Management | 0 (0.0%) | 0 (0.0%) |
| Administrative & Support | 118 (50.4%) | 116 (49.6%) |
| Educational Services | 206 (31.6%) | 445 (68.4%) |
| Health Care & Social Assistance | 309 (36.9%) | 529 (63.1%) |
| Arts, Entertainment & Recreation | 32 (38.6%) | 51 (61.5%) |
| Accommodation & Food Services | 564 (81.3%) | 130 (18.7%) |
| Public Administration | 158 (59.0%) | 110 (41.0%) |
| Total | 3,391 (54.0%) | 2,883 (46.0%) |
Education in South Miami
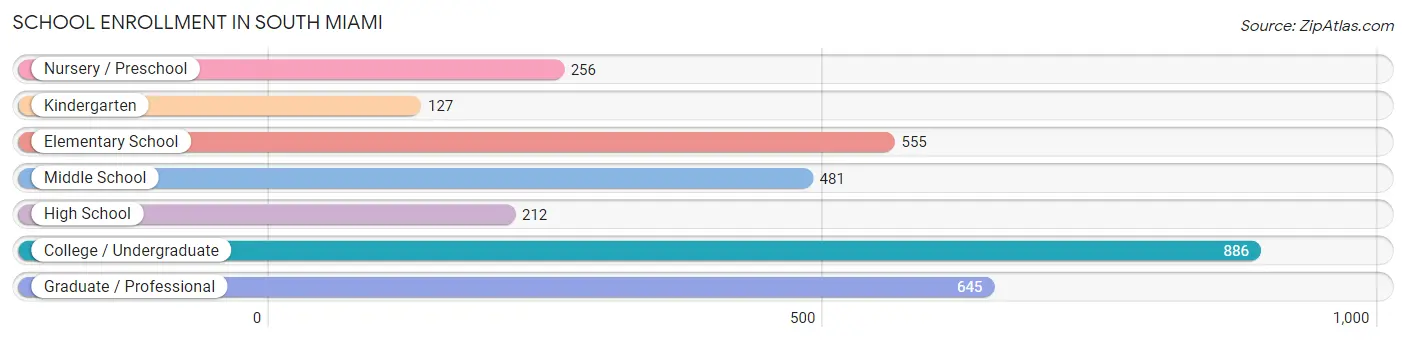
School Enrollment in South Miami
The most common levels of schooling among the 3,162 students in South Miami are college / undergraduate (886 | 28.0%), graduate / professional (645 | 20.4%), and elementary school (555 | 17.5%).
| School Level | # Students | % Students |
| Nursery / Preschool | 256 | 8.1% |
| Kindergarten | 127 | 4.0% |
| Elementary School | 555 | 17.5% |
| Middle School | 481 | 15.2% |
| High School | 212 | 6.7% |
| College / Undergraduate | 886 | 28.0% |
| Graduate / Professional | 645 | 20.4% |
| Total | 3,162 | 100.0% |
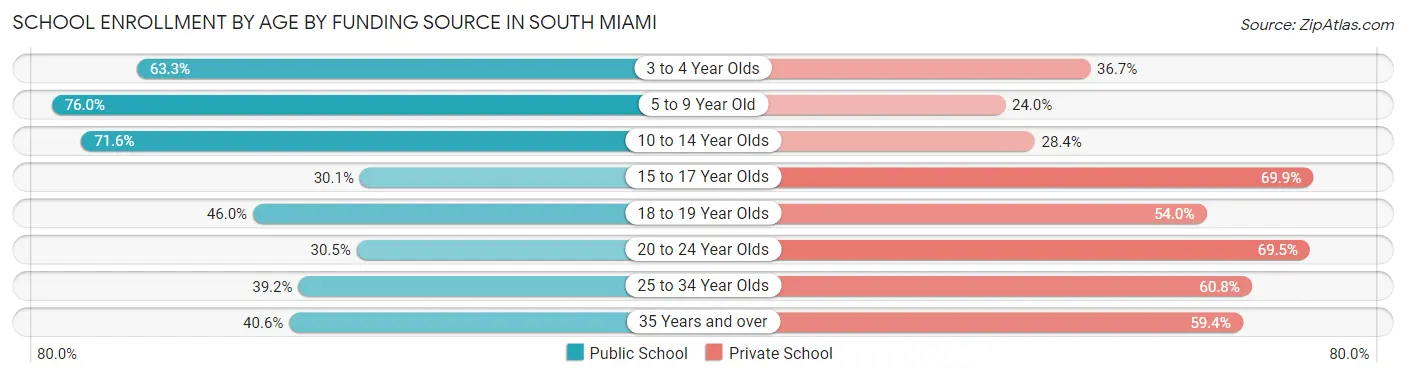
School Enrollment by Age by Funding Source in South Miami
Out of a total of 3,162 students who are enrolled in schools in South Miami, 1,511 (47.8%) attend a private institution, while the remaining 1,651 (52.2%) are enrolled in public schools. The age group of 15 to 17 year olds has the highest likelihood of being enrolled in private schools, with 114 (69.9% in the age bracket) enrolled. Conversely, the age group of 5 to 9 year old has the lowest likelihood of being enrolled in a private school, with 417 (76.0% in the age bracket) attending a public institution.
| Age Bracket | Public School | Private School |
| 3 to 4 Year Olds | 162 (63.3%) | 94 (36.7%) |
| 5 to 9 Year Old | 417 (76.0%) | 132 (24.0%) |
| 10 to 14 Year Olds | 453 (71.6%) | 180 (28.4%) |
| 15 to 17 Year Olds | 49 (30.1%) | 114 (69.9%) |
| 18 to 19 Year Olds | 103 (46.0%) | 121 (54.0%) |
| 20 to 24 Year Olds | 222 (30.5%) | 505 (69.5%) |
| 25 to 34 Year Olds | 131 (39.2%) | 203 (60.8%) |
| 35 Years and over | 112 (40.6%) | 164 (59.4%) |
| Total | 1,651 (52.2%) | 1,511 (47.8%) |
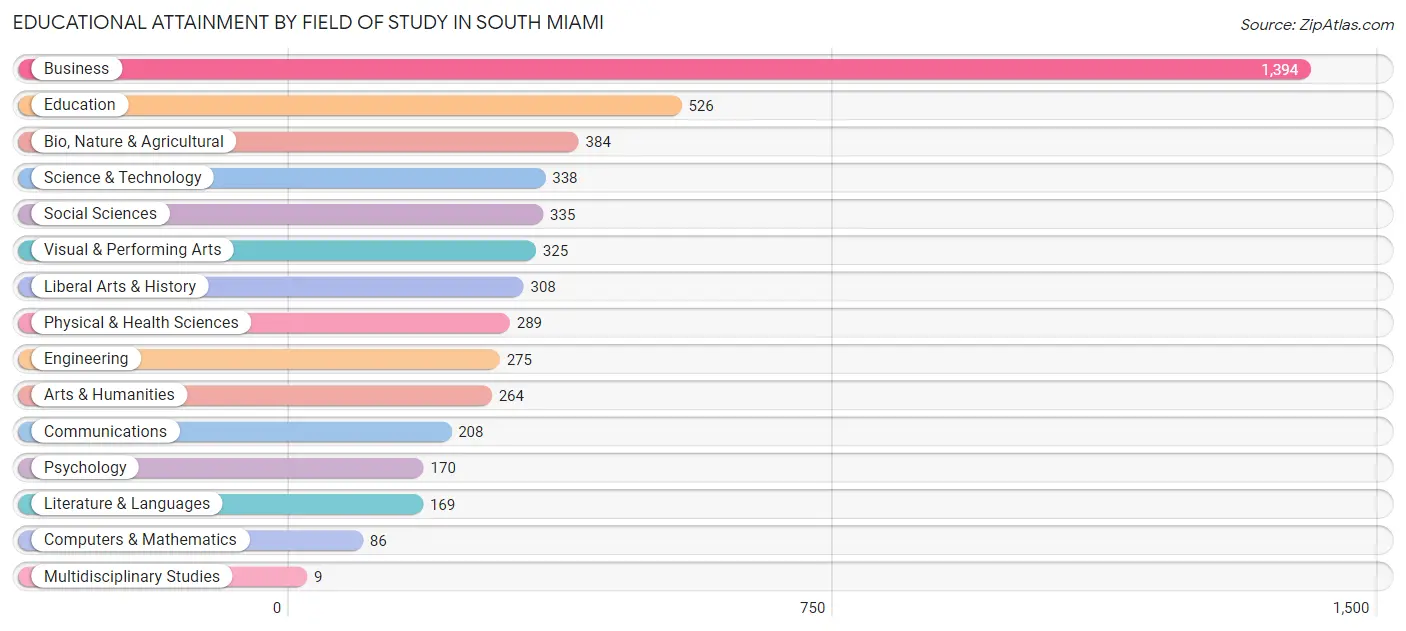
Educational Attainment by Field of Study in South Miami
Business (1,394 | 27.4%), education (526 | 10.3%), bio, nature & agricultural (384 | 7.6%), science & technology (338 | 6.7%), and social sciences (335 | 6.6%) are the most common fields of study among 5,080 individuals in South Miami who have obtained a bachelor's degree or higher.
| Field of Study | # Graduates | % Graduates |
| Computers & Mathematics | 86 | 1.7% |
| Bio, Nature & Agricultural | 384 | 7.6% |
| Physical & Health Sciences | 289 | 5.7% |
| Psychology | 170 | 3.4% |
| Social Sciences | 335 | 6.6% |
| Engineering | 275 | 5.4% |
| Multidisciplinary Studies | 9 | 0.2% |
| Science & Technology | 338 | 6.7% |
| Business | 1,394 | 27.4% |
| Education | 526 | 10.3% |
| Literature & Languages | 169 | 3.3% |
| Liberal Arts & History | 308 | 6.1% |
| Visual & Performing Arts | 325 | 6.4% |
| Communications | 208 | 4.1% |
| Arts & Humanities | 264 | 5.2% |
| Total | 5,080 | 100.0% |
Transportation & Commute in South Miami
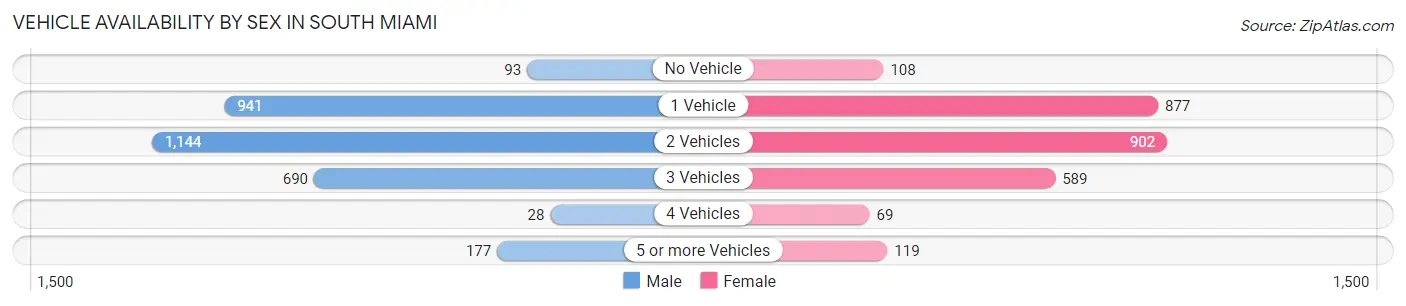
Vehicle Availability by Sex in South Miami
The most prevalent vehicle ownership categories in South Miami are males with 2 vehicles (1,144, accounting for 37.2%) and females with 2 vehicles (902, making up 42.9%).
| Vehicles Available | Male | Female |
| No Vehicle | 93 (3.0%) | 108 (4.1%) |
| 1 Vehicle | 941 (30.6%) | 877 (32.9%) |
| 2 Vehicles | 1,144 (37.2%) | 902 (33.9%) |
| 3 Vehicles | 690 (22.5%) | 589 (22.1%) |
| 4 Vehicles | 28 (0.9%) | 69 (2.6%) |
| 5 or more Vehicles | 177 (5.8%) | 119 (4.5%) |
| Total | 3,073 (100.0%) | 2,664 (100.0%) |
Commute Time in South Miami
The most frequently occuring commute durations in South Miami are 30 to 34 minutes (698 commuters, 15.1%), 45 to 59 minutes (663 commuters, 14.4%), and 20 to 24 minutes (577 commuters, 12.5%).
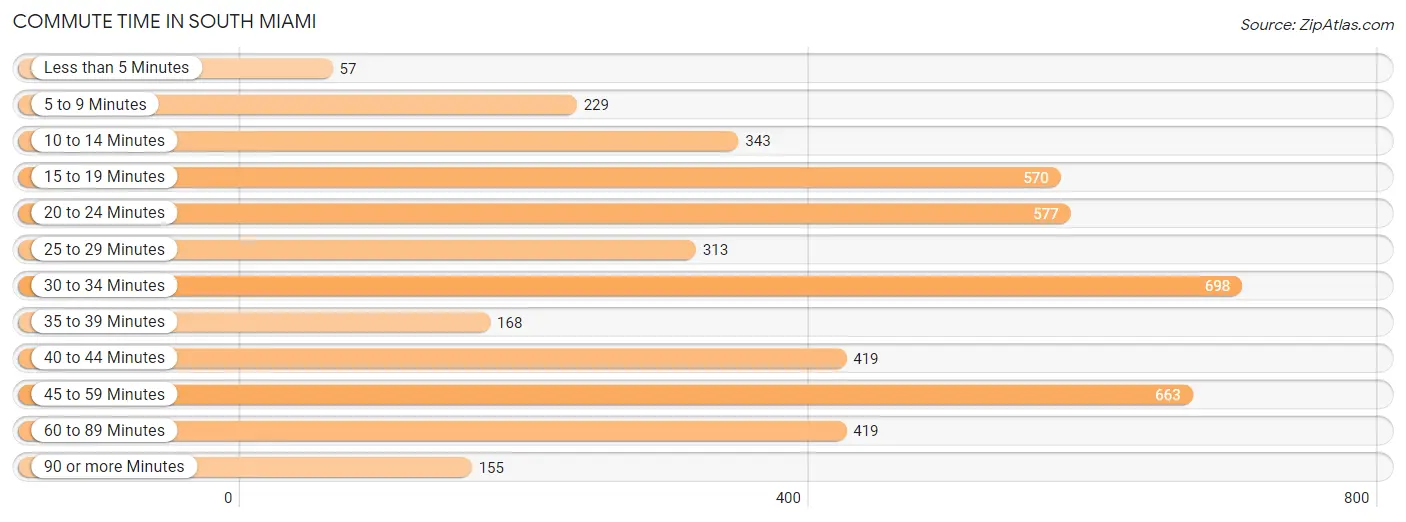
| Commute Time | # Commuters | % Commuters |
| Less than 5 Minutes | 57 | 1.2% |
| 5 to 9 Minutes | 229 | 5.0% |
| 10 to 14 Minutes | 343 | 7.4% |
| 15 to 19 Minutes | 570 | 12.4% |
| 20 to 24 Minutes | 577 | 12.5% |
| 25 to 29 Minutes | 313 | 6.8% |
| 30 to 34 Minutes | 698 | 15.1% |
| 35 to 39 Minutes | 168 | 3.6% |
| 40 to 44 Minutes | 419 | 9.1% |
| 45 to 59 Minutes | 663 | 14.4% |
| 60 to 89 Minutes | 419 | 9.1% |
| 90 or more Minutes | 155 | 3.4% |
Commute Time by Sex in South Miami
The most common commute times in South Miami are 45 to 59 minutes (412 commuters, 16.2%) for males and 20 to 24 minutes (311 commuters, 15.0%) for females.
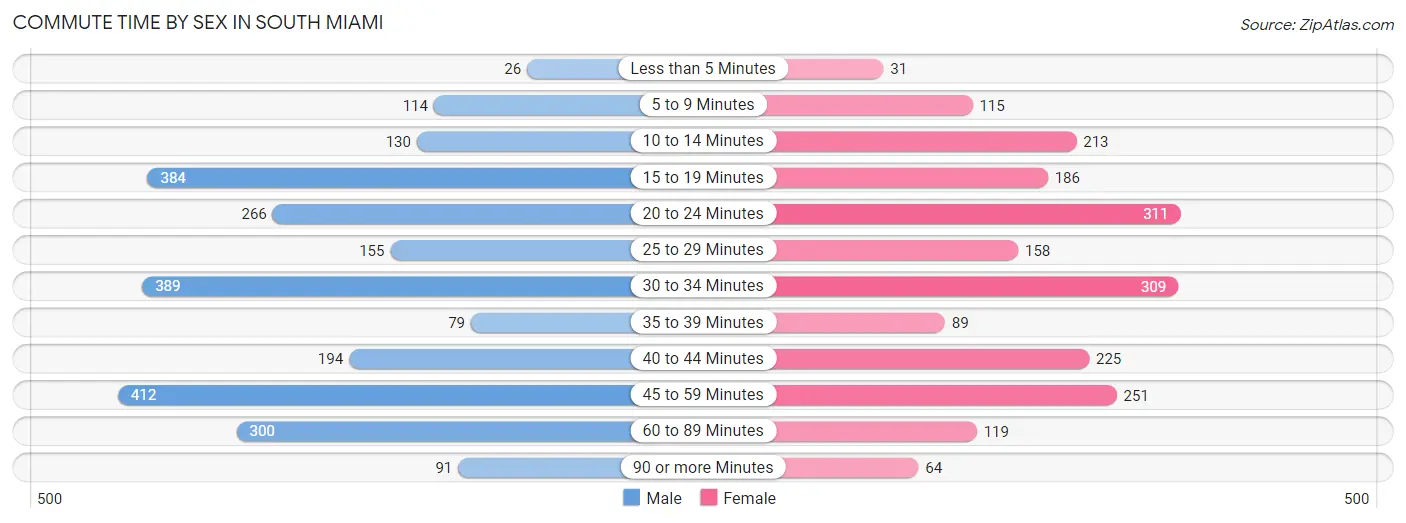
| Commute Time | Male | Female |
| Less than 5 Minutes | 26 (1.0%) | 31 (1.5%) |
| 5 to 9 Minutes | 114 (4.5%) | 115 (5.6%) |
| 10 to 14 Minutes | 130 (5.1%) | 213 (10.3%) |
| 15 to 19 Minutes | 384 (15.1%) | 186 (9.0%) |
| 20 to 24 Minutes | 266 (10.5%) | 311 (15.0%) |
| 25 to 29 Minutes | 155 (6.1%) | 158 (7.6%) |
| 30 to 34 Minutes | 389 (15.3%) | 309 (14.9%) |
| 35 to 39 Minutes | 79 (3.1%) | 89 (4.3%) |
| 40 to 44 Minutes | 194 (7.6%) | 225 (10.9%) |
| 45 to 59 Minutes | 412 (16.2%) | 251 (12.1%) |
| 60 to 89 Minutes | 300 (11.8%) | 119 (5.8%) |
| 90 or more Minutes | 91 (3.6%) | 64 (3.1%) |
Time of Departure to Work by Sex in South Miami
The most frequent times of departure to work in South Miami are 8:00 AM to 8:29 AM (629, 24.8%) for males and 9:00 AM to 9:59 AM (329, 15.9%) for females.
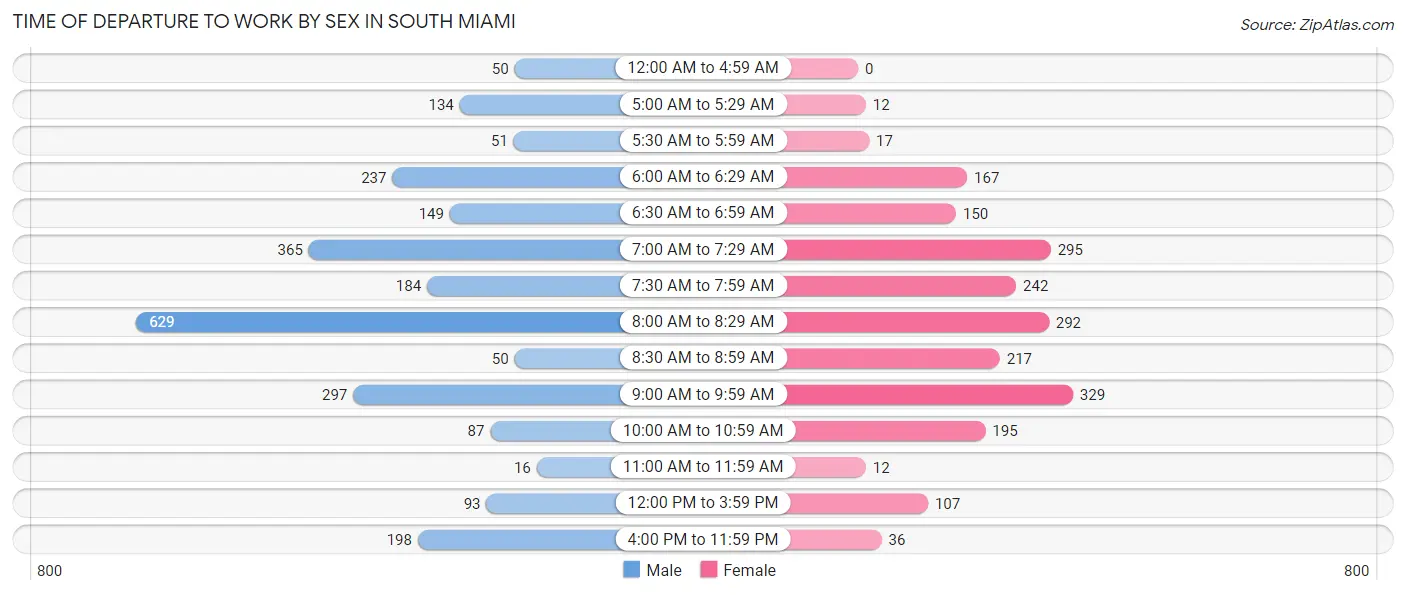
| Time of Departure | Male | Female |
| 12:00 AM to 4:59 AM | 50 (2.0%) | 0 (0.0%) |
| 5:00 AM to 5:29 AM | 134 (5.3%) | 12 (0.6%) |
| 5:30 AM to 5:59 AM | 51 (2.0%) | 17 (0.8%) |
| 6:00 AM to 6:29 AM | 237 (9.3%) | 167 (8.1%) |
| 6:30 AM to 6:59 AM | 149 (5.9%) | 150 (7.2%) |
| 7:00 AM to 7:29 AM | 365 (14.4%) | 295 (14.2%) |
| 7:30 AM to 7:59 AM | 184 (7.2%) | 242 (11.7%) |
| 8:00 AM to 8:29 AM | 629 (24.8%) | 292 (14.1%) |
| 8:30 AM to 8:59 AM | 50 (2.0%) | 217 (10.5%) |
| 9:00 AM to 9:59 AM | 297 (11.7%) | 329 (15.9%) |
| 10:00 AM to 10:59 AM | 87 (3.4%) | 195 (9.4%) |
| 11:00 AM to 11:59 AM | 16 (0.6%) | 12 (0.6%) |
| 12:00 PM to 3:59 PM | 93 (3.7%) | 107 (5.2%) |
| 4:00 PM to 11:59 PM | 198 (7.8%) | 36 (1.7%) |
| Total | 2,540 (100.0%) | 2,071 (100.0%) |
Housing Occupancy in South Miami
Occupancy by Ownership in South Miami
Of the total 4,736 dwellings in South Miami, owner-occupied units account for 2,718 (57.4%), while renter-occupied units make up 2,018 (42.6%).
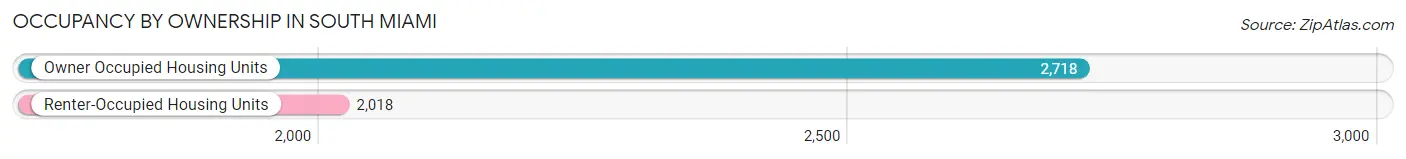
| Occupancy | # Housing Units | % Housing Units |
| Owner Occupied Housing Units | 2,718 | 57.4% |
| Renter-Occupied Housing Units | 2,018 | 42.6% |
| Total Occupied Housing Units | 4,736 | 100.0% |
Occupancy by Household Size in South Miami
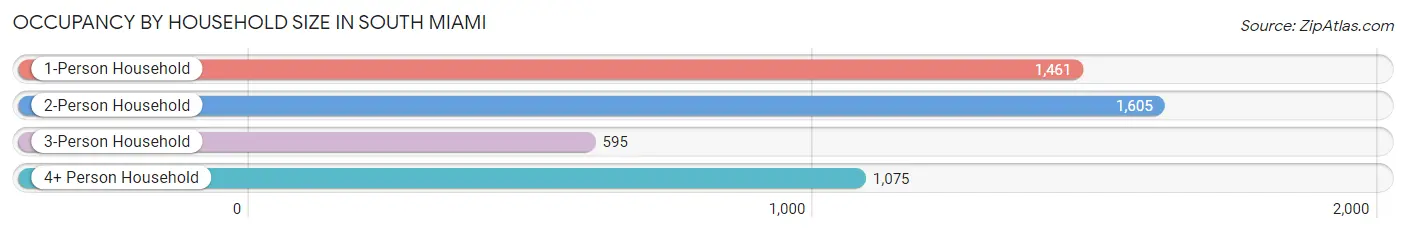
| Household Size | # Housing Units | % Housing Units |
| 1-Person Household | 1,461 | 30.8% |
| 2-Person Household | 1,605 | 33.9% |
| 3-Person Household | 595 | 12.6% |
| 4+ Person Household | 1,075 | 22.7% |
| Total Housing Units | 4,736 | 100.0% |
Occupancy by Ownership by Household Size in South Miami
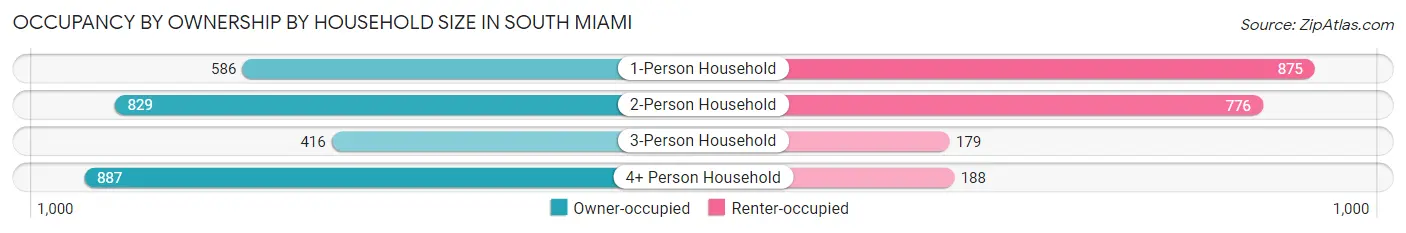
| Household Size | Owner-occupied | Renter-occupied |
| 1-Person Household | 586 (40.1%) | 875 (59.9%) |
| 2-Person Household | 829 (51.6%) | 776 (48.3%) |
| 3-Person Household | 416 (69.9%) | 179 (30.1%) |
| 4+ Person Household | 887 (82.5%) | 188 (17.5%) |
| Total Housing Units | 2,718 (57.4%) | 2,018 (42.6%) |
Occupancy by Educational Attainment in South Miami
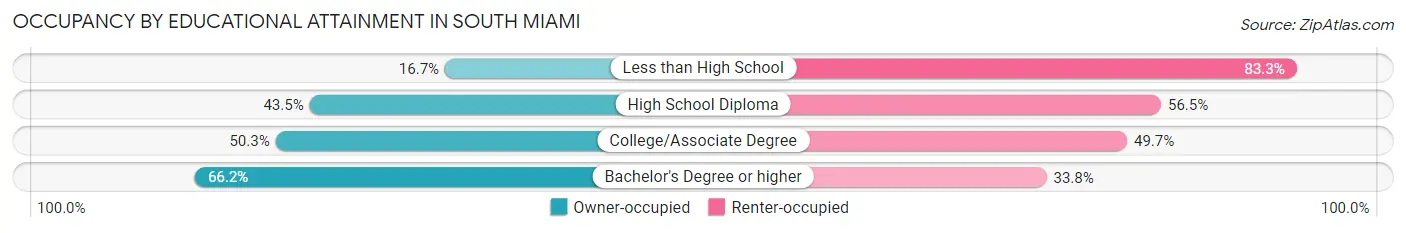
| Household Size | Owner-occupied | Renter-occupied |
| Less than High School | 38 (16.7%) | 190 (83.3%) |
| High School Diploma | 346 (43.5%) | 449 (56.5%) |
| College/Associate Degree | 393 (50.3%) | 389 (49.7%) |
| Bachelor's Degree or higher | 1,941 (66.2%) | 990 (33.8%) |
Occupancy by Age of Householder in South Miami
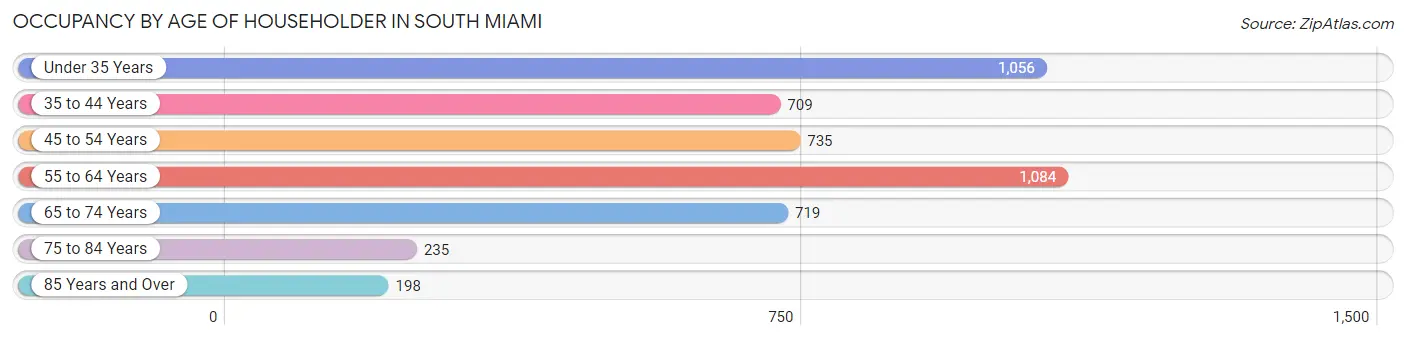
| Age Bracket | # Households | % Households |
| Under 35 Years | 1,056 | 22.3% |
| 35 to 44 Years | 709 | 15.0% |
| 45 to 54 Years | 735 | 15.5% |
| 55 to 64 Years | 1,084 | 22.9% |
| 65 to 74 Years | 719 | 15.2% |
| 75 to 84 Years | 235 | 5.0% |
| 85 Years and Over | 198 | 4.2% |
| Total | 4,736 | 100.0% |
Housing Finances in South Miami
Median Income by Occupancy in South Miami
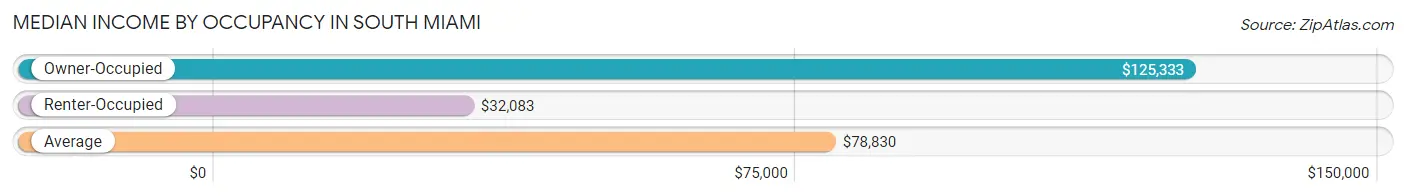
| Occupancy Type | # Households | Median Income |
| Owner-Occupied | 2,718 (57.4%) | $125,333 |
| Renter-Occupied | 2,018 (42.6%) | $32,083 |
| Average | 4,736 (100.0%) | $78,830 |
Occupancy by Householder Income Bracket in South Miami
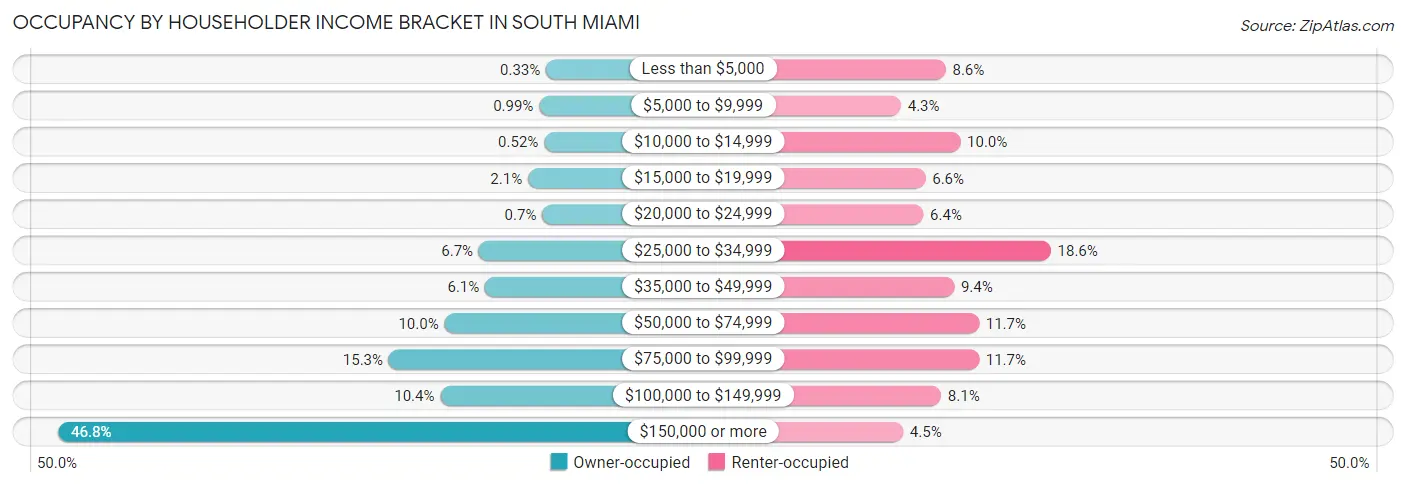
| Income Bracket | Owner-occupied | Renter-occupied |
| Less than $5,000 | 9 (0.3%) | 173 (8.6%) |
| $5,000 to $9,999 | 27 (1.0%) | 87 (4.3%) |
| $10,000 to $14,999 | 14 (0.5%) | 201 (10.0%) |
| $15,000 to $19,999 | 56 (2.1%) | 134 (6.6%) |
| $20,000 to $24,999 | 19 (0.7%) | 130 (6.4%) |
| $25,000 to $34,999 | 183 (6.7%) | 375 (18.6%) |
| $35,000 to $49,999 | 167 (6.1%) | 189 (9.4%) |
| $50,000 to $74,999 | 272 (10.0%) | 237 (11.7%) |
| $75,000 to $99,999 | 416 (15.3%) | 237 (11.7%) |
| $100,000 to $149,999 | 283 (10.4%) | 164 (8.1%) |
| $150,000 or more | 1,272 (46.8%) | 91 (4.5%) |
| Total | 2,718 (100.0%) | 2,018 (100.0%) |
Monthly Housing Cost Tiers in South Miami
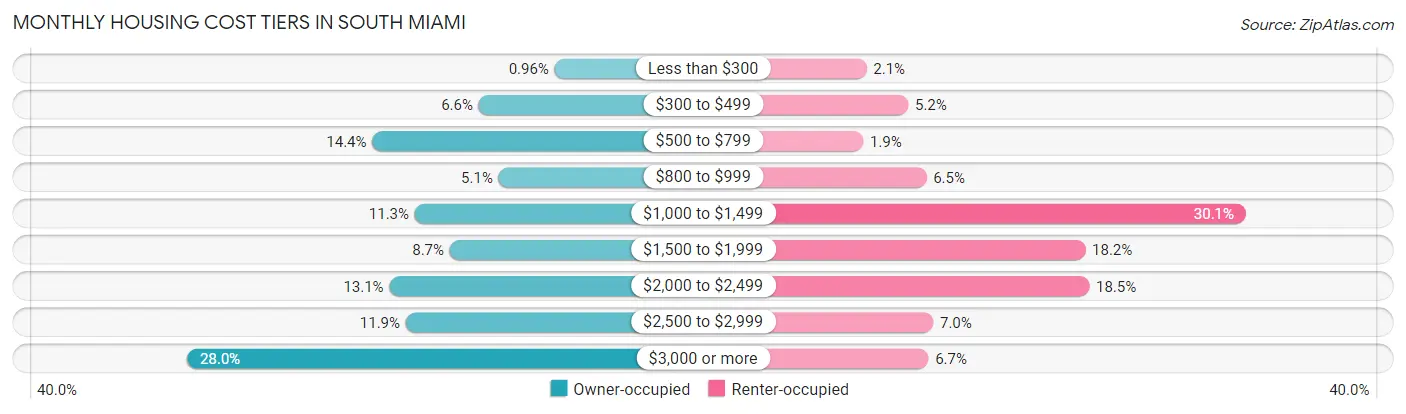
| Monthly Cost | Owner-occupied | Renter-occupied |
| Less than $300 | 26 (1.0%) | 43 (2.1%) |
| $300 to $499 | 178 (6.6%) | 105 (5.2%) |
| $500 to $799 | 391 (14.4%) | 38 (1.9%) |
| $800 to $999 | 138 (5.1%) | 132 (6.5%) |
| $1,000 to $1,499 | 306 (11.3%) | 607 (30.1%) |
| $1,500 to $1,999 | 236 (8.7%) | 368 (18.2%) |
| $2,000 to $2,499 | 357 (13.1%) | 374 (18.5%) |
| $2,500 to $2,999 | 324 (11.9%) | 142 (7.0%) |
| $3,000 or more | 762 (28.0%) | 135 (6.7%) |
| Total | 2,718 (100.0%) | 2,018 (100.0%) |
Physical Housing Characteristics in South Miami
Housing Structures in South Miami
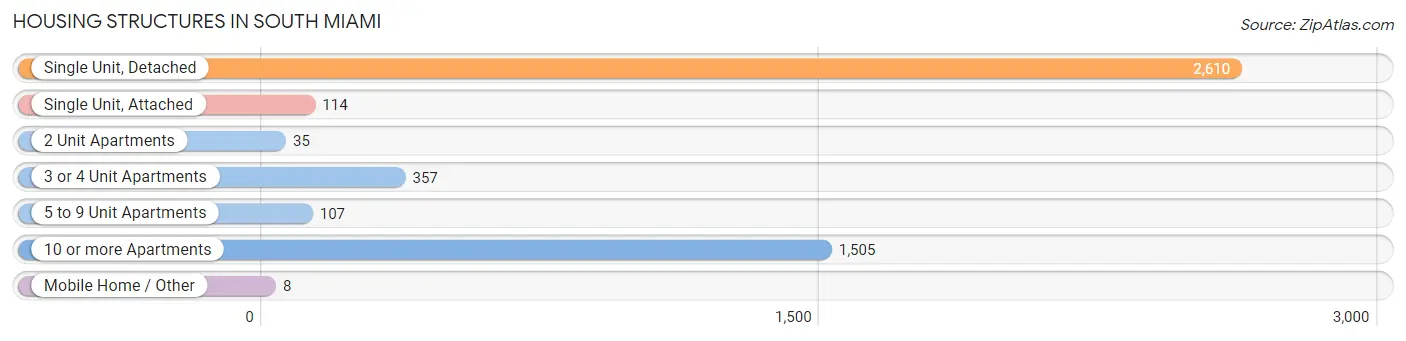
| Structure Type | # Housing Units | % Housing Units |
| Single Unit, Detached | 2,610 | 55.1% |
| Single Unit, Attached | 114 | 2.4% |
| 2 Unit Apartments | 35 | 0.7% |
| 3 or 4 Unit Apartments | 357 | 7.5% |
| 5 to 9 Unit Apartments | 107 | 2.3% |
| 10 or more Apartments | 1,505 | 31.8% |
| Mobile Home / Other | 8 | 0.2% |
| Total | 4,736 | 100.0% |
Housing Structures by Occupancy in South Miami
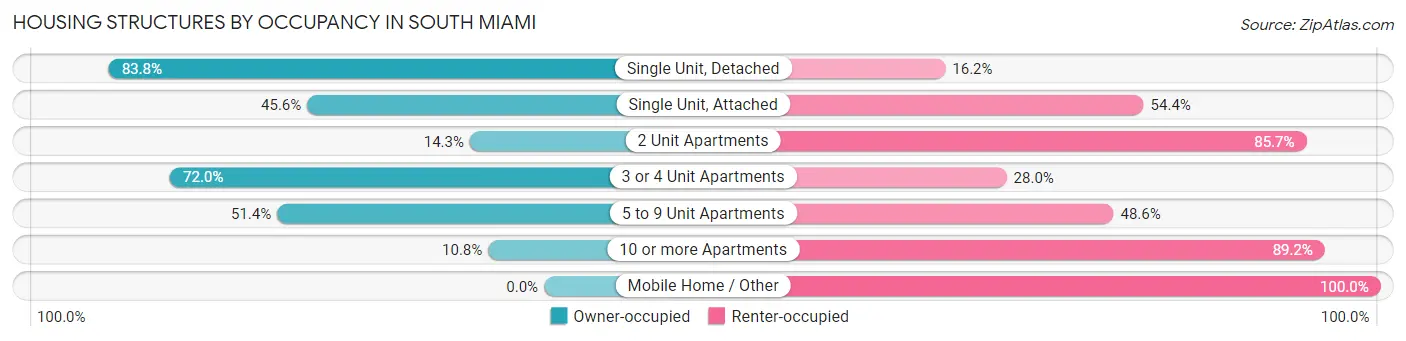
| Structure Type | Owner-occupied | Renter-occupied |
| Single Unit, Detached | 2,187 (83.8%) | 423 (16.2%) |
| Single Unit, Attached | 52 (45.6%) | 62 (54.4%) |
| 2 Unit Apartments | 5 (14.3%) | 30 (85.7%) |
| 3 or 4 Unit Apartments | 257 (72.0%) | 100 (28.0%) |
| 5 to 9 Unit Apartments | 55 (51.4%) | 52 (48.6%) |
| 10 or more Apartments | 162 (10.8%) | 1,343 (89.2%) |
| Mobile Home / Other | 0 (0.0%) | 8 (100.0%) |
| Total | 2,718 (57.4%) | 2,018 (42.6%) |
Housing Structures by Number of Rooms in South Miami
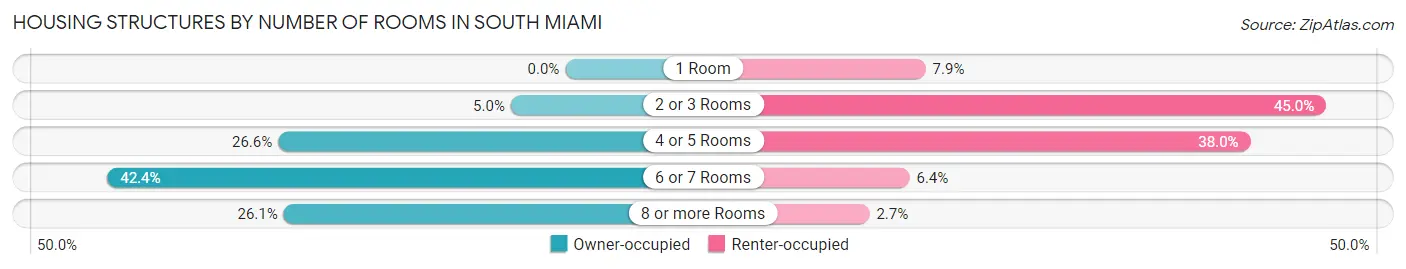
| Number of Rooms | Owner-occupied | Renter-occupied |
| 1 Room | 0 (0.0%) | 160 (7.9%) |
| 2 or 3 Rooms | 137 (5.0%) | 907 (45.0%) |
| 4 or 5 Rooms | 722 (26.6%) | 766 (38.0%) |
| 6 or 7 Rooms | 1,151 (42.3%) | 130 (6.4%) |
| 8 or more Rooms | 708 (26.1%) | 55 (2.7%) |
| Total | 2,718 (100.0%) | 2,018 (100.0%) |
Housing Structure by Heating Type in South Miami
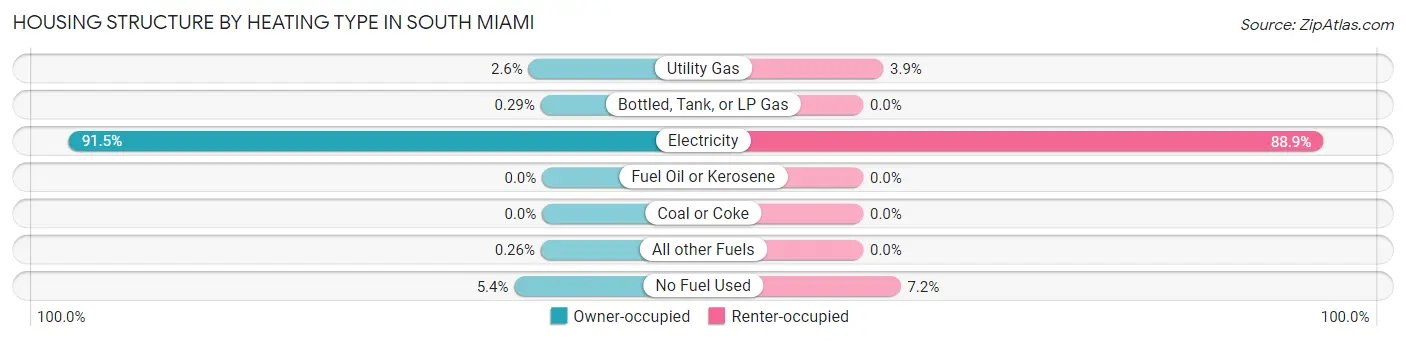
| Heating Type | Owner-occupied | Renter-occupied |
| Utility Gas | 71 (2.6%) | 78 (3.9%) |
| Bottled, Tank, or LP Gas | 8 (0.3%) | 0 (0.0%) |
| Electricity | 2,486 (91.5%) | 1,794 (88.9%) |
| Fuel Oil or Kerosene | 0 (0.0%) | 0 (0.0%) |
| Coal or Coke | 0 (0.0%) | 0 (0.0%) |
| All other Fuels | 7 (0.3%) | 0 (0.0%) |
| No Fuel Used | 146 (5.4%) | 146 (7.2%) |
| Total | 2,718 (100.0%) | 2,018 (100.0%) |
Household Vehicle Usage in South Miami
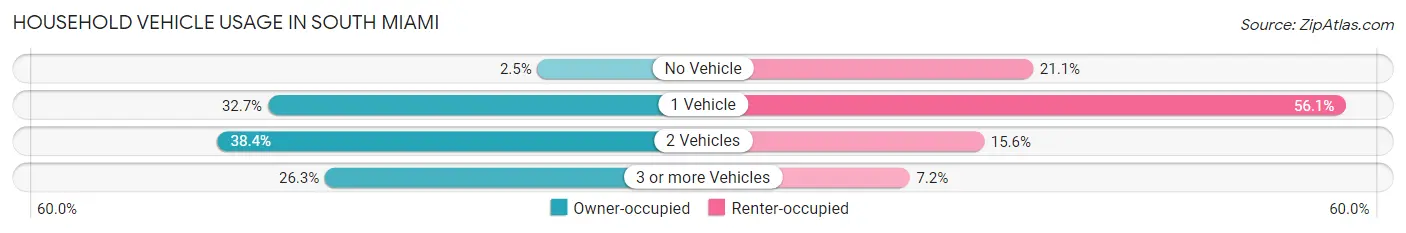
| Vehicles per Household | Owner-occupied | Renter-occupied |
| No Vehicle | 69 (2.5%) | 425 (21.1%) |
| 1 Vehicle | 890 (32.7%) | 1,133 (56.1%) |
| 2 Vehicles | 1,043 (38.4%) | 314 (15.6%) |
| 3 or more Vehicles | 716 (26.3%) | 146 (7.2%) |
| Total | 2,718 (100.0%) | 2,018 (100.0%) |
Real Estate & Mortgages in South Miami
Real Estate and Mortgage Overview in South Miami
| Characteristic | Without Mortgage | With Mortgage |
| Housing Units | 1,095 | 1,623 |
| Median Property Value | $613,800 | $739,200 |
| Median Household Income | $81,607 | $934 |
| Monthly Housing Costs | $763 | $762 |
| Real Estate Taxes | $4,087 | $19 |
Property Value by Mortgage Status in South Miami
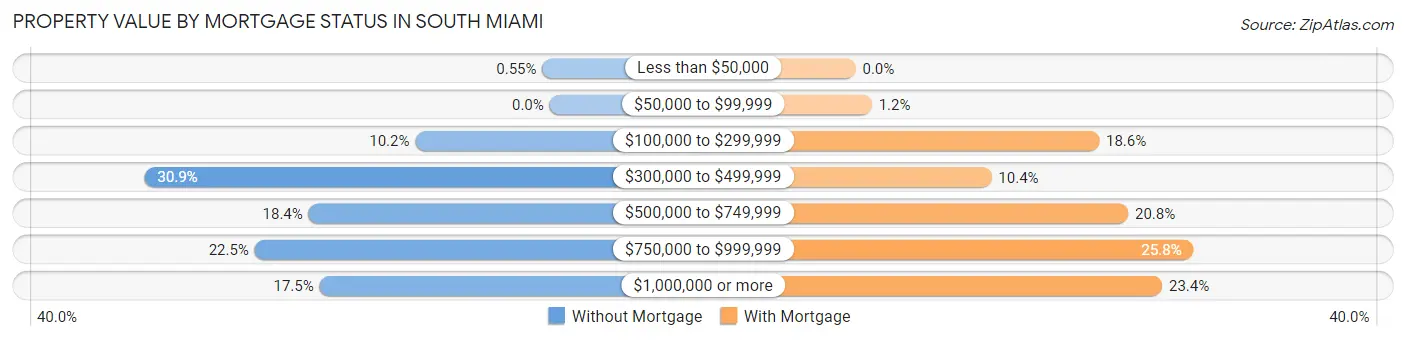
| Property Value | Without Mortgage | With Mortgage |
| Less than $50,000 | 6 (0.5%) | 0 (0.0%) |
| $50,000 to $99,999 | 0 (0.0%) | 20 (1.2%) |
| $100,000 to $299,999 | 112 (10.2%) | 301 (18.5%) |
| $300,000 to $499,999 | 338 (30.9%) | 168 (10.3%) |
| $500,000 to $749,999 | 201 (18.4%) | 337 (20.8%) |
| $750,000 to $999,999 | 246 (22.5%) | 418 (25.8%) |
| $1,000,000 or more | 192 (17.5%) | 379 (23.4%) |
| Total | 1,095 (100.0%) | 1,623 (100.0%) |
Household Income by Mortgage Status in South Miami
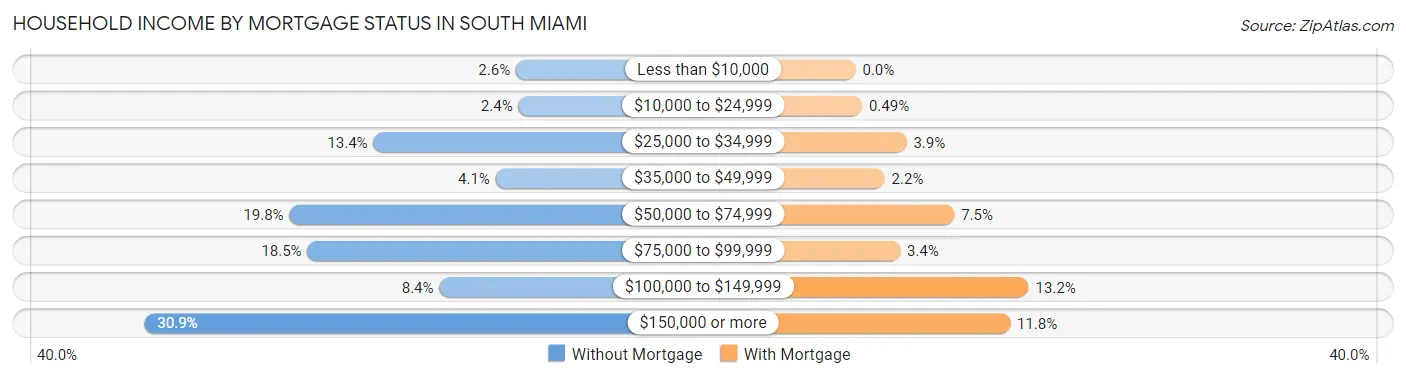
| Household Income | Without Mortgage | With Mortgage |
| Less than $10,000 | 28 (2.6%) | 0 (0.0%) |
| $10,000 to $24,999 | 26 (2.4%) | 8 (0.5%) |
| $25,000 to $34,999 | 147 (13.4%) | 63 (3.9%) |
| $35,000 to $49,999 | 45 (4.1%) | 36 (2.2%) |
| $50,000 to $74,999 | 217 (19.8%) | 122 (7.5%) |
| $75,000 to $99,999 | 202 (18.4%) | 55 (3.4%) |
| $100,000 to $149,999 | 92 (8.4%) | 214 (13.2%) |
| $150,000 or more | 338 (30.9%) | 191 (11.8%) |
| Total | 1,095 (100.0%) | 1,623 (100.0%) |
Property Value to Household Income Ratio in South Miami
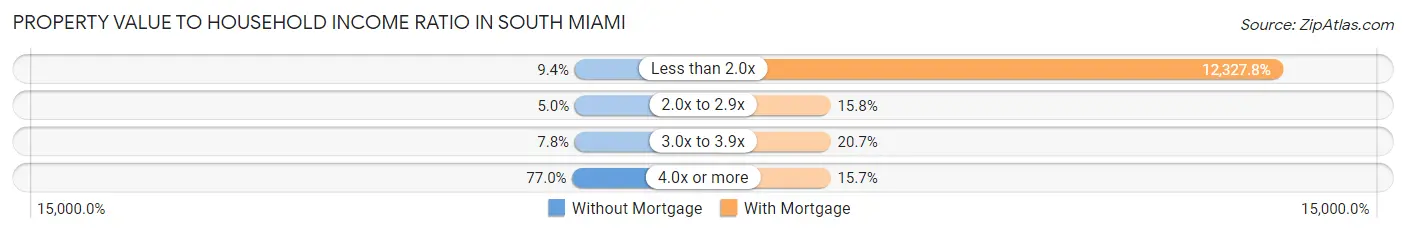
| Value-to-Income Ratio | Without Mortgage | With Mortgage |
| Less than 2.0x | 103 (9.4%) | 200,080 (12,327.8%) |
| 2.0x to 2.9x | 55 (5.0%) | 256 (15.8%) |
| 3.0x to 3.9x | 85 (7.8%) | 336 (20.7%) |
| 4.0x or more | 843 (77.0%) | 255 (15.7%) |
| Total | 1,095 (100.0%) | 1,623 (100.0%) |
Real Estate Taxes by Mortgage Status in South Miami
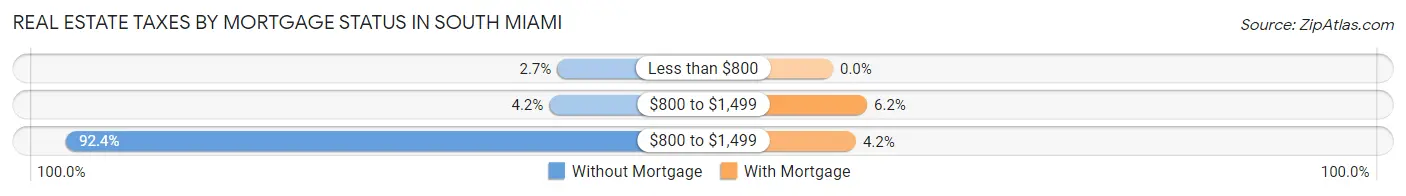
| Property Taxes | Without Mortgage | With Mortgage |
| Less than $800 | 30 (2.7%) | 0 (0.0%) |
| $800 to $1,499 | 46 (4.2%) | 101 (6.2%) |
| $800 to $1,499 | 1,012 (92.4%) | 68 (4.2%) |
| Total | 1,095 (100.0%) | 1,623 (100.0%) |
Health & Disability in South Miami
Health Insurance Coverage by Age in South Miami
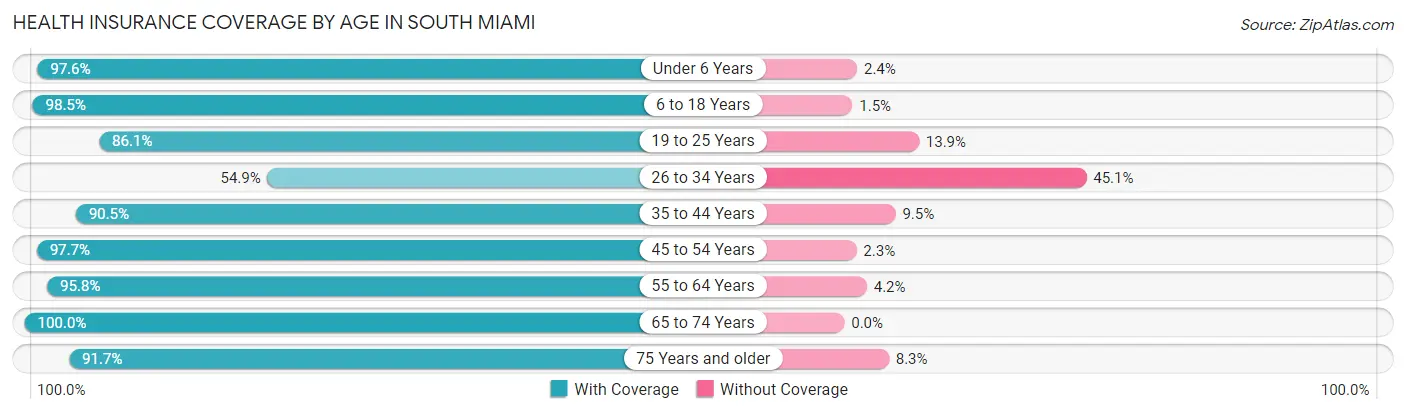
| Age Bracket | With Coverage | Without Coverage |
| Under 6 Years | 821 (97.6%) | 20 (2.4%) |
| 6 to 18 Years | 1,441 (98.5%) | 22 (1.5%) |
| 19 to 25 Years | 1,140 (86.1%) | 184 (13.9%) |
| 26 to 34 Years | 951 (54.9%) | 782 (45.1%) |
| 35 to 44 Years | 1,290 (90.5%) | 136 (9.5%) |
| 45 to 54 Years | 1,253 (97.7%) | 29 (2.3%) |
| 55 to 64 Years | 1,785 (95.8%) | 78 (4.2%) |
| 65 to 74 Years | 1,357 (100.0%) | 0 (0.0%) |
| 75 Years and older | 530 (91.7%) | 48 (8.3%) |
| Total | 10,568 (89.0%) | 1,299 (11.0%) |
Health Insurance Coverage by Citizenship Status in South Miami
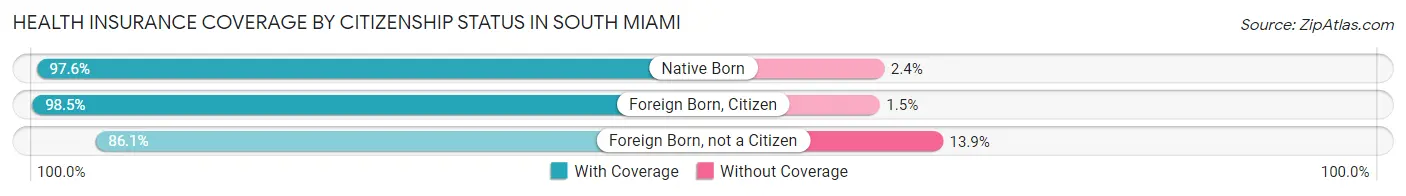
| Citizenship Status | With Coverage | Without Coverage |
| Native Born | 821 (97.6%) | 20 (2.4%) |
| Foreign Born, Citizen | 1,441 (98.5%) | 22 (1.5%) |
| Foreign Born, not a Citizen | 1,140 (86.1%) | 184 (13.9%) |
Health Insurance Coverage by Household Income in South Miami
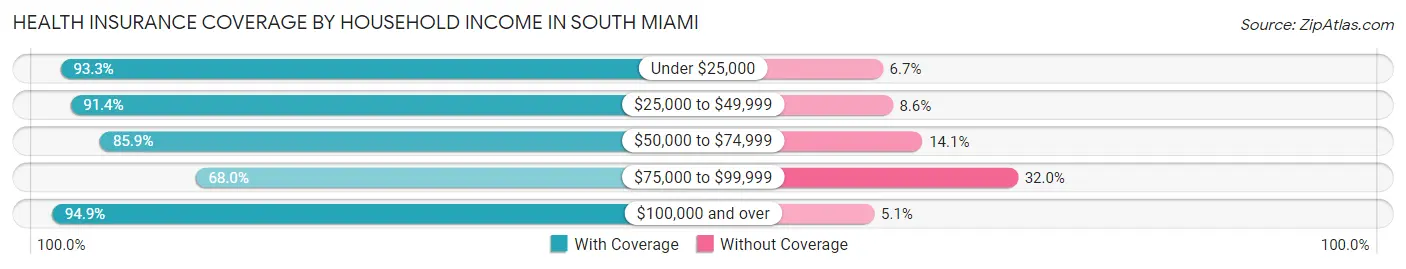
| Household Income | With Coverage | Without Coverage |
| Under $25,000 | 1,319 (93.3%) | 95 (6.7%) |
| $25,000 to $49,999 | 1,549 (91.4%) | 145 (8.6%) |
| $50,000 to $74,999 | 954 (85.9%) | 157 (14.1%) |
| $75,000 to $99,999 | 1,274 (68.0%) | 600 (32.0%) |
| $100,000 and over | 5,446 (94.9%) | 294 (5.1%) |
Public vs Private Health Insurance Coverage by Age in South Miami
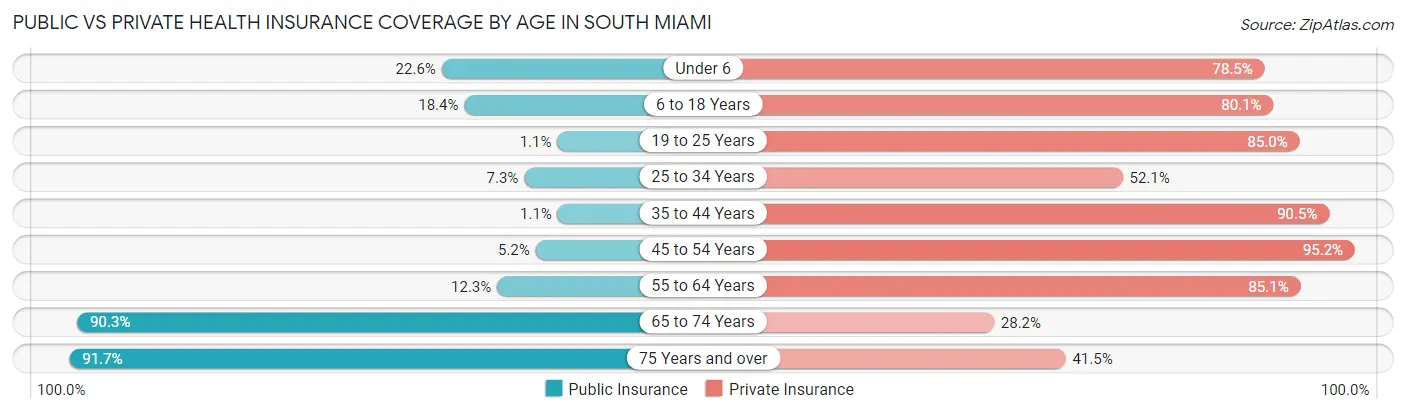
| Age Bracket | Public Insurance | Private Insurance |
| Under 6 | 190 (22.6%) | 660 (78.5%) |
| 6 to 18 Years | 269 (18.4%) | 1,172 (80.1%) |
| 19 to 25 Years | 15 (1.1%) | 1,125 (85.0%) |
| 25 to 34 Years | 126 (7.3%) | 903 (52.1%) |
| 35 to 44 Years | 15 (1.1%) | 1,290 (90.5%) |
| 45 to 54 Years | 66 (5.1%) | 1,221 (95.2%) |
| 55 to 64 Years | 229 (12.3%) | 1,586 (85.1%) |
| 65 to 74 Years | 1,225 (90.3%) | 383 (28.2%) |
| 75 Years and over | 530 (91.7%) | 240 (41.5%) |
| Total | 2,665 (22.5%) | 8,580 (72.3%) |
Disability Status by Sex by Age in South Miami
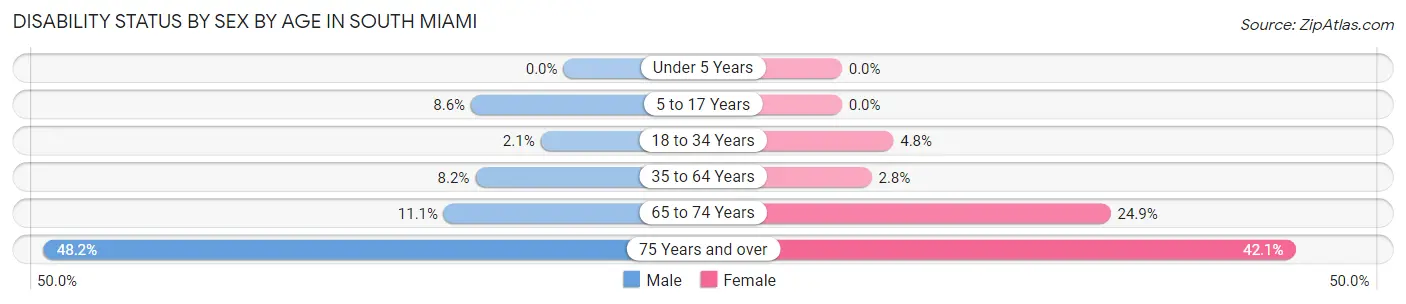
| Age Bracket | Male | Female |
| Under 5 Years | 0 (0.0%) | 0 (0.0%) |
| 5 to 17 Years | 59 (8.6%) | 0 (0.0%) |
| 18 to 34 Years | 35 (2.1%) | 73 (4.8%) |
| 35 to 64 Years | 184 (8.2%) | 64 (2.8%) |
| 65 to 74 Years | 54 (11.1%) | 217 (24.9%) |
| 75 Years and over | 108 (48.2%) | 149 (42.1%) |
Disability Class by Sex by Age in South Miami
Disability Class: Hearing Difficulty
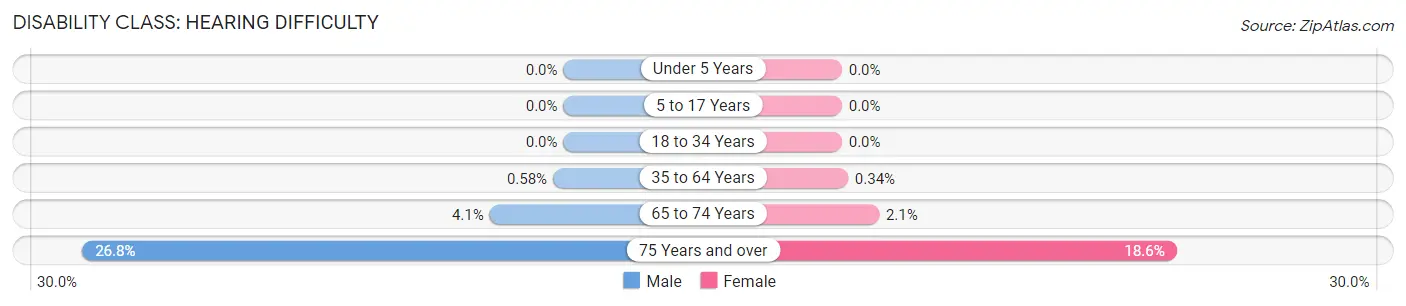
| Age Bracket | Male | Female |
| Under 5 Years | 0 (0.0%) | 0 (0.0%) |
| 5 to 17 Years | 0 (0.0%) | 0 (0.0%) |
| 18 to 34 Years | 0 (0.0%) | 0 (0.0%) |
| 35 to 64 Years | 13 (0.6%) | 8 (0.3%) |
| 65 to 74 Years | 20 (4.1%) | 18 (2.1%) |
| 75 Years and over | 60 (26.8%) | 66 (18.6%) |
Disability Class: Vision Difficulty
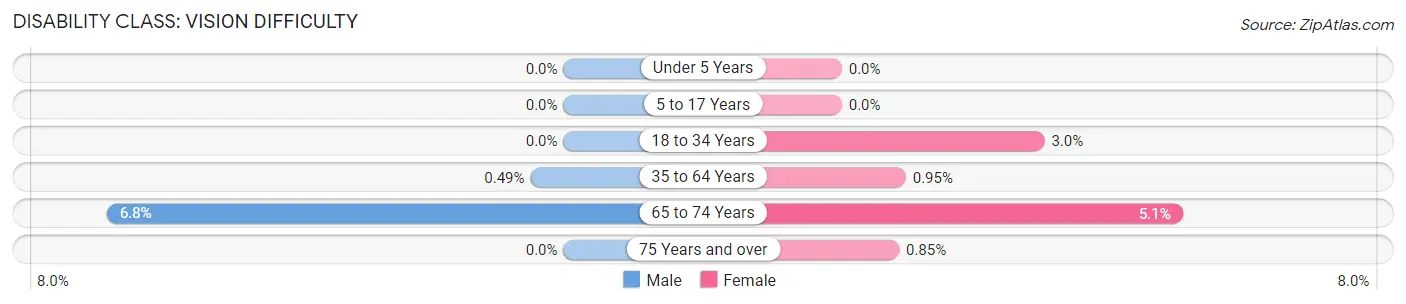
| Age Bracket | Male | Female |
| Under 5 Years | 0 (0.0%) | 0 (0.0%) |
| 5 to 17 Years | 0 (0.0%) | 0 (0.0%) |
| 18 to 34 Years | 0 (0.0%) | 46 (3.0%) |
| 35 to 64 Years | 11 (0.5%) | 22 (0.9%) |
| 65 to 74 Years | 33 (6.8%) | 44 (5.1%) |
| 75 Years and over | 0 (0.0%) | 3 (0.9%) |
Disability Class: Cognitive Difficulty
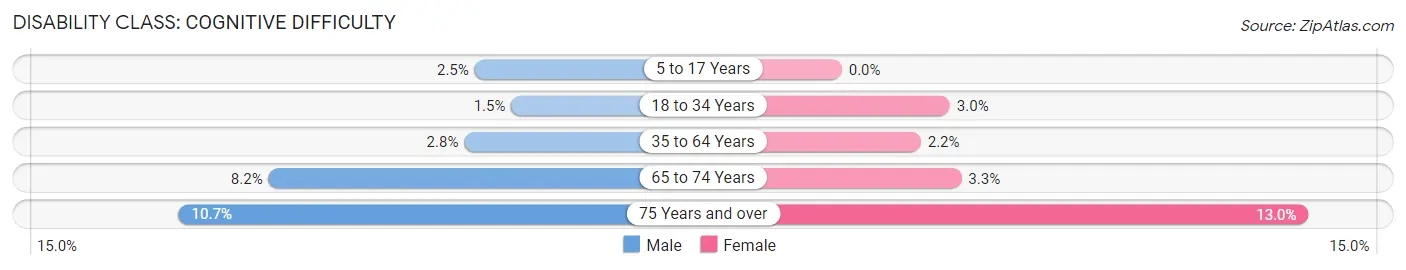
| Age Bracket | Male | Female |
| 5 to 17 Years | 17 (2.5%) | 0 (0.0%) |
| 18 to 34 Years | 24 (1.5%) | 46 (3.0%) |
| 35 to 64 Years | 62 (2.8%) | 51 (2.2%) |
| 65 to 74 Years | 40 (8.2%) | 29 (3.3%) |
| 75 Years and over | 24 (10.7%) | 46 (13.0%) |
Disability Class: Ambulatory Difficulty
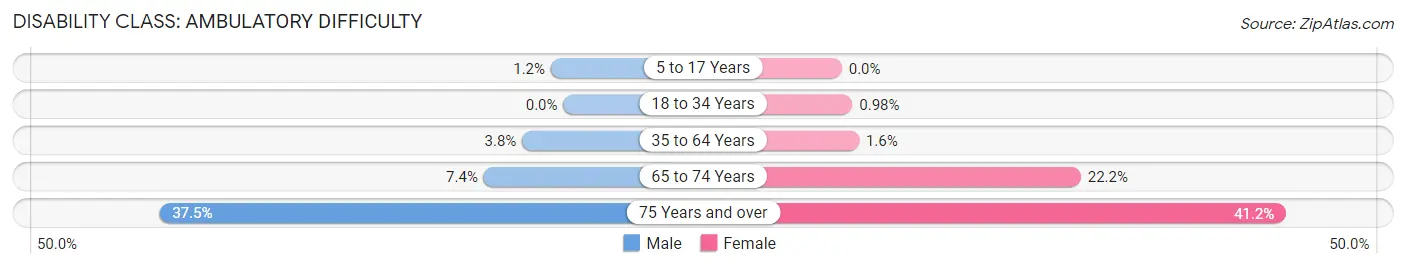
| Age Bracket | Male | Female |
| 5 to 17 Years | 8 (1.2%) | 0 (0.0%) |
| 18 to 34 Years | 0 (0.0%) | 15 (1.0%) |
| 35 to 64 Years | 86 (3.8%) | 37 (1.6%) |
| 65 to 74 Years | 36 (7.4%) | 193 (22.2%) |
| 75 Years and over | 84 (37.5%) | 146 (41.2%) |
Disability Class: Self-Care Difficulty
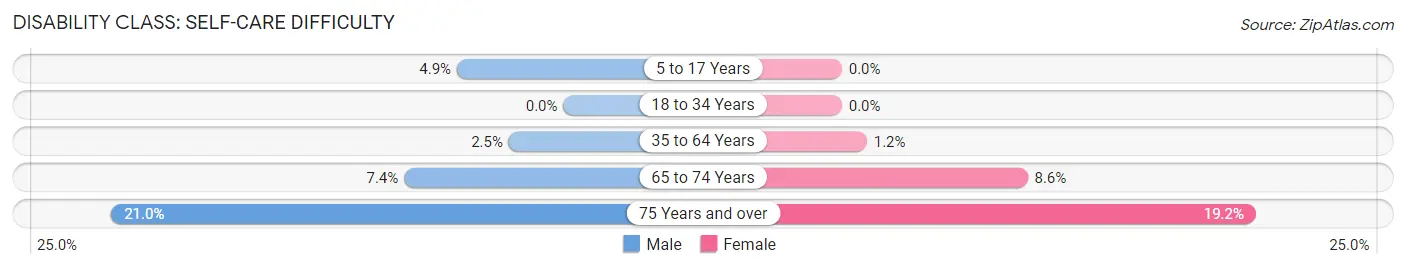
| Age Bracket | Male | Female |
| 5 to 17 Years | 34 (4.9%) | 0 (0.0%) |
| 18 to 34 Years | 0 (0.0%) | 0 (0.0%) |
| 35 to 64 Years | 57 (2.5%) | 27 (1.2%) |
| 65 to 74 Years | 36 (7.4%) | 75 (8.6%) |
| 75 Years and over | 47 (21.0%) | 68 (19.2%) |
Technology Access in South Miami
Computing Device Access in South Miami
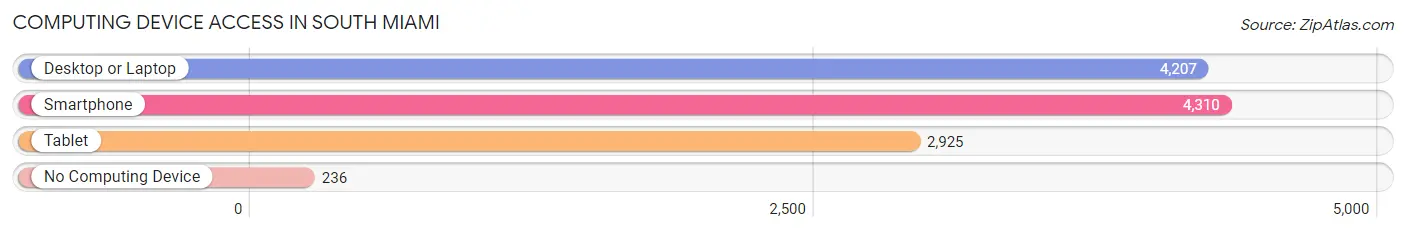
| Device Type | # Households | % Households |
| Desktop or Laptop | 4,207 | 88.8% |
| Smartphone | 4,310 | 91.0% |
| Tablet | 2,925 | 61.8% |
| No Computing Device | 236 | 5.0% |
| Total | 4,736 | 100.0% |
Internet Access in South Miami
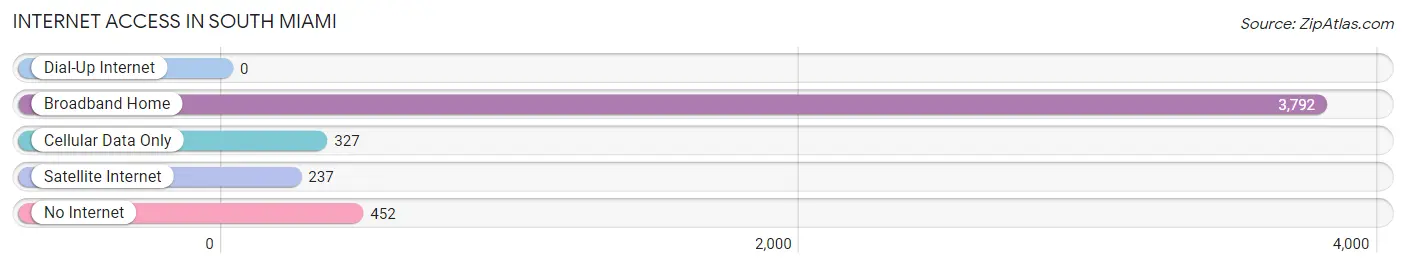
| Internet Type | # Households | % Households |
| Dial-Up Internet | 0 | 0.0% |
| Broadband Home | 3,792 | 80.1% |
| Cellular Data Only | 327 | 6.9% |
| Satellite Internet | 237 | 5.0% |
| No Internet | 452 | 9.5% |
| Total | 4,736 | 100.0% |
South Miami Summary
Miami-Dade County, Florida, is home to the city of South Miami, a vibrant and diverse community located just south of the city of Miami. South Miami is a city of approximately 11,000 people, and is located in the southernmost part of Miami-Dade County. The city is bordered by the cities of Coral Gables, Pinecrest, and Cutler Bay. South Miami is known for its vibrant culture, diverse population, and beautiful parks and recreation areas.
History
South Miami was founded in 1925 by a group of developers who wanted to create a residential community in the area. The city was originally named “Frog City” due to the abundance of frogs in the area. The name was later changed to South Miami in 1926. The city was incorporated in 1927 and has since grown to become a vibrant and diverse community.
Geography
South Miami is located in the southernmost part of Miami-Dade County, Florida. The city is bordered by the cities of Coral Gables, Pinecrest, and Cutler Bay. South Miami is located on the Miami Rock Ridge, a geological formation that runs through the city. The city is also located near the Miami River, which provides a natural border between South Miami and the city of Miami.
The city of South Miami is divided into two distinct areas: the residential area and the commercial area. The residential area is located in the northern part of the city and is home to a variety of single-family homes, townhomes, and condominiums. The commercial area is located in the southern part of the city and is home to a variety of businesses, including restaurants, retail stores, and office buildings.
Economy
South Miami is home to a variety of businesses, including restaurants, retail stores, and office buildings. The city is also home to a number of medical facilities, including the University of Miami Hospital and the South Miami Hospital. The city is also home to a number of educational institutions, including the University of Miami, Florida International University, and Miami Dade College.
The city of South Miami is also home to a number of parks and recreation areas, including the South Miami Community Park, the South Miami Nature Preserve, and the South Miami Dog Park. The city is also home to a number of cultural attractions, including the South Miami Art Museum, the South Miami Cultural Center, and the South Miami Performing Arts Center.
Demographics
As of the 2010 census, the population of South Miami was 11,932. The racial makeup of the city was 57.3% White, 28.2% African American, 0.3% Native American, 3.2% Asian, 0.1% Pacific Islander, 8.2% from other races, and 2.0% from two or more races. Hispanic or Latino of any race were 33.2% of the population.
The median income for a household in South Miami was $45,845, and the median income for a family was $50,919. The per capita income for the city was $25,945. About 15.2% of families and 18.2% of the population were below the poverty line, including 25.2% of those under age 18 and 11.2% of those age 65 or over.
South Miami is a vibrant and diverse community that is home to a variety of businesses, educational institutions, parks, and cultural attractions. The city is also home to a diverse population, with a variety of racial and ethnic backgrounds. South Miami is a great place to live, work, and play, and is a great example of the diversity and vibrancy of Miami-Dade County.
Common Questions
What is Per Capita Income in South Miami?
Per Capita income in South Miami is $54,310.
What is the Median Family Income in South Miami?
Median Family Income in South Miami is $99,719.
What is the Median Household income in South Miami?
Median Household Income in South Miami is $78,830.
What is Income or Wage Gap in South Miami?
Income or Wage Gap in South Miami is 1.7%.
Women in South Miami earn 98.3 cents for every dollar earned by a man.
What is Inequality or Gini Index in South Miami?
Inequality or Gini Index in South Miami is 0.56.
What is the Total Population of South Miami?
Total Population of South Miami is 11,944.
What is the Total Male Population of South Miami?
Total Male Population of South Miami is 5,883.
What is the Total Female Population of South Miami?
Total Female Population of South Miami is 6,061.
What is the Ratio of Males per 100 Females in South Miami?
There are 97.06 Males per 100 Females in South Miami.
What is the Ratio of Females per 100 Males in South Miami?
There are 103.03 Females per 100 Males in South Miami.
What is the Median Population Age in South Miami?
Median Population Age in South Miami is 39.6 Years.
What is the Average Family Size in South Miami
Average Family Size in South Miami is 3.3 People.
What is the Average Household Size in South Miami
Average Household Size in South Miami is 2.5 People.
How Large is the Labor Force in South Miami?
There are 6,527 People in the Labor Forcein in South Miami.
What is the Percentage of People in the Labor Force in South Miami?
66.1% of People are in the Labor Force in South Miami.
What is the Unemployment Rate in South Miami?
Unemployment Rate in South Miami is 3.9%.