Lily Lake, WI Map & Demographics
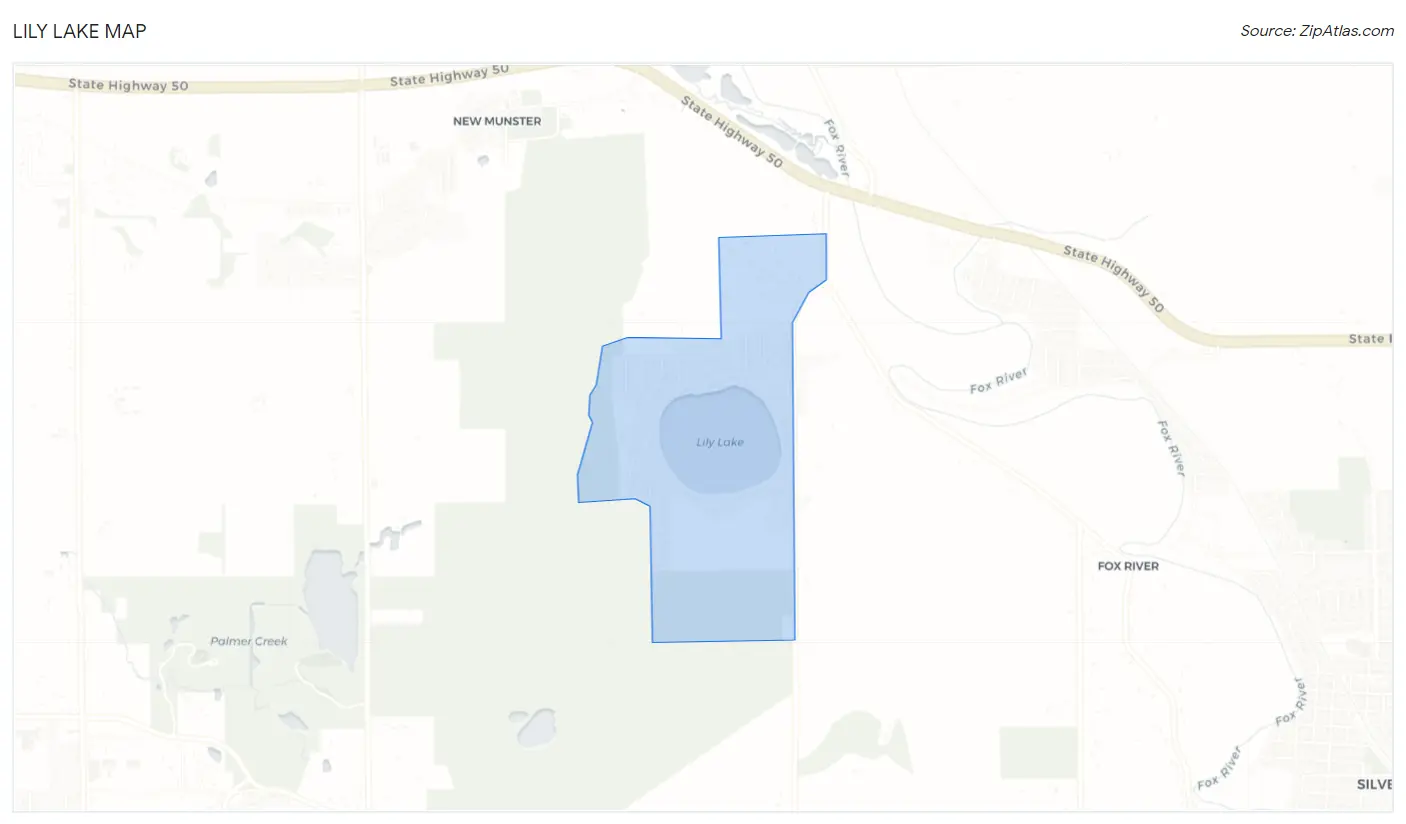
Lily Lake Map
Lily Lake Overview
$38,100
PER CAPITA INCOME
$93,468
AVG FAMILY INCOME
$93,629
AVG HOUSEHOLD INCOME
0.1%
WAGE / INCOME GAP [ % ]
99.9¢/ $1
WAGE / INCOME GAP [ $ ]
0.18
INEQUALITY / GINI INDEX
593
TOTAL POPULATION
334
MALE POPULATION
259
FEMALE POPULATION
128.96
MALES / 100 FEMALES
77.54
FEMALES / 100 MALES
38.2
MEDIAN AGE
2.7
AVG FAMILY SIZE
2.6
AVG HOUSEHOLD SIZE
354
LABOR FORCE [ PEOPLE ]
75.6%
PERCENT IN LABOR FORCE
Income in Lily Lake
Income Overview in Lily Lake
Per Capita Income in Lily Lake is $38,100, while median incomes of families and households are $93,468 and $93,629 respectively.
| Characteristic | Number | Measure |
| Per Capita Income | 593 | $38,100 |
| Median Family Income | 210 | $93,468 |
| Mean Family Income | 210 | $98,083 |
| Median Household Income | 230 | $93,629 |
| Mean Household Income | 230 | $96,369 |
| Income Deficit | 210 | $0 |
| Wage / Income Gap (%) | 593 | 0.07% |
| Wage / Income Gap ($) | 593 | 99.93¢ per $1 |
| Gini / Inequality Index | 593 | 0.18 |
Earnings by Sex in Lily Lake
Average Earnings in Lily Lake are $47,000, $47,009 for men and $46,974 for women, a difference of 0.1%.
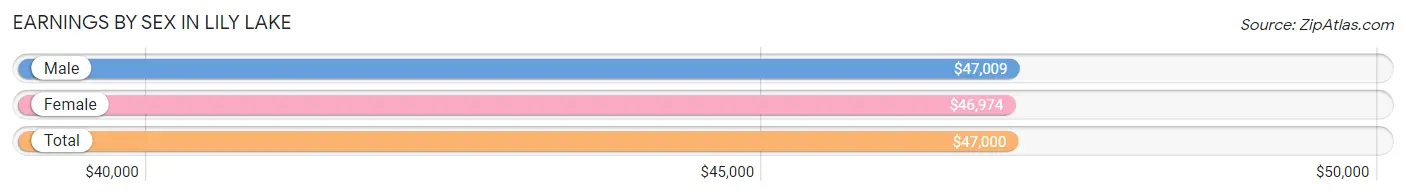
| Sex | Number | Average Earnings |
| Male | 240 (65.2%) | $47,009 |
| Female | 128 (34.8%) | $46,974 |
| Total | 368 (100.0%) | $47,000 |
Earnings by Sex by Income Bracket in Lily Lake
The most common earnings brackets in Lily Lake are $75,000 to $99,999 for men (61 | 25.4%) and $50,000 to $54,999 for women (37 | 28.9%).
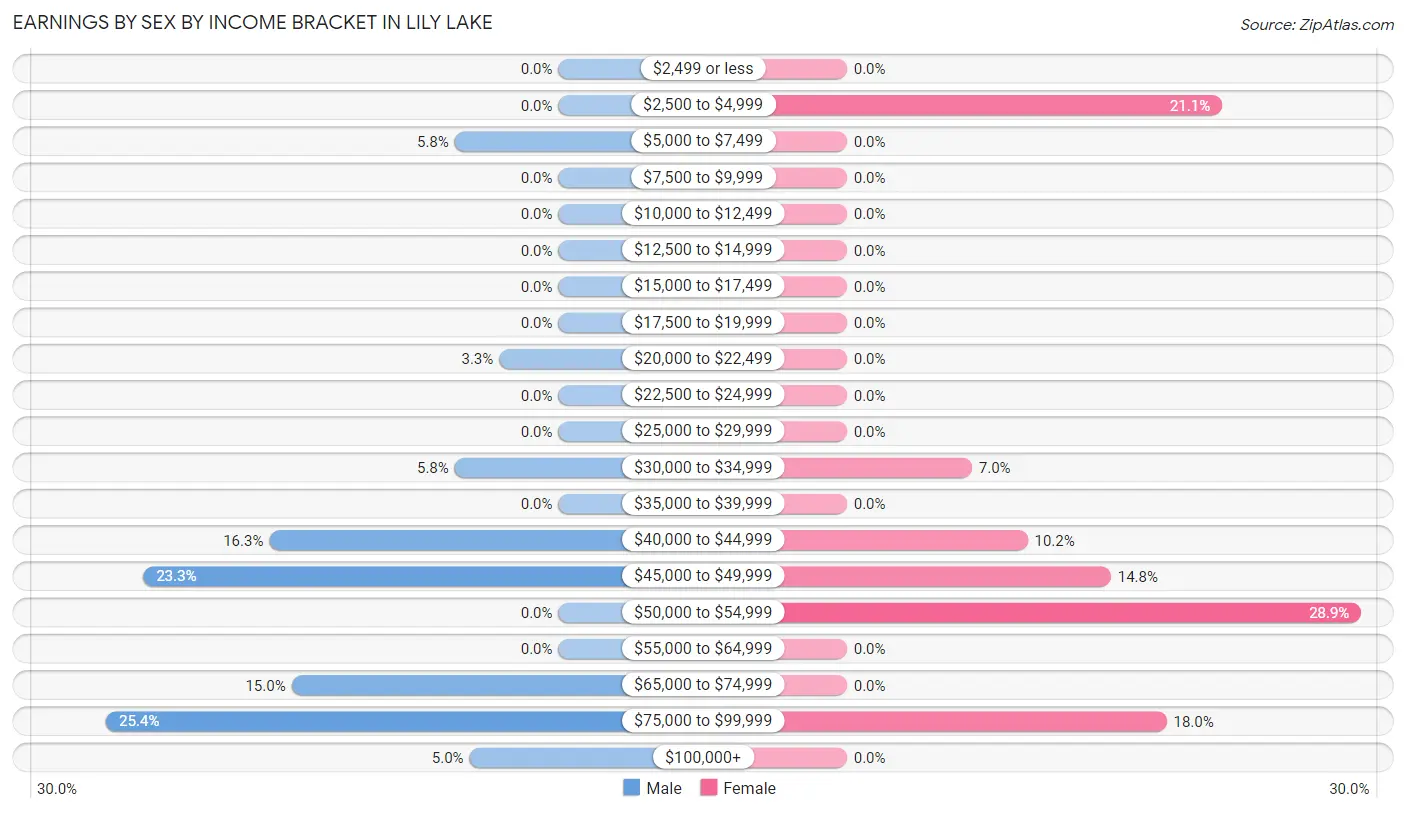
| Income | Male | Female |
| $2,499 or less | 0 (0.0%) | 0 (0.0%) |
| $2,500 to $4,999 | 0 (0.0%) | 27 (21.1%) |
| $5,000 to $7,499 | 14 (5.8%) | 0 (0.0%) |
| $7,500 to $9,999 | 0 (0.0%) | 0 (0.0%) |
| $10,000 to $12,499 | 0 (0.0%) | 0 (0.0%) |
| $12,500 to $14,999 | 0 (0.0%) | 0 (0.0%) |
| $15,000 to $17,499 | 0 (0.0%) | 0 (0.0%) |
| $17,500 to $19,999 | 0 (0.0%) | 0 (0.0%) |
| $20,000 to $22,499 | 8 (3.3%) | 0 (0.0%) |
| $22,500 to $24,999 | 0 (0.0%) | 0 (0.0%) |
| $25,000 to $29,999 | 0 (0.0%) | 0 (0.0%) |
| $30,000 to $34,999 | 14 (5.8%) | 9 (7.0%) |
| $35,000 to $39,999 | 0 (0.0%) | 0 (0.0%) |
| $40,000 to $44,999 | 39 (16.3%) | 13 (10.2%) |
| $45,000 to $49,999 | 56 (23.3%) | 19 (14.8%) |
| $50,000 to $54,999 | 0 (0.0%) | 37 (28.9%) |
| $55,000 to $64,999 | 0 (0.0%) | 0 (0.0%) |
| $65,000 to $74,999 | 36 (15.0%) | 0 (0.0%) |
| $75,000 to $99,999 | 61 (25.4%) | 23 (18.0%) |
| $100,000+ | 12 (5.0%) | 0 (0.0%) |
| Total | 240 (100.0%) | 128 (100.0%) |
Earnings by Sex by Educational Attainment in Lily Lake
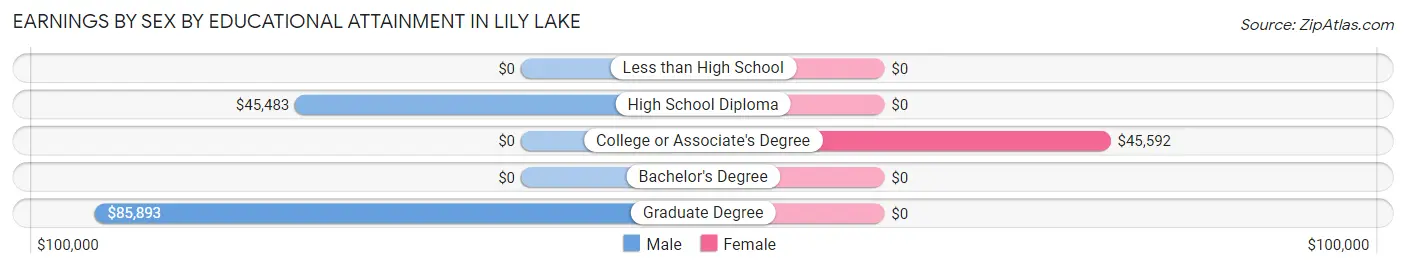
| Educational Attainment | Male Income | Female Income |
| Less than High School | - | - |
| High School Diploma | $45,483 | $0 |
| College or Associate's Degree | - | - |
| Bachelor's Degree | - | - |
| Graduate Degree | $85,893 | $0 |
| Total | - | - |
Family Income in Lily Lake
Family Income Brackets in Lily Lake
According to the Lily Lake family income data, there are 73 families falling into the $75,000 to $99,999 income range, which is the most common income bracket and makes up 34.8% of all families.
| Income Bracket | # Families | % Families |
| Less than $10,000 | 0 | 0.0% |
| $10,000 to $14,999 | 0 | 0.0% |
| $15,000 to $24,999 | 0 | 0.0% |
| $25,000 to $34,999 | 0 | 0.0% |
| $35,000 to $49,999 | 9 | 4.3% |
| $50,000 to $74,999 | 56 | 26.7% |
| $75,000 to $99,999 | 73 | 34.8% |
| $100,000 to $149,999 | 60 | 28.6% |
| $150,000 to $199,999 | 12 | 5.7% |
| $200,000+ | 0 | 0.0% |
Family Income by Famaliy Size in Lily Lake
2-person families (123 | 58.6%) account for the highest median family income in Lily Lake with $93,992 per family, while 2-person families (123 | 58.6%) have the highest median income of $46,996 per family member.
| Income Bracket | # Families | Median Income |
| 2-Person Families | 123 (58.6%) | $93,992 |
| 3-Person Families | 37 (17.6%) | $0 |
| 4-Person Families | 22 (10.5%) | $0 |
| 5-Person Families | 28 (13.3%) | $0 |
| 6-Person Families | 0 (0.0%) | $0 |
| 7+ Person Families | 0 (0.0%) | $0 |
| Total | 210 (100.0%) | $93,468 |
Family Income by Number of Earners in Lily Lake
| Number of Earners | # Families | Median Income |
| No Earners | 12 (5.7%) | $0 |
| 1 Earner | 85 (40.5%) | $72,443 |
| 2 Earners | 76 (36.2%) | $91,429 |
| 3+ Earners | 37 (17.6%) | $0 |
| Total | 210 (100.0%) | $93,468 |
Household Income in Lily Lake
Household Income Brackets in Lily Lake
With 73 households falling in the category, the $75,000 to $99,999 income range is the most frequent in Lily Lake, accounting for 31.7% of all households.
| Income Bracket | # Households | % Households |
| Less than $10,000 | 0 | 0.0% |
| $10,000 to $14,999 | 0 | 0.0% |
| $15,000 to $24,999 | 8 | 3.5% |
| $25,000 to $34,999 | 0 | 0.0% |
| $35,000 to $49,999 | 9 | 3.9% |
| $50,000 to $74,999 | 56 | 24.3% |
| $75,000 to $99,999 | 73 | 31.7% |
| $100,000 to $149,999 | 72 | 31.3% |
| $150,000 to $199,999 | 12 | 5.2% |
| $200,000+ | 0 | 0.0% |
Household Income by Householder Age in Lily Lake
The median household income in Lily Lake is $93,629, with the highest median household income of $117,604 found in the 45 to 64 years age bracket for the primary householder. A total of 97 households (42.2%) fall into this category.
| Income Bracket | # Households | Median Income |
| 15 to 24 Years | 0 (0.0%) | $0 |
| 25 to 44 Years | 75 (32.6%) | $73,173 |
| 45 to 64 Years | 97 (42.2%) | $117,604 |
| 65+ Years | 58 (25.2%) | $96,607 |
| Total | 230 (100.0%) | $93,629 |
Poverty in Lily Lake
Income Below Poverty by Sex and Age in Lily Lake
| Age Bracket | Male | Female |
| Under 5 Years | 0 (0.0%) | 0 (0.0%) |
| 5 Years | 0 (0.0%) | 0 (0.0%) |
| 6 to 11 Years | 0 (0.0%) | 0 (0.0%) |
| 12 to 14 Years | 0 (0.0%) | 0 (0.0%) |
| 15 Years | 0 (0.0%) | 0 (0.0%) |
| 16 and 17 Years | 0 (0.0%) | 0 (0.0%) |
| 18 to 24 Years | 0 (0.0%) | 0 (0.0%) |
| 25 to 34 Years | 0 (0.0%) | 0 (0.0%) |
| 35 to 44 Years | 0 (0.0%) | 0 (0.0%) |
| 45 to 54 Years | 0 (0.0%) | 0 (0.0%) |
| 55 to 64 Years | 0 (0.0%) | 0 (0.0%) |
| 65 to 74 Years | 0 (0.0%) | 0 (0.0%) |
| 75 Years and over | 0 (0.0%) | 0 (0.0%) |
| Total | 0 (0.0%) | 0 (0.0%) |
Income Above Poverty by Sex and Age in Lily Lake
According to the poverty statistics in Lily Lake, males aged 6 to 11 years and females aged under 5 years are the age groups that are most secure financially, with 100.0% of males and 100.0% of females in these age groups living above the poverty line.
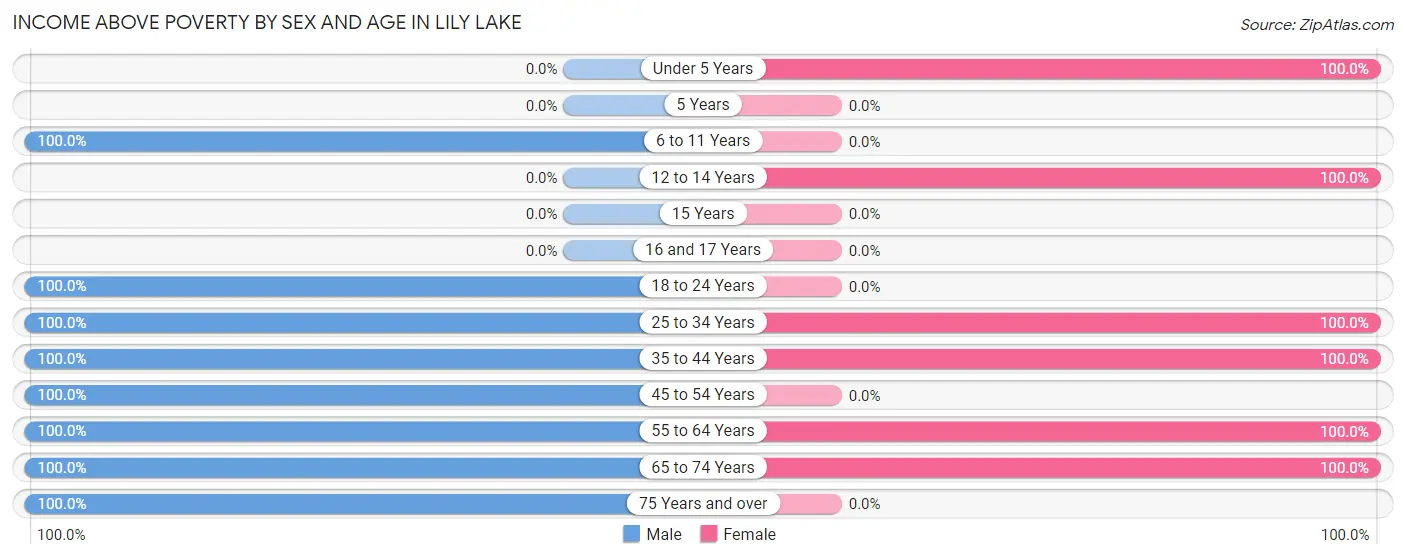
| Age Bracket | Male | Female |
| Under 5 Years | 0 (0.0%) | 66 (100.0%) |
| 5 Years | 0 (0.0%) | 0 (0.0%) |
| 6 to 11 Years | 51 (100.0%) | 0 (0.0%) |
| 12 to 14 Years | 0 (0.0%) | 8 (100.0%) |
| 15 Years | 0 (0.0%) | 0 (0.0%) |
| 16 and 17 Years | 0 (0.0%) | 0 (0.0%) |
| 18 to 24 Years | 14 (100.0%) | 0 (0.0%) |
| 25 to 34 Years | 69 (100.0%) | 28 (100.0%) |
| 35 to 44 Years | 54 (100.0%) | 40 (100.0%) |
| 45 to 54 Years | 44 (100.0%) | 0 (0.0%) |
| 55 to 64 Years | 42 (100.0%) | 93 (100.0%) |
| 65 to 74 Years | 52 (100.0%) | 24 (100.0%) |
| 75 Years and over | 8 (100.0%) | 0 (0.0%) |
| Total | 334 (100.0%) | 259 (100.0%) |
Income Below Poverty Among Married-Couple Families in Lily Lake
| Children | Above Poverty | Below Poverty |
| No Children | 116 (100.0%) | 0 (0.0%) |
| 1 or 2 Children | 22 (100.0%) | 0 (0.0%) |
| 3 or 4 Children | 28 (100.0%) | 0 (0.0%) |
| 5 or more Children | 0 (0.0%) | 0 (0.0%) |
| Total | 166 (100.0%) | 0 (0.0%) |
Income Below Poverty Among Single-Parent Households in Lily Lake
| Children | Single Father | Single Mother |
| No Children | 0 (0.0%) | 0 (0.0%) |
| 1 or 2 Children | 0 (0.0%) | 0 (0.0%) |
| 3 or 4 Children | 0 (0.0%) | 0 (0.0%) |
| 5 or more Children | 0 (0.0%) | 0 (0.0%) |
| Total | 0 (0.0%) | 0 (0.0%) |
Income Below Poverty Among Married-Couple vs Single-Parent Households in Lily Lake
| Children | Married-Couple Families | Single-Parent Households |
| No Children | 0 (0.0%) | 0 (0.0%) |
| 1 or 2 Children | 0 (0.0%) | 0 (0.0%) |
| 3 or 4 Children | 0 (0.0%) | 0 (0.0%) |
| 5 or more Children | 0 (0.0%) | 0 (0.0%) |
| Total | 0 (0.0%) | 0 (0.0%) |
Race in Lily Lake
The most populous races in Lily Lake are White / Caucasian (548 | 92.4%), Hispanic or Latino (103 | 17.4%), and Some other Race (37 | 6.2%).
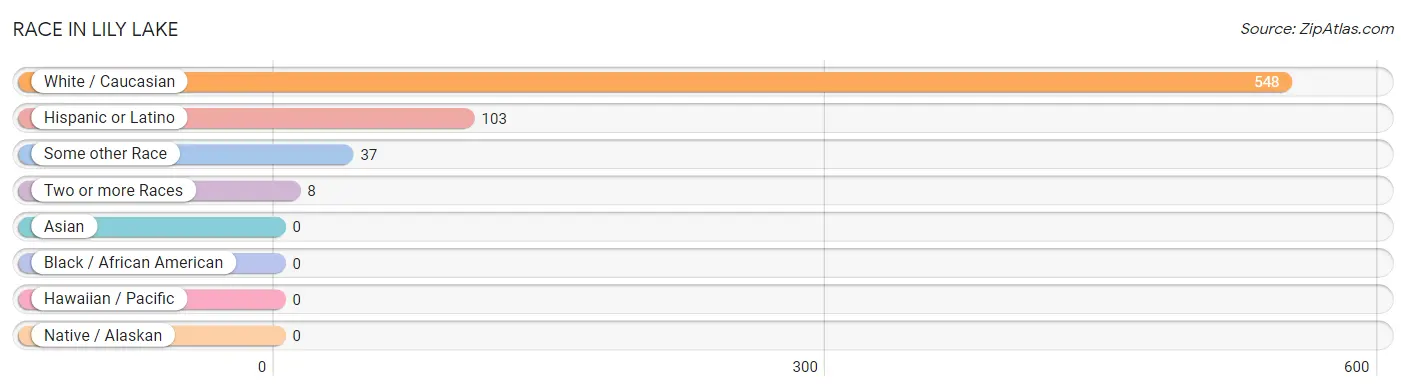
| Race | # Population | % Population |
| Asian | 0 | 0.0% |
| Black / African American | 0 | 0.0% |
| Hawaiian / Pacific | 0 | 0.0% |
| Hispanic or Latino | 103 | 17.4% |
| Native / Alaskan | 0 | 0.0% |
| White / Caucasian | 548 | 92.4% |
| Two or more Races | 8 | 1.3% |
| Some other Race | 37 | 6.2% |
| Total | 593 | 100.0% |
Ancestry in Lily Lake
The most populous ancestries reported in Lily Lake are Irish (150 | 25.3%), German (142 | 23.9%), South American (103 | 17.4%), Italian (101 | 17.0%), and American (70 | 11.8%), together accounting for 95.5% of all Lily Lake residents.
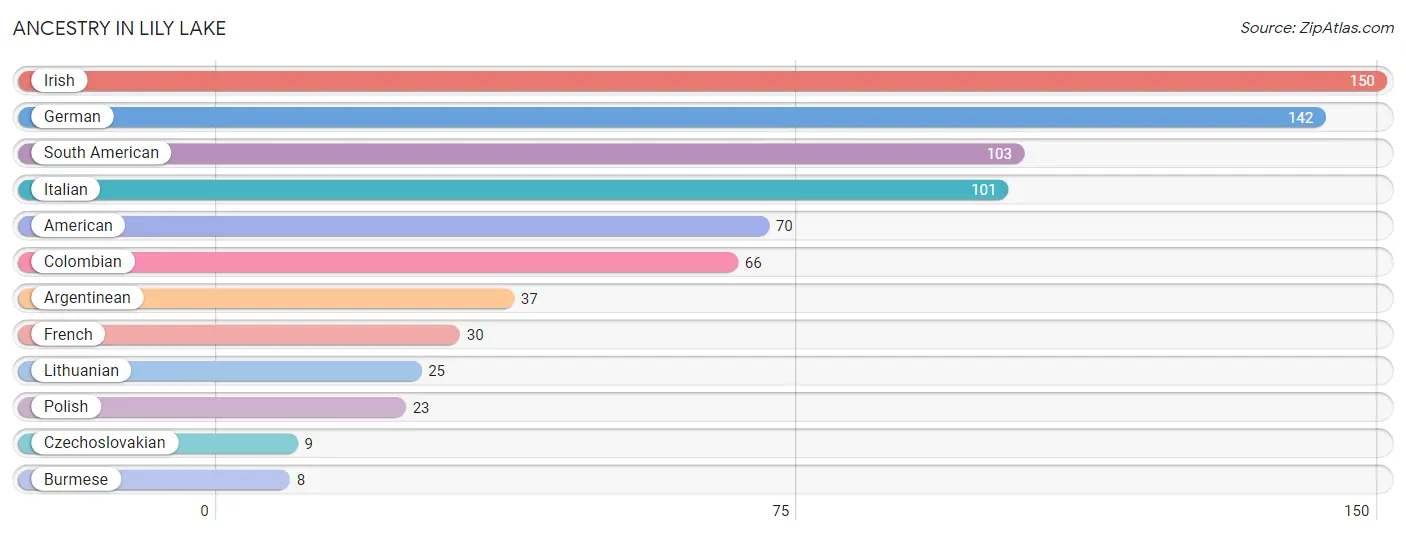
| Ancestry | # Population | % Population |
| American | 70 | 11.8% |
| Argentinean | 37 | 6.2% |
| Burmese | 8 | 1.3% |
| Colombian | 66 | 11.1% |
| Czechoslovakian | 9 | 1.5% |
| French | 30 | 5.1% |
| German | 142 | 23.9% |
| Irish | 150 | 25.3% |
| Italian | 101 | 17.0% |
| Lithuanian | 25 | 4.2% |
| Polish | 23 | 3.9% |
| South American | 103 | 17.4% | View All 12 Rows |
Immigrants in Lily Lake
The most numerous immigrant groups reported in Lily Lake came from Argentina (37 | 6.2%), Latin America (37 | 6.2%), and South America (37 | 6.2%), together accounting for 18.7% of all Lily Lake residents.
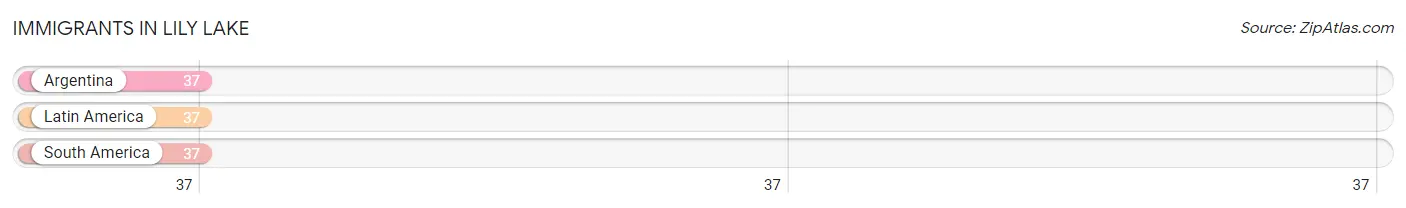
| Immigration Origin | # Population | % Population |
| Argentina | 37 | 6.2% |
| Latin America | 37 | 6.2% |
| South America | 37 | 6.2% | View All 3 Rows |
Sex and Age in Lily Lake
Sex and Age in Lily Lake
The most populous age groups in Lily Lake are 5 to 9 Years (51 | 15.3%) for men and 55 to 59 Years (73 | 28.2%) for women.
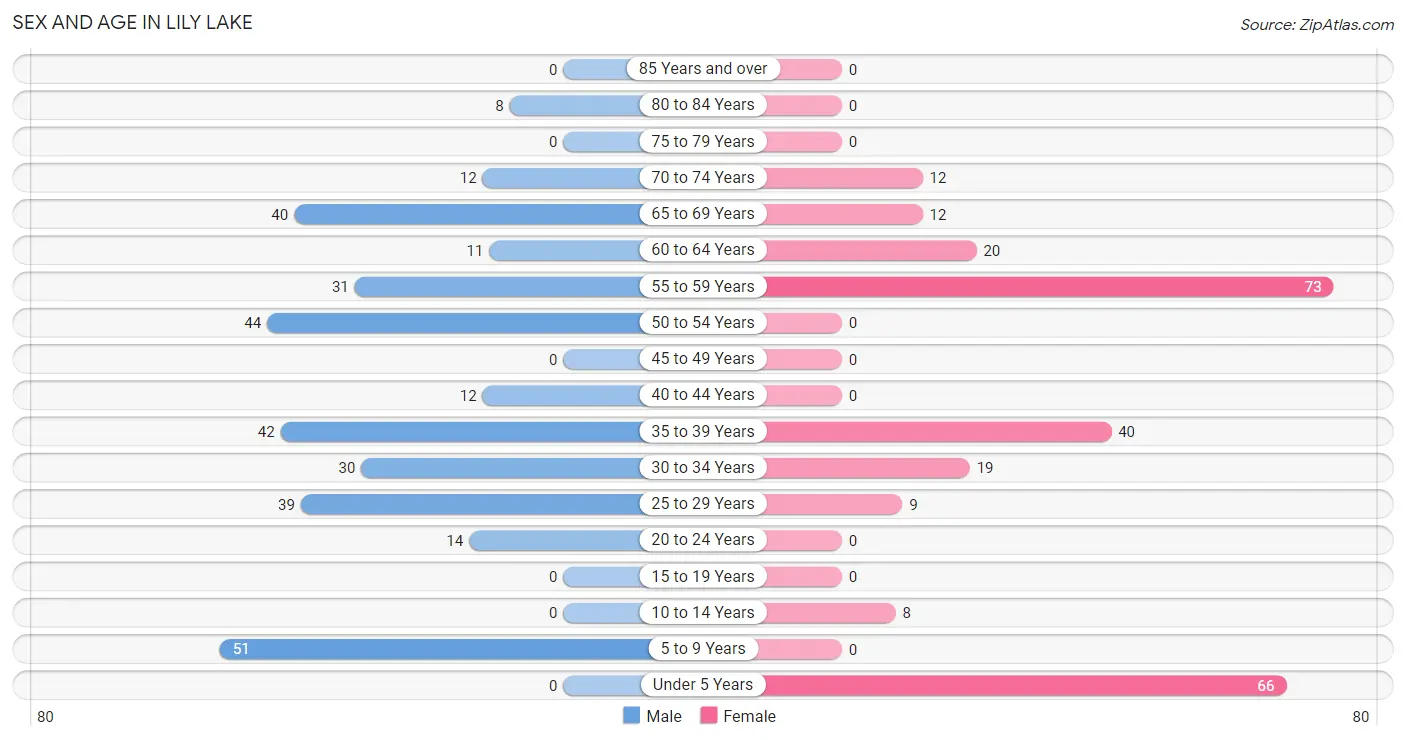
| Age Bracket | Male | Female |
| Under 5 Years | 0 (0.0%) | 66 (25.5%) |
| 5 to 9 Years | 51 (15.3%) | 0 (0.0%) |
| 10 to 14 Years | 0 (0.0%) | 8 (3.1%) |
| 15 to 19 Years | 0 (0.0%) | 0 (0.0%) |
| 20 to 24 Years | 14 (4.2%) | 0 (0.0%) |
| 25 to 29 Years | 39 (11.7%) | 9 (3.5%) |
| 30 to 34 Years | 30 (9.0%) | 19 (7.3%) |
| 35 to 39 Years | 42 (12.6%) | 40 (15.4%) |
| 40 to 44 Years | 12 (3.6%) | 0 (0.0%) |
| 45 to 49 Years | 0 (0.0%) | 0 (0.0%) |
| 50 to 54 Years | 44 (13.2%) | 0 (0.0%) |
| 55 to 59 Years | 31 (9.3%) | 73 (28.2%) |
| 60 to 64 Years | 11 (3.3%) | 20 (7.7%) |
| 65 to 69 Years | 40 (12.0%) | 12 (4.6%) |
| 70 to 74 Years | 12 (3.6%) | 12 (4.6%) |
| 75 to 79 Years | 0 (0.0%) | 0 (0.0%) |
| 80 to 84 Years | 8 (2.4%) | 0 (0.0%) |
| 85 Years and over | 0 (0.0%) | 0 (0.0%) |
| Total | 334 (100.0%) | 259 (100.0%) |
Families and Households in Lily Lake
Median Family Size in Lily Lake
The median family size in Lily Lake is 2.73 persons per family, with married-couple families (166 | 79.0%) accounting for the largest median family size of 2.95 persons per family. On the other hand, single male/father families (26 | 12.4%) represent the smallest median family size with 1.85 persons per family.
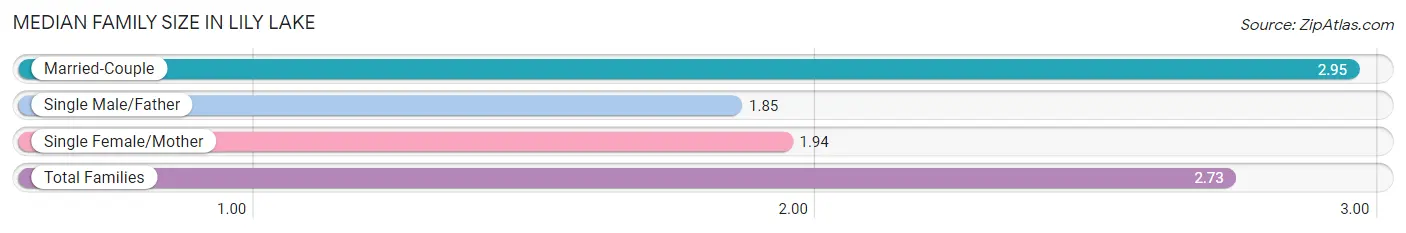
| Family Type | # Families | Family Size |
| Married-Couple | 166 (79.0%) | 2.95 |
| Single Male/Father | 26 (12.4%) | 1.85 |
| Single Female/Mother | 18 (8.6%) | 1.94 |
| Total Families | 210 (100.0%) | 2.73 |
Median Household Size in Lily Lake
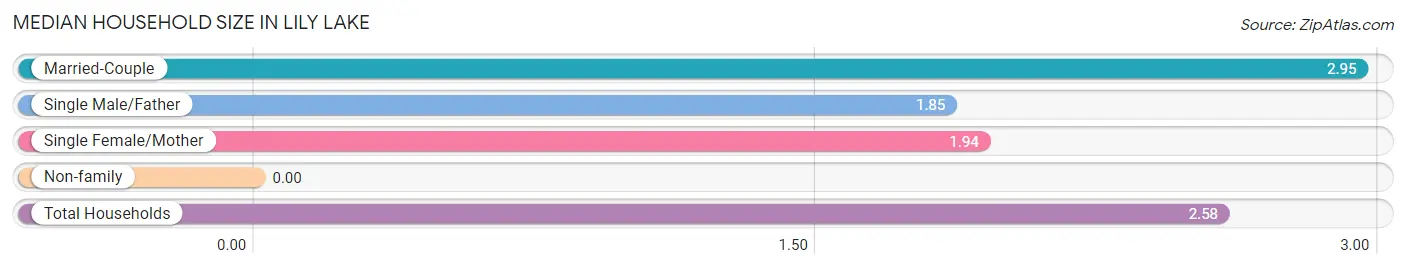
| Household Type | # Households | Household Size |
| Married-Couple | 166 (72.2%) | 2.95 |
| Single Male/Father | 26 (11.3%) | 1.85 |
| Single Female/Mother | 18 (7.8%) | 1.94 |
| Non-family | 20 (8.7%) | - |
| Total Households | 230 (100.0%) | 2.58 |
Household Size by Marriage Status in Lily Lake
Out of a total of 230 households in Lily Lake, 210 (91.3%) are family households, while 20 (8.7%) are nonfamily households. The most numerous type of family households are 2-person households, comprising 123, and the most common type of nonfamily households are 1-person households, comprising 20.
| Household Size | Family Households | Nonfamily Households |
| 1-Person Households | - | 20 (8.7%) |
| 2-Person Households | 123 (53.5%) | 0 (0.0%) |
| 3-Person Households | 37 (16.1%) | 0 (0.0%) |
| 4-Person Households | 22 (9.6%) | 0 (0.0%) |
| 5-Person Households | 28 (12.2%) | 0 (0.0%) |
| 6-Person Households | 0 (0.0%) | 0 (0.0%) |
| 7+ Person Households | 0 (0.0%) | 0 (0.0%) |
| Total | 210 (91.3%) | 20 (8.7%) |
Female Fertility in Lily Lake
Fertility by Age in Lily Lake
| Age Bracket | Women with Births | Births / 1,000 Women |
| 15 to 19 years | 0 (0.0%) | 0.0 |
| 20 to 34 years | 0 (0.0%) | 0.0 |
| 35 to 50 years | 0 (0.0%) | 0.0 |
| Total | 0 (0.0%) | 0.0 |
Fertility by Age by Marriage Status in Lily Lake
| Age Bracket | Married | Unmarried |
| 15 to 19 years | 0 (0.0%) | 0 (0.0%) |
| 20 to 34 years | 0 (0.0%) | 0 (0.0%) |
| 35 to 50 years | 0 (0.0%) | 0 (0.0%) |
| Total | 0 (0.0%) | 0 (0.0%) |
Fertility by Education in Lily Lake
| Educational Attainment | Women with Births | Births / 1,000 Women |
| Less than High School | 0 (0.0%) | 0.0 |
| High School Diploma | 0 (0.0%) | 0.0 |
| College or Associate's Degree | 0 (0.0%) | 0.0 |
| Bachelor's Degree | 0 (0.0%) | 0.0 |
| Graduate Degree | 0 (0.0%) | 0.0 |
| Total | 0 (0.0%) | 0.0 |
Fertility by Education by Marriage Status in Lily Lake
| Educational Attainment | Married | Unmarried |
| Less than High School | 0 (0.0%) | 0 (0.0%) |
| High School Diploma | 0 (0.0%) | 0 (0.0%) |
| College or Associate's Degree | 0 (0.0%) | 0 (0.0%) |
| Bachelor's Degree | 0 (0.0%) | 0 (0.0%) |
| Graduate Degree | 0 (0.0%) | 0 (0.0%) |
| Total | 0 (0.0%) | 0 (0.0%) |
Employment Characteristics in Lily Lake
Employment by Class of Employer in Lily Lake
Among the 354 employed individuals in Lily Lake, private company employees (260 | 73.5%), local government employees (47 | 13.3%), and self-employed (not incorporated) (37 | 10.4%) make up the most common classes of employment.
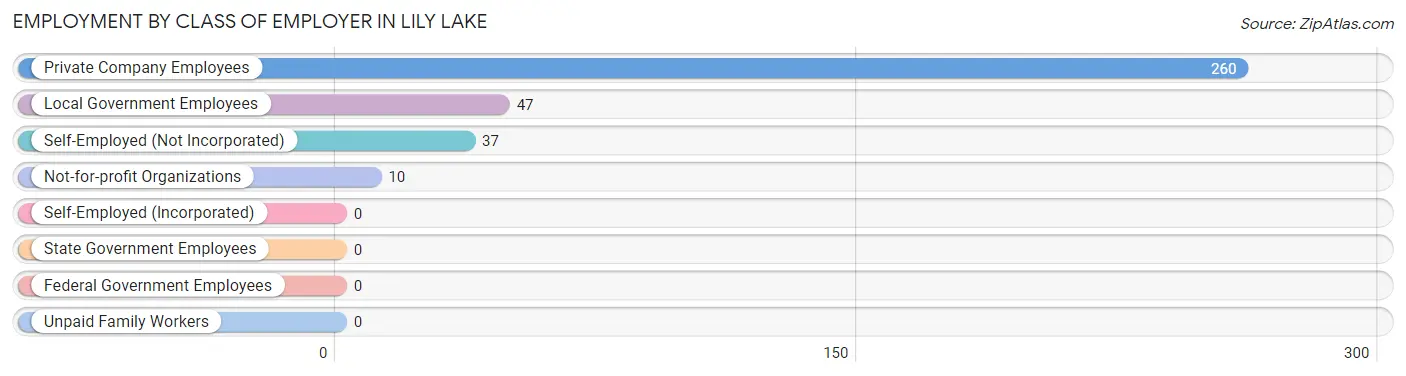
| Employer Class | # Employees | % Employees |
| Private Company Employees | 260 | 73.5% |
| Self-Employed (Incorporated) | 0 | 0.0% |
| Self-Employed (Not Incorporated) | 37 | 10.4% |
| Not-for-profit Organizations | 10 | 2.8% |
| Local Government Employees | 47 | 13.3% |
| State Government Employees | 0 | 0.0% |
| Federal Government Employees | 0 | 0.0% |
| Unpaid Family Workers | 0 | 0.0% |
| Total | 354 | 100.0% |
Employment Status by Age in Lily Lake
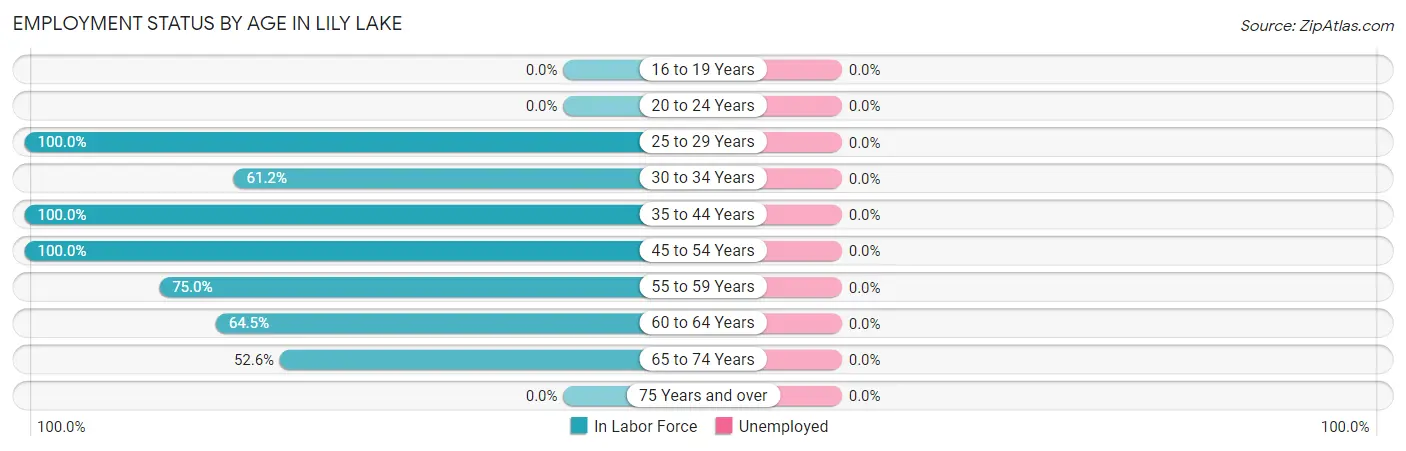
| Age Bracket | In Labor Force | Unemployed |
| 16 to 19 Years | 0 (0.0%) | 0 (0.0%) |
| 20 to 24 Years | 0 (0.0%) | 0 (0.0%) |
| 25 to 29 Years | 48 (100.0%) | 0 (0.0%) |
| 30 to 34 Years | 30 (61.2%) | 0 (0.0%) |
| 35 to 44 Years | 94 (100.0%) | 0 (0.0%) |
| 45 to 54 Years | 44 (100.0%) | 0 (0.0%) |
| 55 to 59 Years | 78 (75.0%) | 0 (0.0%) |
| 60 to 64 Years | 20 (64.5%) | 0 (0.0%) |
| 65 to 74 Years | 40 (52.6%) | 0 (0.0%) |
| 75 Years and over | 0 (0.0%) | 0 (0.0%) |
| Total | 354 (75.6%) | 0 (0.0%) |
Employment Status by Educational Attainment in Lily Lake
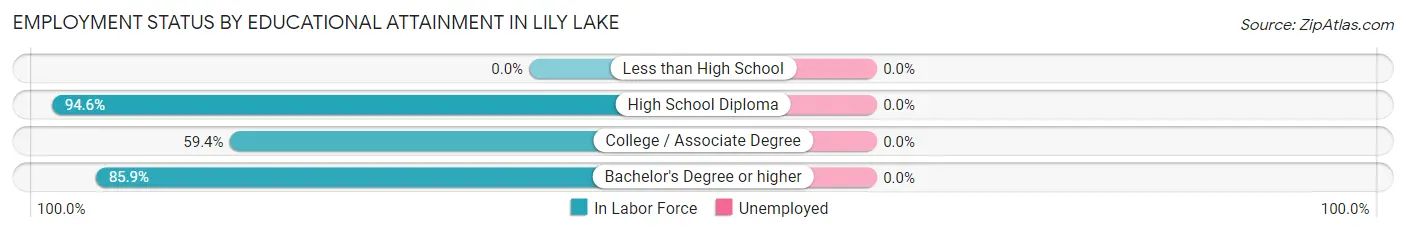
| Educational Attainment | In Labor Force | Unemployed |
| Less than High School | 0 (0.0%) | 0 (0.0%) |
| High School Diploma | 157 (94.6%) | 0 (0.0%) |
| College / Associate Degree | 41 (59.4%) | 0 (0.0%) |
| Bachelor's Degree or higher | 116 (85.9%) | 0 (0.0%) |
| Total | 314 (84.9%) | 0 (0.0%) |
Employment Occupations by Sex in Lily Lake
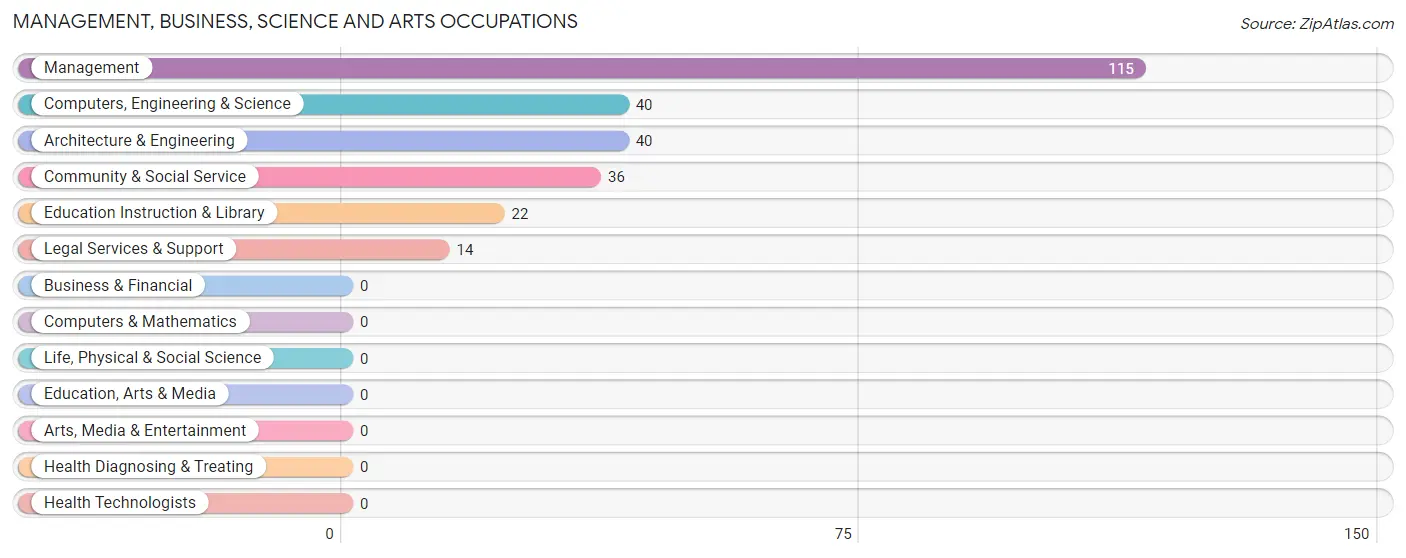
Management, Business, Science and Arts Occupations
The most common Management, Business, Science and Arts occupations in Lily Lake are Management (115 | 32.5%), Computers, Engineering & Science (40 | 11.3%), Architecture & Engineering (40 | 11.3%), Community & Social Service (36 | 10.2%), and Education Instruction & Library (22 | 6.2%).
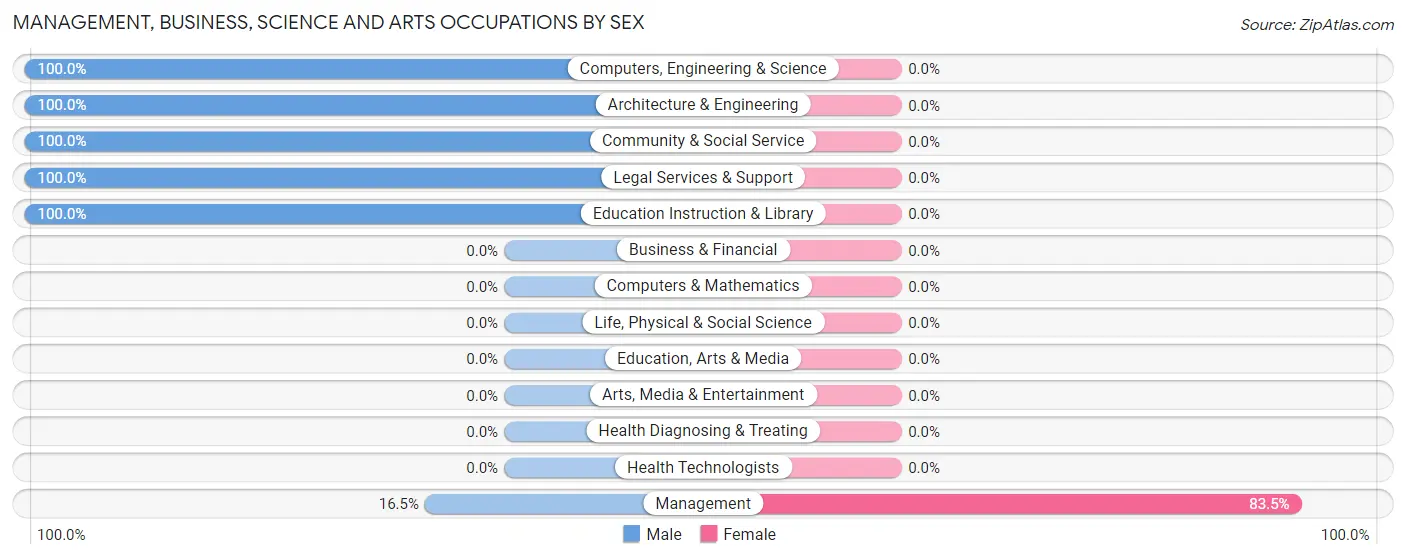
Management, Business, Science and Arts Occupations by Sex
| Occupation | Male | Female |
| Management | 19 (16.5%) | 96 (83.5%) |
| Business & Financial | 0 (0.0%) | 0 (0.0%) |
| Computers, Engineering & Science | 40 (100.0%) | 0 (0.0%) |
| Computers & Mathematics | 0 (0.0%) | 0 (0.0%) |
| Architecture & Engineering | 40 (100.0%) | 0 (0.0%) |
| Life, Physical & Social Science | 0 (0.0%) | 0 (0.0%) |
| Community & Social Service | 36 (100.0%) | 0 (0.0%) |
| Education, Arts & Media | 0 (0.0%) | 0 (0.0%) |
| Legal Services & Support | 14 (100.0%) | 0 (0.0%) |
| Education Instruction & Library | 22 (100.0%) | 0 (0.0%) |
| Arts, Media & Entertainment | 0 (0.0%) | 0 (0.0%) |
| Health Diagnosing & Treating | 0 (0.0%) | 0 (0.0%) |
| Health Technologists | 0 (0.0%) | 0 (0.0%) |
| Total (Category) | 95 (49.7%) | 96 (50.3%) |
| Total (Overall) | 226 (63.8%) | 128 (36.2%) |
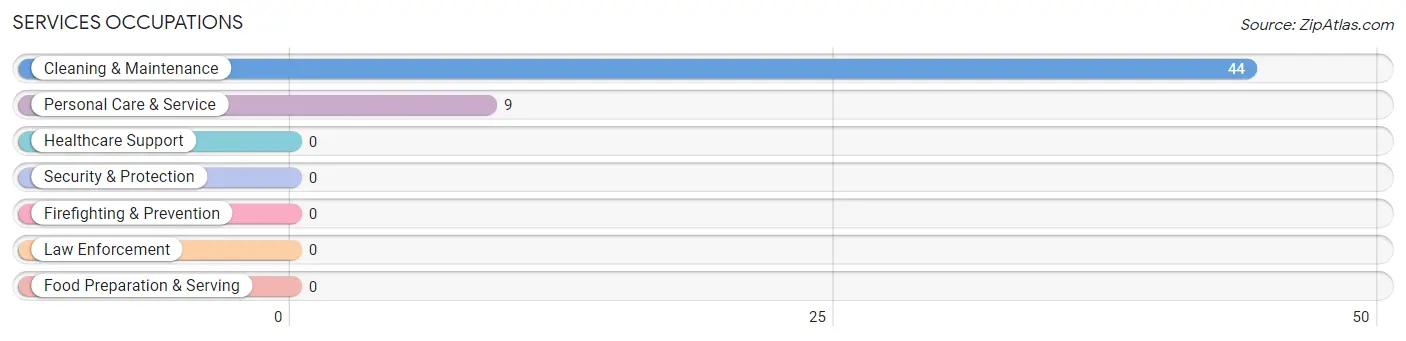
Services Occupations
The most common Services occupations in Lily Lake are Cleaning & Maintenance (44 | 12.4%), and Personal Care & Service (9 | 2.5%).
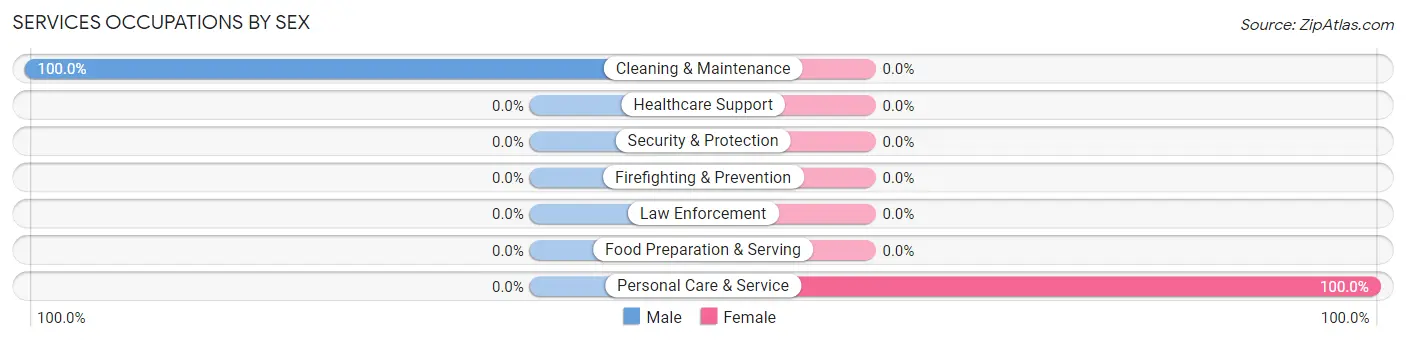
Services Occupations by Sex
| Occupation | Male | Female |
| Healthcare Support | 0 (0.0%) | 0 (0.0%) |
| Security & Protection | 0 (0.0%) | 0 (0.0%) |
| Firefighting & Prevention | 0 (0.0%) | 0 (0.0%) |
| Law Enforcement | 0 (0.0%) | 0 (0.0%) |
| Food Preparation & Serving | 0 (0.0%) | 0 (0.0%) |
| Cleaning & Maintenance | 44 (100.0%) | 0 (0.0%) |
| Personal Care & Service | 0 (0.0%) | 9 (100.0%) |
| Total (Category) | 44 (83.0%) | 9 (17.0%) |
| Total (Overall) | 226 (63.8%) | 128 (36.2%) |
Sales and Office Occupations
The most common Sales and Office occupations in Lily Lake are , and Office & Administration (23 | 6.5%).
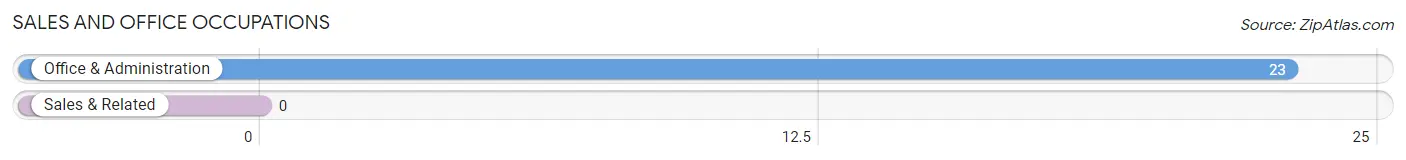
Sales and Office Occupations by Sex
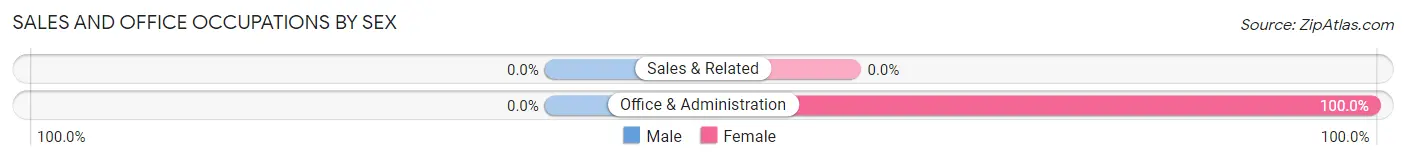
| Occupation | Male | Female |
| Sales & Related | 0 (0.0%) | 0 (0.0%) |
| Office & Administration | 0 (0.0%) | 23 (100.0%) |
| Total (Category) | 0 (0.0%) | 23 (100.0%) |
| Total (Overall) | 226 (63.8%) | 128 (36.2%) |
Natural Resources, Construction and Maintenance Occupations
The most common Natural Resources, Construction and Maintenance occupations in Lily Lake are Installation, Maintenance & Repair (53 | 15.0%), and Farming, Fishing & Forestry (8 | 2.3%).
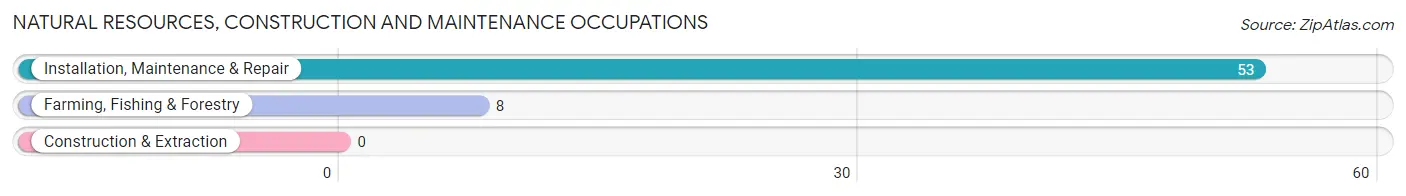
Natural Resources, Construction and Maintenance Occupations by Sex
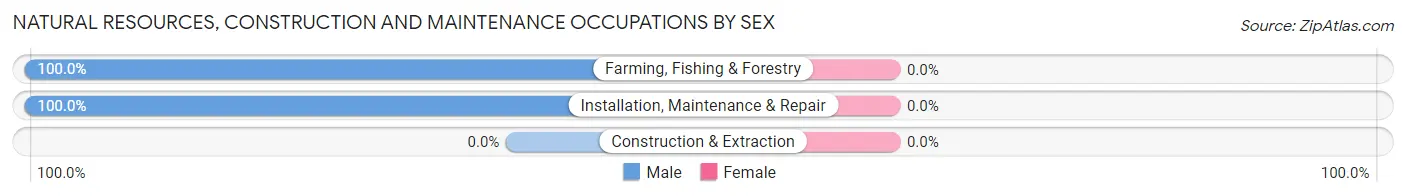
| Occupation | Male | Female |
| Farming, Fishing & Forestry | 8 (100.0%) | 0 (0.0%) |
| Construction & Extraction | 0 (0.0%) | 0 (0.0%) |
| Installation, Maintenance & Repair | 53 (100.0%) | 0 (0.0%) |
| Total (Category) | 61 (100.0%) | 0 (0.0%) |
| Total (Overall) | 226 (63.8%) | 128 (36.2%) |
Production, Transportation and Moving Occupations
The most common Production, Transportation and Moving occupations in Lily Lake are , and Transportation (26 | 7.3%).
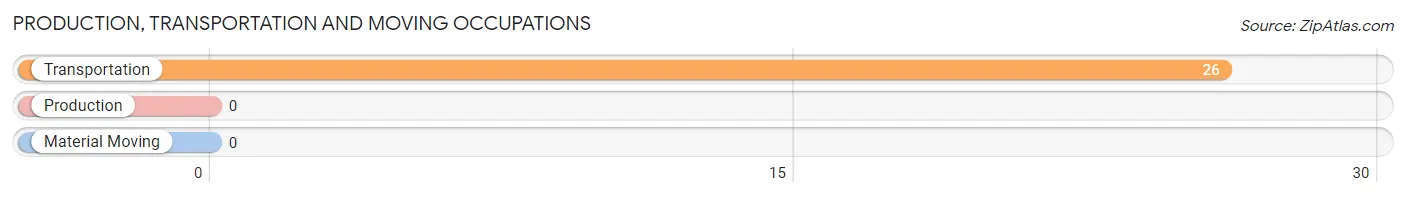
Production, Transportation and Moving Occupations by Sex
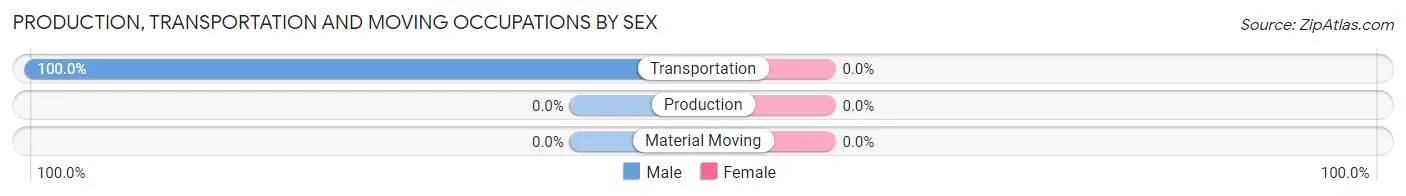
| Occupation | Male | Female |
| Production | 0 (0.0%) | 0 (0.0%) |
| Transportation | 26 (100.0%) | 0 (0.0%) |
| Material Moving | 0 (0.0%) | 0 (0.0%) |
| Total (Category) | 26 (100.0%) | 0 (0.0%) |
| Total (Overall) | 226 (63.8%) | 128 (36.2%) |
Employment Industries by Sex in Lily Lake
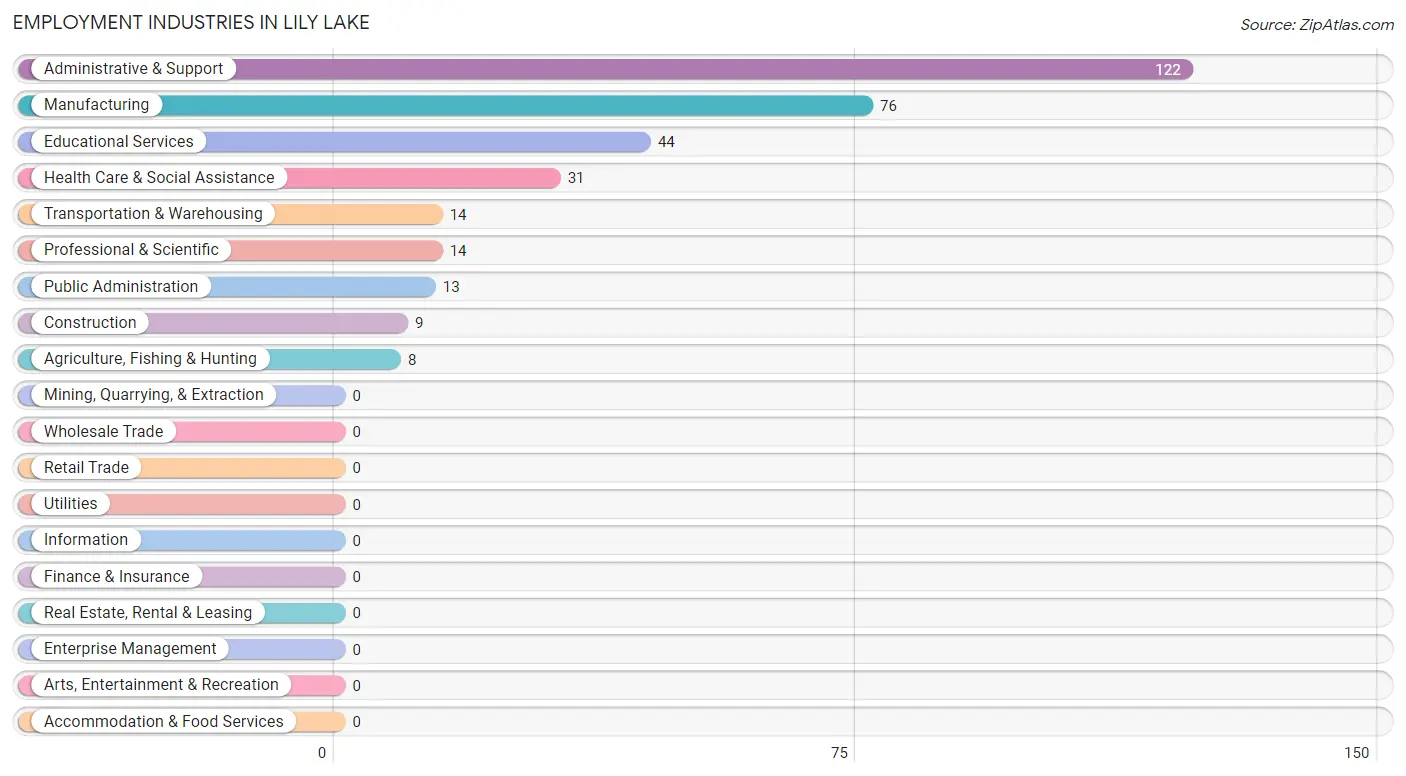
Employment Industries in Lily Lake
The major employment industries in Lily Lake include Administrative & Support (122 | 34.5%), Manufacturing (76 | 21.5%), Educational Services (44 | 12.4%), Health Care & Social Assistance (31 | 8.8%), and Transportation & Warehousing (14 | 4.0%).
Employment Industries by Sex in Lily Lake
The Lily Lake industries that see more men than women are Agriculture, Fishing & Hunting (100.0%), Transportation & Warehousing (100.0%), and Professional & Scientific (100.0%), whereas the industries that tend to have a higher number of women are Construction (100.0%), Public Administration (100.0%), and Educational Services (50.0%).
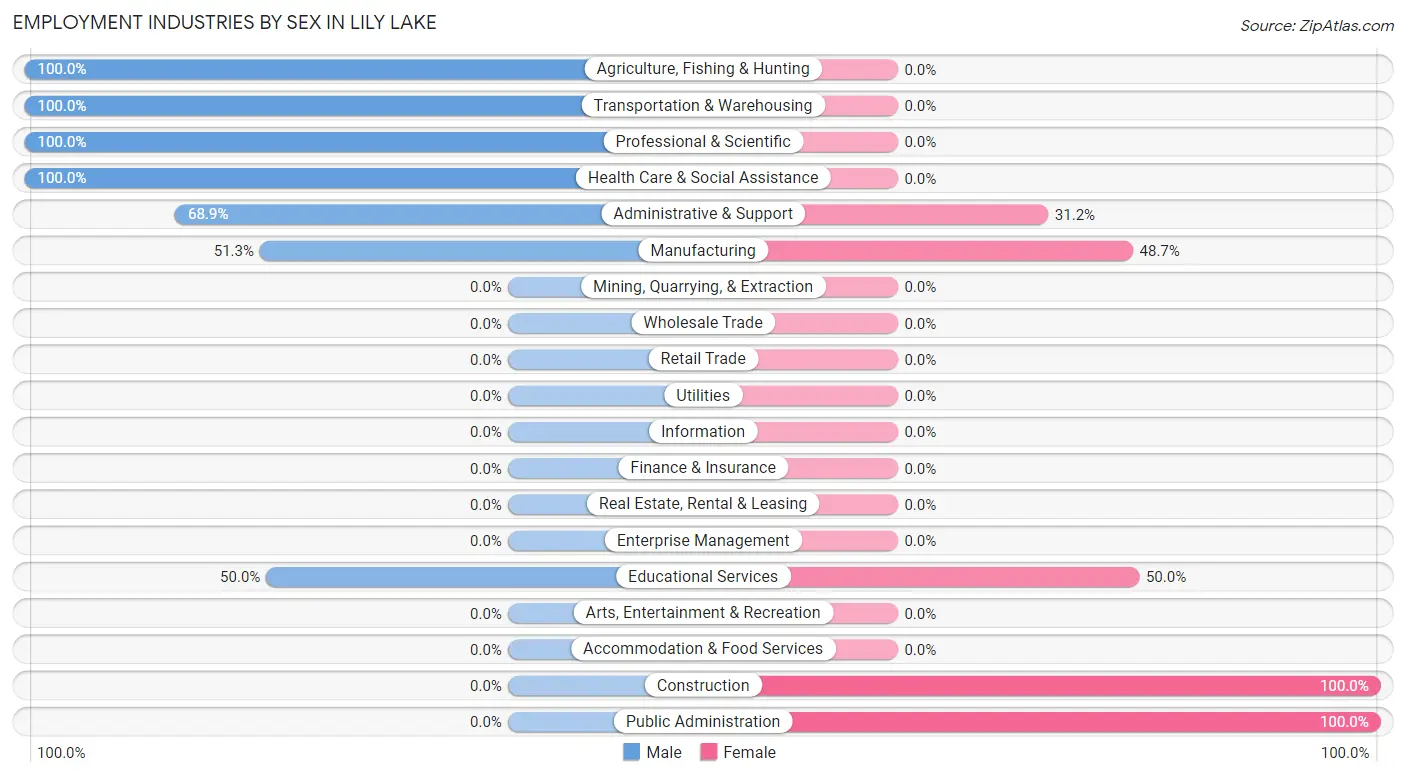
| Industry | Male | Female |
| Agriculture, Fishing & Hunting | 8 (100.0%) | 0 (0.0%) |
| Mining, Quarrying, & Extraction | 0 (0.0%) | 0 (0.0%) |
| Construction | 0 (0.0%) | 9 (100.0%) |
| Manufacturing | 39 (51.3%) | 37 (48.7%) |
| Wholesale Trade | 0 (0.0%) | 0 (0.0%) |
| Retail Trade | 0 (0.0%) | 0 (0.0%) |
| Transportation & Warehousing | 14 (100.0%) | 0 (0.0%) |
| Utilities | 0 (0.0%) | 0 (0.0%) |
| Information | 0 (0.0%) | 0 (0.0%) |
| Finance & Insurance | 0 (0.0%) | 0 (0.0%) |
| Real Estate, Rental & Leasing | 0 (0.0%) | 0 (0.0%) |
| Professional & Scientific | 14 (100.0%) | 0 (0.0%) |
| Enterprise Management | 0 (0.0%) | 0 (0.0%) |
| Administrative & Support | 84 (68.9%) | 38 (31.1%) |
| Educational Services | 22 (50.0%) | 22 (50.0%) |
| Health Care & Social Assistance | 31 (100.0%) | 0 (0.0%) |
| Arts, Entertainment & Recreation | 0 (0.0%) | 0 (0.0%) |
| Accommodation & Food Services | 0 (0.0%) | 0 (0.0%) |
| Public Administration | 0 (0.0%) | 13 (100.0%) |
| Total | 226 (63.8%) | 128 (36.2%) |
Education in Lily Lake
School Enrollment in Lily Lake
The most common levels of schooling among the 73 students in Lily Lake are elementary school (26 | 35.6%), kindergarten (25 | 34.3%), and college / undergraduate (14 | 19.2%).
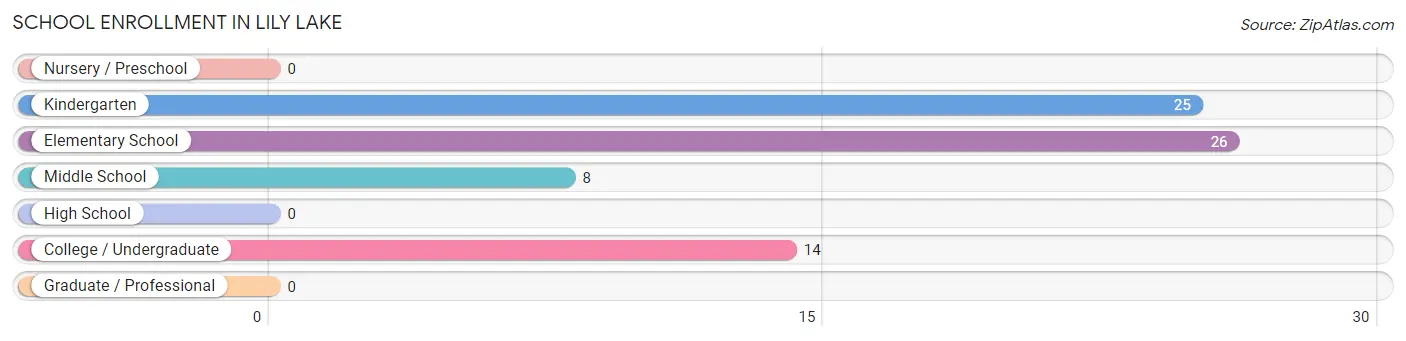
| School Level | # Students | % Students |
| Nursery / Preschool | 0 | 0.0% |
| Kindergarten | 25 | 34.3% |
| Elementary School | 26 | 35.6% |
| Middle School | 8 | 11.0% |
| High School | 0 | 0.0% |
| College / Undergraduate | 14 | 19.2% |
| Graduate / Professional | 0 | 0.0% |
| Total | 73 | 100.0% |
School Enrollment by Age by Funding Source in Lily Lake
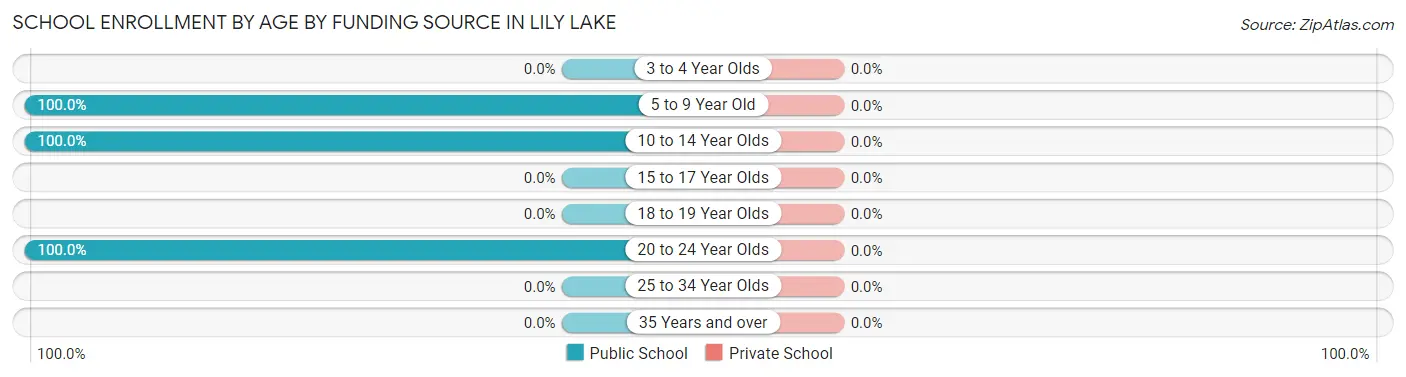
| Age Bracket | Public School | Private School |
| 3 to 4 Year Olds | 0 (0.0%) | 0 (0.0%) |
| 5 to 9 Year Old | 51 (100.0%) | 0 (0.0%) |
| 10 to 14 Year Olds | 8 (100.0%) | 0 (0.0%) |
| 15 to 17 Year Olds | 0 (0.0%) | 0 (0.0%) |
| 18 to 19 Year Olds | 0 (0.0%) | 0 (0.0%) |
| 20 to 24 Year Olds | 14 (100.0%) | 0 (0.0%) |
| 25 to 34 Year Olds | 0 (0.0%) | 0 (0.0%) |
| 35 Years and over | 0 (0.0%) | 0 (0.0%) |
| Total | 73 (100.0%) | 0 (0.0%) |
Educational Attainment by Field of Study in Lily Lake
Arts & humanities (46 | 30.9%), science & technology (28 | 18.8%), social sciences (22 | 14.8%), computers & mathematics (20 | 13.4%), and psychology (19 | 12.8%) are the most common fields of study among 149 individuals in Lily Lake who have obtained a bachelor's degree or higher.
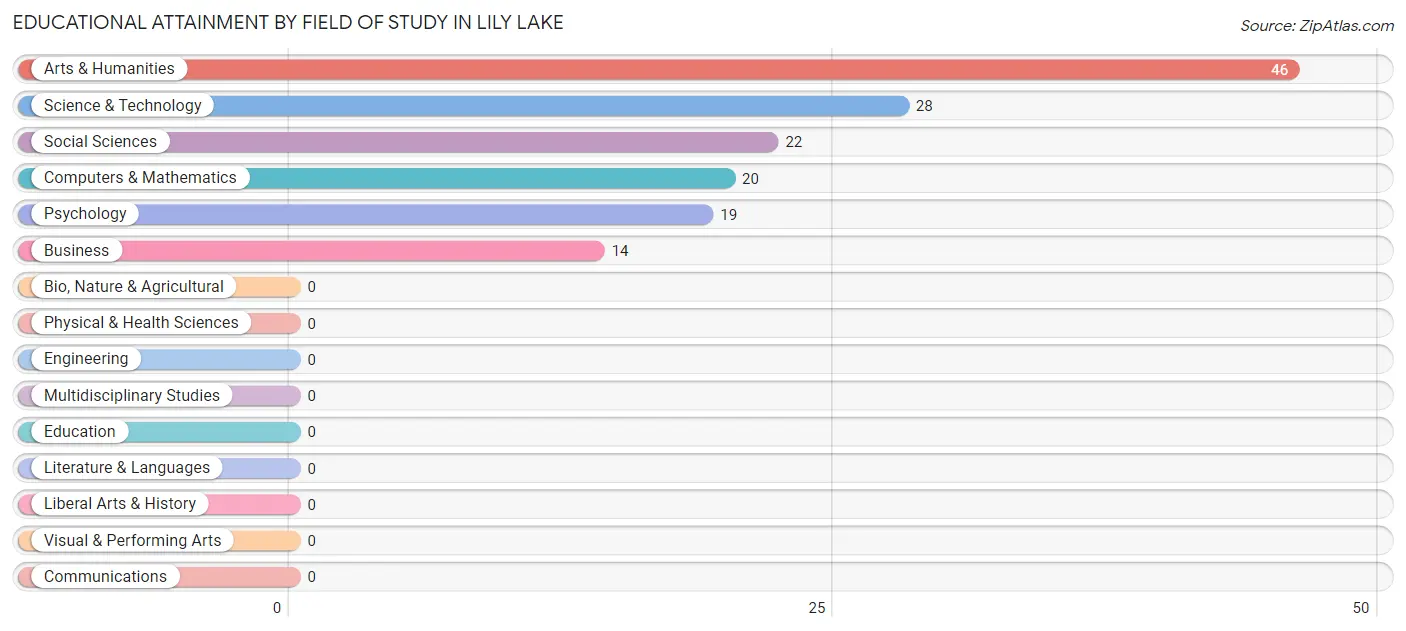
| Field of Study | # Graduates | % Graduates |
| Computers & Mathematics | 20 | 13.4% |
| Bio, Nature & Agricultural | 0 | 0.0% |
| Physical & Health Sciences | 0 | 0.0% |
| Psychology | 19 | 12.8% |
| Social Sciences | 22 | 14.8% |
| Engineering | 0 | 0.0% |
| Multidisciplinary Studies | 0 | 0.0% |
| Science & Technology | 28 | 18.8% |
| Business | 14 | 9.4% |
| Education | 0 | 0.0% |
| Literature & Languages | 0 | 0.0% |
| Liberal Arts & History | 0 | 0.0% |
| Visual & Performing Arts | 0 | 0.0% |
| Communications | 0 | 0.0% |
| Arts & Humanities | 46 | 30.9% |
| Total | 149 | 100.0% |
Transportation & Commute in Lily Lake
Vehicle Availability by Sex in Lily Lake
The most prevalent vehicle ownership categories in Lily Lake are males with 2 vehicles (159, accounting for 70.4%) and females with 2 vehicles (84, making up 124.2%).
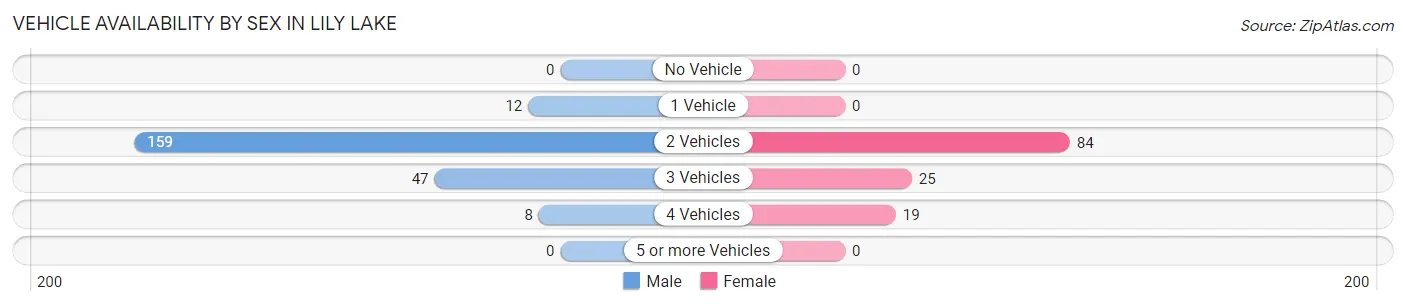
| Vehicles Available | Male | Female |
| No Vehicle | 0 (0.0%) | 0 (0.0%) |
| 1 Vehicle | 12 (5.3%) | 0 (0.0%) |
| 2 Vehicles | 159 (70.4%) | 84 (65.6%) |
| 3 Vehicles | 47 (20.8%) | 25 (19.5%) |
| 4 Vehicles | 8 (3.5%) | 19 (14.8%) |
| 5 or more Vehicles | 0 (0.0%) | 0 (0.0%) |
| Total | 226 (100.0%) | 128 (100.0%) |
Commute Time in Lily Lake
The most frequently occuring commute durations in Lily Lake are 10 to 14 minutes (102 commuters, 32.8%), 20 to 24 minutes (76 commuters, 24.4%), and 45 to 59 minutes (44 commuters, 14.1%).
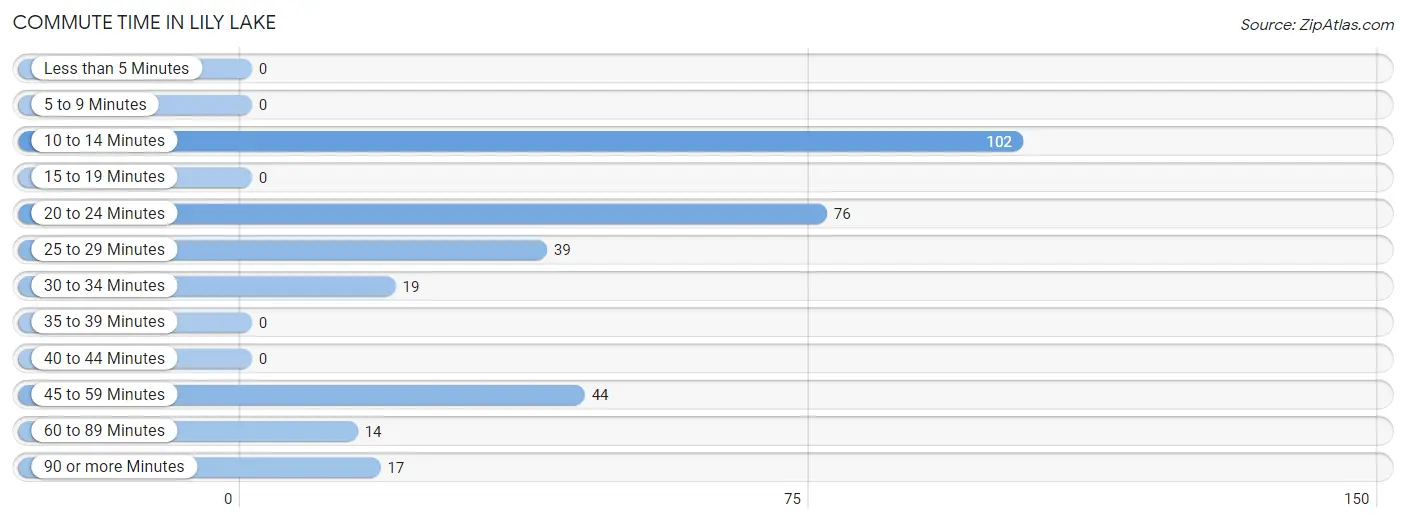
| Commute Time | # Commuters | % Commuters |
| Less than 5 Minutes | 0 | 0.0% |
| 5 to 9 Minutes | 0 | 0.0% |
| 10 to 14 Minutes | 102 | 32.8% |
| 15 to 19 Minutes | 0 | 0.0% |
| 20 to 24 Minutes | 76 | 24.4% |
| 25 to 29 Minutes | 39 | 12.5% |
| 30 to 34 Minutes | 19 | 6.1% |
| 35 to 39 Minutes | 0 | 0.0% |
| 40 to 44 Minutes | 0 | 0.0% |
| 45 to 59 Minutes | 44 | 14.1% |
| 60 to 89 Minutes | 14 | 4.5% |
| 90 or more Minutes | 17 | 5.5% |
Commute Time by Sex in Lily Lake
The most common commute times in Lily Lake are 10 to 14 minutes (64 commuters, 35.0%) for males and 20 to 24 minutes (62 commuters, 48.4%) for females.
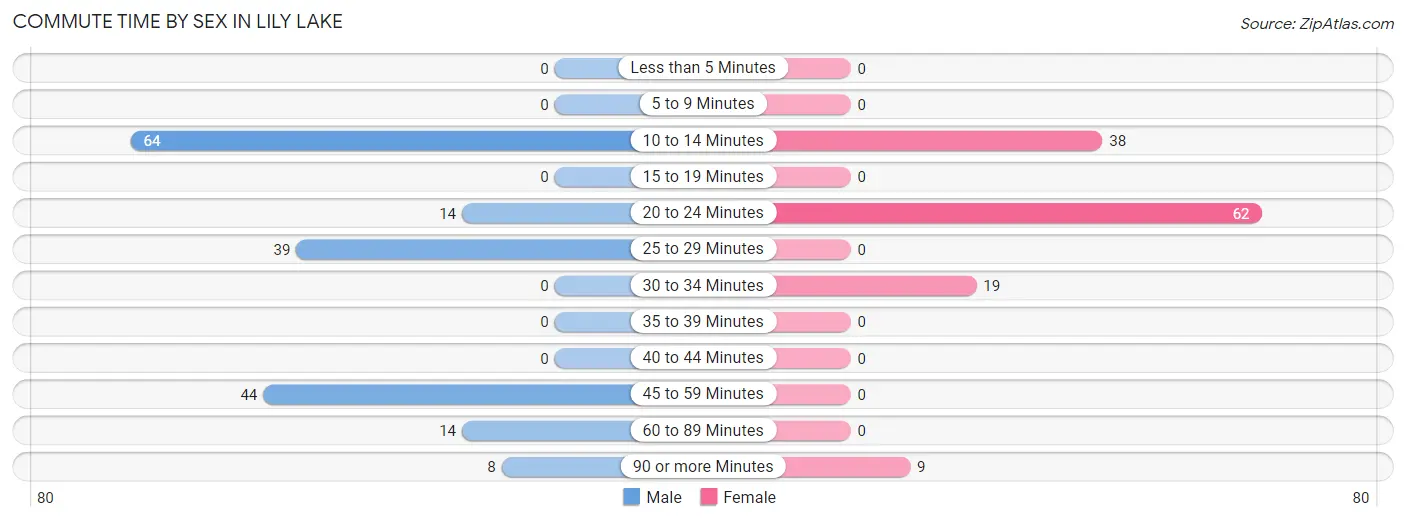
| Commute Time | Male | Female |
| Less than 5 Minutes | 0 (0.0%) | 0 (0.0%) |
| 5 to 9 Minutes | 0 (0.0%) | 0 (0.0%) |
| 10 to 14 Minutes | 64 (35.0%) | 38 (29.7%) |
| 15 to 19 Minutes | 0 (0.0%) | 0 (0.0%) |
| 20 to 24 Minutes | 14 (7.6%) | 62 (48.4%) |
| 25 to 29 Minutes | 39 (21.3%) | 0 (0.0%) |
| 30 to 34 Minutes | 0 (0.0%) | 19 (14.8%) |
| 35 to 39 Minutes | 0 (0.0%) | 0 (0.0%) |
| 40 to 44 Minutes | 0 (0.0%) | 0 (0.0%) |
| 45 to 59 Minutes | 44 (24.0%) | 0 (0.0%) |
| 60 to 89 Minutes | 14 (7.6%) | 0 (0.0%) |
| 90 or more Minutes | 8 (4.4%) | 9 (7.0%) |
Time of Departure to Work by Sex in Lily Lake
The most frequent times of departure to work in Lily Lake are 5:00 AM to 5:29 AM (58, 31.7%) for males and 5:00 AM to 5:29 AM (37, 28.9%) for females.
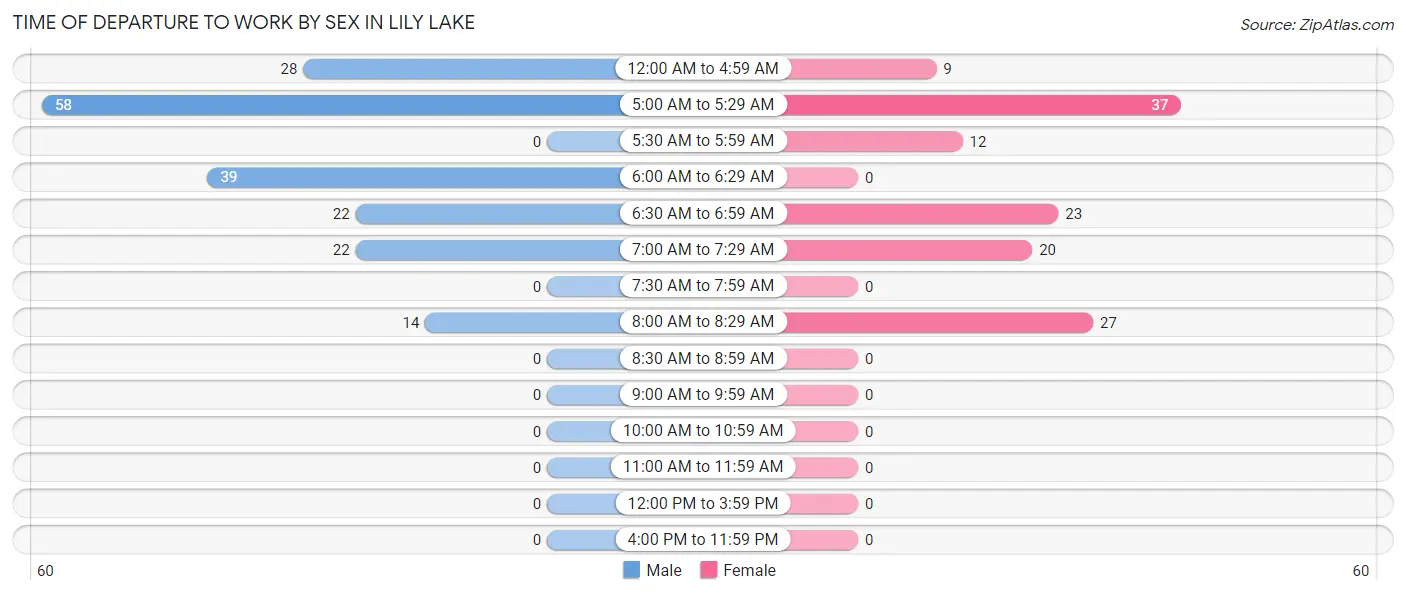
| Time of Departure | Male | Female |
| 12:00 AM to 4:59 AM | 28 (15.3%) | 9 (7.0%) |
| 5:00 AM to 5:29 AM | 58 (31.7%) | 37 (28.9%) |
| 5:30 AM to 5:59 AM | 0 (0.0%) | 12 (9.4%) |
| 6:00 AM to 6:29 AM | 39 (21.3%) | 0 (0.0%) |
| 6:30 AM to 6:59 AM | 22 (12.0%) | 23 (18.0%) |
| 7:00 AM to 7:29 AM | 22 (12.0%) | 20 (15.6%) |
| 7:30 AM to 7:59 AM | 0 (0.0%) | 0 (0.0%) |
| 8:00 AM to 8:29 AM | 14 (7.6%) | 27 (21.1%) |
| 8:30 AM to 8:59 AM | 0 (0.0%) | 0 (0.0%) |
| 9:00 AM to 9:59 AM | 0 (0.0%) | 0 (0.0%) |
| 10:00 AM to 10:59 AM | 0 (0.0%) | 0 (0.0%) |
| 11:00 AM to 11:59 AM | 0 (0.0%) | 0 (0.0%) |
| 12:00 PM to 3:59 PM | 0 (0.0%) | 0 (0.0%) |
| 4:00 PM to 11:59 PM | 0 (0.0%) | 0 (0.0%) |
| Total | 183 (100.0%) | 128 (100.0%) |
Housing Occupancy in Lily Lake
Occupancy by Ownership in Lily Lake
Of the total 230 dwellings in Lily Lake, owner-occupied units account for 218 (94.8%), while renter-occupied units make up 12 (5.2%).
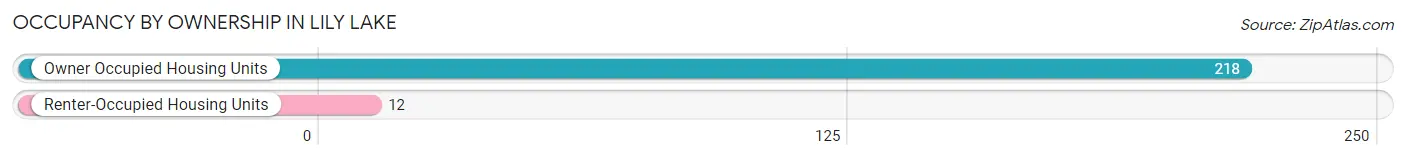
| Occupancy | # Housing Units | % Housing Units |
| Owner Occupied Housing Units | 218 | 94.8% |
| Renter-Occupied Housing Units | 12 | 5.2% |
| Total Occupied Housing Units | 230 | 100.0% |
Occupancy by Household Size in Lily Lake
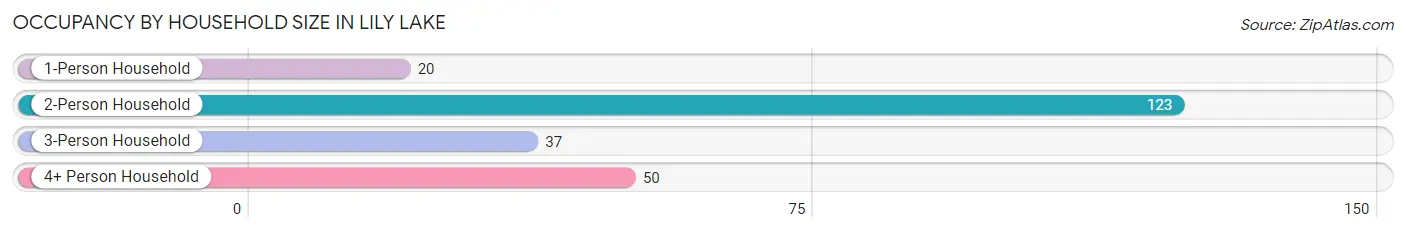
| Household Size | # Housing Units | % Housing Units |
| 1-Person Household | 20 | 8.7% |
| 2-Person Household | 123 | 53.5% |
| 3-Person Household | 37 | 16.1% |
| 4+ Person Household | 50 | 21.7% |
| Total Housing Units | 230 | 100.0% |
Occupancy by Ownership by Household Size in Lily Lake
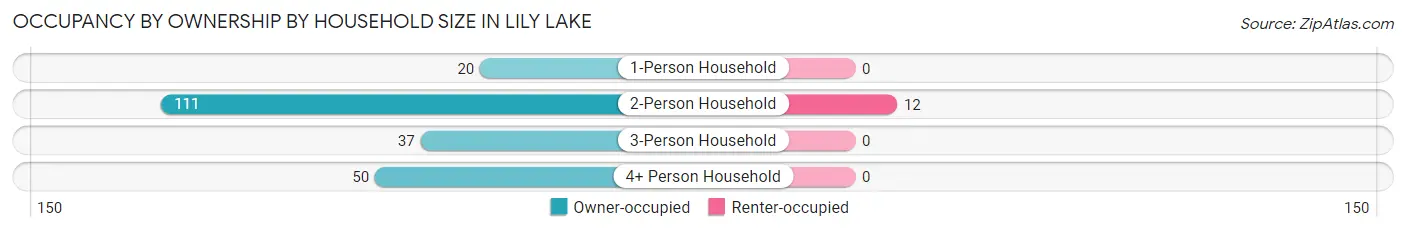
| Household Size | Owner-occupied | Renter-occupied |
| 1-Person Household | 20 (100.0%) | 0 (0.0%) |
| 2-Person Household | 111 (90.2%) | 12 (9.8%) |
| 3-Person Household | 37 (100.0%) | 0 (0.0%) |
| 4+ Person Household | 50 (100.0%) | 0 (0.0%) |
| Total Housing Units | 218 (94.8%) | 12 (5.2%) |
Occupancy by Educational Attainment in Lily Lake
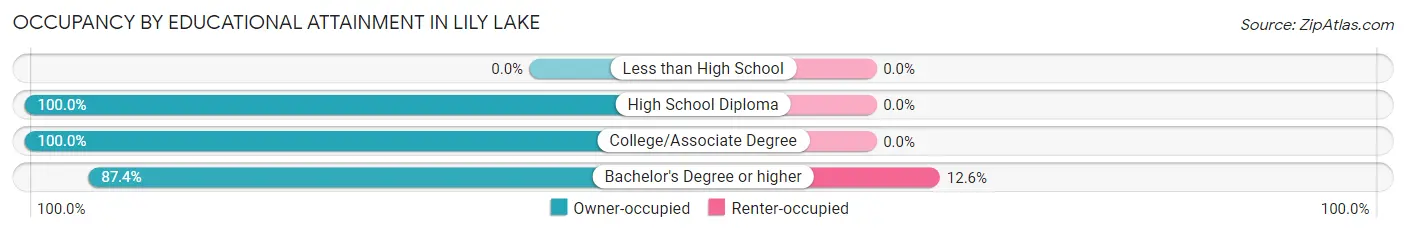
| Household Size | Owner-occupied | Renter-occupied |
| Less than High School | 0 (0.0%) | 0 (0.0%) |
| High School Diploma | 90 (100.0%) | 0 (0.0%) |
| College/Associate Degree | 45 (100.0%) | 0 (0.0%) |
| Bachelor's Degree or higher | 83 (87.4%) | 12 (12.6%) |
Occupancy by Age of Householder in Lily Lake
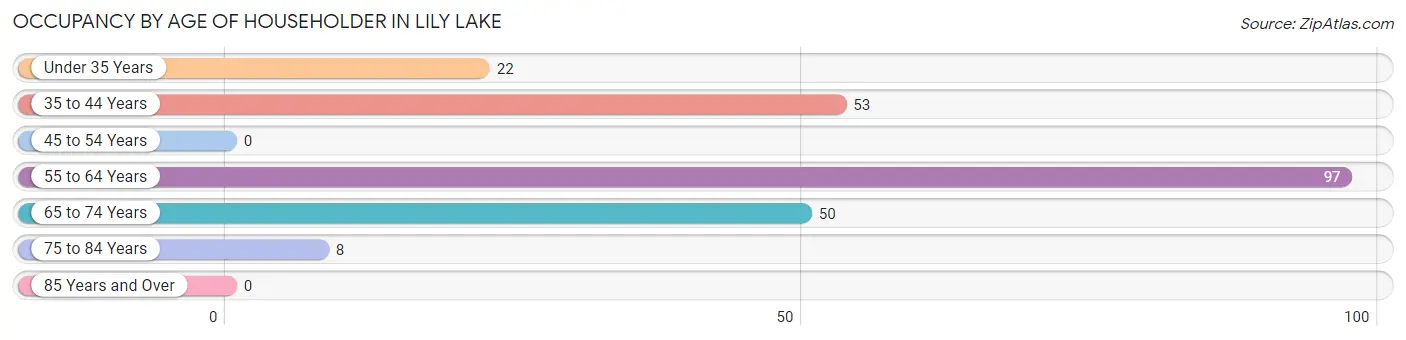
| Age Bracket | # Households | % Households |
| Under 35 Years | 22 | 9.6% |
| 35 to 44 Years | 53 | 23.0% |
| 45 to 54 Years | 0 | 0.0% |
| 55 to 64 Years | 97 | 42.2% |
| 65 to 74 Years | 50 | 21.7% |
| 75 to 84 Years | 8 | 3.5% |
| 85 Years and Over | 0 | 0.0% |
| Total | 230 | 100.0% |
Housing Finances in Lily Lake
Median Income by Occupancy in Lily Lake
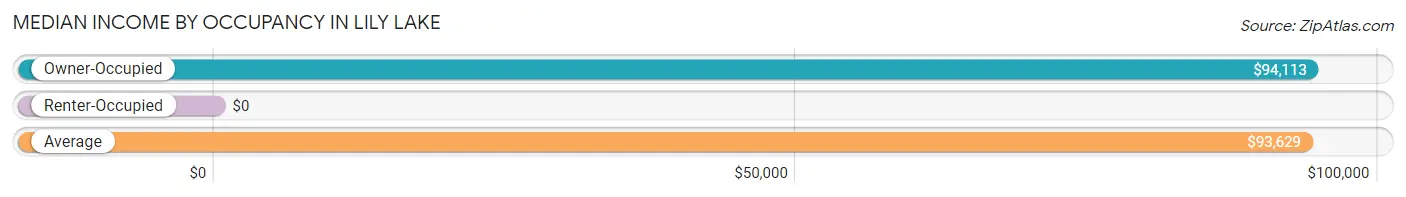
| Occupancy Type | # Households | Median Income |
| Owner-Occupied | 218 (94.8%) | $94,113 |
| Renter-Occupied | 12 (5.2%) | $0 |
| Average | 230 (100.0%) | $93,629 |
Occupancy by Householder Income Bracket in Lily Lake
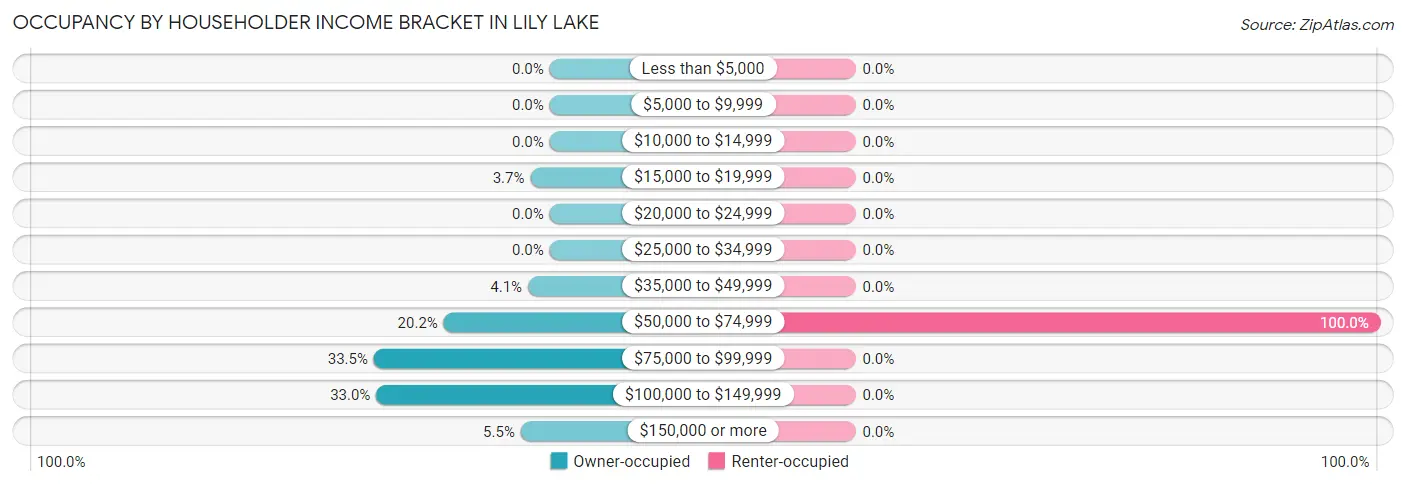
| Income Bracket | Owner-occupied | Renter-occupied |
| Less than $5,000 | 0 (0.0%) | 0 (0.0%) |
| $5,000 to $9,999 | 0 (0.0%) | 0 (0.0%) |
| $10,000 to $14,999 | 0 (0.0%) | 0 (0.0%) |
| $15,000 to $19,999 | 8 (3.7%) | 0 (0.0%) |
| $20,000 to $24,999 | 0 (0.0%) | 0 (0.0%) |
| $25,000 to $34,999 | 0 (0.0%) | 0 (0.0%) |
| $35,000 to $49,999 | 9 (4.1%) | 0 (0.0%) |
| $50,000 to $74,999 | 44 (20.2%) | 12 (100.0%) |
| $75,000 to $99,999 | 73 (33.5%) | 0 (0.0%) |
| $100,000 to $149,999 | 72 (33.0%) | 0 (0.0%) |
| $150,000 or more | 12 (5.5%) | 0 (0.0%) |
| Total | 218 (100.0%) | 12 (100.0%) |
Monthly Housing Cost Tiers in Lily Lake
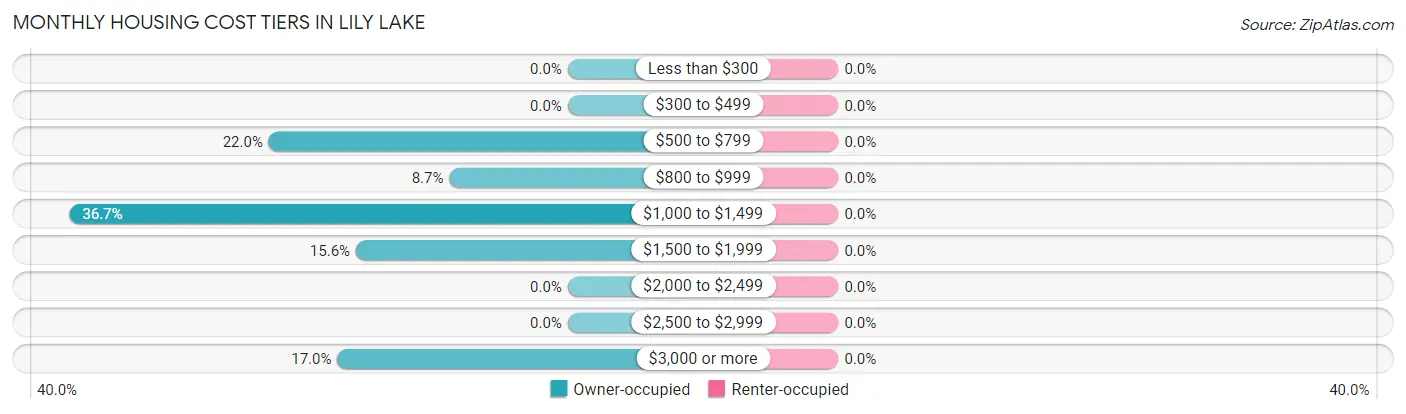
| Monthly Cost | Owner-occupied | Renter-occupied |
| Less than $300 | 0 (0.0%) | 0 (0.0%) |
| $300 to $499 | 0 (0.0%) | 0 (0.0%) |
| $500 to $799 | 48 (22.0%) | 0 (0.0%) |
| $800 to $999 | 19 (8.7%) | 0 (0.0%) |
| $1,000 to $1,499 | 80 (36.7%) | 0 (0.0%) |
| $1,500 to $1,999 | 34 (15.6%) | 0 (0.0%) |
| $2,000 to $2,499 | 0 (0.0%) | 0 (0.0%) |
| $2,500 to $2,999 | 0 (0.0%) | 0 (0.0%) |
| $3,000 or more | 37 (17.0%) | 0 (0.0%) |
| Total | 218 (100.0%) | 12 (100.0%) |
Physical Housing Characteristics in Lily Lake
Housing Structures in Lily Lake
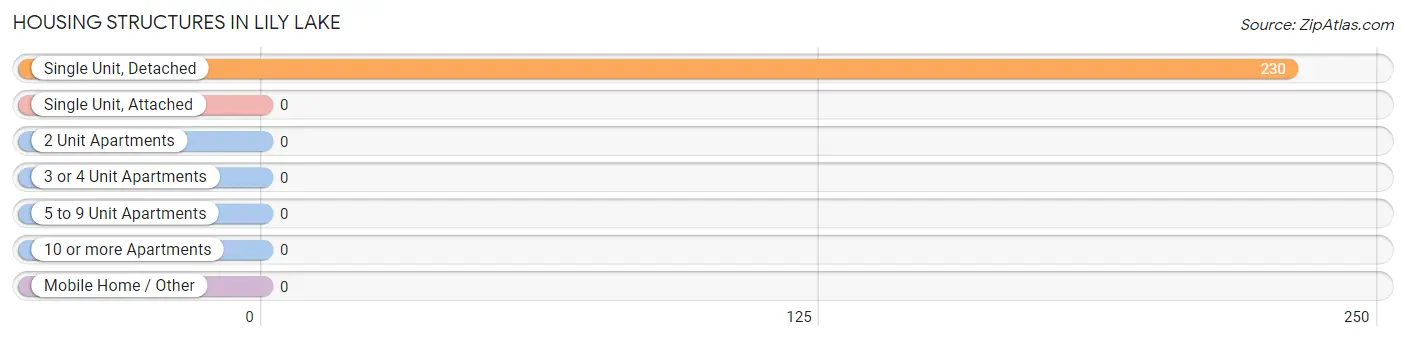
| Structure Type | # Housing Units | % Housing Units |
| Single Unit, Detached | 230 | 100.0% |
| Single Unit, Attached | 0 | 0.0% |
| 2 Unit Apartments | 0 | 0.0% |
| 3 or 4 Unit Apartments | 0 | 0.0% |
| 5 to 9 Unit Apartments | 0 | 0.0% |
| 10 or more Apartments | 0 | 0.0% |
| Mobile Home / Other | 0 | 0.0% |
| Total | 230 | 100.0% |
Housing Structures by Occupancy in Lily Lake
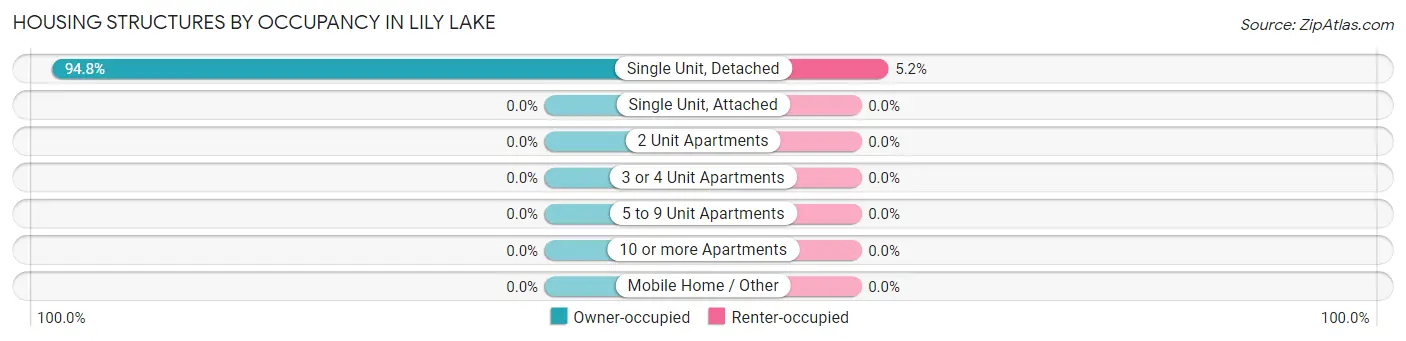
| Structure Type | Owner-occupied | Renter-occupied |
| Single Unit, Detached | 218 (94.8%) | 12 (5.2%) |
| Single Unit, Attached | 0 (0.0%) | 0 (0.0%) |
| 2 Unit Apartments | 0 (0.0%) | 0 (0.0%) |
| 3 or 4 Unit Apartments | 0 (0.0%) | 0 (0.0%) |
| 5 to 9 Unit Apartments | 0 (0.0%) | 0 (0.0%) |
| 10 or more Apartments | 0 (0.0%) | 0 (0.0%) |
| Mobile Home / Other | 0 (0.0%) | 0 (0.0%) |
| Total | 218 (94.8%) | 12 (5.2%) |
Housing Structures by Number of Rooms in Lily Lake
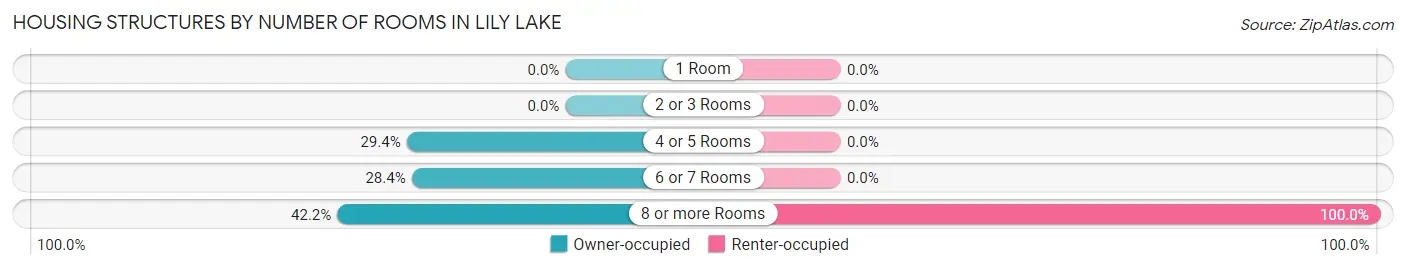
| Number of Rooms | Owner-occupied | Renter-occupied |
| 1 Room | 0 (0.0%) | 0 (0.0%) |
| 2 or 3 Rooms | 0 (0.0%) | 0 (0.0%) |
| 4 or 5 Rooms | 64 (29.4%) | 0 (0.0%) |
| 6 or 7 Rooms | 62 (28.4%) | 0 (0.0%) |
| 8 or more Rooms | 92 (42.2%) | 12 (100.0%) |
| Total | 218 (100.0%) | 12 (100.0%) |
Housing Structure by Heating Type in Lily Lake
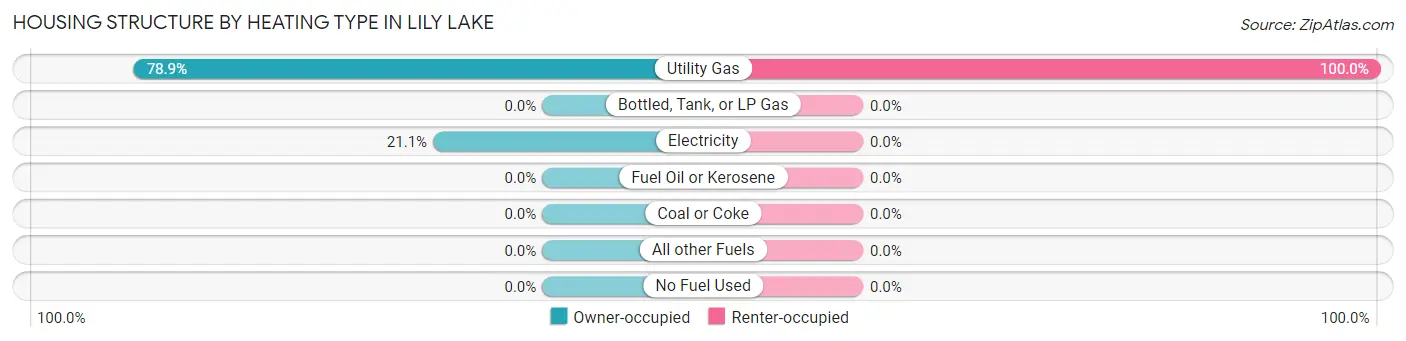
| Heating Type | Owner-occupied | Renter-occupied |
| Utility Gas | 172 (78.9%) | 12 (100.0%) |
| Bottled, Tank, or LP Gas | 0 (0.0%) | 0 (0.0%) |
| Electricity | 46 (21.1%) | 0 (0.0%) |
| Fuel Oil or Kerosene | 0 (0.0%) | 0 (0.0%) |
| Coal or Coke | 0 (0.0%) | 0 (0.0%) |
| All other Fuels | 0 (0.0%) | 0 (0.0%) |
| No Fuel Used | 0 (0.0%) | 0 (0.0%) |
| Total | 218 (100.0%) | 12 (100.0%) |
Household Vehicle Usage in Lily Lake
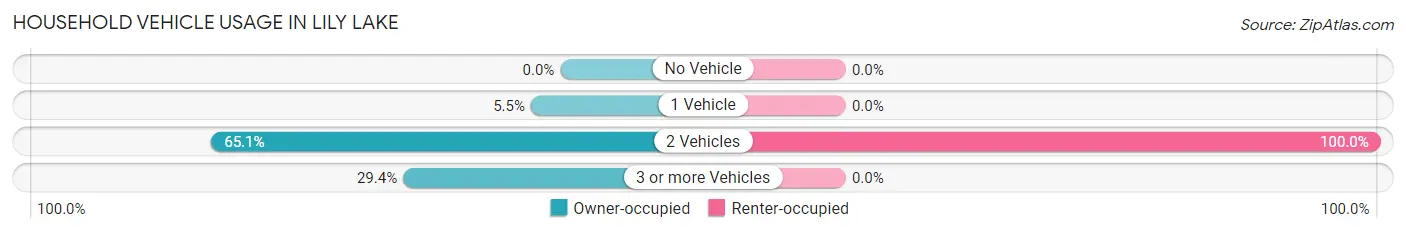
| Vehicles per Household | Owner-occupied | Renter-occupied |
| No Vehicle | 0 (0.0%) | 0 (0.0%) |
| 1 Vehicle | 12 (5.5%) | 0 (0.0%) |
| 2 Vehicles | 142 (65.1%) | 12 (100.0%) |
| 3 or more Vehicles | 64 (29.4%) | 0 (0.0%) |
| Total | 218 (100.0%) | 12 (100.0%) |
Real Estate & Mortgages in Lily Lake
Real Estate and Mortgage Overview in Lily Lake
| Characteristic | Without Mortgage | With Mortgage |
| Housing Units | 48 | 170 |
| Median Property Value | $340,000 | $217,000 |
| Median Household Income | $91,429 | $12 |
| Monthly Housing Costs | $740 | $37 |
| Real Estate Taxes | $6,000 | $0 |
Property Value by Mortgage Status in Lily Lake
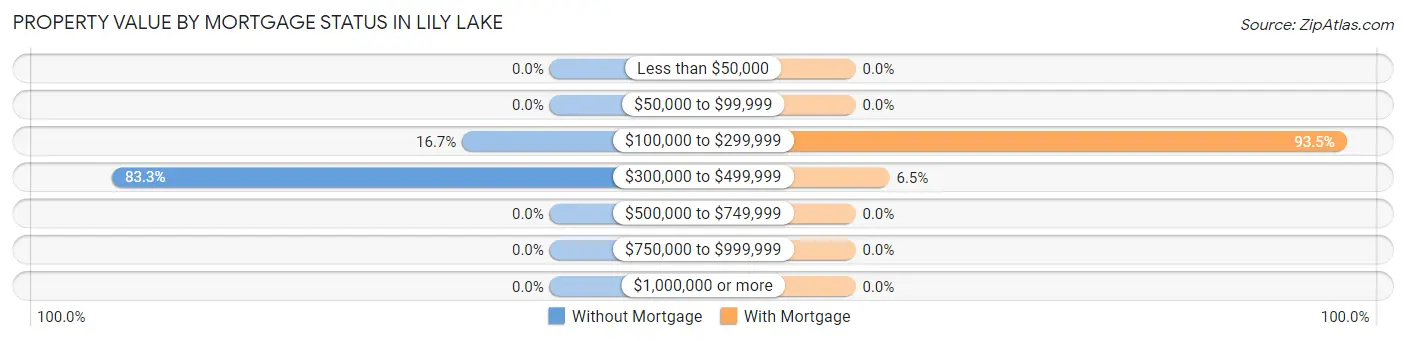
| Property Value | Without Mortgage | With Mortgage |
| Less than $50,000 | 0 (0.0%) | 0 (0.0%) |
| $50,000 to $99,999 | 0 (0.0%) | 0 (0.0%) |
| $100,000 to $299,999 | 8 (16.7%) | 159 (93.5%) |
| $300,000 to $499,999 | 40 (83.3%) | 11 (6.5%) |
| $500,000 to $749,999 | 0 (0.0%) | 0 (0.0%) |
| $750,000 to $999,999 | 0 (0.0%) | 0 (0.0%) |
| $1,000,000 or more | 0 (0.0%) | 0 (0.0%) |
| Total | 48 (100.0%) | 170 (100.0%) |
Household Income by Mortgage Status in Lily Lake
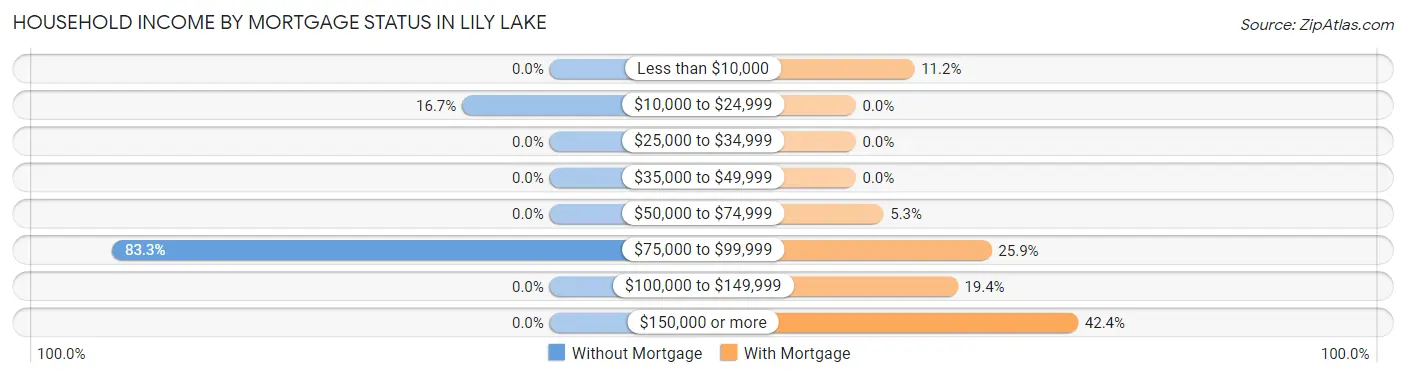
| Household Income | Without Mortgage | With Mortgage |
| Less than $10,000 | 0 (0.0%) | 19 (11.2%) |
| $10,000 to $24,999 | 8 (16.7%) | 0 (0.0%) |
| $25,000 to $34,999 | 0 (0.0%) | 0 (0.0%) |
| $35,000 to $49,999 | 0 (0.0%) | 0 (0.0%) |
| $50,000 to $74,999 | 0 (0.0%) | 9 (5.3%) |
| $75,000 to $99,999 | 40 (83.3%) | 44 (25.9%) |
| $100,000 to $149,999 | 0 (0.0%) | 33 (19.4%) |
| $150,000 or more | 0 (0.0%) | 72 (42.3%) |
| Total | 48 (100.0%) | 170 (100.0%) |
Property Value to Household Income Ratio in Lily Lake
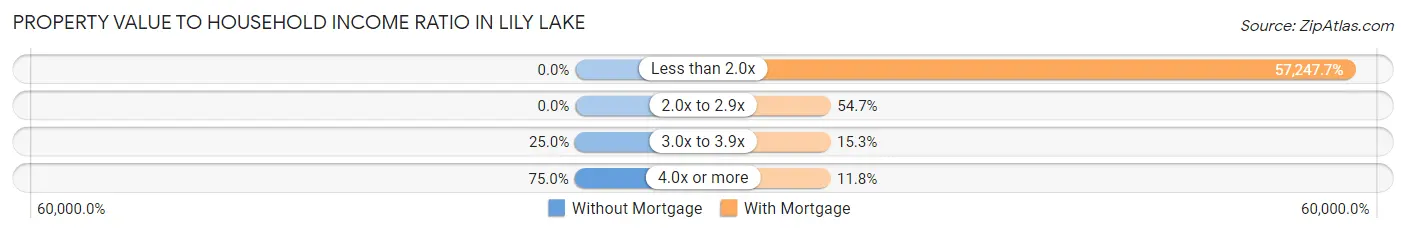
| Value-to-Income Ratio | Without Mortgage | With Mortgage |
| Less than 2.0x | 0 (0.0%) | 97,321 (57,247.6%) |
| 2.0x to 2.9x | 0 (0.0%) | 93 (54.7%) |
| 3.0x to 3.9x | 12 (25.0%) | 26 (15.3%) |
| 4.0x or more | 36 (75.0%) | 20 (11.8%) |
| Total | 48 (100.0%) | 170 (100.0%) |
Real Estate Taxes by Mortgage Status in Lily Lake
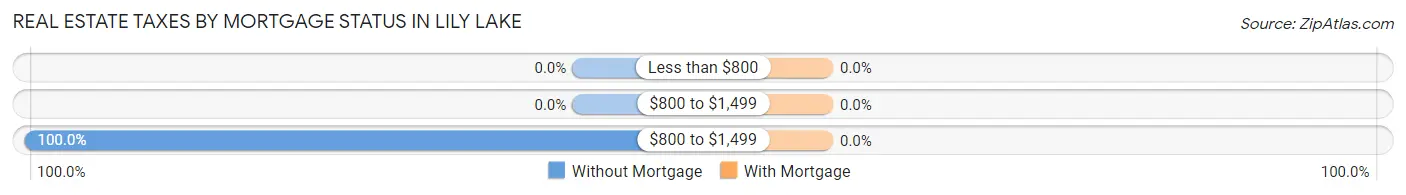
| Property Taxes | Without Mortgage | With Mortgage |
| Less than $800 | 0 (0.0%) | 0 (0.0%) |
| $800 to $1,499 | 0 (0.0%) | 0 (0.0%) |
| $800 to $1,499 | 48 (100.0%) | 0 (0.0%) |
| Total | 48 (100.0%) | 170 (100.0%) |
Health & Disability in Lily Lake
Health Insurance Coverage by Age in Lily Lake
| Age Bracket | With Coverage | Without Coverage |
| Under 6 Years | 66 (100.0%) | 0 (0.0%) |
| 6 to 18 Years | 59 (100.0%) | 0 (0.0%) |
| 19 to 25 Years | 14 (100.0%) | 0 (0.0%) |
| 26 to 34 Years | 89 (91.7%) | 8 (8.3%) |
| 35 to 44 Years | 94 (100.0%) | 0 (0.0%) |
| 45 to 54 Years | 44 (100.0%) | 0 (0.0%) |
| 55 to 64 Years | 126 (93.3%) | 9 (6.7%) |
| 65 to 74 Years | 76 (100.0%) | 0 (0.0%) |
| 75 Years and older | 8 (100.0%) | 0 (0.0%) |
| Total | 576 (97.1%) | 17 (2.9%) |
Health Insurance Coverage by Citizenship Status in Lily Lake
| Citizenship Status | With Coverage | Without Coverage |
| Native Born | 66 (100.0%) | 0 (0.0%) |
| Foreign Born, Citizen | 59 (100.0%) | 0 (0.0%) |
| Foreign Born, not a Citizen | 14 (100.0%) | 0 (0.0%) |
Health Insurance Coverage by Household Income in Lily Lake
| Household Income | With Coverage | Without Coverage |
| Under $25,000 | 8 (100.0%) | 0 (0.0%) |
| $25,000 to $49,999 | 18 (100.0%) | 0 (0.0%) |
| $50,000 to $74,999 | 132 (88.6%) | 17 (11.4%) |
| $75,000 to $99,999 | 216 (100.0%) | 0 (0.0%) |
| $100,000 and over | 202 (100.0%) | 0 (0.0%) |
Public vs Private Health Insurance Coverage by Age in Lily Lake
| Age Bracket | Public Insurance | Private Insurance |
| Under 6 | 0 (0.0%) | 66 (100.0%) |
| 6 to 18 Years | 0 (0.0%) | 59 (100.0%) |
| 19 to 25 Years | 0 (0.0%) | 14 (100.0%) |
| 25 to 34 Years | 39 (40.2%) | 89 (91.7%) |
| 35 to 44 Years | 12 (12.8%) | 94 (100.0%) |
| 45 to 54 Years | 0 (0.0%) | 44 (100.0%) |
| 55 to 64 Years | 28 (20.7%) | 117 (86.7%) |
| 65 to 74 Years | 62 (81.6%) | 76 (100.0%) |
| 75 Years and over | 8 (100.0%) | 8 (100.0%) |
| Total | 149 (25.1%) | 567 (95.6%) |
Disability Status by Sex by Age in Lily Lake
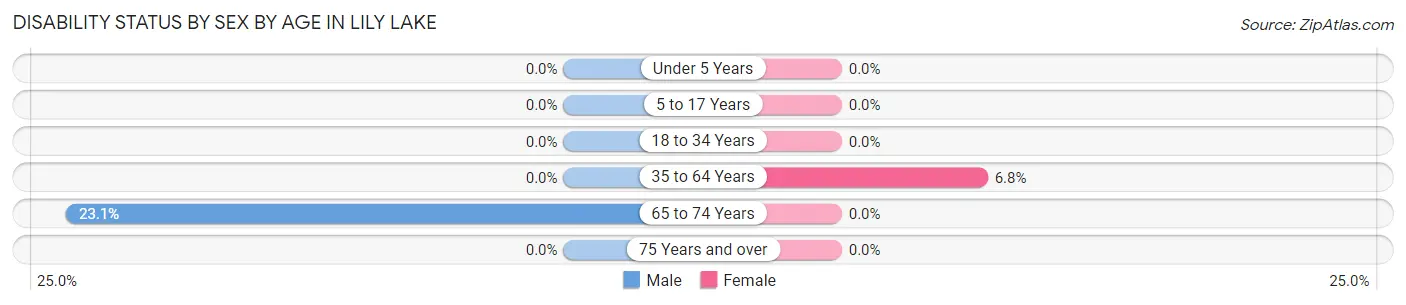
| Age Bracket | Male | Female |
| Under 5 Years | 0 (0.0%) | 0 (0.0%) |
| 5 to 17 Years | 0 (0.0%) | 0 (0.0%) |
| 18 to 34 Years | 0 (0.0%) | 0 (0.0%) |
| 35 to 64 Years | 0 (0.0%) | 9 (6.8%) |
| 65 to 74 Years | 12 (23.1%) | 0 (0.0%) |
| 75 Years and over | 0 (0.0%) | 0 (0.0%) |
Disability Class by Sex by Age in Lily Lake
Disability Class: Hearing Difficulty
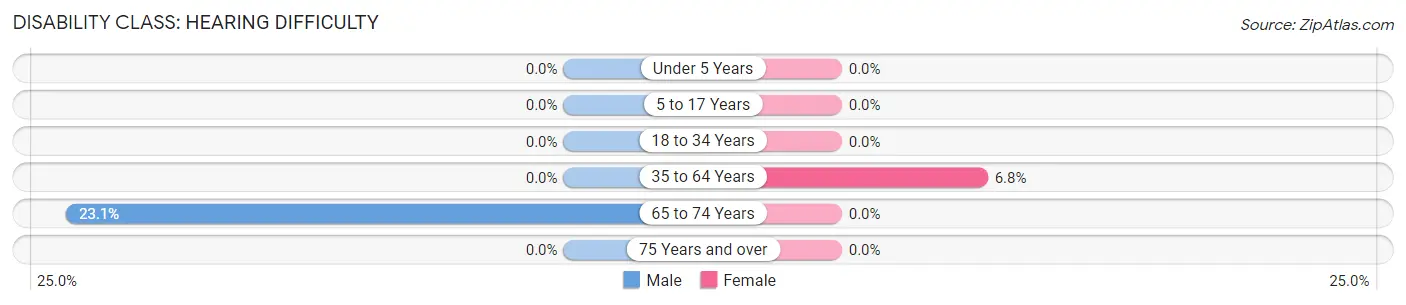
| Age Bracket | Male | Female |
| Under 5 Years | 0 (0.0%) | 0 (0.0%) |
| 5 to 17 Years | 0 (0.0%) | 0 (0.0%) |
| 18 to 34 Years | 0 (0.0%) | 0 (0.0%) |
| 35 to 64 Years | 0 (0.0%) | 9 (6.8%) |
| 65 to 74 Years | 12 (23.1%) | 0 (0.0%) |
| 75 Years and over | 0 (0.0%) | 0 (0.0%) |
Disability Class: Vision Difficulty
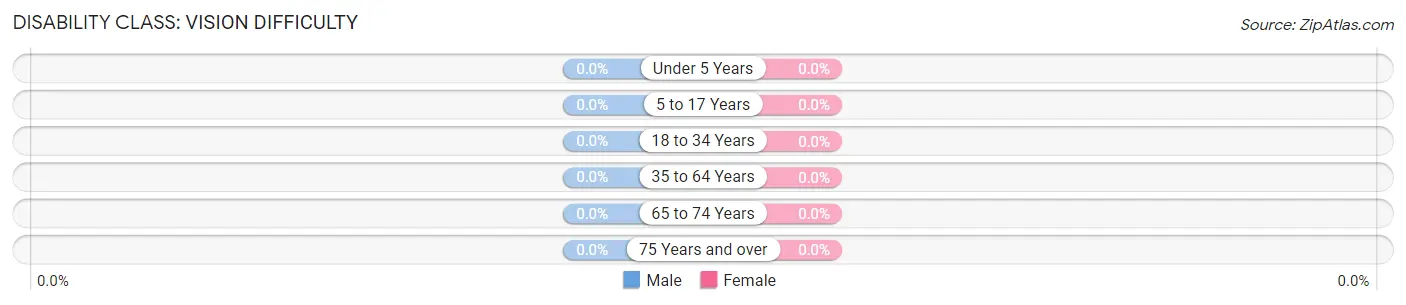
| Age Bracket | Male | Female |
| Under 5 Years | 0 (0.0%) | 0 (0.0%) |
| 5 to 17 Years | 0 (0.0%) | 0 (0.0%) |
| 18 to 34 Years | 0 (0.0%) | 0 (0.0%) |
| 35 to 64 Years | 0 (0.0%) | 0 (0.0%) |
| 65 to 74 Years | 0 (0.0%) | 0 (0.0%) |
| 75 Years and over | 0 (0.0%) | 0 (0.0%) |
Disability Class: Cognitive Difficulty

| Age Bracket | Male | Female |
| 5 to 17 Years | 0 (0.0%) | 0 (0.0%) |
| 18 to 34 Years | 0 (0.0%) | 0 (0.0%) |
| 35 to 64 Years | 0 (0.0%) | 0 (0.0%) |
| 65 to 74 Years | 0 (0.0%) | 0 (0.0%) |
| 75 Years and over | 0 (0.0%) | 0 (0.0%) |
Disability Class: Ambulatory Difficulty
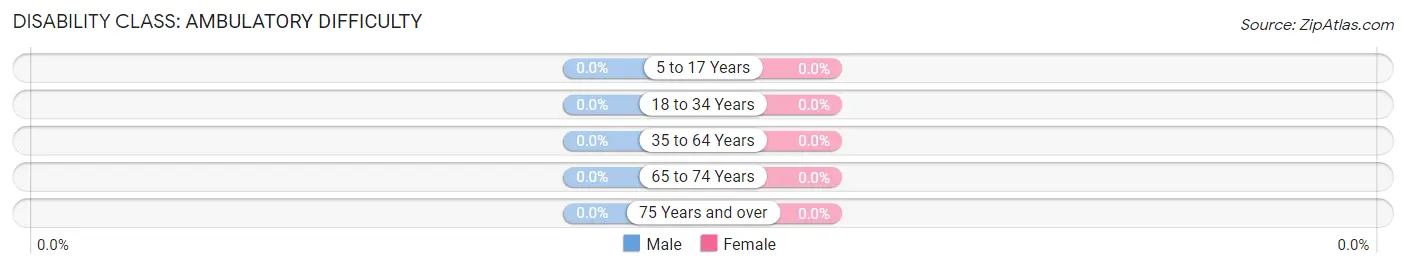
| Age Bracket | Male | Female |
| 5 to 17 Years | 0 (0.0%) | 0 (0.0%) |
| 18 to 34 Years | 0 (0.0%) | 0 (0.0%) |
| 35 to 64 Years | 0 (0.0%) | 0 (0.0%) |
| 65 to 74 Years | 0 (0.0%) | 0 (0.0%) |
| 75 Years and over | 0 (0.0%) | 0 (0.0%) |
Disability Class: Self-Care Difficulty
| Age Bracket | Male | Female |
| 5 to 17 Years | 0 (0.0%) | 0 (0.0%) |
| 18 to 34 Years | 0 (0.0%) | 0 (0.0%) |
| 35 to 64 Years | 0 (0.0%) | 0 (0.0%) |
| 65 to 74 Years | 0 (0.0%) | 0 (0.0%) |
| 75 Years and over | 0 (0.0%) | 0 (0.0%) |
Technology Access in Lily Lake
Computing Device Access in Lily Lake
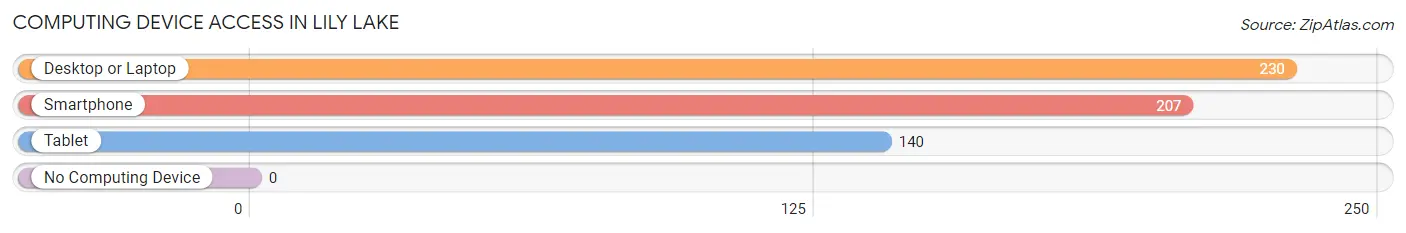
| Device Type | # Households | % Households |
| Desktop or Laptop | 230 | 100.0% |
| Smartphone | 207 | 90.0% |
| Tablet | 140 | 60.9% |
| No Computing Device | 0 | 0.0% |
| Total | 230 | 100.0% |
Internet Access in Lily Lake
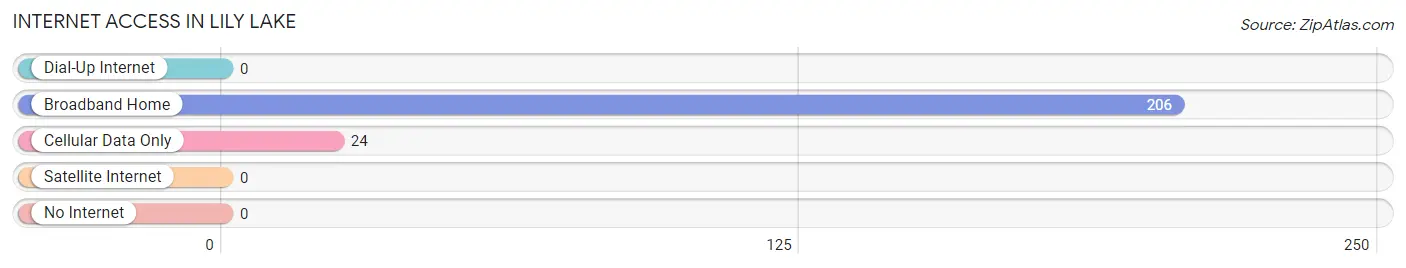
| Internet Type | # Households | % Households |
| Dial-Up Internet | 0 | 0.0% |
| Broadband Home | 206 | 89.6% |
| Cellular Data Only | 24 | 10.4% |
| Satellite Internet | 0 | 0.0% |
| No Internet | 0 | 0.0% |
| Total | 230 | 100.0% |
Lily Lake Summary
Lily Lake is a small village located in Walworth County, Wisconsin, United States. The village is situated on the western shore of Lily Lake, a small lake of the same name. The village is located within the Town of Linn, and is part of the Lake Geneva-Genoa City Metropolitan Statistical Area. As of the 2010 census, the village had a population of 545.
History
The area around Lily Lake was first settled in the early 19th century by settlers from New England. The village was originally known as "Linnville", after the Town of Linn in which it is located. The village was renamed "Lily Lake" in 1856, after the lake of the same name.
The village was incorporated in 1891, and the first mayor was elected in 1892. The village was a popular summer resort destination in the late 19th and early 20th centuries, and was home to several resorts and hotels.
Geography
Lily Lake is located at 42°35'25" North, 88°37'45" West (42.590278, -88.629167). The village is situated on the western shore of Lily Lake, a small lake of the same name. The lake is approximately 1.5 miles long and 0.5 miles wide.
The village is located within the Town of Linn, and is part of the Lake Geneva-Genoa City Metropolitan Statistical Area. The village is located approximately 25 miles southwest of Milwaukee, and 50 miles northwest of Chicago.
Economy
The economy of Lily Lake is largely based on tourism and recreation. The village is home to several resorts and hotels, as well as a number of restaurants and bars. The village is also home to a marina, which offers boat rentals and fishing charters.
Demographics
As of the 2010 census, there were 545 people, 212 households, and 145 families residing in the village. The population density was 1,072.3 people per square mile (414.7/km2). There were 229 housing units at an average density of 449.3 per square mile (173.7/km2). The racial makeup of the village was 97.3% White, 0.2% African American, 0.2% Native American, 0.2% Asian, 0.4% from other races, and 1.7% from two or more races. Hispanic or Latino of any race were 1.3% of the population.
There were 212 households, out of which 28.3% had children under the age of 18 living with them, 54.2% were married couples living together, 8.5% had a female householder with no husband present, and 33.0% were non-families. 28.3% of all households were made up of individuals, and 11.3% had someone living alone who was 65 years of age or older. The average household size was 2.57 and the average family size was 3.17.
In the village, the population was spread out, with 25.2% under the age of 18, 6.7% from 18 to 24, 28.3% from 25 to 44, 24.2% from 45 to 64, and 15.6% who were 65 years of age or older. The median age was 39 years. For every 100 females, there were 97.3 males. For every 100 females age 18 and over, there were 94.3 males.
The median income for a household in the village was $45,000, and the median income for a family was $50,000. Males had a median income of $36,250 versus $25,000 for females. The per capita income for the village was $20,945. About 4.2% of families and 6.2% of the population were below the poverty line, including 8.3% of those under age 18 and 4.2% of those age 65 or over.
Common Questions
What is Per Capita Income in Lily Lake?
Per Capita income in Lily Lake is $38,100.
What is the Median Family Income in Lily Lake?
Median Family Income in Lily Lake is $93,468.
What is the Median Household income in Lily Lake?
Median Household Income in Lily Lake is $93,629.
What is Income or Wage Gap in Lily Lake?
Income or Wage Gap in Lily Lake is 0.1%.
Women in Lily Lake earn 99.9 cents for every dollar earned by a man.
What is Inequality or Gini Index in Lily Lake?
Inequality or Gini Index in Lily Lake is 0.18.
What is the Total Population of Lily Lake?
Total Population of Lily Lake is 593.
What is the Total Male Population of Lily Lake?
Total Male Population of Lily Lake is 334.
What is the Total Female Population of Lily Lake?
Total Female Population of Lily Lake is 259.
What is the Ratio of Males per 100 Females in Lily Lake?
There are 128.96 Males per 100 Females in Lily Lake.
What is the Ratio of Females per 100 Males in Lily Lake?
There are 77.54 Females per 100 Males in Lily Lake.
What is the Median Population Age in Lily Lake?
Median Population Age in Lily Lake is 38.2 Years.
What is the Average Family Size in Lily Lake
Average Family Size in Lily Lake is 2.7 People.
What is the Average Household Size in Lily Lake
Average Household Size in Lily Lake is 2.6 People.
How Large is the Labor Force in Lily Lake?
There are 354 People in the Labor Forcein in Lily Lake.
What is the Percentage of People in the Labor Force in Lily Lake?
75.6% of People are in the Labor Force in Lily Lake.