Key Biscayne, FL Map & Demographics
Key Biscayne Map
Key Biscayne Overview
$87,271
PER CAPITA INCOME
$219,112
AVG FAMILY INCOME
$173,015
AVG HOUSEHOLD INCOME
62.5%
WAGE / INCOME GAP [ % ]
37.5¢/ $1
WAGE / INCOME GAP [ $ ]
$13,371
FAMILY INCOME DEFICIT
0.53
INEQUALITY / GINI INDEX
14,572
TOTAL POPULATION
7,203
MALE POPULATION
7,369
FEMALE POPULATION
97.75
MALES / 100 FEMALES
102.30
FEMALES / 100 MALES
42.3
MEDIAN AGE
3.5
AVG FAMILY SIZE
3.1
AVG HOUSEHOLD SIZE
6,196
LABOR FORCE [ PEOPLE ]
57.4%
PERCENT IN LABOR FORCE
4.1%
UNEMPLOYMENT RATE
Key Biscayne Zip Codes
Key Biscayne Area Codes
Income in Key Biscayne
Income Overview in Key Biscayne
Per Capita Income in Key Biscayne is $87,271, while median incomes of families and households are $219,112 and $173,015 respectively.
| Characteristic | Number | Measure |
| Per Capita Income | 14,572 | $87,271 |
| Median Family Income | 3,673 | $219,112 |
| Mean Family Income | 3,673 | $297,011 |
| Median Household Income | 4,658 | $173,015 |
| Mean Household Income | 4,658 | $264,913 |
| Income Deficit | 3,673 | $13,371 |
| Wage / Income Gap (%) | 14,572 | 62.50% |
| Wage / Income Gap ($) | 14,572 | 37.50¢ per $1 |
| Gini / Inequality Index | 14,572 | 0.53 |
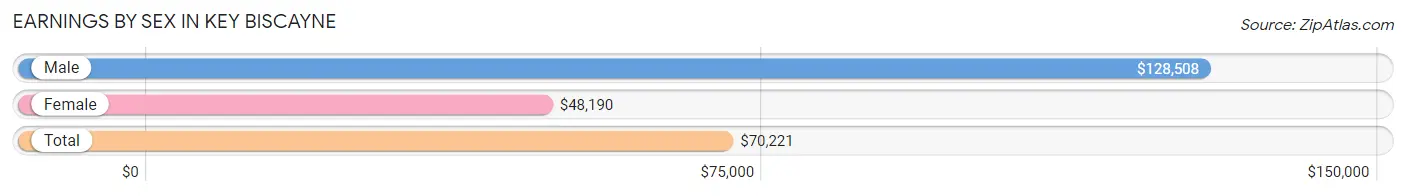
Earnings by Sex in Key Biscayne
Average Earnings in Key Biscayne are $70,221, $128,508 for men and $48,190 for women, a difference of 62.5%.
| Sex | Number | Average Earnings |
| Male | 3,645 (55.4%) | $128,508 |
| Female | 2,930 (44.6%) | $48,190 |
| Total | 6,575 (100.0%) | $70,221 |
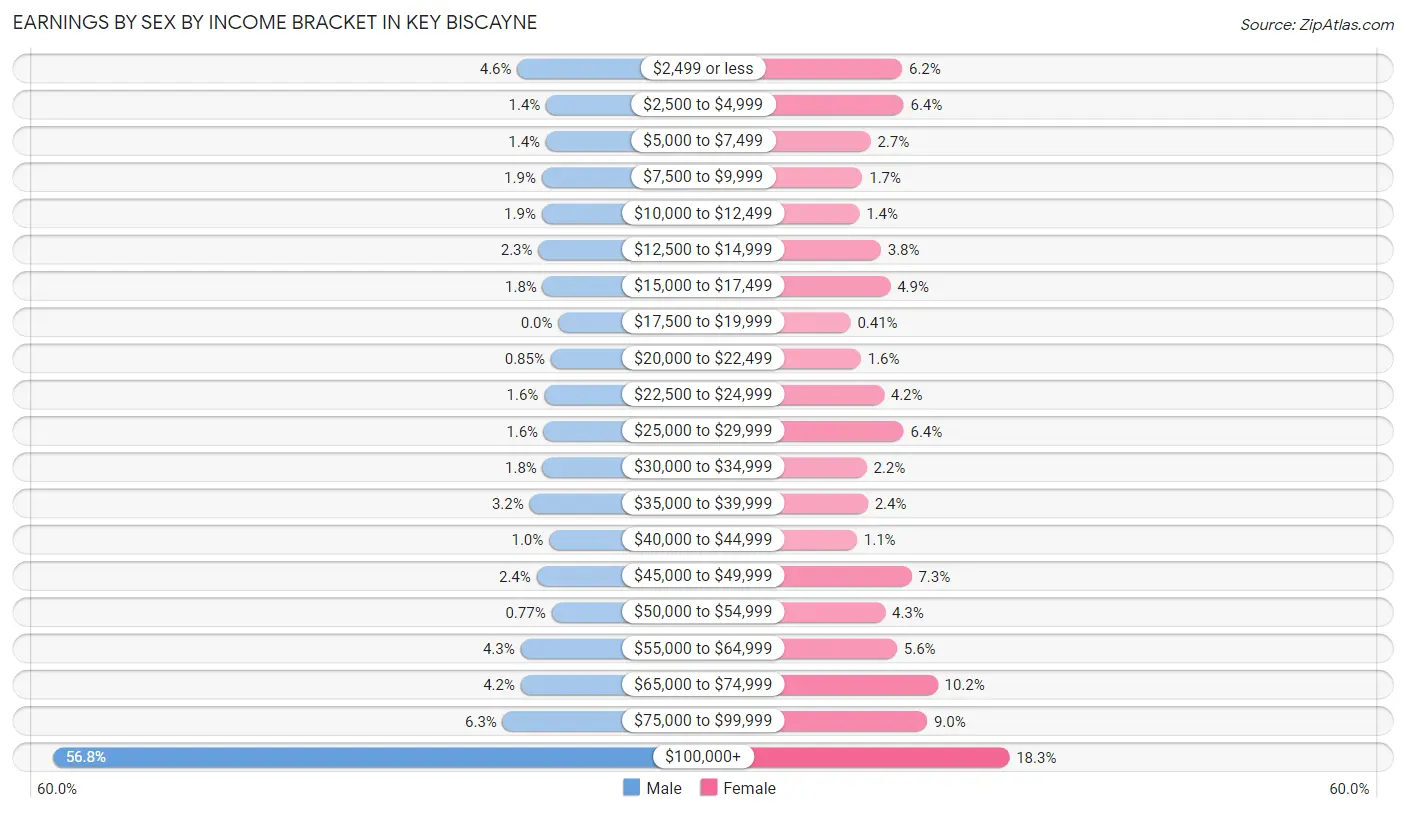
Earnings by Sex by Income Bracket in Key Biscayne
The most common earnings brackets in Key Biscayne are $100,000+ for men (2,072 | 56.8%) and $100,000+ for women (535 | 18.3%).
| Income | Male | Female |
| $2,499 or less | 168 (4.6%) | 182 (6.2%) |
| $2,500 to $4,999 | 50 (1.4%) | 187 (6.4%) |
| $5,000 to $7,499 | 51 (1.4%) | 78 (2.7%) |
| $7,500 to $9,999 | 68 (1.9%) | 51 (1.7%) |
| $10,000 to $12,499 | 68 (1.9%) | 41 (1.4%) |
| $12,500 to $14,999 | 82 (2.2%) | 112 (3.8%) |
| $15,000 to $17,499 | 64 (1.8%) | 143 (4.9%) |
| $17,500 to $19,999 | 0 (0.0%) | 12 (0.4%) |
| $20,000 to $22,499 | 31 (0.9%) | 46 (1.6%) |
| $22,500 to $24,999 | 58 (1.6%) | 122 (4.2%) |
| $25,000 to $29,999 | 59 (1.6%) | 187 (6.4%) |
| $30,000 to $34,999 | 64 (1.8%) | 65 (2.2%) |
| $35,000 to $39,999 | 118 (3.2%) | 69 (2.4%) |
| $40,000 to $44,999 | 38 (1.0%) | 33 (1.1%) |
| $45,000 to $49,999 | 89 (2.4%) | 213 (7.3%) |
| $50,000 to $54,999 | 28 (0.8%) | 126 (4.3%) |
| $55,000 to $64,999 | 155 (4.3%) | 165 (5.6%) |
| $65,000 to $74,999 | 154 (4.2%) | 299 (10.2%) |
| $75,000 to $99,999 | 228 (6.3%) | 264 (9.0%) |
| $100,000+ | 2,072 (56.8%) | 535 (18.3%) |
| Total | 3,645 (100.0%) | 2,930 (100.0%) |
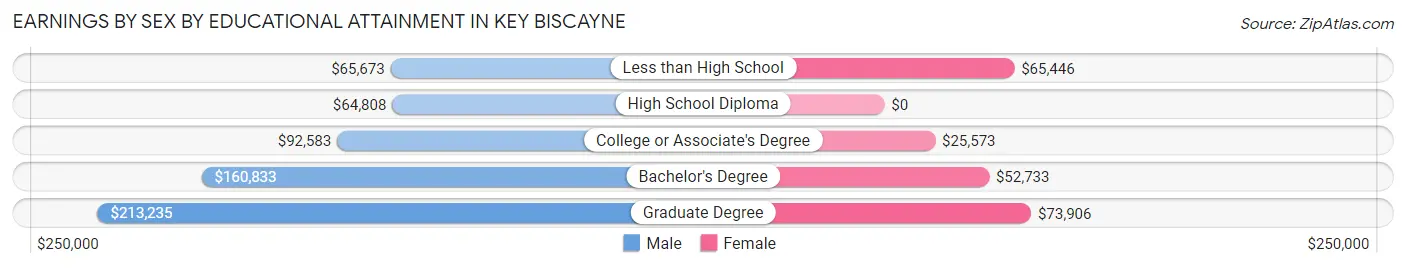
Earnings by Sex by Educational Attainment in Key Biscayne
Average earnings in Key Biscayne are $154,500 for men and $52,500 for women, a difference of 66.0%. Men with an educational attainment of graduate degree enjoy the highest average annual earnings of $213,235, while those with high school diploma education earn the least with $64,808. Women with an educational attainment of graduate degree earn the most with the average annual earnings of $73,906, while those with college or associate's degree education have the smallest earnings of $25,573.
| Educational Attainment | Male Income | Female Income |
| Less than High School | $65,673 | $65,446 |
| High School Diploma | $64,808 | $0 |
| College or Associate's Degree | $92,583 | $25,573 |
| Bachelor's Degree | $160,833 | $52,733 |
| Graduate Degree | $213,235 | $73,906 |
| Total | $154,500 | $52,500 |
Family Income in Key Biscayne
Family Income Brackets in Key Biscayne
According to the Key Biscayne family income data, there are 1,980 families falling into the $200,000+ income range, which is the most common income bracket and makes up 53.9% of all families. Conversely, the $10,000 to $14,999 income bracket is the least frequent group with only 37 families (1.0%) belonging to this category.
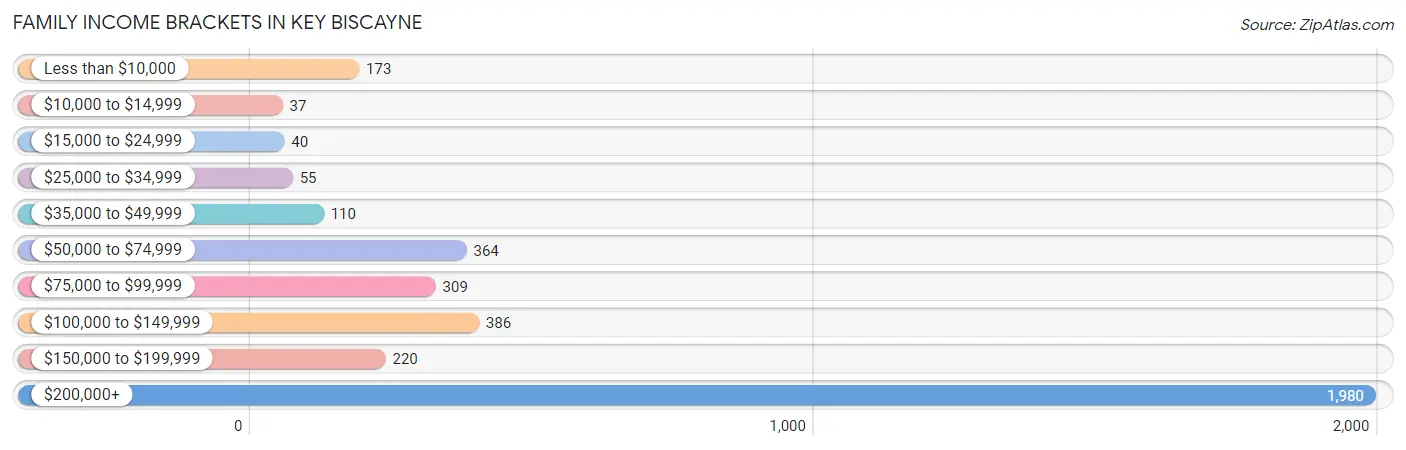
| Income Bracket | # Families | % Families |
| Less than $10,000 | 173 | 4.7% |
| $10,000 to $14,999 | 37 | 1.0% |
| $15,000 to $24,999 | 40 | 1.1% |
| $25,000 to $34,999 | 55 | 1.5% |
| $35,000 to $49,999 | 110 | 3.0% |
| $50,000 to $74,999 | 364 | 9.9% |
| $75,000 to $99,999 | 309 | 8.4% |
| $100,000 to $149,999 | 386 | 10.5% |
| $150,000 to $199,999 | 220 | 6.0% |
| $200,000+ | 1,980 | 53.9% |
Family Income by Famaliy Size in Key Biscayne
4-person families (1,111 | 30.2%) account for the highest median family income in Key Biscayne with $250,001 per family, while 2-person families (1,165 | 31.7%) have the highest median income of $71,146 per family member.
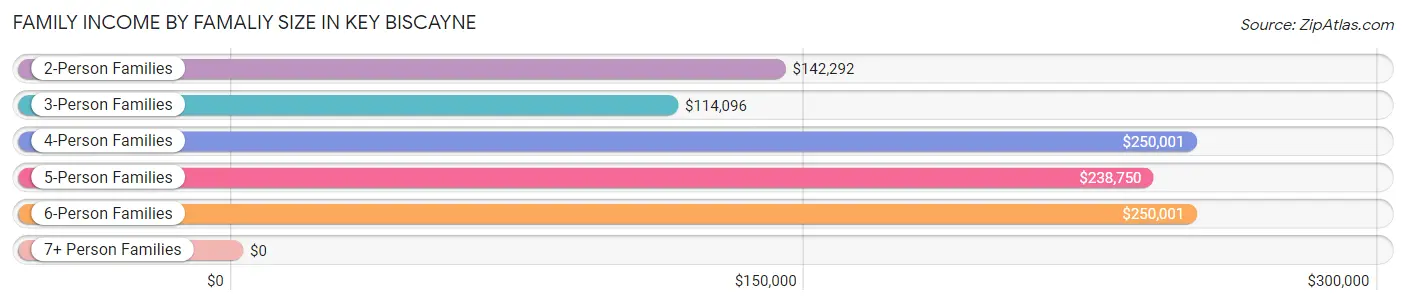
| Income Bracket | # Families | Median Income |
| 2-Person Families | 1,165 (31.7%) | $142,292 |
| 3-Person Families | 794 (21.6%) | $114,096 |
| 4-Person Families | 1,111 (30.2%) | $250,001 |
| 5-Person Families | 394 (10.7%) | $238,750 |
| 6-Person Families | 162 (4.4%) | $250,001 |
| 7+ Person Families | 47 (1.3%) | $0 |
| Total | 3,673 (100.0%) | $219,112 |
Family Income by Number of Earners in Key Biscayne
The median family income in Key Biscayne is $219,112, with families comprising 3+ earners (393) having the highest median family income of $250,001, while families with no earners (432) have the lowest median family income of $86,500, accounting for 10.7% and 11.8% of families, respectively.
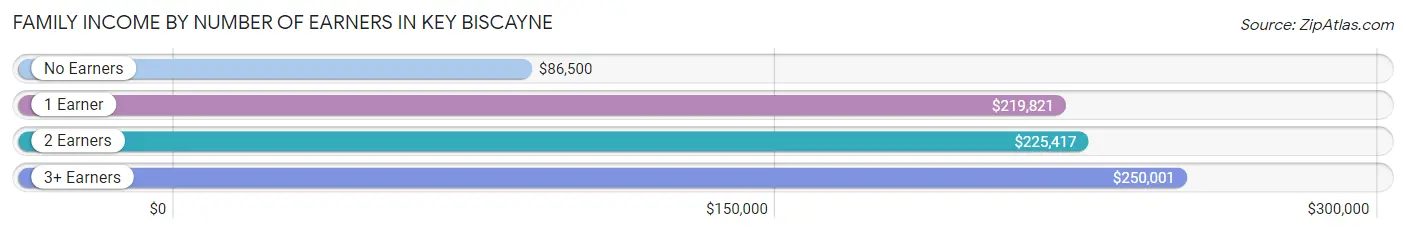
| Number of Earners | # Families | Median Income |
| No Earners | 432 (11.8%) | $86,500 |
| 1 Earner | 1,536 (41.8%) | $219,821 |
| 2 Earners | 1,312 (35.7%) | $225,417 |
| 3+ Earners | 393 (10.7%) | $250,001 |
| Total | 3,673 (100.0%) | $219,112 |
Household Income in Key Biscayne
Household Income Brackets in Key Biscayne
With 2,199 households falling in the category, the $200,000+ income range is the most frequent in Key Biscayne, accounting for 47.2% of all households. In contrast, only 93 households (2.0%) fall into the $10,000 to $14,999 income bracket, making it the least populous group.
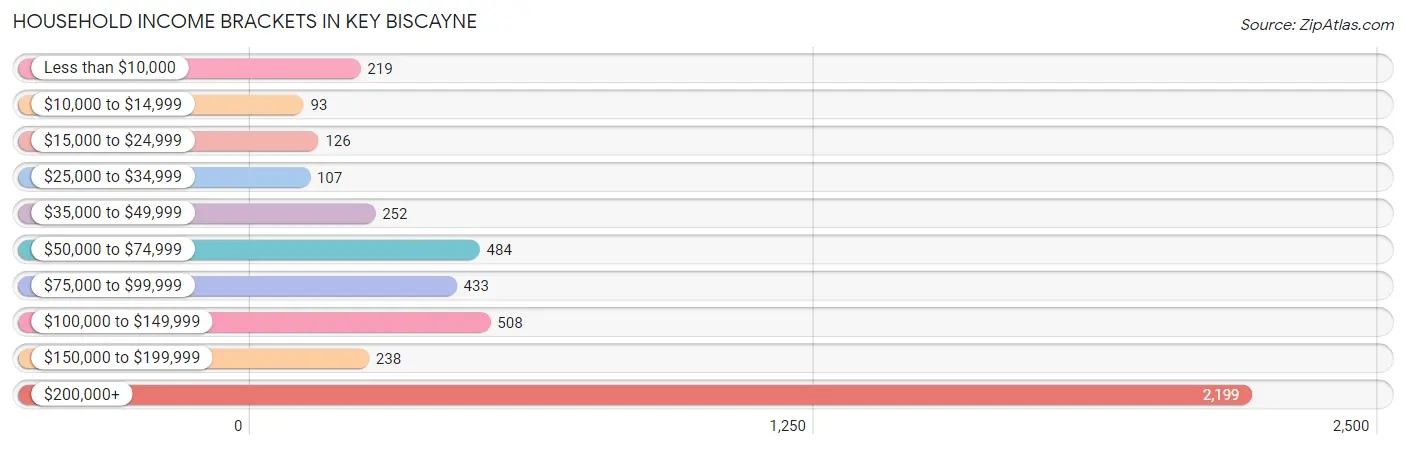
| Income Bracket | # Households | % Households |
| Less than $10,000 | 219 | 4.7% |
| $10,000 to $14,999 | 93 | 2.0% |
| $15,000 to $24,999 | 126 | 2.7% |
| $25,000 to $34,999 | 107 | 2.3% |
| $35,000 to $49,999 | 252 | 5.4% |
| $50,000 to $74,999 | 484 | 10.4% |
| $75,000 to $99,999 | 433 | 9.3% |
| $100,000 to $149,999 | 508 | 10.9% |
| $150,000 to $199,999 | 238 | 5.1% |
| $200,000+ | 2,199 | 47.2% |
Household Income by Householder Age in Key Biscayne
The median household income in Key Biscayne is $173,015, with the highest median household income of $208,107 found in the 45 to 64 years age bracket for the primary householder. A total of 2,375 households (51.0%) fall into this category. Meanwhile, the 15 to 24 years age bracket for the primary householder has the lowest median household income of $0, with 6 households (0.1%) in this group.
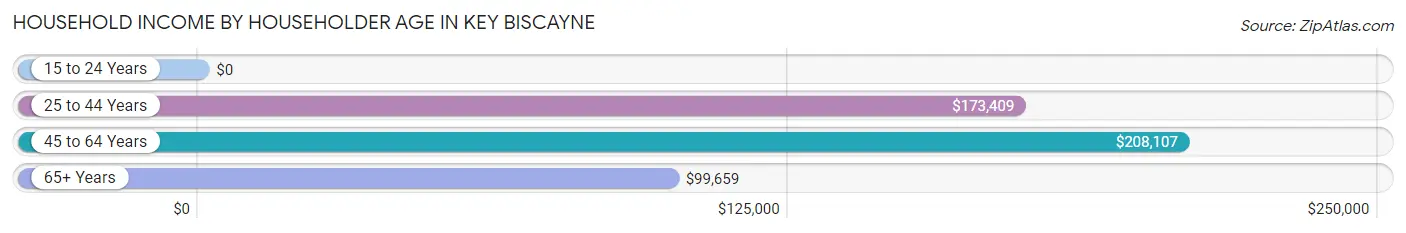
| Income Bracket | # Households | Median Income |
| 15 to 24 Years | 6 (0.1%) | $0 |
| 25 to 44 Years | 876 (18.8%) | $173,409 |
| 45 to 64 Years | 2,375 (51.0%) | $208,107 |
| 65+ Years | 1,401 (30.1%) | $99,659 |
| Total | 4,658 (100.0%) | $173,015 |
Poverty in Key Biscayne
Income Below Poverty by Sex and Age in Key Biscayne
With 6.7% poverty level for males and 10.0% for females among the residents of Key Biscayne, 16 and 17 year old males and 45 to 54 year old females are the most vulnerable to poverty, with 72 males (21.0%) and 302 females (17.5%) in their respective age groups living below the poverty level.
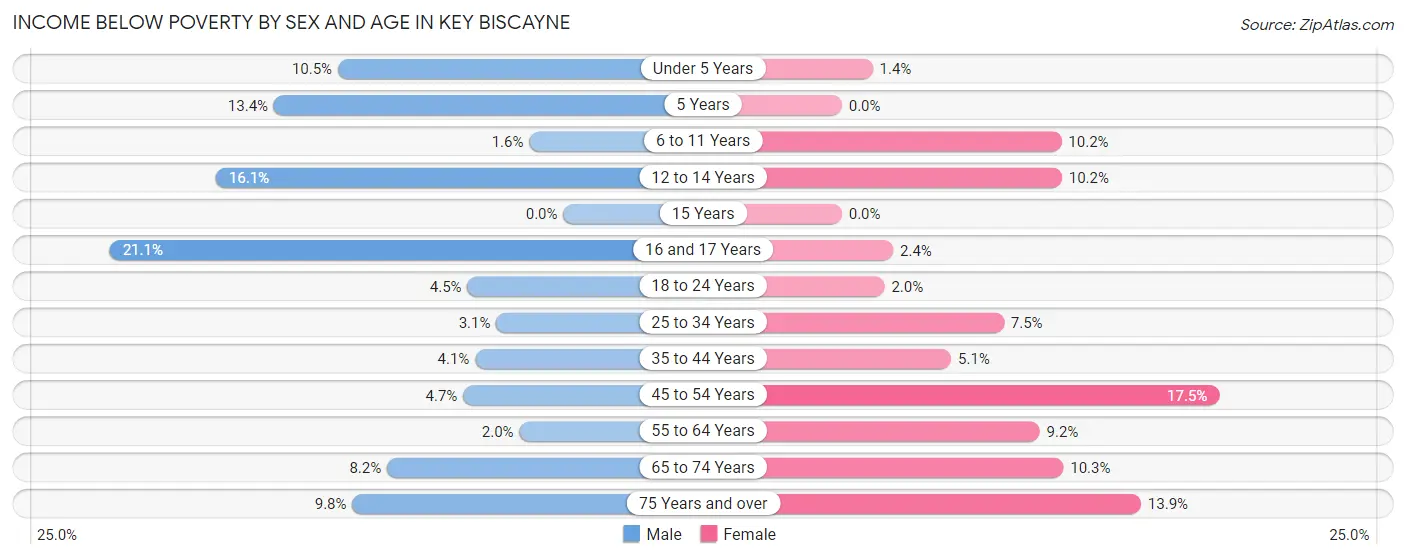
| Age Bracket | Male | Female |
| Under 5 Years | 39 (10.5%) | 4 (1.4%) |
| 5 Years | 9 (13.4%) | 0 (0.0%) |
| 6 to 11 Years | 14 (1.6%) | 53 (10.2%) |
| 12 to 14 Years | 123 (16.1%) | 62 (10.2%) |
| 15 Years | 0 (0.0%) | 0 (0.0%) |
| 16 and 17 Years | 72 (21.0%) | 11 (2.4%) |
| 18 to 24 Years | 26 (4.4%) | 7 (2.0%) |
| 25 to 34 Years | 10 (3.1%) | 30 (7.5%) |
| 35 to 44 Years | 29 (4.1%) | 42 (5.1%) |
| 45 to 54 Years | 66 (4.6%) | 302 (17.5%) |
| 55 to 64 Years | 14 (2.0%) | 65 (9.2%) |
| 65 to 74 Years | 36 (8.2%) | 76 (10.3%) |
| 75 Years and over | 46 (9.8%) | 84 (13.9%) |
| Total | 484 (6.7%) | 736 (10.0%) |
Income Above Poverty by Sex and Age in Key Biscayne
According to the poverty statistics in Key Biscayne, males aged 15 years and females aged 5 years are the age groups that are most secure financially, with 100.0% of males and 100.0% of females in these age groups living above the poverty line.
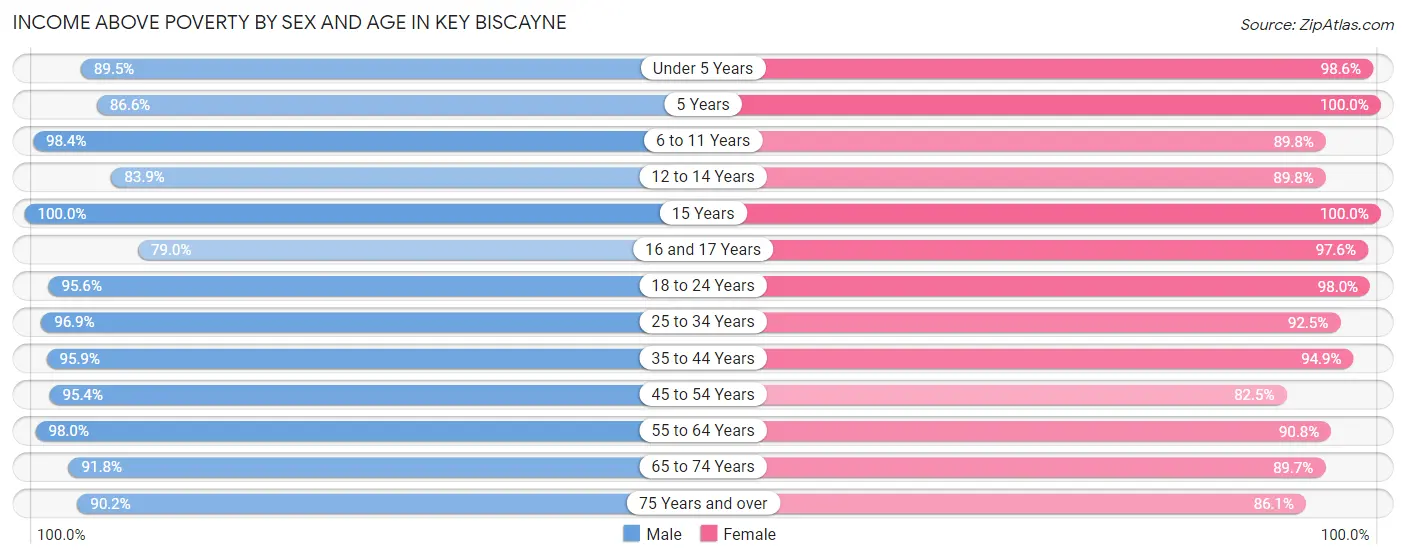
| Age Bracket | Male | Female |
| Under 5 Years | 334 (89.5%) | 276 (98.6%) |
| 5 Years | 58 (86.6%) | 36 (100.0%) |
| 6 to 11 Years | 874 (98.4%) | 467 (89.8%) |
| 12 to 14 Years | 640 (83.9%) | 545 (89.8%) |
| 15 Years | 139 (100.0%) | 105 (100.0%) |
| 16 and 17 Years | 270 (78.9%) | 451 (97.6%) |
| 18 to 24 Years | 558 (95.6%) | 347 (98.0%) |
| 25 to 34 Years | 312 (96.9%) | 369 (92.5%) |
| 35 to 44 Years | 680 (95.9%) | 787 (94.9%) |
| 45 to 54 Years | 1,354 (95.4%) | 1,423 (82.5%) |
| 55 to 64 Years | 672 (98.0%) | 643 (90.8%) |
| 65 to 74 Years | 404 (91.8%) | 663 (89.7%) |
| 75 Years and over | 424 (90.2%) | 521 (86.1%) |
| Total | 6,719 (93.3%) | 6,633 (90.0%) |
Income Below Poverty Among Married-Couple Families in Key Biscayne
The poverty statistics for married-couple families in Key Biscayne show that 4.3% or 134 of the total 3,084 families live below the poverty line. Families with 3 or 4 children have the highest poverty rate of 8.6%, comprising of 33 families. On the other hand, families with 1 or 2 children have the lowest poverty rate of 3.6%, which includes 54 families.
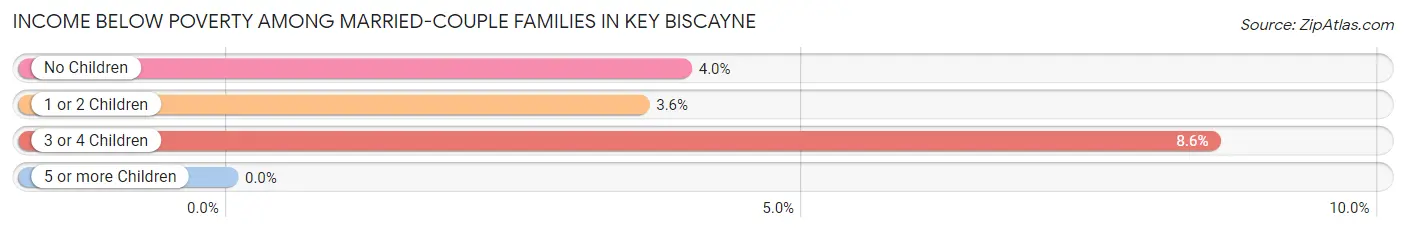
| Children | Above Poverty | Below Poverty |
| No Children | 1,142 (96.1%) | 47 (4.0%) |
| 1 or 2 Children | 1,455 (96.4%) | 54 (3.6%) |
| 3 or 4 Children | 353 (91.4%) | 33 (8.6%) |
| 5 or more Children | 0 (0.0%) | 0 (0.0%) |
| Total | 2,950 (95.7%) | 134 (4.3%) |
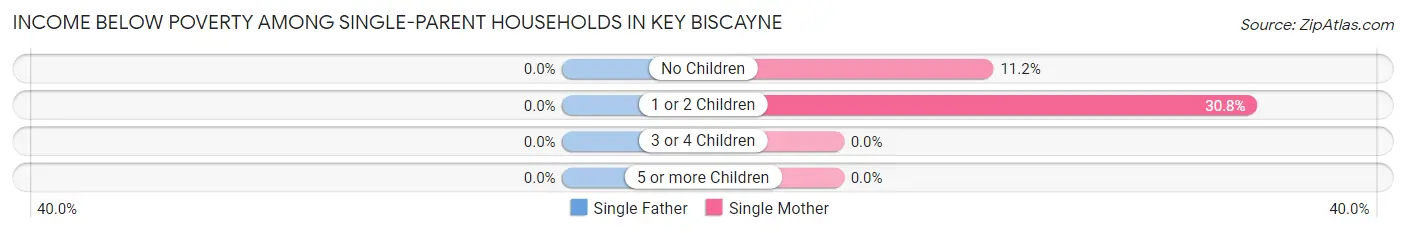
Income Below Poverty Among Single-Parent Households in Key Biscayne
| Children | Single Father | Single Mother |
| No Children | 0 (0.0%) | 24 (11.2%) |
| 1 or 2 Children | 0 (0.0%) | 94 (30.8%) |
| 3 or 4 Children | 0 (0.0%) | 0 (0.0%) |
| 5 or more Children | 0 (0.0%) | 0 (0.0%) |
| Total | 0 (0.0%) | 118 (22.4%) |
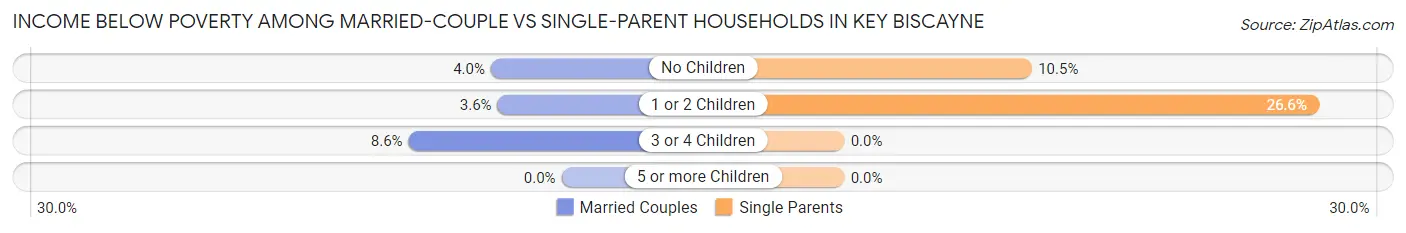
Income Below Poverty Among Married-Couple vs Single-Parent Households in Key Biscayne
The poverty data for Key Biscayne shows that 134 of the married-couple family households (4.3%) and 118 of the single-parent households (20.0%) are living below the poverty level. Within the married-couple family households, those with 3 or 4 children have the highest poverty rate, with 33 households (8.6%) falling below the poverty line. Among the single-parent households, those with 1 or 2 children have the highest poverty rate, with 94 household (26.6%) living below poverty.
| Children | Married-Couple Families | Single-Parent Households |
| No Children | 47 (4.0%) | 24 (10.5%) |
| 1 or 2 Children | 54 (3.6%) | 94 (26.6%) |
| 3 or 4 Children | 33 (8.6%) | 0 (0.0%) |
| 5 or more Children | 0 (0.0%) | 0 (0.0%) |
| Total | 134 (4.3%) | 118 (20.0%) |
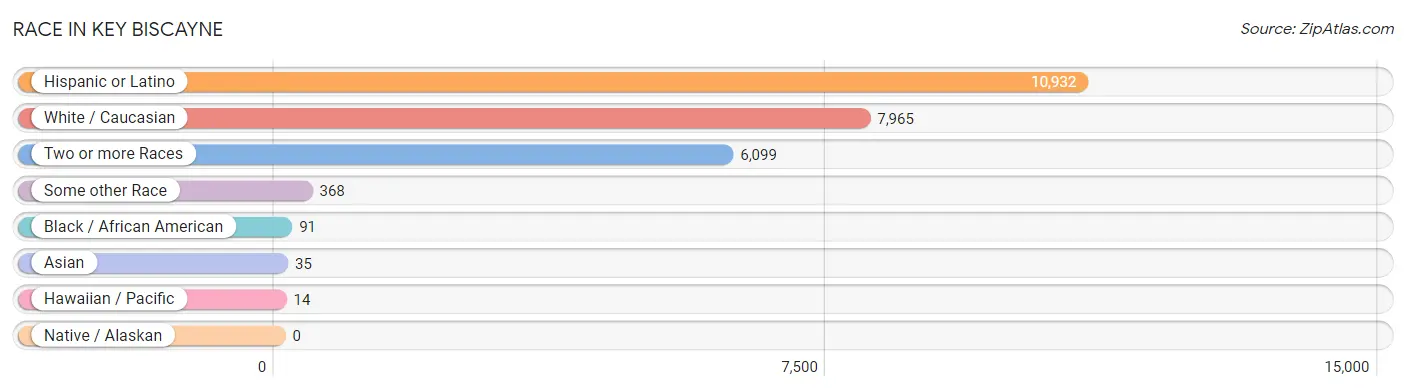
Race in Key Biscayne
The most populous races in Key Biscayne are Hispanic or Latino (10,932 | 75.0%), White / Caucasian (7,965 | 54.7%), and Two or more Races (6,099 | 41.8%).
| Race | # Population | % Population |
| Asian | 35 | 0.2% |
| Black / African American | 91 | 0.6% |
| Hawaiian / Pacific | 14 | 0.1% |
| Hispanic or Latino | 10,932 | 75.0% |
| Native / Alaskan | 0 | 0.0% |
| White / Caucasian | 7,965 | 54.7% |
| Two or more Races | 6,099 | 41.8% |
| Some other Race | 368 | 2.5% |
| Total | 14,572 | 100.0% |
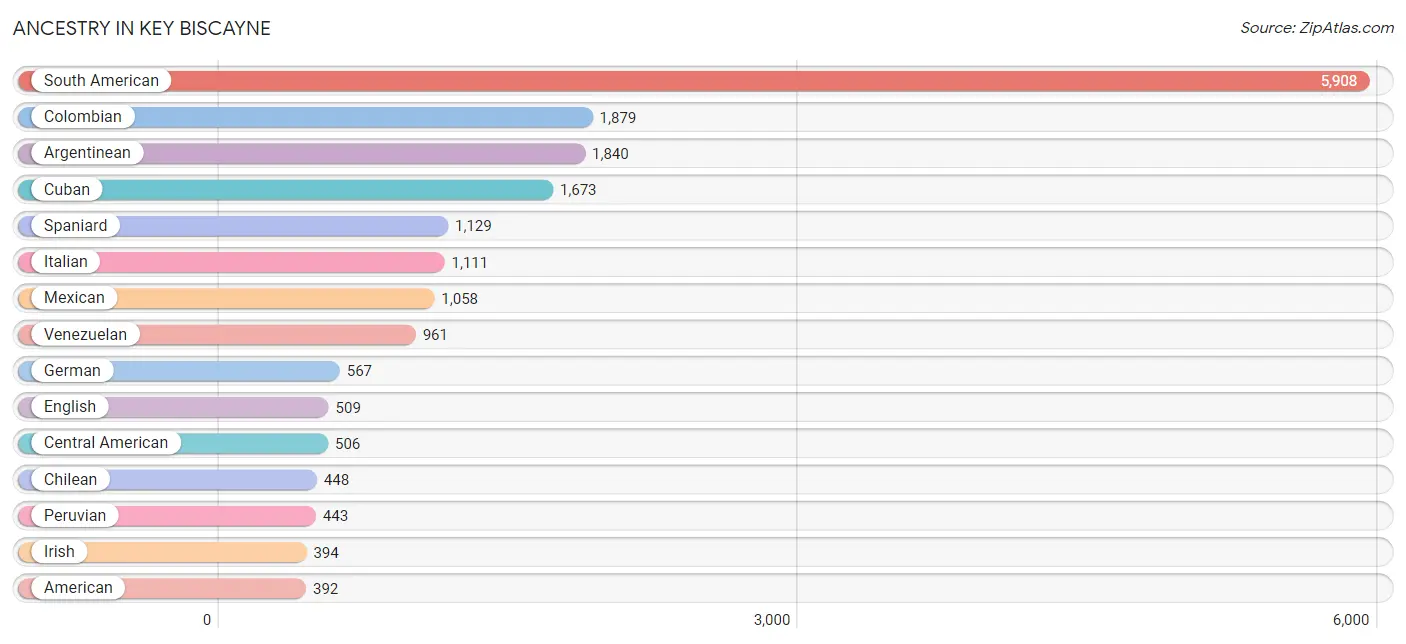
Ancestry in Key Biscayne
The most populous ancestries reported in Key Biscayne are South American (5,908 | 40.5%), Colombian (1,879 | 12.9%), Argentinean (1,840 | 12.6%), Cuban (1,673 | 11.5%), and Spaniard (1,129 | 7.7%), together accounting for 85.3% of all Key Biscayne residents.
| Ancestry | # Population | % Population |
| African | 15 | 0.1% |
| American | 392 | 2.7% |
| Arab | 26 | 0.2% |
| Argentinean | 1,840 | 12.6% |
| Armenian | 27 | 0.2% |
| Austrian | 45 | 0.3% |
| Basque | 40 | 0.3% |
| Bhutanese | 15 | 0.1% |
| Brazilian | 358 | 2.5% |
| British | 109 | 0.7% |
| Bulgarian | 51 | 0.4% |
| Burmese | 21 | 0.1% |
| Canadian | 36 | 0.3% |
| Central American | 506 | 3.5% |
| Chilean | 448 | 3.1% |
| Colombian | 1,879 | 12.9% |
| Croatian | 87 | 0.6% |
| Cuban | 1,673 | 11.5% |
| Cypriot | 26 | 0.2% |
| Danish | 10 | 0.1% |
| Dominican | 96 | 0.7% |
| Dutch | 49 | 0.3% |
| Eastern European | 24 | 0.2% |
| Ecuadorian | 245 | 1.7% |
| English | 509 | 3.5% |
| European | 232 | 1.6% |
| French | 194 | 1.3% |
| French Canadian | 17 | 0.1% |
| German | 567 | 3.9% |
| Greek | 18 | 0.1% |
| Guamanian / Chamorro | 14 | 0.1% |
| Guatemalan | 217 | 1.5% |
| Honduran | 29 | 0.2% |
| Hungarian | 14 | 0.1% |
| Indian (Asian) | 47 | 0.3% |
| Irish | 394 | 2.7% |
| Italian | 1,111 | 7.6% |
| Jamaican | 28 | 0.2% |
| Lebanese | 15 | 0.1% |
| Lithuanian | 8 | 0.1% |
| Mexican | 1,058 | 7.3% |
| Native Hawaiian | 4 | 0.0% |
| Nicaraguan | 202 | 1.4% |
| Northern European | 16 | 0.1% |
| Panamanian | 11 | 0.1% |
| Paraguayan | 6 | 0.0% |
| Peruvian | 443 | 3.0% |
| Polish | 151 | 1.0% |
| Portuguese | 138 | 0.9% |
| Puerto Rican | 304 | 2.1% |
| Romanian | 34 | 0.2% |
| Russian | 88 | 0.6% |
| Salvadoran | 47 | 0.3% |
| Scotch-Irish | 20 | 0.1% |
| Scottish | 94 | 0.6% |
| Slavic | 10 | 0.1% |
| Slovak | 41 | 0.3% |
| South American | 5,908 | 40.5% |
| Spaniard | 1,129 | 7.7% |
| Spanish | 15 | 0.1% |
| Sri Lankan | 9 | 0.1% |
| Subsaharan African | 15 | 0.1% |
| Swedish | 61 | 0.4% |
| Swiss | 53 | 0.4% |
| Thai | 12 | 0.1% |
| Turkish | 10 | 0.1% |
| Ukrainian | 48 | 0.3% |
| Uruguayan | 29 | 0.2% |
| Venezuelan | 961 | 6.6% |
| Welsh | 18 | 0.1% | View All 70 Rows |
Immigrants in Key Biscayne
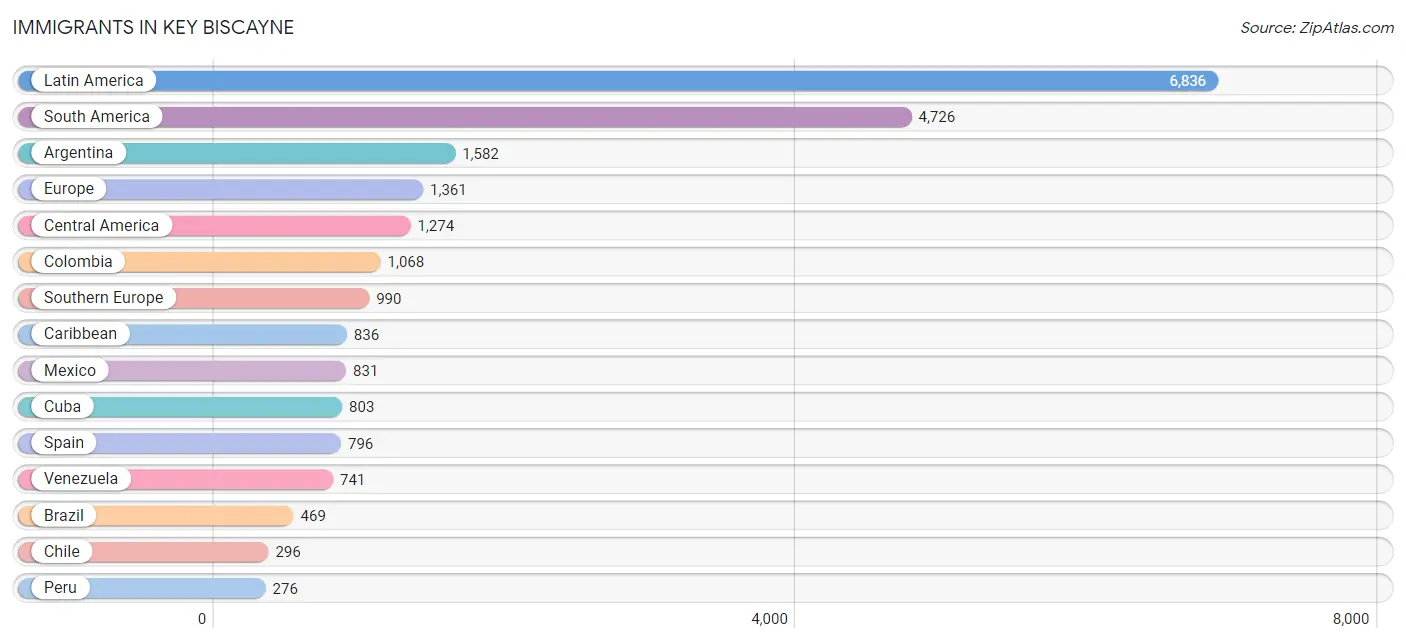
The most numerous immigrant groups reported in Key Biscayne came from Latin America (6,836 | 46.9%), South America (4,726 | 32.4%), Argentina (1,582 | 10.9%), Europe (1,361 | 9.3%), and Central America (1,274 | 8.7%), together accounting for 108.3% of all Key Biscayne residents.
| Immigration Origin | # Population | % Population |
| Argentina | 1,582 | 10.9% |
| Asia | 120 | 0.8% |
| Belarus | 5 | 0.0% |
| Belgium | 19 | 0.1% |
| Bolivia | 10 | 0.1% |
| Brazil | 469 | 3.2% |
| Bulgaria | 19 | 0.1% |
| Canada | 17 | 0.1% |
| Caribbean | 836 | 5.7% |
| Central America | 1,274 | 8.7% |
| Chile | 296 | 2.0% |
| China | 12 | 0.1% |
| Colombia | 1,068 | 7.3% |
| Croatia | 10 | 0.1% |
| Cuba | 803 | 5.5% |
| Dominican Republic | 22 | 0.2% |
| Eastern Asia | 66 | 0.4% |
| Eastern Europe | 113 | 0.8% |
| Ecuador | 177 | 1.2% |
| El Salvador | 10 | 0.1% |
| England | 19 | 0.1% |
| Europe | 1,361 | 9.3% |
| France | 71 | 0.5% |
| Germany | 52 | 0.4% |
| Guatemala | 220 | 1.5% |
| Honduras | 60 | 0.4% |
| Hungary | 33 | 0.2% |
| Ireland | 6 | 0.0% |
| Italy | 194 | 1.3% |
| Jamaica | 6 | 0.0% |
| Japan | 54 | 0.4% |
| Latin America | 6,836 | 46.9% |
| Lebanon | 27 | 0.2% |
| Mexico | 831 | 5.7% |
| Nicaragua | 142 | 1.0% |
| Northern Europe | 101 | 0.7% |
| Panama | 11 | 0.1% |
| Peru | 276 | 1.9% |
| Philippines | 9 | 0.1% |
| Poland | 25 | 0.2% |
| South America | 4,726 | 32.4% |
| South Eastern Asia | 9 | 0.1% |
| Southern Europe | 990 | 6.8% |
| Spain | 796 | 5.5% |
| Sweden | 33 | 0.2% |
| Switzerland | 7 | 0.1% |
| Trinidad and Tobago | 5 | 0.0% |
| Turkey | 10 | 0.1% |
| Ukraine | 21 | 0.1% |
| Uruguay | 44 | 0.3% |
| Venezuela | 741 | 5.1% |
| Western Asia | 45 | 0.3% |
| Western Europe | 149 | 1.0% | View All 53 Rows |
Sex and Age in Key Biscayne
Sex and Age in Key Biscayne
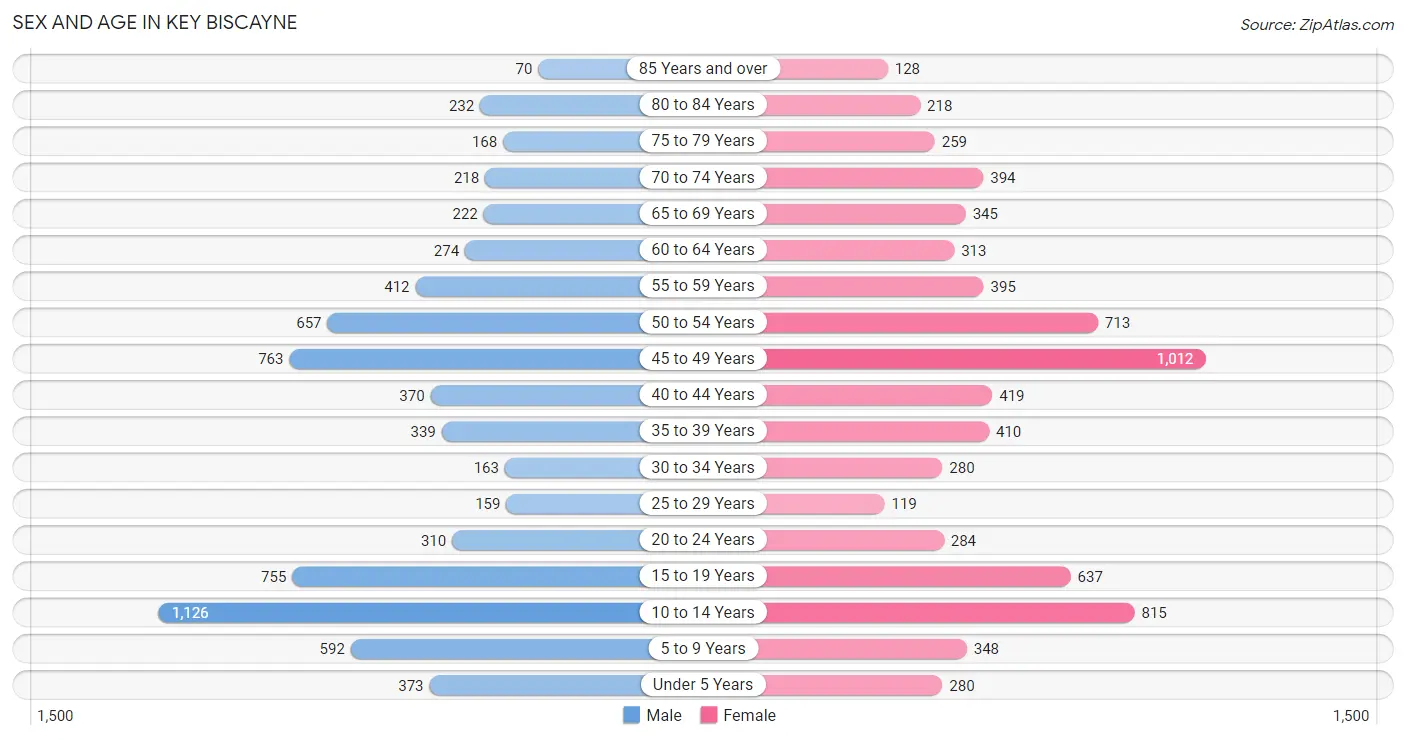
The most populous age groups in Key Biscayne are 10 to 14 Years (1,126 | 15.6%) for men and 45 to 49 Years (1,012 | 13.7%) for women.
| Age Bracket | Male | Female |
| Under 5 Years | 373 (5.2%) | 280 (3.8%) |
| 5 to 9 Years | 592 (8.2%) | 348 (4.7%) |
| 10 to 14 Years | 1,126 (15.6%) | 815 (11.1%) |
| 15 to 19 Years | 755 (10.5%) | 637 (8.6%) |
| 20 to 24 Years | 310 (4.3%) | 284 (3.8%) |
| 25 to 29 Years | 159 (2.2%) | 119 (1.6%) |
| 30 to 34 Years | 163 (2.3%) | 280 (3.8%) |
| 35 to 39 Years | 339 (4.7%) | 410 (5.6%) |
| 40 to 44 Years | 370 (5.1%) | 419 (5.7%) |
| 45 to 49 Years | 763 (10.6%) | 1,012 (13.7%) |
| 50 to 54 Years | 657 (9.1%) | 713 (9.7%) |
| 55 to 59 Years | 412 (5.7%) | 395 (5.4%) |
| 60 to 64 Years | 274 (3.8%) | 313 (4.3%) |
| 65 to 69 Years | 222 (3.1%) | 345 (4.7%) |
| 70 to 74 Years | 218 (3.0%) | 394 (5.3%) |
| 75 to 79 Years | 168 (2.3%) | 259 (3.5%) |
| 80 to 84 Years | 232 (3.2%) | 218 (3.0%) |
| 85 Years and over | 70 (1.0%) | 128 (1.7%) |
| Total | 7,203 (100.0%) | 7,369 (100.0%) |
Families and Households in Key Biscayne
Median Family Size in Key Biscayne
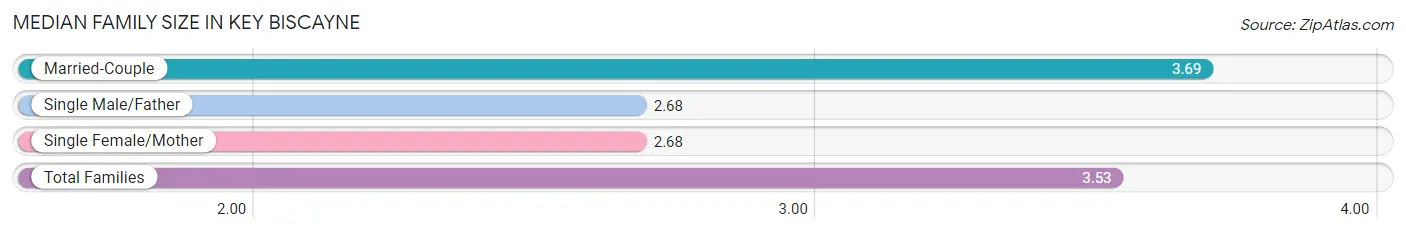
The median family size in Key Biscayne is 3.53 persons per family, with married-couple families (3,084 | 84.0%) accounting for the largest median family size of 3.69 persons per family. On the other hand, single male/father families (63 | 1.7%) represent the smallest median family size with 2.68 persons per family.
| Family Type | # Families | Family Size |
| Married-Couple | 3,084 (84.0%) | 3.69 |
| Single Male/Father | 63 (1.7%) | 2.68 |
| Single Female/Mother | 526 (14.3%) | 2.68 |
| Total Families | 3,673 (100.0%) | 3.53 |
Median Household Size in Key Biscayne
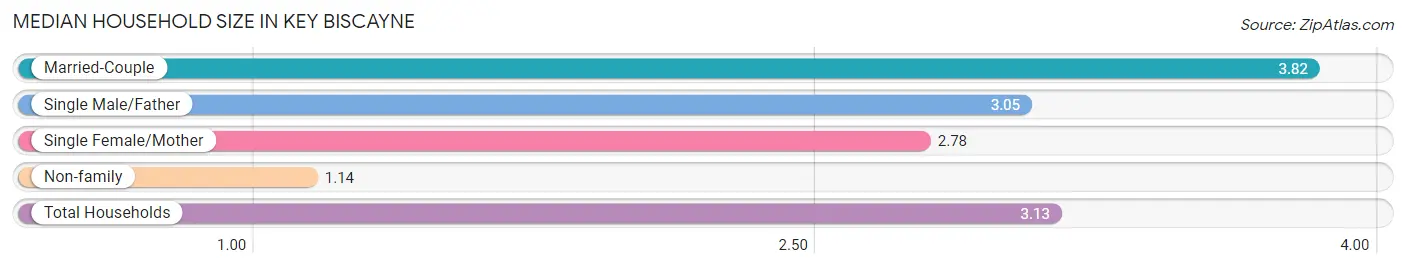
The median household size in Key Biscayne is 3.13 persons per household, with married-couple households (3,084 | 66.2%) accounting for the largest median household size of 3.82 persons per household. non-family households (985 | 21.1%) represent the smallest median household size with 1.14 persons per household.
| Household Type | # Households | Household Size |
| Married-Couple | 3,084 (66.2%) | 3.82 |
| Single Male/Father | 63 (1.3%) | 3.05 |
| Single Female/Mother | 526 (11.3%) | 2.78 |
| Non-family | 985 (21.1%) | 1.14 |
| Total Households | 4,658 (100.0%) | 3.13 |
Household Size by Marriage Status in Key Biscayne
Out of a total of 4,658 households in Key Biscayne, 3,673 (78.8%) are family households, while 985 (21.1%) are nonfamily households. The most numerous type of family households are 2-person households, comprising 1,092, and the most common type of nonfamily households are 1-person households, comprising 864.
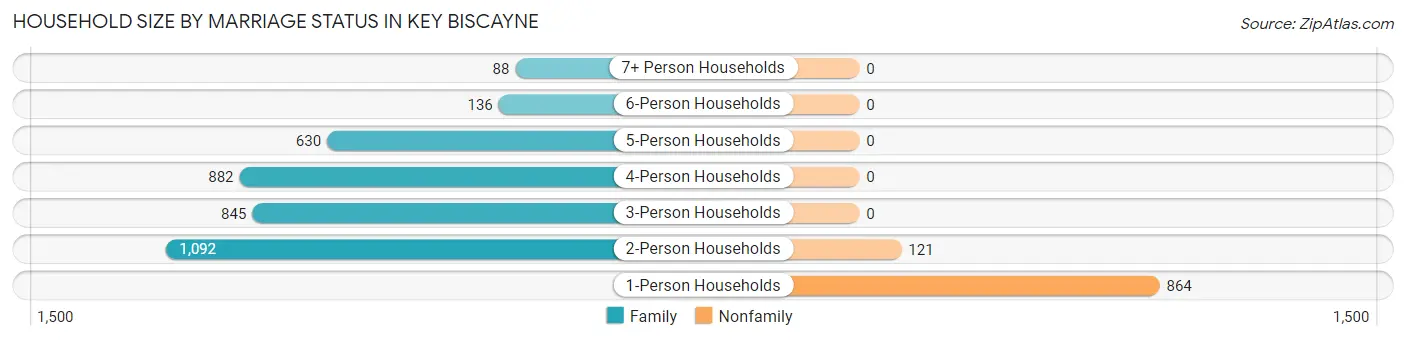
| Household Size | Family Households | Nonfamily Households |
| 1-Person Households | - | 864 (18.5%) |
| 2-Person Households | 1,092 (23.4%) | 121 (2.6%) |
| 3-Person Households | 845 (18.1%) | 0 (0.0%) |
| 4-Person Households | 882 (18.9%) | 0 (0.0%) |
| 5-Person Households | 630 (13.5%) | 0 (0.0%) |
| 6-Person Households | 136 (2.9%) | 0 (0.0%) |
| 7+ Person Households | 88 (1.9%) | 0 (0.0%) |
| Total | 3,673 (78.8%) | 985 (21.1%) |
Female Fertility in Key Biscayne
Fertility by Age in Key Biscayne
Average fertility rate in Key Biscayne is 29.0 births per 1,000 women. Women in the age bracket of 35 to 50 years have the highest fertility rate with 40.0 births per 1,000 women. Women in the age bracket of 35 to 50 years acount for 85.2% of all women with births.
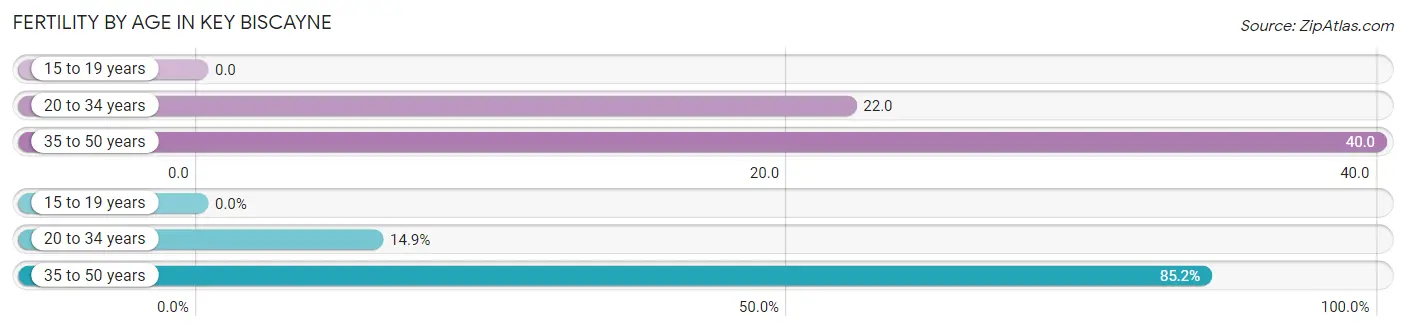
| Age Bracket | Women with Births | Births / 1,000 Women |
| 15 to 19 years | 0 (0.0%) | 0.0 |
| 20 to 34 years | 15 (14.8%) | 22.0 |
| 35 to 50 years | 86 (85.2%) | 40.0 |
| Total | 101 (100.0%) | 29.0 |
Fertility by Age by Marriage Status in Key Biscayne
85.1% of women with births (101) in Key Biscayne are married. The highest percentage of unmarried women with births falls into 20 to 34 years age bracket with 100.0% of them unmarried at the time of birth, while the lowest percentage of unmarried women with births belong to 35 to 50 years age bracket with 0.0% of them unmarried.
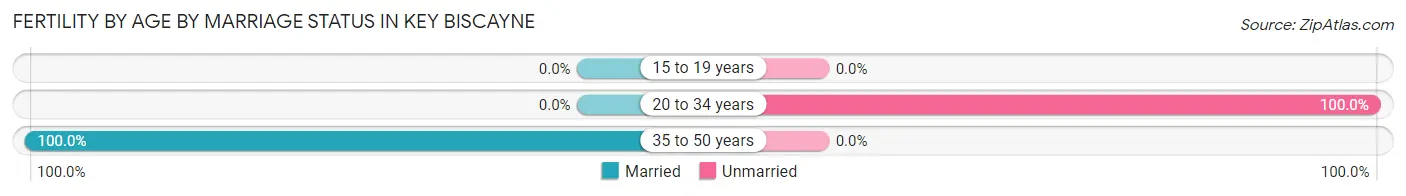
| Age Bracket | Married | Unmarried |
| 15 to 19 years | 0 (0.0%) | 0 (0.0%) |
| 20 to 34 years | 0 (0.0%) | 15 (100.0%) |
| 35 to 50 years | 86 (100.0%) | 0 (0.0%) |
| Total | 86 (85.2%) | 15 (14.8%) |
Fertility by Education in Key Biscayne
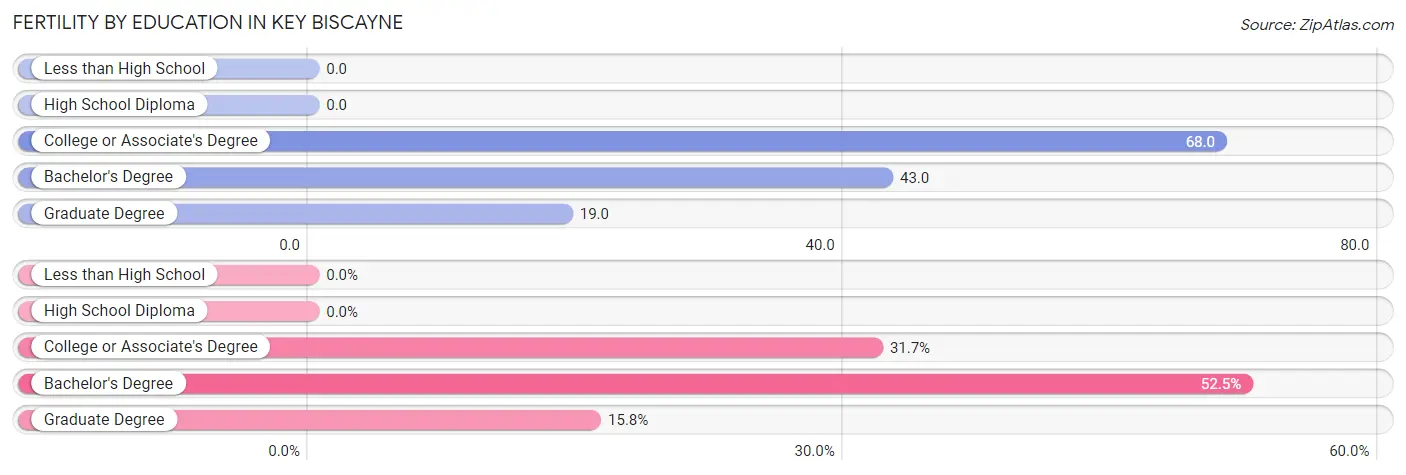
| Educational Attainment | Women with Births | Births / 1,000 Women |
| Less than High School | 0 (0.0%) | 0.0 |
| High School Diploma | 0 (0.0%) | 0.0 |
| College or Associate's Degree | 32 (31.7%) | 68.0 |
| Bachelor's Degree | 53 (52.5%) | 43.0 |
| Graduate Degree | 16 (15.8%) | 19.0 |
| Total | 101 (100.0%) | 29.0 |
Fertility by Education by Marriage Status in Key Biscayne
14.8% of women with births in Key Biscayne are unmarried. Women with the educational attainment of college or associate's degree are most likely to be married with 100.0% of them married at childbirth, while women with the educational attainment of bachelor's degree are least likely to be married with 28.3% of them unmarried at childbirth.
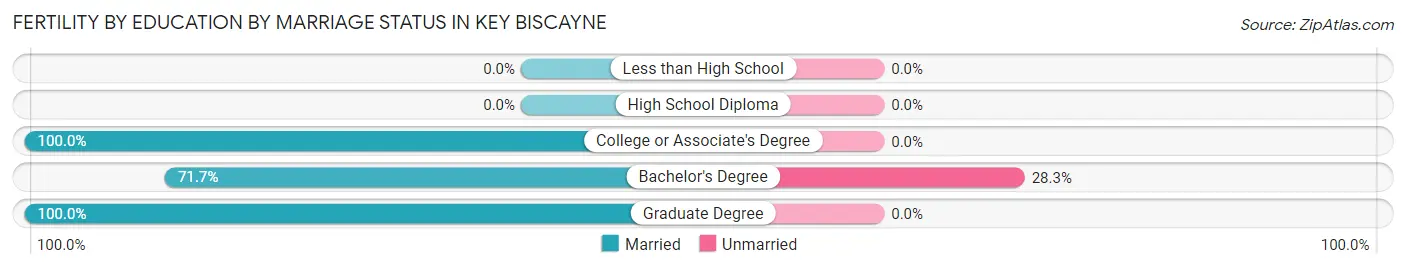
| Educational Attainment | Married | Unmarried |
| Less than High School | 0 (0.0%) | 0 (0.0%) |
| High School Diploma | 0 (0.0%) | 0 (0.0%) |
| College or Associate's Degree | 32 (100.0%) | 0 (0.0%) |
| Bachelor's Degree | 38 (71.7%) | 15 (28.3%) |
| Graduate Degree | 16 (100.0%) | 0 (0.0%) |
| Total | 86 (85.2%) | 15 (14.8%) |
Employment Characteristics in Key Biscayne
Employment by Class of Employer in Key Biscayne
Among the 5,891 employed individuals in Key Biscayne, private company employees (3,639 | 61.8%), self-employed (incorporated) (925 | 15.7%), and self-employed (not incorporated) (621 | 10.5%) make up the most common classes of employment.
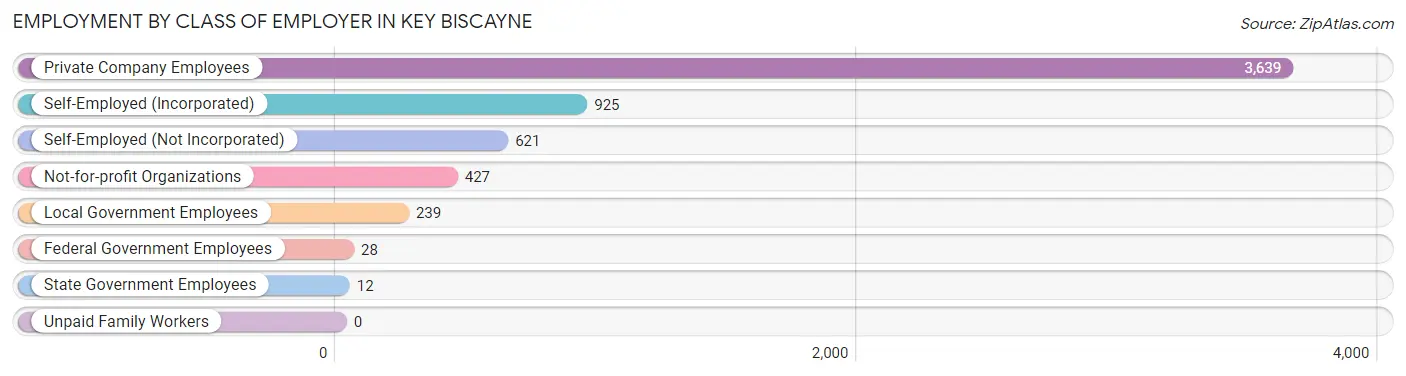
| Employer Class | # Employees | % Employees |
| Private Company Employees | 3,639 | 61.8% |
| Self-Employed (Incorporated) | 925 | 15.7% |
| Self-Employed (Not Incorporated) | 621 | 10.5% |
| Not-for-profit Organizations | 427 | 7.2% |
| Local Government Employees | 239 | 4.1% |
| State Government Employees | 12 | 0.2% |
| Federal Government Employees | 28 | 0.5% |
| Unpaid Family Workers | 0 | 0.0% |
| Total | 5,891 | 100.0% |
Employment Status by Age in Key Biscayne
According to the labor force statistics for Key Biscayne, out of the total population over 16 years of age (10,794), 57.4% or 6,196 individuals are in the labor force, with 4.1% or 254 of them unemployed. The age group with the highest labor force participation rate is 30 to 34 years, with 83.1% or 368 individuals in the labor force. Within the labor force, the 25 to 29 years age range has the highest percentage of unemployed individuals, with 23.5% or 46 of them being unemployed.
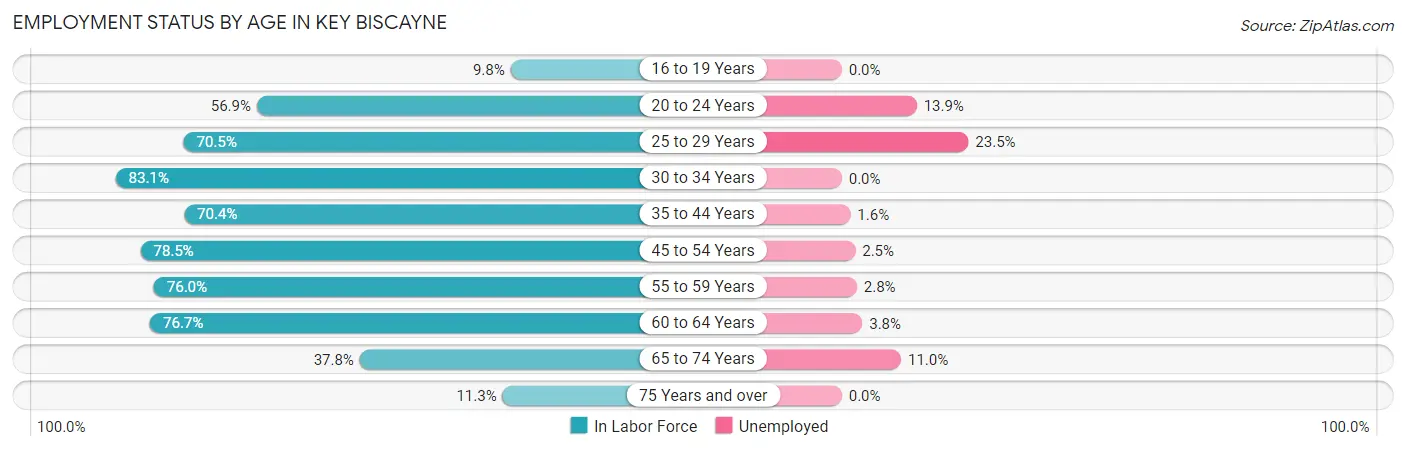
| Age Bracket | In Labor Force | Unemployed |
| 16 to 19 Years | 113 (9.8%) | 0 (0.0%) |
| 20 to 24 Years | 338 (56.9%) | 47 (13.9%) |
| 25 to 29 Years | 196 (70.5%) | 46 (23.5%) |
| 30 to 34 Years | 368 (83.1%) | 0 (0.0%) |
| 35 to 44 Years | 1,083 (70.4%) | 17 (1.6%) |
| 45 to 54 Years | 2,469 (78.5%) | 62 (2.5%) |
| 55 to 59 Years | 613 (76.0%) | 17 (2.8%) |
| 60 to 64 Years | 450 (76.7%) | 17 (3.8%) |
| 65 to 74 Years | 446 (37.8%) | 49 (11.0%) |
| 75 Years and over | 121 (11.3%) | 0 (0.0%) |
| Total | 6,196 (57.4%) | 254 (4.1%) |
Employment Status by Educational Attainment in Key Biscayne
According to labor force statistics for Key Biscayne, 76.2% of individuals (5,180) out of the total population between 25 and 64 years of age (6,798) are in the labor force, with 3.1% or 161 of them being unemployed. The group with the highest labor force participation rate are those with the educational attainment of less than high school, with 100.0% or 174 individuals in the labor force. Within the labor force, individuals with high school diploma education have the highest percentage of unemployment, with 10.6% or 34 of them being unemployed.
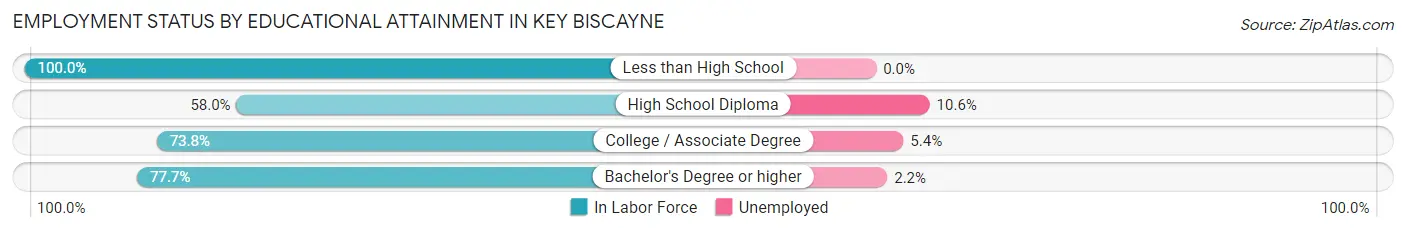
| Educational Attainment | In Labor Force | Unemployed |
| Less than High School | 174 (100.0%) | 0 (0.0%) |
| High School Diploma | 320 (58.0%) | 59 (10.6%) |
| College / Associate Degree | 631 (73.8%) | 46 (5.4%) |
| Bachelor's Degree or higher | 4,054 (77.7%) | 115 (2.2%) |
| Total | 5,180 (76.2%) | 211 (3.1%) |
Employment Occupations by Sex in Key Biscayne
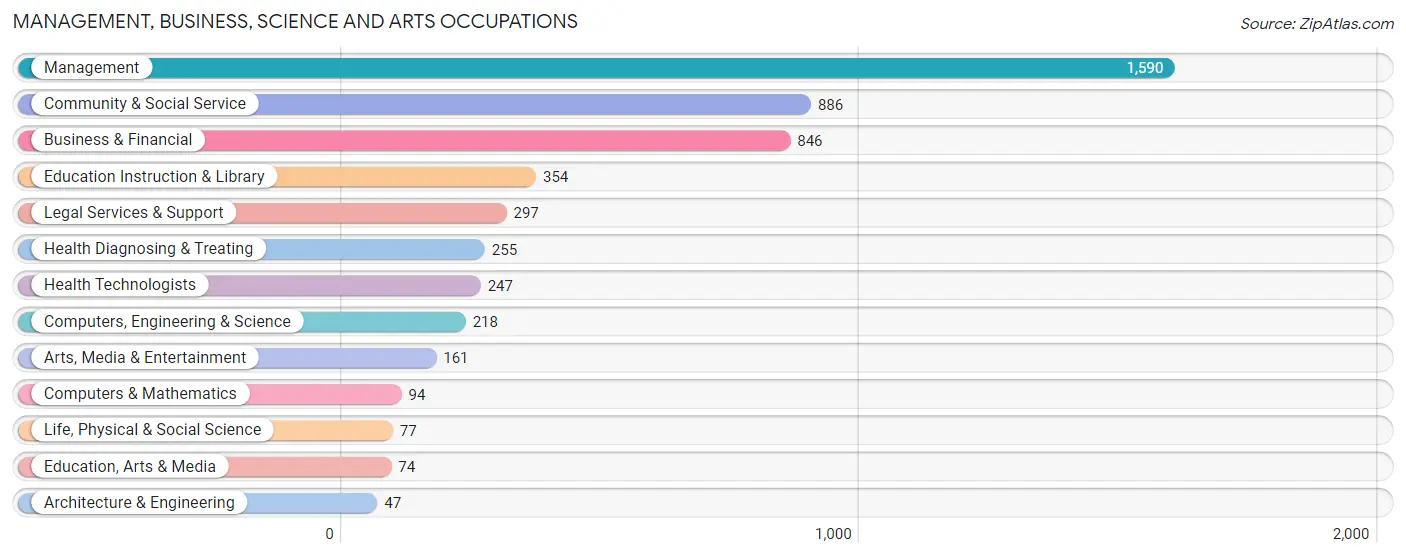
Management, Business, Science and Arts Occupations
The most common Management, Business, Science and Arts occupations in Key Biscayne are Management (1,590 | 26.8%), Community & Social Service (886 | 14.9%), Business & Financial (846 | 14.2%), Education Instruction & Library (354 | 6.0%), and Legal Services & Support (297 | 5.0%).
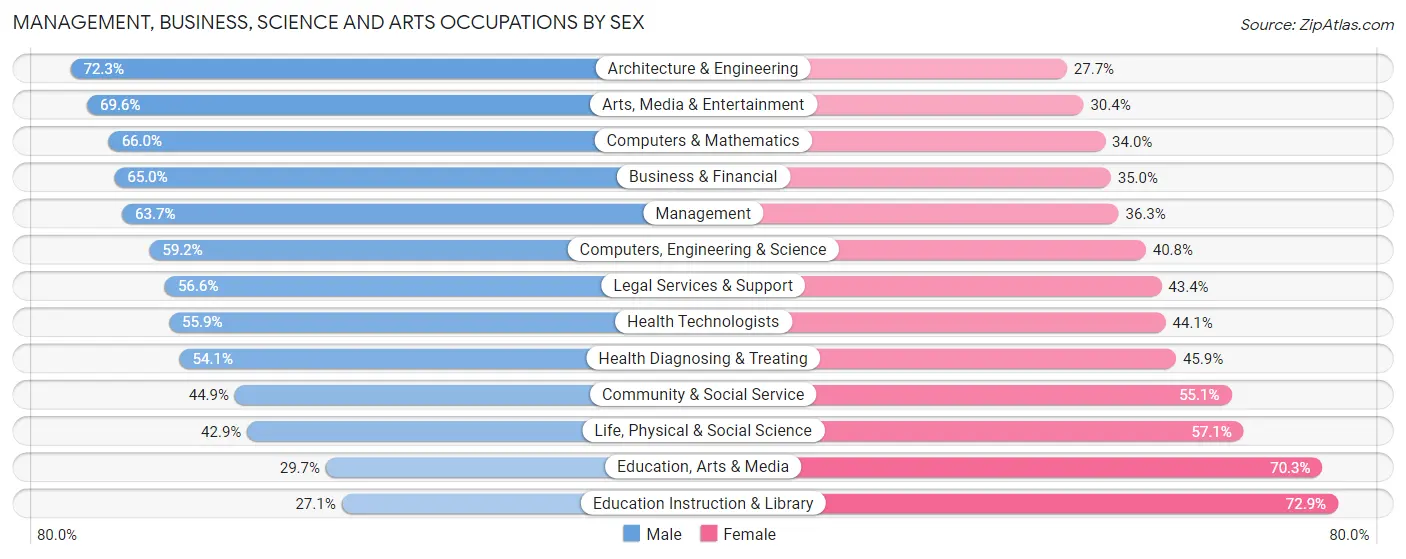
Management, Business, Science and Arts Occupations by Sex
Within the Management, Business, Science and Arts occupations in Key Biscayne, the most male-oriented occupations are Architecture & Engineering (72.3%), Arts, Media & Entertainment (69.6%), and Computers & Mathematics (66.0%), while the most female-oriented occupations are Education Instruction & Library (72.9%), Education, Arts & Media (70.3%), and Life, Physical & Social Science (57.1%).
| Occupation | Male | Female |
| Management | 1,013 (63.7%) | 577 (36.3%) |
| Business & Financial | 550 (65.0%) | 296 (35.0%) |
| Computers, Engineering & Science | 129 (59.2%) | 89 (40.8%) |
| Computers & Mathematics | 62 (66.0%) | 32 (34.0%) |
| Architecture & Engineering | 34 (72.3%) | 13 (27.7%) |
| Life, Physical & Social Science | 33 (42.9%) | 44 (57.1%) |
| Community & Social Service | 398 (44.9%) | 488 (55.1%) |
| Education, Arts & Media | 22 (29.7%) | 52 (70.3%) |
| Legal Services & Support | 168 (56.6%) | 129 (43.4%) |
| Education Instruction & Library | 96 (27.1%) | 258 (72.9%) |
| Arts, Media & Entertainment | 112 (69.6%) | 49 (30.4%) |
| Health Diagnosing & Treating | 138 (54.1%) | 117 (45.9%) |
| Health Technologists | 138 (55.9%) | 109 (44.1%) |
| Total (Category) | 2,228 (58.7%) | 1,567 (41.3%) |
| Total (Overall) | 3,268 (55.0%) | 2,672 (45.0%) |
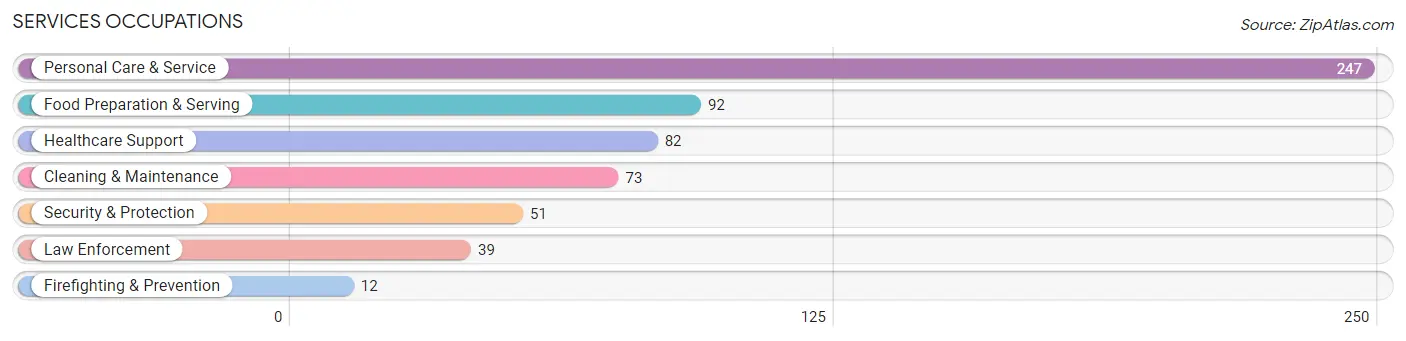
Services Occupations
The most common Services occupations in Key Biscayne are Personal Care & Service (247 | 4.2%), Food Preparation & Serving (92 | 1.5%), Healthcare Support (82 | 1.4%), Cleaning & Maintenance (73 | 1.2%), and Security & Protection (51 | 0.9%).
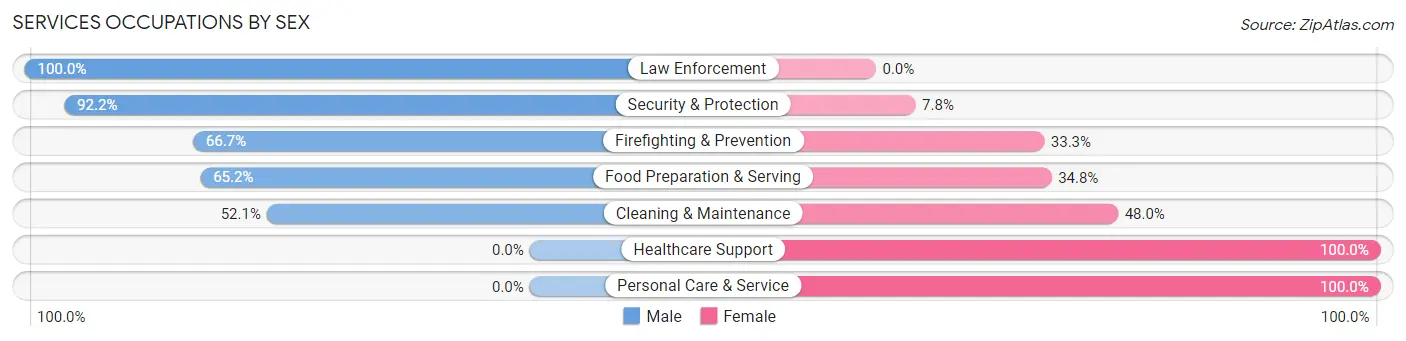
Services Occupations by Sex
Within the Services occupations in Key Biscayne, the most male-oriented occupations are Law Enforcement (100.0%), Security & Protection (92.2%), and Firefighting & Prevention (66.7%), while the most female-oriented occupations are Healthcare Support (100.0%), Personal Care & Service (100.0%), and Cleaning & Maintenance (47.9%).
| Occupation | Male | Female |
| Healthcare Support | 0 (0.0%) | 82 (100.0%) |
| Security & Protection | 47 (92.2%) | 4 (7.8%) |
| Firefighting & Prevention | 8 (66.7%) | 4 (33.3%) |
| Law Enforcement | 39 (100.0%) | 0 (0.0%) |
| Food Preparation & Serving | 60 (65.2%) | 32 (34.8%) |
| Cleaning & Maintenance | 38 (52.0%) | 35 (47.9%) |
| Personal Care & Service | 0 (0.0%) | 247 (100.0%) |
| Total (Category) | 145 (26.6%) | 400 (73.4%) |
| Total (Overall) | 3,268 (55.0%) | 2,672 (45.0%) |
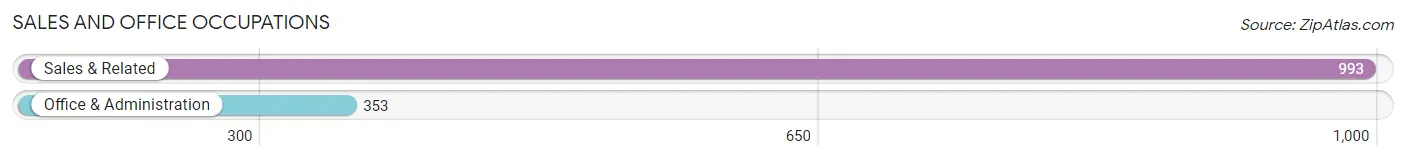
Sales and Office Occupations
The most common Sales and Office occupations in Key Biscayne are Sales & Related (993 | 16.7%), and Office & Administration (353 | 5.9%).
Sales and Office Occupations by Sex
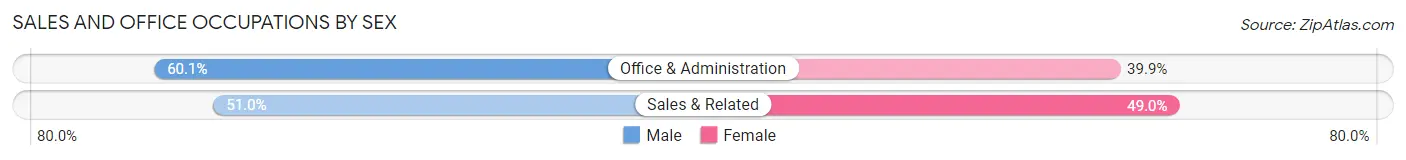
| Occupation | Male | Female |
| Sales & Related | 506 (51.0%) | 487 (49.0%) |
| Office & Administration | 212 (60.1%) | 141 (39.9%) |
| Total (Category) | 718 (53.3%) | 628 (46.7%) |
| Total (Overall) | 3,268 (55.0%) | 2,672 (45.0%) |
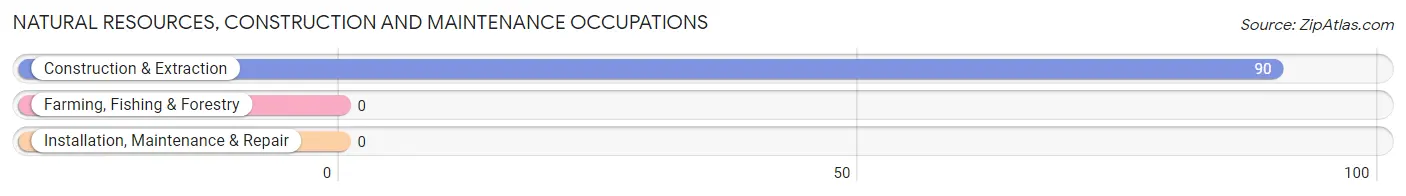
Natural Resources, Construction and Maintenance Occupations
The most common Natural Resources, Construction and Maintenance occupations in Key Biscayne are , and Construction & Extraction (90 | 1.5%).
Natural Resources, Construction and Maintenance Occupations by Sex
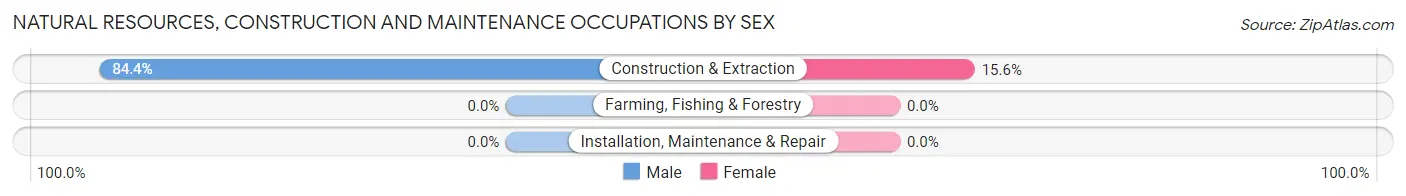
| Occupation | Male | Female |
| Farming, Fishing & Forestry | 0 (0.0%) | 0 (0.0%) |
| Construction & Extraction | 76 (84.4%) | 14 (15.6%) |
| Installation, Maintenance & Repair | 0 (0.0%) | 0 (0.0%) |
| Total (Category) | 76 (84.4%) | 14 (15.6%) |
| Total (Overall) | 3,268 (55.0%) | 2,672 (45.0%) |
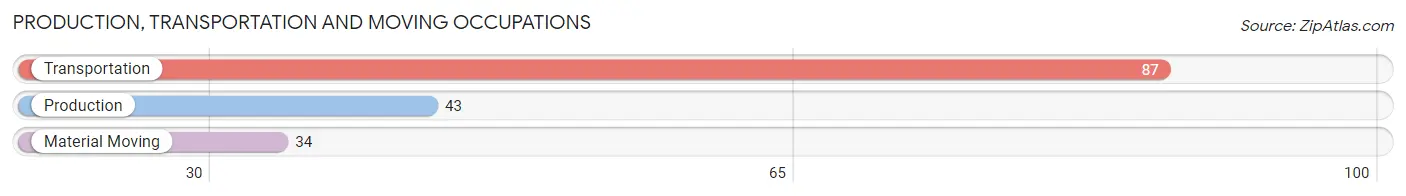
Production, Transportation and Moving Occupations
The most common Production, Transportation and Moving occupations in Key Biscayne are Transportation (87 | 1.5%), Production (43 | 0.7%), and Material Moving (34 | 0.6%).
Production, Transportation and Moving Occupations by Sex
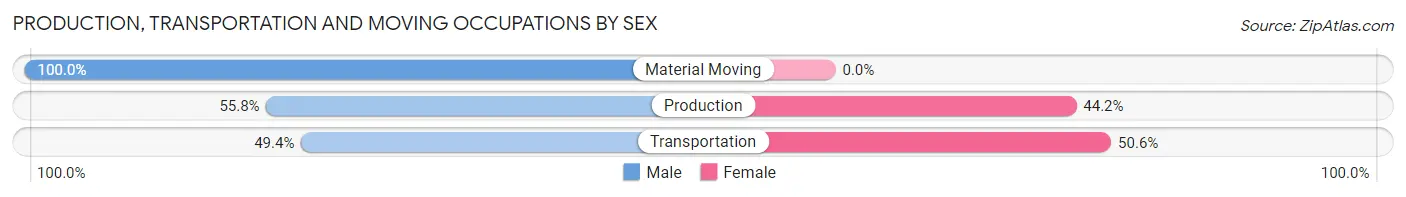
| Occupation | Male | Female |
| Production | 24 (55.8%) | 19 (44.2%) |
| Transportation | 43 (49.4%) | 44 (50.6%) |
| Material Moving | 34 (100.0%) | 0 (0.0%) |
| Total (Category) | 101 (61.6%) | 63 (38.4%) |
| Total (Overall) | 3,268 (55.0%) | 2,672 (45.0%) |
Employment Industries by Sex in Key Biscayne
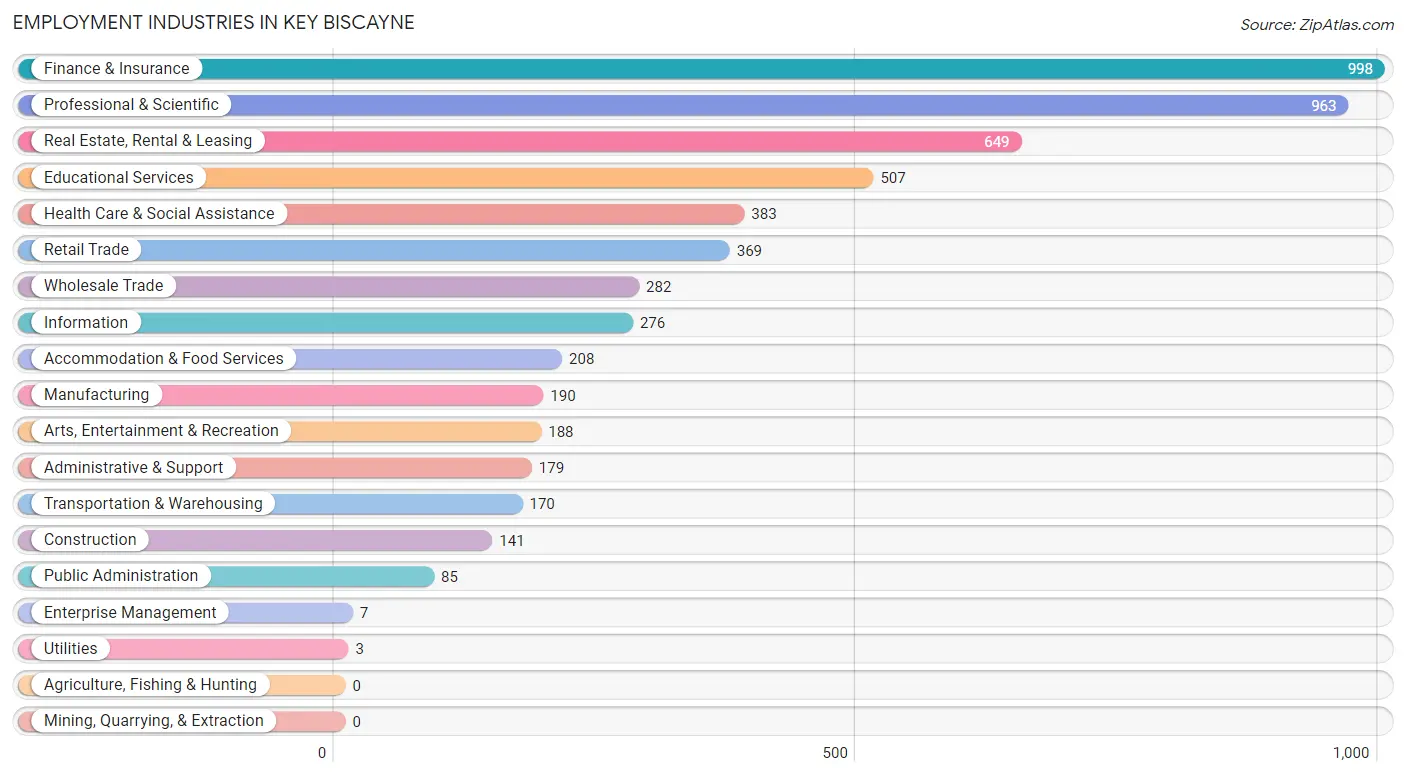
Employment Industries in Key Biscayne
The major employment industries in Key Biscayne include Finance & Insurance (998 | 16.8%), Professional & Scientific (963 | 16.2%), Real Estate, Rental & Leasing (649 | 10.9%), Educational Services (507 | 8.5%), and Health Care & Social Assistance (383 | 6.5%).
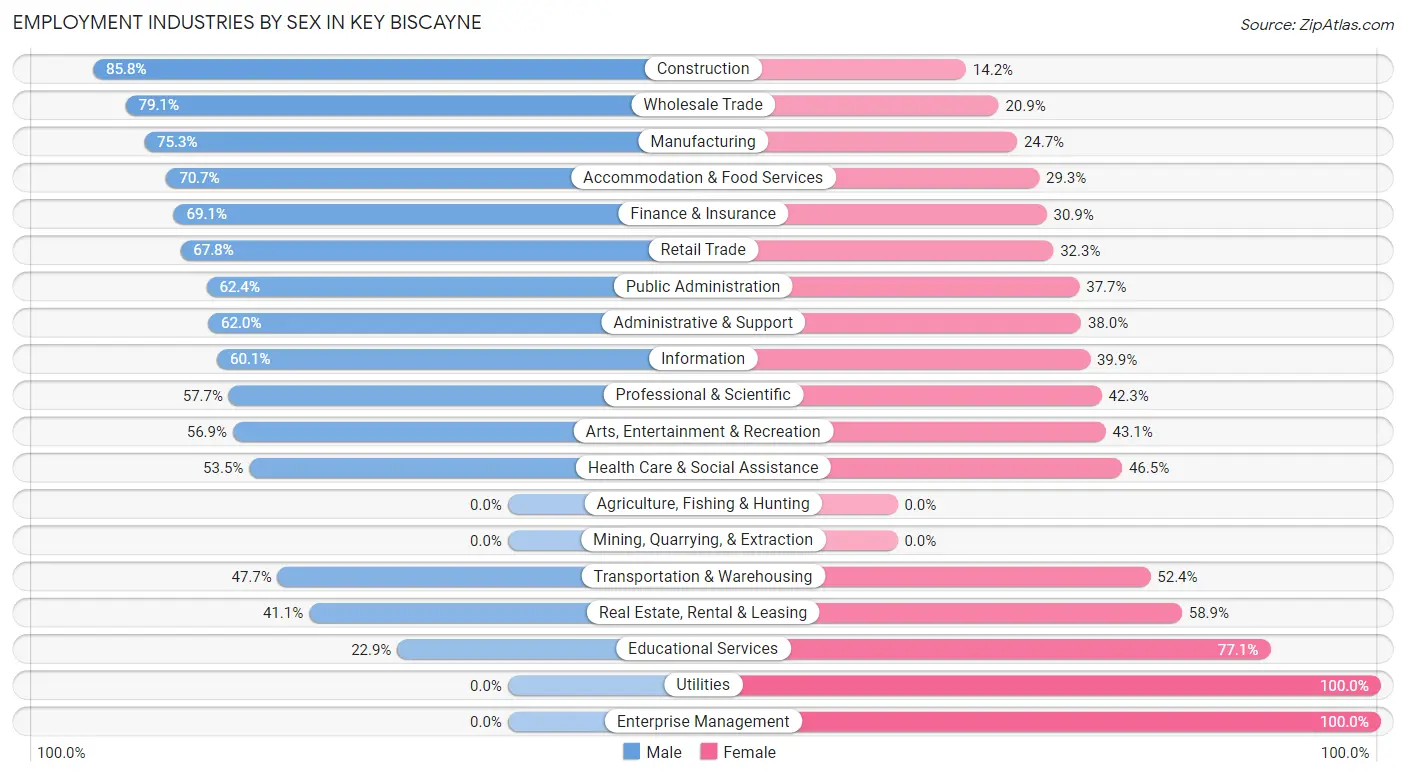
Employment Industries by Sex in Key Biscayne
The Key Biscayne industries that see more men than women are Construction (85.8%), Wholesale Trade (79.1%), and Manufacturing (75.3%), whereas the industries that tend to have a higher number of women are Utilities (100.0%), Enterprise Management (100.0%), and Educational Services (77.1%).
| Industry | Male | Female |
| Agriculture, Fishing & Hunting | 0 (0.0%) | 0 (0.0%) |
| Mining, Quarrying, & Extraction | 0 (0.0%) | 0 (0.0%) |
| Construction | 121 (85.8%) | 20 (14.2%) |
| Manufacturing | 143 (75.3%) | 47 (24.7%) |
| Wholesale Trade | 223 (79.1%) | 59 (20.9%) |
| Retail Trade | 250 (67.7%) | 119 (32.3%) |
| Transportation & Warehousing | 81 (47.6%) | 89 (52.3%) |
| Utilities | 0 (0.0%) | 3 (100.0%) |
| Information | 166 (60.1%) | 110 (39.9%) |
| Finance & Insurance | 690 (69.1%) | 308 (30.9%) |
| Real Estate, Rental & Leasing | 267 (41.1%) | 382 (58.9%) |
| Professional & Scientific | 556 (57.7%) | 407 (42.3%) |
| Enterprise Management | 0 (0.0%) | 7 (100.0%) |
| Administrative & Support | 111 (62.0%) | 68 (38.0%) |
| Educational Services | 116 (22.9%) | 391 (77.1%) |
| Health Care & Social Assistance | 205 (53.5%) | 178 (46.5%) |
| Arts, Entertainment & Recreation | 107 (56.9%) | 81 (43.1%) |
| Accommodation & Food Services | 147 (70.7%) | 61 (29.3%) |
| Public Administration | 53 (62.4%) | 32 (37.7%) |
| Total | 3,268 (55.0%) | 2,672 (45.0%) |
Education in Key Biscayne
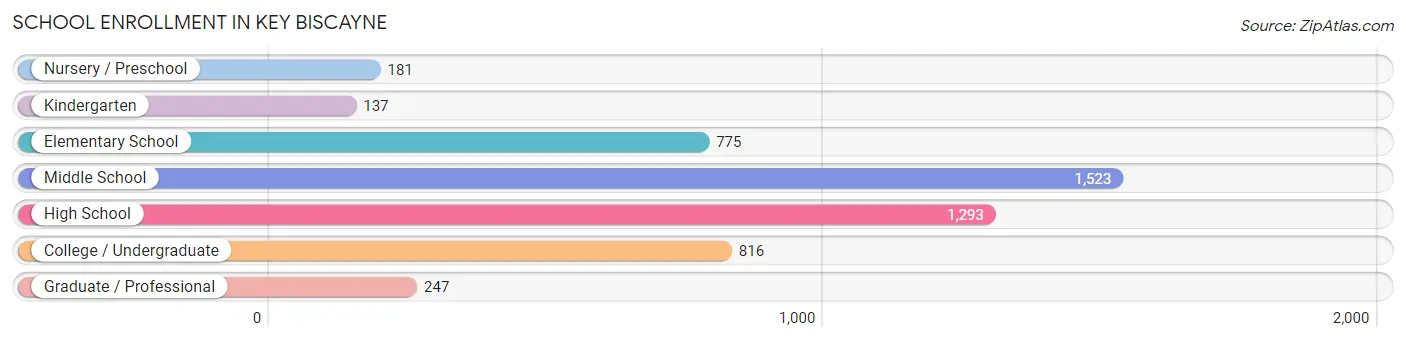
School Enrollment in Key Biscayne
The most common levels of schooling among the 4,972 students in Key Biscayne are middle school (1,523 | 30.6%), high school (1,293 | 26.0%), and college / undergraduate (816 | 16.4%).
| School Level | # Students | % Students |
| Nursery / Preschool | 181 | 3.6% |
| Kindergarten | 137 | 2.8% |
| Elementary School | 775 | 15.6% |
| Middle School | 1,523 | 30.6% |
| High School | 1,293 | 26.0% |
| College / Undergraduate | 816 | 16.4% |
| Graduate / Professional | 247 | 5.0% |
| Total | 4,972 | 100.0% |
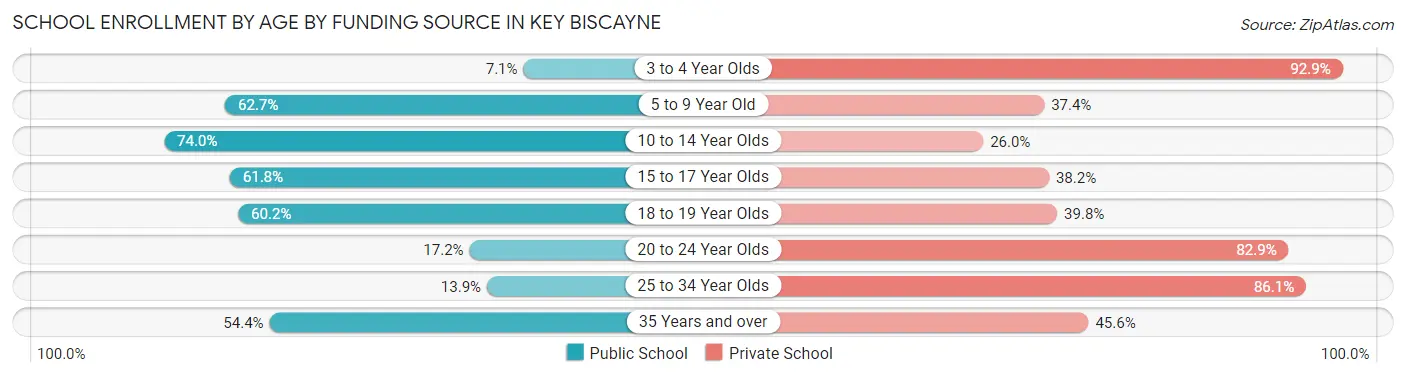
School Enrollment by Age by Funding Source in Key Biscayne
Out of a total of 4,972 students who are enrolled in schools in Key Biscayne, 2,024 (40.7%) attend a private institution, while the remaining 2,948 (59.3%) are enrolled in public schools. The age group of 3 to 4 year olds has the highest likelihood of being enrolled in private schools, with 157 (92.9% in the age bracket) enrolled. Conversely, the age group of 10 to 14 year olds has the lowest likelihood of being enrolled in a private school, with 1,418 (74.0% in the age bracket) attending a public institution.
| Age Bracket | Public School | Private School |
| 3 to 4 Year Olds | 12 (7.1%) | 157 (92.9%) |
| 5 to 9 Year Old | 520 (62.6%) | 310 (37.3%) |
| 10 to 14 Year Olds | 1,418 (74.0%) | 498 (26.0%) |
| 15 to 17 Year Olds | 609 (61.8%) | 377 (38.2%) |
| 18 to 19 Year Olds | 200 (60.2%) | 132 (39.8%) |
| 20 to 24 Year Olds | 77 (17.2%) | 372 (82.9%) |
| 25 to 34 Year Olds | 15 (13.9%) | 93 (86.1%) |
| 35 Years and over | 99 (54.4%) | 83 (45.6%) |
| Total | 2,948 (59.3%) | 2,024 (40.7%) |
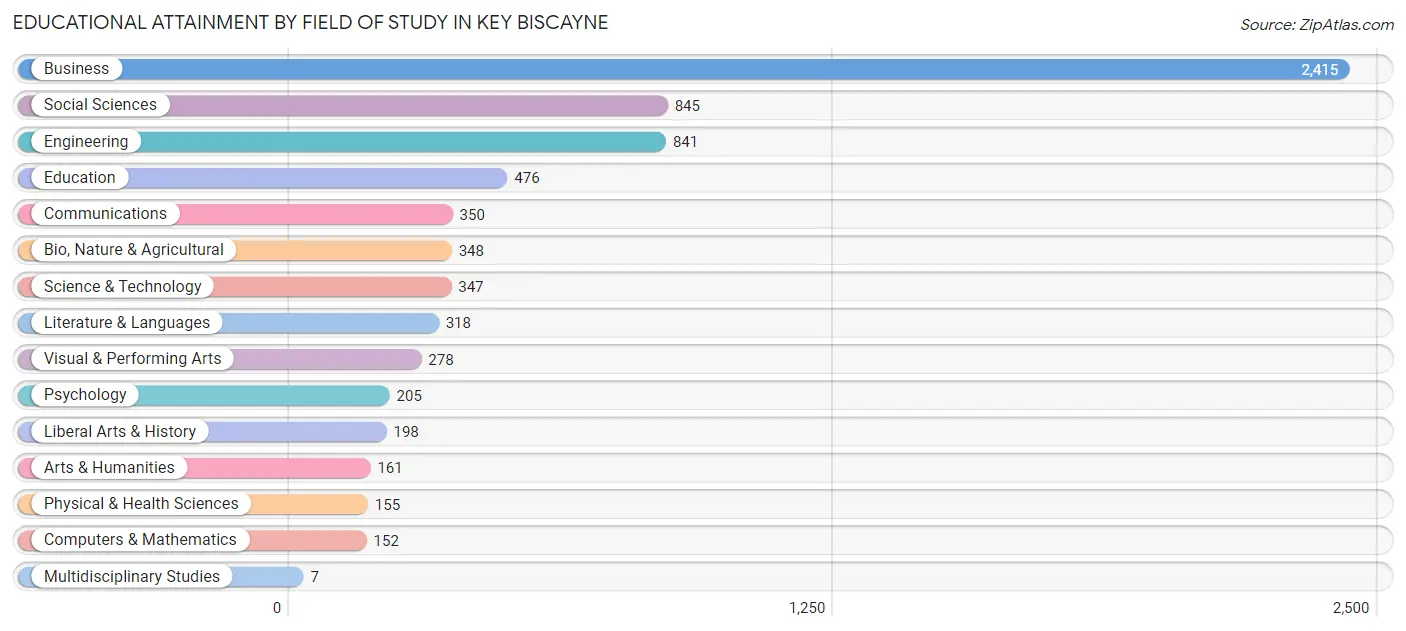
Educational Attainment by Field of Study in Key Biscayne
Business (2,415 | 34.0%), social sciences (845 | 11.9%), engineering (841 | 11.8%), education (476 | 6.7%), and communications (350 | 4.9%) are the most common fields of study among 7,096 individuals in Key Biscayne who have obtained a bachelor's degree or higher.
| Field of Study | # Graduates | % Graduates |
| Computers & Mathematics | 152 | 2.1% |
| Bio, Nature & Agricultural | 348 | 4.9% |
| Physical & Health Sciences | 155 | 2.2% |
| Psychology | 205 | 2.9% |
| Social Sciences | 845 | 11.9% |
| Engineering | 841 | 11.8% |
| Multidisciplinary Studies | 7 | 0.1% |
| Science & Technology | 347 | 4.9% |
| Business | 2,415 | 34.0% |
| Education | 476 | 6.7% |
| Literature & Languages | 318 | 4.5% |
| Liberal Arts & History | 198 | 2.8% |
| Visual & Performing Arts | 278 | 3.9% |
| Communications | 350 | 4.9% |
| Arts & Humanities | 161 | 2.3% |
| Total | 7,096 | 100.0% |
Transportation & Commute in Key Biscayne
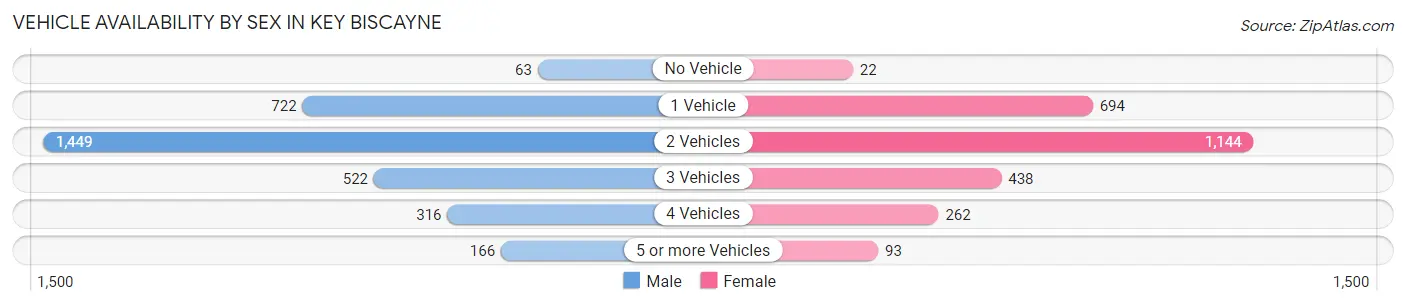
Vehicle Availability by Sex in Key Biscayne
The most prevalent vehicle ownership categories in Key Biscayne are males with 2 vehicles (1,449, accounting for 44.8%) and females with 2 vehicles (1,144, making up 54.6%).
| Vehicles Available | Male | Female |
| No Vehicle | 63 (1.9%) | 22 (0.8%) |
| 1 Vehicle | 722 (22.3%) | 694 (26.2%) |
| 2 Vehicles | 1,449 (44.8%) | 1,144 (43.1%) |
| 3 Vehicles | 522 (16.1%) | 438 (16.5%) |
| 4 Vehicles | 316 (9.8%) | 262 (9.9%) |
| 5 or more Vehicles | 166 (5.1%) | 93 (3.5%) |
| Total | 3,238 (100.0%) | 2,653 (100.0%) |
Commute Time in Key Biscayne
The most frequently occuring commute durations in Key Biscayne are 20 to 24 minutes (948 commuters, 21.7%), 30 to 34 minutes (682 commuters, 15.6%), and 15 to 19 minutes (677 commuters, 15.5%).
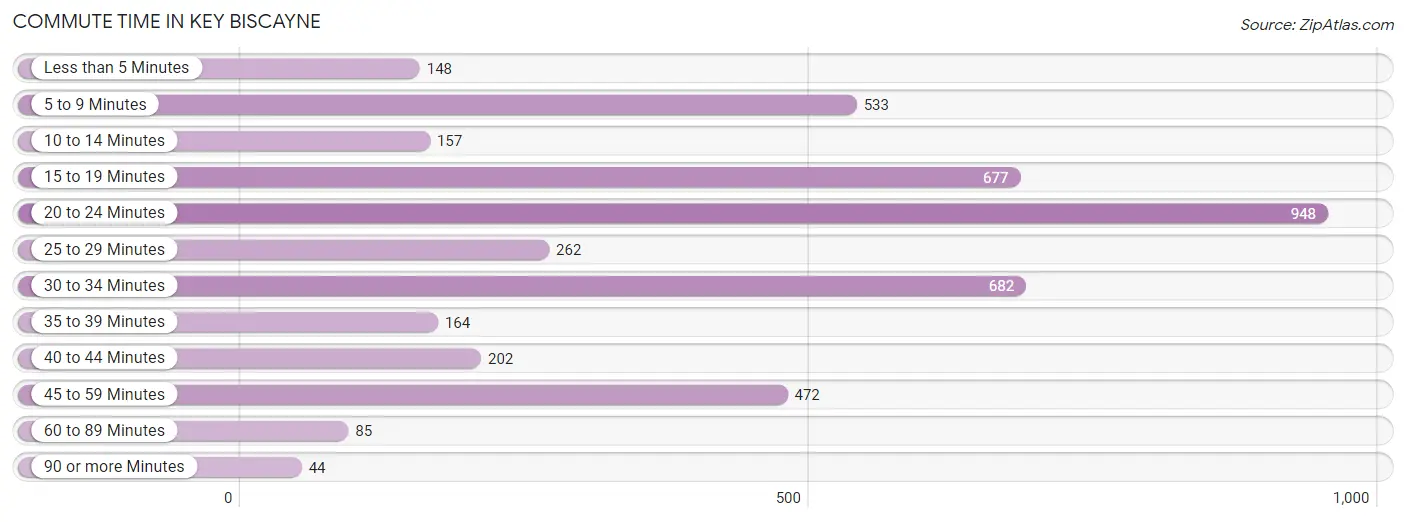
| Commute Time | # Commuters | % Commuters |
| Less than 5 Minutes | 148 | 3.4% |
| 5 to 9 Minutes | 533 | 12.2% |
| 10 to 14 Minutes | 157 | 3.6% |
| 15 to 19 Minutes | 677 | 15.5% |
| 20 to 24 Minutes | 948 | 21.7% |
| 25 to 29 Minutes | 262 | 6.0% |
| 30 to 34 Minutes | 682 | 15.6% |
| 35 to 39 Minutes | 164 | 3.7% |
| 40 to 44 Minutes | 202 | 4.6% |
| 45 to 59 Minutes | 472 | 10.8% |
| 60 to 89 Minutes | 85 | 1.9% |
| 90 or more Minutes | 44 | 1.0% |
Commute Time by Sex in Key Biscayne
The most common commute times in Key Biscayne are 15 to 19 minutes (526 commuters, 20.8%) for males and 20 to 24 minutes (440 commuters, 23.8%) for females.
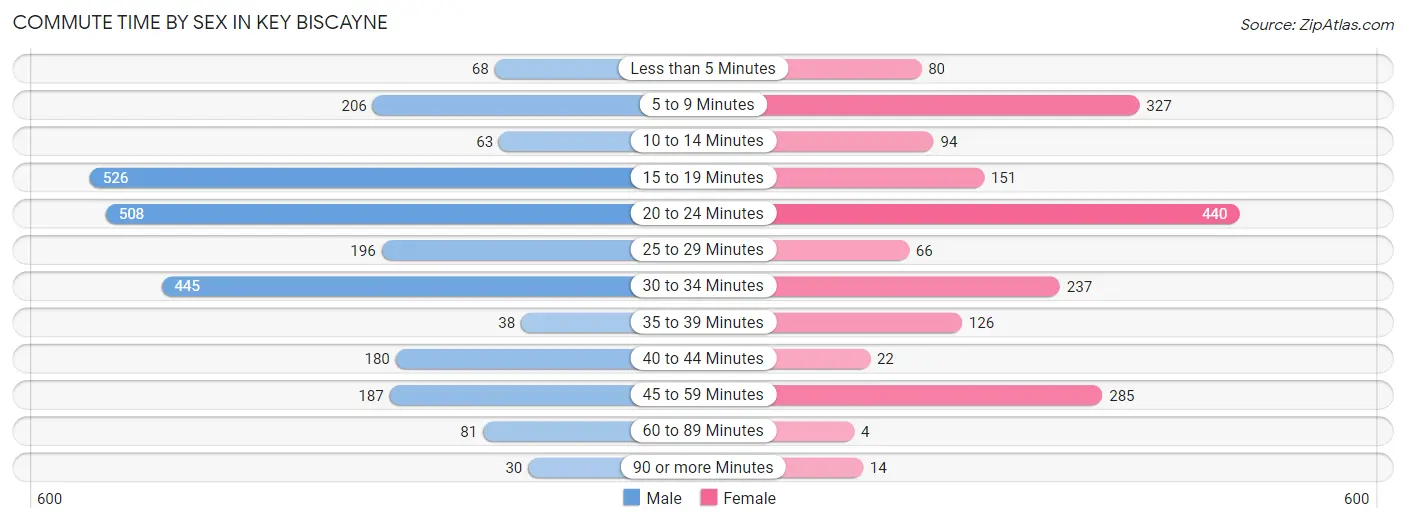
| Commute Time | Male | Female |
| Less than 5 Minutes | 68 (2.7%) | 80 (4.3%) |
| 5 to 9 Minutes | 206 (8.2%) | 327 (17.7%) |
| 10 to 14 Minutes | 63 (2.5%) | 94 (5.1%) |
| 15 to 19 Minutes | 526 (20.8%) | 151 (8.2%) |
| 20 to 24 Minutes | 508 (20.1%) | 440 (23.8%) |
| 25 to 29 Minutes | 196 (7.7%) | 66 (3.6%) |
| 30 to 34 Minutes | 445 (17.6%) | 237 (12.8%) |
| 35 to 39 Minutes | 38 (1.5%) | 126 (6.8%) |
| 40 to 44 Minutes | 180 (7.1%) | 22 (1.2%) |
| 45 to 59 Minutes | 187 (7.4%) | 285 (15.4%) |
| 60 to 89 Minutes | 81 (3.2%) | 4 (0.2%) |
| 90 or more Minutes | 30 (1.2%) | 14 (0.8%) |
Time of Departure to Work by Sex in Key Biscayne
The most frequent times of departure to work in Key Biscayne are 8:00 AM to 8:29 AM (760, 30.1%) for males and 8:00 AM to 8:29 AM (482, 26.1%) for females.
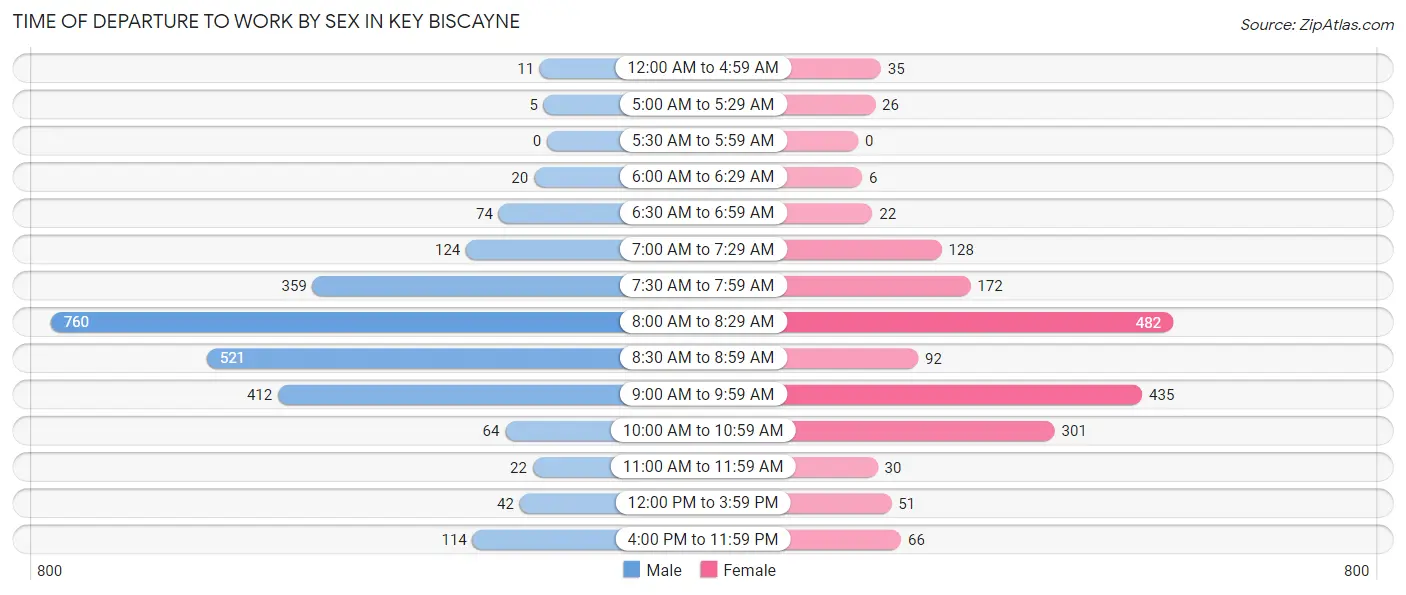
| Time of Departure | Male | Female |
| 12:00 AM to 4:59 AM | 11 (0.4%) | 35 (1.9%) |
| 5:00 AM to 5:29 AM | 5 (0.2%) | 26 (1.4%) |
| 5:30 AM to 5:59 AM | 0 (0.0%) | 0 (0.0%) |
| 6:00 AM to 6:29 AM | 20 (0.8%) | 6 (0.3%) |
| 6:30 AM to 6:59 AM | 74 (2.9%) | 22 (1.2%) |
| 7:00 AM to 7:29 AM | 124 (4.9%) | 128 (6.9%) |
| 7:30 AM to 7:59 AM | 359 (14.2%) | 172 (9.3%) |
| 8:00 AM to 8:29 AM | 760 (30.1%) | 482 (26.1%) |
| 8:30 AM to 8:59 AM | 521 (20.6%) | 92 (5.0%) |
| 9:00 AM to 9:59 AM | 412 (16.3%) | 435 (23.6%) |
| 10:00 AM to 10:59 AM | 64 (2.5%) | 301 (16.3%) |
| 11:00 AM to 11:59 AM | 22 (0.9%) | 30 (1.6%) |
| 12:00 PM to 3:59 PM | 42 (1.7%) | 51 (2.8%) |
| 4:00 PM to 11:59 PM | 114 (4.5%) | 66 (3.6%) |
| Total | 2,528 (100.0%) | 1,846 (100.0%) |
Housing Occupancy in Key Biscayne
Occupancy by Ownership in Key Biscayne
Of the total 4,658 dwellings in Key Biscayne, owner-occupied units account for 3,025 (64.9%), while renter-occupied units make up 1,633 (35.1%).
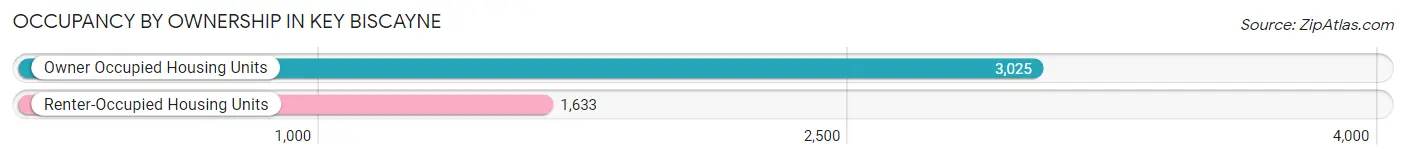
| Occupancy | # Housing Units | % Housing Units |
| Owner Occupied Housing Units | 3,025 | 64.9% |
| Renter-Occupied Housing Units | 1,633 | 35.1% |
| Total Occupied Housing Units | 4,658 | 100.0% |
Occupancy by Household Size in Key Biscayne
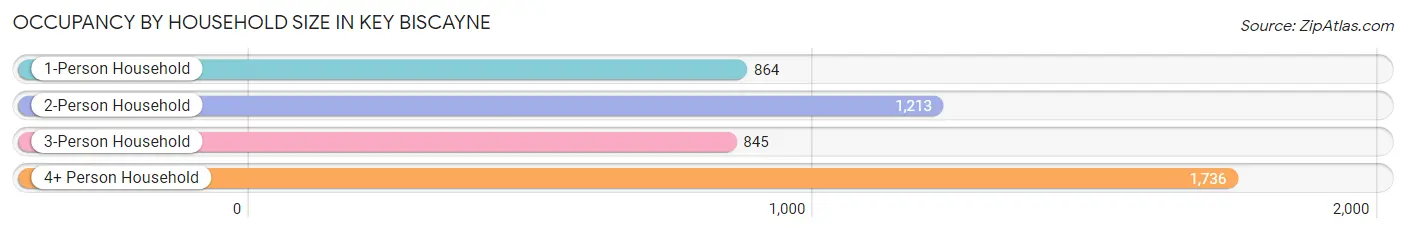
| Household Size | # Housing Units | % Housing Units |
| 1-Person Household | 864 | 18.5% |
| 2-Person Household | 1,213 | 26.0% |
| 3-Person Household | 845 | 18.1% |
| 4+ Person Household | 1,736 | 37.3% |
| Total Housing Units | 4,658 | 100.0% |
Occupancy by Ownership by Household Size in Key Biscayne
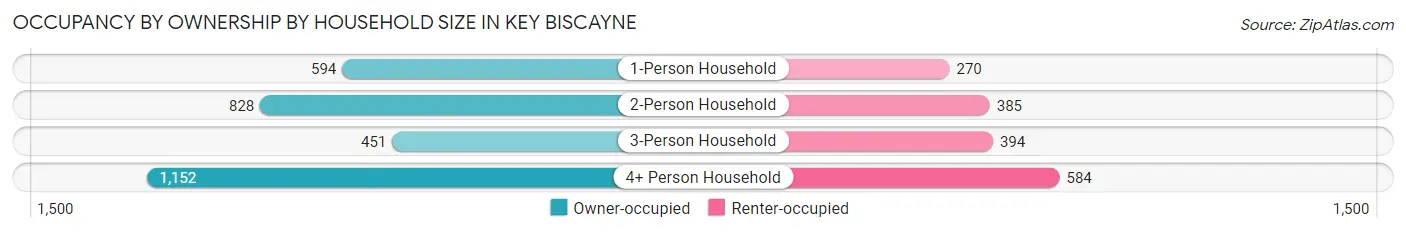
| Household Size | Owner-occupied | Renter-occupied |
| 1-Person Household | 594 (68.8%) | 270 (31.2%) |
| 2-Person Household | 828 (68.3%) | 385 (31.7%) |
| 3-Person Household | 451 (53.4%) | 394 (46.6%) |
| 4+ Person Household | 1,152 (66.4%) | 584 (33.6%) |
| Total Housing Units | 3,025 (64.9%) | 1,633 (35.1%) |
Occupancy by Educational Attainment in Key Biscayne
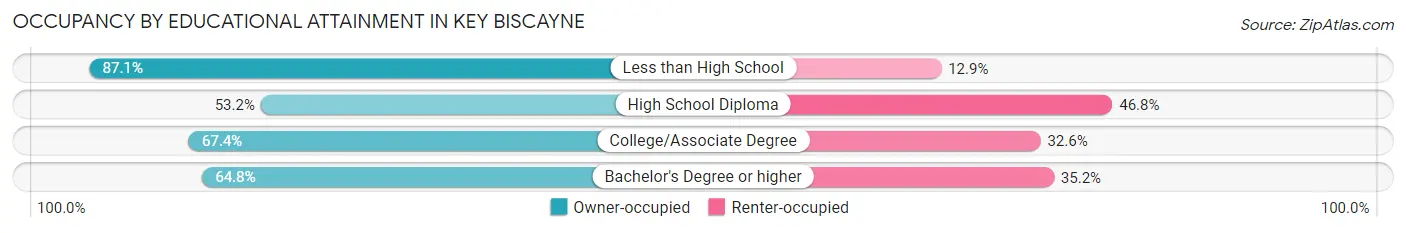
| Household Size | Owner-occupied | Renter-occupied |
| Less than High School | 54 (87.1%) | 8 (12.9%) |
| High School Diploma | 117 (53.2%) | 103 (46.8%) |
| College/Associate Degree | 507 (67.4%) | 245 (32.6%) |
| Bachelor's Degree or higher | 2,347 (64.8%) | 1,277 (35.2%) |
Occupancy by Age of Householder in Key Biscayne
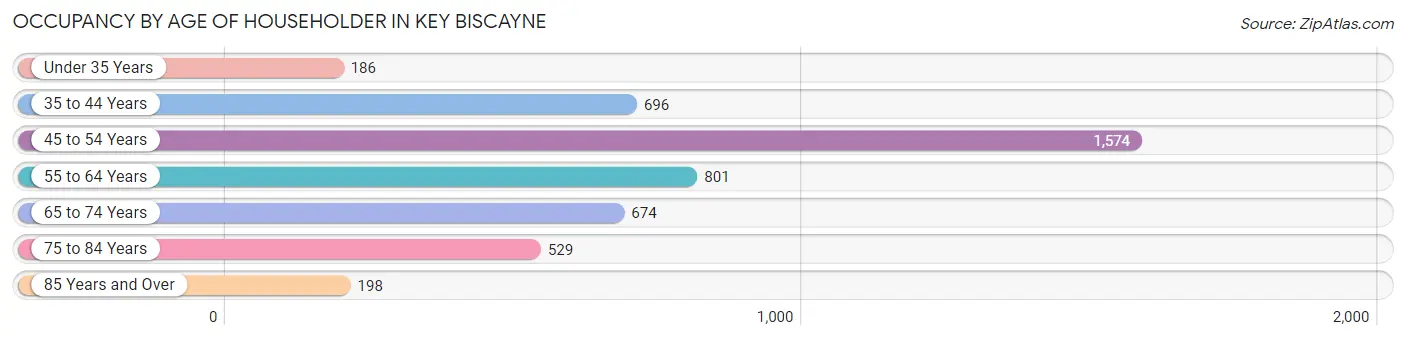
| Age Bracket | # Households | % Households |
| Under 35 Years | 186 | 4.0% |
| 35 to 44 Years | 696 | 14.9% |
| 45 to 54 Years | 1,574 | 33.8% |
| 55 to 64 Years | 801 | 17.2% |
| 65 to 74 Years | 674 | 14.5% |
| 75 to 84 Years | 529 | 11.4% |
| 85 Years and Over | 198 | 4.3% |
| Total | 4,658 | 100.0% |
Housing Finances in Key Biscayne
Median Income by Occupancy in Key Biscayne
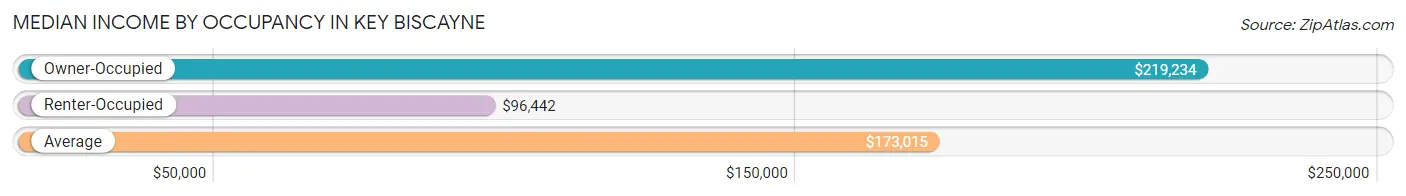
| Occupancy Type | # Households | Median Income |
| Owner-Occupied | 3,025 (64.9%) | $219,234 |
| Renter-Occupied | 1,633 (35.1%) | $96,442 |
| Average | 4,658 (100.0%) | $173,015 |
Occupancy by Householder Income Bracket in Key Biscayne
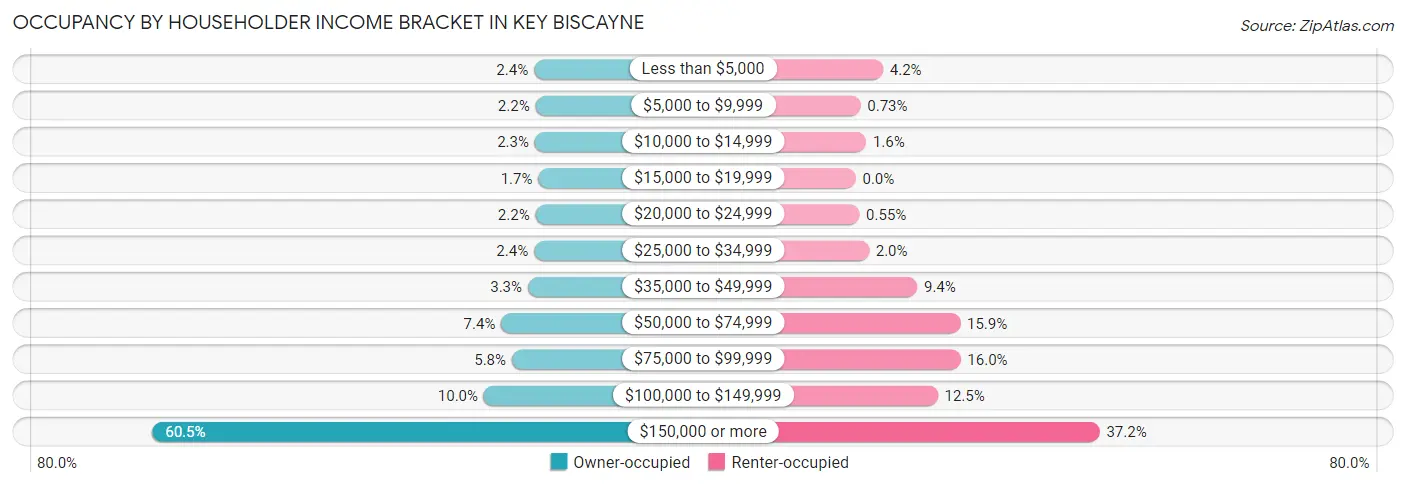
| Income Bracket | Owner-occupied | Renter-occupied |
| Less than $5,000 | 72 (2.4%) | 68 (4.2%) |
| $5,000 to $9,999 | 65 (2.1%) | 12 (0.7%) |
| $10,000 to $14,999 | 68 (2.2%) | 26 (1.6%) |
| $15,000 to $19,999 | 52 (1.7%) | 0 (0.0%) |
| $20,000 to $24,999 | 65 (2.1%) | 9 (0.5%) |
| $25,000 to $34,999 | 72 (2.4%) | 33 (2.0%) |
| $35,000 to $49,999 | 100 (3.3%) | 153 (9.4%) |
| $50,000 to $74,999 | 223 (7.4%) | 260 (15.9%) |
| $75,000 to $99,999 | 174 (5.8%) | 261 (16.0%) |
| $100,000 to $149,999 | 303 (10.0%) | 204 (12.5%) |
| $150,000 or more | 1,831 (60.5%) | 607 (37.2%) |
| Total | 3,025 (100.0%) | 1,633 (100.0%) |
Monthly Housing Cost Tiers in Key Biscayne
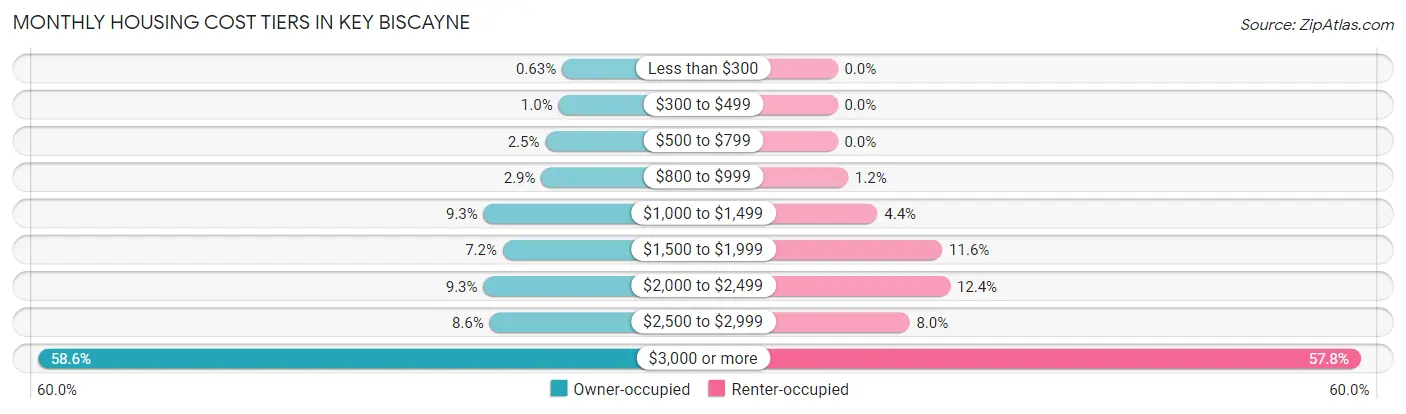
| Monthly Cost | Owner-occupied | Renter-occupied |
| Less than $300 | 19 (0.6%) | 0 (0.0%) |
| $300 to $499 | 31 (1.0%) | 0 (0.0%) |
| $500 to $799 | 75 (2.5%) | 0 (0.0%) |
| $800 to $999 | 88 (2.9%) | 19 (1.2%) |
| $1,000 to $1,499 | 281 (9.3%) | 72 (4.4%) |
| $1,500 to $1,999 | 217 (7.2%) | 189 (11.6%) |
| $2,000 to $2,499 | 282 (9.3%) | 203 (12.4%) |
| $2,500 to $2,999 | 261 (8.6%) | 130 (8.0%) |
| $3,000 or more | 1,771 (58.6%) | 944 (57.8%) |
| Total | 3,025 (100.0%) | 1,633 (100.0%) |
Physical Housing Characteristics in Key Biscayne
Housing Structures in Key Biscayne
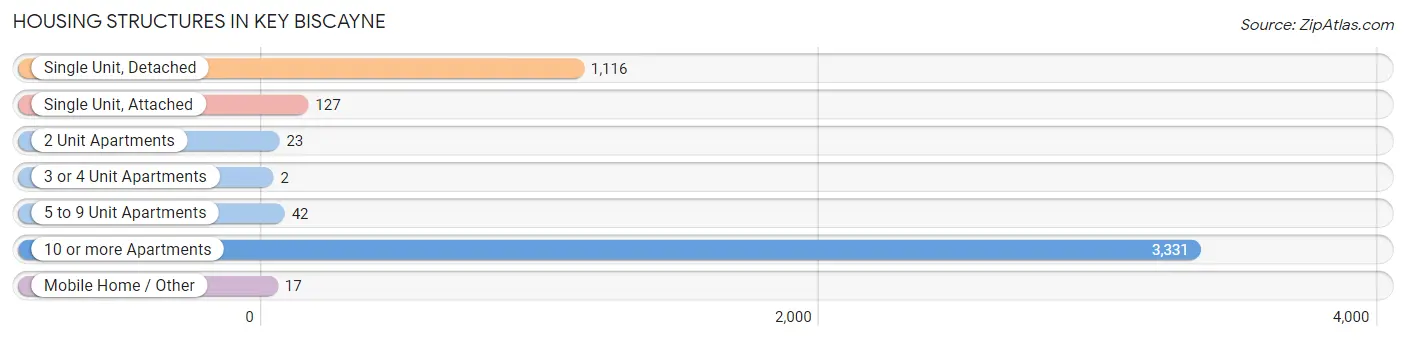
| Structure Type | # Housing Units | % Housing Units |
| Single Unit, Detached | 1,116 | 24.0% |
| Single Unit, Attached | 127 | 2.7% |
| 2 Unit Apartments | 23 | 0.5% |
| 3 or 4 Unit Apartments | 2 | 0.0% |
| 5 to 9 Unit Apartments | 42 | 0.9% |
| 10 or more Apartments | 3,331 | 71.5% |
| Mobile Home / Other | 17 | 0.4% |
| Total | 4,658 | 100.0% |
Housing Structures by Occupancy in Key Biscayne
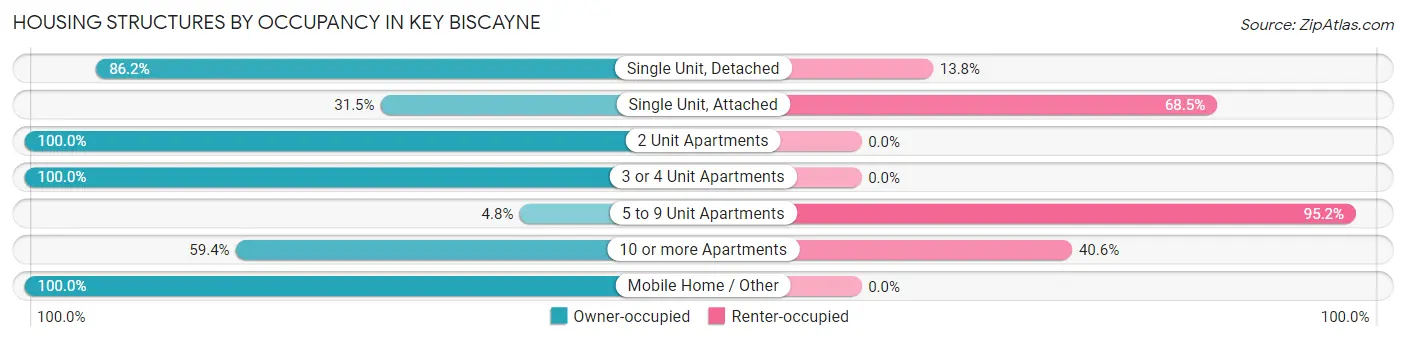
| Structure Type | Owner-occupied | Renter-occupied |
| Single Unit, Detached | 962 (86.2%) | 154 (13.8%) |
| Single Unit, Attached | 40 (31.5%) | 87 (68.5%) |
| 2 Unit Apartments | 23 (100.0%) | 0 (0.0%) |
| 3 or 4 Unit Apartments | 2 (100.0%) | 0 (0.0%) |
| 5 to 9 Unit Apartments | 2 (4.8%) | 40 (95.2%) |
| 10 or more Apartments | 1,979 (59.4%) | 1,352 (40.6%) |
| Mobile Home / Other | 17 (100.0%) | 0 (0.0%) |
| Total | 3,025 (64.9%) | 1,633 (35.1%) |
Housing Structures by Number of Rooms in Key Biscayne
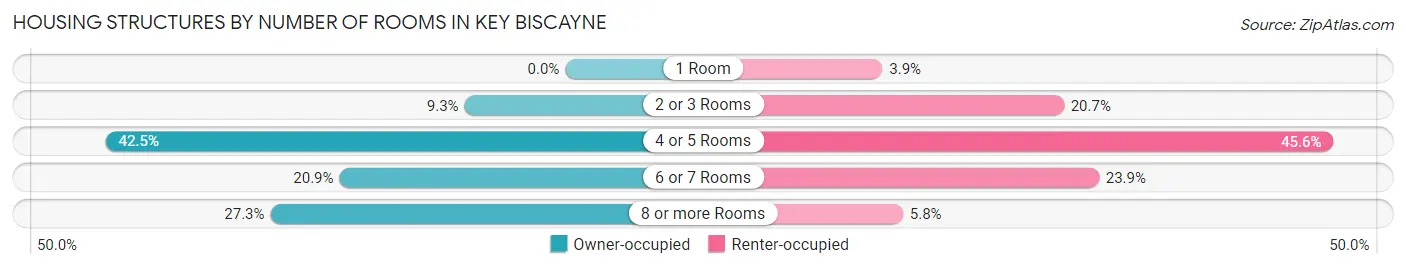
| Number of Rooms | Owner-occupied | Renter-occupied |
| 1 Room | 0 (0.0%) | 64 (3.9%) |
| 2 or 3 Rooms | 282 (9.3%) | 338 (20.7%) |
| 4 or 5 Rooms | 1,286 (42.5%) | 745 (45.6%) |
| 6 or 7 Rooms | 632 (20.9%) | 391 (23.9%) |
| 8 or more Rooms | 825 (27.3%) | 95 (5.8%) |
| Total | 3,025 (100.0%) | 1,633 (100.0%) |
Housing Structure by Heating Type in Key Biscayne
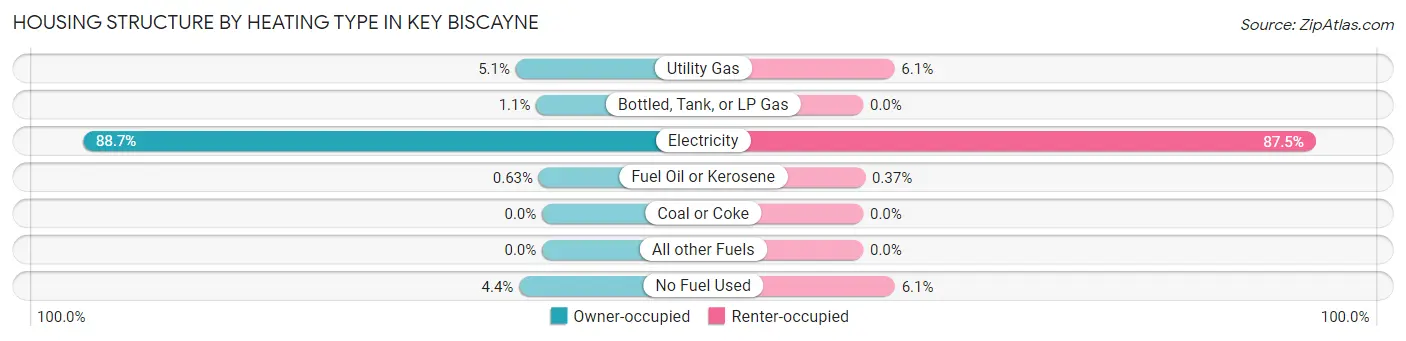
| Heating Type | Owner-occupied | Renter-occupied |
| Utility Gas | 154 (5.1%) | 99 (6.1%) |
| Bottled, Tank, or LP Gas | 34 (1.1%) | 0 (0.0%) |
| Electricity | 2,684 (88.7%) | 1,428 (87.5%) |
| Fuel Oil or Kerosene | 19 (0.6%) | 6 (0.4%) |
| Coal or Coke | 0 (0.0%) | 0 (0.0%) |
| All other Fuels | 0 (0.0%) | 0 (0.0%) |
| No Fuel Used | 134 (4.4%) | 100 (6.1%) |
| Total | 3,025 (100.0%) | 1,633 (100.0%) |
Household Vehicle Usage in Key Biscayne
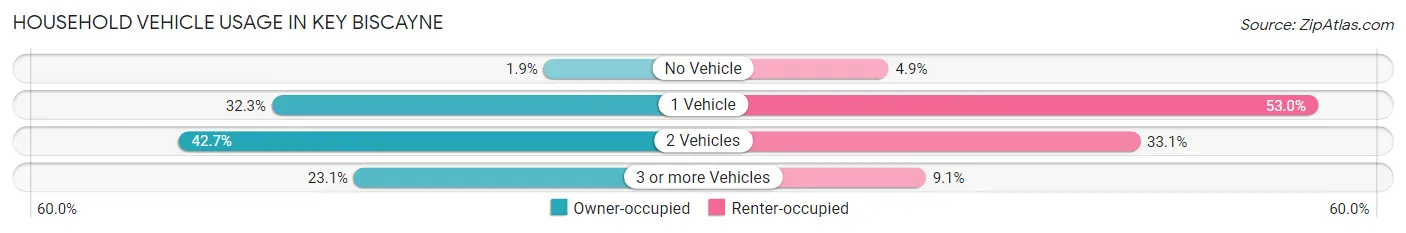
| Vehicles per Household | Owner-occupied | Renter-occupied |
| No Vehicle | 56 (1.8%) | 80 (4.9%) |
| 1 Vehicle | 977 (32.3%) | 865 (53.0%) |
| 2 Vehicles | 1,293 (42.7%) | 540 (33.1%) |
| 3 or more Vehicles | 699 (23.1%) | 148 (9.1%) |
| Total | 3,025 (100.0%) | 1,633 (100.0%) |
Real Estate & Mortgages in Key Biscayne
Real Estate and Mortgage Overview in Key Biscayne
| Characteristic | Without Mortgage | With Mortgage |
| Housing Units | 1,493 | 1,532 |
| Median Property Value | $1,278,800 | $1,372,900 |
| Median Household Income | $172,784 | $1,039 |
| Monthly Housing Costs | $1,501 | $1,264 |
| Real Estate Taxes | $9,885 | $10 |
Property Value by Mortgage Status in Key Biscayne
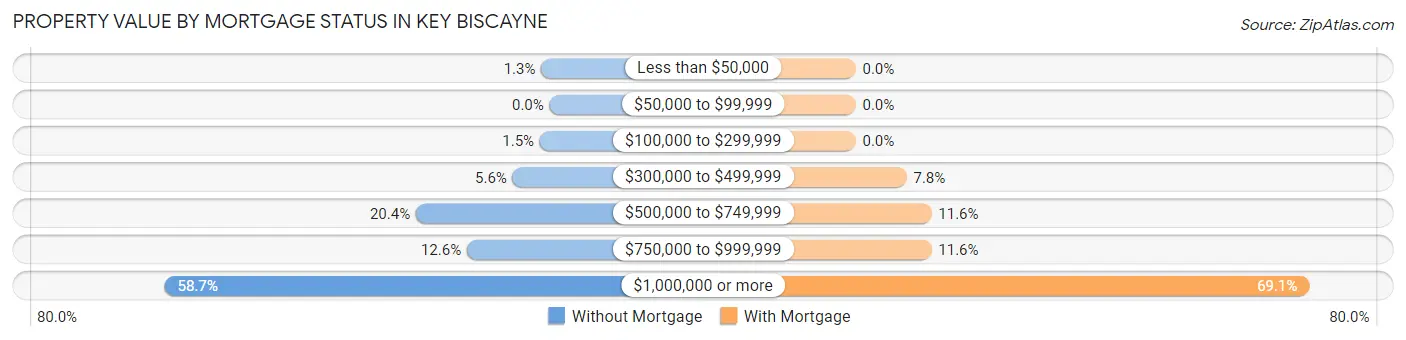
| Property Value | Without Mortgage | With Mortgage |
| Less than $50,000 | 19 (1.3%) | 0 (0.0%) |
| $50,000 to $99,999 | 0 (0.0%) | 0 (0.0%) |
| $100,000 to $299,999 | 22 (1.5%) | 0 (0.0%) |
| $300,000 to $499,999 | 84 (5.6%) | 119 (7.8%) |
| $500,000 to $749,999 | 304 (20.4%) | 177 (11.6%) |
| $750,000 to $999,999 | 188 (12.6%) | 177 (11.6%) |
| $1,000,000 or more | 876 (58.7%) | 1,059 (69.1%) |
| Total | 1,493 (100.0%) | 1,532 (100.0%) |
Household Income by Mortgage Status in Key Biscayne
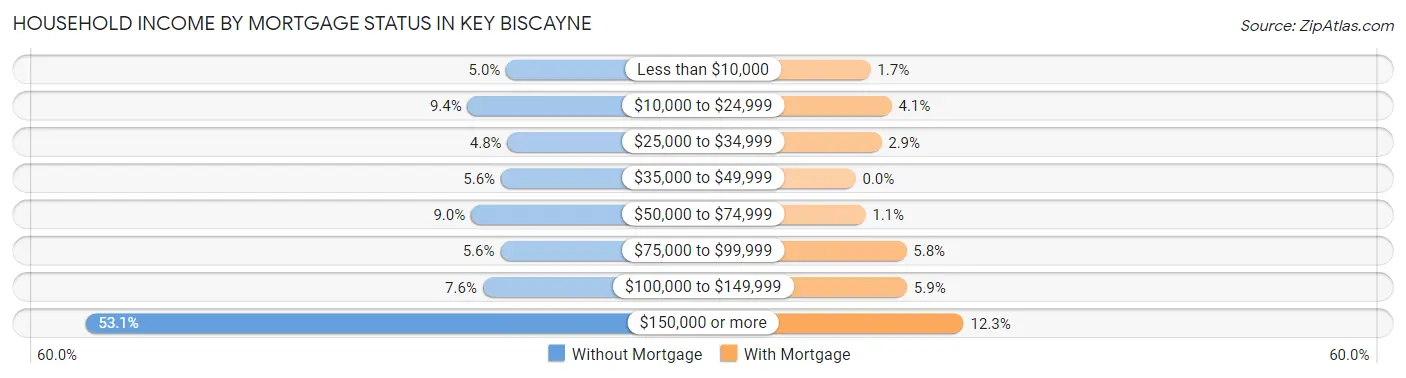
| Household Income | Without Mortgage | With Mortgage |
| Less than $10,000 | 74 (5.0%) | 26 (1.7%) |
| $10,000 to $24,999 | 140 (9.4%) | 63 (4.1%) |
| $25,000 to $34,999 | 72 (4.8%) | 45 (2.9%) |
| $35,000 to $49,999 | 83 (5.6%) | 0 (0.0%) |
| $50,000 to $74,999 | 134 (9.0%) | 17 (1.1%) |
| $75,000 to $99,999 | 84 (5.6%) | 89 (5.8%) |
| $100,000 to $149,999 | 114 (7.6%) | 90 (5.9%) |
| $150,000 or more | 792 (53.0%) | 189 (12.3%) |
| Total | 1,493 (100.0%) | 1,532 (100.0%) |
Property Value to Household Income Ratio in Key Biscayne
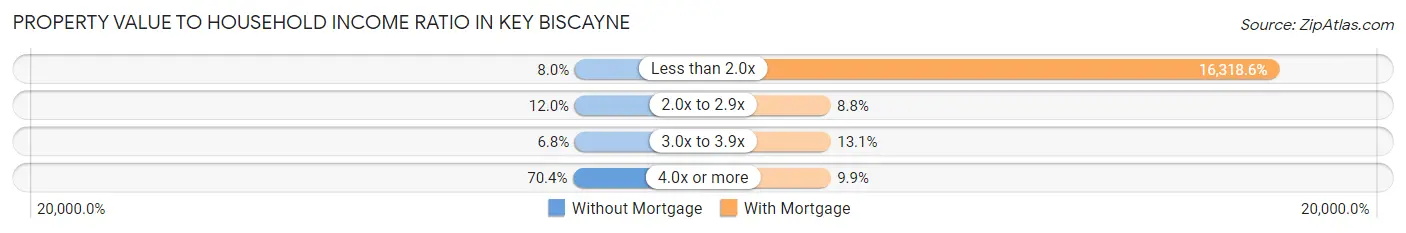
| Value-to-Income Ratio | Without Mortgage | With Mortgage |
| Less than 2.0x | 120 (8.0%) | 250,001 (16,318.6%) |
| 2.0x to 2.9x | 179 (12.0%) | 134 (8.7%) |
| 3.0x to 3.9x | 101 (6.8%) | 200 (13.1%) |
| 4.0x or more | 1,051 (70.4%) | 152 (9.9%) |
| Total | 1,493 (100.0%) | 1,532 (100.0%) |
Real Estate Taxes by Mortgage Status in Key Biscayne
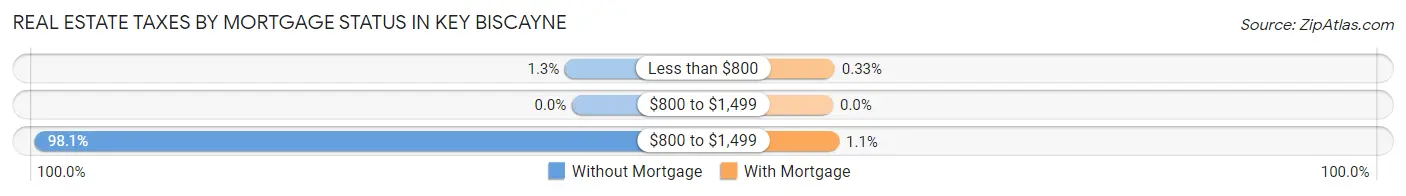
| Property Taxes | Without Mortgage | With Mortgage |
| Less than $800 | 19 (1.3%) | 5 (0.3%) |
| $800 to $1,499 | 0 (0.0%) | 0 (0.0%) |
| $800 to $1,499 | 1,465 (98.1%) | 17 (1.1%) |
| Total | 1,493 (100.0%) | 1,532 (100.0%) |
Health & Disability in Key Biscayne
Health Insurance Coverage by Age in Key Biscayne
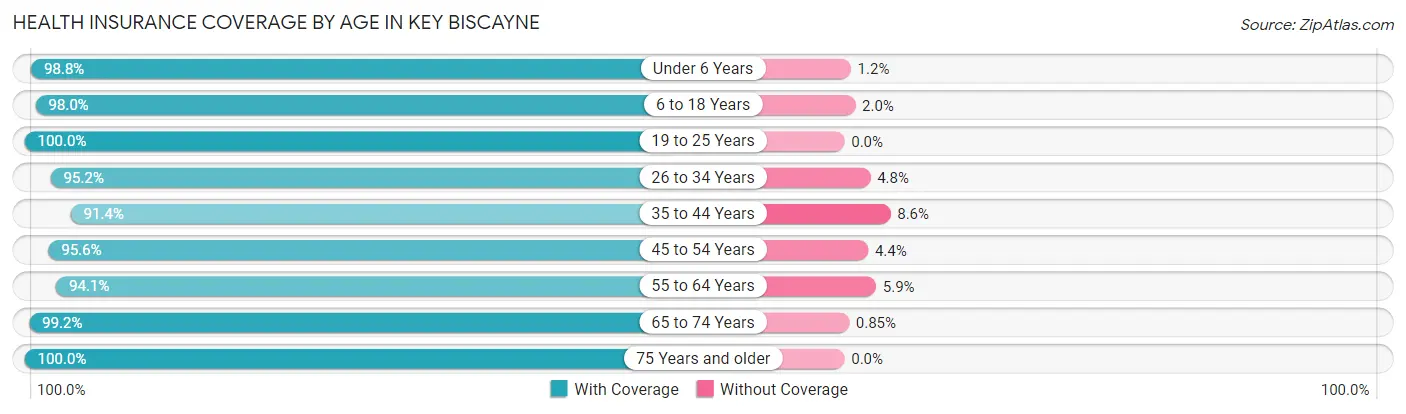
| Age Bracket | With Coverage | Without Coverage |
| Under 6 Years | 747 (98.8%) | 9 (1.2%) |
| 6 to 18 Years | 3,837 (98.0%) | 79 (2.0%) |
| 19 to 25 Years | 865 (100.0%) | 0 (0.0%) |
| 26 to 34 Years | 670 (95.2%) | 34 (4.8%) |
| 35 to 44 Years | 1,406 (91.4%) | 132 (8.6%) |
| 45 to 54 Years | 3,006 (95.6%) | 139 (4.4%) |
| 55 to 64 Years | 1,312 (94.1%) | 82 (5.9%) |
| 65 to 74 Years | 1,169 (99.2%) | 10 (0.9%) |
| 75 Years and older | 1,075 (100.0%) | 0 (0.0%) |
| Total | 14,087 (96.7%) | 485 (3.3%) |
Health Insurance Coverage by Citizenship Status in Key Biscayne
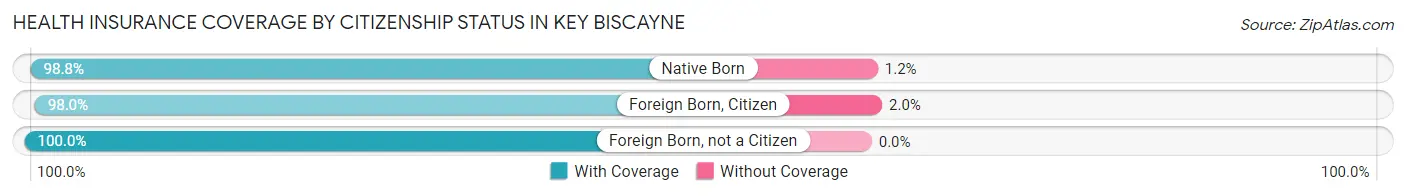
| Citizenship Status | With Coverage | Without Coverage |
| Native Born | 747 (98.8%) | 9 (1.2%) |
| Foreign Born, Citizen | 3,837 (98.0%) | 79 (2.0%) |
| Foreign Born, not a Citizen | 865 (100.0%) | 0 (0.0%) |
Health Insurance Coverage by Household Income in Key Biscayne
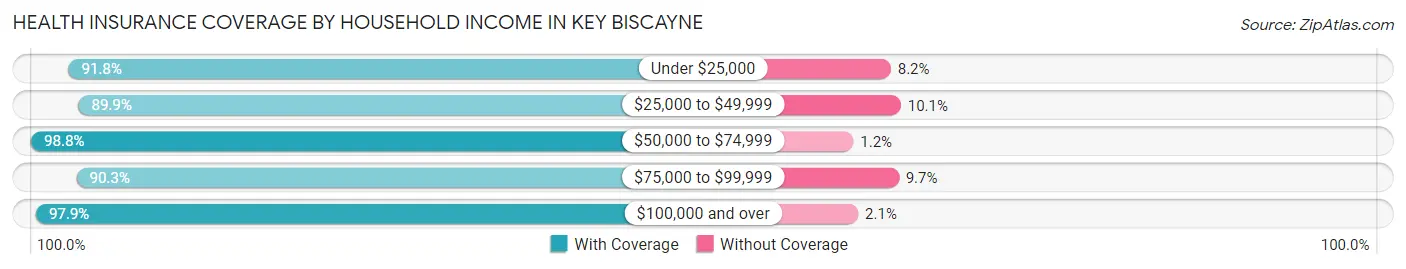
| Household Income | With Coverage | Without Coverage |
| Under $25,000 | 857 (91.8%) | 77 (8.2%) |
| $25,000 to $49,999 | 586 (89.9%) | 66 (10.1%) |
| $50,000 to $74,999 | 1,204 (98.8%) | 15 (1.2%) |
| $75,000 to $99,999 | 909 (90.3%) | 98 (9.7%) |
| $100,000 and over | 10,531 (97.9%) | 229 (2.1%) |
Public vs Private Health Insurance Coverage by Age in Key Biscayne
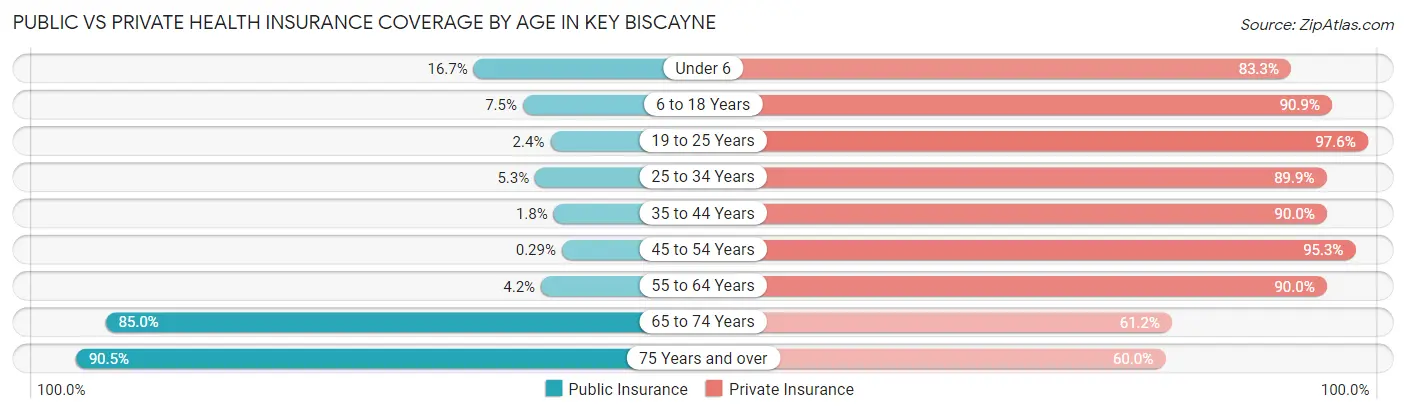
| Age Bracket | Public Insurance | Private Insurance |
| Under 6 | 126 (16.7%) | 630 (83.3%) |
| 6 to 18 Years | 295 (7.5%) | 3,561 (90.9%) |
| 19 to 25 Years | 21 (2.4%) | 844 (97.6%) |
| 25 to 34 Years | 37 (5.3%) | 633 (89.9%) |
| 35 to 44 Years | 28 (1.8%) | 1,384 (90.0%) |
| 45 to 54 Years | 9 (0.3%) | 2,997 (95.3%) |
| 55 to 64 Years | 58 (4.2%) | 1,254 (90.0%) |
| 65 to 74 Years | 1,002 (85.0%) | 722 (61.2%) |
| 75 Years and over | 973 (90.5%) | 645 (60.0%) |
| Total | 2,549 (17.5%) | 12,670 (87.0%) |
Disability Status by Sex by Age in Key Biscayne
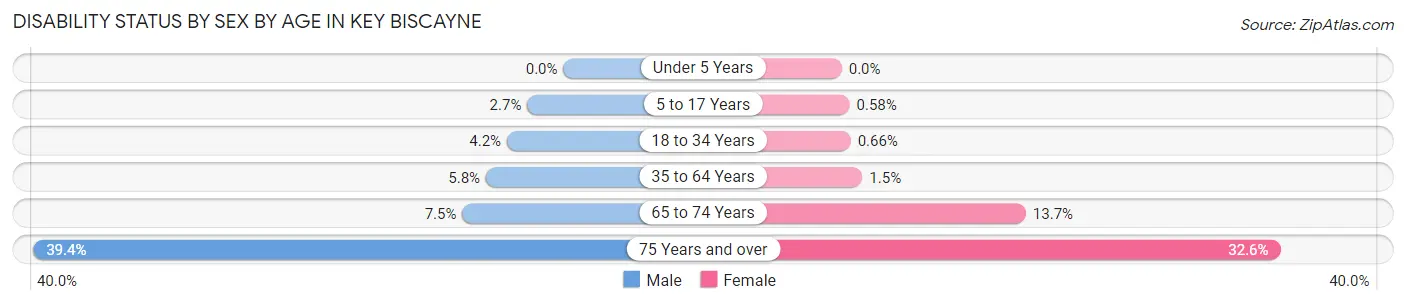
| Age Bracket | Male | Female |
| Under 5 Years | 0 (0.0%) | 0 (0.0%) |
| 5 to 17 Years | 59 (2.7%) | 10 (0.6%) |
| 18 to 34 Years | 38 (4.2%) | 5 (0.7%) |
| 35 to 64 Years | 162 (5.8%) | 50 (1.5%) |
| 65 to 74 Years | 33 (7.5%) | 101 (13.7%) |
| 75 Years and over | 185 (39.4%) | 197 (32.6%) |
Disability Class by Sex by Age in Key Biscayne
Disability Class: Hearing Difficulty
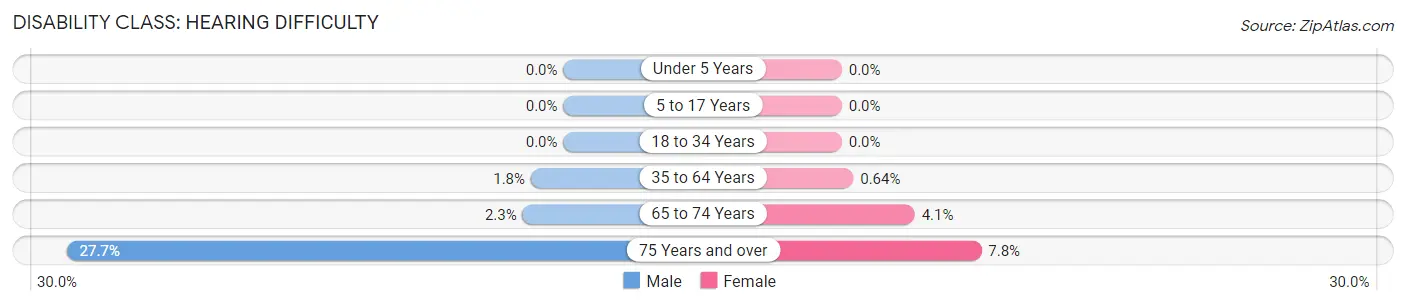
| Age Bracket | Male | Female |
| Under 5 Years | 0 (0.0%) | 0 (0.0%) |
| 5 to 17 Years | 0 (0.0%) | 0 (0.0%) |
| 18 to 34 Years | 0 (0.0%) | 0 (0.0%) |
| 35 to 64 Years | 51 (1.8%) | 21 (0.6%) |
| 65 to 74 Years | 10 (2.3%) | 30 (4.1%) |
| 75 Years and over | 130 (27.7%) | 47 (7.8%) |
Disability Class: Vision Difficulty
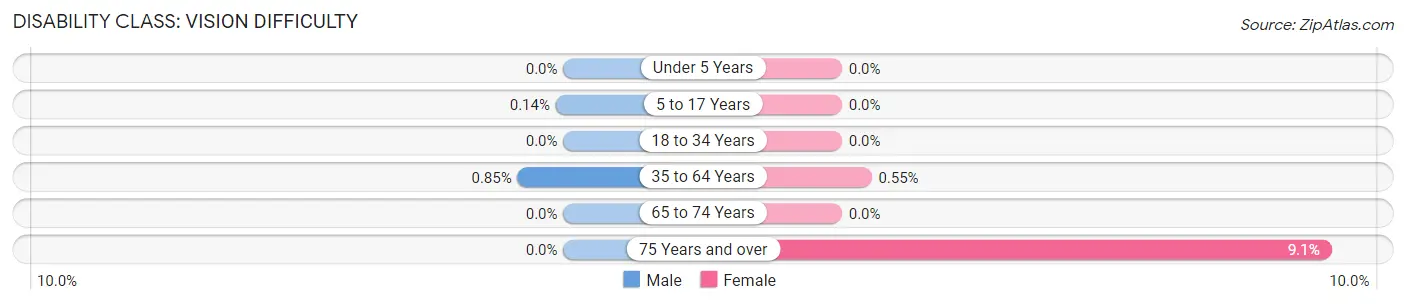
| Age Bracket | Male | Female |
| Under 5 Years | 0 (0.0%) | 0 (0.0%) |
| 5 to 17 Years | 3 (0.1%) | 0 (0.0%) |
| 18 to 34 Years | 0 (0.0%) | 0 (0.0%) |
| 35 to 64 Years | 24 (0.9%) | 18 (0.5%) |
| 65 to 74 Years | 0 (0.0%) | 0 (0.0%) |
| 75 Years and over | 0 (0.0%) | 55 (9.1%) |
Disability Class: Cognitive Difficulty
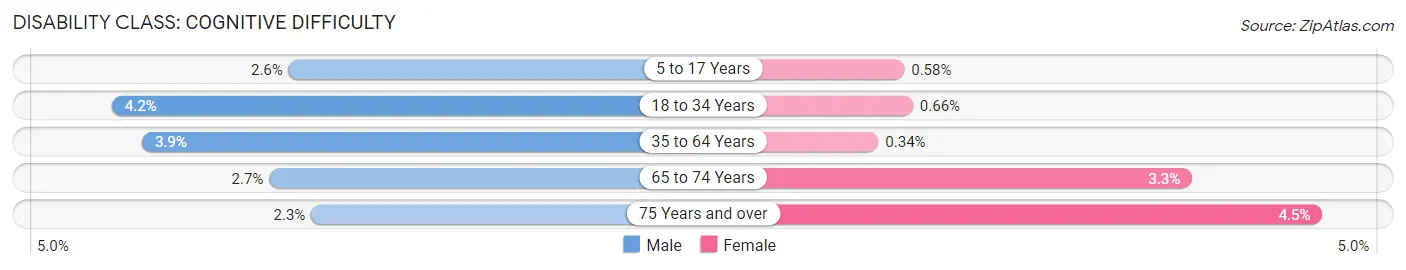
| Age Bracket | Male | Female |
| 5 to 17 Years | 56 (2.5%) | 10 (0.6%) |
| 18 to 34 Years | 38 (4.2%) | 5 (0.7%) |
| 35 to 64 Years | 110 (3.9%) | 11 (0.3%) |
| 65 to 74 Years | 12 (2.7%) | 24 (3.3%) |
| 75 Years and over | 11 (2.3%) | 27 (4.5%) |
Disability Class: Ambulatory Difficulty
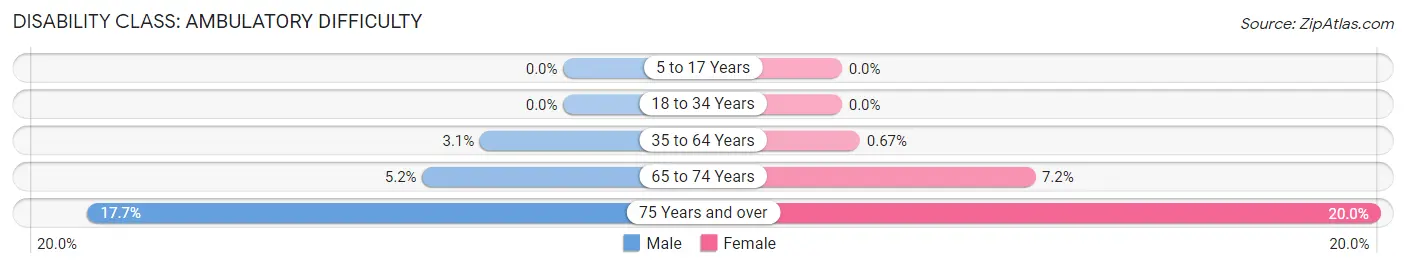
| Age Bracket | Male | Female |
| 5 to 17 Years | 0 (0.0%) | 0 (0.0%) |
| 18 to 34 Years | 0 (0.0%) | 0 (0.0%) |
| 35 to 64 Years | 87 (3.1%) | 22 (0.7%) |
| 65 to 74 Years | 23 (5.2%) | 53 (7.2%) |
| 75 Years and over | 83 (17.7%) | 121 (20.0%) |
Disability Class: Self-Care Difficulty
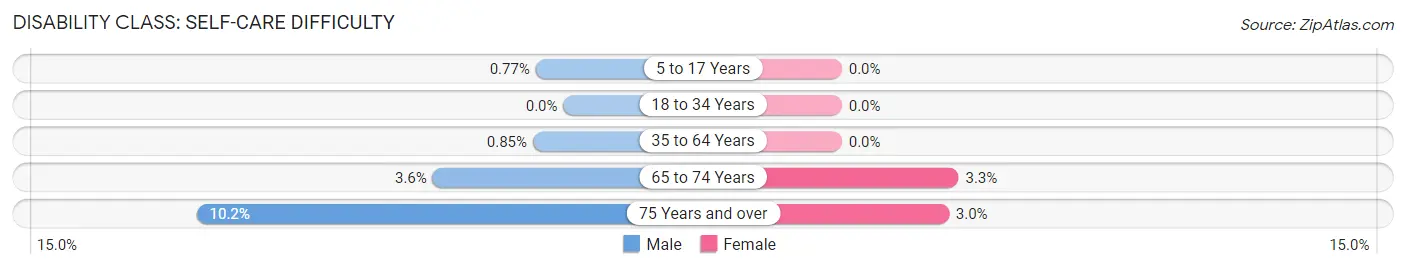
| Age Bracket | Male | Female |
| 5 to 17 Years | 17 (0.8%) | 0 (0.0%) |
| 18 to 34 Years | 0 (0.0%) | 0 (0.0%) |
| 35 to 64 Years | 24 (0.9%) | 0 (0.0%) |
| 65 to 74 Years | 16 (3.6%) | 24 (3.3%) |
| 75 Years and over | 48 (10.2%) | 18 (3.0%) |
Technology Access in Key Biscayne
Computing Device Access in Key Biscayne
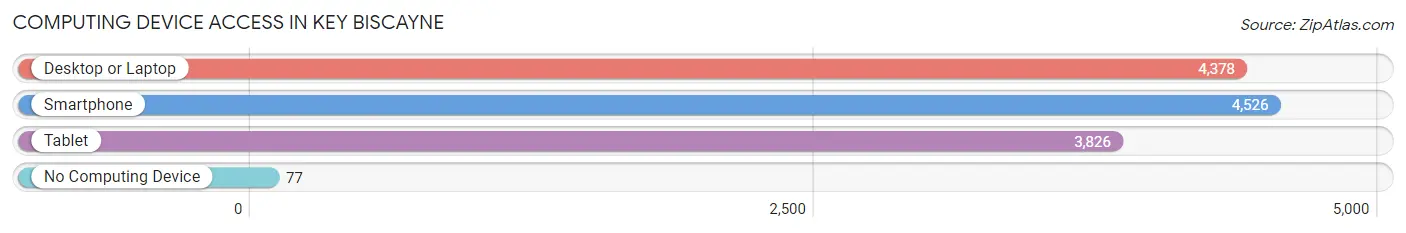
| Device Type | # Households | % Households |
| Desktop or Laptop | 4,378 | 94.0% |
| Smartphone | 4,526 | 97.2% |
| Tablet | 3,826 | 82.1% |
| No Computing Device | 77 | 1.7% |
| Total | 4,658 | 100.0% |
Internet Access in Key Biscayne
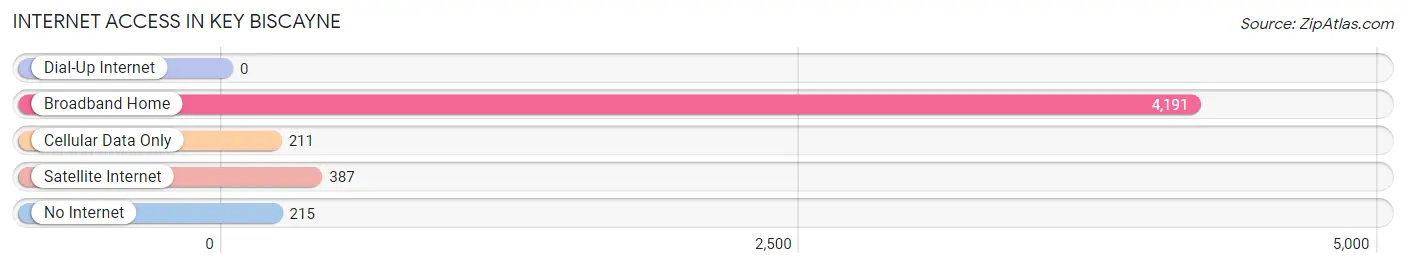
| Internet Type | # Households | % Households |
| Dial-Up Internet | 0 | 0.0% |
| Broadband Home | 4,191 | 90.0% |
| Cellular Data Only | 211 | 4.5% |
| Satellite Internet | 387 | 8.3% |
| No Internet | 215 | 4.6% |
| Total | 4,658 | 100.0% |
Key Biscayne Summary
Key Biscayne is a small island town located in Miami-Dade County, Florida. It is situated on the Atlantic Ocean, just south of Miami Beach and east of the city of Miami. The island is connected to the mainland by the Rickenbacker Causeway, which is a two-lane bridge that spans the bay between the island and the mainland. Key Biscayne is known for its beautiful beaches, lush tropical vegetation, and its laid-back atmosphere.
History
The history of Key Biscayne dates back to the early 1800s when it was inhabited by the Tequesta Indians. The island was later used as a fishing and trading post by the Spanish and the British. In 1891, the island was purchased by William John Matheson, who developed it into a coconut plantation. Matheson named the island after the Spanish word for “key”, which is “biscayne”.
In the early 1900s, the island was used as a military base by the U.S. Navy. During World War II, the island was used as a training ground for the Navy’s amphibious forces. After the war, the island was developed into a residential community. In the 1950s, the island was incorporated as the Village of Key Biscayne.
Geography
Key Biscayne is located on the Atlantic Ocean, just south of Miami Beach and east of the city of Miami. The island is connected to the mainland by the Rickenbacker Causeway, which is a two-lane bridge that spans the bay between the island and the mainland. The island is approximately 4.5 miles long and 1.5 miles wide. It is surrounded by the Atlantic Ocean on the east, Biscayne Bay on the west, and the Rickenbacker Causeway on the north.
The island is home to several parks, including Crandon Park, which is a popular beach park with a golf course, tennis courts, and a marina. The Bill Baggs Cape Florida State Park is located on the southern tip of the island and is home to a historic lighthouse. The island also has several nature preserves, including the Key Biscayne National Wildlife Refuge, which is home to a variety of birds and other wildlife.
Economy
The economy of Key Biscayne is largely based on tourism and real estate. The island is home to several luxury resorts, including the Ritz-Carlton Key Biscayne, which is a popular destination for visitors from around the world. The island also has several marinas, which provide docking and storage for boats and yachts.
The island is also home to several businesses, including restaurants, retail stores, and financial services. The island is also home to several corporate offices, including the headquarters of the Miami Herald newspaper.
Demographics
As of the 2010 census, the population of Key Biscayne was 12,344. The population is predominantly white (77.3%) and Hispanic (17.2%). The median household income is $106,845, which is significantly higher than the national average. The median age is 44.7 years, and the median home value is $1,072,000.
Key Biscayne is a small island town with a rich history, beautiful geography, and a thriving economy. The island is home to a diverse population and is a popular destination for tourists from around the world. The island is known for its laid-back atmosphere and its beautiful beaches, making it a great place to live and visit.
Common Questions
What is Per Capita Income in Key Biscayne?
Per Capita income in Key Biscayne is $87,271.
What is the Median Family Income in Key Biscayne?
Median Family Income in Key Biscayne is $219,112.
What is the Median Household income in Key Biscayne?
Median Household Income in Key Biscayne is $173,015.
What is Income or Wage Gap in Key Biscayne?
Income or Wage Gap in Key Biscayne is 62.5%.
Women in Key Biscayne earn 37.5 cents for every dollar earned by a man.
What is Family Income Deficit in Key Biscayne?
Family Income Deficit in Key Biscayne is $13,371.
Families that are below poverty line in Key Biscayne earn $13,371 less on average than the poverty threshold level.
What is Inequality or Gini Index in Key Biscayne?
Inequality or Gini Index in Key Biscayne is 0.53.
What is the Total Population of Key Biscayne?
Total Population of Key Biscayne is 14,572.
What is the Total Male Population of Key Biscayne?
Total Male Population of Key Biscayne is 7,203.
What is the Total Female Population of Key Biscayne?
Total Female Population of Key Biscayne is 7,369.
What is the Ratio of Males per 100 Females in Key Biscayne?
There are 97.75 Males per 100 Females in Key Biscayne.
What is the Ratio of Females per 100 Males in Key Biscayne?
There are 102.30 Females per 100 Males in Key Biscayne.
What is the Median Population Age in Key Biscayne?
Median Population Age in Key Biscayne is 42.3 Years.
What is the Average Family Size in Key Biscayne
Average Family Size in Key Biscayne is 3.5 People.
What is the Average Household Size in Key Biscayne
Average Household Size in Key Biscayne is 3.1 People.
How Large is the Labor Force in Key Biscayne?
There are 6,196 People in the Labor Forcein in Key Biscayne.
What is the Percentage of People in the Labor Force in Key Biscayne?
57.4% of People are in the Labor Force in Key Biscayne.
What is the Unemployment Rate in Key Biscayne?
Unemployment Rate in Key Biscayne is 4.1%.