Greenville, NH Map & Demographics
Greenville Map

Greenville Overview
$25,168
PER CAPITA INCOME
$85,000
AVG FAMILY INCOME
$67,321
AVG HOUSEHOLD INCOME
10.2%
WAGE / INCOME GAP [ % ]
89.8¢/ $1
WAGE / INCOME GAP [ $ ]
0.34
INEQUALITY / GINI INDEX
1,061
TOTAL POPULATION
621
MALE POPULATION
440
FEMALE POPULATION
141.14
MALES / 100 FEMALES
70.85
FEMALES / 100 MALES
33.8
MEDIAN AGE
3.7
AVG FAMILY SIZE
3.1
AVG HOUSEHOLD SIZE
530
LABOR FORCE [ PEOPLE ]
63.7%
PERCENT IN LABOR FORCE
12.1%
UNEMPLOYMENT RATE
Greenville Zip Codes
Greenville Area Codes
Income in Greenville
Income Overview in Greenville
Per Capita Income in Greenville is $25,168, while median incomes of families and households are $85,000 and $67,321 respectively.
| Characteristic | Number | Measure |
| Per Capita Income | 1,061 | $25,168 |
| Median Family Income | 250 | $85,000 |
| Mean Family Income | 250 | $76,858 |
| Median Household Income | 347 | $67,321 |
| Mean Household Income | 347 | $72,318 |
| Income Deficit | 250 | $0 |
| Wage / Income Gap (%) | 1,061 | 10.16% |
| Wage / Income Gap ($) | 1,061 | 89.84¢ per $1 |
| Gini / Inequality Index | 1,061 | 0.34 |
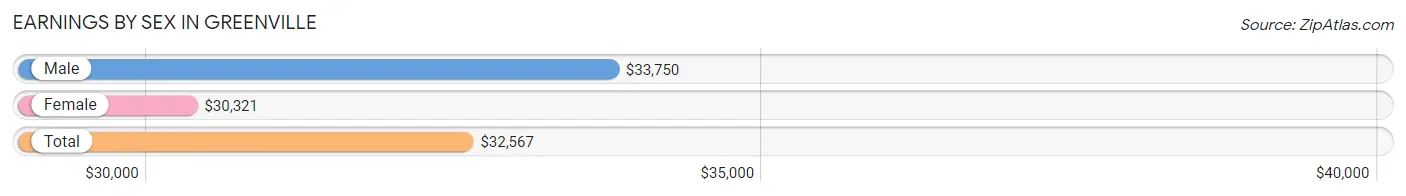
Earnings by Sex in Greenville
Average Earnings in Greenville are $32,567, $33,750 for men and $30,321 for women, a difference of 10.2%.
| Sex | Number | Average Earnings |
| Male | 348 (62.4%) | $33,750 |
| Female | 210 (37.6%) | $30,321 |
| Total | 558 (100.0%) | $32,567 |
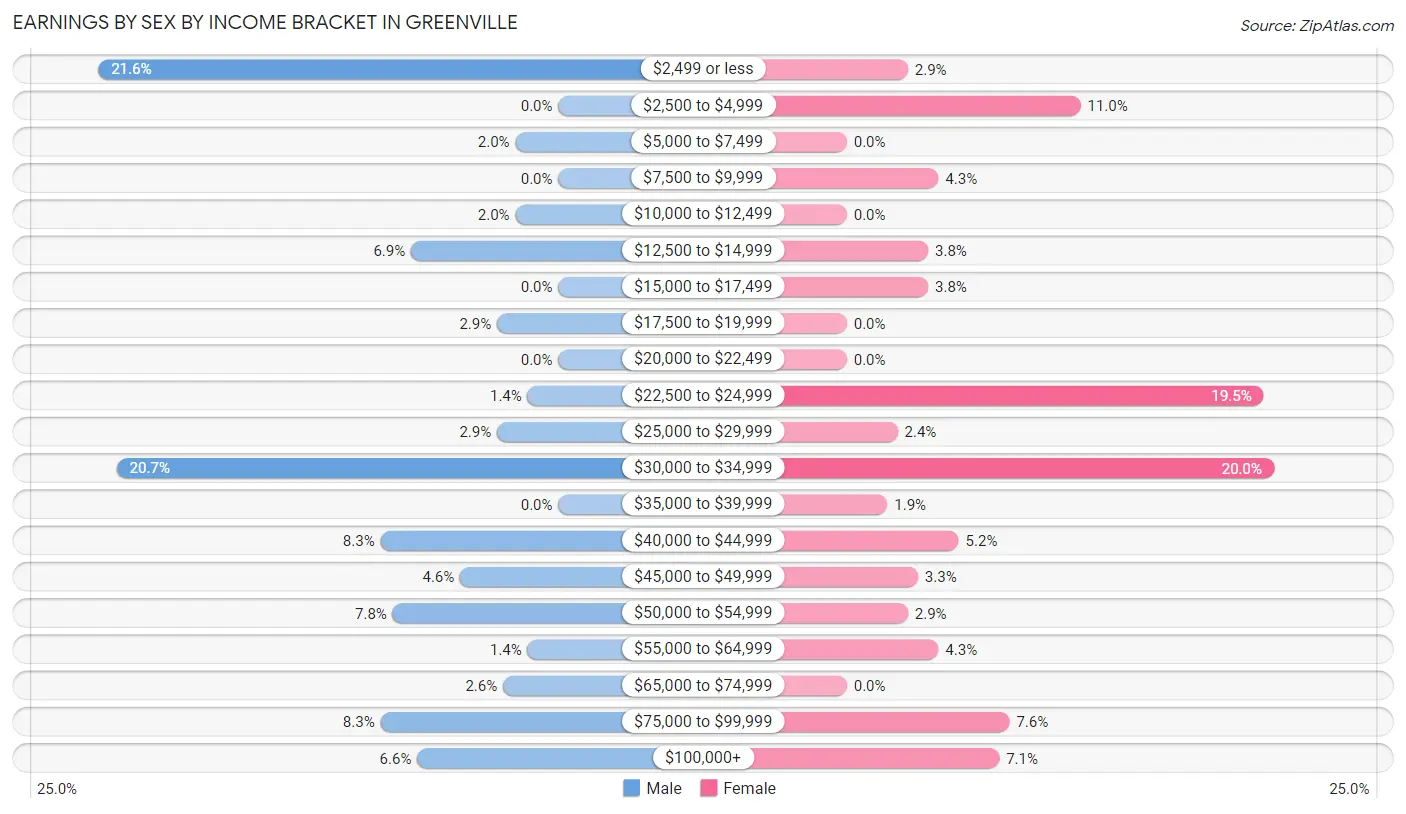
Earnings by Sex by Income Bracket in Greenville
The most common earnings brackets in Greenville are $2,499 or less for men (75 | 21.5%) and $30,000 to $34,999 for women (42 | 20.0%).
| Income | Male | Female |
| $2,499 or less | 75 (21.5%) | 6 (2.9%) |
| $2,500 to $4,999 | 0 (0.0%) | 23 (11.0%) |
| $5,000 to $7,499 | 7 (2.0%) | 0 (0.0%) |
| $7,500 to $9,999 | 0 (0.0%) | 9 (4.3%) |
| $10,000 to $12,499 | 7 (2.0%) | 0 (0.0%) |
| $12,500 to $14,999 | 24 (6.9%) | 8 (3.8%) |
| $15,000 to $17,499 | 0 (0.0%) | 8 (3.8%) |
| $17,500 to $19,999 | 10 (2.9%) | 0 (0.0%) |
| $20,000 to $22,499 | 0 (0.0%) | 0 (0.0%) |
| $22,500 to $24,999 | 5 (1.4%) | 41 (19.5%) |
| $25,000 to $29,999 | 10 (2.9%) | 5 (2.4%) |
| $30,000 to $34,999 | 72 (20.7%) | 42 (20.0%) |
| $35,000 to $39,999 | 0 (0.0%) | 4 (1.9%) |
| $40,000 to $44,999 | 29 (8.3%) | 11 (5.2%) |
| $45,000 to $49,999 | 16 (4.6%) | 7 (3.3%) |
| $50,000 to $54,999 | 27 (7.8%) | 6 (2.9%) |
| $55,000 to $64,999 | 5 (1.4%) | 9 (4.3%) |
| $65,000 to $74,999 | 9 (2.6%) | 0 (0.0%) |
| $75,000 to $99,999 | 29 (8.3%) | 16 (7.6%) |
| $100,000+ | 23 (6.6%) | 15 (7.1%) |
| Total | 348 (100.0%) | 210 (100.0%) |
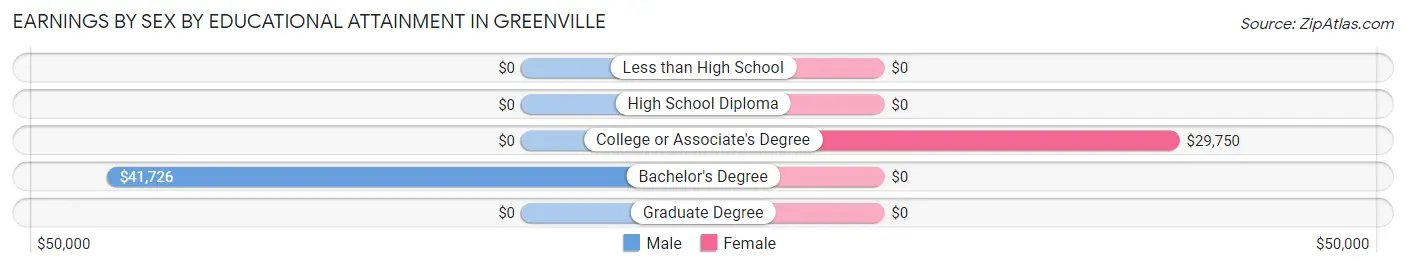
Earnings by Sex by Educational Attainment in Greenville
Average earnings in Greenville are $34,271 for men and $31,506 for women, a difference of 8.1%. Men with an educational attainment of bachelor's degree enjoy the highest average annual earnings of $41,726, while those with bachelor's degree education earn the least with $41,726. Women with an educational attainment of college or associate's degree earn the most with the average annual earnings of $29,750, while those with college or associate's degree education have the smallest earnings of $29,750.
| Educational Attainment | Male Income | Female Income |
| Less than High School | - | - |
| High School Diploma | - | - |
| College or Associate's Degree | - | - |
| Bachelor's Degree | $41,726 | $0 |
| Graduate Degree | - | - |
| Total | $34,271 | $31,506 |
Family Income in Greenville
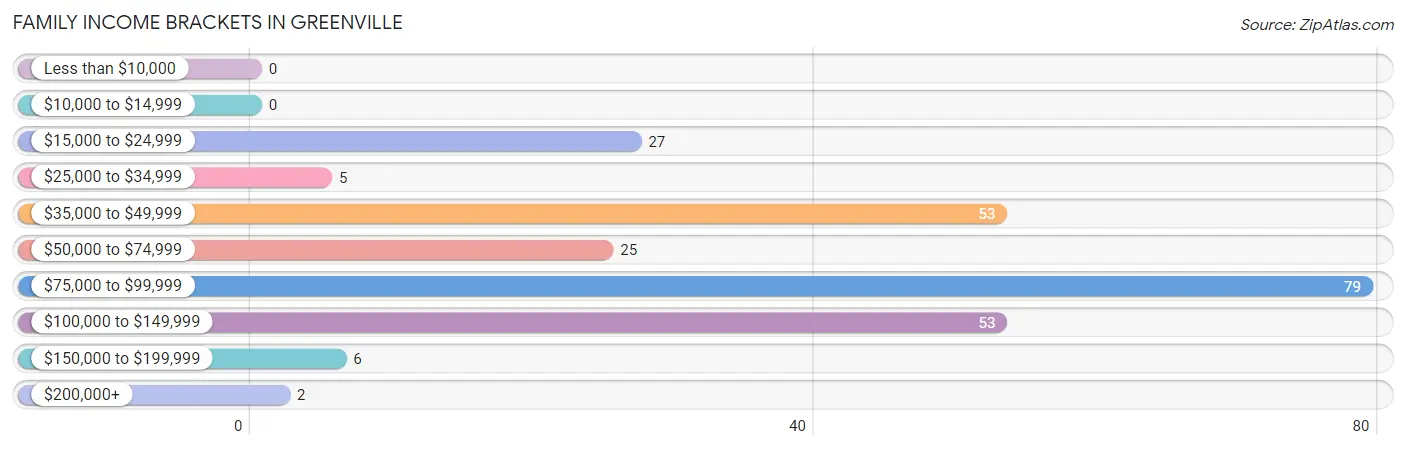
Family Income Brackets in Greenville
According to the Greenville family income data, there are 79 families falling into the $75,000 to $99,999 income range, which is the most common income bracket and makes up 31.6% of all families.
| Income Bracket | # Families | % Families |
| Less than $10,000 | 0 | 0.0% |
| $10,000 to $14,999 | 0 | 0.0% |
| $15,000 to $24,999 | 27 | 10.8% |
| $25,000 to $34,999 | 5 | 2.0% |
| $35,000 to $49,999 | 53 | 21.2% |
| $50,000 to $74,999 | 25 | 10.0% |
| $75,000 to $99,999 | 79 | 31.6% |
| $100,000 to $149,999 | 53 | 21.2% |
| $150,000 to $199,999 | 6 | 2.4% |
| $200,000+ | 2 | 0.8% |
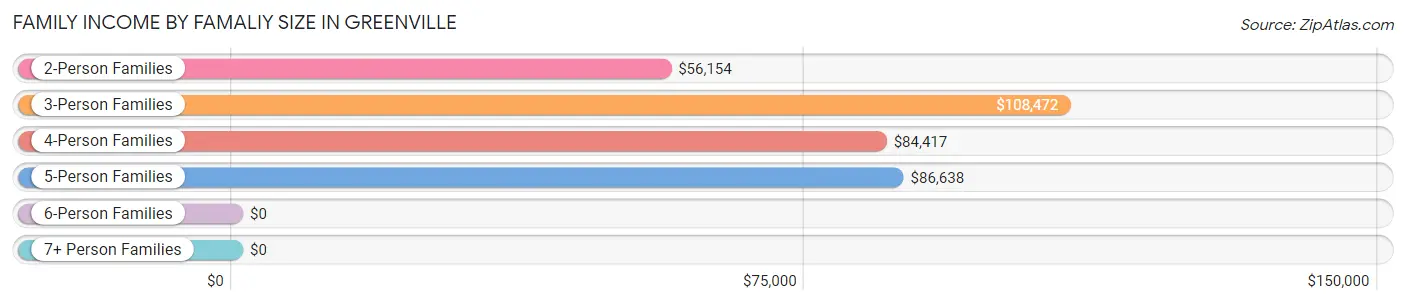
Family Income by Famaliy Size in Greenville
3-person families (53 | 21.2%) account for the highest median family income in Greenville with $108,472 per family, while 3-person families (53 | 21.2%) have the highest median income of $36,157 per family member.
| Income Bracket | # Families | Median Income |
| 2-Person Families | 94 (37.6%) | $56,154 |
| 3-Person Families | 53 (21.2%) | $108,472 |
| 4-Person Families | 23 (9.2%) | $84,417 |
| 5-Person Families | 80 (32.0%) | $86,638 |
| 6-Person Families | 0 (0.0%) | $0 |
| 7+ Person Families | 0 (0.0%) | $0 |
| Total | 250 (100.0%) | $85,000 |
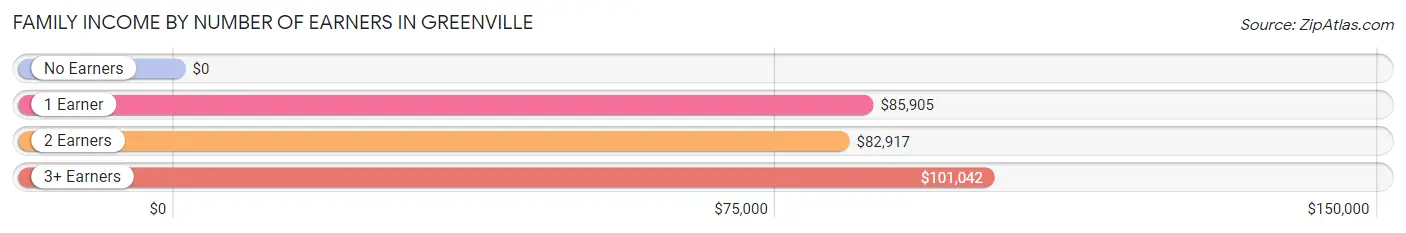
Family Income by Number of Earners in Greenville
| Number of Earners | # Families | Median Income |
| No Earners | 49 (19.6%) | $0 |
| 1 Earner | 87 (34.8%) | $85,905 |
| 2 Earners | 61 (24.4%) | $82,917 |
| 3+ Earners | 53 (21.2%) | $101,042 |
| Total | 250 (100.0%) | $85,000 |
Household Income in Greenville
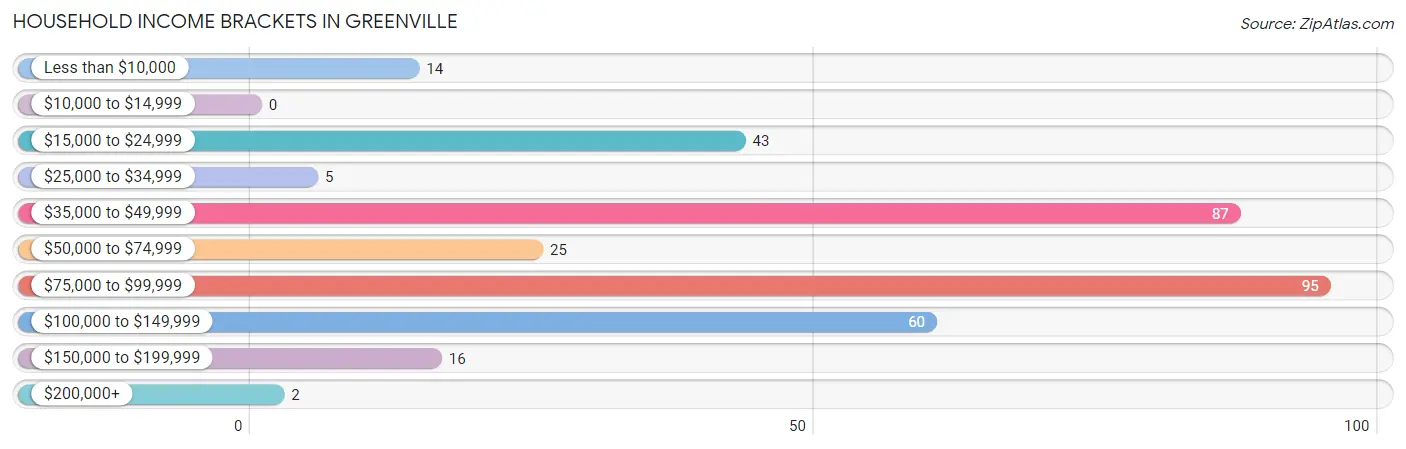
Household Income Brackets in Greenville
With 95 households falling in the category, the $75,000 to $99,999 income range is the most frequent in Greenville, accounting for 27.4% of all households.
| Income Bracket | # Households | % Households |
| Less than $10,000 | 14 | 4.0% |
| $10,000 to $14,999 | 0 | 0.0% |
| $15,000 to $24,999 | 43 | 12.4% |
| $25,000 to $34,999 | 5 | 1.4% |
| $35,000 to $49,999 | 87 | 25.1% |
| $50,000 to $74,999 | 25 | 7.2% |
| $75,000 to $99,999 | 95 | 27.4% |
| $100,000 to $149,999 | 60 | 17.3% |
| $150,000 to $199,999 | 16 | 4.6% |
| $200,000+ | 2 | 0.6% |
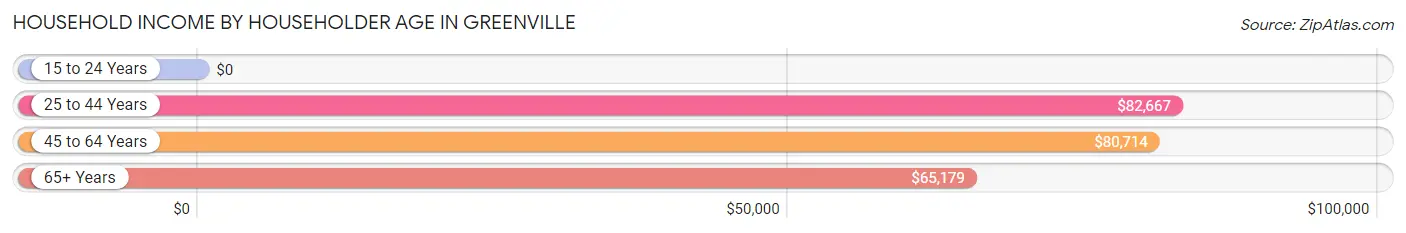
Household Income by Householder Age in Greenville
The median household income in Greenville is $67,321, with the highest median household income of $82,667 found in the 25 to 44 years age bracket for the primary householder. A total of 74 households (21.3%) fall into this category.
| Income Bracket | # Households | Median Income |
| 15 to 24 Years | 0 (0.0%) | $0 |
| 25 to 44 Years | 74 (21.3%) | $82,667 |
| 45 to 64 Years | 204 (58.8%) | $80,714 |
| 65+ Years | 69 (19.9%) | $65,179 |
| Total | 347 (100.0%) | $67,321 |
Poverty in Greenville
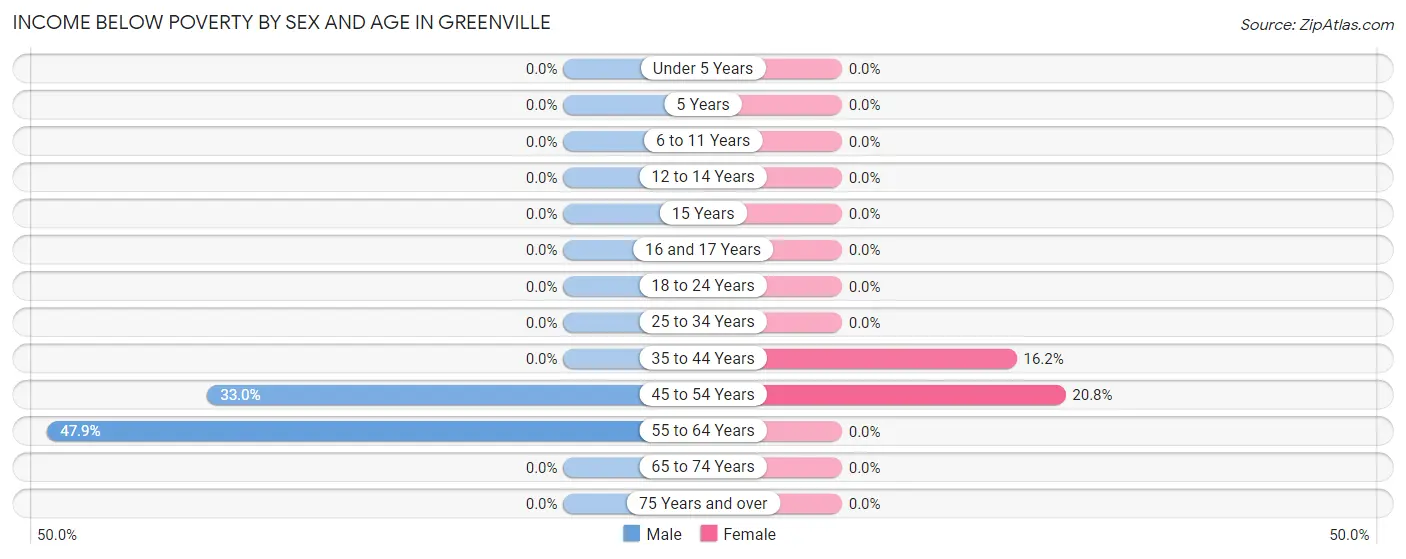
Income Below Poverty by Sex and Age in Greenville
With 11.6% poverty level for males and 6.4% for females among the residents of Greenville, 55 to 64 year old males and 45 to 54 year old females are the most vulnerable to poverty, with 34 males (47.9%) and 22 females (20.7%) in their respective age groups living below the poverty level.
| Age Bracket | Male | Female |
| Under 5 Years | 0 (0.0%) | 0 (0.0%) |
| 5 Years | 0 (0.0%) | 0 (0.0%) |
| 6 to 11 Years | 0 (0.0%) | 0 (0.0%) |
| 12 to 14 Years | 0 (0.0%) | 0 (0.0%) |
| 15 Years | 0 (0.0%) | 0 (0.0%) |
| 16 and 17 Years | 0 (0.0%) | 0 (0.0%) |
| 18 to 24 Years | 0 (0.0%) | 0 (0.0%) |
| 25 to 34 Years | 0 (0.0%) | 0 (0.0%) |
| 35 to 44 Years | 0 (0.0%) | 6 (16.2%) |
| 45 to 54 Years | 38 (33.0%) | 22 (20.7%) |
| 55 to 64 Years | 34 (47.9%) | 0 (0.0%) |
| 65 to 74 Years | 0 (0.0%) | 0 (0.0%) |
| 75 Years and over | 0 (0.0%) | 0 (0.0%) |
| Total | 72 (11.6%) | 28 (6.4%) |
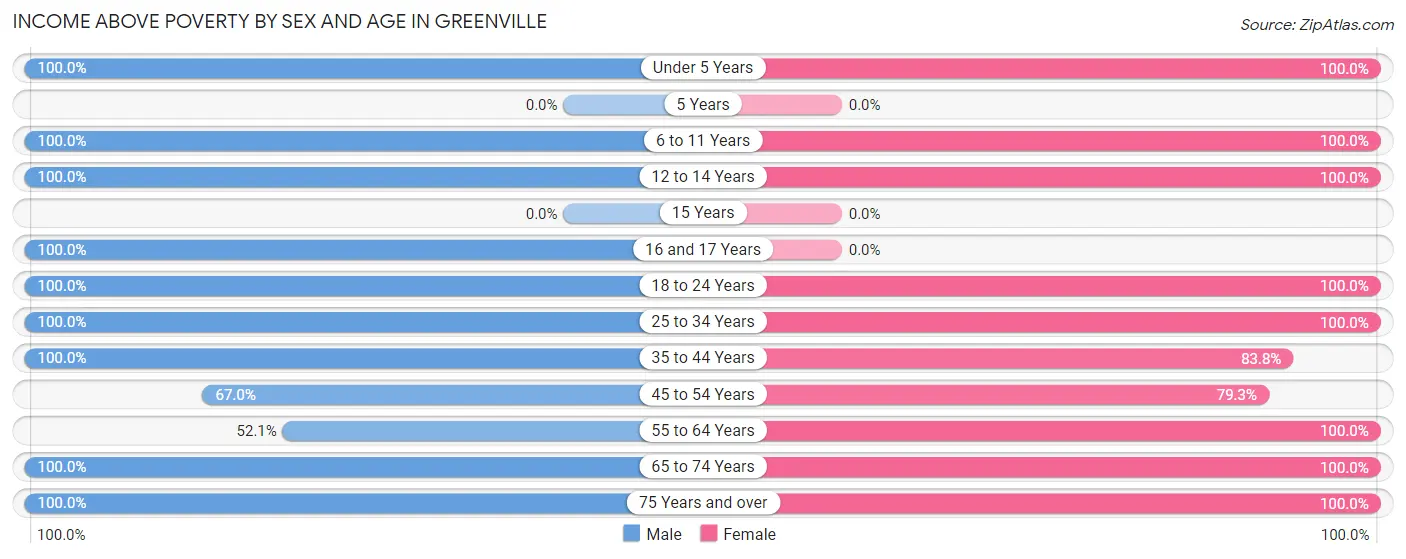
Income Above Poverty by Sex and Age in Greenville
According to the poverty statistics in Greenville, males aged under 5 years and females aged under 5 years are the age groups that are most secure financially, with 100.0% of males and 100.0% of females in these age groups living above the poverty line.
| Age Bracket | Male | Female |
| Under 5 Years | 47 (100.0%) | 45 (100.0%) |
| 5 Years | 0 (0.0%) | 0 (0.0%) |
| 6 to 11 Years | 53 (100.0%) | 30 (100.0%) |
| 12 to 14 Years | 48 (100.0%) | 6 (100.0%) |
| 15 Years | 0 (0.0%) | 0 (0.0%) |
| 16 and 17 Years | 19 (100.0%) | 0 (0.0%) |
| 18 to 24 Years | 74 (100.0%) | 37 (100.0%) |
| 25 to 34 Years | 125 (100.0%) | 64 (100.0%) |
| 35 to 44 Years | 9 (100.0%) | 31 (83.8%) |
| 45 to 54 Years | 77 (67.0%) | 84 (79.2%) |
| 55 to 64 Years | 37 (52.1%) | 44 (100.0%) |
| 65 to 74 Years | 48 (100.0%) | 47 (100.0%) |
| 75 Years and over | 12 (100.0%) | 24 (100.0%) |
| Total | 549 (88.4%) | 412 (93.6%) |
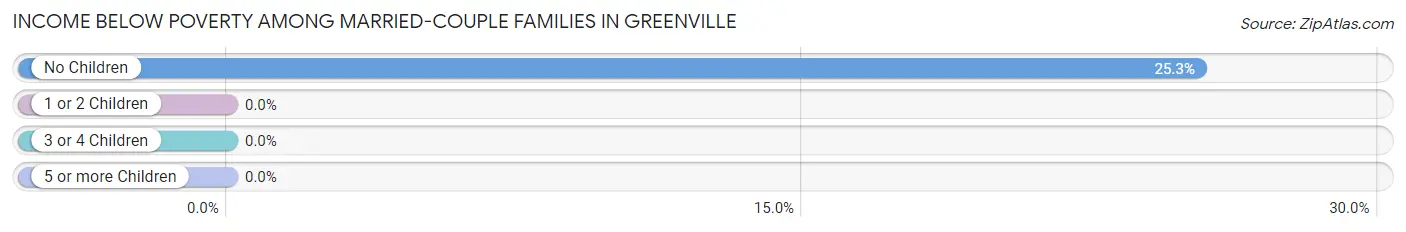
Income Below Poverty Among Married-Couple Families in Greenville
The poverty statistics for married-couple families in Greenville show that 10.9% or 22 of the total 202 families live below the poverty line. Families with no children have the highest poverty rate of 25.3%, comprising of 22 families. On the other hand, families with 1 or 2 children have the lowest poverty rate of 0.0%, which includes 0 families.
| Children | Above Poverty | Below Poverty |
| No Children | 65 (74.7%) | 22 (25.3%) |
| 1 or 2 Children | 65 (100.0%) | 0 (0.0%) |
| 3 or 4 Children | 50 (100.0%) | 0 (0.0%) |
| 5 or more Children | 0 (0.0%) | 0 (0.0%) |
| Total | 180 (89.1%) | 22 (10.9%) |
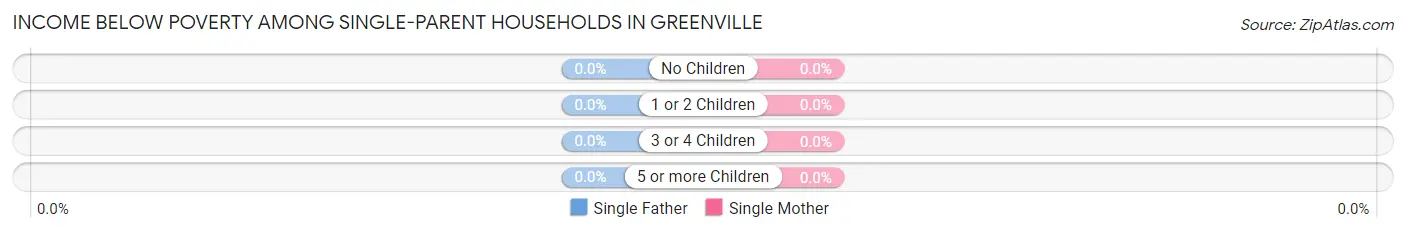
Income Below Poverty Among Single-Parent Households in Greenville
| Children | Single Father | Single Mother |
| No Children | 0 (0.0%) | 0 (0.0%) |
| 1 or 2 Children | 0 (0.0%) | 0 (0.0%) |
| 3 or 4 Children | 0 (0.0%) | 0 (0.0%) |
| 5 or more Children | 0 (0.0%) | 0 (0.0%) |
| Total | 0 (0.0%) | 0 (0.0%) |
Income Below Poverty Among Married-Couple vs Single-Parent Households in Greenville
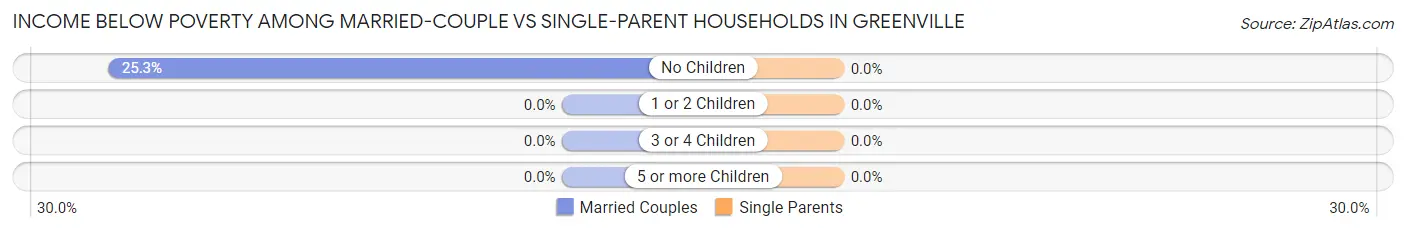
| Children | Married-Couple Families | Single-Parent Households |
| No Children | 22 (25.3%) | 0 (0.0%) |
| 1 or 2 Children | 0 (0.0%) | 0 (0.0%) |
| 3 or 4 Children | 0 (0.0%) | 0 (0.0%) |
| 5 or more Children | 0 (0.0%) | 0 (0.0%) |
| Total | 22 (10.9%) | 0 (0.0%) |
Race in Greenville
The most populous races in Greenville are White / Caucasian (868 | 81.8%), Black / African American (175 | 16.5%), and Hispanic or Latino (105 | 9.9%).
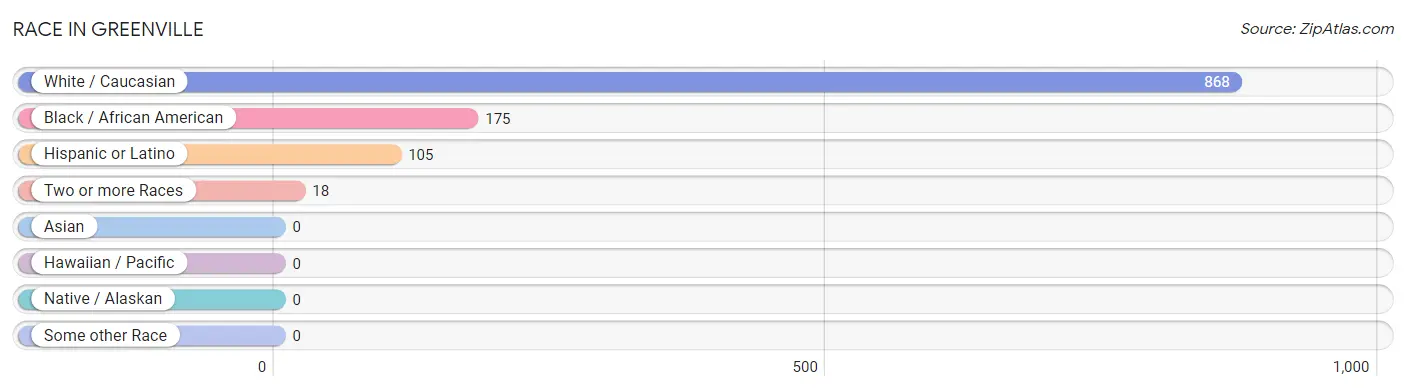
| Race | # Population | % Population |
| Asian | 0 | 0.0% |
| Black / African American | 175 | 16.5% |
| Hawaiian / Pacific | 0 | 0.0% |
| Hispanic or Latino | 105 | 9.9% |
| Native / Alaskan | 0 | 0.0% |
| White / Caucasian | 868 | 81.8% |
| Two or more Races | 18 | 1.7% |
| Some other Race | 0 | 0.0% |
| Total | 1,061 | 100.0% |
Ancestry in Greenville
The most populous ancestries reported in Greenville are French Canadian (281 | 26.5%), French (197 | 18.6%), Italian (170 | 16.0%), English (111 | 10.5%), and Irish (91 | 8.6%), together accounting for 80.1% of all Greenville residents.
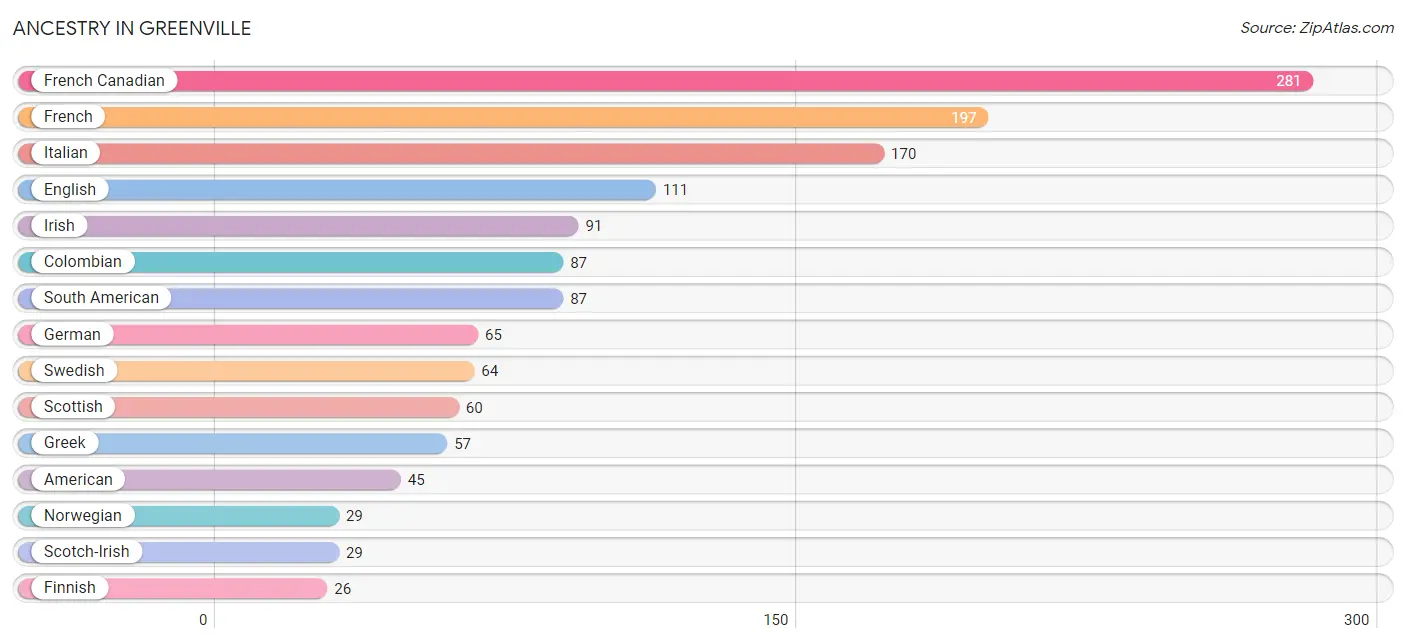
| Ancestry | # Population | % Population |
| American | 45 | 4.2% |
| Canadian | 8 | 0.7% |
| Colombian | 87 | 8.2% |
| Danish | 9 | 0.9% |
| Dutch | 6 | 0.6% |
| English | 111 | 10.5% |
| Finnish | 26 | 2.5% |
| French | 197 | 18.6% |
| French Canadian | 281 | 26.5% |
| German | 65 | 6.1% |
| Greek | 57 | 5.4% |
| Irish | 91 | 8.6% |
| Italian | 170 | 16.0% |
| Mexican | 11 | 1.0% |
| Norwegian | 29 | 2.7% |
| Polish | 8 | 0.7% |
| Romanian | 19 | 1.8% |
| Scotch-Irish | 29 | 2.7% |
| Scottish | 60 | 5.7% |
| South American | 87 | 8.2% |
| Spanish | 7 | 0.7% |
| Swedish | 64 | 6.0% | View All 22 Rows |
Immigrants in Greenville
The most numerous immigrant groups reported in Greenville came from Latin America (22 | 2.1%), Colombia (18 | 1.7%), South America (18 | 1.7%), Canada (5 | 0.5%), and Central America (4 | 0.4%), together accounting for 6.3% of all Greenville residents.
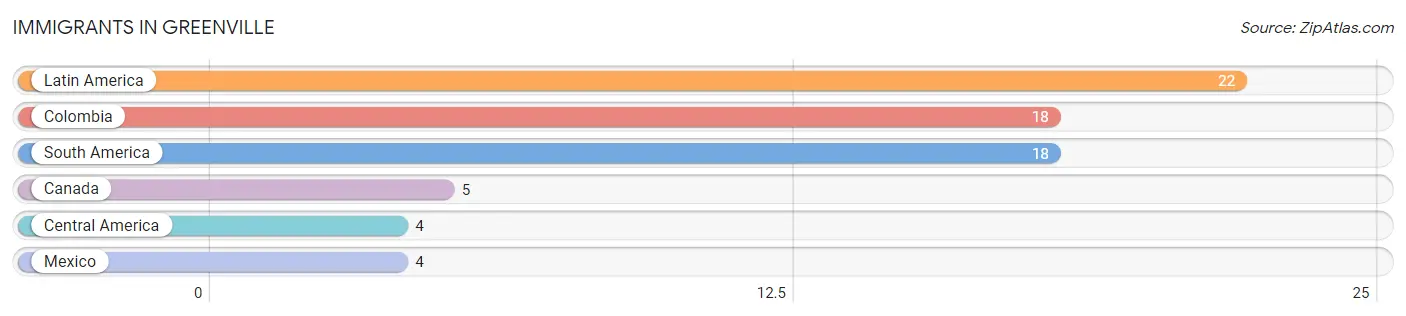
| Immigration Origin | # Population | % Population |
| Canada | 5 | 0.5% |
| Central America | 4 | 0.4% |
| Colombia | 18 | 1.7% |
| Latin America | 22 | 2.1% |
| Mexico | 4 | 0.4% |
| South America | 18 | 1.7% | View All 6 Rows |
Sex and Age in Greenville
Sex and Age in Greenville
The most populous age groups in Greenville are 25 to 29 Years (110 | 17.7%) for men and 45 to 49 Years (69 | 15.7%) for women.
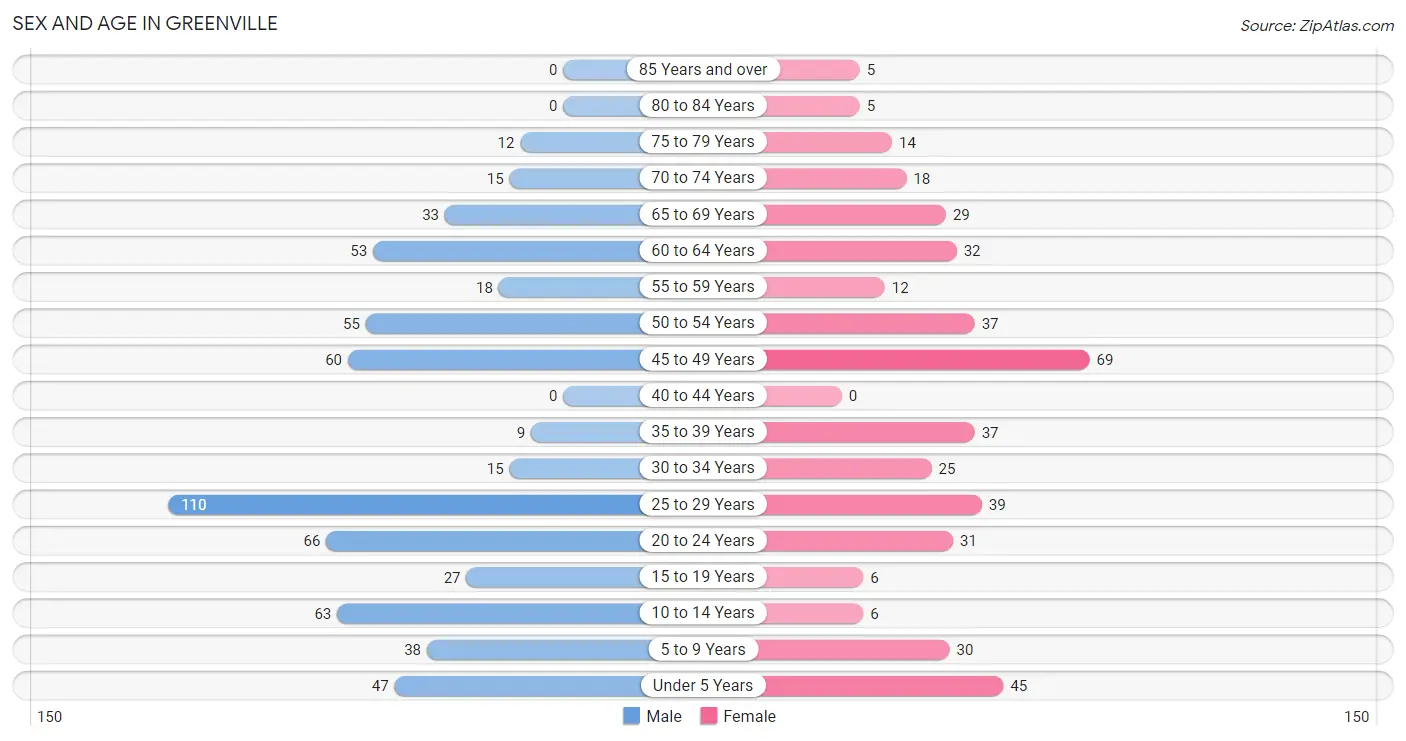
| Age Bracket | Male | Female |
| Under 5 Years | 47 (7.6%) | 45 (10.2%) |
| 5 to 9 Years | 38 (6.1%) | 30 (6.8%) |
| 10 to 14 Years | 63 (10.1%) | 6 (1.4%) |
| 15 to 19 Years | 27 (4.3%) | 6 (1.4%) |
| 20 to 24 Years | 66 (10.6%) | 31 (7.0%) |
| 25 to 29 Years | 110 (17.7%) | 39 (8.9%) |
| 30 to 34 Years | 15 (2.4%) | 25 (5.7%) |
| 35 to 39 Years | 9 (1.5%) | 37 (8.4%) |
| 40 to 44 Years | 0 (0.0%) | 0 (0.0%) |
| 45 to 49 Years | 60 (9.7%) | 69 (15.7%) |
| 50 to 54 Years | 55 (8.9%) | 37 (8.4%) |
| 55 to 59 Years | 18 (2.9%) | 12 (2.7%) |
| 60 to 64 Years | 53 (8.5%) | 32 (7.3%) |
| 65 to 69 Years | 33 (5.3%) | 29 (6.6%) |
| 70 to 74 Years | 15 (2.4%) | 18 (4.1%) |
| 75 to 79 Years | 12 (1.9%) | 14 (3.2%) |
| 80 to 84 Years | 0 (0.0%) | 5 (1.1%) |
| 85 Years and over | 0 (0.0%) | 5 (1.1%) |
| Total | 621 (100.0%) | 440 (100.0%) |
Families and Households in Greenville
Median Family Size in Greenville
The median family size in Greenville is 3.71 persons per family, with single female/mother families (37 | 14.8%) accounting for the largest median family size of 6.35 persons per family. On the other hand, single male/father families (11 | 4.4%) represent the smallest median family size with 2.09 persons per family.
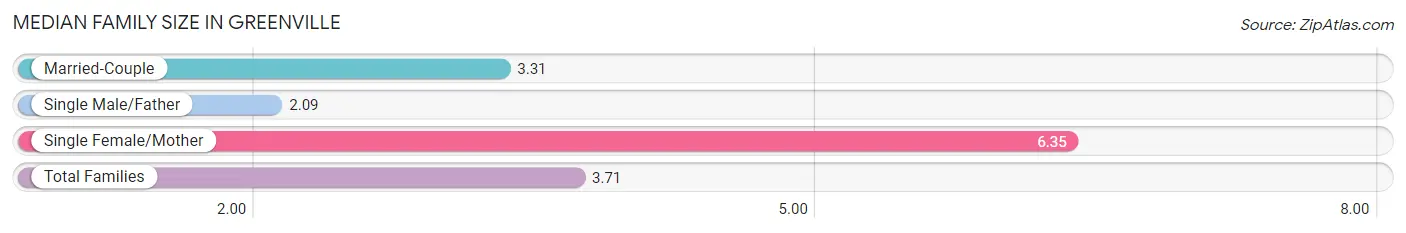
| Family Type | # Families | Family Size |
| Married-Couple | 202 (80.8%) | 3.31 |
| Single Male/Father | 11 (4.4%) | 2.09 |
| Single Female/Mother | 37 (14.8%) | 6.35 |
| Total Families | 250 (100.0%) | 3.71 |
Median Household Size in Greenville
The median household size in Greenville is 3.06 persons per household, with single female/mother households (37 | 10.7%) accounting for the largest median household size of 6.35 persons per household. non-family households (97 | 28.0%) represent the smallest median household size with 1.38 persons per household.
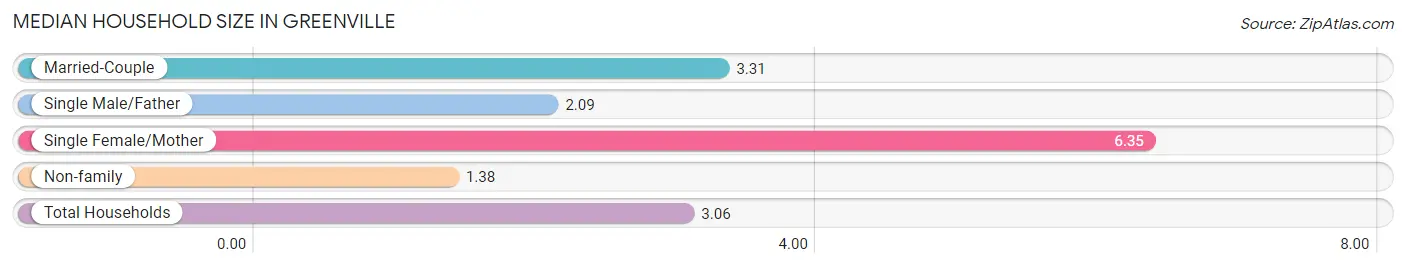
| Household Type | # Households | Household Size |
| Married-Couple | 202 (58.2%) | 3.31 |
| Single Male/Father | 11 (3.2%) | 2.09 |
| Single Female/Mother | 37 (10.7%) | 6.35 |
| Non-family | 97 (28.0%) | 1.38 |
| Total Households | 347 (100.0%) | 3.06 |
Household Size by Marriage Status in Greenville
Out of a total of 347 households in Greenville, 250 (72.1%) are family households, while 97 (28.0%) are nonfamily households. The most numerous type of family households are 2-person households, comprising 94, and the most common type of nonfamily households are 1-person households, comprising 59.
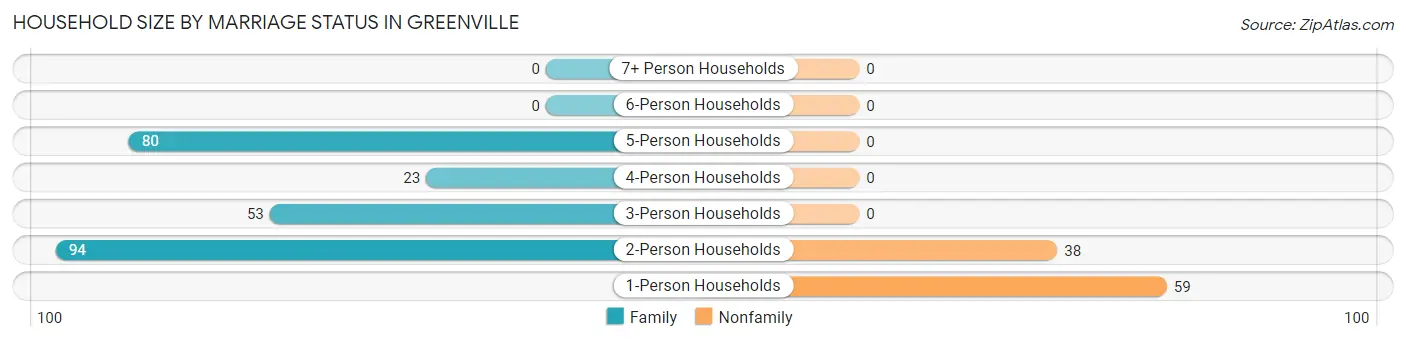
| Household Size | Family Households | Nonfamily Households |
| 1-Person Households | - | 59 (17.0%) |
| 2-Person Households | 94 (27.1%) | 38 (11.0%) |
| 3-Person Households | 53 (15.3%) | 0 (0.0%) |
| 4-Person Households | 23 (6.6%) | 0 (0.0%) |
| 5-Person Households | 80 (23.1%) | 0 (0.0%) |
| 6-Person Households | 0 (0.0%) | 0 (0.0%) |
| 7+ Person Households | 0 (0.0%) | 0 (0.0%) |
| Total | 250 (72.1%) | 97 (28.0%) |
Female Fertility in Greenville
Fertility by Age in Greenville
Average fertility rate in Greenville is 178.0 births per 1,000 women. Women in the age bracket of 20 to 34 years have the highest fertility rate with 400.0 births per 1,000 women. Women in the age bracket of 20 to 34 years acount for 100.0% of all women with births.
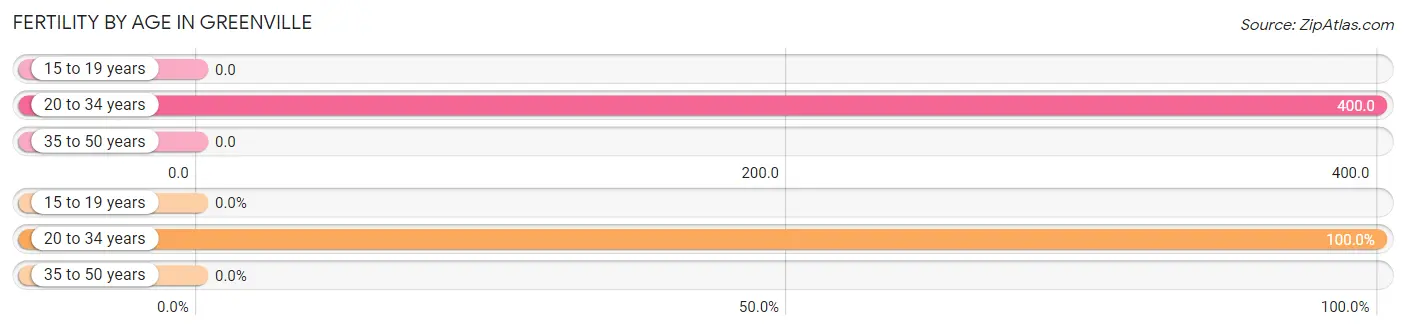
| Age Bracket | Women with Births | Births / 1,000 Women |
| 15 to 19 years | 0 (0.0%) | 0.0 |
| 20 to 34 years | 38 (100.0%) | 400.0 |
| 35 to 50 years | 0 (0.0%) | 0.0 |
| Total | 38 (100.0%) | 178.0 |
Fertility by Age by Marriage Status in Greenville
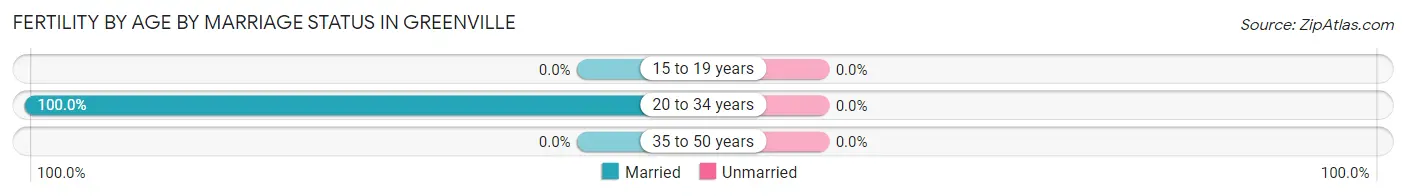
| Age Bracket | Married | Unmarried |
| 15 to 19 years | 0 (0.0%) | 0 (0.0%) |
| 20 to 34 years | 38 (100.0%) | 0 (0.0%) |
| 35 to 50 years | 0 (0.0%) | 0 (0.0%) |
| Total | 38 (100.0%) | 0 (0.0%) |
Fertility by Education in Greenville
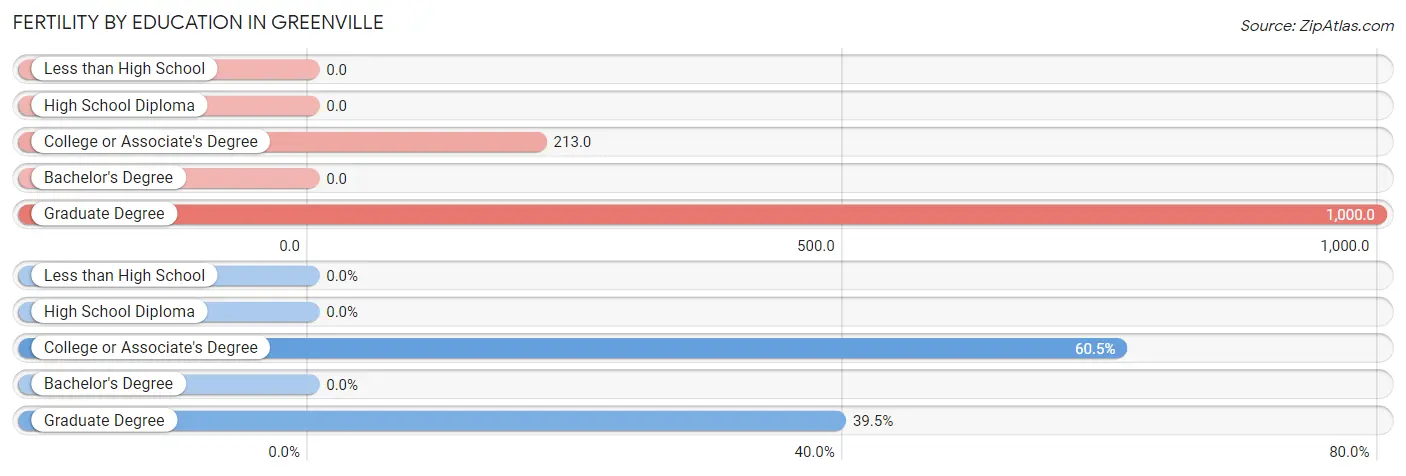
| Educational Attainment | Women with Births | Births / 1,000 Women |
| Less than High School | 0 (0.0%) | 0.0 |
| High School Diploma | 0 (0.0%) | 0.0 |
| College or Associate's Degree | 23 (60.5%) | 213.0 |
| Bachelor's Degree | 0 (0.0%) | 0.0 |
| Graduate Degree | 15 (39.5%) | 1,000.0 |
| Total | 38 (100.0%) | 178.0 |
Fertility by Education by Marriage Status in Greenville
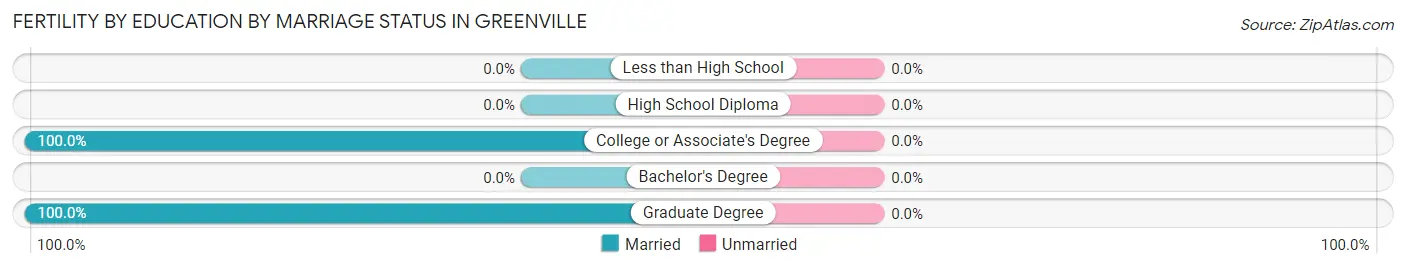
| Educational Attainment | Married | Unmarried |
| Less than High School | 0 (0.0%) | 0 (0.0%) |
| High School Diploma | 0 (0.0%) | 0 (0.0%) |
| College or Associate's Degree | 23 (100.0%) | 0 (0.0%) |
| Bachelor's Degree | 0 (0.0%) | 0 (0.0%) |
| Graduate Degree | 15 (100.0%) | 0 (0.0%) |
| Total | 38 (100.0%) | 0 (0.0%) |
Employment Characteristics in Greenville
Employment by Class of Employer in Greenville
Among the 466 employed individuals in Greenville, private company employees (415 | 89.1%), local government employees (44 | 9.4%), and state government employees (7 | 1.5%) make up the most common classes of employment.
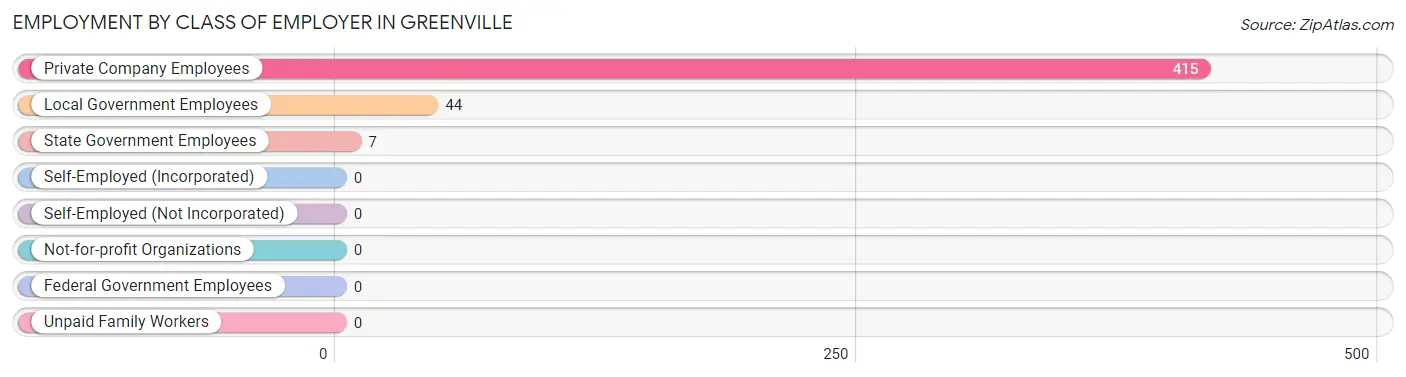
| Employer Class | # Employees | % Employees |
| Private Company Employees | 415 | 89.1% |
| Self-Employed (Incorporated) | 0 | 0.0% |
| Self-Employed (Not Incorporated) | 0 | 0.0% |
| Not-for-profit Organizations | 0 | 0.0% |
| Local Government Employees | 44 | 9.4% |
| State Government Employees | 7 | 1.5% |
| Federal Government Employees | 0 | 0.0% |
| Unpaid Family Workers | 0 | 0.0% |
| Total | 466 | 100.0% |
Employment Status by Age in Greenville
According to the labor force statistics for Greenville, out of the total population over 16 years of age (832), 63.7% or 530 individuals are in the labor force, with 12.1% or 64 of them unemployed. The age group with the highest labor force participation rate is 20 to 24 years, with 100.0% or 97 individuals in the labor force. Within the labor force, the 25 to 29 years age range has the highest percentage of unemployed individuals, with 50.8% or 64 of them being unemployed.
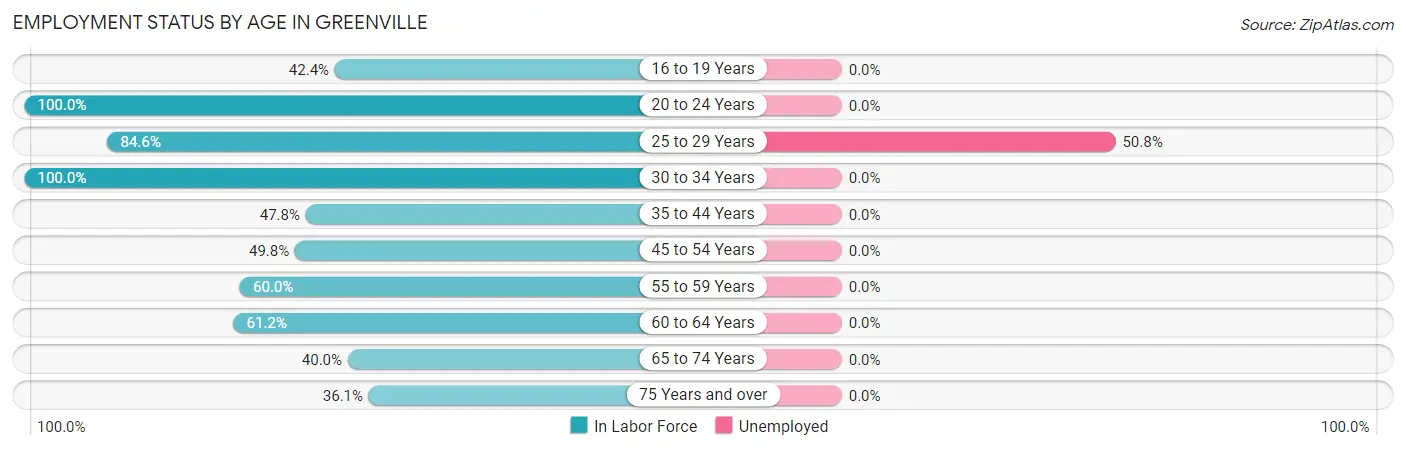
| Age Bracket | In Labor Force | Unemployed |
| 16 to 19 Years | 14 (42.4%) | 0 (0.0%) |
| 20 to 24 Years | 97 (100.0%) | 0 (0.0%) |
| 25 to 29 Years | 126 (84.6%) | 64 (50.8%) |
| 30 to 34 Years | 40 (100.0%) | 0 (0.0%) |
| 35 to 44 Years | 22 (47.8%) | 0 (0.0%) |
| 45 to 54 Years | 110 (49.8%) | 0 (0.0%) |
| 55 to 59 Years | 18 (60.0%) | 0 (0.0%) |
| 60 to 64 Years | 52 (61.2%) | 0 (0.0%) |
| 65 to 74 Years | 38 (40.0%) | 0 (0.0%) |
| 75 Years and over | 13 (36.1%) | 0 (0.0%) |
| Total | 530 (63.7%) | 64 (12.1%) |
Employment Status by Educational Attainment in Greenville
According to labor force statistics for Greenville, 64.4% of individuals (368) out of the total population between 25 and 64 years of age (571) are in the labor force, with 17.4% or 64 of them being unemployed. The group with the highest labor force participation rate are those with the educational attainment of college / associate degree, with 83.1% or 133 individuals in the labor force. Within the labor force, individuals with high school diploma education have the highest percentage of unemployment, with 47.8% or 64 of them being unemployed.
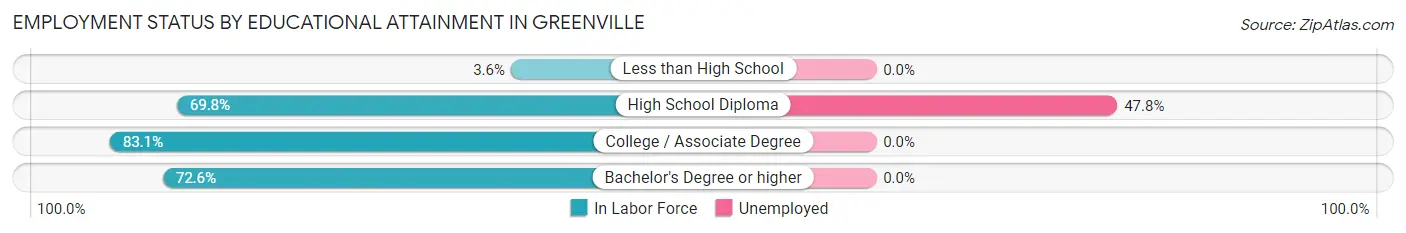
| Educational Attainment | In Labor Force | Unemployed |
| Less than High School | 3 (3.6%) | 0 (0.0%) |
| High School Diploma | 134 (69.8%) | 92 (47.8%) |
| College / Associate Degree | 133 (83.1%) | 0 (0.0%) |
| Bachelor's Degree or higher | 98 (72.6%) | 0 (0.0%) |
| Total | 368 (64.4%) | 99 (17.4%) |
Employment Occupations by Sex in Greenville
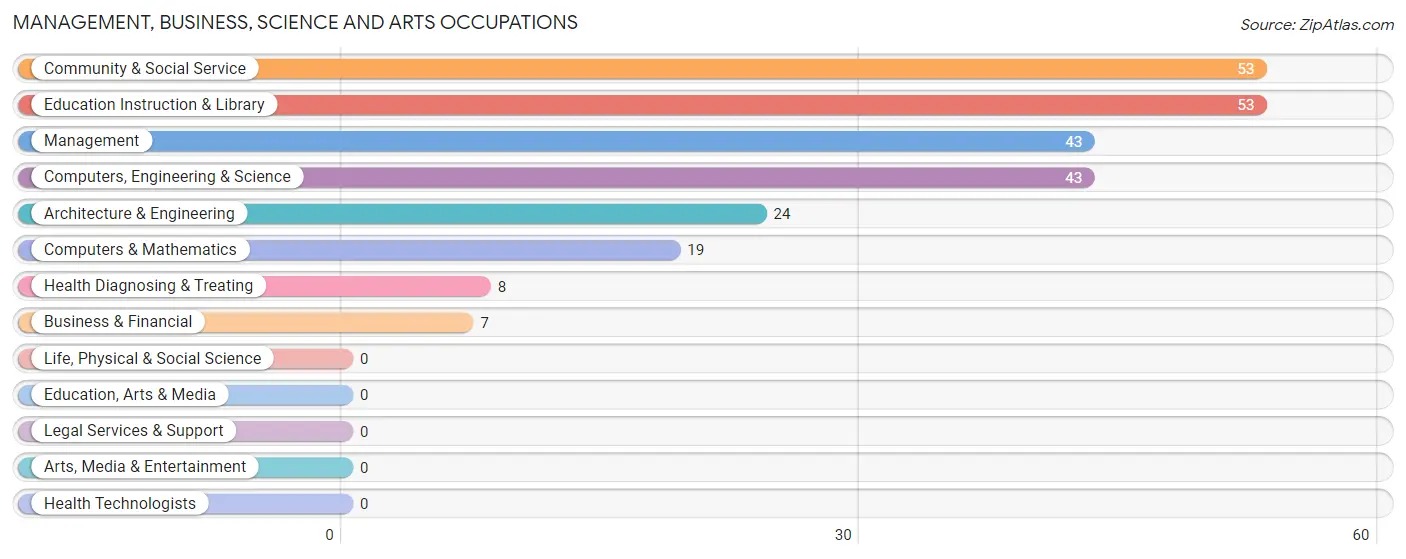
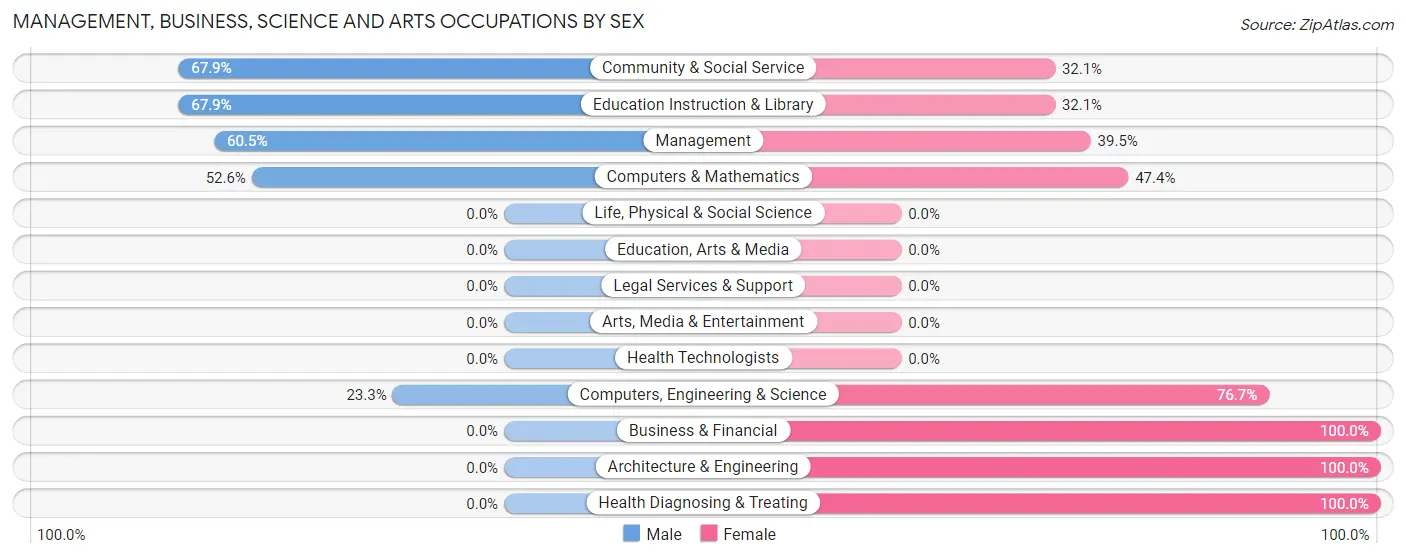
Management, Business, Science and Arts Occupations
The most common Management, Business, Science and Arts occupations in Greenville are Community & Social Service (53 | 11.4%), Education Instruction & Library (53 | 11.4%), Management (43 | 9.2%), Computers, Engineering & Science (43 | 9.2%), and Architecture & Engineering (24 | 5.1%).
Management, Business, Science and Arts Occupations by Sex
Within the Management, Business, Science and Arts occupations in Greenville, the most male-oriented occupations are Community & Social Service (67.9%), Education Instruction & Library (67.9%), and Management (60.5%), while the most female-oriented occupations are Business & Financial (100.0%), Architecture & Engineering (100.0%), and Health Diagnosing & Treating (100.0%).
| Occupation | Male | Female |
| Management | 26 (60.5%) | 17 (39.5%) |
| Business & Financial | 0 (0.0%) | 7 (100.0%) |
| Computers, Engineering & Science | 10 (23.3%) | 33 (76.7%) |
| Computers & Mathematics | 10 (52.6%) | 9 (47.4%) |
| Architecture & Engineering | 0 (0.0%) | 24 (100.0%) |
| Life, Physical & Social Science | 0 (0.0%) | 0 (0.0%) |
| Community & Social Service | 36 (67.9%) | 17 (32.1%) |
| Education, Arts & Media | 0 (0.0%) | 0 (0.0%) |
| Legal Services & Support | 0 (0.0%) | 0 (0.0%) |
| Education Instruction & Library | 36 (67.9%) | 17 (32.1%) |
| Arts, Media & Entertainment | 0 (0.0%) | 0 (0.0%) |
| Health Diagnosing & Treating | 0 (0.0%) | 8 (100.0%) |
| Health Technologists | 0 (0.0%) | 0 (0.0%) |
| Total (Category) | 72 (46.8%) | 82 (53.2%) |
| Total (Overall) | 279 (59.9%) | 187 (40.1%) |
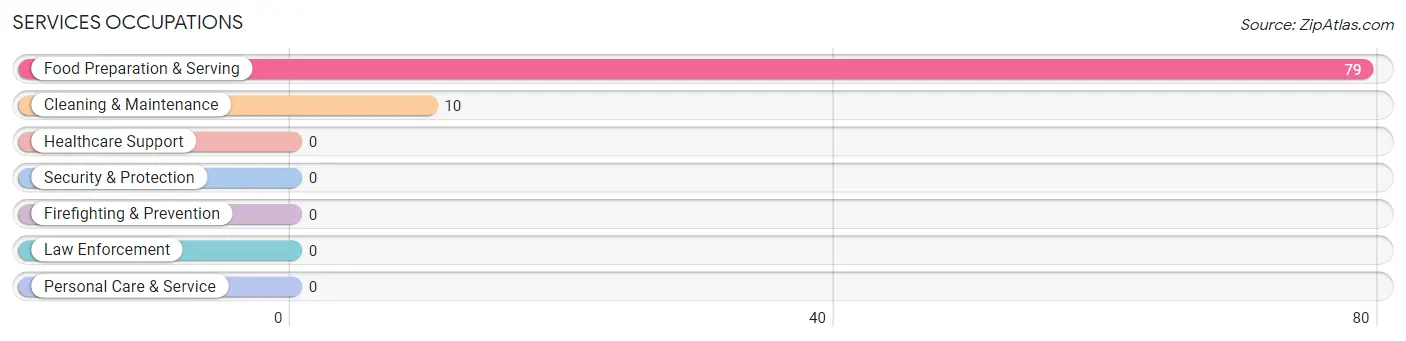
Services Occupations
The most common Services occupations in Greenville are Food Preparation & Serving (79 | 17.0%), and Cleaning & Maintenance (10 | 2.1%).
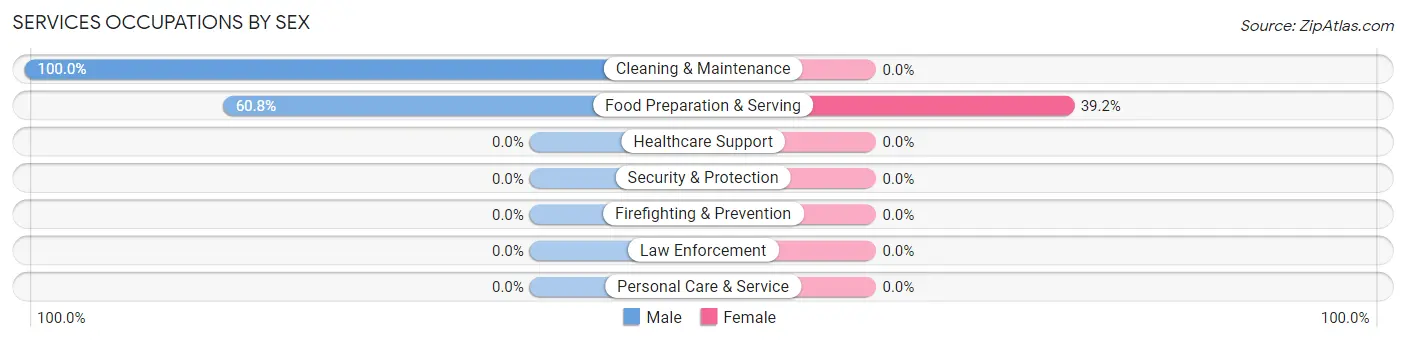
Services Occupations by Sex
| Occupation | Male | Female |
| Healthcare Support | 0 (0.0%) | 0 (0.0%) |
| Security & Protection | 0 (0.0%) | 0 (0.0%) |
| Firefighting & Prevention | 0 (0.0%) | 0 (0.0%) |
| Law Enforcement | 0 (0.0%) | 0 (0.0%) |
| Food Preparation & Serving | 48 (60.8%) | 31 (39.2%) |
| Cleaning & Maintenance | 10 (100.0%) | 0 (0.0%) |
| Personal Care & Service | 0 (0.0%) | 0 (0.0%) |
| Total (Category) | 58 (65.2%) | 31 (34.8%) |
| Total (Overall) | 279 (59.9%) | 187 (40.1%) |
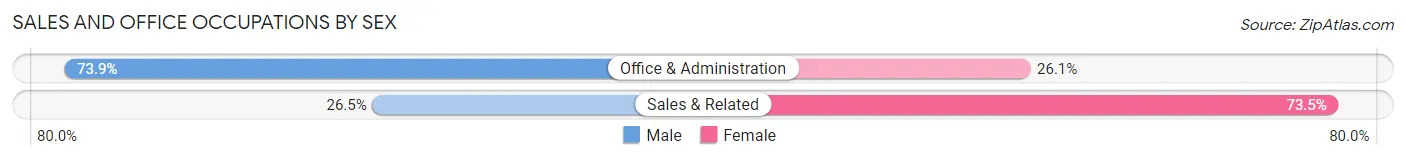
Sales and Office Occupations
The most common Sales and Office occupations in Greenville are Sales & Related (68 | 14.6%), and Office & Administration (23 | 4.9%).

Sales and Office Occupations by Sex
| Occupation | Male | Female |
| Sales & Related | 18 (26.5%) | 50 (73.5%) |
| Office & Administration | 17 (73.9%) | 6 (26.1%) |
| Total (Category) | 35 (38.5%) | 56 (61.5%) |
| Total (Overall) | 279 (59.9%) | 187 (40.1%) |
Natural Resources, Construction and Maintenance Occupations
The most common Natural Resources, Construction and Maintenance occupations in Greenville are Construction & Extraction (61 | 13.1%), and Installation, Maintenance & Repair (6 | 1.3%).

Natural Resources, Construction and Maintenance Occupations by Sex
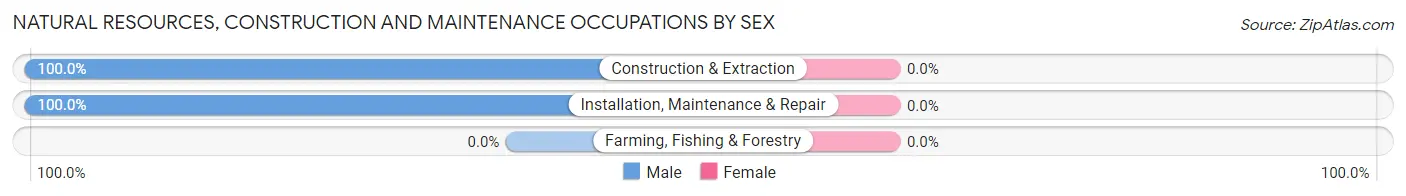
| Occupation | Male | Female |
| Farming, Fishing & Forestry | 0 (0.0%) | 0 (0.0%) |
| Construction & Extraction | 61 (100.0%) | 0 (0.0%) |
| Installation, Maintenance & Repair | 6 (100.0%) | 0 (0.0%) |
| Total (Category) | 67 (100.0%) | 0 (0.0%) |
| Total (Overall) | 279 (59.9%) | 187 (40.1%) |
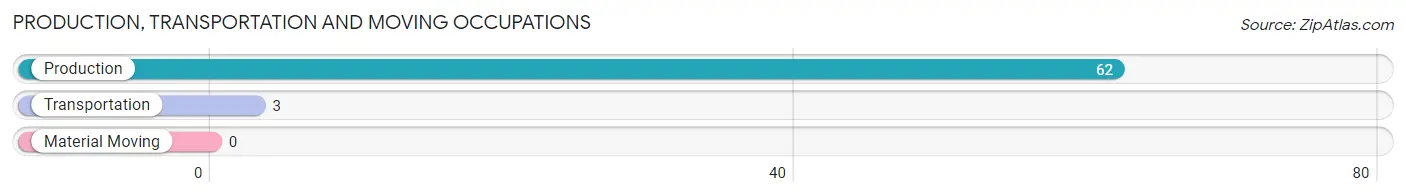
Production, Transportation and Moving Occupations
The most common Production, Transportation and Moving occupations in Greenville are Production (62 | 13.3%), and Transportation (3 | 0.6%).
Production, Transportation and Moving Occupations by Sex
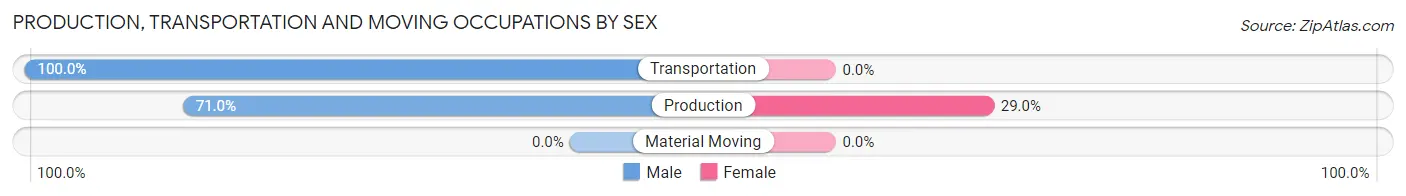
| Occupation | Male | Female |
| Production | 44 (71.0%) | 18 (29.0%) |
| Transportation | 3 (100.0%) | 0 (0.0%) |
| Material Moving | 0 (0.0%) | 0 (0.0%) |
| Total (Category) | 47 (72.3%) | 18 (27.7%) |
| Total (Overall) | 279 (59.9%) | 187 (40.1%) |
Employment Industries by Sex in Greenville
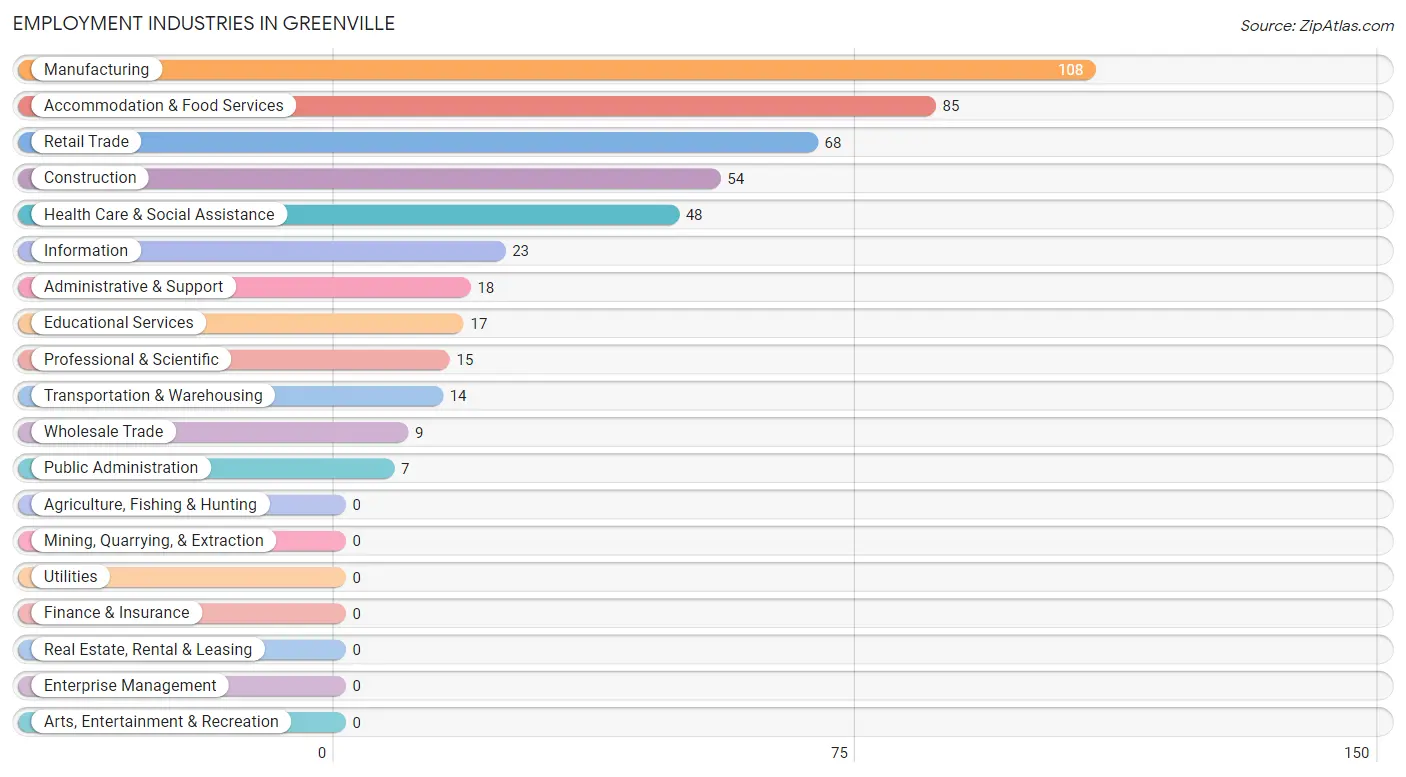
Employment Industries in Greenville
The major employment industries in Greenville include Manufacturing (108 | 23.2%), Accommodation & Food Services (85 | 18.2%), Retail Trade (68 | 14.6%), Construction (54 | 11.6%), and Health Care & Social Assistance (48 | 10.3%).
Employment Industries by Sex in Greenville
The Greenville industries that see more men than women are Construction (100.0%), Transportation & Warehousing (100.0%), and Professional & Scientific (100.0%), whereas the industries that tend to have a higher number of women are Wholesale Trade (100.0%), Information (100.0%), and Retail Trade (64.7%).
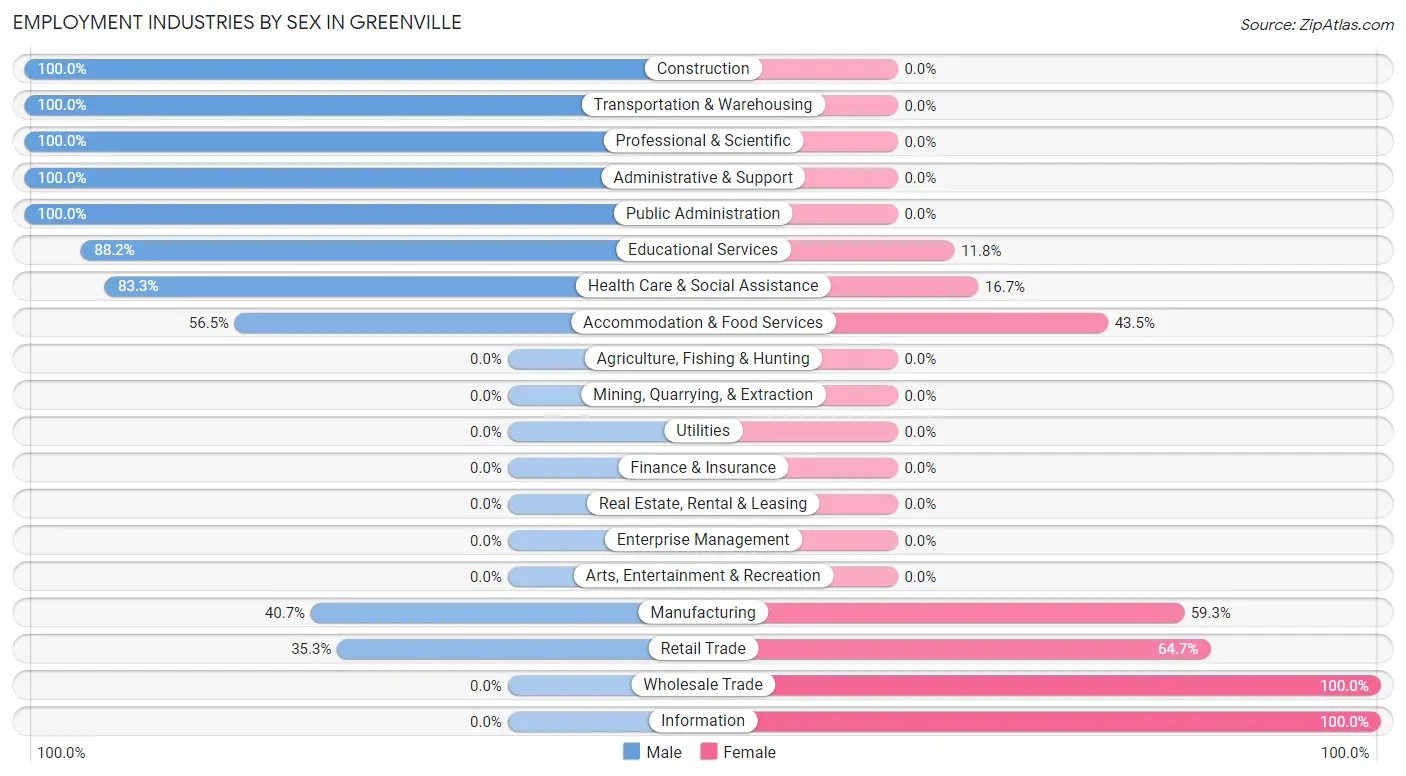
| Industry | Male | Female |
| Agriculture, Fishing & Hunting | 0 (0.0%) | 0 (0.0%) |
| Mining, Quarrying, & Extraction | 0 (0.0%) | 0 (0.0%) |
| Construction | 54 (100.0%) | 0 (0.0%) |
| Manufacturing | 44 (40.7%) | 64 (59.3%) |
| Wholesale Trade | 0 (0.0%) | 9 (100.0%) |
| Retail Trade | 24 (35.3%) | 44 (64.7%) |
| Transportation & Warehousing | 14 (100.0%) | 0 (0.0%) |
| Utilities | 0 (0.0%) | 0 (0.0%) |
| Information | 0 (0.0%) | 23 (100.0%) |
| Finance & Insurance | 0 (0.0%) | 0 (0.0%) |
| Real Estate, Rental & Leasing | 0 (0.0%) | 0 (0.0%) |
| Professional & Scientific | 15 (100.0%) | 0 (0.0%) |
| Enterprise Management | 0 (0.0%) | 0 (0.0%) |
| Administrative & Support | 18 (100.0%) | 0 (0.0%) |
| Educational Services | 15 (88.2%) | 2 (11.8%) |
| Health Care & Social Assistance | 40 (83.3%) | 8 (16.7%) |
| Arts, Entertainment & Recreation | 0 (0.0%) | 0 (0.0%) |
| Accommodation & Food Services | 48 (56.5%) | 37 (43.5%) |
| Public Administration | 7 (100.0%) | 0 (0.0%) |
| Total | 279 (59.9%) | 187 (40.1%) |
Education in Greenville
School Enrollment in Greenville
The most common levels of schooling among the 248 students in Greenville are elementary school (68 | 27.4%), middle school (52 | 21.0%), and graduate / professional (49 | 19.8%).
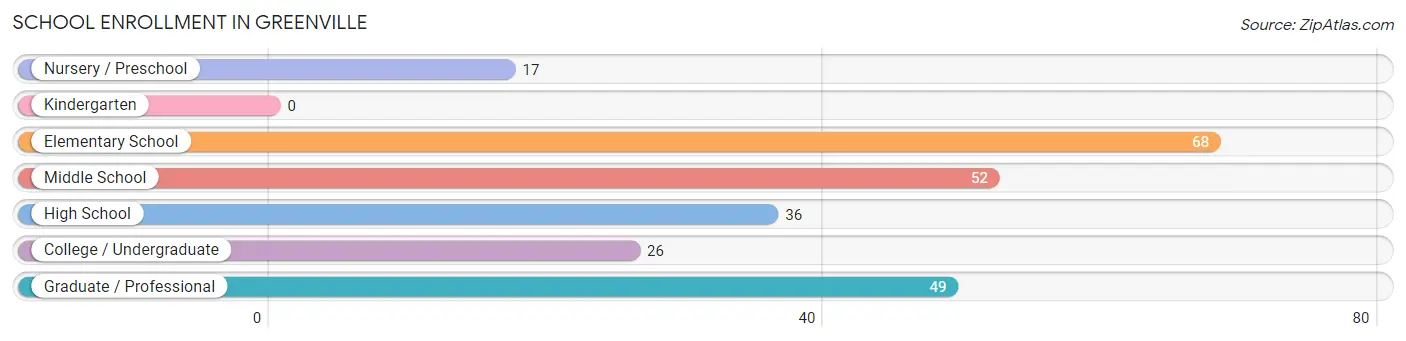
| School Level | # Students | % Students |
| Nursery / Preschool | 17 | 6.9% |
| Kindergarten | 0 | 0.0% |
| Elementary School | 68 | 27.4% |
| Middle School | 52 | 21.0% |
| High School | 36 | 14.5% |
| College / Undergraduate | 26 | 10.5% |
| Graduate / Professional | 49 | 19.8% |
| Total | 248 | 100.0% |
School Enrollment by Age by Funding Source in Greenville
Out of a total of 248 students who are enrolled in schools in Greenville, 9 (3.6%) attend a private institution, while the remaining 239 (96.4%) are enrolled in public schools. The age group of 25 to 34 year olds has the highest likelihood of being enrolled in private schools, with 9 (39.1% in the age bracket) enrolled. Conversely, the age group of 3 to 4 year olds has the lowest likelihood of being enrolled in a private school, with 17 (100.0% in the age bracket) attending a public institution.
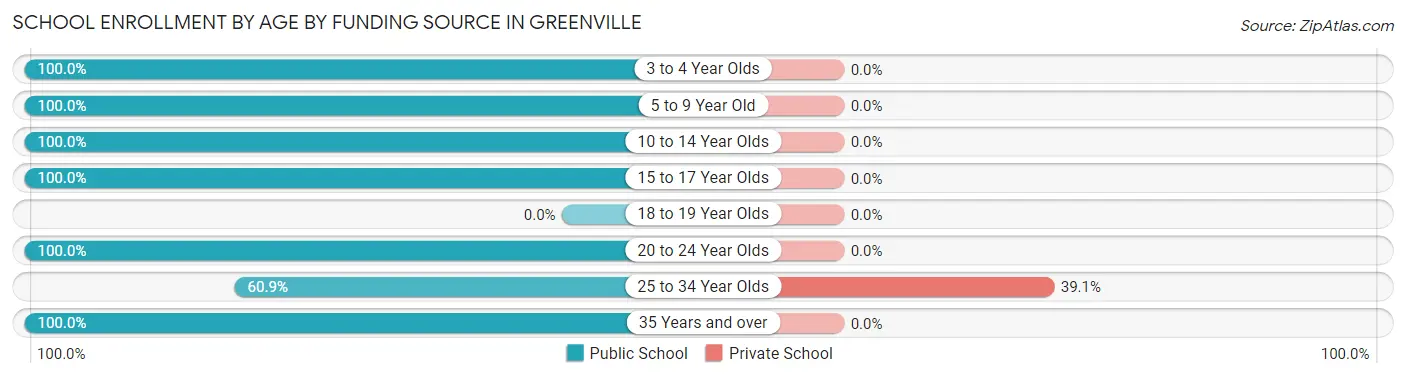
| Age Bracket | Public School | Private School |
| 3 to 4 Year Olds | 17 (100.0%) | 0 (0.0%) |
| 5 to 9 Year Old | 68 (100.0%) | 0 (0.0%) |
| 10 to 14 Year Olds | 69 (100.0%) | 0 (0.0%) |
| 15 to 17 Year Olds | 19 (100.0%) | 0 (0.0%) |
| 18 to 19 Year Olds | 0 (0.0%) | 0 (0.0%) |
| 20 to 24 Year Olds | 31 (100.0%) | 0 (0.0%) |
| 25 to 34 Year Olds | 14 (60.9%) | 9 (39.1%) |
| 35 Years and over | 21 (100.0%) | 0 (0.0%) |
| Total | 239 (96.4%) | 9 (3.6%) |
Educational Attainment by Field of Study in Greenville
Computers & mathematics (31 | 21.5%), liberal arts & history (31 | 21.5%), psychology (28 | 19.4%), business (21 | 14.6%), and education (18 | 12.5%) are the most common fields of study among 144 individuals in Greenville who have obtained a bachelor's degree or higher.
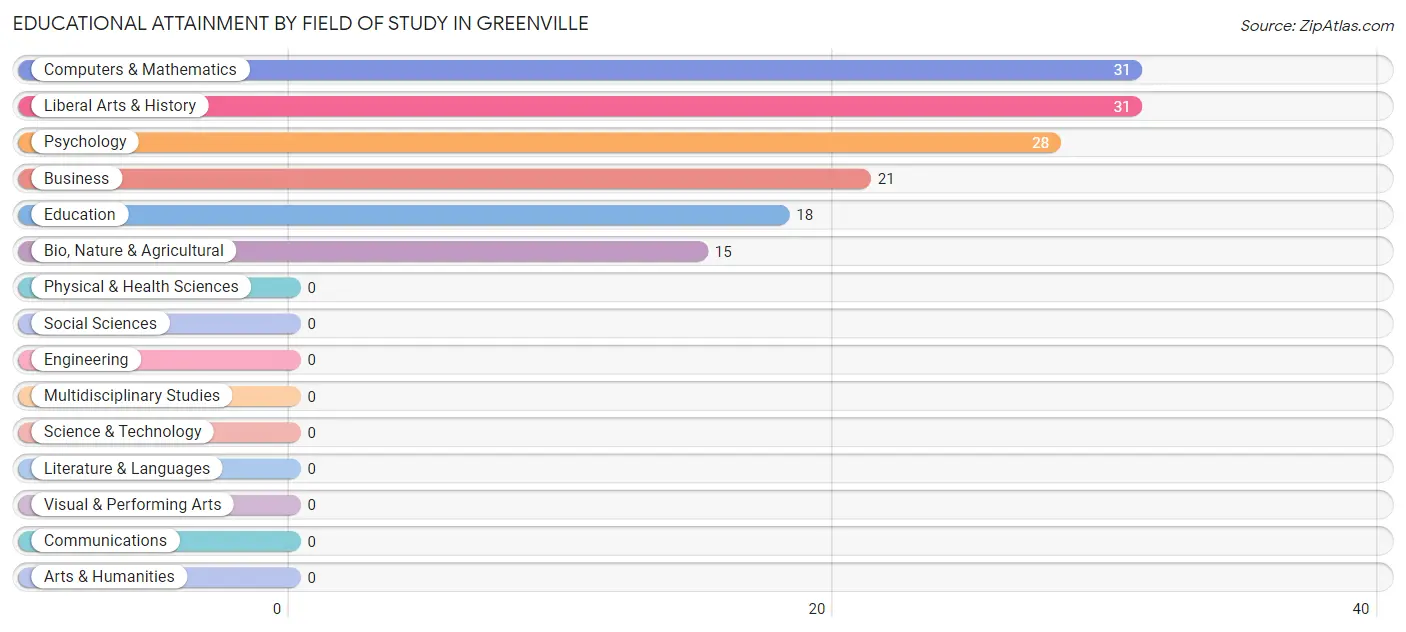
| Field of Study | # Graduates | % Graduates |
| Computers & Mathematics | 31 | 21.5% |
| Bio, Nature & Agricultural | 15 | 10.4% |
| Physical & Health Sciences | 0 | 0.0% |
| Psychology | 28 | 19.4% |
| Social Sciences | 0 | 0.0% |
| Engineering | 0 | 0.0% |
| Multidisciplinary Studies | 0 | 0.0% |
| Science & Technology | 0 | 0.0% |
| Business | 21 | 14.6% |
| Education | 18 | 12.5% |
| Literature & Languages | 0 | 0.0% |
| Liberal Arts & History | 31 | 21.5% |
| Visual & Performing Arts | 0 | 0.0% |
| Communications | 0 | 0.0% |
| Arts & Humanities | 0 | 0.0% |
| Total | 144 | 100.0% |
Transportation & Commute in Greenville
Vehicle Availability by Sex in Greenville
The most prevalent vehicle ownership categories in Greenville are males with 2 vehicles (169, accounting for 60.6%) and females with 2 vehicles (118, making up 90.4%).
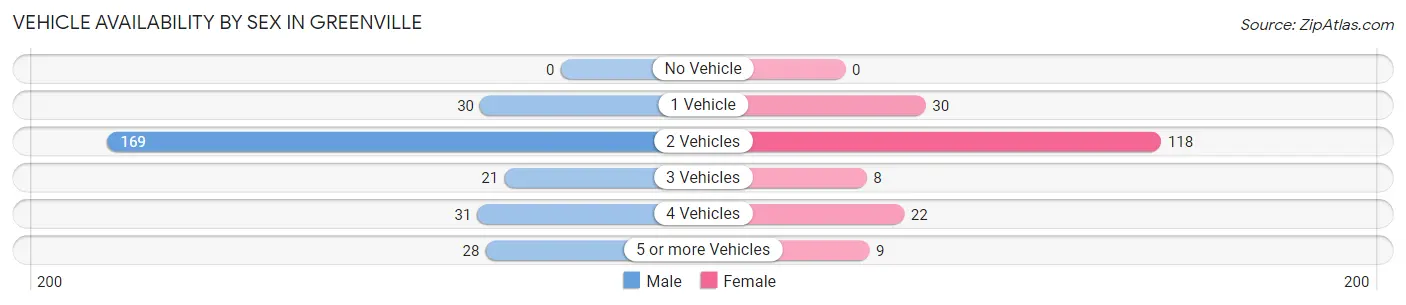
| Vehicles Available | Male | Female |
| No Vehicle | 0 (0.0%) | 0 (0.0%) |
| 1 Vehicle | 30 (10.7%) | 30 (16.0%) |
| 2 Vehicles | 169 (60.6%) | 118 (63.1%) |
| 3 Vehicles | 21 (7.5%) | 8 (4.3%) |
| 4 Vehicles | 31 (11.1%) | 22 (11.8%) |
| 5 or more Vehicles | 28 (10.0%) | 9 (4.8%) |
| Total | 279 (100.0%) | 187 (100.0%) |
Commute Time in Greenville
The most frequently occuring commute durations in Greenville are 40 to 44 minutes (94 commuters, 22.1%), 5 to 9 minutes (91 commuters, 21.4%), and 15 to 19 minutes (62 commuters, 14.6%).
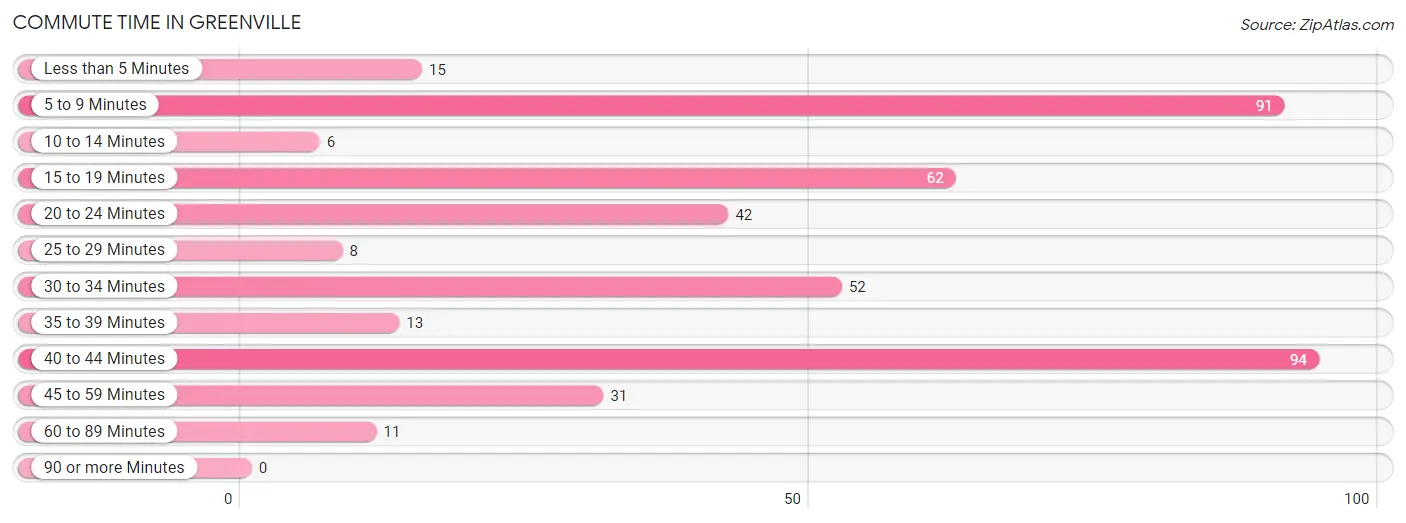
| Commute Time | # Commuters | % Commuters |
| Less than 5 Minutes | 15 | 3.5% |
| 5 to 9 Minutes | 91 | 21.4% |
| 10 to 14 Minutes | 6 | 1.4% |
| 15 to 19 Minutes | 62 | 14.6% |
| 20 to 24 Minutes | 42 | 9.9% |
| 25 to 29 Minutes | 8 | 1.9% |
| 30 to 34 Minutes | 52 | 12.2% |
| 35 to 39 Minutes | 13 | 3.1% |
| 40 to 44 Minutes | 94 | 22.1% |
| 45 to 59 Minutes | 31 | 7.3% |
| 60 to 89 Minutes | 11 | 2.6% |
| 90 or more Minutes | 0 | 0.0% |
Commute Time by Sex in Greenville
The most common commute times in Greenville are 40 to 44 minutes (87 commuters, 33.0%) for males and 15 to 19 minutes (44 commuters, 27.3%) for females.
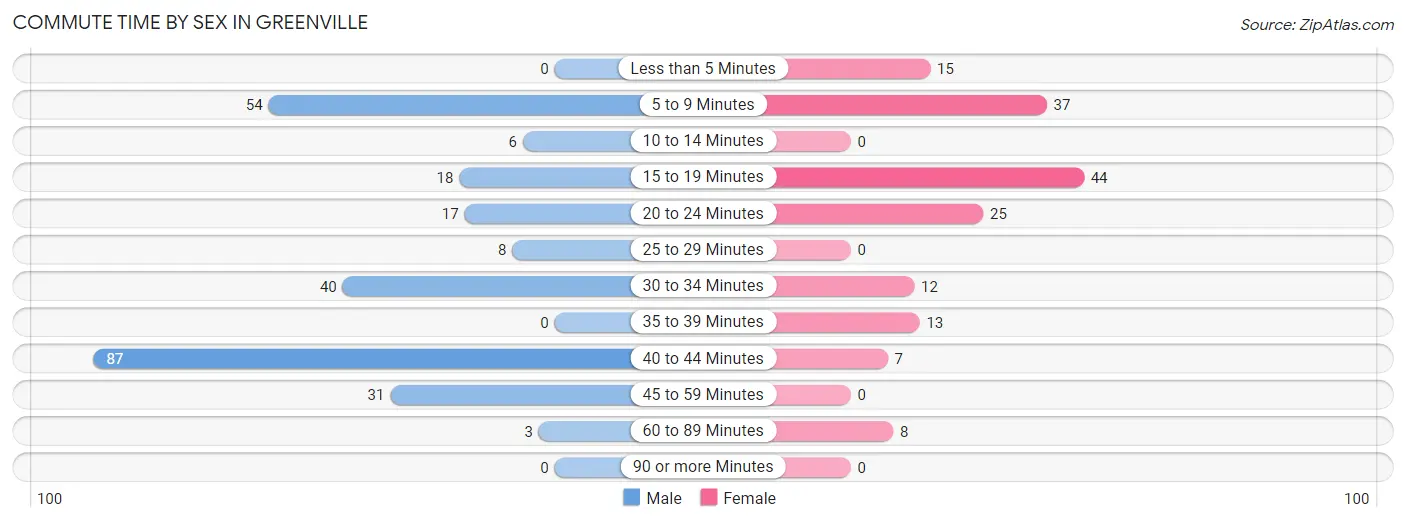
| Commute Time | Male | Female |
| Less than 5 Minutes | 0 (0.0%) | 15 (9.3%) |
| 5 to 9 Minutes | 54 (20.4%) | 37 (23.0%) |
| 10 to 14 Minutes | 6 (2.3%) | 0 (0.0%) |
| 15 to 19 Minutes | 18 (6.8%) | 44 (27.3%) |
| 20 to 24 Minutes | 17 (6.4%) | 25 (15.5%) |
| 25 to 29 Minutes | 8 (3.0%) | 0 (0.0%) |
| 30 to 34 Minutes | 40 (15.1%) | 12 (7.4%) |
| 35 to 39 Minutes | 0 (0.0%) | 13 (8.1%) |
| 40 to 44 Minutes | 87 (33.0%) | 7 (4.3%) |
| 45 to 59 Minutes | 31 (11.7%) | 0 (0.0%) |
| 60 to 89 Minutes | 3 (1.1%) | 8 (5.0%) |
| 90 or more Minutes | 0 (0.0%) | 0 (0.0%) |
Time of Departure to Work by Sex in Greenville
The most frequent times of departure to work in Greenville are 8:30 AM to 8:59 AM (54, 20.4%) for males and 9:00 AM to 9:59 AM (37, 23.0%) for females.
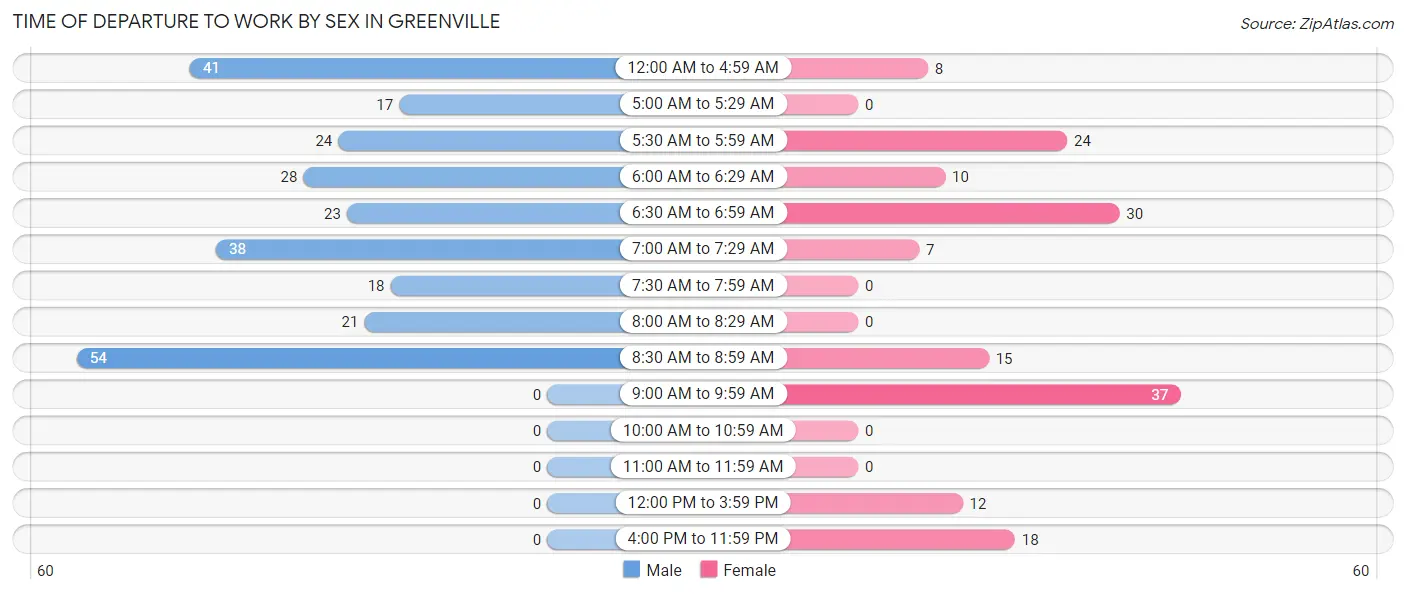
| Time of Departure | Male | Female |
| 12:00 AM to 4:59 AM | 41 (15.5%) | 8 (5.0%) |
| 5:00 AM to 5:29 AM | 17 (6.4%) | 0 (0.0%) |
| 5:30 AM to 5:59 AM | 24 (9.1%) | 24 (14.9%) |
| 6:00 AM to 6:29 AM | 28 (10.6%) | 10 (6.2%) |
| 6:30 AM to 6:59 AM | 23 (8.7%) | 30 (18.6%) |
| 7:00 AM to 7:29 AM | 38 (14.4%) | 7 (4.3%) |
| 7:30 AM to 7:59 AM | 18 (6.8%) | 0 (0.0%) |
| 8:00 AM to 8:29 AM | 21 (8.0%) | 0 (0.0%) |
| 8:30 AM to 8:59 AM | 54 (20.4%) | 15 (9.3%) |
| 9:00 AM to 9:59 AM | 0 (0.0%) | 37 (23.0%) |
| 10:00 AM to 10:59 AM | 0 (0.0%) | 0 (0.0%) |
| 11:00 AM to 11:59 AM | 0 (0.0%) | 0 (0.0%) |
| 12:00 PM to 3:59 PM | 0 (0.0%) | 12 (7.4%) |
| 4:00 PM to 11:59 PM | 0 (0.0%) | 18 (11.2%) |
| Total | 264 (100.0%) | 161 (100.0%) |
Housing Occupancy in Greenville
Occupancy by Ownership in Greenville
Of the total 347 dwellings in Greenville, owner-occupied units account for 179 (51.6%), while renter-occupied units make up 168 (48.4%).
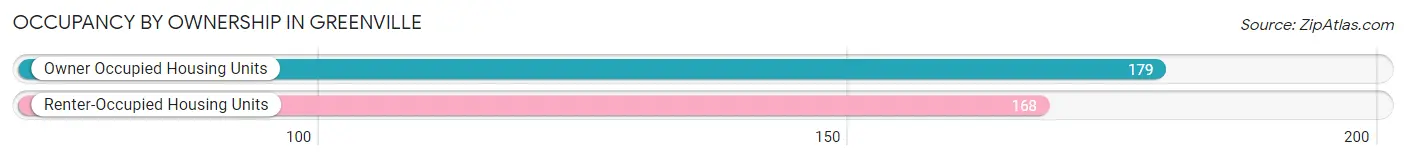
| Occupancy | # Housing Units | % Housing Units |
| Owner Occupied Housing Units | 179 | 51.6% |
| Renter-Occupied Housing Units | 168 | 48.4% |
| Total Occupied Housing Units | 347 | 100.0% |
Occupancy by Household Size in Greenville
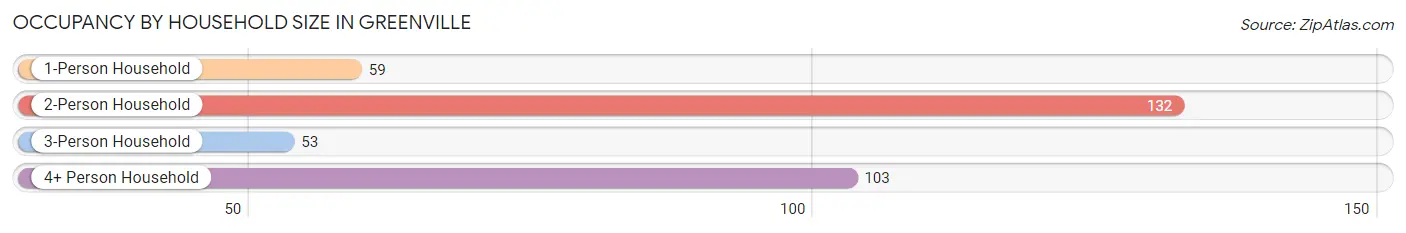
| Household Size | # Housing Units | % Housing Units |
| 1-Person Household | 59 | 17.0% |
| 2-Person Household | 132 | 38.0% |
| 3-Person Household | 53 | 15.3% |
| 4+ Person Household | 103 | 29.7% |
| Total Housing Units | 347 | 100.0% |
Occupancy by Ownership by Household Size in Greenville
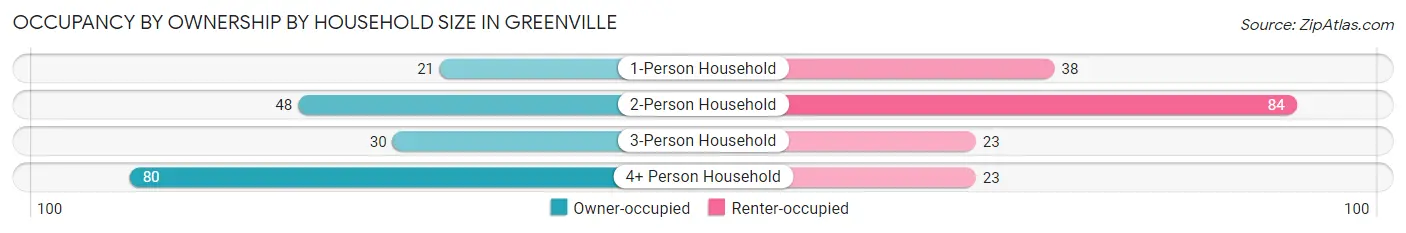
| Household Size | Owner-occupied | Renter-occupied |
| 1-Person Household | 21 (35.6%) | 38 (64.4%) |
| 2-Person Household | 48 (36.4%) | 84 (63.6%) |
| 3-Person Household | 30 (56.6%) | 23 (43.4%) |
| 4+ Person Household | 80 (77.7%) | 23 (22.3%) |
| Total Housing Units | 179 (51.6%) | 168 (48.4%) |
Occupancy by Educational Attainment in Greenville
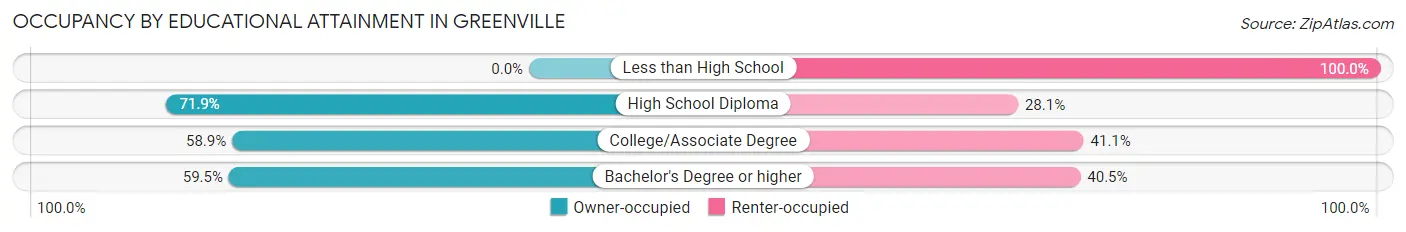
| Household Size | Owner-occupied | Renter-occupied |
| Less than High School | 0 (0.0%) | 58 (100.0%) |
| High School Diploma | 46 (71.9%) | 18 (28.1%) |
| College/Associate Degree | 83 (58.9%) | 58 (41.1%) |
| Bachelor's Degree or higher | 50 (59.5%) | 34 (40.5%) |
Occupancy by Age of Householder in Greenville
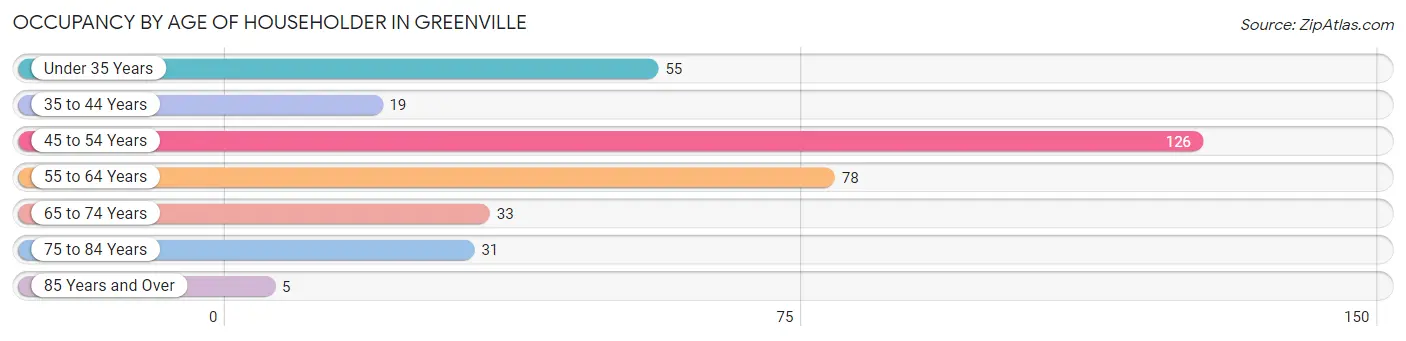
| Age Bracket | # Households | % Households |
| Under 35 Years | 55 | 15.9% |
| 35 to 44 Years | 19 | 5.5% |
| 45 to 54 Years | 126 | 36.3% |
| 55 to 64 Years | 78 | 22.5% |
| 65 to 74 Years | 33 | 9.5% |
| 75 to 84 Years | 31 | 8.9% |
| 85 Years and Over | 5 | 1.4% |
| Total | 347 | 100.0% |
Housing Finances in Greenville
Median Income by Occupancy in Greenville
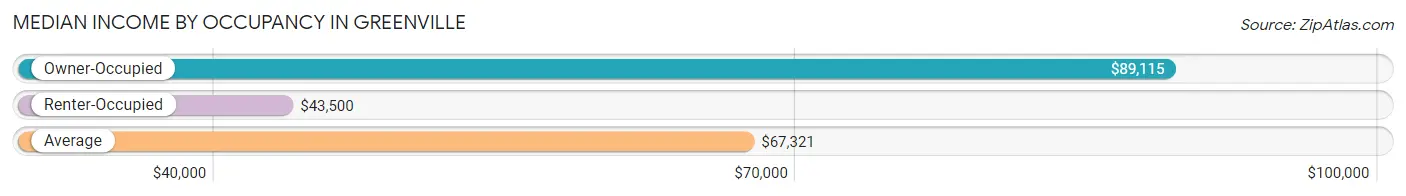
| Occupancy Type | # Households | Median Income |
| Owner-Occupied | 179 (51.6%) | $89,115 |
| Renter-Occupied | 168 (48.4%) | $43,500 |
| Average | 347 (100.0%) | $67,321 |
Occupancy by Householder Income Bracket in Greenville
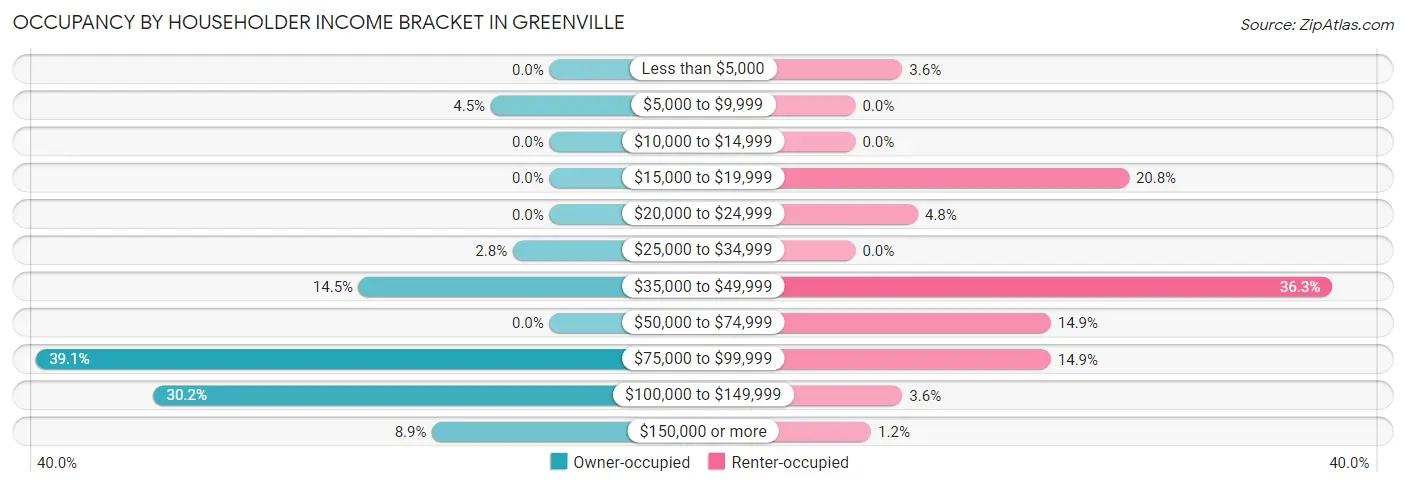
| Income Bracket | Owner-occupied | Renter-occupied |
| Less than $5,000 | 0 (0.0%) | 6 (3.6%) |
| $5,000 to $9,999 | 8 (4.5%) | 0 (0.0%) |
| $10,000 to $14,999 | 0 (0.0%) | 0 (0.0%) |
| $15,000 to $19,999 | 0 (0.0%) | 35 (20.8%) |
| $20,000 to $24,999 | 0 (0.0%) | 8 (4.8%) |
| $25,000 to $34,999 | 5 (2.8%) | 0 (0.0%) |
| $35,000 to $49,999 | 26 (14.5%) | 61 (36.3%) |
| $50,000 to $74,999 | 0 (0.0%) | 25 (14.9%) |
| $75,000 to $99,999 | 70 (39.1%) | 25 (14.9%) |
| $100,000 to $149,999 | 54 (30.2%) | 6 (3.6%) |
| $150,000 or more | 16 (8.9%) | 2 (1.2%) |
| Total | 179 (100.0%) | 168 (100.0%) |
Monthly Housing Cost Tiers in Greenville
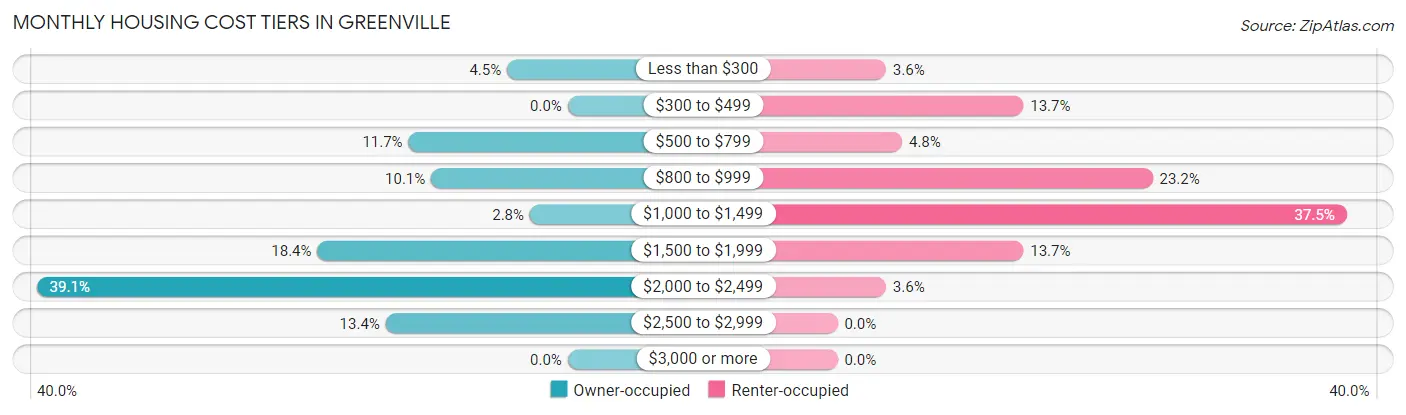
| Monthly Cost | Owner-occupied | Renter-occupied |
| Less than $300 | 8 (4.5%) | 6 (3.6%) |
| $300 to $499 | 0 (0.0%) | 23 (13.7%) |
| $500 to $799 | 21 (11.7%) | 8 (4.8%) |
| $800 to $999 | 18 (10.1%) | 39 (23.2%) |
| $1,000 to $1,499 | 5 (2.8%) | 63 (37.5%) |
| $1,500 to $1,999 | 33 (18.4%) | 23 (13.7%) |
| $2,000 to $2,499 | 70 (39.1%) | 6 (3.6%) |
| $2,500 to $2,999 | 24 (13.4%) | 0 (0.0%) |
| $3,000 or more | 0 (0.0%) | 0 (0.0%) |
| Total | 179 (100.0%) | 168 (100.0%) |
Physical Housing Characteristics in Greenville
Housing Structures in Greenville
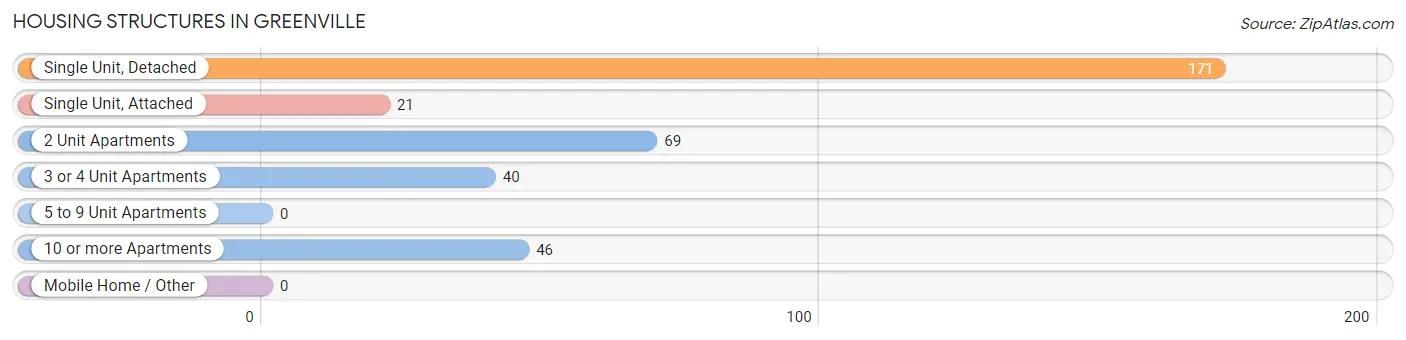
| Structure Type | # Housing Units | % Housing Units |
| Single Unit, Detached | 171 | 49.3% |
| Single Unit, Attached | 21 | 6.0% |
| 2 Unit Apartments | 69 | 19.9% |
| 3 or 4 Unit Apartments | 40 | 11.5% |
| 5 to 9 Unit Apartments | 0 | 0.0% |
| 10 or more Apartments | 46 | 13.3% |
| Mobile Home / Other | 0 | 0.0% |
| Total | 347 | 100.0% |
Housing Structures by Occupancy in Greenville
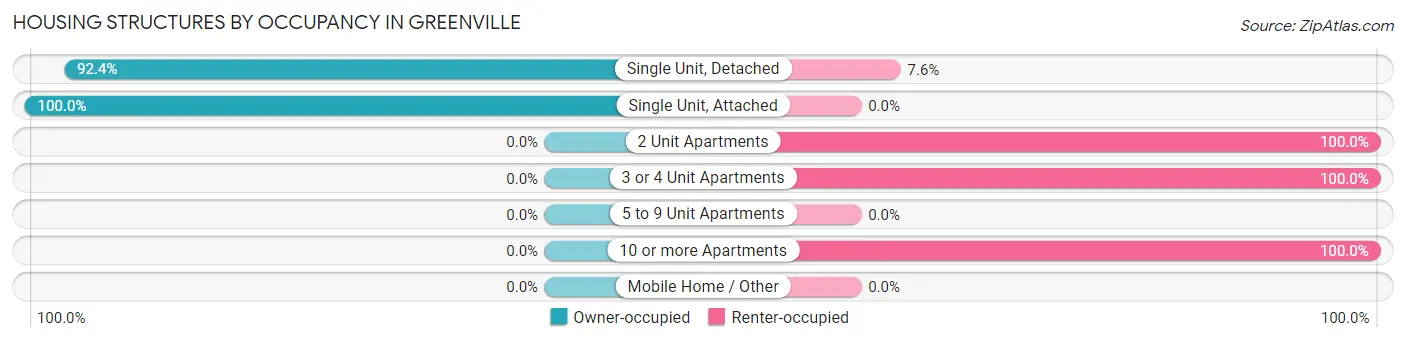
| Structure Type | Owner-occupied | Renter-occupied |
| Single Unit, Detached | 158 (92.4%) | 13 (7.6%) |
| Single Unit, Attached | 21 (100.0%) | 0 (0.0%) |
| 2 Unit Apartments | 0 (0.0%) | 69 (100.0%) |
| 3 or 4 Unit Apartments | 0 (0.0%) | 40 (100.0%) |
| 5 to 9 Unit Apartments | 0 (0.0%) | 0 (0.0%) |
| 10 or more Apartments | 0 (0.0%) | 46 (100.0%) |
| Mobile Home / Other | 0 (0.0%) | 0 (0.0%) |
| Total | 179 (51.6%) | 168 (48.4%) |
Housing Structures by Number of Rooms in Greenville
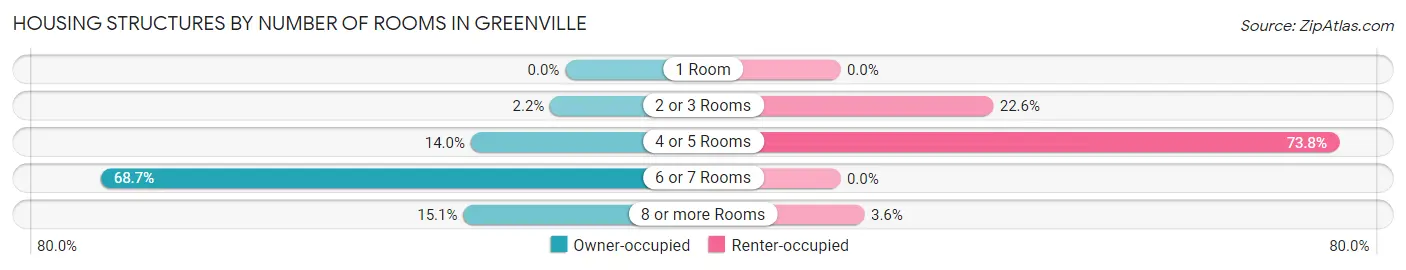
| Number of Rooms | Owner-occupied | Renter-occupied |
| 1 Room | 0 (0.0%) | 0 (0.0%) |
| 2 or 3 Rooms | 4 (2.2%) | 38 (22.6%) |
| 4 or 5 Rooms | 25 (14.0%) | 124 (73.8%) |
| 6 or 7 Rooms | 123 (68.7%) | 0 (0.0%) |
| 8 or more Rooms | 27 (15.1%) | 6 (3.6%) |
| Total | 179 (100.0%) | 168 (100.0%) |
Housing Structure by Heating Type in Greenville
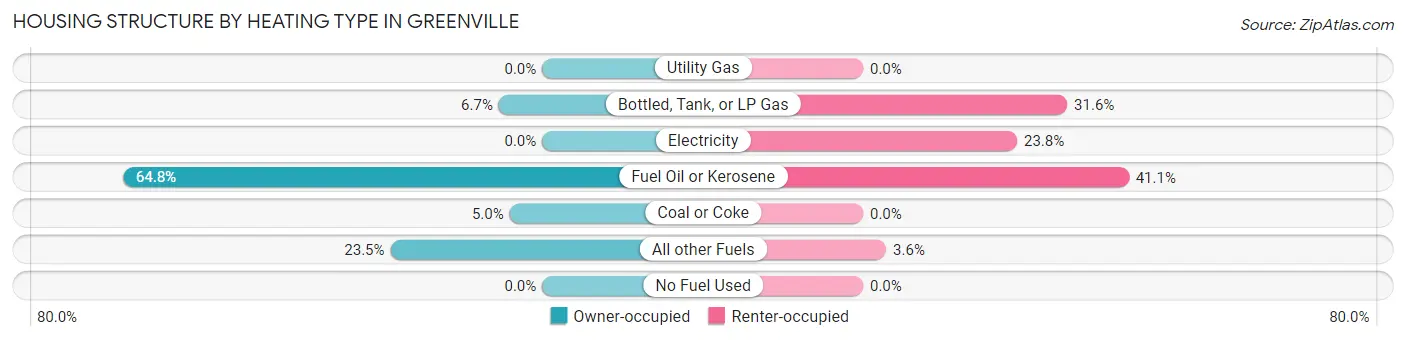
| Heating Type | Owner-occupied | Renter-occupied |
| Utility Gas | 0 (0.0%) | 0 (0.0%) |
| Bottled, Tank, or LP Gas | 12 (6.7%) | 53 (31.6%) |
| Electricity | 0 (0.0%) | 40 (23.8%) |
| Fuel Oil or Kerosene | 116 (64.8%) | 69 (41.1%) |
| Coal or Coke | 9 (5.0%) | 0 (0.0%) |
| All other Fuels | 42 (23.5%) | 6 (3.6%) |
| No Fuel Used | 0 (0.0%) | 0 (0.0%) |
| Total | 179 (100.0%) | 168 (100.0%) |
Household Vehicle Usage in Greenville
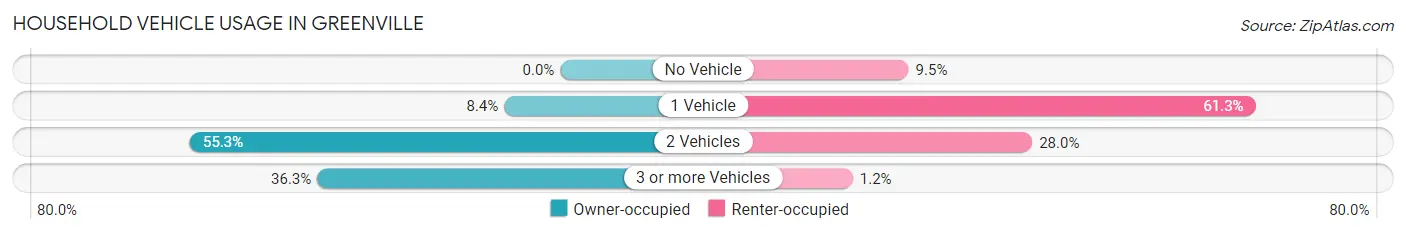
| Vehicles per Household | Owner-occupied | Renter-occupied |
| No Vehicle | 0 (0.0%) | 16 (9.5%) |
| 1 Vehicle | 15 (8.4%) | 103 (61.3%) |
| 2 Vehicles | 99 (55.3%) | 47 (28.0%) |
| 3 or more Vehicles | 65 (36.3%) | 2 (1.2%) |
| Total | 179 (100.0%) | 168 (100.0%) |
Real Estate & Mortgages in Greenville
Real Estate and Mortgage Overview in Greenville
| Characteristic | Without Mortgage | With Mortgage |
| Housing Units | 47 | 132 |
| Median Property Value | $247,700 | $250,000 |
| Median Household Income | $137,250 | $0 |
| Monthly Housing Costs | $708 | $0 |
| Real Estate Taxes | $4,300 | $0 |
Property Value by Mortgage Status in Greenville
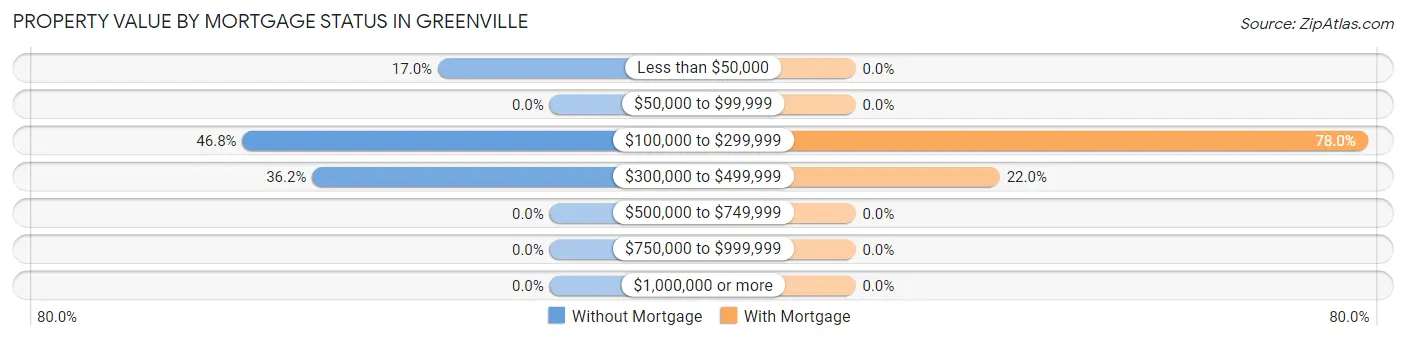
| Property Value | Without Mortgage | With Mortgage |
| Less than $50,000 | 8 (17.0%) | 0 (0.0%) |
| $50,000 to $99,999 | 0 (0.0%) | 0 (0.0%) |
| $100,000 to $299,999 | 22 (46.8%) | 103 (78.0%) |
| $300,000 to $499,999 | 17 (36.2%) | 29 (22.0%) |
| $500,000 to $749,999 | 0 (0.0%) | 0 (0.0%) |
| $750,000 to $999,999 | 0 (0.0%) | 0 (0.0%) |
| $1,000,000 or more | 0 (0.0%) | 0 (0.0%) |
| Total | 47 (100.0%) | 132 (100.0%) |
Household Income by Mortgage Status in Greenville
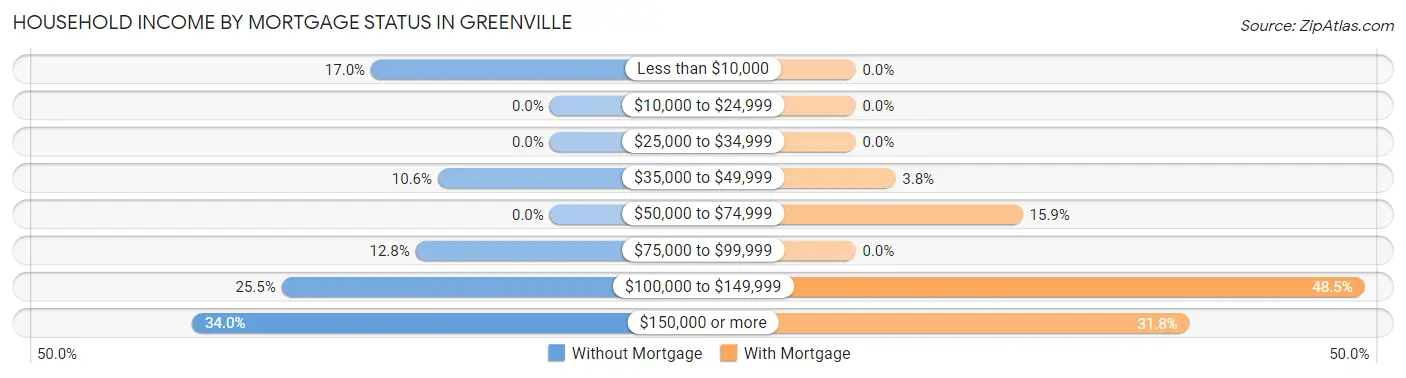
| Household Income | Without Mortgage | With Mortgage |
| Less than $10,000 | 8 (17.0%) | 0 (0.0%) |
| $10,000 to $24,999 | 0 (0.0%) | 0 (0.0%) |
| $25,000 to $34,999 | 0 (0.0%) | 0 (0.0%) |
| $35,000 to $49,999 | 5 (10.6%) | 5 (3.8%) |
| $50,000 to $74,999 | 0 (0.0%) | 21 (15.9%) |
| $75,000 to $99,999 | 6 (12.8%) | 0 (0.0%) |
| $100,000 to $149,999 | 12 (25.5%) | 64 (48.5%) |
| $150,000 or more | 16 (34.0%) | 42 (31.8%) |
| Total | 47 (100.0%) | 132 (100.0%) |
Property Value to Household Income Ratio in Greenville
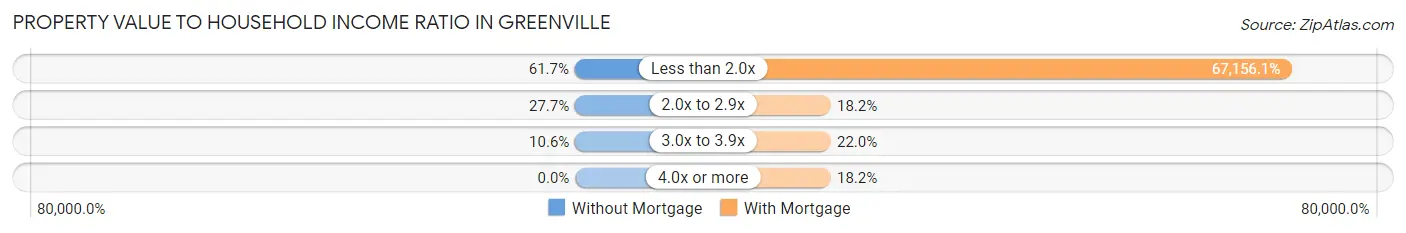
| Value-to-Income Ratio | Without Mortgage | With Mortgage |
| Less than 2.0x | 29 (61.7%) | 88,646 (67,156.1%) |
| 2.0x to 2.9x | 13 (27.7%) | 24 (18.2%) |
| 3.0x to 3.9x | 5 (10.6%) | 29 (22.0%) |
| 4.0x or more | 0 (0.0%) | 24 (18.2%) |
| Total | 47 (100.0%) | 132 (100.0%) |
Real Estate Taxes by Mortgage Status in Greenville
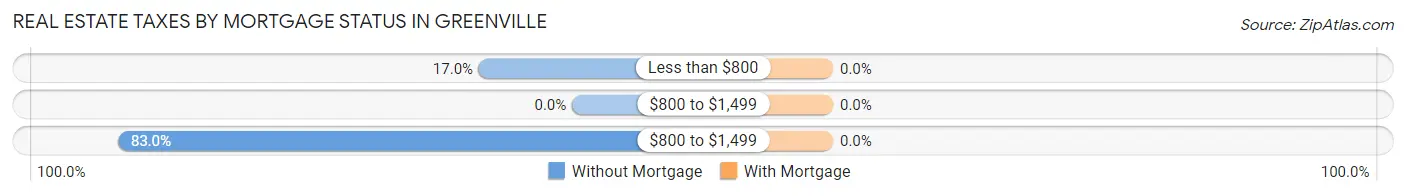
| Property Taxes | Without Mortgage | With Mortgage |
| Less than $800 | 8 (17.0%) | 0 (0.0%) |
| $800 to $1,499 | 0 (0.0%) | 0 (0.0%) |
| $800 to $1,499 | 39 (83.0%) | 0 (0.0%) |
| Total | 47 (100.0%) | 132 (100.0%) |
Health & Disability in Greenville
Health Insurance Coverage by Age in Greenville
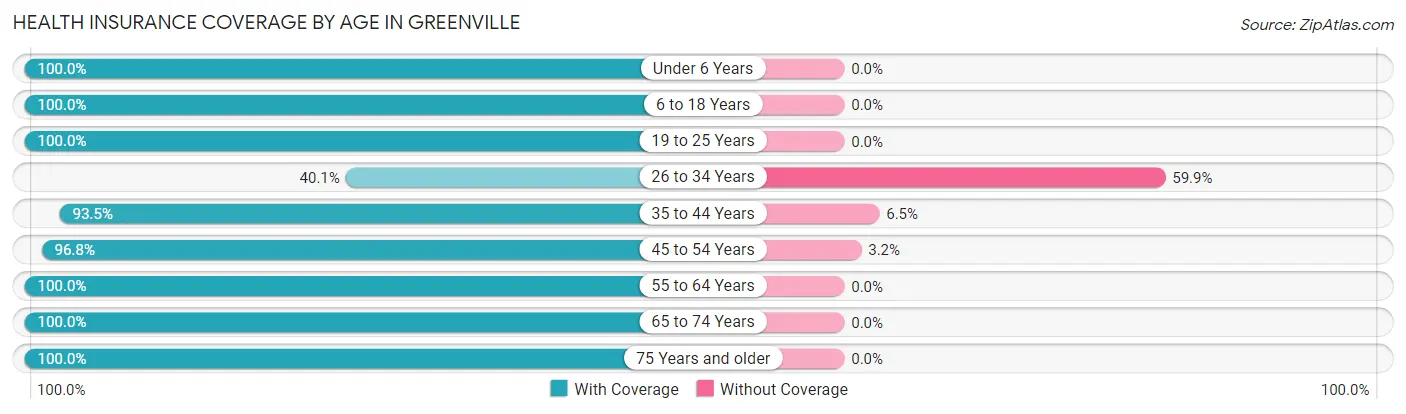
| Age Bracket | With Coverage | Without Coverage |
| Under 6 Years | 92 (100.0%) | 0 (0.0%) |
| 6 to 18 Years | 156 (100.0%) | 0 (0.0%) |
| 19 to 25 Years | 153 (100.0%) | 0 (0.0%) |
| 26 to 34 Years | 59 (40.1%) | 88 (59.9%) |
| 35 to 44 Years | 43 (93.5%) | 3 (6.5%) |
| 45 to 54 Years | 214 (96.8%) | 7 (3.2%) |
| 55 to 64 Years | 115 (100.0%) | 0 (0.0%) |
| 65 to 74 Years | 95 (100.0%) | 0 (0.0%) |
| 75 Years and older | 36 (100.0%) | 0 (0.0%) |
| Total | 963 (90.8%) | 98 (9.2%) |
Health Insurance Coverage by Citizenship Status in Greenville
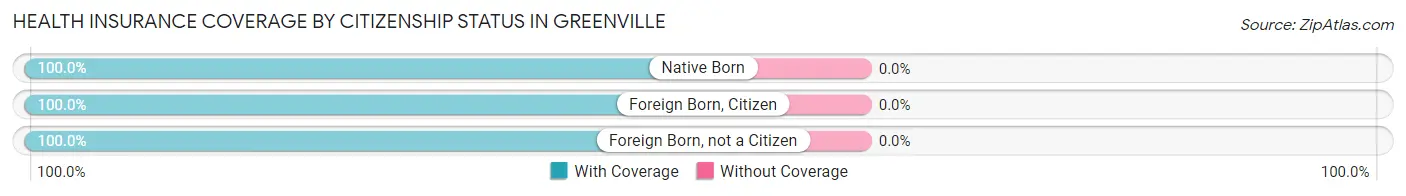
| Citizenship Status | With Coverage | Without Coverage |
| Native Born | 92 (100.0%) | 0 (0.0%) |
| Foreign Born, Citizen | 156 (100.0%) | 0 (0.0%) |
| Foreign Born, not a Citizen | 153 (100.0%) | 0 (0.0%) |
Health Insurance Coverage by Household Income in Greenville
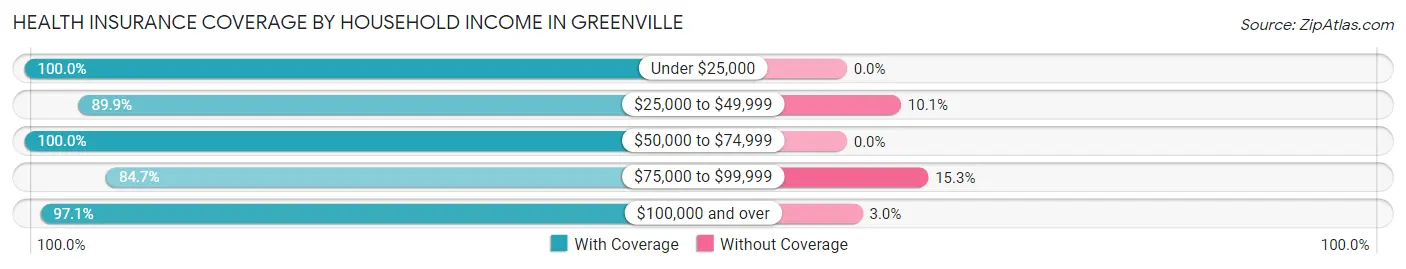
| Household Income | With Coverage | Without Coverage |
| Under $25,000 | 99 (100.0%) | 0 (0.0%) |
| $25,000 to $49,999 | 213 (89.9%) | 24 (10.1%) |
| $50,000 to $74,999 | 49 (100.0%) | 0 (0.0%) |
| $75,000 to $99,999 | 372 (84.7%) | 67 (15.3%) |
| $100,000 and over | 230 (97.1%) | 7 (2.9%) |
Public vs Private Health Insurance Coverage by Age in Greenville
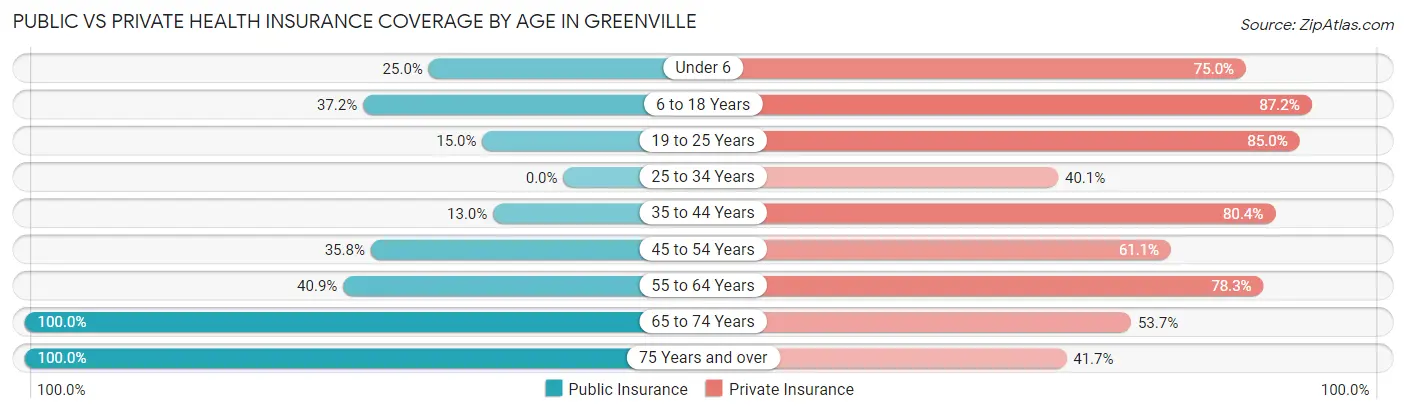
| Age Bracket | Public Insurance | Private Insurance |
| Under 6 | 23 (25.0%) | 69 (75.0%) |
| 6 to 18 Years | 58 (37.2%) | 136 (87.2%) |
| 19 to 25 Years | 23 (15.0%) | 130 (85.0%) |
| 25 to 34 Years | 0 (0.0%) | 59 (40.1%) |
| 35 to 44 Years | 6 (13.0%) | 37 (80.4%) |
| 45 to 54 Years | 79 (35.7%) | 135 (61.1%) |
| 55 to 64 Years | 47 (40.9%) | 90 (78.3%) |
| 65 to 74 Years | 95 (100.0%) | 51 (53.7%) |
| 75 Years and over | 36 (100.0%) | 15 (41.7%) |
| Total | 367 (34.6%) | 722 (68.0%) |
Disability Status by Sex by Age in Greenville
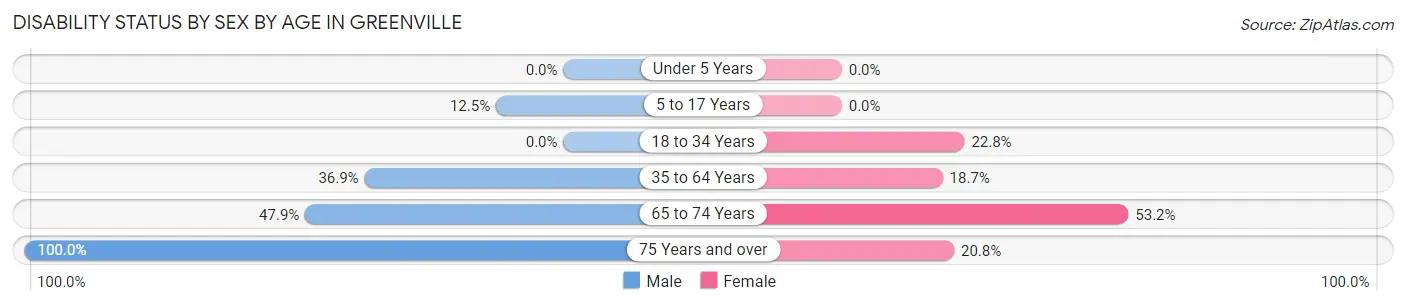
| Age Bracket | Male | Female |
| Under 5 Years | 0 (0.0%) | 0 (0.0%) |
| 5 to 17 Years | 15 (12.5%) | 0 (0.0%) |
| 18 to 34 Years | 0 (0.0%) | 23 (22.8%) |
| 35 to 64 Years | 72 (36.9%) | 35 (18.7%) |
| 65 to 74 Years | 23 (47.9%) | 25 (53.2%) |
| 75 Years and over | 12 (100.0%) | 5 (20.8%) |
Disability Class by Sex by Age in Greenville
Disability Class: Hearing Difficulty
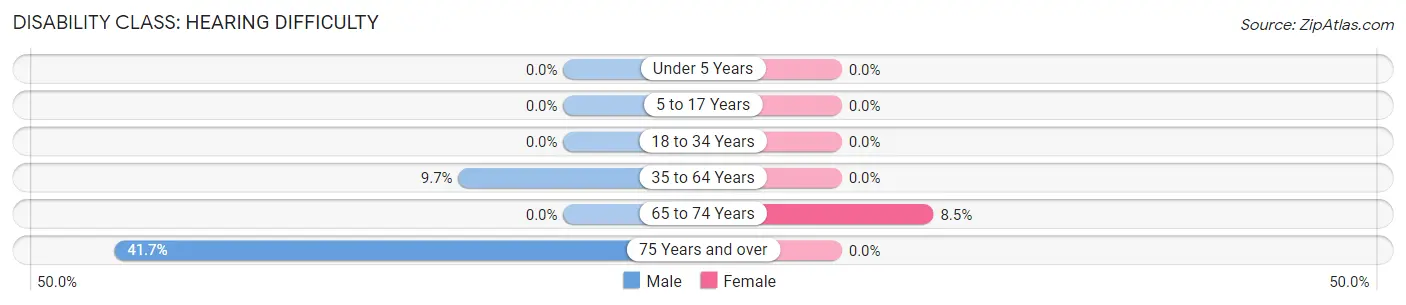
| Age Bracket | Male | Female |
| Under 5 Years | 0 (0.0%) | 0 (0.0%) |
| 5 to 17 Years | 0 (0.0%) | 0 (0.0%) |
| 18 to 34 Years | 0 (0.0%) | 0 (0.0%) |
| 35 to 64 Years | 19 (9.7%) | 0 (0.0%) |
| 65 to 74 Years | 0 (0.0%) | 4 (8.5%) |
| 75 Years and over | 5 (41.7%) | 0 (0.0%) |
Disability Class: Vision Difficulty
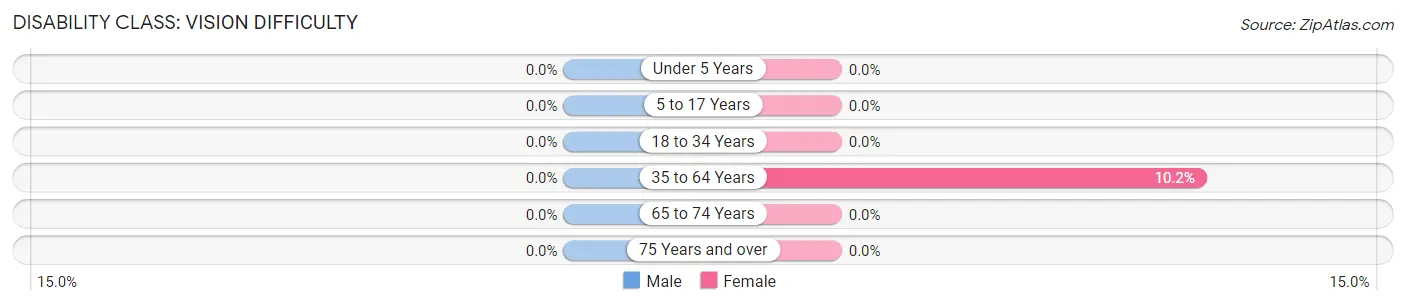
| Age Bracket | Male | Female |
| Under 5 Years | 0 (0.0%) | 0 (0.0%) |
| 5 to 17 Years | 0 (0.0%) | 0 (0.0%) |
| 18 to 34 Years | 0 (0.0%) | 0 (0.0%) |
| 35 to 64 Years | 0 (0.0%) | 19 (10.2%) |
| 65 to 74 Years | 0 (0.0%) | 0 (0.0%) |
| 75 Years and over | 0 (0.0%) | 0 (0.0%) |
Disability Class: Cognitive Difficulty
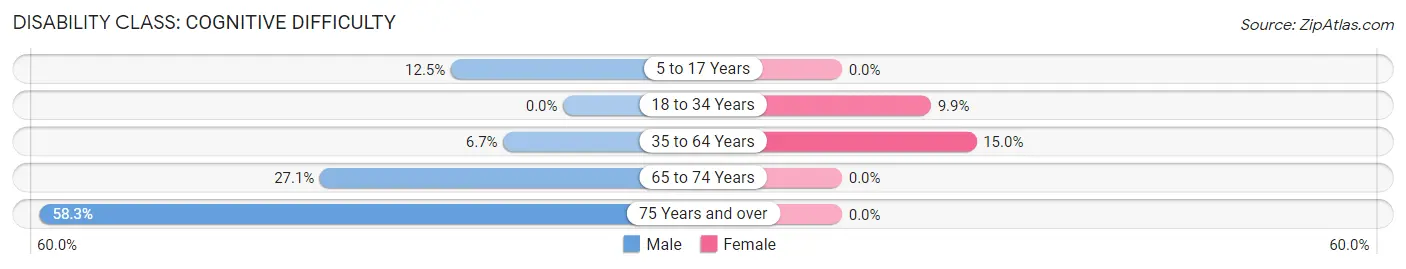
| Age Bracket | Male | Female |
| 5 to 17 Years | 15 (12.5%) | 0 (0.0%) |
| 18 to 34 Years | 0 (0.0%) | 10 (9.9%) |
| 35 to 64 Years | 13 (6.7%) | 28 (15.0%) |
| 65 to 74 Years | 13 (27.1%) | 0 (0.0%) |
| 75 Years and over | 7 (58.3%) | 0 (0.0%) |
Disability Class: Ambulatory Difficulty
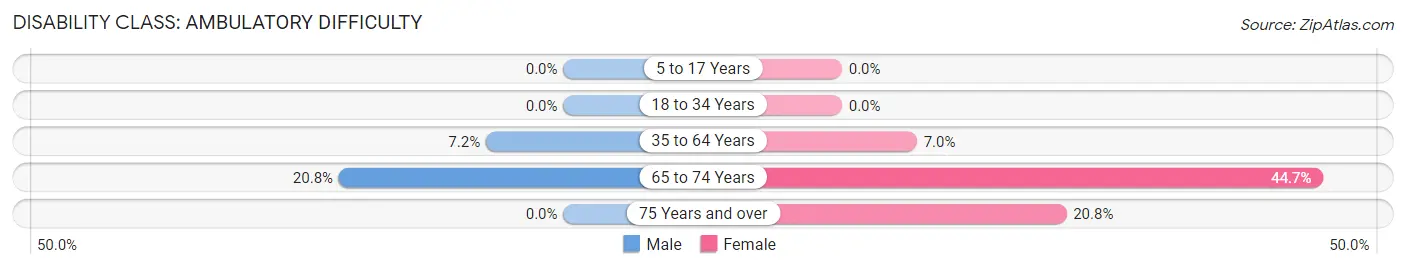
| Age Bracket | Male | Female |
| 5 to 17 Years | 0 (0.0%) | 0 (0.0%) |
| 18 to 34 Years | 0 (0.0%) | 0 (0.0%) |
| 35 to 64 Years | 14 (7.2%) | 13 (7.0%) |
| 65 to 74 Years | 10 (20.8%) | 21 (44.7%) |
| 75 Years and over | 0 (0.0%) | 5 (20.8%) |
Disability Class: Self-Care Difficulty
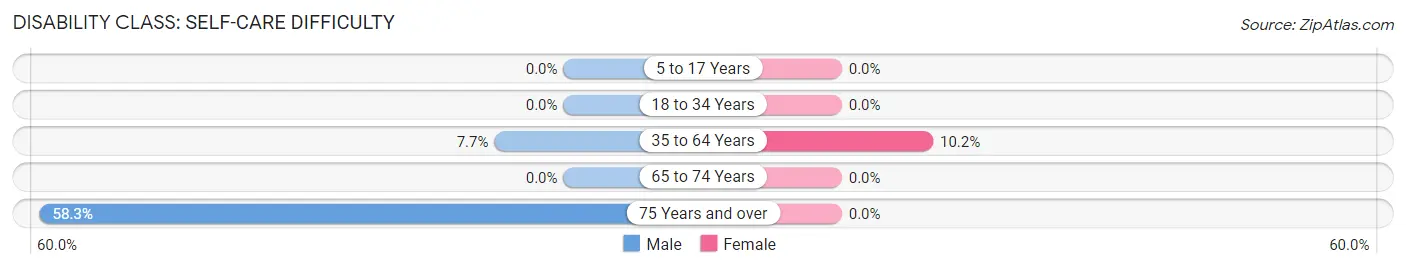
| Age Bracket | Male | Female |
| 5 to 17 Years | 0 (0.0%) | 0 (0.0%) |
| 18 to 34 Years | 0 (0.0%) | 0 (0.0%) |
| 35 to 64 Years | 15 (7.7%) | 19 (10.2%) |
| 65 to 74 Years | 0 (0.0%) | 0 (0.0%) |
| 75 Years and over | 7 (58.3%) | 0 (0.0%) |
Technology Access in Greenville
Computing Device Access in Greenville
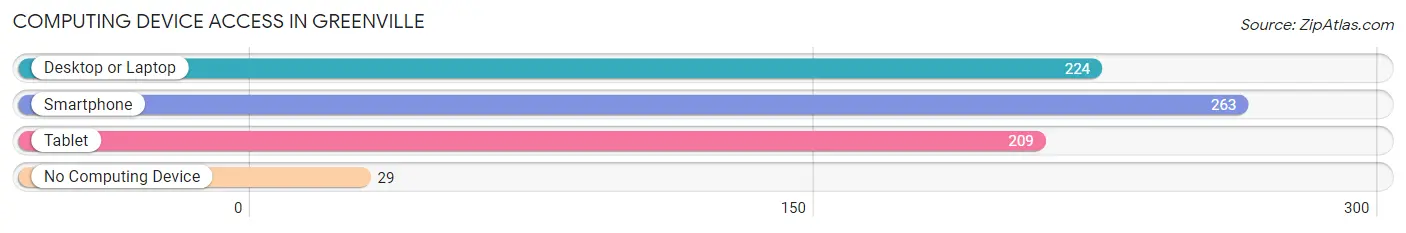
| Device Type | # Households | % Households |
| Desktop or Laptop | 224 | 64.5% |
| Smartphone | 263 | 75.8% |
| Tablet | 209 | 60.2% |
| No Computing Device | 29 | 8.4% |
| Total | 347 | 100.0% |
Internet Access in Greenville
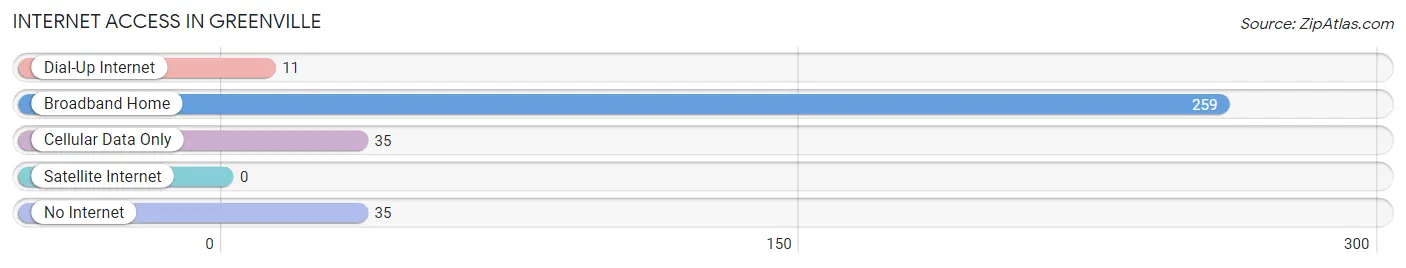
| Internet Type | # Households | % Households |
| Dial-Up Internet | 11 | 3.2% |
| Broadband Home | 259 | 74.6% |
| Cellular Data Only | 35 | 10.1% |
| Satellite Internet | 0 | 0.0% |
| No Internet | 35 | 10.1% |
| Total | 347 | 100.0% |
Greenville Summary
Greenville is a town located in Hillsborough County, New Hampshire, United States. The population was 1,845 at the 2010 census. It is part of the Manchester-Nashua metropolitan area.
Geography
Greenville is located in southwestern Hillsborough County at 42°59'N 71°45'W (42.983, -71.749). It is bordered to the north by the town of Lyndeborough, to the east by Wilton, to the south by Temple and Mason, and to the west by New Ipswich.
According to the United States Census Bureau, the town has a total area of 28.2sqmi, of which 28.1sqmi is land and 0.1sqmi is water, comprising 0.37% of the town. The highest point in Greenville is the summit of Pack Monadnock, at 2,290 feet (698 m) above sea level.
Demographics
As of the census of 2000, there were 1,717 people, 645 households, and 486 families residing in the town. The population density was 61.1 people per square mile (23.6/km^2). There were 676 housing units at an average density of 24.1 per square mile (9.3/km^2). The racial makeup of the town was 97.90% White, 0.35% African American, 0.12% Native American, 0.12% Asian, 0.06% Pacific Islander, 0.35% from other races, and 0.99% from two or more races. Hispanic or Latino of any race were 0.76% of the population.
There were 645 households, out of which 35.2% had children under the age of 18 living with them, 62.2% were married couples living together, 7.3% had a female householder with no husband present, and 26.2% were non-families. 19.7% of all households were made up of individuals, and 6.3% had someone living alone who was 65 years of age or older. The average household size was 2.66 and the average family size was 3.06.
In the town, the population was spread out, with 26.2% under the age of 18, 6.2% from 18 to 24, 32.2% from 25 to 44, 25.2% from 45 to 64, and 10.2% who were 65 years of age or older. The median age was 38 years. For every 100 females, there were 100.2 males. For every 100 females age 18 and over, there were 97.2 males.
The median income for a household in the town was $50,938, and the median income for a family was $54,821. Males had a median income of $36,932 versus $27,500 for females. The per capita income for the town was $20,945. About 3.2% of families and 4.3% of the population were below the poverty line, including 4.3% of those under age 18 and 4.2% of those age 65 or over.
Economy
Greenville is a rural town with a small but growing economy. The town is home to several small businesses, including a few restaurants, a gas station, a hardware store, and a few small retail stores. The town also has a few larger employers, such as a manufacturing plant and a lumber mill.
The town is also home to a number of farms, which produce a variety of products, including dairy, beef, pork, poultry, eggs, and vegetables. The town also has a number of apple orchards, which produce a variety of apples for local consumption and for sale at local farmers markets.
Greenville is also home to a number of recreational activities, including hiking, camping, fishing, and hunting. The town is also home to a number of parks, including Pack Monadnock State Park, which offers a variety of outdoor activities.
Conclusion
Greenville is a small town located in Hillsborough County, New Hampshire. The town has a population of 1,845 as of the 2010 census and is part of the Manchester-Nashua metropolitan area. The town has a rural economy, with a few small businesses, a few larger employers, and a number of farms. The town also has a number of recreational activities, including hiking, camping, fishing, and hunting. Greenville is a great place to live and work, and offers a variety of activities for residents and visitors alike.
Common Questions
What is Per Capita Income in Greenville?
Per Capita income in Greenville is $25,168.
What is the Median Family Income in Greenville?
Median Family Income in Greenville is $85,000.
What is the Median Household income in Greenville?
Median Household Income in Greenville is $67,321.
What is Income or Wage Gap in Greenville?
Income or Wage Gap in Greenville is 10.2%.
Women in Greenville earn 89.8 cents for every dollar earned by a man.
What is Inequality or Gini Index in Greenville?
Inequality or Gini Index in Greenville is 0.34.
What is the Total Population of Greenville?
Total Population of Greenville is 1,061.
What is the Total Male Population of Greenville?
Total Male Population of Greenville is 621.
What is the Total Female Population of Greenville?
Total Female Population of Greenville is 440.
What is the Ratio of Males per 100 Females in Greenville?
There are 141.14 Males per 100 Females in Greenville.
What is the Ratio of Females per 100 Males in Greenville?
There are 70.85 Females per 100 Males in Greenville.
What is the Median Population Age in Greenville?
Median Population Age in Greenville is 33.8 Years.
What is the Average Family Size in Greenville
Average Family Size in Greenville is 3.7 People.
What is the Average Household Size in Greenville
Average Household Size in Greenville is 3.1 People.
How Large is the Labor Force in Greenville?
There are 530 People in the Labor Forcein in Greenville.
What is the Percentage of People in the Labor Force in Greenville?
63.7% of People are in the Labor Force in Greenville.
What is the Unemployment Rate in Greenville?
Unemployment Rate in Greenville is 12.1%.