Midland, CO Map & Demographics
Midland Map
Midland Overview
$26,357
PER CAPITA INCOME
$54,375
AVG FAMILY INCOME
$53,281
AVG HOUSEHOLD INCOME
0.36
INEQUALITY / GINI INDEX
255
TOTAL POPULATION
136
MALE POPULATION
119
FEMALE POPULATION
114.29
MALES / 100 FEMALES
87.50
FEMALES / 100 MALES
38.7
MEDIAN AGE
3.0
AVG FAMILY SIZE
1.9
AVG HOUSEHOLD SIZE
67
LABOR FORCE [ PEOPLE ]
34.5%
PERCENT IN LABOR FORCE
Income in Midland
Income Overview in Midland
Per Capita Income in Midland is $26,357, while median incomes of families and households are $54,375 and $53,281 respectively.
| Characteristic | Number | Measure |
| Per Capita Income | 255 | $26,357 |
| Median Family Income | 60 | $54,375 |
| Mean Family Income | 60 | $68,053 |
| Median Household Income | 135 | $53,281 |
| Mean Household Income | 135 | $50,178 |
| Income Deficit | 60 | $0 |
| Wage / Income Gap (%) | 255 | 0.00% |
| Wage / Income Gap ($) | 255 | 100.00¢ per $1 |
| Gini / Inequality Index | 255 | 0.36 |
Earnings by Sex in Midland
| Sex | Number | Average Earnings |
| Male | 49 (63.6%) | $0 |
| Female | 28 (36.4%) | $0 |
| Total | 77 (100.0%) | $0 |
Earnings by Sex by Income Bracket in Midland
The most common earnings brackets in Midland are $50,000 to $54,999 for men (39 | 79.6%) and $15,000 to $17,499 for women (18 | 64.3%).
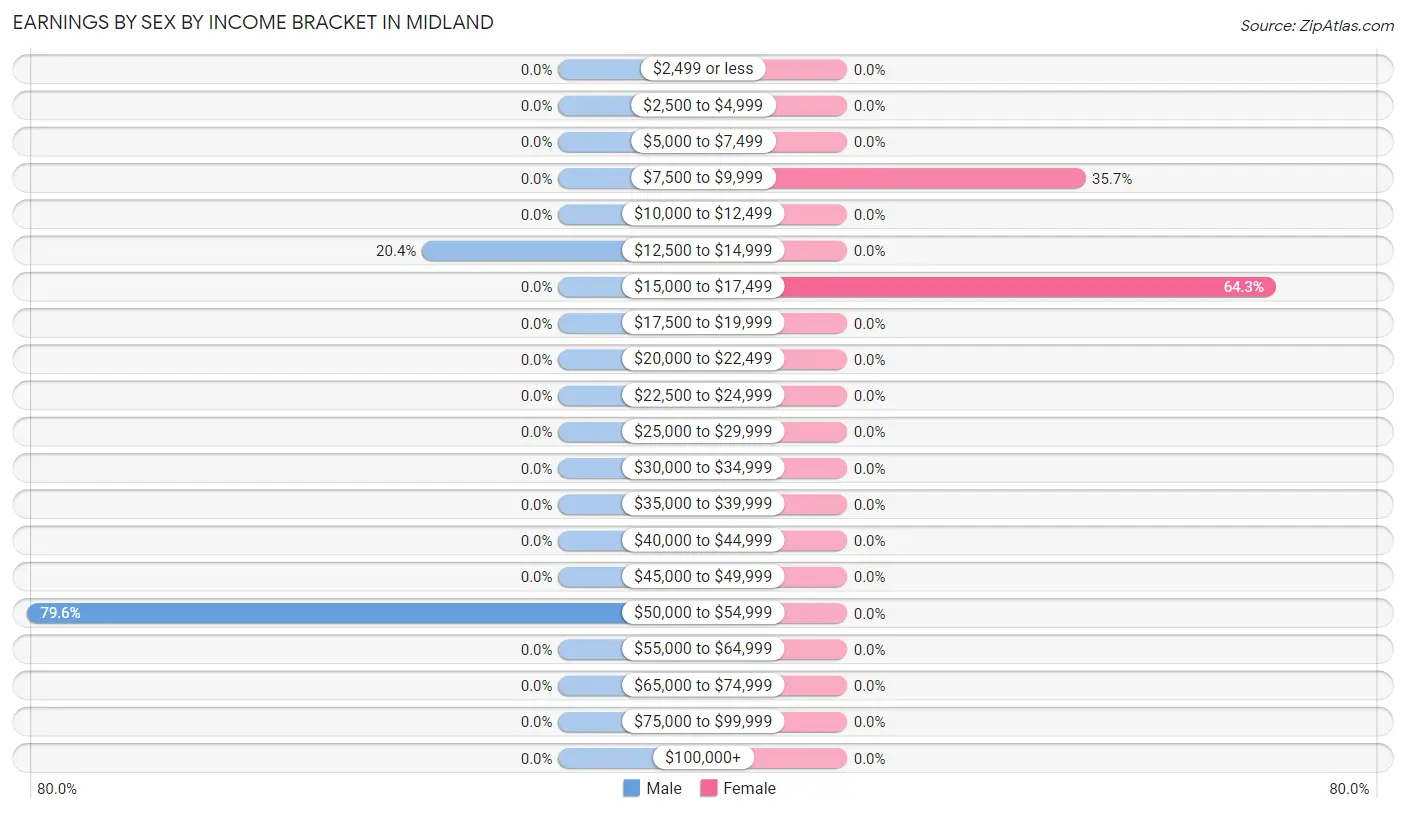
| Income | Male | Female |
| $2,499 or less | 0 (0.0%) | 0 (0.0%) |
| $2,500 to $4,999 | 0 (0.0%) | 0 (0.0%) |
| $5,000 to $7,499 | 0 (0.0%) | 0 (0.0%) |
| $7,500 to $9,999 | 0 (0.0%) | 10 (35.7%) |
| $10,000 to $12,499 | 0 (0.0%) | 0 (0.0%) |
| $12,500 to $14,999 | 10 (20.4%) | 0 (0.0%) |
| $15,000 to $17,499 | 0 (0.0%) | 18 (64.3%) |
| $17,500 to $19,999 | 0 (0.0%) | 0 (0.0%) |
| $20,000 to $22,499 | 0 (0.0%) | 0 (0.0%) |
| $22,500 to $24,999 | 0 (0.0%) | 0 (0.0%) |
| $25,000 to $29,999 | 0 (0.0%) | 0 (0.0%) |
| $30,000 to $34,999 | 0 (0.0%) | 0 (0.0%) |
| $35,000 to $39,999 | 0 (0.0%) | 0 (0.0%) |
| $40,000 to $44,999 | 0 (0.0%) | 0 (0.0%) |
| $45,000 to $49,999 | 0 (0.0%) | 0 (0.0%) |
| $50,000 to $54,999 | 39 (79.6%) | 0 (0.0%) |
| $55,000 to $64,999 | 0 (0.0%) | 0 (0.0%) |
| $65,000 to $74,999 | 0 (0.0%) | 0 (0.0%) |
| $75,000 to $99,999 | 0 (0.0%) | 0 (0.0%) |
| $100,000+ | 0 (0.0%) | 0 (0.0%) |
| Total | 49 (100.0%) | 28 (100.0%) |
Earnings by Sex by Educational Attainment in Midland
| Educational Attainment | Male Income | Female Income |
| Less than High School | - | - |
| High School Diploma | - | - |
| College or Associate's Degree | - | - |
| Bachelor's Degree | - | - |
| Graduate Degree | - | - |
| Total | - | - |
Family Income in Midland
Family Income Brackets in Midland
According to the Midland family income data, there are 40 families falling into the $50,000 to $74,999 income range, which is the most common income bracket and makes up 66.7% of all families.
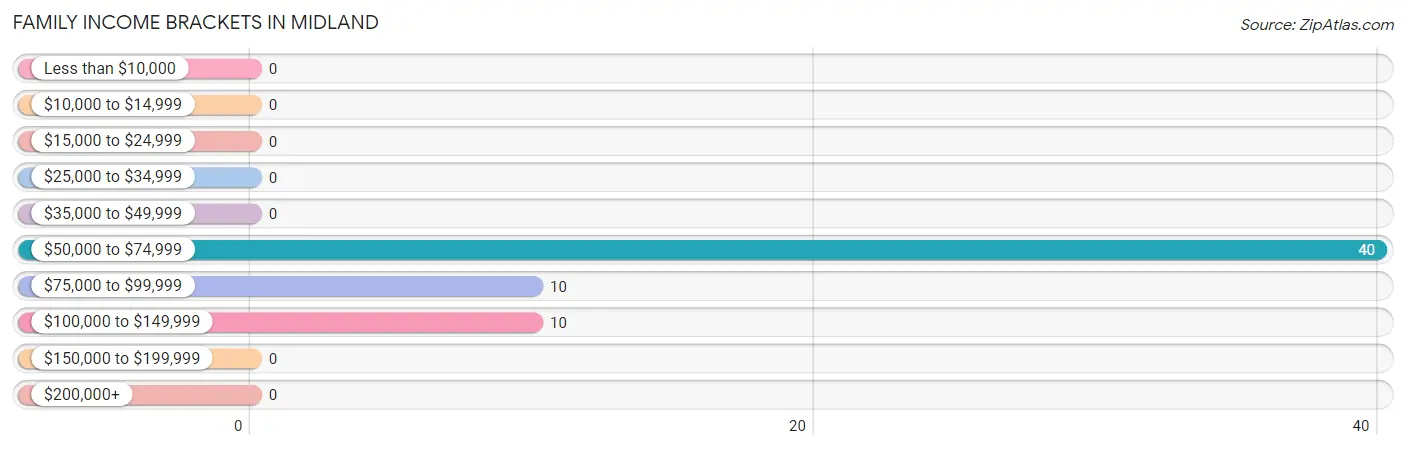
| Income Bracket | # Families | % Families |
| Less than $10,000 | 0 | 0.0% |
| $10,000 to $14,999 | 0 | 0.0% |
| $15,000 to $24,999 | 0 | 0.0% |
| $25,000 to $34,999 | 0 | 0.0% |
| $35,000 to $49,999 | 0 | 0.0% |
| $50,000 to $74,999 | 40 | 66.7% |
| $75,000 to $99,999 | 10 | 16.7% |
| $100,000 to $149,999 | 10 | 16.7% |
| $150,000 to $199,999 | 0 | 0.0% |
| $200,000+ | 0 | 0.0% |
Family Income by Famaliy Size in Midland
| Income Bracket | # Families | Median Income |
| 2-Person Families | 20 (33.3%) | $0 |
| 3-Person Families | 0 (0.0%) | $0 |
| 4-Person Families | 40 (66.7%) | $0 |
| 5-Person Families | 0 (0.0%) | $0 |
| 6-Person Families | 0 (0.0%) | $0 |
| 7+ Person Families | 0 (0.0%) | $0 |
| Total | 60 (100.0%) | $54,375 |
Family Income by Number of Earners in Midland
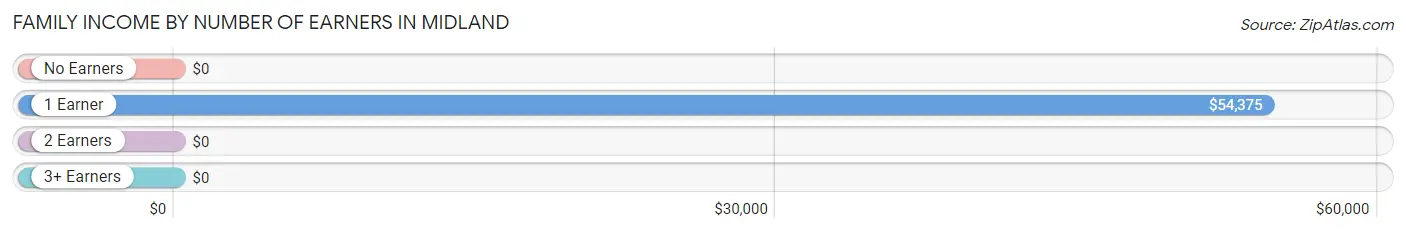
| Number of Earners | # Families | Median Income |
| No Earners | 0 (0.0%) | $0 |
| 1 Earner | 60 (100.0%) | $54,375 |
| 2 Earners | 0 (0.0%) | $0 |
| 3+ Earners | 0 (0.0%) | $0 |
| Total | 60 (100.0%) | $54,375 |
Household Income in Midland
Household Income Brackets in Midland
With 40 households falling in the category, the $50,000 to $74,999 income range is the most frequent in Midland, accounting for 29.6% of all households.
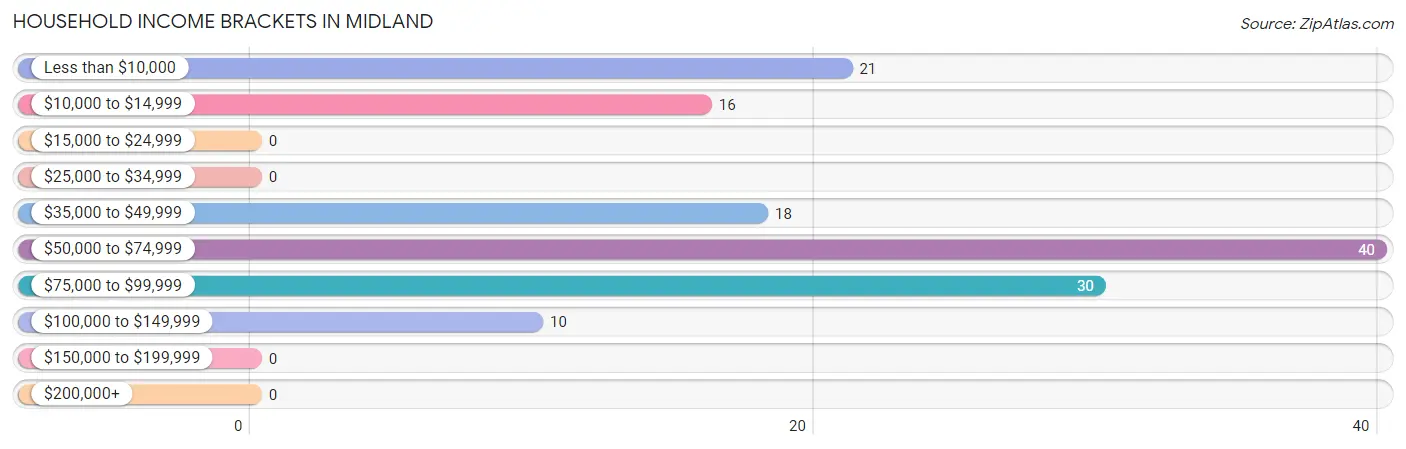
| Income Bracket | # Households | % Households |
| Less than $10,000 | 21 | 15.6% |
| $10,000 to $14,999 | 16 | 11.9% |
| $15,000 to $24,999 | 0 | 0.0% |
| $25,000 to $34,999 | 0 | 0.0% |
| $35,000 to $49,999 | 18 | 13.3% |
| $50,000 to $74,999 | 40 | 29.6% |
| $75,000 to $99,999 | 30 | 22.2% |
| $100,000 to $149,999 | 10 | 7.4% |
| $150,000 to $199,999 | 0 | 0.0% |
| $200,000+ | 0 | 0.0% |
Household Income by Householder Age in Midland
| Income Bracket | # Households | Median Income |
| 15 to 24 Years | 0 (0.0%) | $0 |
| 25 to 44 Years | 40 (29.6%) | $0 |
| 45 to 64 Years | 57 (42.2%) | $0 |
| 65+ Years | 38 (28.1%) | $0 |
| Total | 135 (100.0%) | $53,281 |
Poverty in Midland
Income Below Poverty by Sex and Age in Midland
With 11.8% poverty level for males and 17.6% for females among the residents of Midland, 55 to 64 year old males and 45 to 54 year old females are the most vulnerable to poverty, with 16 males (44.4%) and 21 females (100.0%) in their respective age groups living below the poverty level.
| Age Bracket | Male | Female |
| Under 5 Years | 0 (0.0%) | 0 (0.0%) |
| 5 Years | 0 (0.0%) | 0 (0.0%) |
| 6 to 11 Years | 0 (0.0%) | 0 (0.0%) |
| 12 to 14 Years | 0 (0.0%) | 0 (0.0%) |
| 15 Years | 0 (0.0%) | 0 (0.0%) |
| 16 and 17 Years | 0 (0.0%) | 0 (0.0%) |
| 18 to 24 Years | 0 (0.0%) | 0 (0.0%) |
| 25 to 34 Years | 0 (0.0%) | 0 (0.0%) |
| 35 to 44 Years | 0 (0.0%) | 0 (0.0%) |
| 45 to 54 Years | 0 (0.0%) | 21 (100.0%) |
| 55 to 64 Years | 16 (44.4%) | 0 (0.0%) |
| 65 to 74 Years | 0 (0.0%) | 0 (0.0%) |
| 75 Years and over | 0 (0.0%) | 0 (0.0%) |
| Total | 16 (11.8%) | 21 (17.6%) |
Income Above Poverty by Sex and Age in Midland
According to the poverty statistics in Midland, males aged under 5 years and females aged 35 to 44 years are the age groups that are most secure financially, with 100.0% of males and 100.0% of females in these age groups living above the poverty line.
| Age Bracket | Male | Female |
| Under 5 Years | 30 (100.0%) | 0 (0.0%) |
| 5 Years | 0 (0.0%) | 0 (0.0%) |
| 6 to 11 Years | 31 (100.0%) | 0 (0.0%) |
| 12 to 14 Years | 0 (0.0%) | 0 (0.0%) |
| 15 Years | 0 (0.0%) | 0 (0.0%) |
| 16 and 17 Years | 0 (0.0%) | 0 (0.0%) |
| 18 to 24 Years | 0 (0.0%) | 0 (0.0%) |
| 25 to 34 Years | 39 (100.0%) | 0 (0.0%) |
| 35 to 44 Years | 0 (0.0%) | 40 (100.0%) |
| 45 to 54 Years | 0 (0.0%) | 0 (0.0%) |
| 55 to 64 Years | 20 (55.6%) | 20 (100.0%) |
| 65 to 74 Years | 0 (0.0%) | 38 (100.0%) |
| 75 Years and over | 0 (0.0%) | 0 (0.0%) |
| Total | 120 (88.2%) | 98 (82.4%) |
Income Below Poverty Among Married-Couple Families in Midland
| Children | Above Poverty | Below Poverty |
| No Children | 20 (100.0%) | 0 (0.0%) |
| 1 or 2 Children | 40 (100.0%) | 0 (0.0%) |
| 3 or 4 Children | 0 (0.0%) | 0 (0.0%) |
| 5 or more Children | 0 (0.0%) | 0 (0.0%) |
| Total | 60 (100.0%) | 0 (0.0%) |
Income Below Poverty Among Single-Parent Households in Midland
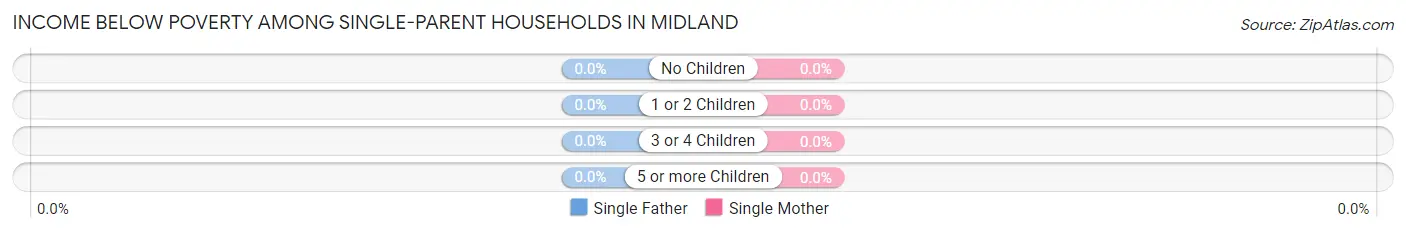
| Children | Single Father | Single Mother |
| No Children | 0 (0.0%) | 0 (0.0%) |
| 1 or 2 Children | 0 (0.0%) | 0 (0.0%) |
| 3 or 4 Children | 0 (0.0%) | 0 (0.0%) |
| 5 or more Children | 0 (0.0%) | 0 (0.0%) |
| Total | 0 (0.0%) | 0 (0.0%) |
Income Below Poverty Among Married-Couple vs Single-Parent Households in Midland
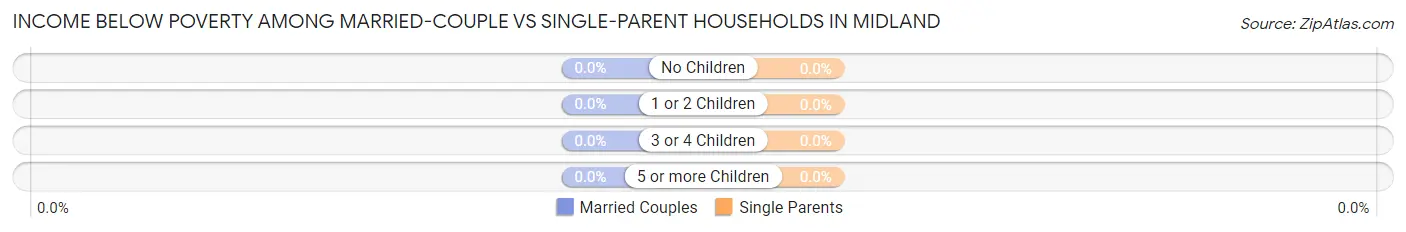
| Children | Married-Couple Families | Single-Parent Households |
| No Children | 0 (0.0%) | 0 (0.0%) |
| 1 or 2 Children | 0 (0.0%) | 0 (0.0%) |
| 3 or 4 Children | 0 (0.0%) | 0 (0.0%) |
| 5 or more Children | 0 (0.0%) | 0 (0.0%) |
| Total | 0 (0.0%) | 0 (0.0%) |
Race in Midland
The most populous races in Midland are White / Caucasian (255 | 100.0%), and Hispanic or Latino (100 | 39.2%).
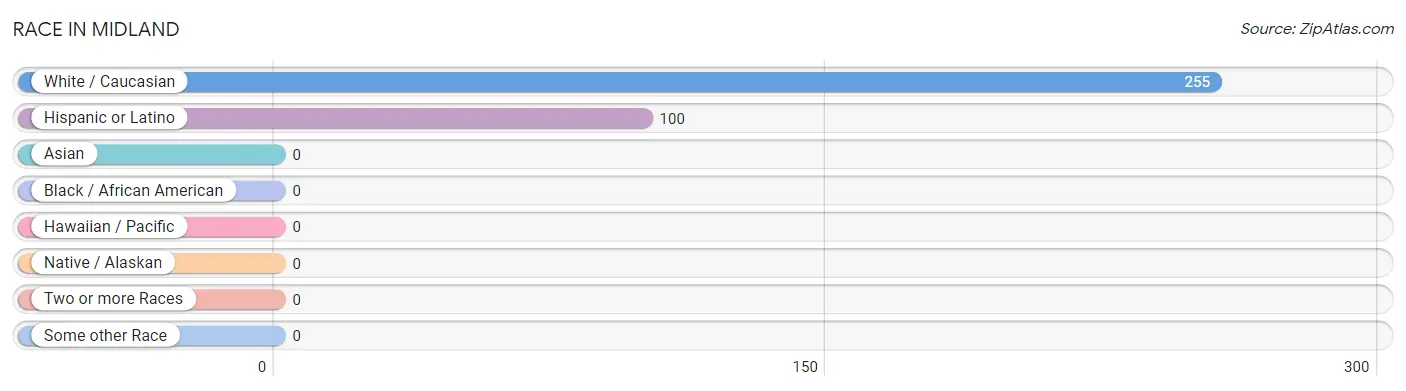
| Race | # Population | % Population |
| Asian | 0 | 0.0% |
| Black / African American | 0 | 0.0% |
| Hawaiian / Pacific | 0 | 0.0% |
| Hispanic or Latino | 100 | 39.2% |
| Native / Alaskan | 0 | 0.0% |
| White / Caucasian | 255 | 100.0% |
| Two or more Races | 0 | 0.0% |
| Some other Race | 0 | 0.0% |
| Total | 255 | 100.0% |
Ancestry in Midland
The most populous ancestries reported in Midland are German (111 | 43.5%), Colombian (100 | 39.2%), South American (100 | 39.2%), Irish (48 | 18.8%), and English (34 | 13.3%), together accounting for 154.1% of all Midland residents.
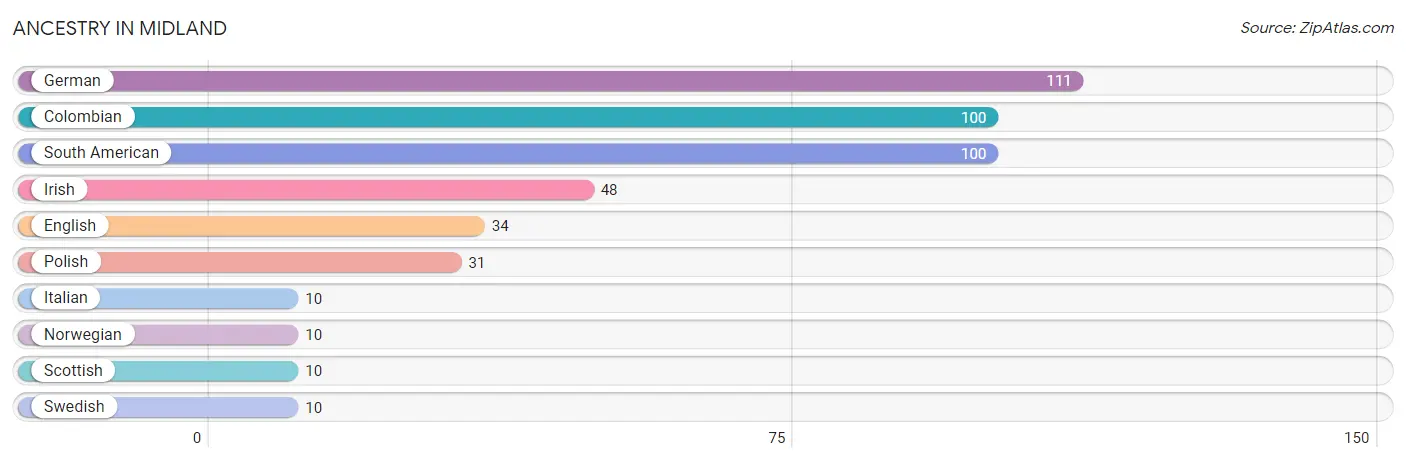
| Ancestry | # Population | % Population |
| Colombian | 100 | 39.2% |
| English | 34 | 13.3% |
| German | 111 | 43.5% |
| Irish | 48 | 18.8% |
| Italian | 10 | 3.9% |
| Norwegian | 10 | 3.9% |
| Polish | 31 | 12.2% |
| Scottish | 10 | 3.9% |
| South American | 100 | 39.2% |
| Swedish | 10 | 3.9% | View All 10 Rows |
Immigrants in Midland
The most numerous immigrant groups reported in Midland came from Colombia (39 | 15.3%), Latin America (39 | 15.3%), and South America (39 | 15.3%), together accounting for 45.9% of all Midland residents.
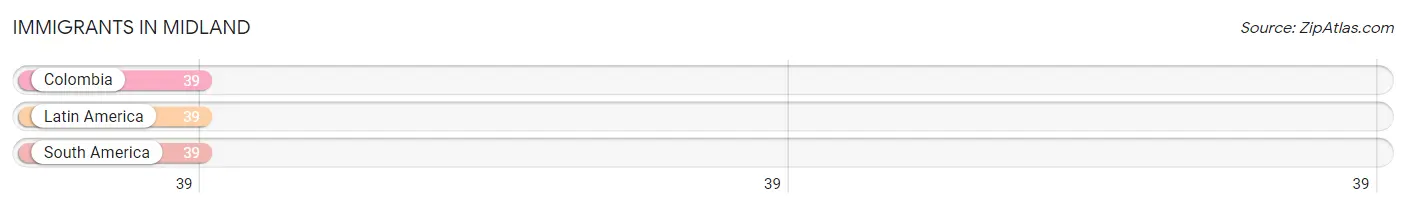
| Immigration Origin | # Population | % Population |
| Colombia | 39 | 15.3% |
| Latin America | 39 | 15.3% |
| South America | 39 | 15.3% | View All 3 Rows |
Sex and Age in Midland
Sex and Age in Midland
The most populous age groups in Midland are 30 to 34 Years (39 | 28.7%) for men and 35 to 39 Years (40 | 33.6%) for women.
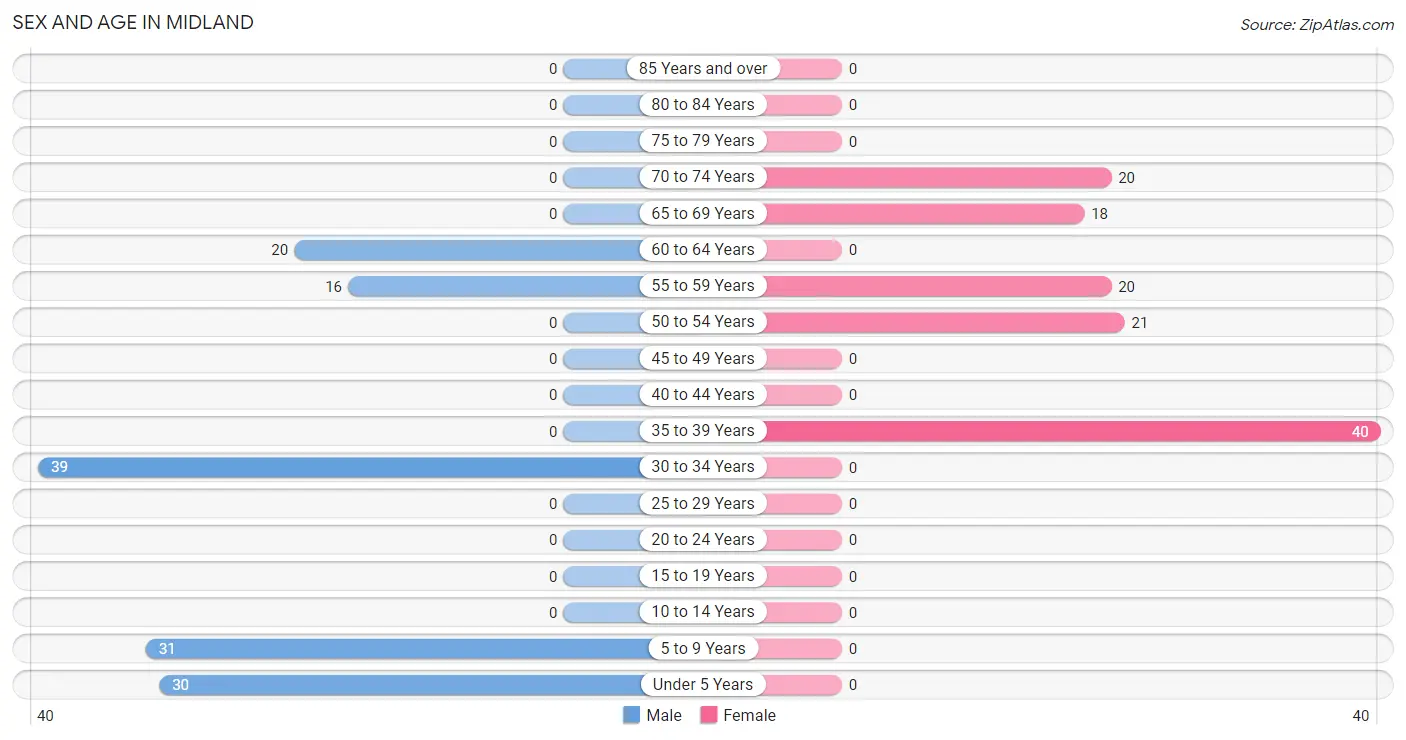
| Age Bracket | Male | Female |
| Under 5 Years | 30 (22.1%) | 0 (0.0%) |
| 5 to 9 Years | 31 (22.8%) | 0 (0.0%) |
| 10 to 14 Years | 0 (0.0%) | 0 (0.0%) |
| 15 to 19 Years | 0 (0.0%) | 0 (0.0%) |
| 20 to 24 Years | 0 (0.0%) | 0 (0.0%) |
| 25 to 29 Years | 0 (0.0%) | 0 (0.0%) |
| 30 to 34 Years | 39 (28.7%) | 0 (0.0%) |
| 35 to 39 Years | 0 (0.0%) | 40 (33.6%) |
| 40 to 44 Years | 0 (0.0%) | 0 (0.0%) |
| 45 to 49 Years | 0 (0.0%) | 0 (0.0%) |
| 50 to 54 Years | 0 (0.0%) | 21 (17.6%) |
| 55 to 59 Years | 16 (11.8%) | 20 (16.8%) |
| 60 to 64 Years | 20 (14.7%) | 0 (0.0%) |
| 65 to 69 Years | 0 (0.0%) | 18 (15.1%) |
| 70 to 74 Years | 0 (0.0%) | 20 (16.8%) |
| 75 to 79 Years | 0 (0.0%) | 0 (0.0%) |
| 80 to 84 Years | 0 (0.0%) | 0 (0.0%) |
| 85 Years and over | 0 (0.0%) | 0 (0.0%) |
| Total | 136 (100.0%) | 119 (100.0%) |
Families and Households in Midland
Median Family Size in Midland
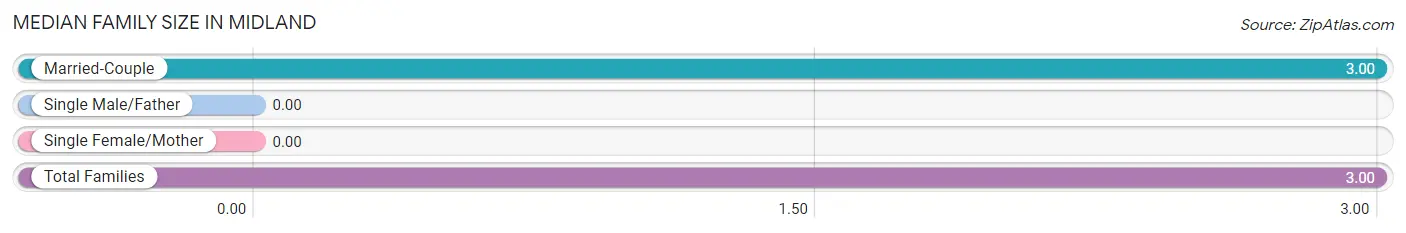
| Family Type | # Families | Family Size |
| Married-Couple | 60 (100.0%) | 3.00 |
| Single Male/Father | 0 (0.0%) | - |
| Single Female/Mother | 0 (0.0%) | - |
| Total Families | 60 (100.0%) | 3.00 |
Median Household Size in Midland
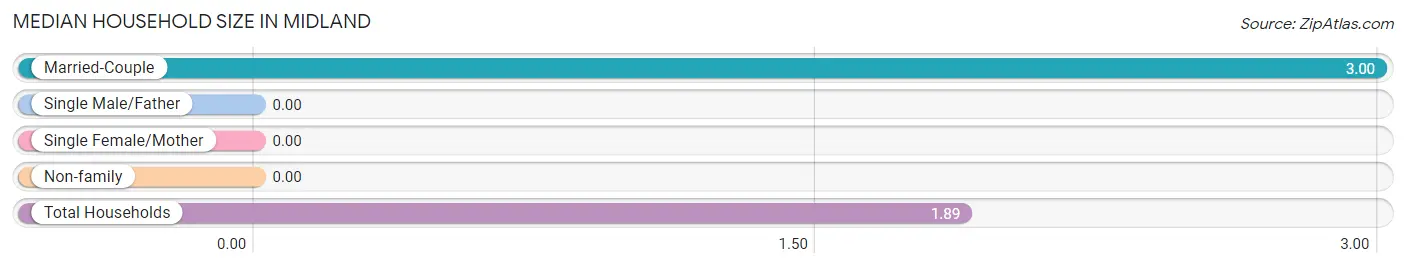
| Household Type | # Households | Household Size |
| Married-Couple | 60 (44.4%) | 3.00 |
| Single Male/Father | 0 (0.0%) | - |
| Single Female/Mother | 0 (0.0%) | - |
| Non-family | 75 (55.6%) | - |
| Total Households | 135 (100.0%) | 1.89 |
Household Size by Marriage Status in Midland
Out of a total of 135 households in Midland, 60 (44.4%) are family households, while 75 (55.6%) are nonfamily households. The most numerous type of family households are 4-person households, comprising 40, and the most common type of nonfamily households are 1-person households, comprising 75.
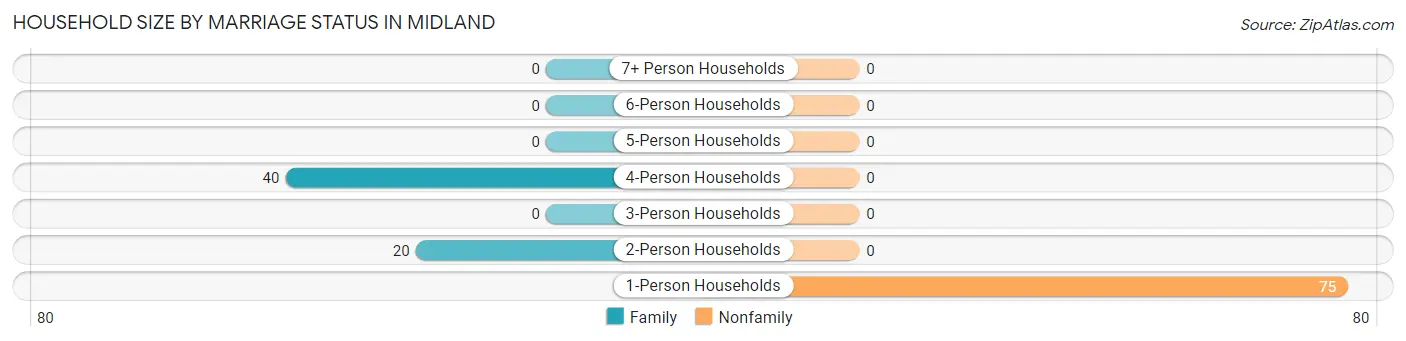
| Household Size | Family Households | Nonfamily Households |
| 1-Person Households | - | 75 (55.6%) |
| 2-Person Households | 20 (14.8%) | 0 (0.0%) |
| 3-Person Households | 0 (0.0%) | 0 (0.0%) |
| 4-Person Households | 40 (29.6%) | 0 (0.0%) |
| 5-Person Households | 0 (0.0%) | 0 (0.0%) |
| 6-Person Households | 0 (0.0%) | 0 (0.0%) |
| 7+ Person Households | 0 (0.0%) | 0 (0.0%) |
| Total | 60 (44.4%) | 75 (55.6%) |
Female Fertility in Midland
Fertility by Age in Midland
| Age Bracket | Women with Births | Births / 1,000 Women |
| 15 to 19 years | 0 (0.0%) | 0.0 |
| 20 to 34 years | 0 (0.0%) | 0.0 |
| 35 to 50 years | 0 (0.0%) | 0.0 |
| Total | 0 (0.0%) | 0.0 |
Fertility by Age by Marriage Status in Midland
| Age Bracket | Married | Unmarried |
| 15 to 19 years | 0 (0.0%) | 0 (0.0%) |
| 20 to 34 years | 0 (0.0%) | 0 (0.0%) |
| 35 to 50 years | 0 (0.0%) | 0 (0.0%) |
| Total | 0 (0.0%) | 0 (0.0%) |
Fertility by Education in Midland
| Educational Attainment | Women with Births | Births / 1,000 Women |
| Less than High School | 0 (0.0%) | 0.0 |
| High School Diploma | 0 (0.0%) | 0.0 |
| College or Associate's Degree | 0 (0.0%) | 0.0 |
| Bachelor's Degree | 0 (0.0%) | 0.0 |
| Graduate Degree | 0 (0.0%) | 0.0 |
| Total | 0 (0.0%) | 0.0 |
Fertility by Education by Marriage Status in Midland
| Educational Attainment | Married | Unmarried |
| Less than High School | 0 (0.0%) | 0 (0.0%) |
| High School Diploma | 0 (0.0%) | 0 (0.0%) |
| College or Associate's Degree | 0 (0.0%) | 0 (0.0%) |
| Bachelor's Degree | 0 (0.0%) | 0 (0.0%) |
| Graduate Degree | 0 (0.0%) | 0 (0.0%) |
| Total | 0 (0.0%) | 0 (0.0%) |
Employment Characteristics in Midland
Employment by Class of Employer in Midland
Among the 67 employed individuals in Midland, , and private company employees (67 | 100.0%) make up the most common classes of employment.
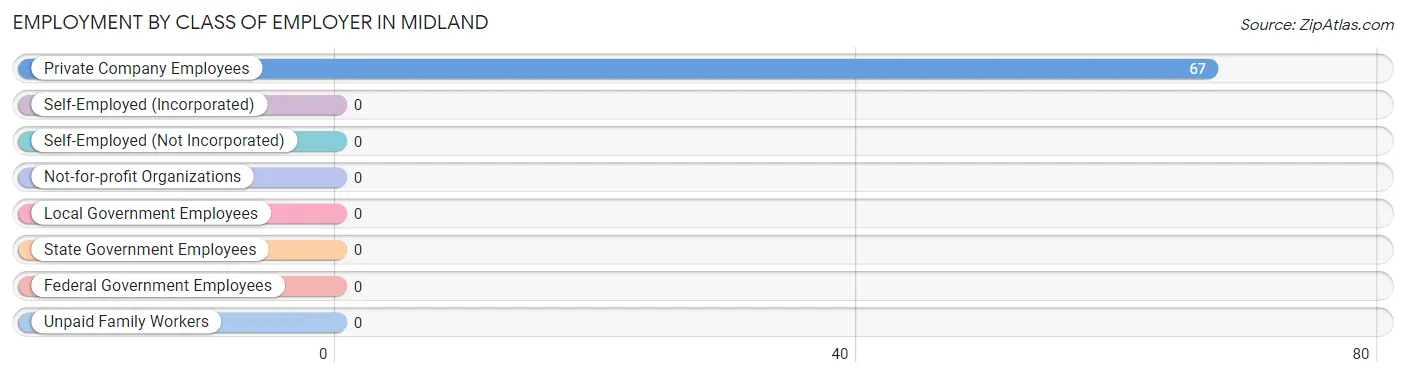
| Employer Class | # Employees | % Employees |
| Private Company Employees | 67 | 100.0% |
| Self-Employed (Incorporated) | 0 | 0.0% |
| Self-Employed (Not Incorporated) | 0 | 0.0% |
| Not-for-profit Organizations | 0 | 0.0% |
| Local Government Employees | 0 | 0.0% |
| State Government Employees | 0 | 0.0% |
| Federal Government Employees | 0 | 0.0% |
| Unpaid Family Workers | 0 | 0.0% |
| Total | 67 | 100.0% |
Employment Status by Age in Midland
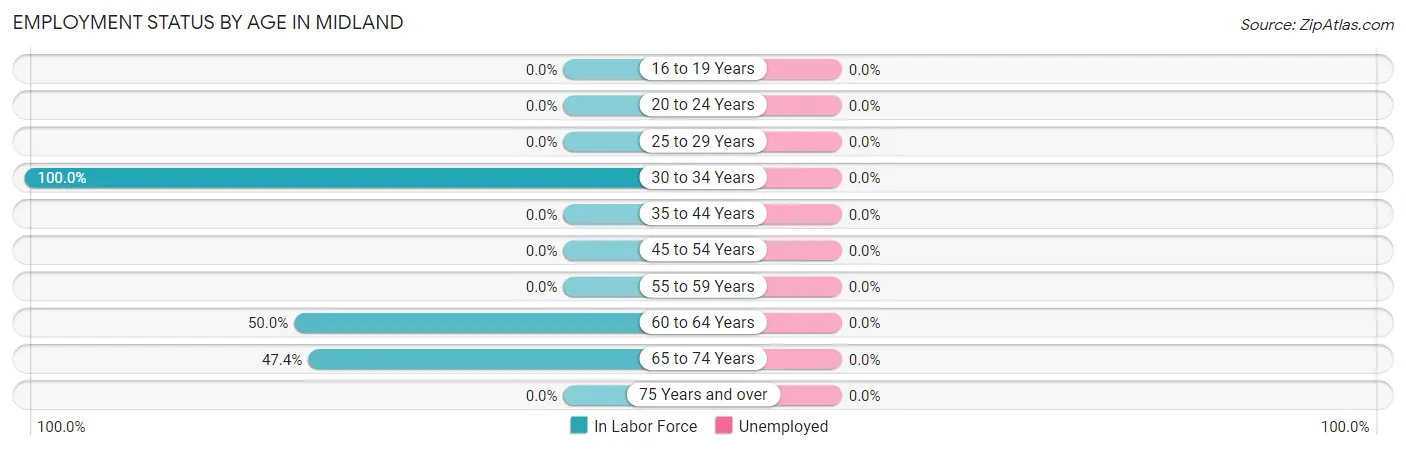
| Age Bracket | In Labor Force | Unemployed |
| 16 to 19 Years | 0 (0.0%) | 0 (0.0%) |
| 20 to 24 Years | 0 (0.0%) | 0 (0.0%) |
| 25 to 29 Years | 0 (0.0%) | 0 (0.0%) |
| 30 to 34 Years | 39 (100.0%) | 0 (0.0%) |
| 35 to 44 Years | 0 (0.0%) | 0 (0.0%) |
| 45 to 54 Years | 0 (0.0%) | 0 (0.0%) |
| 55 to 59 Years | 0 (0.0%) | 0 (0.0%) |
| 60 to 64 Years | 10 (50.0%) | 0 (0.0%) |
| 65 to 74 Years | 18 (47.4%) | 0 (0.0%) |
| 75 Years and over | 0 (0.0%) | 0 (0.0%) |
| Total | 67 (34.5%) | 0 (0.0%) |
Employment Status by Educational Attainment in Midland
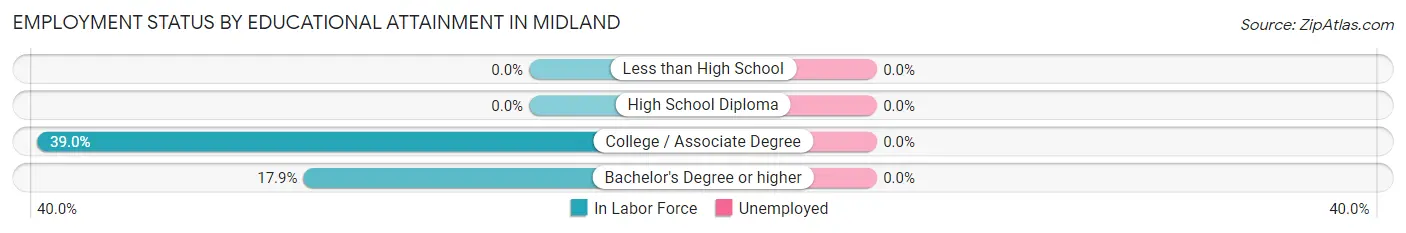
| Educational Attainment | In Labor Force | Unemployed |
| Less than High School | 0 (0.0%) | 0 (0.0%) |
| High School Diploma | 0 (0.0%) | 0 (0.0%) |
| College / Associate Degree | 39 (39.0%) | 0 (0.0%) |
| Bachelor's Degree or higher | 10 (17.9%) | 0 (0.0%) |
| Total | 49 (31.4%) | 0 (0.0%) |
Employment Occupations by Sex in Midland
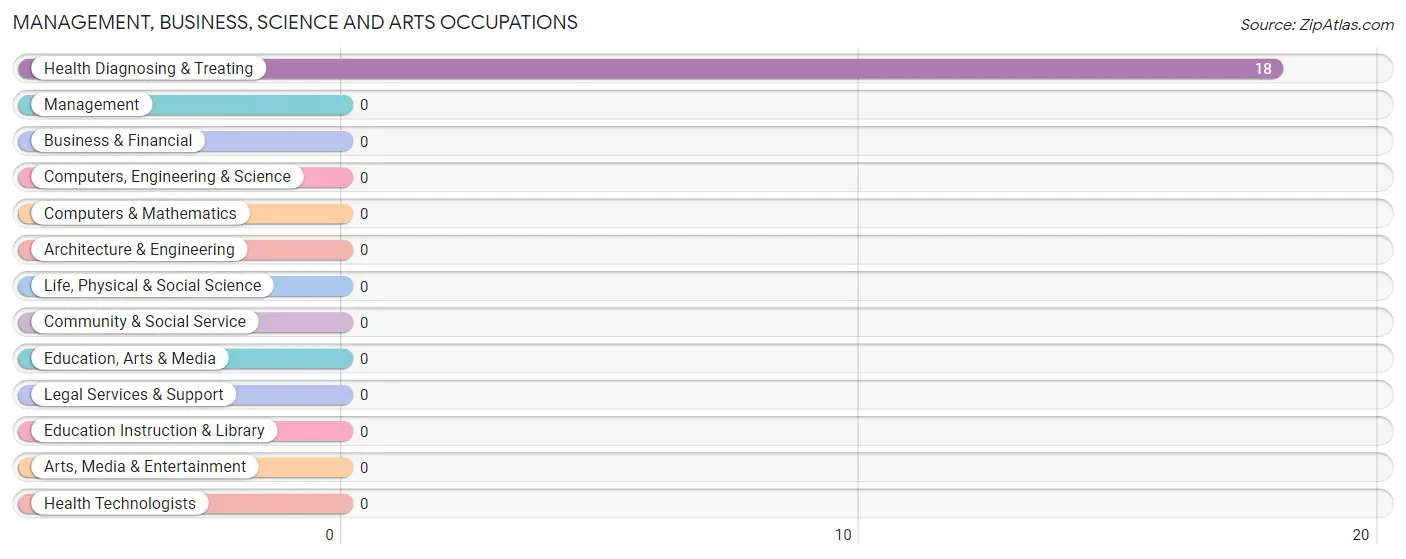
Management, Business, Science and Arts Occupations
The most common Management, Business, Science and Arts occupations in Midland are , and Health Diagnosing & Treating (18 | 26.9%).
Management, Business, Science and Arts Occupations by Sex
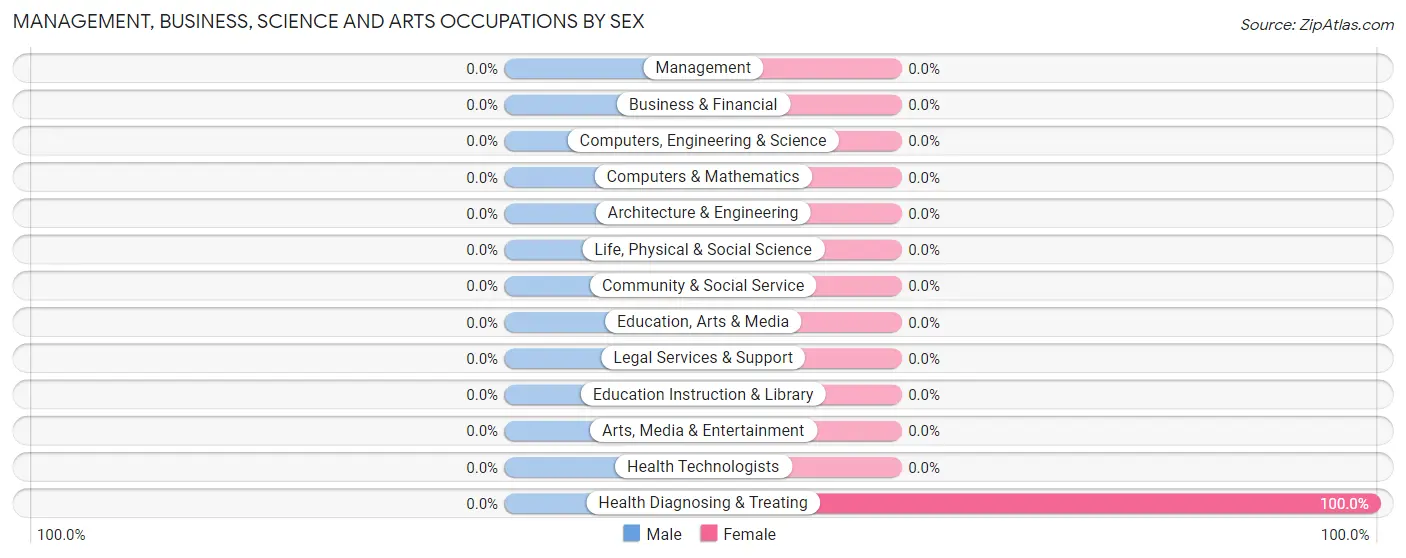
| Occupation | Male | Female |
| Management | 0 (0.0%) | 0 (0.0%) |
| Business & Financial | 0 (0.0%) | 0 (0.0%) |
| Computers, Engineering & Science | 0 (0.0%) | 0 (0.0%) |
| Computers & Mathematics | 0 (0.0%) | 0 (0.0%) |
| Architecture & Engineering | 0 (0.0%) | 0 (0.0%) |
| Life, Physical & Social Science | 0 (0.0%) | 0 (0.0%) |
| Community & Social Service | 0 (0.0%) | 0 (0.0%) |
| Education, Arts & Media | 0 (0.0%) | 0 (0.0%) |
| Legal Services & Support | 0 (0.0%) | 0 (0.0%) |
| Education Instruction & Library | 0 (0.0%) | 0 (0.0%) |
| Arts, Media & Entertainment | 0 (0.0%) | 0 (0.0%) |
| Health Diagnosing & Treating | 0 (0.0%) | 18 (100.0%) |
| Health Technologists | 0 (0.0%) | 0 (0.0%) |
| Total (Category) | 0 (0.0%) | 18 (100.0%) |
| Total (Overall) | 49 (73.1%) | 18 (26.9%) |
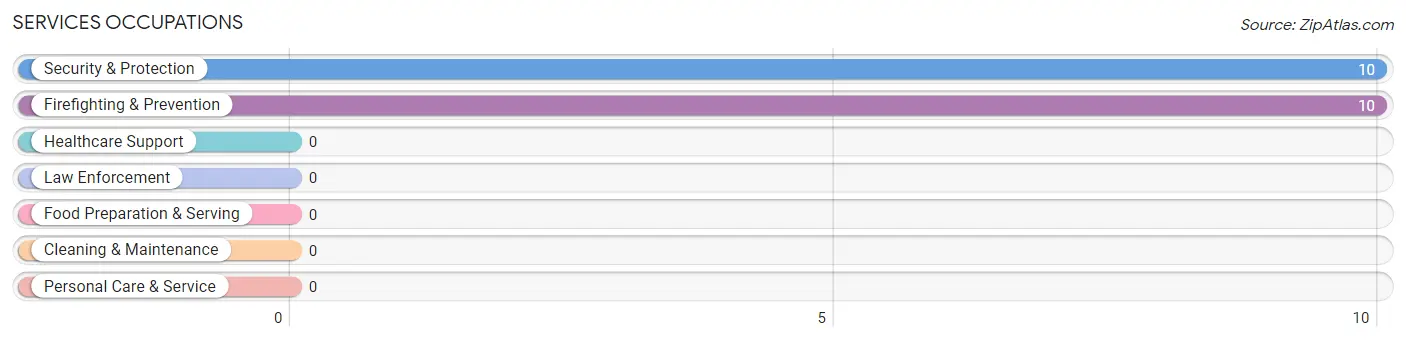
Services Occupations
The most common Services occupations in Midland are Security & Protection (10 | 14.9%), and Firefighting & Prevention (10 | 14.9%).
Services Occupations by Sex
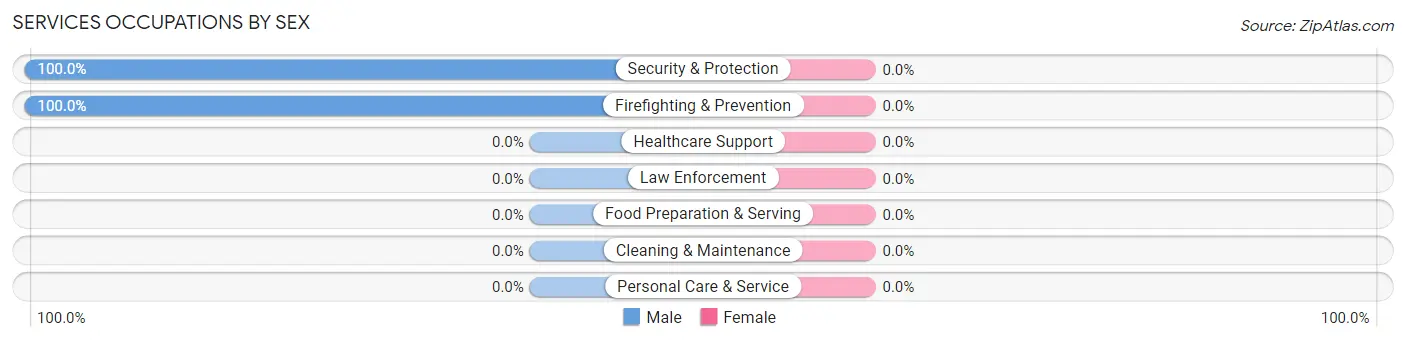
| Occupation | Male | Female |
| Healthcare Support | 0 (0.0%) | 0 (0.0%) |
| Security & Protection | 10 (100.0%) | 0 (0.0%) |
| Firefighting & Prevention | 10 (100.0%) | 0 (0.0%) |
| Law Enforcement | 0 (0.0%) | 0 (0.0%) |
| Food Preparation & Serving | 0 (0.0%) | 0 (0.0%) |
| Cleaning & Maintenance | 0 (0.0%) | 0 (0.0%) |
| Personal Care & Service | 0 (0.0%) | 0 (0.0%) |
| Total (Category) | 10 (100.0%) | 0 (0.0%) |
| Total (Overall) | 49 (73.1%) | 18 (26.9%) |
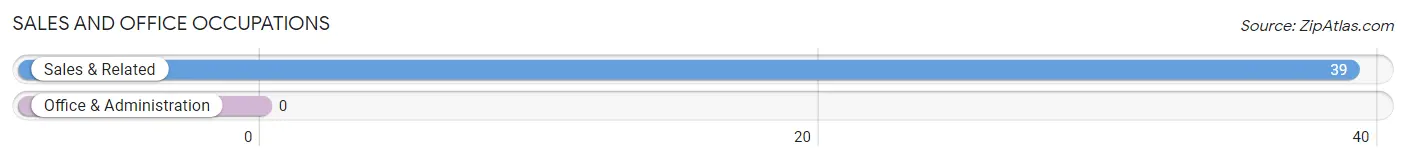
Sales and Office Occupations
The most common Sales and Office occupations in Midland are , and Sales & Related (39 | 58.2%).
Sales and Office Occupations by Sex

| Occupation | Male | Female |
| Sales & Related | 39 (100.0%) | 0 (0.0%) |
| Office & Administration | 0 (0.0%) | 0 (0.0%) |
| Total (Category) | 39 (100.0%) | 0 (0.0%) |
| Total (Overall) | 49 (73.1%) | 18 (26.9%) |
Natural Resources, Construction and Maintenance Occupations
Natural Resources, Construction and Maintenance Occupations by Sex
| Occupation | Male | Female |
| Farming, Fishing & Forestry | 0 (0.0%) | 0 (0.0%) |
| Construction & Extraction | 0 (0.0%) | 0 (0.0%) |
| Installation, Maintenance & Repair | 0 (0.0%) | 0 (0.0%) |
| Total (Category) | 0 (0.0%) | 0 (0.0%) |
| Total (Overall) | 49 (73.1%) | 18 (26.9%) |
Production, Transportation and Moving Occupations
Production, Transportation and Moving Occupations by Sex
| Occupation | Male | Female |
| Production | 0 (0.0%) | 0 (0.0%) |
| Transportation | 0 (0.0%) | 0 (0.0%) |
| Material Moving | 0 (0.0%) | 0 (0.0%) |
| Total (Category) | 0 (0.0%) | 0 (0.0%) |
| Total (Overall) | 49 (73.1%) | 18 (26.9%) |
Employment Industries by Sex in Midland
Employment Industries in Midland
The major employment industries in Midland include Retail Trade (39 | 58.2%), Health Care & Social Assistance (18 | 26.9%), and Arts, Entertainment & Recreation (10 | 14.9%).
Employment Industries by Sex in Midland
| Industry | Male | Female |
| Agriculture, Fishing & Hunting | 0 (0.0%) | 0 (0.0%) |
| Mining, Quarrying, & Extraction | 0 (0.0%) | 0 (0.0%) |
| Construction | 0 (0.0%) | 0 (0.0%) |
| Manufacturing | 0 (0.0%) | 0 (0.0%) |
| Wholesale Trade | 0 (0.0%) | 0 (0.0%) |
| Retail Trade | 39 (100.0%) | 0 (0.0%) |
| Transportation & Warehousing | 0 (0.0%) | 0 (0.0%) |
| Utilities | 0 (0.0%) | 0 (0.0%) |
| Information | 0 (0.0%) | 0 (0.0%) |
| Finance & Insurance | 0 (0.0%) | 0 (0.0%) |
| Real Estate, Rental & Leasing | 0 (0.0%) | 0 (0.0%) |
| Professional & Scientific | 0 (0.0%) | 0 (0.0%) |
| Enterprise Management | 0 (0.0%) | 0 (0.0%) |
| Administrative & Support | 0 (0.0%) | 0 (0.0%) |
| Educational Services | 0 (0.0%) | 0 (0.0%) |
| Health Care & Social Assistance | 0 (0.0%) | 18 (100.0%) |
| Arts, Entertainment & Recreation | 10 (100.0%) | 0 (0.0%) |
| Accommodation & Food Services | 0 (0.0%) | 0 (0.0%) |
| Public Administration | 0 (0.0%) | 0 (0.0%) |
| Total | 49 (73.1%) | 18 (26.9%) |
Education in Midland
School Enrollment in Midland
| School Level | # Students | % Students |
| Nursery / Preschool | 0 | 0.0% |
| Kindergarten | 31 | 100.0% |
| Elementary School | 0 | 0.0% |
| Middle School | 0 | 0.0% |
| High School | 0 | 0.0% |
| College / Undergraduate | 0 | 0.0% |
| Graduate / Professional | 0 | 0.0% |
| Total | 31 | 100.0% |
School Enrollment by Age by Funding Source in Midland
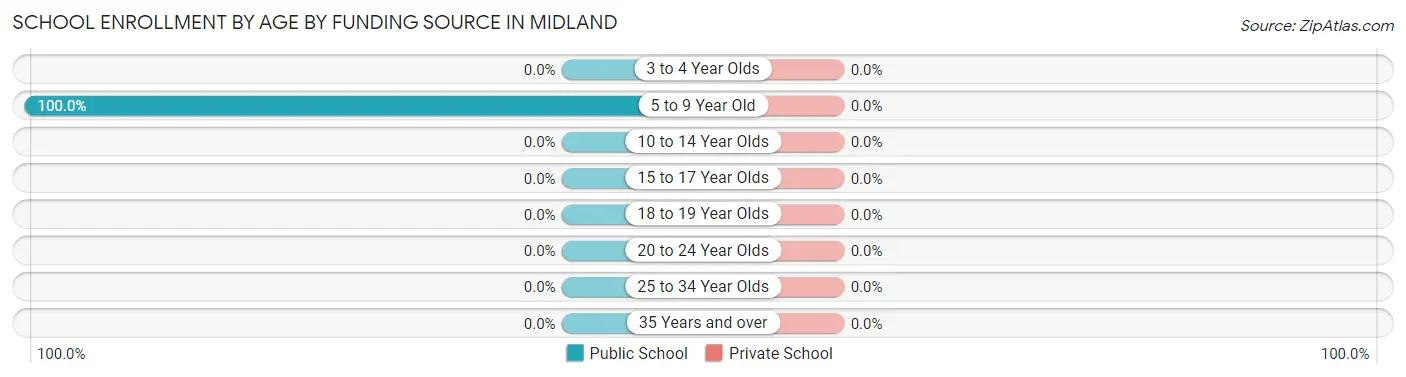
| Age Bracket | Public School | Private School |
| 3 to 4 Year Olds | 0 (0.0%) | 0 (0.0%) |
| 5 to 9 Year Old | 31 (100.0%) | 0 (0.0%) |
| 10 to 14 Year Olds | 0 (0.0%) | 0 (0.0%) |
| 15 to 17 Year Olds | 0 (0.0%) | 0 (0.0%) |
| 18 to 19 Year Olds | 0 (0.0%) | 0 (0.0%) |
| 20 to 24 Year Olds | 0 (0.0%) | 0 (0.0%) |
| 25 to 34 Year Olds | 0 (0.0%) | 0 (0.0%) |
| 35 Years and over | 0 (0.0%) | 0 (0.0%) |
| Total | 31 (100.0%) | 0 (0.0%) |
Educational Attainment by Field of Study in Midland
Science & technology (26 | 46.4%), business (10 | 17.9%), education (10 | 17.9%), and literature & languages (10 | 17.9%) are the most common fields of study among 56 individuals in Midland who have obtained a bachelor's degree or higher.
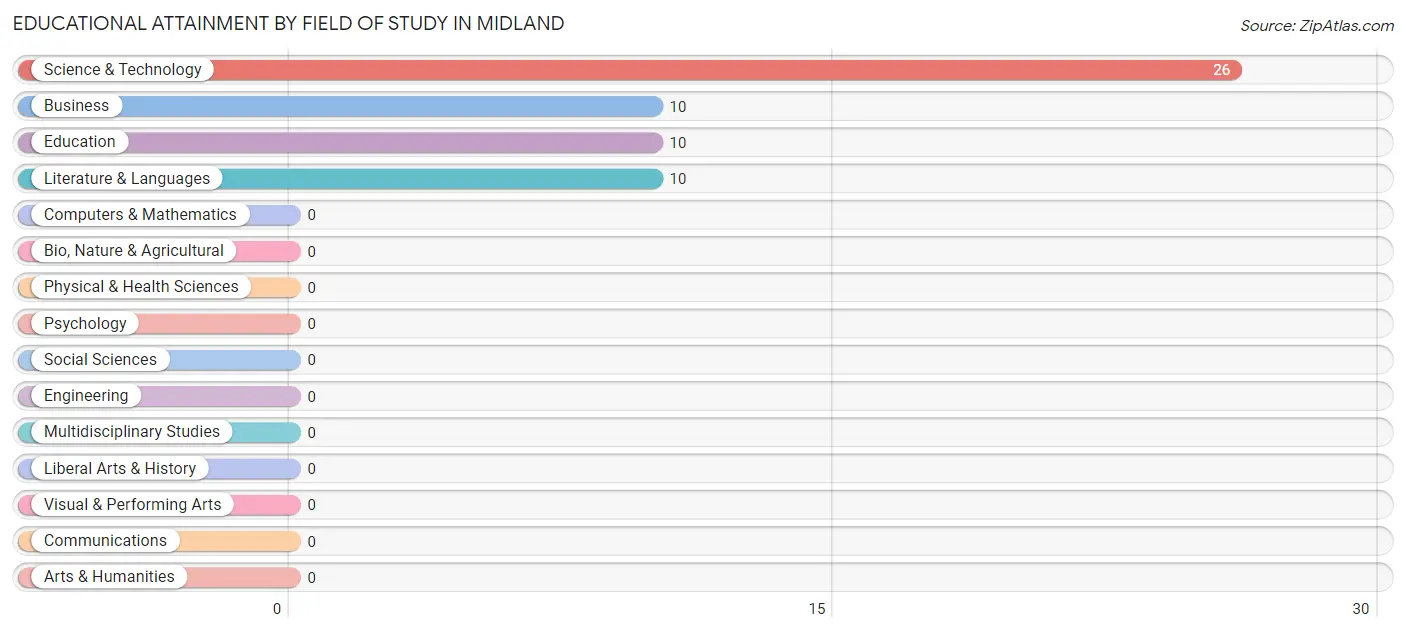
| Field of Study | # Graduates | % Graduates |
| Computers & Mathematics | 0 | 0.0% |
| Bio, Nature & Agricultural | 0 | 0.0% |
| Physical & Health Sciences | 0 | 0.0% |
| Psychology | 0 | 0.0% |
| Social Sciences | 0 | 0.0% |
| Engineering | 0 | 0.0% |
| Multidisciplinary Studies | 0 | 0.0% |
| Science & Technology | 26 | 46.4% |
| Business | 10 | 17.9% |
| Education | 10 | 17.9% |
| Literature & Languages | 10 | 17.9% |
| Liberal Arts & History | 0 | 0.0% |
| Visual & Performing Arts | 0 | 0.0% |
| Communications | 0 | 0.0% |
| Arts & Humanities | 0 | 0.0% |
| Total | 56 | 100.0% |
Transportation & Commute in Midland
Vehicle Availability by Sex in Midland
The most prevalent vehicle ownership categories in Midland are males with 1 vehicle (39, accounting for 79.6%) and females with 1 vehicle (18, making up 216.7%).
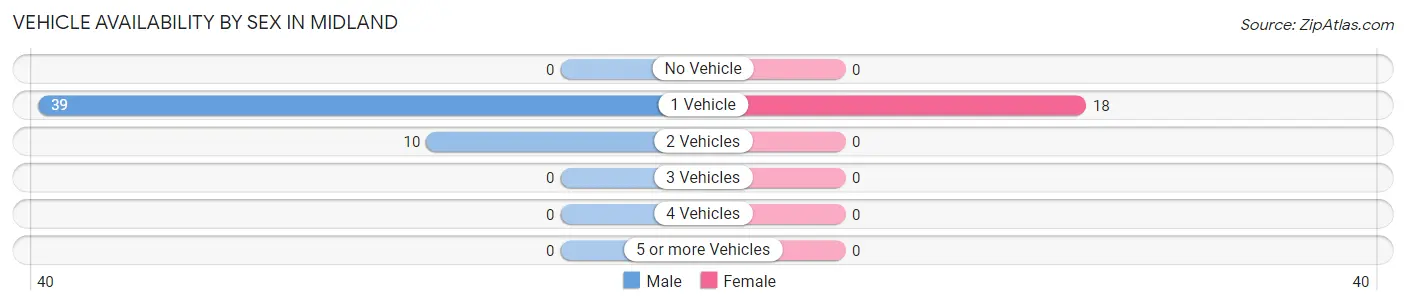
| Vehicles Available | Male | Female |
| No Vehicle | 0 (0.0%) | 0 (0.0%) |
| 1 Vehicle | 39 (79.6%) | 18 (100.0%) |
| 2 Vehicles | 10 (20.4%) | 0 (0.0%) |
| 3 Vehicles | 0 (0.0%) | 0 (0.0%) |
| 4 Vehicles | 0 (0.0%) | 0 (0.0%) |
| 5 or more Vehicles | 0 (0.0%) | 0 (0.0%) |
| Total | 49 (100.0%) | 18 (100.0%) |
Commute Time in Midland
The most frequently occuring commute durations in Midland are 60 to 89 minutes (39 commuters, 58.2%), 15 to 19 minutes (18 commuters, 26.9%), and 25 to 29 minutes (10 commuters, 14.9%).
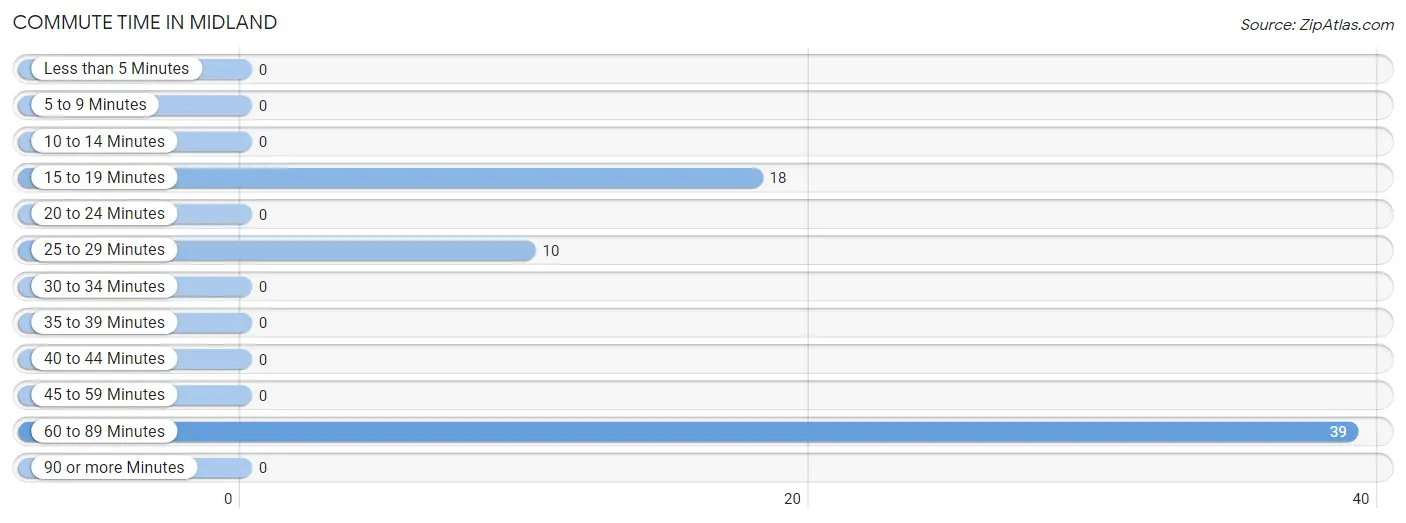
| Commute Time | # Commuters | % Commuters |
| Less than 5 Minutes | 0 | 0.0% |
| 5 to 9 Minutes | 0 | 0.0% |
| 10 to 14 Minutes | 0 | 0.0% |
| 15 to 19 Minutes | 18 | 26.9% |
| 20 to 24 Minutes | 0 | 0.0% |
| 25 to 29 Minutes | 10 | 14.9% |
| 30 to 34 Minutes | 0 | 0.0% |
| 35 to 39 Minutes | 0 | 0.0% |
| 40 to 44 Minutes | 0 | 0.0% |
| 45 to 59 Minutes | 0 | 0.0% |
| 60 to 89 Minutes | 39 | 58.2% |
| 90 or more Minutes | 0 | 0.0% |
Commute Time by Sex in Midland
The most common commute times in Midland are 60 to 89 minutes (39 commuters, 79.6%) for males and 15 to 19 minutes (18 commuters, 100.0%) for females.
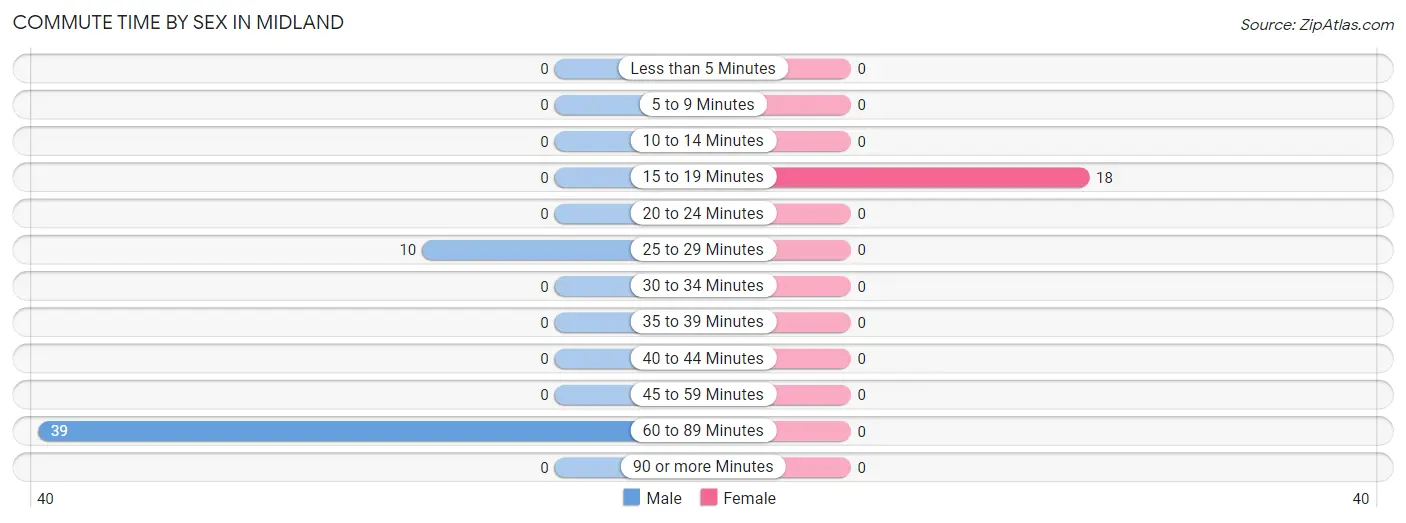
| Commute Time | Male | Female |
| Less than 5 Minutes | 0 (0.0%) | 0 (0.0%) |
| 5 to 9 Minutes | 0 (0.0%) | 0 (0.0%) |
| 10 to 14 Minutes | 0 (0.0%) | 0 (0.0%) |
| 15 to 19 Minutes | 0 (0.0%) | 18 (100.0%) |
| 20 to 24 Minutes | 0 (0.0%) | 0 (0.0%) |
| 25 to 29 Minutes | 10 (20.4%) | 0 (0.0%) |
| 30 to 34 Minutes | 0 (0.0%) | 0 (0.0%) |
| 35 to 39 Minutes | 0 (0.0%) | 0 (0.0%) |
| 40 to 44 Minutes | 0 (0.0%) | 0 (0.0%) |
| 45 to 59 Minutes | 0 (0.0%) | 0 (0.0%) |
| 60 to 89 Minutes | 39 (79.6%) | 0 (0.0%) |
| 90 or more Minutes | 0 (0.0%) | 0 (0.0%) |
Time of Departure to Work by Sex in Midland
The most frequent times of departure to work in Midland are 8:00 AM to 8:29 AM (39, 79.6%) for males and 4:00 PM to 11:59 PM (18, 100.0%) for females.
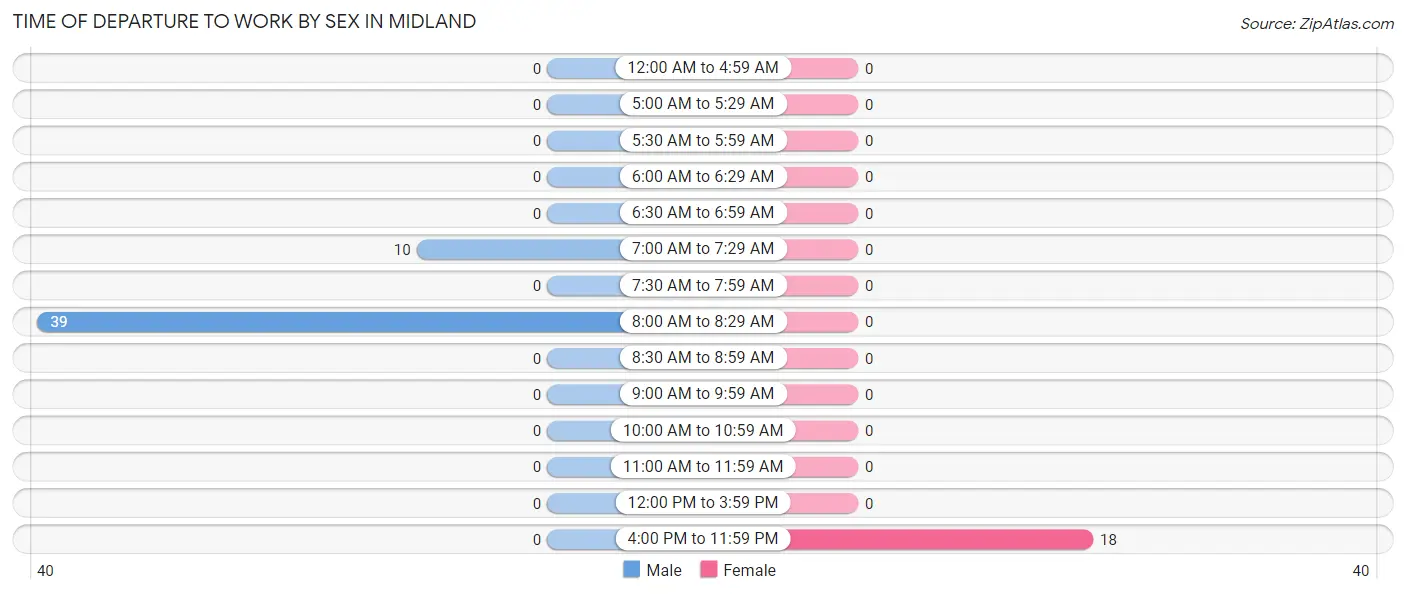
| Time of Departure | Male | Female |
| 12:00 AM to 4:59 AM | 0 (0.0%) | 0 (0.0%) |
| 5:00 AM to 5:29 AM | 0 (0.0%) | 0 (0.0%) |
| 5:30 AM to 5:59 AM | 0 (0.0%) | 0 (0.0%) |
| 6:00 AM to 6:29 AM | 0 (0.0%) | 0 (0.0%) |
| 6:30 AM to 6:59 AM | 0 (0.0%) | 0 (0.0%) |
| 7:00 AM to 7:29 AM | 10 (20.4%) | 0 (0.0%) |
| 7:30 AM to 7:59 AM | 0 (0.0%) | 0 (0.0%) |
| 8:00 AM to 8:29 AM | 39 (79.6%) | 0 (0.0%) |
| 8:30 AM to 8:59 AM | 0 (0.0%) | 0 (0.0%) |
| 9:00 AM to 9:59 AM | 0 (0.0%) | 0 (0.0%) |
| 10:00 AM to 10:59 AM | 0 (0.0%) | 0 (0.0%) |
| 11:00 AM to 11:59 AM | 0 (0.0%) | 0 (0.0%) |
| 12:00 PM to 3:59 PM | 0 (0.0%) | 0 (0.0%) |
| 4:00 PM to 11:59 PM | 0 (0.0%) | 18 (100.0%) |
| Total | 49 (100.0%) | 18 (100.0%) |
Housing Occupancy in Midland
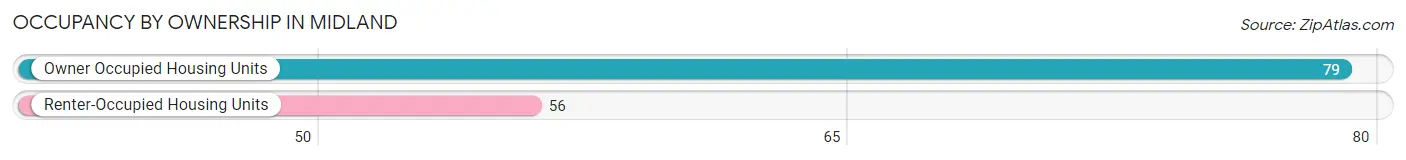
Occupancy by Ownership in Midland
Of the total 135 dwellings in Midland, owner-occupied units account for 79 (58.5%), while renter-occupied units make up 56 (41.5%).
| Occupancy | # Housing Units | % Housing Units |
| Owner Occupied Housing Units | 79 | 58.5% |
| Renter-Occupied Housing Units | 56 | 41.5% |
| Total Occupied Housing Units | 135 | 100.0% |
Occupancy by Household Size in Midland
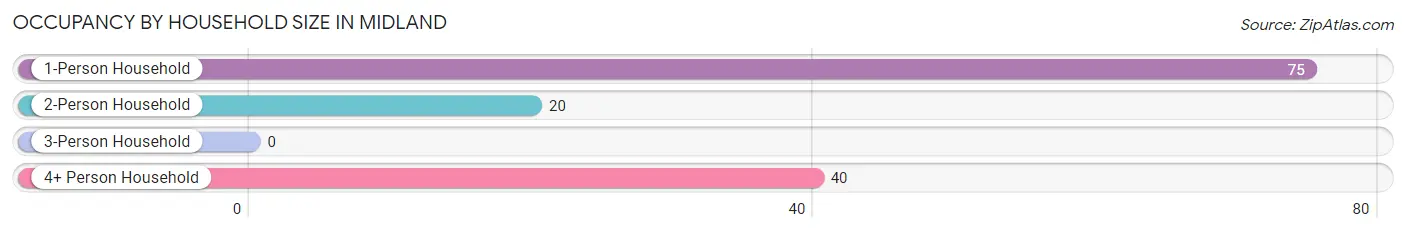
| Household Size | # Housing Units | % Housing Units |
| 1-Person Household | 75 | 55.6% |
| 2-Person Household | 20 | 14.8% |
| 3-Person Household | 0 | 0.0% |
| 4+ Person Household | 40 | 29.6% |
| Total Housing Units | 135 | 100.0% |
Occupancy by Ownership by Household Size in Midland
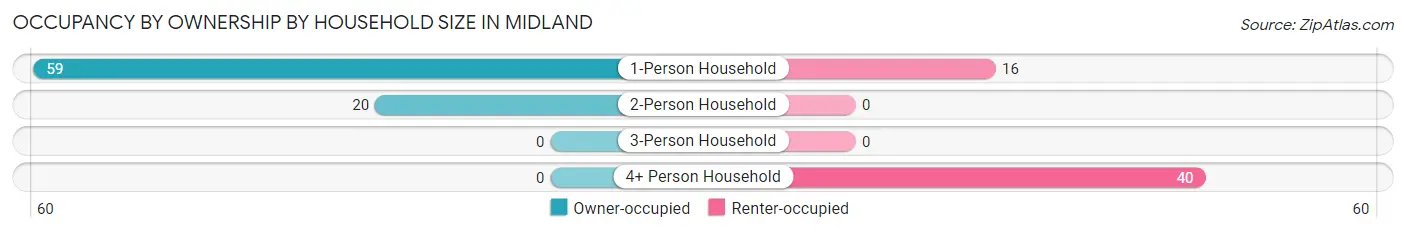
| Household Size | Owner-occupied | Renter-occupied |
| 1-Person Household | 59 (78.7%) | 16 (21.3%) |
| 2-Person Household | 20 (100.0%) | 0 (0.0%) |
| 3-Person Household | 0 (0.0%) | 0 (0.0%) |
| 4+ Person Household | 0 (0.0%) | 40 (100.0%) |
| Total Housing Units | 79 (58.5%) | 56 (41.5%) |
Occupancy by Educational Attainment in Midland
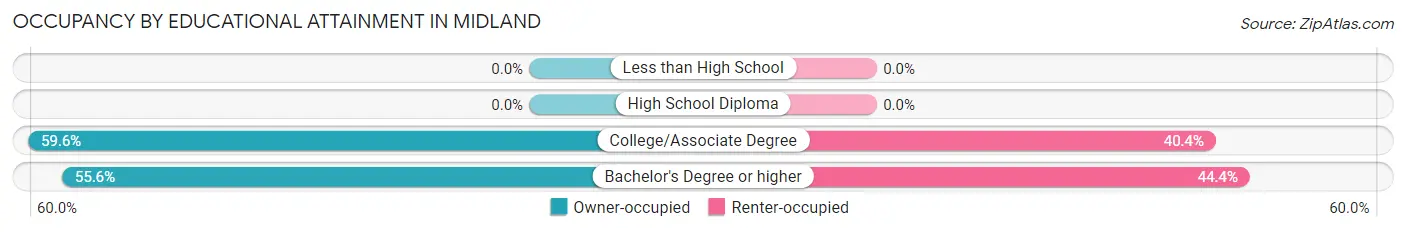
| Household Size | Owner-occupied | Renter-occupied |
| Less than High School | 0 (0.0%) | 0 (0.0%) |
| High School Diploma | 0 (0.0%) | 0 (0.0%) |
| College/Associate Degree | 59 (59.6%) | 40 (40.4%) |
| Bachelor's Degree or higher | 20 (55.6%) | 16 (44.4%) |
Occupancy by Age of Householder in Midland
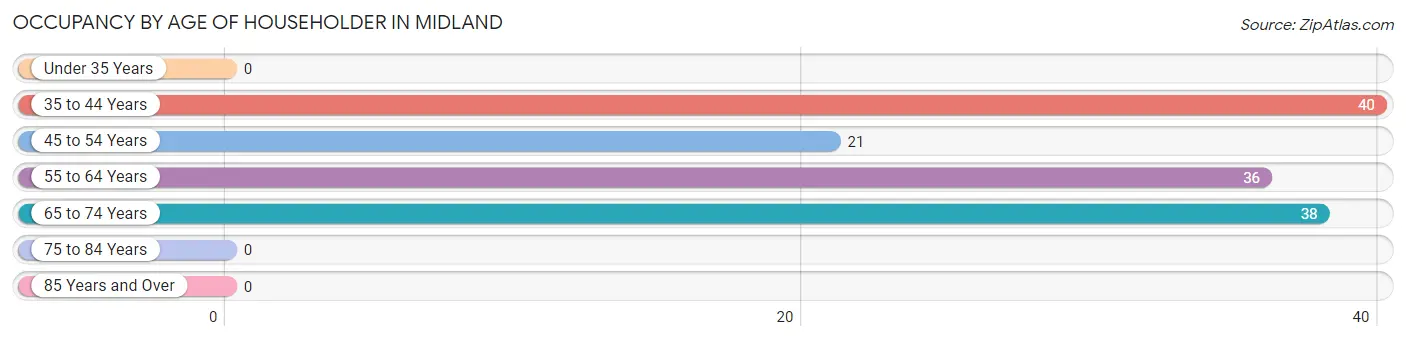
| Age Bracket | # Households | % Households |
| Under 35 Years | 0 | 0.0% |
| 35 to 44 Years | 40 | 29.6% |
| 45 to 54 Years | 21 | 15.6% |
| 55 to 64 Years | 36 | 26.7% |
| 65 to 74 Years | 38 | 28.1% |
| 75 to 84 Years | 0 | 0.0% |
| 85 Years and Over | 0 | 0.0% |
| Total | 135 | 100.0% |
Housing Finances in Midland
Median Income by Occupancy in Midland
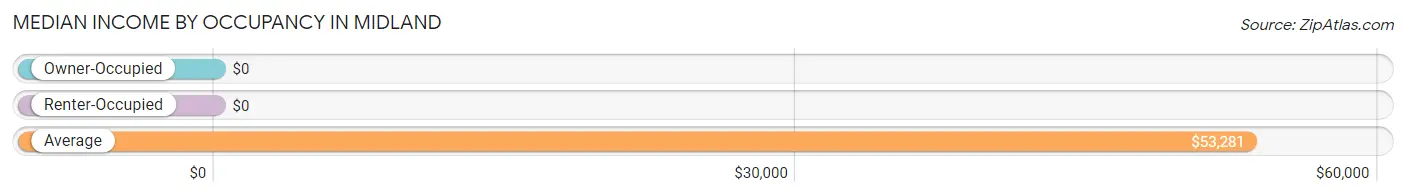
| Occupancy Type | # Households | Median Income |
| Owner-Occupied | 79 (58.5%) | $0 |
| Renter-Occupied | 56 (41.5%) | $0 |
| Average | 135 (100.0%) | $53,281 |
Occupancy by Householder Income Bracket in Midland
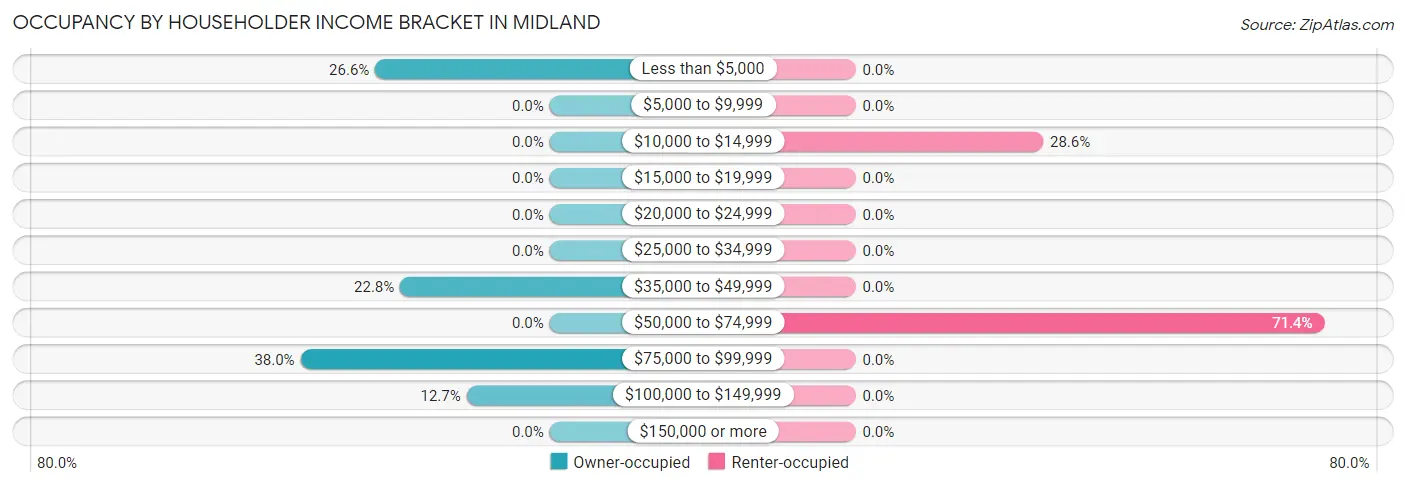
| Income Bracket | Owner-occupied | Renter-occupied |
| Less than $5,000 | 21 (26.6%) | 0 (0.0%) |
| $5,000 to $9,999 | 0 (0.0%) | 0 (0.0%) |
| $10,000 to $14,999 | 0 (0.0%) | 16 (28.6%) |
| $15,000 to $19,999 | 0 (0.0%) | 0 (0.0%) |
| $20,000 to $24,999 | 0 (0.0%) | 0 (0.0%) |
| $25,000 to $34,999 | 0 (0.0%) | 0 (0.0%) |
| $35,000 to $49,999 | 18 (22.8%) | 0 (0.0%) |
| $50,000 to $74,999 | 0 (0.0%) | 40 (71.4%) |
| $75,000 to $99,999 | 30 (38.0%) | 0 (0.0%) |
| $100,000 to $149,999 | 10 (12.7%) | 0 (0.0%) |
| $150,000 or more | 0 (0.0%) | 0 (0.0%) |
| Total | 79 (100.0%) | 56 (100.0%) |
Monthly Housing Cost Tiers in Midland
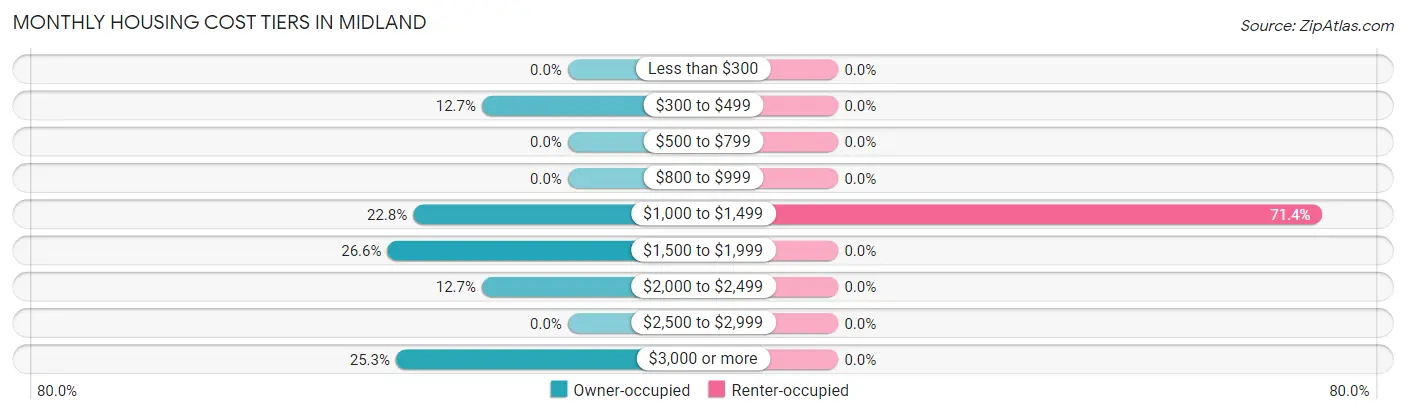
| Monthly Cost | Owner-occupied | Renter-occupied |
| Less than $300 | 0 (0.0%) | 0 (0.0%) |
| $300 to $499 | 10 (12.7%) | 0 (0.0%) |
| $500 to $799 | 0 (0.0%) | 0 (0.0%) |
| $800 to $999 | 0 (0.0%) | 0 (0.0%) |
| $1,000 to $1,499 | 18 (22.8%) | 40 (71.4%) |
| $1,500 to $1,999 | 21 (26.6%) | 0 (0.0%) |
| $2,000 to $2,499 | 10 (12.7%) | 0 (0.0%) |
| $2,500 to $2,999 | 0 (0.0%) | 0 (0.0%) |
| $3,000 or more | 20 (25.3%) | 0 (0.0%) |
| Total | 79 (100.0%) | 56 (100.0%) |
Physical Housing Characteristics in Midland
Housing Structures in Midland
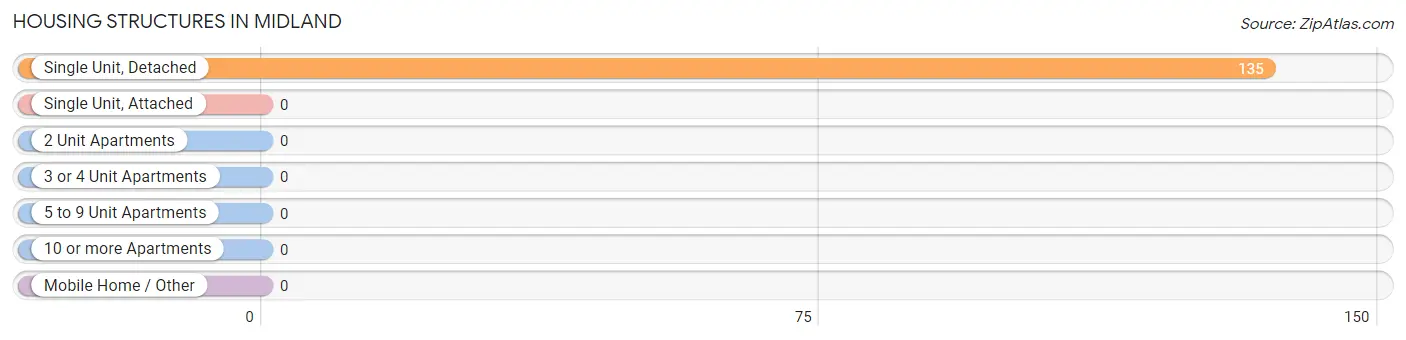
| Structure Type | # Housing Units | % Housing Units |
| Single Unit, Detached | 135 | 100.0% |
| Single Unit, Attached | 0 | 0.0% |
| 2 Unit Apartments | 0 | 0.0% |
| 3 or 4 Unit Apartments | 0 | 0.0% |
| 5 to 9 Unit Apartments | 0 | 0.0% |
| 10 or more Apartments | 0 | 0.0% |
| Mobile Home / Other | 0 | 0.0% |
| Total | 135 | 100.0% |
Housing Structures by Occupancy in Midland
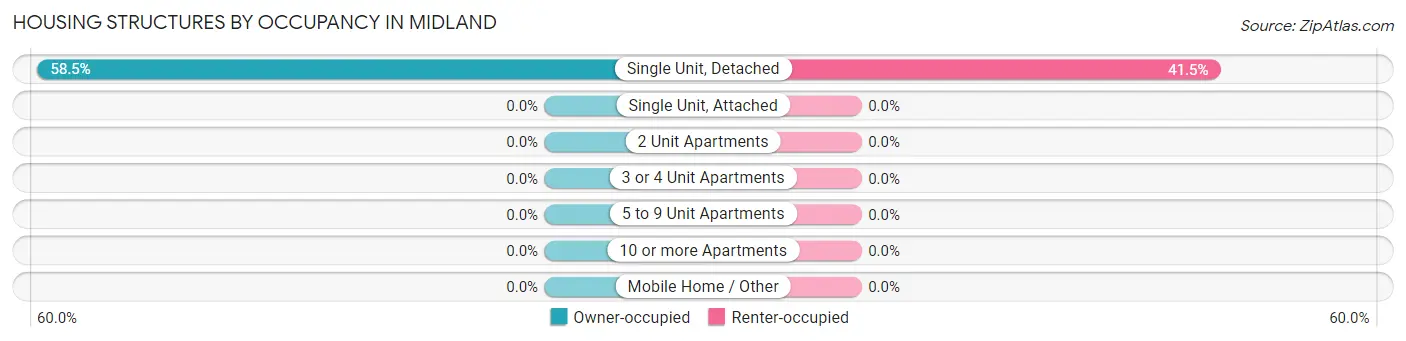
| Structure Type | Owner-occupied | Renter-occupied |
| Single Unit, Detached | 79 (58.5%) | 56 (41.5%) |
| Single Unit, Attached | 0 (0.0%) | 0 (0.0%) |
| 2 Unit Apartments | 0 (0.0%) | 0 (0.0%) |
| 3 or 4 Unit Apartments | 0 (0.0%) | 0 (0.0%) |
| 5 to 9 Unit Apartments | 0 (0.0%) | 0 (0.0%) |
| 10 or more Apartments | 0 (0.0%) | 0 (0.0%) |
| Mobile Home / Other | 0 (0.0%) | 0 (0.0%) |
| Total | 79 (58.5%) | 56 (41.5%) |
Housing Structures by Number of Rooms in Midland
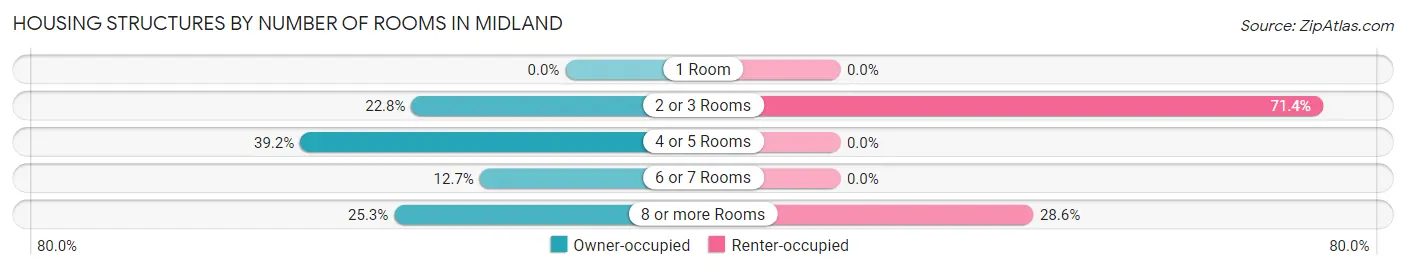
| Number of Rooms | Owner-occupied | Renter-occupied |
| 1 Room | 0 (0.0%) | 0 (0.0%) |
| 2 or 3 Rooms | 18 (22.8%) | 40 (71.4%) |
| 4 or 5 Rooms | 31 (39.2%) | 0 (0.0%) |
| 6 or 7 Rooms | 10 (12.7%) | 0 (0.0%) |
| 8 or more Rooms | 20 (25.3%) | 16 (28.6%) |
| Total | 79 (100.0%) | 56 (100.0%) |
Housing Structure by Heating Type in Midland
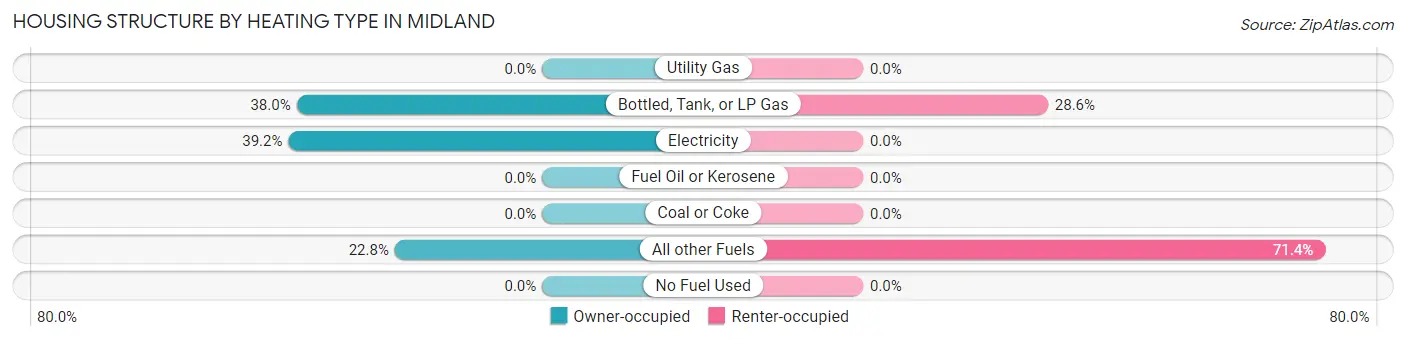
| Heating Type | Owner-occupied | Renter-occupied |
| Utility Gas | 0 (0.0%) | 0 (0.0%) |
| Bottled, Tank, or LP Gas | 30 (38.0%) | 16 (28.6%) |
| Electricity | 31 (39.2%) | 0 (0.0%) |
| Fuel Oil or Kerosene | 0 (0.0%) | 0 (0.0%) |
| Coal or Coke | 0 (0.0%) | 0 (0.0%) |
| All other Fuels | 18 (22.8%) | 40 (71.4%) |
| No Fuel Used | 0 (0.0%) | 0 (0.0%) |
| Total | 79 (100.0%) | 56 (100.0%) |
Household Vehicle Usage in Midland
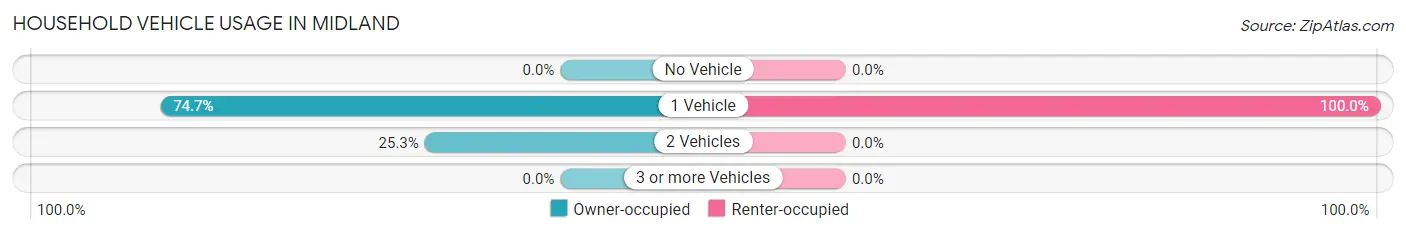
| Vehicles per Household | Owner-occupied | Renter-occupied |
| No Vehicle | 0 (0.0%) | 0 (0.0%) |
| 1 Vehicle | 59 (74.7%) | 56 (100.0%) |
| 2 Vehicles | 20 (25.3%) | 0 (0.0%) |
| 3 or more Vehicles | 0 (0.0%) | 0 (0.0%) |
| Total | 79 (100.0%) | 56 (100.0%) |
Real Estate & Mortgages in Midland
Real Estate and Mortgage Overview in Midland
| Characteristic | Without Mortgage | With Mortgage |
| Housing Units | 10 | 69 |
| Median Property Value | - | - |
| Median Household Income | - | - |
| Monthly Housing Costs | - | - |
| Real Estate Taxes | - | - |
Property Value by Mortgage Status in Midland
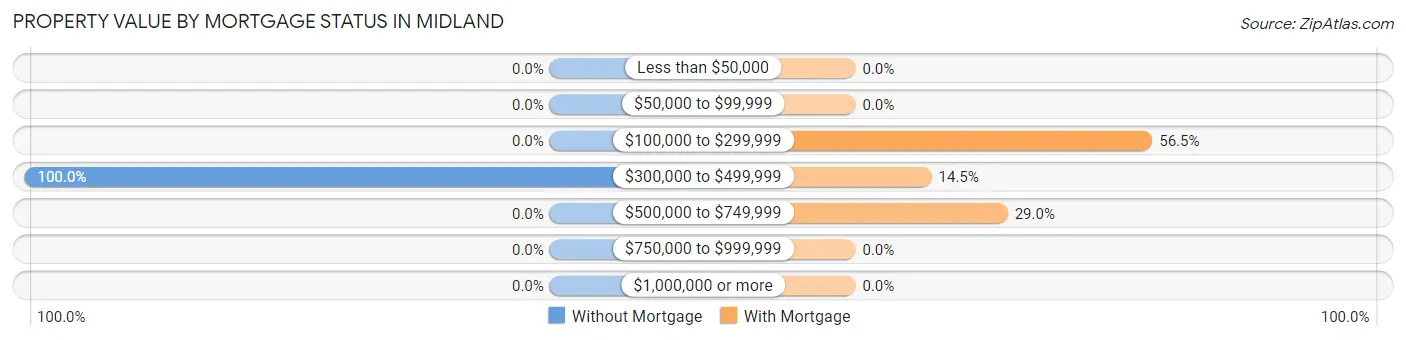
| Property Value | Without Mortgage | With Mortgage |
| Less than $50,000 | 0 (0.0%) | 0 (0.0%) |
| $50,000 to $99,999 | 0 (0.0%) | 0 (0.0%) |
| $100,000 to $299,999 | 0 (0.0%) | 39 (56.5%) |
| $300,000 to $499,999 | 10 (100.0%) | 10 (14.5%) |
| $500,000 to $749,999 | 0 (0.0%) | 20 (29.0%) |
| $750,000 to $999,999 | 0 (0.0%) | 0 (0.0%) |
| $1,000,000 or more | 0 (0.0%) | 0 (0.0%) |
| Total | 10 (100.0%) | 69 (100.0%) |
Household Income by Mortgage Status in Midland
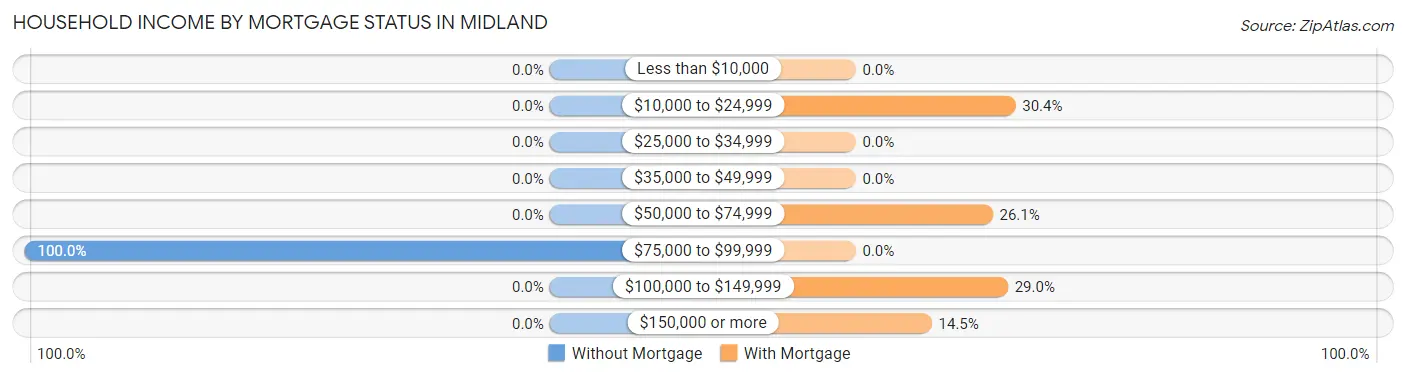
| Household Income | Without Mortgage | With Mortgage |
| Less than $10,000 | 0 (0.0%) | 0 (0.0%) |
| $10,000 to $24,999 | 0 (0.0%) | 21 (30.4%) |
| $25,000 to $34,999 | 0 (0.0%) | 0 (0.0%) |
| $35,000 to $49,999 | 0 (0.0%) | 0 (0.0%) |
| $50,000 to $74,999 | 0 (0.0%) | 18 (26.1%) |
| $75,000 to $99,999 | 10 (100.0%) | 0 (0.0%) |
| $100,000 to $149,999 | 0 (0.0%) | 20 (29.0%) |
| $150,000 or more | 0 (0.0%) | 10 (14.5%) |
| Total | 10 (100.0%) | 69 (100.0%) |
Property Value to Household Income Ratio in Midland
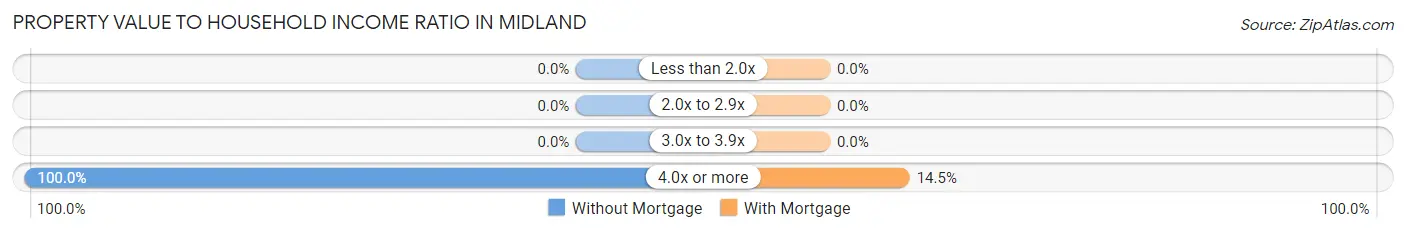
| Value-to-Income Ratio | Without Mortgage | With Mortgage |
| Less than 2.0x | 0 (0.0%) | 0 (0.0%) |
| 2.0x to 2.9x | 0 (0.0%) | 0 (0.0%) |
| 3.0x to 3.9x | 0 (0.0%) | 0 (0.0%) |
| 4.0x or more | 10 (100.0%) | 10 (14.5%) |
| Total | 10 (100.0%) | 69 (100.0%) |
Real Estate Taxes by Mortgage Status in Midland
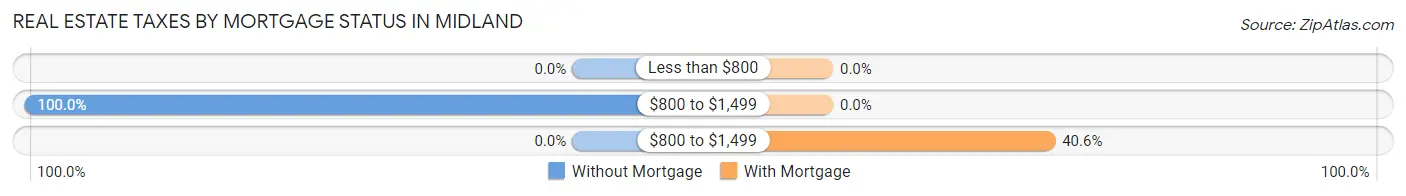
| Property Taxes | Without Mortgage | With Mortgage |
| Less than $800 | 0 (0.0%) | 0 (0.0%) |
| $800 to $1,499 | 10 (100.0%) | 0 (0.0%) |
| $800 to $1,499 | 0 (0.0%) | 28 (40.6%) |
| Total | 10 (100.0%) | 69 (100.0%) |
Health & Disability in Midland
Health Insurance Coverage by Age in Midland
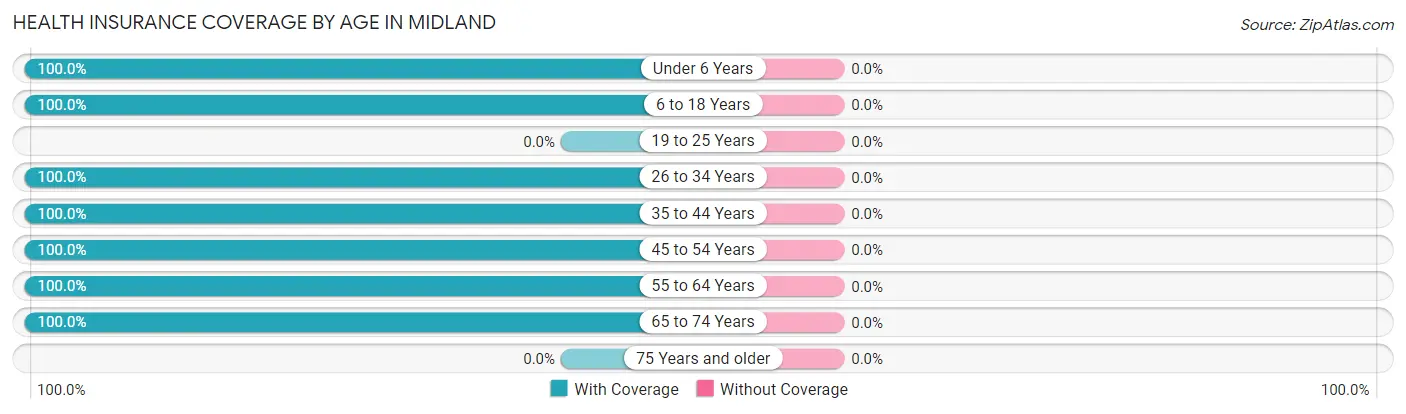
| Age Bracket | With Coverage | Without Coverage |
| Under 6 Years | 30 (100.0%) | 0 (0.0%) |
| 6 to 18 Years | 31 (100.0%) | 0 (0.0%) |
| 19 to 25 Years | 0 (0.0%) | 0 (0.0%) |
| 26 to 34 Years | 39 (100.0%) | 0 (0.0%) |
| 35 to 44 Years | 40 (100.0%) | 0 (0.0%) |
| 45 to 54 Years | 21 (100.0%) | 0 (0.0%) |
| 55 to 64 Years | 56 (100.0%) | 0 (0.0%) |
| 65 to 74 Years | 38 (100.0%) | 0 (0.0%) |
| 75 Years and older | 0 (0.0%) | 0 (0.0%) |
| Total | 255 (100.0%) | 0 (0.0%) |
Health Insurance Coverage by Citizenship Status in Midland
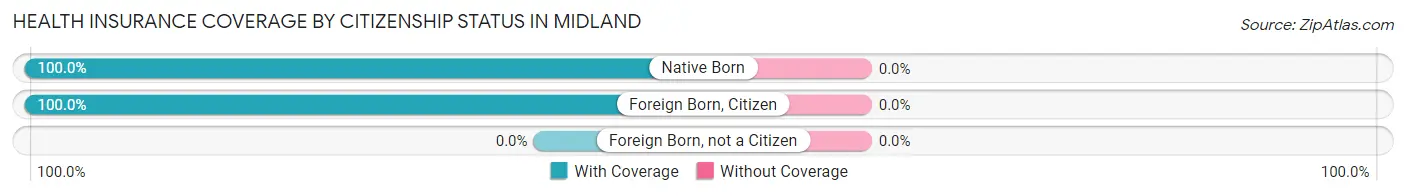
| Citizenship Status | With Coverage | Without Coverage |
| Native Born | 30 (100.0%) | 0 (0.0%) |
| Foreign Born, Citizen | 31 (100.0%) | 0 (0.0%) |
| Foreign Born, not a Citizen | 0 (0.0%) | 0 (0.0%) |
Health Insurance Coverage by Household Income in Midland
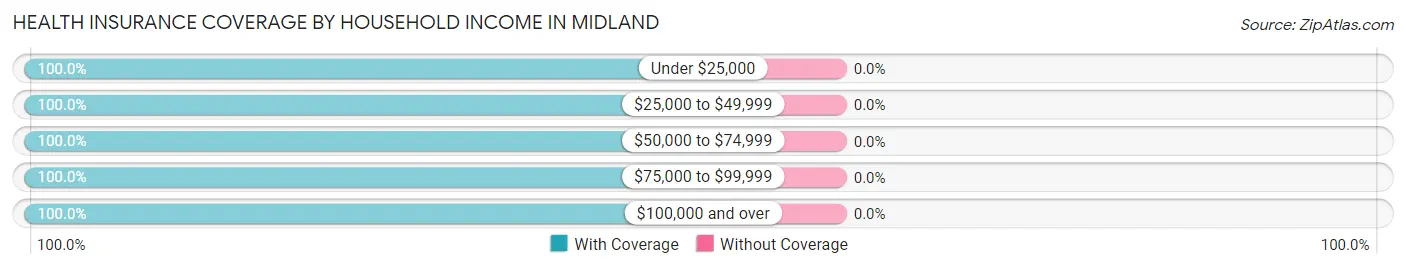
| Household Income | With Coverage | Without Coverage |
| Under $25,000 | 37 (100.0%) | 0 (0.0%) |
| $25,000 to $49,999 | 18 (100.0%) | 0 (0.0%) |
| $50,000 to $74,999 | 140 (100.0%) | 0 (0.0%) |
| $75,000 to $99,999 | 40 (100.0%) | 0 (0.0%) |
| $100,000 and over | 20 (100.0%) | 0 (0.0%) |
Public vs Private Health Insurance Coverage by Age in Midland
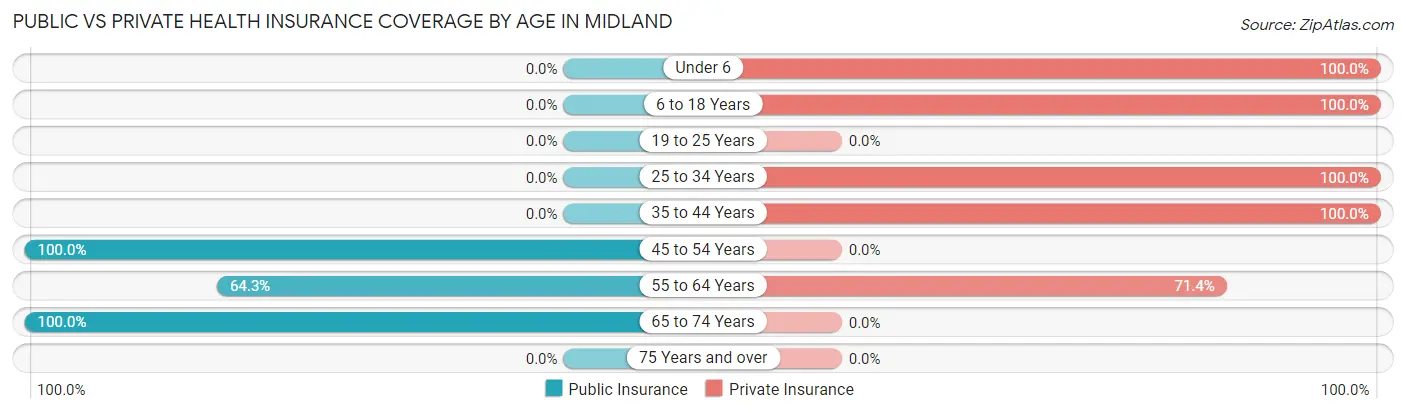
| Age Bracket | Public Insurance | Private Insurance |
| Under 6 | 0 (0.0%) | 30 (100.0%) |
| 6 to 18 Years | 0 (0.0%) | 31 (100.0%) |
| 19 to 25 Years | 0 (0.0%) | 0 (0.0%) |
| 25 to 34 Years | 0 (0.0%) | 39 (100.0%) |
| 35 to 44 Years | 0 (0.0%) | 40 (100.0%) |
| 45 to 54 Years | 21 (100.0%) | 0 (0.0%) |
| 55 to 64 Years | 36 (64.3%) | 40 (71.4%) |
| 65 to 74 Years | 38 (100.0%) | 0 (0.0%) |
| 75 Years and over | 0 (0.0%) | 0 (0.0%) |
| Total | 95 (37.2%) | 180 (70.6%) |
Disability Status by Sex by Age in Midland
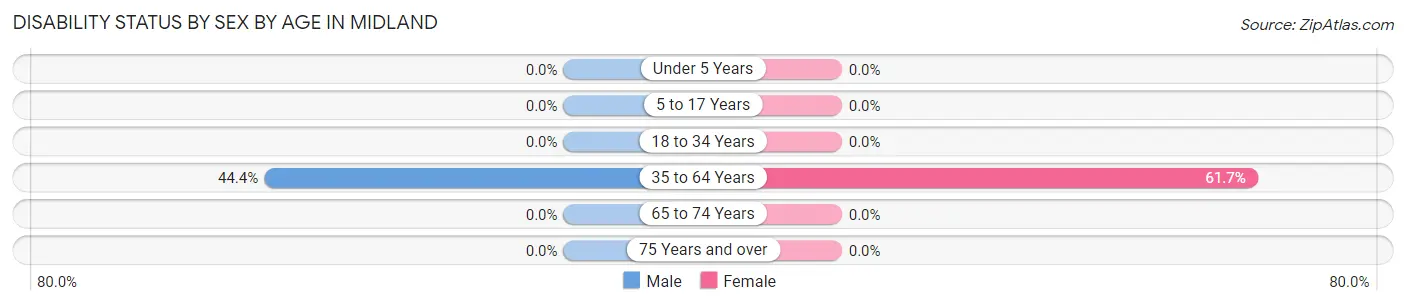
| Age Bracket | Male | Female |
| Under 5 Years | 0 (0.0%) | 0 (0.0%) |
| 5 to 17 Years | 0 (0.0%) | 0 (0.0%) |
| 18 to 34 Years | 0 (0.0%) | 0 (0.0%) |
| 35 to 64 Years | 16 (44.4%) | 50 (61.7%) |
| 65 to 74 Years | 0 (0.0%) | 0 (0.0%) |
| 75 Years and over | 0 (0.0%) | 0 (0.0%) |
Disability Class by Sex by Age in Midland
Disability Class: Hearing Difficulty
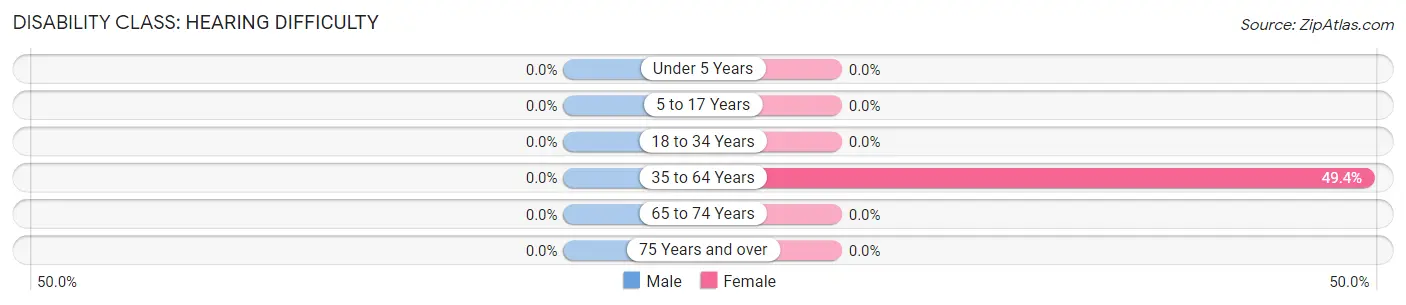
| Age Bracket | Male | Female |
| Under 5 Years | 0 (0.0%) | 0 (0.0%) |
| 5 to 17 Years | 0 (0.0%) | 0 (0.0%) |
| 18 to 34 Years | 0 (0.0%) | 0 (0.0%) |
| 35 to 64 Years | 0 (0.0%) | 40 (49.4%) |
| 65 to 74 Years | 0 (0.0%) | 0 (0.0%) |
| 75 Years and over | 0 (0.0%) | 0 (0.0%) |
Disability Class: Vision Difficulty
| Age Bracket | Male | Female |
| Under 5 Years | 0 (0.0%) | 0 (0.0%) |
| 5 to 17 Years | 0 (0.0%) | 0 (0.0%) |
| 18 to 34 Years | 0 (0.0%) | 0 (0.0%) |
| 35 to 64 Years | 0 (0.0%) | 0 (0.0%) |
| 65 to 74 Years | 0 (0.0%) | 0 (0.0%) |
| 75 Years and over | 0 (0.0%) | 0 (0.0%) |
Disability Class: Cognitive Difficulty
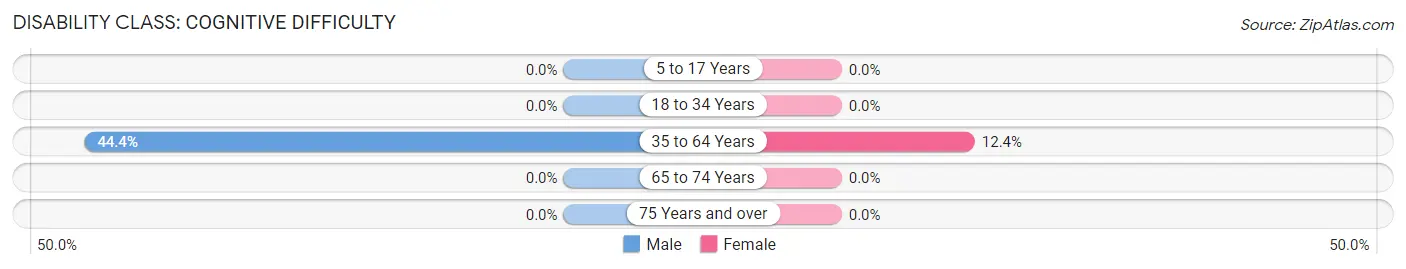
| Age Bracket | Male | Female |
| 5 to 17 Years | 0 (0.0%) | 0 (0.0%) |
| 18 to 34 Years | 0 (0.0%) | 0 (0.0%) |
| 35 to 64 Years | 16 (44.4%) | 10 (12.3%) |
| 65 to 74 Years | 0 (0.0%) | 0 (0.0%) |
| 75 Years and over | 0 (0.0%) | 0 (0.0%) |
Disability Class: Ambulatory Difficulty

| Age Bracket | Male | Female |
| 5 to 17 Years | 0 (0.0%) | 0 (0.0%) |
| 18 to 34 Years | 0 (0.0%) | 0 (0.0%) |
| 35 to 64 Years | 16 (44.4%) | 10 (12.3%) |
| 65 to 74 Years | 0 (0.0%) | 0 (0.0%) |
| 75 Years and over | 0 (0.0%) | 0 (0.0%) |
Disability Class: Self-Care Difficulty
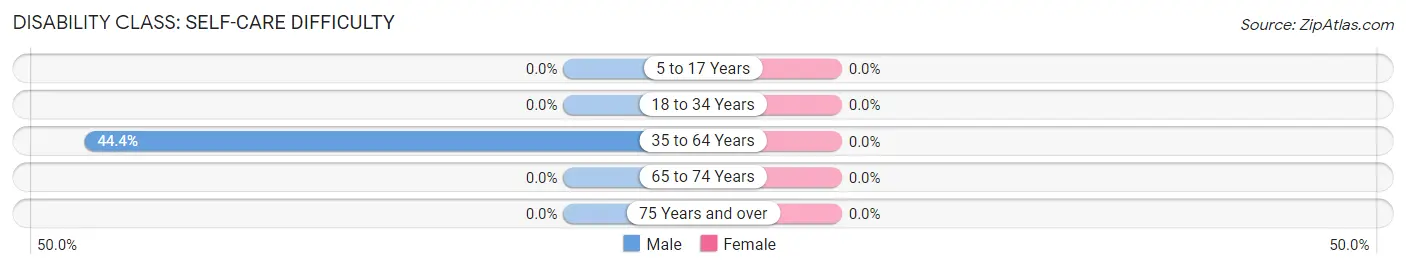
| Age Bracket | Male | Female |
| 5 to 17 Years | 0 (0.0%) | 0 (0.0%) |
| 18 to 34 Years | 0 (0.0%) | 0 (0.0%) |
| 35 to 64 Years | 16 (44.4%) | 0 (0.0%) |
| 65 to 74 Years | 0 (0.0%) | 0 (0.0%) |
| 75 Years and over | 0 (0.0%) | 0 (0.0%) |
Technology Access in Midland
Computing Device Access in Midland
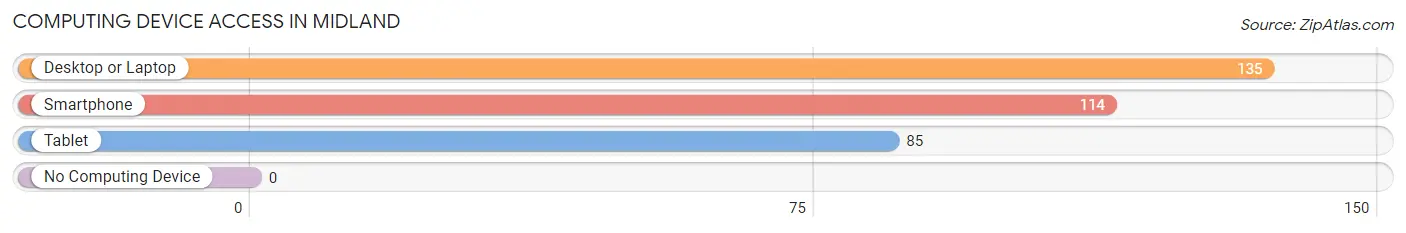
| Device Type | # Households | % Households |
| Desktop or Laptop | 135 | 100.0% |
| Smartphone | 114 | 84.4% |
| Tablet | 85 | 63.0% |
| No Computing Device | 0 | 0.0% |
| Total | 135 | 100.0% |
Internet Access in Midland
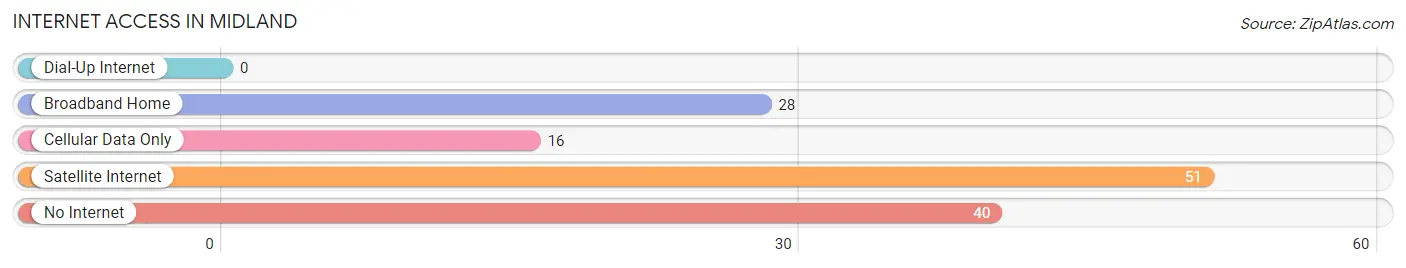
| Internet Type | # Households | % Households |
| Dial-Up Internet | 0 | 0.0% |
| Broadband Home | 28 | 20.7% |
| Cellular Data Only | 16 | 11.8% |
| Satellite Internet | 51 | 37.8% |
| No Internet | 40 | 29.6% |
| Total | 135 | 100.0% |
Midland Summary
Midland, Colorado is a small town located in the western part of the state, in the foothills of the Rocky Mountains. It is situated in the San Luis Valley, which is the largest alpine valley in the world. The town is located at an elevation of 8,000 feet, and is surrounded by the Sangre de Cristo Mountains to the east and the San Juan Mountains to the west.
Midland was founded in 1881 by a group of settlers from the Midwest. The town was named after the Midland Railroad, which ran through the area. The railroad was instrumental in the development of the town, as it provided transportation for goods and people.
The town has a population of approximately 1,000 people, and is home to a variety of businesses, including a grocery store, a hardware store, a restaurant, and a few other small businesses. The town is also home to a post office, a library, and a fire station.
The economy of Midland is largely based on agriculture and tourism. The town is home to several farms, which produce a variety of crops, including potatoes, corn, and hay. The town is also home to several tourist attractions, including the Great Sand Dunes National Park, the San Luis Valley Museum, and the San Luis Valley Historical Society.
The geography of Midland is characterized by its mountainous terrain and its high elevation. The town is located in a valley, surrounded by mountains on all sides. The Sangre de Cristo Mountains to the east, and the San Juan Mountains to the west, provide a stunning backdrop to the town. The town is also home to several rivers, including the Rio Grande, the Arkansas River, and the Conejos River.
The climate of Midland is semi-arid, with hot summers and cold winters. The average temperature in the summer is around 80 degrees Fahrenheit, and the average temperature in the winter is around 20 degrees Fahrenheit. The town receives an average of 12 inches of precipitation per year.
The demographics of Midland are largely made up of white, non-Hispanic residents. The town has a population of approximately 1,000 people, and the median age is 44. The median household income is $37,000, and the median home value is $150,000.
Midland is a small town with a rich history and a unique geography. It is home to a variety of businesses, tourist attractions, and farms, and is surrounded by stunning mountain scenery. The town has a semi-arid climate, and is home to a largely white, non-Hispanic population. The town is a great place to live, work, and visit, and is a great example of the beauty and diversity of Colorado.
Common Questions
What is Per Capita Income in Midland?
Per Capita income in Midland is $26,357.
What is the Median Family Income in Midland?
Median Family Income in Midland is $54,375.
What is the Median Household income in Midland?
Median Household Income in Midland is $53,281.
What is Inequality or Gini Index in Midland?
Inequality or Gini Index in Midland is 0.36.
What is the Total Population of Midland?
Total Population of Midland is 255.
What is the Total Male Population of Midland?
Total Male Population of Midland is 136.
What is the Total Female Population of Midland?
Total Female Population of Midland is 119.
What is the Ratio of Males per 100 Females in Midland?
There are 114.29 Males per 100 Females in Midland.
What is the Ratio of Females per 100 Males in Midland?
There are 87.50 Females per 100 Males in Midland.
What is the Median Population Age in Midland?
Median Population Age in Midland is 38.7 Years.
What is the Average Family Size in Midland
Average Family Size in Midland is 3.0 People.
What is the Average Household Size in Midland
Average Household Size in Midland is 1.9 People.
How Large is the Labor Force in Midland?
There are 67 People in the Labor Forcein in Midland.
What is the Percentage of People in the Labor Force in Midland?
34.5% of People are in the Labor Force in Midland.