Jacksonville, GA Map & Demographics
Jacksonville Map
Jacksonville Overview
$14,823
PER CAPITA INCOME
$36,250
AVG FAMILY INCOME
$34,375
AVG HOUSEHOLD INCOME
0.26
INEQUALITY / GINI INDEX
103
TOTAL POPULATION
60
MALE POPULATION
43
FEMALE POPULATION
139.53
MALES / 100 FEMALES
71.67
FEMALES / 100 MALES
51.5
MEDIAN AGE
5.8
AVG FAMILY SIZE
4.3
AVG HOUSEHOLD SIZE
25
LABOR FORCE [ PEOPLE ]
28.1%
PERCENT IN LABOR FORCE
Jacksonville Zip Codes
Jacksonville Area Codes
Income in Jacksonville
Income Overview in Jacksonville
Per Capita Income in Jacksonville is $14,823, while median incomes of families and households are $36,250 and $34,375 respectively.
| Characteristic | Number | Measure |
| Per Capita Income | 103 | $14,823 |
| Median Family Income | 13 | $36,250 |
| Mean Family Income | 13 | $43,962 |
| Median Household Income | 24 | $34,375 |
| Mean Household Income | 24 | $38,663 |
| Income Deficit | 13 | $0 |
| Wage / Income Gap (%) | 103 | 0.00% |
| Wage / Income Gap ($) | 103 | 100.00¢ per $1 |
| Gini / Inequality Index | 103 | 0.26 |
Earnings by Sex in Jacksonville
| Sex | Number | Average Earnings |
| Male | 18 (69.2%) | $0 |
| Female | 8 (30.8%) | $0 |
| Total | 26 (100.0%) | $0 |
Earnings by Sex by Income Bracket in Jacksonville
The most common earnings brackets in Jacksonville are $2,499 or less for men (7 | 38.9%) and $5,000 to $7,499 for women (3 | 37.5%).
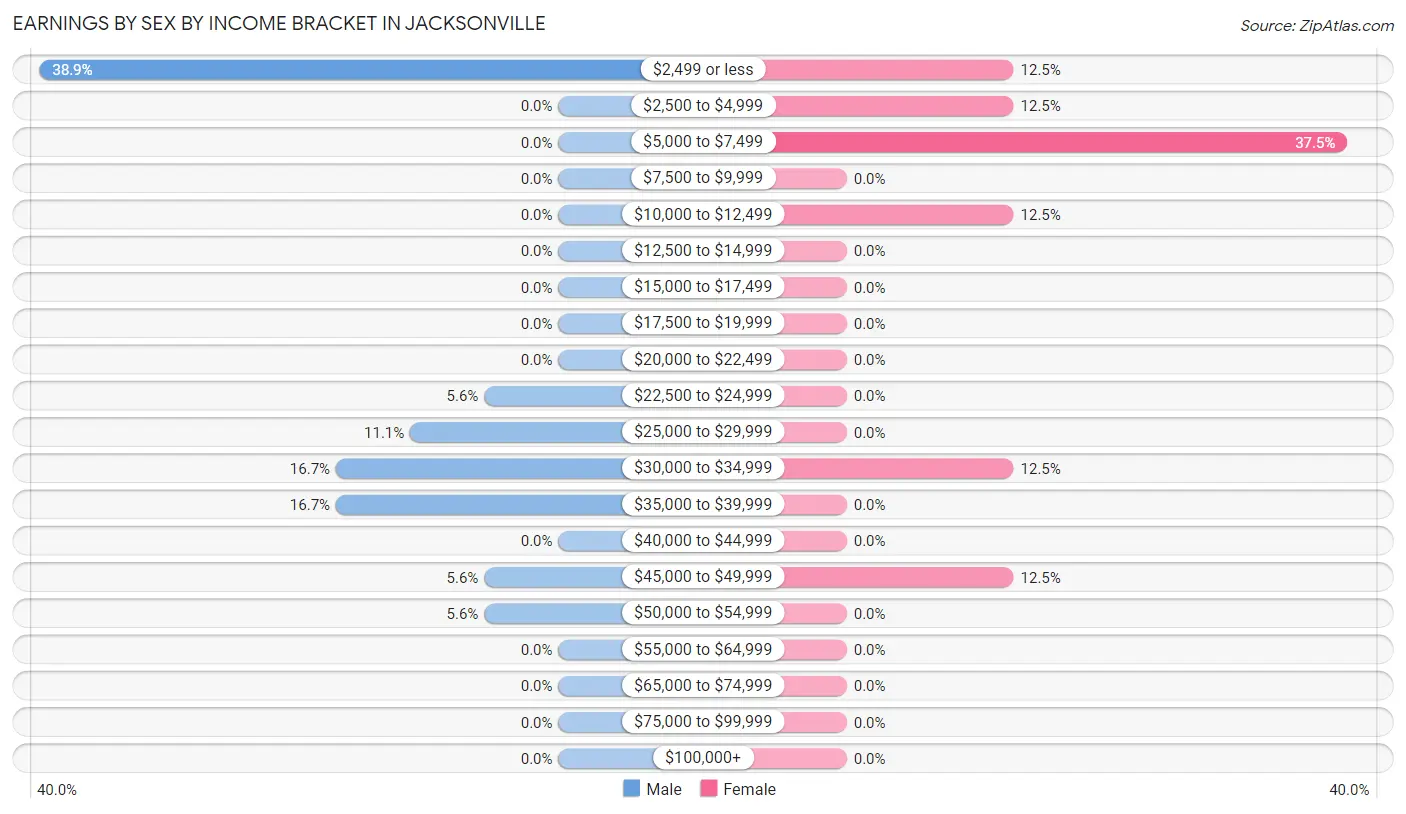
| Income | Male | Female |
| $2,499 or less | 7 (38.9%) | 1 (12.5%) |
| $2,500 to $4,999 | 0 (0.0%) | 1 (12.5%) |
| $5,000 to $7,499 | 0 (0.0%) | 3 (37.5%) |
| $7,500 to $9,999 | 0 (0.0%) | 0 (0.0%) |
| $10,000 to $12,499 | 0 (0.0%) | 1 (12.5%) |
| $12,500 to $14,999 | 0 (0.0%) | 0 (0.0%) |
| $15,000 to $17,499 | 0 (0.0%) | 0 (0.0%) |
| $17,500 to $19,999 | 0 (0.0%) | 0 (0.0%) |
| $20,000 to $22,499 | 0 (0.0%) | 0 (0.0%) |
| $22,500 to $24,999 | 1 (5.6%) | 0 (0.0%) |
| $25,000 to $29,999 | 2 (11.1%) | 0 (0.0%) |
| $30,000 to $34,999 | 3 (16.7%) | 1 (12.5%) |
| $35,000 to $39,999 | 3 (16.7%) | 0 (0.0%) |
| $40,000 to $44,999 | 0 (0.0%) | 0 (0.0%) |
| $45,000 to $49,999 | 1 (5.6%) | 1 (12.5%) |
| $50,000 to $54,999 | 1 (5.6%) | 0 (0.0%) |
| $55,000 to $64,999 | 0 (0.0%) | 0 (0.0%) |
| $65,000 to $74,999 | 0 (0.0%) | 0 (0.0%) |
| $75,000 to $99,999 | 0 (0.0%) | 0 (0.0%) |
| $100,000+ | 0 (0.0%) | 0 (0.0%) |
| Total | 18 (100.0%) | 8 (100.0%) |
Earnings by Sex by Educational Attainment in Jacksonville
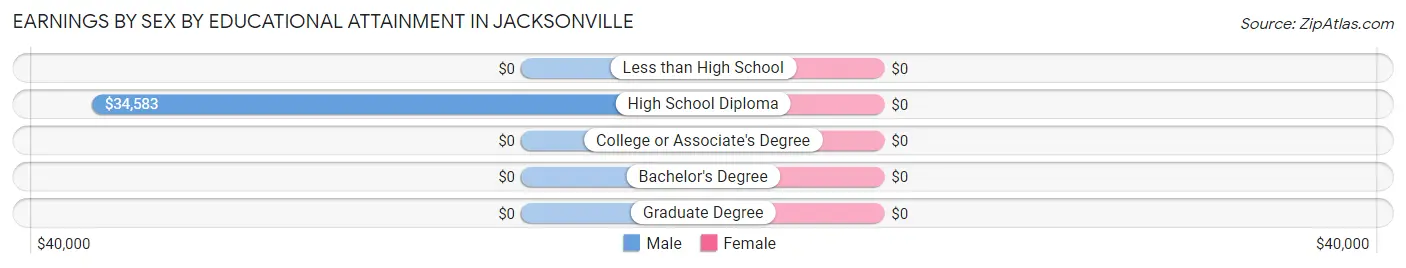
| Educational Attainment | Male Income | Female Income |
| Less than High School | - | - |
| High School Diploma | $34,583 | $0 |
| College or Associate's Degree | - | - |
| Bachelor's Degree | - | - |
| Graduate Degree | - | - |
| Total | $35,000 | $0 |
Family Income in Jacksonville
Family Income Brackets in Jacksonville
According to the Jacksonville family income data, there are 3 families falling into the $15,000 to $24,999 income range, which is the most common income bracket and makes up 23.1% of all families.
| Income Bracket | # Families | % Families |
| Less than $10,000 | 0 | 0.0% |
| $10,000 to $14,999 | 0 | 0.0% |
| $15,000 to $24,999 | 3 | 23.1% |
| $25,000 to $34,999 | 3 | 23.1% |
| $35,000 to $49,999 | 3 | 23.1% |
| $50,000 to $74,999 | 3 | 23.1% |
| $75,000 to $99,999 | 0 | 0.0% |
| $100,000 to $149,999 | 1 | 7.7% |
| $150,000 to $199,999 | 0 | 0.0% |
| $200,000+ | 0 | 0.0% |
Family Income by Famaliy Size in Jacksonville
| Income Bracket | # Families | Median Income |
| 2-Person Families | 8 (61.5%) | $0 |
| 3-Person Families | 4 (30.8%) | $0 |
| 4-Person Families | 1 (7.7%) | $0 |
| 5-Person Families | 0 (0.0%) | $0 |
| 6-Person Families | 0 (0.0%) | $0 |
| 7+ Person Families | 0 (0.0%) | $0 |
| Total | 13 (100.0%) | $36,250 |
Family Income by Number of Earners in Jacksonville
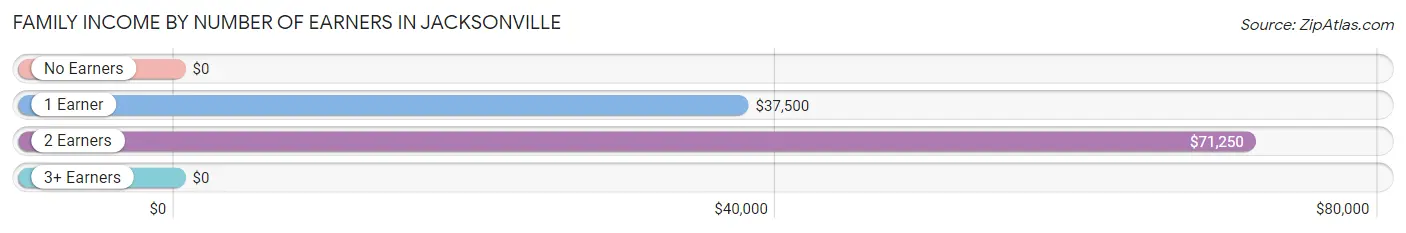
| Number of Earners | # Families | Median Income |
| No Earners | 6 (46.2%) | $0 |
| 1 Earner | 4 (30.8%) | $37,500 |
| 2 Earners | 3 (23.1%) | $71,250 |
| 3+ Earners | 0 (0.0%) | $0 |
| Total | 13 (100.0%) | $36,250 |
Household Income in Jacksonville
Household Income Brackets in Jacksonville
With 7 households falling in the category, the $15,000 to $24,999 income range is the most frequent in Jacksonville, accounting for 29.2% of all households.
| Income Bracket | # Households | % Households |
| Less than $10,000 | 0 | 0.0% |
| $10,000 to $14,999 | 1 | 4.2% |
| $15,000 to $24,999 | 7 | 29.2% |
| $25,000 to $34,999 | 5 | 20.8% |
| $35,000 to $49,999 | 6 | 25.0% |
| $50,000 to $74,999 | 4 | 16.7% |
| $75,000 to $99,999 | 0 | 0.0% |
| $100,000 to $149,999 | 1 | 4.2% |
| $150,000 to $199,999 | 0 | 0.0% |
| $200,000+ | 0 | 0.0% |
Household Income by Householder Age in Jacksonville
The median household income in Jacksonville is $34,375, with the highest median household income of $33,750 found in the 45 to 64 years age bracket for the primary householder. A total of 5 households (20.8%) fall into this category. Meanwhile, the 15 to 24 years age bracket for the primary householder has the lowest median household income of $0, with 1 households (4.2%) in this group.
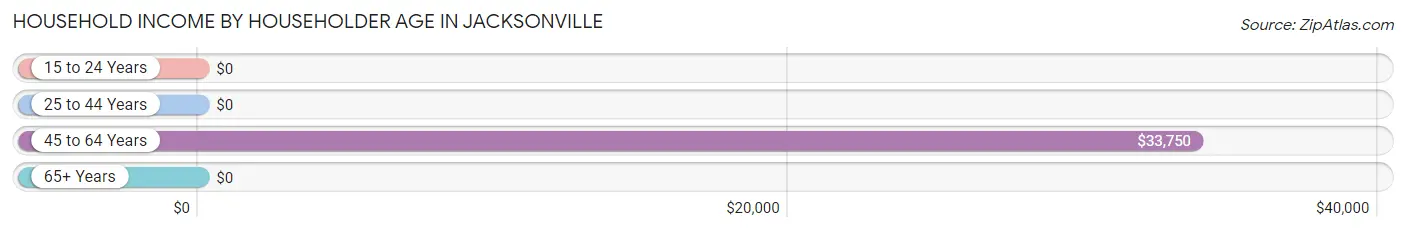
| Income Bracket | # Households | Median Income |
| 15 to 24 Years | 1 (4.2%) | $0 |
| 25 to 44 Years | 5 (20.8%) | $0 |
| 45 to 64 Years | 5 (20.8%) | $33,750 |
| 65+ Years | 13 (54.2%) | $0 |
| Total | 24 (100.0%) | $34,375 |
Poverty in Jacksonville
Income Below Poverty by Sex and Age in Jacksonville
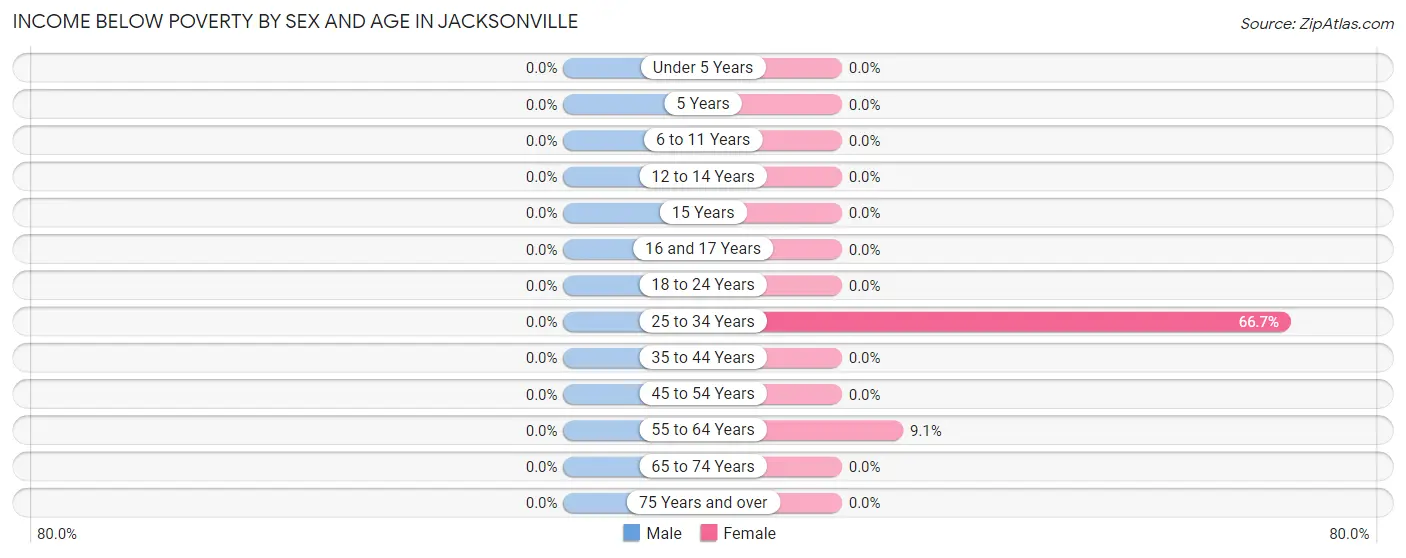
| Age Bracket | Male | Female |
| Under 5 Years | 0 (0.0%) | 0 (0.0%) |
| 5 Years | 0 (0.0%) | 0 (0.0%) |
| 6 to 11 Years | 0 (0.0%) | 0 (0.0%) |
| 12 to 14 Years | 0 (0.0%) | 0 (0.0%) |
| 15 Years | 0 (0.0%) | 0 (0.0%) |
| 16 and 17 Years | 0 (0.0%) | 0 (0.0%) |
| 18 to 24 Years | 0 (0.0%) | 0 (0.0%) |
| 25 to 34 Years | 0 (0.0%) | 4 (66.7%) |
| 35 to 44 Years | 0 (0.0%) | 0 (0.0%) |
| 45 to 54 Years | 0 (0.0%) | 0 (0.0%) |
| 55 to 64 Years | 0 (0.0%) | 1 (9.1%) |
| 65 to 74 Years | 0 (0.0%) | 0 (0.0%) |
| 75 Years and over | 0 (0.0%) | 0 (0.0%) |
| Total | 0 (0.0%) | 5 (12.2%) |
Income Above Poverty by Sex and Age in Jacksonville
According to the poverty statistics in Jacksonville, males aged under 5 years and females aged under 5 years are the age groups that are most secure financially, with 100.0% of males and 100.0% of females in these age groups living above the poverty line.
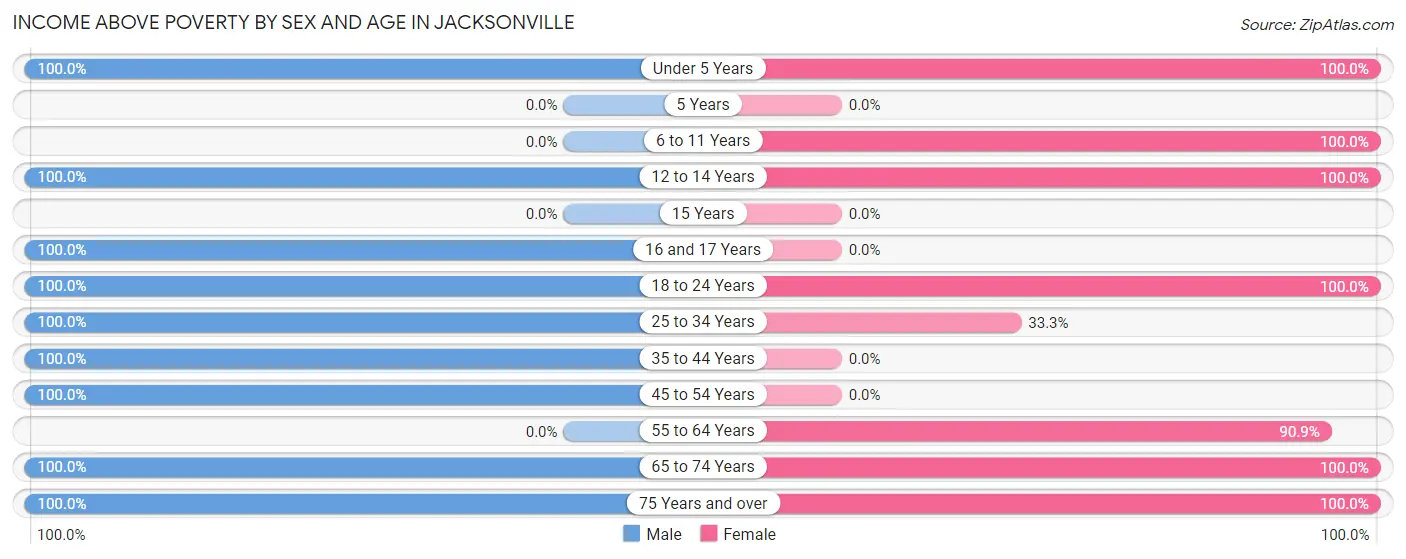
| Age Bracket | Male | Female |
| Under 5 Years | 1 (100.0%) | 1 (100.0%) |
| 5 Years | 0 (0.0%) | 0 (0.0%) |
| 6 to 11 Years | 0 (0.0%) | 3 (100.0%) |
| 12 to 14 Years | 4 (100.0%) | 2 (100.0%) |
| 15 Years | 0 (0.0%) | 0 (0.0%) |
| 16 and 17 Years | 9 (100.0%) | 0 (0.0%) |
| 18 to 24 Years | 1 (100.0%) | 1 (100.0%) |
| 25 to 34 Years | 5 (100.0%) | 2 (33.3%) |
| 35 to 44 Years | 15 (100.0%) | 0 (0.0%) |
| 45 to 54 Years | 4 (100.0%) | 0 (0.0%) |
| 55 to 64 Years | 0 (0.0%) | 10 (90.9%) |
| 65 to 74 Years | 2 (100.0%) | 8 (100.0%) |
| 75 Years and over | 18 (100.0%) | 9 (100.0%) |
| Total | 59 (100.0%) | 36 (87.8%) |
Income Below Poverty Among Married-Couple Families in Jacksonville
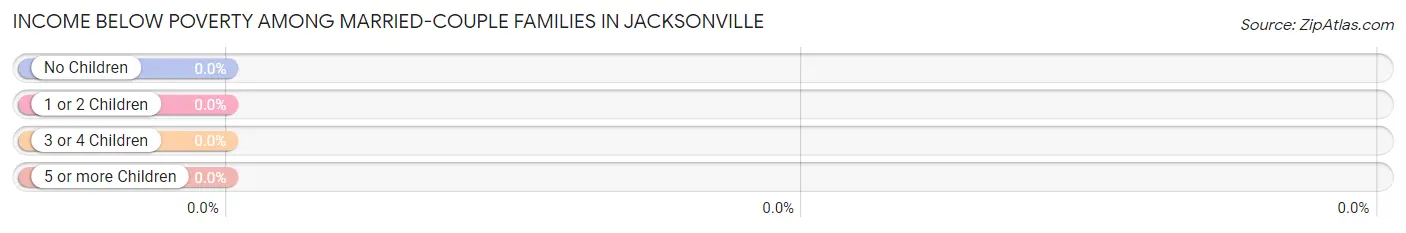
| Children | Above Poverty | Below Poverty |
| No Children | 7 (100.0%) | 0 (0.0%) |
| 1 or 2 Children | 2 (100.0%) | 0 (0.0%) |
| 3 or 4 Children | 0 (0.0%) | 0 (0.0%) |
| 5 or more Children | 0 (0.0%) | 0 (0.0%) |
| Total | 9 (100.0%) | 0 (0.0%) |
Income Below Poverty Among Single-Parent Households in Jacksonville
| Children | Single Father | Single Mother |
| No Children | 0 (0.0%) | 0 (0.0%) |
| 1 or 2 Children | 0 (0.0%) | 0 (0.0%) |
| 3 or 4 Children | 0 (0.0%) | 0 (0.0%) |
| 5 or more Children | 0 (0.0%) | 0 (0.0%) |
| Total | 0 (0.0%) | 0 (0.0%) |
Income Below Poverty Among Married-Couple vs Single-Parent Households in Jacksonville
| Children | Married-Couple Families | Single-Parent Households |
| No Children | 0 (0.0%) | 0 (0.0%) |
| 1 or 2 Children | 0 (0.0%) | 0 (0.0%) |
| 3 or 4 Children | 0 (0.0%) | 0 (0.0%) |
| 5 or more Children | 0 (0.0%) | 0 (0.0%) |
| Total | 0 (0.0%) | 0 (0.0%) |
Race in Jacksonville
The most populous races in Jacksonville are White / Caucasian (79 | 76.7%), Black / African American (16 | 15.5%), and Two or more Races (8 | 7.8%).
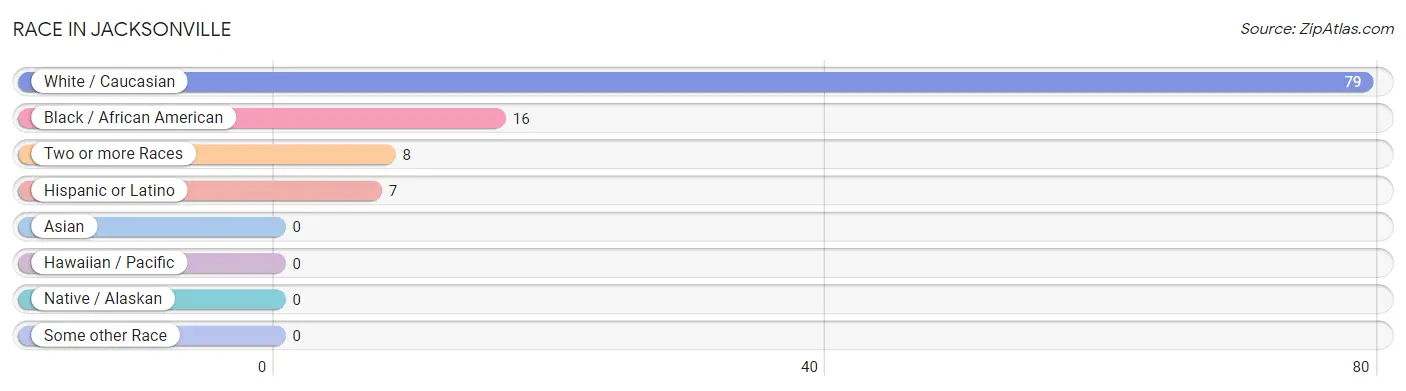
| Race | # Population | % Population |
| Asian | 0 | 0.0% |
| Black / African American | 16 | 15.5% |
| Hawaiian / Pacific | 0 | 0.0% |
| Hispanic or Latino | 7 | 6.8% |
| Native / Alaskan | 0 | 0.0% |
| White / Caucasian | 79 | 76.7% |
| Two or more Races | 8 | 7.8% |
| Some other Race | 0 | 0.0% |
| Total | 103 | 100.0% |
Ancestry in Jacksonville
The most populous ancestries reported in Jacksonville are English (21 | 20.4%), Irish (13 | 12.6%), German (11 | 10.7%), Colombian (7 | 6.8%), and South American (7 | 6.8%), together accounting for 57.3% of all Jacksonville residents.
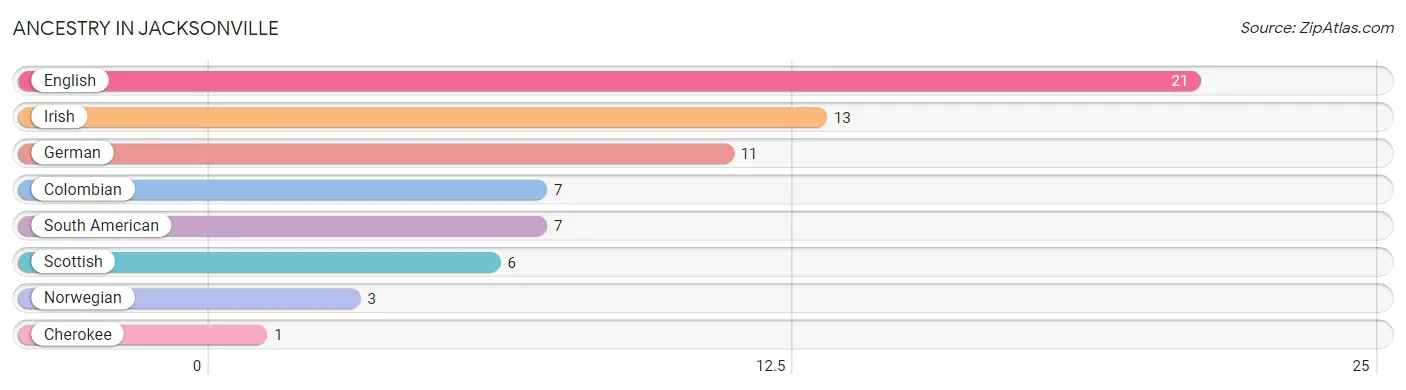
| Ancestry | # Population | % Population |
| Cherokee | 1 | 1.0% |
| Colombian | 7 | 6.8% |
| English | 21 | 20.4% |
| German | 11 | 10.7% |
| Irish | 13 | 12.6% |
| Norwegian | 3 | 2.9% |
| Scottish | 6 | 5.8% |
| South American | 7 | 6.8% | View All 8 Rows |
Immigrants in Jacksonville
The most numerous immigrant groups reported in Jacksonville came from Europe (1 | 1.0%), and Northern Europe (1 | 1.0%), together accounting for 1.9% of all Jacksonville residents.
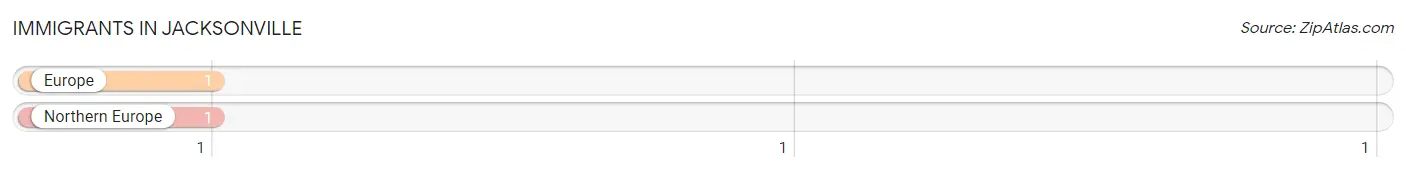
| Immigration Origin | # Population | % Population |
| Europe | 1 | 1.0% |
| Northern Europe | 1 | 1.0% | View All 2 Rows |
Sex and Age in Jacksonville
Sex and Age in Jacksonville
The most populous age groups in Jacksonville are 40 to 44 Years (14 | 23.3%) for men and 55 to 59 Years (10 | 23.3%) for women.
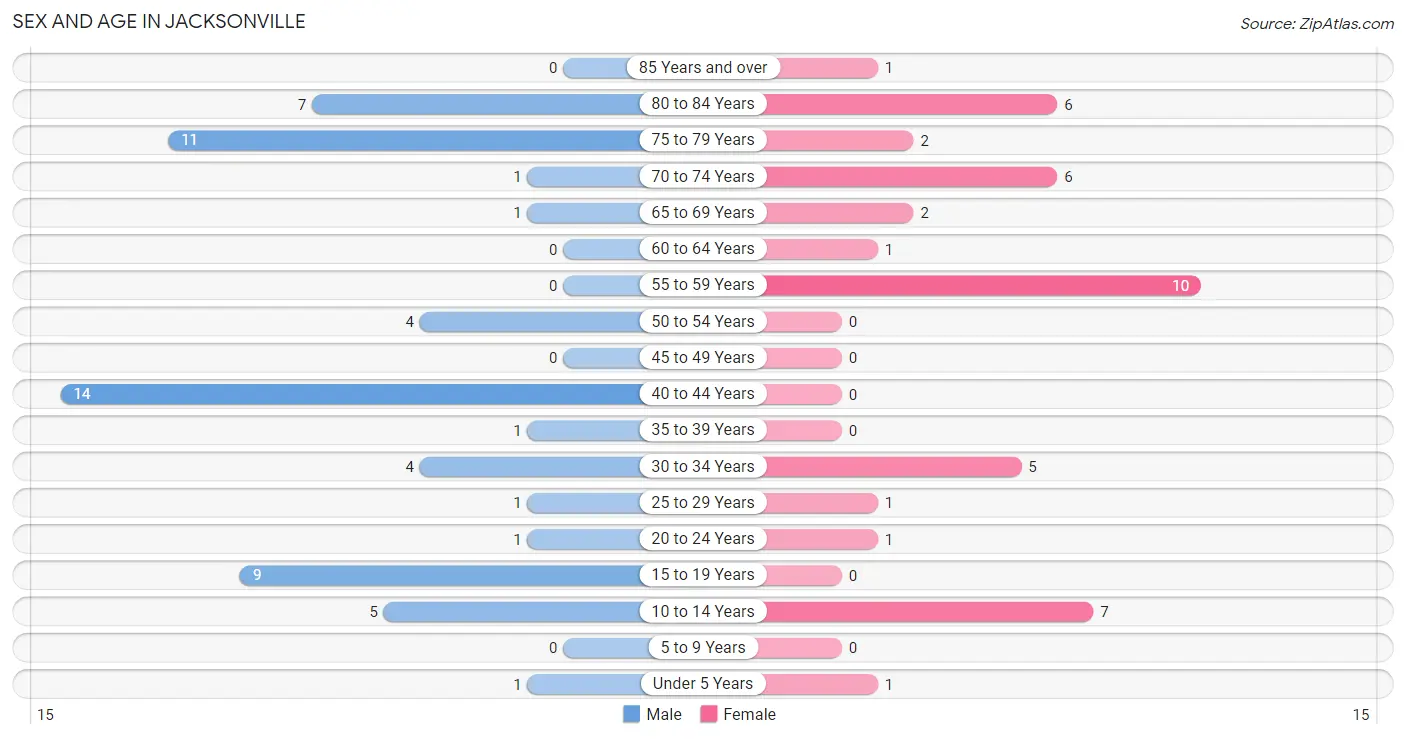
| Age Bracket | Male | Female |
| Under 5 Years | 1 (1.7%) | 1 (2.3%) |
| 5 to 9 Years | 0 (0.0%) | 0 (0.0%) |
| 10 to 14 Years | 5 (8.3%) | 7 (16.3%) |
| 15 to 19 Years | 9 (15.0%) | 0 (0.0%) |
| 20 to 24 Years | 1 (1.7%) | 1 (2.3%) |
| 25 to 29 Years | 1 (1.7%) | 1 (2.3%) |
| 30 to 34 Years | 4 (6.7%) | 5 (11.6%) |
| 35 to 39 Years | 1 (1.7%) | 0 (0.0%) |
| 40 to 44 Years | 14 (23.3%) | 0 (0.0%) |
| 45 to 49 Years | 0 (0.0%) | 0 (0.0%) |
| 50 to 54 Years | 4 (6.7%) | 0 (0.0%) |
| 55 to 59 Years | 0 (0.0%) | 10 (23.3%) |
| 60 to 64 Years | 0 (0.0%) | 1 (2.3%) |
| 65 to 69 Years | 1 (1.7%) | 2 (4.6%) |
| 70 to 74 Years | 1 (1.7%) | 6 (14.0%) |
| 75 to 79 Years | 11 (18.3%) | 2 (4.6%) |
| 80 to 84 Years | 7 (11.7%) | 6 (14.0%) |
| 85 Years and over | 0 (0.0%) | 1 (2.3%) |
| Total | 60 (100.0%) | 43 (100.0%) |
Families and Households in Jacksonville
Median Family Size in Jacksonville
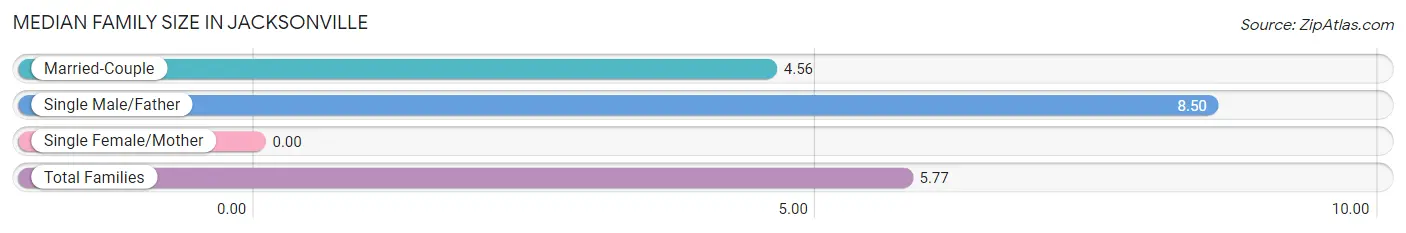
| Family Type | # Families | Family Size |
| Married-Couple | 9 (69.2%) | 4.56 |
| Single Male/Father | 4 (30.8%) | 8.50 |
| Single Female/Mother | 0 (0.0%) | - |
| Total Families | 13 (100.0%) | 5.77 |
Median Household Size in Jacksonville
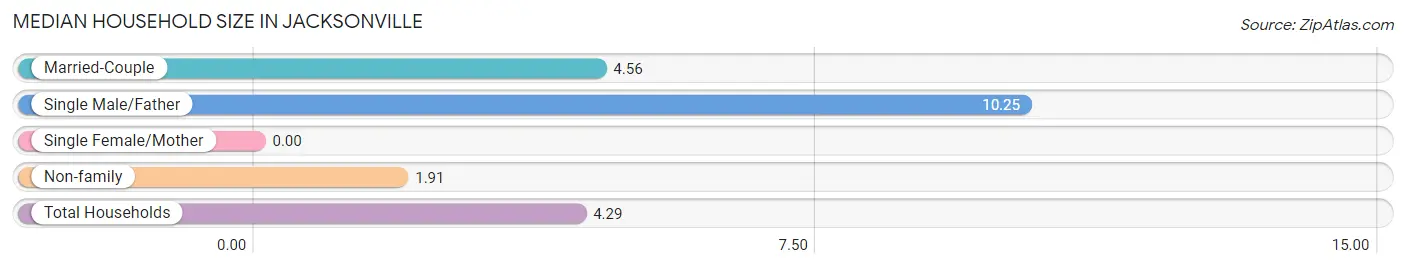
| Household Type | # Households | Household Size |
| Married-Couple | 9 (37.5%) | 4.56 |
| Single Male/Father | 4 (16.7%) | 10.25 |
| Single Female/Mother | 0 (0.0%) | - |
| Non-family | 11 (45.8%) | 1.91 |
| Total Households | 24 (100.0%) | 4.29 |
Household Size by Marriage Status in Jacksonville
Out of a total of 24 households in Jacksonville, 13 (54.2%) are family households, while 11 (45.8%) are nonfamily households. The most numerous type of family households are 2-person households, comprising 6, and the most common type of nonfamily households are 1-person households, comprising 8.
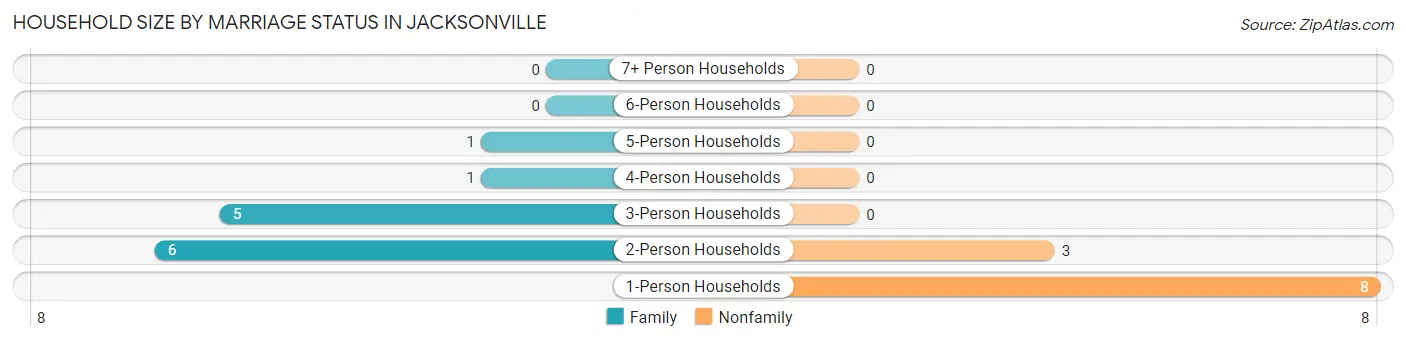
| Household Size | Family Households | Nonfamily Households |
| 1-Person Households | - | 8 (33.3%) |
| 2-Person Households | 6 (25.0%) | 3 (12.5%) |
| 3-Person Households | 5 (20.8%) | 0 (0.0%) |
| 4-Person Households | 1 (4.2%) | 0 (0.0%) |
| 5-Person Households | 1 (4.2%) | 0 (0.0%) |
| 6-Person Households | 0 (0.0%) | 0 (0.0%) |
| 7+ Person Households | 0 (0.0%) | 0 (0.0%) |
| Total | 13 (54.2%) | 11 (45.8%) |
Female Fertility in Jacksonville
Fertility by Age in Jacksonville
| Age Bracket | Women with Births | Births / 1,000 Women |
| 15 to 19 years | 0 (0.0%) | 0.0 |
| 20 to 34 years | 0 (0.0%) | 0.0 |
| 35 to 50 years | 0 (0.0%) | 0.0 |
| Total | 0 (0.0%) | 0.0 |
Fertility by Age by Marriage Status in Jacksonville
| Age Bracket | Married | Unmarried |
| 15 to 19 years | 0 (0.0%) | 0 (0.0%) |
| 20 to 34 years | 0 (0.0%) | 0 (0.0%) |
| 35 to 50 years | 0 (0.0%) | 0 (0.0%) |
| Total | 0 (0.0%) | 0 (0.0%) |
Fertility by Education in Jacksonville
| Educational Attainment | Women with Births | Births / 1,000 Women |
| Less than High School | 0 (0.0%) | 0.0 |
| High School Diploma | 0 (0.0%) | 0.0 |
| College or Associate's Degree | 0 (0.0%) | 0.0 |
| Bachelor's Degree | 0 (0.0%) | 0.0 |
| Graduate Degree | 0 (0.0%) | 0.0 |
| Total | 0 (0.0%) | 0.0 |
Fertility by Education by Marriage Status in Jacksonville
| Educational Attainment | Married | Unmarried |
| Less than High School | 0 (0.0%) | 0 (0.0%) |
| High School Diploma | 0 (0.0%) | 0 (0.0%) |
| College or Associate's Degree | 0 (0.0%) | 0 (0.0%) |
| Bachelor's Degree | 0 (0.0%) | 0 (0.0%) |
| Graduate Degree | 0 (0.0%) | 0 (0.0%) |
| Total | 0 (0.0%) | 0 (0.0%) |
Employment Characteristics in Jacksonville
Employment by Class of Employer in Jacksonville
Among the 25 employed individuals in Jacksonville, private company employees (18 | 72.0%), self-employed (not incorporated) (4 | 16.0%), and state government employees (2 | 8.0%) make up the most common classes of employment.
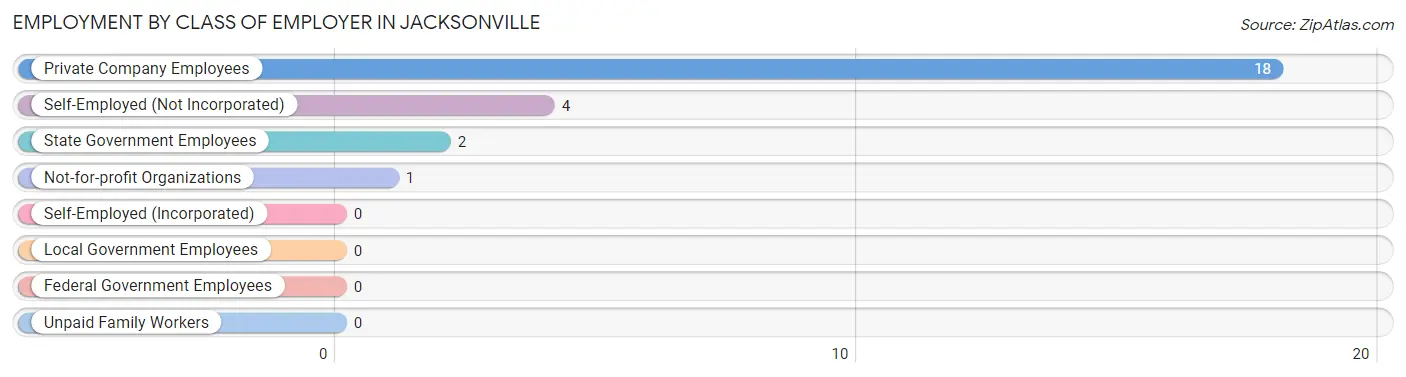
| Employer Class | # Employees | % Employees |
| Private Company Employees | 18 | 72.0% |
| Self-Employed (Incorporated) | 0 | 0.0% |
| Self-Employed (Not Incorporated) | 4 | 16.0% |
| Not-for-profit Organizations | 1 | 4.0% |
| Local Government Employees | 0 | 0.0% |
| State Government Employees | 2 | 8.0% |
| Federal Government Employees | 0 | 0.0% |
| Unpaid Family Workers | 0 | 0.0% |
| Total | 25 | 100.0% |
Employment Status by Age in Jacksonville
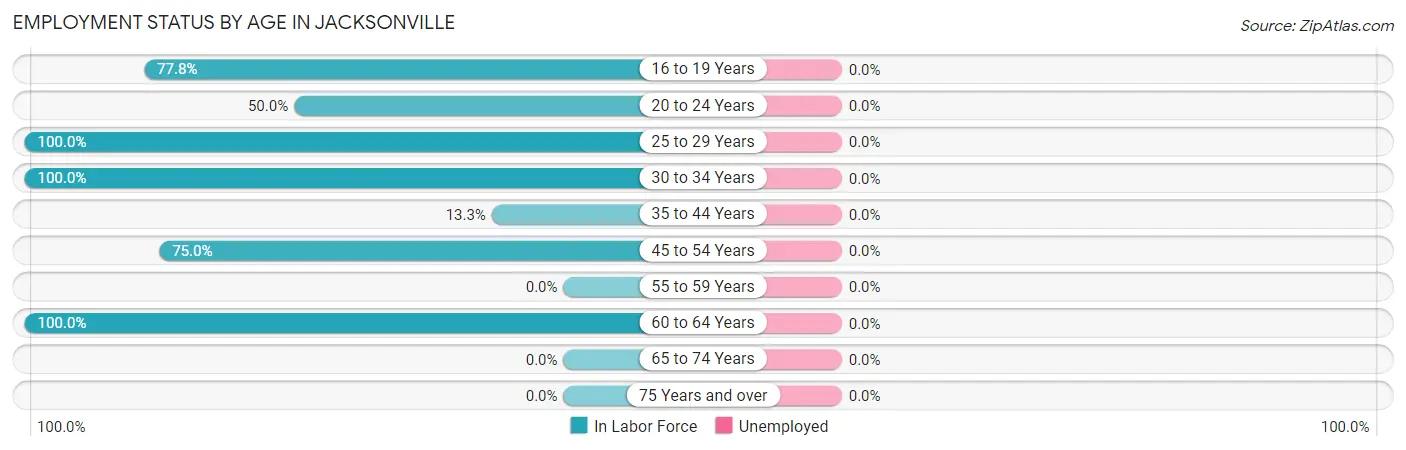
| Age Bracket | In Labor Force | Unemployed |
| 16 to 19 Years | 7 (77.8%) | 0 (0.0%) |
| 20 to 24 Years | 1 (50.0%) | 0 (0.0%) |
| 25 to 29 Years | 2 (100.0%) | 0 (0.0%) |
| 30 to 34 Years | 9 (100.0%) | 0 (0.0%) |
| 35 to 44 Years | 2 (13.3%) | 0 (0.0%) |
| 45 to 54 Years | 3 (75.0%) | 0 (0.0%) |
| 55 to 59 Years | 0 (0.0%) | 0 (0.0%) |
| 60 to 64 Years | 1 (100.0%) | 0 (0.0%) |
| 65 to 74 Years | 0 (0.0%) | 0 (0.0%) |
| 75 Years and over | 0 (0.0%) | 0 (0.0%) |
| Total | 25 (28.1%) | 0 (0.0%) |
Employment Status by Educational Attainment in Jacksonville
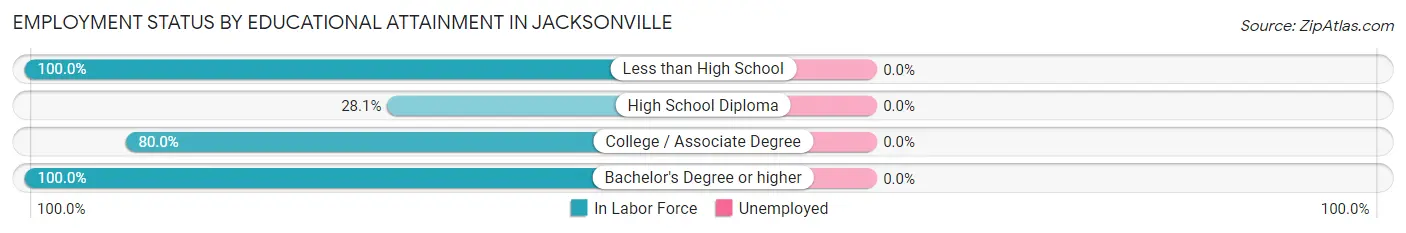
| Educational Attainment | In Labor Force | Unemployed |
| Less than High School | 3 (100.0%) | 0 (0.0%) |
| High School Diploma | 9 (28.1%) | 0 (0.0%) |
| College / Associate Degree | 4 (80.0%) | 0 (0.0%) |
| Bachelor's Degree or higher | 1 (100.0%) | 0 (0.0%) |
| Total | 17 (41.5%) | 0 (0.0%) |
Employment Occupations by Sex in Jacksonville
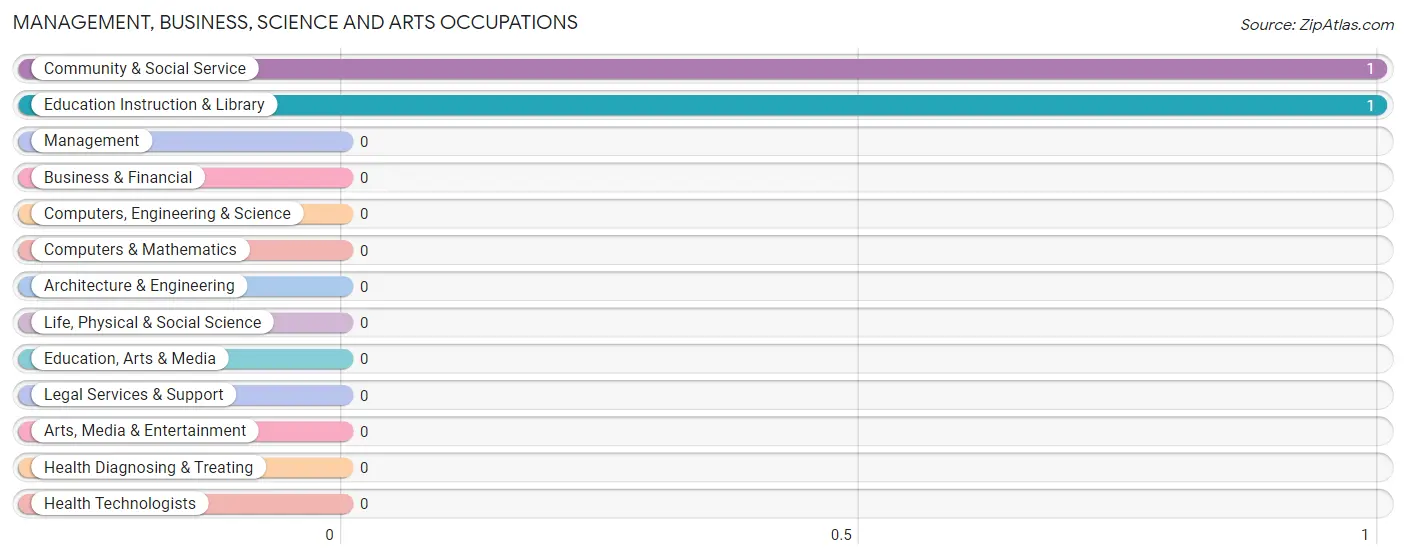
Management, Business, Science and Arts Occupations
The most common Management, Business, Science and Arts occupations in Jacksonville are Community & Social Service (1 | 4.0%), and Education Instruction & Library (1 | 4.0%).
Management, Business, Science and Arts Occupations by Sex
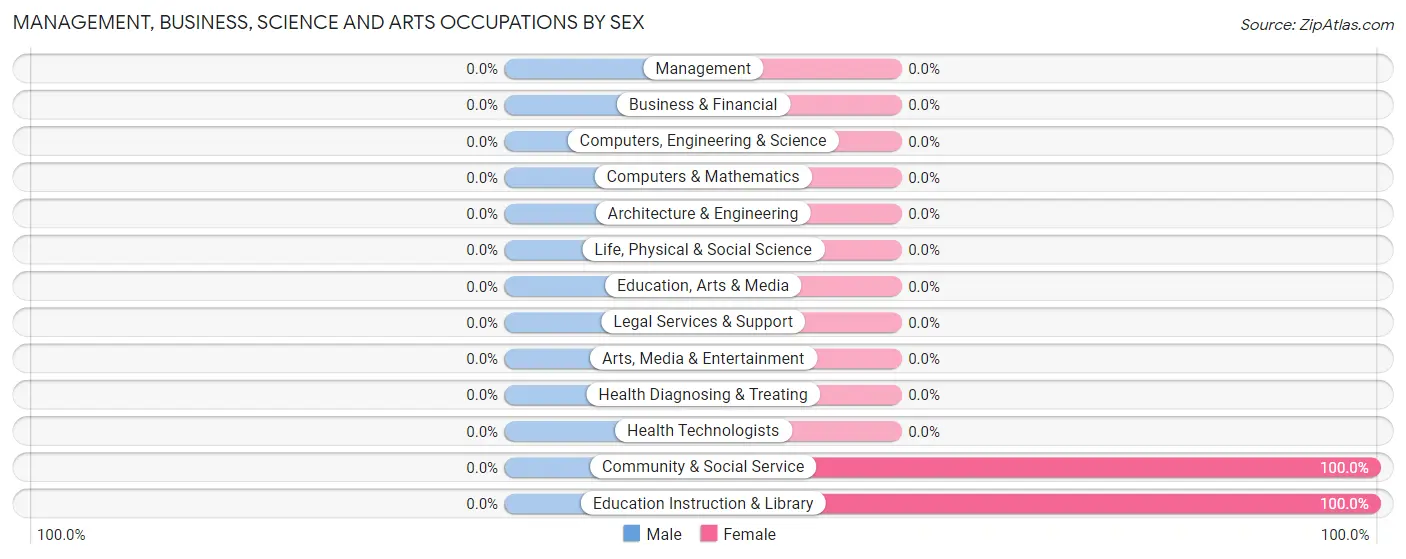
| Occupation | Male | Female |
| Management | 0 (0.0%) | 0 (0.0%) |
| Business & Financial | 0 (0.0%) | 0 (0.0%) |
| Computers, Engineering & Science | 0 (0.0%) | 0 (0.0%) |
| Computers & Mathematics | 0 (0.0%) | 0 (0.0%) |
| Architecture & Engineering | 0 (0.0%) | 0 (0.0%) |
| Life, Physical & Social Science | 0 (0.0%) | 0 (0.0%) |
| Community & Social Service | 0 (0.0%) | 1 (100.0%) |
| Education, Arts & Media | 0 (0.0%) | 0 (0.0%) |
| Legal Services & Support | 0 (0.0%) | 0 (0.0%) |
| Education Instruction & Library | 0 (0.0%) | 1 (100.0%) |
| Arts, Media & Entertainment | 0 (0.0%) | 0 (0.0%) |
| Health Diagnosing & Treating | 0 (0.0%) | 0 (0.0%) |
| Health Technologists | 0 (0.0%) | 0 (0.0%) |
| Total (Category) | 0 (0.0%) | 1 (100.0%) |
| Total (Overall) | 18 (72.0%) | 7 (28.0%) |
Services Occupations
The most common Services occupations in Jacksonville are Food Preparation & Serving (7 | 28.0%), Personal Care & Service (2 | 8.0%), Security & Protection (1 | 4.0%), and Law Enforcement (1 | 4.0%).
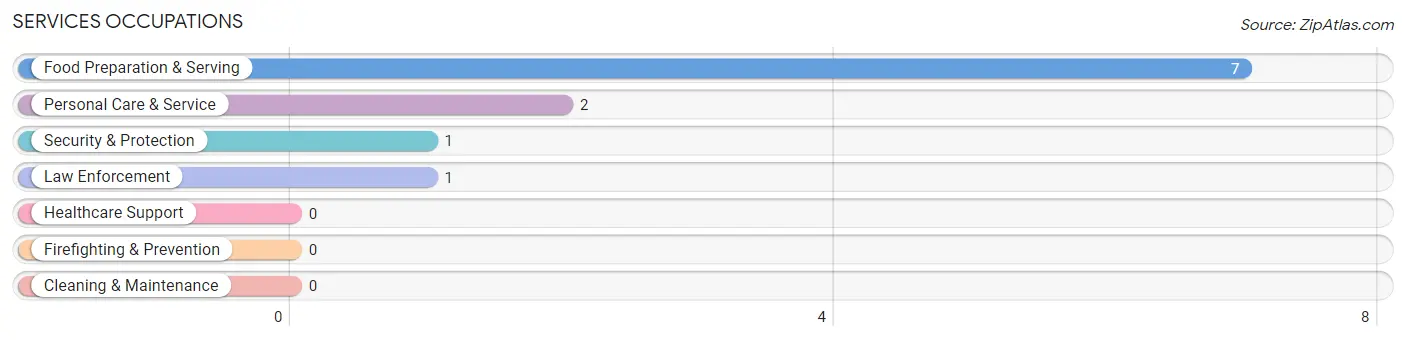
Services Occupations by Sex
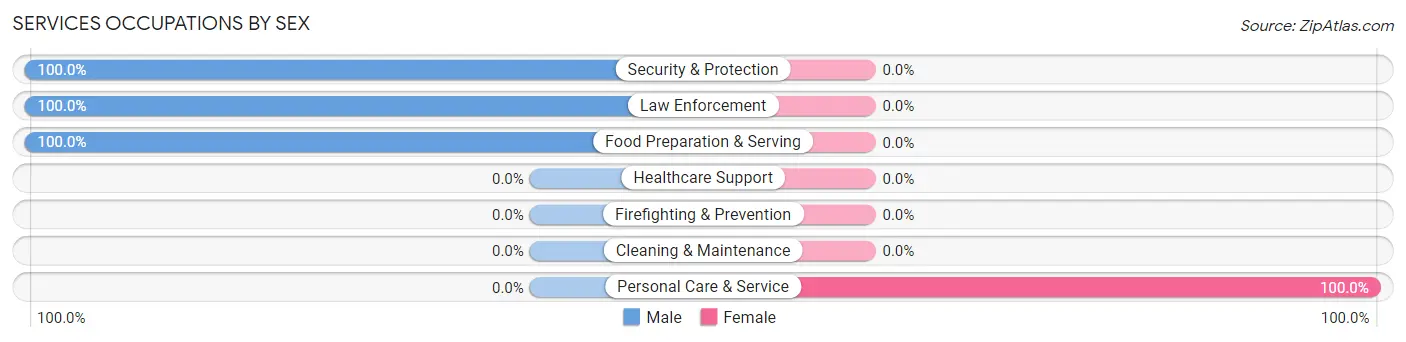
| Occupation | Male | Female |
| Healthcare Support | 0 (0.0%) | 0 (0.0%) |
| Security & Protection | 1 (100.0%) | 0 (0.0%) |
| Firefighting & Prevention | 0 (0.0%) | 0 (0.0%) |
| Law Enforcement | 1 (100.0%) | 0 (0.0%) |
| Food Preparation & Serving | 7 (100.0%) | 0 (0.0%) |
| Cleaning & Maintenance | 0 (0.0%) | 0 (0.0%) |
| Personal Care & Service | 0 (0.0%) | 2 (100.0%) |
| Total (Category) | 8 (80.0%) | 2 (20.0%) |
| Total (Overall) | 18 (72.0%) | 7 (28.0%) |
Sales and Office Occupations
The most common Sales and Office occupations in Jacksonville are Sales & Related (1 | 4.0%), and Office & Administration (1 | 4.0%).
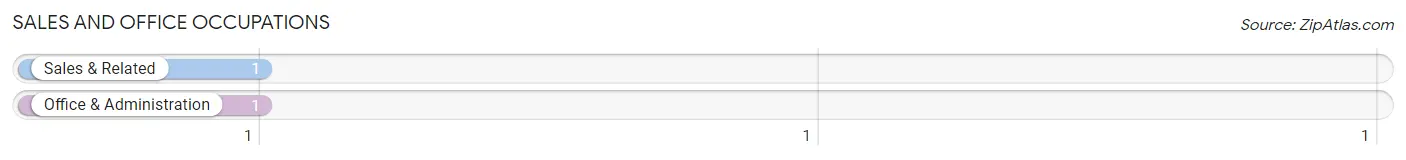
Sales and Office Occupations by Sex

| Occupation | Male | Female |
| Sales & Related | 1 (100.0%) | 0 (0.0%) |
| Office & Administration | 0 (0.0%) | 1 (100.0%) |
| Total (Category) | 1 (50.0%) | 1 (50.0%) |
| Total (Overall) | 18 (72.0%) | 7 (28.0%) |
Natural Resources, Construction and Maintenance Occupations
The most common Natural Resources, Construction and Maintenance occupations in Jacksonville are , and Installation, Maintenance & Repair (5 | 20.0%).
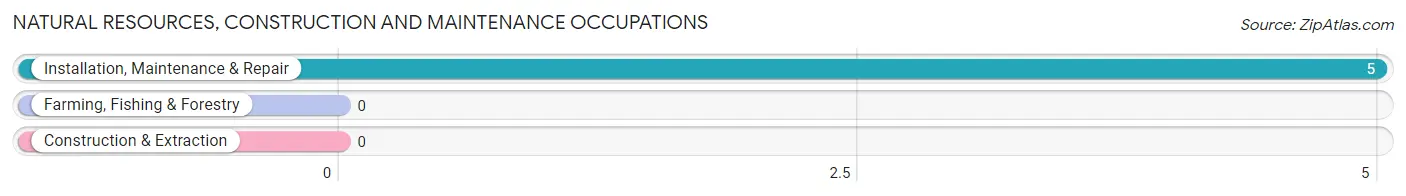
Natural Resources, Construction and Maintenance Occupations by Sex
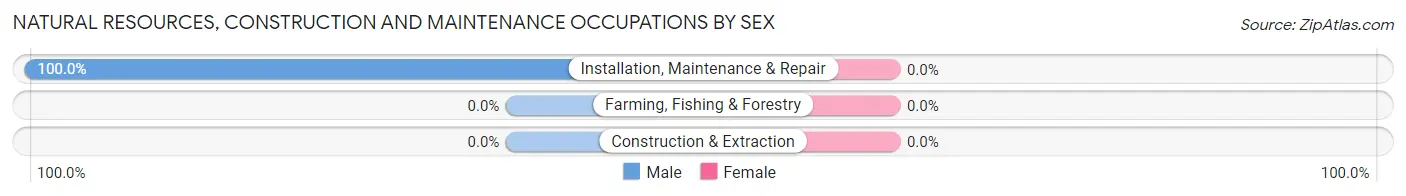
| Occupation | Male | Female |
| Farming, Fishing & Forestry | 0 (0.0%) | 0 (0.0%) |
| Construction & Extraction | 0 (0.0%) | 0 (0.0%) |
| Installation, Maintenance & Repair | 5 (100.0%) | 0 (0.0%) |
| Total (Category) | 5 (100.0%) | 0 (0.0%) |
| Total (Overall) | 18 (72.0%) | 7 (28.0%) |
Production, Transportation and Moving Occupations
The most common Production, Transportation and Moving occupations in Jacksonville are Production (3 | 12.0%), Material Moving (3 | 12.0%), and Transportation (1 | 4.0%).
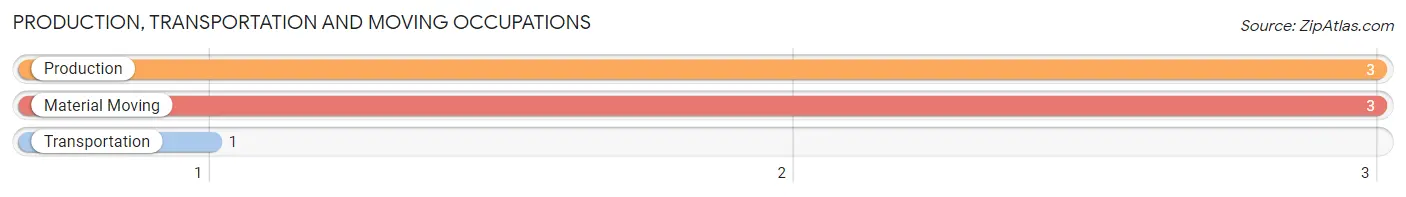
Production, Transportation and Moving Occupations by Sex
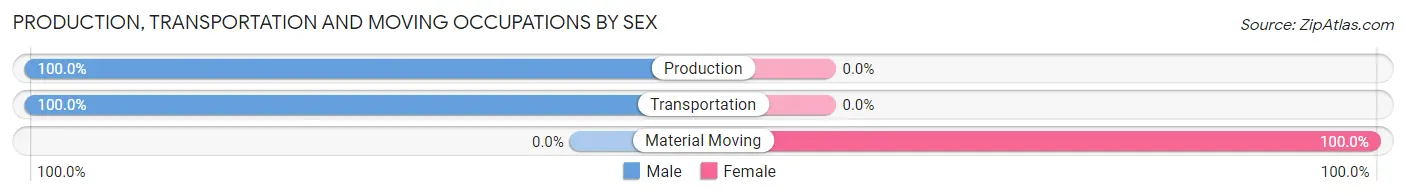
| Occupation | Male | Female |
| Production | 3 (100.0%) | 0 (0.0%) |
| Transportation | 1 (100.0%) | 0 (0.0%) |
| Material Moving | 0 (0.0%) | 3 (100.0%) |
| Total (Category) | 4 (57.1%) | 3 (42.9%) |
| Total (Overall) | 18 (72.0%) | 7 (28.0%) |
Employment Industries by Sex in Jacksonville
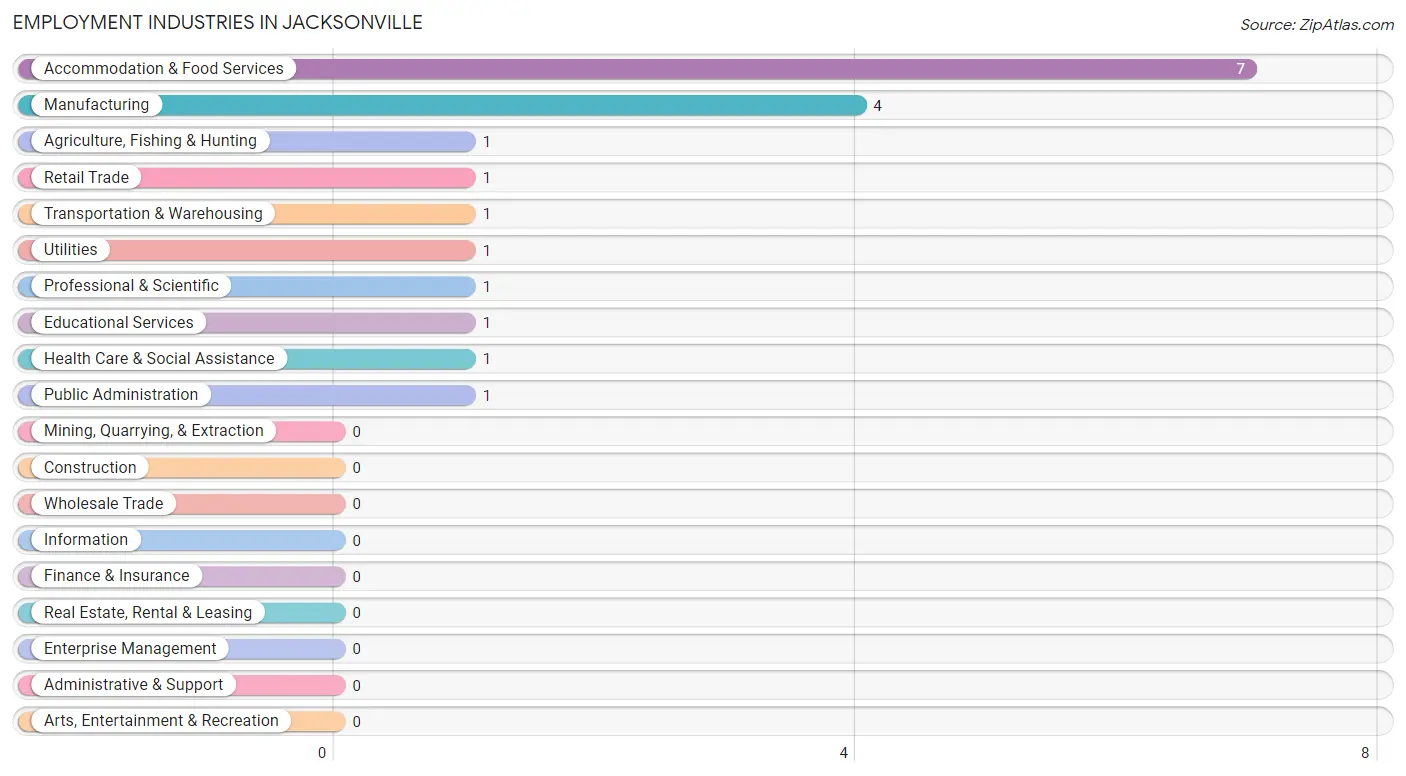
Employment Industries in Jacksonville
The major employment industries in Jacksonville include Accommodation & Food Services (7 | 28.0%), Manufacturing (4 | 16.0%), Agriculture, Fishing & Hunting (1 | 4.0%), Retail Trade (1 | 4.0%), and Transportation & Warehousing (1 | 4.0%).
Employment Industries by Sex in Jacksonville
The Jacksonville industries that see more men than women are Agriculture, Fishing & Hunting (100.0%), Manufacturing (100.0%), and Retail Trade (100.0%), whereas the industries that tend to have a higher number of women are Transportation & Warehousing (100.0%), Professional & Scientific (100.0%), and Educational Services (100.0%).
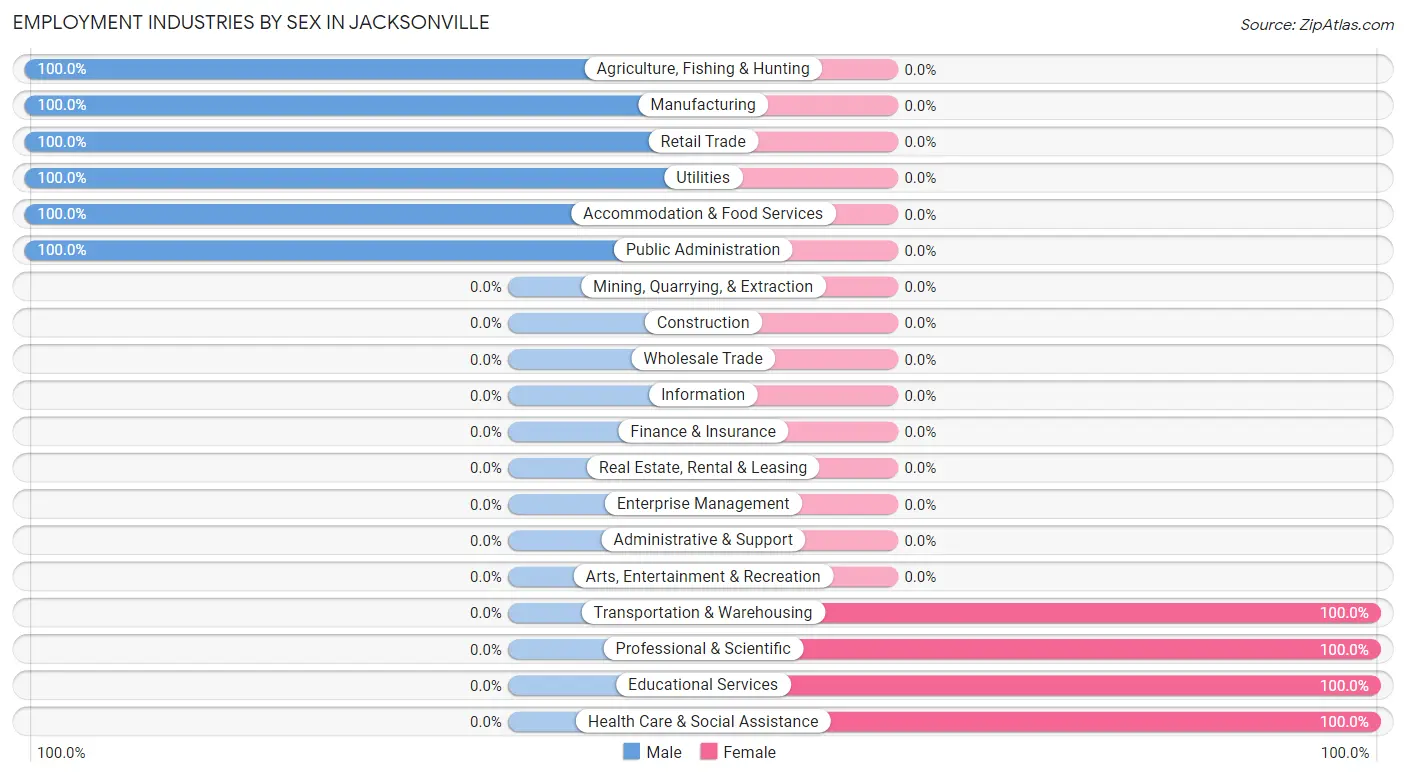
| Industry | Male | Female |
| Agriculture, Fishing & Hunting | 1 (100.0%) | 0 (0.0%) |
| Mining, Quarrying, & Extraction | 0 (0.0%) | 0 (0.0%) |
| Construction | 0 (0.0%) | 0 (0.0%) |
| Manufacturing | 4 (100.0%) | 0 (0.0%) |
| Wholesale Trade | 0 (0.0%) | 0 (0.0%) |
| Retail Trade | 1 (100.0%) | 0 (0.0%) |
| Transportation & Warehousing | 0 (0.0%) | 1 (100.0%) |
| Utilities | 1 (100.0%) | 0 (0.0%) |
| Information | 0 (0.0%) | 0 (0.0%) |
| Finance & Insurance | 0 (0.0%) | 0 (0.0%) |
| Real Estate, Rental & Leasing | 0 (0.0%) | 0 (0.0%) |
| Professional & Scientific | 0 (0.0%) | 1 (100.0%) |
| Enterprise Management | 0 (0.0%) | 0 (0.0%) |
| Administrative & Support | 0 (0.0%) | 0 (0.0%) |
| Educational Services | 0 (0.0%) | 1 (100.0%) |
| Health Care & Social Assistance | 0 (0.0%) | 1 (100.0%) |
| Arts, Entertainment & Recreation | 0 (0.0%) | 0 (0.0%) |
| Accommodation & Food Services | 7 (100.0%) | 0 (0.0%) |
| Public Administration | 1 (100.0%) | 0 (0.0%) |
| Total | 18 (72.0%) | 7 (28.0%) |
Education in Jacksonville
School Enrollment in Jacksonville
The most common levels of schooling among the 21 students in Jacksonville are middle school (9 | 42.9%), high school (9 | 42.9%), and elementary school (3 | 14.3%).
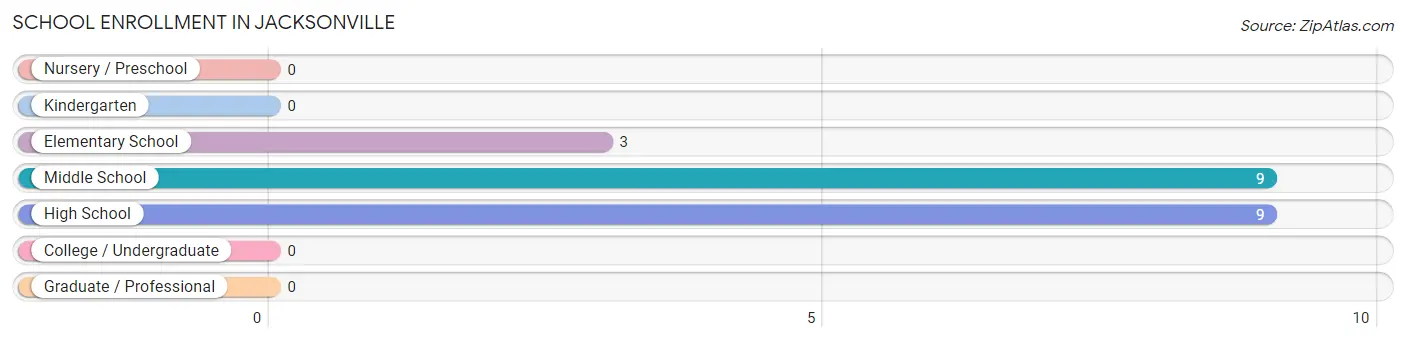
| School Level | # Students | % Students |
| Nursery / Preschool | 0 | 0.0% |
| Kindergarten | 0 | 0.0% |
| Elementary School | 3 | 14.3% |
| Middle School | 9 | 42.9% |
| High School | 9 | 42.9% |
| College / Undergraduate | 0 | 0.0% |
| Graduate / Professional | 0 | 0.0% |
| Total | 21 | 100.0% |
School Enrollment by Age by Funding Source in Jacksonville
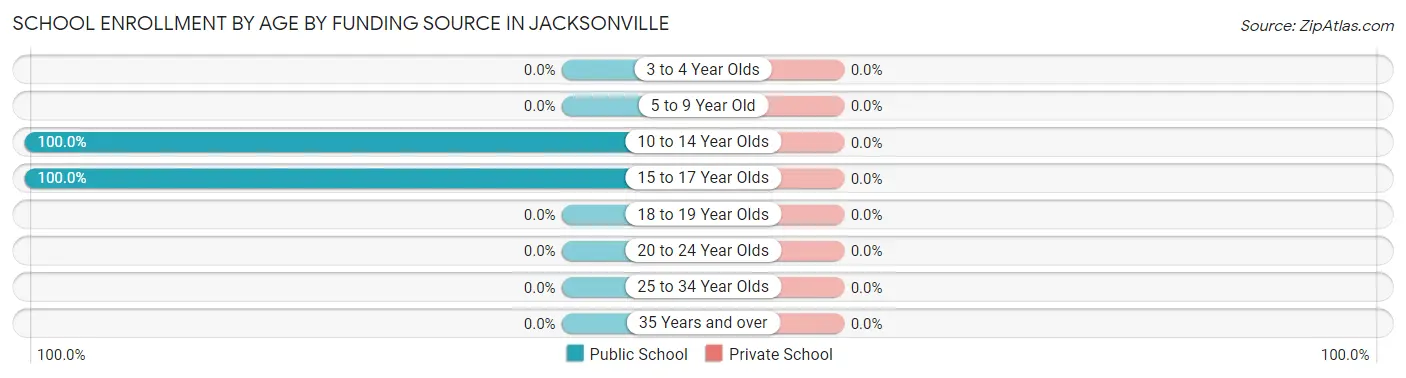
| Age Bracket | Public School | Private School |
| 3 to 4 Year Olds | 0 (0.0%) | 0 (0.0%) |
| 5 to 9 Year Old | 0 (0.0%) | 0 (0.0%) |
| 10 to 14 Year Olds | 12 (100.0%) | 0 (0.0%) |
| 15 to 17 Year Olds | 9 (100.0%) | 0 (0.0%) |
| 18 to 19 Year Olds | 0 (0.0%) | 0 (0.0%) |
| 20 to 24 Year Olds | 0 (0.0%) | 0 (0.0%) |
| 25 to 34 Year Olds | 0 (0.0%) | 0 (0.0%) |
| 35 Years and over | 0 (0.0%) | 0 (0.0%) |
| Total | 21 (100.0%) | 0 (0.0%) |
Educational Attainment by Field of Study in Jacksonville
Arts & humanities (5 | 83.3%), and education (1 | 16.7%) are the most common fields of study among 6 individuals in Jacksonville who have obtained a bachelor's degree or higher.
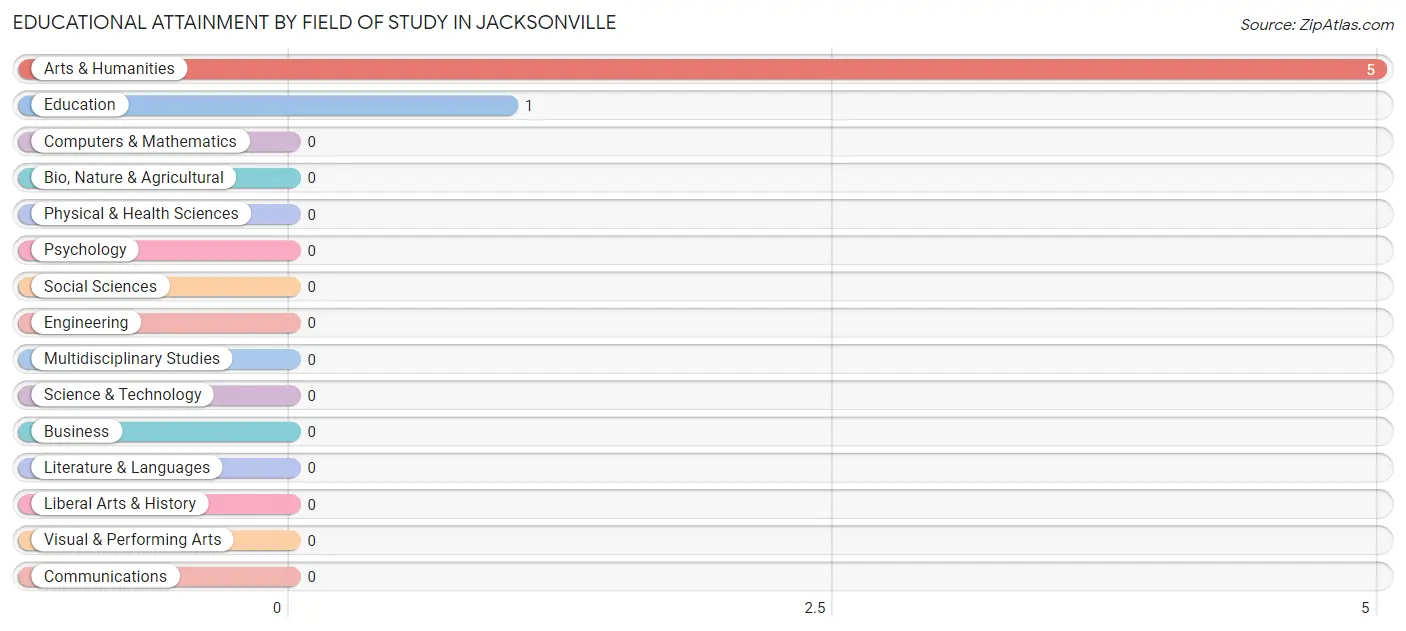
| Field of Study | # Graduates | % Graduates |
| Computers & Mathematics | 0 | 0.0% |
| Bio, Nature & Agricultural | 0 | 0.0% |
| Physical & Health Sciences | 0 | 0.0% |
| Psychology | 0 | 0.0% |
| Social Sciences | 0 | 0.0% |
| Engineering | 0 | 0.0% |
| Multidisciplinary Studies | 0 | 0.0% |
| Science & Technology | 0 | 0.0% |
| Business | 0 | 0.0% |
| Education | 1 | 16.7% |
| Literature & Languages | 0 | 0.0% |
| Liberal Arts & History | 0 | 0.0% |
| Visual & Performing Arts | 0 | 0.0% |
| Communications | 0 | 0.0% |
| Arts & Humanities | 5 | 83.3% |
| Total | 6 | 100.0% |
Transportation & Commute in Jacksonville
Vehicle Availability by Sex in Jacksonville
The most prevalent vehicle ownership categories in Jacksonville are males with 2 vehicles (12, accounting for 66.7%) and females with 2 vehicles (2, making up 171.4%).
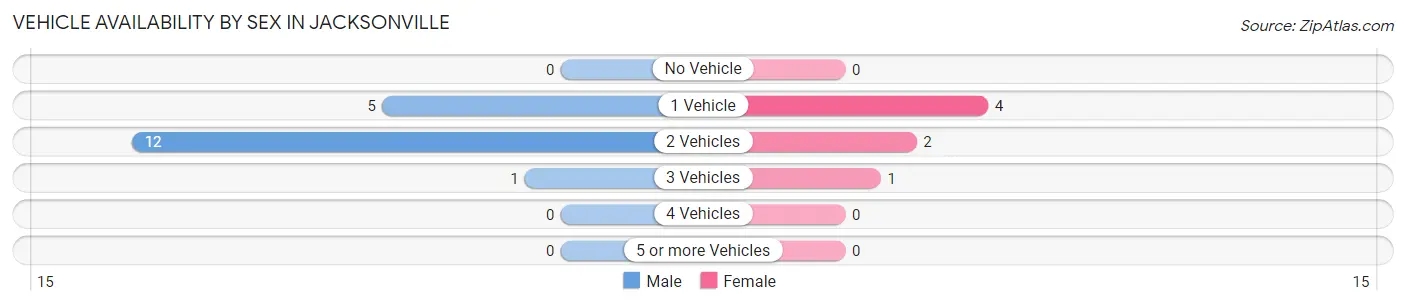
| Vehicles Available | Male | Female |
| No Vehicle | 0 (0.0%) | 0 (0.0%) |
| 1 Vehicle | 5 (27.8%) | 4 (57.1%) |
| 2 Vehicles | 12 (66.7%) | 2 (28.6%) |
| 3 Vehicles | 1 (5.6%) | 1 (14.3%) |
| 4 Vehicles | 0 (0.0%) | 0 (0.0%) |
| 5 or more Vehicles | 0 (0.0%) | 0 (0.0%) |
| Total | 18 (100.0%) | 7 (100.0%) |
Commute Time in Jacksonville
The most frequently occuring commute durations in Jacksonville are 25 to 29 minutes (7 commuters, 29.2%), 20 to 24 minutes (6 commuters, 25.0%), and 10 to 14 minutes (4 commuters, 16.7%).
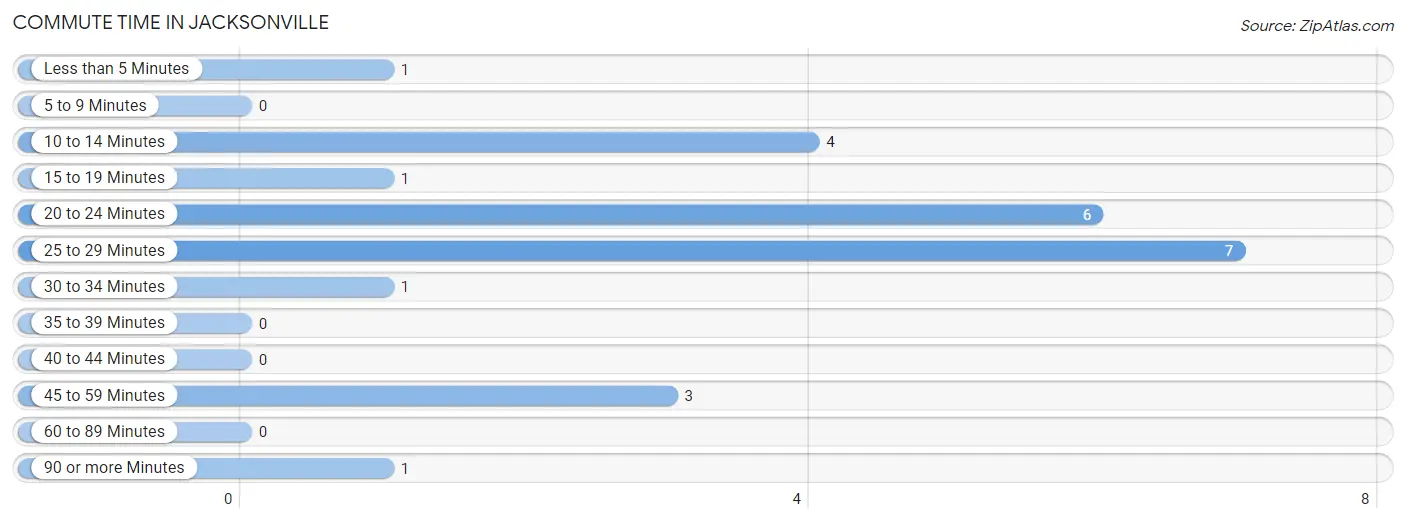
| Commute Time | # Commuters | % Commuters |
| Less than 5 Minutes | 1 | 4.2% |
| 5 to 9 Minutes | 0 | 0.0% |
| 10 to 14 Minutes | 4 | 16.7% |
| 15 to 19 Minutes | 1 | 4.2% |
| 20 to 24 Minutes | 6 | 25.0% |
| 25 to 29 Minutes | 7 | 29.2% |
| 30 to 34 Minutes | 1 | 4.2% |
| 35 to 39 Minutes | 0 | 0.0% |
| 40 to 44 Minutes | 0 | 0.0% |
| 45 to 59 Minutes | 3 | 12.5% |
| 60 to 89 Minutes | 0 | 0.0% |
| 90 or more Minutes | 1 | 4.2% |
Commute Time by Sex in Jacksonville
The most common commute times in Jacksonville are 25 to 29 minutes (7 commuters, 38.9%) for males and 10 to 14 minutes (3 commuters, 50.0%) for females.
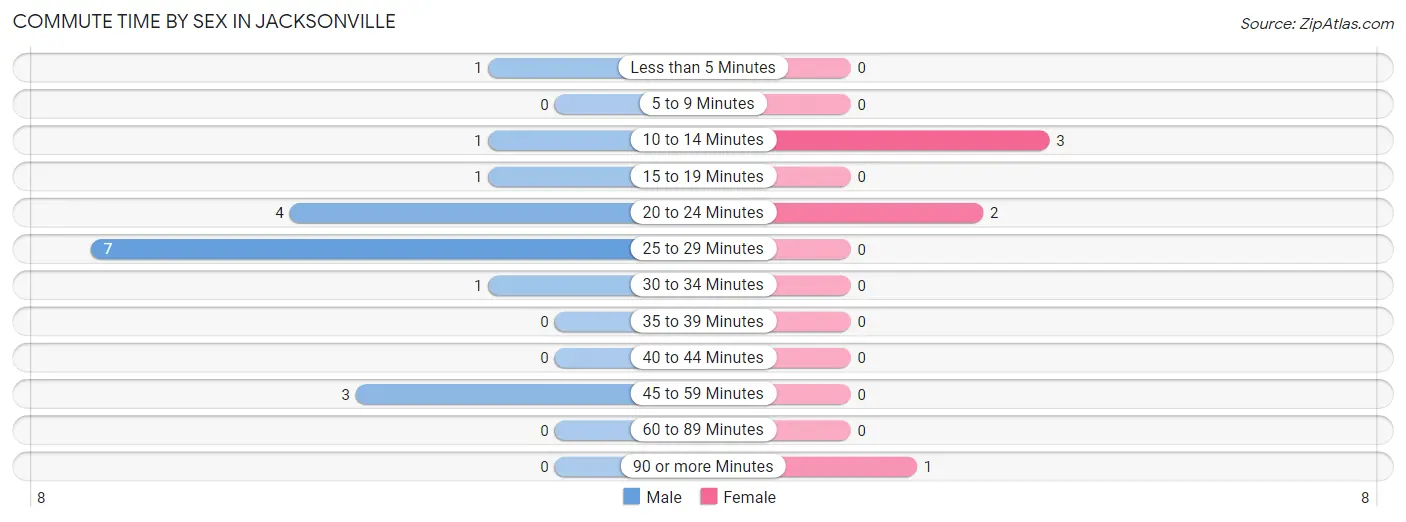
| Commute Time | Male | Female |
| Less than 5 Minutes | 1 (5.6%) | 0 (0.0%) |
| 5 to 9 Minutes | 0 (0.0%) | 0 (0.0%) |
| 10 to 14 Minutes | 1 (5.6%) | 3 (50.0%) |
| 15 to 19 Minutes | 1 (5.6%) | 0 (0.0%) |
| 20 to 24 Minutes | 4 (22.2%) | 2 (33.3%) |
| 25 to 29 Minutes | 7 (38.9%) | 0 (0.0%) |
| 30 to 34 Minutes | 1 (5.6%) | 0 (0.0%) |
| 35 to 39 Minutes | 0 (0.0%) | 0 (0.0%) |
| 40 to 44 Minutes | 0 (0.0%) | 0 (0.0%) |
| 45 to 59 Minutes | 3 (16.7%) | 0 (0.0%) |
| 60 to 89 Minutes | 0 (0.0%) | 0 (0.0%) |
| 90 or more Minutes | 0 (0.0%) | 1 (16.7%) |
Time of Departure to Work by Sex in Jacksonville
The most frequent times of departure to work in Jacksonville are 12:00 PM to 3:59 PM (8, 44.4%) for males and 7:00 AM to 7:29 AM (3, 50.0%) for females.
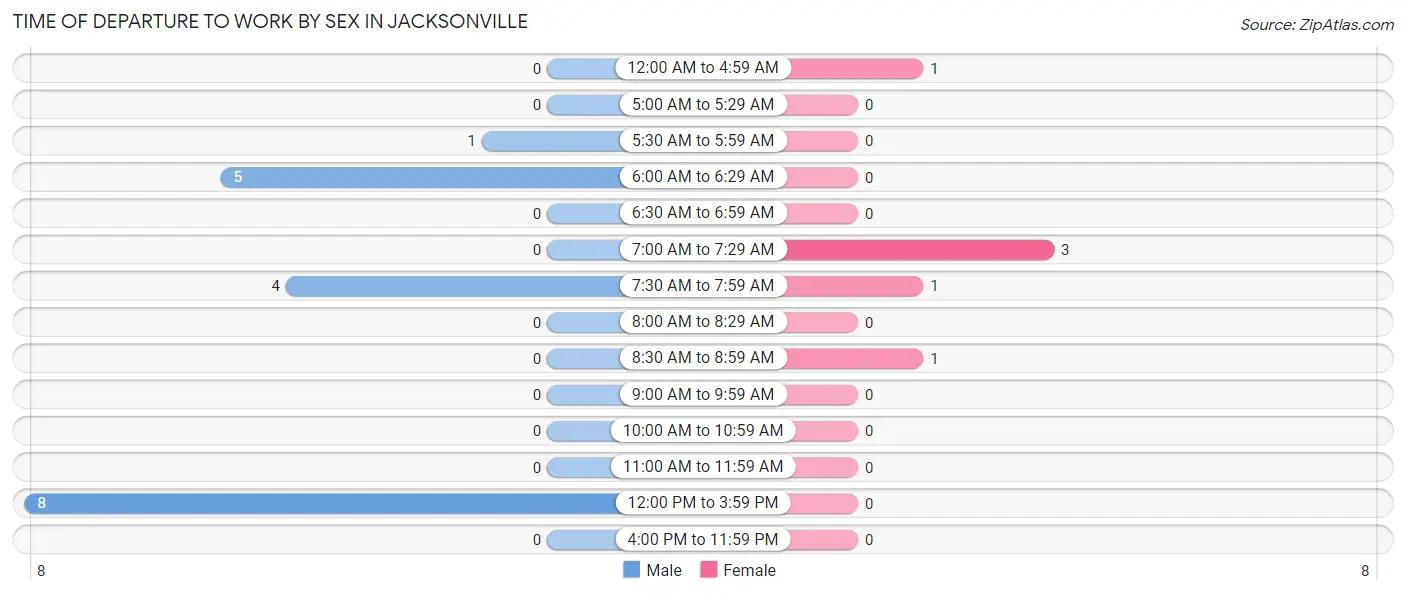
| Time of Departure | Male | Female |
| 12:00 AM to 4:59 AM | 0 (0.0%) | 1 (16.7%) |
| 5:00 AM to 5:29 AM | 0 (0.0%) | 0 (0.0%) |
| 5:30 AM to 5:59 AM | 1 (5.6%) | 0 (0.0%) |
| 6:00 AM to 6:29 AM | 5 (27.8%) | 0 (0.0%) |
| 6:30 AM to 6:59 AM | 0 (0.0%) | 0 (0.0%) |
| 7:00 AM to 7:29 AM | 0 (0.0%) | 3 (50.0%) |
| 7:30 AM to 7:59 AM | 4 (22.2%) | 1 (16.7%) |
| 8:00 AM to 8:29 AM | 0 (0.0%) | 0 (0.0%) |
| 8:30 AM to 8:59 AM | 0 (0.0%) | 1 (16.7%) |
| 9:00 AM to 9:59 AM | 0 (0.0%) | 0 (0.0%) |
| 10:00 AM to 10:59 AM | 0 (0.0%) | 0 (0.0%) |
| 11:00 AM to 11:59 AM | 0 (0.0%) | 0 (0.0%) |
| 12:00 PM to 3:59 PM | 8 (44.4%) | 0 (0.0%) |
| 4:00 PM to 11:59 PM | 0 (0.0%) | 0 (0.0%) |
| Total | 18 (100.0%) | 6 (100.0%) |
Housing Occupancy in Jacksonville
Occupancy by Ownership in Jacksonville
Of the total 24 dwellings in Jacksonville, owner-occupied units account for 20 (83.3%), while renter-occupied units make up 4 (16.7%).
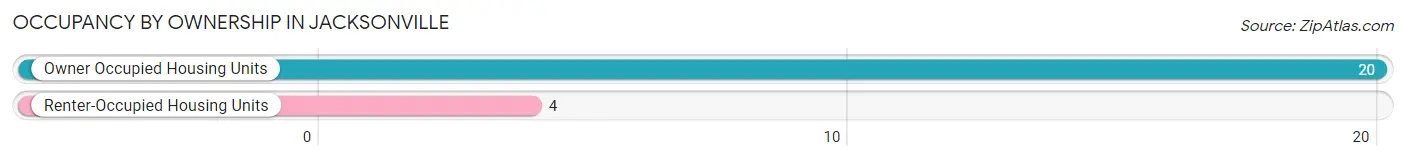
| Occupancy | # Housing Units | % Housing Units |
| Owner Occupied Housing Units | 20 | 83.3% |
| Renter-Occupied Housing Units | 4 | 16.7% |
| Total Occupied Housing Units | 24 | 100.0% |
Occupancy by Household Size in Jacksonville
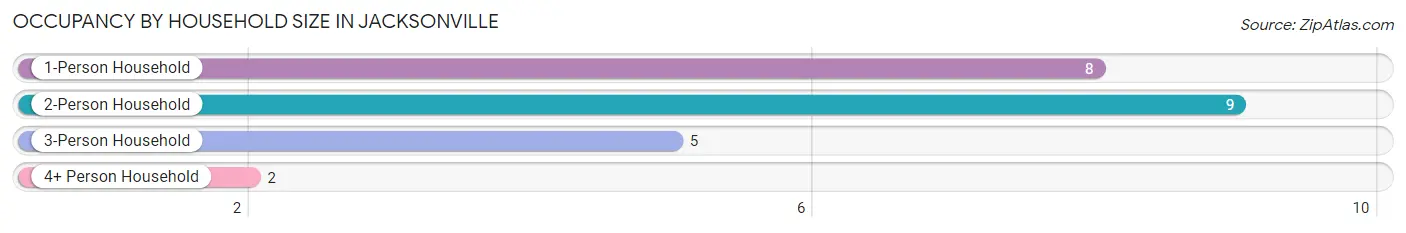
| Household Size | # Housing Units | % Housing Units |
| 1-Person Household | 8 | 33.3% |
| 2-Person Household | 9 | 37.5% |
| 3-Person Household | 5 | 20.8% |
| 4+ Person Household | 2 | 8.3% |
| Total Housing Units | 24 | 100.0% |
Occupancy by Ownership by Household Size in Jacksonville
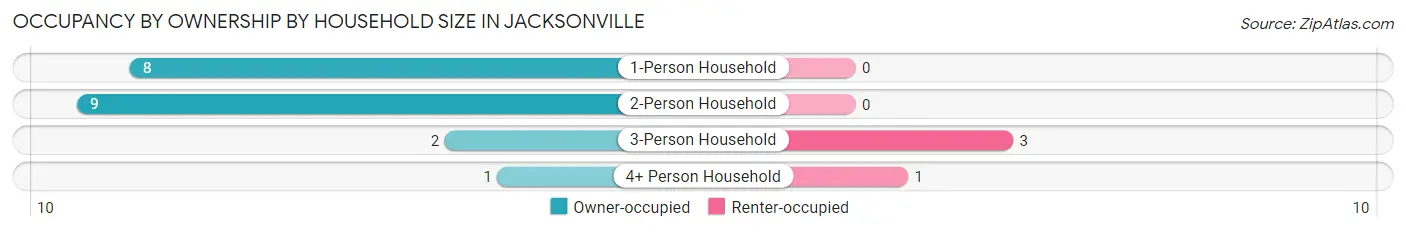
| Household Size | Owner-occupied | Renter-occupied |
| 1-Person Household | 8 (100.0%) | 0 (0.0%) |
| 2-Person Household | 9 (100.0%) | 0 (0.0%) |
| 3-Person Household | 2 (40.0%) | 3 (60.0%) |
| 4+ Person Household | 1 (50.0%) | 1 (50.0%) |
| Total Housing Units | 20 (83.3%) | 4 (16.7%) |
Occupancy by Educational Attainment in Jacksonville
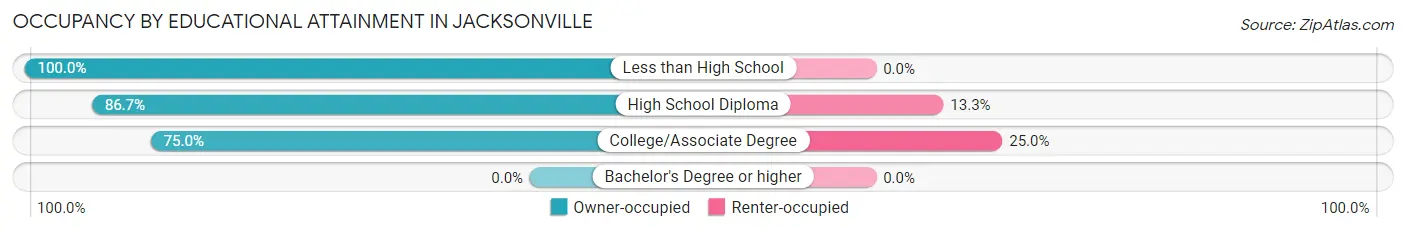
| Household Size | Owner-occupied | Renter-occupied |
| Less than High School | 1 (100.0%) | 0 (0.0%) |
| High School Diploma | 13 (86.7%) | 2 (13.3%) |
| College/Associate Degree | 6 (75.0%) | 2 (25.0%) |
| Bachelor's Degree or higher | 0 (0.0%) | 0 (0.0%) |
Occupancy by Age of Householder in Jacksonville
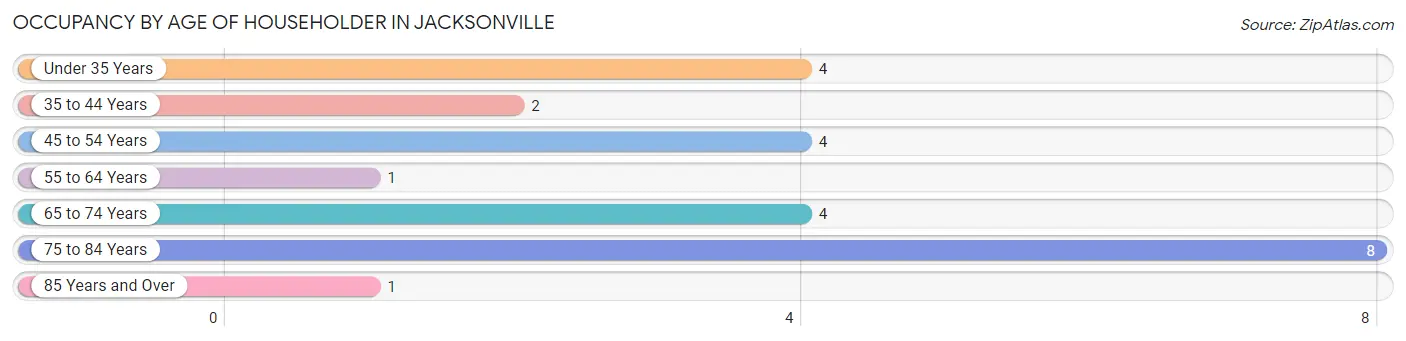
| Age Bracket | # Households | % Households |
| Under 35 Years | 4 | 16.7% |
| 35 to 44 Years | 2 | 8.3% |
| 45 to 54 Years | 4 | 16.7% |
| 55 to 64 Years | 1 | 4.2% |
| 65 to 74 Years | 4 | 16.7% |
| 75 to 84 Years | 8 | 33.3% |
| 85 Years and Over | 1 | 4.2% |
| Total | 24 | 100.0% |
Housing Finances in Jacksonville
Median Income by Occupancy in Jacksonville
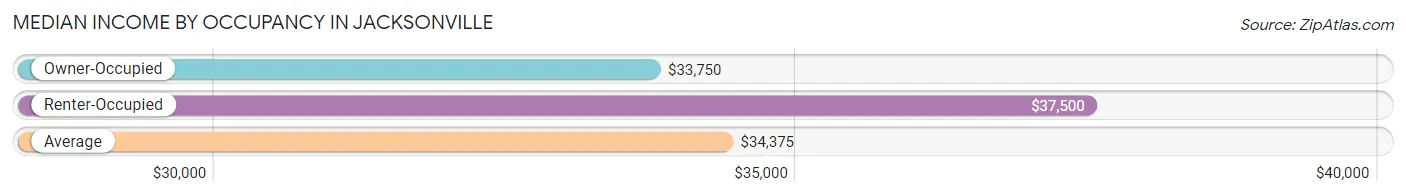
| Occupancy Type | # Households | Median Income |
| Owner-Occupied | 20 (83.3%) | $33,750 |
| Renter-Occupied | 4 (16.7%) | $37,500 |
| Average | 24 (100.0%) | $34,375 |
Occupancy by Householder Income Bracket in Jacksonville
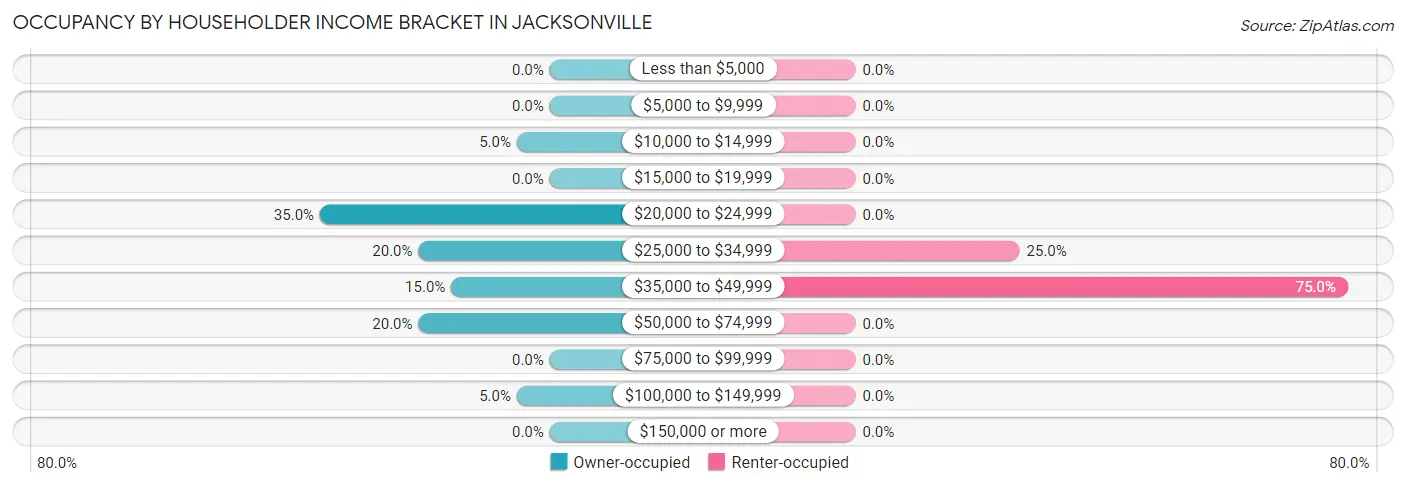
| Income Bracket | Owner-occupied | Renter-occupied |
| Less than $5,000 | 0 (0.0%) | 0 (0.0%) |
| $5,000 to $9,999 | 0 (0.0%) | 0 (0.0%) |
| $10,000 to $14,999 | 1 (5.0%) | 0 (0.0%) |
| $15,000 to $19,999 | 0 (0.0%) | 0 (0.0%) |
| $20,000 to $24,999 | 7 (35.0%) | 0 (0.0%) |
| $25,000 to $34,999 | 4 (20.0%) | 1 (25.0%) |
| $35,000 to $49,999 | 3 (15.0%) | 3 (75.0%) |
| $50,000 to $74,999 | 4 (20.0%) | 0 (0.0%) |
| $75,000 to $99,999 | 0 (0.0%) | 0 (0.0%) |
| $100,000 to $149,999 | 1 (5.0%) | 0 (0.0%) |
| $150,000 or more | 0 (0.0%) | 0 (0.0%) |
| Total | 20 (100.0%) | 4 (100.0%) |
Monthly Housing Cost Tiers in Jacksonville
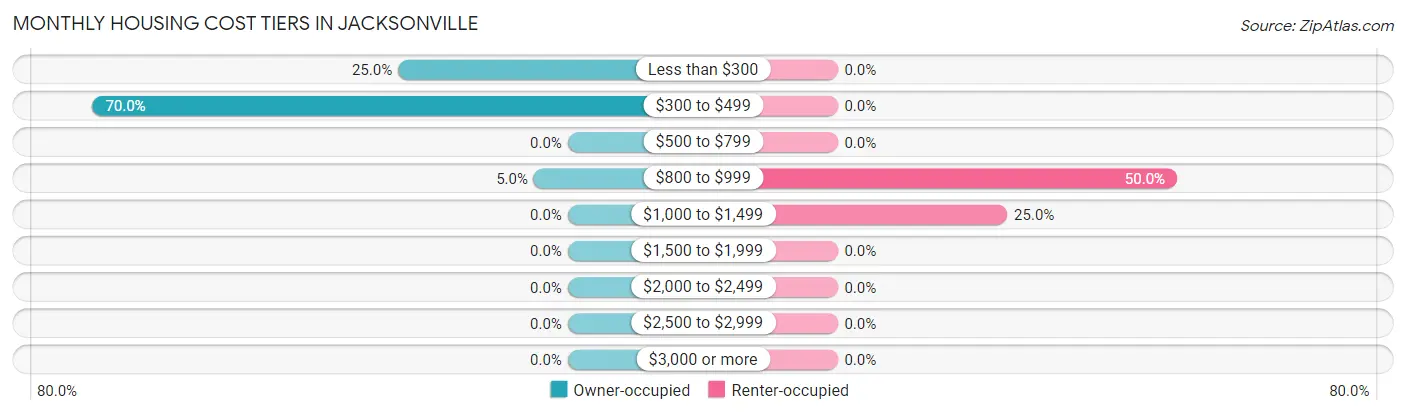
| Monthly Cost | Owner-occupied | Renter-occupied |
| Less than $300 | 5 (25.0%) | 0 (0.0%) |
| $300 to $499 | 14 (70.0%) | 0 (0.0%) |
| $500 to $799 | 0 (0.0%) | 0 (0.0%) |
| $800 to $999 | 1 (5.0%) | 2 (50.0%) |
| $1,000 to $1,499 | 0 (0.0%) | 1 (25.0%) |
| $1,500 to $1,999 | 0 (0.0%) | 0 (0.0%) |
| $2,000 to $2,499 | 0 (0.0%) | 0 (0.0%) |
| $2,500 to $2,999 | 0 (0.0%) | 0 (0.0%) |
| $3,000 or more | 0 (0.0%) | 0 (0.0%) |
| Total | 20 (100.0%) | 4 (100.0%) |
Physical Housing Characteristics in Jacksonville
Housing Structures in Jacksonville
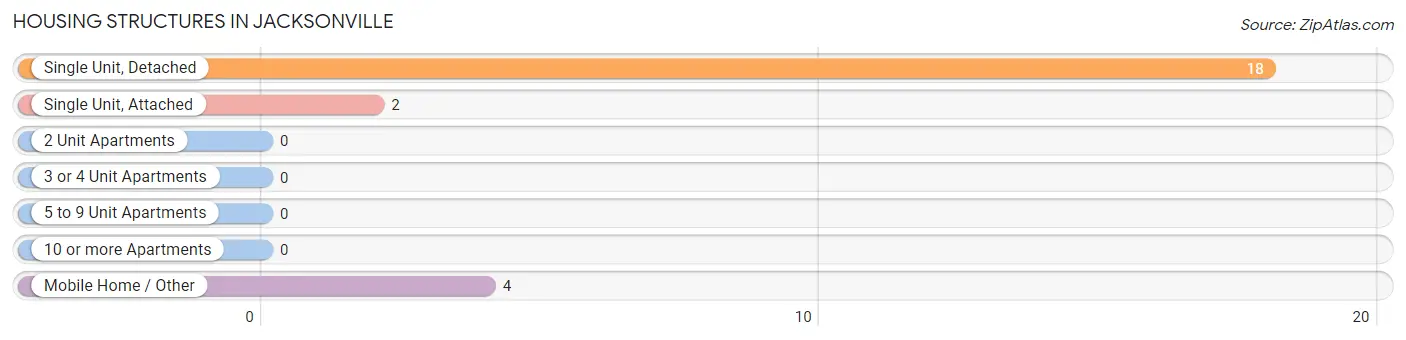
| Structure Type | # Housing Units | % Housing Units |
| Single Unit, Detached | 18 | 75.0% |
| Single Unit, Attached | 2 | 8.3% |
| 2 Unit Apartments | 0 | 0.0% |
| 3 or 4 Unit Apartments | 0 | 0.0% |
| 5 to 9 Unit Apartments | 0 | 0.0% |
| 10 or more Apartments | 0 | 0.0% |
| Mobile Home / Other | 4 | 16.7% |
| Total | 24 | 100.0% |
Housing Structures by Occupancy in Jacksonville
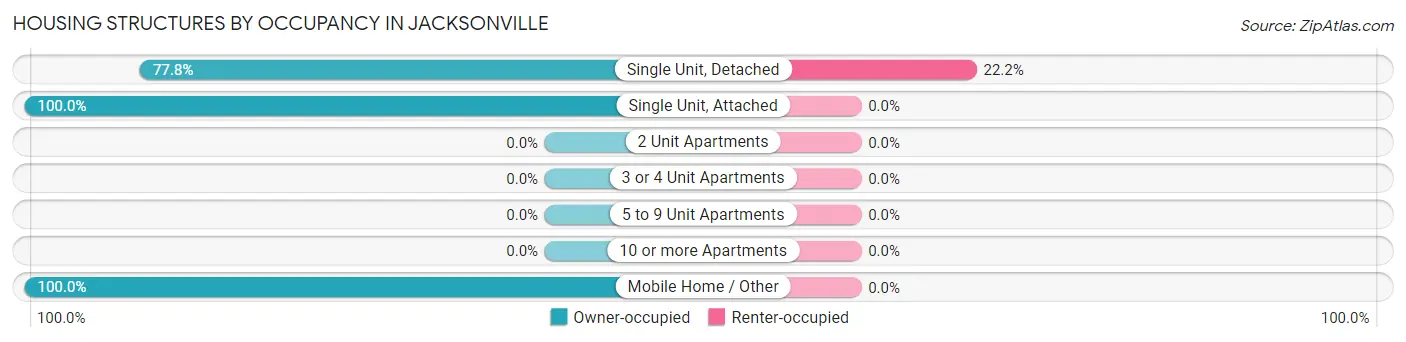
| Structure Type | Owner-occupied | Renter-occupied |
| Single Unit, Detached | 14 (77.8%) | 4 (22.2%) |
| Single Unit, Attached | 2 (100.0%) | 0 (0.0%) |
| 2 Unit Apartments | 0 (0.0%) | 0 (0.0%) |
| 3 or 4 Unit Apartments | 0 (0.0%) | 0 (0.0%) |
| 5 to 9 Unit Apartments | 0 (0.0%) | 0 (0.0%) |
| 10 or more Apartments | 0 (0.0%) | 0 (0.0%) |
| Mobile Home / Other | 4 (100.0%) | 0 (0.0%) |
| Total | 20 (83.3%) | 4 (16.7%) |
Housing Structures by Number of Rooms in Jacksonville
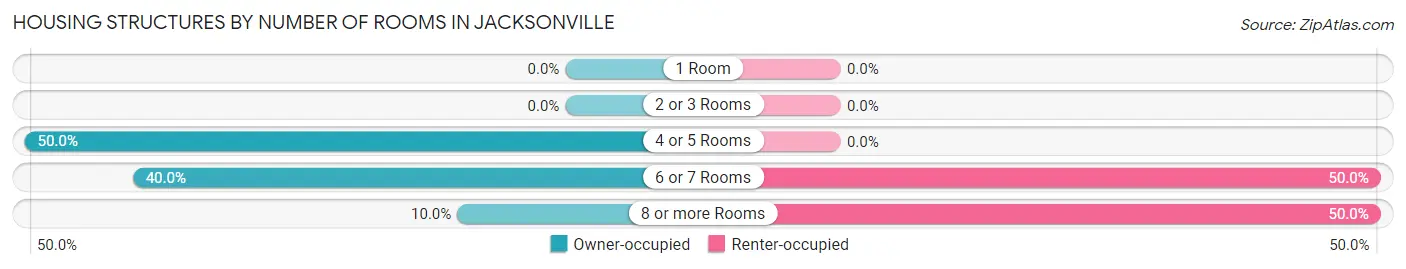
| Number of Rooms | Owner-occupied | Renter-occupied |
| 1 Room | 0 (0.0%) | 0 (0.0%) |
| 2 or 3 Rooms | 0 (0.0%) | 0 (0.0%) |
| 4 or 5 Rooms | 10 (50.0%) | 0 (0.0%) |
| 6 or 7 Rooms | 8 (40.0%) | 2 (50.0%) |
| 8 or more Rooms | 2 (10.0%) | 2 (50.0%) |
| Total | 20 (100.0%) | 4 (100.0%) |
Housing Structure by Heating Type in Jacksonville
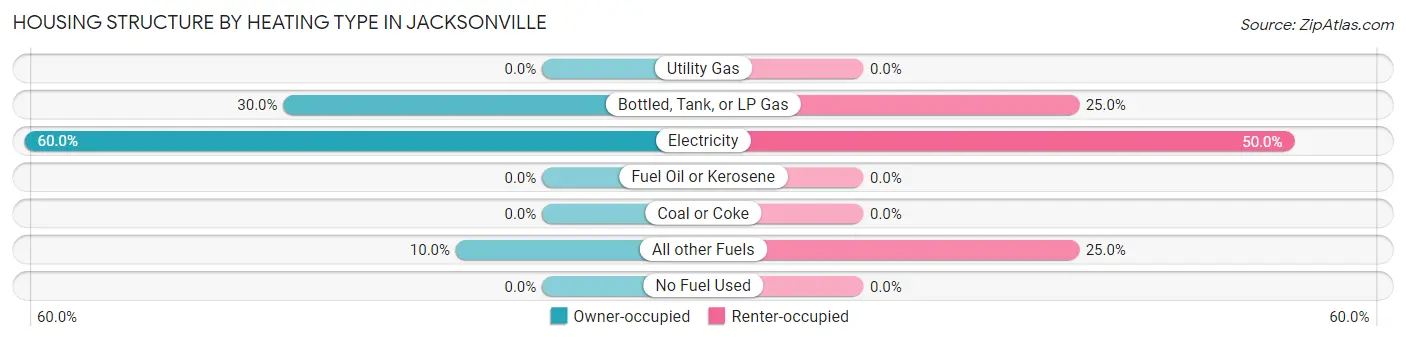
| Heating Type | Owner-occupied | Renter-occupied |
| Utility Gas | 0 (0.0%) | 0 (0.0%) |
| Bottled, Tank, or LP Gas | 6 (30.0%) | 1 (25.0%) |
| Electricity | 12 (60.0%) | 2 (50.0%) |
| Fuel Oil or Kerosene | 0 (0.0%) | 0 (0.0%) |
| Coal or Coke | 0 (0.0%) | 0 (0.0%) |
| All other Fuels | 2 (10.0%) | 1 (25.0%) |
| No Fuel Used | 0 (0.0%) | 0 (0.0%) |
| Total | 20 (100.0%) | 4 (100.0%) |
Household Vehicle Usage in Jacksonville
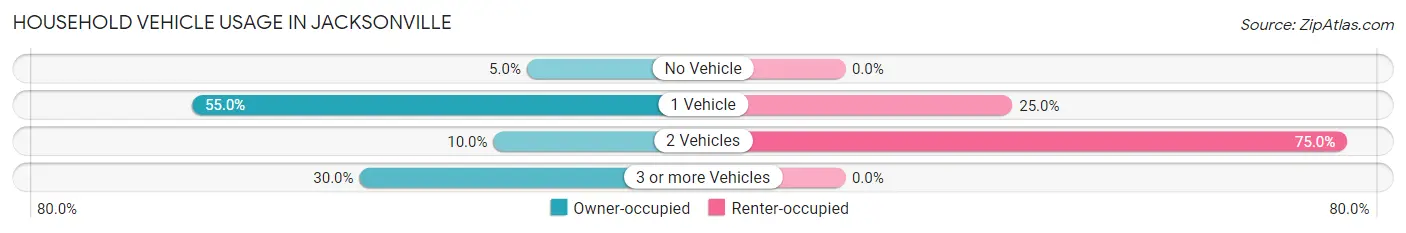
| Vehicles per Household | Owner-occupied | Renter-occupied |
| No Vehicle | 1 (5.0%) | 0 (0.0%) |
| 1 Vehicle | 11 (55.0%) | 1 (25.0%) |
| 2 Vehicles | 2 (10.0%) | 3 (75.0%) |
| 3 or more Vehicles | 6 (30.0%) | 0 (0.0%) |
| Total | 20 (100.0%) | 4 (100.0%) |
Real Estate & Mortgages in Jacksonville
Real Estate and Mortgage Overview in Jacksonville
| Characteristic | Without Mortgage | With Mortgage |
| Housing Units | 18 | 2 |
| Median Property Value | - | - |
| Median Household Income | $33,125 | $0 |
| Monthly Housing Costs | $371 | $0 |
| Real Estate Taxes | - | - |
Property Value by Mortgage Status in Jacksonville
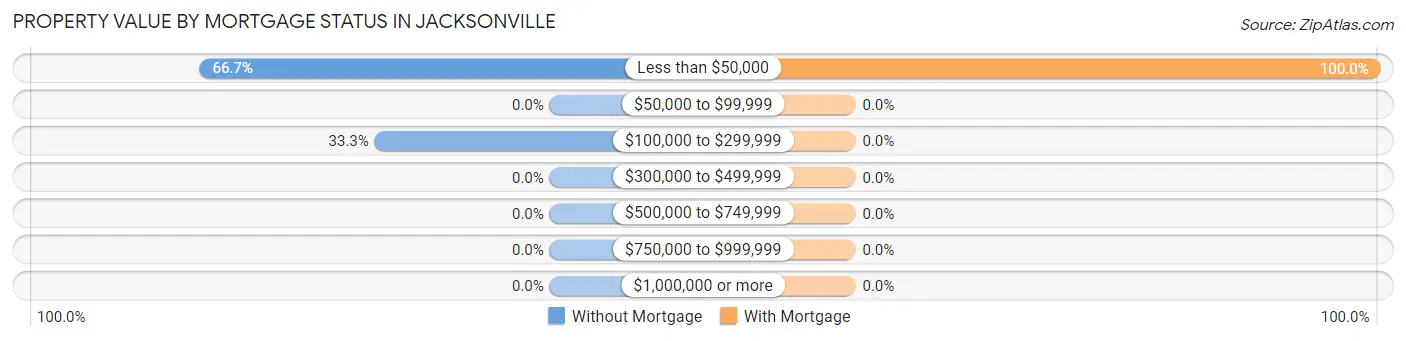
| Property Value | Without Mortgage | With Mortgage |
| Less than $50,000 | 12 (66.7%) | 2 (100.0%) |
| $50,000 to $99,999 | 0 (0.0%) | 0 (0.0%) |
| $100,000 to $299,999 | 6 (33.3%) | 0 (0.0%) |
| $300,000 to $499,999 | 0 (0.0%) | 0 (0.0%) |
| $500,000 to $749,999 | 0 (0.0%) | 0 (0.0%) |
| $750,000 to $999,999 | 0 (0.0%) | 0 (0.0%) |
| $1,000,000 or more | 0 (0.0%) | 0 (0.0%) |
| Total | 18 (100.0%) | 2 (100.0%) |
Household Income by Mortgage Status in Jacksonville
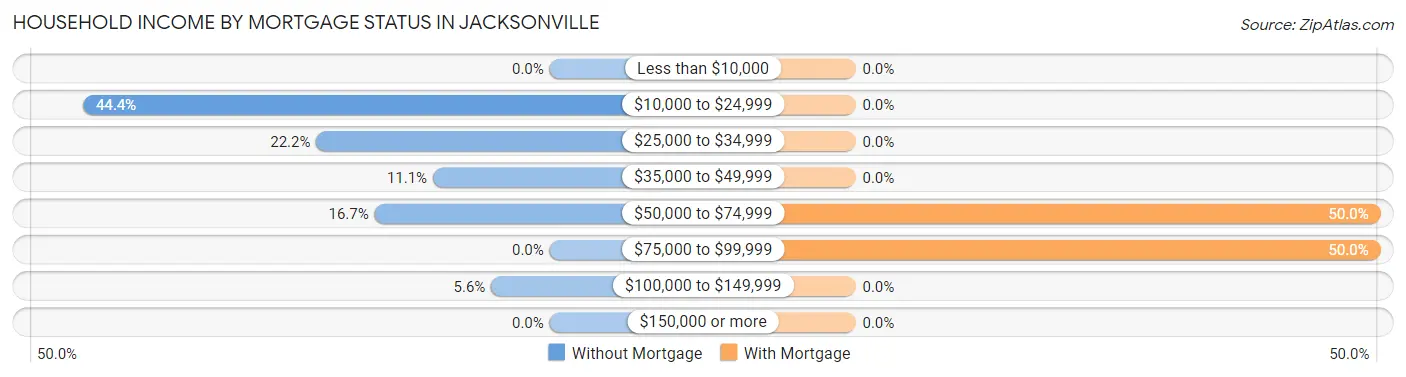
| Household Income | Without Mortgage | With Mortgage |
| Less than $10,000 | 0 (0.0%) | 0 (0.0%) |
| $10,000 to $24,999 | 8 (44.4%) | 0 (0.0%) |
| $25,000 to $34,999 | 4 (22.2%) | 0 (0.0%) |
| $35,000 to $49,999 | 2 (11.1%) | 0 (0.0%) |
| $50,000 to $74,999 | 3 (16.7%) | 1 (50.0%) |
| $75,000 to $99,999 | 0 (0.0%) | 1 (50.0%) |
| $100,000 to $149,999 | 1 (5.6%) | 0 (0.0%) |
| $150,000 or more | 0 (0.0%) | 0 (0.0%) |
| Total | 18 (100.0%) | 2 (100.0%) |
Property Value to Household Income Ratio in Jacksonville
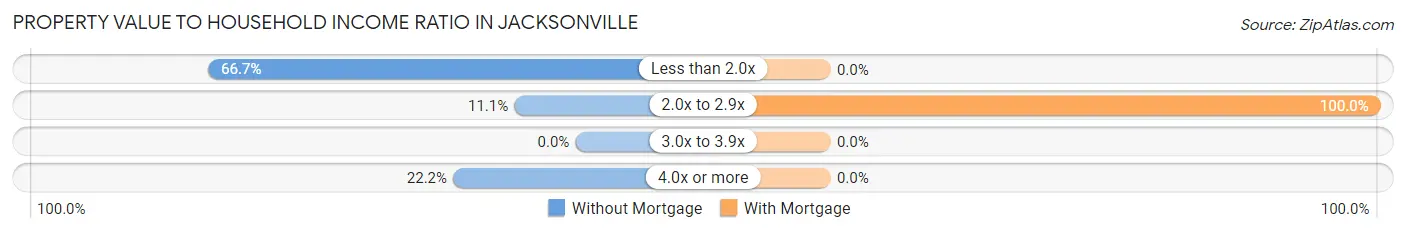
| Value-to-Income Ratio | Without Mortgage | With Mortgage |
| Less than 2.0x | 12 (66.7%) | 0 (0.0%) |
| 2.0x to 2.9x | 2 (11.1%) | 2 (100.0%) |
| 3.0x to 3.9x | 0 (0.0%) | 0 (0.0%) |
| 4.0x or more | 4 (22.2%) | 0 (0.0%) |
| Total | 18 (100.0%) | 2 (100.0%) |
Real Estate Taxes by Mortgage Status in Jacksonville
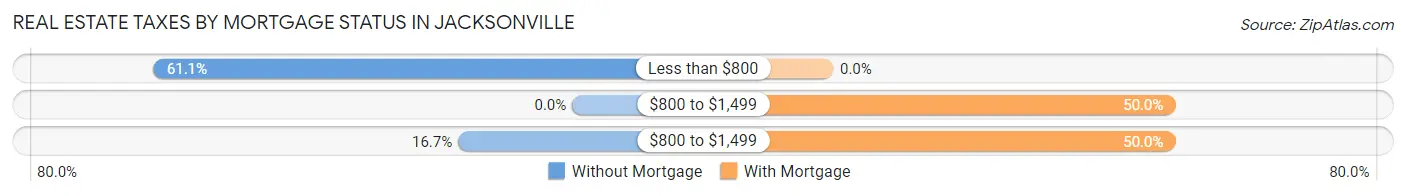
| Property Taxes | Without Mortgage | With Mortgage |
| Less than $800 | 11 (61.1%) | 0 (0.0%) |
| $800 to $1,499 | 0 (0.0%) | 1 (50.0%) |
| $800 to $1,499 | 3 (16.7%) | 1 (50.0%) |
| Total | 18 (100.0%) | 2 (100.0%) |
Health & Disability in Jacksonville
Health Insurance Coverage by Age in Jacksonville
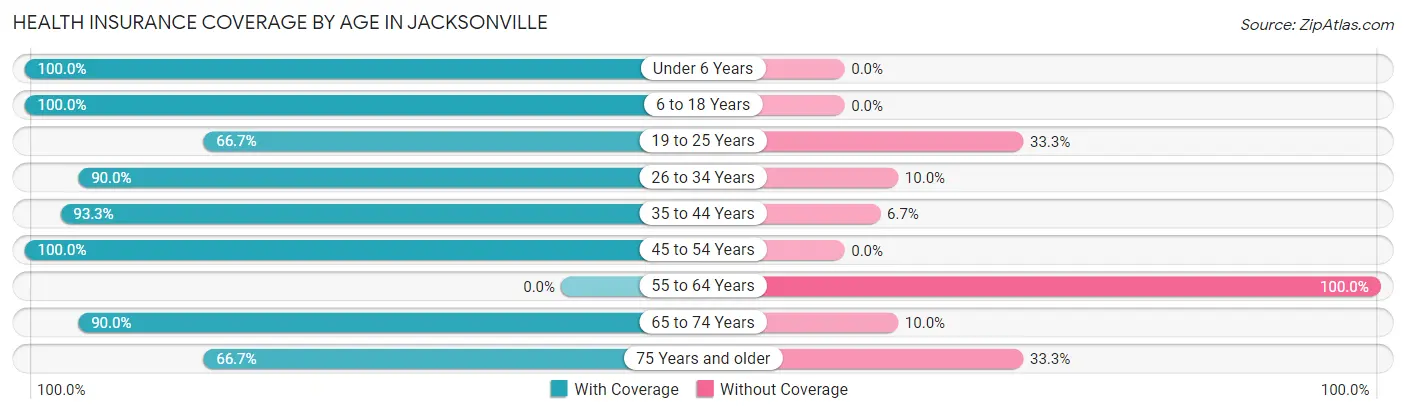
| Age Bracket | With Coverage | Without Coverage |
| Under 6 Years | 2 (100.0%) | 0 (0.0%) |
| 6 to 18 Years | 21 (100.0%) | 0 (0.0%) |
| 19 to 25 Years | 2 (66.7%) | 1 (33.3%) |
| 26 to 34 Years | 9 (90.0%) | 1 (10.0%) |
| 35 to 44 Years | 14 (93.3%) | 1 (6.7%) |
| 45 to 54 Years | 4 (100.0%) | 0 (0.0%) |
| 55 to 64 Years | 0 (0.0%) | 11 (100.0%) |
| 65 to 74 Years | 9 (90.0%) | 1 (10.0%) |
| 75 Years and older | 18 (66.7%) | 9 (33.3%) |
| Total | 79 (76.7%) | 24 (23.3%) |
Health Insurance Coverage by Citizenship Status in Jacksonville
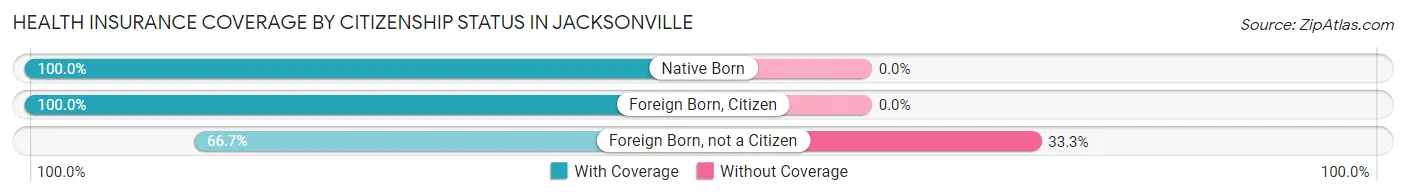
| Citizenship Status | With Coverage | Without Coverage |
| Native Born | 2 (100.0%) | 0 (0.0%) |
| Foreign Born, Citizen | 21 (100.0%) | 0 (0.0%) |
| Foreign Born, not a Citizen | 2 (66.7%) | 1 (33.3%) |
Health Insurance Coverage by Household Income in Jacksonville
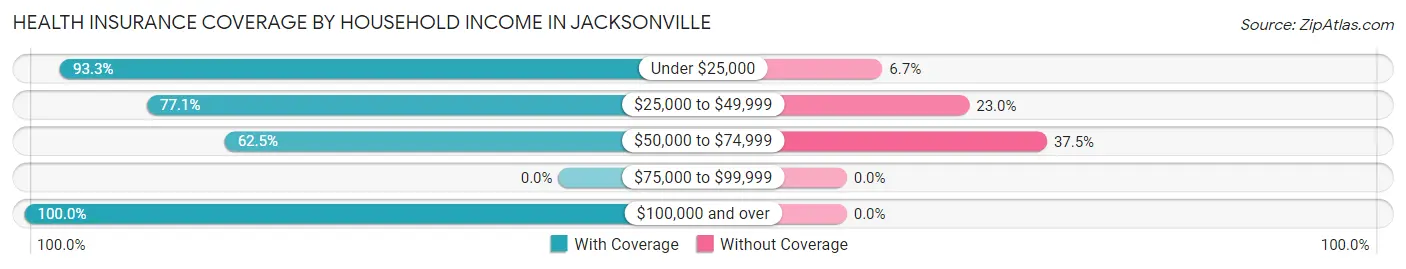
| Household Income | With Coverage | Without Coverage |
| Under $25,000 | 14 (93.3%) | 1 (6.7%) |
| $25,000 to $49,999 | 47 (77.0%) | 14 (23.0%) |
| $50,000 to $74,999 | 15 (62.5%) | 9 (37.5%) |
| $75,000 to $99,999 | 0 (0.0%) | 0 (0.0%) |
| $100,000 and over | 3 (100.0%) | 0 (0.0%) |
Public vs Private Health Insurance Coverage by Age in Jacksonville
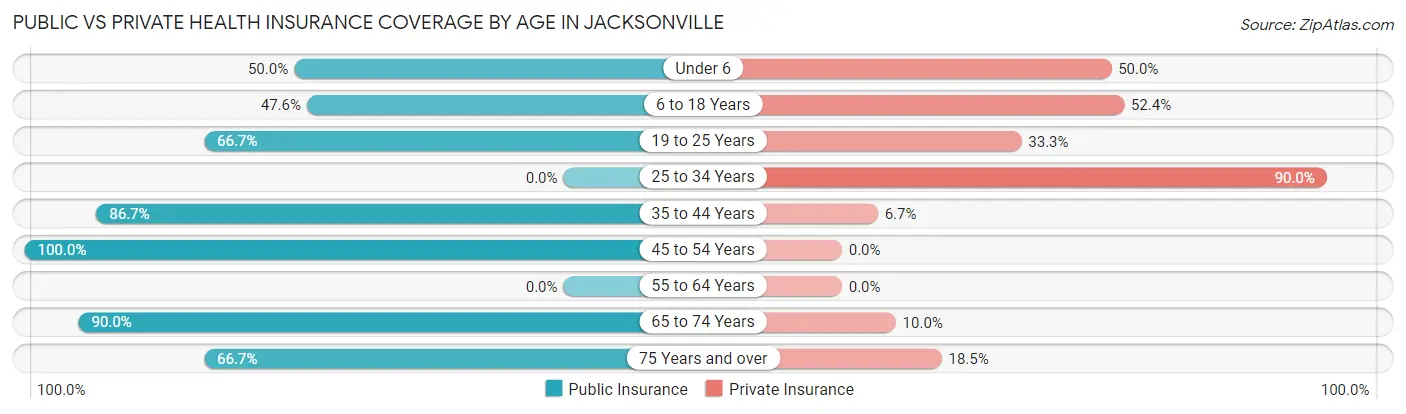
| Age Bracket | Public Insurance | Private Insurance |
| Under 6 | 1 (50.0%) | 1 (50.0%) |
| 6 to 18 Years | 10 (47.6%) | 11 (52.4%) |
| 19 to 25 Years | 2 (66.7%) | 1 (33.3%) |
| 25 to 34 Years | 0 (0.0%) | 9 (90.0%) |
| 35 to 44 Years | 13 (86.7%) | 1 (6.7%) |
| 45 to 54 Years | 4 (100.0%) | 0 (0.0%) |
| 55 to 64 Years | 0 (0.0%) | 0 (0.0%) |
| 65 to 74 Years | 9 (90.0%) | 1 (10.0%) |
| 75 Years and over | 18 (66.7%) | 5 (18.5%) |
| Total | 57 (55.3%) | 29 (28.2%) |
Disability Status by Sex by Age in Jacksonville
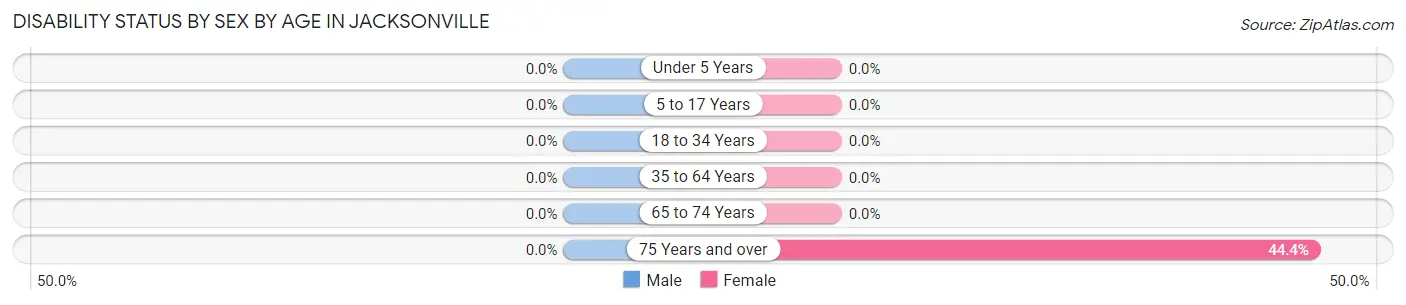
| Age Bracket | Male | Female |
| Under 5 Years | 0 (0.0%) | 0 (0.0%) |
| 5 to 17 Years | 0 (0.0%) | 0 (0.0%) |
| 18 to 34 Years | 0 (0.0%) | 0 (0.0%) |
| 35 to 64 Years | 0 (0.0%) | 0 (0.0%) |
| 65 to 74 Years | 0 (0.0%) | 0 (0.0%) |
| 75 Years and over | 0 (0.0%) | 4 (44.4%) |
Disability Class by Sex by Age in Jacksonville
Disability Class: Hearing Difficulty
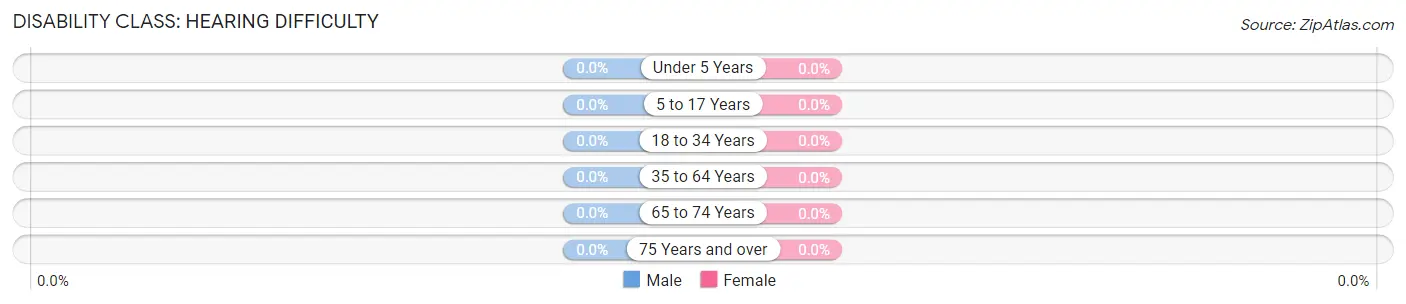
| Age Bracket | Male | Female |
| Under 5 Years | 0 (0.0%) | 0 (0.0%) |
| 5 to 17 Years | 0 (0.0%) | 0 (0.0%) |
| 18 to 34 Years | 0 (0.0%) | 0 (0.0%) |
| 35 to 64 Years | 0 (0.0%) | 0 (0.0%) |
| 65 to 74 Years | 0 (0.0%) | 0 (0.0%) |
| 75 Years and over | 0 (0.0%) | 0 (0.0%) |
Disability Class: Vision Difficulty
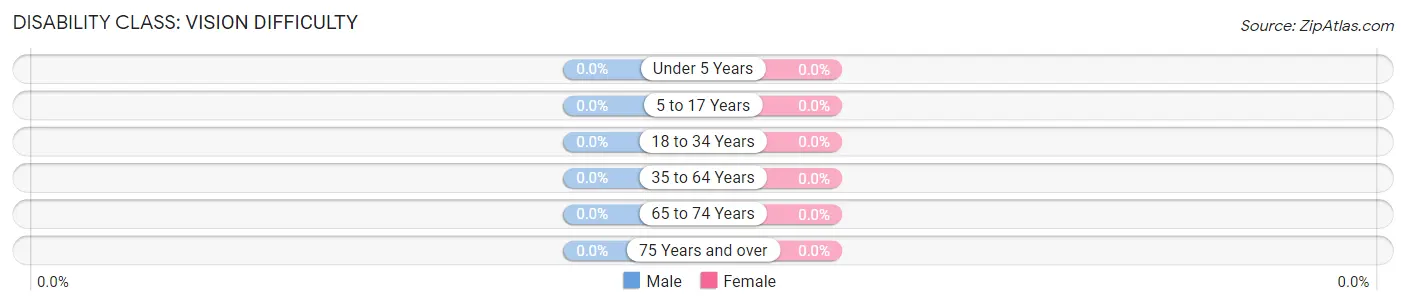
| Age Bracket | Male | Female |
| Under 5 Years | 0 (0.0%) | 0 (0.0%) |
| 5 to 17 Years | 0 (0.0%) | 0 (0.0%) |
| 18 to 34 Years | 0 (0.0%) | 0 (0.0%) |
| 35 to 64 Years | 0 (0.0%) | 0 (0.0%) |
| 65 to 74 Years | 0 (0.0%) | 0 (0.0%) |
| 75 Years and over | 0 (0.0%) | 0 (0.0%) |
Disability Class: Cognitive Difficulty
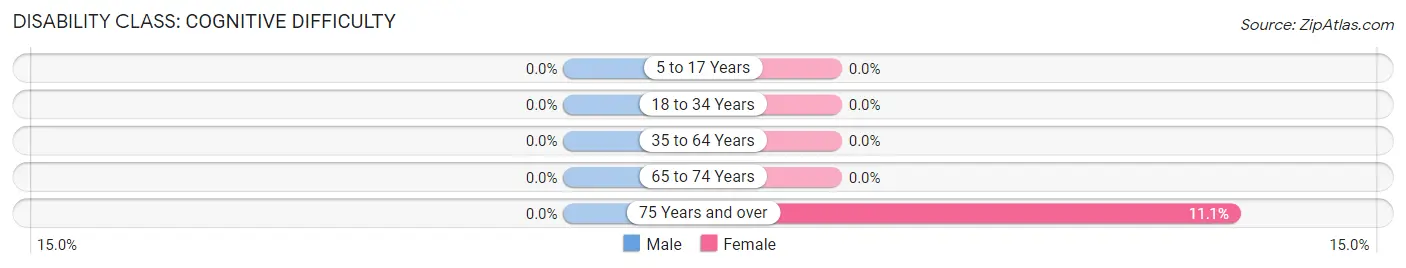
| Age Bracket | Male | Female |
| 5 to 17 Years | 0 (0.0%) | 0 (0.0%) |
| 18 to 34 Years | 0 (0.0%) | 0 (0.0%) |
| 35 to 64 Years | 0 (0.0%) | 0 (0.0%) |
| 65 to 74 Years | 0 (0.0%) | 0 (0.0%) |
| 75 Years and over | 0 (0.0%) | 1 (11.1%) |
Disability Class: Ambulatory Difficulty
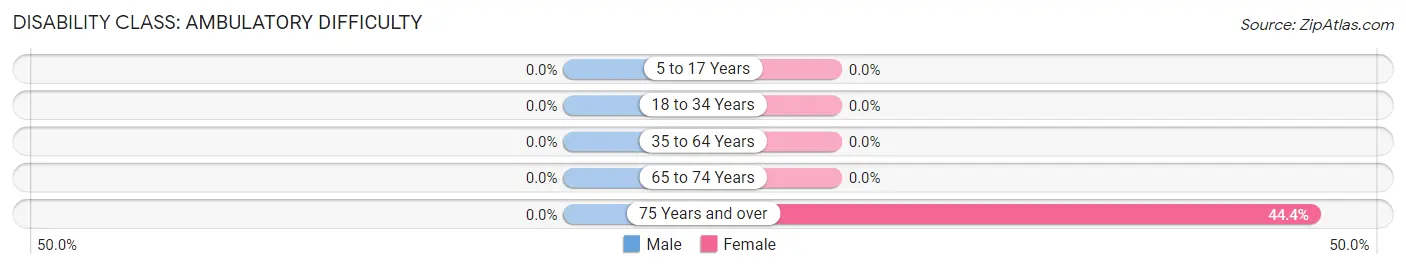
| Age Bracket | Male | Female |
| 5 to 17 Years | 0 (0.0%) | 0 (0.0%) |
| 18 to 34 Years | 0 (0.0%) | 0 (0.0%) |
| 35 to 64 Years | 0 (0.0%) | 0 (0.0%) |
| 65 to 74 Years | 0 (0.0%) | 0 (0.0%) |
| 75 Years and over | 0 (0.0%) | 4 (44.4%) |
Disability Class: Self-Care Difficulty
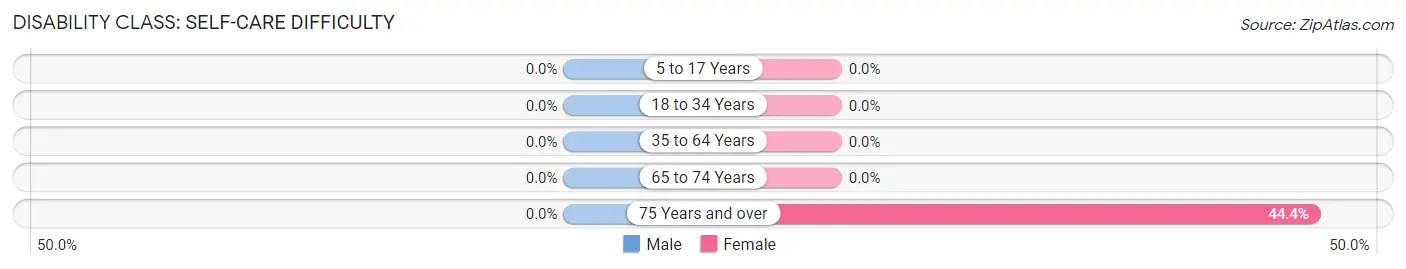
| Age Bracket | Male | Female |
| 5 to 17 Years | 0 (0.0%) | 0 (0.0%) |
| 18 to 34 Years | 0 (0.0%) | 0 (0.0%) |
| 35 to 64 Years | 0 (0.0%) | 0 (0.0%) |
| 65 to 74 Years | 0 (0.0%) | 0 (0.0%) |
| 75 Years and over | 0 (0.0%) | 4 (44.4%) |
Technology Access in Jacksonville
Computing Device Access in Jacksonville
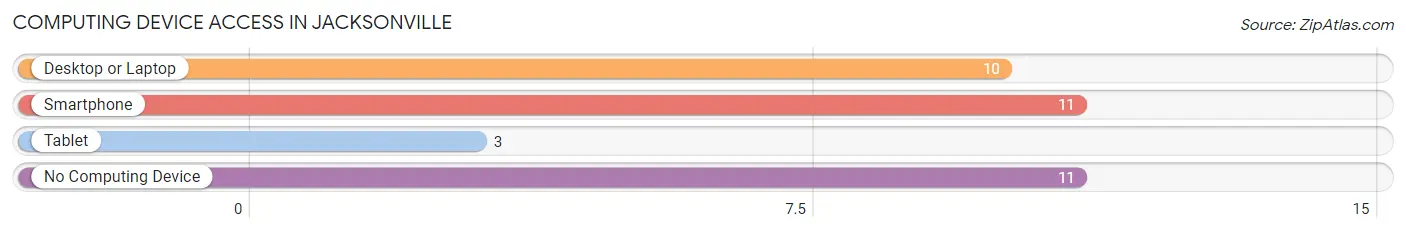
| Device Type | # Households | % Households |
| Desktop or Laptop | 10 | 41.7% |
| Smartphone | 11 | 45.8% |
| Tablet | 3 | 12.5% |
| No Computing Device | 11 | 45.8% |
| Total | 24 | 100.0% |
Internet Access in Jacksonville
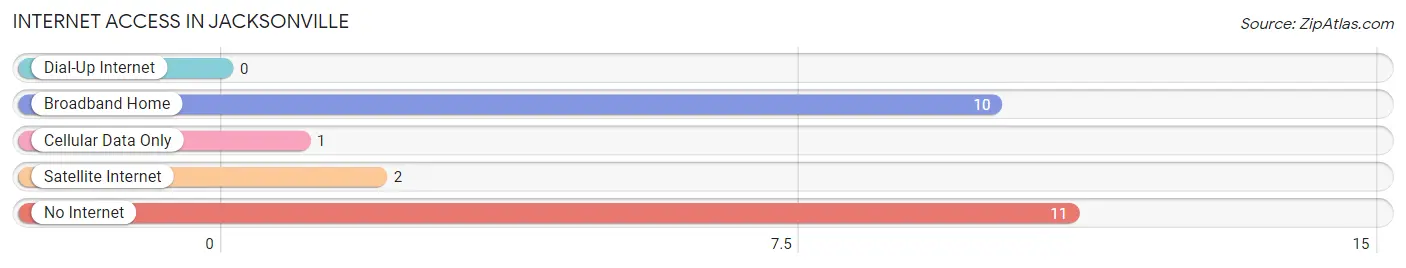
| Internet Type | # Households | % Households |
| Dial-Up Internet | 0 | 0.0% |
| Broadband Home | 10 | 41.7% |
| Cellular Data Only | 1 | 4.2% |
| Satellite Internet | 2 | 8.3% |
| No Internet | 11 | 45.8% |
| Total | 24 | 100.0% |
Jacksonville Summary
Jacksonville is a city located in the state of Georgia, in the United States. It is the county seat of Cherokee County and is located in the foothills of the Appalachian Mountains. The city is situated on the banks of the Etowah River and is part of the Atlanta metropolitan area. Jacksonville has a population of approximately 8,000 people and is the largest city in Cherokee County.
History
The area that is now Jacksonville was first settled in the early 1800s by Cherokee Indians. The city was officially founded in 1833 and was named after President Andrew Jackson. The city was incorporated in 1857 and was the county seat of Cherokee County. During the Civil War, Jacksonville was the site of several battles, including the Battle of New Hope Church. After the war, the city experienced a period of growth and development, with the construction of several new buildings and businesses.
Geography
Jacksonville is located in the foothills of the Appalachian Mountains in northwest Georgia. The city is situated on the banks of the Etowah River and is part of the Atlanta metropolitan area. The city has a total area of 8.3 square miles, of which 8.2 square miles is land and 0.1 square miles is water. The city has a humid subtropical climate, with hot, humid summers and mild winters.
Economy
Jacksonville’s economy is largely based on manufacturing and agriculture. The city is home to several manufacturing plants, including a paper mill, a furniture factory, and a plastics plant. The city is also home to several agricultural businesses, including a dairy farm, a poultry farm, and a vegetable farm. In addition, the city is home to several retail stores, restaurants, and other businesses.
Demographics
As of the 2010 census, Jacksonville had a population of 8,000 people. The racial makeup of the city was 79.2% White, 15.3% African American, 0.7% Native American, 0.7% Asian, 0.1% Pacific Islander, and 3.9% from other races. The median household income was $37,941, and the median family income was $45,941. The per capita income was $19,941. The city’s poverty rate was 17.2%.
Jacksonville is a small city with a rich history and a diverse economy. The city is home to several manufacturing and agricultural businesses, as well as a variety of retail stores and restaurants. The city has a diverse population, with a mix of races and ethnicities. Jacksonville is a great place to live and work, and is a great place to visit.
Common Questions
What is Per Capita Income in Jacksonville?
Per Capita income in Jacksonville is $14,823.
What is the Median Family Income in Jacksonville?
Median Family Income in Jacksonville is $36,250.
What is the Median Household income in Jacksonville?
Median Household Income in Jacksonville is $34,375.
What is Inequality or Gini Index in Jacksonville?
Inequality or Gini Index in Jacksonville is 0.26.
What is the Total Population of Jacksonville?
Total Population of Jacksonville is 103.
What is the Total Male Population of Jacksonville?
Total Male Population of Jacksonville is 60.
What is the Total Female Population of Jacksonville?
Total Female Population of Jacksonville is 43.
What is the Ratio of Males per 100 Females in Jacksonville?
There are 139.53 Males per 100 Females in Jacksonville.
What is the Ratio of Females per 100 Males in Jacksonville?
There are 71.67 Females per 100 Males in Jacksonville.
What is the Median Population Age in Jacksonville?
Median Population Age in Jacksonville is 51.5 Years.
What is the Average Family Size in Jacksonville
Average Family Size in Jacksonville is 5.8 People.
What is the Average Household Size in Jacksonville
Average Household Size in Jacksonville is 4.3 People.
How Large is the Labor Force in Jacksonville?
There are 25 People in the Labor Forcein in Jacksonville.
What is the Percentage of People in the Labor Force in Jacksonville?
28.1% of People are in the Labor Force in Jacksonville.