The Hammocks, FL Map & Demographics
The Hammocks Map
The Hammocks Overview
$31,594
PER CAPITA INCOME
$85,022
AVG FAMILY INCOME
$79,139
AVG HOUSEHOLD INCOME
23.2%
WAGE / INCOME GAP [ % ]
76.8¢/ $1
WAGE / INCOME GAP [ $ ]
$10,018
FAMILY INCOME DEFICIT
0.41
INEQUALITY / GINI INDEX
59,843
TOTAL POPULATION
29,338
MALE POPULATION
30,505
FEMALE POPULATION
96.17
MALES / 100 FEMALES
103.98
FEMALES / 100 MALES
41.1
MEDIAN AGE
3.4
AVG FAMILY SIZE
3.1
AVG HOUSEHOLD SIZE
30,788
LABOR FORCE [ PEOPLE ]
63.1%
PERCENT IN LABOR FORCE
3.3%
UNEMPLOYMENT RATE
Income in The Hammocks
Income Overview in The Hammocks
Per Capita Income in The Hammocks is $31,594, while median incomes of families and households are $85,022 and $79,139 respectively.
| Characteristic | Number | Measure |
| Per Capita Income | 59,843 | $31,594 |
| Median Family Income | 15,798 | $85,022 |
| Mean Family Income | 15,798 | $99,665 |
| Median Household Income | 19,358 | $79,139 |
| Mean Household Income | 19,358 | $94,956 |
| Income Deficit | 15,798 | $10,018 |
| Wage / Income Gap (%) | 59,843 | 23.22% |
| Wage / Income Gap ($) | 59,843 | 76.78¢ per $1 |
| Gini / Inequality Index | 59,843 | 0.41 |
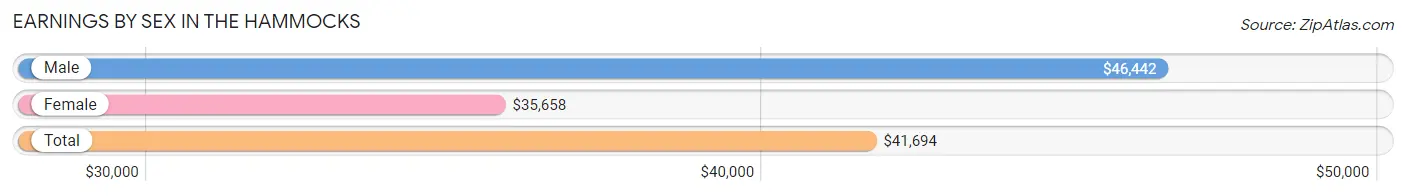
Earnings by Sex in The Hammocks
Average Earnings in The Hammocks are $41,694, $46,442 for men and $35,658 for women, a difference of 23.2%.
| Sex | Number | Average Earnings |
| Male | 16,476 (53.2%) | $46,442 |
| Female | 14,466 (46.8%) | $35,658 |
| Total | 30,942 (100.0%) | $41,694 |
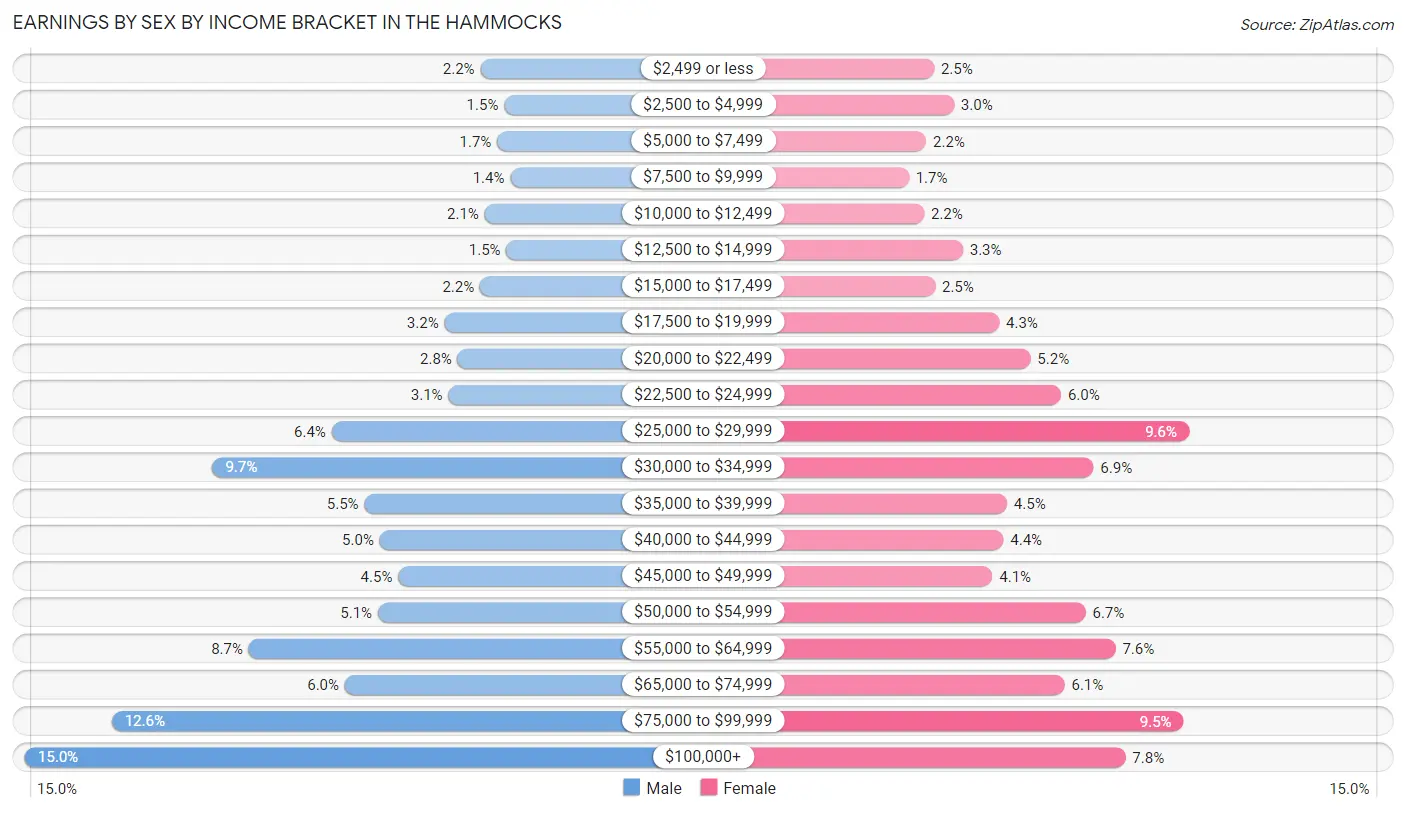
Earnings by Sex by Income Bracket in The Hammocks
The most common earnings brackets in The Hammocks are $100,000+ for men (2,469 | 15.0%) and $25,000 to $29,999 for women (1,390 | 9.6%).
| Income | Male | Female |
| $2,499 or less | 361 (2.2%) | 355 (2.5%) |
| $2,500 to $4,999 | 251 (1.5%) | 436 (3.0%) |
| $5,000 to $7,499 | 283 (1.7%) | 322 (2.2%) |
| $7,500 to $9,999 | 223 (1.3%) | 252 (1.7%) |
| $10,000 to $12,499 | 341 (2.1%) | 314 (2.2%) |
| $12,500 to $14,999 | 240 (1.5%) | 472 (3.3%) |
| $15,000 to $17,499 | 363 (2.2%) | 359 (2.5%) |
| $17,500 to $19,999 | 527 (3.2%) | 619 (4.3%) |
| $20,000 to $22,499 | 466 (2.8%) | 747 (5.2%) |
| $22,500 to $24,999 | 509 (3.1%) | 871 (6.0%) |
| $25,000 to $29,999 | 1,050 (6.4%) | 1,390 (9.6%) |
| $30,000 to $34,999 | 1,602 (9.7%) | 1,002 (6.9%) |
| $35,000 to $39,999 | 898 (5.4%) | 651 (4.5%) |
| $40,000 to $44,999 | 827 (5.0%) | 637 (4.4%) |
| $45,000 to $49,999 | 741 (4.5%) | 591 (4.1%) |
| $50,000 to $54,999 | 836 (5.1%) | 970 (6.7%) |
| $55,000 to $64,999 | 1,433 (8.7%) | 1,092 (7.5%) |
| $65,000 to $74,999 | 988 (6.0%) | 886 (6.1%) |
| $75,000 to $99,999 | 2,068 (12.6%) | 1,368 (9.5%) |
| $100,000+ | 2,469 (15.0%) | 1,132 (7.8%) |
| Total | 16,476 (100.0%) | 14,466 (100.0%) |
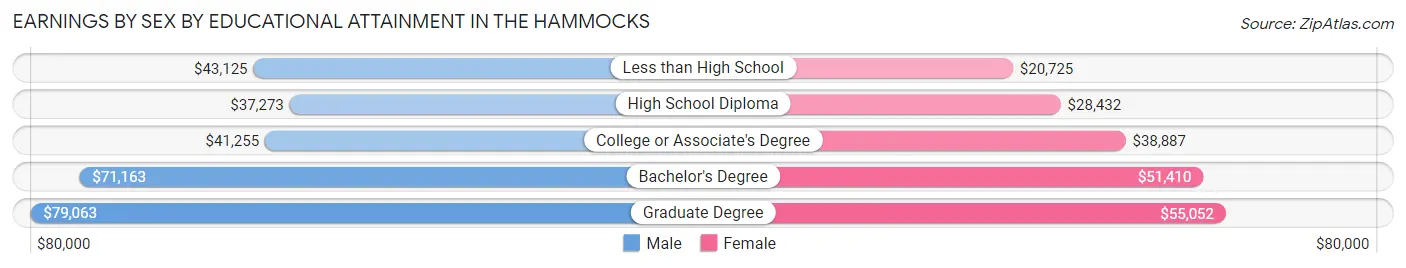
Earnings by Sex by Educational Attainment in The Hammocks
Average earnings in The Hammocks are $51,073 for men and $39,956 for women, a difference of 21.8%. Men with an educational attainment of graduate degree enjoy the highest average annual earnings of $79,063, while those with high school diploma education earn the least with $37,273. Women with an educational attainment of graduate degree earn the most with the average annual earnings of $55,052, while those with less than high school education have the smallest earnings of $20,725.
| Educational Attainment | Male Income | Female Income |
| Less than High School | $43,125 | $20,725 |
| High School Diploma | $37,273 | $28,432 |
| College or Associate's Degree | $41,255 | $38,887 |
| Bachelor's Degree | $71,163 | $51,410 |
| Graduate Degree | $79,063 | $55,052 |
| Total | $51,073 | $39,956 |
Family Income in The Hammocks
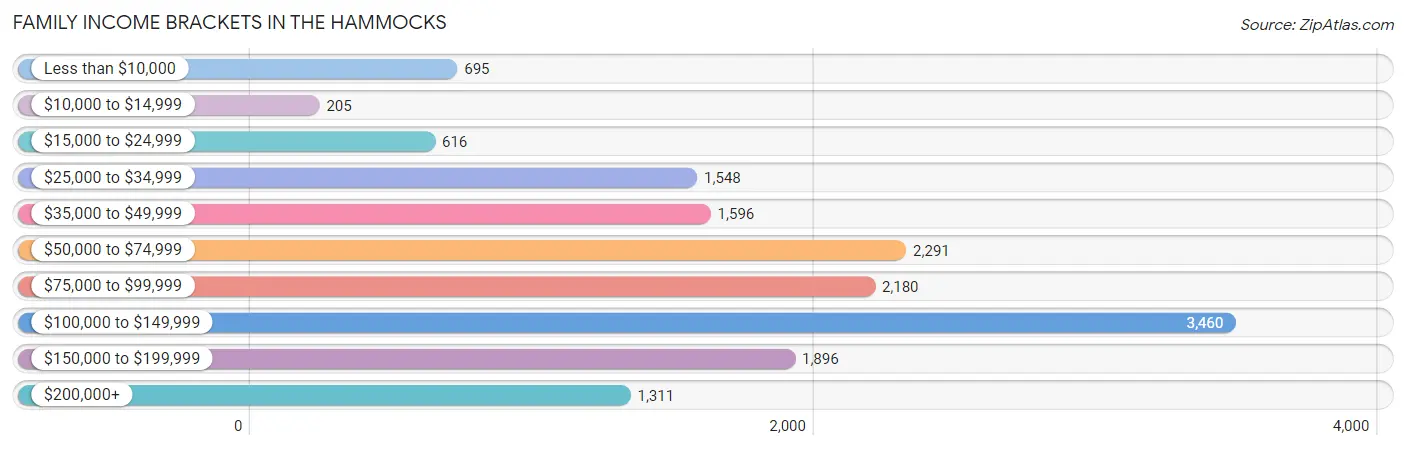
Family Income Brackets in The Hammocks
According to the The Hammocks family income data, there are 3,460 families falling into the $100,000 to $149,999 income range, which is the most common income bracket and makes up 21.9% of all families. Conversely, the $10,000 to $14,999 income bracket is the least frequent group with only 205 families (1.3%) belonging to this category.
| Income Bracket | # Families | % Families |
| Less than $10,000 | 695 | 4.4% |
| $10,000 to $14,999 | 205 | 1.3% |
| $15,000 to $24,999 | 616 | 3.9% |
| $25,000 to $34,999 | 1,548 | 9.8% |
| $35,000 to $49,999 | 1,596 | 10.1% |
| $50,000 to $74,999 | 2,291 | 14.5% |
| $75,000 to $99,999 | 2,180 | 13.8% |
| $100,000 to $149,999 | 3,460 | 21.9% |
| $150,000 to $199,999 | 1,896 | 12.0% |
| $200,000+ | 1,311 | 8.3% |
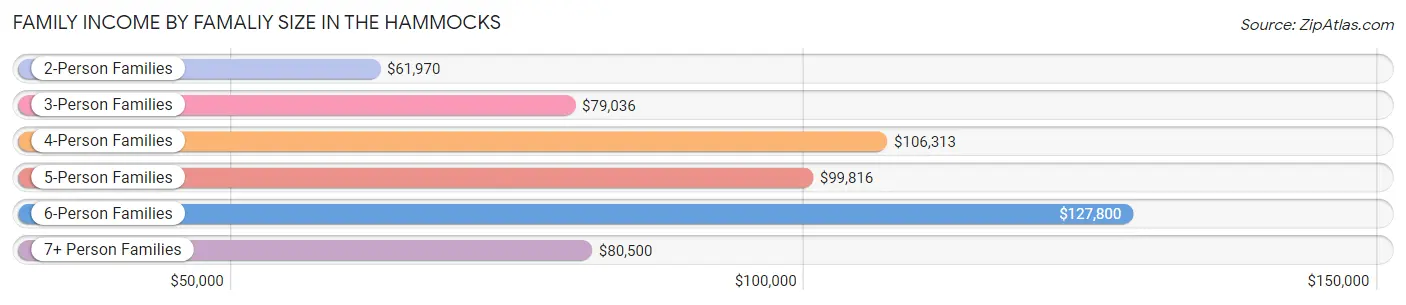
Family Income by Famaliy Size in The Hammocks
6-person families (757 | 4.8%) account for the highest median family income in The Hammocks with $127,800 per family, while 2-person families (5,639 | 35.7%) have the highest median income of $30,985 per family member.
| Income Bracket | # Families | Median Income |
| 2-Person Families | 5,639 (35.7%) | $61,970 |
| 3-Person Families | 3,667 (23.2%) | $79,036 |
| 4-Person Families | 4,232 (26.8%) | $106,313 |
| 5-Person Families | 1,447 (9.2%) | $99,816 |
| 6-Person Families | 757 (4.8%) | $127,800 |
| 7+ Person Families | 56 (0.4%) | $80,500 |
| Total | 15,798 (100.0%) | $85,022 |
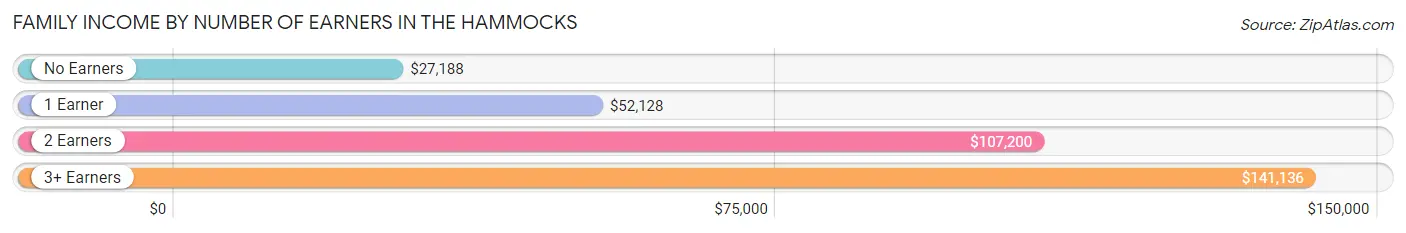
Family Income by Number of Earners in The Hammocks
The median family income in The Hammocks is $85,022, with families comprising 3+ earners (2,008) having the highest median family income of $141,136, while families with no earners (1,534) have the lowest median family income of $27,188, accounting for 12.7% and 9.7% of families, respectively.
| Number of Earners | # Families | Median Income |
| No Earners | 1,534 (9.7%) | $27,188 |
| 1 Earner | 5,424 (34.3%) | $52,128 |
| 2 Earners | 6,832 (43.2%) | $107,200 |
| 3+ Earners | 2,008 (12.7%) | $141,136 |
| Total | 15,798 (100.0%) | $85,022 |
Household Income in The Hammocks
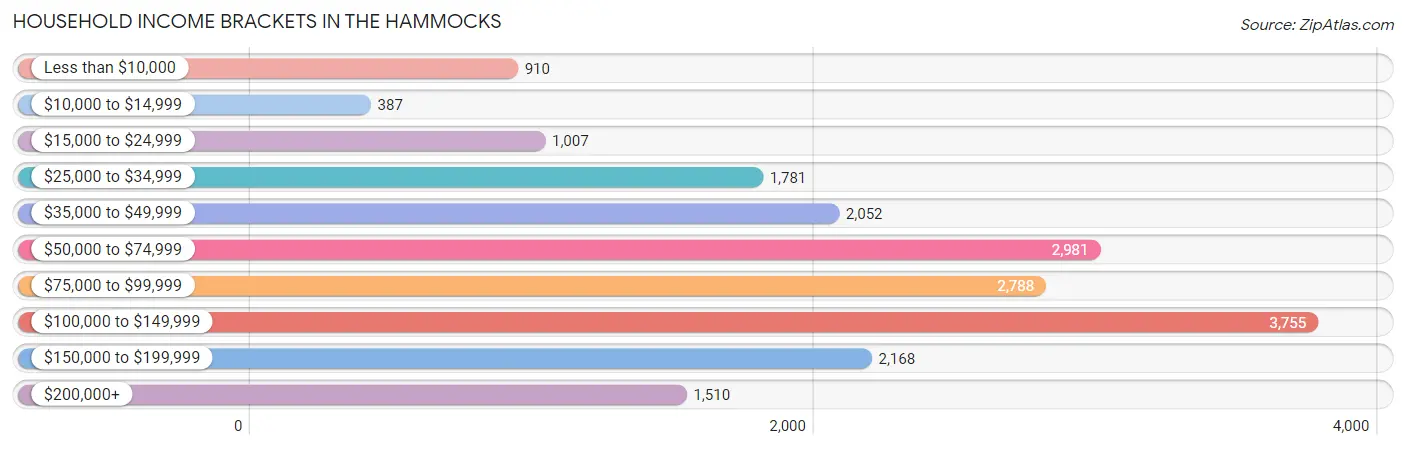
Household Income Brackets in The Hammocks
With 3,755 households falling in the category, the $100,000 to $149,999 income range is the most frequent in The Hammocks, accounting for 19.4% of all households. In contrast, only 387 households (2.0%) fall into the $10,000 to $14,999 income bracket, making it the least populous group.
| Income Bracket | # Households | % Households |
| Less than $10,000 | 910 | 4.7% |
| $10,000 to $14,999 | 387 | 2.0% |
| $15,000 to $24,999 | 1,007 | 5.2% |
| $25,000 to $34,999 | 1,781 | 9.2% |
| $35,000 to $49,999 | 2,052 | 10.6% |
| $50,000 to $74,999 | 2,981 | 15.4% |
| $75,000 to $99,999 | 2,788 | 14.4% |
| $100,000 to $149,999 | 3,755 | 19.4% |
| $150,000 to $199,999 | 2,168 | 11.2% |
| $200,000+ | 1,510 | 7.8% |
Household Income by Householder Age in The Hammocks
The median household income in The Hammocks is $79,139, with the highest median household income of $93,663 found in the 45 to 64 years age bracket for the primary householder. A total of 8,530 households (44.1%) fall into this category. Meanwhile, the 15 to 24 years age bracket for the primary householder has the lowest median household income of $44,030, with 299 households (1.5%) in this group.
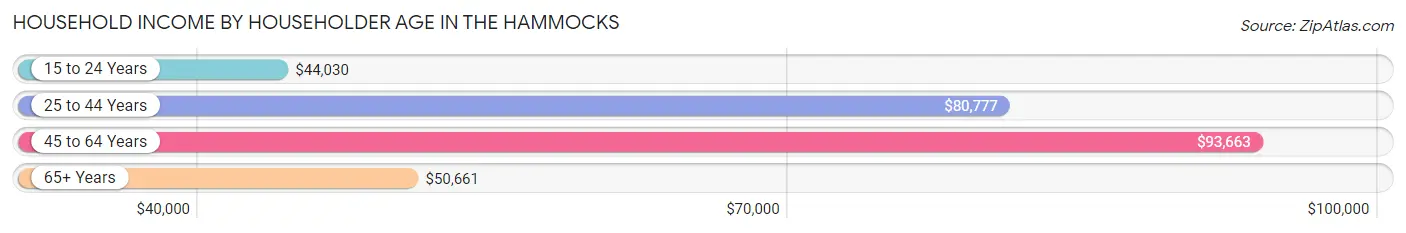
| Income Bracket | # Households | Median Income |
| 15 to 24 Years | 299 (1.5%) | $44,030 |
| 25 to 44 Years | 6,302 (32.6%) | $80,777 |
| 45 to 64 Years | 8,530 (44.1%) | $93,663 |
| 65+ Years | 4,227 (21.8%) | $50,661 |
| Total | 19,358 (100.0%) | $79,139 |
Poverty in The Hammocks
Income Below Poverty by Sex and Age in The Hammocks
With 11.0% poverty level for males and 14.6% for females among the residents of The Hammocks, 16 and 17 year old males and 5 year old females are the most vulnerable to poverty, with 317 males (30.8%) and 244 females (41.1%) in their respective age groups living below the poverty level.
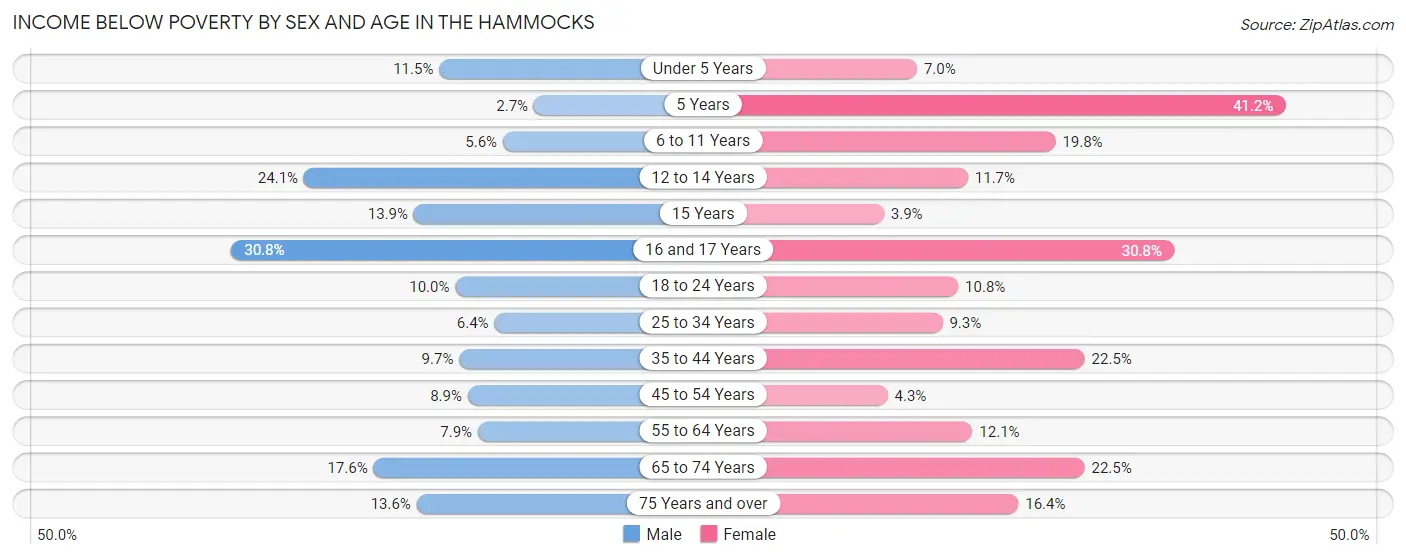
| Age Bracket | Male | Female |
| Under 5 Years | 205 (11.5%) | 71 (7.0%) |
| 5 Years | 10 (2.7%) | 244 (41.1%) |
| 6 to 11 Years | 103 (5.6%) | 417 (19.8%) |
| 12 to 14 Years | 341 (24.1%) | 97 (11.7%) |
| 15 Years | 64 (13.9%) | 23 (3.9%) |
| 16 and 17 Years | 317 (30.8%) | 260 (30.8%) |
| 18 to 24 Years | 252 (10.0%) | 267 (10.8%) |
| 25 to 34 Years | 268 (6.4%) | 307 (9.3%) |
| 35 to 44 Years | 356 (9.7%) | 961 (22.5%) |
| 45 to 54 Years | 384 (8.9%) | 198 (4.3%) |
| 55 to 64 Years | 299 (7.9%) | 514 (12.1%) |
| 65 to 74 Years | 411 (17.6%) | 700 (22.5%) |
| 75 Years and over | 213 (13.6%) | 386 (16.4%) |
| Total | 3,223 (11.0%) | 4,445 (14.6%) |
Income Above Poverty by Sex and Age in The Hammocks
According to the poverty statistics in The Hammocks, males aged 5 years and females aged 15 years are the age groups that are most secure financially, with 97.3% of males and 96.1% of females in these age groups living above the poverty line.
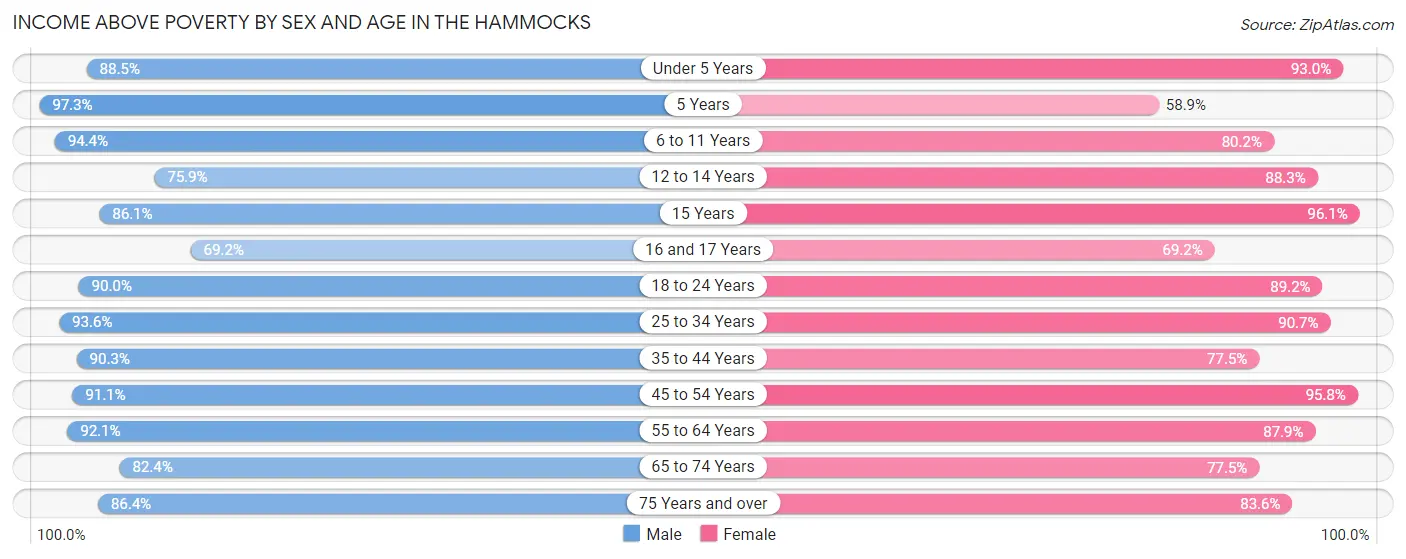
| Age Bracket | Male | Female |
| Under 5 Years | 1,575 (88.5%) | 946 (93.0%) |
| 5 Years | 356 (97.3%) | 349 (58.9%) |
| 6 to 11 Years | 1,733 (94.4%) | 1,686 (80.2%) |
| 12 to 14 Years | 1,075 (75.9%) | 732 (88.3%) |
| 15 Years | 397 (86.1%) | 566 (96.1%) |
| 16 and 17 Years | 712 (69.2%) | 584 (69.2%) |
| 18 to 24 Years | 2,260 (90.0%) | 2,205 (89.2%) |
| 25 to 34 Years | 3,919 (93.6%) | 2,979 (90.7%) |
| 35 to 44 Years | 3,331 (90.3%) | 3,302 (77.5%) |
| 45 to 54 Years | 3,945 (91.1%) | 4,462 (95.8%) |
| 55 to 64 Years | 3,472 (92.1%) | 3,727 (87.9%) |
| 65 to 74 Years | 1,921 (82.4%) | 2,407 (77.5%) |
| 75 Years and over | 1,352 (86.4%) | 1,970 (83.6%) |
| Total | 26,048 (89.0%) | 25,915 (85.4%) |
Income Below Poverty Among Married-Couple Families in The Hammocks
The poverty statistics for married-couple families in The Hammocks show that 7.8% or 923 of the total 11,779 families live below the poverty line. Families with no children have the highest poverty rate of 9.6%, comprising of 636 families. On the other hand, families with 1 or 2 children have the lowest poverty rate of 5.4%, which includes 246 families.
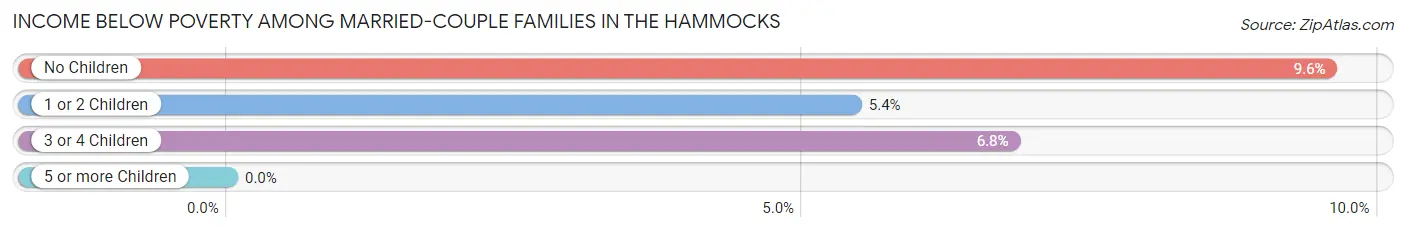
| Children | Above Poverty | Below Poverty |
| No Children | 6,011 (90.4%) | 636 (9.6%) |
| 1 or 2 Children | 4,284 (94.6%) | 246 (5.4%) |
| 3 or 4 Children | 561 (93.2%) | 41 (6.8%) |
| 5 or more Children | 0 (0.0%) | 0 (0.0%) |
| Total | 10,856 (92.2%) | 923 (7.8%) |
Income Below Poverty Among Single-Parent Households in The Hammocks
According to the poverty data in The Hammocks, 10.9% or 96 single-father households and 25.7% or 806 single-mother households are living below the poverty line. Among single-father households, those with no children have the highest poverty rate, with 83 households (17.5%) experiencing poverty. Likewise, among single-mother households, those with 3 or 4 children have the highest poverty rate, with 415 households (82.2%) falling below the poverty line.
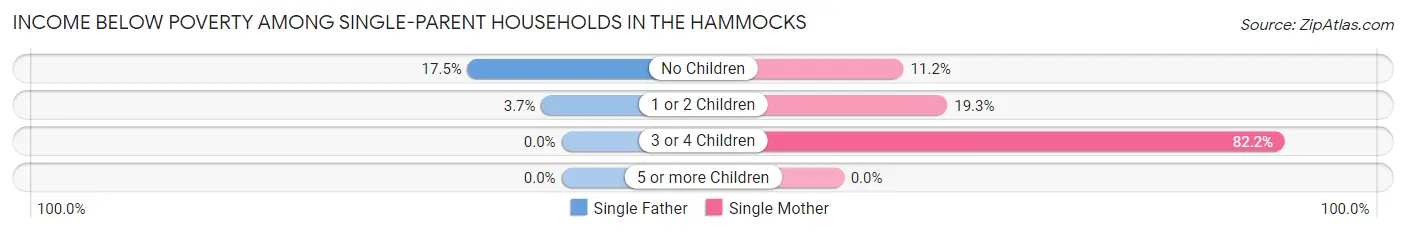
| Children | Single Father | Single Mother |
| No Children | 83 (17.5%) | 161 (11.2%) |
| 1 or 2 Children | 13 (3.7%) | 230 (19.3%) |
| 3 or 4 Children | 0 (0.0%) | 415 (82.2%) |
| 5 or more Children | 0 (0.0%) | 0 (0.0%) |
| Total | 96 (10.9%) | 806 (25.7%) |
Income Below Poverty Among Married-Couple vs Single-Parent Households in The Hammocks
The poverty data for The Hammocks shows that 923 of the married-couple family households (7.8%) and 902 of the single-parent households (22.4%) are living below the poverty level. Within the married-couple family households, those with no children have the highest poverty rate, with 636 households (9.6%) falling below the poverty line. Among the single-parent households, those with 3 or 4 children have the highest poverty rate, with 415 household (73.7%) living below poverty.
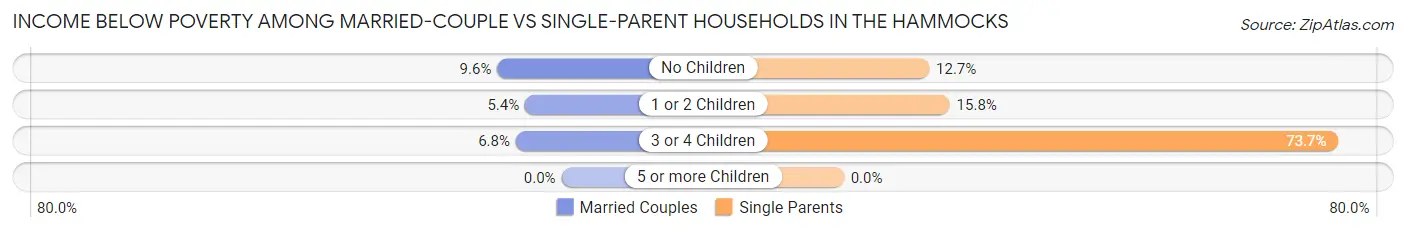
| Children | Married-Couple Families | Single-Parent Households |
| No Children | 636 (9.6%) | 244 (12.7%) |
| 1 or 2 Children | 246 (5.4%) | 243 (15.8%) |
| 3 or 4 Children | 41 (6.8%) | 415 (73.7%) |
| 5 or more Children | 0 (0.0%) | 0 (0.0%) |
| Total | 923 (7.8%) | 902 (22.4%) |
Race in The Hammocks
The most populous races in The Hammocks are Hispanic or Latino (47,021 | 78.6%), White / Caucasian (31,191 | 52.1%), and Two or more Races (18,756 | 31.3%).
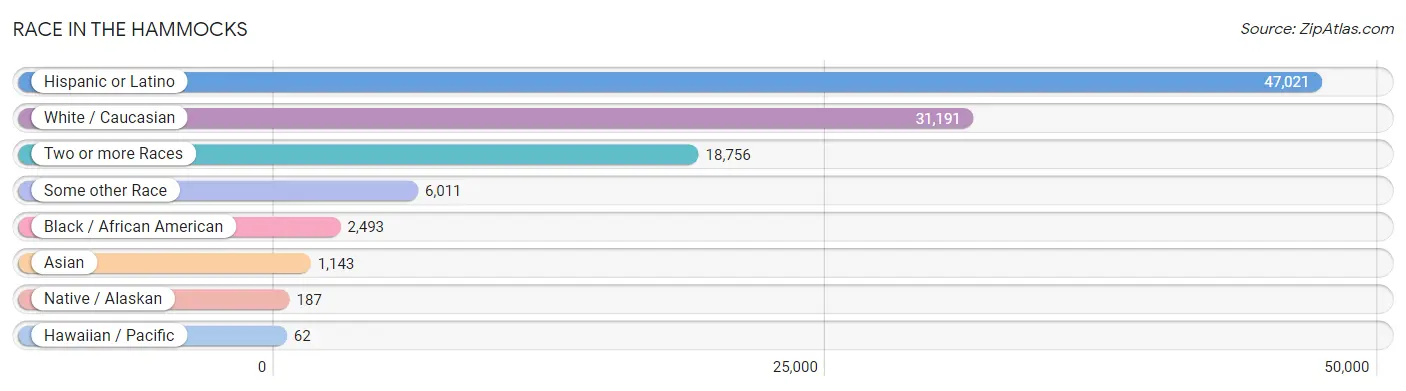
| Race | # Population | % Population |
| Asian | 1,143 | 1.9% |
| Black / African American | 2,493 | 4.2% |
| Hawaiian / Pacific | 62 | 0.1% |
| Hispanic or Latino | 47,021 | 78.6% |
| Native / Alaskan | 187 | 0.3% |
| White / Caucasian | 31,191 | 52.1% |
| Two or more Races | 18,756 | 31.3% |
| Some other Race | 6,011 | 10.0% |
| Total | 59,843 | 100.0% |
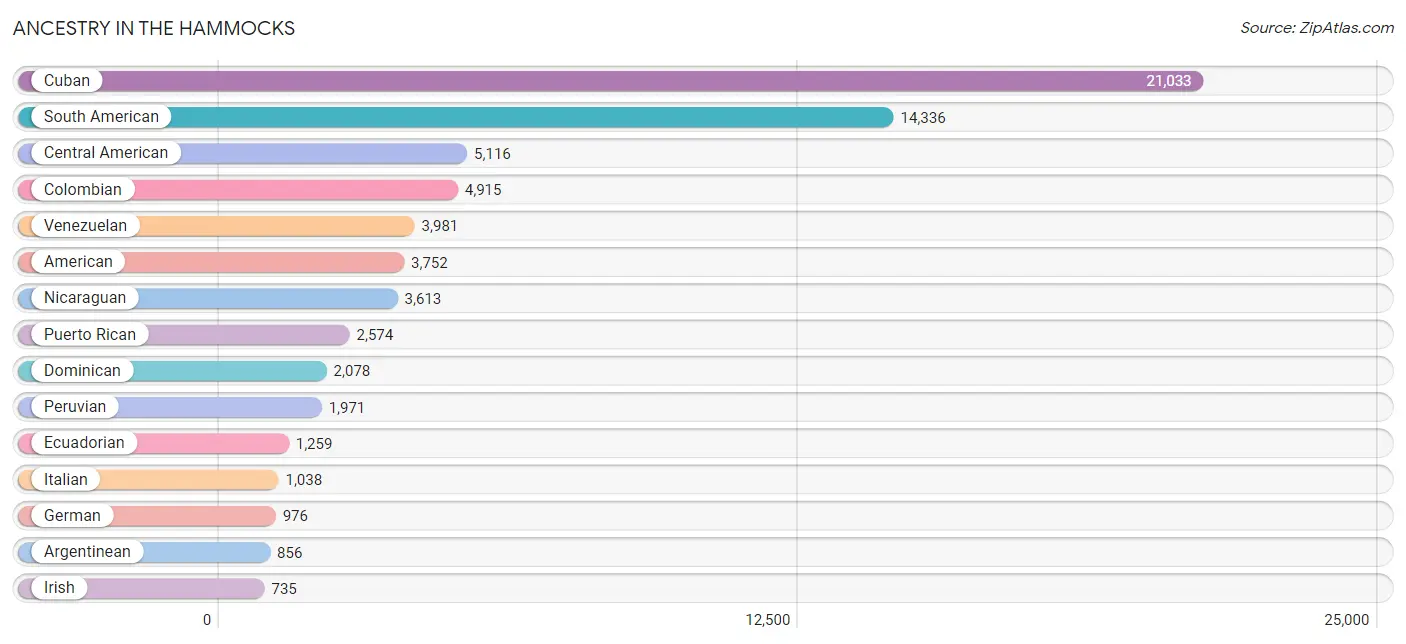
Ancestry in The Hammocks
The most populous ancestries reported in The Hammocks are Cuban (21,033 | 35.1%), South American (14,336 | 24.0%), Central American (5,116 | 8.6%), Colombian (4,915 | 8.2%), and Venezuelan (3,981 | 6.7%), together accounting for 82.5% of all The Hammocks residents.
| Ancestry | # Population | % Population |
| African | 74 | 0.1% |
| American | 3,752 | 6.3% |
| Arab | 441 | 0.7% |
| Argentinean | 856 | 1.4% |
| Armenian | 16 | 0.0% |
| Austrian | 55 | 0.1% |
| Belizean | 12 | 0.0% |
| Bhutanese | 7 | 0.0% |
| Bolivian | 213 | 0.4% |
| Brazilian | 346 | 0.6% |
| British | 28 | 0.1% |
| British West Indian | 233 | 0.4% |
| Bulgarian | 130 | 0.2% |
| Burmese | 59 | 0.1% |
| Canadian | 28 | 0.1% |
| Central American | 5,116 | 8.6% |
| Central American Indian | 216 | 0.4% |
| Cherokee | 23 | 0.0% |
| Chilean | 613 | 1.0% |
| Colombian | 4,915 | 8.2% |
| Costa Rican | 25 | 0.0% |
| Croatian | 25 | 0.0% |
| Cuban | 21,033 | 35.1% |
| Czech | 15 | 0.0% |
| Danish | 7 | 0.0% |
| Dominican | 2,078 | 3.5% |
| Dutch | 85 | 0.1% |
| Eastern European | 24 | 0.0% |
| Ecuadorian | 1,259 | 2.1% |
| Egyptian | 15 | 0.0% |
| English | 504 | 0.8% |
| European | 184 | 0.3% |
| Filipino | 30 | 0.1% |
| Finnish | 7 | 0.0% |
| French | 426 | 0.7% |
| French Canadian | 37 | 0.1% |
| German | 976 | 1.6% |
| Greek | 226 | 0.4% |
| Guatemalan | 529 | 0.9% |
| Guyanese | 64 | 0.1% |
| Haitian | 574 | 1.0% |
| Honduran | 223 | 0.4% |
| Hungarian | 73 | 0.1% |
| Indian (Asian) | 633 | 1.1% |
| Iranian | 56 | 0.1% |
| Irish | 735 | 1.2% |
| Israeli | 11 | 0.0% |
| Italian | 1,038 | 1.7% |
| Jamaican | 490 | 0.8% |
| Japanese | 33 | 0.1% |
| Korean | 173 | 0.3% |
| Lebanese | 69 | 0.1% |
| Lithuanian | 18 | 0.0% |
| Mexican | 646 | 1.1% |
| Mexican American Indian | 14 | 0.0% |
| Native Hawaiian | 56 | 0.1% |
| Nicaraguan | 3,613 | 6.0% |
| Nigerian | 122 | 0.2% |
| Norwegian | 72 | 0.1% |
| Pakistani | 28 | 0.1% |
| Palestinian | 9 | 0.0% |
| Panamanian | 331 | 0.5% |
| Paraguayan | 29 | 0.1% |
| Peruvian | 1,971 | 3.3% |
| Polish | 167 | 0.3% |
| Portuguese | 208 | 0.4% |
| Puerto Rican | 2,574 | 4.3% |
| Romanian | 14 | 0.0% |
| Russian | 164 | 0.3% |
| Salvadoran | 395 | 0.7% |
| Samoan | 27 | 0.1% |
| Scandinavian | 7 | 0.0% |
| Scotch-Irish | 63 | 0.1% |
| Scottish | 50 | 0.1% |
| Slovak | 9 | 0.0% |
| Slovene | 15 | 0.0% |
| South American | 14,336 | 24.0% |
| Spaniard | 278 | 0.5% |
| Spanish | 99 | 0.2% |
| Sri Lankan | 137 | 0.2% |
| Subsaharan African | 204 | 0.3% |
| Swedish | 24 | 0.0% |
| Swiss | 17 | 0.0% |
| Syrian | 205 | 0.3% |
| Thai | 349 | 0.6% |
| Trinidadian and Tobagonian | 34 | 0.1% |
| Ukrainian | 15 | 0.0% |
| Uruguayan | 499 | 0.8% |
| Venezuelan | 3,981 | 6.7% |
| Welsh | 55 | 0.1% |
| West Indian | 48 | 0.1% |
| Yugoslavian | 7 | 0.0% | View All 92 Rows |
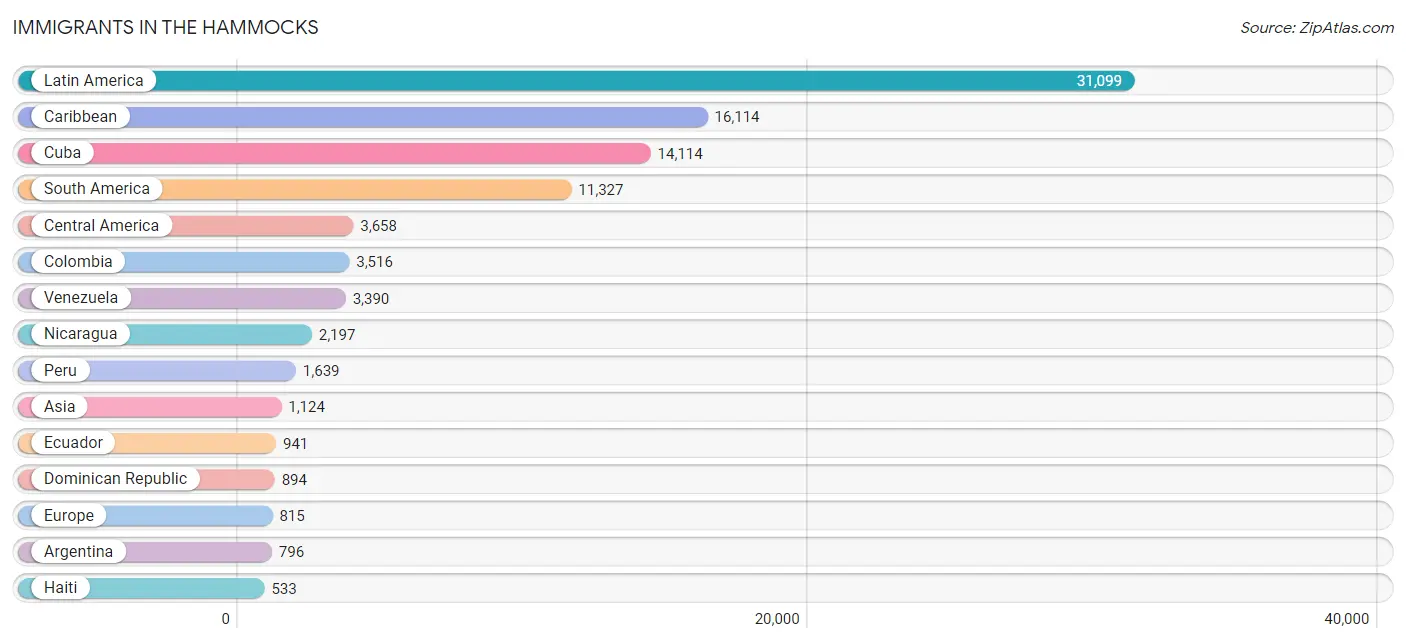
Immigrants in The Hammocks
The most numerous immigrant groups reported in The Hammocks came from Latin America (31,099 | 52.0%), Caribbean (16,114 | 26.9%), Cuba (14,114 | 23.6%), South America (11,327 | 18.9%), and Central America (3,658 | 6.1%), together accounting for 127.5% of all The Hammocks residents.
| Immigration Origin | # Population | % Population |
| Africa | 148 | 0.3% |
| Argentina | 796 | 1.3% |
| Asia | 1,124 | 1.9% |
| Australia | 7 | 0.0% |
| Austria | 4 | 0.0% |
| Belgium | 22 | 0.0% |
| Belize | 9 | 0.0% |
| Bolivia | 213 | 0.4% |
| Brazil | 184 | 0.3% |
| Bulgaria | 72 | 0.1% |
| Canada | 30 | 0.1% |
| Caribbean | 16,114 | 26.9% |
| Central America | 3,658 | 6.1% |
| Chile | 312 | 0.5% |
| China | 105 | 0.2% |
| Colombia | 3,516 | 5.9% |
| Costa Rica | 21 | 0.0% |
| Cuba | 14,114 | 23.6% |
| Dominica | 27 | 0.1% |
| Dominican Republic | 894 | 1.5% |
| Eastern Africa | 21 | 0.0% |
| Eastern Asia | 162 | 0.3% |
| Eastern Europe | 143 | 0.2% |
| Ecuador | 941 | 1.6% |
| Egypt | 15 | 0.0% |
| El Salvador | 260 | 0.4% |
| England | 23 | 0.0% |
| Europe | 815 | 1.4% |
| Germany | 109 | 0.2% |
| Greece | 114 | 0.2% |
| Guatemala | 411 | 0.7% |
| Guyana | 110 | 0.2% |
| Haiti | 533 | 0.9% |
| Honduras | 158 | 0.3% |
| India | 262 | 0.4% |
| Iran | 56 | 0.1% |
| Ireland | 13 | 0.0% |
| Israel | 107 | 0.2% |
| Italy | 126 | 0.2% |
| Jamaica | 312 | 0.5% |
| Kenya | 21 | 0.0% |
| Korea | 57 | 0.1% |
| Latin America | 31,099 | 52.0% |
| Lebanon | 16 | 0.0% |
| Mexico | 444 | 0.7% |
| Netherlands | 8 | 0.0% |
| Nicaragua | 2,197 | 3.7% |
| Nigeria | 112 | 0.2% |
| Northern Africa | 15 | 0.0% |
| Northern Europe | 40 | 0.1% |
| Oceania | 7 | 0.0% |
| Pakistan | 89 | 0.2% |
| Panama | 158 | 0.3% |
| Peru | 1,639 | 2.7% |
| Philippines | 100 | 0.2% |
| Poland | 11 | 0.0% |
| Russia | 53 | 0.1% |
| Saudi Arabia | 76 | 0.1% |
| South America | 11,327 | 18.9% |
| South Central Asia | 423 | 0.7% |
| South Eastern Asia | 244 | 0.4% |
| Southern Europe | 489 | 0.8% |
| Spain | 249 | 0.4% |
| Sri Lanka | 16 | 0.0% |
| St. Vincent and the Grenadines | 88 | 0.2% |
| Syria | 96 | 0.2% |
| Taiwan | 30 | 0.1% |
| Thailand | 15 | 0.0% |
| Trinidad and Tobago | 126 | 0.2% |
| Uruguay | 154 | 0.3% |
| Venezuela | 3,390 | 5.7% |
| Vietnam | 129 | 0.2% |
| Western Africa | 112 | 0.2% |
| Western Asia | 295 | 0.5% |
| Western Europe | 143 | 0.2% | View All 75 Rows |
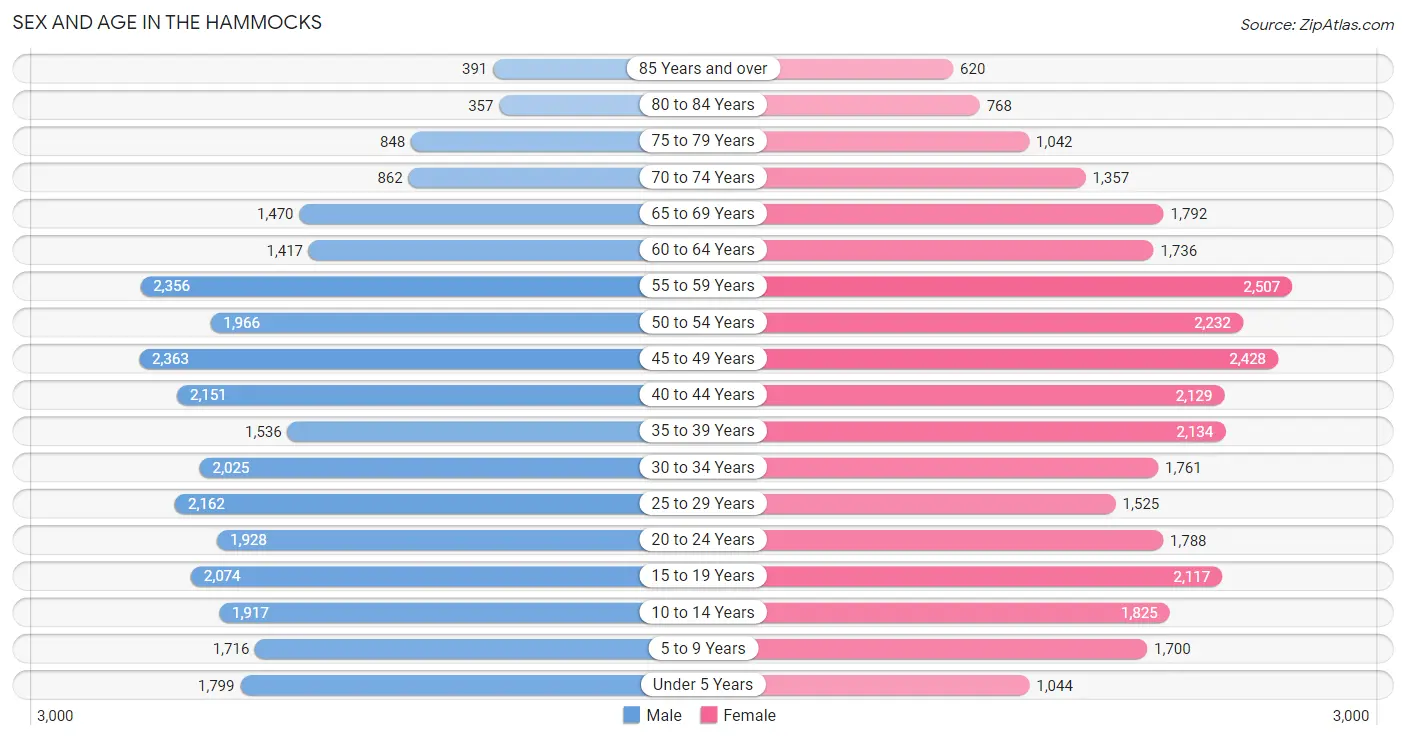
Sex and Age in The Hammocks
Sex and Age in The Hammocks
The most populous age groups in The Hammocks are 45 to 49 Years (2,363 | 8.1%) for men and 55 to 59 Years (2,507 | 8.2%) for women.
| Age Bracket | Male | Female |
| Under 5 Years | 1,799 (6.1%) | 1,044 (3.4%) |
| 5 to 9 Years | 1,716 (5.9%) | 1,700 (5.6%) |
| 10 to 14 Years | 1,917 (6.5%) | 1,825 (6.0%) |
| 15 to 19 Years | 2,074 (7.1%) | 2,117 (6.9%) |
| 20 to 24 Years | 1,928 (6.6%) | 1,788 (5.9%) |
| 25 to 29 Years | 2,162 (7.4%) | 1,525 (5.0%) |
| 30 to 34 Years | 2,025 (6.9%) | 1,761 (5.8%) |
| 35 to 39 Years | 1,536 (5.2%) | 2,134 (7.0%) |
| 40 to 44 Years | 2,151 (7.3%) | 2,129 (7.0%) |
| 45 to 49 Years | 2,363 (8.1%) | 2,428 (8.0%) |
| 50 to 54 Years | 1,966 (6.7%) | 2,232 (7.3%) |
| 55 to 59 Years | 2,356 (8.0%) | 2,507 (8.2%) |
| 60 to 64 Years | 1,417 (4.8%) | 1,736 (5.7%) |
| 65 to 69 Years | 1,470 (5.0%) | 1,792 (5.9%) |
| 70 to 74 Years | 862 (2.9%) | 1,357 (4.4%) |
| 75 to 79 Years | 848 (2.9%) | 1,042 (3.4%) |
| 80 to 84 Years | 357 (1.2%) | 768 (2.5%) |
| 85 Years and over | 391 (1.3%) | 620 (2.0%) |
| Total | 29,338 (100.0%) | 30,505 (100.0%) |
Families and Households in The Hammocks
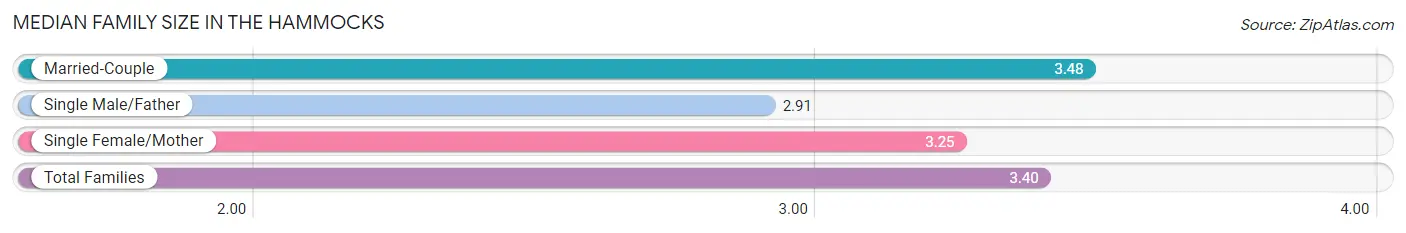
Median Family Size in The Hammocks
The median family size in The Hammocks is 3.40 persons per family, with married-couple families (11,779 | 74.6%) accounting for the largest median family size of 3.48 persons per family. On the other hand, single male/father families (881 | 5.6%) represent the smallest median family size with 2.91 persons per family.
| Family Type | # Families | Family Size |
| Married-Couple | 11,779 (74.6%) | 3.48 |
| Single Male/Father | 881 (5.6%) | 2.91 |
| Single Female/Mother | 3,138 (19.9%) | 3.25 |
| Total Families | 15,798 (100.0%) | 3.40 |
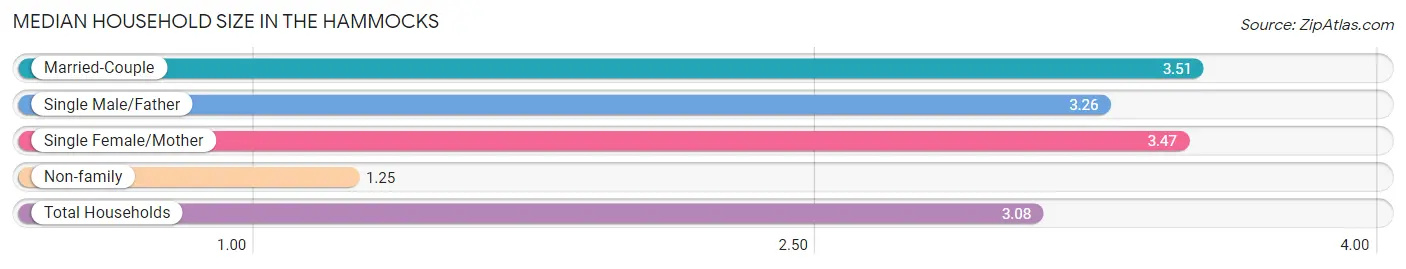
Median Household Size in The Hammocks
The median household size in The Hammocks is 3.08 persons per household, with married-couple households (11,779 | 60.9%) accounting for the largest median household size of 3.51 persons per household. non-family households (3,560 | 18.4%) represent the smallest median household size with 1.25 persons per household.
| Household Type | # Households | Household Size |
| Married-Couple | 11,779 (60.9%) | 3.51 |
| Single Male/Father | 881 (4.5%) | 3.26 |
| Single Female/Mother | 3,138 (16.2%) | 3.47 |
| Non-family | 3,560 (18.4%) | 1.25 |
| Total Households | 19,358 (100.0%) | 3.08 |
Household Size by Marriage Status in The Hammocks
Out of a total of 19,358 households in The Hammocks, 15,798 (81.6%) are family households, while 3,560 (18.4%) are nonfamily households. The most numerous type of family households are 2-person households, comprising 5,122, and the most common type of nonfamily households are 1-person households, comprising 2,892.
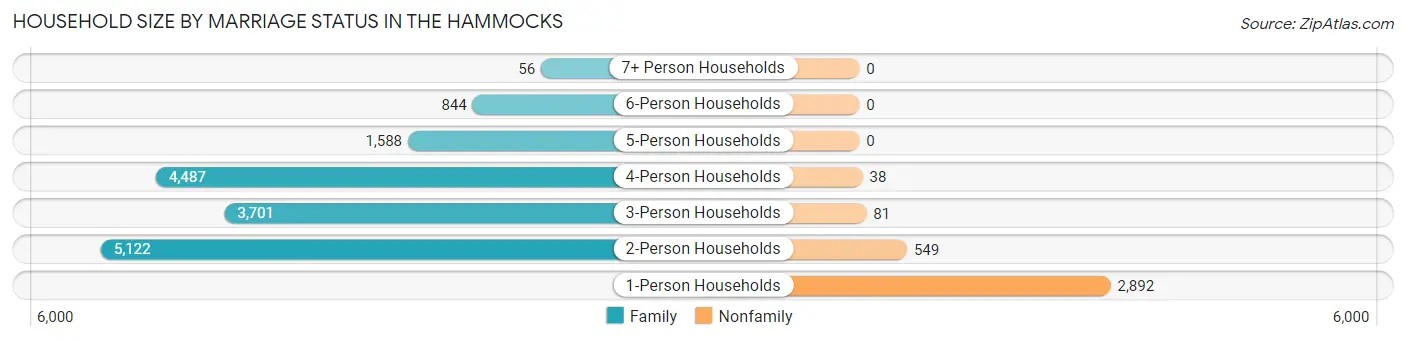
| Household Size | Family Households | Nonfamily Households |
| 1-Person Households | - | 2,892 (14.9%) |
| 2-Person Households | 5,122 (26.5%) | 549 (2.8%) |
| 3-Person Households | 3,701 (19.1%) | 81 (0.4%) |
| 4-Person Households | 4,487 (23.2%) | 38 (0.2%) |
| 5-Person Households | 1,588 (8.2%) | 0 (0.0%) |
| 6-Person Households | 844 (4.4%) | 0 (0.0%) |
| 7+ Person Households | 56 (0.3%) | 0 (0.0%) |
| Total | 15,798 (81.6%) | 3,560 (18.4%) |
Female Fertility in The Hammocks
Fertility by Age in The Hammocks
Average fertility rate in The Hammocks is 41.0 births per 1,000 women. Women in the age bracket of 20 to 34 years have the highest fertility rate with 76.0 births per 1,000 women. Women in the age bracket of 20 to 34 years acount for 65.9% of all women with births.
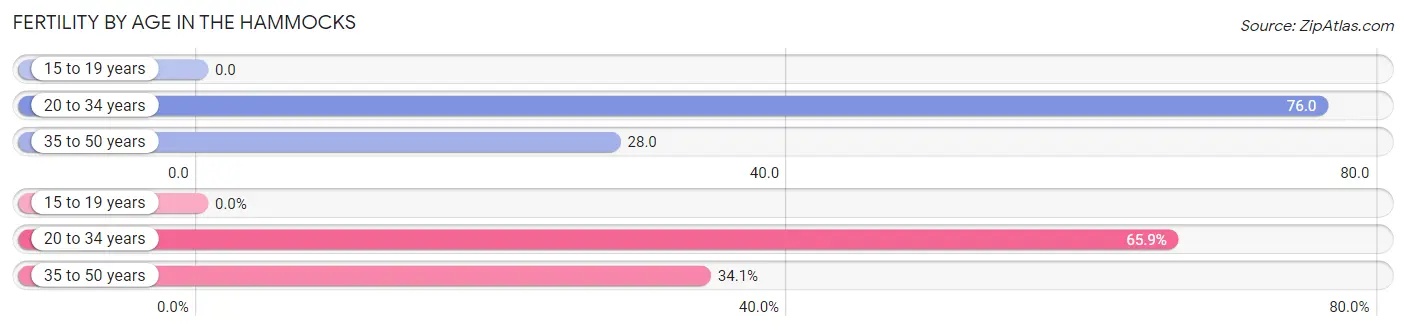
| Age Bracket | Women with Births | Births / 1,000 Women |
| 15 to 19 years | 0 (0.0%) | 0.0 |
| 20 to 34 years | 388 (65.9%) | 76.0 |
| 35 to 50 years | 201 (34.1%) | 28.0 |
| Total | 589 (100.0%) | 41.0 |
Fertility by Age by Marriage Status in The Hammocks
78.1% of women with births (589) in The Hammocks are married. The highest percentage of unmarried women with births falls into 20 to 34 years age bracket with 33.3% of them unmarried at the time of birth, while the lowest percentage of unmarried women with births belong to 35 to 50 years age bracket with 0.0% of them unmarried.
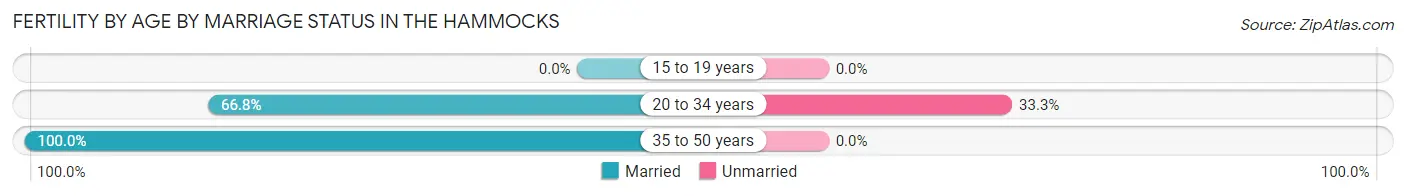
| Age Bracket | Married | Unmarried |
| 15 to 19 years | 0 (0.0%) | 0 (0.0%) |
| 20 to 34 years | 259 (66.7%) | 129 (33.3%) |
| 35 to 50 years | 201 (100.0%) | 0 (0.0%) |
| Total | 460 (78.1%) | 129 (21.9%) |
Fertility by Education in The Hammocks
Average fertility rate in The Hammocks is 41.0 births per 1,000 women. Women with the education attainment of high school diploma have the highest fertility rate of 64.0 births per 1,000 women, while women with the education attainment of less than high school have the lowest fertility at 13.0 births per 1,000 women. Women with the education attainment of college or associate's degree represent 34.1% of all women with births.
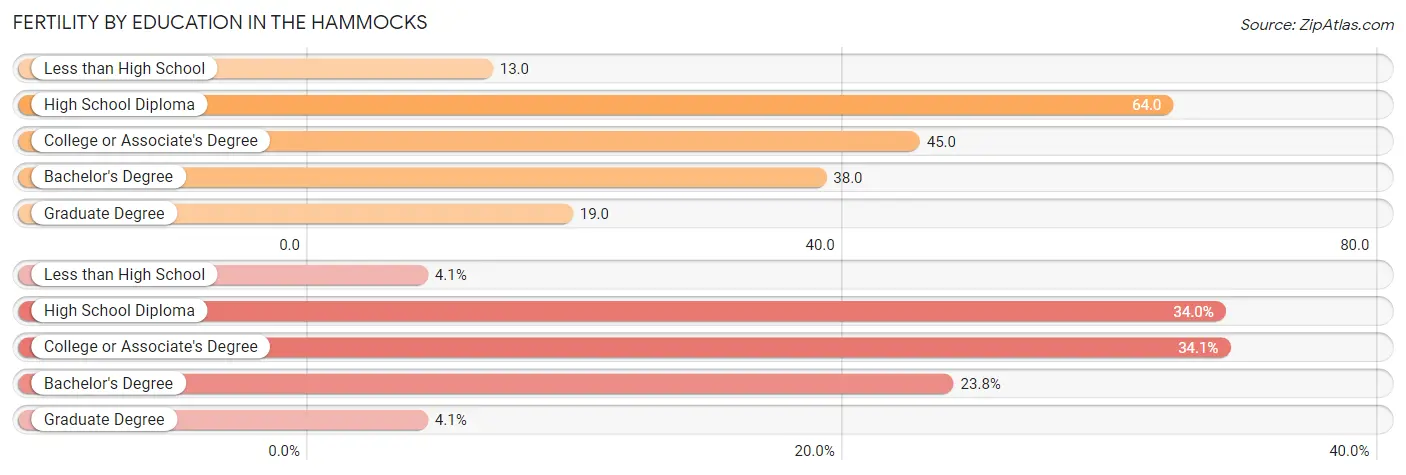
| Educational Attainment | Women with Births | Births / 1,000 Women |
| Less than High School | 24 (4.1%) | 13.0 |
| High School Diploma | 200 (34.0%) | 64.0 |
| College or Associate's Degree | 201 (34.1%) | 45.0 |
| Bachelor's Degree | 140 (23.8%) | 38.0 |
| Graduate Degree | 24 (4.1%) | 19.0 |
| Total | 589 (100.0%) | 41.0 |
Fertility by Education by Marriage Status in The Hammocks
21.9% of women with births in The Hammocks are unmarried. Women with the educational attainment of less than high school are most likely to be married with 100.0% of them married at childbirth, while women with the educational attainment of college or associate's degree are least likely to be married with 34.3% of them unmarried at childbirth.
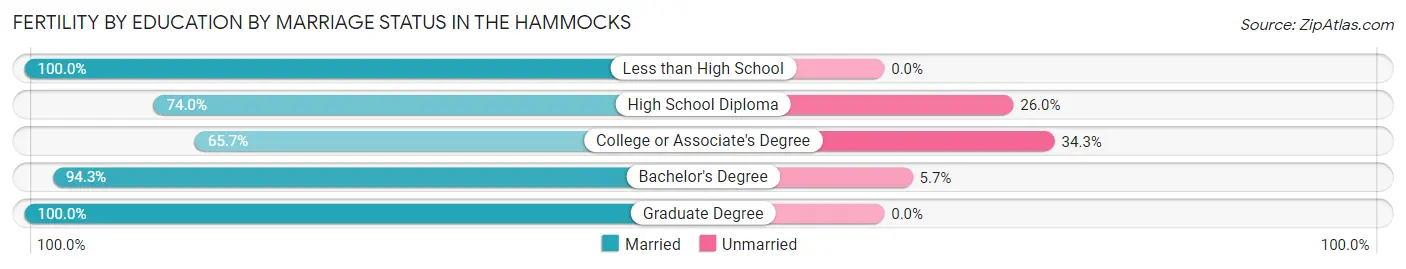
| Educational Attainment | Married | Unmarried |
| Less than High School | 24 (100.0%) | 0 (0.0%) |
| High School Diploma | 148 (74.0%) | 52 (26.0%) |
| College or Associate's Degree | 132 (65.7%) | 69 (34.3%) |
| Bachelor's Degree | 132 (94.3%) | 8 (5.7%) |
| Graduate Degree | 24 (100.0%) | 0 (0.0%) |
| Total | 460 (78.1%) | 129 (21.9%) |
Employment Characteristics in The Hammocks
Employment by Class of Employer in The Hammocks
Among the 29,310 employed individuals in The Hammocks, private company employees (21,316 | 72.7%), self-employed (incorporated) (2,254 | 7.7%), and local government employees (2,056 | 7.0%) make up the most common classes of employment.
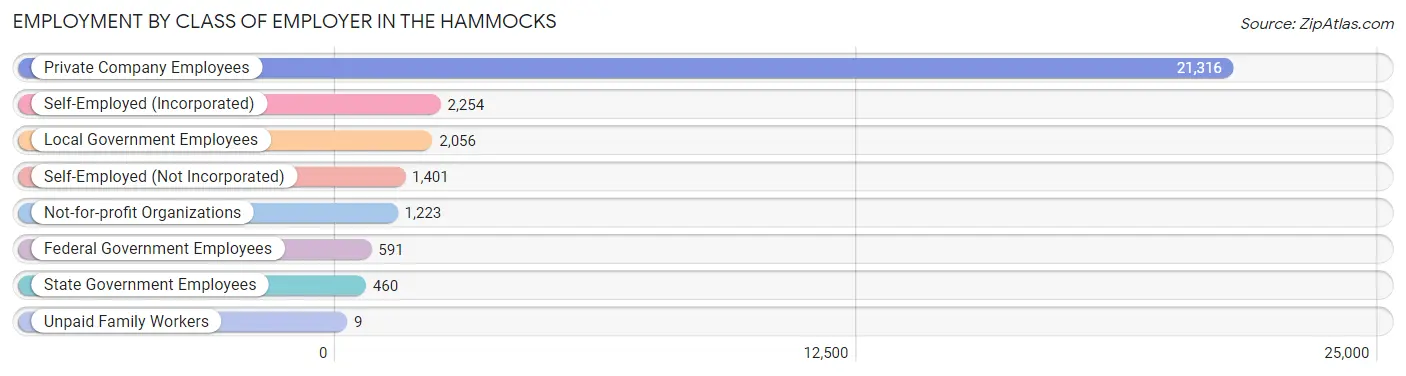
| Employer Class | # Employees | % Employees |
| Private Company Employees | 21,316 | 72.7% |
| Self-Employed (Incorporated) | 2,254 | 7.7% |
| Self-Employed (Not Incorporated) | 1,401 | 4.8% |
| Not-for-profit Organizations | 1,223 | 4.2% |
| Local Government Employees | 2,056 | 7.0% |
| State Government Employees | 460 | 1.6% |
| Federal Government Employees | 591 | 2.0% |
| Unpaid Family Workers | 9 | 0.0% |
| Total | 29,310 | 100.0% |
Employment Status by Age in The Hammocks
According to the labor force statistics for The Hammocks, out of the total population over 16 years of age (48,792), 63.1% or 30,788 individuals are in the labor force, with 3.3% or 1,016 of them unemployed. The age group with the highest labor force participation rate is 45 to 54 years, with 89.1% or 8,009 individuals in the labor force. Within the labor force, the 16 to 19 years age range has the highest percentage of unemployed individuals, with 10.7% or 59 of them being unemployed.
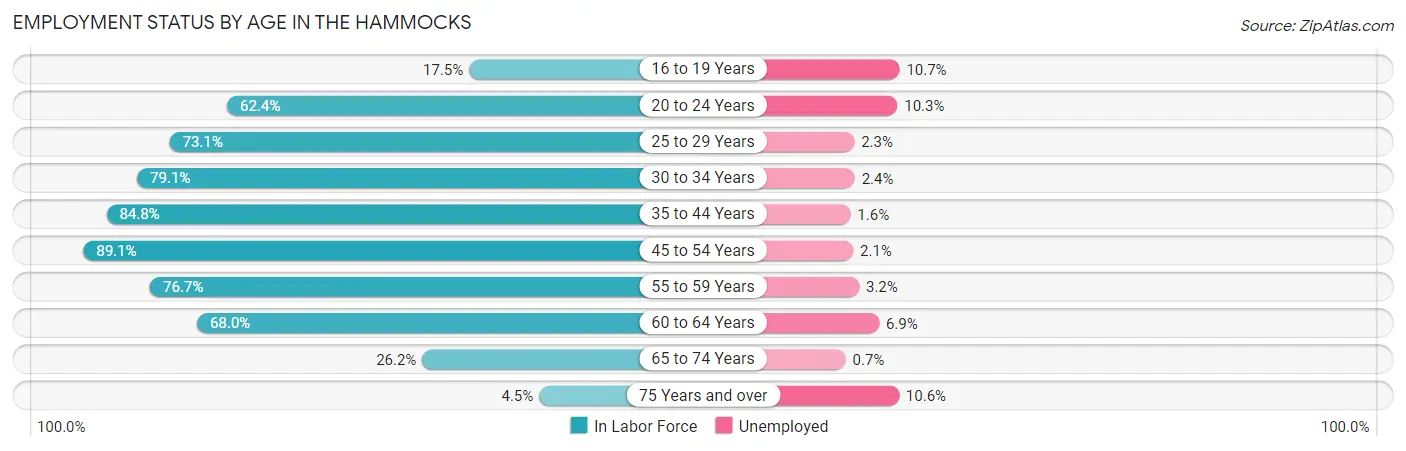
| Age Bracket | In Labor Force | Unemployed |
| 16 to 19 Years | 550 (17.5%) | 59 (10.7%) |
| 20 to 24 Years | 2,319 (62.4%) | 239 (10.3%) |
| 25 to 29 Years | 2,695 (73.1%) | 62 (2.3%) |
| 30 to 34 Years | 2,995 (79.1%) | 72 (2.4%) |
| 35 to 44 Years | 6,742 (84.8%) | 108 (1.6%) |
| 45 to 54 Years | 8,009 (89.1%) | 168 (2.1%) |
| 55 to 59 Years | 3,730 (76.7%) | 119 (3.2%) |
| 60 to 64 Years | 2,144 (68.0%) | 148 (6.9%) |
| 65 to 74 Years | 1,436 (26.2%) | 10 (0.7%) |
| 75 Years and over | 181 (4.5%) | 19 (10.6%) |
| Total | 30,788 (63.1%) | 1,016 (3.3%) |
Employment Status by Educational Attainment in The Hammocks
According to labor force statistics for The Hammocks, 81.1% of individuals (26,299) out of the total population between 25 and 64 years of age (32,428) are in the labor force, with 2.6% or 684 of them being unemployed. The group with the highest labor force participation rate are those with the educational attainment of bachelor's degree or higher, with 87.2% or 10,933 individuals in the labor force. Within the labor force, individuals with less than high school education have the highest percentage of unemployment, with 7.0% or 70 of them being unemployed.
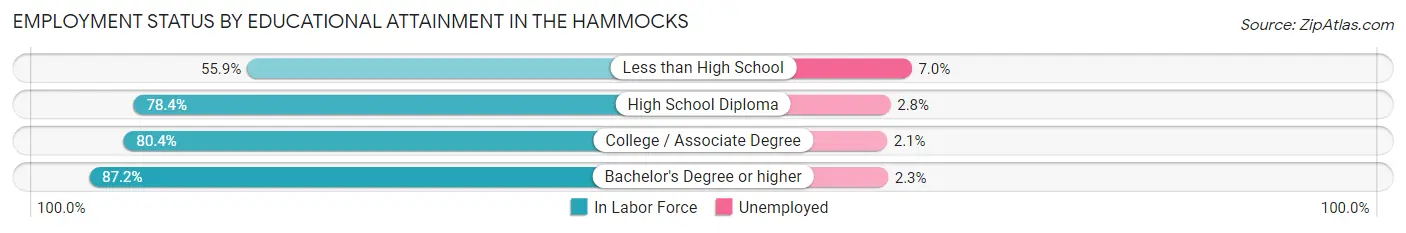
| Educational Attainment | In Labor Force | Unemployed |
| Less than High School | 1,005 (55.9%) | 126 (7.0%) |
| High School Diploma | 6,985 (78.4%) | 249 (2.8%) |
| College / Associate Degree | 7,384 (80.4%) | 193 (2.1%) |
| Bachelor's Degree or higher | 10,933 (87.2%) | 288 (2.3%) |
| Total | 26,299 (81.1%) | 843 (2.6%) |
Employment Occupations by Sex in The Hammocks
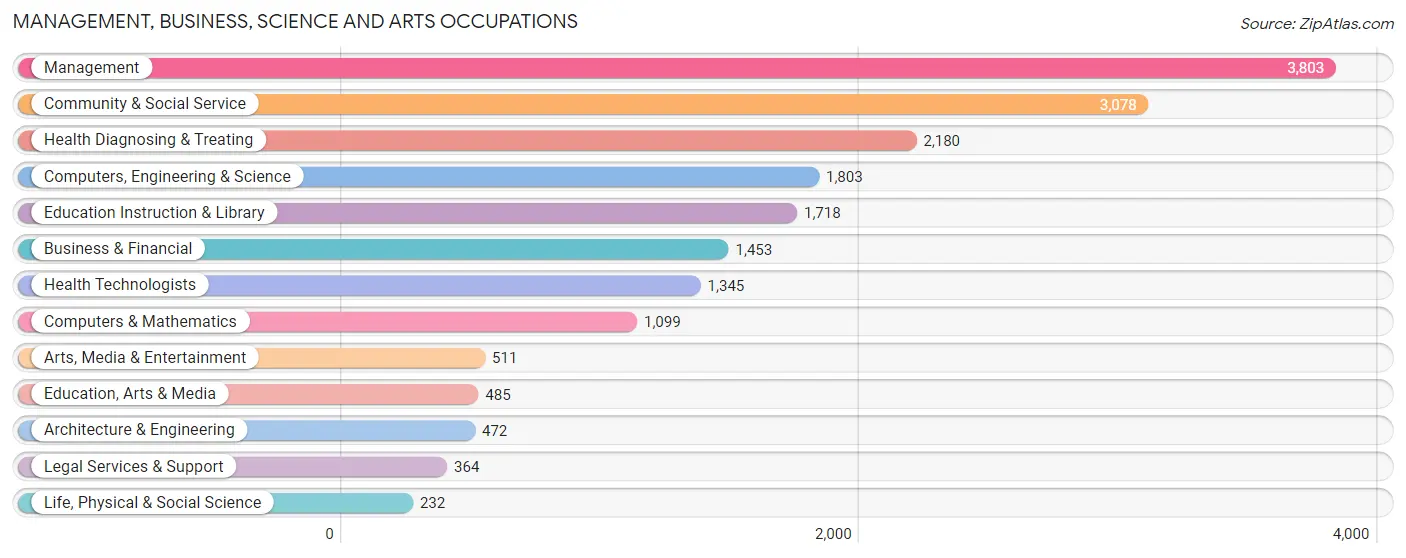
Management, Business, Science and Arts Occupations
The most common Management, Business, Science and Arts occupations in The Hammocks are Management (3,803 | 12.8%), Community & Social Service (3,078 | 10.3%), Health Diagnosing & Treating (2,180 | 7.3%), Computers, Engineering & Science (1,803 | 6.1%), and Education Instruction & Library (1,718 | 5.8%).
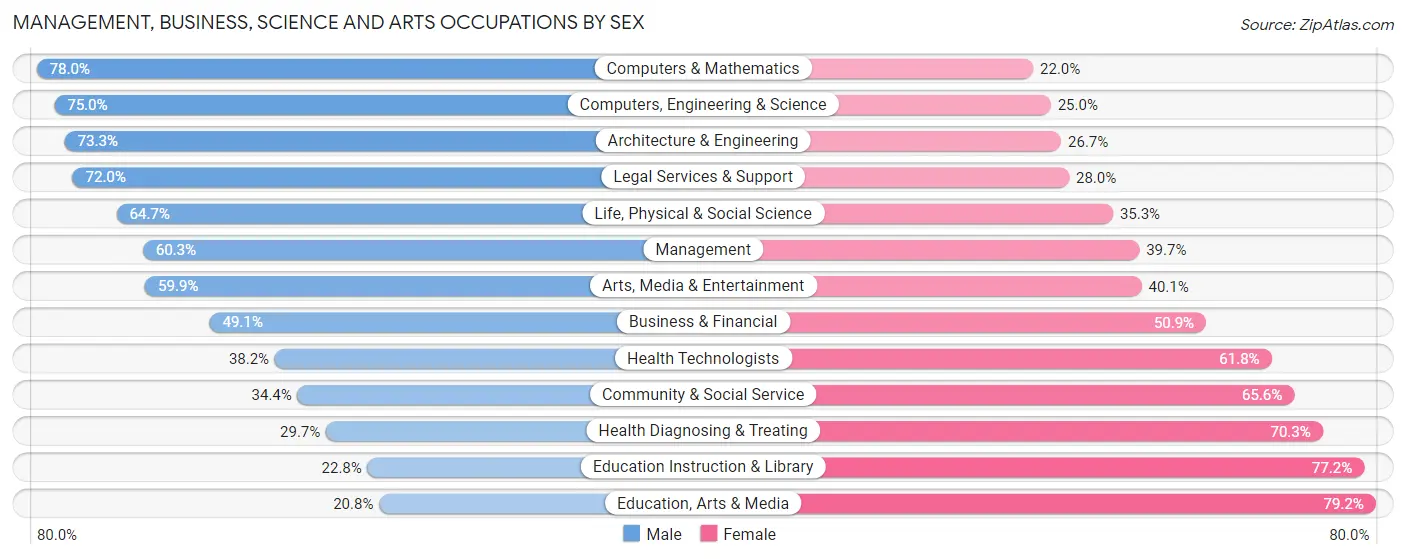
Management, Business, Science and Arts Occupations by Sex
Within the Management, Business, Science and Arts occupations in The Hammocks, the most male-oriented occupations are Computers & Mathematics (78.0%), Computers, Engineering & Science (75.0%), and Architecture & Engineering (73.3%), while the most female-oriented occupations are Education, Arts & Media (79.2%), Education Instruction & Library (77.2%), and Health Diagnosing & Treating (70.3%).
| Occupation | Male | Female |
| Management | 2,292 (60.3%) | 1,511 (39.7%) |
| Business & Financial | 714 (49.1%) | 739 (50.9%) |
| Computers, Engineering & Science | 1,353 (75.0%) | 450 (25.0%) |
| Computers & Mathematics | 857 (78.0%) | 242 (22.0%) |
| Architecture & Engineering | 346 (73.3%) | 126 (26.7%) |
| Life, Physical & Social Science | 150 (64.7%) | 82 (35.3%) |
| Community & Social Service | 1,060 (34.4%) | 2,018 (65.6%) |
| Education, Arts & Media | 101 (20.8%) | 384 (79.2%) |
| Legal Services & Support | 262 (72.0%) | 102 (28.0%) |
| Education Instruction & Library | 391 (22.8%) | 1,327 (77.2%) |
| Arts, Media & Entertainment | 306 (59.9%) | 205 (40.1%) |
| Health Diagnosing & Treating | 647 (29.7%) | 1,533 (70.3%) |
| Health Technologists | 514 (38.2%) | 831 (61.8%) |
| Total (Category) | 6,066 (49.2%) | 6,251 (50.7%) |
| Total (Overall) | 15,896 (53.4%) | 13,855 (46.6%) |
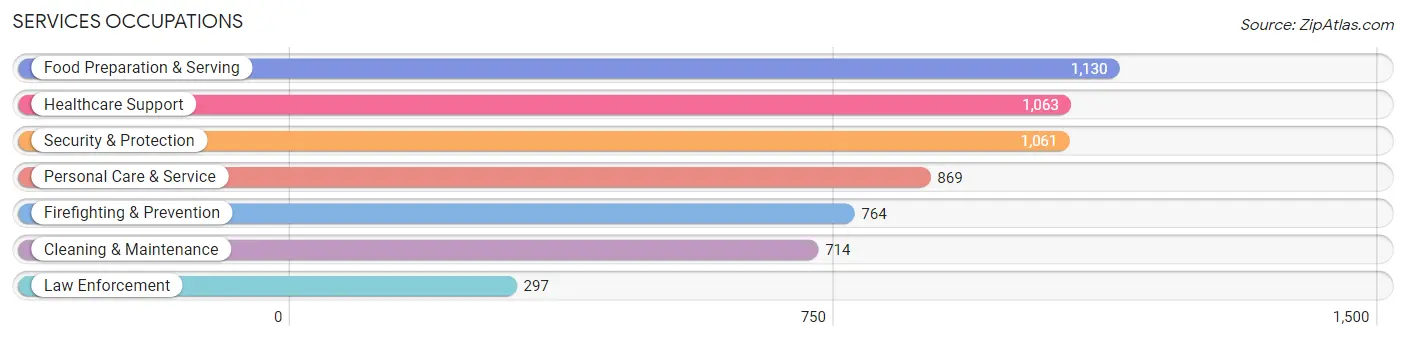
Services Occupations
The most common Services occupations in The Hammocks are Food Preparation & Serving (1,130 | 3.8%), Healthcare Support (1,063 | 3.6%), Security & Protection (1,061 | 3.6%), Personal Care & Service (869 | 2.9%), and Firefighting & Prevention (764 | 2.6%).
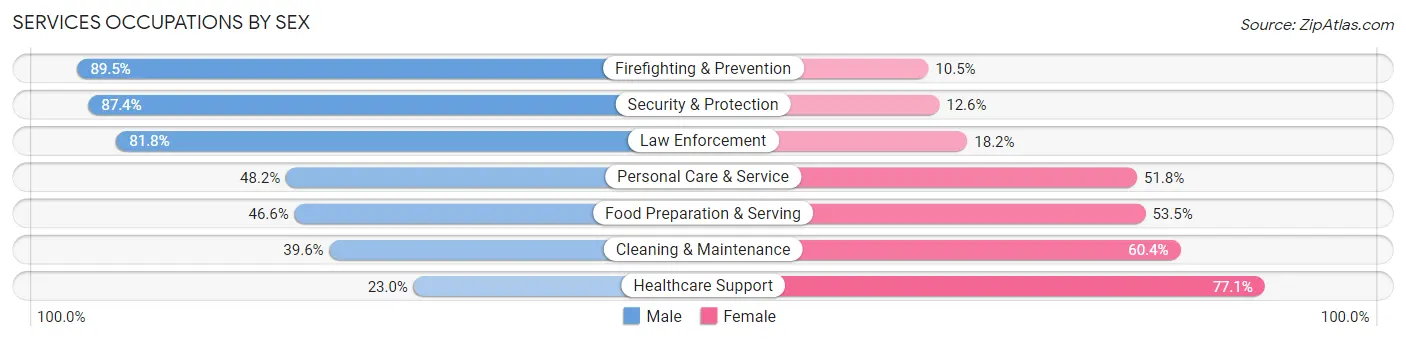
Services Occupations by Sex
Within the Services occupations in The Hammocks, the most male-oriented occupations are Firefighting & Prevention (89.5%), Security & Protection (87.4%), and Law Enforcement (81.8%), while the most female-oriented occupations are Healthcare Support (77.0%), Cleaning & Maintenance (60.4%), and Food Preparation & Serving (53.4%).
| Occupation | Male | Female |
| Healthcare Support | 244 (23.0%) | 819 (77.0%) |
| Security & Protection | 927 (87.4%) | 134 (12.6%) |
| Firefighting & Prevention | 684 (89.5%) | 80 (10.5%) |
| Law Enforcement | 243 (81.8%) | 54 (18.2%) |
| Food Preparation & Serving | 526 (46.6%) | 604 (53.4%) |
| Cleaning & Maintenance | 283 (39.6%) | 431 (60.4%) |
| Personal Care & Service | 419 (48.2%) | 450 (51.8%) |
| Total (Category) | 2,399 (49.6%) | 2,438 (50.4%) |
| Total (Overall) | 15,896 (53.4%) | 13,855 (46.6%) |
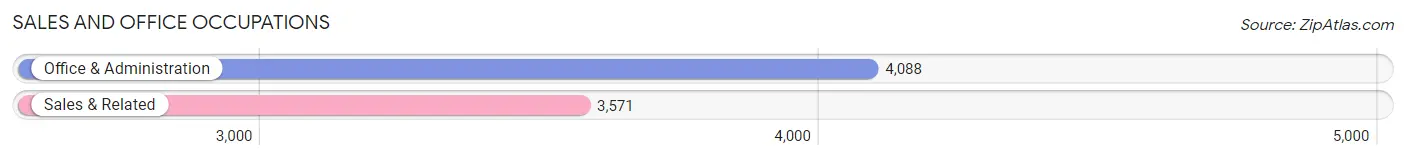
Sales and Office Occupations
The most common Sales and Office occupations in The Hammocks are Office & Administration (4,088 | 13.7%), and Sales & Related (3,571 | 12.0%).
Sales and Office Occupations by Sex
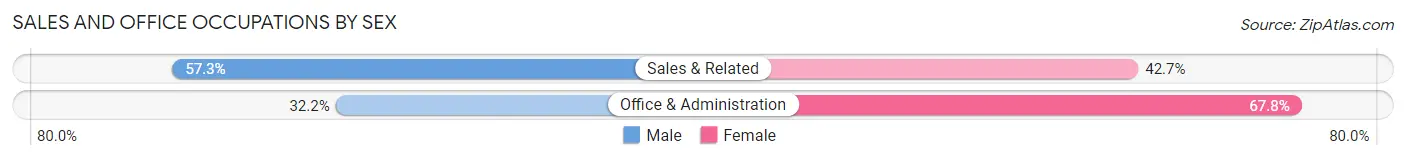
| Occupation | Male | Female |
| Sales & Related | 2,045 (57.3%) | 1,526 (42.7%) |
| Office & Administration | 1,315 (32.2%) | 2,773 (67.8%) |
| Total (Category) | 3,360 (43.9%) | 4,299 (56.1%) |
| Total (Overall) | 15,896 (53.4%) | 13,855 (46.6%) |
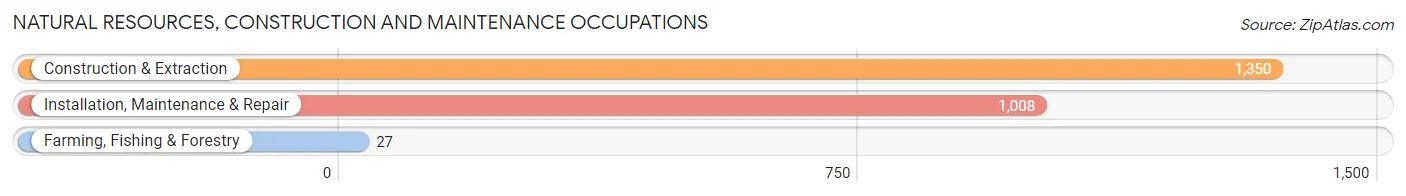
Natural Resources, Construction and Maintenance Occupations
The most common Natural Resources, Construction and Maintenance occupations in The Hammocks are Construction & Extraction (1,350 | 4.5%), Installation, Maintenance & Repair (1,008 | 3.4%), and Farming, Fishing & Forestry (27 | 0.1%).
Natural Resources, Construction and Maintenance Occupations by Sex
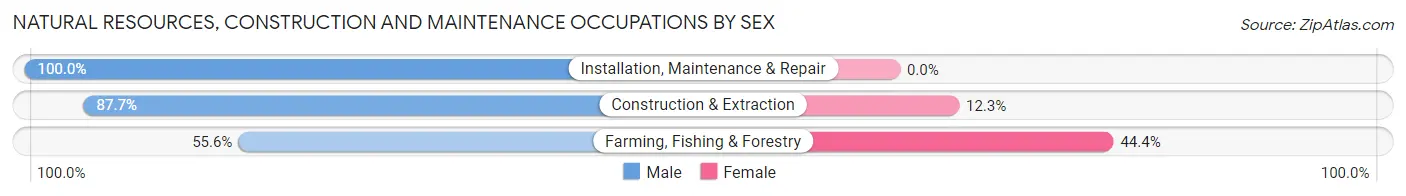
| Occupation | Male | Female |
| Farming, Fishing & Forestry | 15 (55.6%) | 12 (44.4%) |
| Construction & Extraction | 1,184 (87.7%) | 166 (12.3%) |
| Installation, Maintenance & Repair | 1,008 (100.0%) | 0 (0.0%) |
| Total (Category) | 2,207 (92.5%) | 178 (7.5%) |
| Total (Overall) | 15,896 (53.4%) | 13,855 (46.6%) |
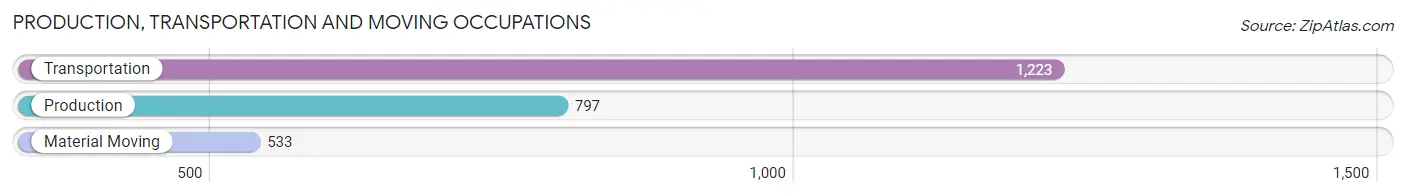
Production, Transportation and Moving Occupations
The most common Production, Transportation and Moving occupations in The Hammocks are Transportation (1,223 | 4.1%), Production (797 | 2.7%), and Material Moving (533 | 1.8%).
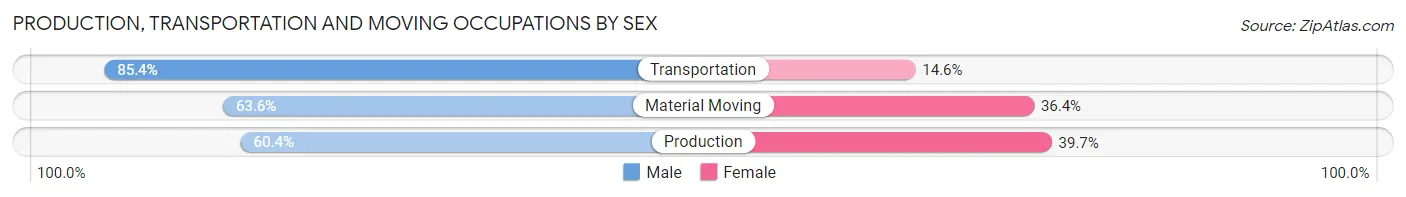
Production, Transportation and Moving Occupations by Sex
| Occupation | Male | Female |
| Production | 481 (60.4%) | 316 (39.7%) |
| Transportation | 1,044 (85.4%) | 179 (14.6%) |
| Material Moving | 339 (63.6%) | 194 (36.4%) |
| Total (Category) | 1,864 (73.0%) | 689 (27.0%) |
| Total (Overall) | 15,896 (53.4%) | 13,855 (46.6%) |
Employment Industries by Sex in The Hammocks
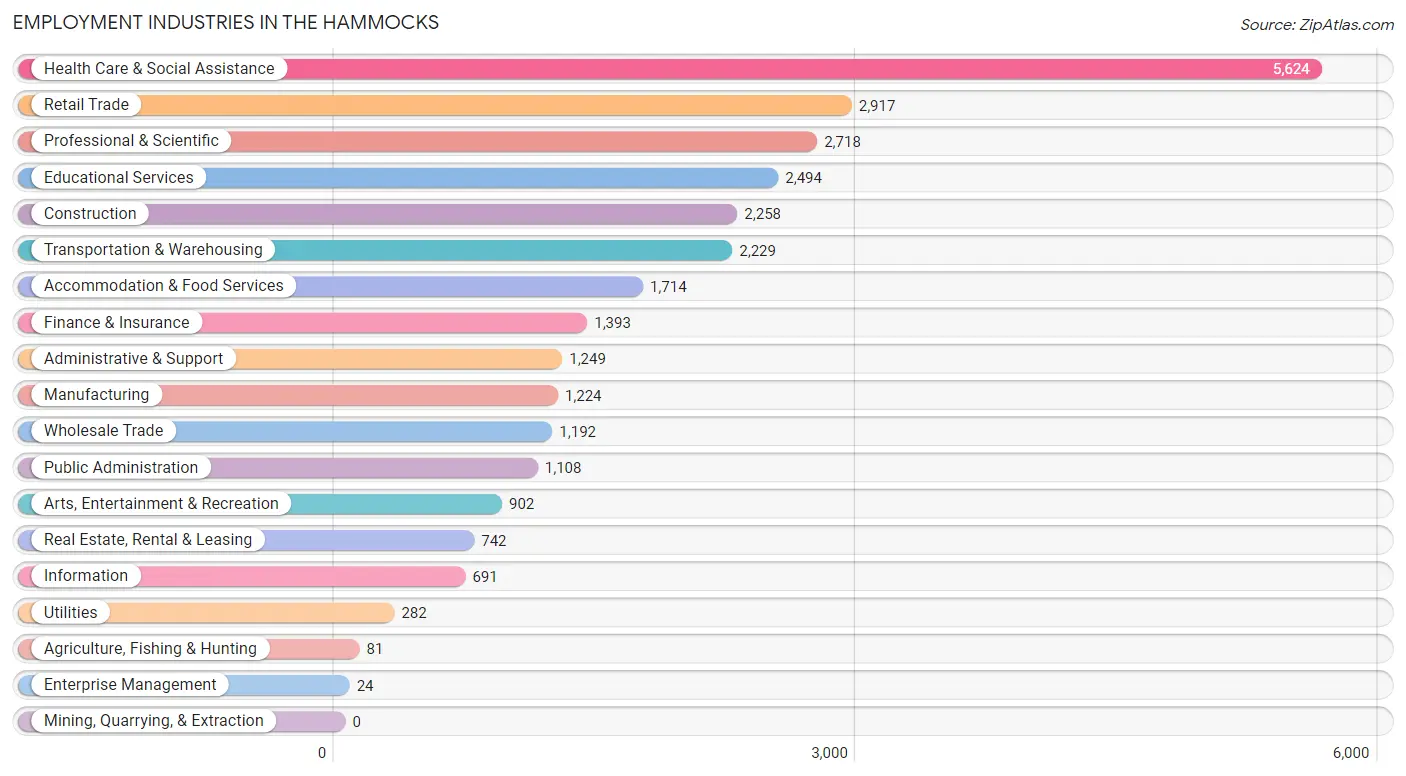
Employment Industries in The Hammocks
The major employment industries in The Hammocks include Health Care & Social Assistance (5,624 | 18.9%), Retail Trade (2,917 | 9.8%), Professional & Scientific (2,718 | 9.1%), Educational Services (2,494 | 8.4%), and Construction (2,258 | 7.6%).
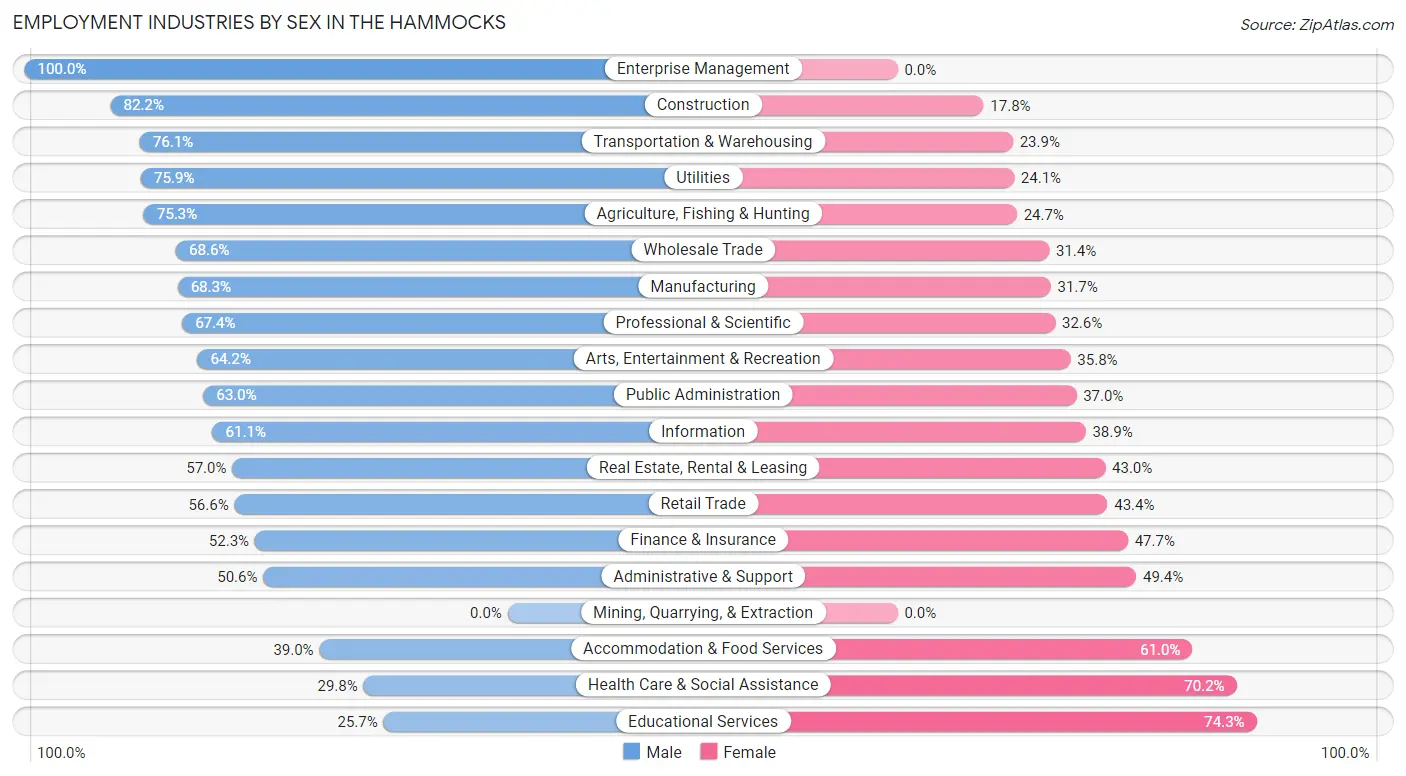
Employment Industries by Sex in The Hammocks
The The Hammocks industries that see more men than women are Enterprise Management (100.0%), Construction (82.2%), and Transportation & Warehousing (76.1%), whereas the industries that tend to have a higher number of women are Educational Services (74.3%), Health Care & Social Assistance (70.2%), and Accommodation & Food Services (61.0%).
| Industry | Male | Female |
| Agriculture, Fishing & Hunting | 61 (75.3%) | 20 (24.7%) |
| Mining, Quarrying, & Extraction | 0 (0.0%) | 0 (0.0%) |
| Construction | 1,856 (82.2%) | 402 (17.8%) |
| Manufacturing | 836 (68.3%) | 388 (31.7%) |
| Wholesale Trade | 818 (68.6%) | 374 (31.4%) |
| Retail Trade | 1,650 (56.6%) | 1,267 (43.4%) |
| Transportation & Warehousing | 1,697 (76.1%) | 532 (23.9%) |
| Utilities | 214 (75.9%) | 68 (24.1%) |
| Information | 422 (61.1%) | 269 (38.9%) |
| Finance & Insurance | 729 (52.3%) | 664 (47.7%) |
| Real Estate, Rental & Leasing | 423 (57.0%) | 319 (43.0%) |
| Professional & Scientific | 1,831 (67.4%) | 887 (32.6%) |
| Enterprise Management | 24 (100.0%) | 0 (0.0%) |
| Administrative & Support | 632 (50.6%) | 617 (49.4%) |
| Educational Services | 641 (25.7%) | 1,853 (74.3%) |
| Health Care & Social Assistance | 1,678 (29.8%) | 3,946 (70.2%) |
| Arts, Entertainment & Recreation | 579 (64.2%) | 323 (35.8%) |
| Accommodation & Food Services | 668 (39.0%) | 1,046 (61.0%) |
| Public Administration | 698 (63.0%) | 410 (37.0%) |
| Total | 15,896 (53.4%) | 13,855 (46.6%) |
Education in The Hammocks
School Enrollment in The Hammocks
The most common levels of schooling among the 16,224 students in The Hammocks are college / undergraduate (3,841 | 23.7%), high school (3,698 | 22.8%), and middle school (3,307 | 20.4%).
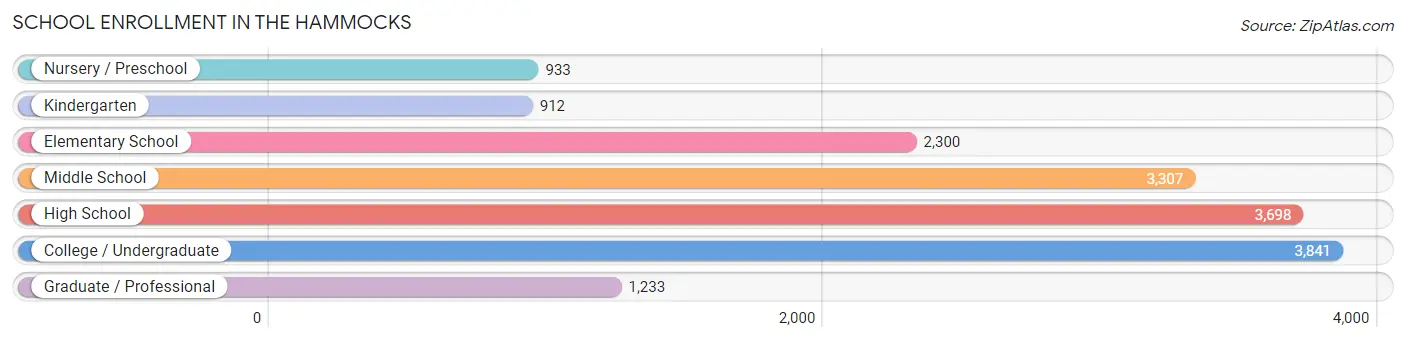
| School Level | # Students | % Students |
| Nursery / Preschool | 933 | 5.8% |
| Kindergarten | 912 | 5.6% |
| Elementary School | 2,300 | 14.2% |
| Middle School | 3,307 | 20.4% |
| High School | 3,698 | 22.8% |
| College / Undergraduate | 3,841 | 23.7% |
| Graduate / Professional | 1,233 | 7.6% |
| Total | 16,224 | 100.0% |
School Enrollment by Age by Funding Source in The Hammocks
Out of a total of 16,224 students who are enrolled in schools in The Hammocks, 2,158 (13.3%) attend a private institution, while the remaining 14,066 (86.7%) are enrolled in public schools. The age group of 35 years and over has the highest likelihood of being enrolled in private schools, with 550 (50.3% in the age bracket) enrolled. Conversely, the age group of 10 to 14 year olds has the lowest likelihood of being enrolled in a private school, with 3,520 (95.2% in the age bracket) attending a public institution.
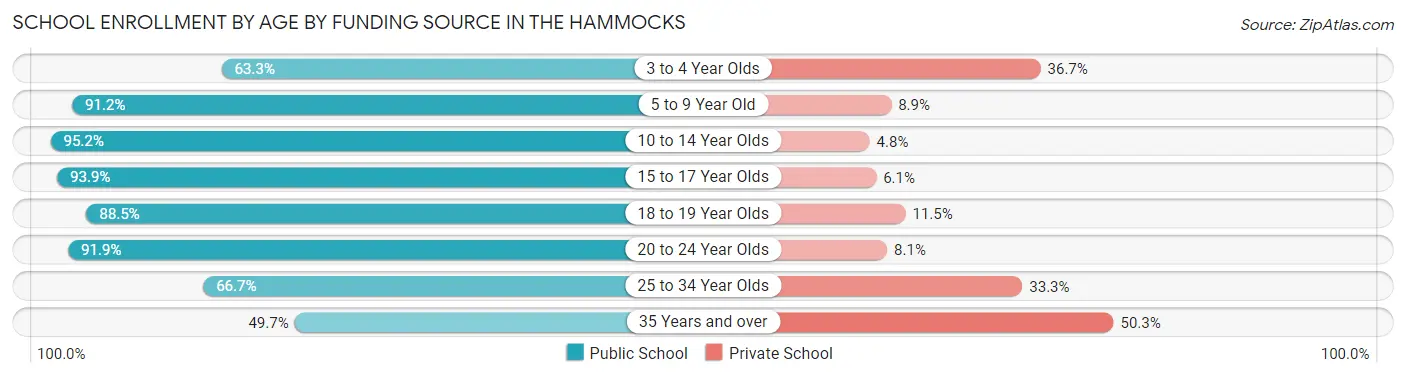
| Age Bracket | Public School | Private School |
| 3 to 4 Year Olds | 435 (63.3%) | 252 (36.7%) |
| 5 to 9 Year Old | 3,069 (91.1%) | 298 (8.8%) |
| 10 to 14 Year Olds | 3,520 (95.2%) | 179 (4.8%) |
| 15 to 17 Year Olds | 2,665 (93.9%) | 172 (6.1%) |
| 18 to 19 Year Olds | 906 (88.5%) | 118 (11.5%) |
| 20 to 24 Year Olds | 2,143 (91.9%) | 189 (8.1%) |
| 25 to 34 Year Olds | 790 (66.7%) | 394 (33.3%) |
| 35 Years and over | 544 (49.7%) | 550 (50.3%) |
| Total | 14,066 (86.7%) | 2,158 (13.3%) |
Educational Attainment by Field of Study in The Hammocks
Business (4,116 | 25.5%), science & technology (2,381 | 14.7%), engineering (2,031 | 12.6%), education (1,804 | 11.2%), and computers & mathematics (886 | 5.5%) are the most common fields of study among 16,158 individuals in The Hammocks who have obtained a bachelor's degree or higher.
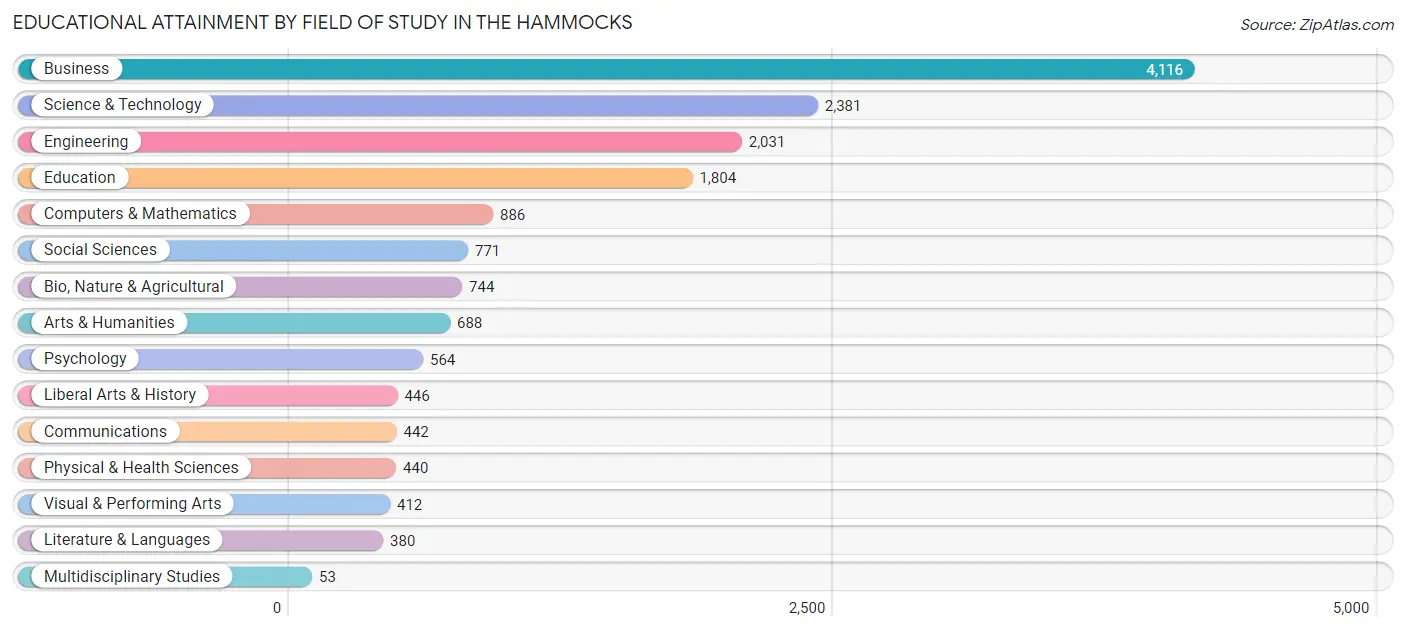
| Field of Study | # Graduates | % Graduates |
| Computers & Mathematics | 886 | 5.5% |
| Bio, Nature & Agricultural | 744 | 4.6% |
| Physical & Health Sciences | 440 | 2.7% |
| Psychology | 564 | 3.5% |
| Social Sciences | 771 | 4.8% |
| Engineering | 2,031 | 12.6% |
| Multidisciplinary Studies | 53 | 0.3% |
| Science & Technology | 2,381 | 14.7% |
| Business | 4,116 | 25.5% |
| Education | 1,804 | 11.2% |
| Literature & Languages | 380 | 2.4% |
| Liberal Arts & History | 446 | 2.8% |
| Visual & Performing Arts | 412 | 2.5% |
| Communications | 442 | 2.7% |
| Arts & Humanities | 688 | 4.3% |
| Total | 16,158 | 100.0% |
Transportation & Commute in The Hammocks
Vehicle Availability by Sex in The Hammocks
The most prevalent vehicle ownership categories in The Hammocks are males with 2 vehicles (7,663, accounting for 49.0%) and females with 2 vehicles (5,889, making up 56.1%).
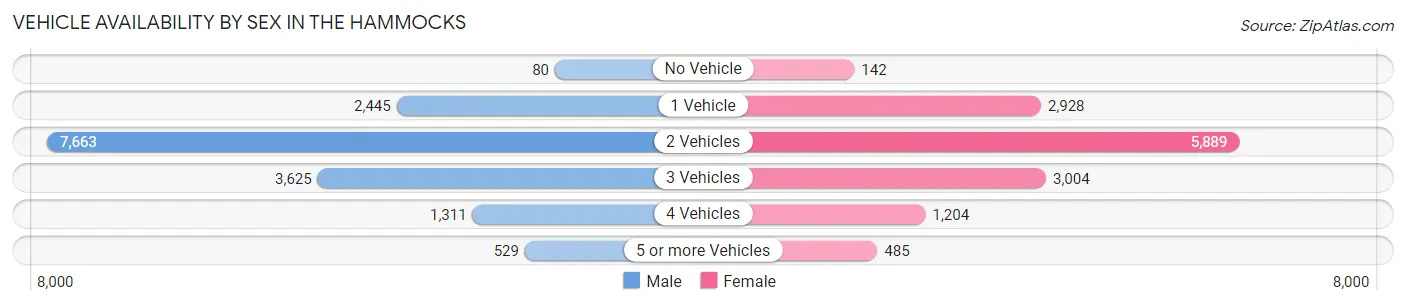
| Vehicles Available | Male | Female |
| No Vehicle | 80 (0.5%) | 142 (1.0%) |
| 1 Vehicle | 2,445 (15.6%) | 2,928 (21.4%) |
| 2 Vehicles | 7,663 (49.0%) | 5,889 (43.1%) |
| 3 Vehicles | 3,625 (23.2%) | 3,004 (22.0%) |
| 4 Vehicles | 1,311 (8.4%) | 1,204 (8.8%) |
| 5 or more Vehicles | 529 (3.4%) | 485 (3.5%) |
| Total | 15,653 (100.0%) | 13,652 (100.0%) |
Commute Time in The Hammocks
The most frequently occuring commute durations in The Hammocks are 20 to 24 minutes (5,290 commuters, 19.5%), 30 to 34 minutes (4,220 commuters, 15.5%), and 45 to 59 minutes (3,670 commuters, 13.5%).
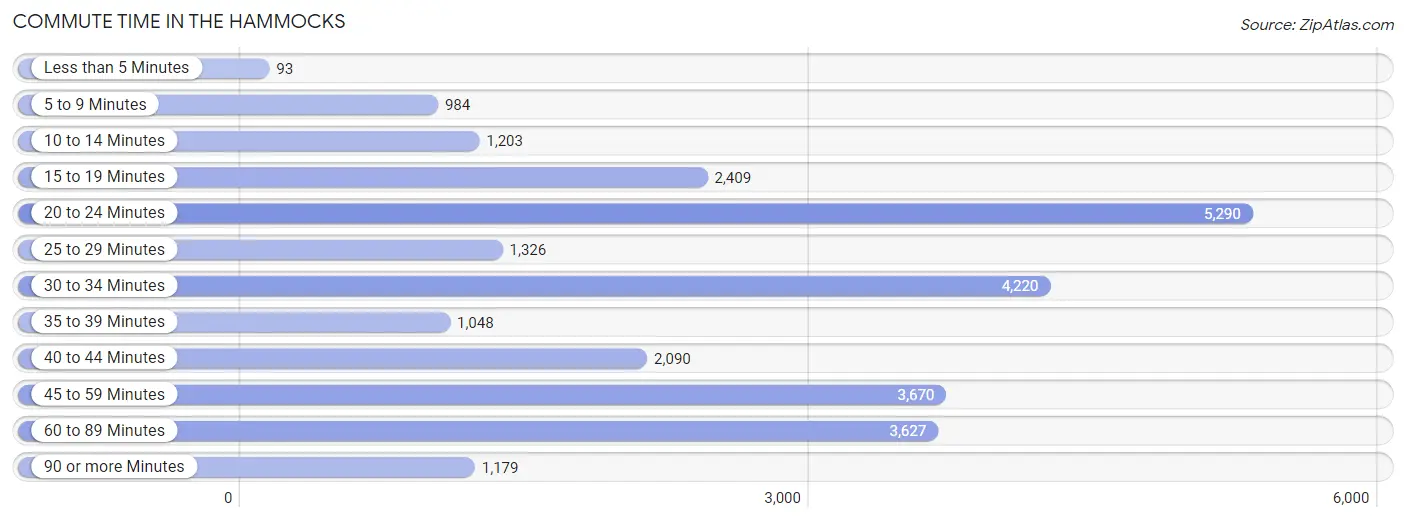
| Commute Time | # Commuters | % Commuters |
| Less than 5 Minutes | 93 | 0.3% |
| 5 to 9 Minutes | 984 | 3.6% |
| 10 to 14 Minutes | 1,203 | 4.4% |
| 15 to 19 Minutes | 2,409 | 8.9% |
| 20 to 24 Minutes | 5,290 | 19.5% |
| 25 to 29 Minutes | 1,326 | 4.9% |
| 30 to 34 Minutes | 4,220 | 15.5% |
| 35 to 39 Minutes | 1,048 | 3.9% |
| 40 to 44 Minutes | 2,090 | 7.7% |
| 45 to 59 Minutes | 3,670 | 13.5% |
| 60 to 89 Minutes | 3,627 | 13.4% |
| 90 or more Minutes | 1,179 | 4.3% |
Commute Time by Sex in The Hammocks
The most common commute times in The Hammocks are 20 to 24 minutes (2,919 commuters, 20.3%) for males and 20 to 24 minutes (2,371 commuters, 18.5%) for females.
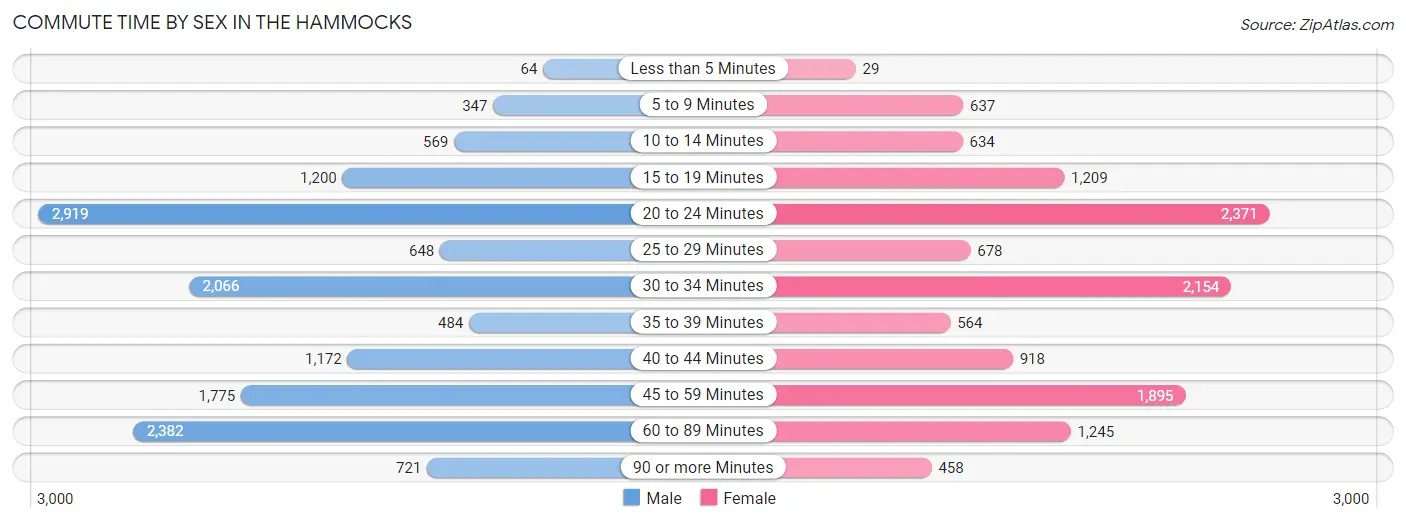
| Commute Time | Male | Female |
| Less than 5 Minutes | 64 (0.4%) | 29 (0.2%) |
| 5 to 9 Minutes | 347 (2.4%) | 637 (5.0%) |
| 10 to 14 Minutes | 569 (4.0%) | 634 (5.0%) |
| 15 to 19 Minutes | 1,200 (8.4%) | 1,209 (9.5%) |
| 20 to 24 Minutes | 2,919 (20.3%) | 2,371 (18.5%) |
| 25 to 29 Minutes | 648 (4.5%) | 678 (5.3%) |
| 30 to 34 Minutes | 2,066 (14.4%) | 2,154 (16.8%) |
| 35 to 39 Minutes | 484 (3.4%) | 564 (4.4%) |
| 40 to 44 Minutes | 1,172 (8.2%) | 918 (7.2%) |
| 45 to 59 Minutes | 1,775 (12.4%) | 1,895 (14.8%) |
| 60 to 89 Minutes | 2,382 (16.6%) | 1,245 (9.7%) |
| 90 or more Minutes | 721 (5.0%) | 458 (3.6%) |
Time of Departure to Work by Sex in The Hammocks
The most frequent times of departure to work in The Hammocks are 8:00 AM to 8:29 AM (2,796, 19.5%) for males and 8:00 AM to 8:29 AM (2,851, 22.3%) for females.
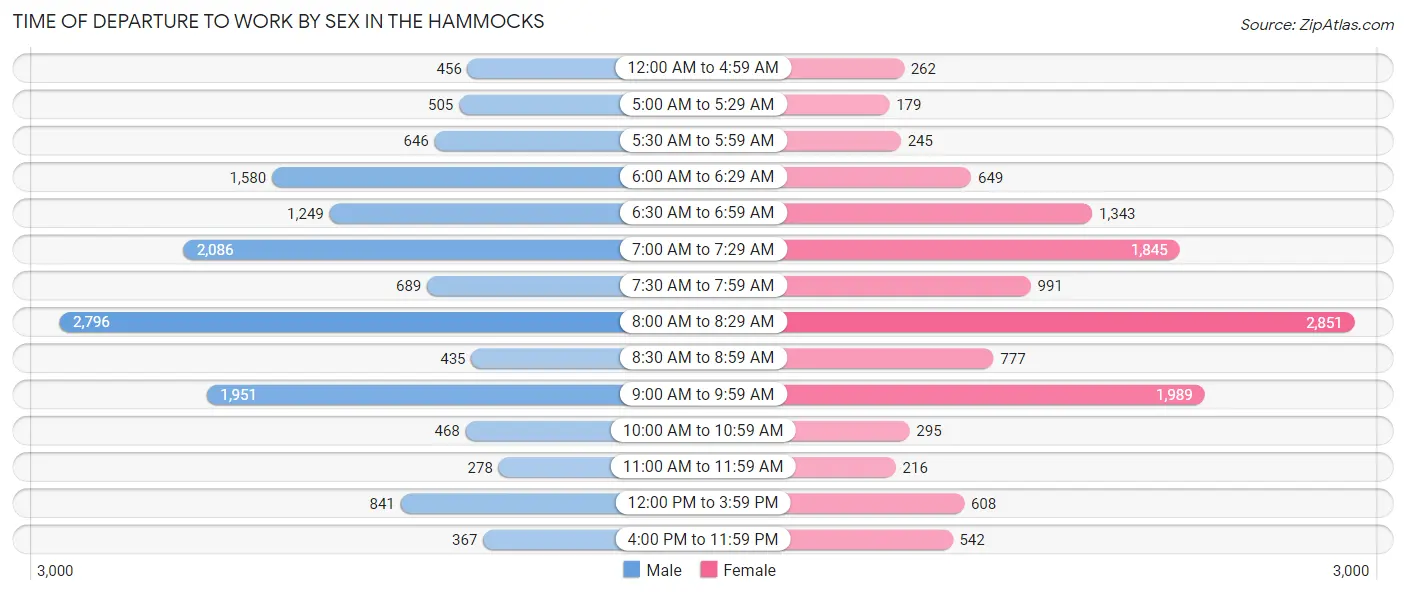
| Time of Departure | Male | Female |
| 12:00 AM to 4:59 AM | 456 (3.2%) | 262 (2.1%) |
| 5:00 AM to 5:29 AM | 505 (3.5%) | 179 (1.4%) |
| 5:30 AM to 5:59 AM | 646 (4.5%) | 245 (1.9%) |
| 6:00 AM to 6:29 AM | 1,580 (11.0%) | 649 (5.1%) |
| 6:30 AM to 6:59 AM | 1,249 (8.7%) | 1,343 (10.5%) |
| 7:00 AM to 7:29 AM | 2,086 (14.5%) | 1,845 (14.4%) |
| 7:30 AM to 7:59 AM | 689 (4.8%) | 991 (7.7%) |
| 8:00 AM to 8:29 AM | 2,796 (19.5%) | 2,851 (22.3%) |
| 8:30 AM to 8:59 AM | 435 (3.0%) | 777 (6.1%) |
| 9:00 AM to 9:59 AM | 1,951 (13.6%) | 1,989 (15.5%) |
| 10:00 AM to 10:59 AM | 468 (3.3%) | 295 (2.3%) |
| 11:00 AM to 11:59 AM | 278 (1.9%) | 216 (1.7%) |
| 12:00 PM to 3:59 PM | 841 (5.9%) | 608 (4.8%) |
| 4:00 PM to 11:59 PM | 367 (2.6%) | 542 (4.2%) |
| Total | 14,347 (100.0%) | 12,792 (100.0%) |
Housing Occupancy in The Hammocks
Occupancy by Ownership in The Hammocks
Of the total 19,358 dwellings in The Hammocks, owner-occupied units account for 11,955 (61.8%), while renter-occupied units make up 7,403 (38.2%).
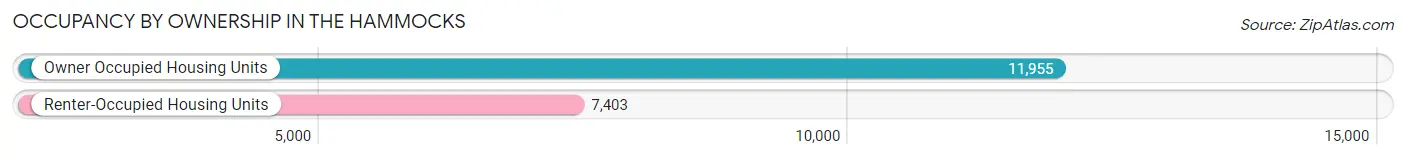
| Occupancy | # Housing Units | % Housing Units |
| Owner Occupied Housing Units | 11,955 | 61.8% |
| Renter-Occupied Housing Units | 7,403 | 38.2% |
| Total Occupied Housing Units | 19,358 | 100.0% |
Occupancy by Household Size in The Hammocks
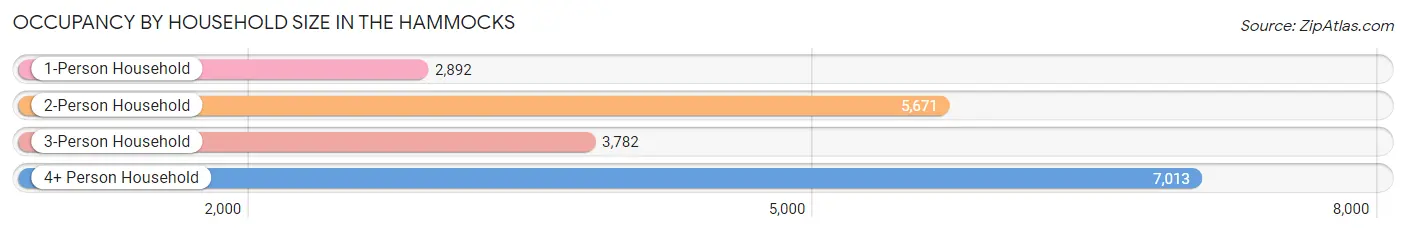
| Household Size | # Housing Units | % Housing Units |
| 1-Person Household | 2,892 | 14.9% |
| 2-Person Household | 5,671 | 29.3% |
| 3-Person Household | 3,782 | 19.5% |
| 4+ Person Household | 7,013 | 36.2% |
| Total Housing Units | 19,358 | 100.0% |
Occupancy by Ownership by Household Size in The Hammocks
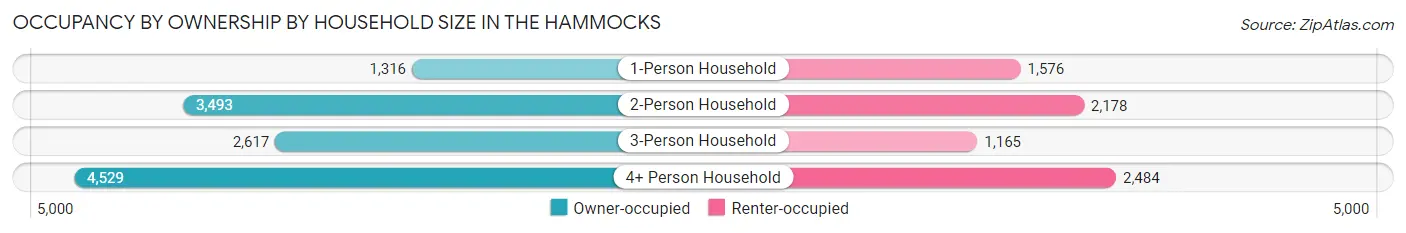
| Household Size | Owner-occupied | Renter-occupied |
| 1-Person Household | 1,316 (45.5%) | 1,576 (54.5%) |
| 2-Person Household | 3,493 (61.6%) | 2,178 (38.4%) |
| 3-Person Household | 2,617 (69.2%) | 1,165 (30.8%) |
| 4+ Person Household | 4,529 (64.6%) | 2,484 (35.4%) |
| Total Housing Units | 11,955 (61.8%) | 7,403 (38.2%) |
Occupancy by Educational Attainment in The Hammocks
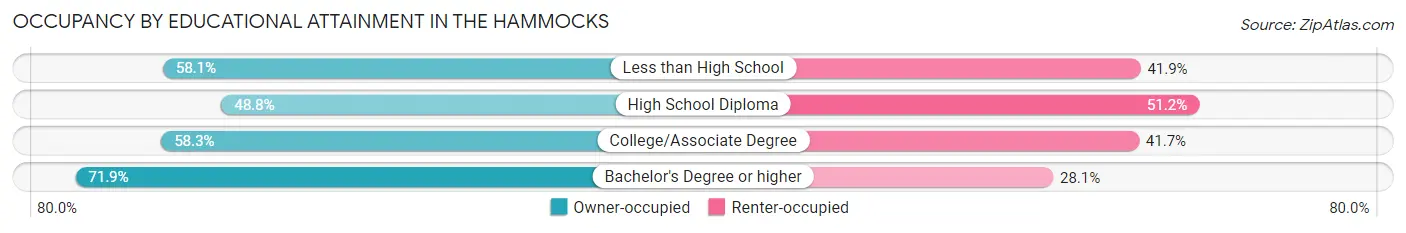
| Household Size | Owner-occupied | Renter-occupied |
| Less than High School | 827 (58.1%) | 597 (41.9%) |
| High School Diploma | 2,231 (48.8%) | 2,342 (51.2%) |
| College/Associate Degree | 3,063 (58.3%) | 2,188 (41.7%) |
| Bachelor's Degree or higher | 5,834 (71.9%) | 2,276 (28.1%) |
Occupancy by Age of Householder in The Hammocks
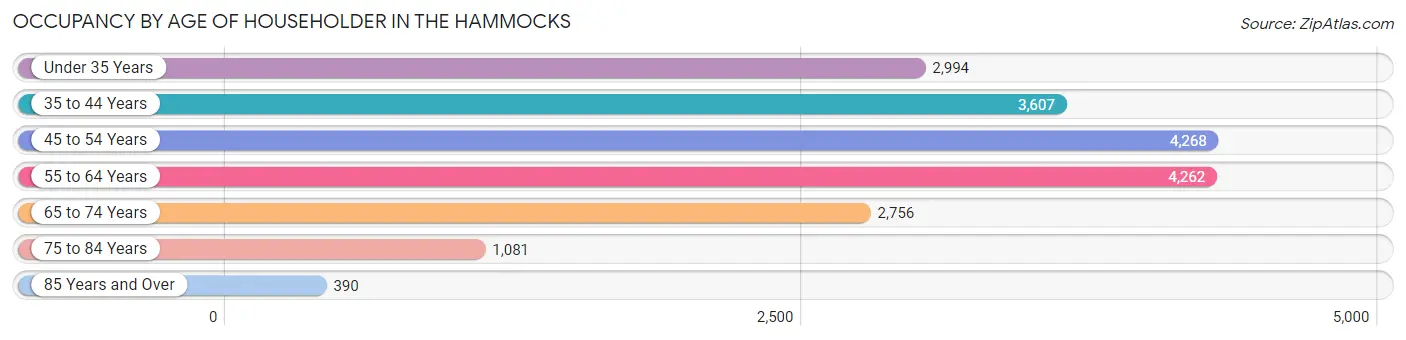
| Age Bracket | # Households | % Households |
| Under 35 Years | 2,994 | 15.5% |
| 35 to 44 Years | 3,607 | 18.6% |
| 45 to 54 Years | 4,268 | 22.1% |
| 55 to 64 Years | 4,262 | 22.0% |
| 65 to 74 Years | 2,756 | 14.2% |
| 75 to 84 Years | 1,081 | 5.6% |
| 85 Years and Over | 390 | 2.0% |
| Total | 19,358 | 100.0% |
Housing Finances in The Hammocks
Median Income by Occupancy in The Hammocks
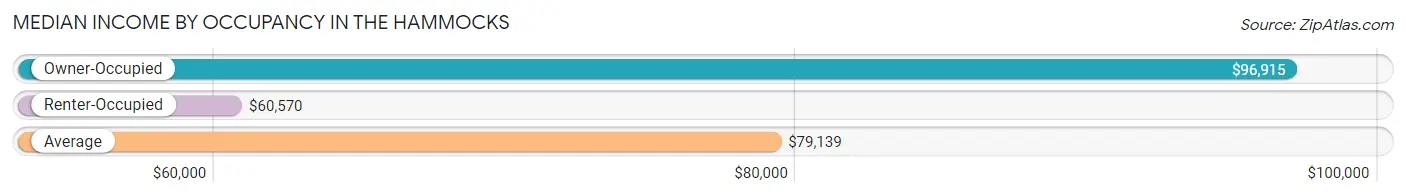
| Occupancy Type | # Households | Median Income |
| Owner-Occupied | 11,955 (61.8%) | $96,915 |
| Renter-Occupied | 7,403 (38.2%) | $60,570 |
| Average | 19,358 (100.0%) | $79,139 |
Occupancy by Householder Income Bracket in The Hammocks
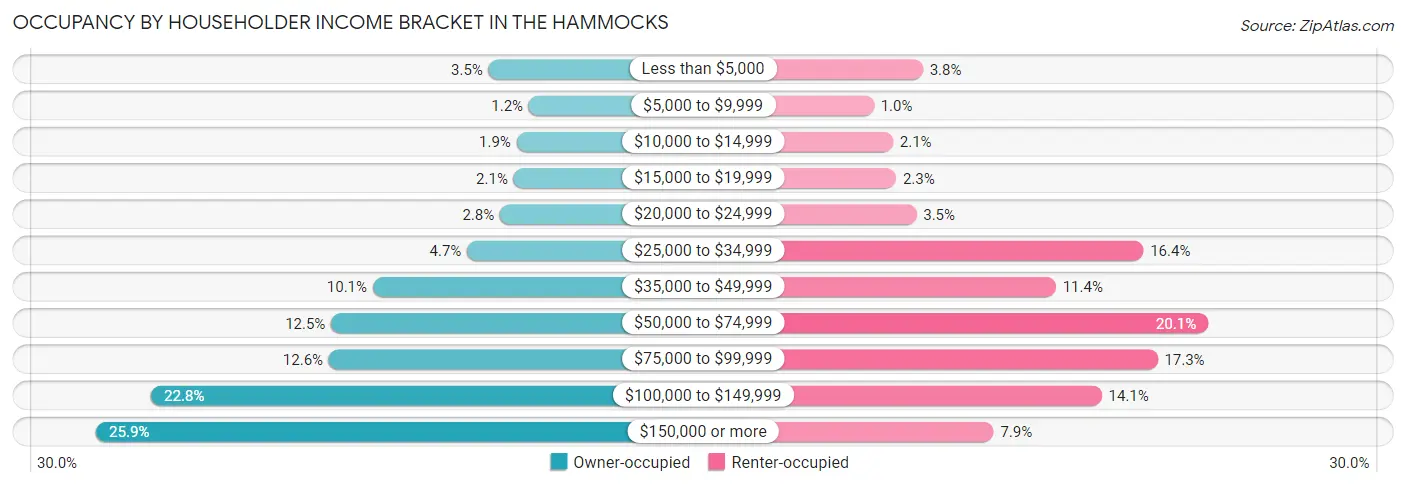
| Income Bracket | Owner-occupied | Renter-occupied |
| Less than $5,000 | 416 (3.5%) | 284 (3.8%) |
| $5,000 to $9,999 | 141 (1.2%) | 77 (1.0%) |
| $10,000 to $14,999 | 225 (1.9%) | 158 (2.1%) |
| $15,000 to $19,999 | 245 (2.1%) | 171 (2.3%) |
| $20,000 to $24,999 | 338 (2.8%) | 257 (3.5%) |
| $25,000 to $34,999 | 563 (4.7%) | 1,217 (16.4%) |
| $35,000 to $49,999 | 1,207 (10.1%) | 847 (11.4%) |
| $50,000 to $74,999 | 1,492 (12.5%) | 1,491 (20.1%) |
| $75,000 to $99,999 | 1,508 (12.6%) | 1,277 (17.2%) |
| $100,000 to $149,999 | 2,722 (22.8%) | 1,041 (14.1%) |
| $150,000 or more | 3,098 (25.9%) | 583 (7.9%) |
| Total | 11,955 (100.0%) | 7,403 (100.0%) |
Monthly Housing Cost Tiers in The Hammocks
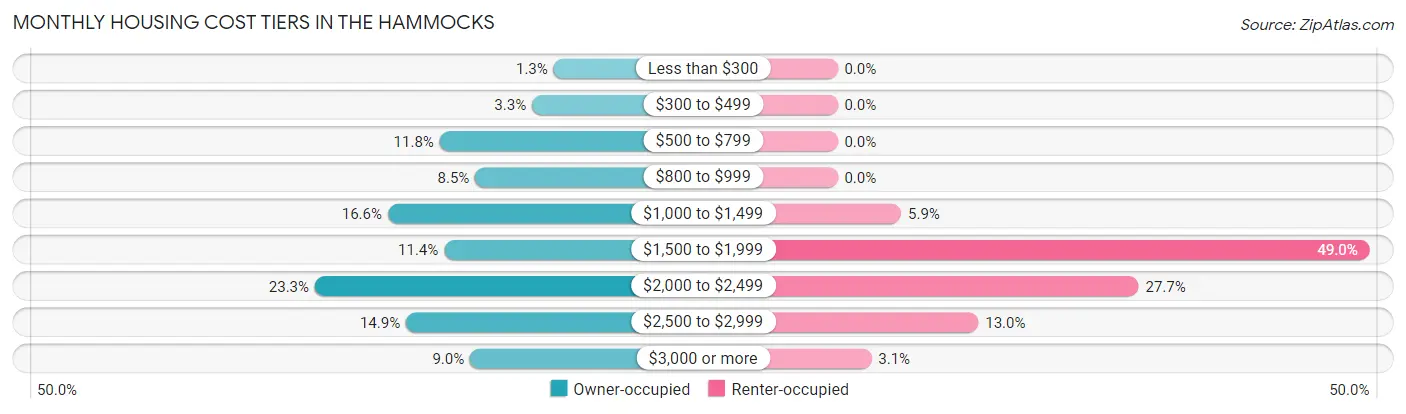
| Monthly Cost | Owner-occupied | Renter-occupied |
| Less than $300 | 156 (1.3%) | 0 (0.0%) |
| $300 to $499 | 393 (3.3%) | 0 (0.0%) |
| $500 to $799 | 1,409 (11.8%) | 0 (0.0%) |
| $800 to $999 | 1,019 (8.5%) | 0 (0.0%) |
| $1,000 to $1,499 | 1,980 (16.6%) | 434 (5.9%) |
| $1,500 to $1,999 | 1,360 (11.4%) | 3,627 (49.0%) |
| $2,000 to $2,499 | 2,783 (23.3%) | 2,052 (27.7%) |
| $2,500 to $2,999 | 1,780 (14.9%) | 960 (13.0%) |
| $3,000 or more | 1,075 (9.0%) | 231 (3.1%) |
| Total | 11,955 (100.0%) | 7,403 (100.0%) |
Physical Housing Characteristics in The Hammocks
Housing Structures in The Hammocks
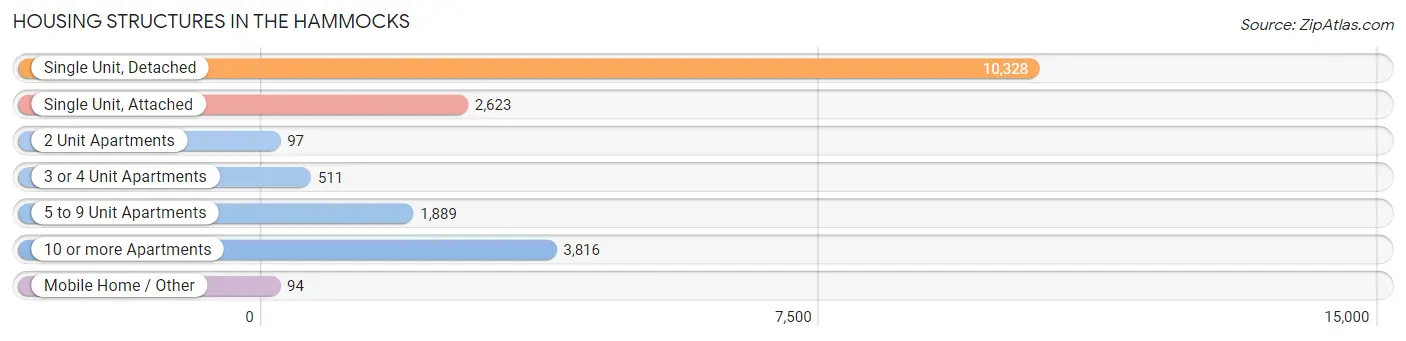
| Structure Type | # Housing Units | % Housing Units |
| Single Unit, Detached | 10,328 | 53.3% |
| Single Unit, Attached | 2,623 | 13.6% |
| 2 Unit Apartments | 97 | 0.5% |
| 3 or 4 Unit Apartments | 511 | 2.6% |
| 5 to 9 Unit Apartments | 1,889 | 9.8% |
| 10 or more Apartments | 3,816 | 19.7% |
| Mobile Home / Other | 94 | 0.5% |
| Total | 19,358 | 100.0% |
Housing Structures by Occupancy in The Hammocks
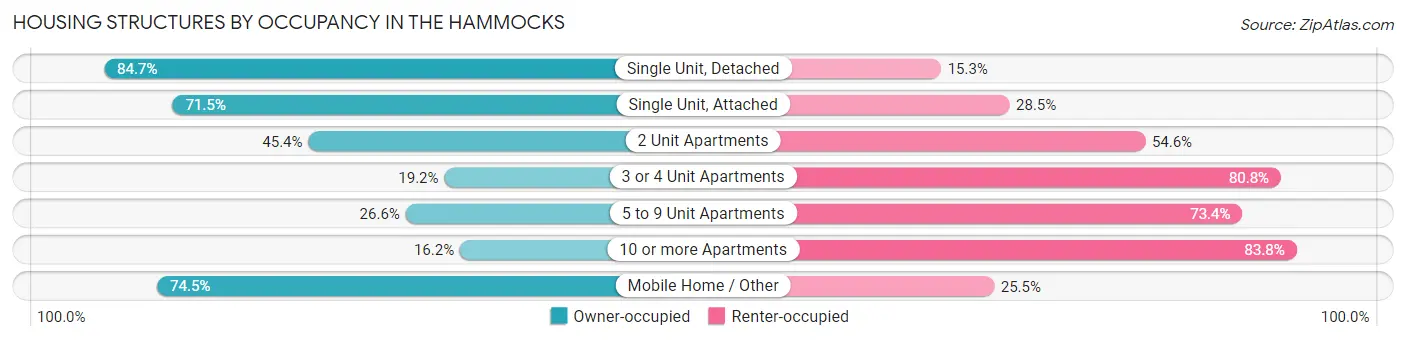
| Structure Type | Owner-occupied | Renter-occupied |
| Single Unit, Detached | 8,747 (84.7%) | 1,581 (15.3%) |
| Single Unit, Attached | 1,876 (71.5%) | 747 (28.5%) |
| 2 Unit Apartments | 44 (45.4%) | 53 (54.6%) |
| 3 or 4 Unit Apartments | 98 (19.2%) | 413 (80.8%) |
| 5 to 9 Unit Apartments | 503 (26.6%) | 1,386 (73.4%) |
| 10 or more Apartments | 617 (16.2%) | 3,199 (83.8%) |
| Mobile Home / Other | 70 (74.5%) | 24 (25.5%) |
| Total | 11,955 (61.8%) | 7,403 (38.2%) |
Housing Structures by Number of Rooms in The Hammocks
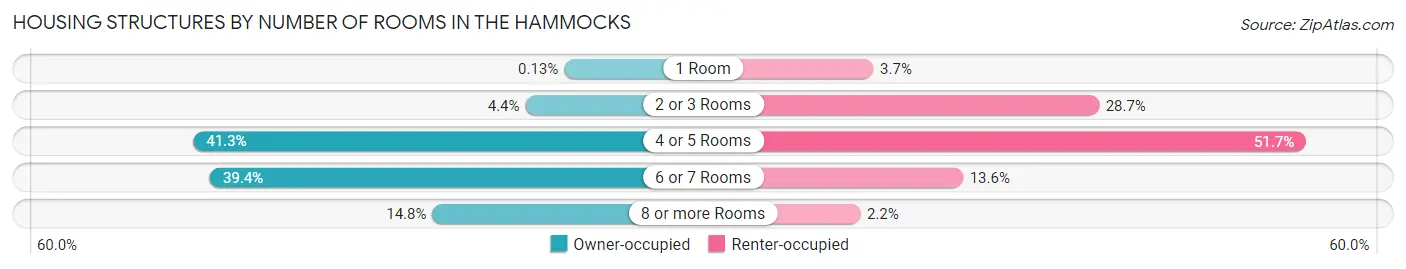
| Number of Rooms | Owner-occupied | Renter-occupied |
| 1 Room | 15 (0.1%) | 273 (3.7%) |
| 2 or 3 Rooms | 529 (4.4%) | 2,126 (28.7%) |
| 4 or 5 Rooms | 4,934 (41.3%) | 3,830 (51.7%) |
| 6 or 7 Rooms | 4,714 (39.4%) | 1,009 (13.6%) |
| 8 or more Rooms | 1,763 (14.7%) | 165 (2.2%) |
| Total | 11,955 (100.0%) | 7,403 (100.0%) |
Housing Structure by Heating Type in The Hammocks
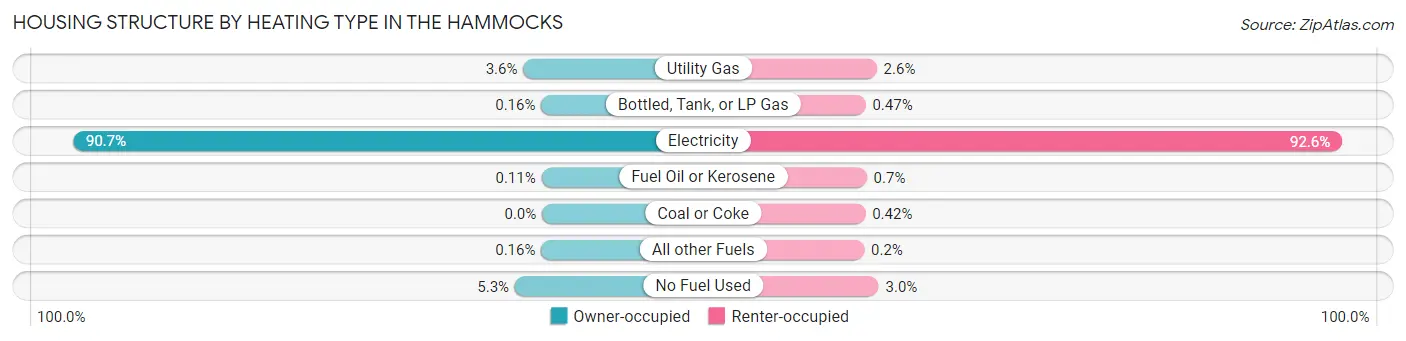
| Heating Type | Owner-occupied | Renter-occupied |
| Utility Gas | 435 (3.6%) | 195 (2.6%) |
| Bottled, Tank, or LP Gas | 19 (0.2%) | 35 (0.5%) |
| Electricity | 10,841 (90.7%) | 6,852 (92.6%) |
| Fuel Oil or Kerosene | 13 (0.1%) | 52 (0.7%) |
| Coal or Coke | 0 (0.0%) | 31 (0.4%) |
| All other Fuels | 19 (0.2%) | 15 (0.2%) |
| No Fuel Used | 628 (5.2%) | 223 (3.0%) |
| Total | 11,955 (100.0%) | 7,403 (100.0%) |
Household Vehicle Usage in The Hammocks
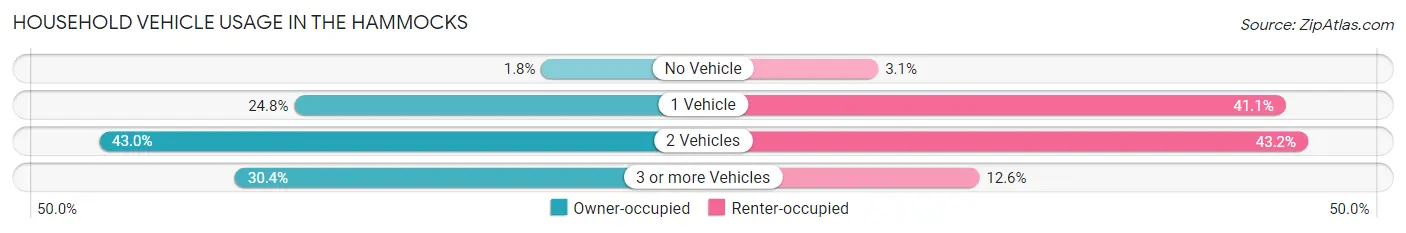
| Vehicles per Household | Owner-occupied | Renter-occupied |
| No Vehicle | 211 (1.8%) | 230 (3.1%) |
| 1 Vehicle | 2,968 (24.8%) | 3,045 (41.1%) |
| 2 Vehicles | 5,145 (43.0%) | 3,199 (43.2%) |
| 3 or more Vehicles | 3,631 (30.4%) | 929 (12.6%) |
| Total | 11,955 (100.0%) | 7,403 (100.0%) |
Real Estate & Mortgages in The Hammocks
Real Estate and Mortgage Overview in The Hammocks
| Characteristic | Without Mortgage | With Mortgage |
| Housing Units | 3,577 | 8,378 |
| Median Property Value | $394,400 | $411,100 |
| Median Household Income | $67,929 | $2,349 |
| Monthly Housing Costs | $796 | $1,049 |
| Real Estate Taxes | $3,090 | $199 |
Property Value by Mortgage Status in The Hammocks
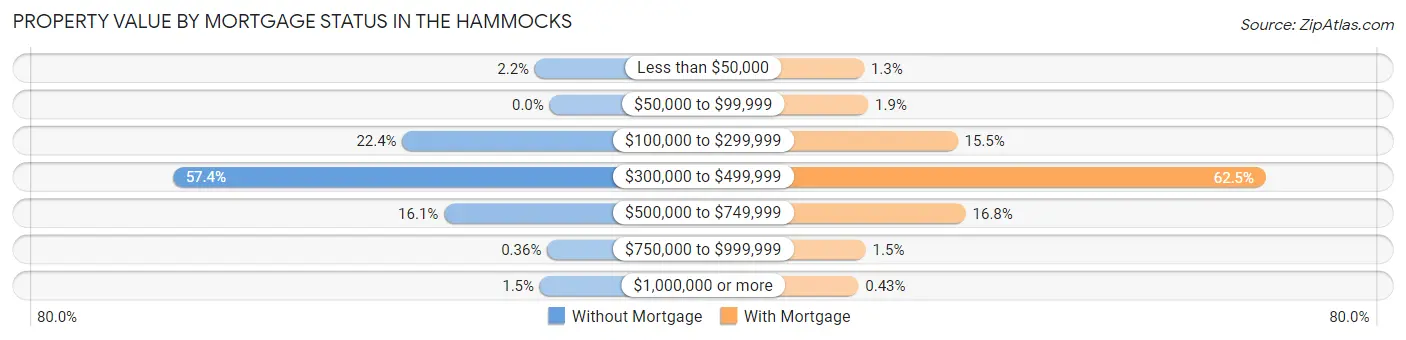
| Property Value | Without Mortgage | With Mortgage |
| Less than $50,000 | 80 (2.2%) | 107 (1.3%) |
| $50,000 to $99,999 | 0 (0.0%) | 161 (1.9%) |
| $100,000 to $299,999 | 802 (22.4%) | 1,302 (15.5%) |
| $300,000 to $499,999 | 2,054 (57.4%) | 5,238 (62.5%) |
| $500,000 to $749,999 | 575 (16.1%) | 1,405 (16.8%) |
| $750,000 to $999,999 | 13 (0.4%) | 129 (1.5%) |
| $1,000,000 or more | 53 (1.5%) | 36 (0.4%) |
| Total | 3,577 (100.0%) | 8,378 (100.0%) |
Household Income by Mortgage Status in The Hammocks
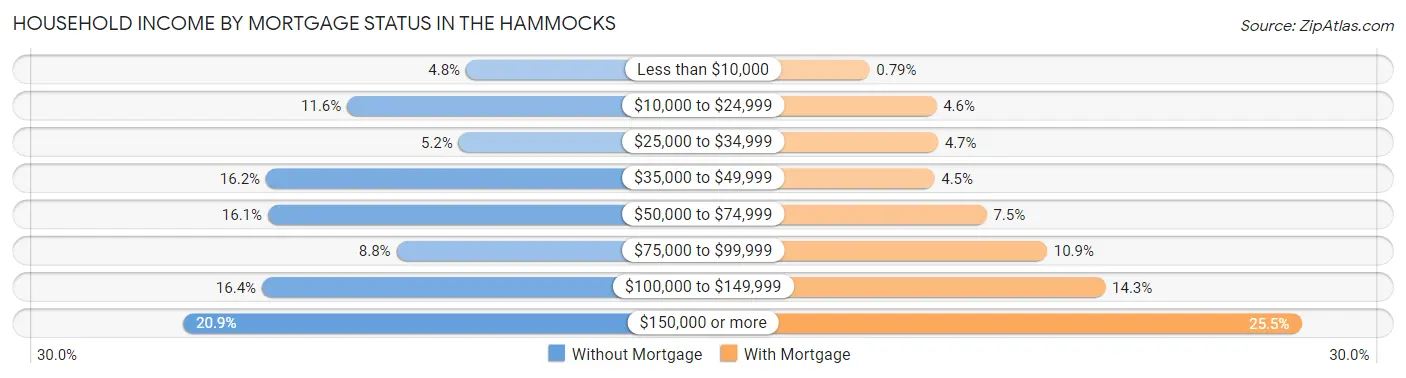
| Household Income | Without Mortgage | With Mortgage |
| Less than $10,000 | 171 (4.8%) | 66 (0.8%) |
| $10,000 to $24,999 | 414 (11.6%) | 386 (4.6%) |
| $25,000 to $34,999 | 186 (5.2%) | 394 (4.7%) |
| $35,000 to $49,999 | 580 (16.2%) | 377 (4.5%) |
| $50,000 to $74,999 | 576 (16.1%) | 627 (7.5%) |
| $75,000 to $99,999 | 313 (8.7%) | 916 (10.9%) |
| $100,000 to $149,999 | 588 (16.4%) | 1,195 (14.3%) |
| $150,000 or more | 749 (20.9%) | 2,134 (25.5%) |
| Total | 3,577 (100.0%) | 8,378 (100.0%) |
Property Value to Household Income Ratio in The Hammocks
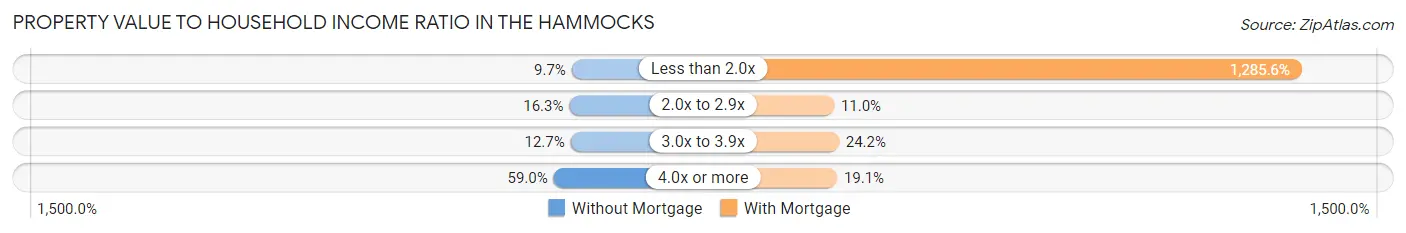
| Value-to-Income Ratio | Without Mortgage | With Mortgage |
| Less than 2.0x | 347 (9.7%) | 107,705 (1,285.6%) |
| 2.0x to 2.9x | 582 (16.3%) | 921 (11.0%) |
| 3.0x to 3.9x | 455 (12.7%) | 2,024 (24.2%) |
| 4.0x or more | 2,110 (59.0%) | 1,601 (19.1%) |
| Total | 3,577 (100.0%) | 8,378 (100.0%) |
Real Estate Taxes by Mortgage Status in The Hammocks
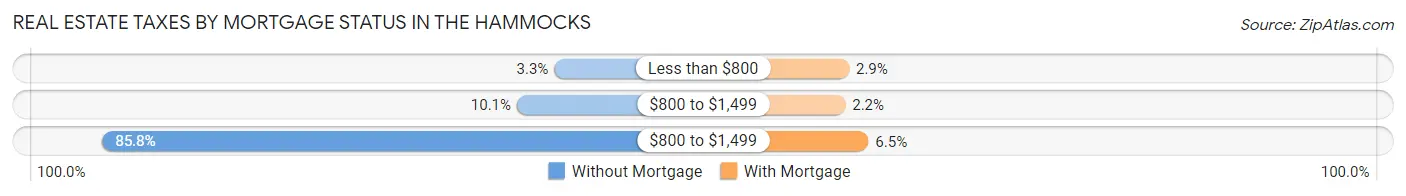
| Property Taxes | Without Mortgage | With Mortgage |
| Less than $800 | 117 (3.3%) | 245 (2.9%) |
| $800 to $1,499 | 361 (10.1%) | 187 (2.2%) |
| $800 to $1,499 | 3,069 (85.8%) | 541 (6.5%) |
| Total | 3,577 (100.0%) | 8,378 (100.0%) |
Health & Disability in The Hammocks
Health Insurance Coverage by Age in The Hammocks
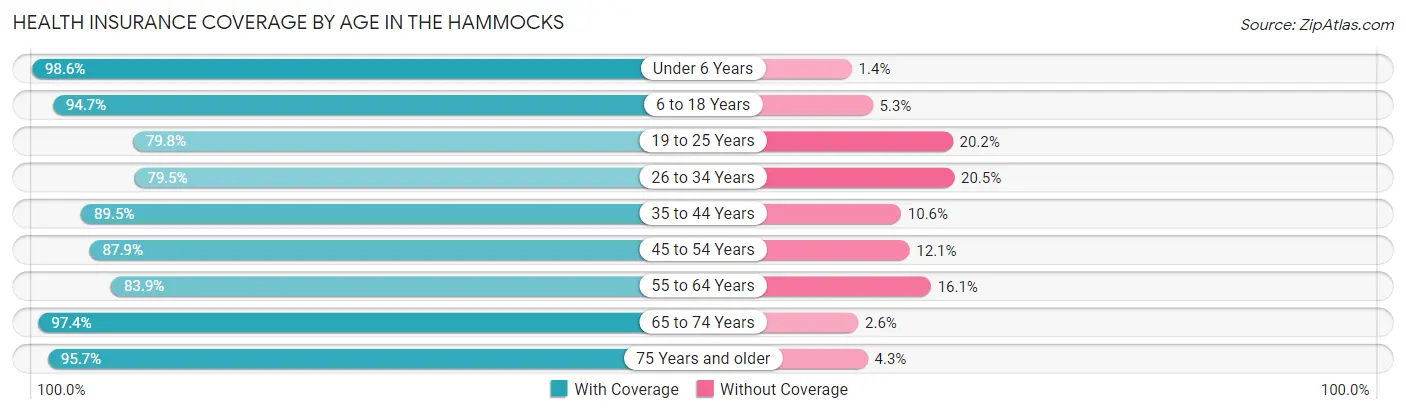
| Age Bracket | With Coverage | Without Coverage |
| Under 6 Years | 3,757 (98.6%) | 52 (1.4%) |
| 6 to 18 Years | 9,212 (94.7%) | 514 (5.3%) |
| 19 to 25 Years | 3,856 (79.8%) | 975 (20.2%) |
| 26 to 34 Years | 5,559 (79.5%) | 1,430 (20.5%) |
| 35 to 44 Years | 7,098 (89.4%) | 837 (10.5%) |
| 45 to 54 Years | 7,899 (87.9%) | 1,090 (12.1%) |
| 55 to 64 Years | 6,721 (83.9%) | 1,291 (16.1%) |
| 65 to 74 Years | 5,299 (97.4%) | 140 (2.6%) |
| 75 Years and older | 3,751 (95.7%) | 170 (4.3%) |
| Total | 53,152 (89.1%) | 6,499 (10.9%) |
Health Insurance Coverage by Citizenship Status in The Hammocks
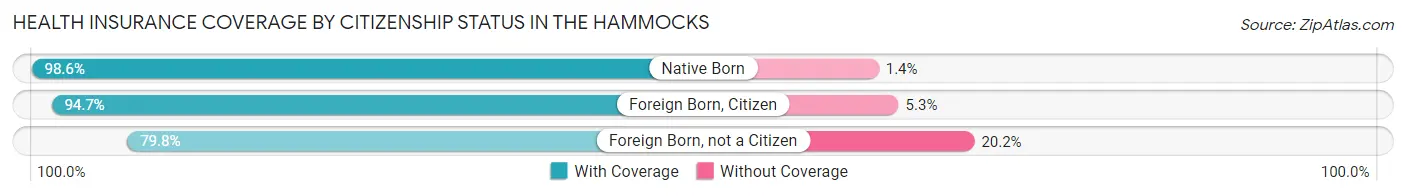
| Citizenship Status | With Coverage | Without Coverage |
| Native Born | 3,757 (98.6%) | 52 (1.4%) |
| Foreign Born, Citizen | 9,212 (94.7%) | 514 (5.3%) |
| Foreign Born, not a Citizen | 3,856 (79.8%) | 975 (20.2%) |
Health Insurance Coverage by Household Income in The Hammocks
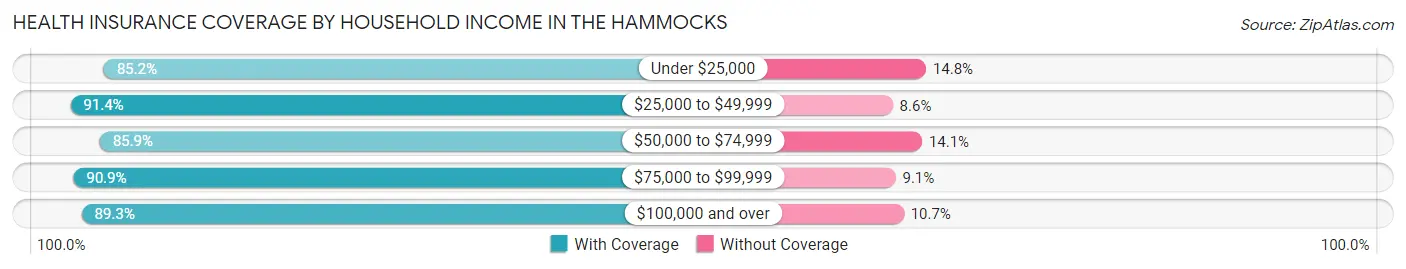
| Household Income | With Coverage | Without Coverage |
| Under $25,000 | 4,099 (85.2%) | 714 (14.8%) |
| $25,000 to $49,999 | 9,552 (91.4%) | 898 (8.6%) |
| $50,000 to $74,999 | 7,240 (85.9%) | 1,186 (14.1%) |
| $75,000 to $99,999 | 8,261 (90.9%) | 830 (9.1%) |
| $100,000 and over | 23,882 (89.3%) | 2,851 (10.7%) |
Public vs Private Health Insurance Coverage by Age in The Hammocks
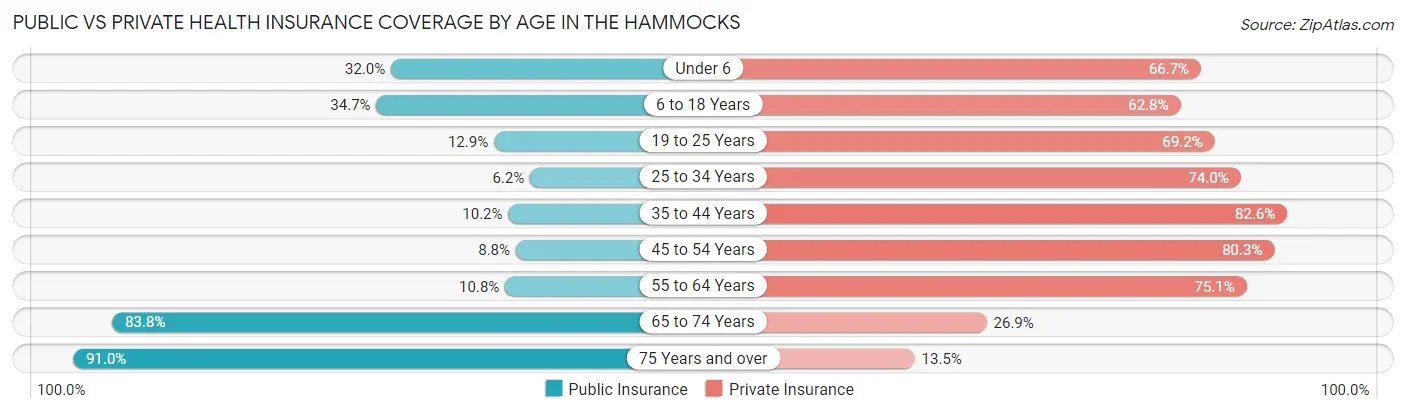
| Age Bracket | Public Insurance | Private Insurance |
| Under 6 | 1,218 (32.0%) | 2,539 (66.7%) |
| 6 to 18 Years | 3,375 (34.7%) | 6,112 (62.8%) |
| 19 to 25 Years | 622 (12.9%) | 3,342 (69.2%) |
| 25 to 34 Years | 432 (6.2%) | 5,174 (74.0%) |
| 35 to 44 Years | 810 (10.2%) | 6,557 (82.6%) |
| 45 to 54 Years | 792 (8.8%) | 7,215 (80.3%) |
| 55 to 64 Years | 865 (10.8%) | 6,019 (75.1%) |
| 65 to 74 Years | 4,556 (83.8%) | 1,462 (26.9%) |
| 75 Years and over | 3,569 (91.0%) | 530 (13.5%) |
| Total | 16,239 (27.2%) | 38,950 (65.3%) |
Disability Status by Sex by Age in The Hammocks
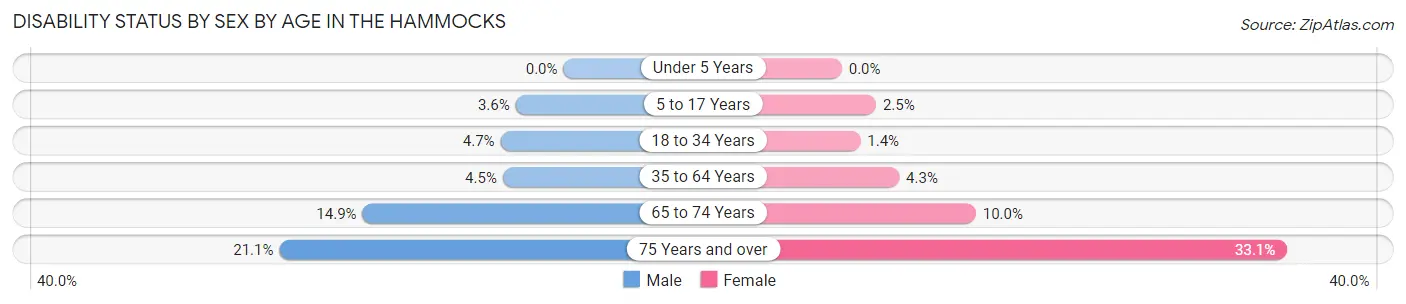
| Age Bracket | Male | Female |
| Under 5 Years | 0 (0.0%) | 0 (0.0%) |
| 5 to 17 Years | 182 (3.5%) | 126 (2.5%) |
| 18 to 34 Years | 313 (4.7%) | 79 (1.4%) |
| 35 to 64 Years | 530 (4.5%) | 561 (4.3%) |
| 65 to 74 Years | 348 (14.9%) | 309 (10.0%) |
| 75 Years and over | 330 (21.1%) | 779 (33.1%) |
Disability Class by Sex by Age in The Hammocks
Disability Class: Hearing Difficulty
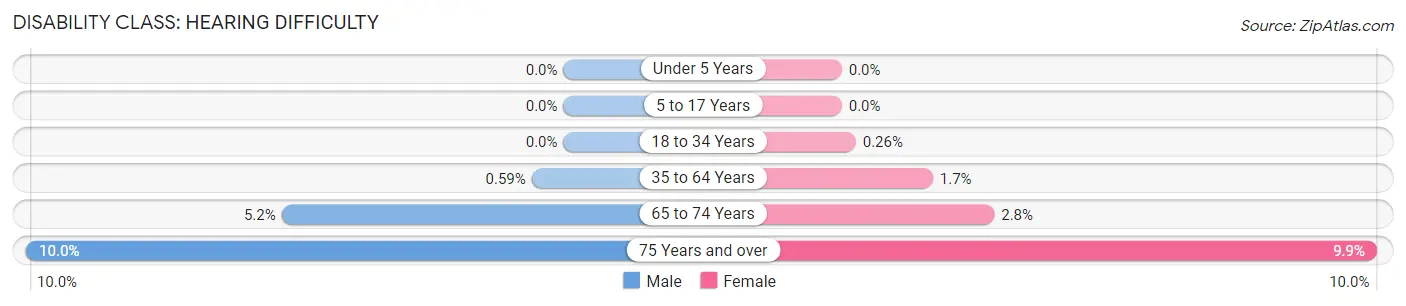
| Age Bracket | Male | Female |
| Under 5 Years | 0 (0.0%) | 0 (0.0%) |
| 5 to 17 Years | 0 (0.0%) | 0 (0.0%) |
| 18 to 34 Years | 0 (0.0%) | 15 (0.3%) |
| 35 to 64 Years | 69 (0.6%) | 223 (1.7%) |
| 65 to 74 Years | 122 (5.2%) | 88 (2.8%) |
| 75 Years and over | 156 (10.0%) | 234 (9.9%) |
Disability Class: Vision Difficulty
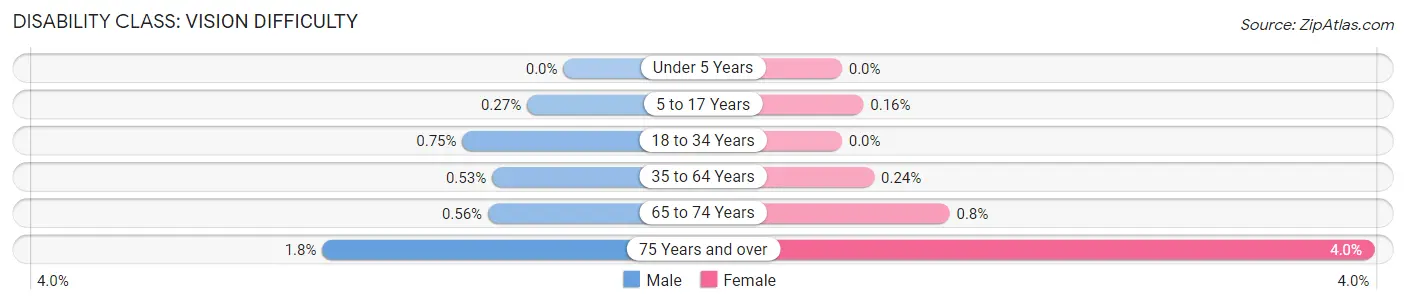
| Age Bracket | Male | Female |
| Under 5 Years | 0 (0.0%) | 0 (0.0%) |
| 5 to 17 Years | 14 (0.3%) | 8 (0.2%) |
| 18 to 34 Years | 50 (0.7%) | 0 (0.0%) |
| 35 to 64 Years | 62 (0.5%) | 32 (0.2%) |
| 65 to 74 Years | 13 (0.6%) | 25 (0.8%) |
| 75 Years and over | 28 (1.8%) | 93 (4.0%) |
Disability Class: Cognitive Difficulty
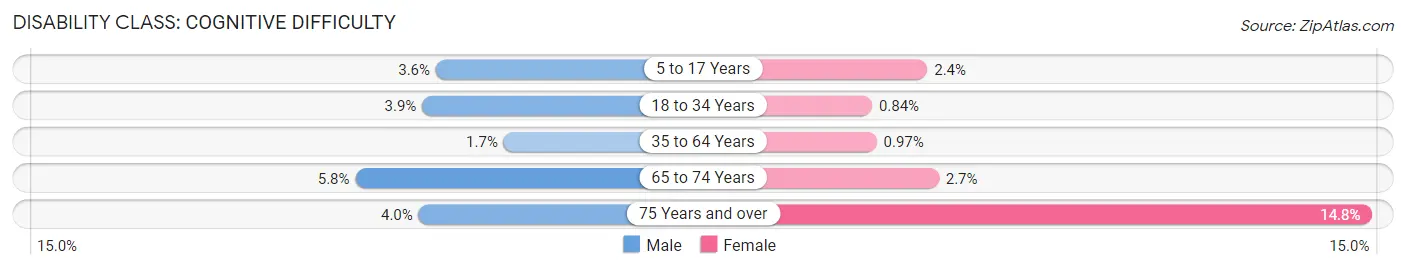
| Age Bracket | Male | Female |
| 5 to 17 Years | 182 (3.5%) | 118 (2.4%) |
| 18 to 34 Years | 263 (3.9%) | 48 (0.8%) |
| 35 to 64 Years | 195 (1.7%) | 128 (1.0%) |
| 65 to 74 Years | 135 (5.8%) | 84 (2.7%) |
| 75 Years and over | 63 (4.0%) | 348 (14.8%) |
Disability Class: Ambulatory Difficulty
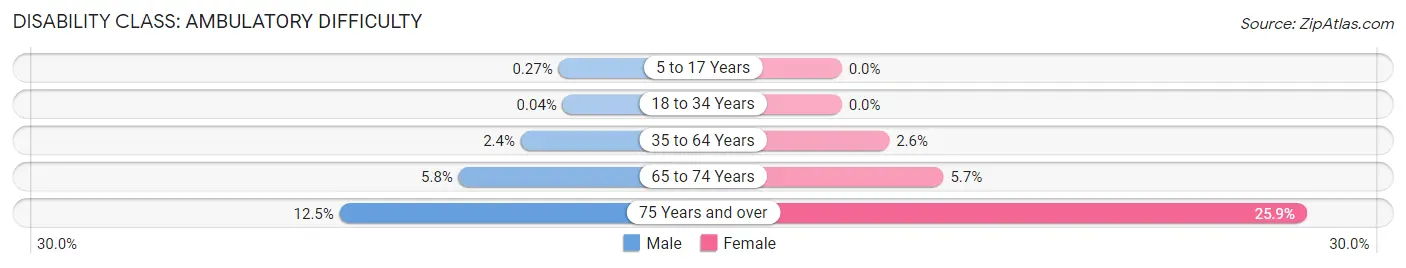
| Age Bracket | Male | Female |
| 5 to 17 Years | 14 (0.3%) | 0 (0.0%) |
| 18 to 34 Years | 3 (0.0%) | 0 (0.0%) |
| 35 to 64 Years | 279 (2.4%) | 347 (2.6%) |
| 65 to 74 Years | 136 (5.8%) | 176 (5.7%) |
| 75 Years and over | 195 (12.5%) | 610 (25.9%) |
Disability Class: Self-Care Difficulty
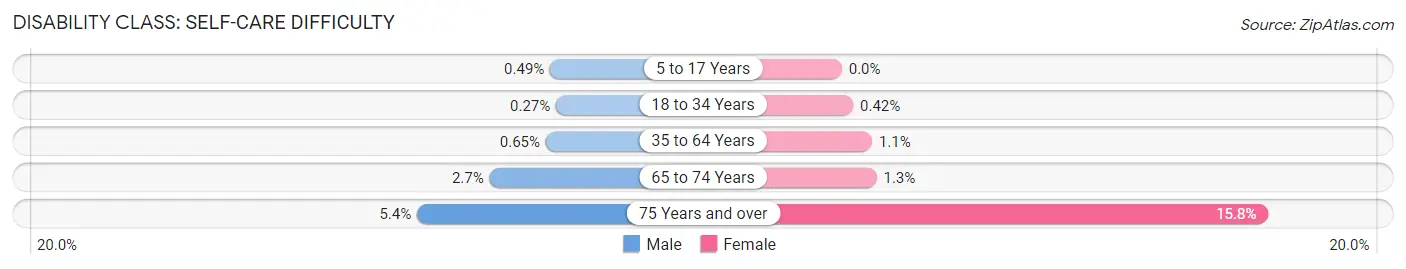
| Age Bracket | Male | Female |
| 5 to 17 Years | 25 (0.5%) | 0 (0.0%) |
| 18 to 34 Years | 18 (0.3%) | 24 (0.4%) |
| 35 to 64 Years | 76 (0.6%) | 148 (1.1%) |
| 65 to 74 Years | 64 (2.7%) | 40 (1.3%) |
| 75 Years and over | 85 (5.4%) | 373 (15.8%) |
Technology Access in The Hammocks
Computing Device Access in The Hammocks
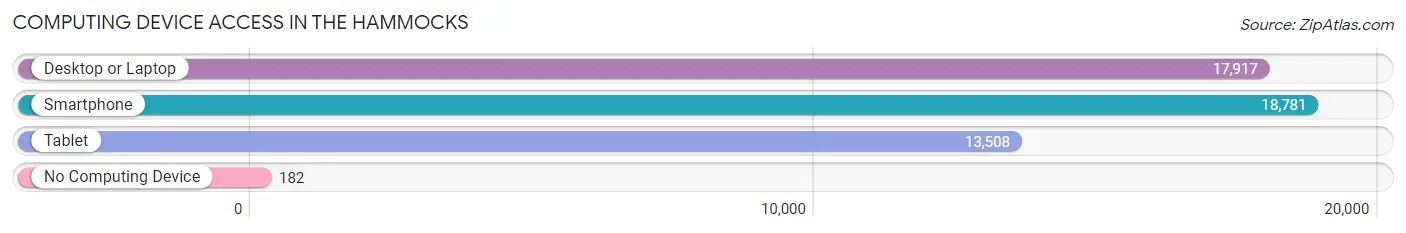
| Device Type | # Households | % Households |
| Desktop or Laptop | 17,917 | 92.6% |
| Smartphone | 18,781 | 97.0% |
| Tablet | 13,508 | 69.8% |
| No Computing Device | 182 | 0.9% |
| Total | 19,358 | 100.0% |
Internet Access in The Hammocks
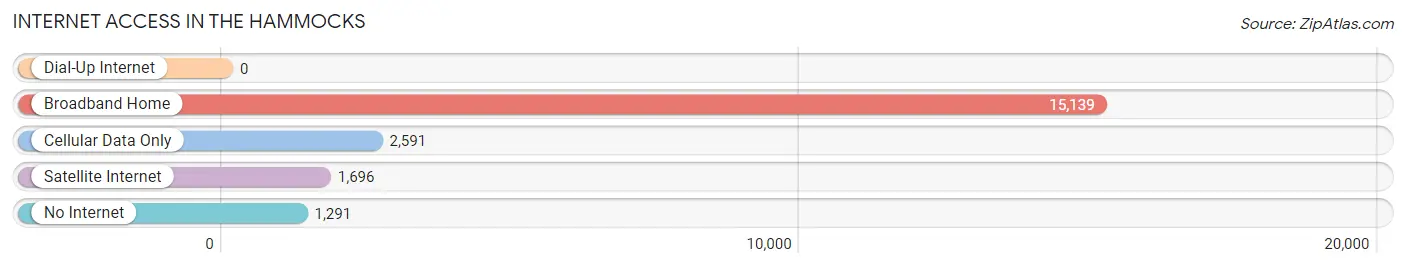
| Internet Type | # Households | % Households |
| Dial-Up Internet | 0 | 0.0% |
| Broadband Home | 15,139 | 78.2% |
| Cellular Data Only | 2,591 | 13.4% |
| Satellite Internet | 1,696 | 8.8% |
| No Internet | 1,291 | 6.7% |
| Total | 19,358 | 100.0% |
The Hammocks Summary
The Hammocks is a census-designated place (CDP) located in Miami-Dade County, Florida, United States. The population was 24,735 at the 2010 census. The Hammocks is located in the western part of the county, near the Everglades.
History
The Hammocks was originally inhabited by the Tequesta Indians, who were the first Native American tribe to inhabit the area. The Tequesta Indians were a peaceful tribe that lived off the land and were known for their fishing and hunting skills. The Tequesta Indians were eventually displaced by the Seminole Indians, who were forced to move to the area after being pushed out of their original homelands in Georgia and Alabama. The Seminole Indians were known for their fierce resistance to the United States government and their refusal to be relocated to reservations.
The area that is now The Hammocks was first settled by non-Native Americans in the late 19th century. The first settlers were farmers who grew crops such as tomatoes, beans, and squash. The area was also known for its citrus groves and was home to several small farms.
In the early 20th century, the area began to develop as a residential community. The first homes were built in the 1920s and 1930s, and the area continued to grow throughout the 1940s and 1950s. By the 1960s, The Hammocks had become a popular destination for families looking for a suburban lifestyle.
Geography
The Hammocks is located at 25°41'25" North, 80°25'45" West (25.6903, -80.4292). It is bordered by the cities of Miami and Kendall to the east, West Kendall to the west, and the Everglades to the south. The Hammocks is located in the western part of Miami-Dade County, near the Everglades.
The Hammocks has a total area of 8.3 square miles, of which 8.2 square miles is land and 0.1 square miles is water. The terrain is mostly flat, with some areas of higher elevation. The highest point in The Hammocks is approximately 20 feet above sea level.
Economy
The Hammocks is primarily a residential community, with most of its residents employed in the nearby cities of Miami and Kendall. The area is home to several small businesses, including restaurants, retail stores, and professional services. The Hammocks is also home to several corporate offices, including those of Burger King, Ryder, and Ryder Logistics.
Demographics
As of the 2010 census, The Hammocks had a population of 24,735. The racial makeup of The Hammocks was 68.3% White, 16.2% African American, 0.3% Native American, 5.2% Asian, 0.1% Pacific Islander, 6.2% from other races, and 3.7% from two or more races. Hispanic or Latino of any race were 33.2% of the population.
The median household income in The Hammocks was $50,945, and the median family income was $54,945. The per capita income for The Hammocks was $25,945. About 11.2% of families and 13.2% of the population were below the poverty line, including 17.2% of those under age 18 and 8.2% of those age 65 or over.
Conclusion
The Hammocks is a census-designated place located in Miami-Dade County, Florida. The area was originally inhabited by the Tequesta Indians, and later by the Seminole Indians. The area was first settled by non-Native Americans in the late 19th century, and has since grown into a popular residential community. The Hammocks has a total area of 8.3 square miles, and is primarily a residential community, with most of its residents employed in the nearby cities of Miami and Kendall. As of the 2010 census, The Hammocks had a population of 24,735, with a median household income of $50,945.
Common Questions
What is Per Capita Income in The Hammocks?
Per Capita income in The Hammocks is $31,594.
What is the Median Family Income in The Hammocks?
Median Family Income in The Hammocks is $85,022.
What is the Median Household income in The Hammocks?
Median Household Income in The Hammocks is $79,139.
What is Income or Wage Gap in The Hammocks?
Income or Wage Gap in The Hammocks is 23.2%.
Women in The Hammocks earn 76.8 cents for every dollar earned by a man.
What is Family Income Deficit in The Hammocks?
Family Income Deficit in The Hammocks is $10,018.
Families that are below poverty line in The Hammocks earn $10,018 less on average than the poverty threshold level.
What is Inequality or Gini Index in The Hammocks?
Inequality or Gini Index in The Hammocks is 0.41.
What is the Total Population of The Hammocks?
Total Population of The Hammocks is 59,843.
What is the Total Male Population of The Hammocks?
Total Male Population of The Hammocks is 29,338.
What is the Total Female Population of The Hammocks?
Total Female Population of The Hammocks is 30,505.
What is the Ratio of Males per 100 Females in The Hammocks?
There are 96.17 Males per 100 Females in The Hammocks.
What is the Ratio of Females per 100 Males in The Hammocks?
There are 103.98 Females per 100 Males in The Hammocks.
What is the Median Population Age in The Hammocks?
Median Population Age in The Hammocks is 41.1 Years.
What is the Average Family Size in The Hammocks
Average Family Size in The Hammocks is 3.4 People.
What is the Average Household Size in The Hammocks
Average Household Size in The Hammocks is 3.1 People.
How Large is the Labor Force in The Hammocks?
There are 30,788 People in the Labor Forcein in The Hammocks.
What is the Percentage of People in the Labor Force in The Hammocks?
63.1% of People are in the Labor Force in The Hammocks.
What is the Unemployment Rate in The Hammocks?
Unemployment Rate in The Hammocks is 3.3%.