Quintana, TX Map & Demographics
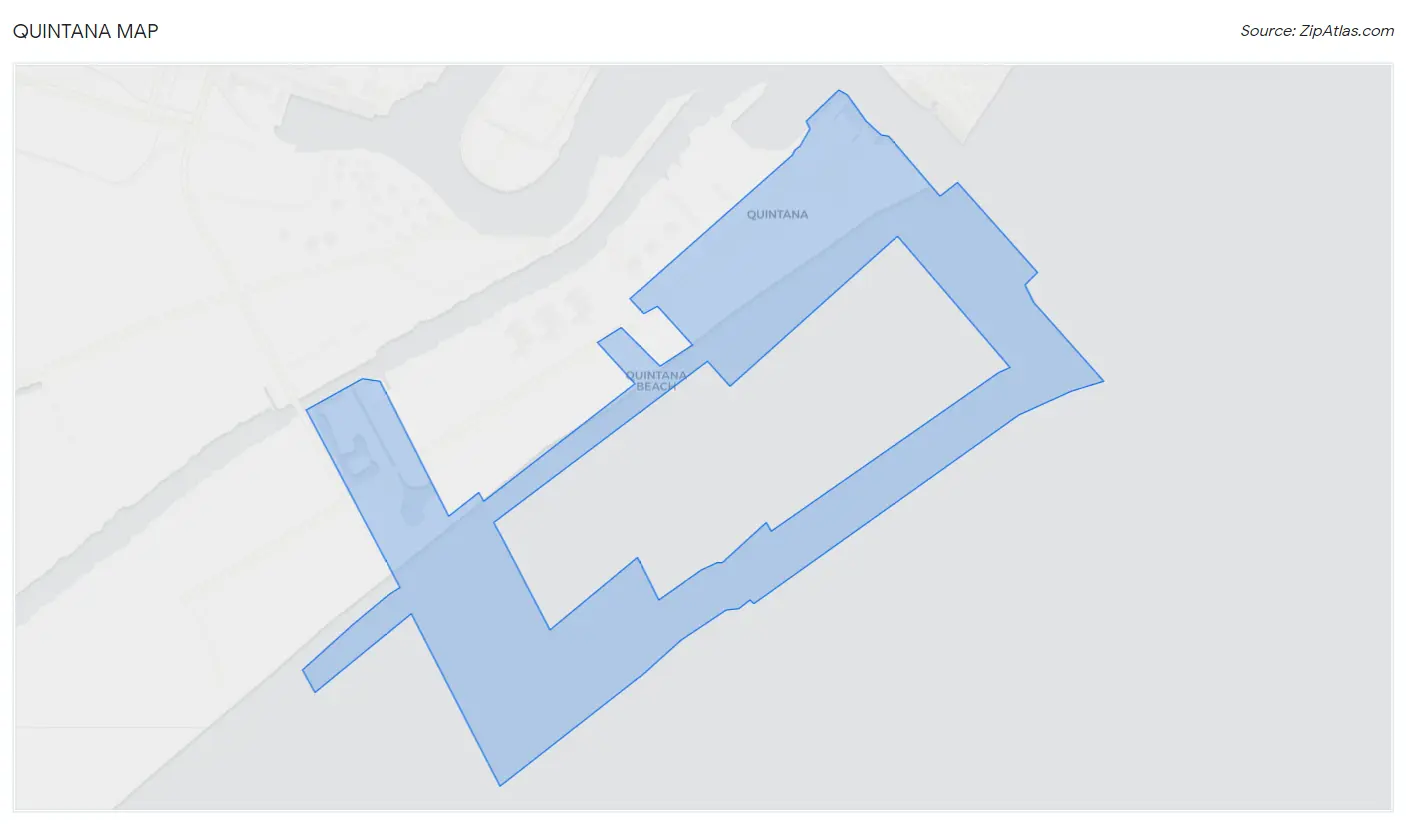
Quintana Map
Quintana Overview
$185,624
PER CAPITA INCOME
0.60
INEQUALITY / GINI INDEX
41
TOTAL POPULATION
29
MALE POPULATION
12
FEMALE POPULATION
241.67
MALES / 100 FEMALES
41.38
FEMALES / 100 MALES
58.8
MEDIAN AGE
2.3
AVG FAMILY SIZE
1.4
AVG HOUSEHOLD SIZE
33
LABOR FORCE [ PEOPLE ]
86.8%
PERCENT IN LABOR FORCE
Quintana Area Codes
Income in Quintana
Income Overview in Quintana
| Characteristic | Number | Measure |
| Per Capita Income | 41 | $185,624 |
| Median Family Income | 9 | $0 |
| Mean Family Income | 9 | $511,589 |
| Median Household Income | 29 | $0 |
| Mean Household Income | 29 | $250,593 |
| Income Deficit | 9 | $0 |
| Wage / Income Gap (%) | 41 | 0.00% |
| Wage / Income Gap ($) | 41 | 100.00¢ per $1 |
| Gini / Inequality Index | 41 | 0.60 |
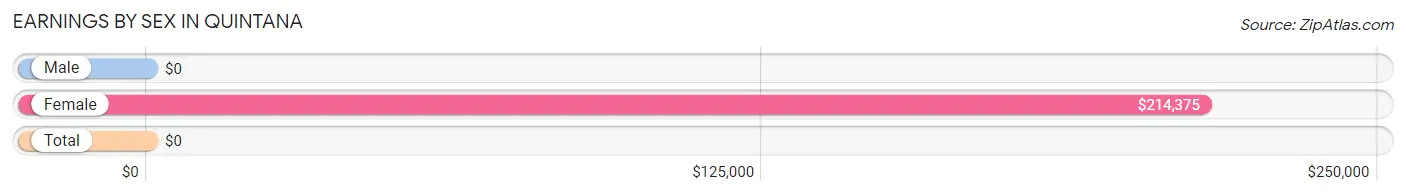
Earnings by Sex in Quintana
| Sex | Number | Average Earnings |
| Male | 26 (78.8%) | $0 |
| Female | 7 (21.2%) | $214,375 |
| Total | 33 (100.0%) | $0 |
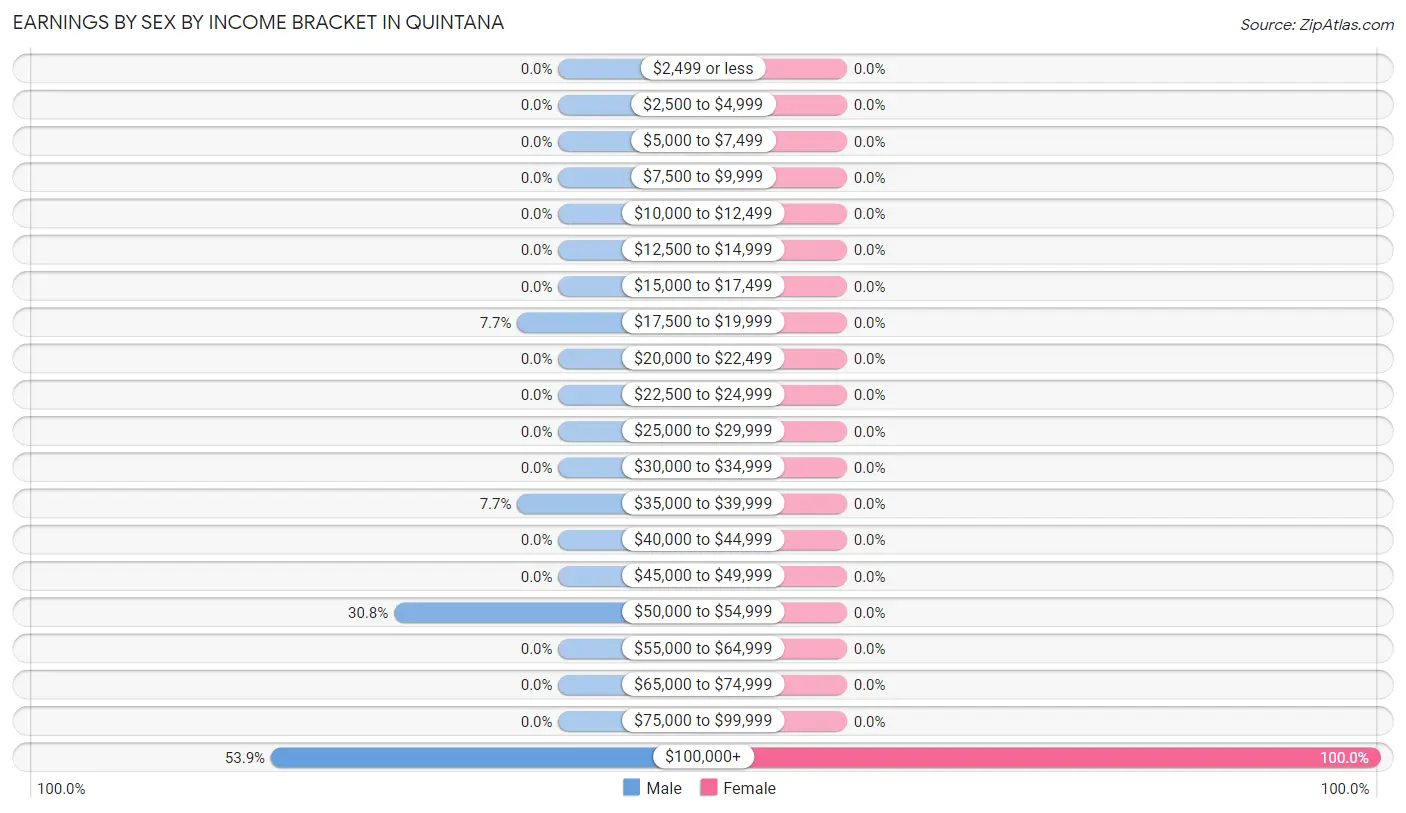
Earnings by Sex by Income Bracket in Quintana
The most common earnings brackets in Quintana are $100,000+ for men (14 | 53.8%) and $100,000+ for women (7 | 100.0%).
| Income | Male | Female |
| $2,499 or less | 0 (0.0%) | 0 (0.0%) |
| $2,500 to $4,999 | 0 (0.0%) | 0 (0.0%) |
| $5,000 to $7,499 | 0 (0.0%) | 0 (0.0%) |
| $7,500 to $9,999 | 0 (0.0%) | 0 (0.0%) |
| $10,000 to $12,499 | 0 (0.0%) | 0 (0.0%) |
| $12,500 to $14,999 | 0 (0.0%) | 0 (0.0%) |
| $15,000 to $17,499 | 0 (0.0%) | 0 (0.0%) |
| $17,500 to $19,999 | 2 (7.7%) | 0 (0.0%) |
| $20,000 to $22,499 | 0 (0.0%) | 0 (0.0%) |
| $22,500 to $24,999 | 0 (0.0%) | 0 (0.0%) |
| $25,000 to $29,999 | 0 (0.0%) | 0 (0.0%) |
| $30,000 to $34,999 | 0 (0.0%) | 0 (0.0%) |
| $35,000 to $39,999 | 2 (7.7%) | 0 (0.0%) |
| $40,000 to $44,999 | 0 (0.0%) | 0 (0.0%) |
| $45,000 to $49,999 | 0 (0.0%) | 0 (0.0%) |
| $50,000 to $54,999 | 8 (30.8%) | 0 (0.0%) |
| $55,000 to $64,999 | 0 (0.0%) | 0 (0.0%) |
| $65,000 to $74,999 | 0 (0.0%) | 0 (0.0%) |
| $75,000 to $99,999 | 0 (0.0%) | 0 (0.0%) |
| $100,000+ | 14 (53.8%) | 7 (100.0%) |
| Total | 26 (100.0%) | 7 (100.0%) |
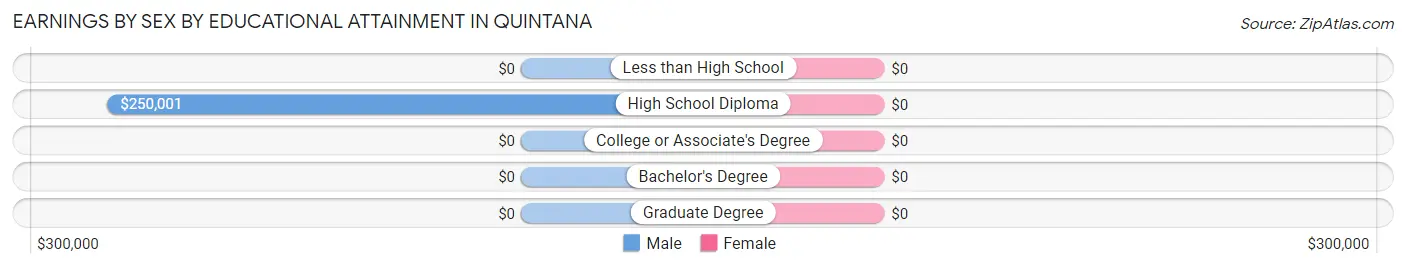
Earnings by Sex by Educational Attainment in Quintana
| Educational Attainment | Male Income | Female Income |
| Less than High School | - | - |
| High School Diploma | $250,001 | $0 |
| College or Associate's Degree | - | - |
| Bachelor's Degree | - | - |
| Graduate Degree | - | - |
| Total | - | - |
Family Income in Quintana
Family Income Brackets in Quintana
According to the Quintana family income data, there are 4 families falling into the $200,000+ income range, which is the most common income bracket and makes up 44.4% of all families.
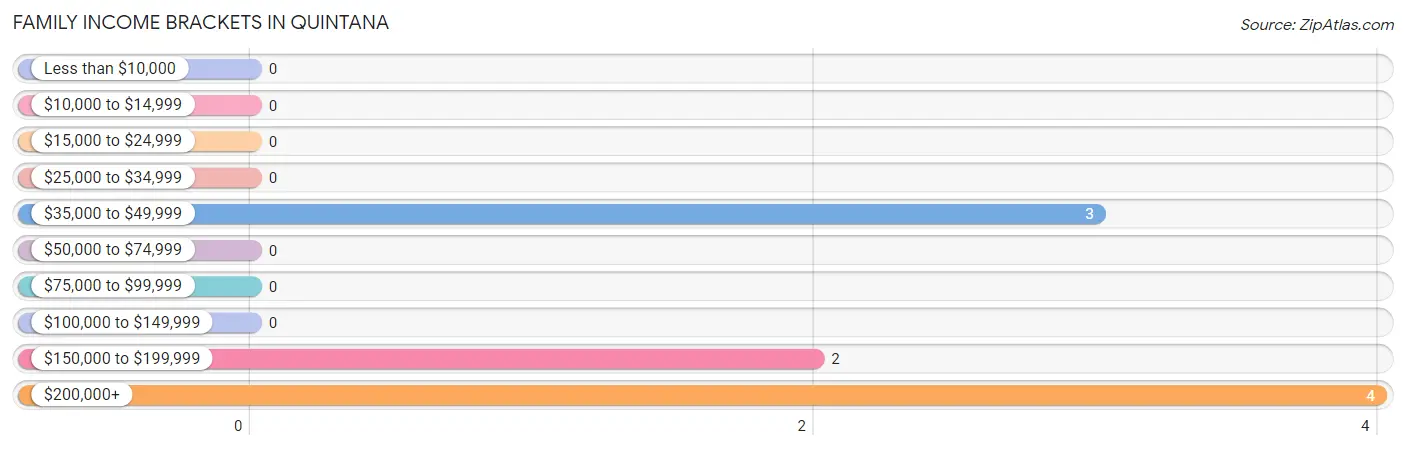
| Income Bracket | # Families | % Families |
| Less than $10,000 | 0 | 0.0% |
| $10,000 to $14,999 | 0 | 0.0% |
| $15,000 to $24,999 | 0 | 0.0% |
| $25,000 to $34,999 | 0 | 0.0% |
| $35,000 to $49,999 | 3 | 33.3% |
| $50,000 to $74,999 | 0 | 0.0% |
| $75,000 to $99,999 | 0 | 0.0% |
| $100,000 to $149,999 | 0 | 0.0% |
| $150,000 to $199,999 | 2 | 22.2% |
| $200,000+ | 4 | 44.4% |
Family Income by Famaliy Size in Quintana
2-person families (7 | 77.8%) account for the highest median family income in Quintana with $250,001 per family, while 2-person families (7 | 77.8%) have the highest median income of $125,000 per family member.
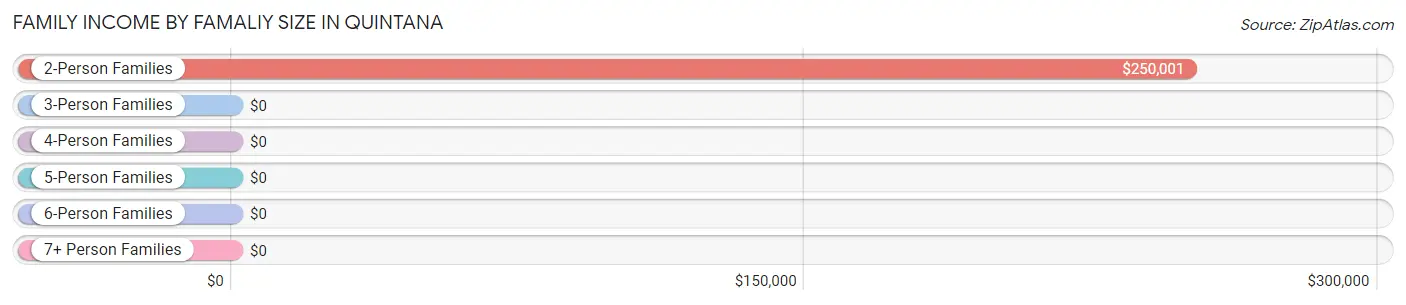
| Income Bracket | # Families | Median Income |
| 2-Person Families | 7 (77.8%) | $250,001 |
| 3-Person Families | 2 (22.2%) | $0 |
| 4-Person Families | 0 (0.0%) | $0 |
| 5-Person Families | 0 (0.0%) | $0 |
| 6-Person Families | 0 (0.0%) | $0 |
| 7+ Person Families | 0 (0.0%) | $0 |
| Total | 9 (100.0%) | $0 |
Family Income by Number of Earners in Quintana
| Number of Earners | # Families | Median Income |
| No Earners | 0 (0.0%) | $0 |
| 1 Earner | 5 (55.6%) | $0 |
| 2 Earners | 4 (44.4%) | $0 |
| 3+ Earners | 0 (0.0%) | $0 |
| Total | 9 (100.0%) | $0 |
Household Income in Quintana
Household Income Brackets in Quintana
With 10 households falling in the category, the $200,000+ income range is the most frequent in Quintana, accounting for 34.5% of all households.
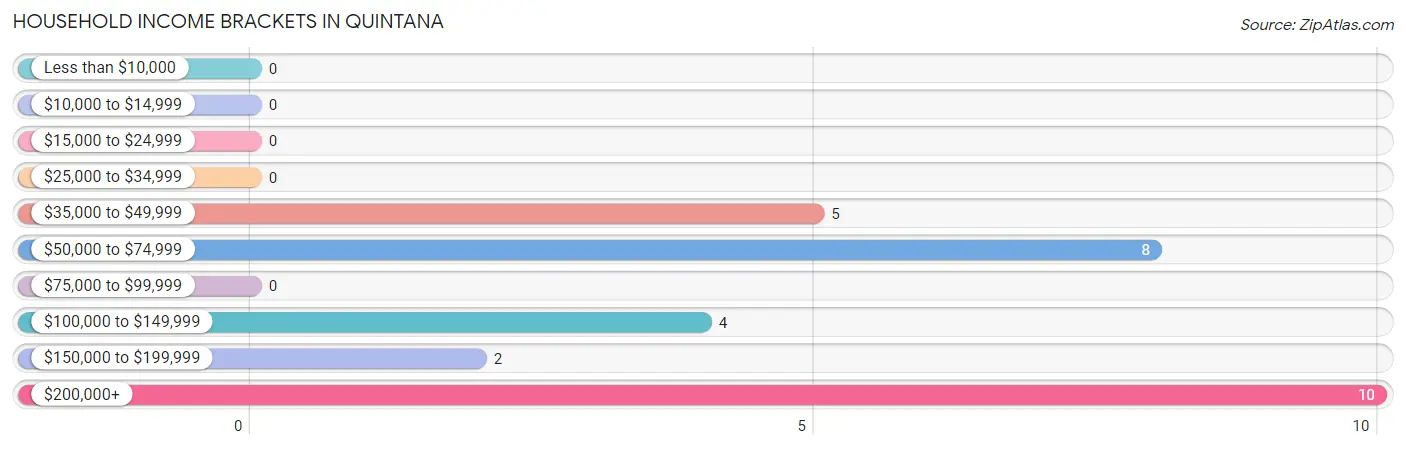
| Income Bracket | # Households | % Households |
| Less than $10,000 | 0 | 0.0% |
| $10,000 to $14,999 | 0 | 0.0% |
| $15,000 to $24,999 | 0 | 0.0% |
| $25,000 to $34,999 | 0 | 0.0% |
| $35,000 to $49,999 | 5 | 17.2% |
| $50,000 to $74,999 | 8 | 27.6% |
| $75,000 to $99,999 | 0 | 0.0% |
| $100,000 to $149,999 | 4 | 13.8% |
| $150,000 to $199,999 | 2 | 6.9% |
| $200,000+ | 10 | 34.5% |
Household Income by Householder Age in Quintana
The median household income in Quintana is $0, with the highest median household income of $183,750 found in the 65+ years age bracket for the primary householder. A total of 10 households (34.5%) fall into this category.
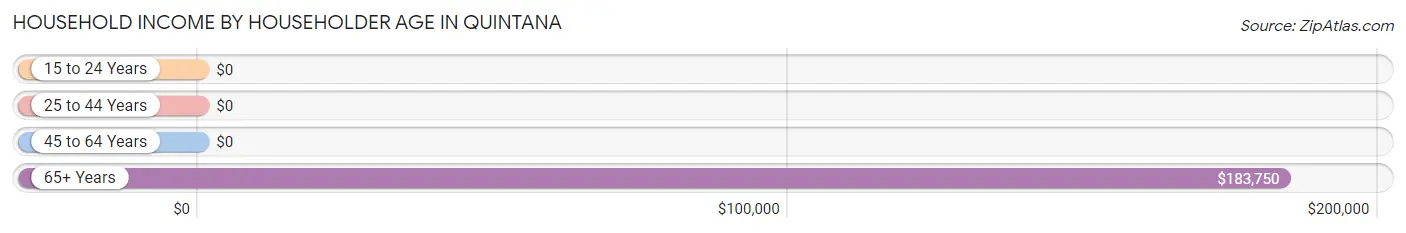
| Income Bracket | # Households | Median Income |
| 15 to 24 Years | 0 (0.0%) | $0 |
| 25 to 44 Years | 0 (0.0%) | $0 |
| 45 to 64 Years | 19 (65.5%) | $0 |
| 65+ Years | 10 (34.5%) | $183,750 |
| Total | 29 (100.0%) | $0 |
Poverty in Quintana
Income Below Poverty by Sex and Age in Quintana
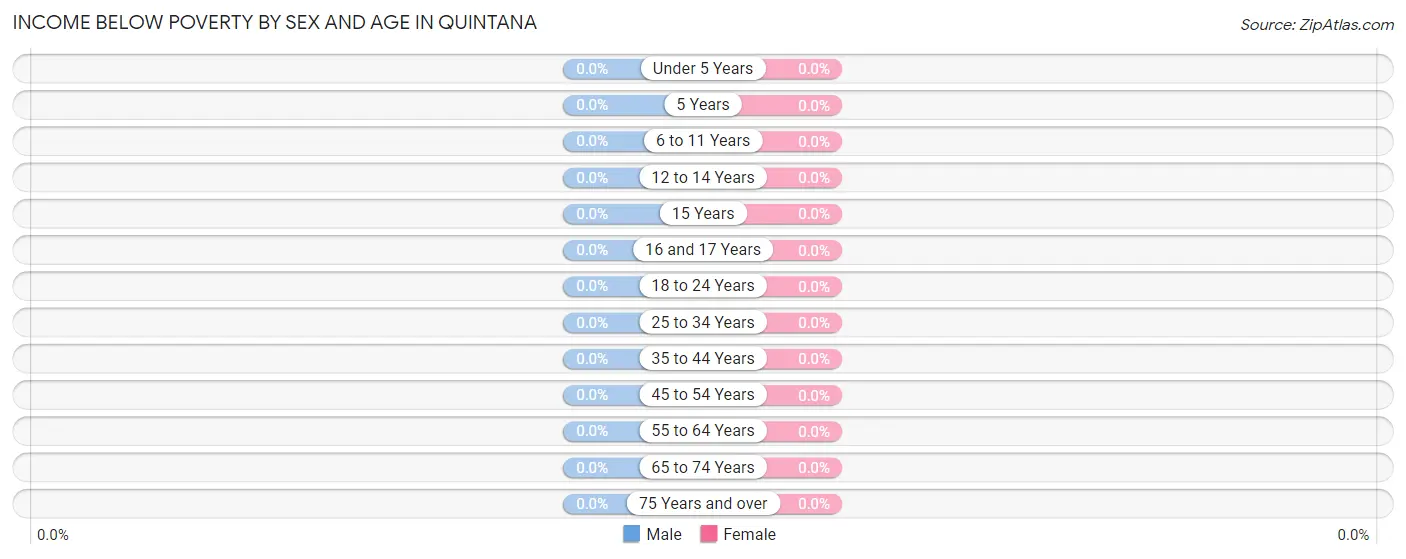
| Age Bracket | Male | Female |
| Under 5 Years | 0 (0.0%) | 0 (0.0%) |
| 5 Years | 0 (0.0%) | 0 (0.0%) |
| 6 to 11 Years | 0 (0.0%) | 0 (0.0%) |
| 12 to 14 Years | 0 (0.0%) | 0 (0.0%) |
| 15 Years | 0 (0.0%) | 0 (0.0%) |
| 16 and 17 Years | 0 (0.0%) | 0 (0.0%) |
| 18 to 24 Years | 0 (0.0%) | 0 (0.0%) |
| 25 to 34 Years | 0 (0.0%) | 0 (0.0%) |
| 35 to 44 Years | 0 (0.0%) | 0 (0.0%) |
| 45 to 54 Years | 0 (0.0%) | 0 (0.0%) |
| 55 to 64 Years | 0 (0.0%) | 0 (0.0%) |
| 65 to 74 Years | 0 (0.0%) | 0 (0.0%) |
| 75 Years and over | 0 (0.0%) | 0 (0.0%) |
| Total | 0 (0.0%) | 0 (0.0%) |
Income Above Poverty by Sex and Age in Quintana
According to the poverty statistics in Quintana, males aged 12 to 14 years and females aged 45 to 54 years are the age groups that are most secure financially, with 100.0% of males and 100.0% of females in these age groups living above the poverty line.
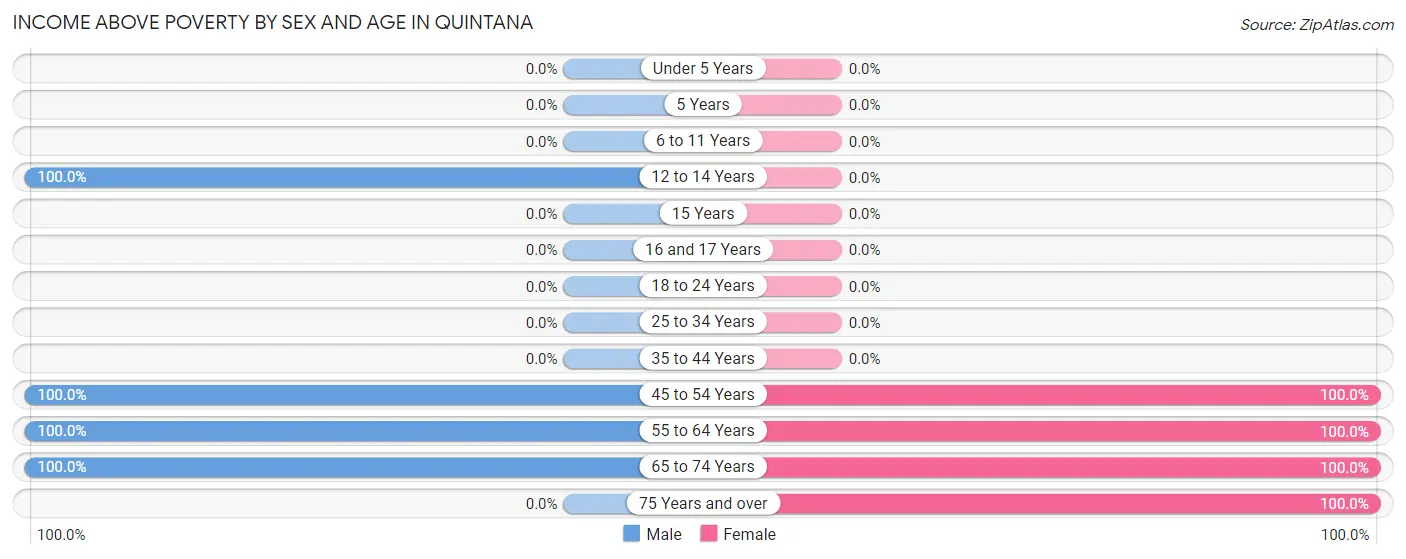
| Age Bracket | Male | Female |
| Under 5 Years | 0 (0.0%) | 0 (0.0%) |
| 5 Years | 0 (0.0%) | 0 (0.0%) |
| 6 to 11 Years | 0 (0.0%) | 0 (0.0%) |
| 12 to 14 Years | 3 (100.0%) | 0 (0.0%) |
| 15 Years | 0 (0.0%) | 0 (0.0%) |
| 16 and 17 Years | 0 (0.0%) | 0 (0.0%) |
| 18 to 24 Years | 0 (0.0%) | 0 (0.0%) |
| 25 to 34 Years | 0 (0.0%) | 0 (0.0%) |
| 35 to 44 Years | 0 (0.0%) | 0 (0.0%) |
| 45 to 54 Years | 11 (100.0%) | 4 (100.0%) |
| 55 to 64 Years | 10 (100.0%) | 3 (100.0%) |
| 65 to 74 Years | 5 (100.0%) | 3 (100.0%) |
| 75 Years and over | 0 (0.0%) | 2 (100.0%) |
| Total | 29 (100.0%) | 12 (100.0%) |
Income Below Poverty Among Married-Couple Families in Quintana
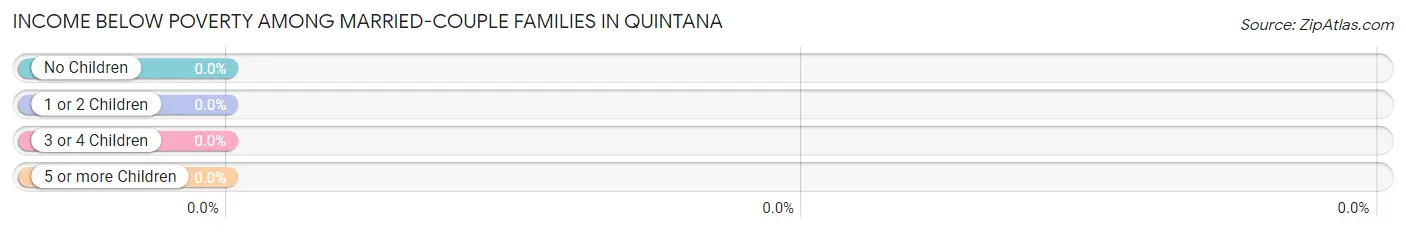
| Children | Above Poverty | Below Poverty |
| No Children | 5 (100.0%) | 0 (0.0%) |
| 1 or 2 Children | 0 (0.0%) | 0 (0.0%) |
| 3 or 4 Children | 0 (0.0%) | 0 (0.0%) |
| 5 or more Children | 0 (0.0%) | 0 (0.0%) |
| Total | 5 (100.0%) | 0 (0.0%) |
Income Below Poverty Among Single-Parent Households in Quintana
| Children | Single Father | Single Mother |
| No Children | 0 (0.0%) | 0 (0.0%) |
| 1 or 2 Children | 0 (0.0%) | 0 (0.0%) |
| 3 or 4 Children | 0 (0.0%) | 0 (0.0%) |
| 5 or more Children | 0 (0.0%) | 0 (0.0%) |
| Total | 0 (0.0%) | 0 (0.0%) |
Income Below Poverty Among Married-Couple vs Single-Parent Households in Quintana
| Children | Married-Couple Families | Single-Parent Households |
| No Children | 0 (0.0%) | 0 (0.0%) |
| 1 or 2 Children | 0 (0.0%) | 0 (0.0%) |
| 3 or 4 Children | 0 (0.0%) | 0 (0.0%) |
| 5 or more Children | 0 (0.0%) | 0 (0.0%) |
| Total | 0 (0.0%) | 0 (0.0%) |
Race in Quintana
The most populous races in Quintana are White / Caucasian (41 | 100.0%), and Hispanic or Latino (8 | 19.5%).
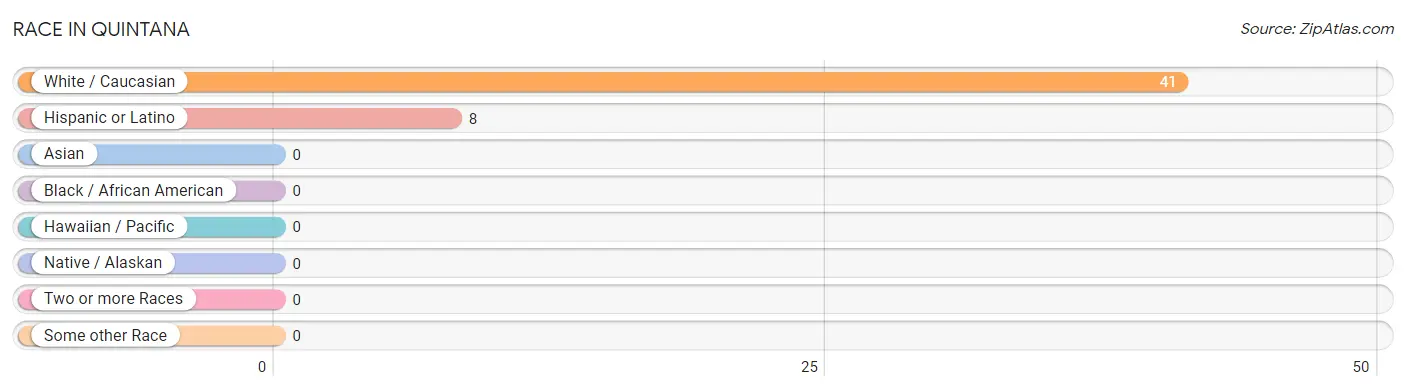
| Race | # Population | % Population |
| Asian | 0 | 0.0% |
| Black / African American | 0 | 0.0% |
| Hawaiian / Pacific | 0 | 0.0% |
| Hispanic or Latino | 8 | 19.5% |
| Native / Alaskan | 0 | 0.0% |
| White / Caucasian | 41 | 100.0% |
| Two or more Races | 0 | 0.0% |
| Some other Race | 0 | 0.0% |
| Total | 41 | 100.0% |
Ancestry in Quintana
The most populous ancestries reported in Quintana are English (14 | 34.2%), German (10 | 24.4%), Colombian (8 | 19.5%), South American (8 | 19.5%), and Irish (4 | 9.8%), together accounting for 107.3% of all Quintana residents.
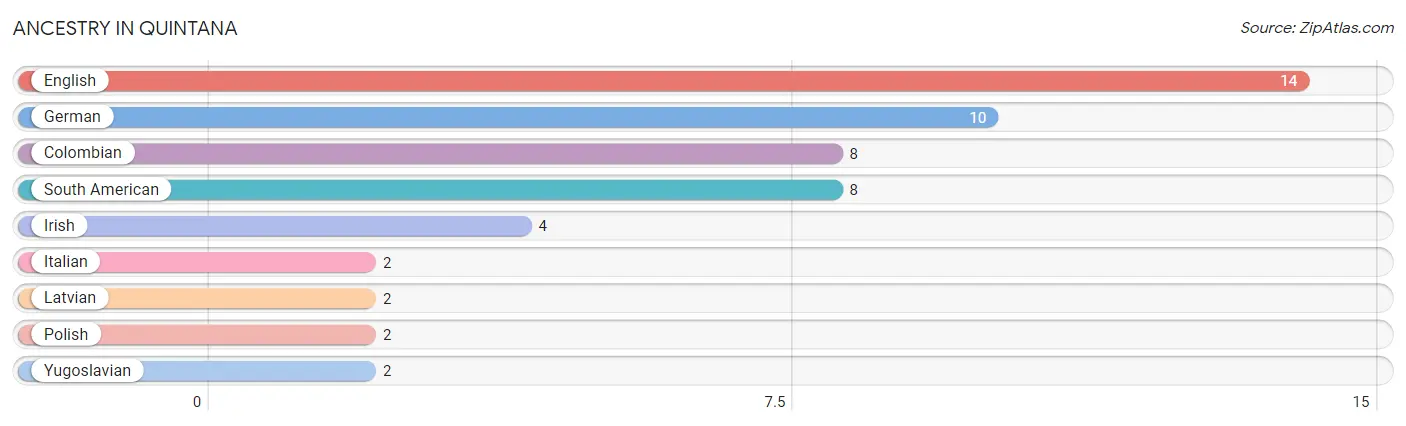
| Ancestry | # Population | % Population |
| Colombian | 8 | 19.5% |
| English | 14 | 34.2% |
| German | 10 | 24.4% |
| Irish | 4 | 9.8% |
| Italian | 2 | 4.9% |
| Latvian | 2 | 4.9% |
| Polish | 2 | 4.9% |
| South American | 8 | 19.5% |
| Yugoslavian | 2 | 4.9% | View All 9 Rows |
Immigrants in Quintana
The most numerous immigrant groups reported in Quintana came from Colombia (8 | 19.5%), Latin America (8 | 19.5%), South America (8 | 19.5%), Australia (5 | 12.2%), and Oceania (5 | 12.2%), together accounting for 82.9% of all Quintana residents.
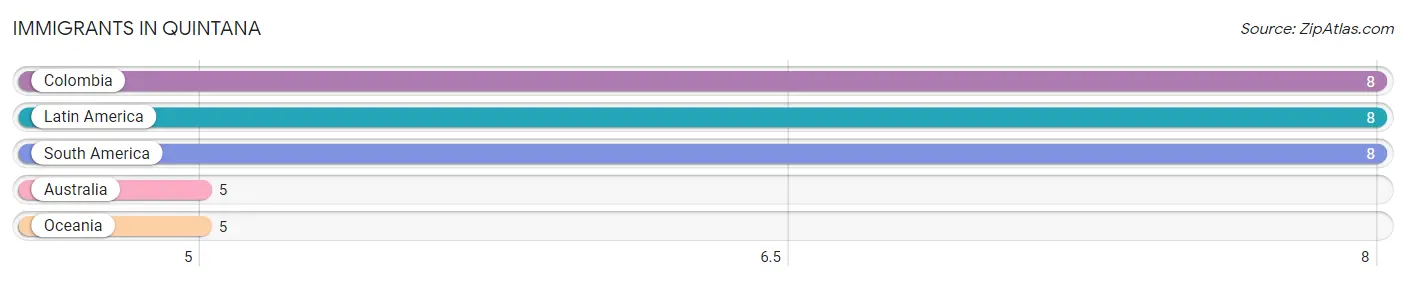
| Immigration Origin | # Population | % Population |
| Australia | 5 | 12.2% |
| Colombia | 8 | 19.5% |
| Latin America | 8 | 19.5% |
| Oceania | 5 | 12.2% |
| South America | 8 | 19.5% | View All 5 Rows |
Sex and Age in Quintana
Sex and Age in Quintana
The most populous age groups in Quintana are 50 to 54 Years (11 | 37.9%) for men and 55 to 59 Years (3 | 25.0%) for women.
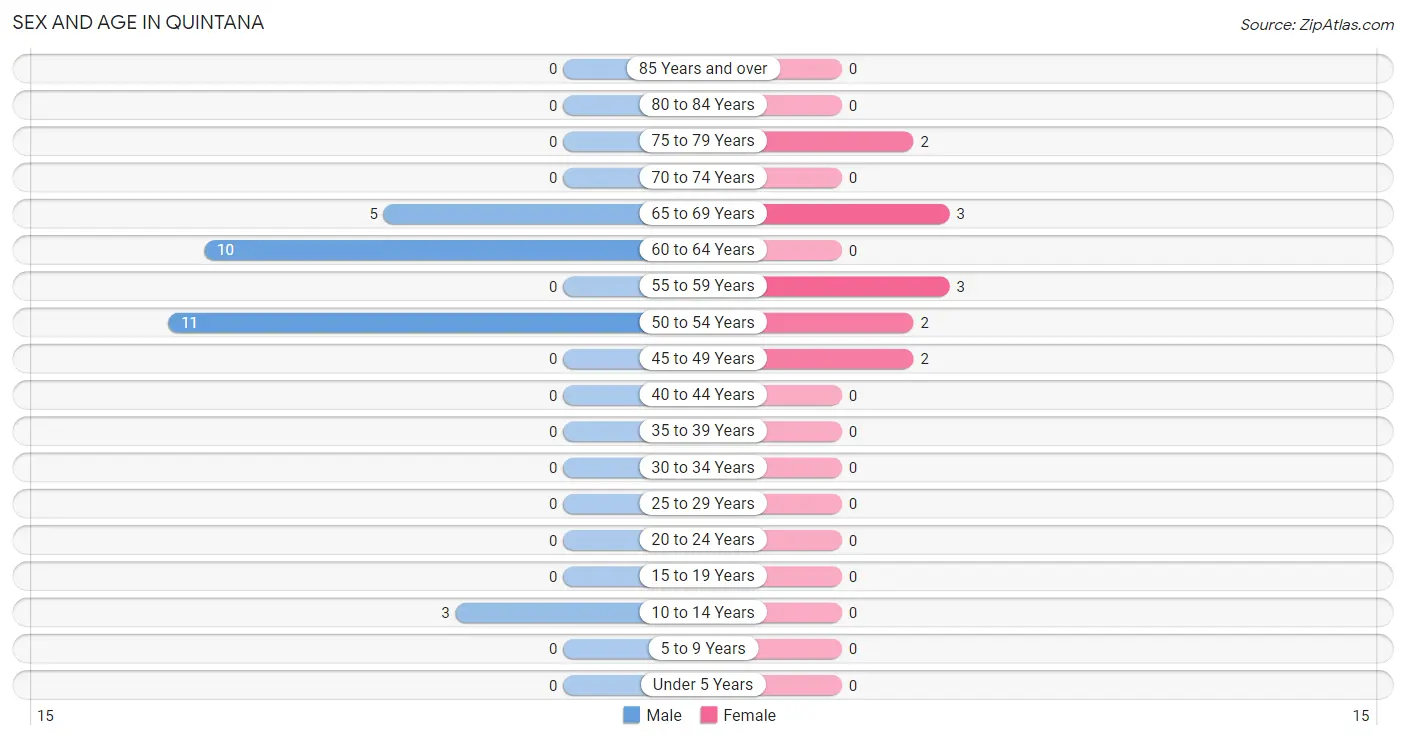
| Age Bracket | Male | Female |
| Under 5 Years | 0 (0.0%) | 0 (0.0%) |
| 5 to 9 Years | 0 (0.0%) | 0 (0.0%) |
| 10 to 14 Years | 3 (10.3%) | 0 (0.0%) |
| 15 to 19 Years | 0 (0.0%) | 0 (0.0%) |
| 20 to 24 Years | 0 (0.0%) | 0 (0.0%) |
| 25 to 29 Years | 0 (0.0%) | 0 (0.0%) |
| 30 to 34 Years | 0 (0.0%) | 0 (0.0%) |
| 35 to 39 Years | 0 (0.0%) | 0 (0.0%) |
| 40 to 44 Years | 0 (0.0%) | 0 (0.0%) |
| 45 to 49 Years | 0 (0.0%) | 2 (16.7%) |
| 50 to 54 Years | 11 (37.9%) | 2 (16.7%) |
| 55 to 59 Years | 0 (0.0%) | 3 (25.0%) |
| 60 to 64 Years | 10 (34.5%) | 0 (0.0%) |
| 65 to 69 Years | 5 (17.2%) | 3 (25.0%) |
| 70 to 74 Years | 0 (0.0%) | 0 (0.0%) |
| 75 to 79 Years | 0 (0.0%) | 2 (16.7%) |
| 80 to 84 Years | 0 (0.0%) | 0 (0.0%) |
| 85 Years and over | 0 (0.0%) | 0 (0.0%) |
| Total | 29 (100.0%) | 12 (100.0%) |
Families and Households in Quintana
Median Family Size in Quintana
The median family size in Quintana is 2.33 persons per family, with single female/mother families (2 | 22.2%) accounting for the largest median family size of 3.5 persons per family. On the other hand, married-couple families (5 | 55.6%) represent the smallest median family size with 2.00 persons per family.
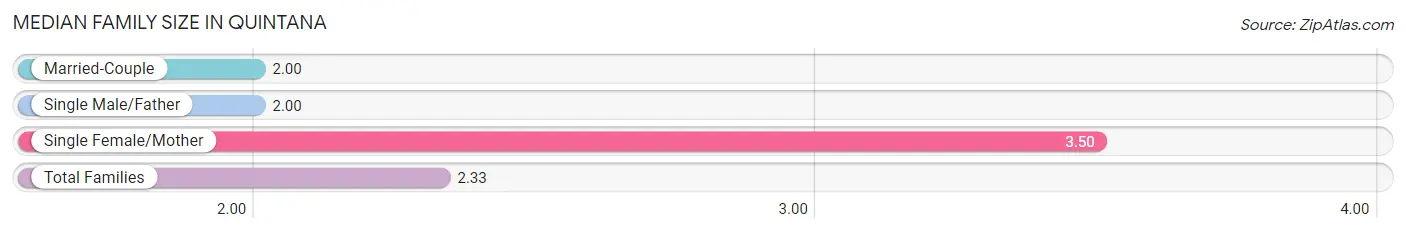
| Family Type | # Families | Family Size |
| Married-Couple | 5 (55.6%) | 2.00 |
| Single Male/Father | 2 (22.2%) | 2.00 |
| Single Female/Mother | 2 (22.2%) | 3.50 |
| Total Families | 9 (100.0%) | 2.33 |
Median Household Size in Quintana
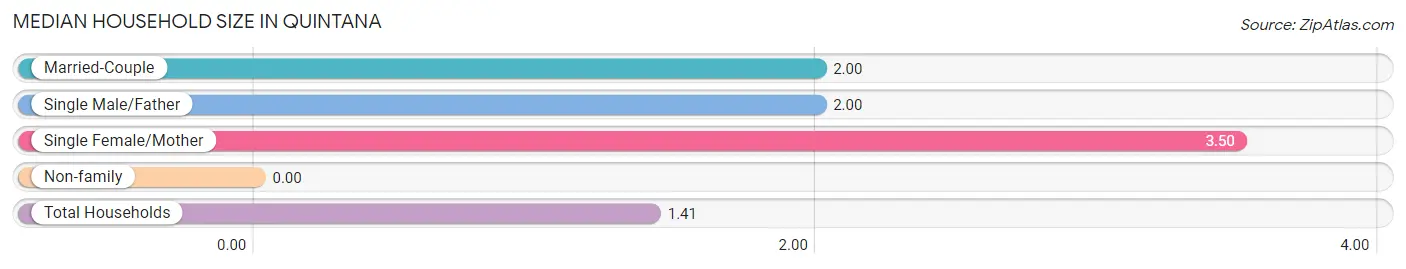
| Household Type | # Households | Household Size |
| Married-Couple | 5 (17.2%) | 2.00 |
| Single Male/Father | 2 (6.9%) | 2.00 |
| Single Female/Mother | 2 (6.9%) | 3.50 |
| Non-family | 20 (69.0%) | - |
| Total Households | 29 (100.0%) | 1.41 |
Household Size by Marriage Status in Quintana
Out of a total of 29 households in Quintana, 9 (31.0%) are family households, while 20 (69.0%) are nonfamily households. The most numerous type of family households are 2-person households, comprising 7, and the most common type of nonfamily households are 1-person households, comprising 20.
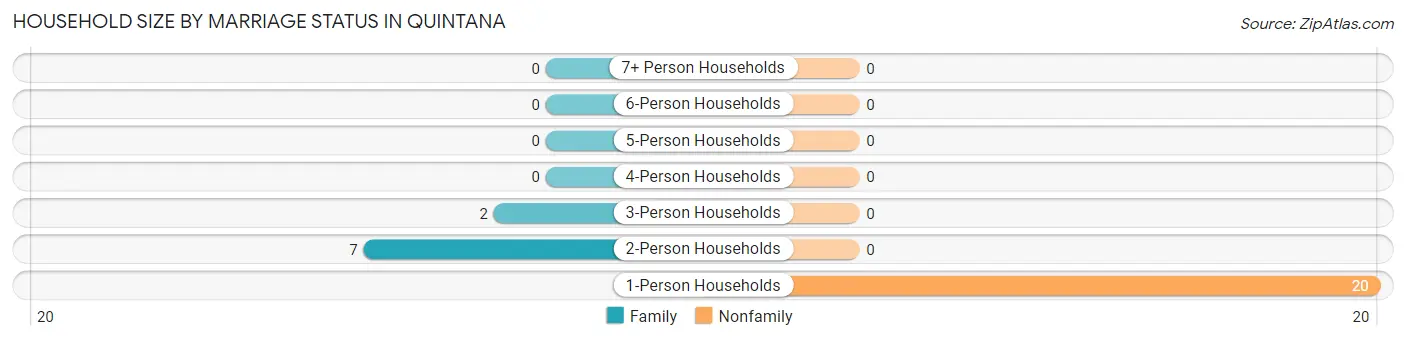
| Household Size | Family Households | Nonfamily Households |
| 1-Person Households | - | 20 (69.0%) |
| 2-Person Households | 7 (24.1%) | 0 (0.0%) |
| 3-Person Households | 2 (6.9%) | 0 (0.0%) |
| 4-Person Households | 0 (0.0%) | 0 (0.0%) |
| 5-Person Households | 0 (0.0%) | 0 (0.0%) |
| 6-Person Households | 0 (0.0%) | 0 (0.0%) |
| 7+ Person Households | 0 (0.0%) | 0 (0.0%) |
| Total | 9 (31.0%) | 20 (69.0%) |
Female Fertility in Quintana
Fertility by Age in Quintana
| Age Bracket | Women with Births | Births / 1,000 Women |
| 15 to 19 years | 0 (0.0%) | 0.0 |
| 20 to 34 years | 0 (0.0%) | 0.0 |
| 35 to 50 years | 0 (0.0%) | 0.0 |
| Total | 0 (0.0%) | 0.0 |
Fertility by Age by Marriage Status in Quintana
| Age Bracket | Married | Unmarried |
| 15 to 19 years | 0 (0.0%) | 0 (0.0%) |
| 20 to 34 years | 0 (0.0%) | 0 (0.0%) |
| 35 to 50 years | 0 (0.0%) | 0 (0.0%) |
| Total | 0 (0.0%) | 0 (0.0%) |
Fertility by Education in Quintana
| Educational Attainment | Women with Births | Births / 1,000 Women |
| Less than High School | 0 (0.0%) | 0.0 |
| High School Diploma | 0 (0.0%) | 0.0 |
| College or Associate's Degree | 0 (0.0%) | 0.0 |
| Bachelor's Degree | 0 (0.0%) | 0.0 |
| Graduate Degree | 0 (0.0%) | 0.0 |
| Total | 0 (0.0%) | 0.0 |
Fertility by Education by Marriage Status in Quintana
| Educational Attainment | Married | Unmarried |
| Less than High School | 0 (0.0%) | 0 (0.0%) |
| High School Diploma | 0 (0.0%) | 0 (0.0%) |
| College or Associate's Degree | 0 (0.0%) | 0 (0.0%) |
| Bachelor's Degree | 0 (0.0%) | 0 (0.0%) |
| Graduate Degree | 0 (0.0%) | 0 (0.0%) |
| Total | 0 (0.0%) | 0 (0.0%) |
Employment Characteristics in Quintana
Employment by Class of Employer in Quintana
Among the 33 employed individuals in Quintana, private company employees (31 | 93.9%), and local government employees (2 | 6.1%) make up the most common classes of employment.
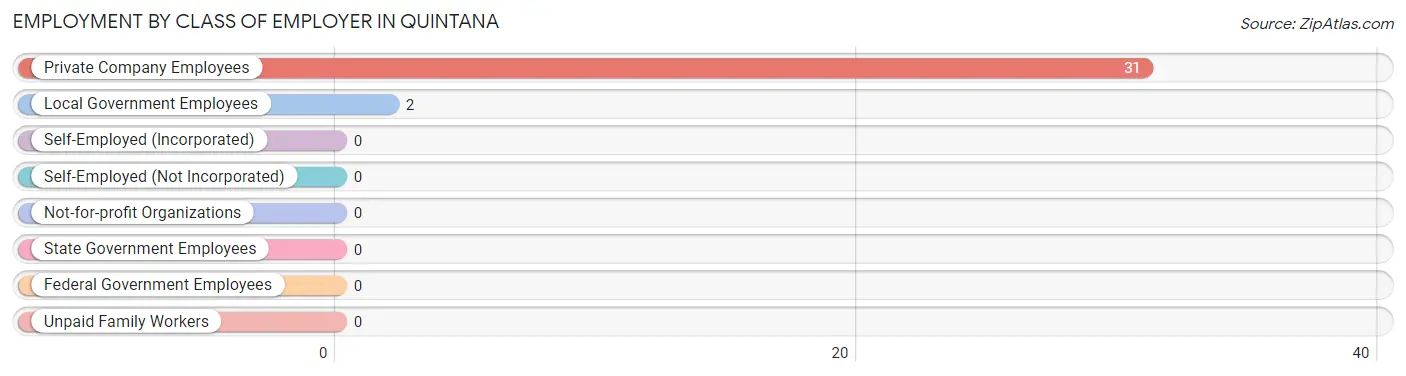
| Employer Class | # Employees | % Employees |
| Private Company Employees | 31 | 93.9% |
| Self-Employed (Incorporated) | 0 | 0.0% |
| Self-Employed (Not Incorporated) | 0 | 0.0% |
| Not-for-profit Organizations | 0 | 0.0% |
| Local Government Employees | 2 | 6.1% |
| State Government Employees | 0 | 0.0% |
| Federal Government Employees | 0 | 0.0% |
| Unpaid Family Workers | 0 | 0.0% |
| Total | 33 | 100.0% |
Employment Status by Age in Quintana
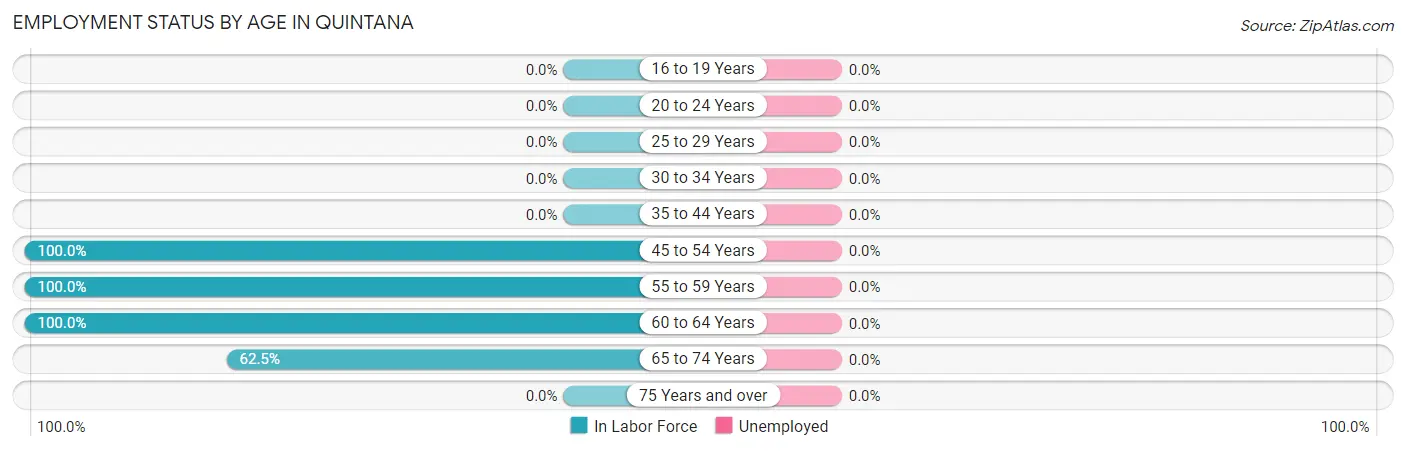
| Age Bracket | In Labor Force | Unemployed |
| 16 to 19 Years | 0 (0.0%) | 0 (0.0%) |
| 20 to 24 Years | 0 (0.0%) | 0 (0.0%) |
| 25 to 29 Years | 0 (0.0%) | 0 (0.0%) |
| 30 to 34 Years | 0 (0.0%) | 0 (0.0%) |
| 35 to 44 Years | 0 (0.0%) | 0 (0.0%) |
| 45 to 54 Years | 15 (100.0%) | 0 (0.0%) |
| 55 to 59 Years | 3 (100.0%) | 0 (0.0%) |
| 60 to 64 Years | 10 (100.0%) | 0 (0.0%) |
| 65 to 74 Years | 5 (62.5%) | 0 (0.0%) |
| 75 Years and over | 0 (0.0%) | 0 (0.0%) |
| Total | 33 (86.8%) | 0 (0.0%) |
Employment Status by Educational Attainment in Quintana
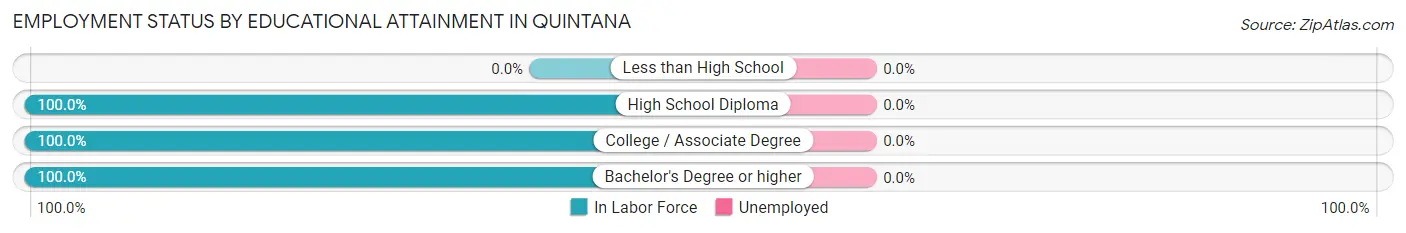
| Educational Attainment | In Labor Force | Unemployed |
| Less than High School | 0 (0.0%) | 0 (0.0%) |
| High School Diploma | 6 (100.0%) | 0 (0.0%) |
| College / Associate Degree | 6 (100.0%) | 0 (0.0%) |
| Bachelor's Degree or higher | 16 (100.0%) | 0 (0.0%) |
| Total | 28 (100.0%) | 0 (0.0%) |
Employment Occupations by Sex in Quintana
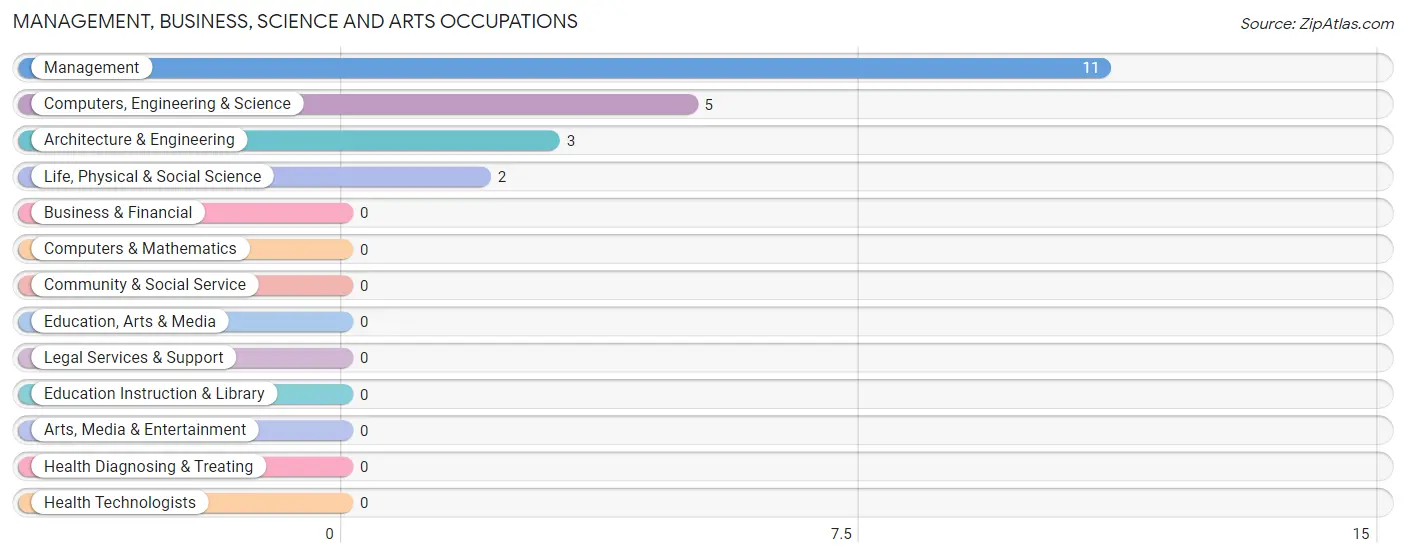
Management, Business, Science and Arts Occupations
The most common Management, Business, Science and Arts occupations in Quintana are Management (11 | 33.3%), Computers, Engineering & Science (5 | 15.1%), Architecture & Engineering (3 | 9.1%), and Life, Physical & Social Science (2 | 6.1%).
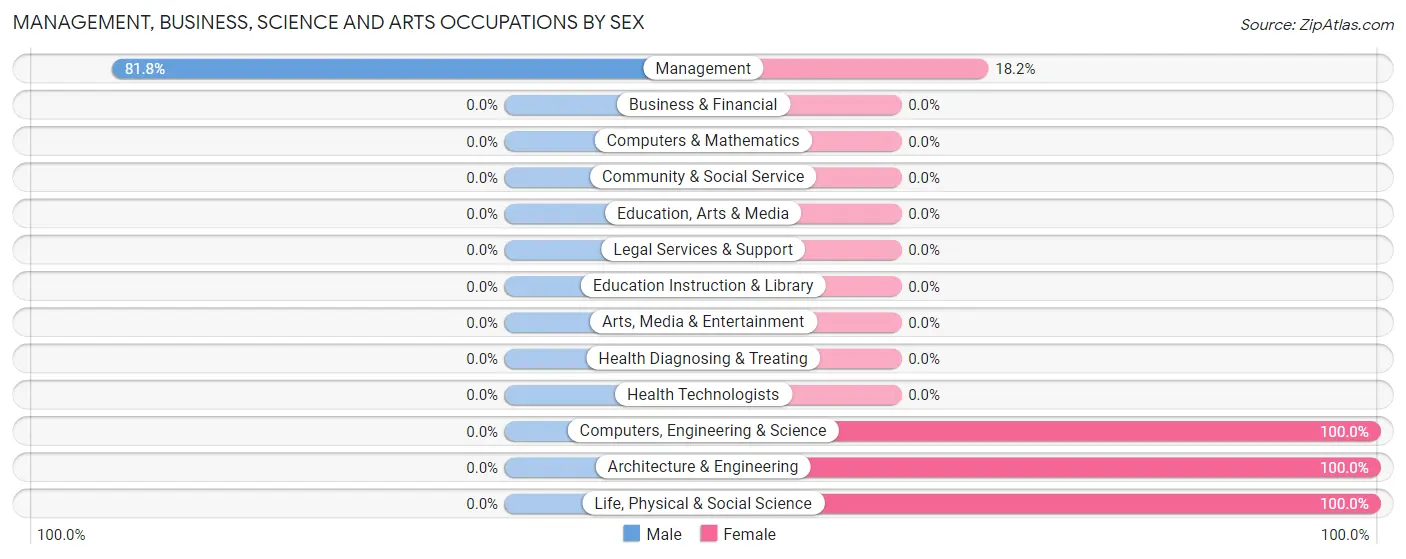
Management, Business, Science and Arts Occupations by Sex
| Occupation | Male | Female |
| Management | 9 (81.8%) | 2 (18.2%) |
| Business & Financial | 0 (0.0%) | 0 (0.0%) |
| Computers, Engineering & Science | 0 (0.0%) | 5 (100.0%) |
| Computers & Mathematics | 0 (0.0%) | 0 (0.0%) |
| Architecture & Engineering | 0 (0.0%) | 3 (100.0%) |
| Life, Physical & Social Science | 0 (0.0%) | 2 (100.0%) |
| Community & Social Service | 0 (0.0%) | 0 (0.0%) |
| Education, Arts & Media | 0 (0.0%) | 0 (0.0%) |
| Legal Services & Support | 0 (0.0%) | 0 (0.0%) |
| Education Instruction & Library | 0 (0.0%) | 0 (0.0%) |
| Arts, Media & Entertainment | 0 (0.0%) | 0 (0.0%) |
| Health Diagnosing & Treating | 0 (0.0%) | 0 (0.0%) |
| Health Technologists | 0 (0.0%) | 0 (0.0%) |
| Total (Category) | 9 (56.2%) | 7 (43.8%) |
| Total (Overall) | 26 (78.8%) | 7 (21.2%) |
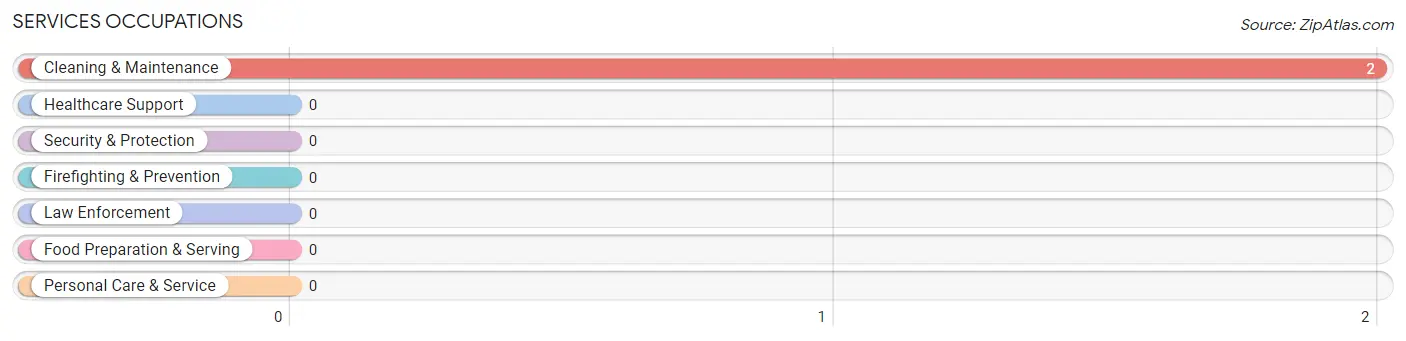
Services Occupations
The most common Services occupations in Quintana are , and Cleaning & Maintenance (2 | 6.1%).
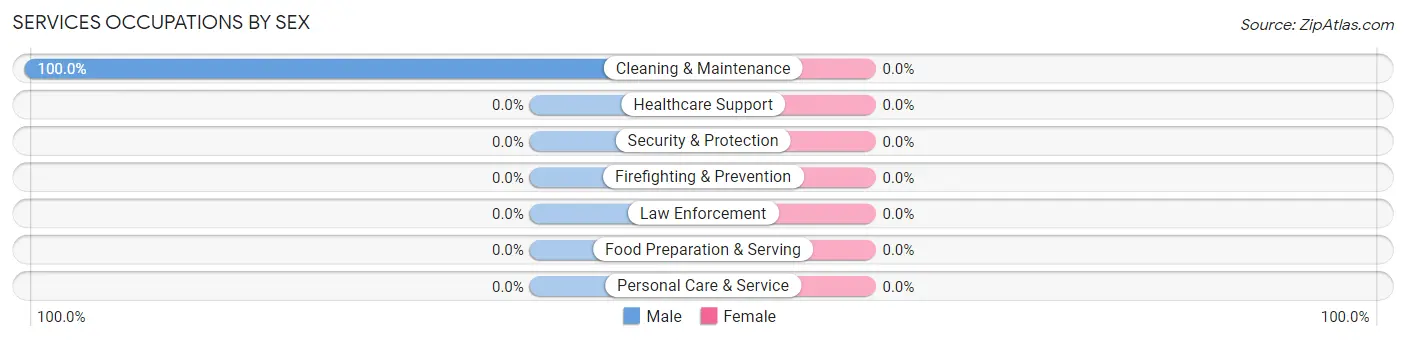
Services Occupations by Sex
| Occupation | Male | Female |
| Healthcare Support | 0 (0.0%) | 0 (0.0%) |
| Security & Protection | 0 (0.0%) | 0 (0.0%) |
| Firefighting & Prevention | 0 (0.0%) | 0 (0.0%) |
| Law Enforcement | 0 (0.0%) | 0 (0.0%) |
| Food Preparation & Serving | 0 (0.0%) | 0 (0.0%) |
| Cleaning & Maintenance | 2 (100.0%) | 0 (0.0%) |
| Personal Care & Service | 0 (0.0%) | 0 (0.0%) |
| Total (Category) | 2 (100.0%) | 0 (0.0%) |
| Total (Overall) | 26 (78.8%) | 7 (21.2%) |
Sales and Office Occupations
Sales and Office Occupations by Sex
| Occupation | Male | Female |
| Sales & Related | 0 (0.0%) | 0 (0.0%) |
| Office & Administration | 0 (0.0%) | 0 (0.0%) |
| Total (Category) | 0 (0.0%) | 0 (0.0%) |
| Total (Overall) | 26 (78.8%) | 7 (21.2%) |
Natural Resources, Construction and Maintenance Occupations
The most common Natural Resources, Construction and Maintenance occupations in Quintana are , and Construction & Extraction (4 | 12.1%).
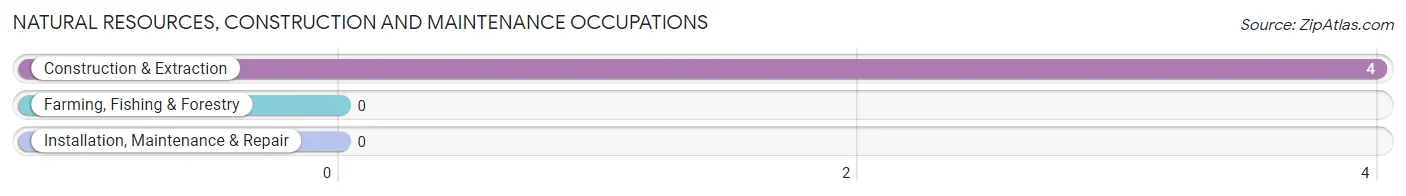
Natural Resources, Construction and Maintenance Occupations by Sex
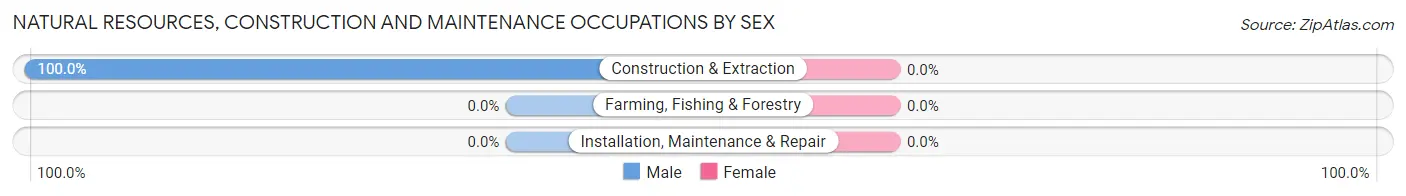
| Occupation | Male | Female |
| Farming, Fishing & Forestry | 0 (0.0%) | 0 (0.0%) |
| Construction & Extraction | 4 (100.0%) | 0 (0.0%) |
| Installation, Maintenance & Repair | 0 (0.0%) | 0 (0.0%) |
| Total (Category) | 4 (100.0%) | 0 (0.0%) |
| Total (Overall) | 26 (78.8%) | 7 (21.2%) |
Production, Transportation and Moving Occupations
The most common Production, Transportation and Moving occupations in Quintana are , and Production (11 | 33.3%).
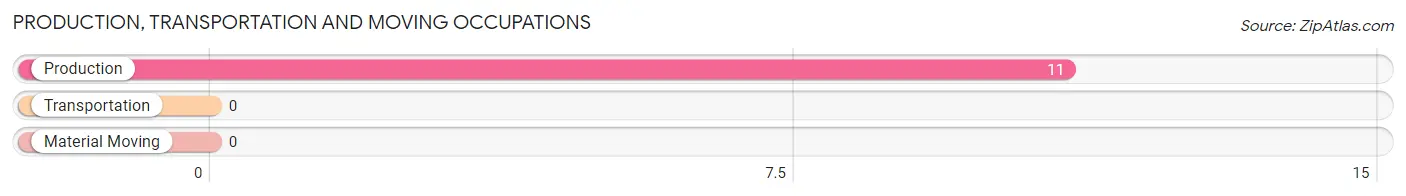
Production, Transportation and Moving Occupations by Sex
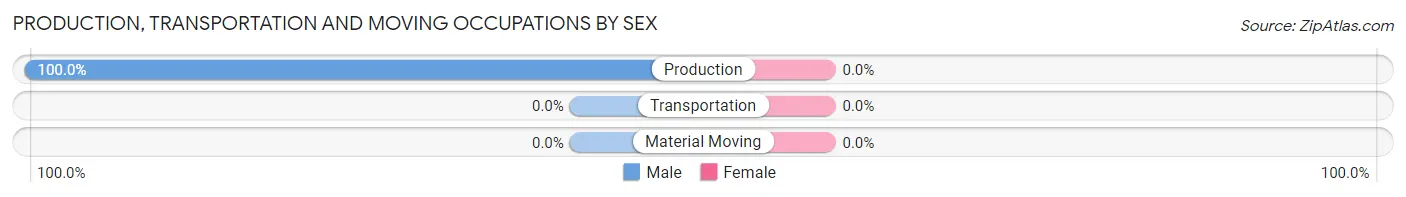
| Occupation | Male | Female |
| Production | 11 (100.0%) | 0 (0.0%) |
| Transportation | 0 (0.0%) | 0 (0.0%) |
| Material Moving | 0 (0.0%) | 0 (0.0%) |
| Total (Category) | 11 (100.0%) | 0 (0.0%) |
| Total (Overall) | 26 (78.8%) | 7 (21.2%) |
Employment Industries by Sex in Quintana
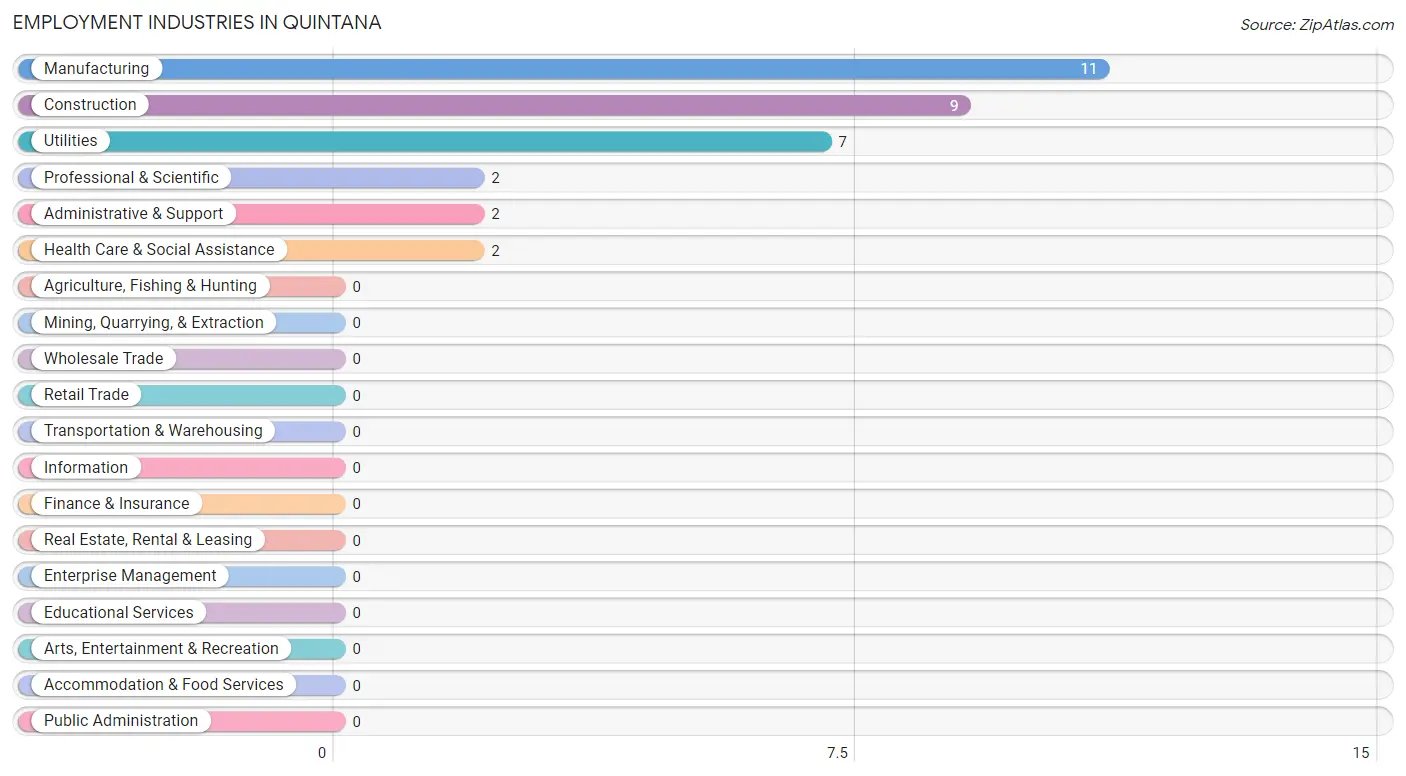
Employment Industries in Quintana
The major employment industries in Quintana include Manufacturing (11 | 33.3%), Construction (9 | 27.3%), Utilities (7 | 21.2%), Professional & Scientific (2 | 6.1%), and Administrative & Support (2 | 6.1%).
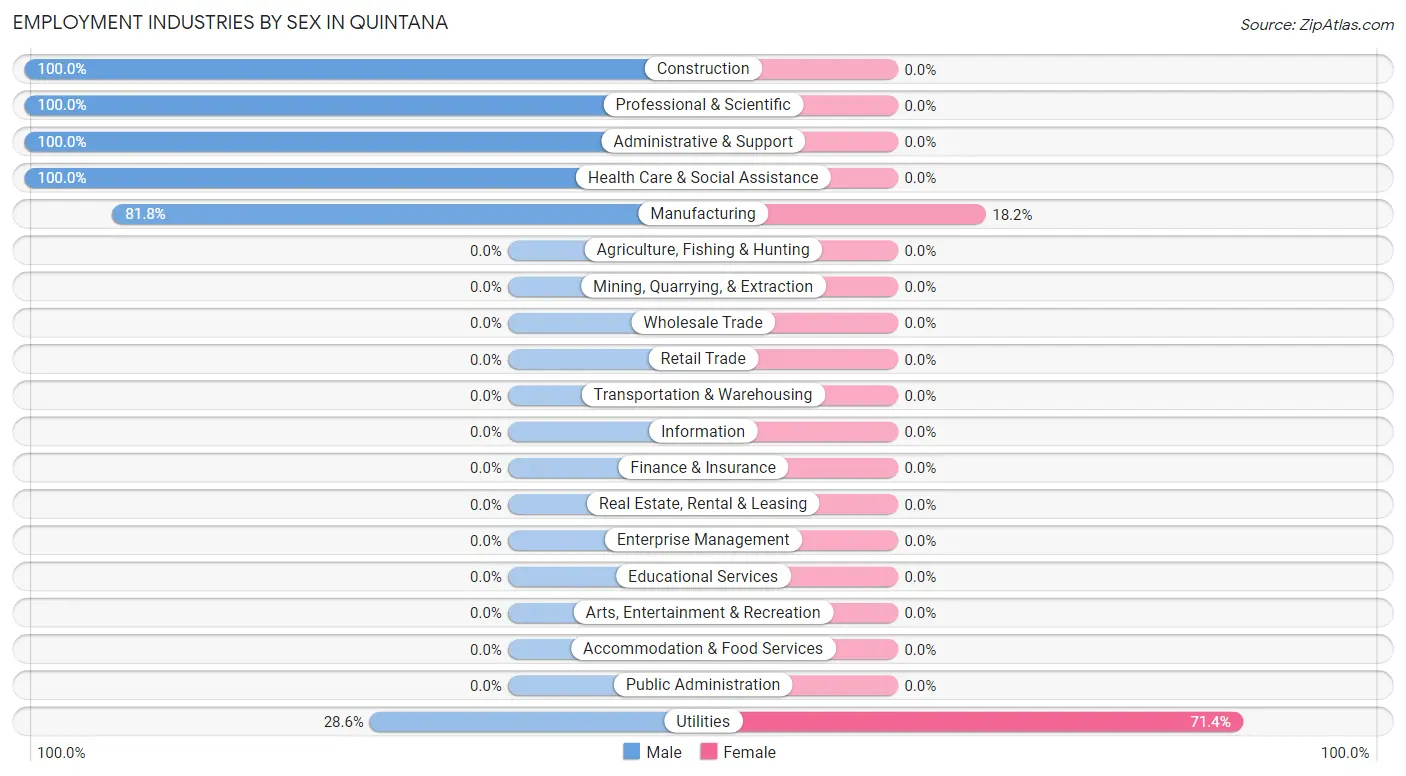
Employment Industries by Sex in Quintana
The Quintana industries that see more men than women are Construction (100.0%), Professional & Scientific (100.0%), and Administrative & Support (100.0%), whereas the industries that tend to have a higher number of women are Utilities (71.4%), and Manufacturing (18.2%).
| Industry | Male | Female |
| Agriculture, Fishing & Hunting | 0 (0.0%) | 0 (0.0%) |
| Mining, Quarrying, & Extraction | 0 (0.0%) | 0 (0.0%) |
| Construction | 9 (100.0%) | 0 (0.0%) |
| Manufacturing | 9 (81.8%) | 2 (18.2%) |
| Wholesale Trade | 0 (0.0%) | 0 (0.0%) |
| Retail Trade | 0 (0.0%) | 0 (0.0%) |
| Transportation & Warehousing | 0 (0.0%) | 0 (0.0%) |
| Utilities | 2 (28.6%) | 5 (71.4%) |
| Information | 0 (0.0%) | 0 (0.0%) |
| Finance & Insurance | 0 (0.0%) | 0 (0.0%) |
| Real Estate, Rental & Leasing | 0 (0.0%) | 0 (0.0%) |
| Professional & Scientific | 2 (100.0%) | 0 (0.0%) |
| Enterprise Management | 0 (0.0%) | 0 (0.0%) |
| Administrative & Support | 2 (100.0%) | 0 (0.0%) |
| Educational Services | 0 (0.0%) | 0 (0.0%) |
| Health Care & Social Assistance | 2 (100.0%) | 0 (0.0%) |
| Arts, Entertainment & Recreation | 0 (0.0%) | 0 (0.0%) |
| Accommodation & Food Services | 0 (0.0%) | 0 (0.0%) |
| Public Administration | 0 (0.0%) | 0 (0.0%) |
| Total | 26 (78.8%) | 7 (21.2%) |
Education in Quintana
School Enrollment in Quintana
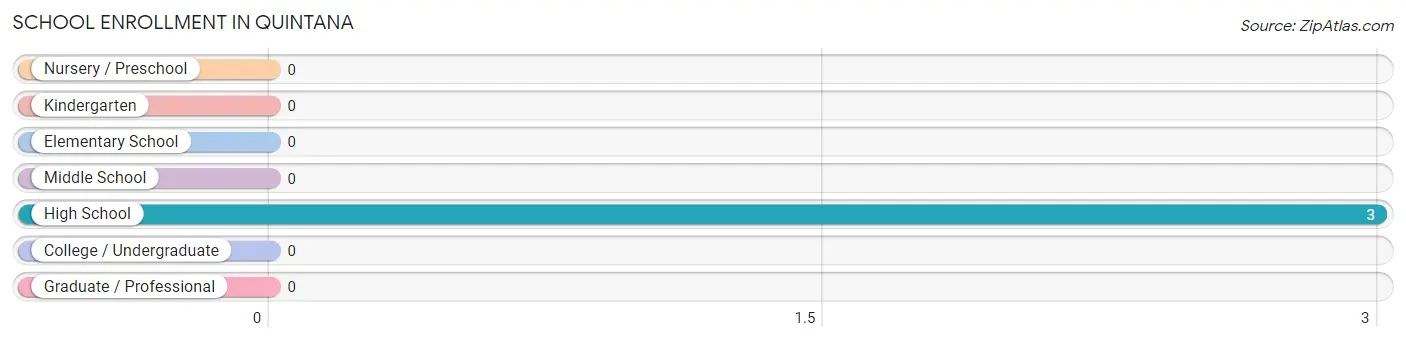
| School Level | # Students | % Students |
| Nursery / Preschool | 0 | 0.0% |
| Kindergarten | 0 | 0.0% |
| Elementary School | 0 | 0.0% |
| Middle School | 0 | 0.0% |
| High School | 3 | 100.0% |
| College / Undergraduate | 0 | 0.0% |
| Graduate / Professional | 0 | 0.0% |
| Total | 3 | 100.0% |
School Enrollment by Age by Funding Source in Quintana
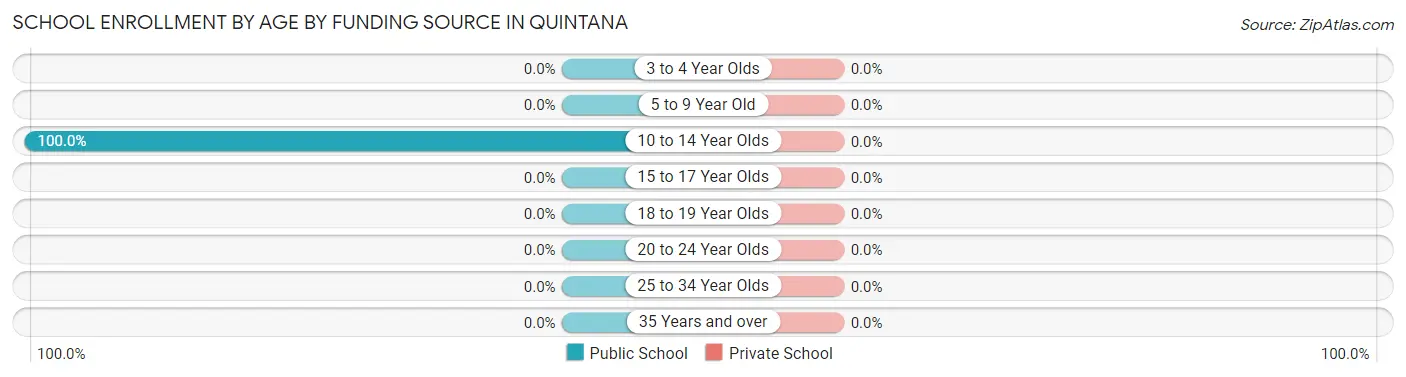
| Age Bracket | Public School | Private School |
| 3 to 4 Year Olds | 0 (0.0%) | 0 (0.0%) |
| 5 to 9 Year Old | 0 (0.0%) | 0 (0.0%) |
| 10 to 14 Year Olds | 3 (100.0%) | 0 (0.0%) |
| 15 to 17 Year Olds | 0 (0.0%) | 0 (0.0%) |
| 18 to 19 Year Olds | 0 (0.0%) | 0 (0.0%) |
| 20 to 24 Year Olds | 0 (0.0%) | 0 (0.0%) |
| 25 to 34 Year Olds | 0 (0.0%) | 0 (0.0%) |
| 35 Years and over | 0 (0.0%) | 0 (0.0%) |
| Total | 3 (100.0%) | 0 (0.0%) |
Educational Attainment by Field of Study in Quintana
Business (10 | 55.6%), and engineering (8 | 44.4%) are the most common fields of study among 18 individuals in Quintana who have obtained a bachelor's degree or higher.
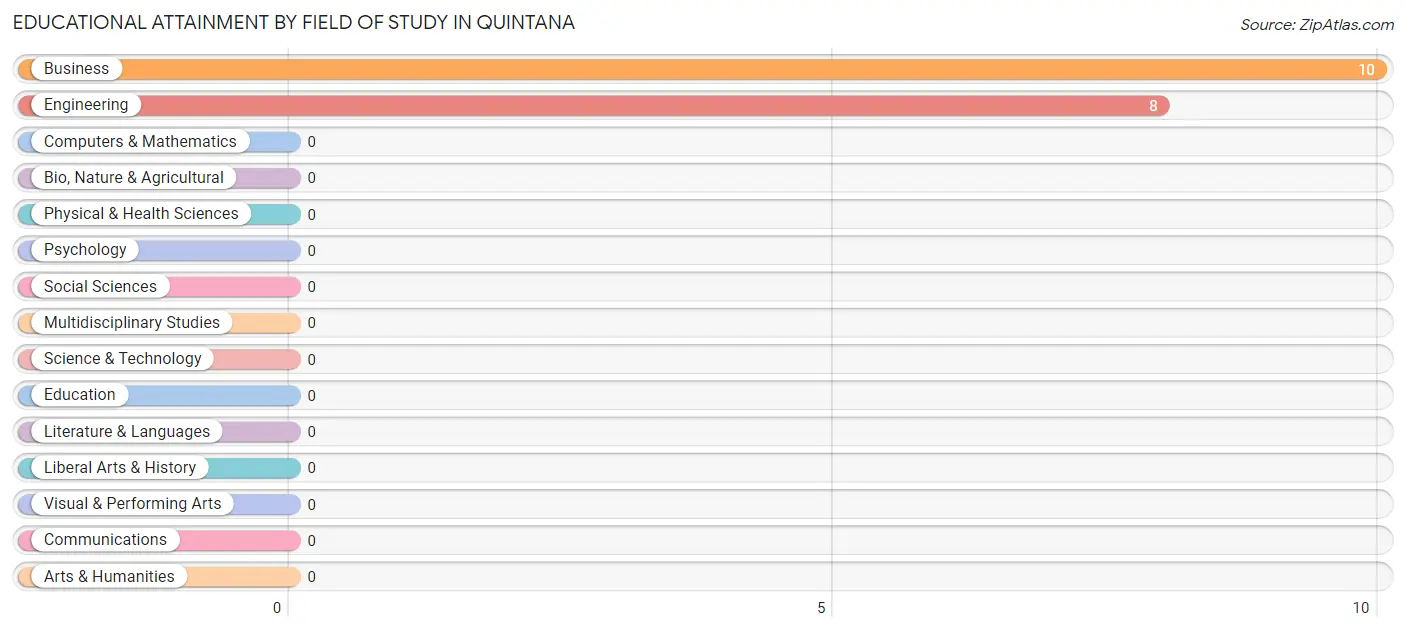
| Field of Study | # Graduates | % Graduates |
| Computers & Mathematics | 0 | 0.0% |
| Bio, Nature & Agricultural | 0 | 0.0% |
| Physical & Health Sciences | 0 | 0.0% |
| Psychology | 0 | 0.0% |
| Social Sciences | 0 | 0.0% |
| Engineering | 8 | 44.4% |
| Multidisciplinary Studies | 0 | 0.0% |
| Science & Technology | 0 | 0.0% |
| Business | 10 | 55.6% |
| Education | 0 | 0.0% |
| Literature & Languages | 0 | 0.0% |
| Liberal Arts & History | 0 | 0.0% |
| Visual & Performing Arts | 0 | 0.0% |
| Communications | 0 | 0.0% |
| Arts & Humanities | 0 | 0.0% |
| Total | 18 | 100.0% |
Transportation & Commute in Quintana
Vehicle Availability by Sex in Quintana
The most prevalent vehicle ownership categories in Quintana are males with 1 vehicle (16, accounting for 61.5%) and females with 1 vehicle (2, making up 228.6%).
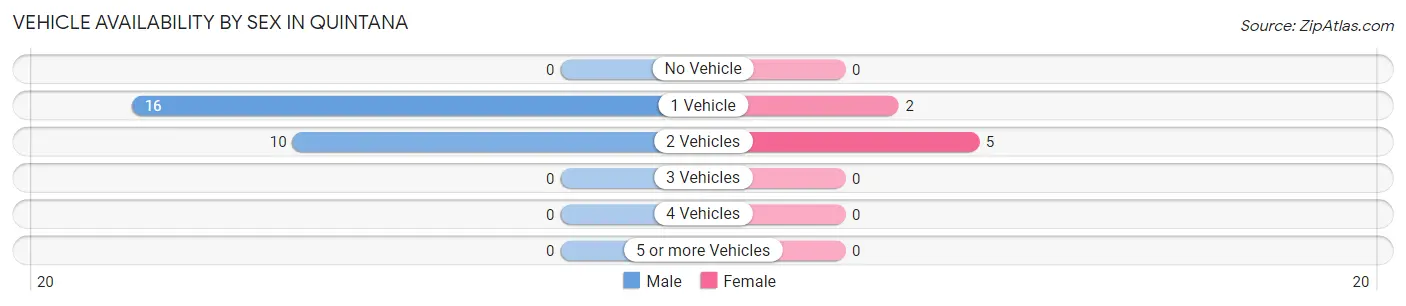
| Vehicles Available | Male | Female |
| No Vehicle | 0 (0.0%) | 0 (0.0%) |
| 1 Vehicle | 16 (61.5%) | 2 (28.6%) |
| 2 Vehicles | 10 (38.5%) | 5 (71.4%) |
| 3 Vehicles | 0 (0.0%) | 0 (0.0%) |
| 4 Vehicles | 0 (0.0%) | 0 (0.0%) |
| 5 or more Vehicles | 0 (0.0%) | 0 (0.0%) |
| Total | 26 (100.0%) | 7 (100.0%) |
Commute Time in Quintana
The most frequently occuring commute durations in Quintana are 5 to 9 minutes (13 commuters, 39.4%), 45 to 59 minutes (8 commuters, 24.2%), and 10 to 14 minutes (5 commuters, 15.1%).
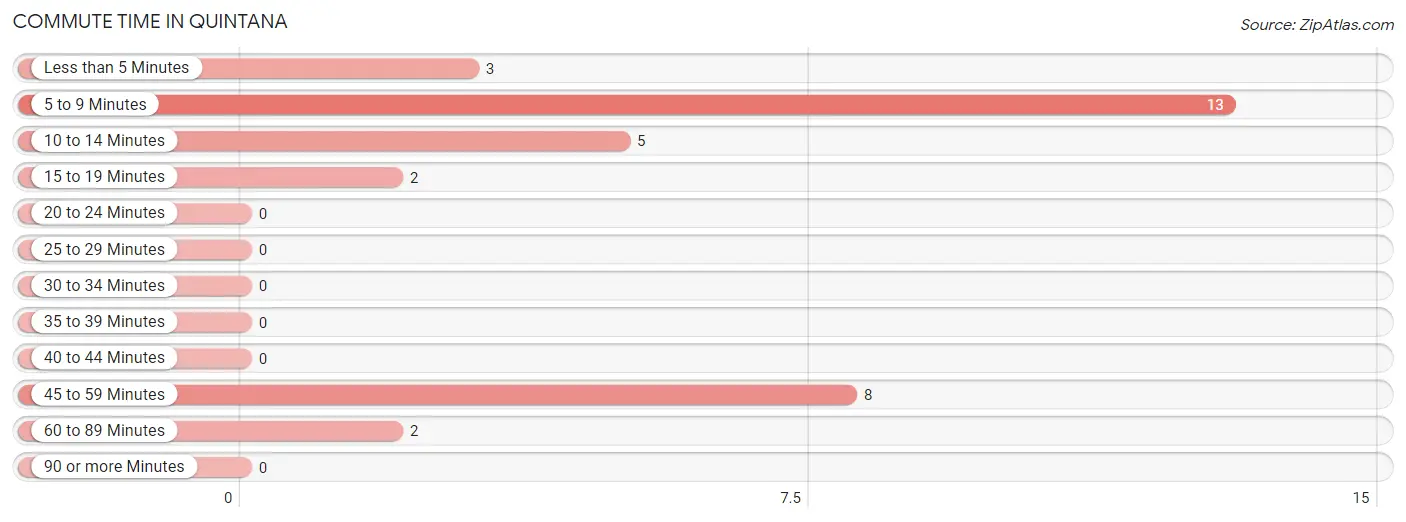
| Commute Time | # Commuters | % Commuters |
| Less than 5 Minutes | 3 | 9.1% |
| 5 to 9 Minutes | 13 | 39.4% |
| 10 to 14 Minutes | 5 | 15.1% |
| 15 to 19 Minutes | 2 | 6.1% |
| 20 to 24 Minutes | 0 | 0.0% |
| 25 to 29 Minutes | 0 | 0.0% |
| 30 to 34 Minutes | 0 | 0.0% |
| 35 to 39 Minutes | 0 | 0.0% |
| 40 to 44 Minutes | 0 | 0.0% |
| 45 to 59 Minutes | 8 | 24.2% |
| 60 to 89 Minutes | 2 | 6.1% |
| 90 or more Minutes | 0 | 0.0% |
Commute Time by Sex in Quintana
The most common commute times in Quintana are 5 to 9 minutes (9 commuters, 34.6%) for males and 5 to 9 minutes (4 commuters, 57.1%) for females.
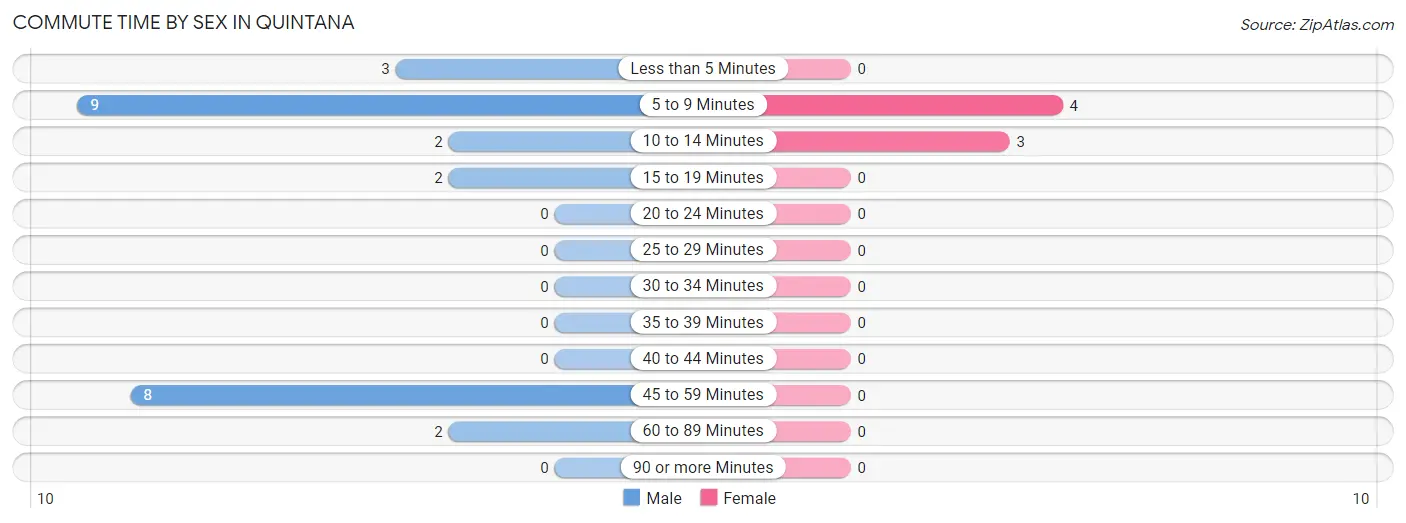
| Commute Time | Male | Female |
| Less than 5 Minutes | 3 (11.5%) | 0 (0.0%) |
| 5 to 9 Minutes | 9 (34.6%) | 4 (57.1%) |
| 10 to 14 Minutes | 2 (7.7%) | 3 (42.9%) |
| 15 to 19 Minutes | 2 (7.7%) | 0 (0.0%) |
| 20 to 24 Minutes | 0 (0.0%) | 0 (0.0%) |
| 25 to 29 Minutes | 0 (0.0%) | 0 (0.0%) |
| 30 to 34 Minutes | 0 (0.0%) | 0 (0.0%) |
| 35 to 39 Minutes | 0 (0.0%) | 0 (0.0%) |
| 40 to 44 Minutes | 0 (0.0%) | 0 (0.0%) |
| 45 to 59 Minutes | 8 (30.8%) | 0 (0.0%) |
| 60 to 89 Minutes | 2 (7.7%) | 0 (0.0%) |
| 90 or more Minutes | 0 (0.0%) | 0 (0.0%) |
Time of Departure to Work by Sex in Quintana
The most frequent times of departure to work in Quintana are 5:30 AM to 5:59 AM (15, 57.7%) for males and 7:00 AM to 7:29 AM (5, 71.4%) for females.
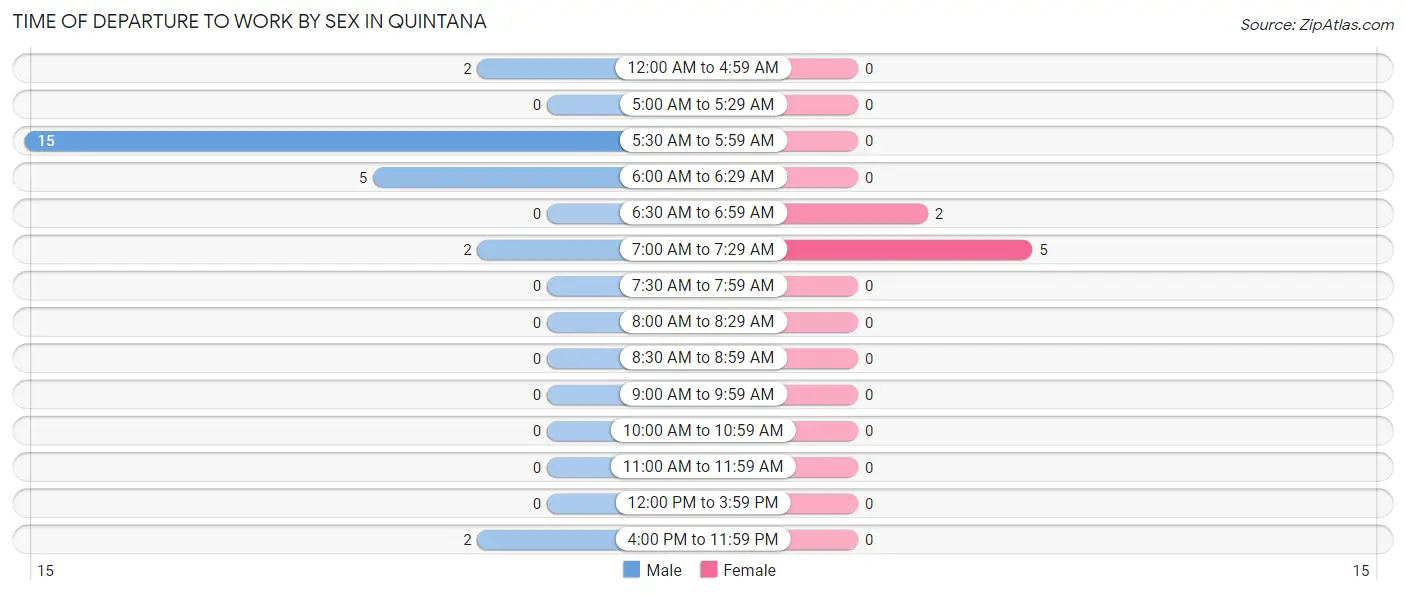
| Time of Departure | Male | Female |
| 12:00 AM to 4:59 AM | 2 (7.7%) | 0 (0.0%) |
| 5:00 AM to 5:29 AM | 0 (0.0%) | 0 (0.0%) |
| 5:30 AM to 5:59 AM | 15 (57.7%) | 0 (0.0%) |
| 6:00 AM to 6:29 AM | 5 (19.2%) | 0 (0.0%) |
| 6:30 AM to 6:59 AM | 0 (0.0%) | 2 (28.6%) |
| 7:00 AM to 7:29 AM | 2 (7.7%) | 5 (71.4%) |
| 7:30 AM to 7:59 AM | 0 (0.0%) | 0 (0.0%) |
| 8:00 AM to 8:29 AM | 0 (0.0%) | 0 (0.0%) |
| 8:30 AM to 8:59 AM | 0 (0.0%) | 0 (0.0%) |
| 9:00 AM to 9:59 AM | 0 (0.0%) | 0 (0.0%) |
| 10:00 AM to 10:59 AM | 0 (0.0%) | 0 (0.0%) |
| 11:00 AM to 11:59 AM | 0 (0.0%) | 0 (0.0%) |
| 12:00 PM to 3:59 PM | 0 (0.0%) | 0 (0.0%) |
| 4:00 PM to 11:59 PM | 2 (7.7%) | 0 (0.0%) |
| Total | 26 (100.0%) | 7 (100.0%) |
Housing Occupancy in Quintana
Occupancy by Ownership in Quintana
Of the total 29 dwellings in Quintana, owner-occupied units account for 5 (17.2%), while renter-occupied units make up 24 (82.8%).
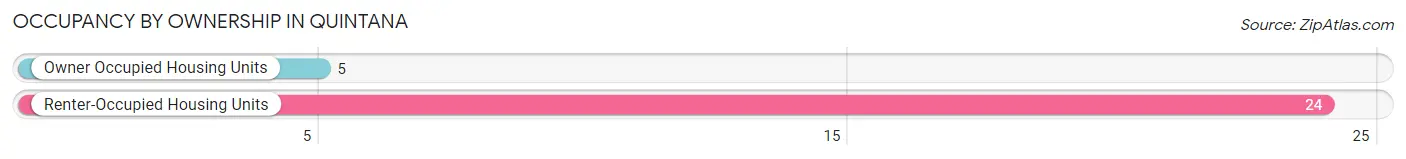
| Occupancy | # Housing Units | % Housing Units |
| Owner Occupied Housing Units | 5 | 17.2% |
| Renter-Occupied Housing Units | 24 | 82.8% |
| Total Occupied Housing Units | 29 | 100.0% |
Occupancy by Household Size in Quintana
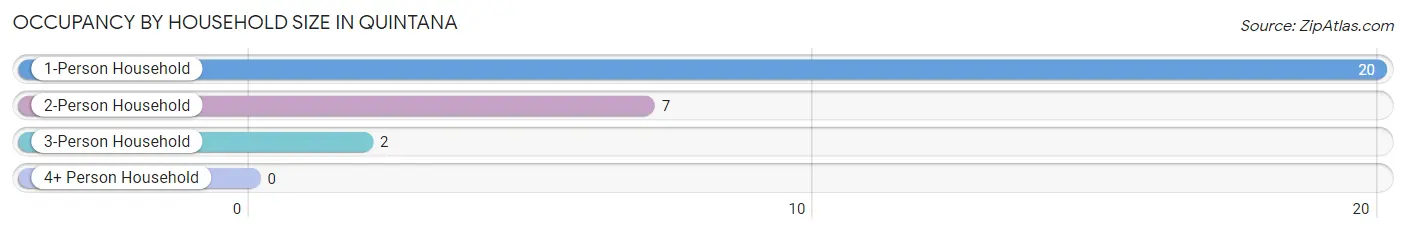
| Household Size | # Housing Units | % Housing Units |
| 1-Person Household | 20 | 69.0% |
| 2-Person Household | 7 | 24.1% |
| 3-Person Household | 2 | 6.9% |
| 4+ Person Household | 0 | 0.0% |
| Total Housing Units | 29 | 100.0% |
Occupancy by Ownership by Household Size in Quintana
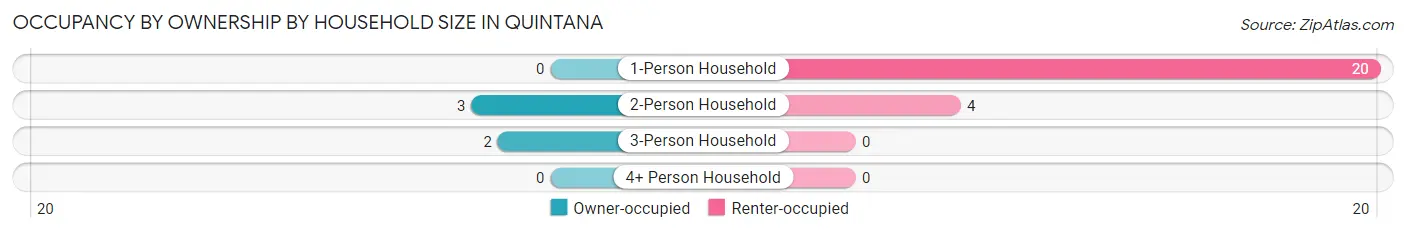
| Household Size | Owner-occupied | Renter-occupied |
| 1-Person Household | 0 (0.0%) | 20 (100.0%) |
| 2-Person Household | 3 (42.9%) | 4 (57.1%) |
| 3-Person Household | 2 (100.0%) | 0 (0.0%) |
| 4+ Person Household | 0 (0.0%) | 0 (0.0%) |
| Total Housing Units | 5 (17.2%) | 24 (82.8%) |
Occupancy by Educational Attainment in Quintana
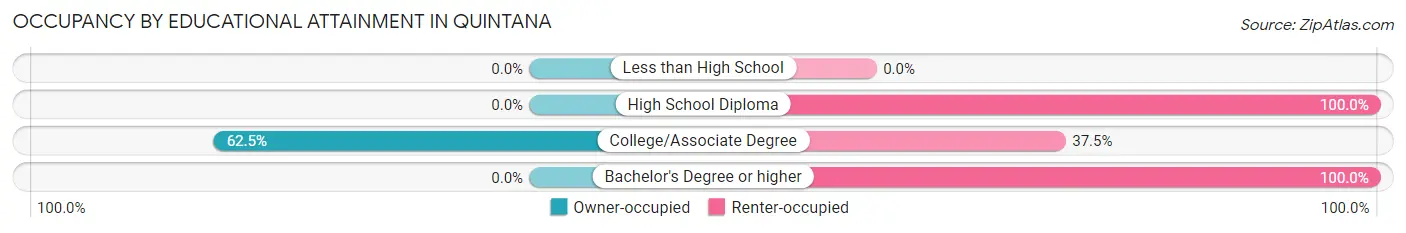
| Household Size | Owner-occupied | Renter-occupied |
| Less than High School | 0 (0.0%) | 0 (0.0%) |
| High School Diploma | 0 (0.0%) | 6 (100.0%) |
| College/Associate Degree | 5 (62.5%) | 3 (37.5%) |
| Bachelor's Degree or higher | 0 (0.0%) | 15 (100.0%) |
Occupancy by Age of Householder in Quintana
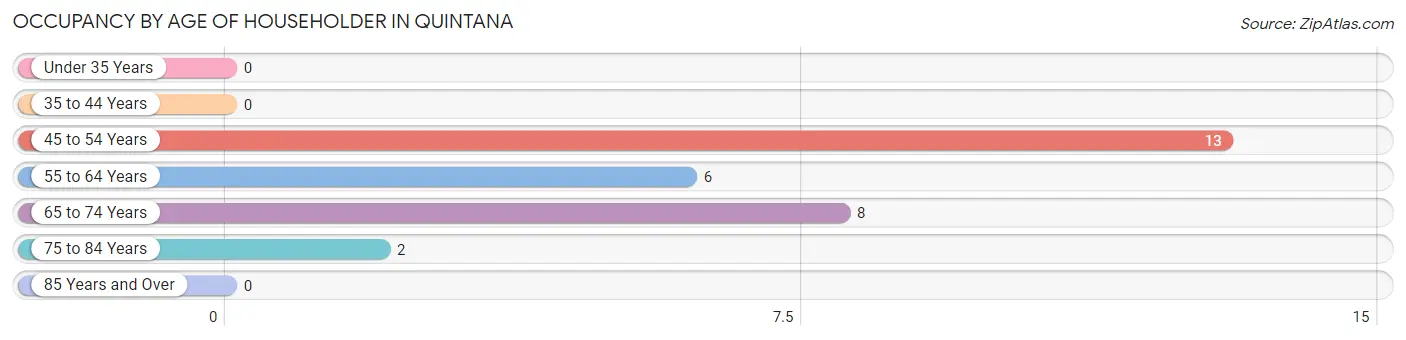
| Age Bracket | # Households | % Households |
| Under 35 Years | 0 | 0.0% |
| 35 to 44 Years | 0 | 0.0% |
| 45 to 54 Years | 13 | 44.8% |
| 55 to 64 Years | 6 | 20.7% |
| 65 to 74 Years | 8 | 27.6% |
| 75 to 84 Years | 2 | 6.9% |
| 85 Years and Over | 0 | 0.0% |
| Total | 29 | 100.0% |
Housing Finances in Quintana
Median Income by Occupancy in Quintana
| Occupancy Type | # Households | Median Income |
| Owner-Occupied | 5 (17.2%) | $0 |
| Renter-Occupied | 24 (82.8%) | $0 |
| Average | 29 (100.0%) | $0 |
Occupancy by Householder Income Bracket in Quintana
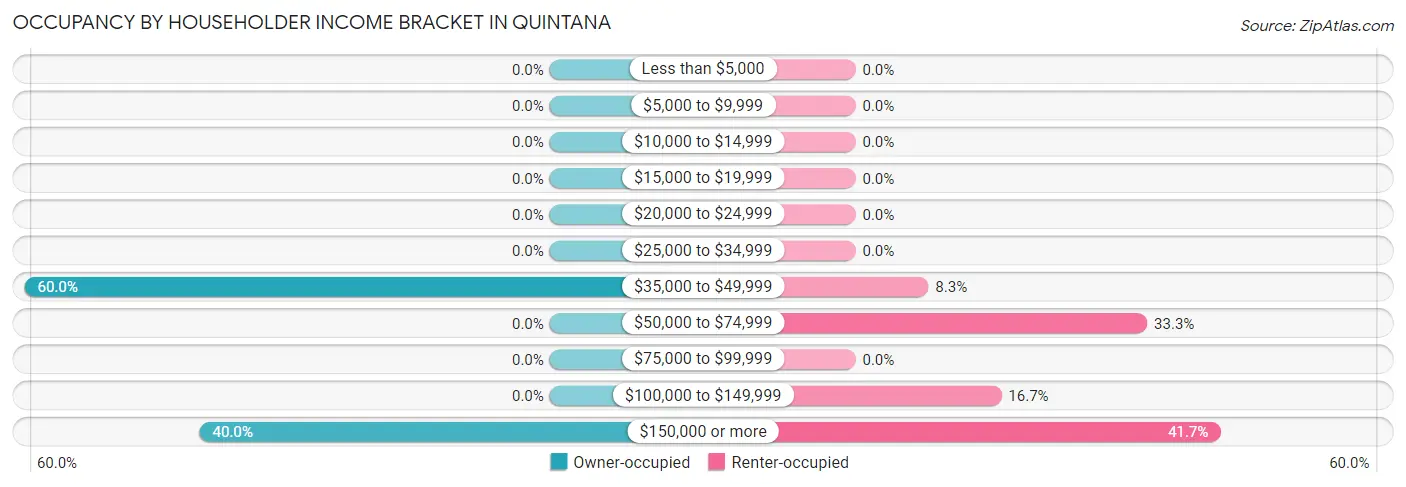
| Income Bracket | Owner-occupied | Renter-occupied |
| Less than $5,000 | 0 (0.0%) | 0 (0.0%) |
| $5,000 to $9,999 | 0 (0.0%) | 0 (0.0%) |
| $10,000 to $14,999 | 0 (0.0%) | 0 (0.0%) |
| $15,000 to $19,999 | 0 (0.0%) | 0 (0.0%) |
| $20,000 to $24,999 | 0 (0.0%) | 0 (0.0%) |
| $25,000 to $34,999 | 0 (0.0%) | 0 (0.0%) |
| $35,000 to $49,999 | 3 (60.0%) | 2 (8.3%) |
| $50,000 to $74,999 | 0 (0.0%) | 8 (33.3%) |
| $75,000 to $99,999 | 0 (0.0%) | 0 (0.0%) |
| $100,000 to $149,999 | 0 (0.0%) | 4 (16.7%) |
| $150,000 or more | 2 (40.0%) | 10 (41.7%) |
| Total | 5 (100.0%) | 24 (100.0%) |
Monthly Housing Cost Tiers in Quintana
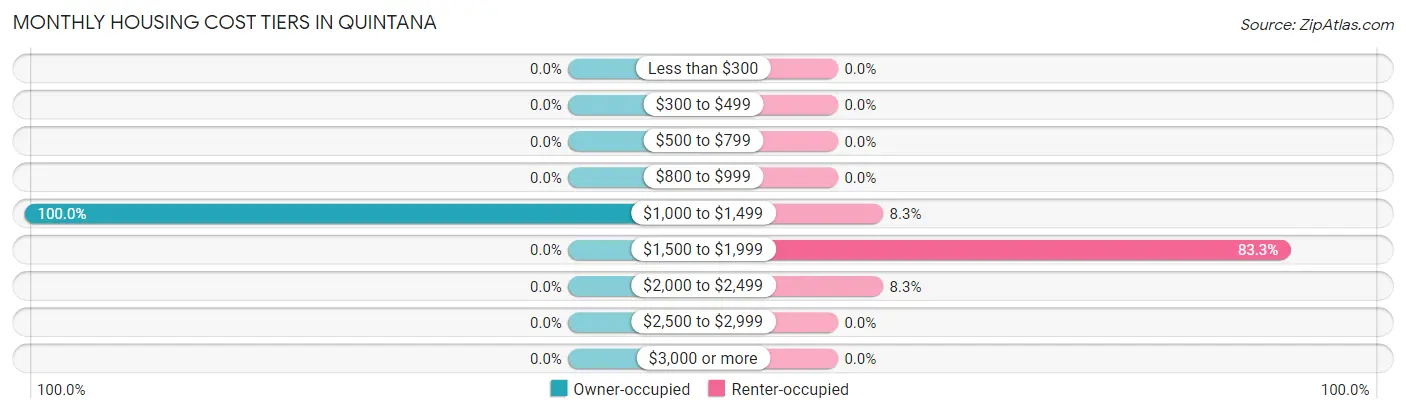
| Monthly Cost | Owner-occupied | Renter-occupied |
| Less than $300 | 0 (0.0%) | 0 (0.0%) |
| $300 to $499 | 0 (0.0%) | 0 (0.0%) |
| $500 to $799 | 0 (0.0%) | 0 (0.0%) |
| $800 to $999 | 0 (0.0%) | 0 (0.0%) |
| $1,000 to $1,499 | 5 (100.0%) | 2 (8.3%) |
| $1,500 to $1,999 | 0 (0.0%) | 20 (83.3%) |
| $2,000 to $2,499 | 0 (0.0%) | 2 (8.3%) |
| $2,500 to $2,999 | 0 (0.0%) | 0 (0.0%) |
| $3,000 or more | 0 (0.0%) | 0 (0.0%) |
| Total | 5 (100.0%) | 24 (100.0%) |
Physical Housing Characteristics in Quintana
Housing Structures in Quintana
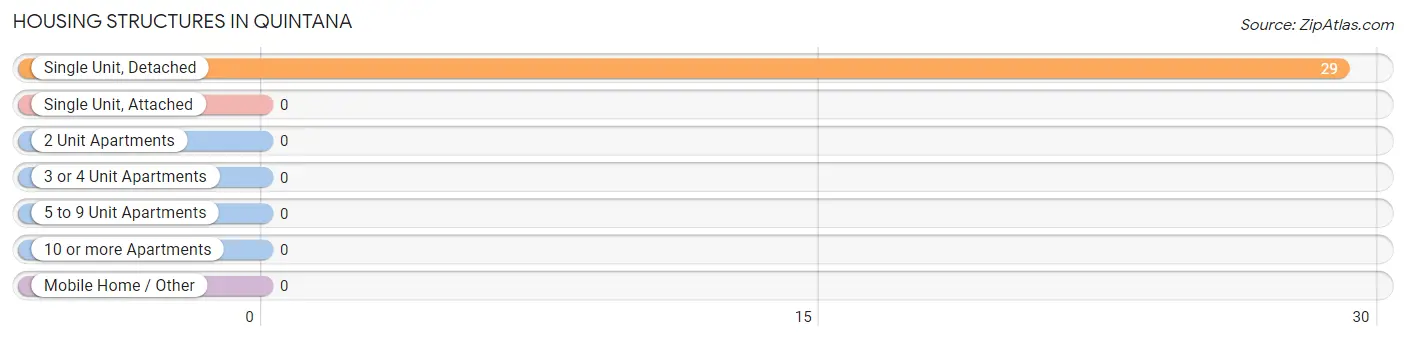
| Structure Type | # Housing Units | % Housing Units |
| Single Unit, Detached | 29 | 100.0% |
| Single Unit, Attached | 0 | 0.0% |
| 2 Unit Apartments | 0 | 0.0% |
| 3 or 4 Unit Apartments | 0 | 0.0% |
| 5 to 9 Unit Apartments | 0 | 0.0% |
| 10 or more Apartments | 0 | 0.0% |
| Mobile Home / Other | 0 | 0.0% |
| Total | 29 | 100.0% |
Housing Structures by Occupancy in Quintana
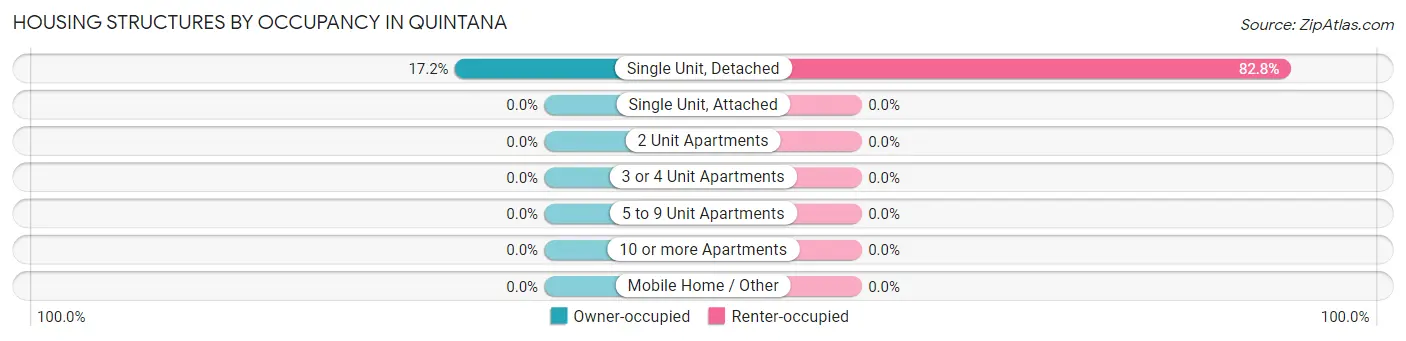
| Structure Type | Owner-occupied | Renter-occupied |
| Single Unit, Detached | 5 (17.2%) | 24 (82.8%) |
| Single Unit, Attached | 0 (0.0%) | 0 (0.0%) |
| 2 Unit Apartments | 0 (0.0%) | 0 (0.0%) |
| 3 or 4 Unit Apartments | 0 (0.0%) | 0 (0.0%) |
| 5 to 9 Unit Apartments | 0 (0.0%) | 0 (0.0%) |
| 10 or more Apartments | 0 (0.0%) | 0 (0.0%) |
| Mobile Home / Other | 0 (0.0%) | 0 (0.0%) |
| Total | 5 (17.2%) | 24 (82.8%) |
Housing Structures by Number of Rooms in Quintana
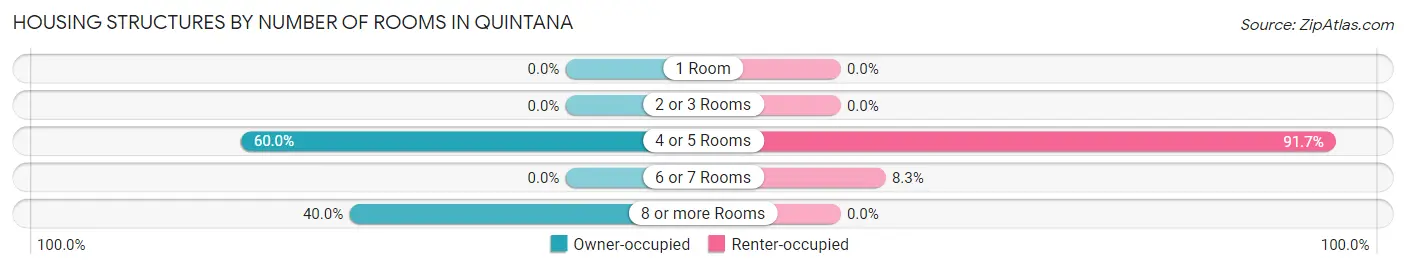
| Number of Rooms | Owner-occupied | Renter-occupied |
| 1 Room | 0 (0.0%) | 0 (0.0%) |
| 2 or 3 Rooms | 0 (0.0%) | 0 (0.0%) |
| 4 or 5 Rooms | 3 (60.0%) | 22 (91.7%) |
| 6 or 7 Rooms | 0 (0.0%) | 2 (8.3%) |
| 8 or more Rooms | 2 (40.0%) | 0 (0.0%) |
| Total | 5 (100.0%) | 24 (100.0%) |
Housing Structure by Heating Type in Quintana
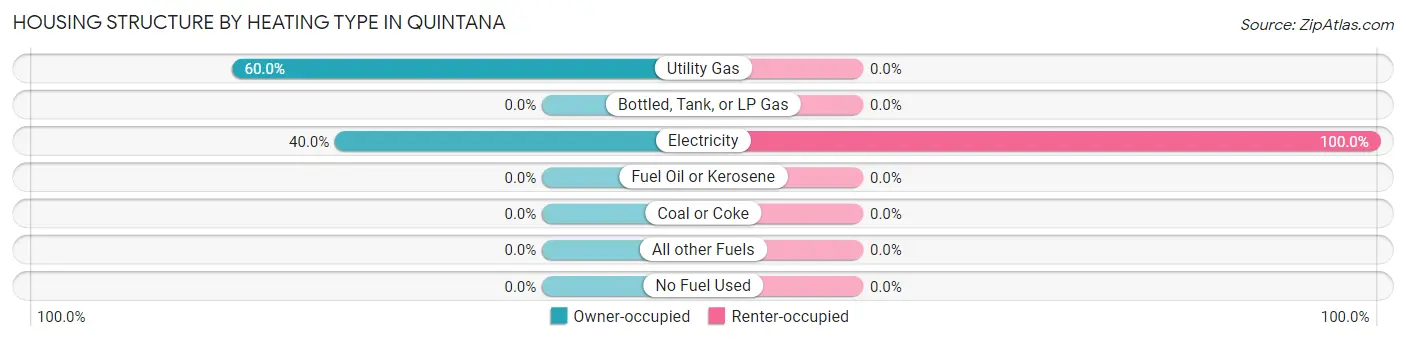
| Heating Type | Owner-occupied | Renter-occupied |
| Utility Gas | 3 (60.0%) | 0 (0.0%) |
| Bottled, Tank, or LP Gas | 0 (0.0%) | 0 (0.0%) |
| Electricity | 2 (40.0%) | 24 (100.0%) |
| Fuel Oil or Kerosene | 0 (0.0%) | 0 (0.0%) |
| Coal or Coke | 0 (0.0%) | 0 (0.0%) |
| All other Fuels | 0 (0.0%) | 0 (0.0%) |
| No Fuel Used | 0 (0.0%) | 0 (0.0%) |
| Total | 5 (100.0%) | 24 (100.0%) |
Household Vehicle Usage in Quintana
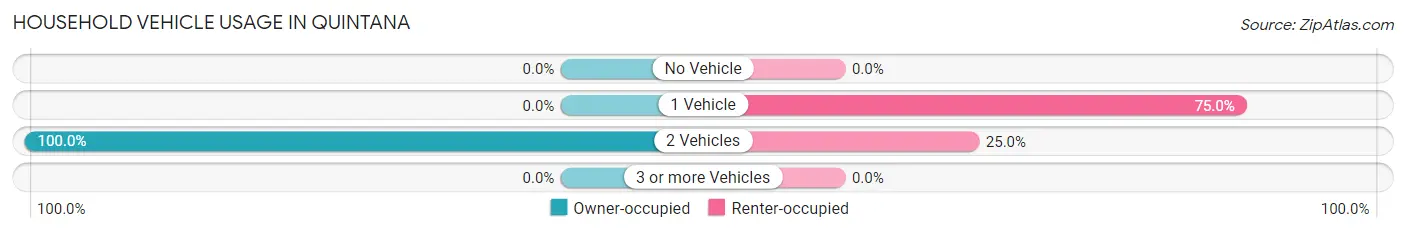
| Vehicles per Household | Owner-occupied | Renter-occupied |
| No Vehicle | 0 (0.0%) | 0 (0.0%) |
| 1 Vehicle | 0 (0.0%) | 18 (75.0%) |
| 2 Vehicles | 5 (100.0%) | 6 (25.0%) |
| 3 or more Vehicles | 0 (0.0%) | 0 (0.0%) |
| Total | 5 (100.0%) | 24 (100.0%) |
Real Estate & Mortgages in Quintana
Real Estate and Mortgage Overview in Quintana
| Characteristic | Without Mortgage | With Mortgage |
| Housing Units | 5 | 0 |
| Median Property Value | - | - |
| Median Household Income | - | - |
| Monthly Housing Costs | - | - |
| Real Estate Taxes | - | - |
Property Value by Mortgage Status in Quintana
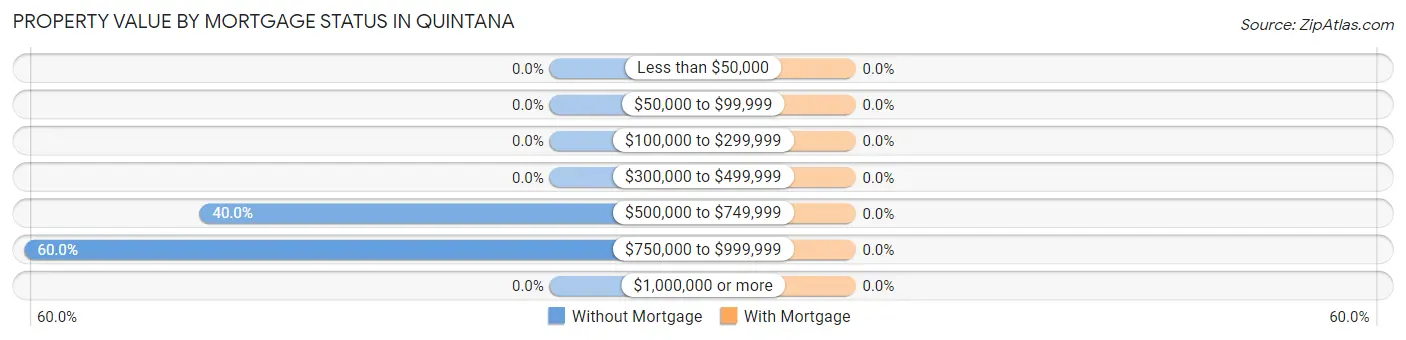
| Property Value | Without Mortgage | With Mortgage |
| Less than $50,000 | 0 (0.0%) | 0 (0.0%) |
| $50,000 to $99,999 | 0 (0.0%) | 0 (0.0%) |
| $100,000 to $299,999 | 0 (0.0%) | 0 (0.0%) |
| $300,000 to $499,999 | 0 (0.0%) | 0 (0.0%) |
| $500,000 to $749,999 | 2 (40.0%) | 0 (0.0%) |
| $750,000 to $999,999 | 3 (60.0%) | 0 (0.0%) |
| $1,000,000 or more | 0 (0.0%) | 0 (0.0%) |
| Total | 5 (100.0%) | 0 (0.0%) |
Household Income by Mortgage Status in Quintana
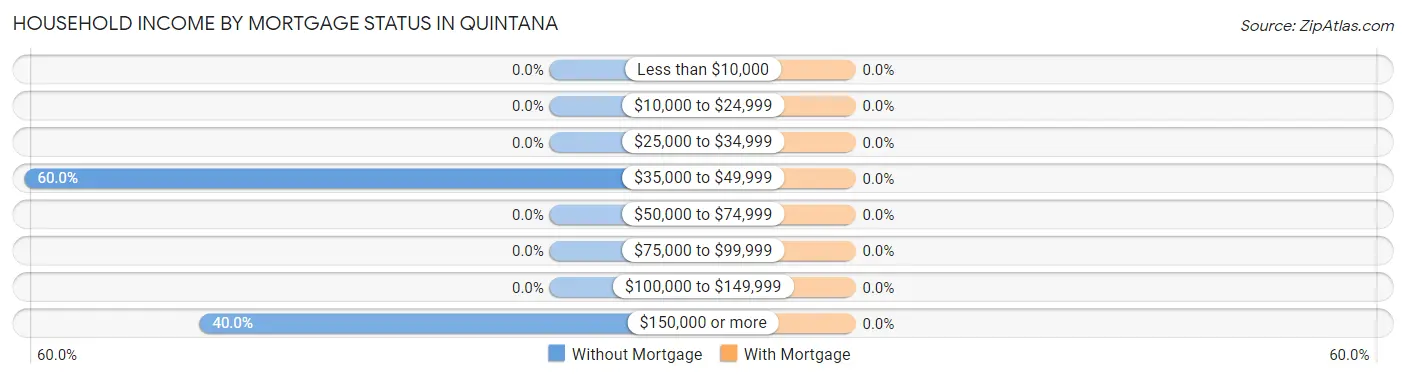
| Household Income | Without Mortgage | With Mortgage |
| Less than $10,000 | 0 (0.0%) | 0 (0.0%) |
| $10,000 to $24,999 | 0 (0.0%) | 0 (0.0%) |
| $25,000 to $34,999 | 0 (0.0%) | 0 (0.0%) |
| $35,000 to $49,999 | 3 (60.0%) | 0 (0.0%) |
| $50,000 to $74,999 | 0 (0.0%) | 0 (0.0%) |
| $75,000 to $99,999 | 0 (0.0%) | 0 (0.0%) |
| $100,000 to $149,999 | 0 (0.0%) | 0 (0.0%) |
| $150,000 or more | 2 (40.0%) | 0 (0.0%) |
| Total | 5 (100.0%) | 0 (0.0%) |
Property Value to Household Income Ratio in Quintana
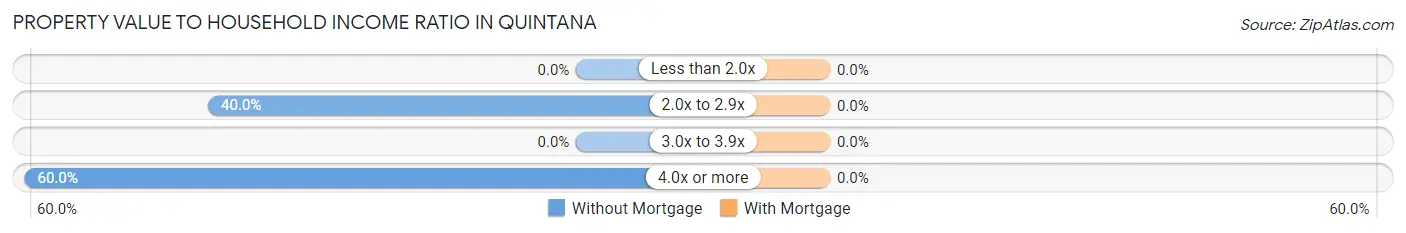
| Value-to-Income Ratio | Without Mortgage | With Mortgage |
| Less than 2.0x | 0 (0.0%) | 0 (0.0%) |
| 2.0x to 2.9x | 2 (40.0%) | 0 (0.0%) |
| 3.0x to 3.9x | 0 (0.0%) | 0 (0.0%) |
| 4.0x or more | 3 (60.0%) | 0 (0.0%) |
| Total | 5 (100.0%) | 0 (0.0%) |
Real Estate Taxes by Mortgage Status in Quintana
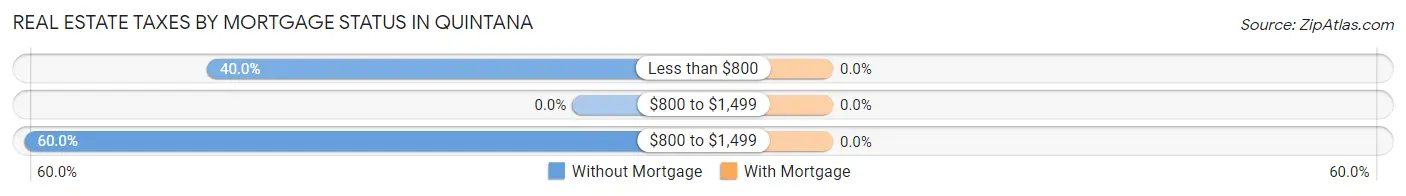
| Property Taxes | Without Mortgage | With Mortgage |
| Less than $800 | 2 (40.0%) | 0 (0.0%) |
| $800 to $1,499 | 0 (0.0%) | 0 (0.0%) |
| $800 to $1,499 | 3 (60.0%) | 0 (0.0%) |
| Total | 5 (100.0%) | 0 (0.0%) |
Health & Disability in Quintana
Health Insurance Coverage by Age in Quintana
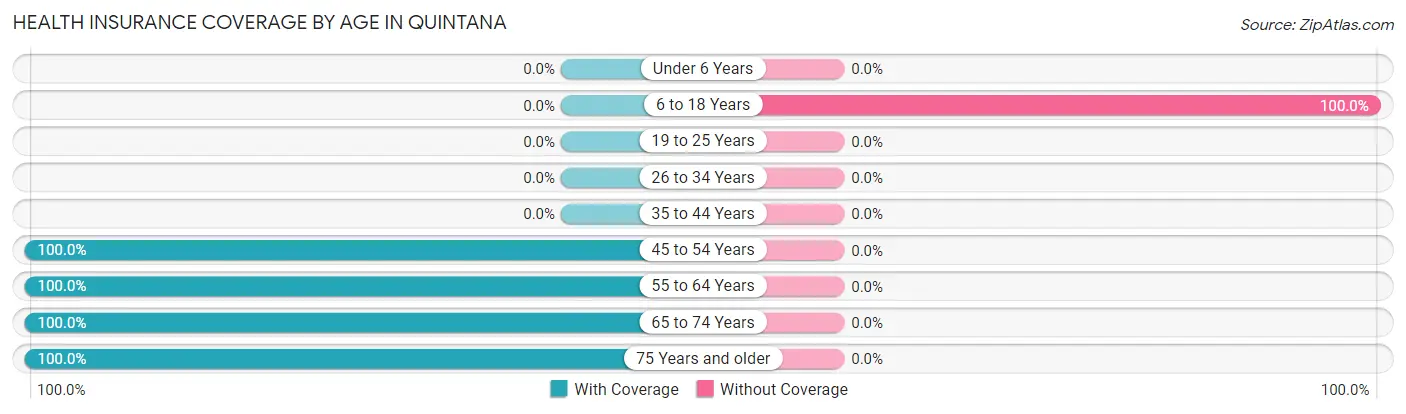
| Age Bracket | With Coverage | Without Coverage |
| Under 6 Years | 0 (0.0%) | 0 (0.0%) |
| 6 to 18 Years | 0 (0.0%) | 3 (100.0%) |
| 19 to 25 Years | 0 (0.0%) | 0 (0.0%) |
| 26 to 34 Years | 0 (0.0%) | 0 (0.0%) |
| 35 to 44 Years | 0 (0.0%) | 0 (0.0%) |
| 45 to 54 Years | 15 (100.0%) | 0 (0.0%) |
| 55 to 64 Years | 13 (100.0%) | 0 (0.0%) |
| 65 to 74 Years | 8 (100.0%) | 0 (0.0%) |
| 75 Years and older | 2 (100.0%) | 0 (0.0%) |
| Total | 38 (92.7%) | 3 (7.3%) |
Health Insurance Coverage by Citizenship Status in Quintana
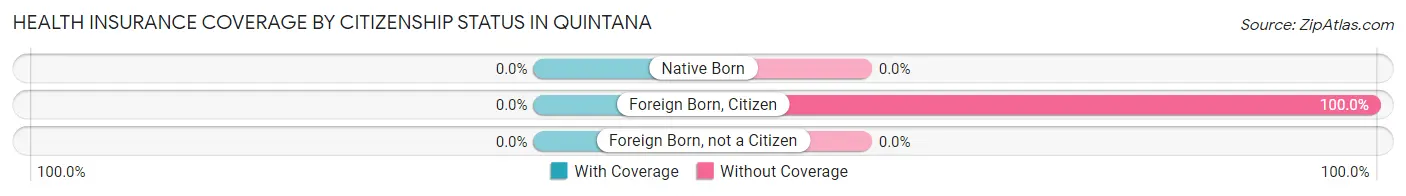
| Citizenship Status | With Coverage | Without Coverage |
| Native Born | 0 (0.0%) | 0 (0.0%) |
| Foreign Born, Citizen | 0 (0.0%) | 3 (100.0%) |
| Foreign Born, not a Citizen | 0 (0.0%) | 0 (0.0%) |
Health Insurance Coverage by Household Income in Quintana
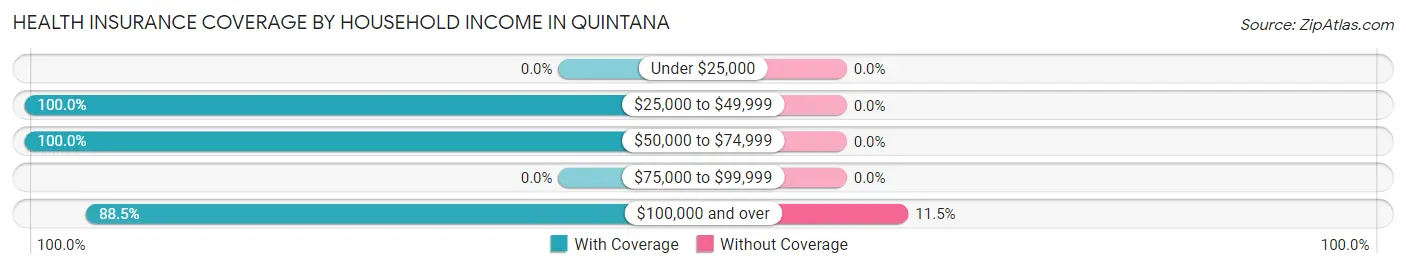
| Household Income | With Coverage | Without Coverage |
| Under $25,000 | 0 (0.0%) | 0 (0.0%) |
| $25,000 to $49,999 | 7 (100.0%) | 0 (0.0%) |
| $50,000 to $74,999 | 8 (100.0%) | 0 (0.0%) |
| $75,000 to $99,999 | 0 (0.0%) | 0 (0.0%) |
| $100,000 and over | 23 (88.5%) | 3 (11.5%) |
Public vs Private Health Insurance Coverage by Age in Quintana
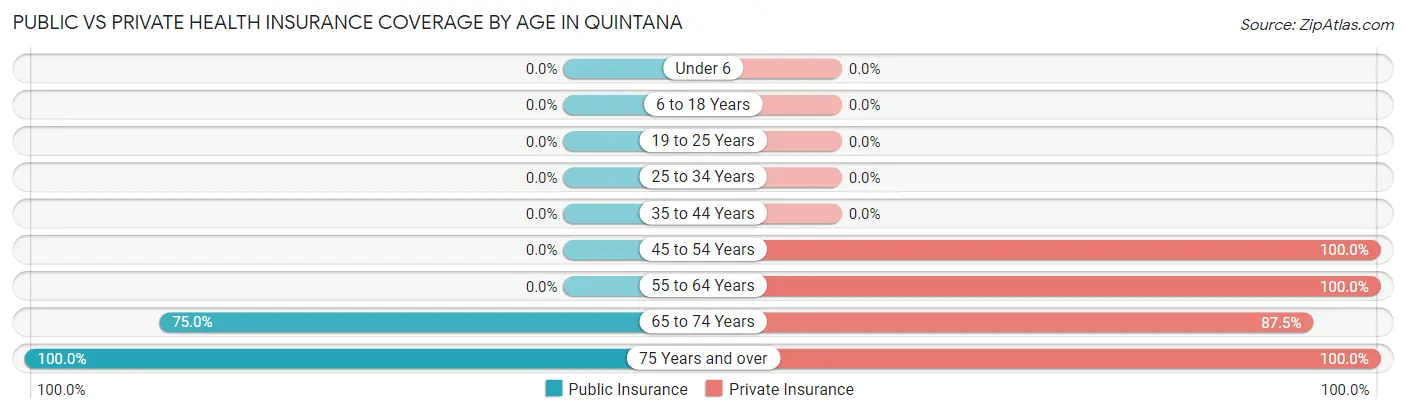
| Age Bracket | Public Insurance | Private Insurance |
| Under 6 | 0 (0.0%) | 0 (0.0%) |
| 6 to 18 Years | 0 (0.0%) | 0 (0.0%) |
| 19 to 25 Years | 0 (0.0%) | 0 (0.0%) |
| 25 to 34 Years | 0 (0.0%) | 0 (0.0%) |
| 35 to 44 Years | 0 (0.0%) | 0 (0.0%) |
| 45 to 54 Years | 0 (0.0%) | 15 (100.0%) |
| 55 to 64 Years | 0 (0.0%) | 13 (100.0%) |
| 65 to 74 Years | 6 (75.0%) | 7 (87.5%) |
| 75 Years and over | 2 (100.0%) | 2 (100.0%) |
| Total | 8 (19.5%) | 37 (90.2%) |
Disability Status by Sex by Age in Quintana
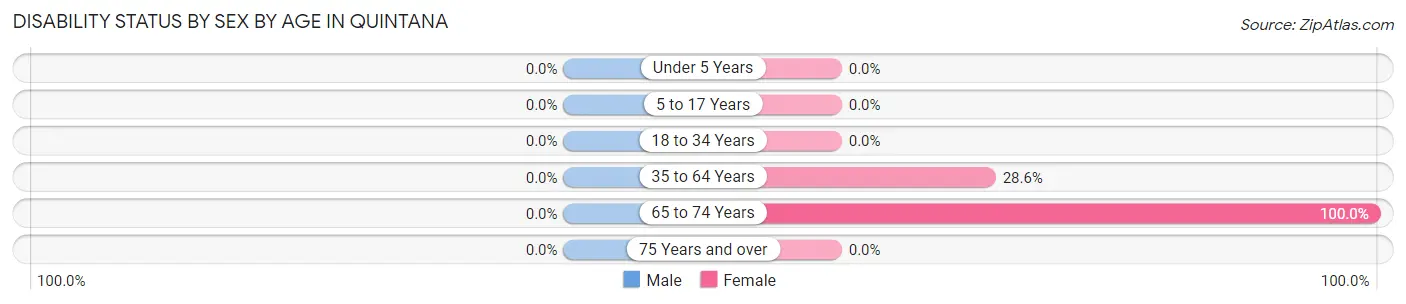
| Age Bracket | Male | Female |
| Under 5 Years | 0 (0.0%) | 0 (0.0%) |
| 5 to 17 Years | 0 (0.0%) | 0 (0.0%) |
| 18 to 34 Years | 0 (0.0%) | 0 (0.0%) |
| 35 to 64 Years | 0 (0.0%) | 2 (28.6%) |
| 65 to 74 Years | 0 (0.0%) | 3 (100.0%) |
| 75 Years and over | 0 (0.0%) | 0 (0.0%) |
Disability Class by Sex by Age in Quintana
Disability Class: Hearing Difficulty
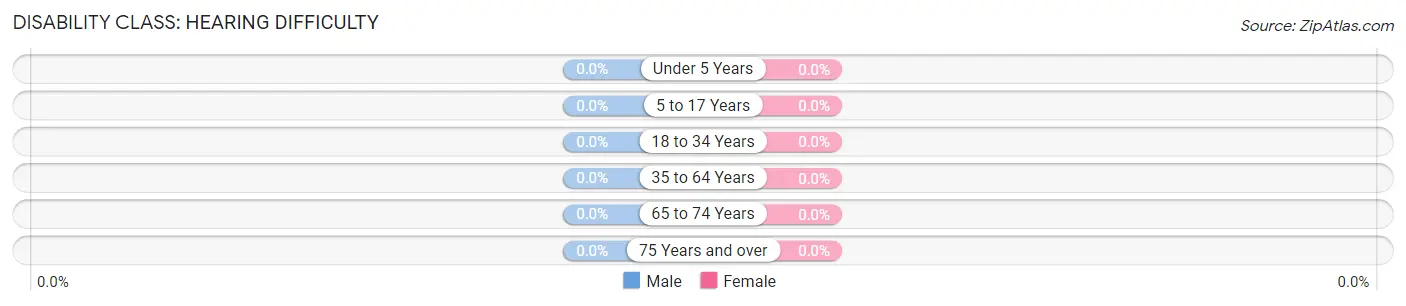
| Age Bracket | Male | Female |
| Under 5 Years | 0 (0.0%) | 0 (0.0%) |
| 5 to 17 Years | 0 (0.0%) | 0 (0.0%) |
| 18 to 34 Years | 0 (0.0%) | 0 (0.0%) |
| 35 to 64 Years | 0 (0.0%) | 0 (0.0%) |
| 65 to 74 Years | 0 (0.0%) | 0 (0.0%) |
| 75 Years and over | 0 (0.0%) | 0 (0.0%) |
Disability Class: Vision Difficulty
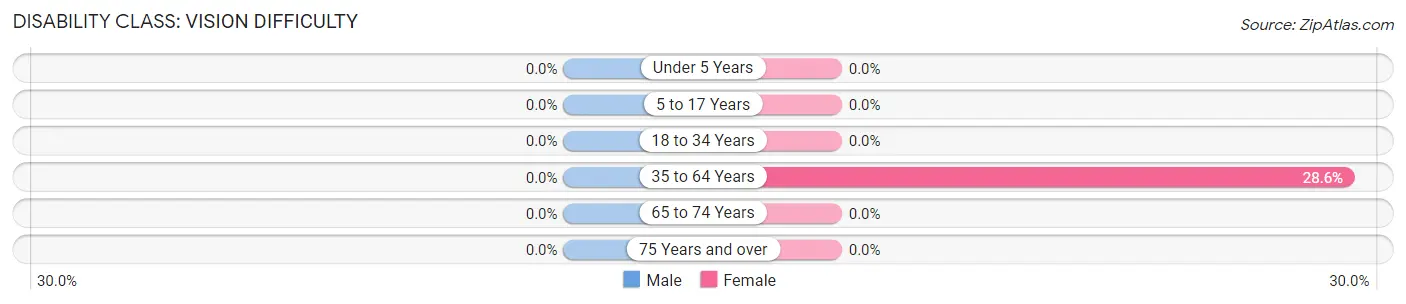
| Age Bracket | Male | Female |
| Under 5 Years | 0 (0.0%) | 0 (0.0%) |
| 5 to 17 Years | 0 (0.0%) | 0 (0.0%) |
| 18 to 34 Years | 0 (0.0%) | 0 (0.0%) |
| 35 to 64 Years | 0 (0.0%) | 2 (28.6%) |
| 65 to 74 Years | 0 (0.0%) | 0 (0.0%) |
| 75 Years and over | 0 (0.0%) | 0 (0.0%) |
Disability Class: Cognitive Difficulty
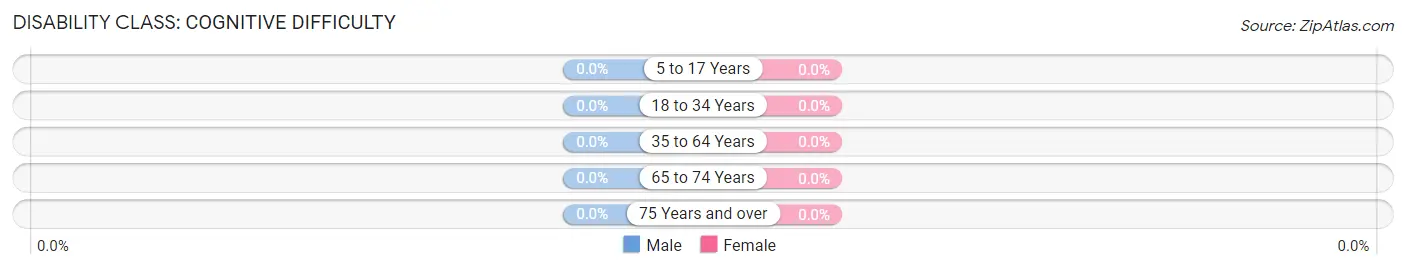
| Age Bracket | Male | Female |
| 5 to 17 Years | 0 (0.0%) | 0 (0.0%) |
| 18 to 34 Years | 0 (0.0%) | 0 (0.0%) |
| 35 to 64 Years | 0 (0.0%) | 0 (0.0%) |
| 65 to 74 Years | 0 (0.0%) | 0 (0.0%) |
| 75 Years and over | 0 (0.0%) | 0 (0.0%) |
Disability Class: Ambulatory Difficulty
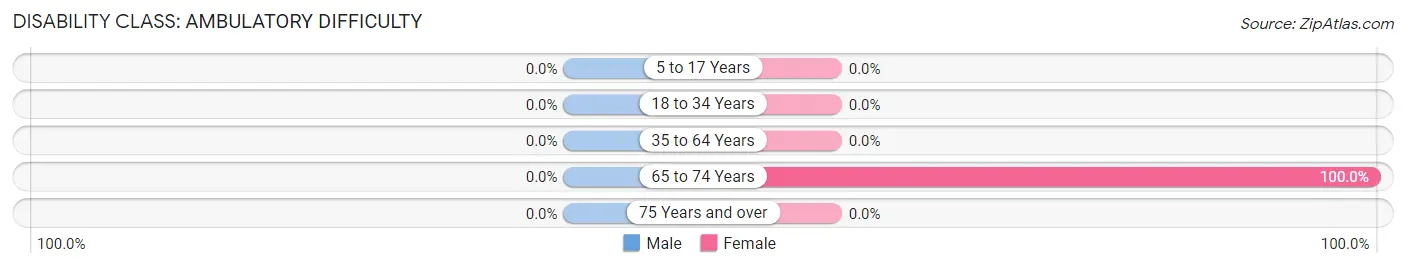
| Age Bracket | Male | Female |
| 5 to 17 Years | 0 (0.0%) | 0 (0.0%) |
| 18 to 34 Years | 0 (0.0%) | 0 (0.0%) |
| 35 to 64 Years | 0 (0.0%) | 0 (0.0%) |
| 65 to 74 Years | 0 (0.0%) | 3 (100.0%) |
| 75 Years and over | 0 (0.0%) | 0 (0.0%) |
Disability Class: Self-Care Difficulty
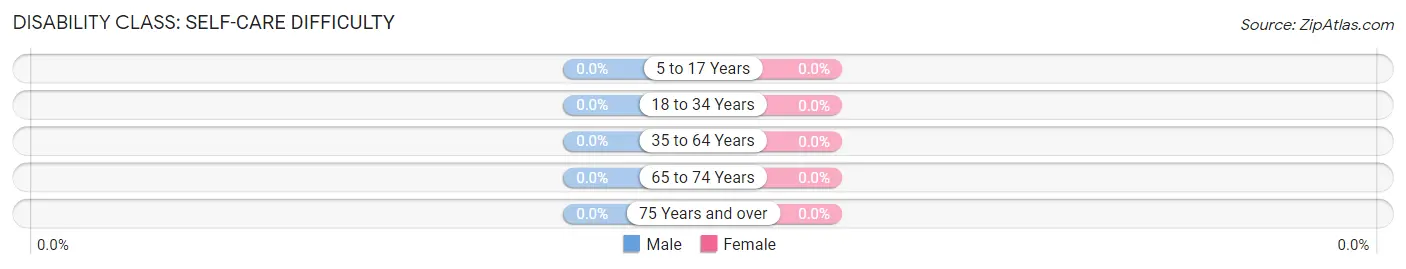
| Age Bracket | Male | Female |
| 5 to 17 Years | 0 (0.0%) | 0 (0.0%) |
| 18 to 34 Years | 0 (0.0%) | 0 (0.0%) |
| 35 to 64 Years | 0 (0.0%) | 0 (0.0%) |
| 65 to 74 Years | 0 (0.0%) | 0 (0.0%) |
| 75 Years and over | 0 (0.0%) | 0 (0.0%) |
Technology Access in Quintana
Computing Device Access in Quintana
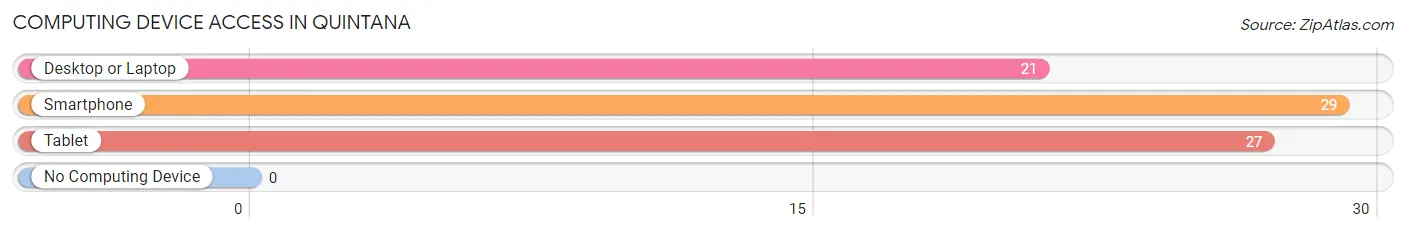
| Device Type | # Households | % Households |
| Desktop or Laptop | 21 | 72.4% |
| Smartphone | 29 | 100.0% |
| Tablet | 27 | 93.1% |
| No Computing Device | 0 | 0.0% |
| Total | 29 | 100.0% |
Internet Access in Quintana
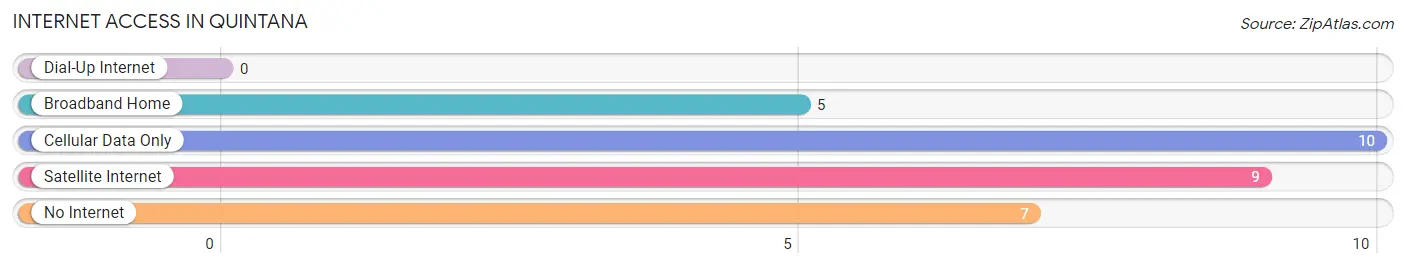
| Internet Type | # Households | % Households |
| Dial-Up Internet | 0 | 0.0% |
| Broadband Home | 5 | 17.2% |
| Cellular Data Only | 10 | 34.5% |
| Satellite Internet | 9 | 31.0% |
| No Internet | 7 | 24.1% |
| Total | 29 | 100.0% |
Quintana Summary
Quintana is a small town located in Brazoria County, Texas, United States. It is situated on the Gulf Coast, approximately 40 miles south of Houston. The town was founded in 1891 and named after the Quintana family, who were among the first settlers in the area. As of the 2010 census, the population of Quintana was 545.
Geography
Quintana is located at the intersection of State Highway 36 and Farm to Market Road 521, approximately 40 miles south of Houston. The town is situated on the Gulf Coast, and is bordered by the San Bernard River to the east and the Brazos River to the west. The terrain is mostly flat, with some rolling hills in the area. The climate is humid subtropical, with hot summers and mild winters.
Economy
The economy of Quintana is largely based on tourism and fishing. The town is home to several marinas, which provide access to the Gulf of Mexico for recreational fishing and boating. There are also several restaurants and bars in the area, which cater to tourists and locals alike. Additionally, Quintana is home to a number of small businesses, including a grocery store, a hardware store, and a gas station.
Demographics
As of the 2010 census, the population of Quintana was 545. The racial makeup of the town was 79.2% White, 15.2% Hispanic or Latino, 2.2% African American, 0.7% Native American, 0.4% Asian, and 2.3% from other races. The median household income was $37,500, and the median family income was $41,250.
The majority of the population (77.3%) was over the age of 18, and the median age was 37.5. The population was spread out, with 24.3% under the age of 18, 8.2% from 18 to 24, 28.2% from 25 to 44, 24.3% from 45 to 64, and 14.9% who were 65 years of age or older.
Conclusion
Quintana is a small town located in Brazoria County, Texas, United States. It is situated on the Gulf Coast, approximately 40 miles south of Houston. The town was founded in 1891 and named after the Quintana family, who were among the first settlers in the area. As of the 2010 census, the population of Quintana was 545. The economy of Quintana is largely based on tourism and fishing, and the town is home to several marinas, restaurants, and small businesses. The racial makeup of the town was 79.2% White, 15.2% Hispanic or Latino, 2.2% African American, 0.7% Native American, 0.4% Asian, and 2.3% from other races. The median household income was $37,500, and the median family income was $41,250.
Common Questions
What is Per Capita Income in Quintana?
Per Capita income in Quintana is $185,624.
What is Inequality or Gini Index in Quintana?
Inequality or Gini Index in Quintana is 0.60.
What is the Total Population of Quintana?
Total Population of Quintana is 41.
What is the Total Male Population of Quintana?
Total Male Population of Quintana is 29.
What is the Total Female Population of Quintana?
Total Female Population of Quintana is 12.
What is the Ratio of Males per 100 Females in Quintana?
There are 241.67 Males per 100 Females in Quintana.
What is the Ratio of Females per 100 Males in Quintana?
There are 41.38 Females per 100 Males in Quintana.
What is the Median Population Age in Quintana?
Median Population Age in Quintana is 58.8 Years.
What is the Average Family Size in Quintana
Average Family Size in Quintana is 2.3 People.
What is the Average Household Size in Quintana
Average Household Size in Quintana is 1.4 People.
How Large is the Labor Force in Quintana?
There are 33 People in the Labor Forcein in Quintana.
What is the Percentage of People in the Labor Force in Quintana?
86.8% of People are in the Labor Force in Quintana.