Northdale, FL Map & Demographics
Northdale Map
Northdale Overview
$42,319
PER CAPITA INCOME
$108,203
AVG FAMILY INCOME
$92,824
AVG HOUSEHOLD INCOME
18.7%
WAGE / INCOME GAP [ % ]
81.3¢/ $1
WAGE / INCOME GAP [ $ ]
$8,576
FAMILY INCOME DEFICIT
0.38
INEQUALITY / GINI INDEX
26,079
TOTAL POPULATION
12,483
MALE POPULATION
13,596
FEMALE POPULATION
91.81
MALES / 100 FEMALES
108.92
FEMALES / 100 MALES
41.6
MEDIAN AGE
3.2
AVG FAMILY SIZE
2.7
AVG HOUSEHOLD SIZE
15,044
LABOR FORCE [ PEOPLE ]
70.3%
PERCENT IN LABOR FORCE
3.3%
UNEMPLOYMENT RATE
Income in Northdale
Income Overview in Northdale
Per Capita Income in Northdale is $42,319, while median incomes of families and households are $108,203 and $92,824 respectively.
| Characteristic | Number | Measure |
| Per Capita Income | 26,079 | $42,319 |
| Median Family Income | 6,837 | $108,203 |
| Mean Family Income | 6,837 | $128,895 |
| Median Household Income | 9,560 | $92,824 |
| Mean Household Income | 9,560 | $112,884 |
| Income Deficit | 6,837 | $8,576 |
| Wage / Income Gap (%) | 26,079 | 18.67% |
| Wage / Income Gap ($) | 26,079 | 81.33¢ per $1 |
| Gini / Inequality Index | 26,079 | 0.38 |
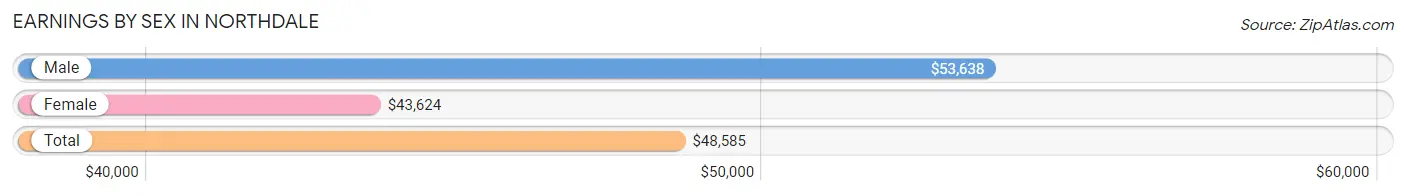
Earnings by Sex in Northdale
Average Earnings in Northdale are $48,585, $53,638 for men and $43,624 for women, a difference of 18.7%.
| Sex | Number | Average Earnings |
| Male | 8,017 (52.0%) | $53,638 |
| Female | 7,412 (48.0%) | $43,624 |
| Total | 15,429 (100.0%) | $48,585 |
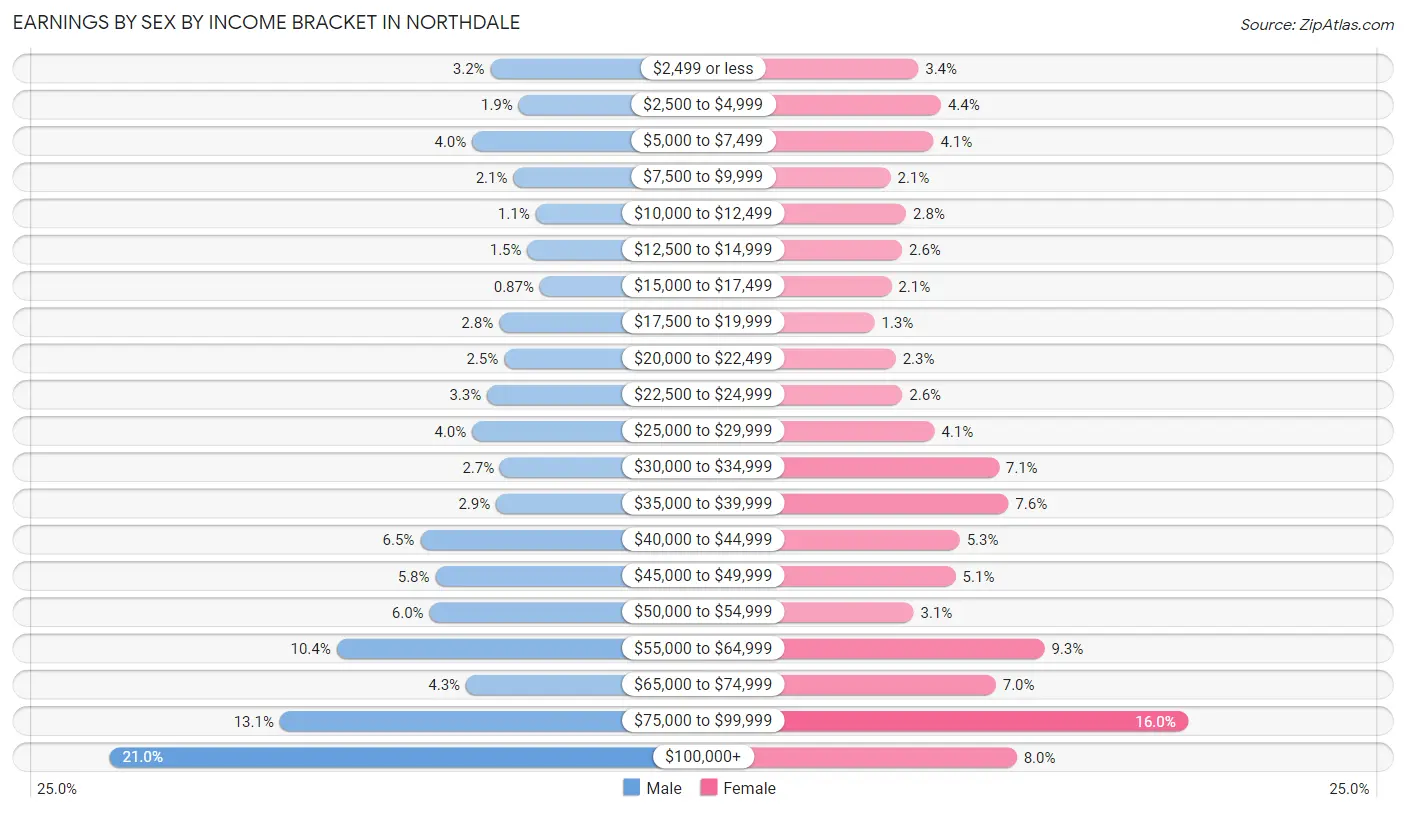
Earnings by Sex by Income Bracket in Northdale
The most common earnings brackets in Northdale are $100,000+ for men (1,685 | 21.0%) and $75,000 to $99,999 for women (1,183 | 16.0%).
| Income | Male | Female |
| $2,499 or less | 255 (3.2%) | 248 (3.4%) |
| $2,500 to $4,999 | 149 (1.9%) | 327 (4.4%) |
| $5,000 to $7,499 | 324 (4.0%) | 301 (4.1%) |
| $7,500 to $9,999 | 169 (2.1%) | 152 (2.1%) |
| $10,000 to $12,499 | 86 (1.1%) | 206 (2.8%) |
| $12,500 to $14,999 | 116 (1.5%) | 192 (2.6%) |
| $15,000 to $17,499 | 70 (0.9%) | 155 (2.1%) |
| $17,500 to $19,999 | 223 (2.8%) | 96 (1.3%) |
| $20,000 to $22,499 | 204 (2.5%) | 170 (2.3%) |
| $22,500 to $24,999 | 268 (3.3%) | 193 (2.6%) |
| $25,000 to $29,999 | 324 (4.0%) | 305 (4.1%) |
| $30,000 to $34,999 | 219 (2.7%) | 528 (7.1%) |
| $35,000 to $39,999 | 234 (2.9%) | 561 (7.6%) |
| $40,000 to $44,999 | 519 (6.5%) | 392 (5.3%) |
| $45,000 to $49,999 | 462 (5.8%) | 378 (5.1%) |
| $50,000 to $54,999 | 484 (6.0%) | 232 (3.1%) |
| $55,000 to $64,999 | 833 (10.4%) | 686 (9.3%) |
| $65,000 to $74,999 | 347 (4.3%) | 517 (7.0%) |
| $75,000 to $99,999 | 1,046 (13.1%) | 1,183 (16.0%) |
| $100,000+ | 1,685 (21.0%) | 590 (8.0%) |
| Total | 8,017 (100.0%) | 7,412 (100.0%) |
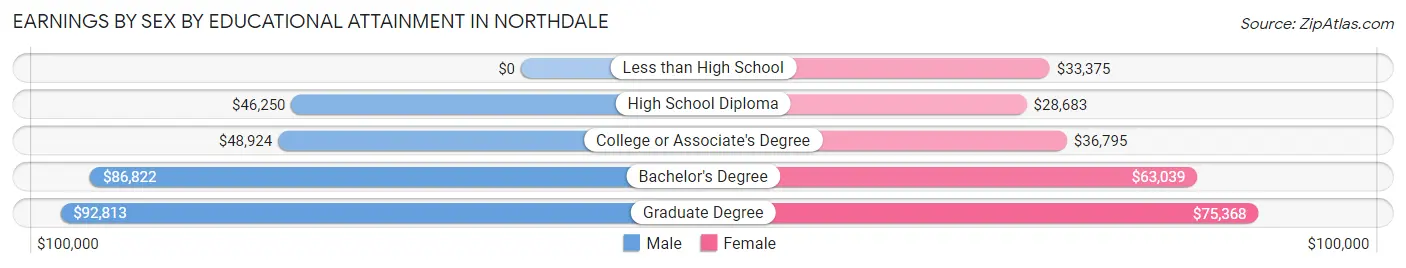
Earnings by Sex by Educational Attainment in Northdale
Average earnings in Northdale are $57,710 for men and $48,596 for women, a difference of 15.8%. Men with an educational attainment of graduate degree enjoy the highest average annual earnings of $92,813, while those with high school diploma education earn the least with $46,250. Women with an educational attainment of graduate degree earn the most with the average annual earnings of $75,368, while those with high school diploma education have the smallest earnings of $28,683.
| Educational Attainment | Male Income | Female Income |
| Less than High School | - | - |
| High School Diploma | $46,250 | $28,683 |
| College or Associate's Degree | $48,924 | $36,795 |
| Bachelor's Degree | $86,822 | $63,039 |
| Graduate Degree | $92,813 | $75,368 |
| Total | $57,710 | $48,596 |
Family Income in Northdale
Family Income Brackets in Northdale
According to the Northdale family income data, there are 1,538 families falling into the $150,000 to $199,999 income range, which is the most common income bracket and makes up 22.5% of all families. Conversely, the $10,000 to $14,999 income bracket is the least frequent group with only 34 families (0.5%) belonging to this category.
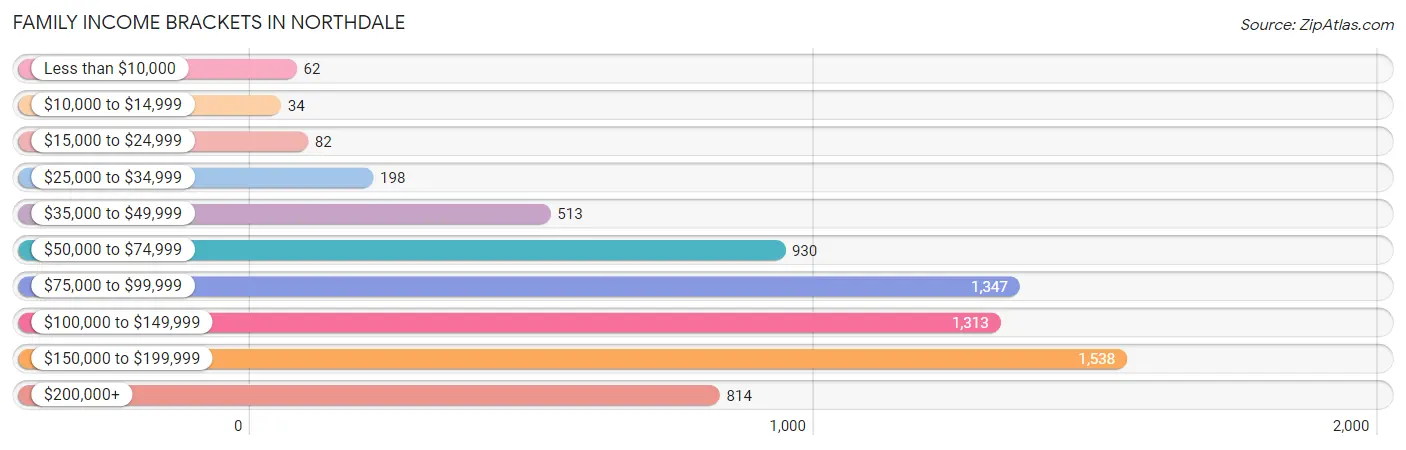
| Income Bracket | # Families | % Families |
| Less than $10,000 | 62 | 0.9% |
| $10,000 to $14,999 | 34 | 0.5% |
| $15,000 to $24,999 | 82 | 1.2% |
| $25,000 to $34,999 | 198 | 2.9% |
| $35,000 to $49,999 | 513 | 7.5% |
| $50,000 to $74,999 | 930 | 13.6% |
| $75,000 to $99,999 | 1,347 | 19.7% |
| $100,000 to $149,999 | 1,313 | 19.2% |
| $150,000 to $199,999 | 1,538 | 22.5% |
| $200,000+ | 814 | 11.9% |
Family Income by Famaliy Size in Northdale
5-person families (457 | 6.7%) account for the highest median family income in Northdale with $144,482 per family, while 3-person families (1,949 | 28.5%) have the highest median income of $46,358 per family member.
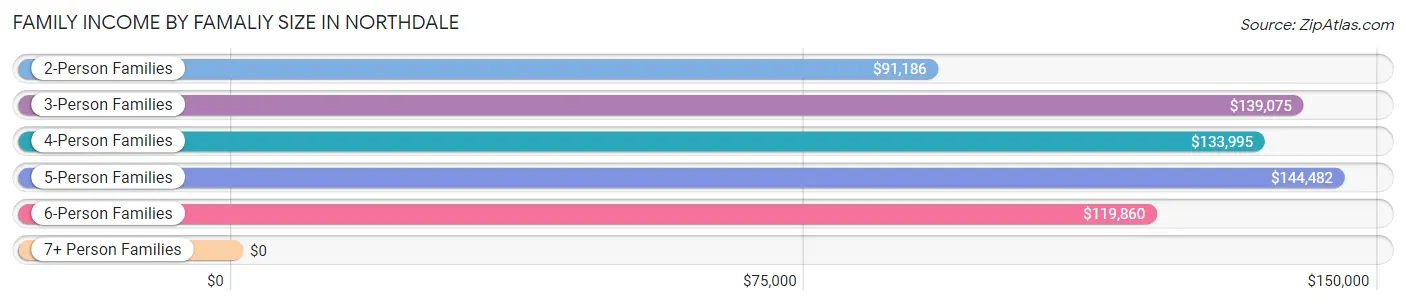
| Income Bracket | # Families | Median Income |
| 2-Person Families | 2,792 (40.8%) | $91,186 |
| 3-Person Families | 1,949 (28.5%) | $139,075 |
| 4-Person Families | 1,355 (19.8%) | $133,995 |
| 5-Person Families | 457 (6.7%) | $144,482 |
| 6-Person Families | 252 (3.7%) | $119,860 |
| 7+ Person Families | 32 (0.5%) | $0 |
| Total | 6,837 (100.0%) | $108,203 |
Family Income by Number of Earners in Northdale
The median family income in Northdale is $108,203, with families comprising 2 earners (3,725) having the highest median family income of $138,114, while families with no earners (543) have the lowest median family income of $67,569, accounting for 54.5% and 7.9% of families, respectively.
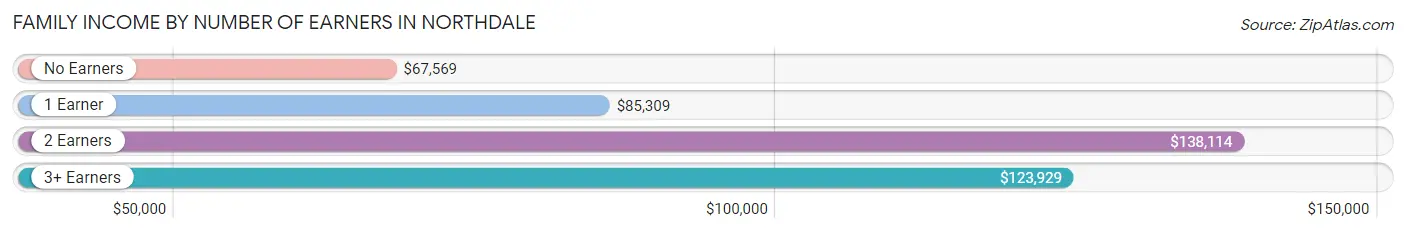
| Number of Earners | # Families | Median Income |
| No Earners | 543 (7.9%) | $67,569 |
| 1 Earner | 1,675 (24.5%) | $85,309 |
| 2 Earners | 3,725 (54.5%) | $138,114 |
| 3+ Earners | 894 (13.1%) | $123,929 |
| Total | 6,837 (100.0%) | $108,203 |
Household Income in Northdale
Household Income Brackets in Northdale
With 1,711 households falling in the category, the $100,000 to $149,999 income range is the most frequent in Northdale, accounting for 17.9% of all households. In contrast, only 115 households (1.2%) fall into the $10,000 to $14,999 income bracket, making it the least populous group.
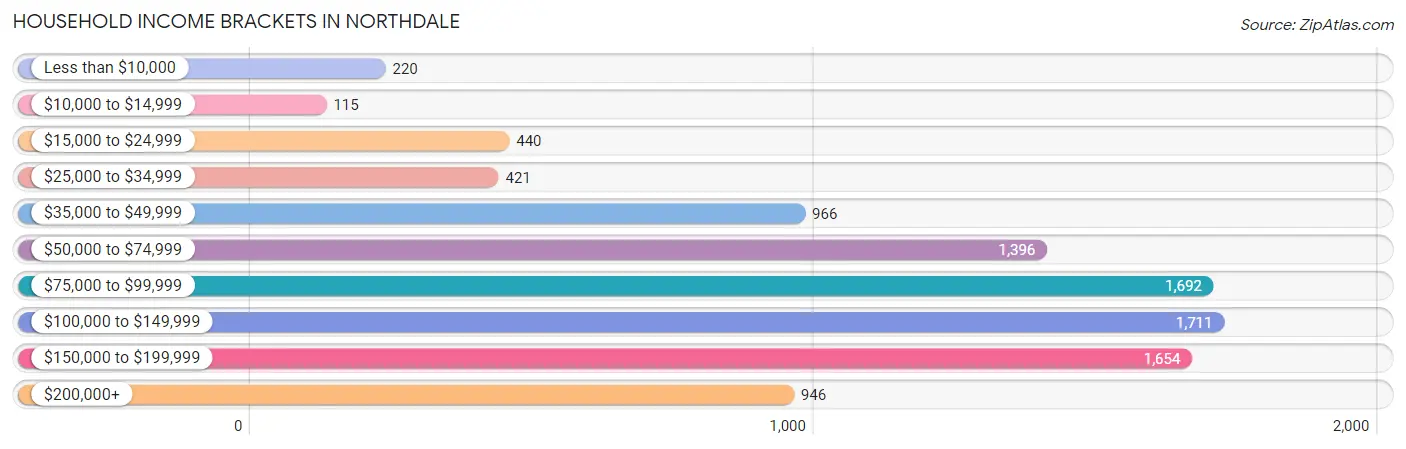
| Income Bracket | # Households | % Households |
| Less than $10,000 | 220 | 2.3% |
| $10,000 to $14,999 | 115 | 1.2% |
| $15,000 to $24,999 | 440 | 4.6% |
| $25,000 to $34,999 | 421 | 4.4% |
| $35,000 to $49,999 | 966 | 10.1% |
| $50,000 to $74,999 | 1,396 | 14.6% |
| $75,000 to $99,999 | 1,692 | 17.7% |
| $100,000 to $149,999 | 1,711 | 17.9% |
| $150,000 to $199,999 | 1,654 | 17.3% |
| $200,000+ | 946 | 9.9% |
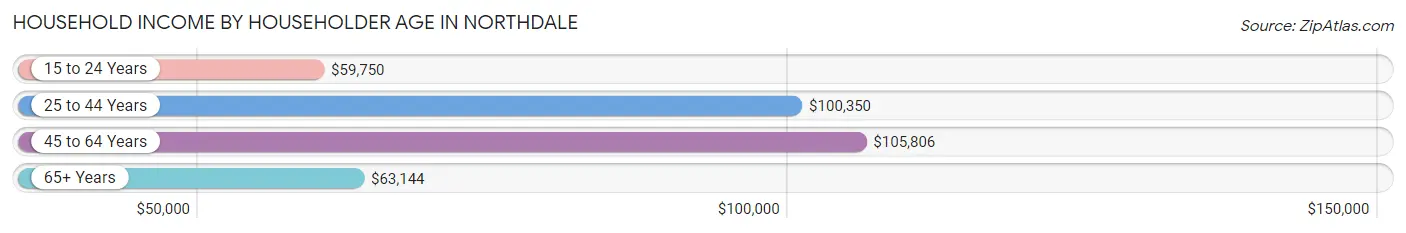
Household Income by Householder Age in Northdale
The median household income in Northdale is $92,824, with the highest median household income of $105,806 found in the 45 to 64 years age bracket for the primary householder. A total of 4,228 households (44.2%) fall into this category. Meanwhile, the 15 to 24 years age bracket for the primary householder has the lowest median household income of $59,750, with 193 households (2.0%) in this group.
| Income Bracket | # Households | Median Income |
| 15 to 24 Years | 193 (2.0%) | $59,750 |
| 25 to 44 Years | 3,034 (31.7%) | $100,350 |
| 45 to 64 Years | 4,228 (44.2%) | $105,806 |
| 65+ Years | 2,105 (22.0%) | $63,144 |
| Total | 9,560 (100.0%) | $92,824 |
Poverty in Northdale
Income Below Poverty by Sex and Age in Northdale
With 4.0% poverty level for males and 3.9% for females among the residents of Northdale, 25 to 34 year old males and 18 to 24 year old females are the most vulnerable to poverty, with 184 males (10.7%) and 81 females (9.3%) in their respective age groups living below the poverty level.
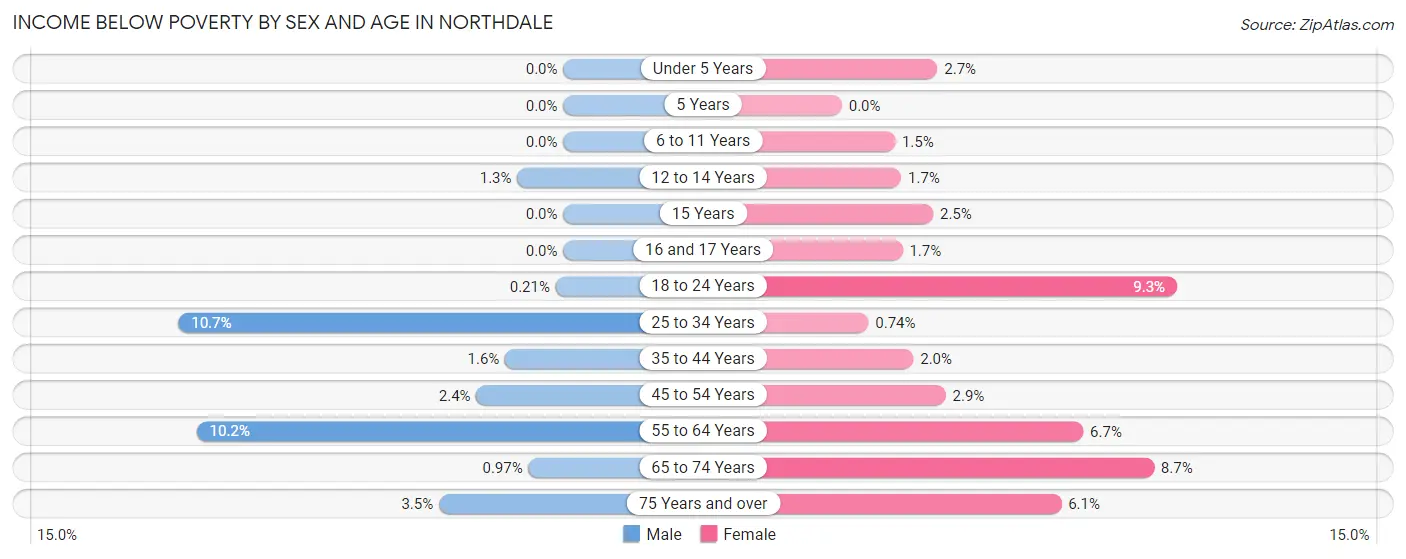
| Age Bracket | Male | Female |
| Under 5 Years | 0 (0.0%) | 18 (2.7%) |
| 5 Years | 0 (0.0%) | 0 (0.0%) |
| 6 to 11 Years | 0 (0.0%) | 16 (1.5%) |
| 12 to 14 Years | 6 (1.3%) | 7 (1.7%) |
| 15 Years | 0 (0.0%) | 5 (2.5%) |
| 16 and 17 Years | 0 (0.0%) | 6 (1.7%) |
| 18 to 24 Years | 2 (0.2%) | 81 (9.3%) |
| 25 to 34 Years | 184 (10.7%) | 13 (0.7%) |
| 35 to 44 Years | 31 (1.6%) | 36 (2.0%) |
| 45 to 54 Years | 54 (2.4%) | 62 (2.9%) |
| 55 to 64 Years | 179 (10.2%) | 101 (6.7%) |
| 65 to 74 Years | 8 (1.0%) | 111 (8.7%) |
| 75 Years and over | 25 (3.5%) | 64 (6.1%) |
| Total | 489 (4.0%) | 520 (3.9%) |
Income Above Poverty by Sex and Age in Northdale
According to the poverty statistics in Northdale, males aged under 5 years and females aged 5 years are the age groups that are most secure financially, with 100.0% of males and 100.0% of females in these age groups living above the poverty line.
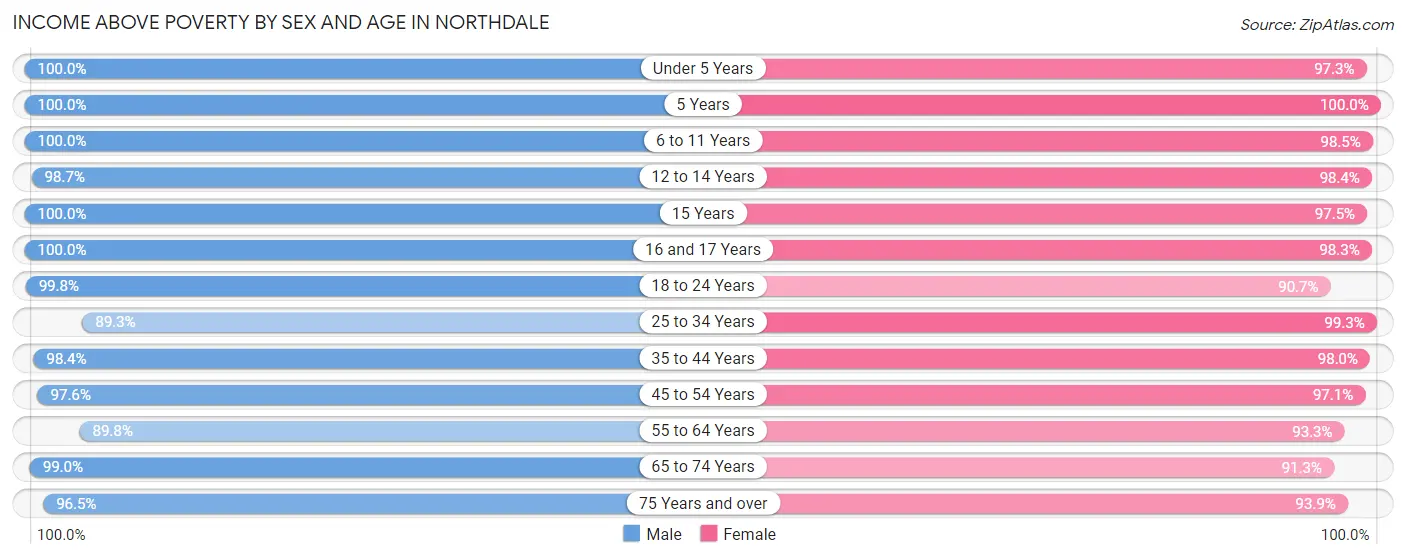
| Age Bracket | Male | Female |
| Under 5 Years | 351 (100.0%) | 658 (97.3%) |
| 5 Years | 44 (100.0%) | 259 (100.0%) |
| 6 to 11 Years | 920 (100.0%) | 1,067 (98.5%) |
| 12 to 14 Years | 462 (98.7%) | 418 (98.4%) |
| 15 Years | 112 (100.0%) | 192 (97.5%) |
| 16 and 17 Years | 289 (100.0%) | 350 (98.3%) |
| 18 to 24 Years | 956 (99.8%) | 787 (90.7%) |
| 25 to 34 Years | 1,532 (89.3%) | 1,733 (99.3%) |
| 35 to 44 Years | 1,882 (98.4%) | 1,775 (98.0%) |
| 45 to 54 Years | 2,181 (97.6%) | 2,082 (97.1%) |
| 55 to 64 Years | 1,575 (89.8%) | 1,401 (93.3%) |
| 65 to 74 Years | 815 (99.0%) | 1,166 (91.3%) |
| 75 Years and over | 697 (96.5%) | 984 (93.9%) |
| Total | 11,816 (96.0%) | 12,872 (96.1%) |
Income Below Poverty Among Married-Couple Families in Northdale
The poverty statistics for married-couple families in Northdale show that 1.5% or 81 of the total 5,493 families live below the poverty line. Families with no children have the highest poverty rate of 2.3%, comprising of 75 families. On the other hand, families with 3 or 4 children have the lowest poverty rate of 0.0%, which includes 0 families.
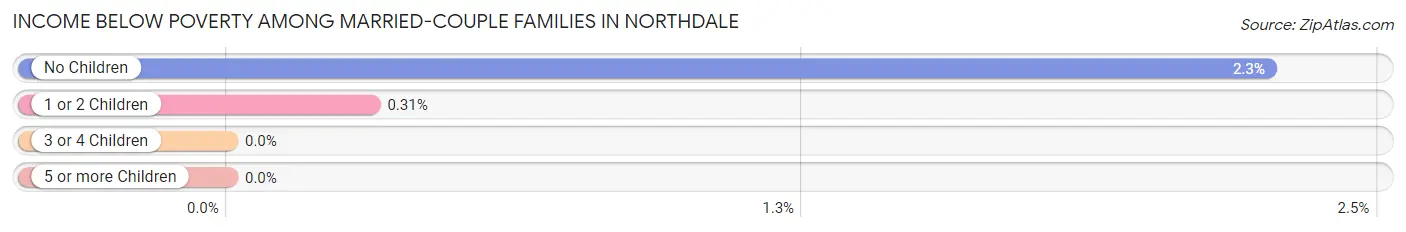
| Children | Above Poverty | Below Poverty |
| No Children | 3,245 (97.7%) | 75 (2.3%) |
| 1 or 2 Children | 1,930 (99.7%) | 6 (0.3%) |
| 3 or 4 Children | 237 (100.0%) | 0 (0.0%) |
| 5 or more Children | 0 (0.0%) | 0 (0.0%) |
| Total | 5,412 (98.5%) | 81 (1.5%) |
Income Below Poverty Among Single-Parent Households in Northdale
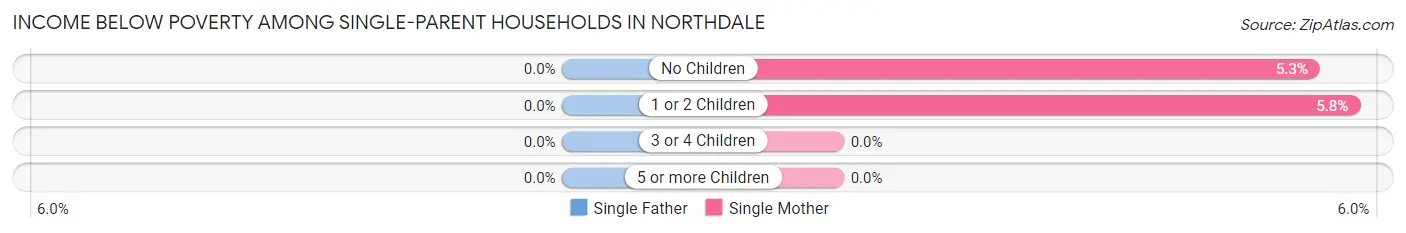
| Children | Single Father | Single Mother |
| No Children | 0 (0.0%) | 25 (5.3%) |
| 1 or 2 Children | 0 (0.0%) | 28 (5.8%) |
| 3 or 4 Children | 0 (0.0%) | 0 (0.0%) |
| 5 or more Children | 0 (0.0%) | 0 (0.0%) |
| Total | 0 (0.0%) | 53 (5.2%) |
Income Below Poverty Among Married-Couple vs Single-Parent Households in Northdale
The poverty data for Northdale shows that 81 of the married-couple family households (1.5%) and 53 of the single-parent households (3.9%) are living below the poverty level. Within the married-couple family households, those with no children have the highest poverty rate, with 75 households (2.3%) falling below the poverty line. Among the single-parent households, those with no children have the highest poverty rate, with 25 household (4.4%) living below poverty.
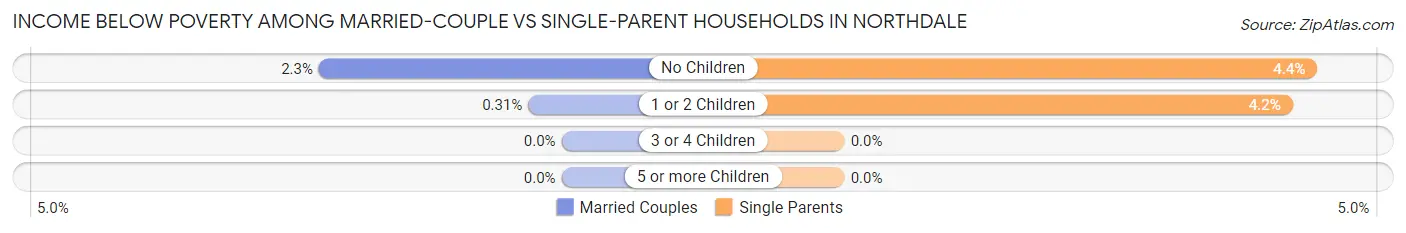
| Children | Married-Couple Families | Single-Parent Households |
| No Children | 75 (2.3%) | 25 (4.4%) |
| 1 or 2 Children | 6 (0.3%) | 28 (4.2%) |
| 3 or 4 Children | 0 (0.0%) | 0 (0.0%) |
| 5 or more Children | 0 (0.0%) | 0 (0.0%) |
| Total | 81 (1.5%) | 53 (3.9%) |
Race in Northdale
The most populous races in Northdale are White / Caucasian (18,598 | 71.3%), Hispanic or Latino (10,130 | 38.8%), and Two or more Races (3,915 | 15.0%).
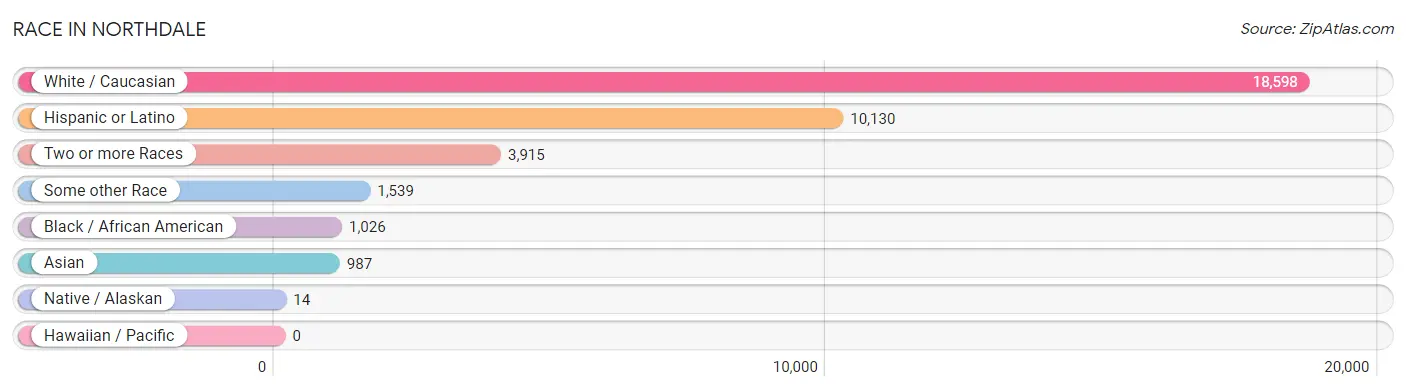
| Race | # Population | % Population |
| Asian | 987 | 3.8% |
| Black / African American | 1,026 | 3.9% |
| Hawaiian / Pacific | 0 | 0.0% |
| Hispanic or Latino | 10,130 | 38.8% |
| Native / Alaskan | 14 | 0.1% |
| White / Caucasian | 18,598 | 71.3% |
| Two or more Races | 3,915 | 15.0% |
| Some other Race | 1,539 | 5.9% |
| Total | 26,079 | 100.0% |
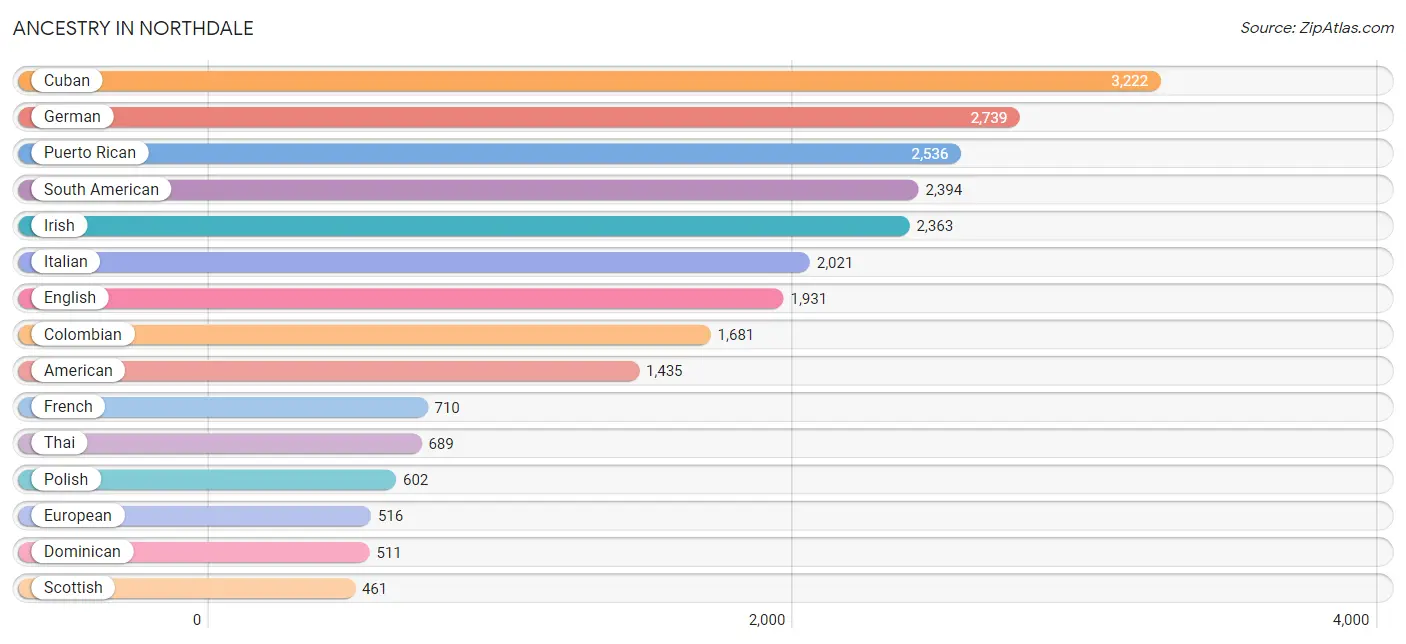
Ancestry in Northdale
The most populous ancestries reported in Northdale are Cuban (3,222 | 12.3%), German (2,739 | 10.5%), Puerto Rican (2,536 | 9.7%), South American (2,394 | 9.2%), and Irish (2,363 | 9.1%), together accounting for 50.8% of all Northdale residents.
| Ancestry | # Population | % Population |
| African | 300 | 1.1% |
| American | 1,435 | 5.5% |
| Arab | 389 | 1.5% |
| Argentinean | 56 | 0.2% |
| Austrian | 26 | 0.1% |
| Basque | 36 | 0.1% |
| Belgian | 6 | 0.0% |
| Bhutanese | 41 | 0.2% |
| Blackfeet | 19 | 0.1% |
| Brazilian | 329 | 1.3% |
| British | 206 | 0.8% |
| British West Indian | 42 | 0.2% |
| Bulgarian | 6 | 0.0% |
| Burmese | 51 | 0.2% |
| Canadian | 12 | 0.1% |
| Central American | 193 | 0.7% |
| Central American Indian | 49 | 0.2% |
| Cherokee | 10 | 0.0% |
| Chippewa | 6 | 0.0% |
| Colombian | 1,681 | 6.5% |
| Costa Rican | 4 | 0.0% |
| Creek | 12 | 0.1% |
| Croatian | 11 | 0.0% |
| Cuban | 3,222 | 12.3% |
| Czech | 57 | 0.2% |
| Danish | 21 | 0.1% |
| Dominican | 511 | 2.0% |
| Dutch | 197 | 0.8% |
| Eastern European | 199 | 0.8% |
| Ecuadorian | 169 | 0.6% |
| Egyptian | 228 | 0.9% |
| English | 1,931 | 7.4% |
| European | 516 | 2.0% |
| Filipino | 23 | 0.1% |
| Finnish | 19 | 0.1% |
| French | 710 | 2.7% |
| French Canadian | 128 | 0.5% |
| German | 2,739 | 10.5% |
| Greek | 102 | 0.4% |
| Guatemalan | 17 | 0.1% |
| Honduran | 45 | 0.2% |
| Hungarian | 118 | 0.4% |
| Indian (Asian) | 185 | 0.7% |
| Irish | 2,363 | 9.1% |
| Italian | 2,021 | 7.7% |
| Jamaican | 117 | 0.4% |
| Japanese | 8 | 0.0% |
| Korean | 75 | 0.3% |
| Laotian | 12 | 0.1% |
| Lebanese | 45 | 0.2% |
| Lithuanian | 37 | 0.1% |
| Mexican | 261 | 1.0% |
| Nicaraguan | 108 | 0.4% |
| Nigerian | 15 | 0.1% |
| Northern European | 47 | 0.2% |
| Norwegian | 262 | 1.0% |
| Pakistani | 48 | 0.2% |
| Palestinian | 54 | 0.2% |
| Peruvian | 260 | 1.0% |
| Polish | 602 | 2.3% |
| Portuguese | 17 | 0.1% |
| Puerto Rican | 2,536 | 9.7% |
| Romanian | 23 | 0.1% |
| Russian | 99 | 0.4% |
| Salvadoran | 19 | 0.1% |
| Scandinavian | 220 | 0.8% |
| Scotch-Irish | 145 | 0.6% |
| Scottish | 461 | 1.8% |
| Serbian | 8 | 0.0% |
| Slavic | 22 | 0.1% |
| Slovak | 28 | 0.1% |
| Slovene | 20 | 0.1% |
| South African | 24 | 0.1% |
| South American | 2,394 | 9.2% |
| South American Indian | 15 | 0.1% |
| Spaniard | 306 | 1.2% |
| Spanish | 387 | 1.5% |
| Sri Lankan | 93 | 0.4% |
| Subsaharan African | 396 | 1.5% |
| Swedish | 342 | 1.3% |
| Swiss | 66 | 0.3% |
| Thai | 689 | 2.6% |
| Trinidadian and Tobagonian | 47 | 0.2% |
| Ukrainian | 106 | 0.4% |
| Venezuelan | 228 | 0.9% |
| Welsh | 22 | 0.1% |
| Yugoslavian | 57 | 0.2% | View All 87 Rows |
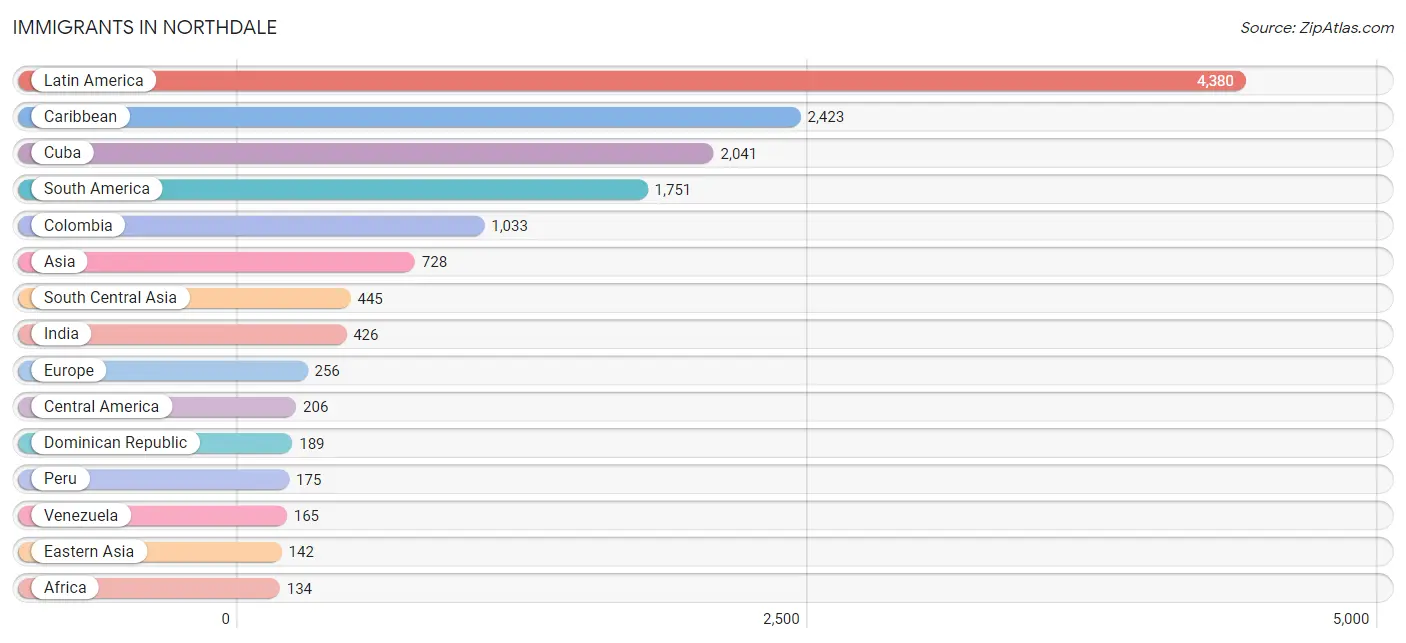
Immigrants in Northdale
The most numerous immigrant groups reported in Northdale came from Latin America (4,380 | 16.8%), Caribbean (2,423 | 9.3%), Cuba (2,041 | 7.8%), South America (1,751 | 6.7%), and Colombia (1,033 | 4.0%), together accounting for 44.6% of all Northdale residents.
| Immigration Origin | # Population | % Population |
| Africa | 134 | 0.5% |
| Argentina | 40 | 0.2% |
| Asia | 728 | 2.8% |
| Australia | 8 | 0.0% |
| Austria | 17 | 0.1% |
| Brazil | 103 | 0.4% |
| Cambodia | 8 | 0.0% |
| Canada | 99 | 0.4% |
| Caribbean | 2,423 | 9.3% |
| Central America | 206 | 0.8% |
| China | 93 | 0.4% |
| Colombia | 1,033 | 4.0% |
| Costa Rica | 4 | 0.0% |
| Cuba | 2,041 | 7.8% |
| Dominican Republic | 189 | 0.7% |
| Eastern Africa | 30 | 0.1% |
| Eastern Asia | 142 | 0.5% |
| Eastern Europe | 132 | 0.5% |
| Ecuador | 90 | 0.4% |
| Egypt | 65 | 0.3% |
| England | 25 | 0.1% |
| Ethiopia | 30 | 0.1% |
| Europe | 256 | 1.0% |
| France | 19 | 0.1% |
| Guyana | 124 | 0.5% |
| Honduras | 32 | 0.1% |
| India | 426 | 1.6% |
| Iraq | 9 | 0.0% |
| Ireland | 10 | 0.0% |
| Israel | 12 | 0.1% |
| Jamaica | 114 | 0.4% |
| Japan | 8 | 0.0% |
| Kazakhstan | 19 | 0.1% |
| Korea | 41 | 0.2% |
| Latin America | 4,380 | 16.8% |
| Lebanon | 16 | 0.1% |
| Mexico | 101 | 0.4% |
| Netherlands | 18 | 0.1% |
| Nicaragua | 61 | 0.2% |
| Nigeria | 15 | 0.1% |
| Northern Africa | 65 | 0.3% |
| Northern Europe | 70 | 0.3% |
| Oceania | 8 | 0.0% |
| Panama | 8 | 0.0% |
| Peru | 175 | 0.7% |
| Philippines | 17 | 0.1% |
| Poland | 28 | 0.1% |
| Russia | 35 | 0.1% |
| South Africa | 24 | 0.1% |
| South America | 1,751 | 6.7% |
| South Central Asia | 445 | 1.7% |
| South Eastern Asia | 74 | 0.3% |
| Sweden | 12 | 0.1% |
| Taiwan | 25 | 0.1% |
| Thailand | 16 | 0.1% |
| Trinidad and Tobago | 37 | 0.1% |
| Turkey | 12 | 0.1% |
| Ukraine | 69 | 0.3% |
| Uruguay | 21 | 0.1% |
| Venezuela | 165 | 0.6% |
| Vietnam | 33 | 0.1% |
| Western Africa | 15 | 0.1% |
| Western Asia | 67 | 0.3% |
| Western Europe | 54 | 0.2% | View All 64 Rows |
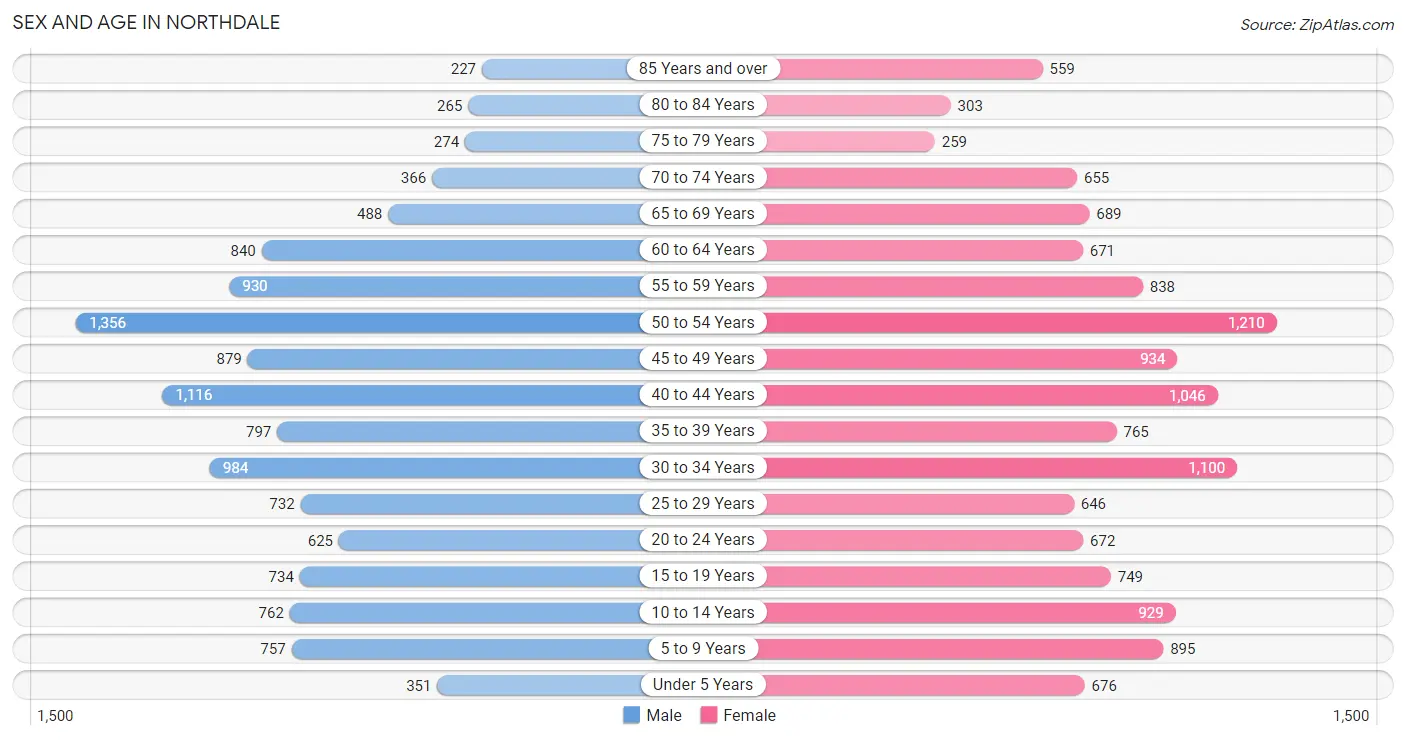
Sex and Age in Northdale
Sex and Age in Northdale
The most populous age groups in Northdale are 50 to 54 Years (1,356 | 10.9%) for men and 50 to 54 Years (1,210 | 8.9%) for women.
| Age Bracket | Male | Female |
| Under 5 Years | 351 (2.8%) | 676 (5.0%) |
| 5 to 9 Years | 757 (6.1%) | 895 (6.6%) |
| 10 to 14 Years | 762 (6.1%) | 929 (6.8%) |
| 15 to 19 Years | 734 (5.9%) | 749 (5.5%) |
| 20 to 24 Years | 625 (5.0%) | 672 (4.9%) |
| 25 to 29 Years | 732 (5.9%) | 646 (4.8%) |
| 30 to 34 Years | 984 (7.9%) | 1,100 (8.1%) |
| 35 to 39 Years | 797 (6.4%) | 765 (5.6%) |
| 40 to 44 Years | 1,116 (8.9%) | 1,046 (7.7%) |
| 45 to 49 Years | 879 (7.0%) | 934 (6.9%) |
| 50 to 54 Years | 1,356 (10.9%) | 1,210 (8.9%) |
| 55 to 59 Years | 930 (7.4%) | 838 (6.2%) |
| 60 to 64 Years | 840 (6.7%) | 671 (4.9%) |
| 65 to 69 Years | 488 (3.9%) | 689 (5.1%) |
| 70 to 74 Years | 366 (2.9%) | 655 (4.8%) |
| 75 to 79 Years | 274 (2.2%) | 259 (1.9%) |
| 80 to 84 Years | 265 (2.1%) | 303 (2.2%) |
| 85 Years and over | 227 (1.8%) | 559 (4.1%) |
| Total | 12,483 (100.0%) | 13,596 (100.0%) |
Families and Households in Northdale
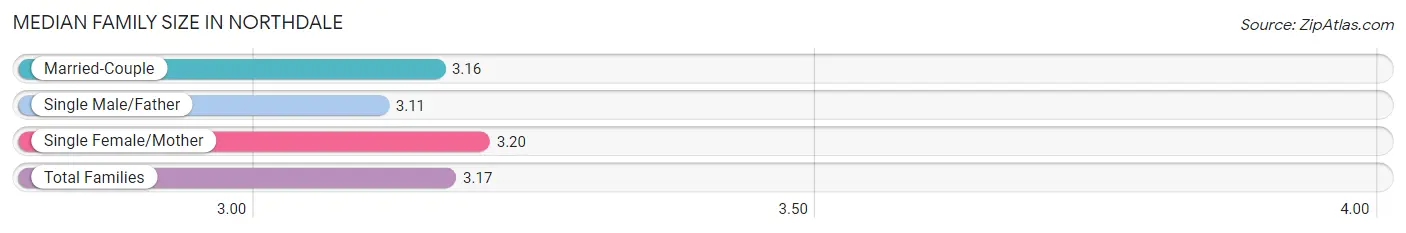
Median Family Size in Northdale
The median family size in Northdale is 3.17 persons per family, with single female/mother families (1,021 | 14.9%) accounting for the largest median family size of 3.2 persons per family. On the other hand, single male/father families (323 | 4.7%) represent the smallest median family size with 3.11 persons per family.
| Family Type | # Families | Family Size |
| Married-Couple | 5,493 (80.3%) | 3.16 |
| Single Male/Father | 323 (4.7%) | 3.11 |
| Single Female/Mother | 1,021 (14.9%) | 3.20 |
| Total Families | 6,837 (100.0%) | 3.17 |
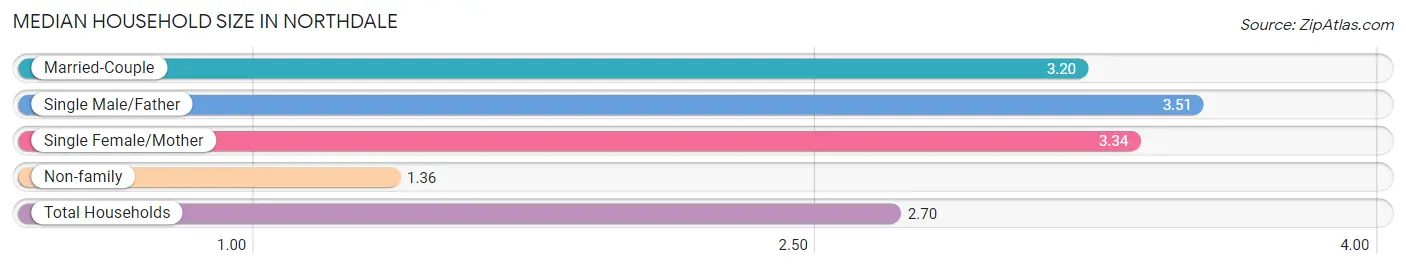
Median Household Size in Northdale
The median household size in Northdale is 2.70 persons per household, with single male/father households (323 | 3.4%) accounting for the largest median household size of 3.51 persons per household. non-family households (2,723 | 28.5%) represent the smallest median household size with 1.36 persons per household.
| Household Type | # Households | Household Size |
| Married-Couple | 5,493 (57.5%) | 3.20 |
| Single Male/Father | 323 (3.4%) | 3.51 |
| Single Female/Mother | 1,021 (10.7%) | 3.34 |
| Non-family | 2,723 (28.5%) | 1.36 |
| Total Households | 9,560 (100.0%) | 2.70 |
Household Size by Marriage Status in Northdale
Out of a total of 9,560 households in Northdale, 6,837 (71.5%) are family households, while 2,723 (28.5%) are nonfamily households. The most numerous type of family households are 2-person households, comprising 2,621, and the most common type of nonfamily households are 1-person households, comprising 2,075.
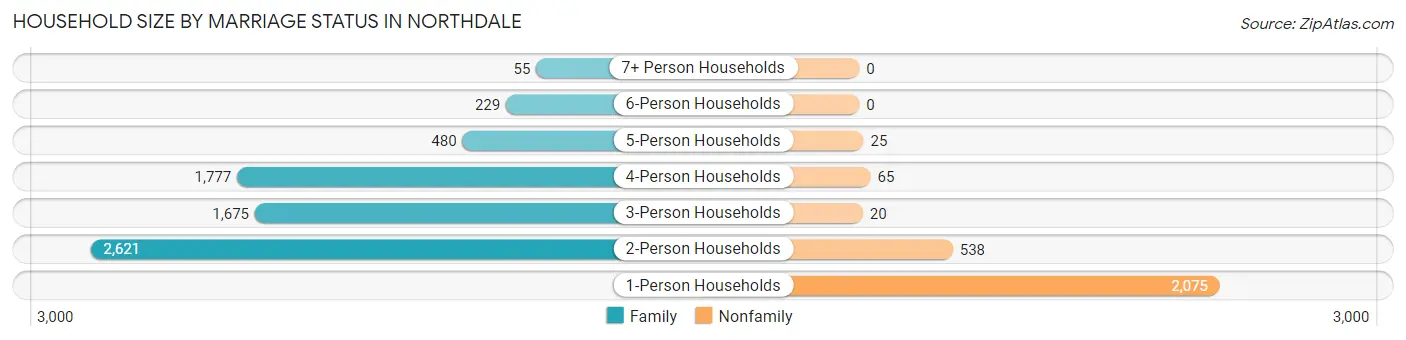
| Household Size | Family Households | Nonfamily Households |
| 1-Person Households | - | 2,075 (21.7%) |
| 2-Person Households | 2,621 (27.4%) | 538 (5.6%) |
| 3-Person Households | 1,675 (17.5%) | 20 (0.2%) |
| 4-Person Households | 1,777 (18.6%) | 65 (0.7%) |
| 5-Person Households | 480 (5.0%) | 25 (0.3%) |
| 6-Person Households | 229 (2.4%) | 0 (0.0%) |
| 7+ Person Households | 55 (0.6%) | 0 (0.0%) |
| Total | 6,837 (71.5%) | 2,723 (28.5%) |
Female Fertility in Northdale
Fertility by Age in Northdale
Average fertility rate in Northdale is 51.0 births per 1,000 women. Women in the age bracket of 20 to 34 years have the highest fertility rate with 82.0 births per 1,000 women. Women in the age bracket of 20 to 34 years acount for 63.6% of all women with births.
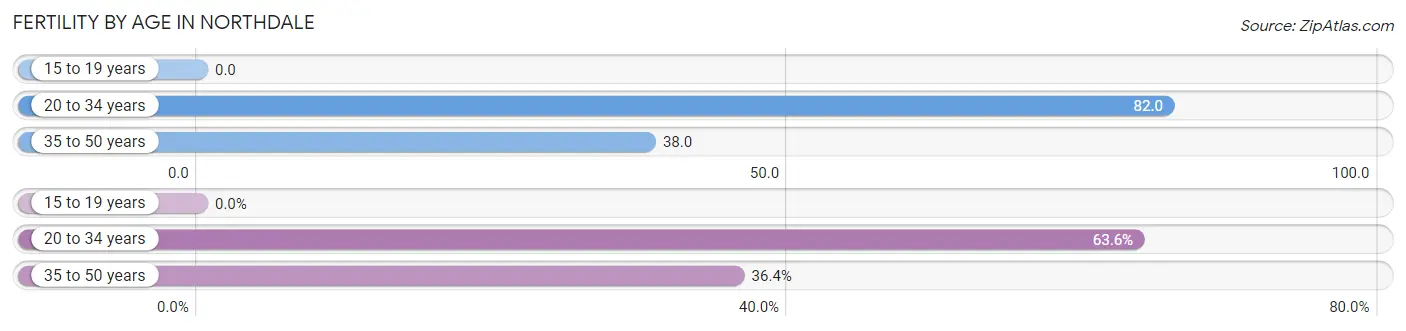
| Age Bracket | Women with Births | Births / 1,000 Women |
| 15 to 19 years | 0 (0.0%) | 0.0 |
| 20 to 34 years | 199 (63.6%) | 82.0 |
| 35 to 50 years | 114 (36.4%) | 38.0 |
| Total | 313 (100.0%) | 51.0 |
Fertility by Age by Marriage Status in Northdale
92.7% of women with births (313) in Northdale are married. The highest percentage of unmarried women with births falls into 20 to 34 years age bracket with 11.6% of them unmarried at the time of birth, while the lowest percentage of unmarried women with births belong to 35 to 50 years age bracket with 0.0% of them unmarried.
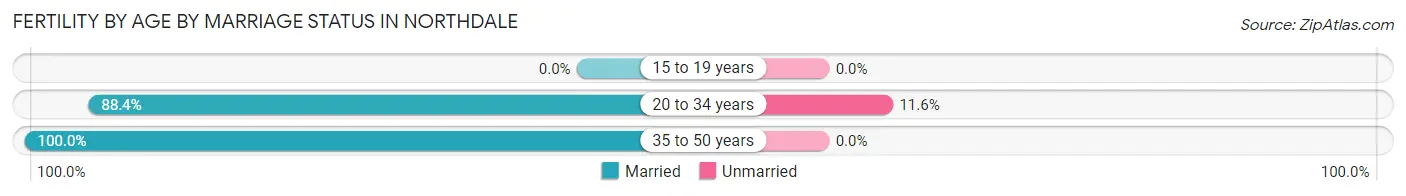
| Age Bracket | Married | Unmarried |
| 15 to 19 years | 0 (0.0%) | 0 (0.0%) |
| 20 to 34 years | 176 (88.4%) | 23 (11.6%) |
| 35 to 50 years | 114 (100.0%) | 0 (0.0%) |
| Total | 290 (92.6%) | 23 (7.3%) |
Fertility by Education in Northdale
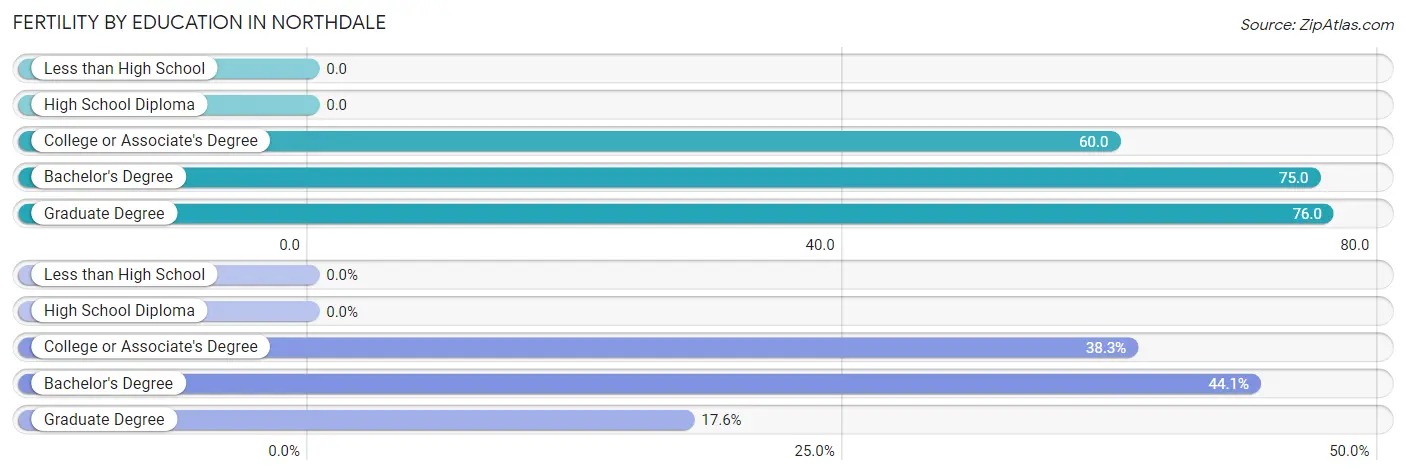
| Educational Attainment | Women with Births | Births / 1,000 Women |
| Less than High School | 0 (0.0%) | 0.0 |
| High School Diploma | 0 (0.0%) | 0.0 |
| College or Associate's Degree | 120 (38.3%) | 60.0 |
| Bachelor's Degree | 138 (44.1%) | 75.0 |
| Graduate Degree | 55 (17.6%) | 76.0 |
| Total | 313 (100.0%) | 51.0 |
Fertility by Education by Marriage Status in Northdale
7.3% of women with births in Northdale are unmarried. Women with the educational attainment of bachelor's degree are most likely to be married with 100.0% of them married at childbirth, while women with the educational attainment of college or associate's degree are least likely to be married with 19.2% of them unmarried at childbirth.
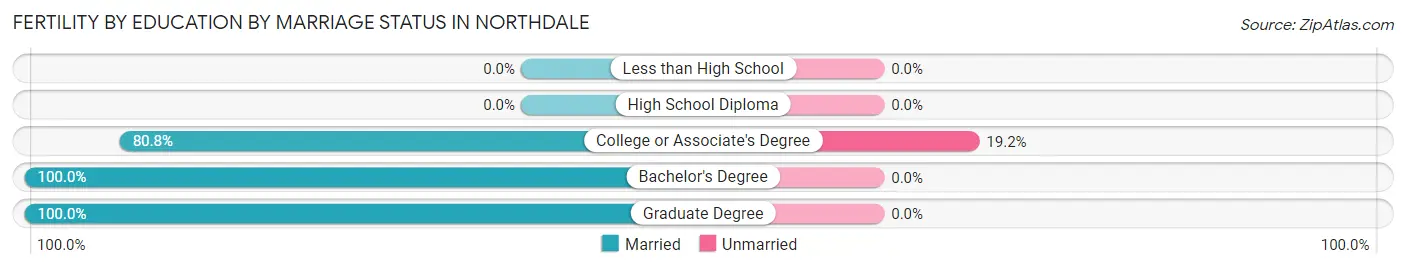
| Educational Attainment | Married | Unmarried |
| Less than High School | 0 (0.0%) | 0 (0.0%) |
| High School Diploma | 0 (0.0%) | 0 (0.0%) |
| College or Associate's Degree | 97 (80.8%) | 23 (19.2%) |
| Bachelor's Degree | 138 (100.0%) | 0 (0.0%) |
| Graduate Degree | 55 (100.0%) | 0 (0.0%) |
| Total | 290 (92.6%) | 23 (7.3%) |
Employment Characteristics in Northdale
Employment by Class of Employer in Northdale
Among the 14,365 employed individuals in Northdale, private company employees (9,242 | 64.3%), not-for-profit organizations (1,364 | 9.5%), and self-employed (incorporated) (1,244 | 8.7%) make up the most common classes of employment.
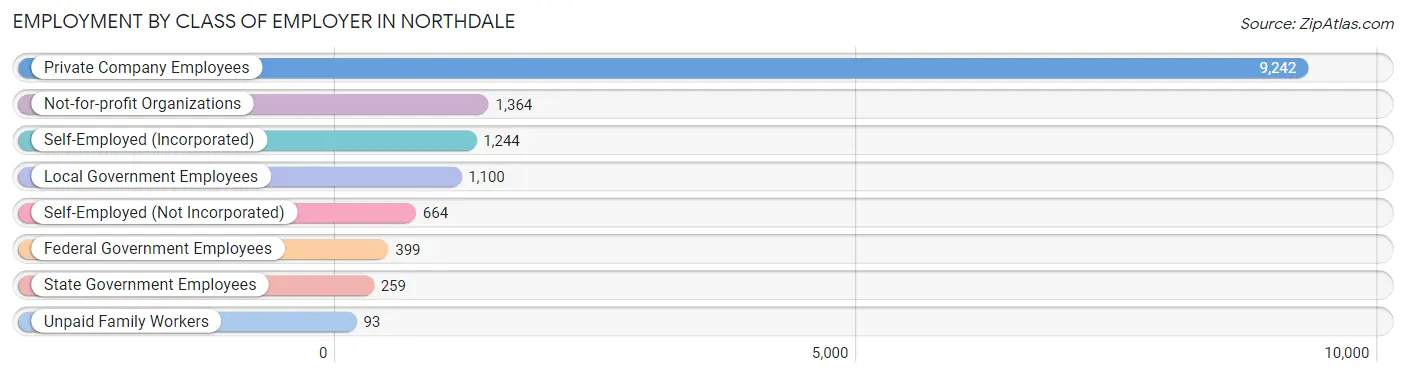
| Employer Class | # Employees | % Employees |
| Private Company Employees | 9,242 | 64.3% |
| Self-Employed (Incorporated) | 1,244 | 8.7% |
| Self-Employed (Not Incorporated) | 664 | 4.6% |
| Not-for-profit Organizations | 1,364 | 9.5% |
| Local Government Employees | 1,100 | 7.7% |
| State Government Employees | 259 | 1.8% |
| Federal Government Employees | 399 | 2.8% |
| Unpaid Family Workers | 93 | 0.6% |
| Total | 14,365 | 100.0% |
Employment Status by Age in Northdale
According to the labor force statistics for Northdale, out of the total population over 16 years of age (21,400), 70.3% or 15,044 individuals are in the labor force, with 3.3% or 496 of them unemployed. The age group with the highest labor force participation rate is 30 to 34 years, with 94.6% or 1,971 individuals in the labor force. Within the labor force, the 75 years and over age range has the highest percentage of unemployed individuals, with 24.4% or 10 of them being unemployed.
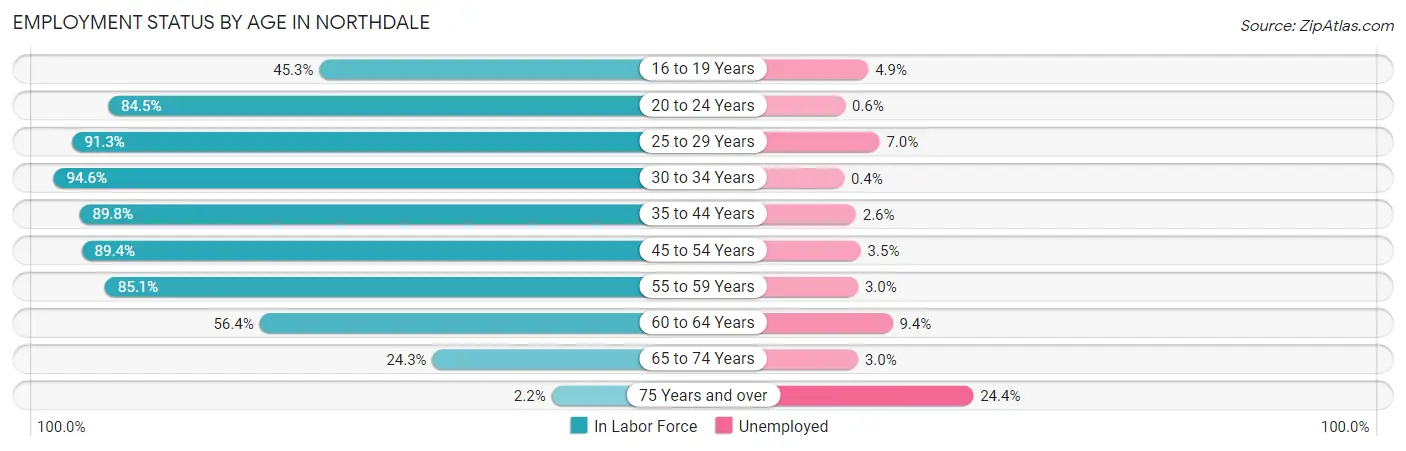
| Age Bracket | In Labor Force | Unemployed |
| 16 to 19 Years | 532 (45.3%) | 26 (4.9%) |
| 20 to 24 Years | 1,096 (84.5%) | 7 (0.6%) |
| 25 to 29 Years | 1,258 (91.3%) | 88 (7.0%) |
| 30 to 34 Years | 1,971 (94.6%) | 8 (0.4%) |
| 35 to 44 Years | 3,344 (89.8%) | 87 (2.6%) |
| 45 to 54 Years | 3,915 (89.4%) | 137 (3.5%) |
| 55 to 59 Years | 1,505 (85.1%) | 45 (3.0%) |
| 60 to 64 Years | 852 (56.4%) | 80 (9.4%) |
| 65 to 74 Years | 534 (24.3%) | 16 (3.0%) |
| 75 Years and over | 42 (2.2%) | 10 (24.4%) |
| Total | 15,044 (70.3%) | 496 (3.3%) |
Employment Status by Educational Attainment in Northdale
According to labor force statistics for Northdale, 86.5% of individuals (12,840) out of the total population between 25 and 64 years of age (14,844) are in the labor force, with 3.5% or 449 of them being unemployed. The group with the highest labor force participation rate are those with the educational attainment of bachelor's degree or higher, with 91.7% or 6,476 individuals in the labor force. Within the labor force, individuals with less than high school education have the highest percentage of unemployment, with 6.3% or 33 of them being unemployed.
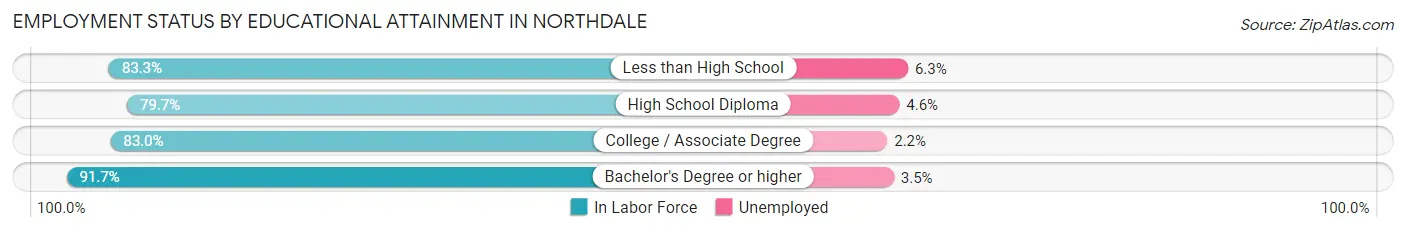
| Educational Attainment | In Labor Force | Unemployed |
| Less than High School | 520 (83.3%) | 39 (6.3%) |
| High School Diploma | 2,171 (79.7%) | 125 (4.6%) |
| College / Associate Degree | 3,680 (83.0%) | 98 (2.2%) |
| Bachelor's Degree or higher | 6,476 (91.7%) | 247 (3.5%) |
| Total | 12,840 (86.5%) | 520 (3.5%) |
Employment Occupations by Sex in Northdale
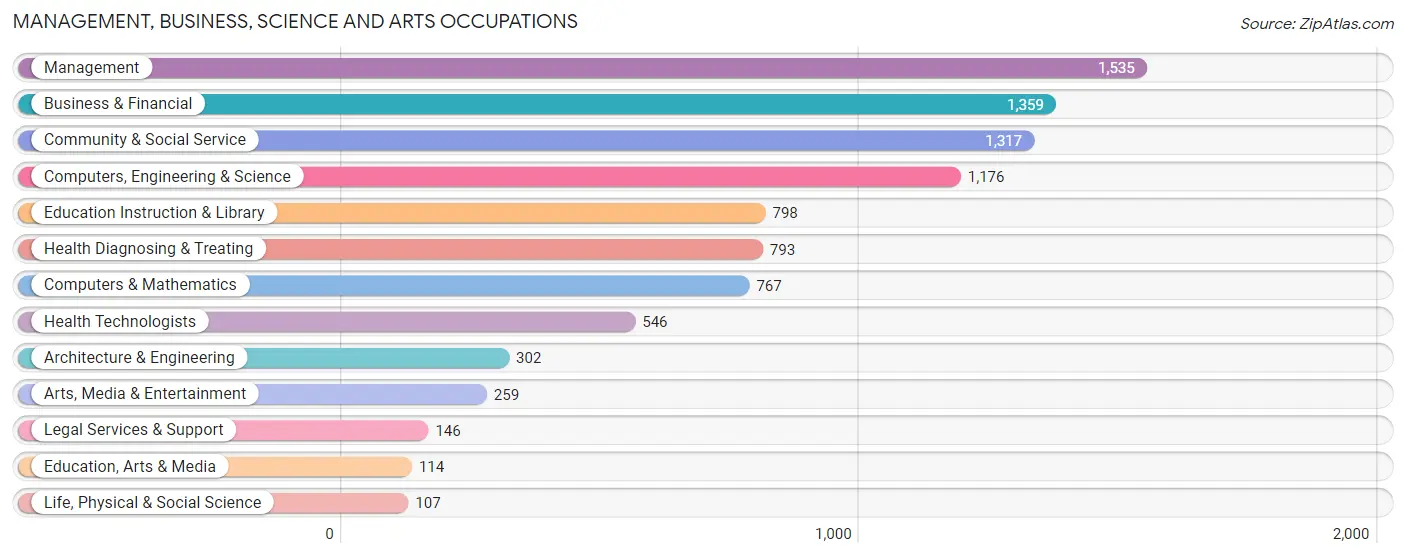
Management, Business, Science and Arts Occupations
The most common Management, Business, Science and Arts occupations in Northdale are Management (1,535 | 10.6%), Business & Financial (1,359 | 9.4%), Community & Social Service (1,317 | 9.1%), Computers, Engineering & Science (1,176 | 8.1%), and Education Instruction & Library (798 | 5.5%).
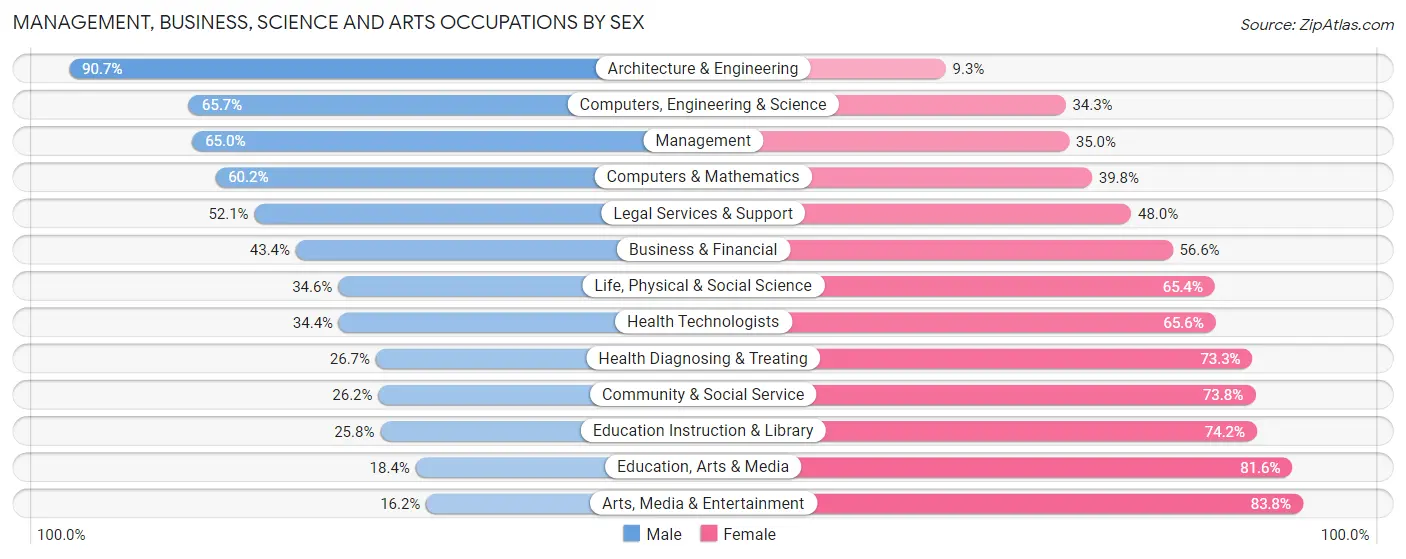
Management, Business, Science and Arts Occupations by Sex
Within the Management, Business, Science and Arts occupations in Northdale, the most male-oriented occupations are Architecture & Engineering (90.7%), Computers, Engineering & Science (65.7%), and Management (65.0%), while the most female-oriented occupations are Arts, Media & Entertainment (83.8%), Education, Arts & Media (81.6%), and Education Instruction & Library (74.2%).
| Occupation | Male | Female |
| Management | 998 (65.0%) | 537 (35.0%) |
| Business & Financial | 590 (43.4%) | 769 (56.6%) |
| Computers, Engineering & Science | 773 (65.7%) | 403 (34.3%) |
| Computers & Mathematics | 462 (60.2%) | 305 (39.8%) |
| Architecture & Engineering | 274 (90.7%) | 28 (9.3%) |
| Life, Physical & Social Science | 37 (34.6%) | 70 (65.4%) |
| Community & Social Service | 345 (26.2%) | 972 (73.8%) |
| Education, Arts & Media | 21 (18.4%) | 93 (81.6%) |
| Legal Services & Support | 76 (52.0%) | 70 (47.9%) |
| Education Instruction & Library | 206 (25.8%) | 592 (74.2%) |
| Arts, Media & Entertainment | 42 (16.2%) | 217 (83.8%) |
| Health Diagnosing & Treating | 212 (26.7%) | 581 (73.3%) |
| Health Technologists | 188 (34.4%) | 358 (65.6%) |
| Total (Category) | 2,918 (47.2%) | 3,262 (52.8%) |
| Total (Overall) | 7,558 (52.2%) | 6,924 (47.8%) |
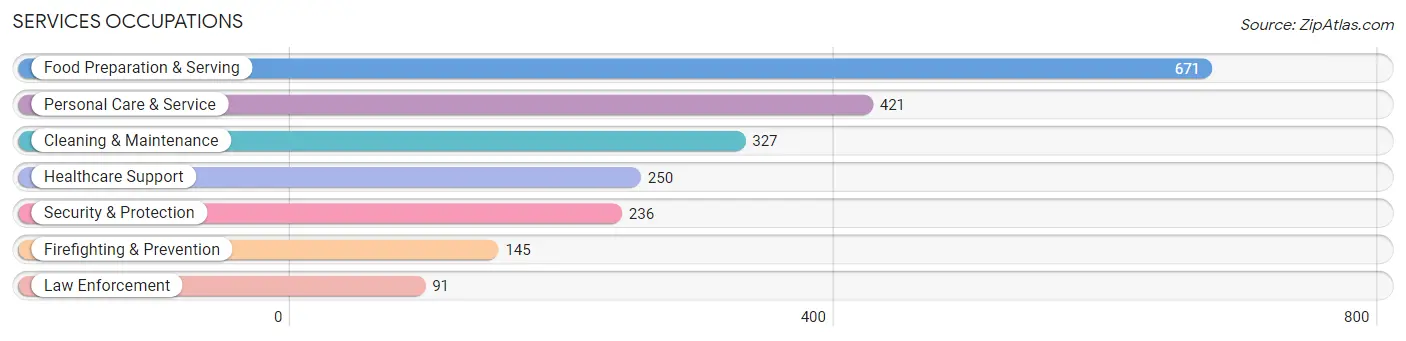
Services Occupations
The most common Services occupations in Northdale are Food Preparation & Serving (671 | 4.6%), Personal Care & Service (421 | 2.9%), Cleaning & Maintenance (327 | 2.3%), Healthcare Support (250 | 1.7%), and Security & Protection (236 | 1.6%).
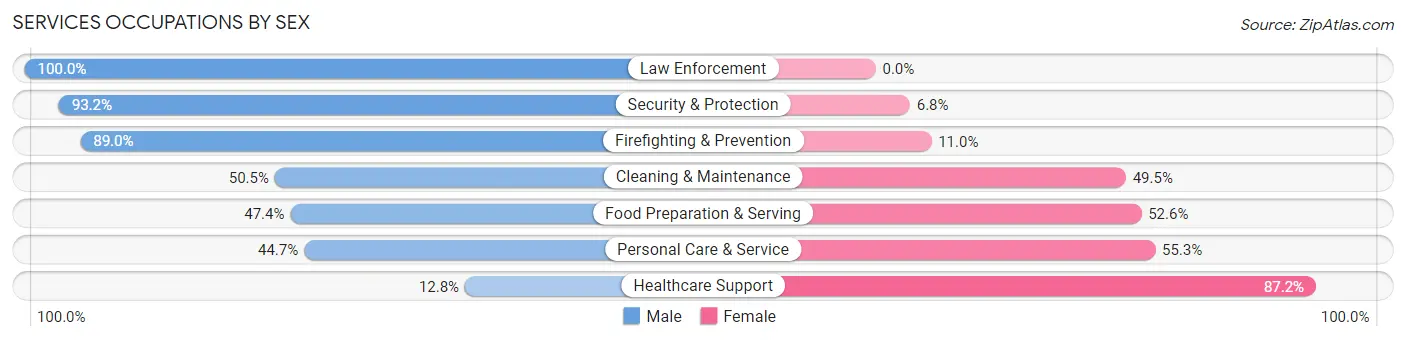
Services Occupations by Sex
Within the Services occupations in Northdale, the most male-oriented occupations are Law Enforcement (100.0%), Security & Protection (93.2%), and Firefighting & Prevention (89.0%), while the most female-oriented occupations are Healthcare Support (87.2%), Personal Care & Service (55.3%), and Food Preparation & Serving (52.6%).
| Occupation | Male | Female |
| Healthcare Support | 32 (12.8%) | 218 (87.2%) |
| Security & Protection | 220 (93.2%) | 16 (6.8%) |
| Firefighting & Prevention | 129 (89.0%) | 16 (11.0%) |
| Law Enforcement | 91 (100.0%) | 0 (0.0%) |
| Food Preparation & Serving | 318 (47.4%) | 353 (52.6%) |
| Cleaning & Maintenance | 165 (50.5%) | 162 (49.5%) |
| Personal Care & Service | 188 (44.7%) | 233 (55.3%) |
| Total (Category) | 923 (48.4%) | 982 (51.5%) |
| Total (Overall) | 7,558 (52.2%) | 6,924 (47.8%) |
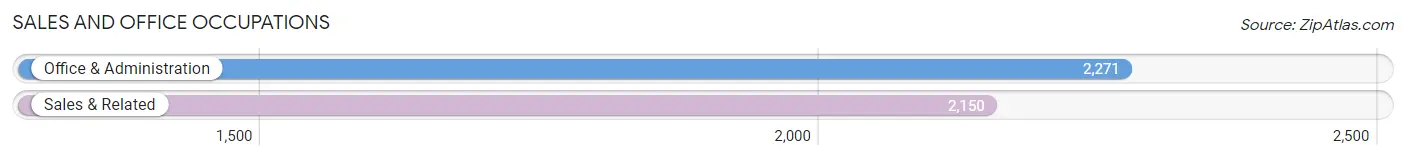
Sales and Office Occupations
The most common Sales and Office occupations in Northdale are Office & Administration (2,271 | 15.7%), and Sales & Related (2,150 | 14.8%).
Sales and Office Occupations by Sex
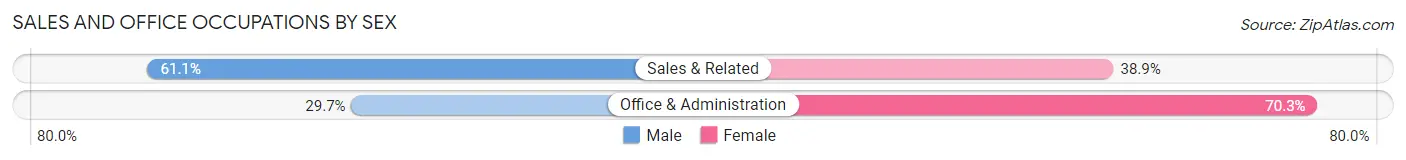
| Occupation | Male | Female |
| Sales & Related | 1,313 (61.1%) | 837 (38.9%) |
| Office & Administration | 675 (29.7%) | 1,596 (70.3%) |
| Total (Category) | 1,988 (45.0%) | 2,433 (55.0%) |
| Total (Overall) | 7,558 (52.2%) | 6,924 (47.8%) |
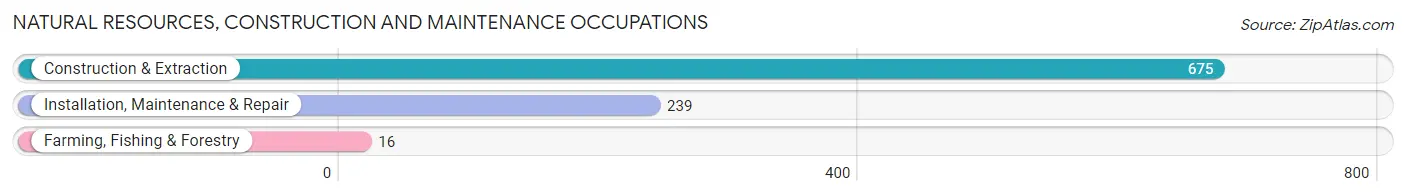
Natural Resources, Construction and Maintenance Occupations
The most common Natural Resources, Construction and Maintenance occupations in Northdale are Construction & Extraction (675 | 4.7%), Installation, Maintenance & Repair (239 | 1.7%), and Farming, Fishing & Forestry (16 | 0.1%).
Natural Resources, Construction and Maintenance Occupations by Sex
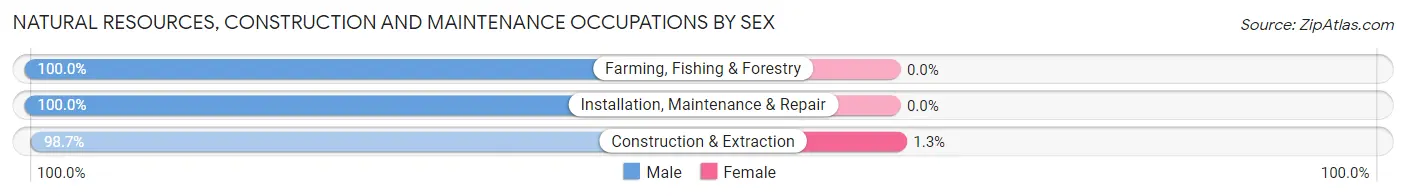
| Occupation | Male | Female |
| Farming, Fishing & Forestry | 16 (100.0%) | 0 (0.0%) |
| Construction & Extraction | 666 (98.7%) | 9 (1.3%) |
| Installation, Maintenance & Repair | 239 (100.0%) | 0 (0.0%) |
| Total (Category) | 921 (99.0%) | 9 (1.0%) |
| Total (Overall) | 7,558 (52.2%) | 6,924 (47.8%) |
Production, Transportation and Moving Occupations
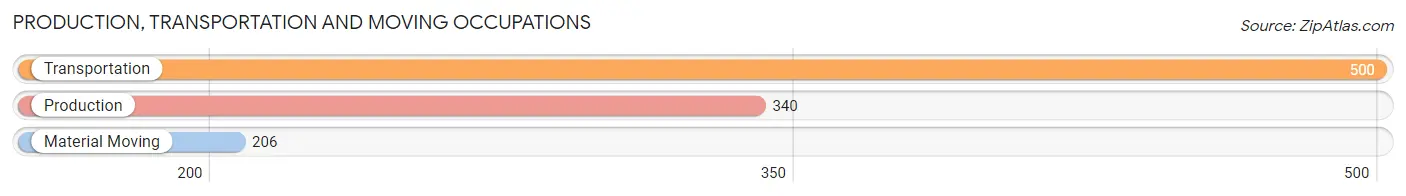
The most common Production, Transportation and Moving occupations in Northdale are Transportation (500 | 3.5%), Production (340 | 2.4%), and Material Moving (206 | 1.4%).
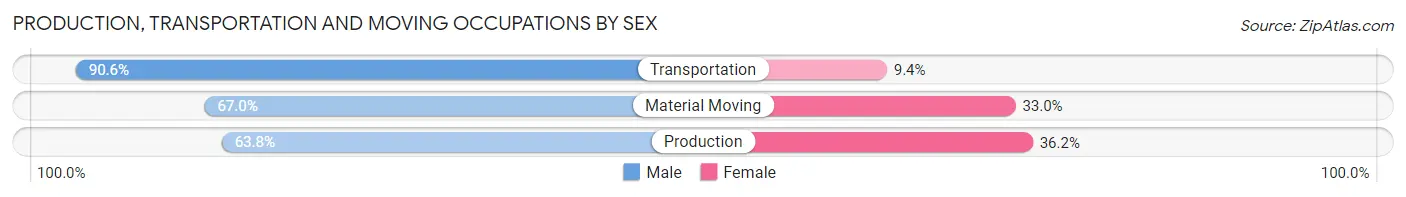
Production, Transportation and Moving Occupations by Sex
| Occupation | Male | Female |
| Production | 217 (63.8%) | 123 (36.2%) |
| Transportation | 453 (90.6%) | 47 (9.4%) |
| Material Moving | 138 (67.0%) | 68 (33.0%) |
| Total (Category) | 808 (77.2%) | 238 (22.8%) |
| Total (Overall) | 7,558 (52.2%) | 6,924 (47.8%) |
Employment Industries by Sex in Northdale
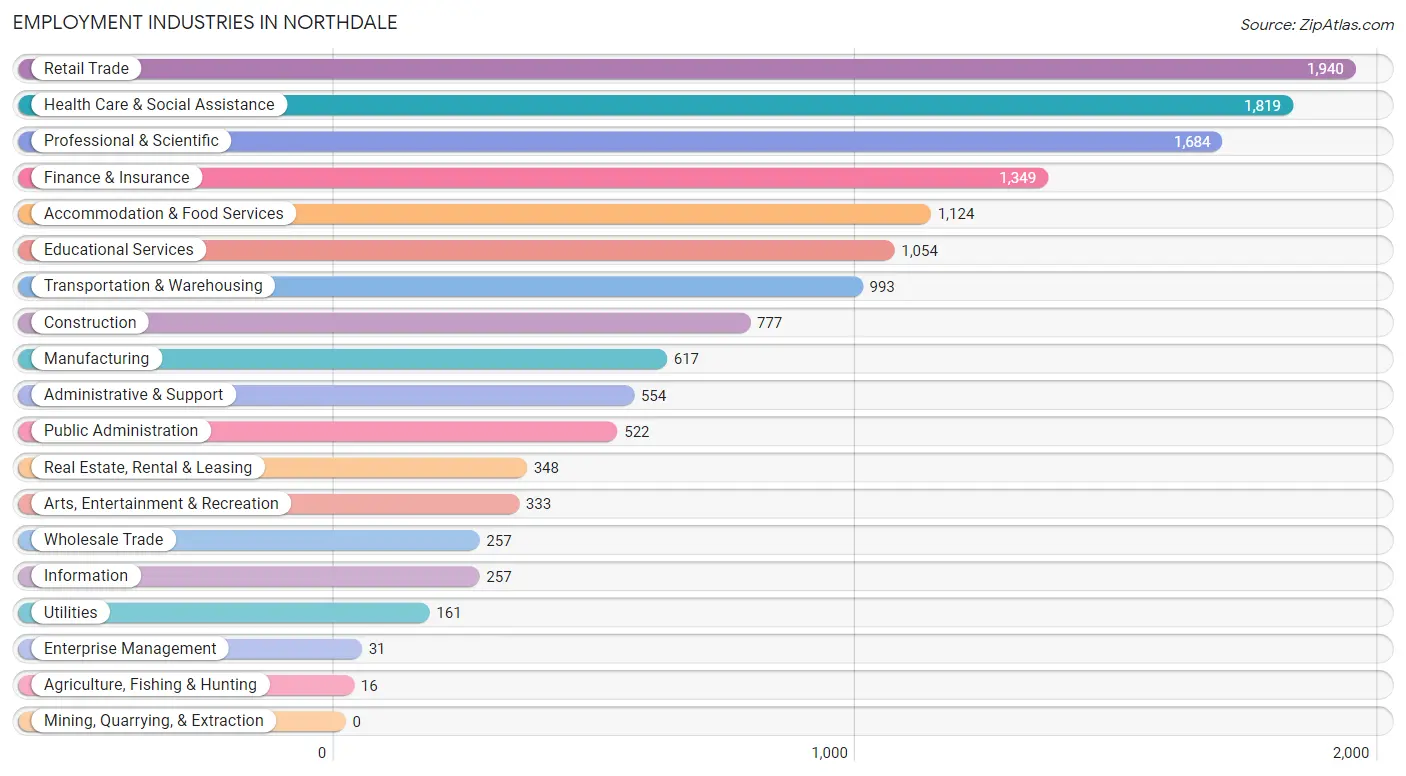
Employment Industries in Northdale
The major employment industries in Northdale include Retail Trade (1,940 | 13.4%), Health Care & Social Assistance (1,819 | 12.6%), Professional & Scientific (1,684 | 11.6%), Finance & Insurance (1,349 | 9.3%), and Accommodation & Food Services (1,124 | 7.8%).
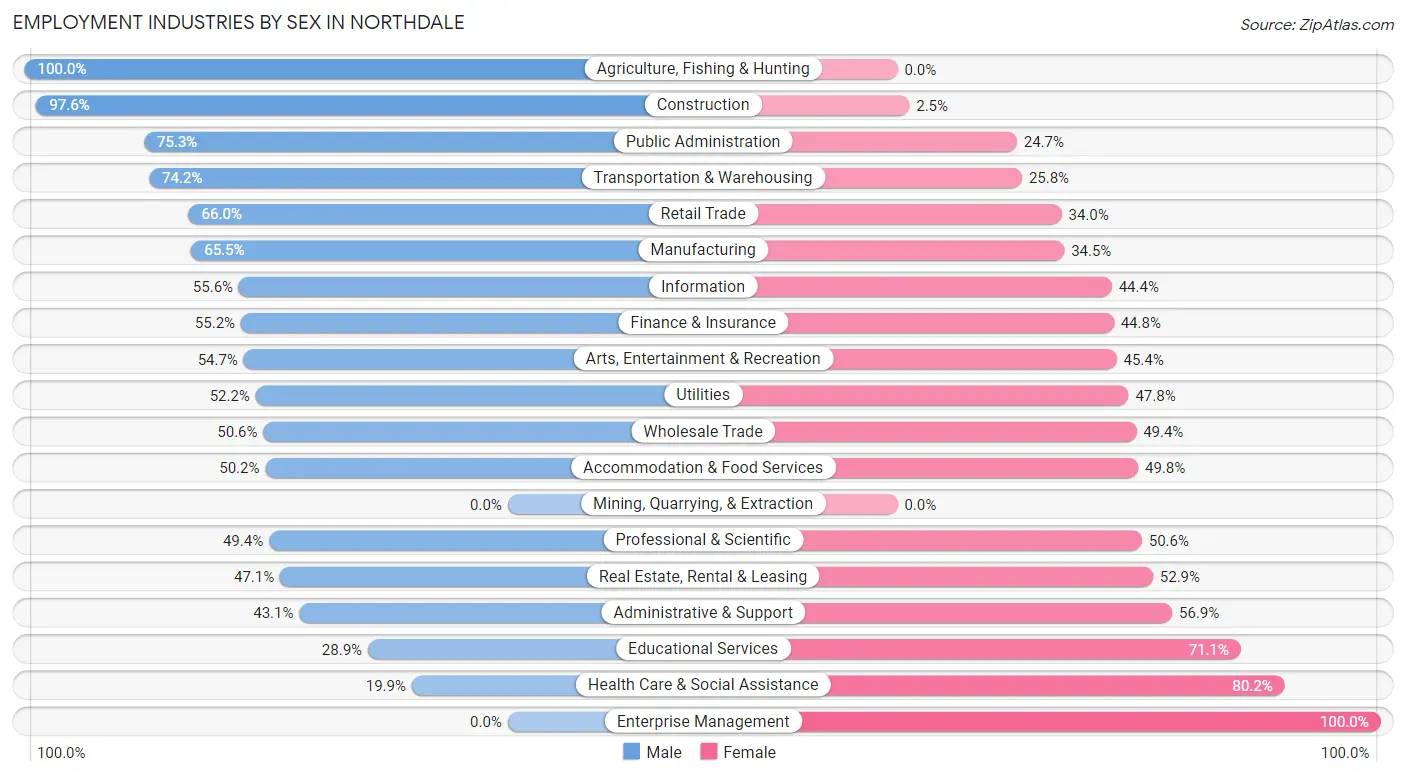
Employment Industries by Sex in Northdale
The Northdale industries that see more men than women are Agriculture, Fishing & Hunting (100.0%), Construction (97.6%), and Public Administration (75.3%), whereas the industries that tend to have a higher number of women are Enterprise Management (100.0%), Health Care & Social Assistance (80.1%), and Educational Services (71.1%).
| Industry | Male | Female |
| Agriculture, Fishing & Hunting | 16 (100.0%) | 0 (0.0%) |
| Mining, Quarrying, & Extraction | 0 (0.0%) | 0 (0.0%) |
| Construction | 758 (97.6%) | 19 (2.5%) |
| Manufacturing | 404 (65.5%) | 213 (34.5%) |
| Wholesale Trade | 130 (50.6%) | 127 (49.4%) |
| Retail Trade | 1,281 (66.0%) | 659 (34.0%) |
| Transportation & Warehousing | 737 (74.2%) | 256 (25.8%) |
| Utilities | 84 (52.2%) | 77 (47.8%) |
| Information | 143 (55.6%) | 114 (44.4%) |
| Finance & Insurance | 745 (55.2%) | 604 (44.8%) |
| Real Estate, Rental & Leasing | 164 (47.1%) | 184 (52.9%) |
| Professional & Scientific | 832 (49.4%) | 852 (50.6%) |
| Enterprise Management | 0 (0.0%) | 31 (100.0%) |
| Administrative & Support | 239 (43.1%) | 315 (56.9%) |
| Educational Services | 305 (28.9%) | 749 (71.1%) |
| Health Care & Social Assistance | 361 (19.9%) | 1,458 (80.1%) |
| Arts, Entertainment & Recreation | 182 (54.6%) | 151 (45.4%) |
| Accommodation & Food Services | 564 (50.2%) | 560 (49.8%) |
| Public Administration | 393 (75.3%) | 129 (24.7%) |
| Total | 7,558 (52.2%) | 6,924 (47.8%) |
Education in Northdale
School Enrollment in Northdale
The most common levels of schooling among the 6,078 students in Northdale are elementary school (1,532 | 25.2%), high school (1,239 | 20.4%), and middle school (1,214 | 20.0%).
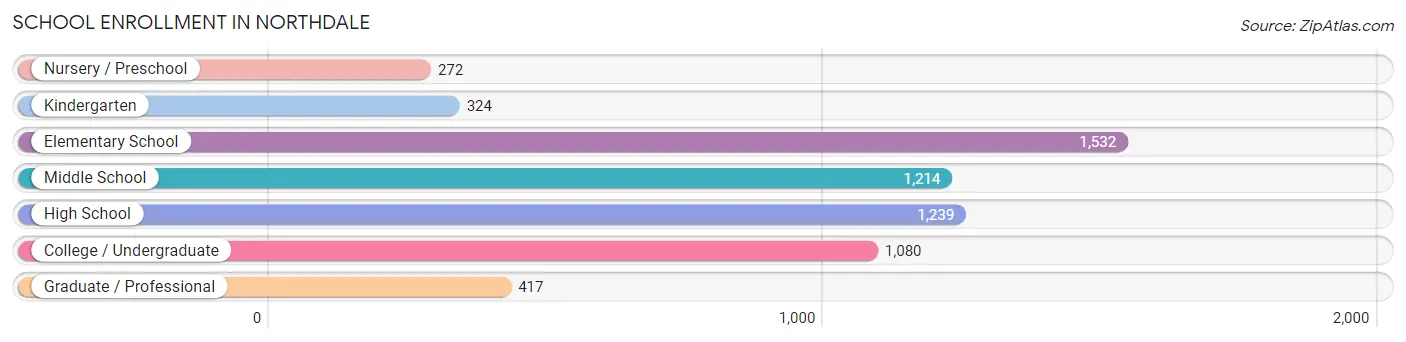
| School Level | # Students | % Students |
| Nursery / Preschool | 272 | 4.5% |
| Kindergarten | 324 | 5.3% |
| Elementary School | 1,532 | 25.2% |
| Middle School | 1,214 | 20.0% |
| High School | 1,239 | 20.4% |
| College / Undergraduate | 1,080 | 17.8% |
| Graduate / Professional | 417 | 6.9% |
| Total | 6,078 | 100.0% |
School Enrollment by Age by Funding Source in Northdale
Out of a total of 6,078 students who are enrolled in schools in Northdale, 1,197 (19.7%) attend a private institution, while the remaining 4,881 (80.3%) are enrolled in public schools. The age group of 3 to 4 year olds has the highest likelihood of being enrolled in private schools, with 120 (49.2% in the age bracket) enrolled. Conversely, the age group of 15 to 17 year olds has the lowest likelihood of being enrolled in a private school, with 859 (93.1% in the age bracket) attending a public institution.
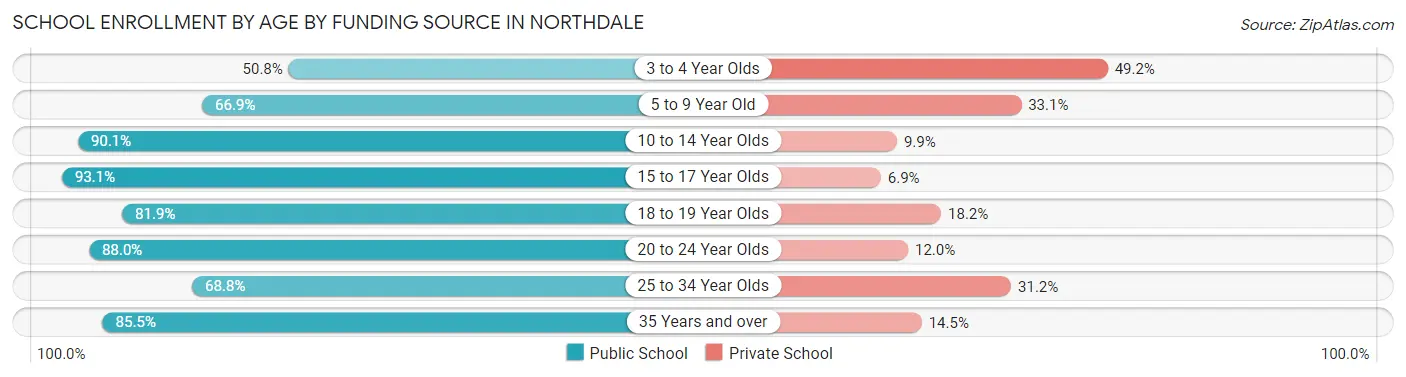
| Age Bracket | Public School | Private School |
| 3 to 4 Year Olds | 124 (50.8%) | 120 (49.2%) |
| 5 to 9 Year Old | 1,089 (66.9%) | 538 (33.1%) |
| 10 to 14 Year Olds | 1,478 (90.1%) | 163 (9.9%) |
| 15 to 17 Year Olds | 859 (93.1%) | 64 (6.9%) |
| 18 to 19 Year Olds | 266 (81.9%) | 59 (18.1%) |
| 20 to 24 Year Olds | 514 (88.0%) | 70 (12.0%) |
| 25 to 34 Year Olds | 311 (68.8%) | 141 (31.2%) |
| 35 Years and over | 241 (85.5%) | 41 (14.5%) |
| Total | 4,881 (80.3%) | 1,197 (19.7%) |
Educational Attainment by Field of Study in Northdale
Business (2,619 | 29.9%), engineering (1,323 | 15.1%), education (1,008 | 11.5%), science & technology (735 | 8.4%), and arts & humanities (504 | 5.8%) are the most common fields of study among 8,771 individuals in Northdale who have obtained a bachelor's degree or higher.
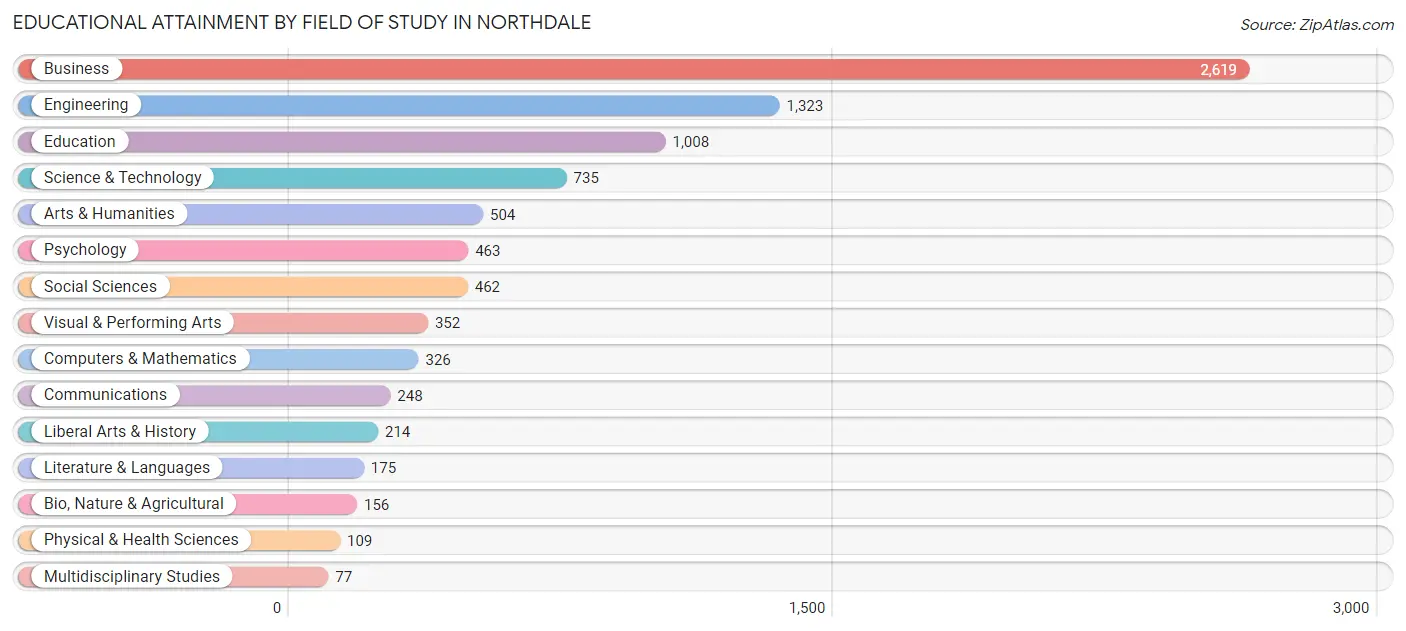
| Field of Study | # Graduates | % Graduates |
| Computers & Mathematics | 326 | 3.7% |
| Bio, Nature & Agricultural | 156 | 1.8% |
| Physical & Health Sciences | 109 | 1.2% |
| Psychology | 463 | 5.3% |
| Social Sciences | 462 | 5.3% |
| Engineering | 1,323 | 15.1% |
| Multidisciplinary Studies | 77 | 0.9% |
| Science & Technology | 735 | 8.4% |
| Business | 2,619 | 29.9% |
| Education | 1,008 | 11.5% |
| Literature & Languages | 175 | 2.0% |
| Liberal Arts & History | 214 | 2.4% |
| Visual & Performing Arts | 352 | 4.0% |
| Communications | 248 | 2.8% |
| Arts & Humanities | 504 | 5.8% |
| Total | 8,771 | 100.0% |
Transportation & Commute in Northdale
Vehicle Availability by Sex in Northdale
The most prevalent vehicle ownership categories in Northdale are males with 2 vehicles (3,969, accounting for 53.1%) and females with 2 vehicles (3,738, making up 57.7%).
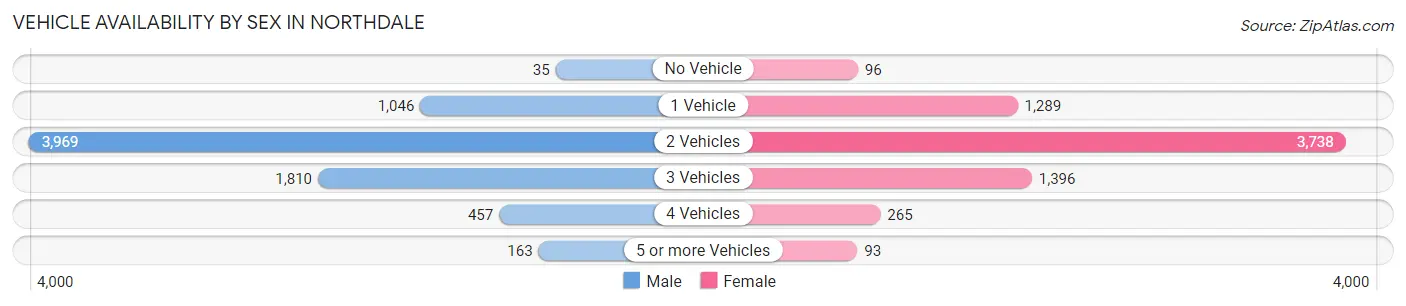
| Vehicles Available | Male | Female |
| No Vehicle | 35 (0.5%) | 96 (1.4%) |
| 1 Vehicle | 1,046 (14.0%) | 1,289 (18.7%) |
| 2 Vehicles | 3,969 (53.1%) | 3,738 (54.4%) |
| 3 Vehicles | 1,810 (24.2%) | 1,396 (20.3%) |
| 4 Vehicles | 457 (6.1%) | 265 (3.8%) |
| 5 or more Vehicles | 163 (2.2%) | 93 (1.3%) |
| Total | 7,480 (100.0%) | 6,877 (100.0%) |
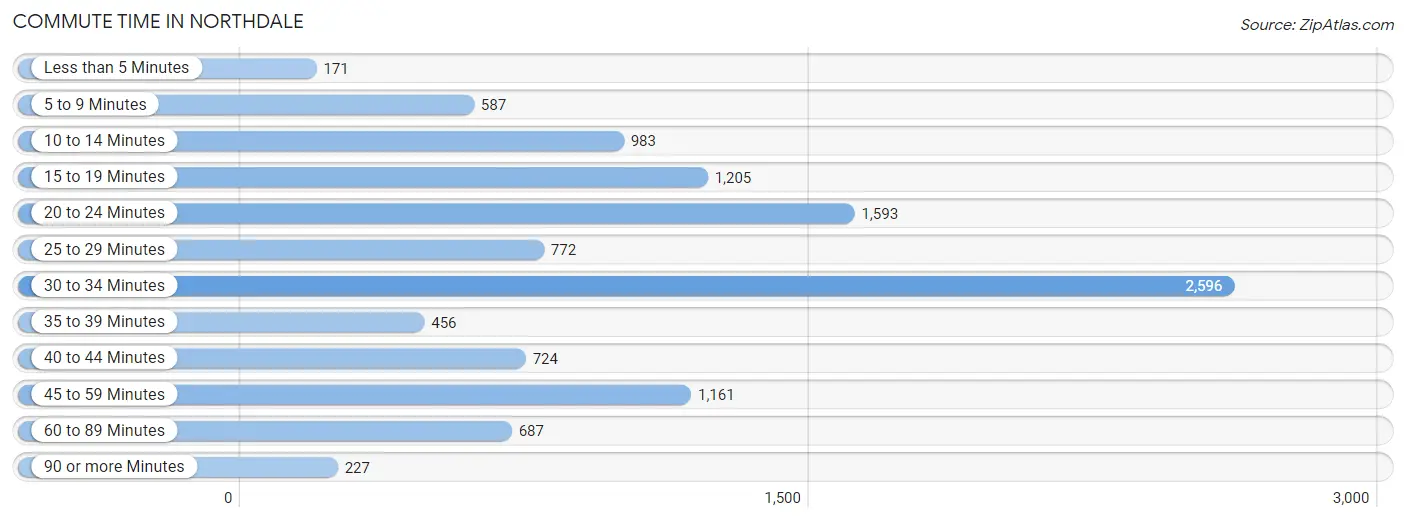
Commute Time in Northdale
The most frequently occuring commute durations in Northdale are 30 to 34 minutes (2,596 commuters, 23.3%), 20 to 24 minutes (1,593 commuters, 14.3%), and 15 to 19 minutes (1,205 commuters, 10.8%).
| Commute Time | # Commuters | % Commuters |
| Less than 5 Minutes | 171 | 1.5% |
| 5 to 9 Minutes | 587 | 5.3% |
| 10 to 14 Minutes | 983 | 8.8% |
| 15 to 19 Minutes | 1,205 | 10.8% |
| 20 to 24 Minutes | 1,593 | 14.3% |
| 25 to 29 Minutes | 772 | 6.9% |
| 30 to 34 Minutes | 2,596 | 23.3% |
| 35 to 39 Minutes | 456 | 4.1% |
| 40 to 44 Minutes | 724 | 6.5% |
| 45 to 59 Minutes | 1,161 | 10.4% |
| 60 to 89 Minutes | 687 | 6.1% |
| 90 or more Minutes | 227 | 2.0% |
Commute Time by Sex in Northdale
The most common commute times in Northdale are 30 to 34 minutes (1,681 commuters, 27.0%) for males and 30 to 34 minutes (915 commuters, 18.5%) for females.
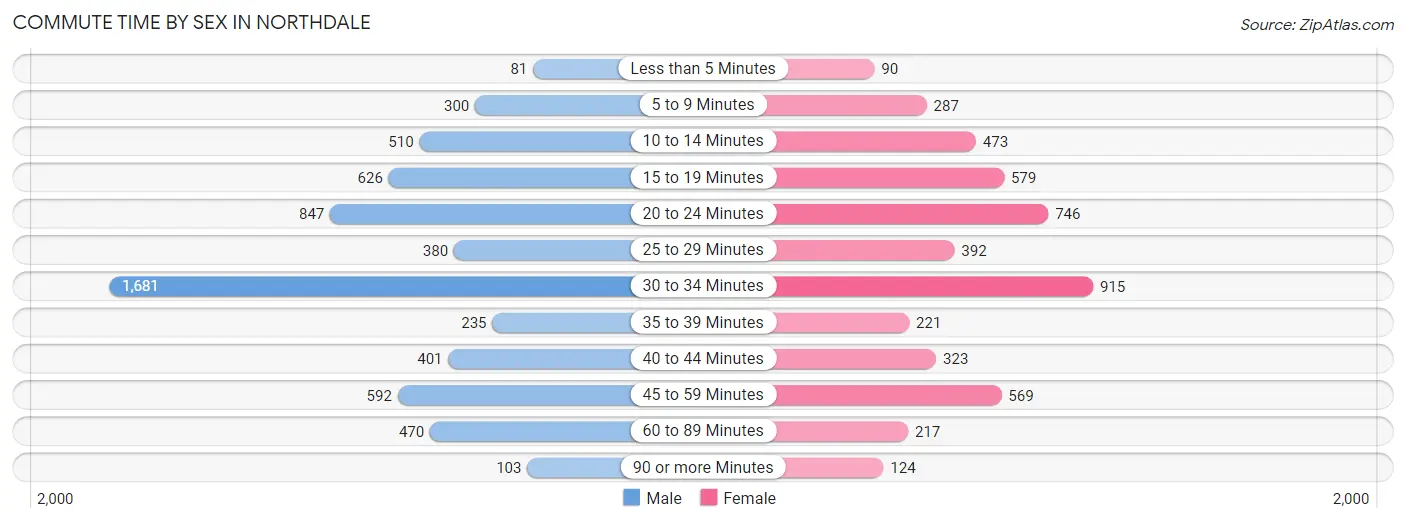
| Commute Time | Male | Female |
| Less than 5 Minutes | 81 (1.3%) | 90 (1.8%) |
| 5 to 9 Minutes | 300 (4.8%) | 287 (5.8%) |
| 10 to 14 Minutes | 510 (8.2%) | 473 (9.6%) |
| 15 to 19 Minutes | 626 (10.1%) | 579 (11.7%) |
| 20 to 24 Minutes | 847 (13.6%) | 746 (15.1%) |
| 25 to 29 Minutes | 380 (6.1%) | 392 (7.9%) |
| 30 to 34 Minutes | 1,681 (27.0%) | 915 (18.5%) |
| 35 to 39 Minutes | 235 (3.8%) | 221 (4.5%) |
| 40 to 44 Minutes | 401 (6.4%) | 323 (6.5%) |
| 45 to 59 Minutes | 592 (9.5%) | 569 (11.5%) |
| 60 to 89 Minutes | 470 (7.5%) | 217 (4.4%) |
| 90 or more Minutes | 103 (1.7%) | 124 (2.5%) |
Time of Departure to Work by Sex in Northdale
The most frequent times of departure to work in Northdale are 7:00 AM to 7:29 AM (1,065, 17.1%) for males and 7:00 AM to 7:29 AM (1,144, 23.2%) for females.
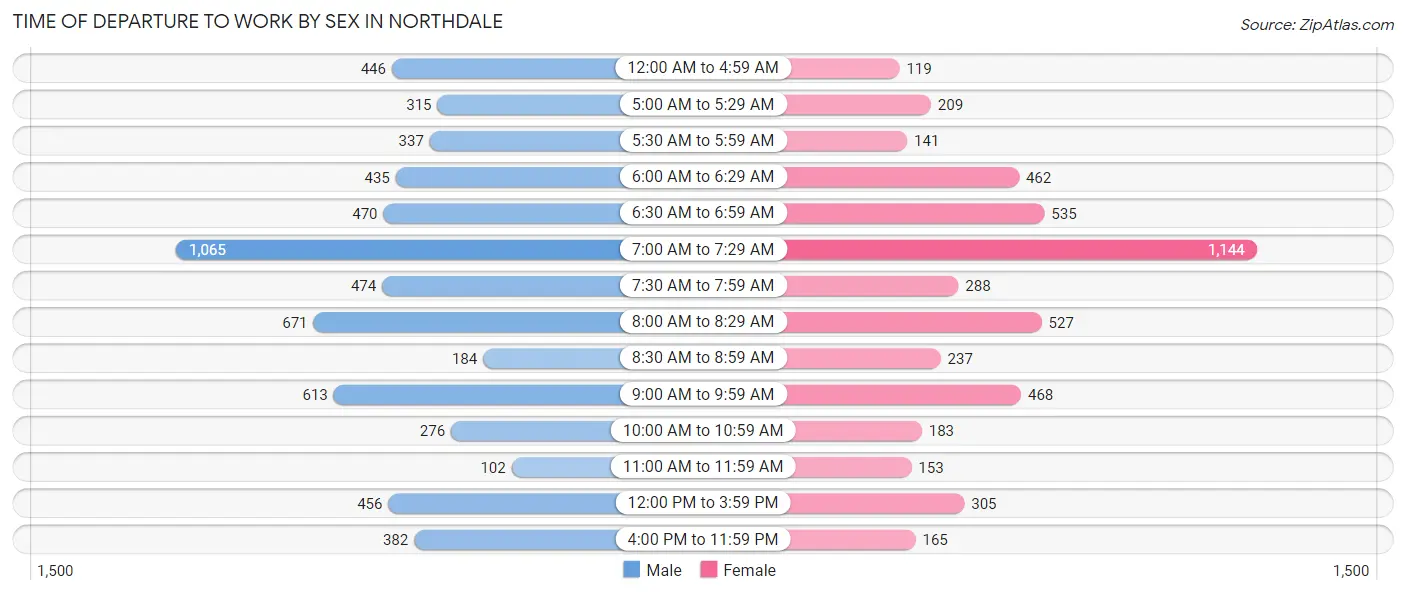
| Time of Departure | Male | Female |
| 12:00 AM to 4:59 AM | 446 (7.2%) | 119 (2.4%) |
| 5:00 AM to 5:29 AM | 315 (5.1%) | 209 (4.2%) |
| 5:30 AM to 5:59 AM | 337 (5.4%) | 141 (2.9%) |
| 6:00 AM to 6:29 AM | 435 (7.0%) | 462 (9.4%) |
| 6:30 AM to 6:59 AM | 470 (7.5%) | 535 (10.8%) |
| 7:00 AM to 7:29 AM | 1,065 (17.1%) | 1,144 (23.2%) |
| 7:30 AM to 7:59 AM | 474 (7.6%) | 288 (5.8%) |
| 8:00 AM to 8:29 AM | 671 (10.8%) | 527 (10.7%) |
| 8:30 AM to 8:59 AM | 184 (3.0%) | 237 (4.8%) |
| 9:00 AM to 9:59 AM | 613 (9.9%) | 468 (9.5%) |
| 10:00 AM to 10:59 AM | 276 (4.4%) | 183 (3.7%) |
| 11:00 AM to 11:59 AM | 102 (1.6%) | 153 (3.1%) |
| 12:00 PM to 3:59 PM | 456 (7.3%) | 305 (6.2%) |
| 4:00 PM to 11:59 PM | 382 (6.1%) | 165 (3.3%) |
| Total | 6,226 (100.0%) | 4,936 (100.0%) |
Housing Occupancy in Northdale
Occupancy by Ownership in Northdale
Of the total 9,560 dwellings in Northdale, owner-occupied units account for 6,839 (71.5%), while renter-occupied units make up 2,721 (28.5%).
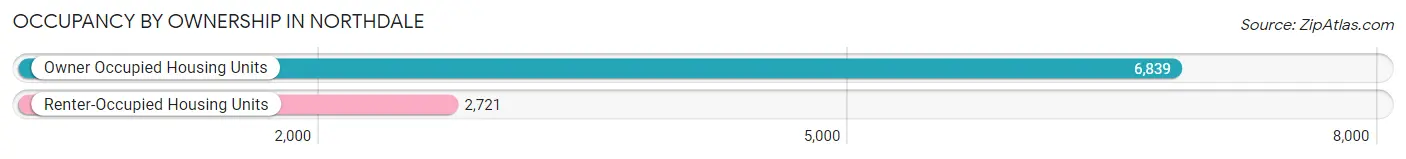
| Occupancy | # Housing Units | % Housing Units |
| Owner Occupied Housing Units | 6,839 | 71.5% |
| Renter-Occupied Housing Units | 2,721 | 28.5% |
| Total Occupied Housing Units | 9,560 | 100.0% |
Occupancy by Household Size in Northdale
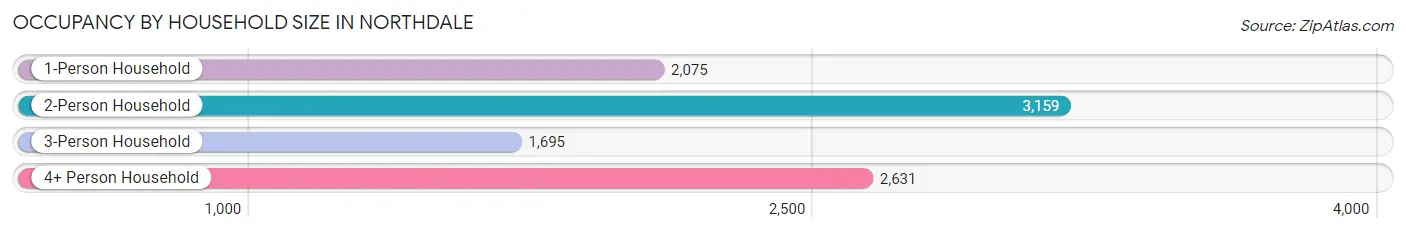
| Household Size | # Housing Units | % Housing Units |
| 1-Person Household | 2,075 | 21.7% |
| 2-Person Household | 3,159 | 33.0% |
| 3-Person Household | 1,695 | 17.7% |
| 4+ Person Household | 2,631 | 27.5% |
| Total Housing Units | 9,560 | 100.0% |
Occupancy by Ownership by Household Size in Northdale
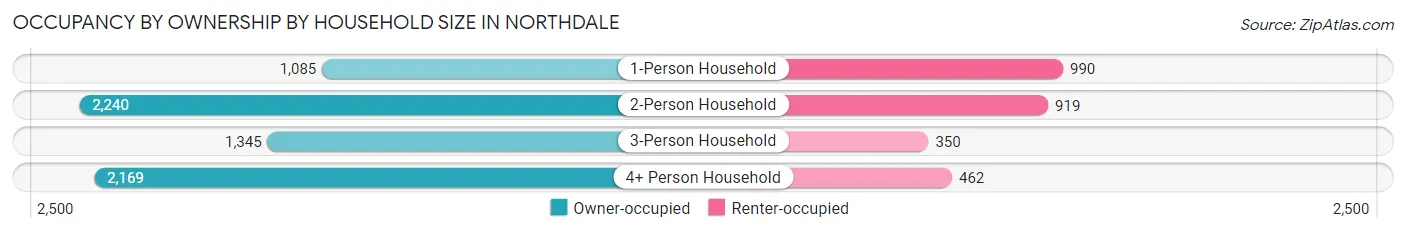
| Household Size | Owner-occupied | Renter-occupied |
| 1-Person Household | 1,085 (52.3%) | 990 (47.7%) |
| 2-Person Household | 2,240 (70.9%) | 919 (29.1%) |
| 3-Person Household | 1,345 (79.3%) | 350 (20.6%) |
| 4+ Person Household | 2,169 (82.4%) | 462 (17.6%) |
| Total Housing Units | 6,839 (71.5%) | 2,721 (28.5%) |
Occupancy by Educational Attainment in Northdale
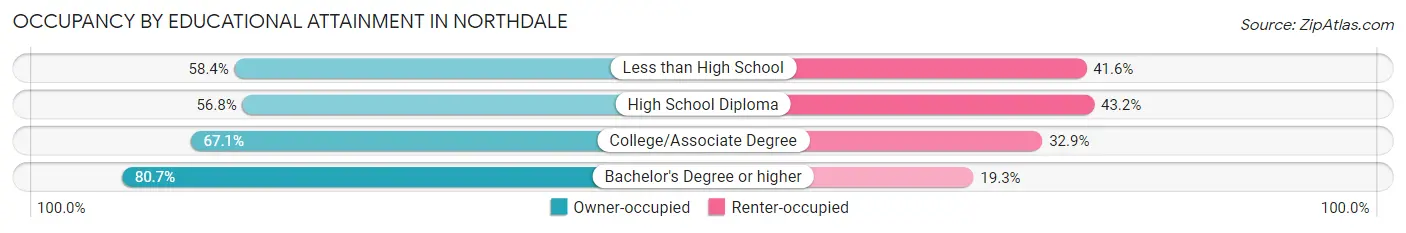
| Household Size | Owner-occupied | Renter-occupied |
| Less than High School | 164 (58.4%) | 117 (41.6%) |
| High School Diploma | 919 (56.8%) | 699 (43.2%) |
| College/Associate Degree | 2,105 (67.1%) | 1,033 (32.9%) |
| Bachelor's Degree or higher | 3,651 (80.7%) | 872 (19.3%) |
Occupancy by Age of Householder in Northdale
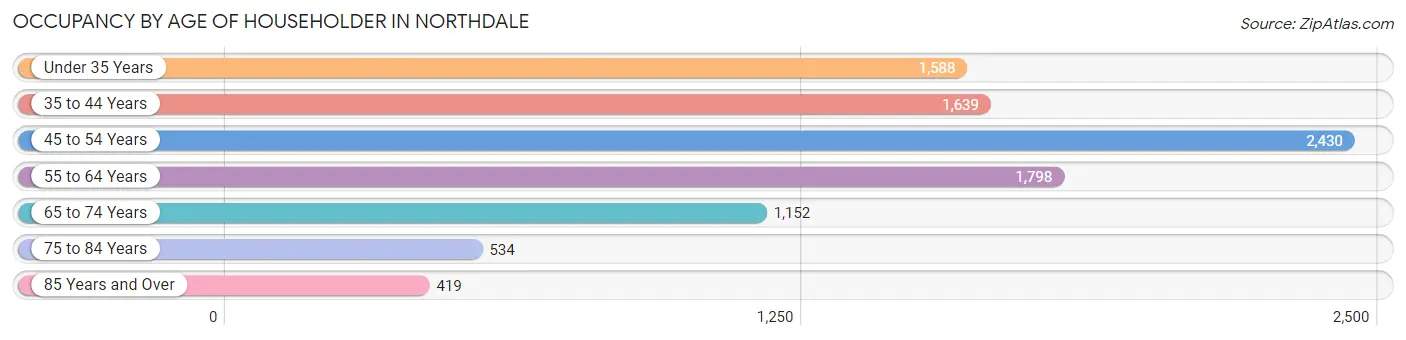
| Age Bracket | # Households | % Households |
| Under 35 Years | 1,588 | 16.6% |
| 35 to 44 Years | 1,639 | 17.1% |
| 45 to 54 Years | 2,430 | 25.4% |
| 55 to 64 Years | 1,798 | 18.8% |
| 65 to 74 Years | 1,152 | 12.0% |
| 75 to 84 Years | 534 | 5.6% |
| 85 Years and Over | 419 | 4.4% |
| Total | 9,560 | 100.0% |
Housing Finances in Northdale
Median Income by Occupancy in Northdale
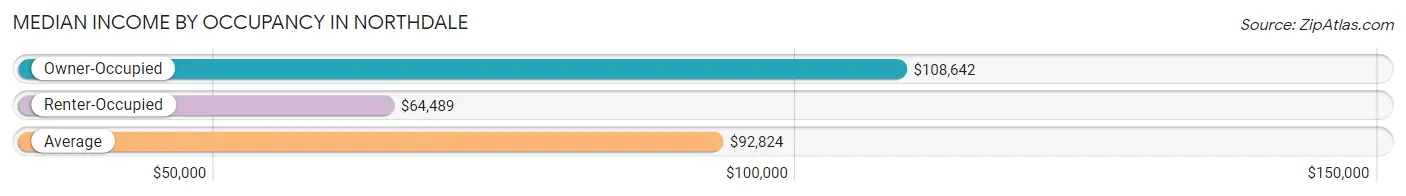
| Occupancy Type | # Households | Median Income |
| Owner-Occupied | 6,839 (71.5%) | $108,642 |
| Renter-Occupied | 2,721 (28.5%) | $64,489 |
| Average | 9,560 (100.0%) | $92,824 |
Occupancy by Householder Income Bracket in Northdale
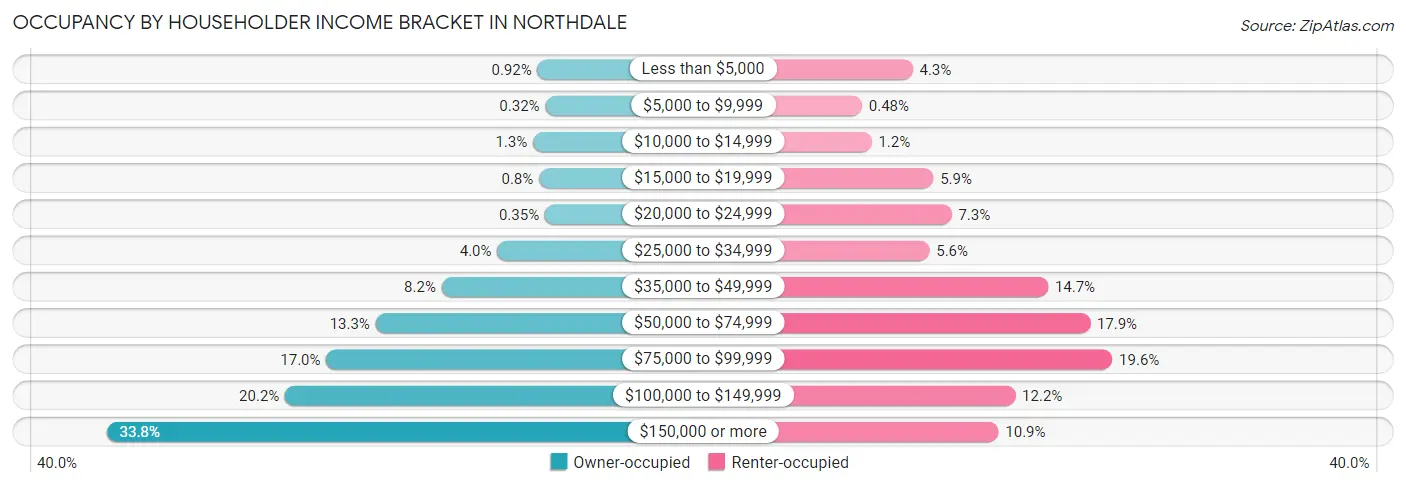
| Income Bracket | Owner-occupied | Renter-occupied |
| Less than $5,000 | 63 (0.9%) | 118 (4.3%) |
| $5,000 to $9,999 | 22 (0.3%) | 13 (0.5%) |
| $10,000 to $14,999 | 86 (1.3%) | 33 (1.2%) |
| $15,000 to $19,999 | 55 (0.8%) | 161 (5.9%) |
| $20,000 to $24,999 | 24 (0.4%) | 199 (7.3%) |
| $25,000 to $34,999 | 272 (4.0%) | 153 (5.6%) |
| $35,000 to $49,999 | 562 (8.2%) | 399 (14.7%) |
| $50,000 to $74,999 | 906 (13.3%) | 486 (17.9%) |
| $75,000 to $99,999 | 1,163 (17.0%) | 532 (19.6%) |
| $100,000 to $149,999 | 1,378 (20.2%) | 331 (12.2%) |
| $150,000 or more | 2,308 (33.8%) | 296 (10.9%) |
| Total | 6,839 (100.0%) | 2,721 (100.0%) |
Monthly Housing Cost Tiers in Northdale
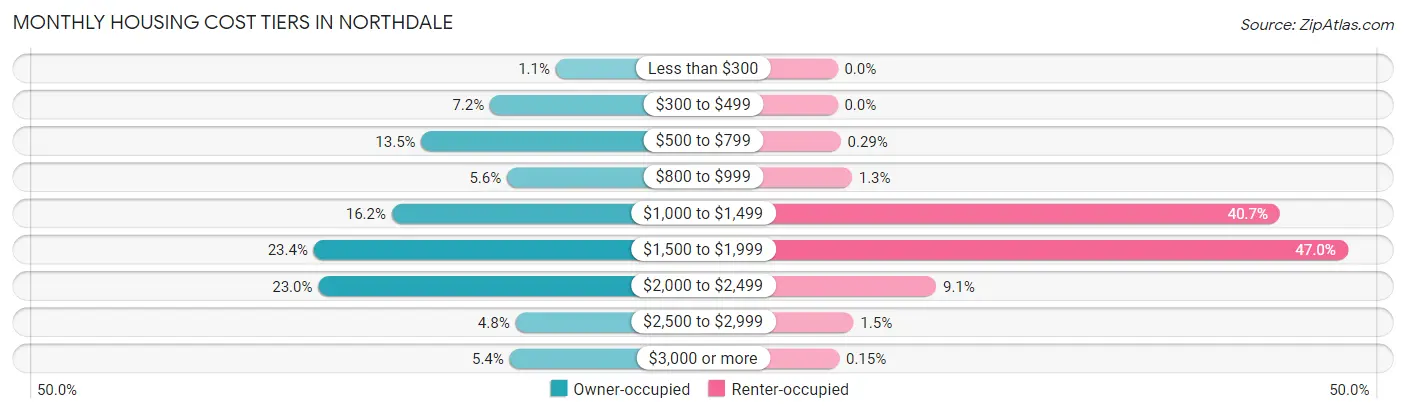
| Monthly Cost | Owner-occupied | Renter-occupied |
| Less than $300 | 75 (1.1%) | 0 (0.0%) |
| $300 to $499 | 489 (7.1%) | 0 (0.0%) |
| $500 to $799 | 921 (13.5%) | 8 (0.3%) |
| $800 to $999 | 382 (5.6%) | 36 (1.3%) |
| $1,000 to $1,499 | 1,108 (16.2%) | 1,108 (40.7%) |
| $1,500 to $1,999 | 1,599 (23.4%) | 1,278 (47.0%) |
| $2,000 to $2,499 | 1,570 (23.0%) | 247 (9.1%) |
| $2,500 to $2,999 | 329 (4.8%) | 40 (1.5%) |
| $3,000 or more | 366 (5.3%) | 4 (0.2%) |
| Total | 6,839 (100.0%) | 2,721 (100.0%) |
Physical Housing Characteristics in Northdale
Housing Structures in Northdale
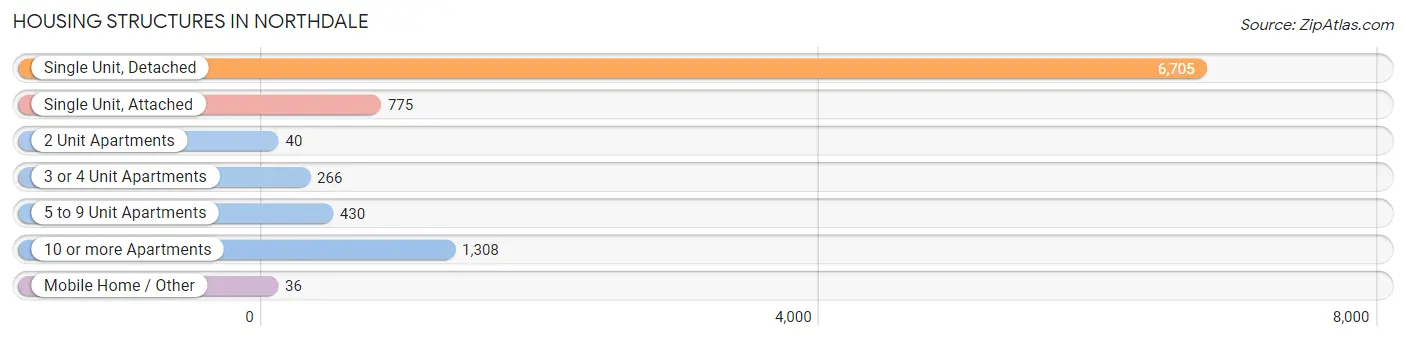
| Structure Type | # Housing Units | % Housing Units |
| Single Unit, Detached | 6,705 | 70.1% |
| Single Unit, Attached | 775 | 8.1% |
| 2 Unit Apartments | 40 | 0.4% |
| 3 or 4 Unit Apartments | 266 | 2.8% |
| 5 to 9 Unit Apartments | 430 | 4.5% |
| 10 or more Apartments | 1,308 | 13.7% |
| Mobile Home / Other | 36 | 0.4% |
| Total | 9,560 | 100.0% |
Housing Structures by Occupancy in Northdale
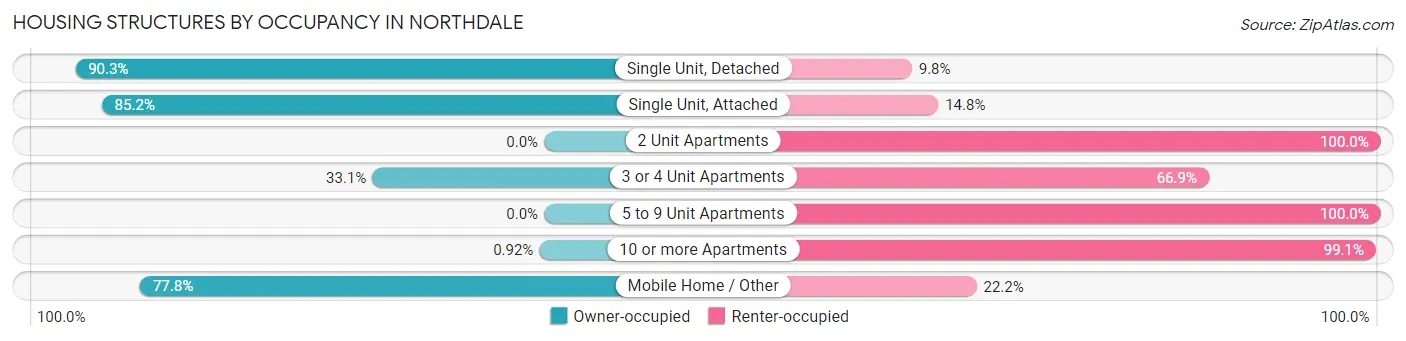
| Structure Type | Owner-occupied | Renter-occupied |
| Single Unit, Detached | 6,051 (90.2%) | 654 (9.8%) |
| Single Unit, Attached | 660 (85.2%) | 115 (14.8%) |
| 2 Unit Apartments | 0 (0.0%) | 40 (100.0%) |
| 3 or 4 Unit Apartments | 88 (33.1%) | 178 (66.9%) |
| 5 to 9 Unit Apartments | 0 (0.0%) | 430 (100.0%) |
| 10 or more Apartments | 12 (0.9%) | 1,296 (99.1%) |
| Mobile Home / Other | 28 (77.8%) | 8 (22.2%) |
| Total | 6,839 (71.5%) | 2,721 (28.5%) |
Housing Structures by Number of Rooms in Northdale
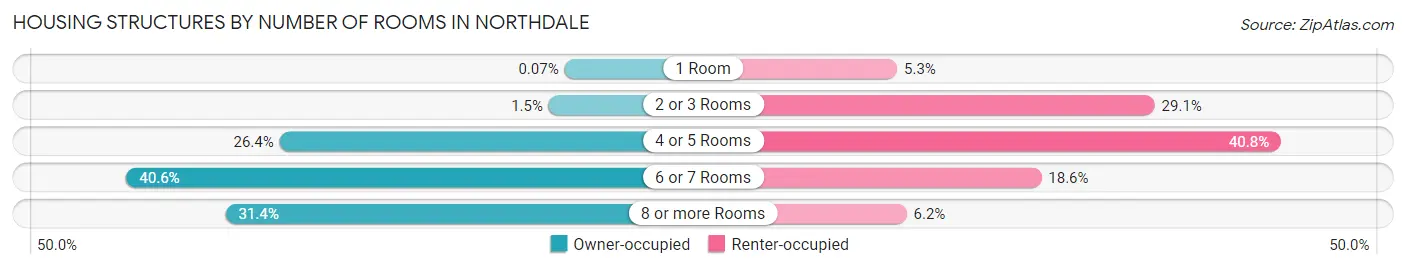
| Number of Rooms | Owner-occupied | Renter-occupied |
| 1 Room | 5 (0.1%) | 144 (5.3%) |
| 2 or 3 Rooms | 104 (1.5%) | 792 (29.1%) |
| 4 or 5 Rooms | 1,807 (26.4%) | 1,110 (40.8%) |
| 6 or 7 Rooms | 2,775 (40.6%) | 507 (18.6%) |
| 8 or more Rooms | 2,148 (31.4%) | 168 (6.2%) |
| Total | 6,839 (100.0%) | 2,721 (100.0%) |
Housing Structure by Heating Type in Northdale
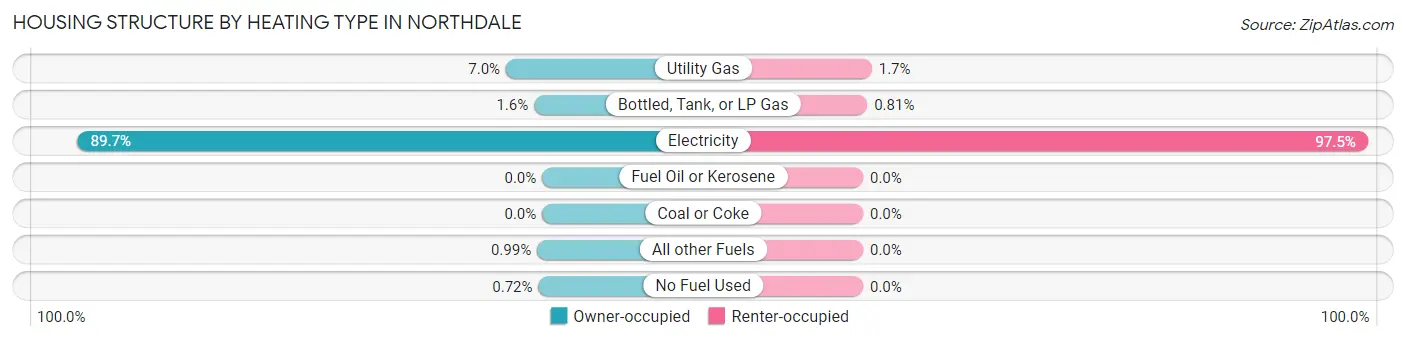
| Heating Type | Owner-occupied | Renter-occupied |
| Utility Gas | 478 (7.0%) | 46 (1.7%) |
| Bottled, Tank, or LP Gas | 107 (1.6%) | 22 (0.8%) |
| Electricity | 6,137 (89.7%) | 2,653 (97.5%) |
| Fuel Oil or Kerosene | 0 (0.0%) | 0 (0.0%) |
| Coal or Coke | 0 (0.0%) | 0 (0.0%) |
| All other Fuels | 68 (1.0%) | 0 (0.0%) |
| No Fuel Used | 49 (0.7%) | 0 (0.0%) |
| Total | 6,839 (100.0%) | 2,721 (100.0%) |
Household Vehicle Usage in Northdale
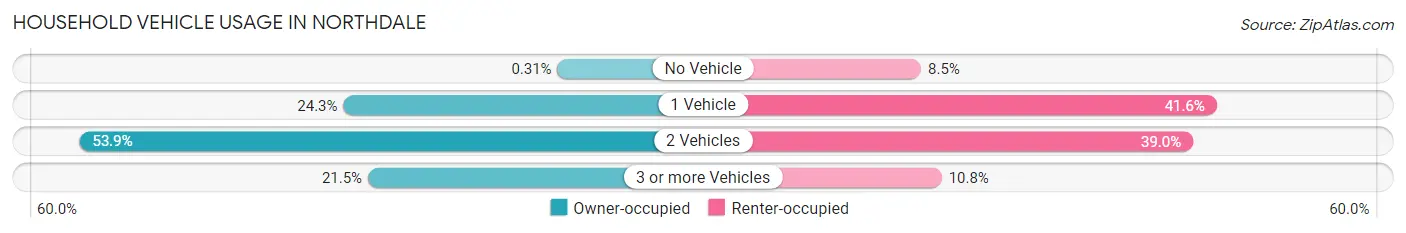
| Vehicles per Household | Owner-occupied | Renter-occupied |
| No Vehicle | 21 (0.3%) | 232 (8.5%) |
| 1 Vehicle | 1,661 (24.3%) | 1,133 (41.6%) |
| 2 Vehicles | 3,684 (53.9%) | 1,061 (39.0%) |
| 3 or more Vehicles | 1,473 (21.5%) | 295 (10.8%) |
| Total | 6,839 (100.0%) | 2,721 (100.0%) |
Real Estate & Mortgages in Northdale
Real Estate and Mortgage Overview in Northdale
| Characteristic | Without Mortgage | With Mortgage |
| Housing Units | 1,794 | 5,045 |
| Median Property Value | $345,100 | $340,300 |
| Median Household Income | $77,600 | $1,913 |
| Monthly Housing Costs | $632 | $366 |
| Real Estate Taxes | $2,486 | $28 |
Property Value by Mortgage Status in Northdale
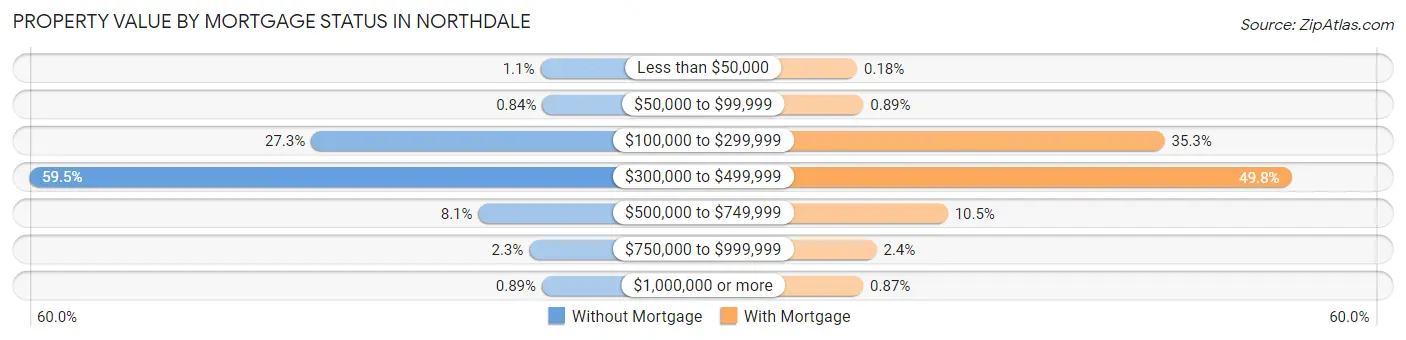
| Property Value | Without Mortgage | With Mortgage |
| Less than $50,000 | 19 (1.1%) | 9 (0.2%) |
| $50,000 to $99,999 | 15 (0.8%) | 45 (0.9%) |
| $100,000 to $299,999 | 489 (27.3%) | 1,782 (35.3%) |
| $300,000 to $499,999 | 1,067 (59.5%) | 2,513 (49.8%) |
| $500,000 to $749,999 | 146 (8.1%) | 531 (10.5%) |
| $750,000 to $999,999 | 42 (2.3%) | 121 (2.4%) |
| $1,000,000 or more | 16 (0.9%) | 44 (0.9%) |
| Total | 1,794 (100.0%) | 5,045 (100.0%) |
Household Income by Mortgage Status in Northdale
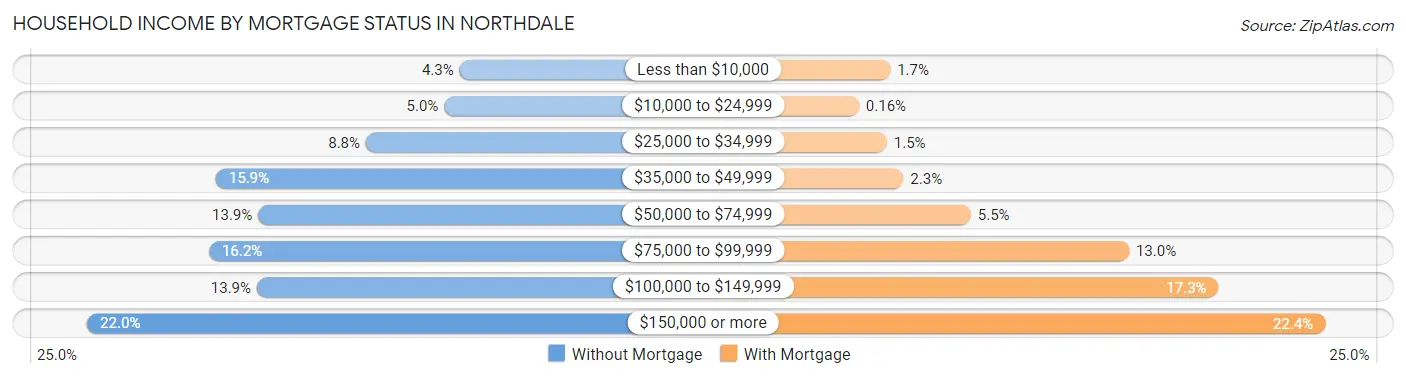
| Household Income | Without Mortgage | With Mortgage |
| Less than $10,000 | 77 (4.3%) | 83 (1.7%) |
| $10,000 to $24,999 | 90 (5.0%) | 8 (0.2%) |
| $25,000 to $34,999 | 157 (8.7%) | 75 (1.5%) |
| $35,000 to $49,999 | 285 (15.9%) | 115 (2.3%) |
| $50,000 to $74,999 | 249 (13.9%) | 277 (5.5%) |
| $75,000 to $99,999 | 291 (16.2%) | 657 (13.0%) |
| $100,000 to $149,999 | 250 (13.9%) | 872 (17.3%) |
| $150,000 or more | 395 (22.0%) | 1,128 (22.4%) |
| Total | 1,794 (100.0%) | 5,045 (100.0%) |
Property Value to Household Income Ratio in Northdale
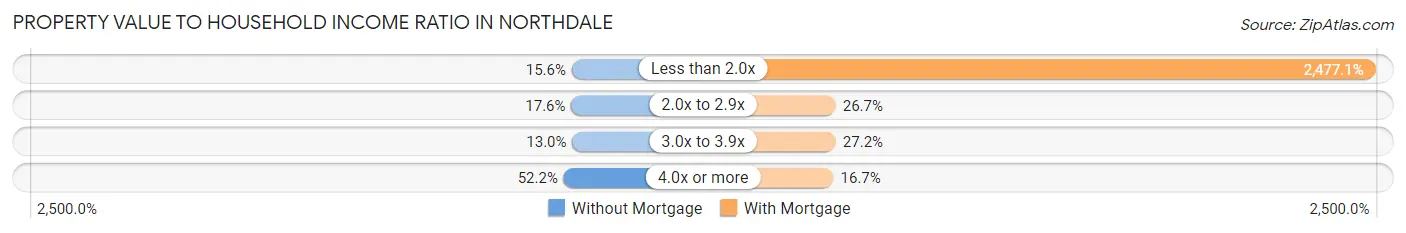
| Value-to-Income Ratio | Without Mortgage | With Mortgage |
| Less than 2.0x | 280 (15.6%) | 124,971 (2,477.1%) |
| 2.0x to 2.9x | 315 (17.6%) | 1,346 (26.7%) |
| 3.0x to 3.9x | 234 (13.0%) | 1,373 (27.2%) |
| 4.0x or more | 937 (52.2%) | 843 (16.7%) |
| Total | 1,794 (100.0%) | 5,045 (100.0%) |
Real Estate Taxes by Mortgage Status in Northdale
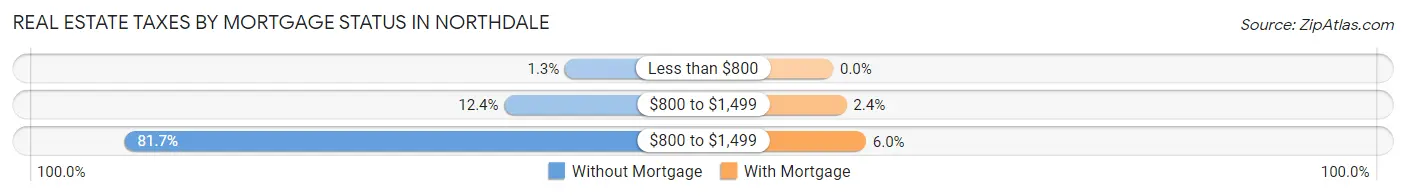
| Property Taxes | Without Mortgage | With Mortgage |
| Less than $800 | 23 (1.3%) | 0 (0.0%) |
| $800 to $1,499 | 222 (12.4%) | 123 (2.4%) |
| $800 to $1,499 | 1,466 (81.7%) | 302 (6.0%) |
| Total | 1,794 (100.0%) | 5,045 (100.0%) |
Health & Disability in Northdale
Health Insurance Coverage by Age in Northdale
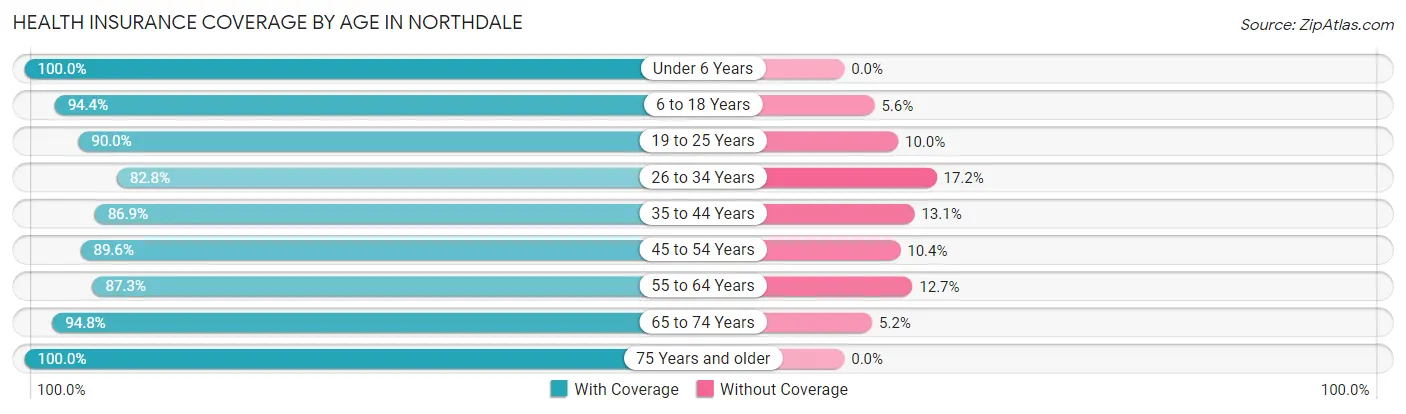
| Age Bracket | With Coverage | Without Coverage |
| Under 6 Years | 1,330 (100.0%) | 0 (0.0%) |
| 6 to 18 Years | 4,039 (94.4%) | 241 (5.6%) |
| 19 to 25 Years | 1,561 (90.0%) | 174 (10.0%) |
| 26 to 34 Years | 2,705 (82.8%) | 562 (17.2%) |
| 35 to 44 Years | 3,186 (86.9%) | 480 (13.1%) |
| 45 to 54 Years | 3,922 (89.6%) | 457 (10.4%) |
| 55 to 64 Years | 2,834 (87.3%) | 412 (12.7%) |
| 65 to 74 Years | 1,991 (94.8%) | 109 (5.2%) |
| 75 Years and older | 1,770 (100.0%) | 0 (0.0%) |
| Total | 23,338 (90.5%) | 2,435 (9.5%) |
Health Insurance Coverage by Citizenship Status in Northdale
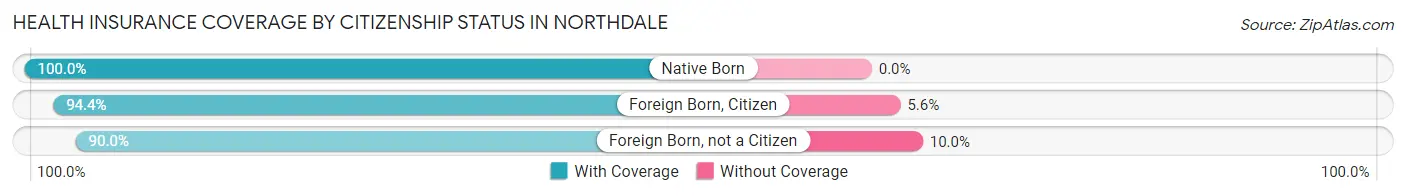
| Citizenship Status | With Coverage | Without Coverage |
| Native Born | 1,330 (100.0%) | 0 (0.0%) |
| Foreign Born, Citizen | 4,039 (94.4%) | 241 (5.6%) |
| Foreign Born, not a Citizen | 1,561 (90.0%) | 174 (10.0%) |
Health Insurance Coverage by Household Income in Northdale
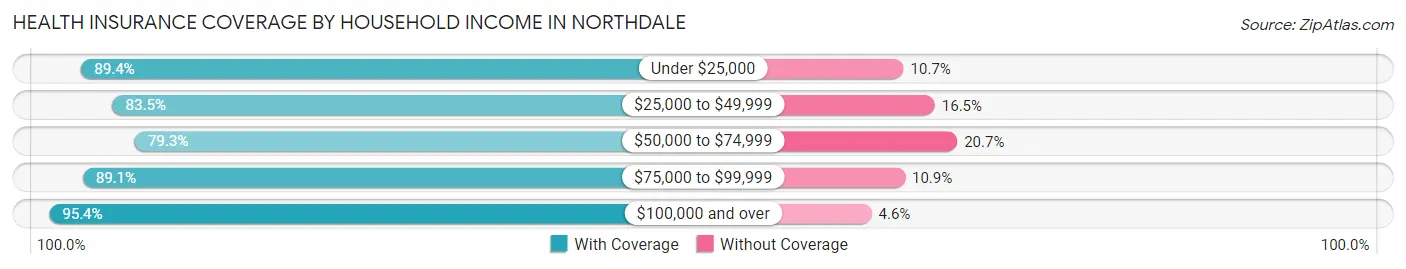
| Household Income | With Coverage | Without Coverage |
| Under $25,000 | 940 (89.3%) | 112 (10.6%) |
| $25,000 to $49,999 | 2,226 (83.5%) | 440 (16.5%) |
| $50,000 to $74,999 | 2,703 (79.3%) | 705 (20.7%) |
| $75,000 to $99,999 | 4,371 (89.1%) | 535 (10.9%) |
| $100,000 and over | 13,065 (95.4%) | 636 (4.6%) |
Public vs Private Health Insurance Coverage by Age in Northdale
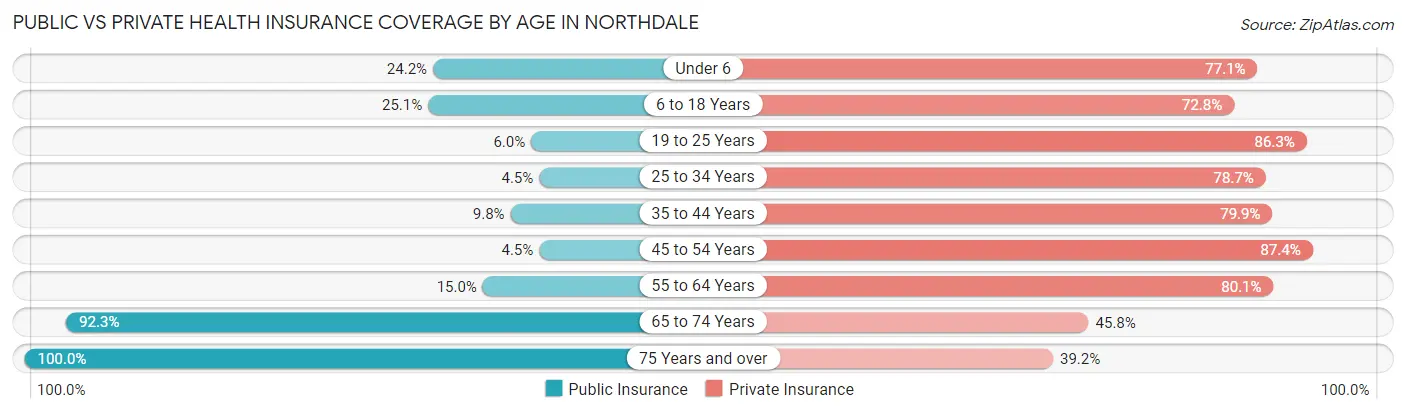
| Age Bracket | Public Insurance | Private Insurance |
| Under 6 | 322 (24.2%) | 1,026 (77.1%) |
| 6 to 18 Years | 1,075 (25.1%) | 3,116 (72.8%) |
| 19 to 25 Years | 104 (6.0%) | 1,497 (86.3%) |
| 25 to 34 Years | 147 (4.5%) | 2,570 (78.7%) |
| 35 to 44 Years | 360 (9.8%) | 2,929 (79.9%) |
| 45 to 54 Years | 197 (4.5%) | 3,827 (87.4%) |
| 55 to 64 Years | 486 (15.0%) | 2,600 (80.1%) |
| 65 to 74 Years | 1,938 (92.3%) | 962 (45.8%) |
| 75 Years and over | 1,770 (100.0%) | 694 (39.2%) |
| Total | 6,399 (24.8%) | 19,221 (74.6%) |
Disability Status by Sex by Age in Northdale
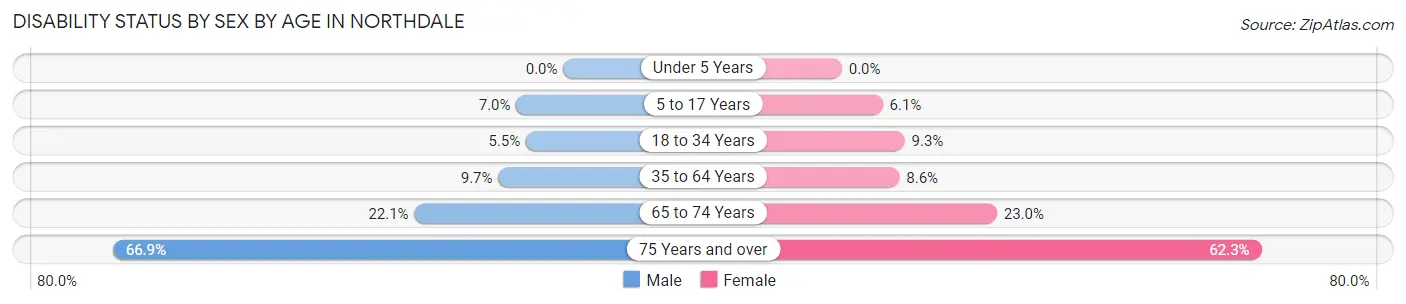
| Age Bracket | Male | Female |
| Under 5 Years | 0 (0.0%) | 0 (0.0%) |
| 5 to 17 Years | 134 (7.0%) | 144 (6.1%) |
| 18 to 34 Years | 148 (5.5%) | 244 (9.3%) |
| 35 to 64 Years | 565 (9.7%) | 465 (8.6%) |
| 65 to 74 Years | 182 (22.1%) | 294 (23.0%) |
| 75 Years and over | 483 (66.9%) | 653 (62.3%) |
Disability Class by Sex by Age in Northdale
Disability Class: Hearing Difficulty
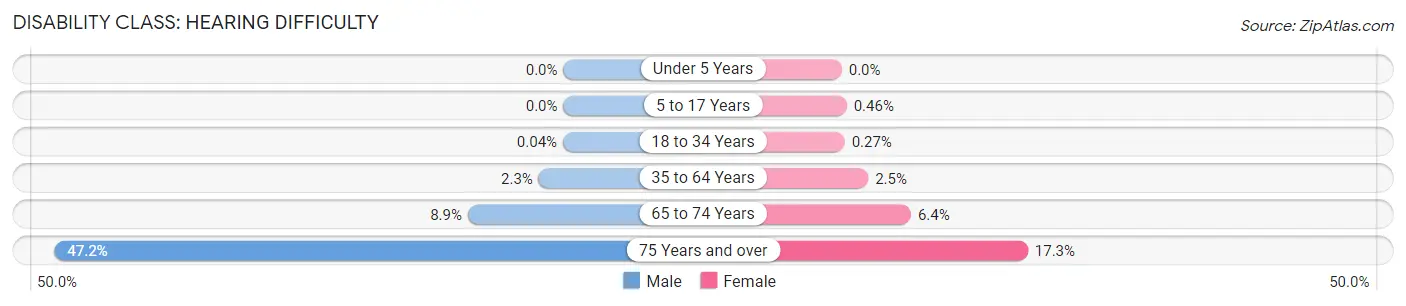
| Age Bracket | Male | Female |
| Under 5 Years | 0 (0.0%) | 0 (0.0%) |
| 5 to 17 Years | 0 (0.0%) | 11 (0.5%) |
| 18 to 34 Years | 1 (0.0%) | 7 (0.3%) |
| 35 to 64 Years | 134 (2.3%) | 133 (2.5%) |
| 65 to 74 Years | 73 (8.9%) | 82 (6.4%) |
| 75 Years and over | 341 (47.2%) | 181 (17.3%) |
Disability Class: Vision Difficulty
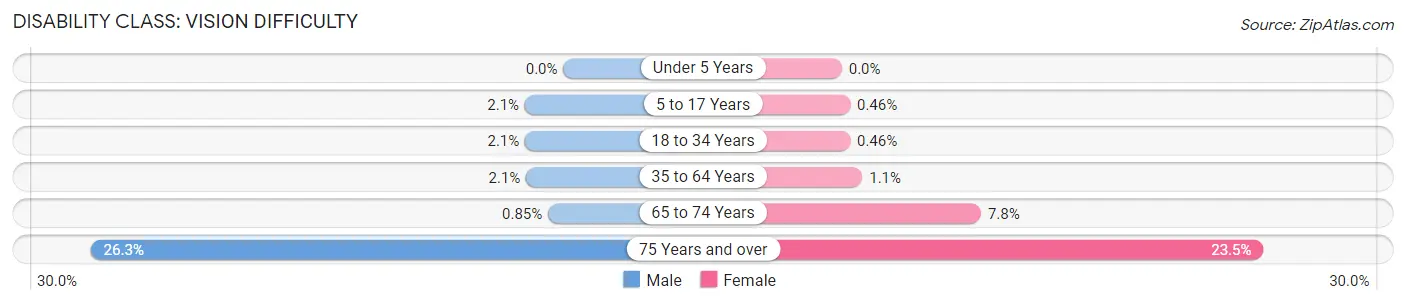
| Age Bracket | Male | Female |
| Under 5 Years | 0 (0.0%) | 0 (0.0%) |
| 5 to 17 Years | 41 (2.1%) | 11 (0.5%) |
| 18 to 34 Years | 57 (2.1%) | 12 (0.5%) |
| 35 to 64 Years | 121 (2.1%) | 62 (1.1%) |
| 65 to 74 Years | 7 (0.9%) | 99 (7.7%) |
| 75 Years and over | 190 (26.3%) | 246 (23.5%) |
Disability Class: Cognitive Difficulty
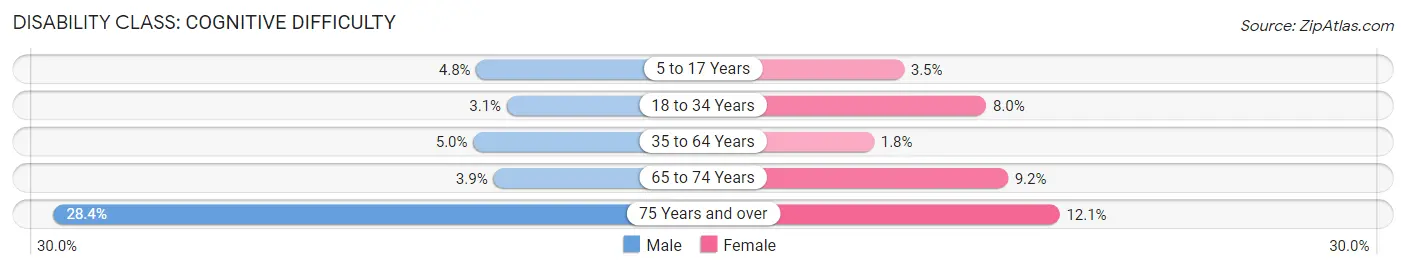
| Age Bracket | Male | Female |
| 5 to 17 Years | 93 (4.8%) | 82 (3.5%) |
| 18 to 34 Years | 84 (3.1%) | 210 (8.0%) |
| 35 to 64 Years | 293 (5.0%) | 97 (1.8%) |
| 65 to 74 Years | 32 (3.9%) | 118 (9.2%) |
| 75 Years and over | 205 (28.4%) | 127 (12.1%) |
Disability Class: Ambulatory Difficulty
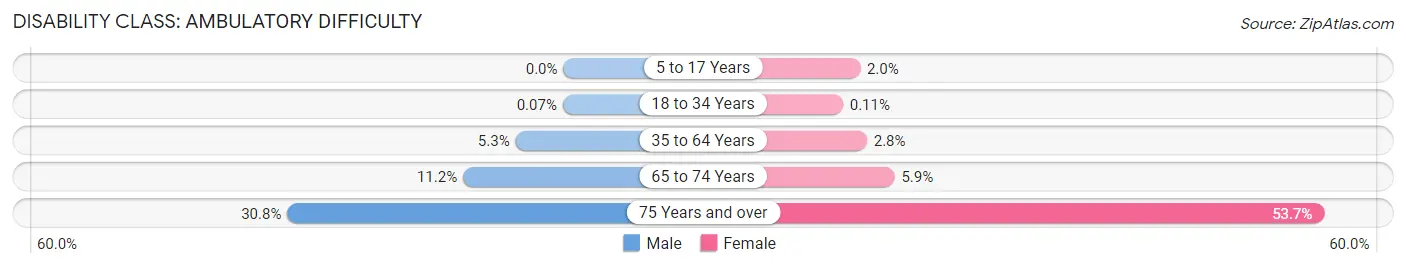
| Age Bracket | Male | Female |
| 5 to 17 Years | 0 (0.0%) | 48 (2.0%) |
| 18 to 34 Years | 2 (0.1%) | 3 (0.1%) |
| 35 to 64 Years | 312 (5.3%) | 151 (2.8%) |
| 65 to 74 Years | 92 (11.2%) | 75 (5.9%) |
| 75 Years and over | 222 (30.7%) | 563 (53.7%) |
Disability Class: Self-Care Difficulty
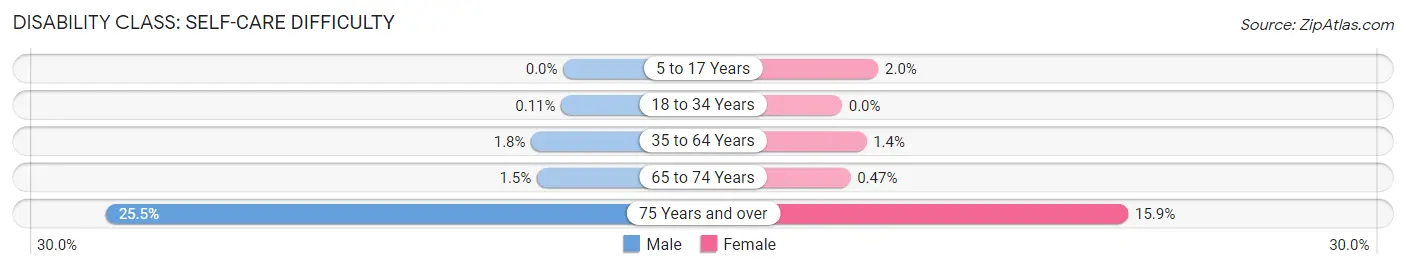
| Age Bracket | Male | Female |
| 5 to 17 Years | 0 (0.0%) | 48 (2.0%) |
| 18 to 34 Years | 3 (0.1%) | 0 (0.0%) |
| 35 to 64 Years | 104 (1.8%) | 74 (1.4%) |
| 65 to 74 Years | 12 (1.5%) | 6 (0.5%) |
| 75 Years and over | 184 (25.5%) | 167 (15.9%) |
Technology Access in Northdale
Computing Device Access in Northdale
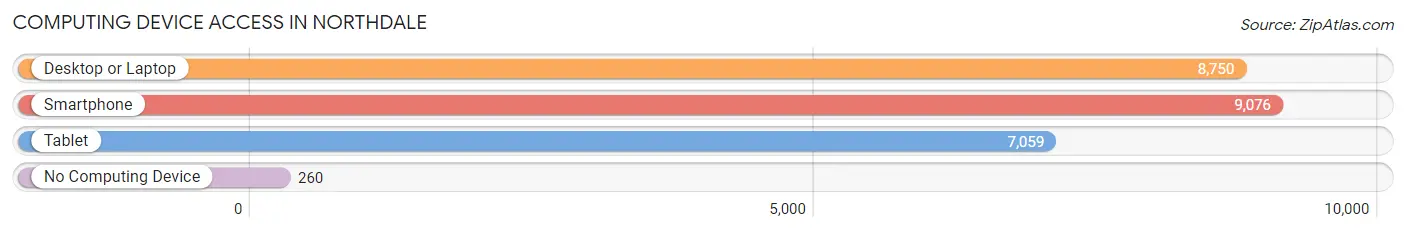
| Device Type | # Households | % Households |
| Desktop or Laptop | 8,750 | 91.5% |
| Smartphone | 9,076 | 94.9% |
| Tablet | 7,059 | 73.8% |
| No Computing Device | 260 | 2.7% |
| Total | 9,560 | 100.0% |
Internet Access in Northdale
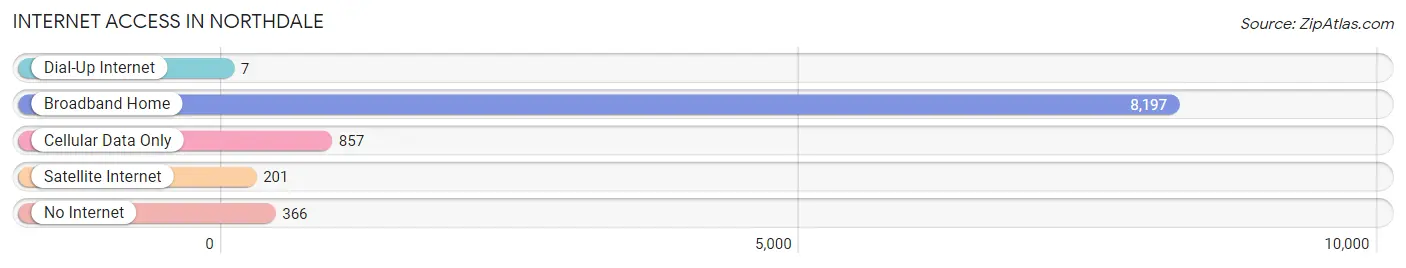
| Internet Type | # Households | % Households |
| Dial-Up Internet | 7 | 0.1% |
| Broadband Home | 8,197 | 85.7% |
| Cellular Data Only | 857 | 9.0% |
| Satellite Internet | 201 | 2.1% |
| No Internet | 366 | 3.8% |
| Total | 9,560 | 100.0% |
Northdale Summary
Northdale is a census-designated place (CDP) located in Hillsborough County, Florida, United States. The population was 11,845 at the 2010 census. Northdale is located in the northern part of Hillsborough County, just north of Tampa.
Geography
Northdale is located at 28°3'25" North, 82°30'25" West (28.056944, -82.506944). According to the United States Census Bureau, the CDP has a total area of 4.2 square miles (10.8 km2), all land.
History
Northdale was originally developed in the late 1960s as a planned community. The area was developed by the Northdale Land Company, which was owned by the family of former Tampa Mayor Dick Greco. The community was designed to be a self-contained suburb of Tampa, with its own shopping center, schools, and recreational facilities.
The community was initially planned to be a retirement community, but the developers soon realized that the area was attractive to young families as well. The community quickly grew in popularity, and by the 1980s it was one of the most desirable neighborhoods in the Tampa Bay area.
Economy
Northdale is home to a variety of businesses, including retail stores, restaurants, and professional services. The area is also home to several corporate offices, including the headquarters of the Tampa Bay Times newspaper.
The area is also home to several medical facilities, including the Northdale Medical Center, which is part of the Tampa General Hospital system.
Demographics
As of the 2010 census, there were 11,845 people, 4,845 households, and 3,541 families residing in the CDP. The population density was 2,837.3 people per square mile (1,098.7/km2). There were 5,093 housing units at an average density of 1,213.3/sq mi (468.7/km2). The racial makeup of the CDP was 79.2% White, 8.2% African American, 0.3% Native American, 5.7% Asian, 0.1% Pacific Islander, 4.2% from other races, and 2.4% from two or more races. Hispanic or Latino of any race were 14.2% of the population.
There were 4,845 households, out of which 28.2% had children under the age of 18 living with them, 57.2% were married couples living together, 10.2% had a female householder with no husband present, and 28.3% were non-families. 22.2% of all households were made up of individuals, and 8.2% had someone living alone who was 65 years of age or older. The average household size was 2.45 and the average family size was 2.86.
In the CDP, the population was spread out, with 21.2% under the age of 18, 6.7% from 18 to 24, 25.2% from 25 to 44, 28.7% from 45 to 64, and 18.2% who were 65 years of age or older. The median age was 42 years. For every 100 females, there were 93.2 males. For every 100 females age 18 and over, there were 90.2 males.
The median income for a household in the CDP was $50,945, and the median income for a family was $58,945. Males had a median income of $41,945 versus $30,945 for females. The per capita income for the CDP was $25,945. About 4.2% of families and 5.7% of the population were below the poverty line, including 7.2% of those under age 18 and 4.2% of those age 65 or over.
Common Questions
What is Per Capita Income in Northdale?
Per Capita income in Northdale is $42,319.
What is the Median Family Income in Northdale?
Median Family Income in Northdale is $108,203.
What is the Median Household income in Northdale?
Median Household Income in Northdale is $92,824.
What is Income or Wage Gap in Northdale?
Income or Wage Gap in Northdale is 18.7%.
Women in Northdale earn 81.3 cents for every dollar earned by a man.
What is Family Income Deficit in Northdale?
Family Income Deficit in Northdale is $8,576.
Families that are below poverty line in Northdale earn $8,576 less on average than the poverty threshold level.
What is Inequality or Gini Index in Northdale?
Inequality or Gini Index in Northdale is 0.38.
What is the Total Population of Northdale?
Total Population of Northdale is 26,079.
What is the Total Male Population of Northdale?
Total Male Population of Northdale is 12,483.
What is the Total Female Population of Northdale?
Total Female Population of Northdale is 13,596.
What is the Ratio of Males per 100 Females in Northdale?
There are 91.81 Males per 100 Females in Northdale.
What is the Ratio of Females per 100 Males in Northdale?
There are 108.92 Females per 100 Males in Northdale.
What is the Median Population Age in Northdale?
Median Population Age in Northdale is 41.6 Years.
What is the Average Family Size in Northdale
Average Family Size in Northdale is 3.2 People.
What is the Average Household Size in Northdale
Average Household Size in Northdale is 2.7 People.
How Large is the Labor Force in Northdale?
There are 15,044 People in the Labor Forcein in Northdale.
What is the Percentage of People in the Labor Force in Northdale?
70.3% of People are in the Labor Force in Northdale.
What is the Unemployment Rate in Northdale?
Unemployment Rate in Northdale is 3.3%.