Bay Harbor Islands, FL Map & Demographics
Bay Harbor Islands Map
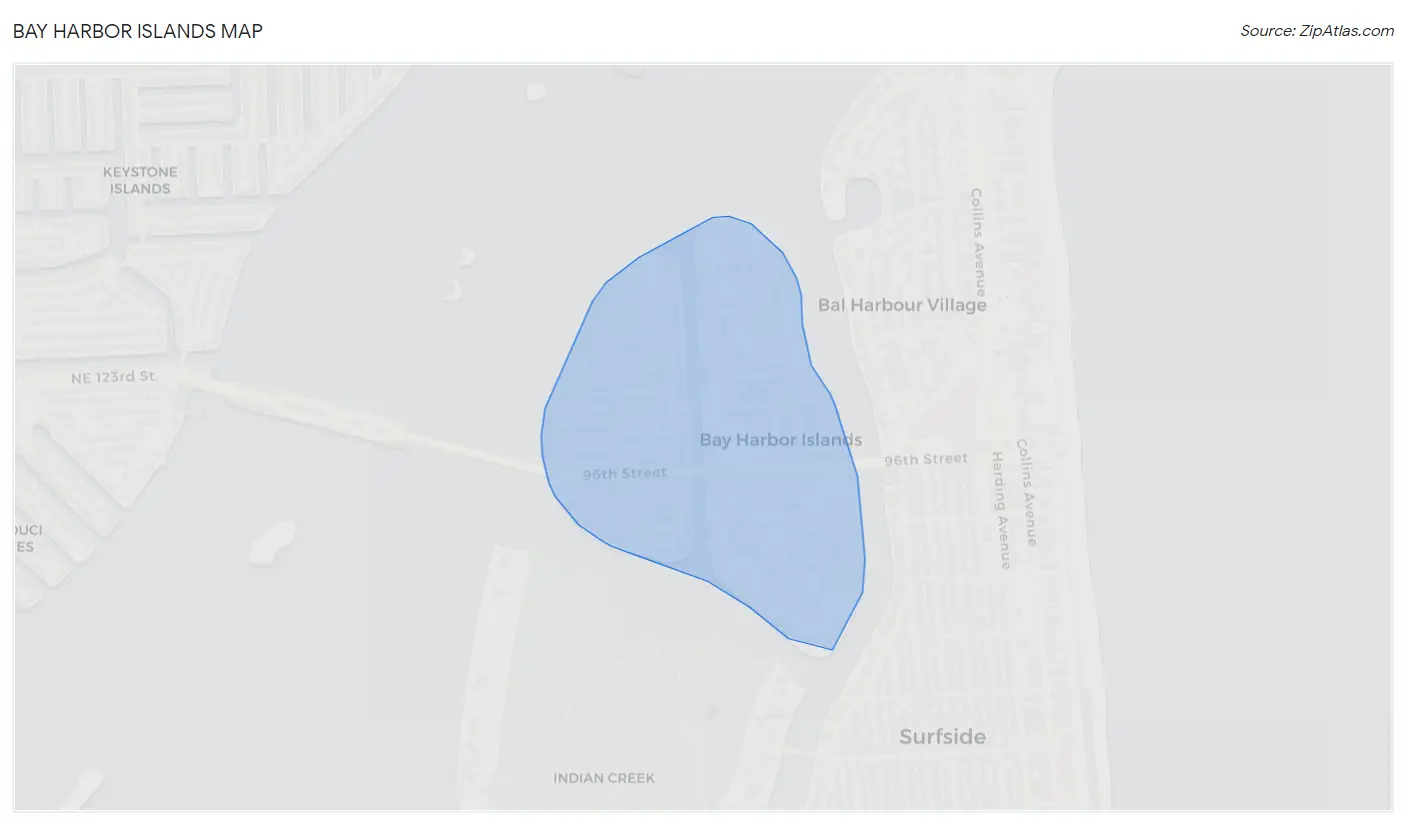
Bay Harbor Islands Overview
$52,686
PER CAPITA INCOME
$69,485
AVG FAMILY INCOME
$73,587
AVG HOUSEHOLD INCOME
50.8%
WAGE / INCOME GAP [ % ]
49.2¢/ $1
WAGE / INCOME GAP [ $ ]
0.55
INEQUALITY / GINI INDEX
5,843
TOTAL POPULATION
2,358
MALE POPULATION
3,485
FEMALE POPULATION
67.66
MALES / 100 FEMALES
147.79
FEMALES / 100 MALES
35.9
MEDIAN AGE
3.4
AVG FAMILY SIZE
2.6
AVG HOUSEHOLD SIZE
3,034
LABOR FORCE [ PEOPLE ]
72.6%
PERCENT IN LABOR FORCE
3.4%
UNEMPLOYMENT RATE
Income in Bay Harbor Islands
Income Overview in Bay Harbor Islands
Per Capita Income in Bay Harbor Islands is $52,686, while median incomes of families and households are $69,485 and $73,587 respectively.
| Characteristic | Number | Measure |
| Per Capita Income | 5,843 | $52,686 |
| Median Family Income | 1,421 | $69,485 |
| Mean Family Income | 1,421 | $142,950 |
| Median Household Income | 2,208 | $73,587 |
| Mean Household Income | 2,208 | $135,223 |
| Income Deficit | 1,421 | $0 |
| Wage / Income Gap (%) | 5,843 | 50.83% |
| Wage / Income Gap ($) | 5,843 | 49.17¢ per $1 |
| Gini / Inequality Index | 5,843 | 0.55 |
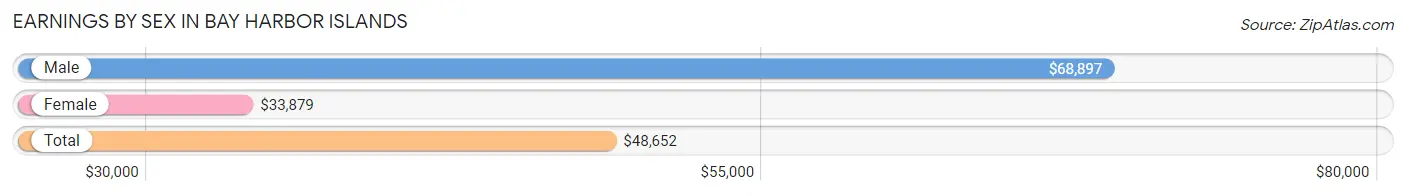
Earnings by Sex in Bay Harbor Islands
Average Earnings in Bay Harbor Islands are $48,652, $68,897 for men and $33,879 for women, a difference of 50.8%.
| Sex | Number | Average Earnings |
| Male | 1,349 (43.5%) | $68,897 |
| Female | 1,752 (56.5%) | $33,879 |
| Total | 3,101 (100.0%) | $48,652 |
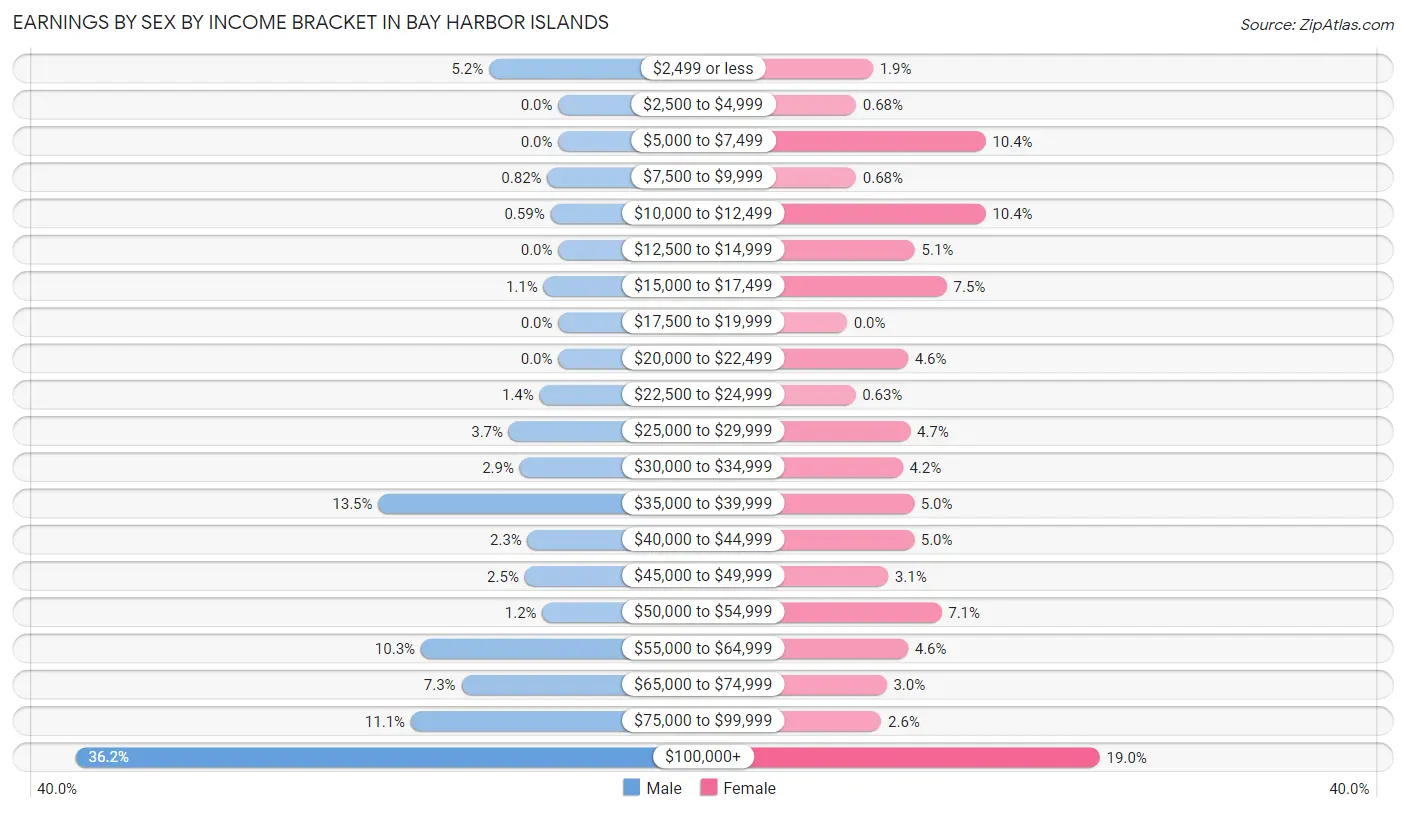
Earnings by Sex by Income Bracket in Bay Harbor Islands
The most common earnings brackets in Bay Harbor Islands are $100,000+ for men (488 | 36.2%) and $100,000+ for women (332 | 19.0%).
| Income | Male | Female |
| $2,499 or less | 70 (5.2%) | 34 (1.9%) |
| $2,500 to $4,999 | 0 (0.0%) | 12 (0.7%) |
| $5,000 to $7,499 | 0 (0.0%) | 182 (10.4%) |
| $7,500 to $9,999 | 11 (0.8%) | 12 (0.7%) |
| $10,000 to $12,499 | 8 (0.6%) | 182 (10.4%) |
| $12,500 to $14,999 | 0 (0.0%) | 89 (5.1%) |
| $15,000 to $17,499 | 15 (1.1%) | 131 (7.5%) |
| $17,500 to $19,999 | 0 (0.0%) | 0 (0.0%) |
| $20,000 to $22,499 | 0 (0.0%) | 80 (4.6%) |
| $22,500 to $24,999 | 19 (1.4%) | 11 (0.6%) |
| $25,000 to $29,999 | 50 (3.7%) | 83 (4.7%) |
| $30,000 to $34,999 | 39 (2.9%) | 73 (4.2%) |
| $35,000 to $39,999 | 182 (13.5%) | 88 (5.0%) |
| $40,000 to $44,999 | 31 (2.3%) | 88 (5.0%) |
| $45,000 to $49,999 | 34 (2.5%) | 54 (3.1%) |
| $50,000 to $54,999 | 16 (1.2%) | 124 (7.1%) |
| $55,000 to $64,999 | 139 (10.3%) | 80 (4.6%) |
| $65,000 to $74,999 | 98 (7.3%) | 52 (3.0%) |
| $75,000 to $99,999 | 149 (11.1%) | 45 (2.6%) |
| $100,000+ | 488 (36.2%) | 332 (19.0%) |
| Total | 1,349 (100.0%) | 1,752 (100.0%) |
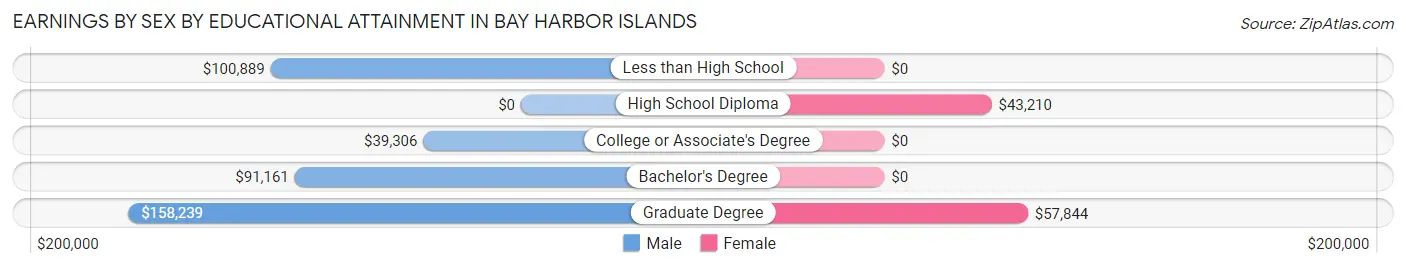
Earnings by Sex by Educational Attainment in Bay Harbor Islands
Average earnings in Bay Harbor Islands are $69,618 for men and $43,565 for women, a difference of 37.4%. Men with an educational attainment of graduate degree enjoy the highest average annual earnings of $158,239, while those with college or associate's degree education earn the least with $39,306. Women with an educational attainment of graduate degree earn the most with the average annual earnings of $57,844, while those with high school diploma education have the smallest earnings of $43,210.
| Educational Attainment | Male Income | Female Income |
| Less than High School | $100,889 | $0 |
| High School Diploma | - | - |
| College or Associate's Degree | $39,306 | $0 |
| Bachelor's Degree | $91,161 | $0 |
| Graduate Degree | $158,239 | $57,844 |
| Total | $69,618 | $43,565 |
Family Income in Bay Harbor Islands
Family Income Brackets in Bay Harbor Islands
According to the Bay Harbor Islands family income data, there are 334 families falling into the $200,000+ income range, which is the most common income bracket and makes up 23.5% of all families. Conversely, the $10,000 to $14,999 income bracket is the least frequent group with only 14 families (1.0%) belonging to this category.
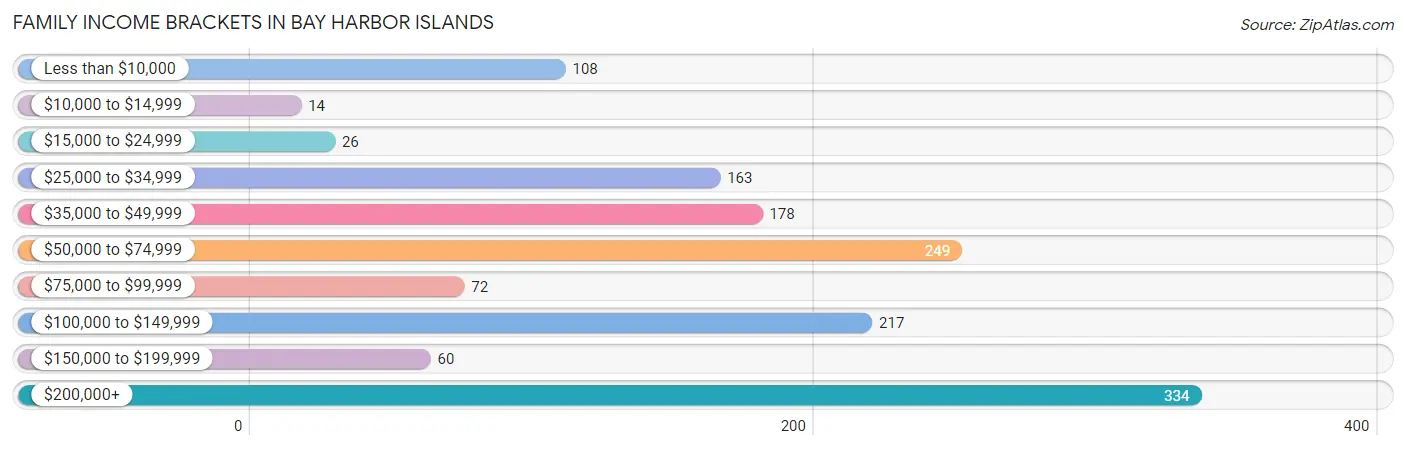
| Income Bracket | # Families | % Families |
| Less than $10,000 | 108 | 7.6% |
| $10,000 to $14,999 | 14 | 1.0% |
| $15,000 to $24,999 | 26 | 1.8% |
| $25,000 to $34,999 | 163 | 11.5% |
| $35,000 to $49,999 | 178 | 12.5% |
| $50,000 to $74,999 | 249 | 17.5% |
| $75,000 to $99,999 | 72 | 5.1% |
| $100,000 to $149,999 | 217 | 15.3% |
| $150,000 to $199,999 | 60 | 4.2% |
| $200,000+ | 334 | 23.5% |
Family Income by Famaliy Size in Bay Harbor Islands
4-person families (484 | 34.1%) account for the highest median family income in Bay Harbor Islands with $123,198 per family, while 4-person families (484 | 34.1%) have the highest median income of $30,800 per family member.
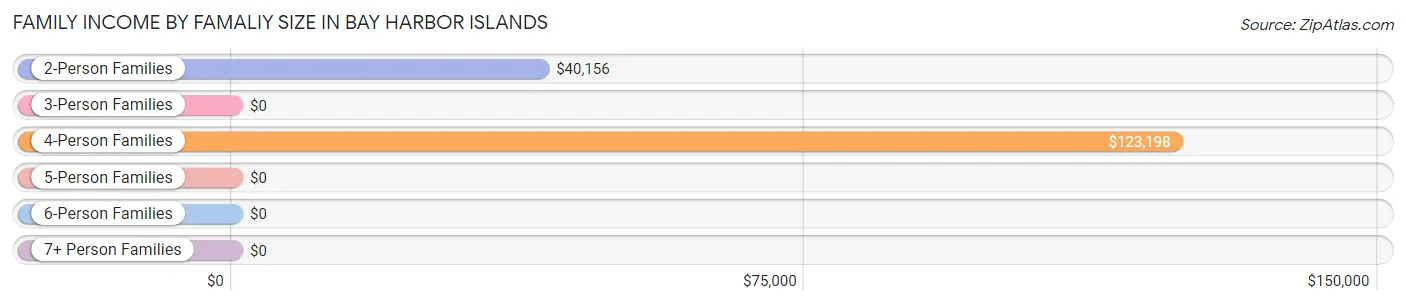
| Income Bracket | # Families | Median Income |
| 2-Person Families | 379 (26.7%) | $40,156 |
| 3-Person Families | 528 (37.2%) | $0 |
| 4-Person Families | 484 (34.1%) | $123,198 |
| 5-Person Families | 30 (2.1%) | $0 |
| 6-Person Families | 0 (0.0%) | $0 |
| 7+ Person Families | 0 (0.0%) | $0 |
| Total | 1,421 (100.0%) | $69,485 |
Family Income by Number of Earners in Bay Harbor Islands
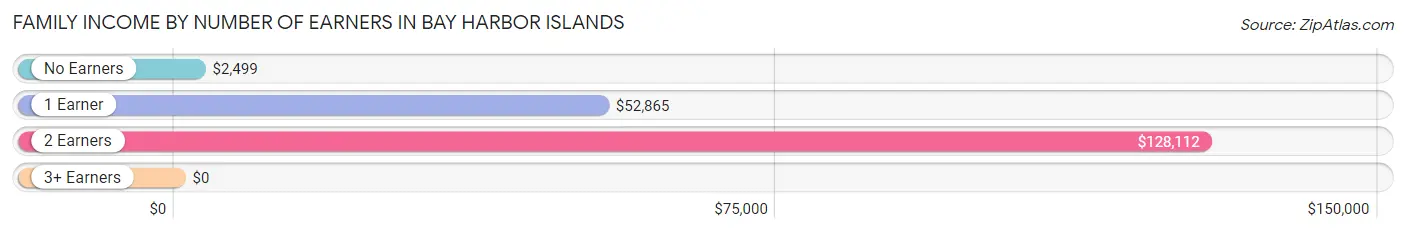
| Number of Earners | # Families | Median Income |
| No Earners | 109 (7.7%) | $2,499 |
| 1 Earner | 479 (33.7%) | $52,865 |
| 2 Earners | 804 (56.6%) | $128,112 |
| 3+ Earners | 29 (2.0%) | $0 |
| Total | 1,421 (100.0%) | $69,485 |
Household Income in Bay Harbor Islands
Household Income Brackets in Bay Harbor Islands
With 461 households falling in the category, the $200,000+ income range is the most frequent in Bay Harbor Islands, accounting for 20.9% of all households. In contrast, only 53 households (2.4%) fall into the $10,000 to $14,999 income bracket, making it the least populous group.
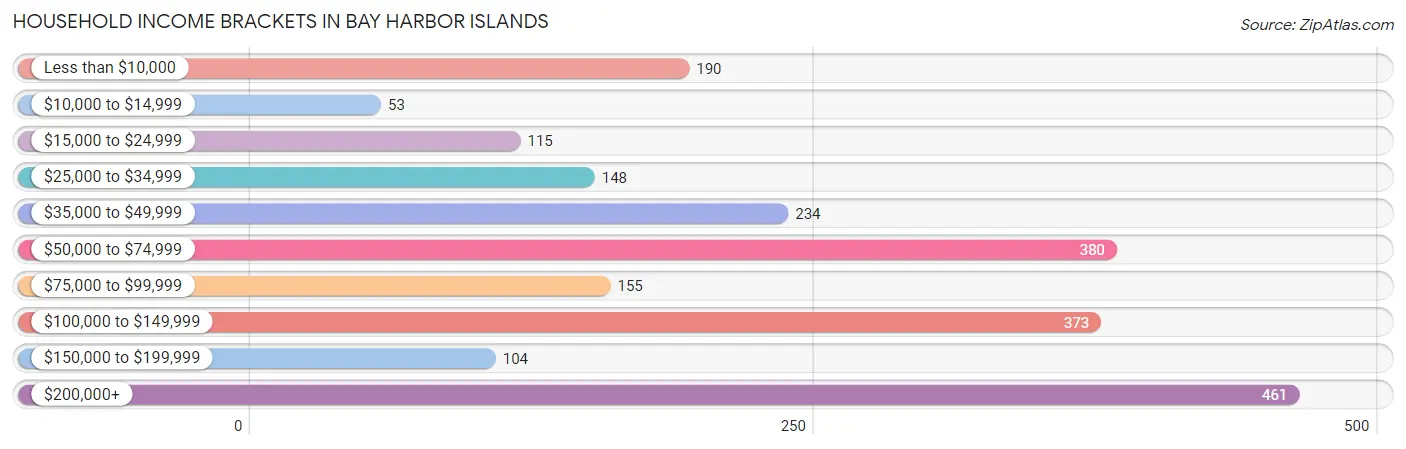
| Income Bracket | # Households | % Households |
| Less than $10,000 | 190 | 8.6% |
| $10,000 to $14,999 | 53 | 2.4% |
| $15,000 to $24,999 | 115 | 5.2% |
| $25,000 to $34,999 | 148 | 6.7% |
| $35,000 to $49,999 | 234 | 10.6% |
| $50,000 to $74,999 | 380 | 17.2% |
| $75,000 to $99,999 | 155 | 7.0% |
| $100,000 to $149,999 | 373 | 16.9% |
| $150,000 to $199,999 | 104 | 4.7% |
| $200,000+ | 461 | 20.9% |
Household Income by Householder Age in Bay Harbor Islands
The median household income in Bay Harbor Islands is $73,587, with the highest median household income of $91,875 found in the 45 to 64 years age bracket for the primary householder. A total of 916 households (41.5%) fall into this category. Meanwhile, the 15 to 24 years age bracket for the primary householder has the lowest median household income of $0, with 82 households (3.7%) in this group.
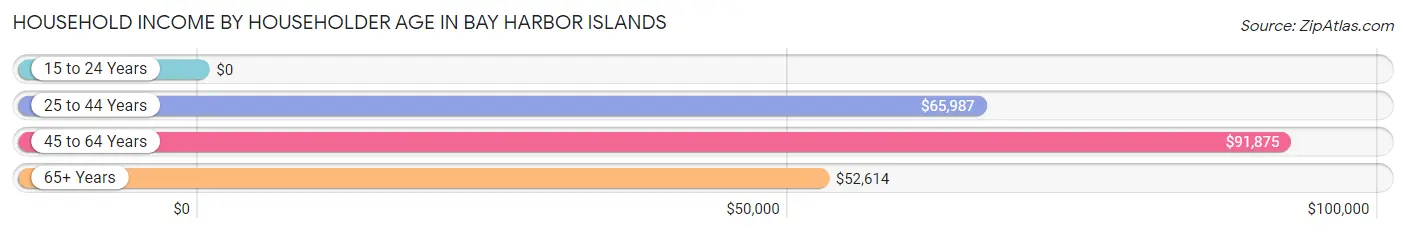
| Income Bracket | # Households | Median Income |
| 15 to 24 Years | 82 (3.7%) | $0 |
| 25 to 44 Years | 770 (34.9%) | $65,987 |
| 45 to 64 Years | 916 (41.5%) | $91,875 |
| 65+ Years | 440 (19.9%) | $52,614 |
| Total | 2,208 (100.0%) | $73,587 |
Poverty in Bay Harbor Islands
Income Below Poverty by Sex and Age in Bay Harbor Islands
With 8.0% poverty level for males and 9.4% for females among the residents of Bay Harbor Islands, 15 year old males and 5 year old females are the most vulnerable to poverty, with 8 males (100.0%) and 15 females (100.0%) in their respective age groups living below the poverty level.
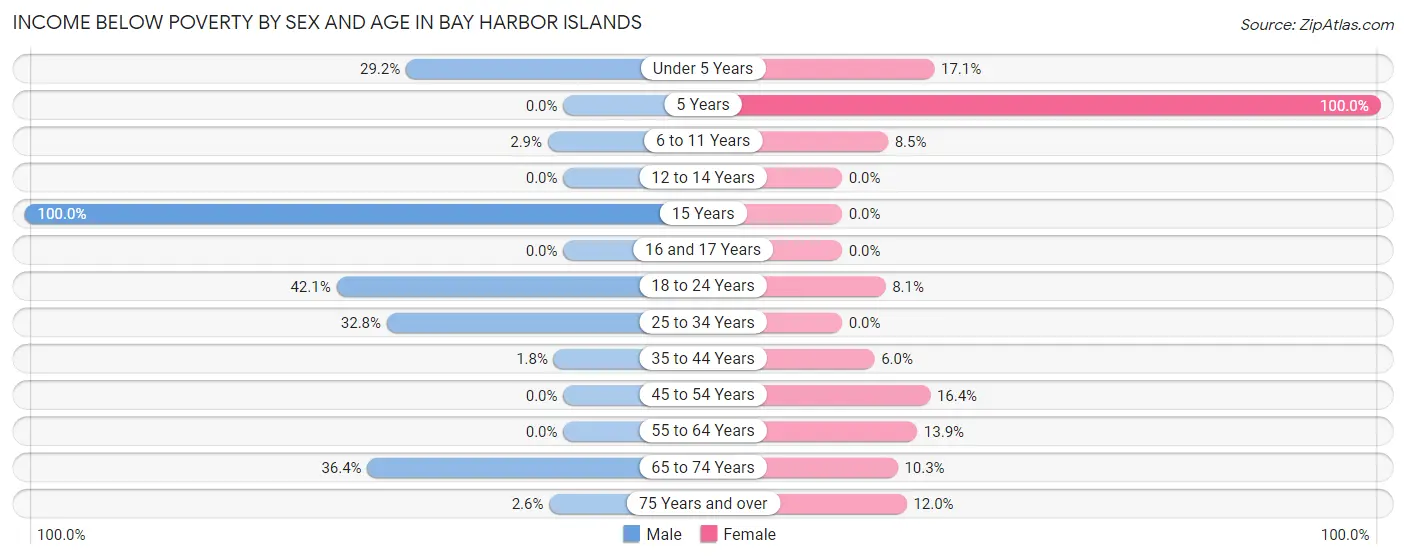
| Age Bracket | Male | Female |
| Under 5 Years | 40 (29.2%) | 38 (17.1%) |
| 5 Years | 0 (0.0%) | 15 (100.0%) |
| 6 to 11 Years | 15 (2.9%) | 36 (8.5%) |
| 12 to 14 Years | 0 (0.0%) | 0 (0.0%) |
| 15 Years | 8 (100.0%) | 0 (0.0%) |
| 16 and 17 Years | 0 (0.0%) | 0 (0.0%) |
| 18 to 24 Years | 40 (42.1%) | 34 (8.1%) |
| 25 to 34 Years | 38 (32.8%) | 0 (0.0%) |
| 35 to 44 Years | 11 (1.8%) | 33 (6.0%) |
| 45 to 54 Years | 0 (0.0%) | 99 (16.4%) |
| 55 to 64 Years | 0 (0.0%) | 23 (13.9%) |
| 65 to 74 Years | 32 (36.4%) | 25 (10.3%) |
| 75 Years and over | 4 (2.6%) | 24 (12.0%) |
| Total | 188 (8.0%) | 327 (9.4%) |
Income Above Poverty by Sex and Age in Bay Harbor Islands
According to the poverty statistics in Bay Harbor Islands, males aged 12 to 14 years and females aged 12 to 14 years are the age groups that are most secure financially, with 100.0% of males and 100.0% of females in these age groups living above the poverty line.

| Age Bracket | Male | Female |
| Under 5 Years | 97 (70.8%) | 184 (82.9%) |
| 5 Years | 0 (0.0%) | 0 (0.0%) |
| 6 to 11 Years | 507 (97.1%) | 386 (91.5%) |
| 12 to 14 Years | 89 (100.0%) | 142 (100.0%) |
| 15 Years | 0 (0.0%) | 107 (100.0%) |
| 16 and 17 Years | 9 (100.0%) | 55 (100.0%) |
| 18 to 24 Years | 55 (57.9%) | 388 (91.9%) |
| 25 to 34 Years | 78 (67.2%) | 340 (100.0%) |
| 35 to 44 Years | 606 (98.2%) | 515 (94.0%) |
| 45 to 54 Years | 335 (100.0%) | 506 (83.6%) |
| 55 to 64 Years | 188 (100.0%) | 142 (86.1%) |
| 65 to 74 Years | 56 (63.6%) | 217 (89.7%) |
| 75 Years and over | 150 (97.4%) | 176 (88.0%) |
| Total | 2,170 (92.0%) | 3,158 (90.6%) |
Income Below Poverty Among Married-Couple Families in Bay Harbor Islands
The poverty statistics for married-couple families in Bay Harbor Islands show that 6.3% or 64 of the total 1,023 families live below the poverty line. Families with no children have the highest poverty rate of 7.3%, comprising of 26 families. On the other hand, families with 3 or 4 children have the lowest poverty rate of 0.0%, which includes 0 families.
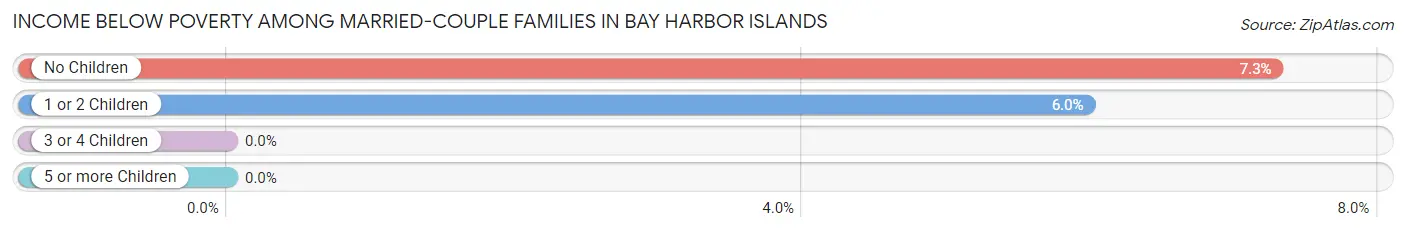
| Children | Above Poverty | Below Poverty |
| No Children | 331 (92.7%) | 26 (7.3%) |
| 1 or 2 Children | 598 (94.0%) | 38 (6.0%) |
| 3 or 4 Children | 30 (100.0%) | 0 (0.0%) |
| 5 or more Children | 0 (0.0%) | 0 (0.0%) |
| Total | 959 (93.7%) | 64 (6.3%) |
Income Below Poverty Among Single-Parent Households in Bay Harbor Islands
According to the poverty data in Bay Harbor Islands, 42.3% or 11 single-father households and 15.0% or 56 single-mother households are living below the poverty line. Among single-father households, those with 1 or 2 children have the highest poverty rate, with 11 households (42.3%) experiencing poverty. Likewise, among single-mother households, those with 1 or 2 children have the highest poverty rate, with 42 households (16.6%) falling below the poverty line.
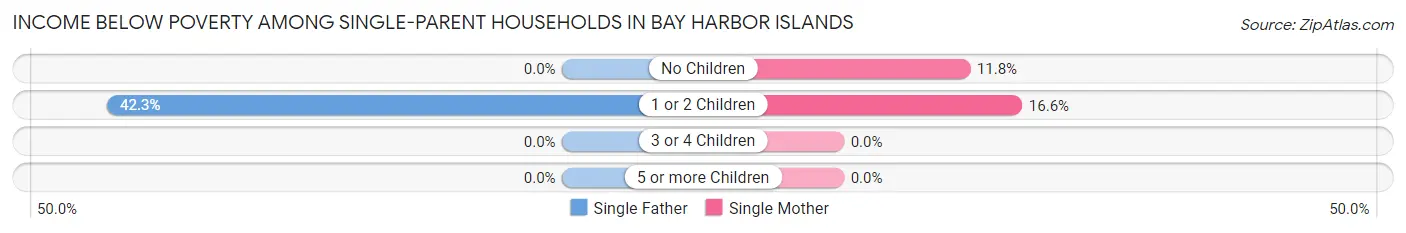
| Children | Single Father | Single Mother |
| No Children | 0 (0.0%) | 14 (11.8%) |
| 1 or 2 Children | 11 (42.3%) | 42 (16.6%) |
| 3 or 4 Children | 0 (0.0%) | 0 (0.0%) |
| 5 or more Children | 0 (0.0%) | 0 (0.0%) |
| Total | 11 (42.3%) | 56 (15.0%) |
Income Below Poverty Among Married-Couple vs Single-Parent Households in Bay Harbor Islands
The poverty data for Bay Harbor Islands shows that 64 of the married-couple family households (6.3%) and 67 of the single-parent households (16.8%) are living below the poverty level. Within the married-couple family households, those with no children have the highest poverty rate, with 26 households (7.3%) falling below the poverty line. Among the single-parent households, those with 1 or 2 children have the highest poverty rate, with 53 household (19.0%) living below poverty.
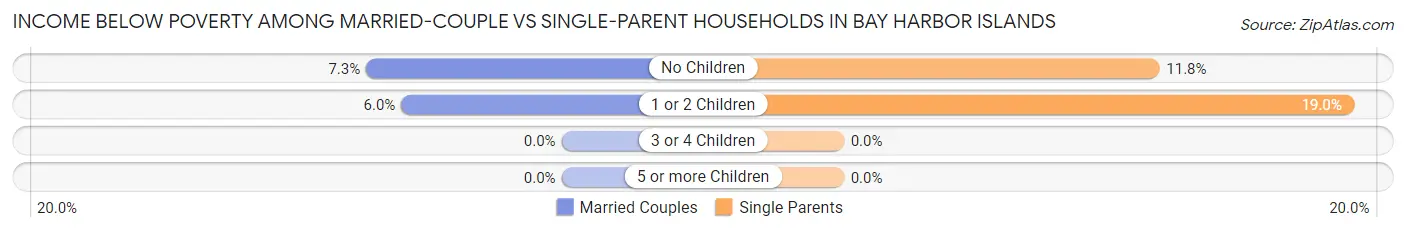
| Children | Married-Couple Families | Single-Parent Households |
| No Children | 26 (7.3%) | 14 (11.8%) |
| 1 or 2 Children | 38 (6.0%) | 53 (19.0%) |
| 3 or 4 Children | 0 (0.0%) | 0 (0.0%) |
| 5 or more Children | 0 (0.0%) | 0 (0.0%) |
| Total | 64 (6.3%) | 67 (16.8%) |
Race in Bay Harbor Islands
The most populous races in Bay Harbor Islands are White / Caucasian (3,249 | 55.6%), Hispanic or Latino (3,233 | 55.3%), and Two or more Races (1,898 | 32.5%).
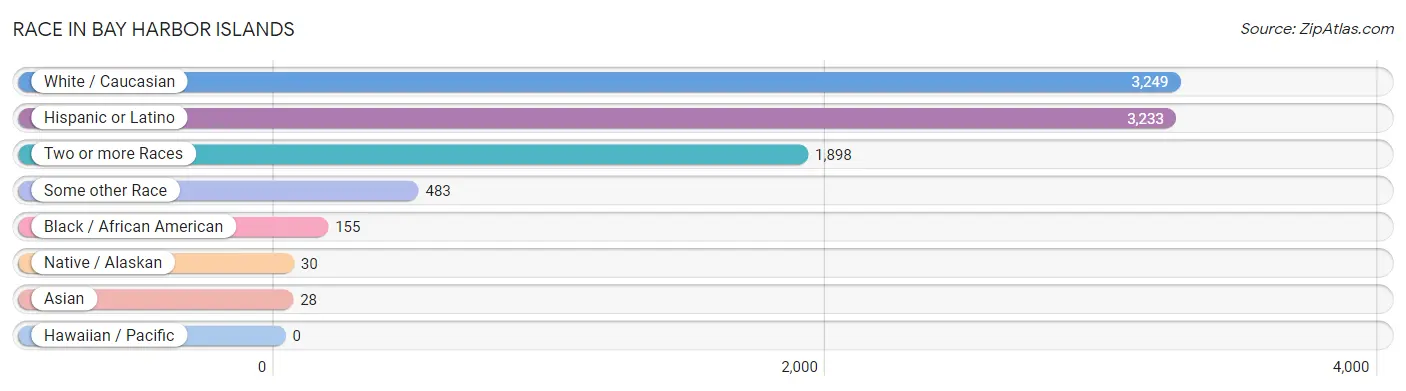
| Race | # Population | % Population |
| Asian | 28 | 0.5% |
| Black / African American | 155 | 2.6% |
| Hawaiian / Pacific | 0 | 0.0% |
| Hispanic or Latino | 3,233 | 55.3% |
| Native / Alaskan | 30 | 0.5% |
| White / Caucasian | 3,249 | 55.6% |
| Two or more Races | 1,898 | 32.5% |
| Some other Race | 483 | 8.3% |
| Total | 5,843 | 100.0% |
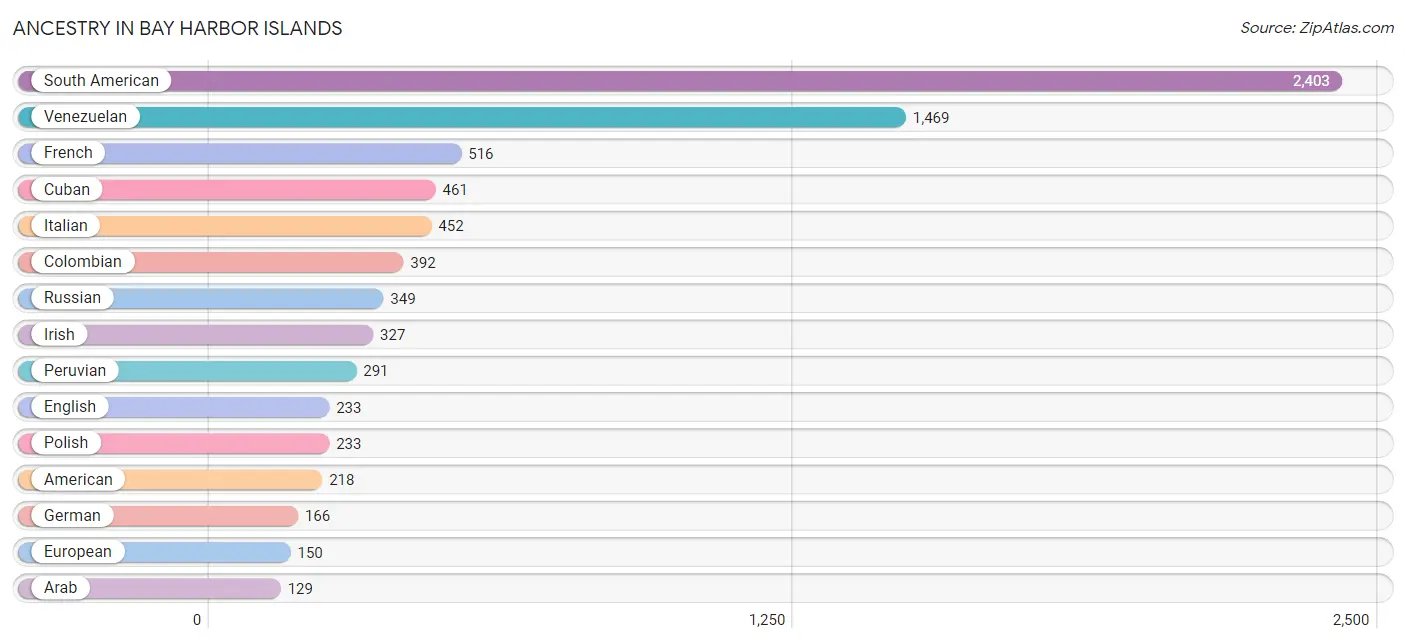
Ancestry in Bay Harbor Islands
The most populous ancestries reported in Bay Harbor Islands are South American (2,403 | 41.1%), Venezuelan (1,469 | 25.1%), French (516 | 8.8%), Cuban (461 | 7.9%), and Italian (452 | 7.7%), together accounting for 90.7% of all Bay Harbor Islands residents.
| Ancestry | # Population | % Population |
| African | 118 | 2.0% |
| American | 218 | 3.7% |
| Arab | 129 | 2.2% |
| Argentinean | 112 | 1.9% |
| Armenian | 9 | 0.2% |
| Austrian | 5 | 0.1% |
| Bhutanese | 28 | 0.5% |
| Brazilian | 43 | 0.7% |
| British | 70 | 1.2% |
| British West Indian | 61 | 1.0% |
| Chilean | 75 | 1.3% |
| Colombian | 392 | 6.7% |
| Croatian | 17 | 0.3% |
| Cuban | 461 | 7.9% |
| Czech | 14 | 0.2% |
| Dutch | 10 | 0.2% |
| Eastern European | 97 | 1.7% |
| English | 233 | 4.0% |
| European | 150 | 2.6% |
| French | 516 | 8.8% |
| German | 166 | 2.8% |
| Greek | 24 | 0.4% |
| Hungarian | 116 | 2.0% |
| Irish | 327 | 5.6% |
| Israeli | 23 | 0.4% |
| Italian | 452 | 7.7% |
| Lithuanian | 40 | 0.7% |
| Mexican | 56 | 1.0% |
| Moroccan | 6 | 0.1% |
| Palestinian | 32 | 0.5% |
| Peruvian | 291 | 5.0% |
| Polish | 233 | 4.0% |
| Portuguese | 81 | 1.4% |
| Puerto Rican | 90 | 1.5% |
| Romanian | 24 | 0.4% |
| Russian | 349 | 6.0% |
| Scandinavian | 10 | 0.2% |
| Scottish | 42 | 0.7% |
| South American | 2,403 | 41.1% |
| Spaniard | 126 | 2.2% |
| Spanish | 33 | 0.6% |
| Subsaharan African | 118 | 2.0% |
| Swedish | 9 | 0.2% |
| Swiss | 5 | 0.1% |
| Ukrainian | 34 | 0.6% |
| Venezuelan | 1,469 | 25.1% |
| Welsh | 12 | 0.2% | View All 47 Rows |
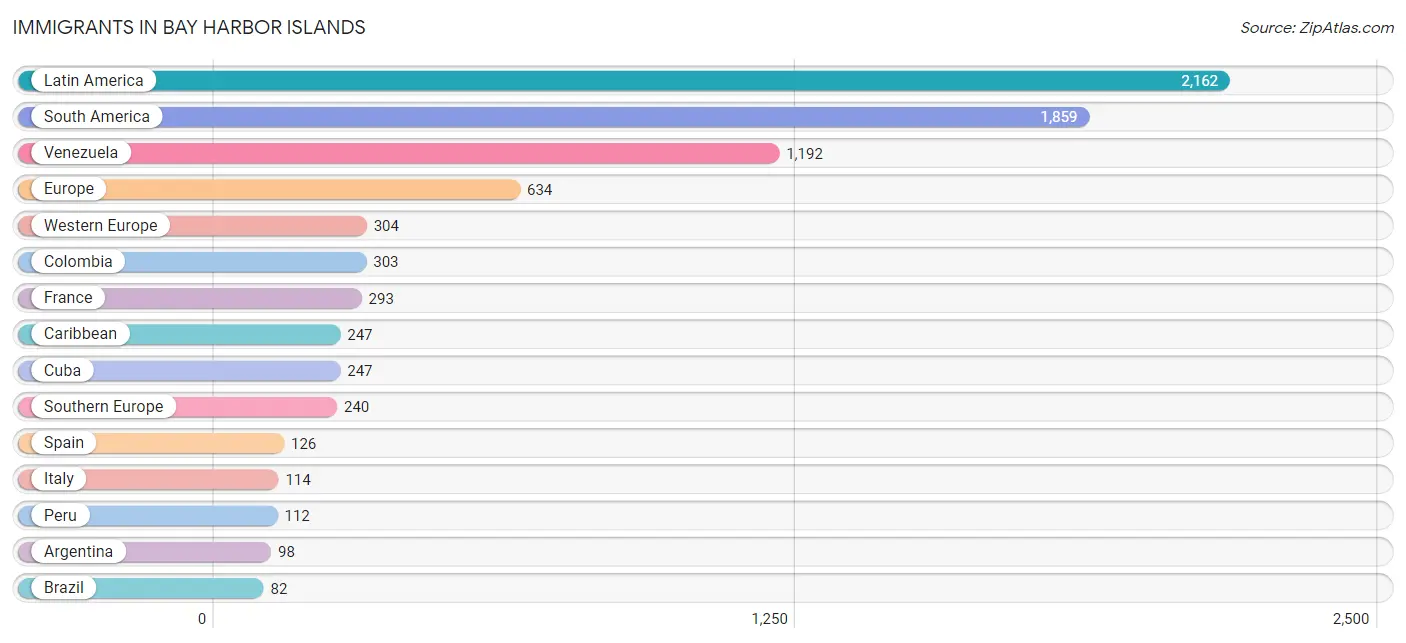
Immigrants in Bay Harbor Islands
The most numerous immigrant groups reported in Bay Harbor Islands came from Latin America (2,162 | 37.0%), South America (1,859 | 31.8%), Venezuela (1,192 | 20.4%), Europe (634 | 10.8%), and Western Europe (304 | 5.2%), together accounting for 105.3% of all Bay Harbor Islands residents.
| Immigration Origin | # Population | % Population |
| Africa | 63 | 1.1% |
| Argentina | 98 | 1.7% |
| Asia | 49 | 0.8% |
| Brazil | 82 | 1.4% |
| Canada | 79 | 1.3% |
| Caribbean | 247 | 4.2% |
| Central America | 56 | 1.0% |
| Chile | 72 | 1.2% |
| Colombia | 303 | 5.2% |
| Cuba | 247 | 4.2% |
| Eastern Europe | 17 | 0.3% |
| England | 24 | 0.4% |
| Europe | 634 | 10.8% |
| France | 293 | 5.0% |
| Germany | 6 | 0.1% |
| Iran | 12 | 0.2% |
| Israel | 11 | 0.2% |
| Italy | 114 | 1.9% |
| Latin America | 2,162 | 37.0% |
| Mexico | 56 | 1.0% |
| Moldova | 7 | 0.1% |
| Morocco | 6 | 0.1% |
| Northern Africa | 6 | 0.1% |
| Northern Europe | 73 | 1.3% |
| Oceania | 12 | 0.2% |
| Peru | 112 | 1.9% |
| Poland | 10 | 0.2% |
| Saudi Arabia | 26 | 0.4% |
| Scotland | 32 | 0.5% |
| South Africa | 15 | 0.3% |
| South America | 1,859 | 31.8% |
| South Central Asia | 12 | 0.2% |
| Southern Europe | 240 | 4.1% |
| Spain | 126 | 2.2% |
| Switzerland | 5 | 0.1% |
| Venezuela | 1,192 | 20.4% |
| Western Asia | 37 | 0.6% |
| Western Europe | 304 | 5.2% | View All 38 Rows |
Sex and Age in Bay Harbor Islands
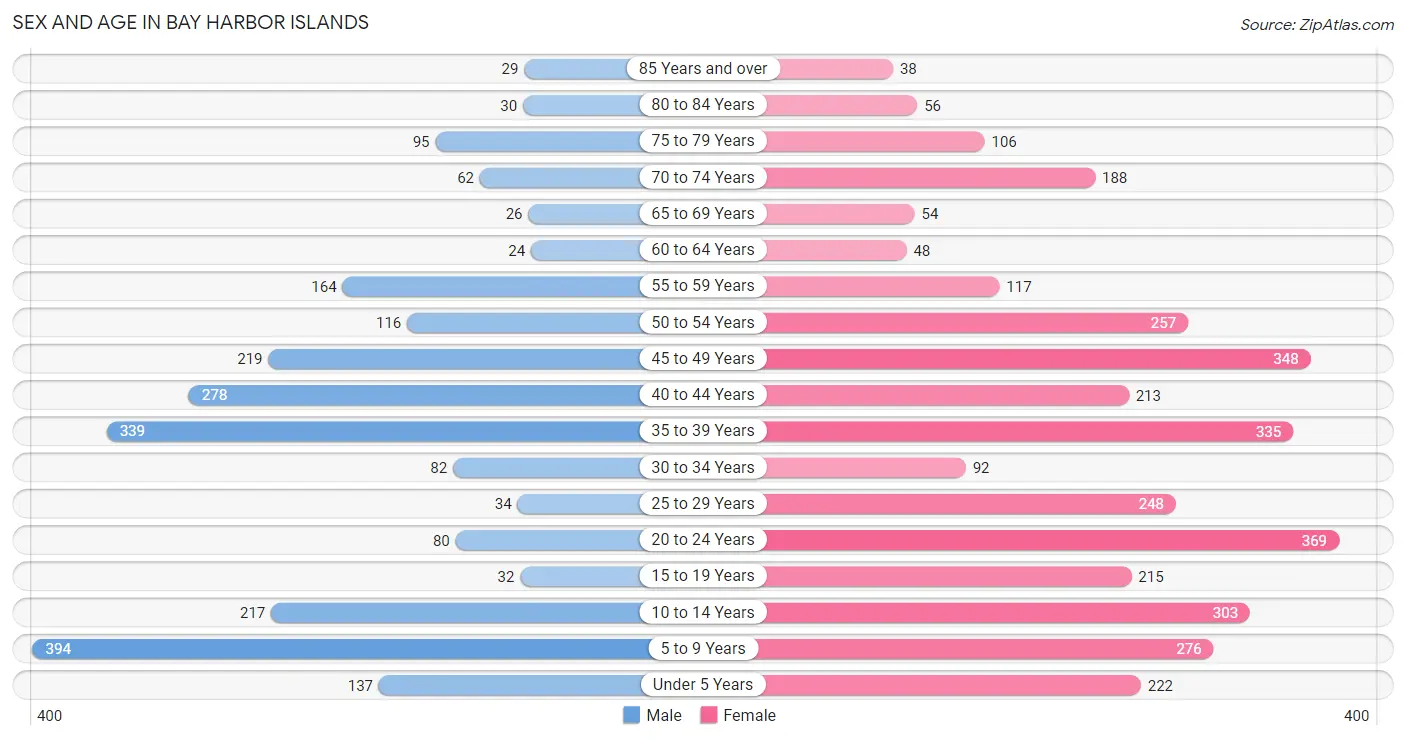
Sex and Age in Bay Harbor Islands
The most populous age groups in Bay Harbor Islands are 5 to 9 Years (394 | 16.7%) for men and 20 to 24 Years (369 | 10.6%) for women.
| Age Bracket | Male | Female |
| Under 5 Years | 137 (5.8%) | 222 (6.4%) |
| 5 to 9 Years | 394 (16.7%) | 276 (7.9%) |
| 10 to 14 Years | 217 (9.2%) | 303 (8.7%) |
| 15 to 19 Years | 32 (1.4%) | 215 (6.2%) |
| 20 to 24 Years | 80 (3.4%) | 369 (10.6%) |
| 25 to 29 Years | 34 (1.4%) | 248 (7.1%) |
| 30 to 34 Years | 82 (3.5%) | 92 (2.6%) |
| 35 to 39 Years | 339 (14.4%) | 335 (9.6%) |
| 40 to 44 Years | 278 (11.8%) | 213 (6.1%) |
| 45 to 49 Years | 219 (9.3%) | 348 (10.0%) |
| 50 to 54 Years | 116 (4.9%) | 257 (7.4%) |
| 55 to 59 Years | 164 (7.0%) | 117 (3.4%) |
| 60 to 64 Years | 24 (1.0%) | 48 (1.4%) |
| 65 to 69 Years | 26 (1.1%) | 54 (1.5%) |
| 70 to 74 Years | 62 (2.6%) | 188 (5.4%) |
| 75 to 79 Years | 95 (4.0%) | 106 (3.0%) |
| 80 to 84 Years | 30 (1.3%) | 56 (1.6%) |
| 85 Years and over | 29 (1.2%) | 38 (1.1%) |
| Total | 2,358 (100.0%) | 3,485 (100.0%) |
Families and Households in Bay Harbor Islands
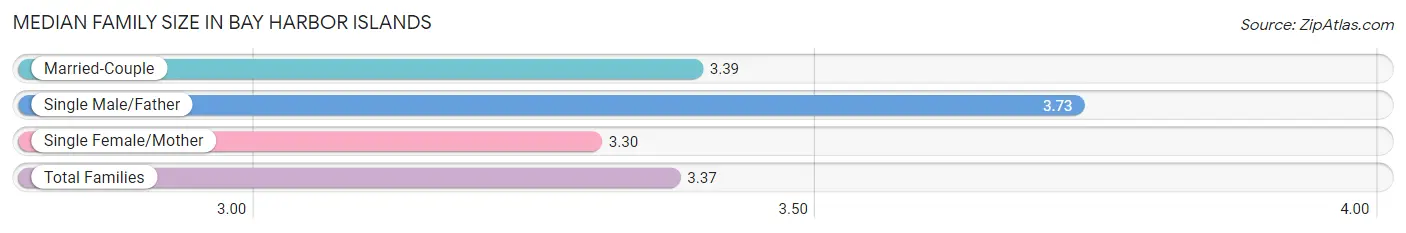
Median Family Size in Bay Harbor Islands
The median family size in Bay Harbor Islands is 3.37 persons per family, with single male/father families (26 | 1.8%) accounting for the largest median family size of 3.73 persons per family. On the other hand, single female/mother families (372 | 26.2%) represent the smallest median family size with 3.30 persons per family.
| Family Type | # Families | Family Size |
| Married-Couple | 1,023 (72.0%) | 3.39 |
| Single Male/Father | 26 (1.8%) | 3.73 |
| Single Female/Mother | 372 (26.2%) | 3.30 |
| Total Families | 1,421 (100.0%) | 3.37 |
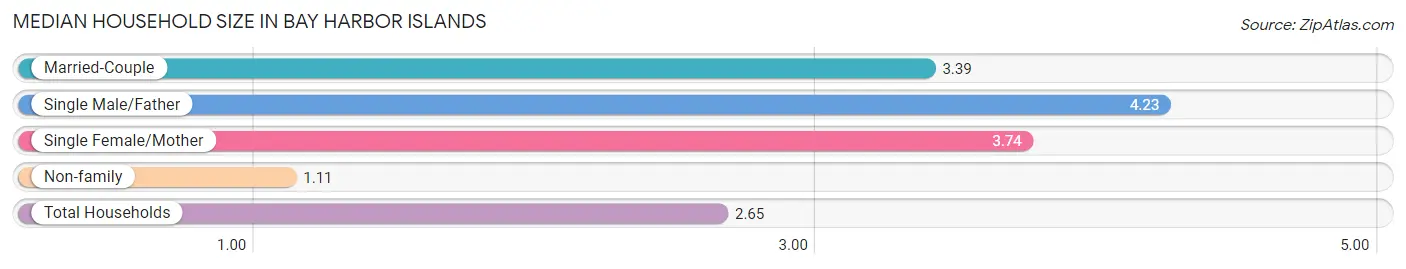
Median Household Size in Bay Harbor Islands
The median household size in Bay Harbor Islands is 2.65 persons per household, with single male/father households (26 | 1.2%) accounting for the largest median household size of 4.23 persons per household. non-family households (787 | 35.6%) represent the smallest median household size with 1.11 persons per household.
| Household Type | # Households | Household Size |
| Married-Couple | 1,023 (46.3%) | 3.39 |
| Single Male/Father | 26 (1.2%) | 4.23 |
| Single Female/Mother | 372 (16.9%) | 3.74 |
| Non-family | 787 (35.6%) | 1.11 |
| Total Households | 2,208 (100.0%) | 2.65 |
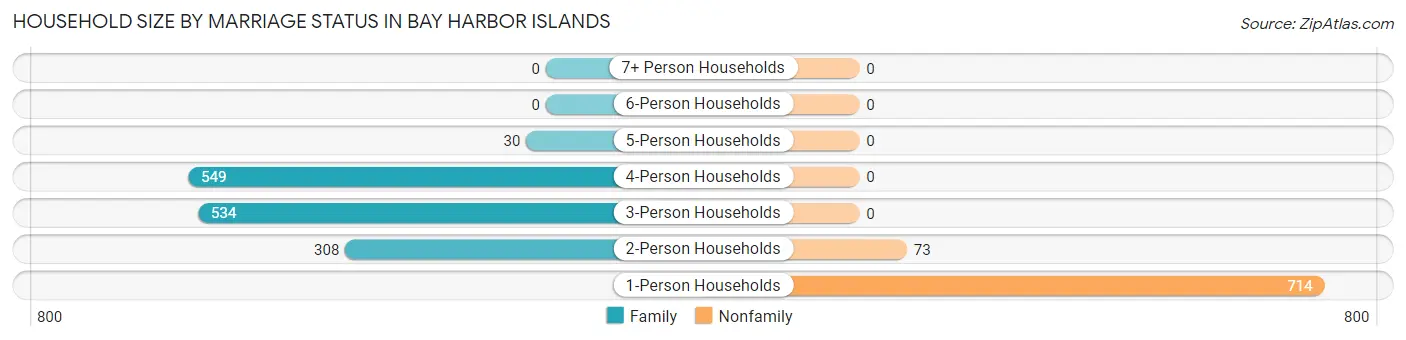
Household Size by Marriage Status in Bay Harbor Islands
Out of a total of 2,208 households in Bay Harbor Islands, 1,421 (64.4%) are family households, while 787 (35.6%) are nonfamily households. The most numerous type of family households are 4-person households, comprising 549, and the most common type of nonfamily households are 1-person households, comprising 714.
| Household Size | Family Households | Nonfamily Households |
| 1-Person Households | - | 714 (32.3%) |
| 2-Person Households | 308 (14.0%) | 73 (3.3%) |
| 3-Person Households | 534 (24.2%) | 0 (0.0%) |
| 4-Person Households | 549 (24.9%) | 0 (0.0%) |
| 5-Person Households | 30 (1.4%) | 0 (0.0%) |
| 6-Person Households | 0 (0.0%) | 0 (0.0%) |
| 7+ Person Households | 0 (0.0%) | 0 (0.0%) |
| Total | 1,421 (64.4%) | 787 (35.6%) |
Female Fertility in Bay Harbor Islands
Fertility by Age in Bay Harbor Islands
Average fertility rate in Bay Harbor Islands is 24.0 births per 1,000 women. Women in the age bracket of 35 to 50 years have the highest fertility rate with 34.0 births per 1,000 women. Women in the age bracket of 35 to 50 years acount for 70.5% of all women with births.
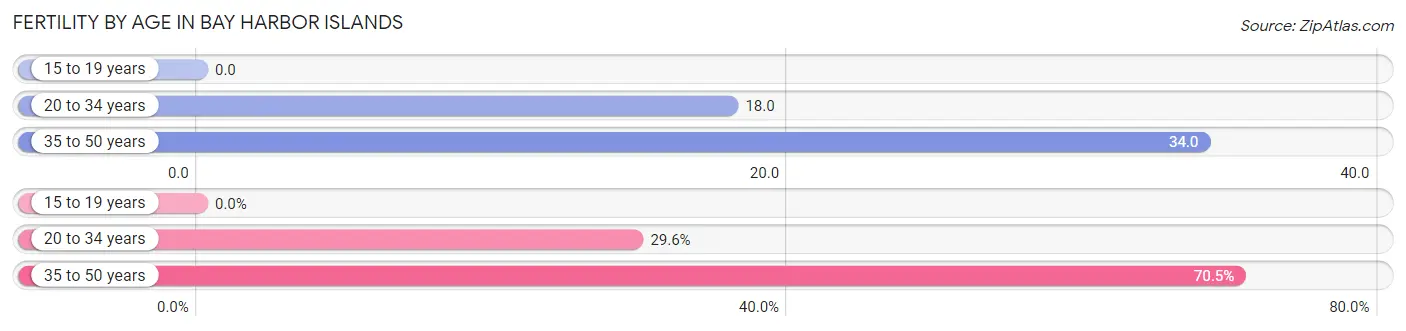
| Age Bracket | Women with Births | Births / 1,000 Women |
| 15 to 19 years | 0 (0.0%) | 0.0 |
| 20 to 34 years | 13 (29.5%) | 18.0 |
| 35 to 50 years | 31 (70.5%) | 34.0 |
| Total | 44 (100.0%) | 24.0 |
Fertility by Age by Marriage Status in Bay Harbor Islands
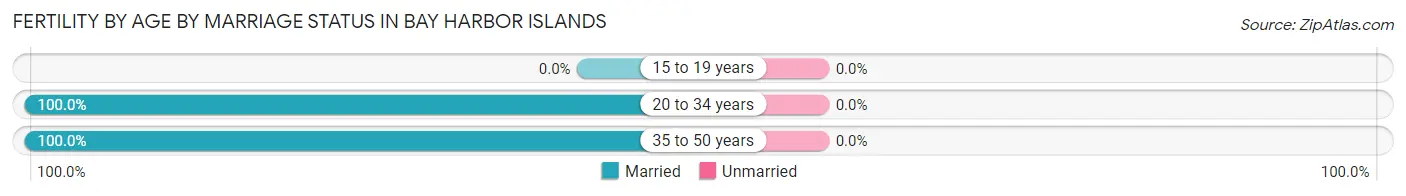
| Age Bracket | Married | Unmarried |
| 15 to 19 years | 0 (0.0%) | 0 (0.0%) |
| 20 to 34 years | 13 (100.0%) | 0 (0.0%) |
| 35 to 50 years | 31 (100.0%) | 0 (0.0%) |
| Total | 44 (100.0%) | 0 (0.0%) |
Fertility by Education in Bay Harbor Islands
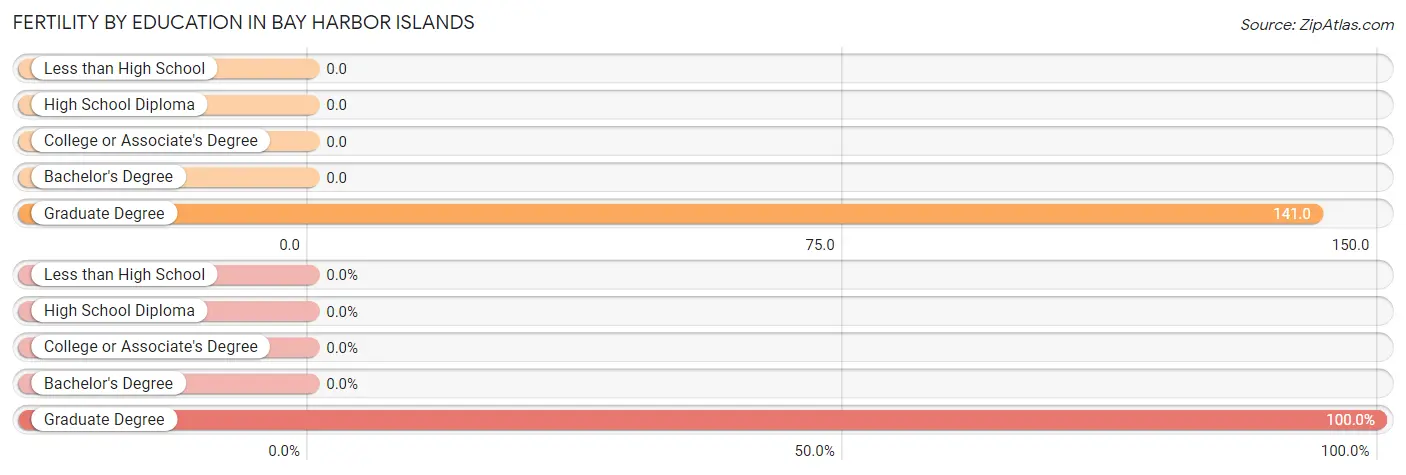
| Educational Attainment | Women with Births | Births / 1,000 Women |
| Less than High School | 0 (0.0%) | 0.0 |
| High School Diploma | 0 (0.0%) | 0.0 |
| College or Associate's Degree | 0 (0.0%) | 0.0 |
| Bachelor's Degree | 0 (0.0%) | 0.0 |
| Graduate Degree | 44 (100.0%) | 141.0 |
| Total | 44 (100.0%) | 24.0 |
Fertility by Education by Marriage Status in Bay Harbor Islands
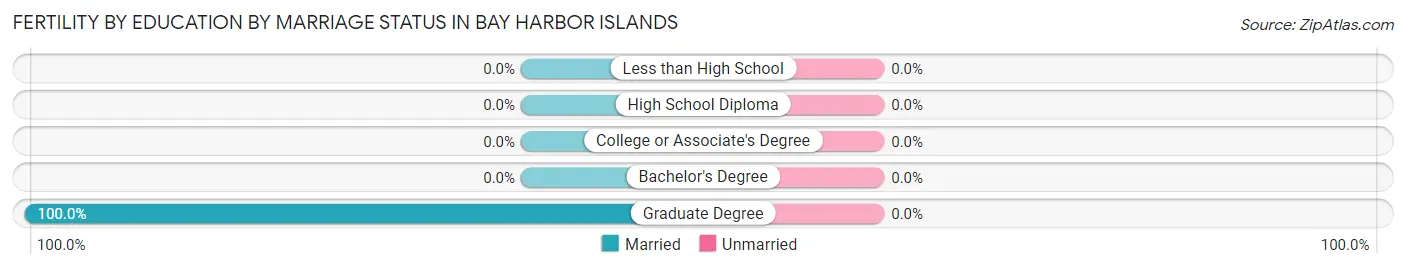
| Educational Attainment | Married | Unmarried |
| Less than High School | 0 (0.0%) | 0 (0.0%) |
| High School Diploma | 0 (0.0%) | 0 (0.0%) |
| College or Associate's Degree | 0 (0.0%) | 0 (0.0%) |
| Bachelor's Degree | 0 (0.0%) | 0 (0.0%) |
| Graduate Degree | 44 (100.0%) | 0 (0.0%) |
| Total | 44 (100.0%) | 0 (0.0%) |
Employment Characteristics in Bay Harbor Islands
Employment by Class of Employer in Bay Harbor Islands
Among the 2,921 employed individuals in Bay Harbor Islands, private company employees (1,827 | 62.5%), self-employed (incorporated) (487 | 16.7%), and self-employed (not incorporated) (264 | 9.0%) make up the most common classes of employment.
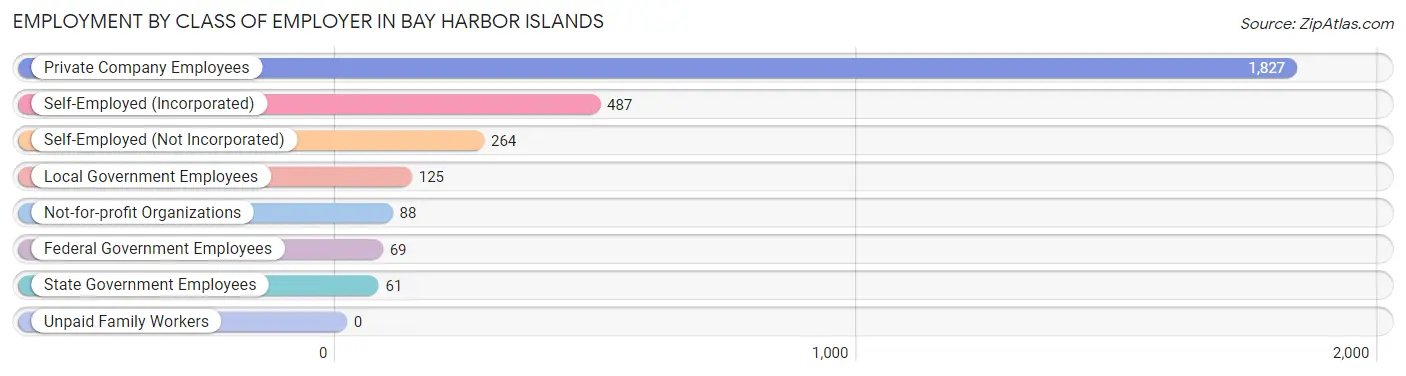
| Employer Class | # Employees | % Employees |
| Private Company Employees | 1,827 | 62.5% |
| Self-Employed (Incorporated) | 487 | 16.7% |
| Self-Employed (Not Incorporated) | 264 | 9.0% |
| Not-for-profit Organizations | 88 | 3.0% |
| Local Government Employees | 125 | 4.3% |
| State Government Employees | 61 | 2.1% |
| Federal Government Employees | 69 | 2.4% |
| Unpaid Family Workers | 0 | 0.0% |
| Total | 2,921 | 100.0% |
Employment Status by Age in Bay Harbor Islands
According to the labor force statistics for Bay Harbor Islands, out of the total population over 16 years of age (4,179), 72.6% or 3,034 individuals are in the labor force, with 3.4% or 103 of them unemployed. The age group with the highest labor force participation rate is 25 to 29 years, with 100.0% or 282 individuals in the labor force. Within the labor force, the 45 to 54 years age range has the highest percentage of unemployed individuals, with 8.1% or 62 of them being unemployed.
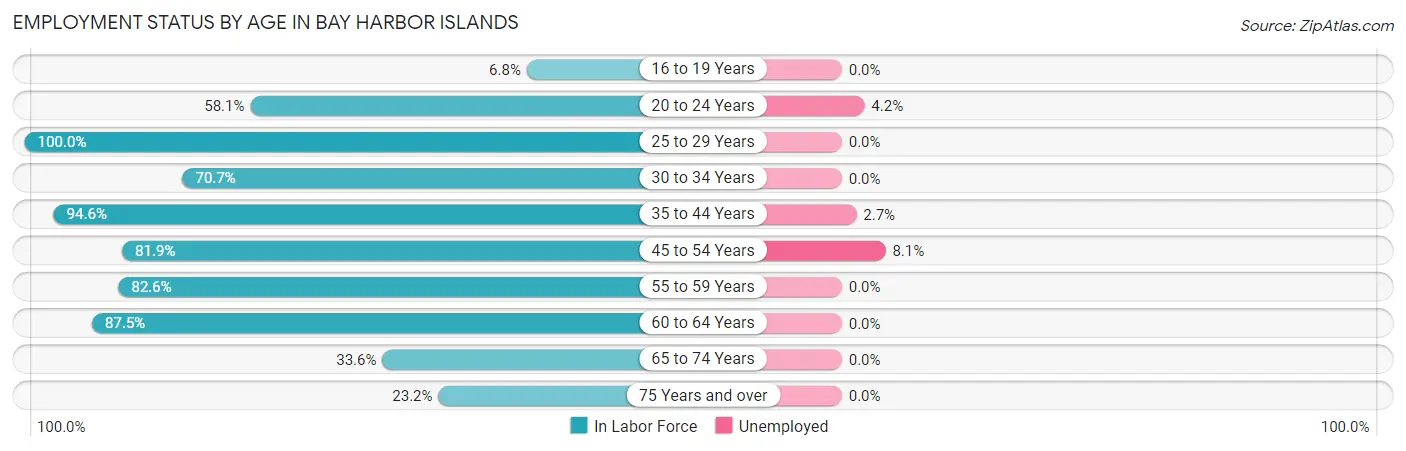
| Age Bracket | In Labor Force | Unemployed |
| 16 to 19 Years | 9 (6.8%) | 0 (0.0%) |
| 20 to 24 Years | 261 (58.1%) | 11 (4.2%) |
| 25 to 29 Years | 282 (100.0%) | 0 (0.0%) |
| 30 to 34 Years | 123 (70.7%) | 0 (0.0%) |
| 35 to 44 Years | 1,102 (94.6%) | 30 (2.7%) |
| 45 to 54 Years | 770 (81.9%) | 62 (8.1%) |
| 55 to 59 Years | 232 (82.6%) | 0 (0.0%) |
| 60 to 64 Years | 63 (87.5%) | 0 (0.0%) |
| 65 to 74 Years | 111 (33.6%) | 0 (0.0%) |
| 75 Years and over | 82 (23.2%) | 0 (0.0%) |
| Total | 3,034 (72.6%) | 103 (3.4%) |
Employment Status by Educational Attainment in Bay Harbor Islands
According to labor force statistics for Bay Harbor Islands, 88.3% of individuals (2,573) out of the total population between 25 and 64 years of age (2,914) are in the labor force, with 3.6% or 93 of them being unemployed. The group with the highest labor force participation rate are those with the educational attainment of college / associate degree, with 89.3% or 671 individuals in the labor force. Within the labor force, individuals with college / associate degree education have the highest percentage of unemployment, with 7.6% or 51 of them being unemployed.
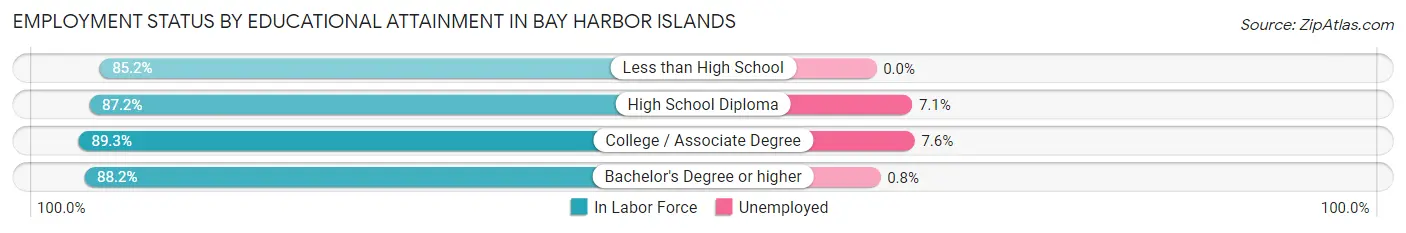
| Educational Attainment | In Labor Force | Unemployed |
| Less than High School | 69 (85.2%) | 0 (0.0%) |
| High School Diploma | 422 (87.2%) | 34 (7.1%) |
| College / Associate Degree | 671 (89.3%) | 57 (7.6%) |
| Bachelor's Degree or higher | 1,409 (88.2%) | 13 (0.8%) |
| Total | 2,573 (88.3%) | 105 (3.6%) |
Employment Occupations by Sex in Bay Harbor Islands
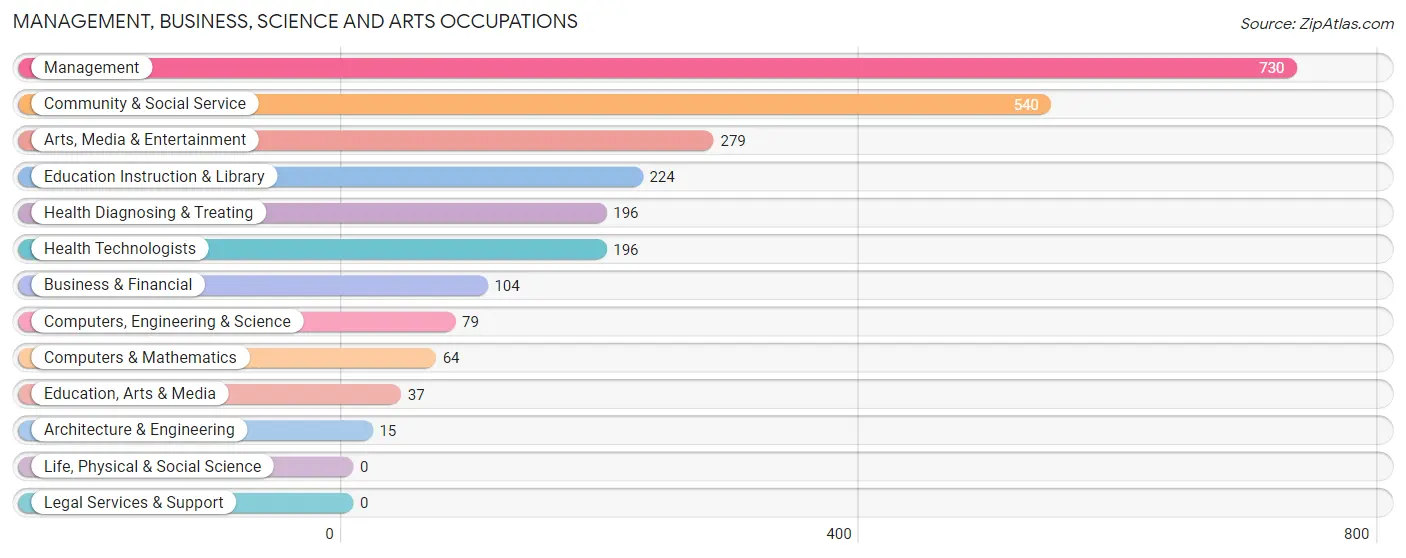
Management, Business, Science and Arts Occupations
The most common Management, Business, Science and Arts occupations in Bay Harbor Islands are Management (730 | 25.1%), Community & Social Service (540 | 18.6%), Arts, Media & Entertainment (279 | 9.6%), Education Instruction & Library (224 | 7.7%), and Health Diagnosing & Treating (196 | 6.7%).
Management, Business, Science and Arts Occupations by Sex
Within the Management, Business, Science and Arts occupations in Bay Harbor Islands, the most male-oriented occupations are Computers & Mathematics (100.0%), Computers, Engineering & Science (91.1%), and Business & Financial (90.4%), while the most female-oriented occupations are Education, Arts & Media (100.0%), Education Instruction & Library (97.8%), and Community & Social Service (80.7%).
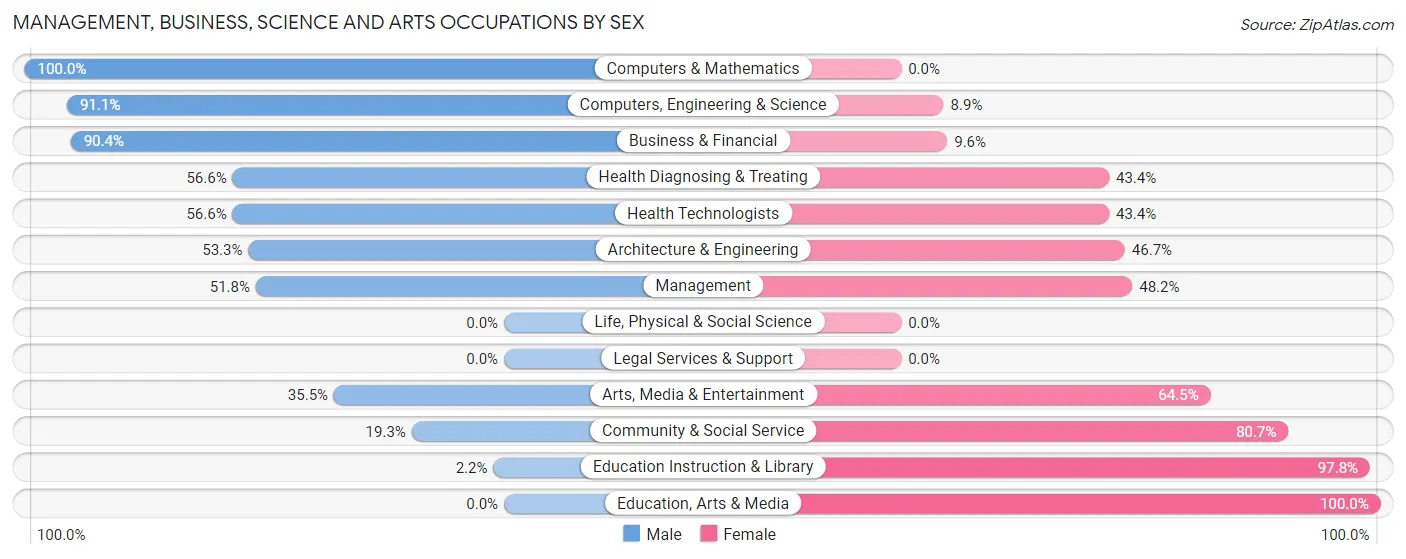
| Occupation | Male | Female |
| Management | 378 (51.8%) | 352 (48.2%) |
| Business & Financial | 94 (90.4%) | 10 (9.6%) |
| Computers, Engineering & Science | 72 (91.1%) | 7 (8.9%) |
| Computers & Mathematics | 64 (100.0%) | 0 (0.0%) |
| Architecture & Engineering | 8 (53.3%) | 7 (46.7%) |
| Life, Physical & Social Science | 0 (0.0%) | 0 (0.0%) |
| Community & Social Service | 104 (19.3%) | 436 (80.7%) |
| Education, Arts & Media | 0 (0.0%) | 37 (100.0%) |
| Legal Services & Support | 0 (0.0%) | 0 (0.0%) |
| Education Instruction & Library | 5 (2.2%) | 219 (97.8%) |
| Arts, Media & Entertainment | 99 (35.5%) | 180 (64.5%) |
| Health Diagnosing & Treating | 111 (56.6%) | 85 (43.4%) |
| Health Technologists | 111 (56.6%) | 85 (43.4%) |
| Total (Category) | 759 (46.0%) | 890 (54.0%) |
| Total (Overall) | 1,339 (46.1%) | 1,569 (53.9%) |
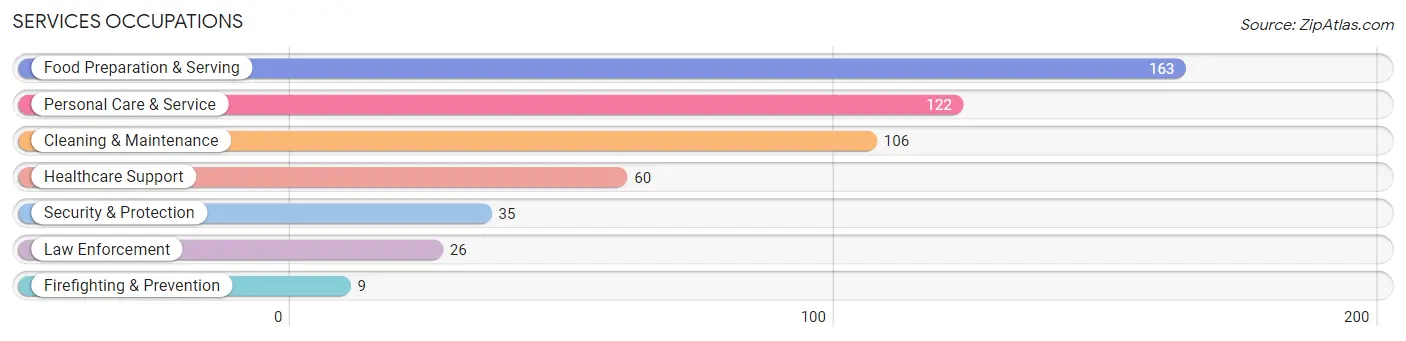
Services Occupations
The most common Services occupations in Bay Harbor Islands are Food Preparation & Serving (163 | 5.6%), Personal Care & Service (122 | 4.2%), Cleaning & Maintenance (106 | 3.6%), Healthcare Support (60 | 2.1%), and Security & Protection (35 | 1.2%).
Services Occupations by Sex
Within the Services occupations in Bay Harbor Islands, the most male-oriented occupations are Security & Protection (100.0%), Firefighting & Prevention (100.0%), and Law Enforcement (100.0%), while the most female-oriented occupations are Healthcare Support (100.0%), Personal Care & Service (92.6%), and Cleaning & Maintenance (73.6%).
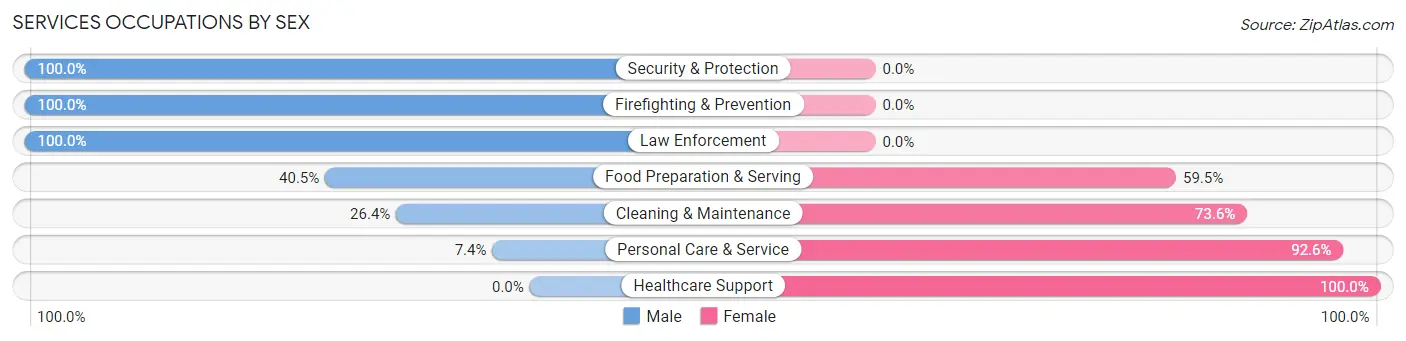
| Occupation | Male | Female |
| Healthcare Support | 0 (0.0%) | 60 (100.0%) |
| Security & Protection | 35 (100.0%) | 0 (0.0%) |
| Firefighting & Prevention | 9 (100.0%) | 0 (0.0%) |
| Law Enforcement | 26 (100.0%) | 0 (0.0%) |
| Food Preparation & Serving | 66 (40.5%) | 97 (59.5%) |
| Cleaning & Maintenance | 28 (26.4%) | 78 (73.6%) |
| Personal Care & Service | 9 (7.4%) | 113 (92.6%) |
| Total (Category) | 138 (28.4%) | 348 (71.6%) |
| Total (Overall) | 1,339 (46.1%) | 1,569 (53.9%) |
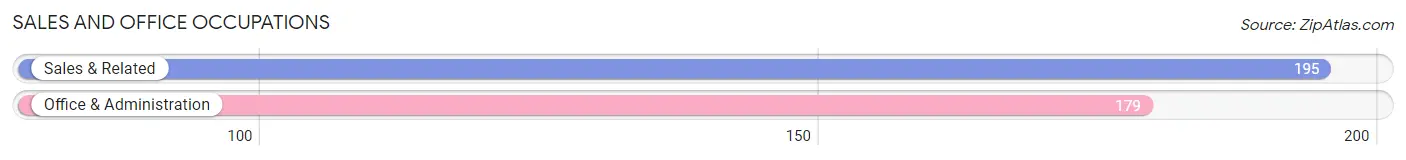
Sales and Office Occupations
The most common Sales and Office occupations in Bay Harbor Islands are Sales & Related (195 | 6.7%), and Office & Administration (179 | 6.2%).
Sales and Office Occupations by Sex
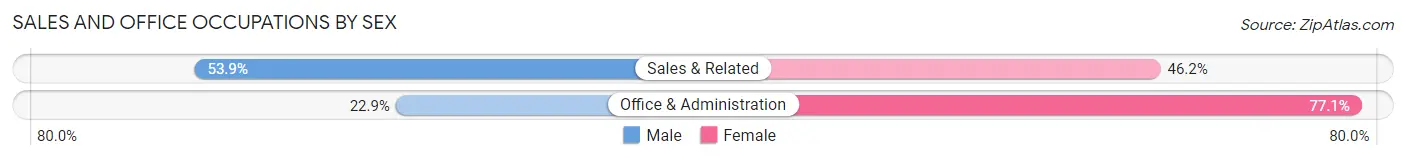
| Occupation | Male | Female |
| Sales & Related | 105 (53.8%) | 90 (46.2%) |
| Office & Administration | 41 (22.9%) | 138 (77.1%) |
| Total (Category) | 146 (39.0%) | 228 (61.0%) |
| Total (Overall) | 1,339 (46.1%) | 1,569 (53.9%) |
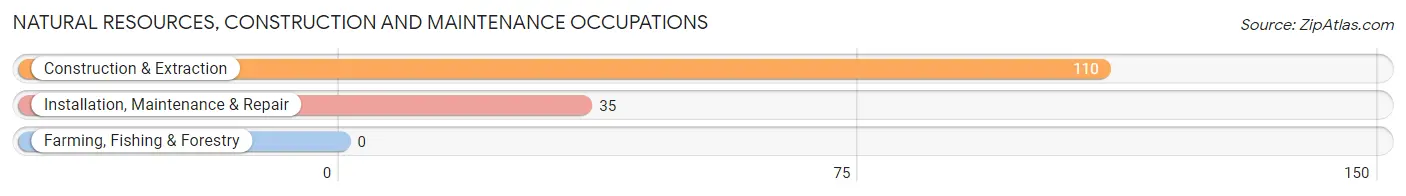
Natural Resources, Construction and Maintenance Occupations
The most common Natural Resources, Construction and Maintenance occupations in Bay Harbor Islands are Construction & Extraction (110 | 3.8%), and Installation, Maintenance & Repair (35 | 1.2%).
Natural Resources, Construction and Maintenance Occupations by Sex
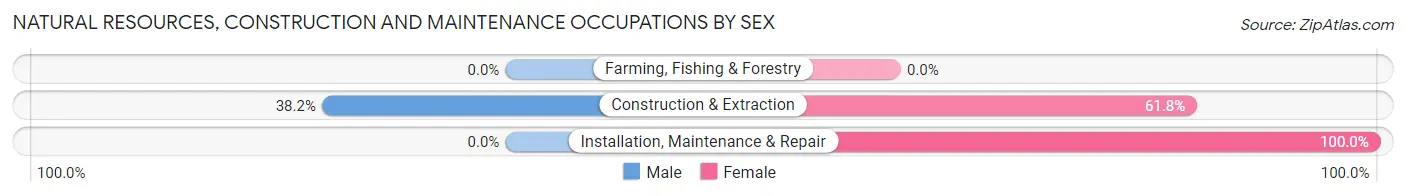
| Occupation | Male | Female |
| Farming, Fishing & Forestry | 0 (0.0%) | 0 (0.0%) |
| Construction & Extraction | 42 (38.2%) | 68 (61.8%) |
| Installation, Maintenance & Repair | 0 (0.0%) | 35 (100.0%) |
| Total (Category) | 42 (29.0%) | 103 (71.0%) |
| Total (Overall) | 1,339 (46.1%) | 1,569 (53.9%) |
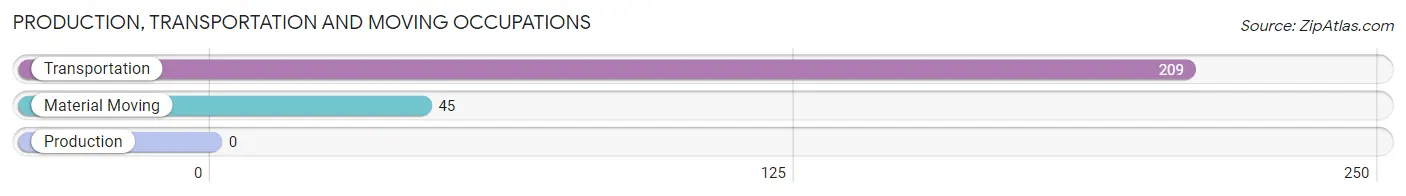
Production, Transportation and Moving Occupations
The most common Production, Transportation and Moving occupations in Bay Harbor Islands are Transportation (209 | 7.2%), and Material Moving (45 | 1.5%).
Production, Transportation and Moving Occupations by Sex
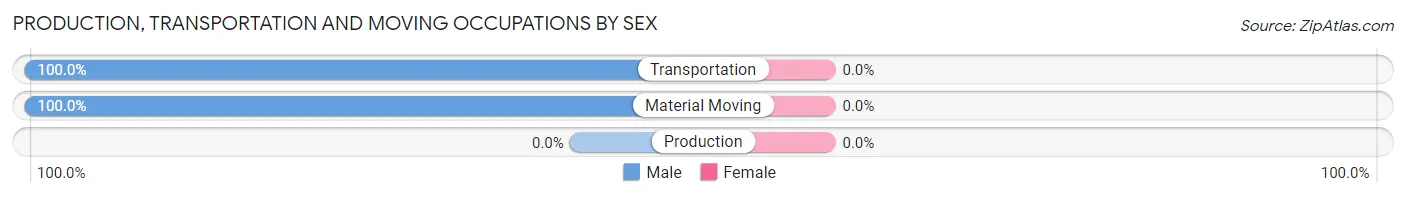
| Occupation | Male | Female |
| Production | 0 (0.0%) | 0 (0.0%) |
| Transportation | 209 (100.0%) | 0 (0.0%) |
| Material Moving | 45 (100.0%) | 0 (0.0%) |
| Total (Category) | 254 (100.0%) | 0 (0.0%) |
| Total (Overall) | 1,339 (46.1%) | 1,569 (53.9%) |
Employment Industries by Sex in Bay Harbor Islands
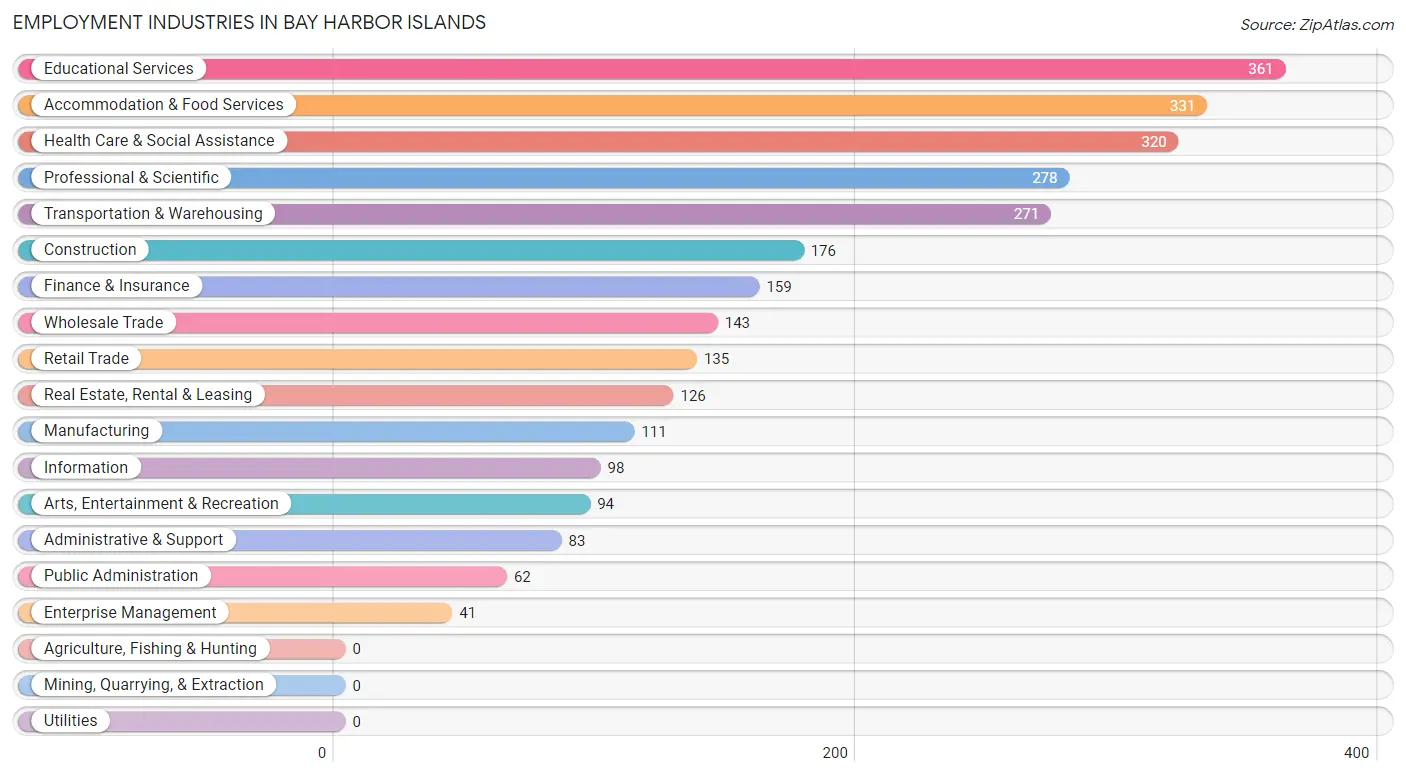
Employment Industries in Bay Harbor Islands
The major employment industries in Bay Harbor Islands include Educational Services (361 | 12.4%), Accommodation & Food Services (331 | 11.4%), Health Care & Social Assistance (320 | 11.0%), Professional & Scientific (278 | 9.6%), and Transportation & Warehousing (271 | 9.3%).
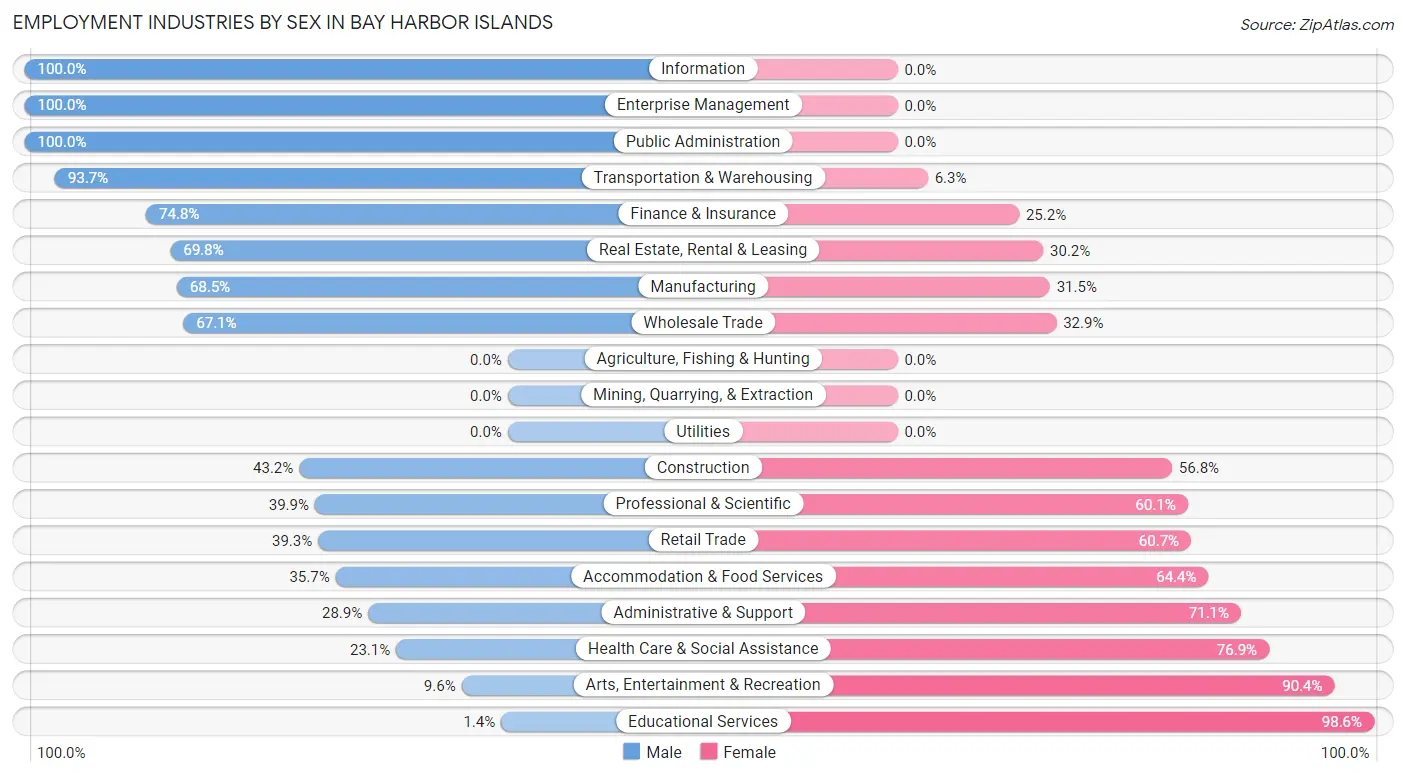
Employment Industries by Sex in Bay Harbor Islands
The Bay Harbor Islands industries that see more men than women are Information (100.0%), Enterprise Management (100.0%), and Public Administration (100.0%), whereas the industries that tend to have a higher number of women are Educational Services (98.6%), Arts, Entertainment & Recreation (90.4%), and Health Care & Social Assistance (76.9%).
| Industry | Male | Female |
| Agriculture, Fishing & Hunting | 0 (0.0%) | 0 (0.0%) |
| Mining, Quarrying, & Extraction | 0 (0.0%) | 0 (0.0%) |
| Construction | 76 (43.2%) | 100 (56.8%) |
| Manufacturing | 76 (68.5%) | 35 (31.5%) |
| Wholesale Trade | 96 (67.1%) | 47 (32.9%) |
| Retail Trade | 53 (39.3%) | 82 (60.7%) |
| Transportation & Warehousing | 254 (93.7%) | 17 (6.3%) |
| Utilities | 0 (0.0%) | 0 (0.0%) |
| Information | 98 (100.0%) | 0 (0.0%) |
| Finance & Insurance | 119 (74.8%) | 40 (25.2%) |
| Real Estate, Rental & Leasing | 88 (69.8%) | 38 (30.2%) |
| Professional & Scientific | 111 (39.9%) | 167 (60.1%) |
| Enterprise Management | 41 (100.0%) | 0 (0.0%) |
| Administrative & Support | 24 (28.9%) | 59 (71.1%) |
| Educational Services | 5 (1.4%) | 356 (98.6%) |
| Health Care & Social Assistance | 74 (23.1%) | 246 (76.9%) |
| Arts, Entertainment & Recreation | 9 (9.6%) | 85 (90.4%) |
| Accommodation & Food Services | 118 (35.6%) | 213 (64.3%) |
| Public Administration | 62 (100.0%) | 0 (0.0%) |
| Total | 1,339 (46.1%) | 1,569 (53.9%) |
Education in Bay Harbor Islands
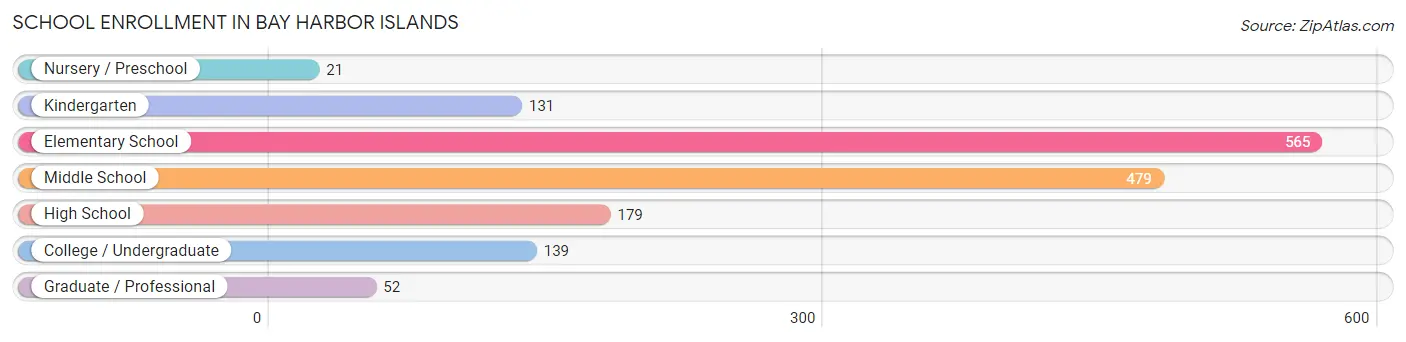
School Enrollment in Bay Harbor Islands
The most common levels of schooling among the 1,566 students in Bay Harbor Islands are elementary school (565 | 36.1%), middle school (479 | 30.6%), and high school (179 | 11.4%).
| School Level | # Students | % Students |
| Nursery / Preschool | 21 | 1.3% |
| Kindergarten | 131 | 8.4% |
| Elementary School | 565 | 36.1% |
| Middle School | 479 | 30.6% |
| High School | 179 | 11.4% |
| College / Undergraduate | 139 | 8.9% |
| Graduate / Professional | 52 | 3.3% |
| Total | 1,566 | 100.0% |
School Enrollment by Age by Funding Source in Bay Harbor Islands
Out of a total of 1,566 students who are enrolled in schools in Bay Harbor Islands, 191 (12.2%) attend a private institution, while the remaining 1,375 (87.8%) are enrolled in public schools. The age group of 25 to 34 year olds has the highest likelihood of being enrolled in private schools, with 34 (100.0% in the age bracket) enrolled. Conversely, the age group of 3 to 4 year olds has the lowest likelihood of being enrolled in a private school, with 6 (100.0% in the age bracket) attending a public institution.
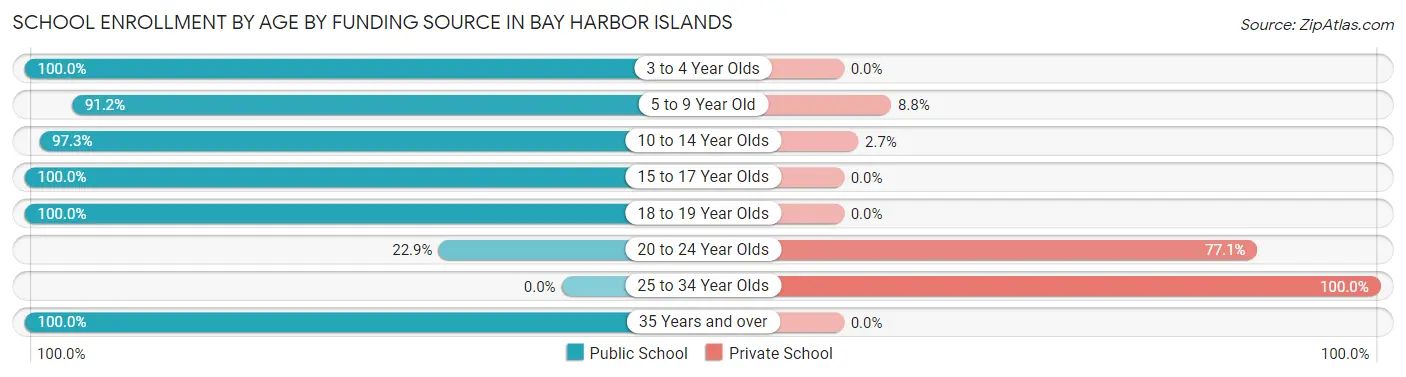
| Age Bracket | Public School | Private School |
| 3 to 4 Year Olds | 6 (100.0%) | 0 (0.0%) |
| 5 to 9 Year Old | 611 (91.2%) | 59 (8.8%) |
| 10 to 14 Year Olds | 506 (97.3%) | 14 (2.7%) |
| 15 to 17 Year Olds | 179 (100.0%) | 0 (0.0%) |
| 18 to 19 Year Olds | 16 (100.0%) | 0 (0.0%) |
| 20 to 24 Year Olds | 25 (22.9%) | 84 (77.1%) |
| 25 to 34 Year Olds | 0 (0.0%) | 34 (100.0%) |
| 35 Years and over | 32 (100.0%) | 0 (0.0%) |
| Total | 1,375 (87.8%) | 191 (12.2%) |
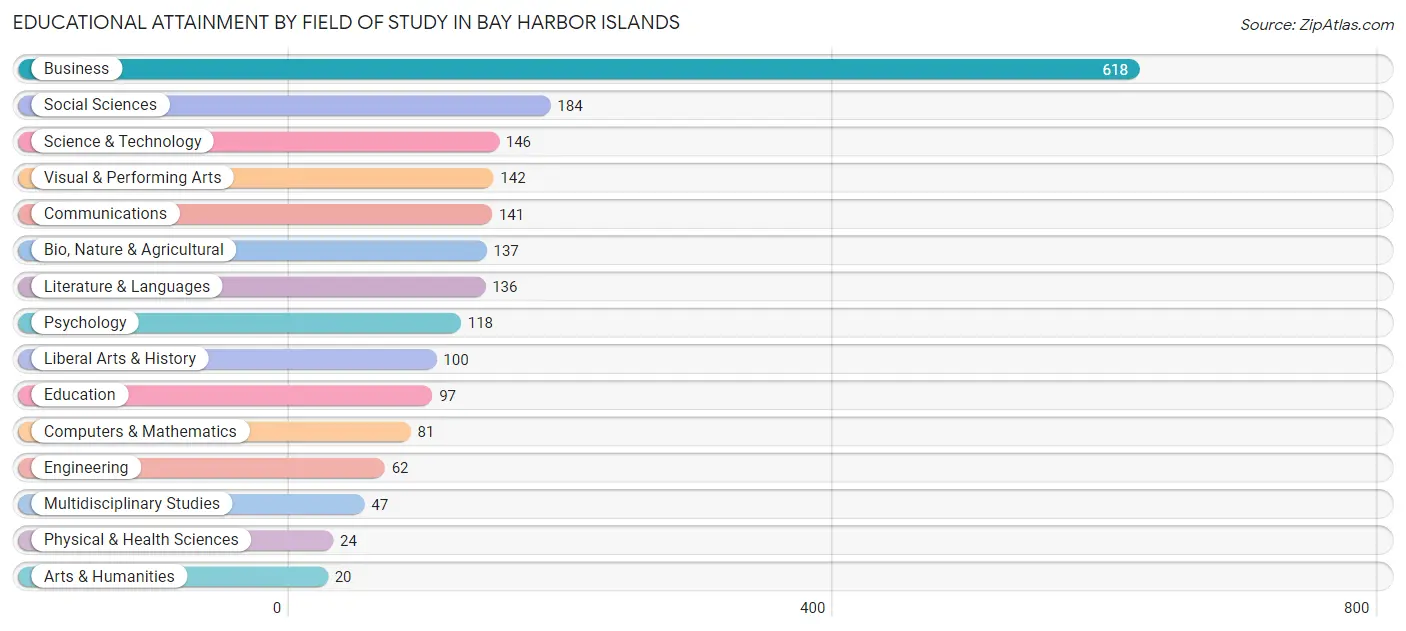
Educational Attainment by Field of Study in Bay Harbor Islands
Business (618 | 30.1%), social sciences (184 | 9.0%), science & technology (146 | 7.1%), visual & performing arts (142 | 6.9%), and communications (141 | 6.9%) are the most common fields of study among 2,053 individuals in Bay Harbor Islands who have obtained a bachelor's degree or higher.
| Field of Study | # Graduates | % Graduates |
| Computers & Mathematics | 81 | 4.0% |
| Bio, Nature & Agricultural | 137 | 6.7% |
| Physical & Health Sciences | 24 | 1.2% |
| Psychology | 118 | 5.8% |
| Social Sciences | 184 | 9.0% |
| Engineering | 62 | 3.0% |
| Multidisciplinary Studies | 47 | 2.3% |
| Science & Technology | 146 | 7.1% |
| Business | 618 | 30.1% |
| Education | 97 | 4.7% |
| Literature & Languages | 136 | 6.6% |
| Liberal Arts & History | 100 | 4.9% |
| Visual & Performing Arts | 142 | 6.9% |
| Communications | 141 | 6.9% |
| Arts & Humanities | 20 | 1.0% |
| Total | 2,053 | 100.0% |
Transportation & Commute in Bay Harbor Islands
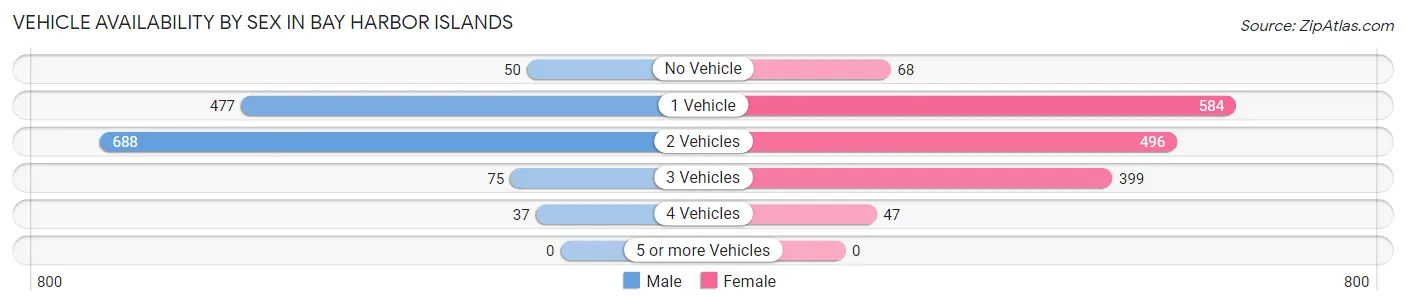
Vehicle Availability by Sex in Bay Harbor Islands
The most prevalent vehicle ownership categories in Bay Harbor Islands are males with 2 vehicles (688, accounting for 51.8%) and females with 2 vehicles (496, making up 43.2%).
| Vehicles Available | Male | Female |
| No Vehicle | 50 (3.8%) | 68 (4.3%) |
| 1 Vehicle | 477 (35.9%) | 584 (36.6%) |
| 2 Vehicles | 688 (51.8%) | 496 (31.1%) |
| 3 Vehicles | 75 (5.7%) | 399 (25.0%) |
| 4 Vehicles | 37 (2.8%) | 47 (2.9%) |
| 5 or more Vehicles | 0 (0.0%) | 0 (0.0%) |
| Total | 1,327 (100.0%) | 1,594 (100.0%) |
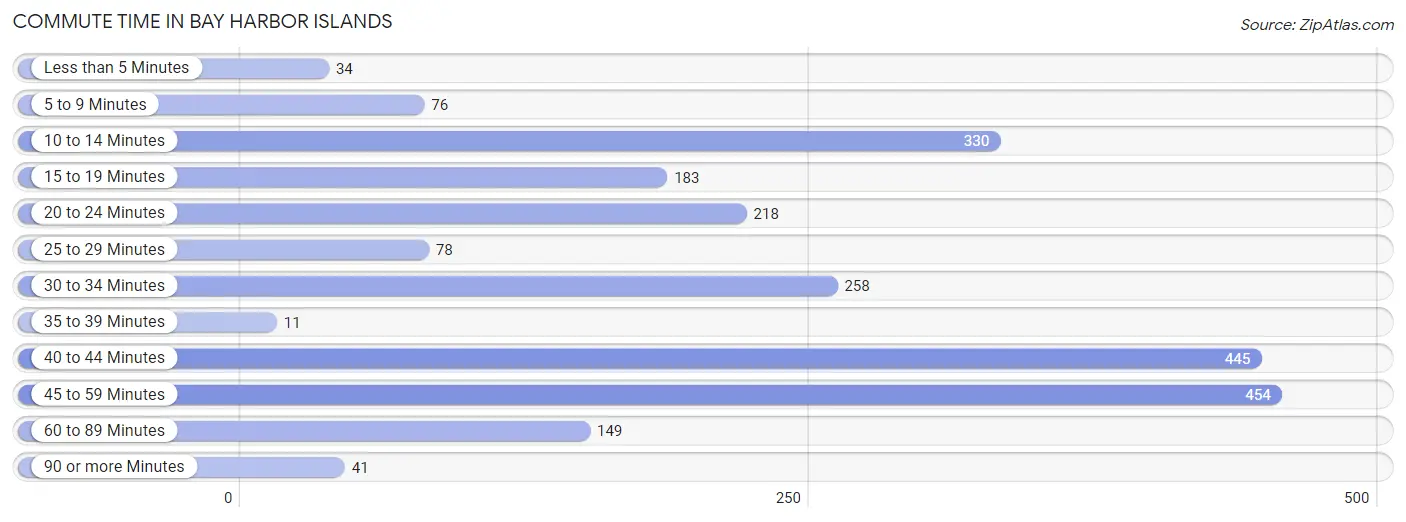
Commute Time in Bay Harbor Islands
The most frequently occuring commute durations in Bay Harbor Islands are 45 to 59 minutes (454 commuters, 19.9%), 40 to 44 minutes (445 commuters, 19.5%), and 10 to 14 minutes (330 commuters, 14.5%).
| Commute Time | # Commuters | % Commuters |
| Less than 5 Minutes | 34 | 1.5% |
| 5 to 9 Minutes | 76 | 3.3% |
| 10 to 14 Minutes | 330 | 14.5% |
| 15 to 19 Minutes | 183 | 8.0% |
| 20 to 24 Minutes | 218 | 9.6% |
| 25 to 29 Minutes | 78 | 3.4% |
| 30 to 34 Minutes | 258 | 11.3% |
| 35 to 39 Minutes | 11 | 0.5% |
| 40 to 44 Minutes | 445 | 19.5% |
| 45 to 59 Minutes | 454 | 19.9% |
| 60 to 89 Minutes | 149 | 6.5% |
| 90 or more Minutes | 41 | 1.8% |
Commute Time by Sex in Bay Harbor Islands
The most common commute times in Bay Harbor Islands are 10 to 14 minutes (242 commuters, 23.3%) for males and 40 to 44 minutes (339 commuters, 27.4%) for females.
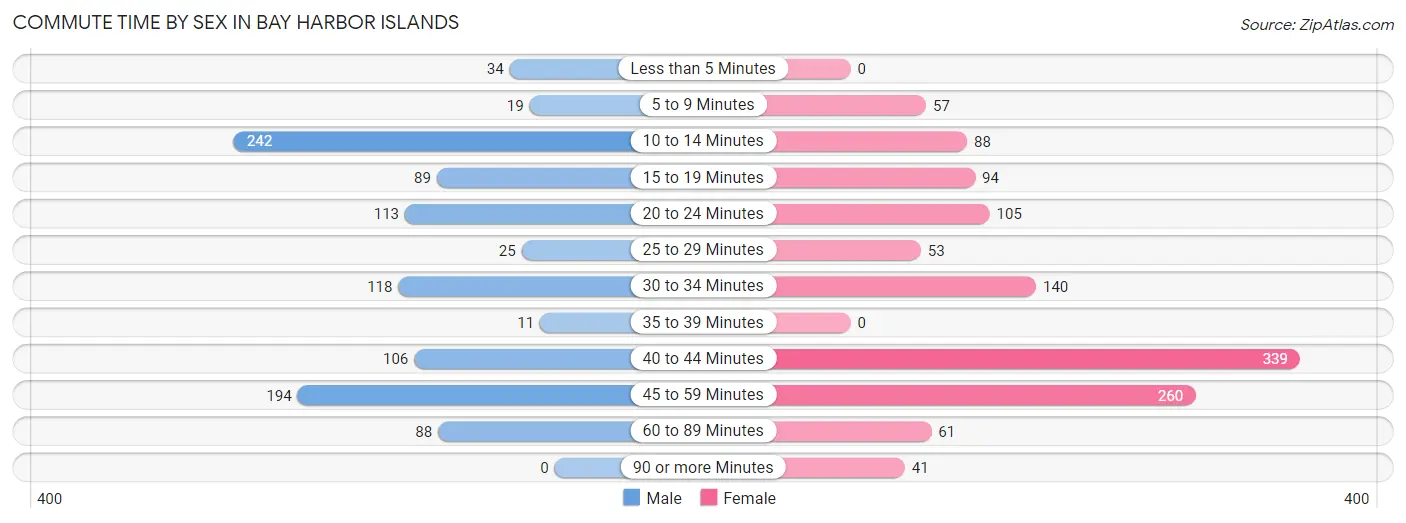
| Commute Time | Male | Female |
| Less than 5 Minutes | 34 (3.3%) | 0 (0.0%) |
| 5 to 9 Minutes | 19 (1.8%) | 57 (4.6%) |
| 10 to 14 Minutes | 242 (23.3%) | 88 (7.1%) |
| 15 to 19 Minutes | 89 (8.6%) | 94 (7.6%) |
| 20 to 24 Minutes | 113 (10.9%) | 105 (8.5%) |
| 25 to 29 Minutes | 25 (2.4%) | 53 (4.3%) |
| 30 to 34 Minutes | 118 (11.4%) | 140 (11.3%) |
| 35 to 39 Minutes | 11 (1.1%) | 0 (0.0%) |
| 40 to 44 Minutes | 106 (10.2%) | 339 (27.4%) |
| 45 to 59 Minutes | 194 (18.7%) | 260 (21.0%) |
| 60 to 89 Minutes | 88 (8.5%) | 61 (4.9%) |
| 90 or more Minutes | 0 (0.0%) | 41 (3.3%) |
Time of Departure to Work by Sex in Bay Harbor Islands
The most frequent times of departure to work in Bay Harbor Islands are 8:00 AM to 8:29 AM (357, 34.4%) for males and 8:00 AM to 8:29 AM (330, 26.7%) for females.
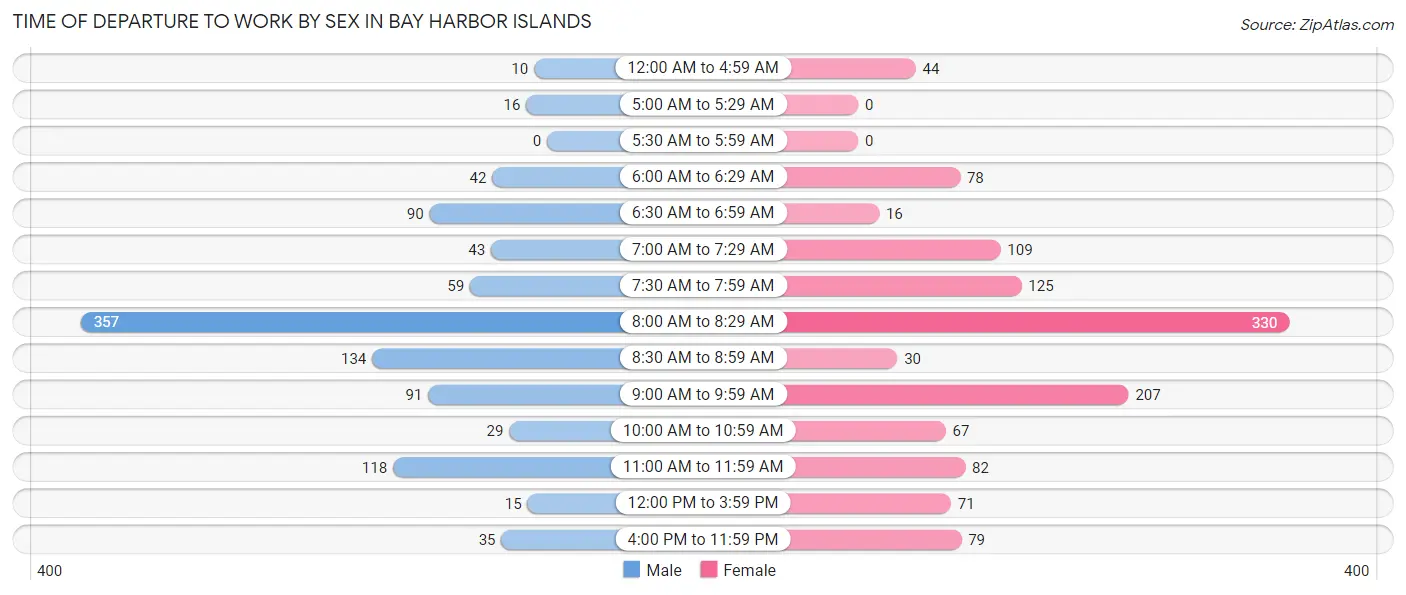
| Time of Departure | Male | Female |
| 12:00 AM to 4:59 AM | 10 (1.0%) | 44 (3.5%) |
| 5:00 AM to 5:29 AM | 16 (1.5%) | 0 (0.0%) |
| 5:30 AM to 5:59 AM | 0 (0.0%) | 0 (0.0%) |
| 6:00 AM to 6:29 AM | 42 (4.0%) | 78 (6.3%) |
| 6:30 AM to 6:59 AM | 90 (8.7%) | 16 (1.3%) |
| 7:00 AM to 7:29 AM | 43 (4.1%) | 109 (8.8%) |
| 7:30 AM to 7:59 AM | 59 (5.7%) | 125 (10.1%) |
| 8:00 AM to 8:29 AM | 357 (34.4%) | 330 (26.7%) |
| 8:30 AM to 8:59 AM | 134 (12.9%) | 30 (2.4%) |
| 9:00 AM to 9:59 AM | 91 (8.8%) | 207 (16.7%) |
| 10:00 AM to 10:59 AM | 29 (2.8%) | 67 (5.4%) |
| 11:00 AM to 11:59 AM | 118 (11.4%) | 82 (6.6%) |
| 12:00 PM to 3:59 PM | 15 (1.4%) | 71 (5.7%) |
| 4:00 PM to 11:59 PM | 35 (3.4%) | 79 (6.4%) |
| Total | 1,039 (100.0%) | 1,238 (100.0%) |
Housing Occupancy in Bay Harbor Islands
Occupancy by Ownership in Bay Harbor Islands
Of the total 2,208 dwellings in Bay Harbor Islands, owner-occupied units account for 1,002 (45.4%), while renter-occupied units make up 1,206 (54.6%).
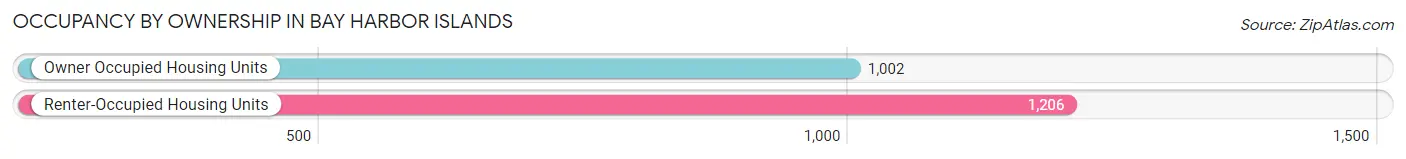
| Occupancy | # Housing Units | % Housing Units |
| Owner Occupied Housing Units | 1,002 | 45.4% |
| Renter-Occupied Housing Units | 1,206 | 54.6% |
| Total Occupied Housing Units | 2,208 | 100.0% |
Occupancy by Household Size in Bay Harbor Islands
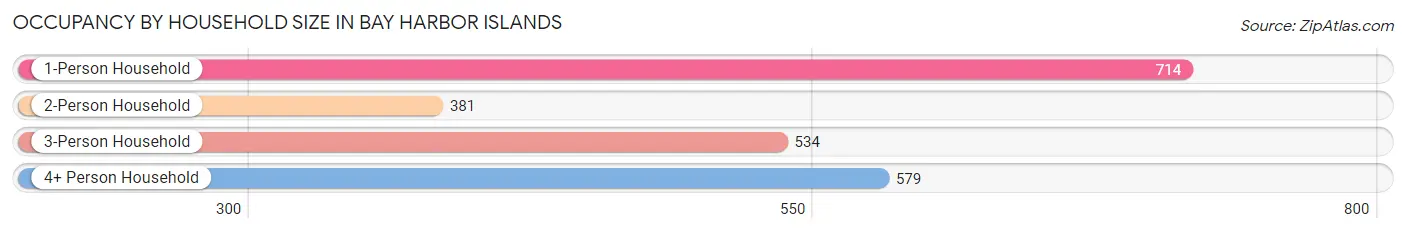
| Household Size | # Housing Units | % Housing Units |
| 1-Person Household | 714 | 32.3% |
| 2-Person Household | 381 | 17.3% |
| 3-Person Household | 534 | 24.2% |
| 4+ Person Household | 579 | 26.2% |
| Total Housing Units | 2,208 | 100.0% |
Occupancy by Ownership by Household Size in Bay Harbor Islands
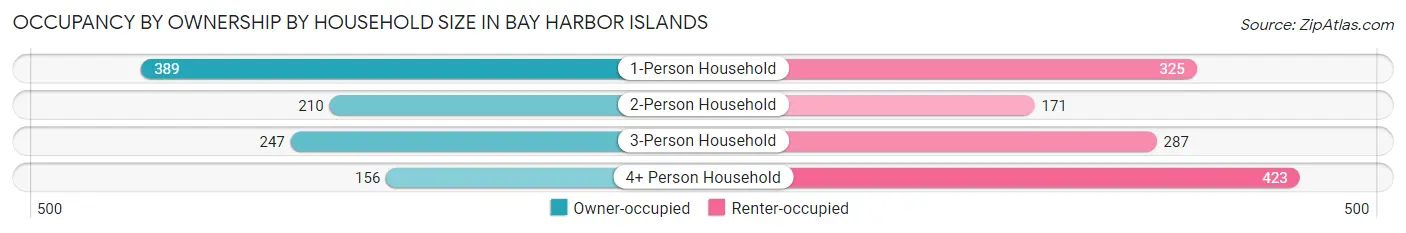
| Household Size | Owner-occupied | Renter-occupied |
| 1-Person Household | 389 (54.5%) | 325 (45.5%) |
| 2-Person Household | 210 (55.1%) | 171 (44.9%) |
| 3-Person Household | 247 (46.3%) | 287 (53.7%) |
| 4+ Person Household | 156 (26.9%) | 423 (73.1%) |
| Total Housing Units | 1,002 (45.4%) | 1,206 (54.6%) |
Occupancy by Educational Attainment in Bay Harbor Islands
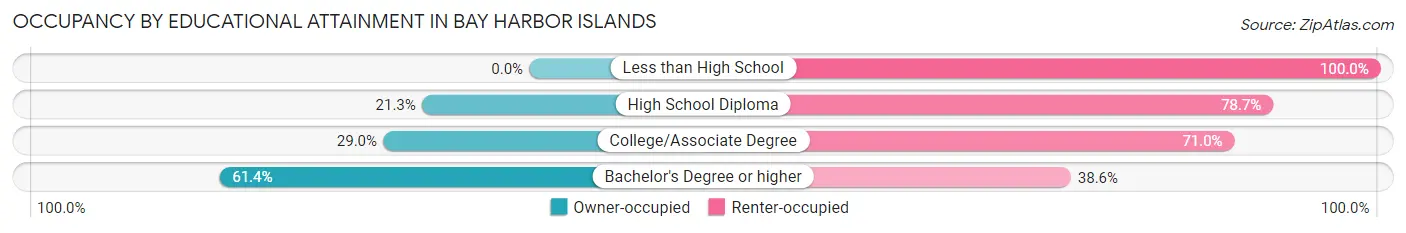
| Household Size | Owner-occupied | Renter-occupied |
| Less than High School | 0 (0.0%) | 11 (100.0%) |
| High School Diploma | 79 (21.3%) | 292 (78.7%) |
| College/Associate Degree | 177 (29.0%) | 434 (71.0%) |
| Bachelor's Degree or higher | 746 (61.4%) | 469 (38.6%) |
Occupancy by Age of Householder in Bay Harbor Islands
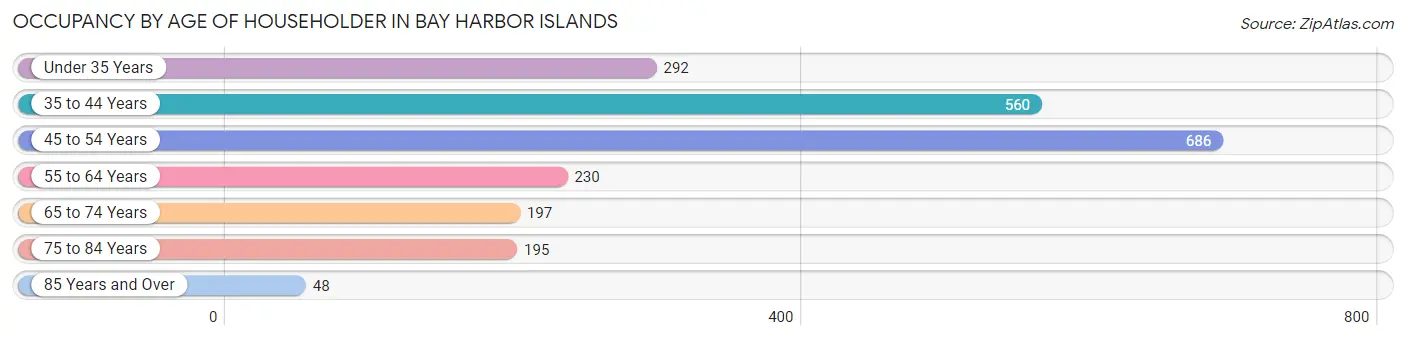
| Age Bracket | # Households | % Households |
| Under 35 Years | 292 | 13.2% |
| 35 to 44 Years | 560 | 25.4% |
| 45 to 54 Years | 686 | 31.1% |
| 55 to 64 Years | 230 | 10.4% |
| 65 to 74 Years | 197 | 8.9% |
| 75 to 84 Years | 195 | 8.8% |
| 85 Years and Over | 48 | 2.2% |
| Total | 2,208 | 100.0% |
Housing Finances in Bay Harbor Islands
Median Income by Occupancy in Bay Harbor Islands
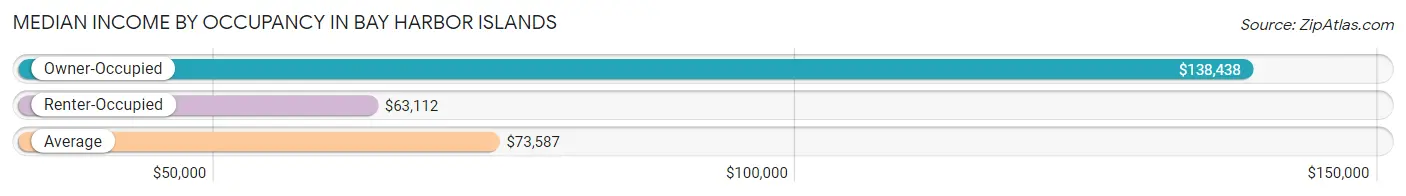
| Occupancy Type | # Households | Median Income |
| Owner-Occupied | 1,002 (45.4%) | $138,438 |
| Renter-Occupied | 1,206 (54.6%) | $63,112 |
| Average | 2,208 (100.0%) | $73,587 |
Occupancy by Householder Income Bracket in Bay Harbor Islands
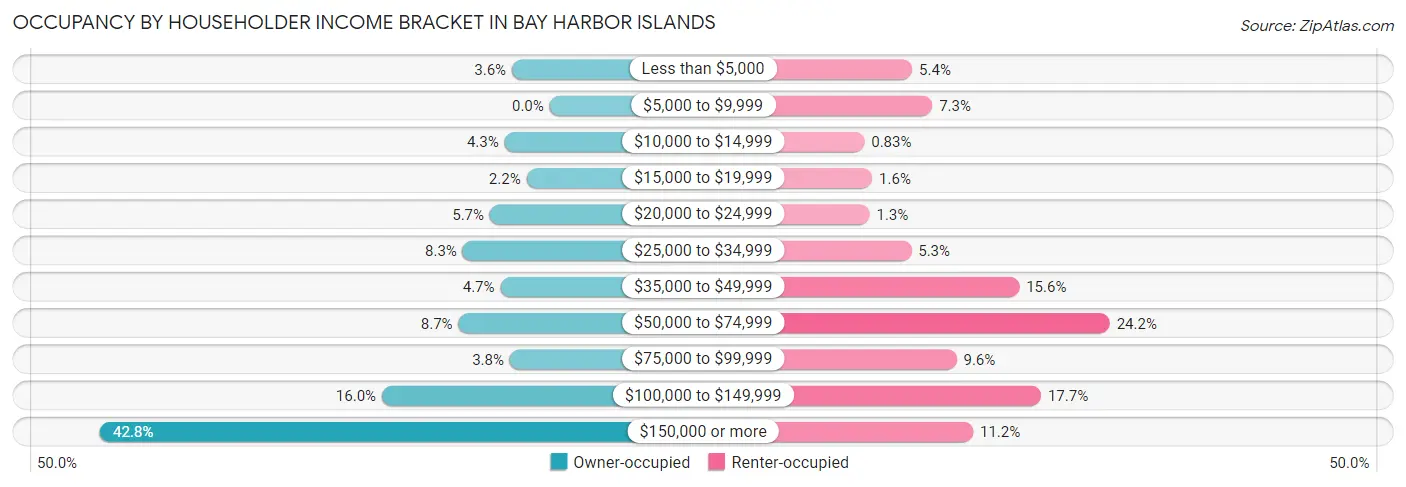
| Income Bracket | Owner-occupied | Renter-occupied |
| Less than $5,000 | 36 (3.6%) | 65 (5.4%) |
| $5,000 to $9,999 | 0 (0.0%) | 88 (7.3%) |
| $10,000 to $14,999 | 43 (4.3%) | 10 (0.8%) |
| $15,000 to $19,999 | 22 (2.2%) | 19 (1.6%) |
| $20,000 to $24,999 | 57 (5.7%) | 16 (1.3%) |
| $25,000 to $34,999 | 83 (8.3%) | 64 (5.3%) |
| $35,000 to $49,999 | 47 (4.7%) | 188 (15.6%) |
| $50,000 to $74,999 | 87 (8.7%) | 292 (24.2%) |
| $75,000 to $99,999 | 38 (3.8%) | 116 (9.6%) |
| $100,000 to $149,999 | 160 (16.0%) | 213 (17.7%) |
| $150,000 or more | 429 (42.8%) | 135 (11.2%) |
| Total | 1,002 (100.0%) | 1,206 (100.0%) |
Monthly Housing Cost Tiers in Bay Harbor Islands
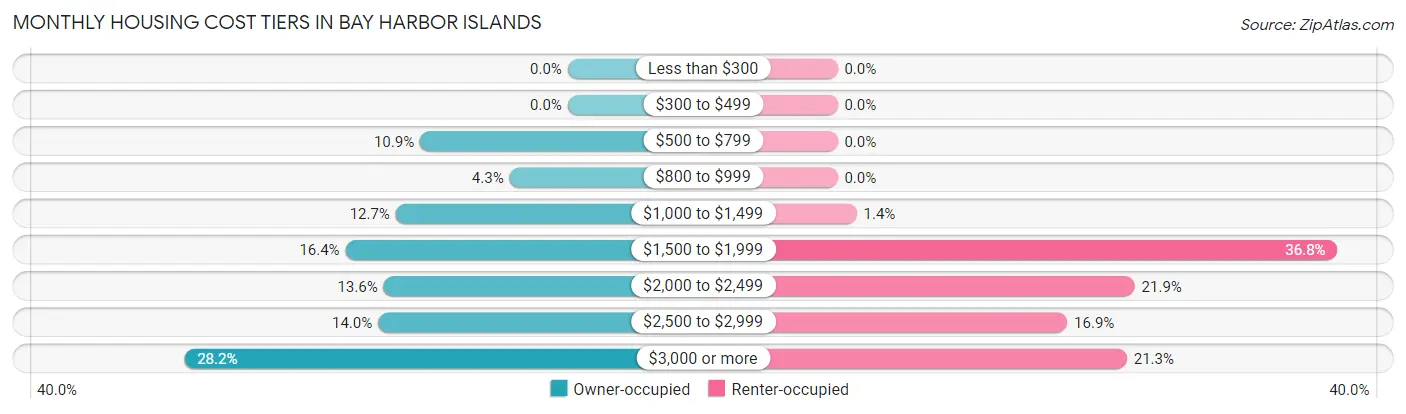
| Monthly Cost | Owner-occupied | Renter-occupied |
| Less than $300 | 0 (0.0%) | 0 (0.0%) |
| $300 to $499 | 0 (0.0%) | 0 (0.0%) |
| $500 to $799 | 109 (10.9%) | 0 (0.0%) |
| $800 to $999 | 43 (4.3%) | 0 (0.0%) |
| $1,000 to $1,499 | 127 (12.7%) | 17 (1.4%) |
| $1,500 to $1,999 | 164 (16.4%) | 444 (36.8%) |
| $2,000 to $2,499 | 136 (13.6%) | 264 (21.9%) |
| $2,500 to $2,999 | 140 (14.0%) | 204 (16.9%) |
| $3,000 or more | 283 (28.2%) | 257 (21.3%) |
| Total | 1,002 (100.0%) | 1,206 (100.0%) |
Physical Housing Characteristics in Bay Harbor Islands
Housing Structures in Bay Harbor Islands
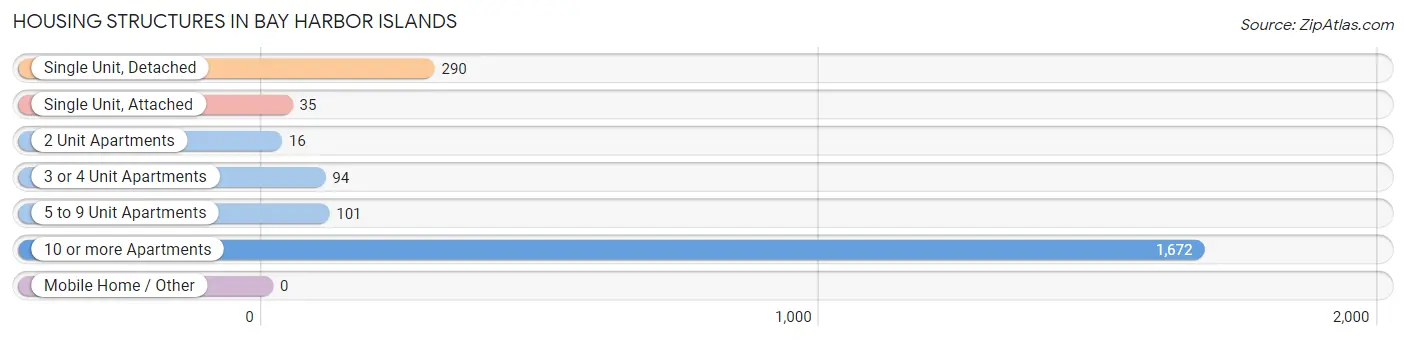
| Structure Type | # Housing Units | % Housing Units |
| Single Unit, Detached | 290 | 13.1% |
| Single Unit, Attached | 35 | 1.6% |
| 2 Unit Apartments | 16 | 0.7% |
| 3 or 4 Unit Apartments | 94 | 4.3% |
| 5 to 9 Unit Apartments | 101 | 4.6% |
| 10 or more Apartments | 1,672 | 75.7% |
| Mobile Home / Other | 0 | 0.0% |
| Total | 2,208 | 100.0% |
Housing Structures by Occupancy in Bay Harbor Islands
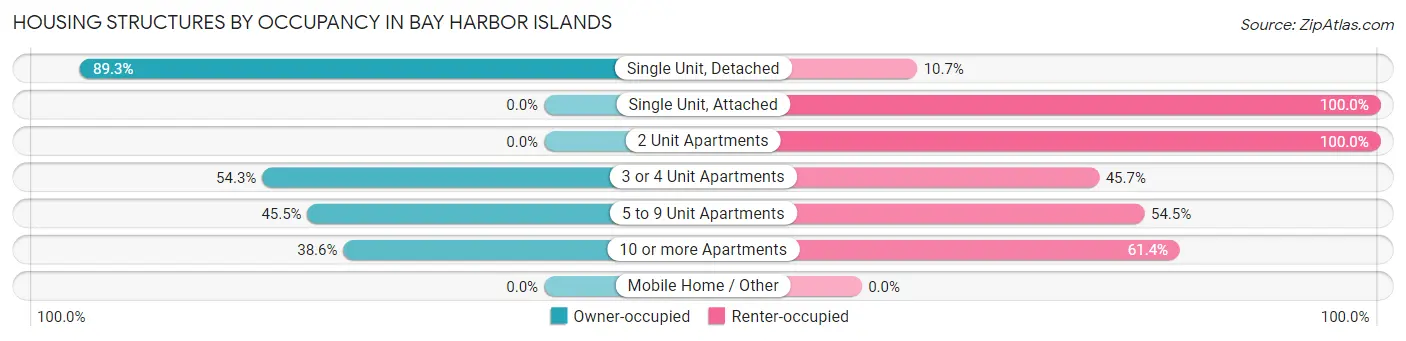
| Structure Type | Owner-occupied | Renter-occupied |
| Single Unit, Detached | 259 (89.3%) | 31 (10.7%) |
| Single Unit, Attached | 0 (0.0%) | 35 (100.0%) |
| 2 Unit Apartments | 0 (0.0%) | 16 (100.0%) |
| 3 or 4 Unit Apartments | 51 (54.3%) | 43 (45.7%) |
| 5 to 9 Unit Apartments | 46 (45.5%) | 55 (54.5%) |
| 10 or more Apartments | 646 (38.6%) | 1,026 (61.4%) |
| Mobile Home / Other | 0 (0.0%) | 0 (0.0%) |
| Total | 1,002 (45.4%) | 1,206 (54.6%) |
Housing Structures by Number of Rooms in Bay Harbor Islands
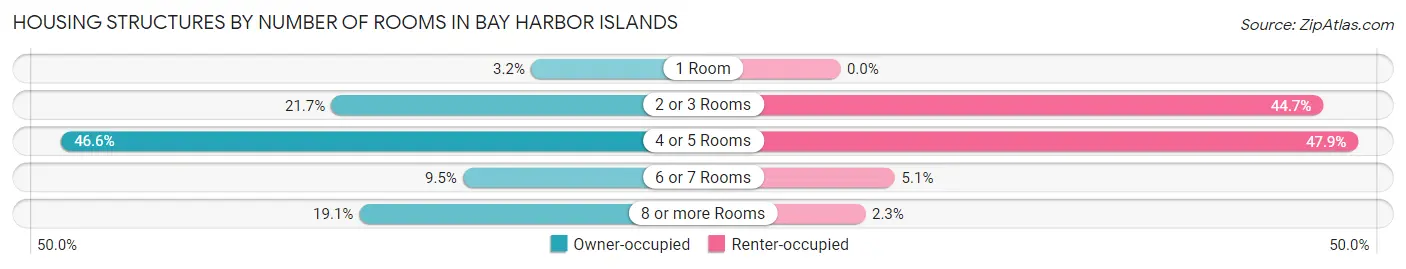
| Number of Rooms | Owner-occupied | Renter-occupied |
| 1 Room | 32 (3.2%) | 0 (0.0%) |
| 2 or 3 Rooms | 217 (21.7%) | 539 (44.7%) |
| 4 or 5 Rooms | 467 (46.6%) | 578 (47.9%) |
| 6 or 7 Rooms | 95 (9.5%) | 61 (5.1%) |
| 8 or more Rooms | 191 (19.1%) | 28 (2.3%) |
| Total | 1,002 (100.0%) | 1,206 (100.0%) |
Housing Structure by Heating Type in Bay Harbor Islands
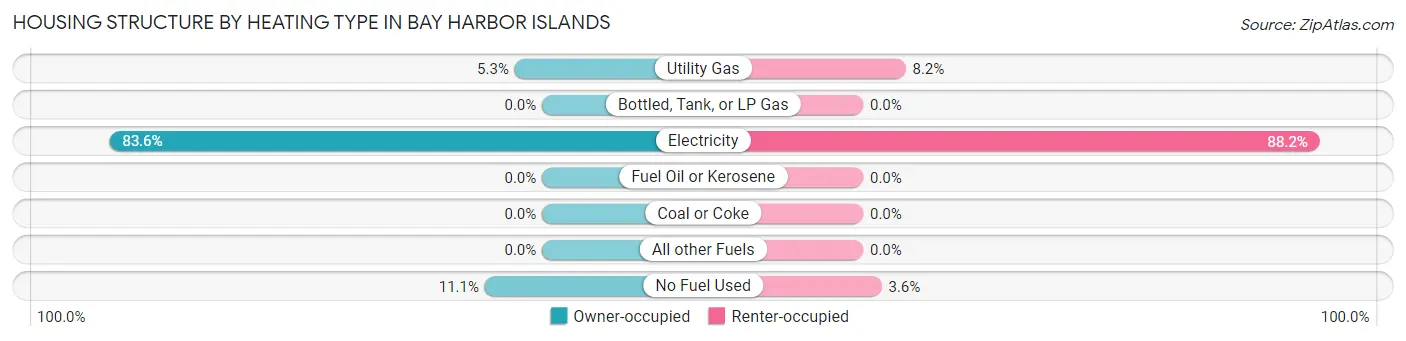
| Heating Type | Owner-occupied | Renter-occupied |
| Utility Gas | 53 (5.3%) | 99 (8.2%) |
| Bottled, Tank, or LP Gas | 0 (0.0%) | 0 (0.0%) |
| Electricity | 838 (83.6%) | 1,064 (88.2%) |
| Fuel Oil or Kerosene | 0 (0.0%) | 0 (0.0%) |
| Coal or Coke | 0 (0.0%) | 0 (0.0%) |
| All other Fuels | 0 (0.0%) | 0 (0.0%) |
| No Fuel Used | 111 (11.1%) | 43 (3.6%) |
| Total | 1,002 (100.0%) | 1,206 (100.0%) |
Household Vehicle Usage in Bay Harbor Islands
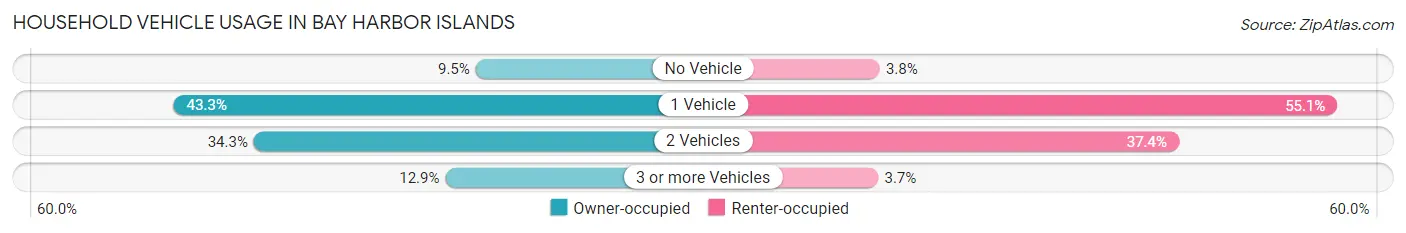
| Vehicles per Household | Owner-occupied | Renter-occupied |
| No Vehicle | 95 (9.5%) | 46 (3.8%) |
| 1 Vehicle | 434 (43.3%) | 665 (55.1%) |
| 2 Vehicles | 344 (34.3%) | 451 (37.4%) |
| 3 or more Vehicles | 129 (12.9%) | 44 (3.6%) |
| Total | 1,002 (100.0%) | 1,206 (100.0%) |
Real Estate & Mortgages in Bay Harbor Islands
Real Estate and Mortgage Overview in Bay Harbor Islands
| Characteristic | Without Mortgage | With Mortgage |
| Housing Units | 565 | 437 |
| Median Property Value | $421,000 | $580,000 |
| Median Household Income | $118,750 | $239 |
| Monthly Housing Costs | $1,501 | $251 |
| Real Estate Taxes | $5,619 | $0 |
Property Value by Mortgage Status in Bay Harbor Islands
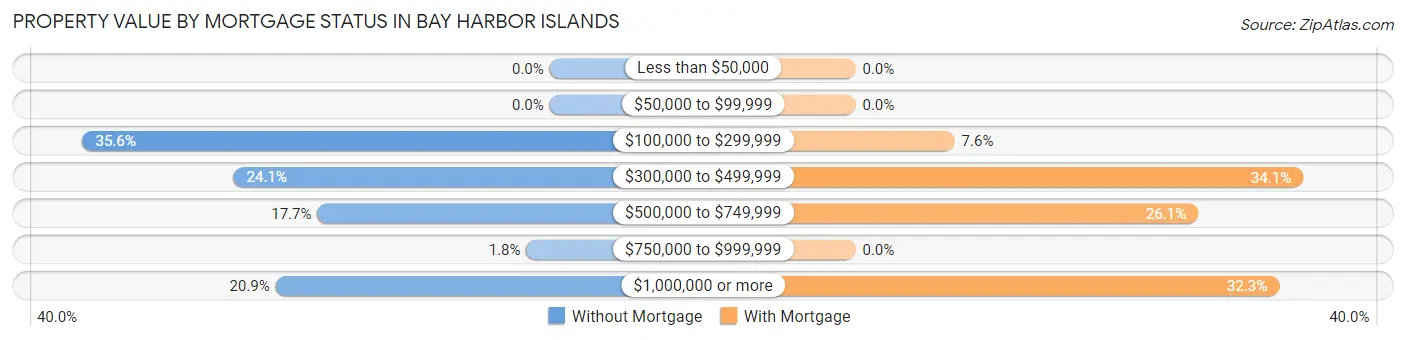
| Property Value | Without Mortgage | With Mortgage |
| Less than $50,000 | 0 (0.0%) | 0 (0.0%) |
| $50,000 to $99,999 | 0 (0.0%) | 0 (0.0%) |
| $100,000 to $299,999 | 201 (35.6%) | 33 (7.5%) |
| $300,000 to $499,999 | 136 (24.1%) | 149 (34.1%) |
| $500,000 to $749,999 | 100 (17.7%) | 114 (26.1%) |
| $750,000 to $999,999 | 10 (1.8%) | 0 (0.0%) |
| $1,000,000 or more | 118 (20.9%) | 141 (32.3%) |
| Total | 565 (100.0%) | 437 (100.0%) |
Household Income by Mortgage Status in Bay Harbor Islands
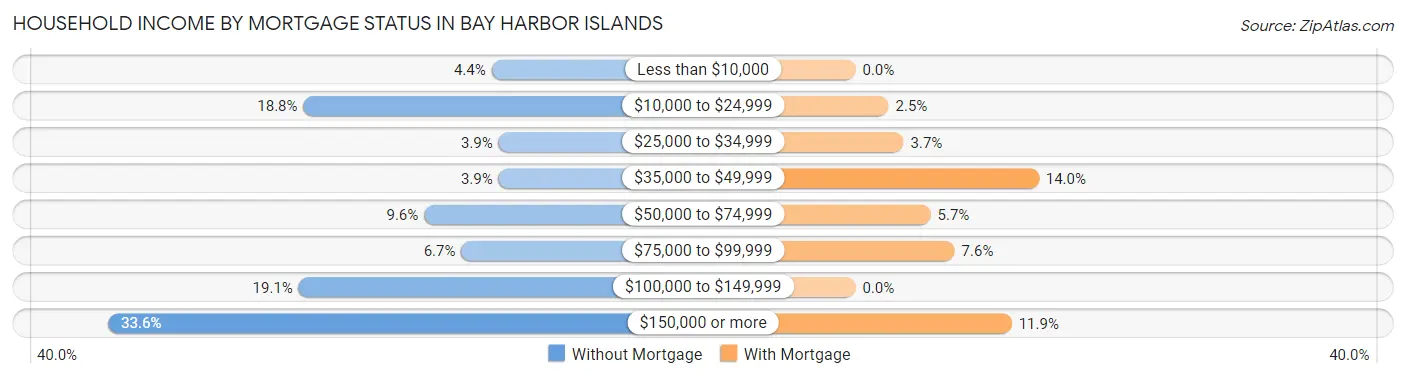
| Household Income | Without Mortgage | With Mortgage |
| Less than $10,000 | 25 (4.4%) | 0 (0.0%) |
| $10,000 to $24,999 | 106 (18.8%) | 11 (2.5%) |
| $25,000 to $34,999 | 22 (3.9%) | 16 (3.7%) |
| $35,000 to $49,999 | 22 (3.9%) | 61 (14.0%) |
| $50,000 to $74,999 | 54 (9.6%) | 25 (5.7%) |
| $75,000 to $99,999 | 38 (6.7%) | 33 (7.5%) |
| $100,000 to $149,999 | 108 (19.1%) | 0 (0.0%) |
| $150,000 or more | 190 (33.6%) | 52 (11.9%) |
| Total | 565 (100.0%) | 437 (100.0%) |
Property Value to Household Income Ratio in Bay Harbor Islands
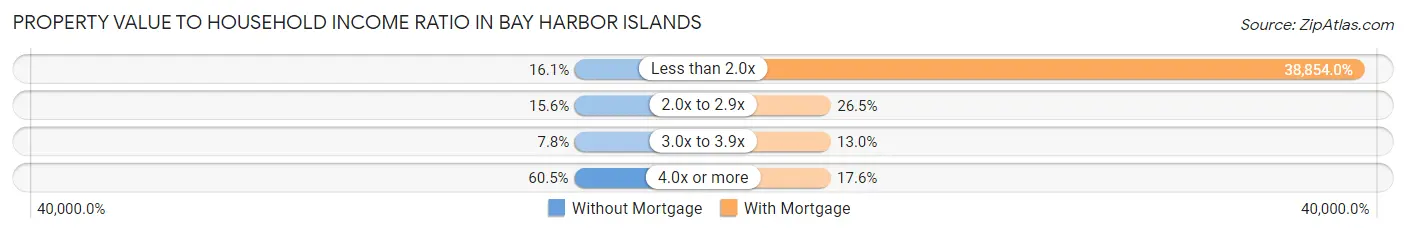
| Value-to-Income Ratio | Without Mortgage | With Mortgage |
| Less than 2.0x | 91 (16.1%) | 169,792 (38,854.0%) |
| 2.0x to 2.9x | 88 (15.6%) | 116 (26.5%) |
| 3.0x to 3.9x | 44 (7.8%) | 57 (13.0%) |
| 4.0x or more | 342 (60.5%) | 77 (17.6%) |
| Total | 565 (100.0%) | 437 (100.0%) |
Real Estate Taxes by Mortgage Status in Bay Harbor Islands
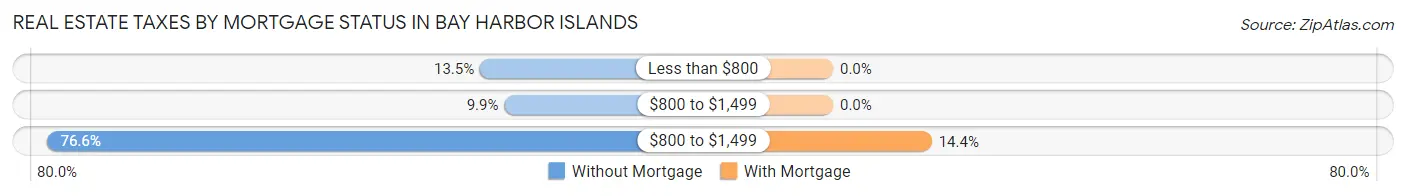
| Property Taxes | Without Mortgage | With Mortgage |
| Less than $800 | 76 (13.5%) | 0 (0.0%) |
| $800 to $1,499 | 56 (9.9%) | 0 (0.0%) |
| $800 to $1,499 | 433 (76.6%) | 63 (14.4%) |
| Total | 565 (100.0%) | 437 (100.0%) |
Health & Disability in Bay Harbor Islands
Health Insurance Coverage by Age in Bay Harbor Islands
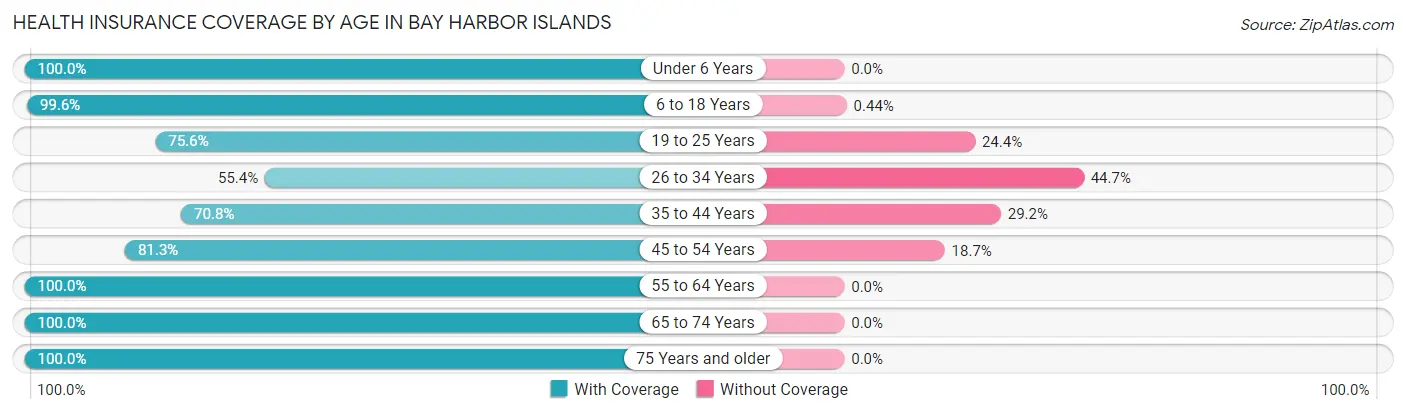
| Age Bracket | With Coverage | Without Coverage |
| Under 6 Years | 374 (100.0%) | 0 (0.0%) |
| 6 to 18 Years | 1,348 (99.6%) | 6 (0.4%) |
| 19 to 25 Years | 512 (75.6%) | 165 (24.4%) |
| 26 to 34 Years | 150 (55.3%) | 121 (44.7%) |
| 35 to 44 Years | 825 (70.8%) | 340 (29.2%) |
| 45 to 54 Years | 764 (81.3%) | 176 (18.7%) |
| 55 to 64 Years | 353 (100.0%) | 0 (0.0%) |
| 65 to 74 Years | 330 (100.0%) | 0 (0.0%) |
| 75 Years and older | 354 (100.0%) | 0 (0.0%) |
| Total | 5,010 (86.1%) | 808 (13.9%) |
Health Insurance Coverage by Citizenship Status in Bay Harbor Islands
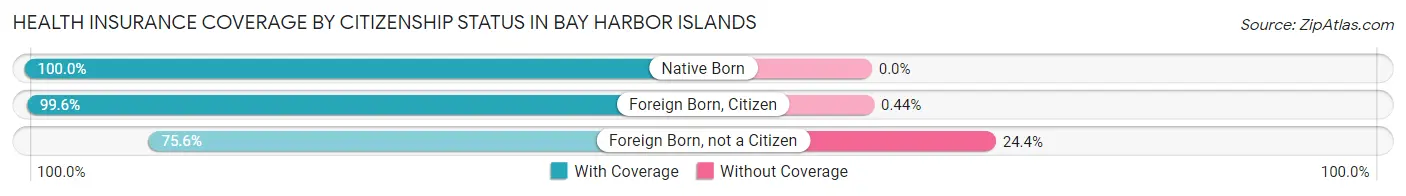
| Citizenship Status | With Coverage | Without Coverage |
| Native Born | 374 (100.0%) | 0 (0.0%) |
| Foreign Born, Citizen | 1,348 (99.6%) | 6 (0.4%) |
| Foreign Born, not a Citizen | 512 (75.6%) | 165 (24.4%) |
Health Insurance Coverage by Household Income in Bay Harbor Islands
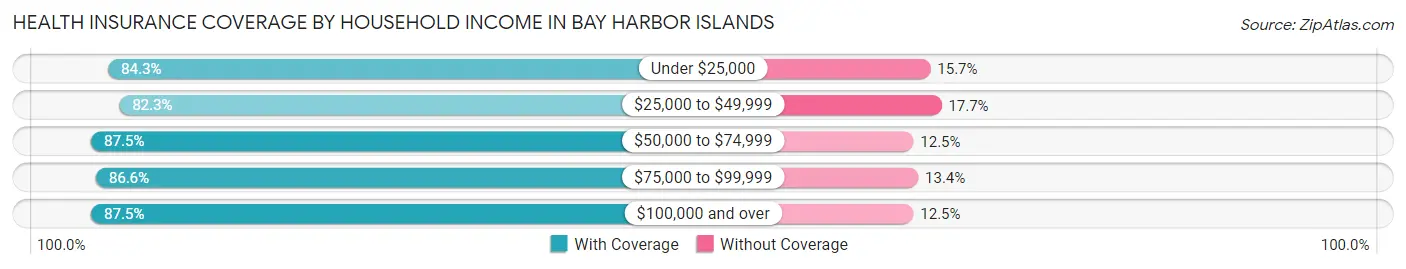
| Household Income | With Coverage | Without Coverage |
| Under $25,000 | 474 (84.3%) | 88 (15.7%) |
| $25,000 to $49,999 | 970 (82.3%) | 209 (17.7%) |
| $50,000 to $74,999 | 955 (87.5%) | 136 (12.5%) |
| $75,000 to $99,999 | 253 (86.6%) | 39 (13.4%) |
| $100,000 and over | 2,358 (87.5%) | 336 (12.5%) |
Public vs Private Health Insurance Coverage by Age in Bay Harbor Islands
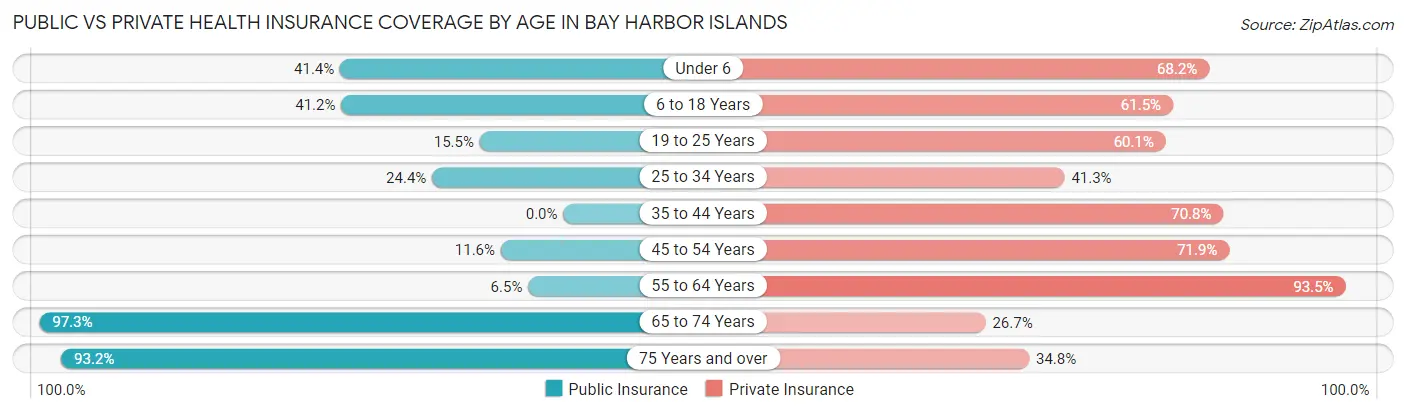
| Age Bracket | Public Insurance | Private Insurance |
| Under 6 | 155 (41.4%) | 255 (68.2%) |
| 6 to 18 Years | 558 (41.2%) | 832 (61.5%) |
| 19 to 25 Years | 105 (15.5%) | 407 (60.1%) |
| 25 to 34 Years | 66 (24.3%) | 112 (41.3%) |
| 35 to 44 Years | 0 (0.0%) | 825 (70.8%) |
| 45 to 54 Years | 109 (11.6%) | 676 (71.9%) |
| 55 to 64 Years | 23 (6.5%) | 330 (93.5%) |
| 65 to 74 Years | 321 (97.3%) | 88 (26.7%) |
| 75 Years and over | 330 (93.2%) | 123 (34.7%) |
| Total | 1,667 (28.6%) | 3,648 (62.7%) |
Disability Status by Sex by Age in Bay Harbor Islands
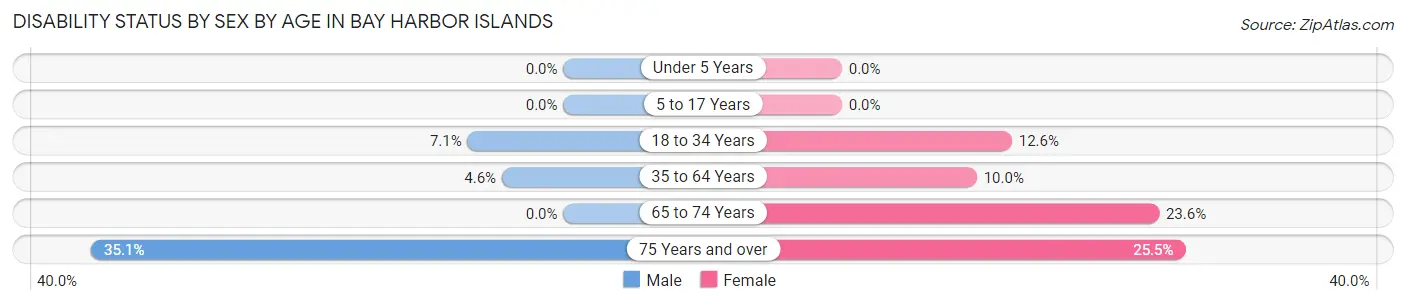
| Age Bracket | Male | Female |
| Under 5 Years | 0 (0.0%) | 0 (0.0%) |
| 5 to 17 Years | 0 (0.0%) | 0 (0.0%) |
| 18 to 34 Years | 15 (7.1%) | 93 (12.6%) |
| 35 to 64 Years | 52 (4.6%) | 132 (10.0%) |
| 65 to 74 Years | 0 (0.0%) | 57 (23.5%) |
| 75 Years and over | 54 (35.1%) | 51 (25.5%) |
Disability Class by Sex by Age in Bay Harbor Islands
Disability Class: Hearing Difficulty
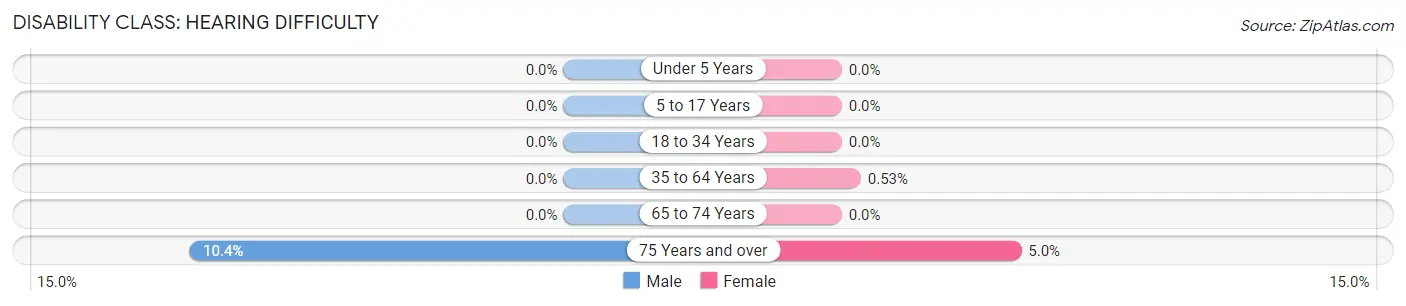
| Age Bracket | Male | Female |
| Under 5 Years | 0 (0.0%) | 0 (0.0%) |
| 5 to 17 Years | 0 (0.0%) | 0 (0.0%) |
| 18 to 34 Years | 0 (0.0%) | 0 (0.0%) |
| 35 to 64 Years | 0 (0.0%) | 7 (0.5%) |
| 65 to 74 Years | 0 (0.0%) | 0 (0.0%) |
| 75 Years and over | 16 (10.4%) | 10 (5.0%) |
Disability Class: Vision Difficulty
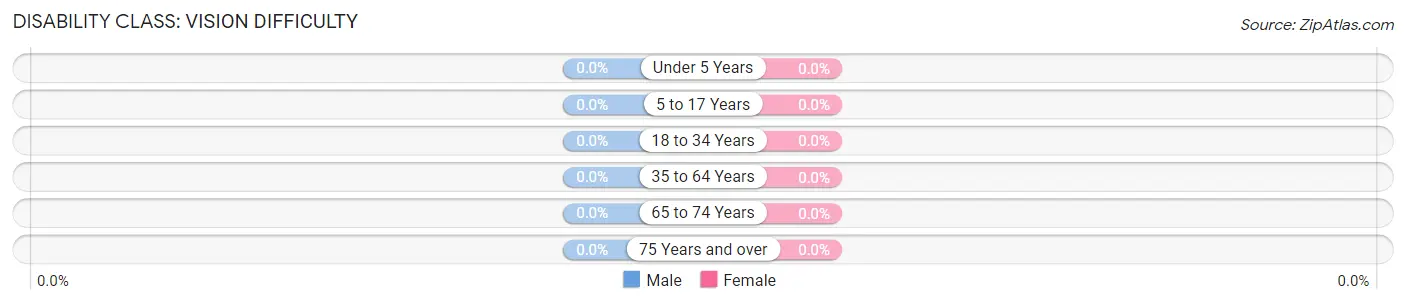
| Age Bracket | Male | Female |
| Under 5 Years | 0 (0.0%) | 0 (0.0%) |
| 5 to 17 Years | 0 (0.0%) | 0 (0.0%) |
| 18 to 34 Years | 0 (0.0%) | 0 (0.0%) |
| 35 to 64 Years | 0 (0.0%) | 0 (0.0%) |
| 65 to 74 Years | 0 (0.0%) | 0 (0.0%) |
| 75 Years and over | 0 (0.0%) | 0 (0.0%) |
Disability Class: Cognitive Difficulty
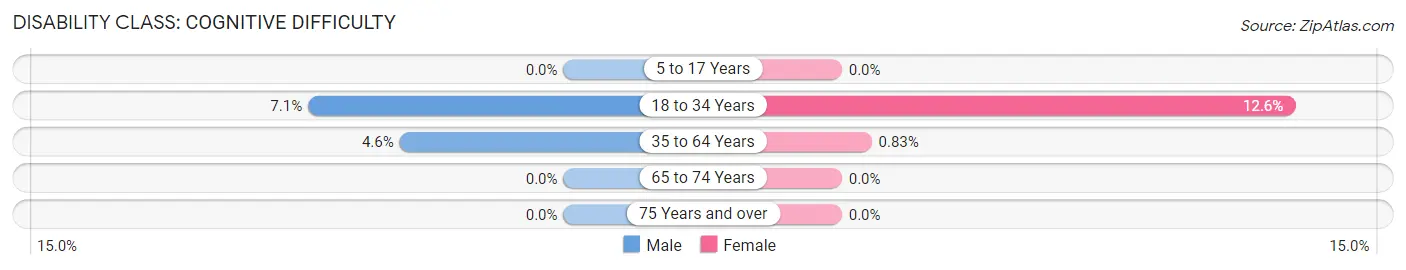
| Age Bracket | Male | Female |
| 5 to 17 Years | 0 (0.0%) | 0 (0.0%) |
| 18 to 34 Years | 15 (7.1%) | 93 (12.6%) |
| 35 to 64 Years | 52 (4.6%) | 11 (0.8%) |
| 65 to 74 Years | 0 (0.0%) | 0 (0.0%) |
| 75 Years and over | 0 (0.0%) | 0 (0.0%) |
Disability Class: Ambulatory Difficulty
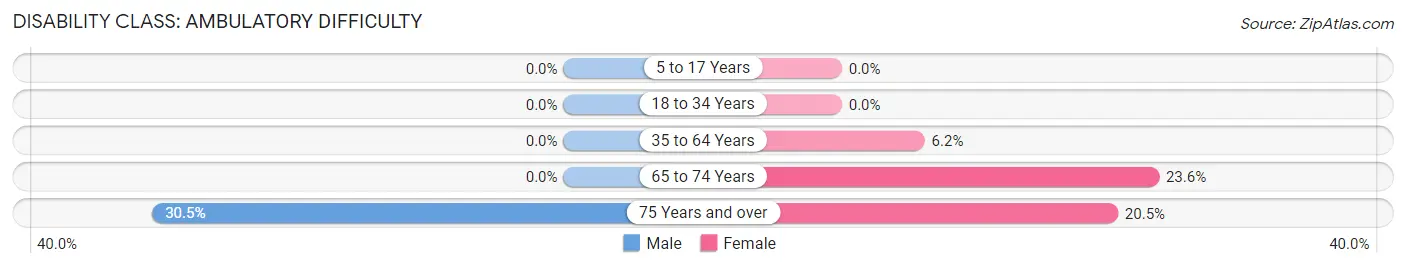
| Age Bracket | Male | Female |
| 5 to 17 Years | 0 (0.0%) | 0 (0.0%) |
| 18 to 34 Years | 0 (0.0%) | 0 (0.0%) |
| 35 to 64 Years | 0 (0.0%) | 81 (6.1%) |
| 65 to 74 Years | 0 (0.0%) | 57 (23.5%) |
| 75 Years and over | 47 (30.5%) | 41 (20.5%) |
Disability Class: Self-Care Difficulty
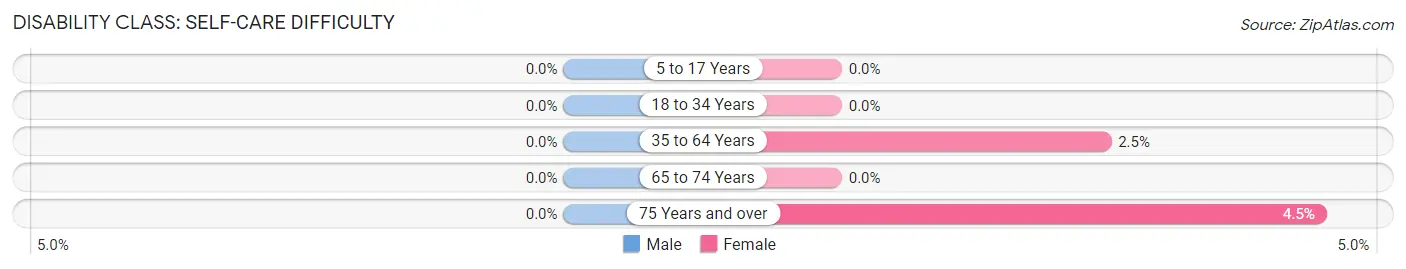
| Age Bracket | Male | Female |
| 5 to 17 Years | 0 (0.0%) | 0 (0.0%) |
| 18 to 34 Years | 0 (0.0%) | 0 (0.0%) |
| 35 to 64 Years | 0 (0.0%) | 33 (2.5%) |
| 65 to 74 Years | 0 (0.0%) | 0 (0.0%) |
| 75 Years and over | 0 (0.0%) | 9 (4.5%) |
Technology Access in Bay Harbor Islands
Computing Device Access in Bay Harbor Islands
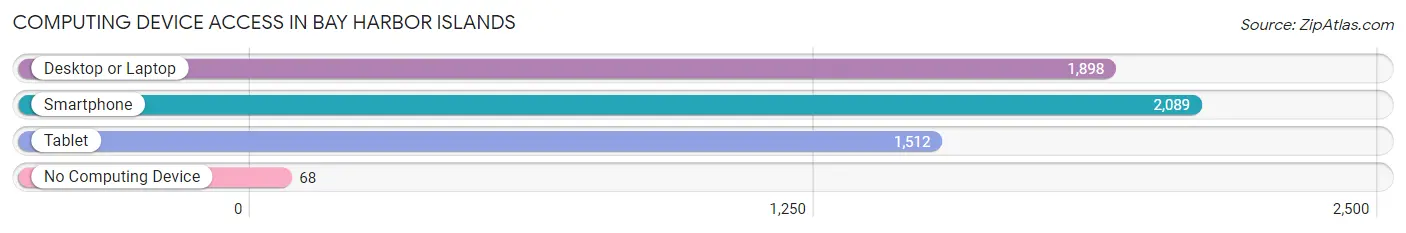
| Device Type | # Households | % Households |
| Desktop or Laptop | 1,898 | 86.0% |
| Smartphone | 2,089 | 94.6% |
| Tablet | 1,512 | 68.5% |
| No Computing Device | 68 | 3.1% |
| Total | 2,208 | 100.0% |
Internet Access in Bay Harbor Islands
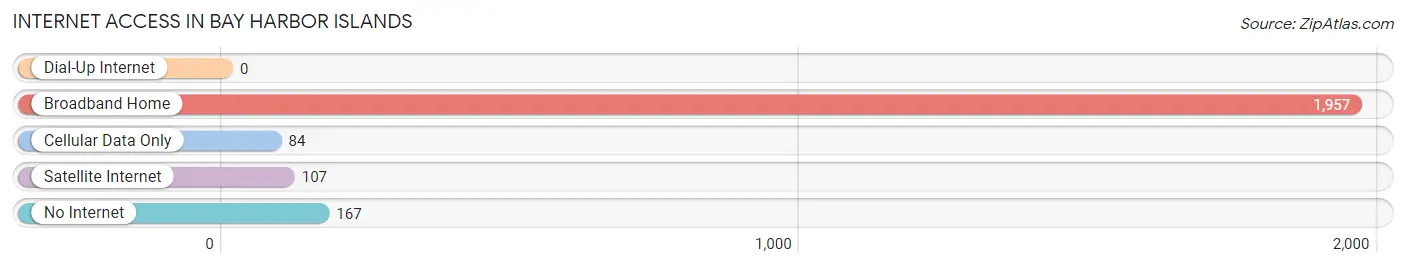
| Internet Type | # Households | % Households |
| Dial-Up Internet | 0 | 0.0% |
| Broadband Home | 1,957 | 88.6% |
| Cellular Data Only | 84 | 3.8% |
| Satellite Internet | 107 | 4.9% |
| No Internet | 167 | 7.6% |
| Total | 2,208 | 100.0% |
Bay Harbor Islands Summary
Bay Harbor Islands is a town located in Miami-Dade County, Florida, United States. It is located on a barrier island between the Atlantic Ocean and Biscayne Bay, just north of the city of Miami Beach. The town is made up of two islands, the larger one being called Harbor Island and the smaller one being called Treasure Island. The town was incorporated in 1947 and has a population of approximately 5,000 people.
Geography
Bay Harbor Islands is located on a barrier island between the Atlantic Ocean and Biscayne Bay. The town is made up of two islands, the larger one being called Harbor Island and the smaller one being called Treasure Island. The town is located just north of the city of Miami Beach and is bordered by the cities of North Miami Beach and Surfside. The town is approximately 1.5 miles long and 0.5 miles wide.
The town is located in a tropical climate and experiences hot and humid summers and mild winters. The average temperature in the summer is around 85 degrees Fahrenheit and the average temperature in the winter is around 70 degrees Fahrenheit. The town receives an average of 60 inches of rain per year.
Economy
The economy of Bay Harbor Islands is largely based on tourism and real estate. The town is home to many luxury hotels, resorts, and condominiums, which attract visitors from all over the world. The town also has a large number of restaurants, bars, and shops, which cater to both tourists and locals.
The town is also home to a number of financial institutions, including banks, investment firms, and insurance companies. The town is also home to a number of medical facilities, including hospitals, clinics, and medical offices.
Demographics
As of the 2010 census, the population of Bay Harbor Islands was 5,628. The population is made up of a diverse mix of people from all over the world. The town has a large Jewish population, with approximately 40% of the population identifying as Jewish. The town also has a large Hispanic population, with approximately 30% of the population identifying as Hispanic.
The median household income in Bay Harbor Islands is $68,845, which is higher than the national average. The median home value in the town is $541,000, which is also higher than the national average.
Conclusion
Bay Harbor Islands is a small town located in Miami-Dade County, Florida, United States. The town is made up of two islands, the larger one being called Harbor Island and the smaller one being called Treasure Island. The town has a population of approximately 5,000 people and is largely based on tourism and real estate. The town has a diverse population, with a large Jewish and Hispanic population. The town has a median household income of $68,845 and a median home value of $541,000.
Common Questions
What is Per Capita Income in Bay Harbor Islands?
Per Capita income in Bay Harbor Islands is $52,686.
What is the Median Family Income in Bay Harbor Islands?
Median Family Income in Bay Harbor Islands is $69,485.
What is the Median Household income in Bay Harbor Islands?
Median Household Income in Bay Harbor Islands is $73,587.
What is Income or Wage Gap in Bay Harbor Islands?
Income or Wage Gap in Bay Harbor Islands is 50.8%.
Women in Bay Harbor Islands earn 49.2 cents for every dollar earned by a man.
What is Inequality or Gini Index in Bay Harbor Islands?
Inequality or Gini Index in Bay Harbor Islands is 0.55.
What is the Total Population of Bay Harbor Islands?
Total Population of Bay Harbor Islands is 5,843.
What is the Total Male Population of Bay Harbor Islands?
Total Male Population of Bay Harbor Islands is 2,358.
What is the Total Female Population of Bay Harbor Islands?
Total Female Population of Bay Harbor Islands is 3,485.
What is the Ratio of Males per 100 Females in Bay Harbor Islands?
There are 67.66 Males per 100 Females in Bay Harbor Islands.
What is the Ratio of Females per 100 Males in Bay Harbor Islands?
There are 147.79 Females per 100 Males in Bay Harbor Islands.
What is the Median Population Age in Bay Harbor Islands?
Median Population Age in Bay Harbor Islands is 35.9 Years.
What is the Average Family Size in Bay Harbor Islands
Average Family Size in Bay Harbor Islands is 3.4 People.
What is the Average Household Size in Bay Harbor Islands
Average Household Size in Bay Harbor Islands is 2.6 People.
How Large is the Labor Force in Bay Harbor Islands?
There are 3,034 People in the Labor Forcein in Bay Harbor Islands.
What is the Percentage of People in the Labor Force in Bay Harbor Islands?
72.6% of People are in the Labor Force in Bay Harbor Islands.
What is the Unemployment Rate in Bay Harbor Islands?
Unemployment Rate in Bay Harbor Islands is 3.4%.