Country Walk, FL Map & Demographics
Country Walk Map
Country Walk Overview
$40,543
PER CAPITA INCOME
$116,360
AVG FAMILY INCOME
$106,510
AVG HOUSEHOLD INCOME
21.1%
WAGE / INCOME GAP [ % ]
78.9¢/ $1
WAGE / INCOME GAP [ $ ]
0.38
INEQUALITY / GINI INDEX
18,719
TOTAL POPULATION
9,635
MALE POPULATION
9,084
FEMALE POPULATION
106.07
MALES / 100 FEMALES
94.28
FEMALES / 100 MALES
38.0
MEDIAN AGE
3.6
AVG FAMILY SIZE
3.4
AVG HOUSEHOLD SIZE
9,796
LABOR FORCE [ PEOPLE ]
66.8%
PERCENT IN LABOR FORCE
3.4%
UNEMPLOYMENT RATE
Income in Country Walk
Income Overview in Country Walk
Per Capita Income in Country Walk is $40,543, while median incomes of families and households are $116,360 and $106,510 respectively.
| Characteristic | Number | Measure |
| Per Capita Income | 18,719 | $40,543 |
| Median Family Income | 4,801 | $116,360 |
| Mean Family Income | 4,801 | $136,644 |
| Median Household Income | 5,475 | $106,510 |
| Mean Household Income | 5,475 | $133,601 |
| Income Deficit | 4,801 | $0 |
| Wage / Income Gap (%) | 18,719 | 21.09% |
| Wage / Income Gap ($) | 18,719 | 78.91¢ per $1 |
| Gini / Inequality Index | 18,719 | 0.38 |
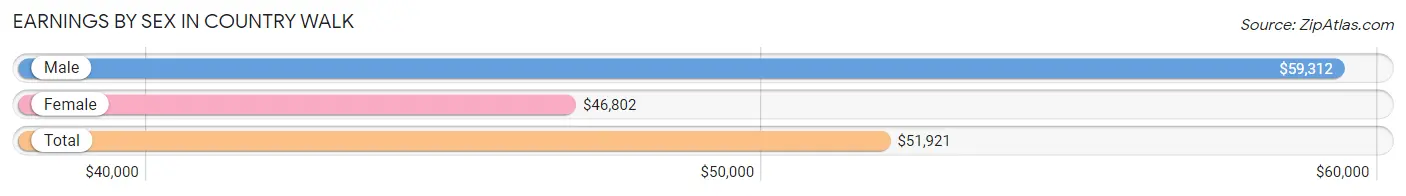
Earnings by Sex in Country Walk
Average Earnings in Country Walk are $51,921, $59,312 for men and $46,802 for women, a difference of 21.1%.
| Sex | Number | Average Earnings |
| Male | 5,760 (55.8%) | $59,312 |
| Female | 4,558 (44.2%) | $46,802 |
| Total | 10,318 (100.0%) | $51,921 |
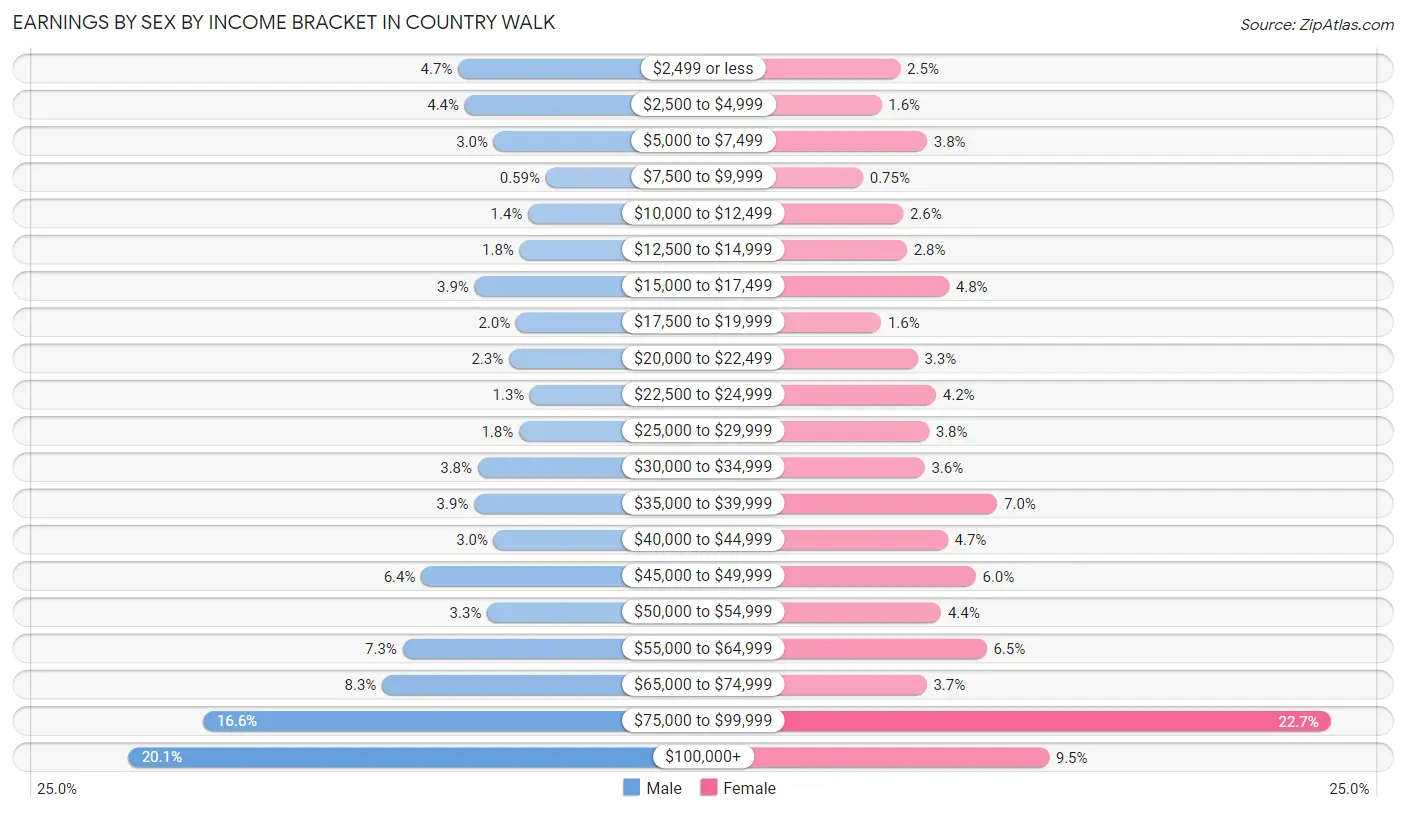
Earnings by Sex by Income Bracket in Country Walk
The most common earnings brackets in Country Walk are $100,000+ for men (1,159 | 20.1%) and $75,000 to $99,999 for women (1,033 | 22.7%).
| Income | Male | Female |
| $2,499 or less | 270 (4.7%) | 114 (2.5%) |
| $2,500 to $4,999 | 252 (4.4%) | 74 (1.6%) |
| $5,000 to $7,499 | 174 (3.0%) | 171 (3.7%) |
| $7,500 to $9,999 | 34 (0.6%) | 34 (0.7%) |
| $10,000 to $12,499 | 81 (1.4%) | 120 (2.6%) |
| $12,500 to $14,999 | 104 (1.8%) | 128 (2.8%) |
| $15,000 to $17,499 | 226 (3.9%) | 218 (4.8%) |
| $17,500 to $19,999 | 114 (2.0%) | 73 (1.6%) |
| $20,000 to $22,499 | 133 (2.3%) | 151 (3.3%) |
| $22,500 to $24,999 | 76 (1.3%) | 190 (4.2%) |
| $25,000 to $29,999 | 106 (1.8%) | 175 (3.8%) |
| $30,000 to $34,999 | 217 (3.8%) | 166 (3.6%) |
| $35,000 to $39,999 | 227 (3.9%) | 321 (7.0%) |
| $40,000 to $44,999 | 174 (3.0%) | 215 (4.7%) |
| $45,000 to $49,999 | 370 (6.4%) | 275 (6.0%) |
| $50,000 to $54,999 | 192 (3.3%) | 201 (4.4%) |
| $55,000 to $64,999 | 420 (7.3%) | 298 (6.5%) |
| $65,000 to $74,999 | 475 (8.3%) | 170 (3.7%) |
| $75,000 to $99,999 | 956 (16.6%) | 1,033 (22.7%) |
| $100,000+ | 1,159 (20.1%) | 431 (9.5%) |
| Total | 5,760 (100.0%) | 4,558 (100.0%) |
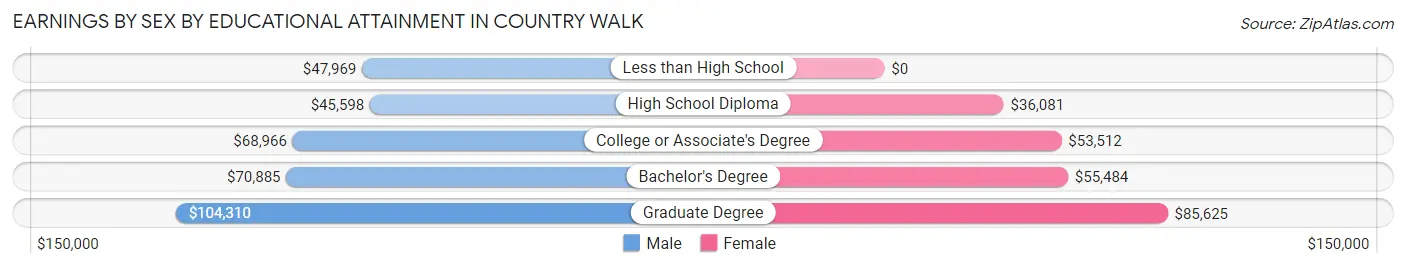
Earnings by Sex by Educational Attainment in Country Walk
Average earnings in Country Walk are $64,670 for men and $52,161 for women, a difference of 19.3%. Men with an educational attainment of graduate degree enjoy the highest average annual earnings of $104,310, while those with high school diploma education earn the least with $45,598. Women with an educational attainment of graduate degree earn the most with the average annual earnings of $85,625, while those with high school diploma education have the smallest earnings of $36,081.
| Educational Attainment | Male Income | Female Income |
| Less than High School | $47,969 | $0 |
| High School Diploma | $45,598 | $36,081 |
| College or Associate's Degree | $68,966 | $53,512 |
| Bachelor's Degree | $70,885 | $55,484 |
| Graduate Degree | $104,310 | $85,625 |
| Total | $64,670 | $52,161 |
Family Income in Country Walk
Family Income Brackets in Country Walk
According to the Country Walk family income data, there are 1,176 families falling into the $100,000 to $149,999 income range, which is the most common income bracket and makes up 24.5% of all families.
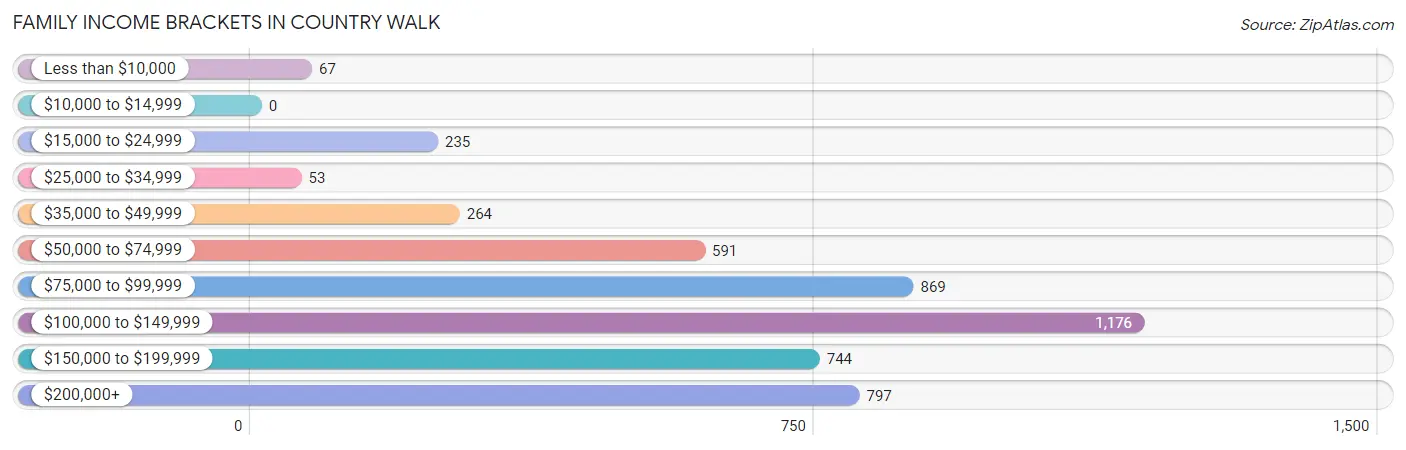
| Income Bracket | # Families | % Families |
| Less than $10,000 | 67 | 1.4% |
| $10,000 to $14,999 | 0 | 0.0% |
| $15,000 to $24,999 | 235 | 4.9% |
| $25,000 to $34,999 | 53 | 1.1% |
| $35,000 to $49,999 | 264 | 5.5% |
| $50,000 to $74,999 | 591 | 12.3% |
| $75,000 to $99,999 | 869 | 18.1% |
| $100,000 to $149,999 | 1,176 | 24.5% |
| $150,000 to $199,999 | 744 | 15.5% |
| $200,000+ | 797 | 16.6% |
Family Income by Famaliy Size in Country Walk
5-person families (353 | 7.3%) account for the highest median family income in Country Walk with $142,569 per family, while 3-person families (1,409 | 29.3%) have the highest median income of $45,603 per family member.
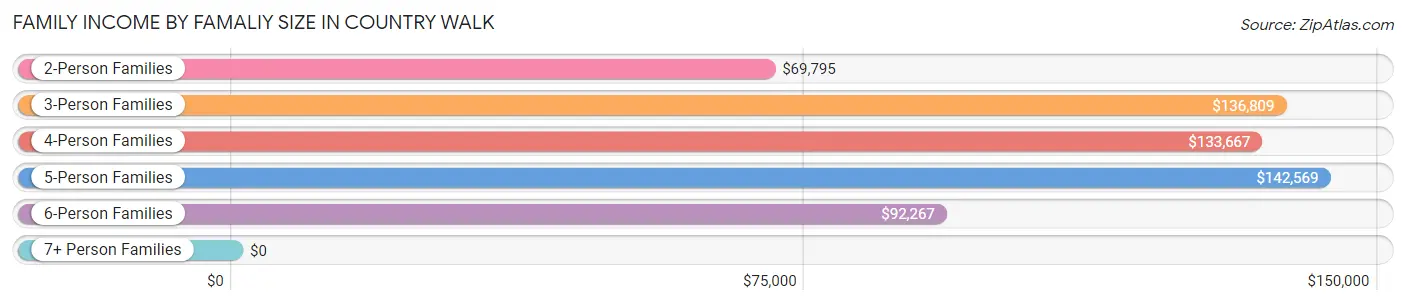
| Income Bracket | # Families | Median Income |
| 2-Person Families | 1,417 (29.5%) | $69,795 |
| 3-Person Families | 1,409 (29.3%) | $136,809 |
| 4-Person Families | 1,350 (28.1%) | $133,667 |
| 5-Person Families | 353 (7.3%) | $142,569 |
| 6-Person Families | 191 (4.0%) | $92,267 |
| 7+ Person Families | 81 (1.7%) | $0 |
| Total | 4,801 (100.0%) | $116,360 |
Family Income by Number of Earners in Country Walk
The median family income in Country Walk is $116,360, with families comprising 3+ earners (988) having the highest median family income of $165,153, while families with no earners (242) have the lowest median family income of $49,737, accounting for 20.6% and 5.0% of families, respectively.
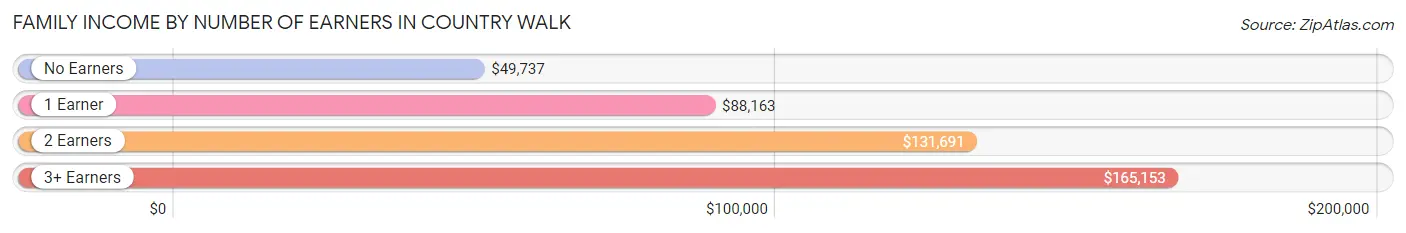
| Number of Earners | # Families | Median Income |
| No Earners | 242 (5.0%) | $49,737 |
| 1 Earner | 1,570 (32.7%) | $88,163 |
| 2 Earners | 2,001 (41.7%) | $131,691 |
| 3+ Earners | 988 (20.6%) | $165,153 |
| Total | 4,801 (100.0%) | $116,360 |
Household Income in Country Walk
Household Income Brackets in Country Walk
With 1,396 households falling in the category, the $100,000 to $149,999 income range is the most frequent in Country Walk, accounting for 25.5% of all households. In contrast, only 38 households (0.7%) fall into the $10,000 to $14,999 income bracket, making it the least populous group.
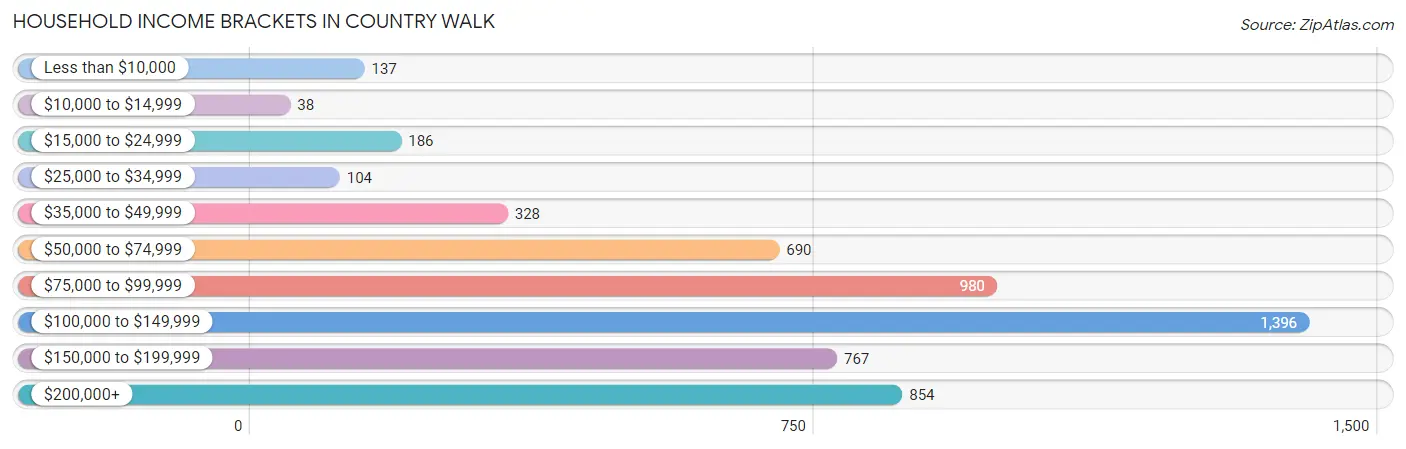
| Income Bracket | # Households | % Households |
| Less than $10,000 | 137 | 2.5% |
| $10,000 to $14,999 | 38 | 0.7% |
| $15,000 to $24,999 | 186 | 3.4% |
| $25,000 to $34,999 | 104 | 1.9% |
| $35,000 to $49,999 | 328 | 6.0% |
| $50,000 to $74,999 | 690 | 12.6% |
| $75,000 to $99,999 | 980 | 17.9% |
| $100,000 to $149,999 | 1,396 | 25.5% |
| $150,000 to $199,999 | 767 | 14.0% |
| $200,000+ | 854 | 15.6% |
Household Income by Householder Age in Country Walk
The median household income in Country Walk is $106,510, with the highest median household income of $124,375 found in the 45 to 64 years age bracket for the primary householder. A total of 2,722 households (49.7%) fall into this category. Meanwhile, the 15 to 24 years age bracket for the primary householder has the lowest median household income of $0, with 11 households (0.2%) in this group.
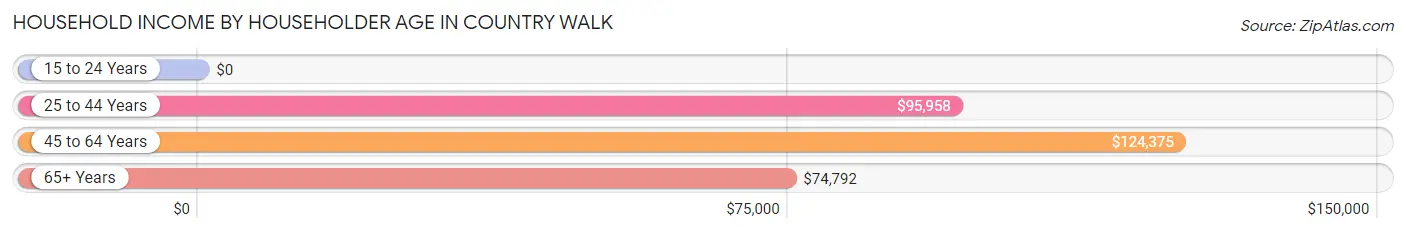
| Income Bracket | # Households | Median Income |
| 15 to 24 Years | 11 (0.2%) | $0 |
| 25 to 44 Years | 1,923 (35.1%) | $95,958 |
| 45 to 64 Years | 2,722 (49.7%) | $124,375 |
| 65+ Years | 819 (15.0%) | $74,792 |
| Total | 5,475 (100.0%) | $106,510 |
Poverty in Country Walk
Income Below Poverty by Sex and Age in Country Walk
With 4.4% poverty level for males and 8.2% for females among the residents of Country Walk, 75 year old and over males and 75 year old and over females are the most vulnerable to poverty, with 59 males (24.0%) and 160 females (26.5%) in their respective age groups living below the poverty level.
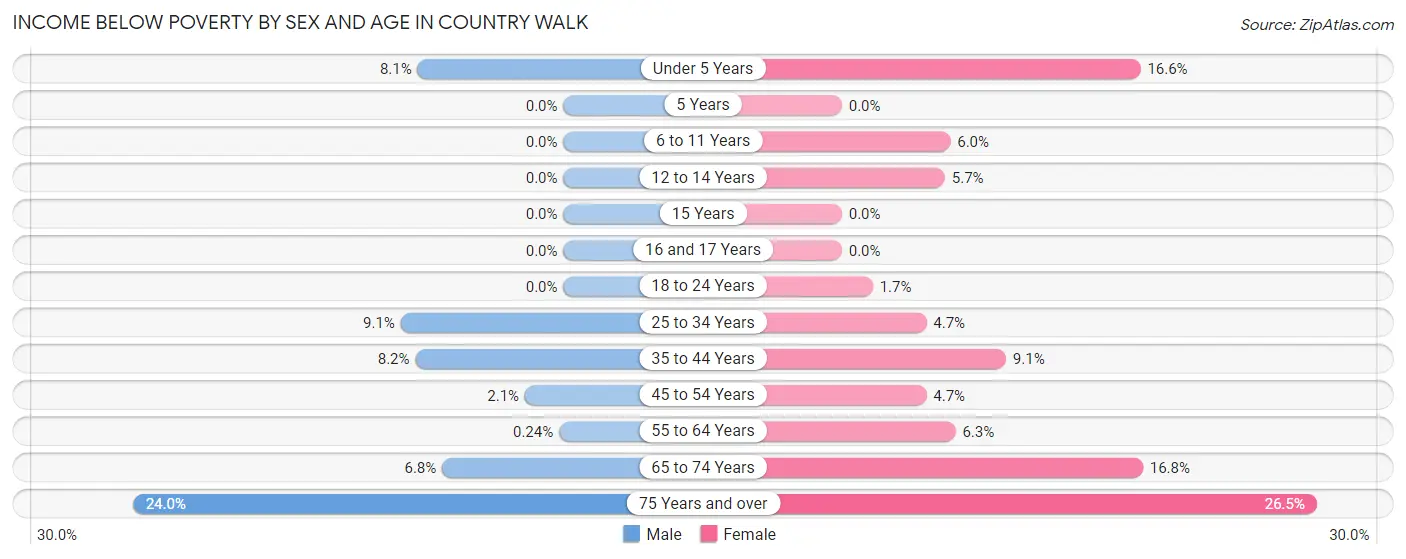
| Age Bracket | Male | Female |
| Under 5 Years | 51 (8.1%) | 72 (16.6%) |
| 5 Years | 0 (0.0%) | 0 (0.0%) |
| 6 to 11 Years | 0 (0.0%) | 57 (6.0%) |
| 12 to 14 Years | 0 (0.0%) | 21 (5.7%) |
| 15 Years | 0 (0.0%) | 0 (0.0%) |
| 16 and 17 Years | 0 (0.0%) | 0 (0.0%) |
| 18 to 24 Years | 0 (0.0%) | 12 (1.7%) |
| 25 to 34 Years | 124 (9.1%) | 48 (4.7%) |
| 35 to 44 Years | 123 (8.2%) | 110 (9.1%) |
| 45 to 54 Years | 31 (2.1%) | 70 (4.7%) |
| 55 to 64 Years | 3 (0.2%) | 77 (6.3%) |
| 65 to 74 Years | 32 (6.8%) | 114 (16.8%) |
| 75 Years and over | 59 (24.0%) | 160 (26.5%) |
| Total | 423 (4.4%) | 741 (8.2%) |
Income Above Poverty by Sex and Age in Country Walk
According to the poverty statistics in Country Walk, males aged 5 years and females aged 5 years are the age groups that are most secure financially, with 100.0% of males and 100.0% of females in these age groups living above the poverty line.
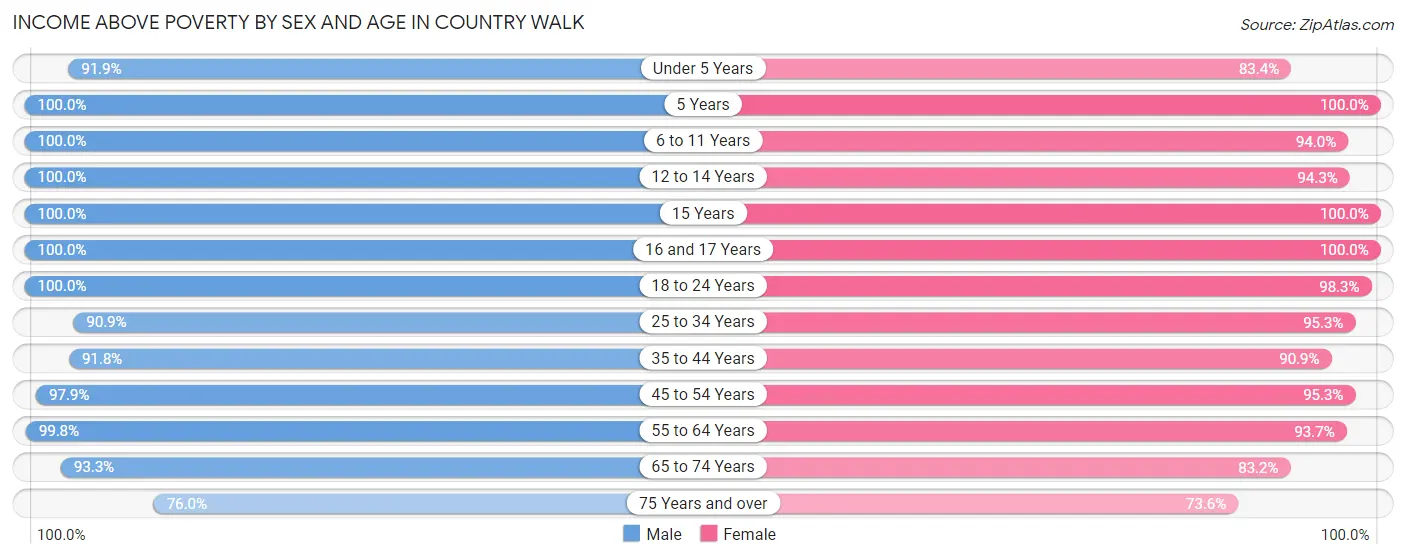
| Age Bracket | Male | Female |
| Under 5 Years | 577 (91.9%) | 361 (83.4%) |
| 5 Years | 115 (100.0%) | 83 (100.0%) |
| 6 to 11 Years | 1,066 (100.0%) | 886 (94.0%) |
| 12 to 14 Years | 270 (100.0%) | 345 (94.3%) |
| 15 Years | 107 (100.0%) | 43 (100.0%) |
| 16 and 17 Years | 273 (100.0%) | 307 (100.0%) |
| 18 to 24 Years | 885 (100.0%) | 685 (98.3%) |
| 25 to 34 Years | 1,245 (90.9%) | 972 (95.3%) |
| 35 to 44 Years | 1,370 (91.8%) | 1,094 (90.9%) |
| 45 to 54 Years | 1,418 (97.9%) | 1,416 (95.3%) |
| 55 to 64 Years | 1,257 (99.8%) | 1,139 (93.7%) |
| 65 to 74 Years | 442 (93.2%) | 566 (83.2%) |
| 75 Years and over | 187 (76.0%) | 445 (73.6%) |
| Total | 9,212 (95.6%) | 8,342 (91.8%) |
Income Below Poverty Among Married-Couple Families in Country Walk
The poverty statistics for married-couple families in Country Walk show that 4.0% or 139 of the total 3,459 families live below the poverty line. Families with no children have the highest poverty rate of 7.8%, comprising of 139 families. On the other hand, families with 1 or 2 children have the lowest poverty rate of 0.0%, which includes 0 families.
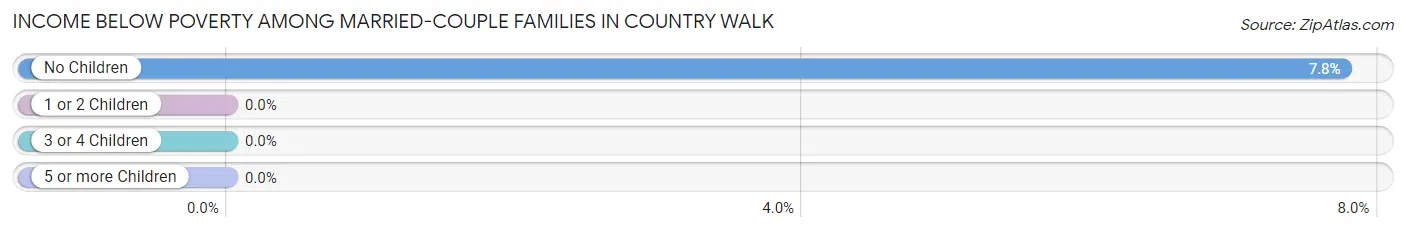
| Children | Above Poverty | Below Poverty |
| No Children | 1,652 (92.2%) | 139 (7.8%) |
| 1 or 2 Children | 1,448 (100.0%) | 0 (0.0%) |
| 3 or 4 Children | 176 (100.0%) | 0 (0.0%) |
| 5 or more Children | 44 (100.0%) | 0 (0.0%) |
| Total | 3,320 (96.0%) | 139 (4.0%) |
Income Below Poverty Among Single-Parent Households in Country Walk
According to the poverty data in Country Walk, 4.7% or 30 single-father households and 13.5% or 95 single-mother households are living below the poverty line. Among single-father households, those with 1 or 2 children have the highest poverty rate, with 30 households (6.4%) experiencing poverty. Likewise, among single-mother households, those with 1 or 2 children have the highest poverty rate, with 60 households (16.2%) falling below the poverty line.
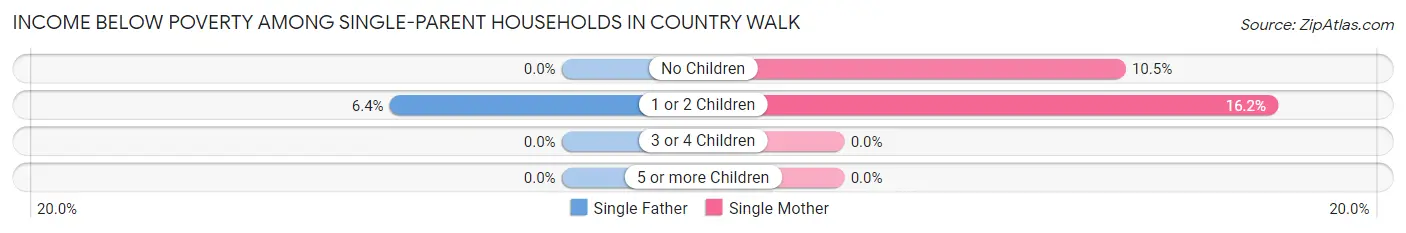
| Children | Single Father | Single Mother |
| No Children | 0 (0.0%) | 35 (10.5%) |
| 1 or 2 Children | 30 (6.4%) | 60 (16.2%) |
| 3 or 4 Children | 0 (0.0%) | 0 (0.0%) |
| 5 or more Children | 0 (0.0%) | 0 (0.0%) |
| Total | 30 (4.7%) | 95 (13.5%) |
Income Below Poverty Among Married-Couple vs Single-Parent Households in Country Walk
The poverty data for Country Walk shows that 139 of the married-couple family households (4.0%) and 125 of the single-parent households (9.3%) are living below the poverty level. Within the married-couple family households, those with no children have the highest poverty rate, with 139 households (7.8%) falling below the poverty line. Among the single-parent households, those with 1 or 2 children have the highest poverty rate, with 90 household (10.7%) living below poverty.
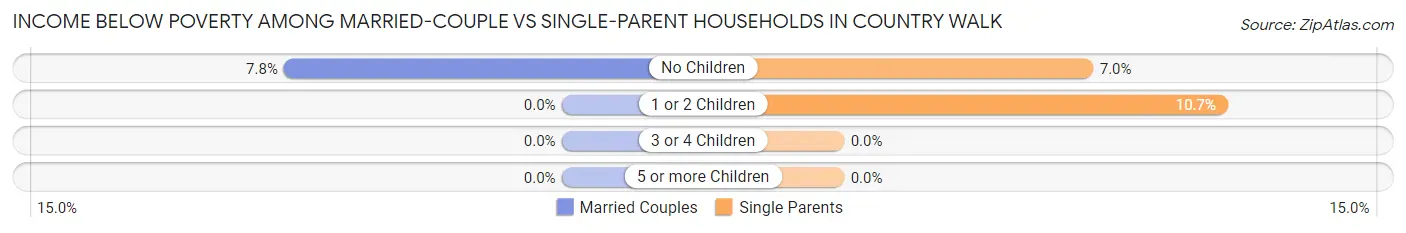
| Children | Married-Couple Families | Single-Parent Households |
| No Children | 139 (7.8%) | 35 (7.0%) |
| 1 or 2 Children | 0 (0.0%) | 90 (10.7%) |
| 3 or 4 Children | 0 (0.0%) | 0 (0.0%) |
| 5 or more Children | 0 (0.0%) | 0 (0.0%) |
| Total | 139 (4.0%) | 125 (9.3%) |
Race in Country Walk
The most populous races in Country Walk are Hispanic or Latino (14,189 | 75.8%), White / Caucasian (7,895 | 42.2%), and Two or more Races (6,444 | 34.4%).
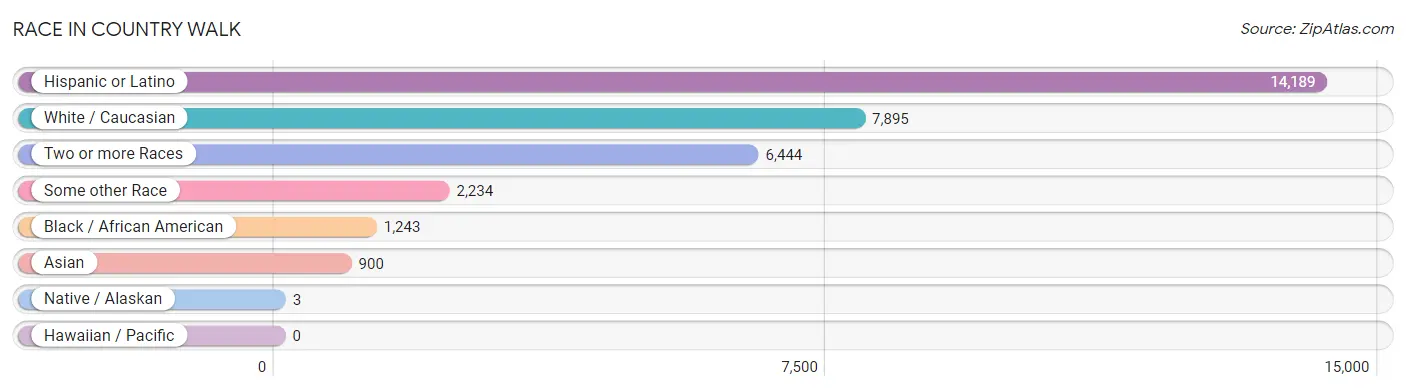
| Race | # Population | % Population |
| Asian | 900 | 4.8% |
| Black / African American | 1,243 | 6.6% |
| Hawaiian / Pacific | 0 | 0.0% |
| Hispanic or Latino | 14,189 | 75.8% |
| Native / Alaskan | 3 | 0.0% |
| White / Caucasian | 7,895 | 42.2% |
| Two or more Races | 6,444 | 34.4% |
| Some other Race | 2,234 | 11.9% |
| Total | 18,719 | 100.0% |
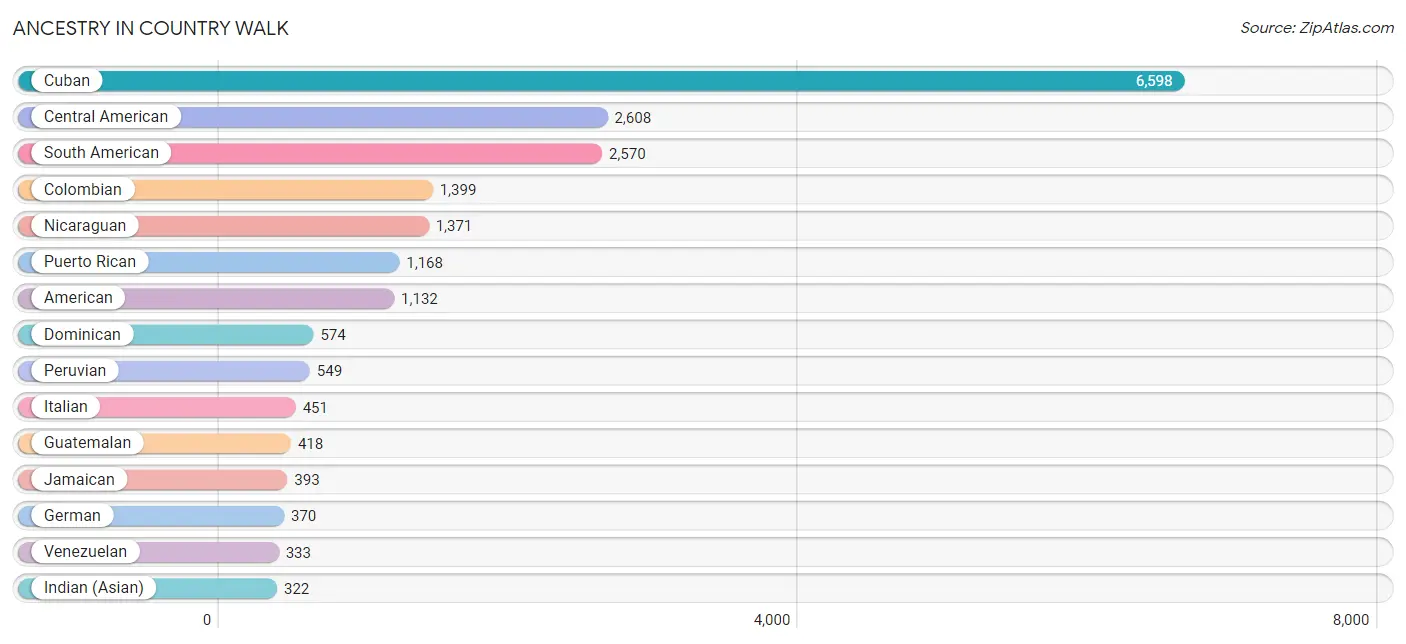
Ancestry in Country Walk
The most populous ancestries reported in Country Walk are Cuban (6,598 | 35.2%), Central American (2,608 | 13.9%), South American (2,570 | 13.7%), Colombian (1,399 | 7.5%), and Nicaraguan (1,371 | 7.3%), together accounting for 77.7% of all Country Walk residents.
| Ancestry | # Population | % Population |
| African | 109 | 0.6% |
| American | 1,132 | 6.0% |
| Arab | 64 | 0.3% |
| Argentinean | 127 | 0.7% |
| Bahamian | 25 | 0.1% |
| Bolivian | 15 | 0.1% |
| Brazilian | 109 | 0.6% |
| British | 38 | 0.2% |
| British West Indian | 25 | 0.1% |
| Central American | 2,608 | 13.9% |
| Chilean | 12 | 0.1% |
| Colombian | 1,399 | 7.5% |
| Costa Rican | 96 | 0.5% |
| Croatian | 30 | 0.2% |
| Cuban | 6,598 | 35.2% |
| Dominican | 574 | 3.1% |
| Ecuadorian | 128 | 0.7% |
| English | 133 | 0.7% |
| European | 16 | 0.1% |
| French | 143 | 0.8% |
| German | 370 | 2.0% |
| Guatemalan | 418 | 2.2% |
| Guyanese | 15 | 0.1% |
| Haitian | 268 | 1.4% |
| Honduran | 259 | 1.4% |
| Hungarian | 18 | 0.1% |
| Indian (Asian) | 322 | 1.7% |
| Irish | 180 | 1.0% |
| Italian | 451 | 2.4% |
| Jamaican | 393 | 2.1% |
| Korean | 64 | 0.3% |
| Lebanese | 36 | 0.2% |
| Mexican | 125 | 0.7% |
| Navajo | 3 | 0.0% |
| Nicaraguan | 1,371 | 7.3% |
| Norwegian | 24 | 0.1% |
| Pakistani | 315 | 1.7% |
| Palestinian | 24 | 0.1% |
| Panamanian | 169 | 0.9% |
| Peruvian | 549 | 2.9% |
| Polish | 71 | 0.4% |
| Portuguese | 36 | 0.2% |
| Puerto Rican | 1,168 | 6.2% |
| Romanian | 15 | 0.1% |
| Russian | 46 | 0.3% |
| Salvadoran | 295 | 1.6% |
| Scandinavian | 28 | 0.2% |
| Scottish | 132 | 0.7% |
| South American | 2,570 | 13.7% |
| Spaniard | 81 | 0.4% |
| Spanish | 15 | 0.1% |
| Sri Lankan | 189 | 1.0% |
| Subsaharan African | 130 | 0.7% |
| Swedish | 27 | 0.1% |
| Syrian | 4 | 0.0% |
| Thai | 243 | 1.3% |
| Trinidadian and Tobagonian | 25 | 0.1% |
| Uruguayan | 7 | 0.0% |
| Venezuelan | 333 | 1.8% |
| Welsh | 19 | 0.1% |
| West Indian | 70 | 0.4% | View All 61 Rows |
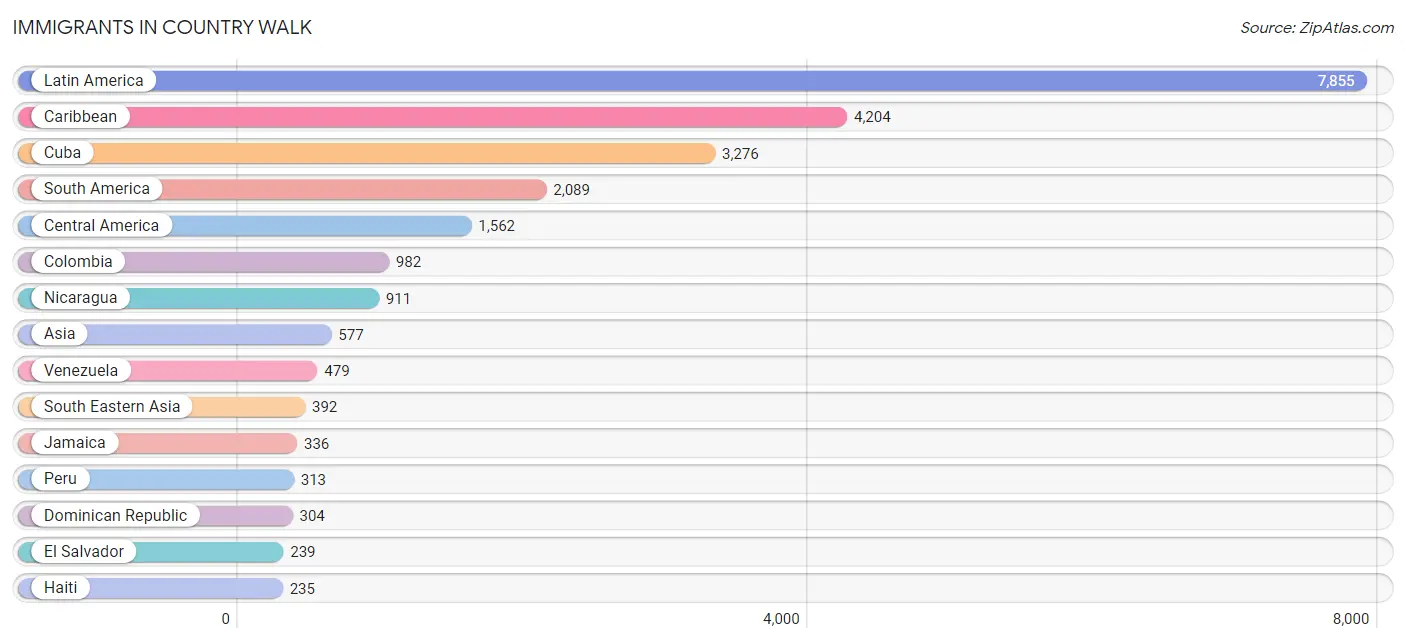
Immigrants in Country Walk
The most numerous immigrant groups reported in Country Walk came from Latin America (7,855 | 42.0%), Caribbean (4,204 | 22.5%), Cuba (3,276 | 17.5%), South America (2,089 | 11.2%), and Central America (1,562 | 8.3%), together accounting for 101.4% of all Country Walk residents.
| Immigration Origin | # Population | % Population |
| Africa | 128 | 0.7% |
| Argentina | 93 | 0.5% |
| Asia | 577 | 3.1% |
| Bahamas | 16 | 0.1% |
| Bolivia | 15 | 0.1% |
| Brazil | 94 | 0.5% |
| Cameroon | 69 | 0.4% |
| Canada | 67 | 0.4% |
| Caribbean | 4,204 | 22.5% |
| Central America | 1,562 | 8.3% |
| Chile | 12 | 0.1% |
| China | 47 | 0.3% |
| Colombia | 982 | 5.2% |
| Costa Rica | 26 | 0.1% |
| Cuba | 3,276 | 17.5% |
| Dominican Republic | 304 | 1.6% |
| Eastern Africa | 14 | 0.1% |
| Eastern Asia | 47 | 0.3% |
| Ecuador | 79 | 0.4% |
| El Salvador | 239 | 1.3% |
| Europe | 63 | 0.3% |
| Guatemala | 114 | 0.6% |
| Guyana | 15 | 0.1% |
| Haiti | 235 | 1.3% |
| Honduras | 180 | 1.0% |
| India | 18 | 0.1% |
| Jamaica | 336 | 1.8% |
| Kuwait | 8 | 0.0% |
| Latin America | 7,855 | 42.0% |
| Mexico | 51 | 0.3% |
| Middle Africa | 69 | 0.4% |
| Nicaragua | 911 | 4.9% |
| Northern Europe | 12 | 0.1% |
| Pakistan | 112 | 0.6% |
| Panama | 41 | 0.2% |
| Peru | 313 | 1.7% |
| Philippines | 131 | 0.7% |
| Scotland | 12 | 0.1% |
| South America | 2,089 | 11.2% |
| South Central Asia | 130 | 0.7% |
| South Eastern Asia | 392 | 2.1% |
| Southern Europe | 51 | 0.3% |
| Spain | 51 | 0.3% |
| St. Vincent and the Grenadines | 25 | 0.1% |
| Taiwan | 21 | 0.1% |
| Thailand | 72 | 0.4% |
| Trinidad and Tobago | 12 | 0.1% |
| Uruguay | 7 | 0.0% |
| Venezuela | 479 | 2.6% |
| Vietnam | 189 | 1.0% |
| Western Asia | 8 | 0.0% | View All 51 Rows |
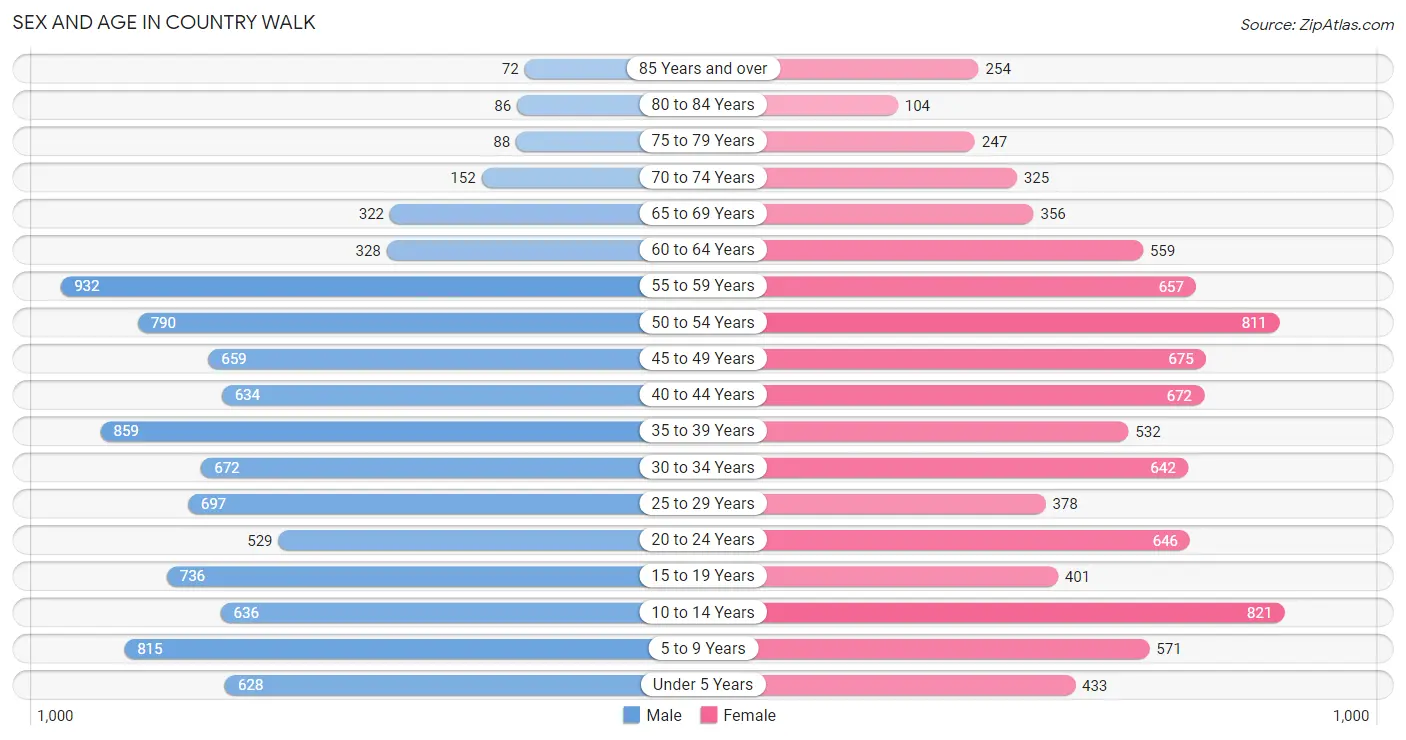
Sex and Age in Country Walk
Sex and Age in Country Walk
The most populous age groups in Country Walk are 55 to 59 Years (932 | 9.7%) for men and 10 to 14 Years (821 | 9.0%) for women.
| Age Bracket | Male | Female |
| Under 5 Years | 628 (6.5%) | 433 (4.8%) |
| 5 to 9 Years | 815 (8.5%) | 571 (6.3%) |
| 10 to 14 Years | 636 (6.6%) | 821 (9.0%) |
| 15 to 19 Years | 736 (7.6%) | 401 (4.4%) |
| 20 to 24 Years | 529 (5.5%) | 646 (7.1%) |
| 25 to 29 Years | 697 (7.2%) | 378 (4.2%) |
| 30 to 34 Years | 672 (7.0%) | 642 (7.1%) |
| 35 to 39 Years | 859 (8.9%) | 532 (5.9%) |
| 40 to 44 Years | 634 (6.6%) | 672 (7.4%) |
| 45 to 49 Years | 659 (6.8%) | 675 (7.4%) |
| 50 to 54 Years | 790 (8.2%) | 811 (8.9%) |
| 55 to 59 Years | 932 (9.7%) | 657 (7.2%) |
| 60 to 64 Years | 328 (3.4%) | 559 (6.1%) |
| 65 to 69 Years | 322 (3.3%) | 356 (3.9%) |
| 70 to 74 Years | 152 (1.6%) | 325 (3.6%) |
| 75 to 79 Years | 88 (0.9%) | 247 (2.7%) |
| 80 to 84 Years | 86 (0.9%) | 104 (1.1%) |
| 85 Years and over | 72 (0.7%) | 254 (2.8%) |
| Total | 9,635 (100.0%) | 9,084 (100.0%) |
Families and Households in Country Walk
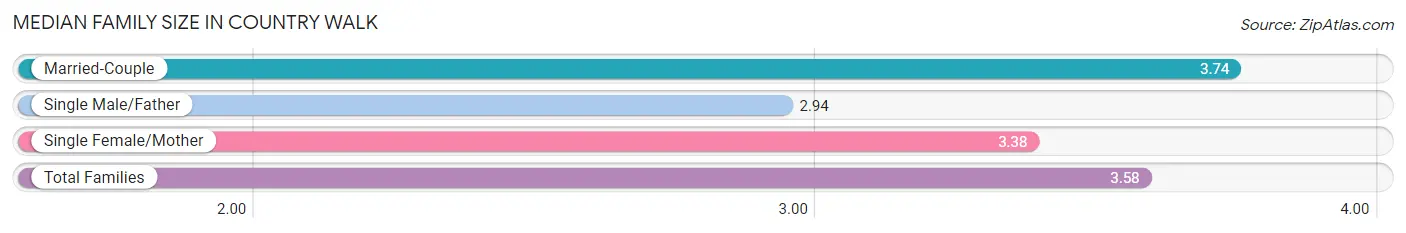
Median Family Size in Country Walk
The median family size in Country Walk is 3.58 persons per family, with married-couple families (3,459 | 72.1%) accounting for the largest median family size of 3.74 persons per family. On the other hand, single male/father families (637 | 13.3%) represent the smallest median family size with 2.94 persons per family.
| Family Type | # Families | Family Size |
| Married-Couple | 3,459 (72.1%) | 3.74 |
| Single Male/Father | 637 (13.3%) | 2.94 |
| Single Female/Mother | 705 (14.7%) | 3.38 |
| Total Families | 4,801 (100.0%) | 3.58 |
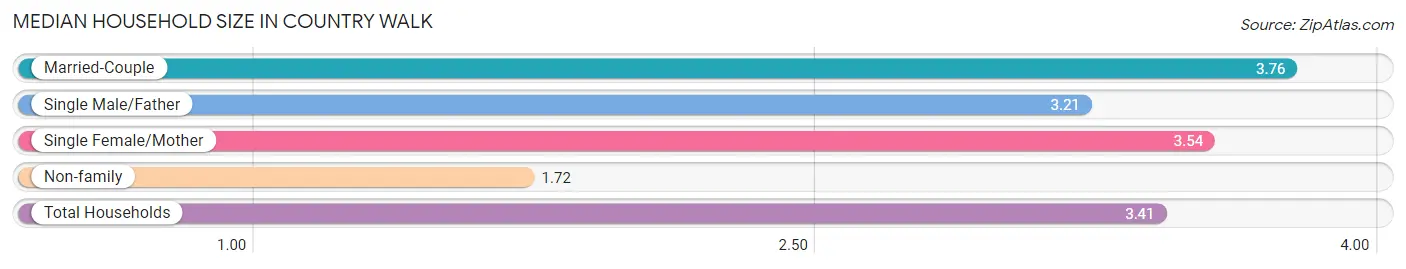
Median Household Size in Country Walk
The median household size in Country Walk is 3.41 persons per household, with married-couple households (3,459 | 63.2%) accounting for the largest median household size of 3.76 persons per household. non-family households (674 | 12.3%) represent the smallest median household size with 1.72 persons per household.
| Household Type | # Households | Household Size |
| Married-Couple | 3,459 (63.2%) | 3.76 |
| Single Male/Father | 637 (11.6%) | 3.21 |
| Single Female/Mother | 705 (12.9%) | 3.54 |
| Non-family | 674 (12.3%) | 1.72 |
| Total Households | 5,475 (100.0%) | 3.41 |
Household Size by Marriage Status in Country Walk
Out of a total of 5,475 households in Country Walk, 4,801 (87.7%) are family households, while 674 (12.3%) are nonfamily households. The most numerous type of family households are 3-person households, comprising 1,452, and the most common type of nonfamily households are 1-person households, comprising 404.
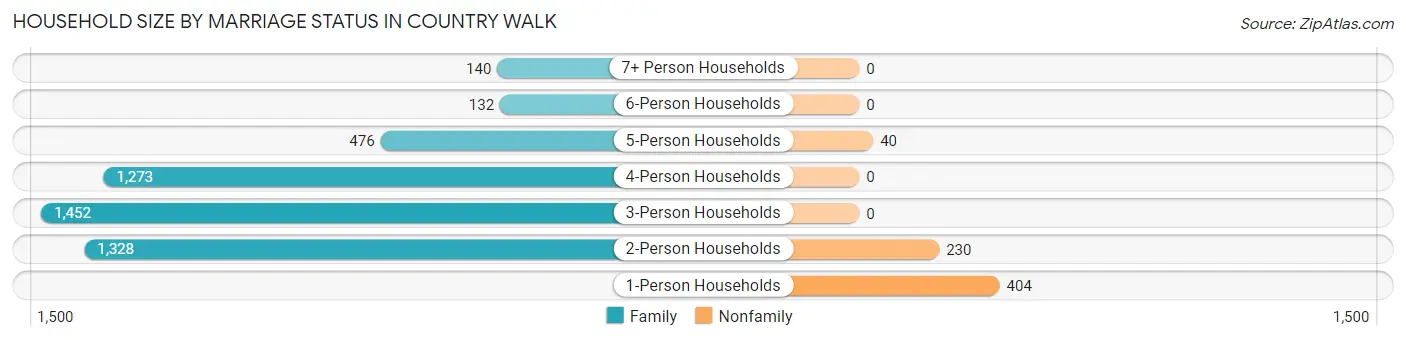
| Household Size | Family Households | Nonfamily Households |
| 1-Person Households | - | 404 (7.4%) |
| 2-Person Households | 1,328 (24.3%) | 230 (4.2%) |
| 3-Person Households | 1,452 (26.5%) | 0 (0.0%) |
| 4-Person Households | 1,273 (23.3%) | 0 (0.0%) |
| 5-Person Households | 476 (8.7%) | 40 (0.7%) |
| 6-Person Households | 132 (2.4%) | 0 (0.0%) |
| 7+ Person Households | 140 (2.6%) | 0 (0.0%) |
| Total | 4,801 (87.7%) | 674 (12.3%) |
Female Fertility in Country Walk
Fertility by Age in Country Walk
Average fertility rate in Country Walk is 41.0 births per 1,000 women. Women in the age bracket of 35 to 50 years have the highest fertility rate with 56.0 births per 1,000 women. Women in the age bracket of 35 to 50 years acount for 65.4% of all women with births.
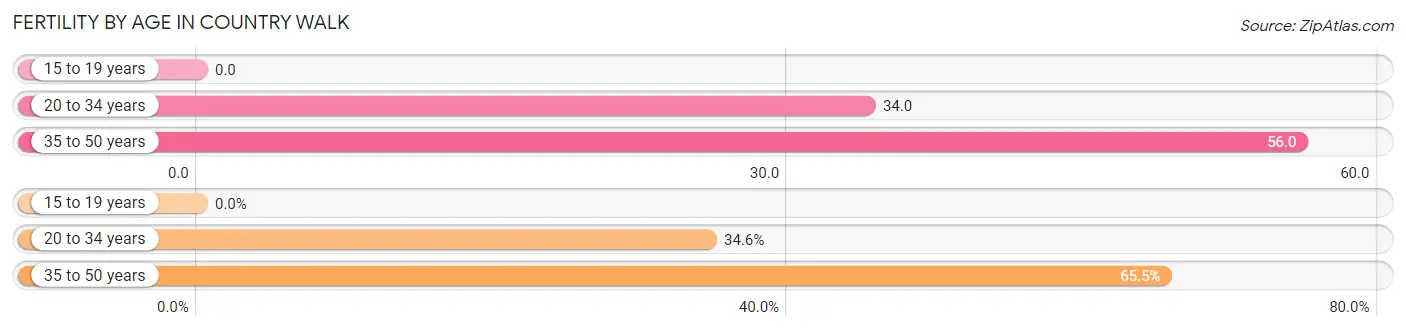
| Age Bracket | Women with Births | Births / 1,000 Women |
| 15 to 19 years | 0 (0.0%) | 0.0 |
| 20 to 34 years | 57 (34.5%) | 34.0 |
| 35 to 50 years | 108 (65.4%) | 56.0 |
| Total | 165 (100.0%) | 41.0 |
Fertility by Age by Marriage Status in Country Walk
78.2% of women with births (165) in Country Walk are married. The highest percentage of unmarried women with births falls into 20 to 34 years age bracket with 63.2% of them unmarried at the time of birth, while the lowest percentage of unmarried women with births belong to 35 to 50 years age bracket with 0.0% of them unmarried.
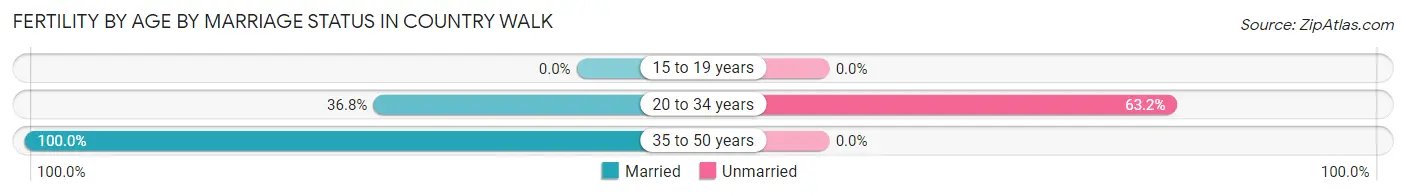
| Age Bracket | Married | Unmarried |
| 15 to 19 years | 0 (0.0%) | 0 (0.0%) |
| 20 to 34 years | 21 (36.8%) | 36 (63.2%) |
| 35 to 50 years | 108 (100.0%) | 0 (0.0%) |
| Total | 129 (78.2%) | 36 (21.8%) |
Fertility by Education in Country Walk
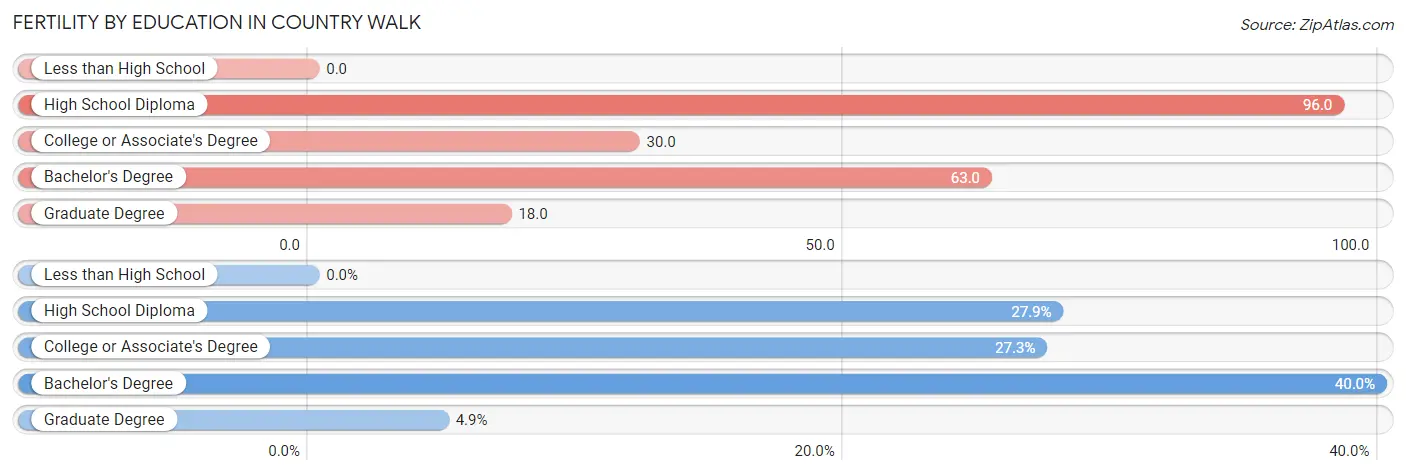
| Educational Attainment | Women with Births | Births / 1,000 Women |
| Less than High School | 0 (0.0%) | 0.0 |
| High School Diploma | 46 (27.9%) | 96.0 |
| College or Associate's Degree | 45 (27.3%) | 30.0 |
| Bachelor's Degree | 66 (40.0%) | 63.0 |
| Graduate Degree | 8 (4.9%) | 18.0 |
| Total | 165 (100.0%) | 41.0 |
Fertility by Education by Marriage Status in Country Walk
21.8% of women with births in Country Walk are unmarried. Women with the educational attainment of high school diploma are most likely to be married with 100.0% of them married at childbirth, while women with the educational attainment of bachelor's degree are least likely to be married with 54.5% of them unmarried at childbirth.
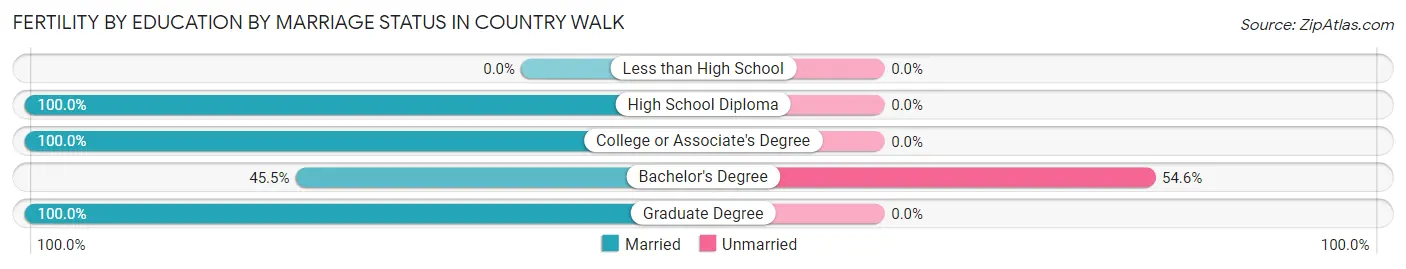
| Educational Attainment | Married | Unmarried |
| Less than High School | 0 (0.0%) | 0 (0.0%) |
| High School Diploma | 46 (100.0%) | 0 (0.0%) |
| College or Associate's Degree | 45 (100.0%) | 0 (0.0%) |
| Bachelor's Degree | 30 (45.5%) | 36 (54.5%) |
| Graduate Degree | 8 (100.0%) | 0 (0.0%) |
| Total | 129 (78.2%) | 36 (21.8%) |
Employment Characteristics in Country Walk
Employment by Class of Employer in Country Walk
Among the 9,425 employed individuals in Country Walk, private company employees (6,427 | 68.2%), self-employed (incorporated) (690 | 7.3%), and local government employees (644 | 6.8%) make up the most common classes of employment.
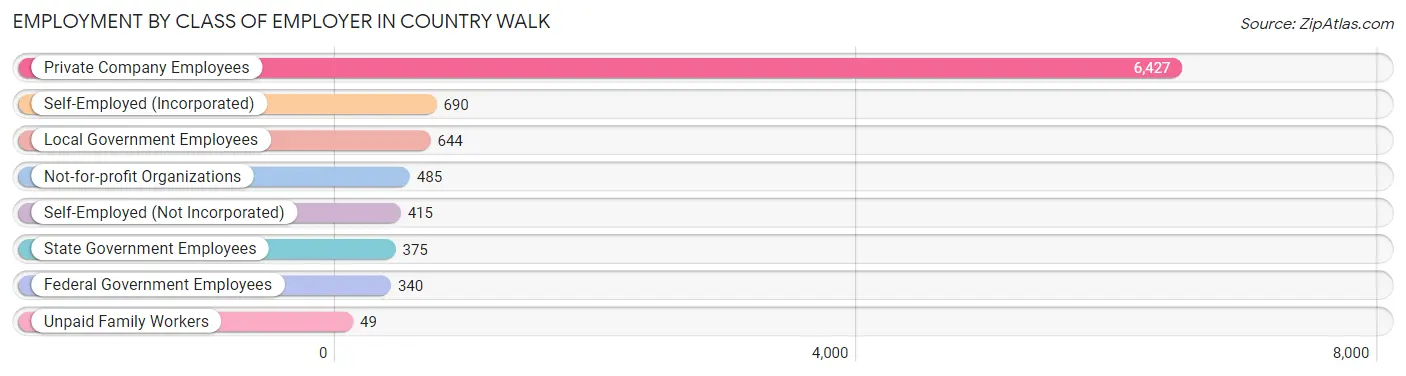
| Employer Class | # Employees | % Employees |
| Private Company Employees | 6,427 | 68.2% |
| Self-Employed (Incorporated) | 690 | 7.3% |
| Self-Employed (Not Incorporated) | 415 | 4.4% |
| Not-for-profit Organizations | 485 | 5.1% |
| Local Government Employees | 644 | 6.8% |
| State Government Employees | 375 | 4.0% |
| Federal Government Employees | 340 | 3.6% |
| Unpaid Family Workers | 49 | 0.5% |
| Total | 9,425 | 100.0% |
Employment Status by Age in Country Walk
According to the labor force statistics for Country Walk, out of the total population over 16 years of age (14,665), 66.8% or 9,796 individuals are in the labor force, with 3.4% or 333 of them unemployed. The age group with the highest labor force participation rate is 45 to 54 years, with 91.9% or 2,697 individuals in the labor force. Within the labor force, the 20 to 24 years age range has the highest percentage of unemployed individuals, with 17.2% or 112 of them being unemployed.
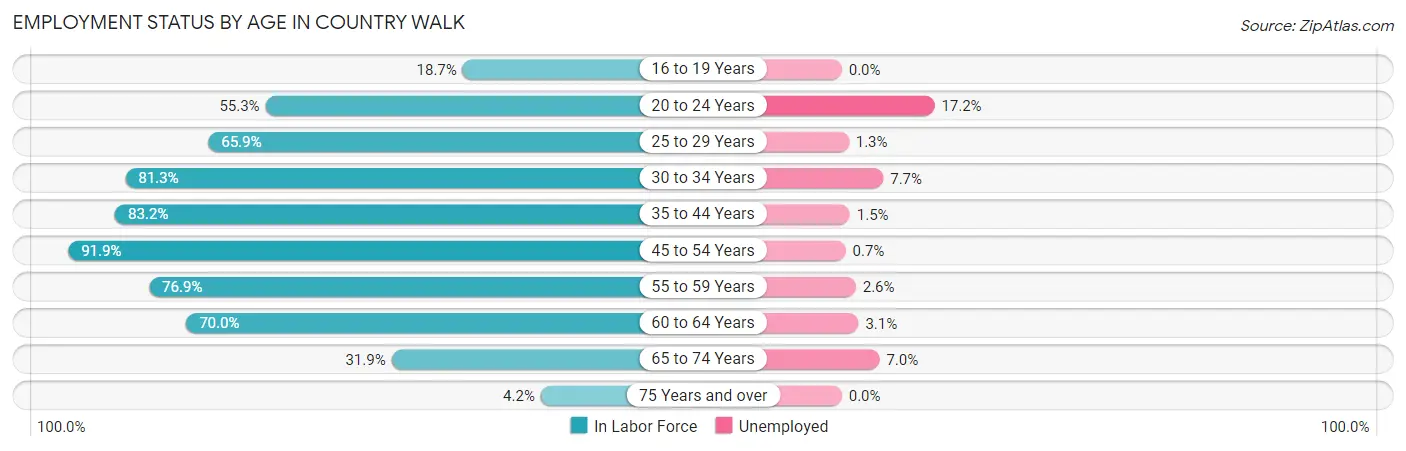
| Age Bracket | In Labor Force | Unemployed |
| 16 to 19 Years | 185 (18.7%) | 0 (0.0%) |
| 20 to 24 Years | 650 (55.3%) | 112 (17.2%) |
| 25 to 29 Years | 708 (65.9%) | 9 (1.3%) |
| 30 to 34 Years | 1,068 (81.3%) | 82 (7.7%) |
| 35 to 44 Years | 2,244 (83.2%) | 34 (1.5%) |
| 45 to 54 Years | 2,697 (91.9%) | 19 (0.7%) |
| 55 to 59 Years | 1,222 (76.9%) | 32 (2.6%) |
| 60 to 64 Years | 621 (70.0%) | 19 (3.1%) |
| 65 to 74 Years | 368 (31.9%) | 26 (7.0%) |
| 75 Years and over | 36 (4.2%) | 0 (0.0%) |
| Total | 9,796 (66.8%) | 333 (3.4%) |
Employment Status by Educational Attainment in Country Walk
According to labor force statistics for Country Walk, 81.5% of individuals (8,555) out of the total population between 25 and 64 years of age (10,497) are in the labor force, with 2.3% or 197 of them being unemployed. The group with the highest labor force participation rate are those with the educational attainment of bachelor's degree or higher, with 87.2% or 3,446 individuals in the labor force. Within the labor force, individuals with high school diploma education have the highest percentage of unemployment, with 5.5% or 103 of them being unemployed.
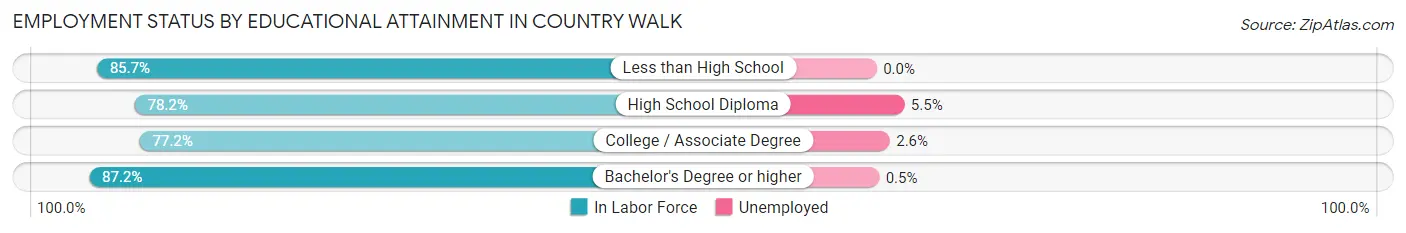
| Educational Attainment | In Labor Force | Unemployed |
| Less than High School | 360 (85.7%) | 0 (0.0%) |
| High School Diploma | 1,870 (78.2%) | 132 (5.5%) |
| College / Associate Degree | 2,883 (77.2%) | 97 (2.6%) |
| Bachelor's Degree or higher | 3,446 (87.2%) | 20 (0.5%) |
| Total | 8,555 (81.5%) | 241 (2.3%) |
Employment Occupations by Sex in Country Walk
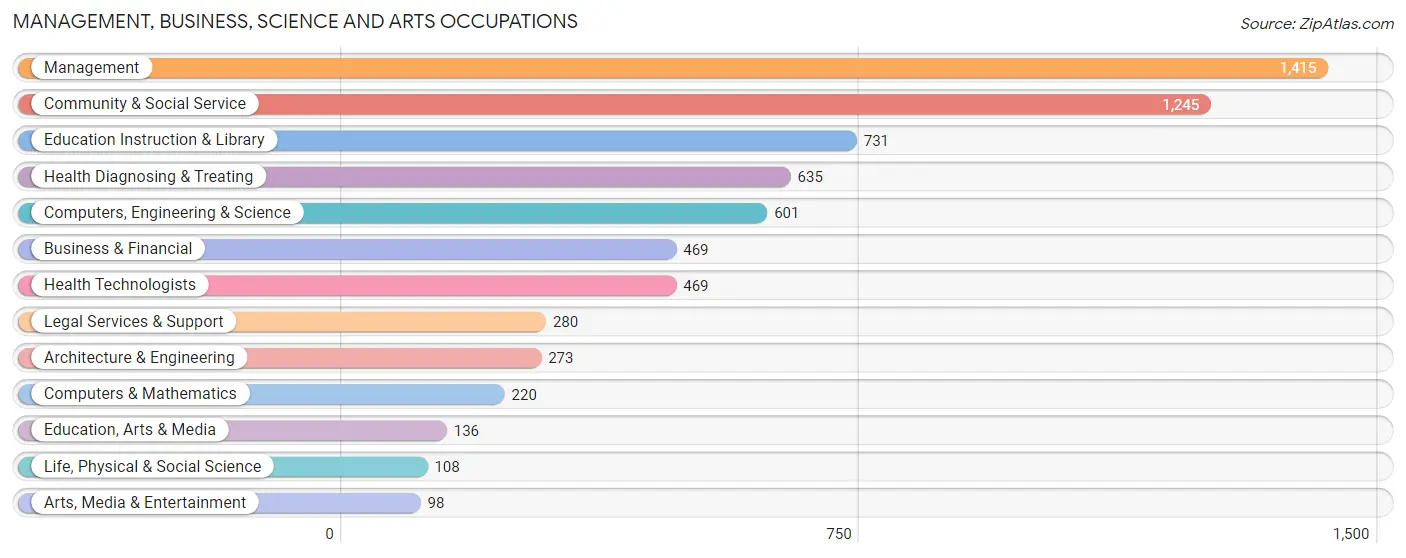
Management, Business, Science and Arts Occupations
The most common Management, Business, Science and Arts occupations in Country Walk are Management (1,415 | 15.0%), Community & Social Service (1,245 | 13.2%), Education Instruction & Library (731 | 7.7%), Health Diagnosing & Treating (635 | 6.7%), and Computers, Engineering & Science (601 | 6.4%).
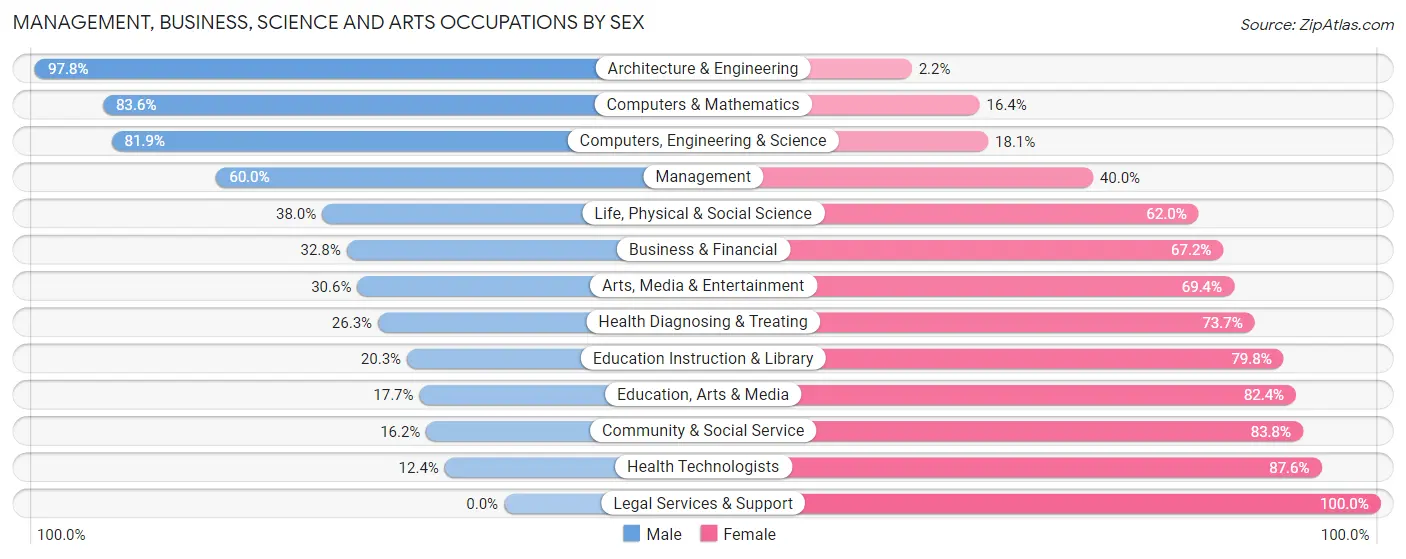
Management, Business, Science and Arts Occupations by Sex
Within the Management, Business, Science and Arts occupations in Country Walk, the most male-oriented occupations are Architecture & Engineering (97.8%), Computers & Mathematics (83.6%), and Computers, Engineering & Science (81.9%), while the most female-oriented occupations are Legal Services & Support (100.0%), Health Technologists (87.6%), and Community & Social Service (83.8%).
| Occupation | Male | Female |
| Management | 849 (60.0%) | 566 (40.0%) |
| Business & Financial | 154 (32.8%) | 315 (67.2%) |
| Computers, Engineering & Science | 492 (81.9%) | 109 (18.1%) |
| Computers & Mathematics | 184 (83.6%) | 36 (16.4%) |
| Architecture & Engineering | 267 (97.8%) | 6 (2.2%) |
| Life, Physical & Social Science | 41 (38.0%) | 67 (62.0%) |
| Community & Social Service | 202 (16.2%) | 1,043 (83.8%) |
| Education, Arts & Media | 24 (17.6%) | 112 (82.4%) |
| Legal Services & Support | 0 (0.0%) | 280 (100.0%) |
| Education Instruction & Library | 148 (20.3%) | 583 (79.7%) |
| Arts, Media & Entertainment | 30 (30.6%) | 68 (69.4%) |
| Health Diagnosing & Treating | 167 (26.3%) | 468 (73.7%) |
| Health Technologists | 58 (12.4%) | 411 (87.6%) |
| Total (Category) | 1,864 (42.7%) | 2,501 (57.3%) |
| Total (Overall) | 5,188 (54.9%) | 4,254 (45.1%) |
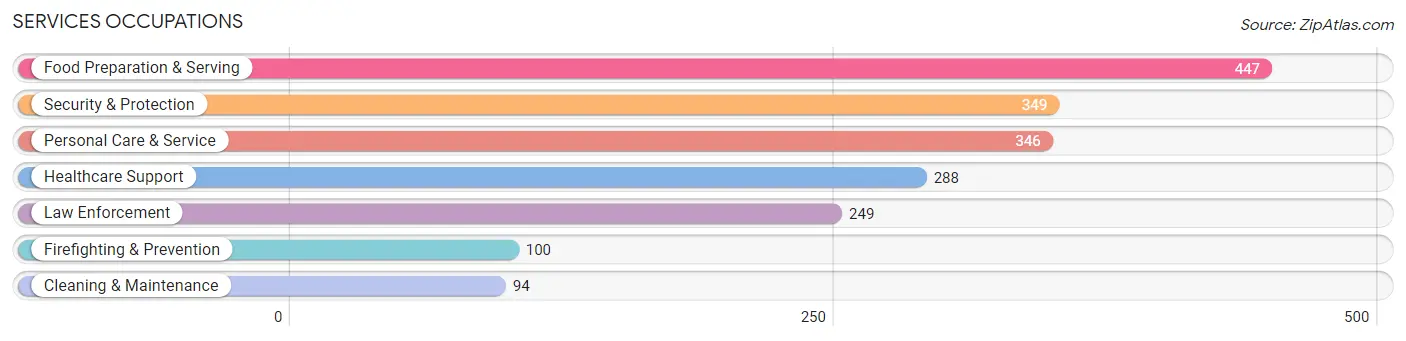
Services Occupations
The most common Services occupations in Country Walk are Food Preparation & Serving (447 | 4.7%), Security & Protection (349 | 3.7%), Personal Care & Service (346 | 3.7%), Healthcare Support (288 | 3.0%), and Law Enforcement (249 | 2.6%).
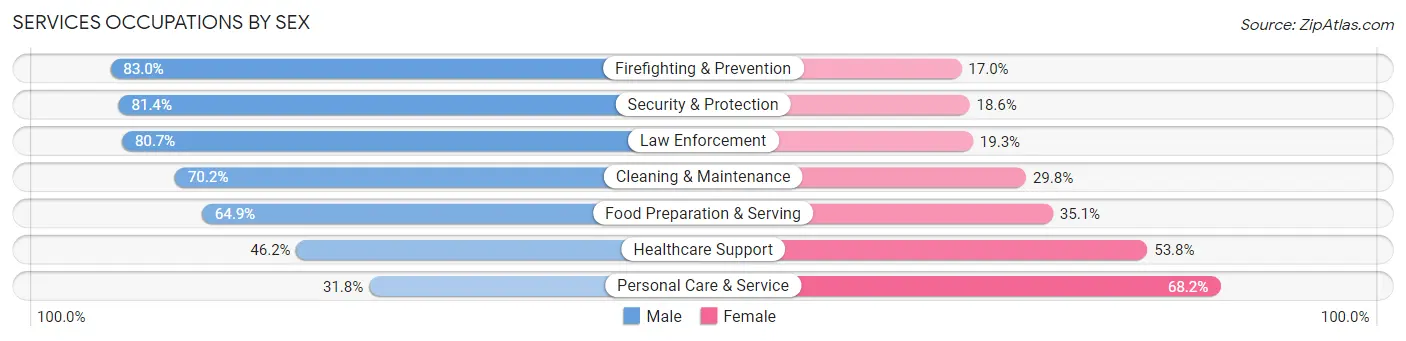
Services Occupations by Sex
Within the Services occupations in Country Walk, the most male-oriented occupations are Firefighting & Prevention (83.0%), Security & Protection (81.4%), and Law Enforcement (80.7%), while the most female-oriented occupations are Personal Care & Service (68.2%), Healthcare Support (53.8%), and Food Preparation & Serving (35.1%).
| Occupation | Male | Female |
| Healthcare Support | 133 (46.2%) | 155 (53.8%) |
| Security & Protection | 284 (81.4%) | 65 (18.6%) |
| Firefighting & Prevention | 83 (83.0%) | 17 (17.0%) |
| Law Enforcement | 201 (80.7%) | 48 (19.3%) |
| Food Preparation & Serving | 290 (64.9%) | 157 (35.1%) |
| Cleaning & Maintenance | 66 (70.2%) | 28 (29.8%) |
| Personal Care & Service | 110 (31.8%) | 236 (68.2%) |
| Total (Category) | 883 (57.9%) | 641 (42.1%) |
| Total (Overall) | 5,188 (54.9%) | 4,254 (45.1%) |
Sales and Office Occupations
The most common Sales and Office occupations in Country Walk are Sales & Related (1,415 | 15.0%), and Office & Administration (858 | 9.1%).
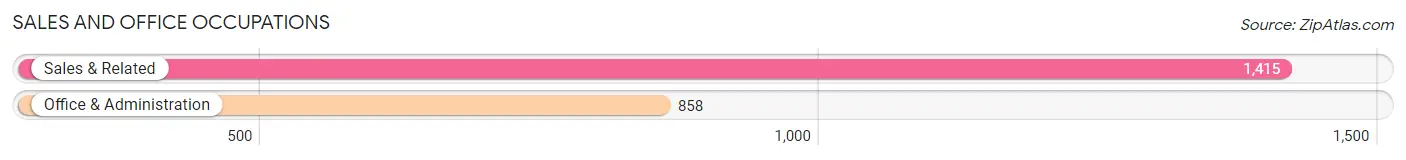
Sales and Office Occupations by Sex
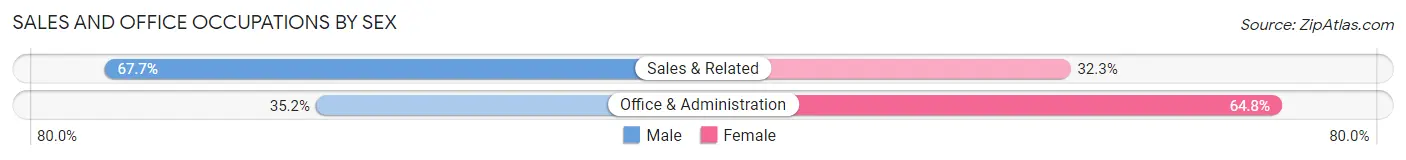
| Occupation | Male | Female |
| Sales & Related | 958 (67.7%) | 457 (32.3%) |
| Office & Administration | 302 (35.2%) | 556 (64.8%) |
| Total (Category) | 1,260 (55.4%) | 1,013 (44.6%) |
| Total (Overall) | 5,188 (54.9%) | 4,254 (45.1%) |
Natural Resources, Construction and Maintenance Occupations
The most common Natural Resources, Construction and Maintenance occupations in Country Walk are Installation, Maintenance & Repair (302 | 3.2%), Construction & Extraction (201 | 2.1%), and Farming, Fishing & Forestry (23 | 0.2%).
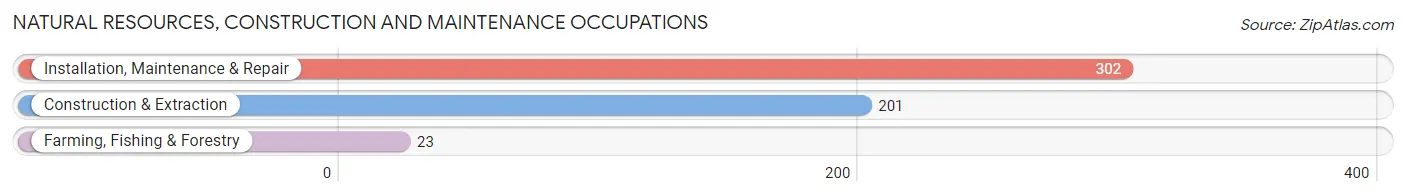
Natural Resources, Construction and Maintenance Occupations by Sex
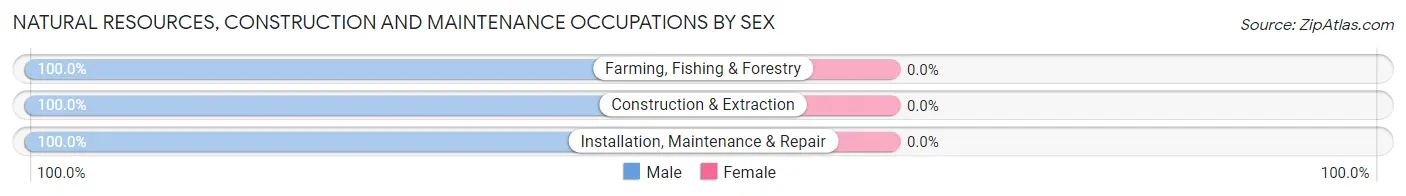
| Occupation | Male | Female |
| Farming, Fishing & Forestry | 23 (100.0%) | 0 (0.0%) |
| Construction & Extraction | 201 (100.0%) | 0 (0.0%) |
| Installation, Maintenance & Repair | 302 (100.0%) | 0 (0.0%) |
| Total (Category) | 526 (100.0%) | 0 (0.0%) |
| Total (Overall) | 5,188 (54.9%) | 4,254 (45.1%) |
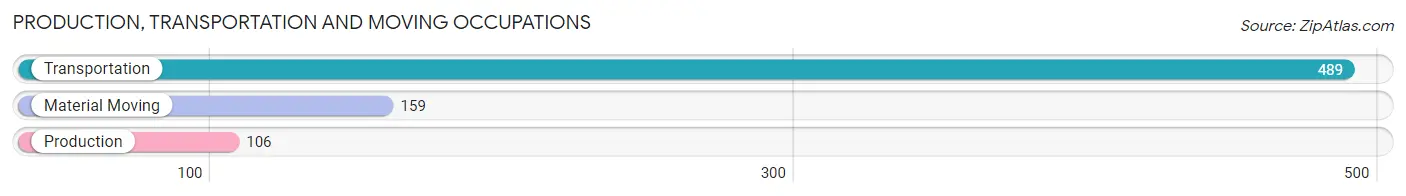
Production, Transportation and Moving Occupations
The most common Production, Transportation and Moving occupations in Country Walk are Transportation (489 | 5.2%), Material Moving (159 | 1.7%), and Production (106 | 1.1%).
Production, Transportation and Moving Occupations by Sex
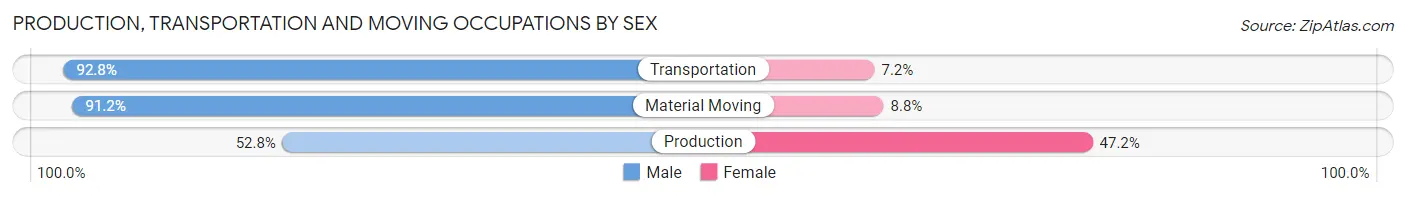
| Occupation | Male | Female |
| Production | 56 (52.8%) | 50 (47.2%) |
| Transportation | 454 (92.8%) | 35 (7.2%) |
| Material Moving | 145 (91.2%) | 14 (8.8%) |
| Total (Category) | 655 (86.9%) | 99 (13.1%) |
| Total (Overall) | 5,188 (54.9%) | 4,254 (45.1%) |
Employment Industries by Sex in Country Walk
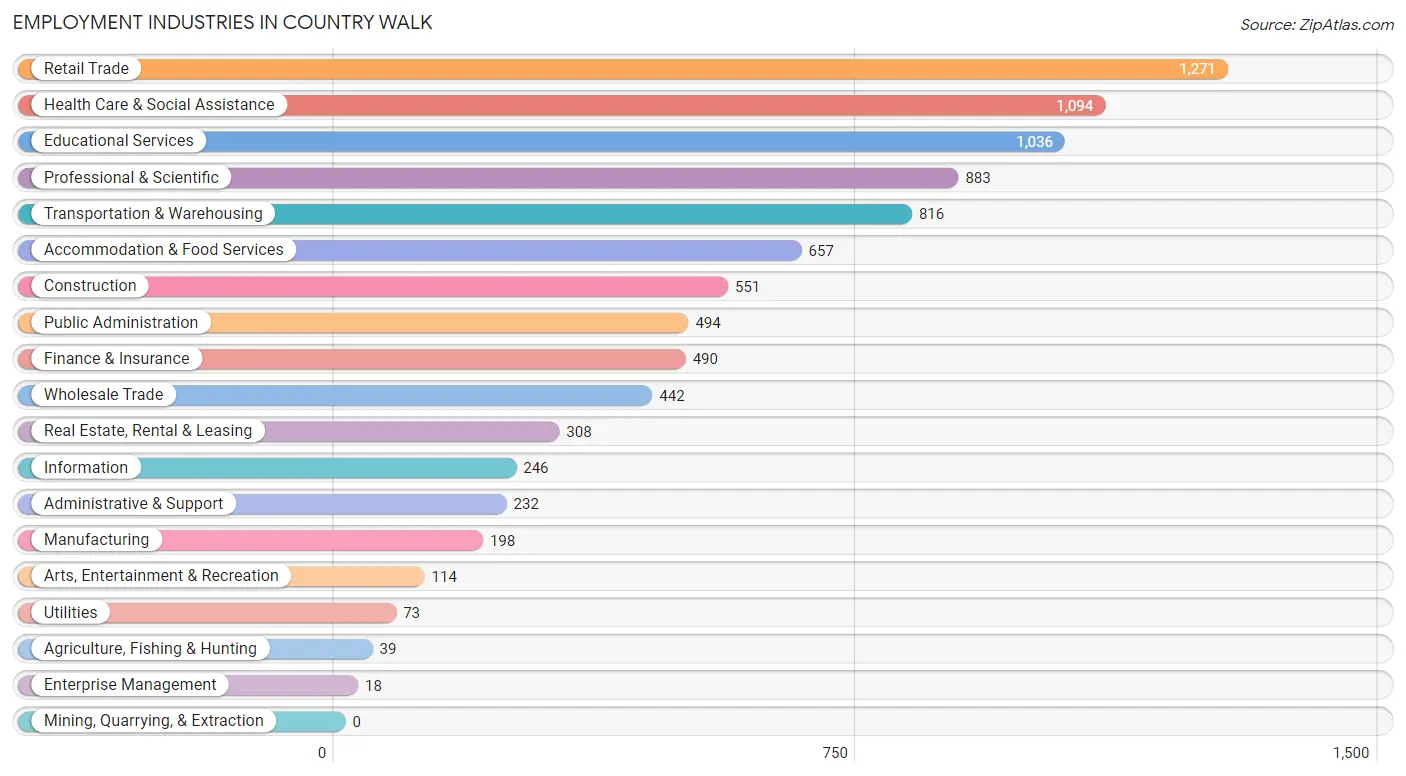
Employment Industries in Country Walk
The major employment industries in Country Walk include Retail Trade (1,271 | 13.5%), Health Care & Social Assistance (1,094 | 11.6%), Educational Services (1,036 | 11.0%), Professional & Scientific (883 | 9.3%), and Transportation & Warehousing (816 | 8.6%).
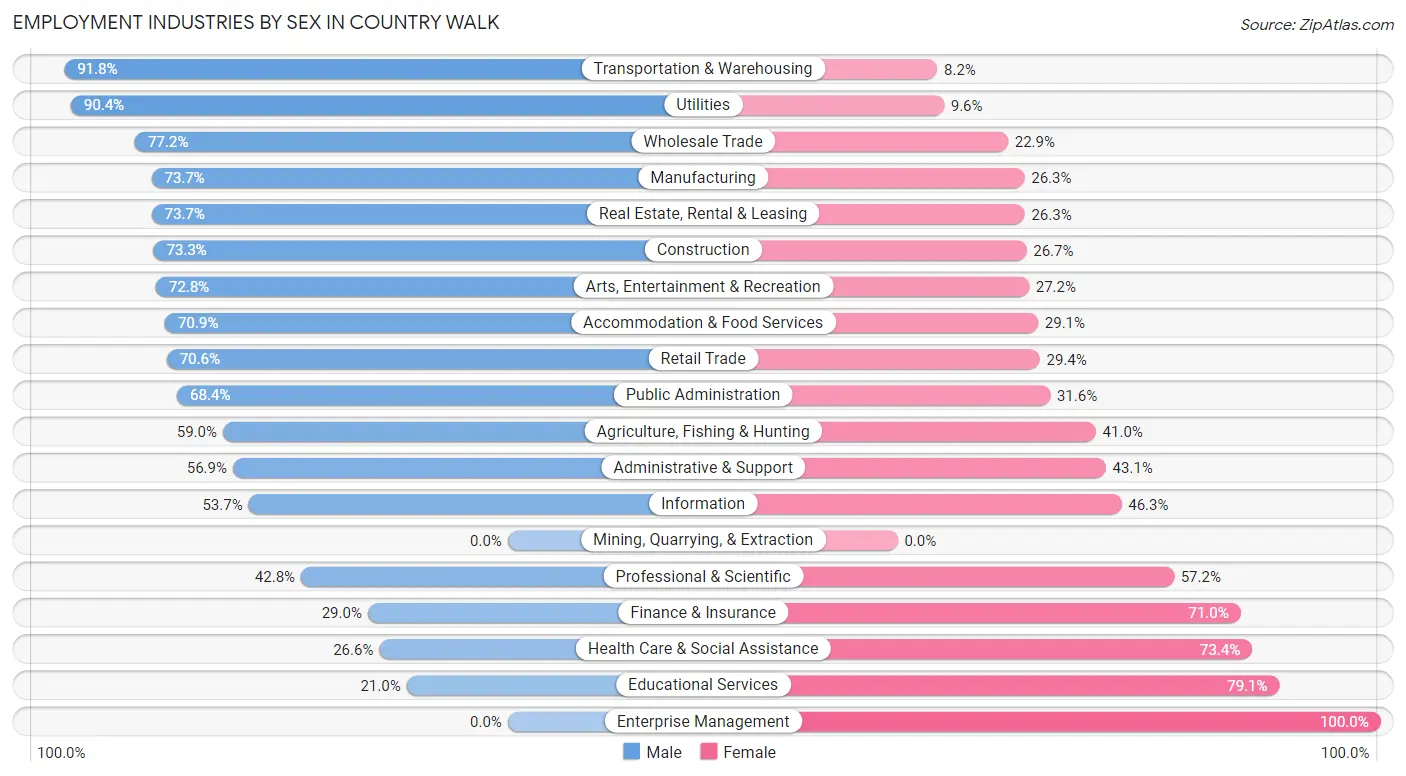
Employment Industries by Sex in Country Walk
The Country Walk industries that see more men than women are Transportation & Warehousing (91.8%), Utilities (90.4%), and Wholesale Trade (77.1%), whereas the industries that tend to have a higher number of women are Enterprise Management (100.0%), Educational Services (79.0%), and Health Care & Social Assistance (73.4%).
| Industry | Male | Female |
| Agriculture, Fishing & Hunting | 23 (59.0%) | 16 (41.0%) |
| Mining, Quarrying, & Extraction | 0 (0.0%) | 0 (0.0%) |
| Construction | 404 (73.3%) | 147 (26.7%) |
| Manufacturing | 146 (73.7%) | 52 (26.3%) |
| Wholesale Trade | 341 (77.1%) | 101 (22.9%) |
| Retail Trade | 897 (70.6%) | 374 (29.4%) |
| Transportation & Warehousing | 749 (91.8%) | 67 (8.2%) |
| Utilities | 66 (90.4%) | 7 (9.6%) |
| Information | 132 (53.7%) | 114 (46.3%) |
| Finance & Insurance | 142 (29.0%) | 348 (71.0%) |
| Real Estate, Rental & Leasing | 227 (73.7%) | 81 (26.3%) |
| Professional & Scientific | 378 (42.8%) | 505 (57.2%) |
| Enterprise Management | 0 (0.0%) | 18 (100.0%) |
| Administrative & Support | 132 (56.9%) | 100 (43.1%) |
| Educational Services | 217 (20.9%) | 819 (79.0%) |
| Health Care & Social Assistance | 291 (26.6%) | 803 (73.4%) |
| Arts, Entertainment & Recreation | 83 (72.8%) | 31 (27.2%) |
| Accommodation & Food Services | 466 (70.9%) | 191 (29.1%) |
| Public Administration | 338 (68.4%) | 156 (31.6%) |
| Total | 5,188 (54.9%) | 4,254 (45.1%) |
Education in Country Walk
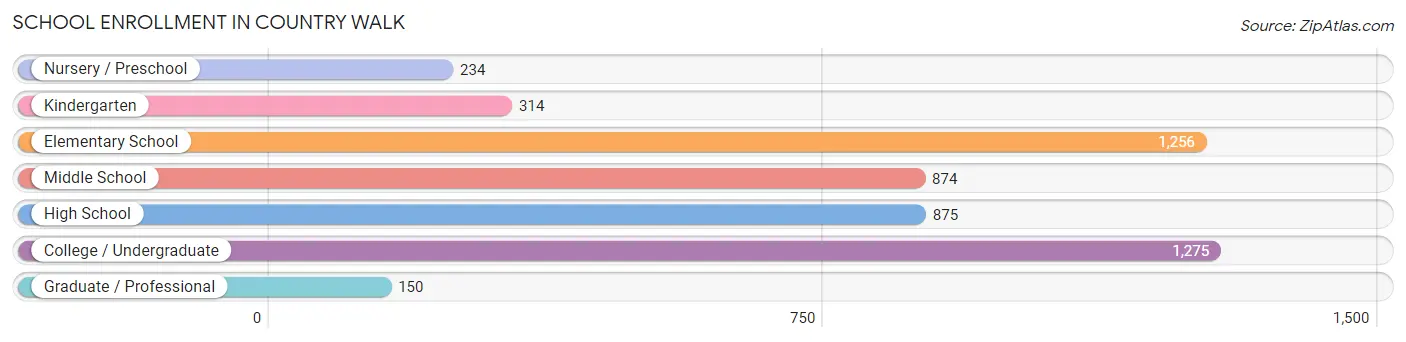
School Enrollment in Country Walk
The most common levels of schooling among the 4,978 students in Country Walk are college / undergraduate (1,275 | 25.6%), elementary school (1,256 | 25.2%), and high school (875 | 17.6%).
| School Level | # Students | % Students |
| Nursery / Preschool | 234 | 4.7% |
| Kindergarten | 314 | 6.3% |
| Elementary School | 1,256 | 25.2% |
| Middle School | 874 | 17.6% |
| High School | 875 | 17.6% |
| College / Undergraduate | 1,275 | 25.6% |
| Graduate / Professional | 150 | 3.0% |
| Total | 4,978 | 100.0% |
School Enrollment by Age by Funding Source in Country Walk
Out of a total of 4,978 students who are enrolled in schools in Country Walk, 592 (11.9%) attend a private institution, while the remaining 4,386 (88.1%) are enrolled in public schools. The age group of 35 years and over has the highest likelihood of being enrolled in private schools, with 37 (29.1% in the age bracket) enrolled. Conversely, the age group of 18 to 19 year olds has the lowest likelihood of being enrolled in a private school, with 381 (100.0% in the age bracket) attending a public institution.
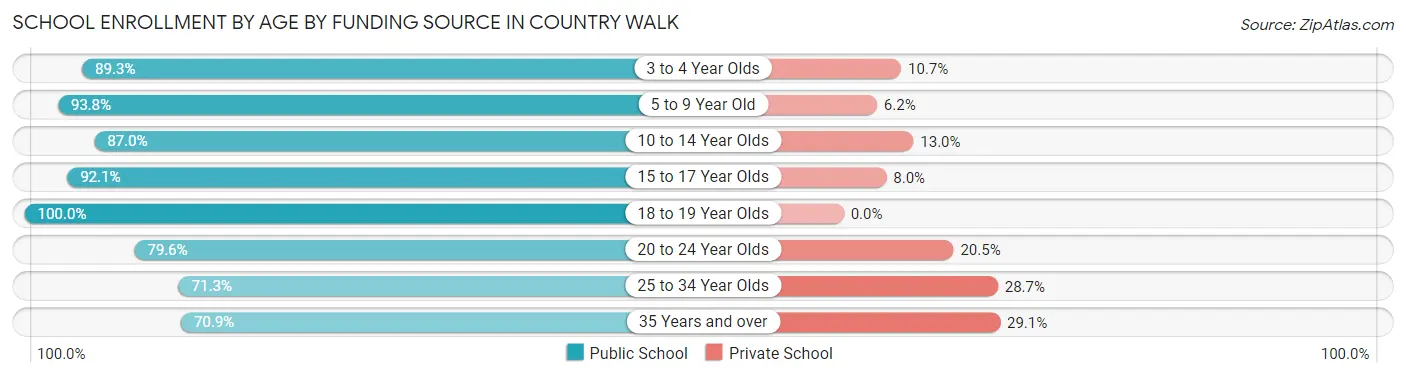
| Age Bracket | Public School | Private School |
| 3 to 4 Year Olds | 192 (89.3%) | 23 (10.7%) |
| 5 to 9 Year Old | 1,151 (93.8%) | 76 (6.2%) |
| 10 to 14 Year Olds | 1,193 (87.0%) | 178 (13.0%) |
| 15 to 17 Year Olds | 672 (92.0%) | 58 (8.0%) |
| 18 to 19 Year Olds | 381 (100.0%) | 0 (0.0%) |
| 20 to 24 Year Olds | 463 (79.5%) | 119 (20.4%) |
| 25 to 34 Year Olds | 246 (71.3%) | 99 (28.7%) |
| 35 Years and over | 90 (70.9%) | 37 (29.1%) |
| Total | 4,386 (88.1%) | 592 (11.9%) |
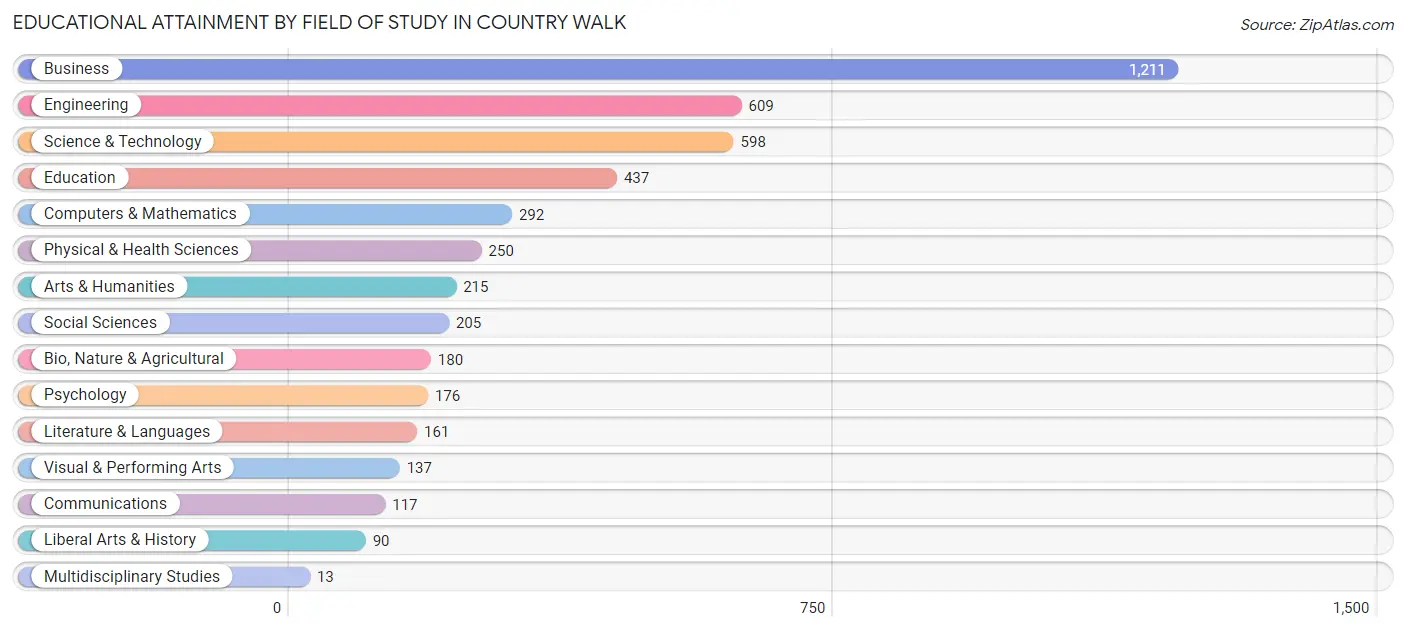
Educational Attainment by Field of Study in Country Walk
Business (1,211 | 25.8%), engineering (609 | 13.0%), science & technology (598 | 12.8%), education (437 | 9.3%), and computers & mathematics (292 | 6.2%) are the most common fields of study among 4,691 individuals in Country Walk who have obtained a bachelor's degree or higher.
| Field of Study | # Graduates | % Graduates |
| Computers & Mathematics | 292 | 6.2% |
| Bio, Nature & Agricultural | 180 | 3.8% |
| Physical & Health Sciences | 250 | 5.3% |
| Psychology | 176 | 3.7% |
| Social Sciences | 205 | 4.4% |
| Engineering | 609 | 13.0% |
| Multidisciplinary Studies | 13 | 0.3% |
| Science & Technology | 598 | 12.8% |
| Business | 1,211 | 25.8% |
| Education | 437 | 9.3% |
| Literature & Languages | 161 | 3.4% |
| Liberal Arts & History | 90 | 1.9% |
| Visual & Performing Arts | 137 | 2.9% |
| Communications | 117 | 2.5% |
| Arts & Humanities | 215 | 4.6% |
| Total | 4,691 | 100.0% |
Transportation & Commute in Country Walk
Vehicle Availability by Sex in Country Walk
The most prevalent vehicle ownership categories in Country Walk are males with 2 vehicles (2,202, accounting for 42.5%) and females with 2 vehicles (1,698, making up 52.0%).
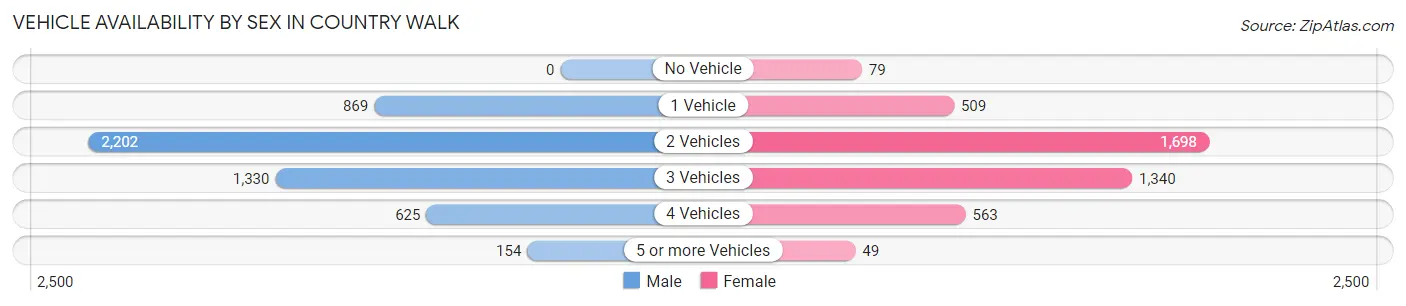
| Vehicles Available | Male | Female |
| No Vehicle | 0 (0.0%) | 79 (1.9%) |
| 1 Vehicle | 869 (16.8%) | 509 (12.0%) |
| 2 Vehicles | 2,202 (42.5%) | 1,698 (40.1%) |
| 3 Vehicles | 1,330 (25.7%) | 1,340 (31.6%) |
| 4 Vehicles | 625 (12.1%) | 563 (13.3%) |
| 5 or more Vehicles | 154 (3.0%) | 49 (1.2%) |
| Total | 5,180 (100.0%) | 4,238 (100.0%) |
Commute Time in Country Walk
The most frequently occuring commute durations in Country Walk are 30 to 34 minutes (1,711 commuters, 20.5%), 60 to 89 minutes (1,335 commuters, 16.0%), and 45 to 59 minutes (1,099 commuters, 13.1%).
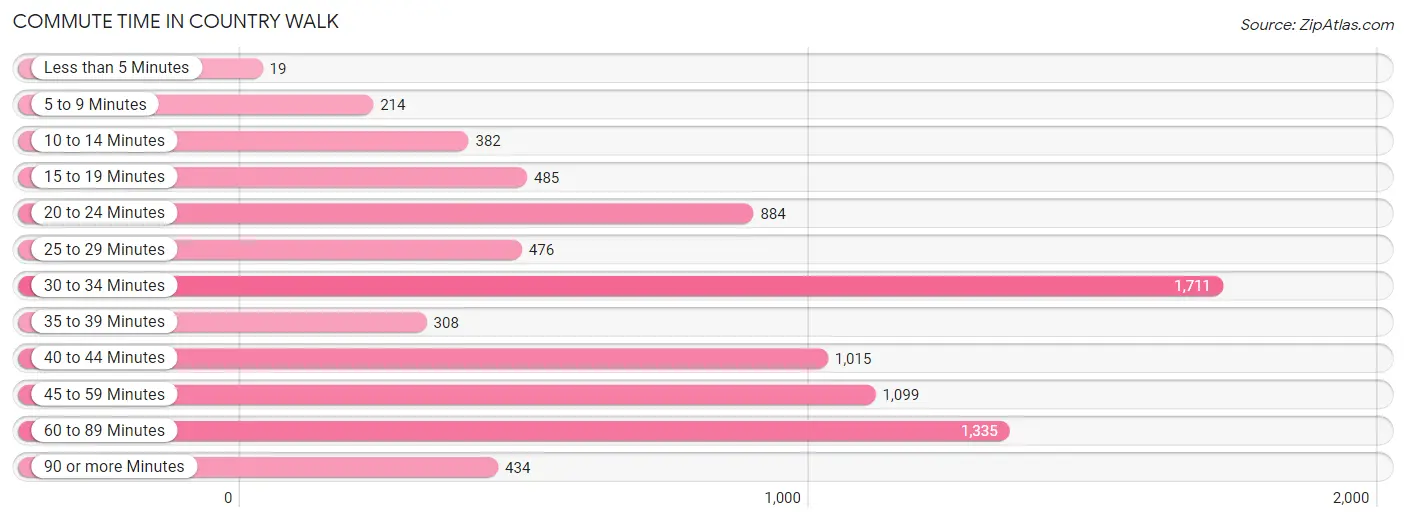
| Commute Time | # Commuters | % Commuters |
| Less than 5 Minutes | 19 | 0.2% |
| 5 to 9 Minutes | 214 | 2.6% |
| 10 to 14 Minutes | 382 | 4.6% |
| 15 to 19 Minutes | 485 | 5.8% |
| 20 to 24 Minutes | 884 | 10.6% |
| 25 to 29 Minutes | 476 | 5.7% |
| 30 to 34 Minutes | 1,711 | 20.5% |
| 35 to 39 Minutes | 308 | 3.7% |
| 40 to 44 Minutes | 1,015 | 12.1% |
| 45 to 59 Minutes | 1,099 | 13.1% |
| 60 to 89 Minutes | 1,335 | 16.0% |
| 90 or more Minutes | 434 | 5.2% |
Commute Time by Sex in Country Walk
The most common commute times in Country Walk are 30 to 34 minutes (970 commuters, 20.7%) for males and 30 to 34 minutes (741 commuters, 20.2%) for females.
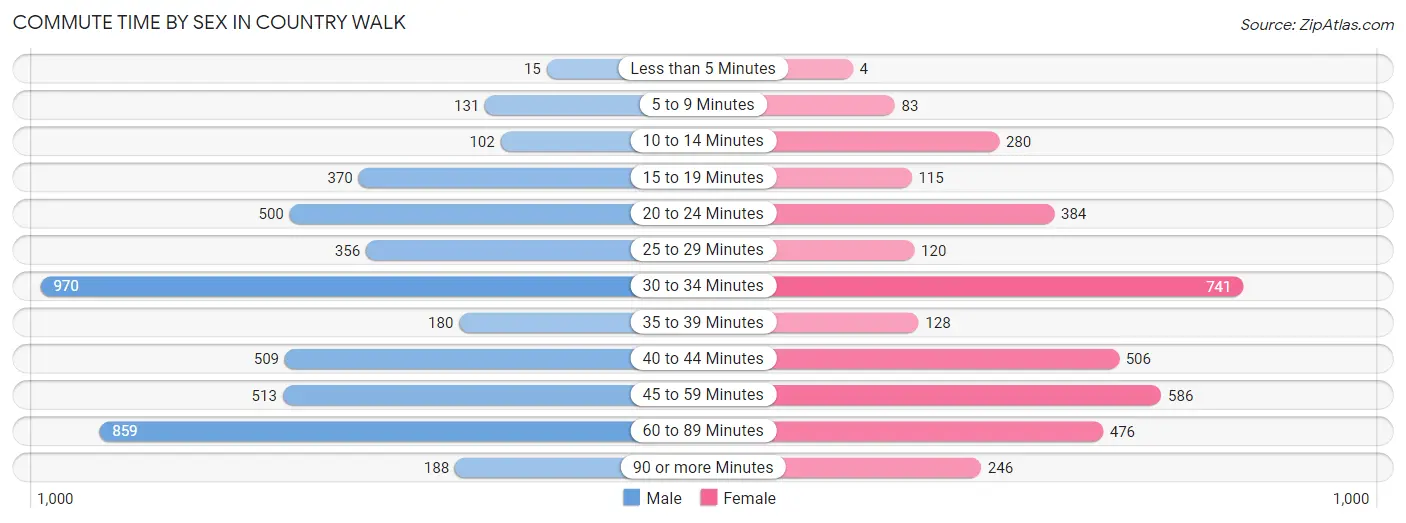
| Commute Time | Male | Female |
| Less than 5 Minutes | 15 (0.3%) | 4 (0.1%) |
| 5 to 9 Minutes | 131 (2.8%) | 83 (2.3%) |
| 10 to 14 Minutes | 102 (2.2%) | 280 (7.6%) |
| 15 to 19 Minutes | 370 (7.9%) | 115 (3.1%) |
| 20 to 24 Minutes | 500 (10.6%) | 384 (10.5%) |
| 25 to 29 Minutes | 356 (7.6%) | 120 (3.3%) |
| 30 to 34 Minutes | 970 (20.7%) | 741 (20.2%) |
| 35 to 39 Minutes | 180 (3.8%) | 128 (3.5%) |
| 40 to 44 Minutes | 509 (10.8%) | 506 (13.8%) |
| 45 to 59 Minutes | 513 (10.9%) | 586 (16.0%) |
| 60 to 89 Minutes | 859 (18.3%) | 476 (13.0%) |
| 90 or more Minutes | 188 (4.0%) | 246 (6.7%) |
Time of Departure to Work by Sex in Country Walk
The most frequent times of departure to work in Country Walk are 7:00 AM to 7:29 AM (661, 14.1%) for males and 7:00 AM to 7:29 AM (716, 19.5%) for females.
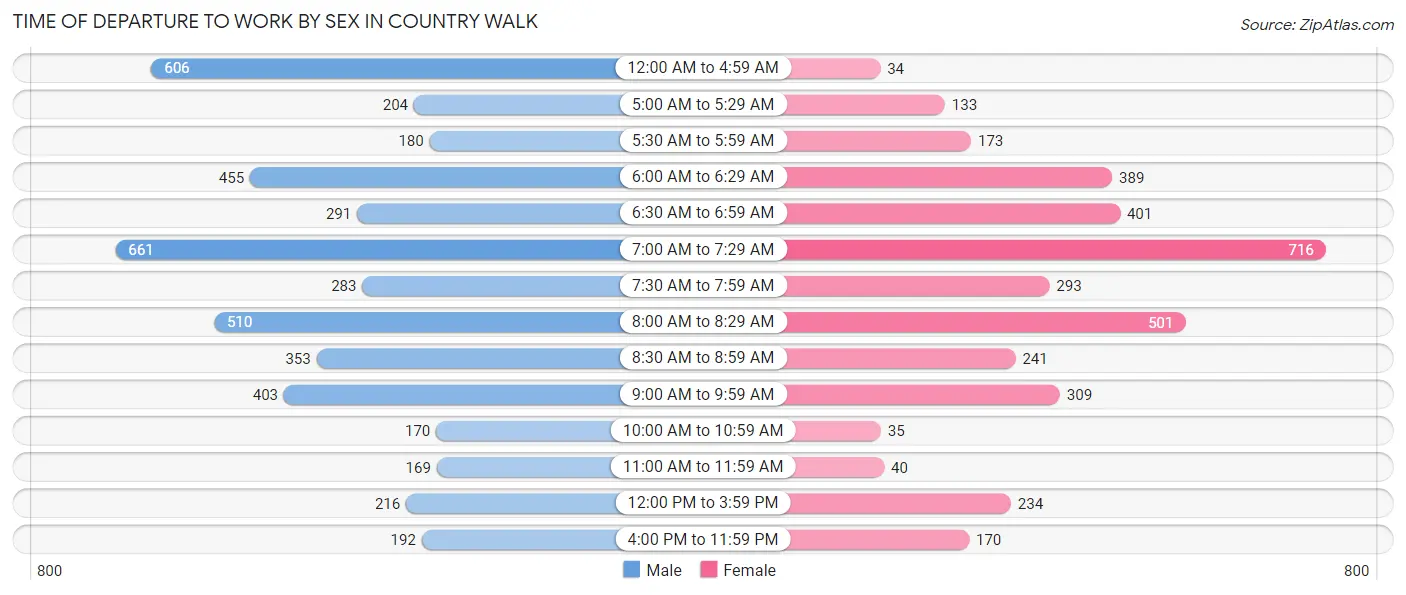
| Time of Departure | Male | Female |
| 12:00 AM to 4:59 AM | 606 (12.9%) | 34 (0.9%) |
| 5:00 AM to 5:29 AM | 204 (4.3%) | 133 (3.6%) |
| 5:30 AM to 5:59 AM | 180 (3.8%) | 173 (4.7%) |
| 6:00 AM to 6:29 AM | 455 (9.7%) | 389 (10.6%) |
| 6:30 AM to 6:59 AM | 291 (6.2%) | 401 (10.9%) |
| 7:00 AM to 7:29 AM | 661 (14.1%) | 716 (19.5%) |
| 7:30 AM to 7:59 AM | 283 (6.0%) | 293 (8.0%) |
| 8:00 AM to 8:29 AM | 510 (10.9%) | 501 (13.7%) |
| 8:30 AM to 8:59 AM | 353 (7.5%) | 241 (6.6%) |
| 9:00 AM to 9:59 AM | 403 (8.6%) | 309 (8.4%) |
| 10:00 AM to 10:59 AM | 170 (3.6%) | 35 (0.9%) |
| 11:00 AM to 11:59 AM | 169 (3.6%) | 40 (1.1%) |
| 12:00 PM to 3:59 PM | 216 (4.6%) | 234 (6.4%) |
| 4:00 PM to 11:59 PM | 192 (4.1%) | 170 (4.6%) |
| Total | 4,693 (100.0%) | 3,669 (100.0%) |
Housing Occupancy in Country Walk
Occupancy by Ownership in Country Walk
Of the total 5,475 dwellings in Country Walk, owner-occupied units account for 4,540 (82.9%), while renter-occupied units make up 935 (17.1%).
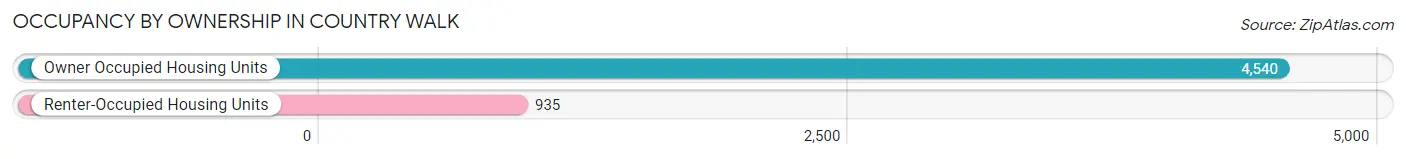
| Occupancy | # Housing Units | % Housing Units |
| Owner Occupied Housing Units | 4,540 | 82.9% |
| Renter-Occupied Housing Units | 935 | 17.1% |
| Total Occupied Housing Units | 5,475 | 100.0% |
Occupancy by Household Size in Country Walk
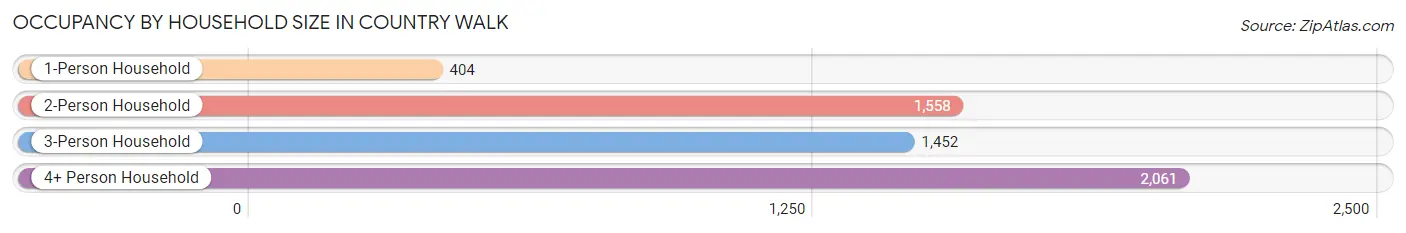
| Household Size | # Housing Units | % Housing Units |
| 1-Person Household | 404 | 7.4% |
| 2-Person Household | 1,558 | 28.5% |
| 3-Person Household | 1,452 | 26.5% |
| 4+ Person Household | 2,061 | 37.6% |
| Total Housing Units | 5,475 | 100.0% |
Occupancy by Ownership by Household Size in Country Walk
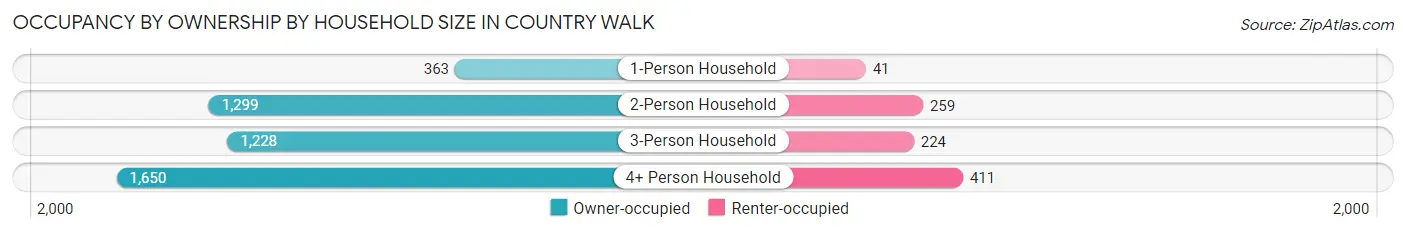
| Household Size | Owner-occupied | Renter-occupied |
| 1-Person Household | 363 (89.8%) | 41 (10.2%) |
| 2-Person Household | 1,299 (83.4%) | 259 (16.6%) |
| 3-Person Household | 1,228 (84.6%) | 224 (15.4%) |
| 4+ Person Household | 1,650 (80.1%) | 411 (19.9%) |
| Total Housing Units | 4,540 (82.9%) | 935 (17.1%) |
Occupancy by Educational Attainment in Country Walk
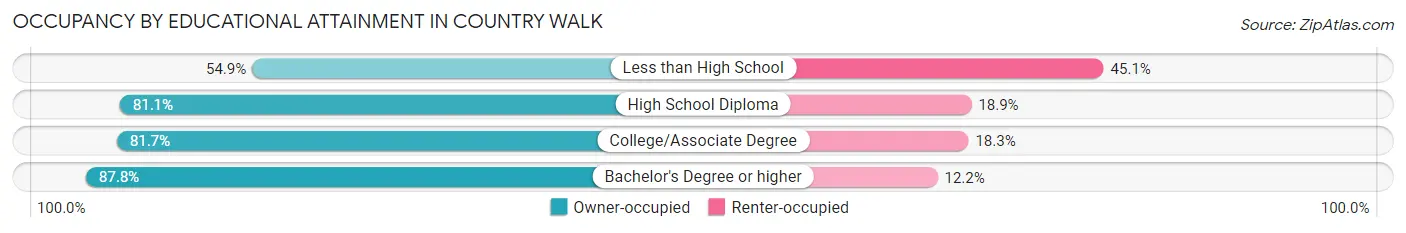
| Household Size | Owner-occupied | Renter-occupied |
| Less than High School | 112 (54.9%) | 92 (45.1%) |
| High School Diploma | 863 (81.1%) | 201 (18.9%) |
| College/Associate Degree | 1,737 (81.7%) | 389 (18.3%) |
| Bachelor's Degree or higher | 1,828 (87.8%) | 253 (12.2%) |
Occupancy by Age of Householder in Country Walk
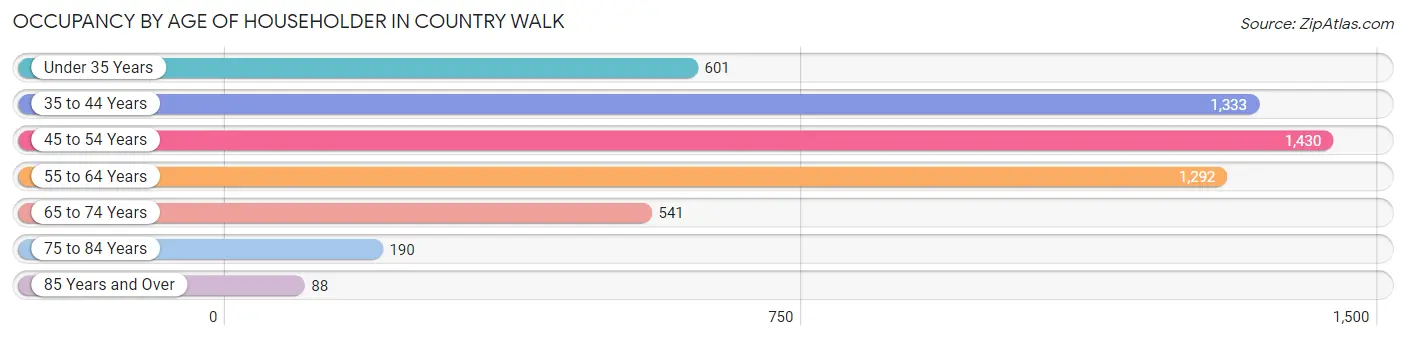
| Age Bracket | # Households | % Households |
| Under 35 Years | 601 | 11.0% |
| 35 to 44 Years | 1,333 | 24.3% |
| 45 to 54 Years | 1,430 | 26.1% |
| 55 to 64 Years | 1,292 | 23.6% |
| 65 to 74 Years | 541 | 9.9% |
| 75 to 84 Years | 190 | 3.5% |
| 85 Years and Over | 88 | 1.6% |
| Total | 5,475 | 100.0% |
Housing Finances in Country Walk
Median Income by Occupancy in Country Walk
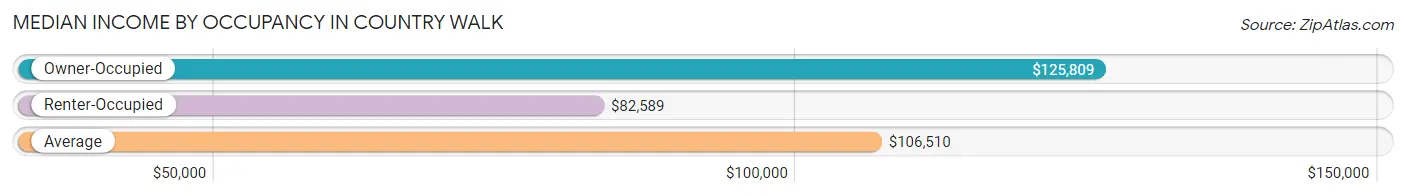
| Occupancy Type | # Households | Median Income |
| Owner-Occupied | 4,540 (82.9%) | $125,809 |
| Renter-Occupied | 935 (17.1%) | $82,589 |
| Average | 5,475 (100.0%) | $106,510 |
Occupancy by Householder Income Bracket in Country Walk
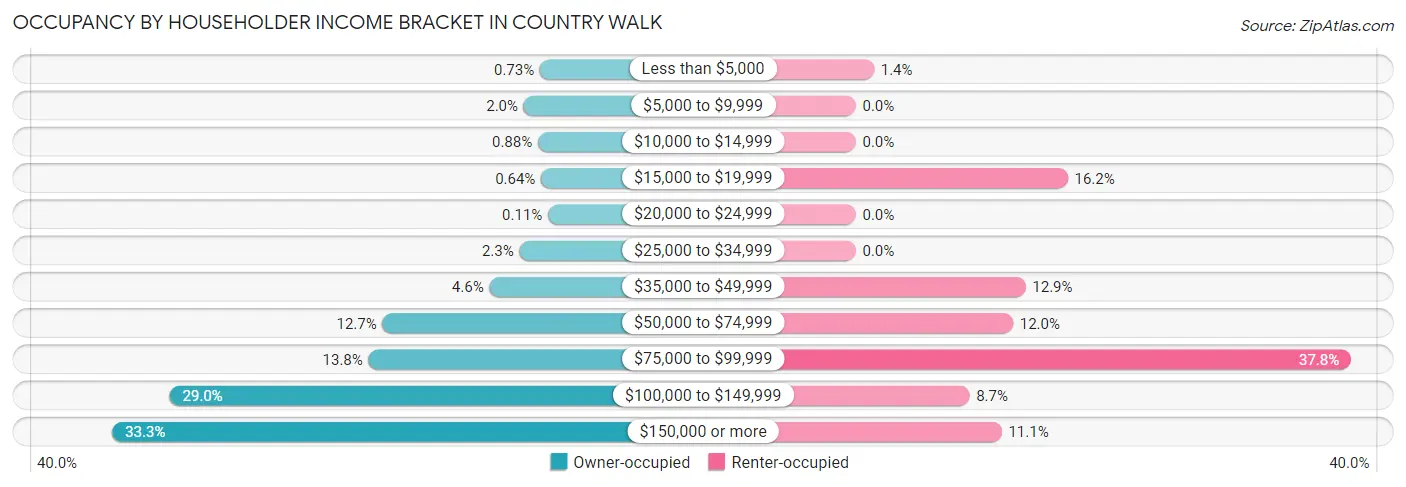
| Income Bracket | Owner-occupied | Renter-occupied |
| Less than $5,000 | 33 (0.7%) | 13 (1.4%) |
| $5,000 to $9,999 | 89 (2.0%) | 0 (0.0%) |
| $10,000 to $14,999 | 40 (0.9%) | 0 (0.0%) |
| $15,000 to $19,999 | 29 (0.6%) | 151 (16.2%) |
| $20,000 to $24,999 | 5 (0.1%) | 0 (0.0%) |
| $25,000 to $34,999 | 104 (2.3%) | 0 (0.0%) |
| $35,000 to $49,999 | 208 (4.6%) | 121 (12.9%) |
| $50,000 to $74,999 | 578 (12.7%) | 112 (12.0%) |
| $75,000 to $99,999 | 626 (13.8%) | 353 (37.8%) |
| $100,000 to $149,999 | 1,315 (29.0%) | 81 (8.7%) |
| $150,000 or more | 1,513 (33.3%) | 104 (11.1%) |
| Total | 4,540 (100.0%) | 935 (100.0%) |
Monthly Housing Cost Tiers in Country Walk
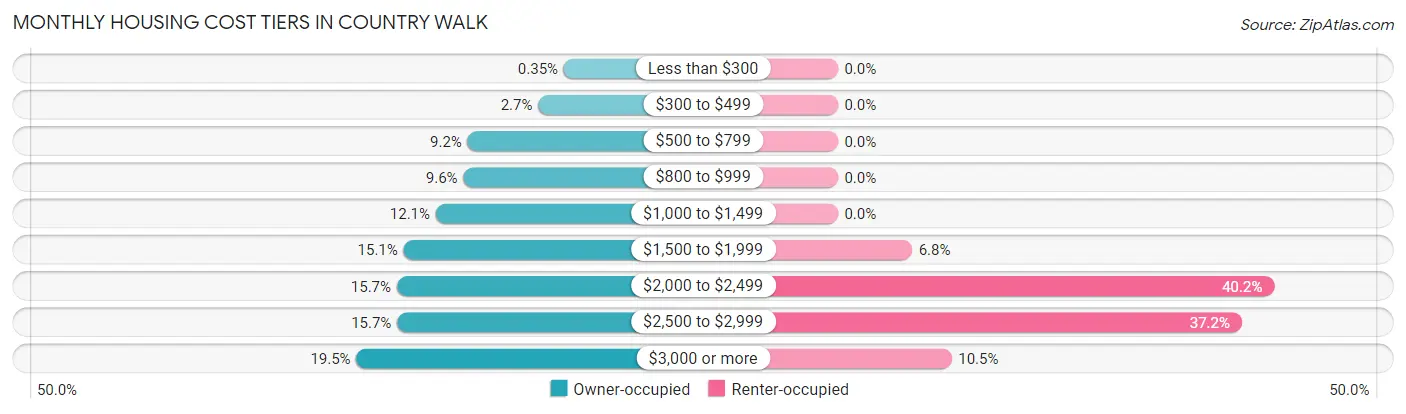
| Monthly Cost | Owner-occupied | Renter-occupied |
| Less than $300 | 16 (0.4%) | 0 (0.0%) |
| $300 to $499 | 123 (2.7%) | 0 (0.0%) |
| $500 to $799 | 418 (9.2%) | 0 (0.0%) |
| $800 to $999 | 436 (9.6%) | 0 (0.0%) |
| $1,000 to $1,499 | 551 (12.1%) | 0 (0.0%) |
| $1,500 to $1,999 | 686 (15.1%) | 64 (6.8%) |
| $2,000 to $2,499 | 714 (15.7%) | 376 (40.2%) |
| $2,500 to $2,999 | 713 (15.7%) | 348 (37.2%) |
| $3,000 or more | 883 (19.5%) | 98 (10.5%) |
| Total | 4,540 (100.0%) | 935 (100.0%) |
Physical Housing Characteristics in Country Walk
Housing Structures in Country Walk
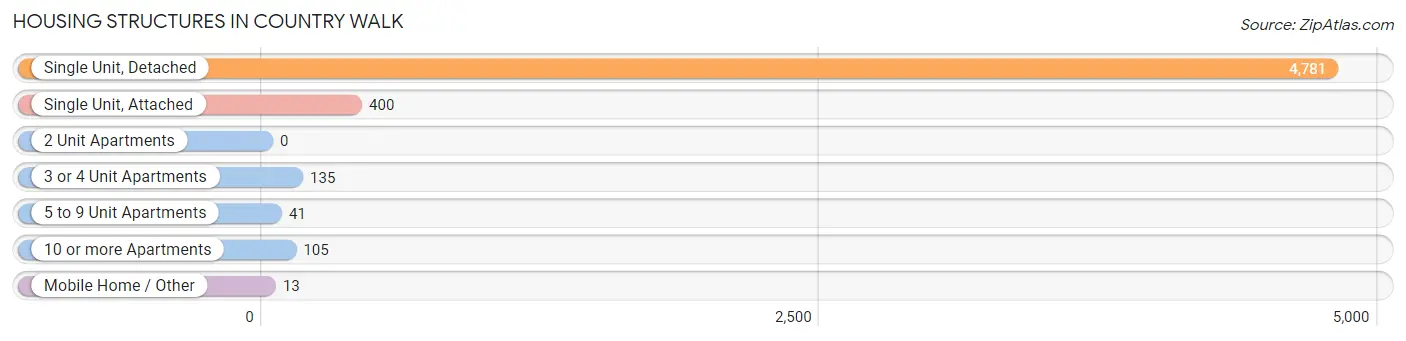
| Structure Type | # Housing Units | % Housing Units |
| Single Unit, Detached | 4,781 | 87.3% |
| Single Unit, Attached | 400 | 7.3% |
| 2 Unit Apartments | 0 | 0.0% |
| 3 or 4 Unit Apartments | 135 | 2.5% |
| 5 to 9 Unit Apartments | 41 | 0.7% |
| 10 or more Apartments | 105 | 1.9% |
| Mobile Home / Other | 13 | 0.2% |
| Total | 5,475 | 100.0% |
Housing Structures by Occupancy in Country Walk
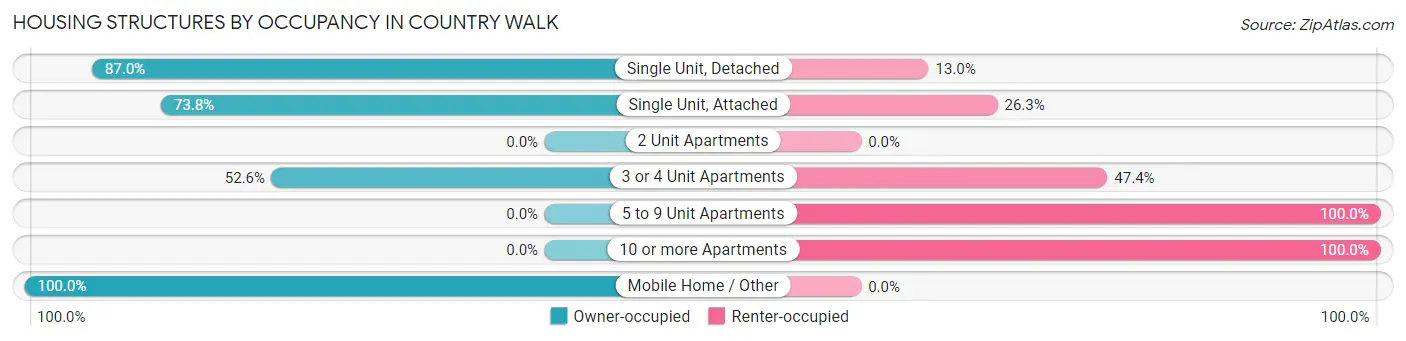
| Structure Type | Owner-occupied | Renter-occupied |
| Single Unit, Detached | 4,161 (87.0%) | 620 (13.0%) |
| Single Unit, Attached | 295 (73.8%) | 105 (26.3%) |
| 2 Unit Apartments | 0 (0.0%) | 0 (0.0%) |
| 3 or 4 Unit Apartments | 71 (52.6%) | 64 (47.4%) |
| 5 to 9 Unit Apartments | 0 (0.0%) | 41 (100.0%) |
| 10 or more Apartments | 0 (0.0%) | 105 (100.0%) |
| Mobile Home / Other | 13 (100.0%) | 0 (0.0%) |
| Total | 4,540 (82.9%) | 935 (17.1%) |
Housing Structures by Number of Rooms in Country Walk
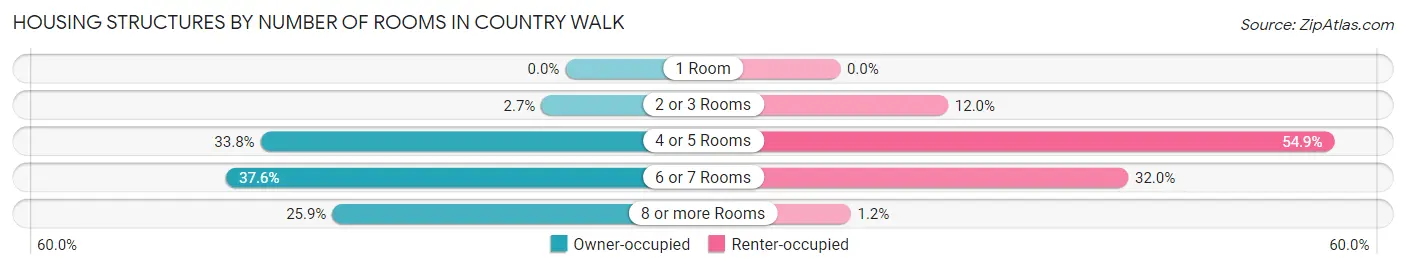
| Number of Rooms | Owner-occupied | Renter-occupied |
| 1 Room | 0 (0.0%) | 0 (0.0%) |
| 2 or 3 Rooms | 121 (2.7%) | 112 (12.0%) |
| 4 or 5 Rooms | 1,536 (33.8%) | 513 (54.9%) |
| 6 or 7 Rooms | 1,709 (37.6%) | 299 (32.0%) |
| 8 or more Rooms | 1,174 (25.9%) | 11 (1.2%) |
| Total | 4,540 (100.0%) | 935 (100.0%) |
Housing Structure by Heating Type in Country Walk
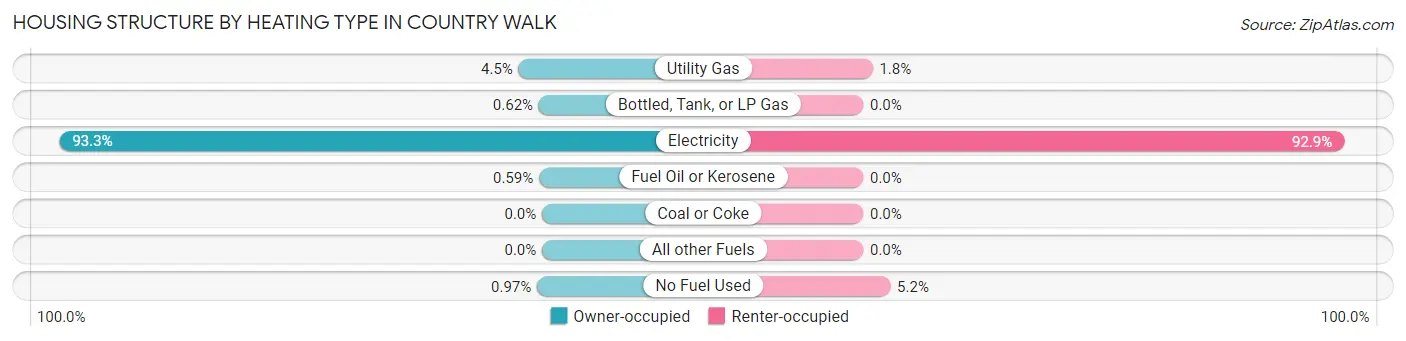
| Heating Type | Owner-occupied | Renter-occupied |
| Utility Gas | 205 (4.5%) | 17 (1.8%) |
| Bottled, Tank, or LP Gas | 28 (0.6%) | 0 (0.0%) |
| Electricity | 4,236 (93.3%) | 869 (92.9%) |
| Fuel Oil or Kerosene | 27 (0.6%) | 0 (0.0%) |
| Coal or Coke | 0 (0.0%) | 0 (0.0%) |
| All other Fuels | 0 (0.0%) | 0 (0.0%) |
| No Fuel Used | 44 (1.0%) | 49 (5.2%) |
| Total | 4,540 (100.0%) | 935 (100.0%) |
Household Vehicle Usage in Country Walk
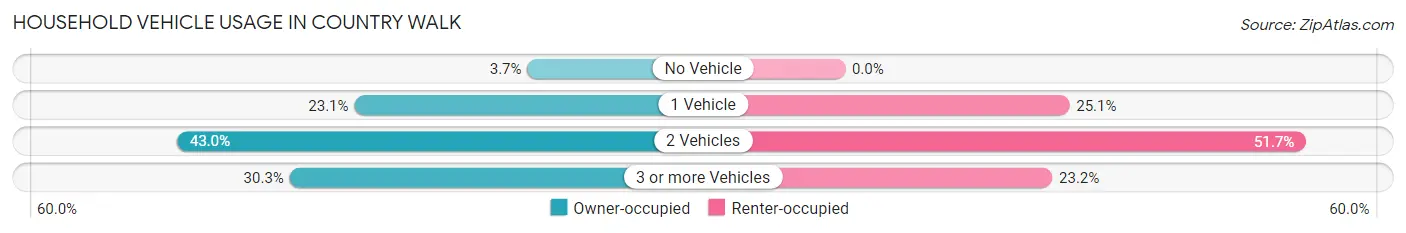
| Vehicles per Household | Owner-occupied | Renter-occupied |
| No Vehicle | 167 (3.7%) | 0 (0.0%) |
| 1 Vehicle | 1,047 (23.1%) | 235 (25.1%) |
| 2 Vehicles | 1,950 (42.9%) | 483 (51.7%) |
| 3 or more Vehicles | 1,376 (30.3%) | 217 (23.2%) |
| Total | 4,540 (100.0%) | 935 (100.0%) |
Real Estate & Mortgages in Country Walk
Real Estate and Mortgage Overview in Country Walk
| Characteristic | Without Mortgage | With Mortgage |
| Housing Units | 1,307 | 3,233 |
| Median Property Value | $444,600 | $450,200 |
| Median Household Income | $130,625 | $1,162 |
| Monthly Housing Costs | $880 | $883 |
| Real Estate Taxes | $3,787 | $0 |
Property Value by Mortgage Status in Country Walk
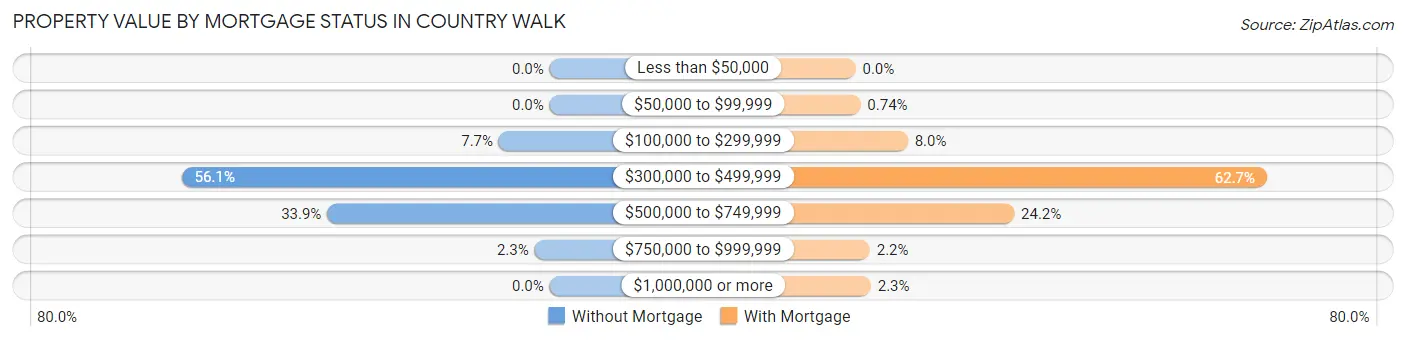
| Property Value | Without Mortgage | With Mortgage |
| Less than $50,000 | 0 (0.0%) | 0 (0.0%) |
| $50,000 to $99,999 | 0 (0.0%) | 24 (0.7%) |
| $100,000 to $299,999 | 101 (7.7%) | 257 (8.0%) |
| $300,000 to $499,999 | 733 (56.1%) | 2,026 (62.7%) |
| $500,000 to $749,999 | 443 (33.9%) | 781 (24.2%) |
| $750,000 to $999,999 | 30 (2.3%) | 70 (2.2%) |
| $1,000,000 or more | 0 (0.0%) | 75 (2.3%) |
| Total | 1,307 (100.0%) | 3,233 (100.0%) |
Household Income by Mortgage Status in Country Walk
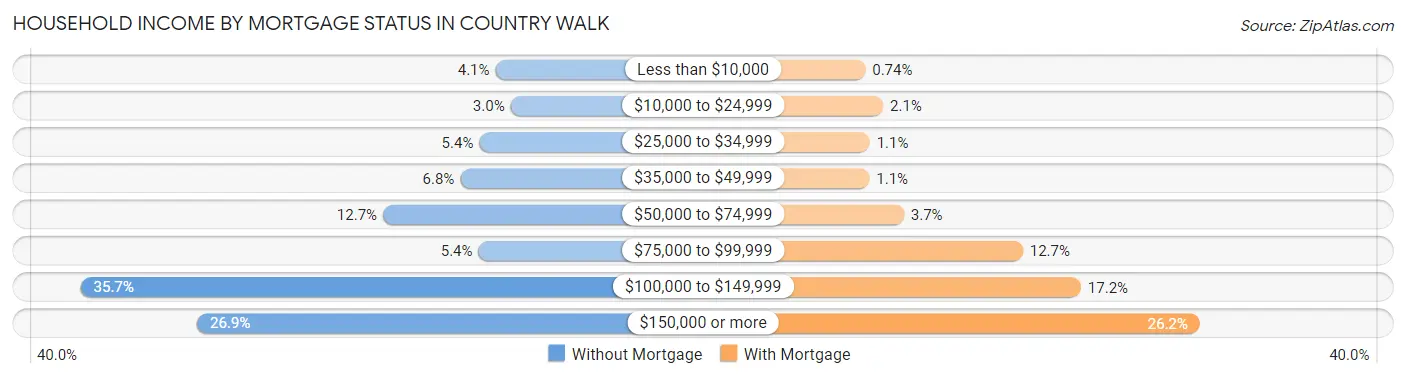
| Household Income | Without Mortgage | With Mortgage |
| Less than $10,000 | 54 (4.1%) | 24 (0.7%) |
| $10,000 to $24,999 | 39 (3.0%) | 68 (2.1%) |
| $25,000 to $34,999 | 70 (5.4%) | 35 (1.1%) |
| $35,000 to $49,999 | 89 (6.8%) | 34 (1.1%) |
| $50,000 to $74,999 | 166 (12.7%) | 119 (3.7%) |
| $75,000 to $99,999 | 71 (5.4%) | 412 (12.7%) |
| $100,000 to $149,999 | 467 (35.7%) | 555 (17.2%) |
| $150,000 or more | 351 (26.9%) | 848 (26.2%) |
| Total | 1,307 (100.0%) | 3,233 (100.0%) |
Property Value to Household Income Ratio in Country Walk
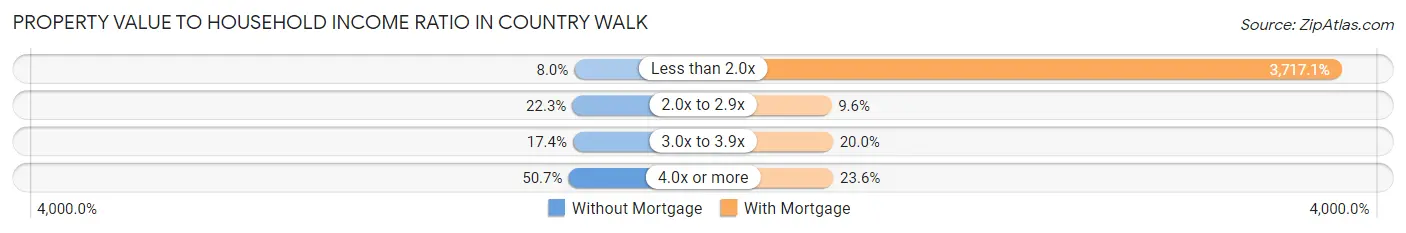
| Value-to-Income Ratio | Without Mortgage | With Mortgage |
| Less than 2.0x | 105 (8.0%) | 120,174 (3,717.1%) |
| 2.0x to 2.9x | 291 (22.3%) | 311 (9.6%) |
| 3.0x to 3.9x | 227 (17.4%) | 647 (20.0%) |
| 4.0x or more | 662 (50.6%) | 763 (23.6%) |
| Total | 1,307 (100.0%) | 3,233 (100.0%) |
Real Estate Taxes by Mortgage Status in Country Walk
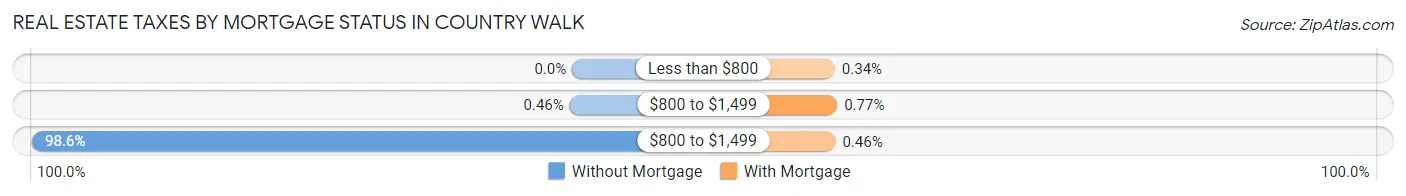
| Property Taxes | Without Mortgage | With Mortgage |
| Less than $800 | 0 (0.0%) | 11 (0.3%) |
| $800 to $1,499 | 6 (0.5%) | 25 (0.8%) |
| $800 to $1,499 | 1,289 (98.6%) | 15 (0.5%) |
| Total | 1,307 (100.0%) | 3,233 (100.0%) |
Health & Disability in Country Walk
Health Insurance Coverage by Age in Country Walk
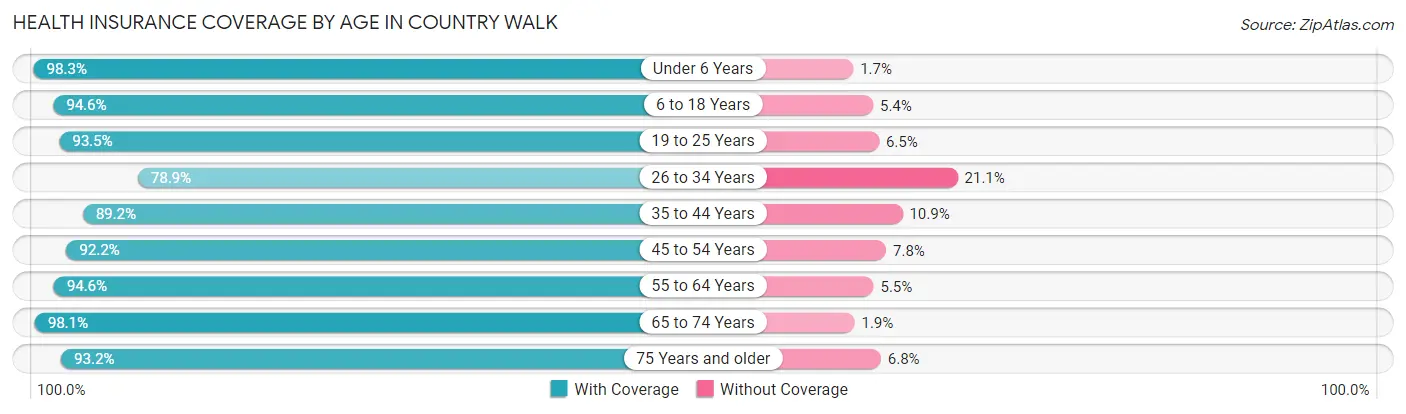
| Age Bracket | With Coverage | Without Coverage |
| Under 6 Years | 1,238 (98.3%) | 21 (1.7%) |
| 6 to 18 Years | 3,393 (94.6%) | 192 (5.4%) |
| 19 to 25 Years | 1,459 (93.5%) | 101 (6.5%) |
| 26 to 34 Years | 1,736 (78.9%) | 465 (21.1%) |
| 35 to 44 Years | 2,383 (89.1%) | 290 (10.8%) |
| 45 to 54 Years | 2,706 (92.2%) | 229 (7.8%) |
| 55 to 64 Years | 2,341 (94.6%) | 135 (5.4%) |
| 65 to 74 Years | 1,132 (98.1%) | 22 (1.9%) |
| 75 Years and older | 793 (93.2%) | 58 (6.8%) |
| Total | 17,181 (91.9%) | 1,513 (8.1%) |
Health Insurance Coverage by Citizenship Status in Country Walk
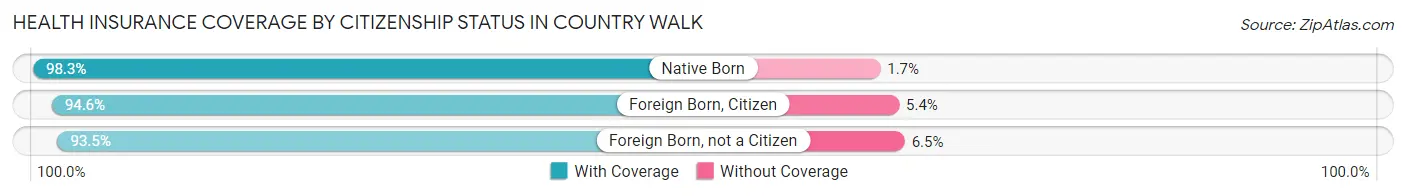
| Citizenship Status | With Coverage | Without Coverage |
| Native Born | 1,238 (98.3%) | 21 (1.7%) |
| Foreign Born, Citizen | 3,393 (94.6%) | 192 (5.4%) |
| Foreign Born, not a Citizen | 1,459 (93.5%) | 101 (6.5%) |
Health Insurance Coverage by Household Income in Country Walk
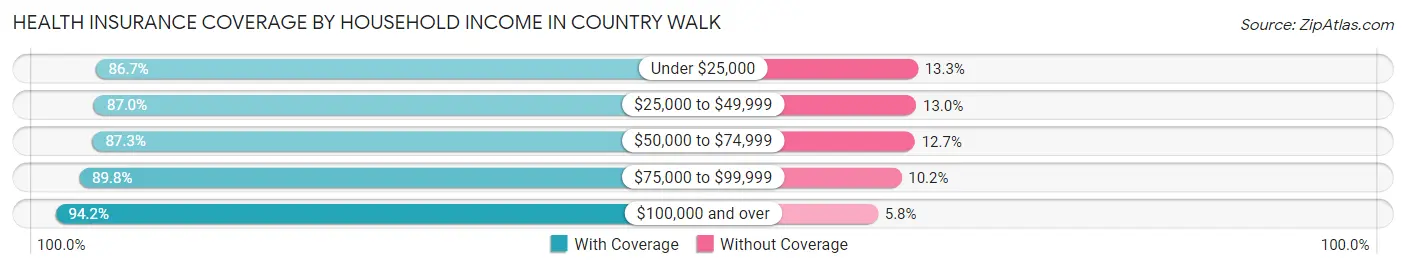
| Household Income | With Coverage | Without Coverage |
| Under $25,000 | 542 (86.7%) | 83 (13.3%) |
| $25,000 to $49,999 | 1,180 (87.0%) | 176 (13.0%) |
| $50,000 to $74,999 | 1,481 (87.3%) | 216 (12.7%) |
| $75,000 to $99,999 | 3,238 (89.8%) | 368 (10.2%) |
| $100,000 and over | 10,727 (94.2%) | 660 (5.8%) |
Public vs Private Health Insurance Coverage by Age in Country Walk
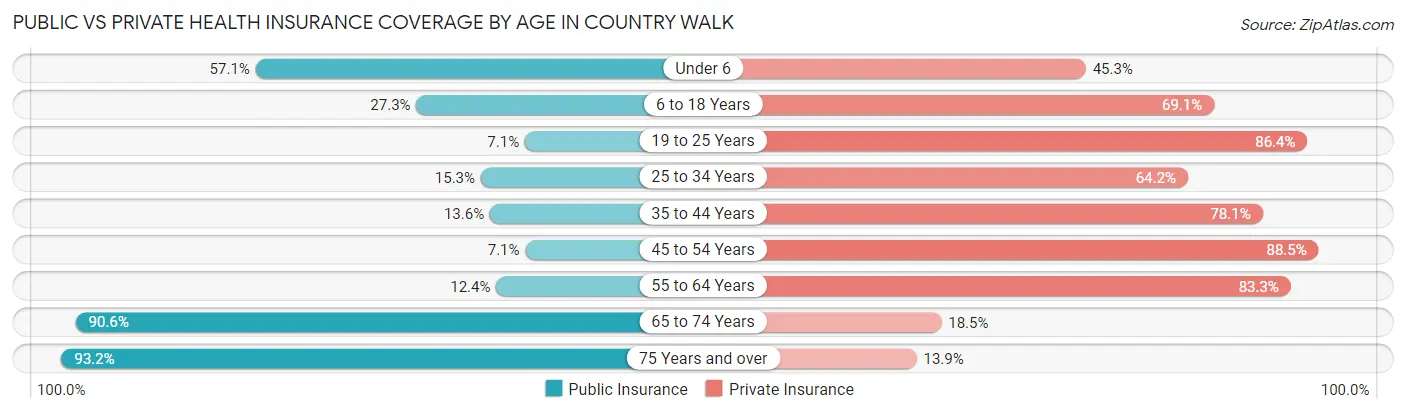
| Age Bracket | Public Insurance | Private Insurance |
| Under 6 | 719 (57.1%) | 570 (45.3%) |
| 6 to 18 Years | 978 (27.3%) | 2,477 (69.1%) |
| 19 to 25 Years | 111 (7.1%) | 1,348 (86.4%) |
| 25 to 34 Years | 337 (15.3%) | 1,414 (64.2%) |
| 35 to 44 Years | 364 (13.6%) | 2,087 (78.1%) |
| 45 to 54 Years | 207 (7.0%) | 2,597 (88.5%) |
| 55 to 64 Years | 308 (12.4%) | 2,063 (83.3%) |
| 65 to 74 Years | 1,045 (90.5%) | 213 (18.5%) |
| 75 Years and over | 793 (93.2%) | 118 (13.9%) |
| Total | 4,862 (26.0%) | 12,887 (68.9%) |
Disability Status by Sex by Age in Country Walk
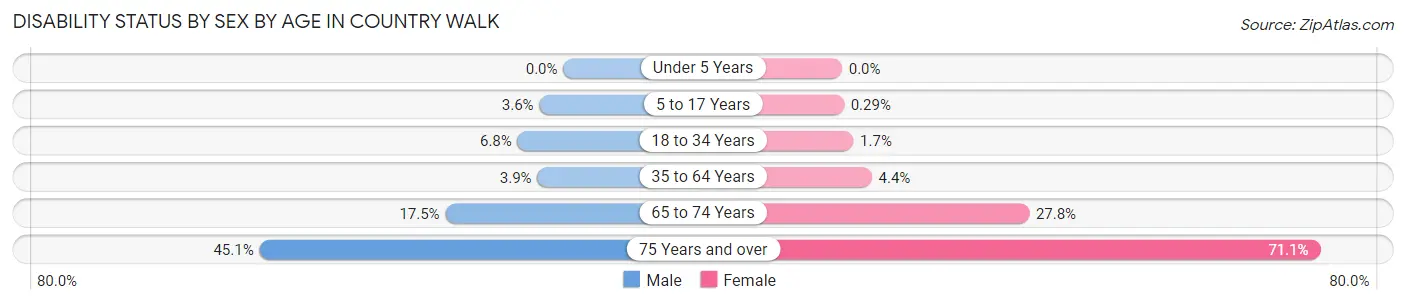
| Age Bracket | Male | Female |
| Under 5 Years | 0 (0.0%) | 0 (0.0%) |
| 5 to 17 Years | 65 (3.5%) | 5 (0.3%) |
| 18 to 34 Years | 153 (6.8%) | 29 (1.7%) |
| 35 to 64 Years | 161 (3.8%) | 173 (4.4%) |
| 65 to 74 Years | 83 (17.5%) | 189 (27.8%) |
| 75 Years and over | 111 (45.1%) | 430 (71.1%) |
Disability Class by Sex by Age in Country Walk
Disability Class: Hearing Difficulty
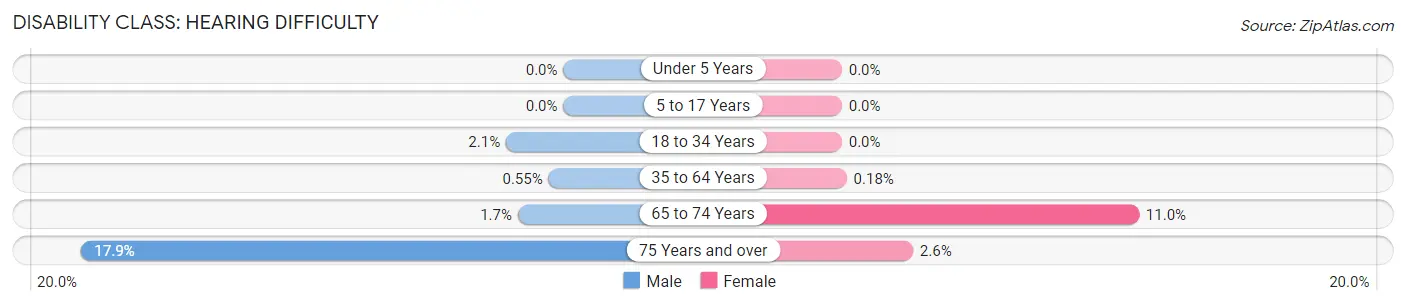
| Age Bracket | Male | Female |
| Under 5 Years | 0 (0.0%) | 0 (0.0%) |
| 5 to 17 Years | 0 (0.0%) | 0 (0.0%) |
| 18 to 34 Years | 48 (2.1%) | 0 (0.0%) |
| 35 to 64 Years | 23 (0.5%) | 7 (0.2%) |
| 65 to 74 Years | 8 (1.7%) | 75 (11.0%) |
| 75 Years and over | 44 (17.9%) | 16 (2.6%) |
Disability Class: Vision Difficulty
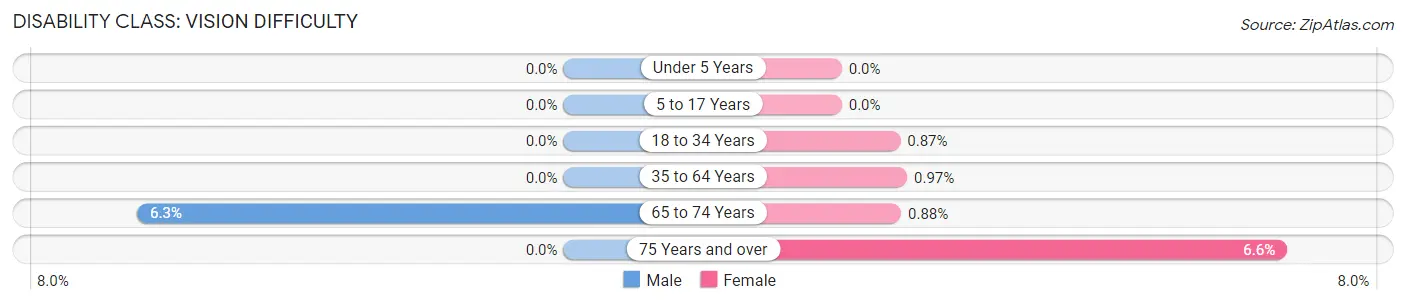
| Age Bracket | Male | Female |
| Under 5 Years | 0 (0.0%) | 0 (0.0%) |
| 5 to 17 Years | 0 (0.0%) | 0 (0.0%) |
| 18 to 34 Years | 0 (0.0%) | 15 (0.9%) |
| 35 to 64 Years | 0 (0.0%) | 38 (1.0%) |
| 65 to 74 Years | 30 (6.3%) | 6 (0.9%) |
| 75 Years and over | 0 (0.0%) | 40 (6.6%) |
Disability Class: Cognitive Difficulty
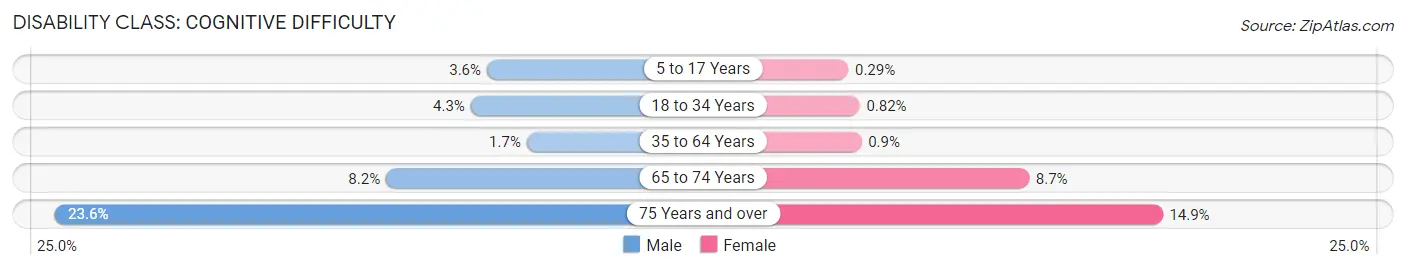
| Age Bracket | Male | Female |
| 5 to 17 Years | 65 (3.5%) | 5 (0.3%) |
| 18 to 34 Years | 97 (4.3%) | 14 (0.8%) |
| 35 to 64 Years | 71 (1.7%) | 35 (0.9%) |
| 65 to 74 Years | 39 (8.2%) | 59 (8.7%) |
| 75 Years and over | 58 (23.6%) | 90 (14.9%) |
Disability Class: Ambulatory Difficulty
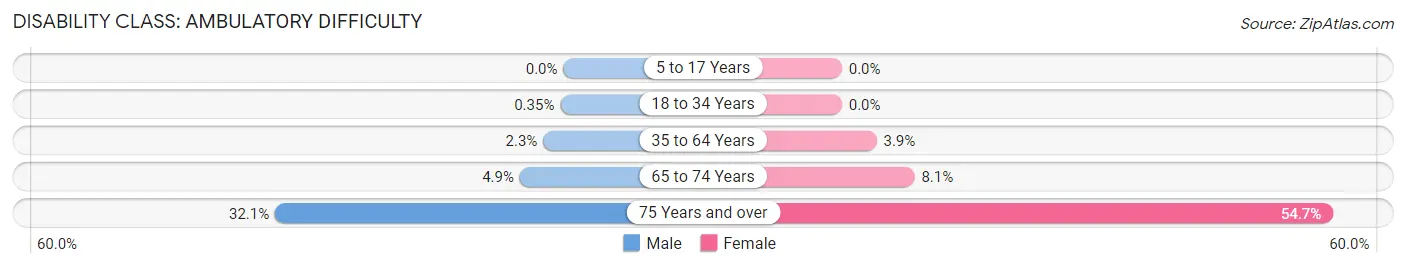
| Age Bracket | Male | Female |
| 5 to 17 Years | 0 (0.0%) | 0 (0.0%) |
| 18 to 34 Years | 8 (0.4%) | 0 (0.0%) |
| 35 to 64 Years | 94 (2.2%) | 151 (3.9%) |
| 65 to 74 Years | 23 (4.9%) | 55 (8.1%) |
| 75 Years and over | 79 (32.1%) | 331 (54.7%) |
Disability Class: Self-Care Difficulty
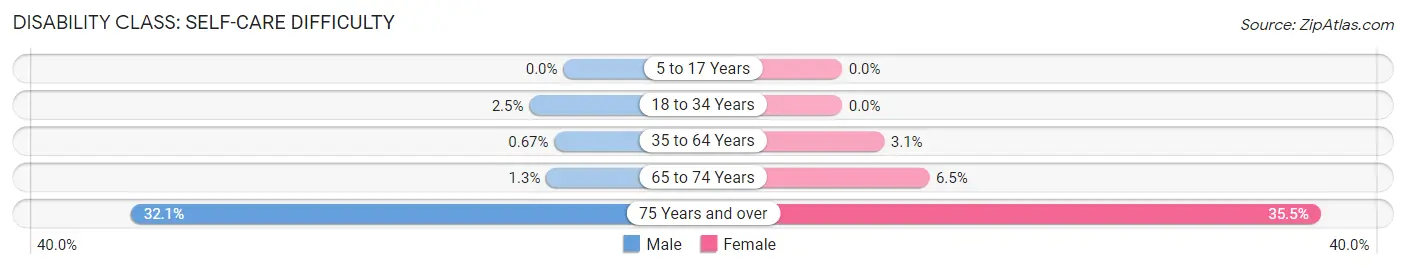
| Age Bracket | Male | Female |
| 5 to 17 Years | 0 (0.0%) | 0 (0.0%) |
| 18 to 34 Years | 57 (2.5%) | 0 (0.0%) |
| 35 to 64 Years | 28 (0.7%) | 122 (3.1%) |
| 65 to 74 Years | 6 (1.3%) | 44 (6.5%) |
| 75 Years and over | 79 (32.1%) | 215 (35.5%) |
Technology Access in Country Walk
Computing Device Access in Country Walk
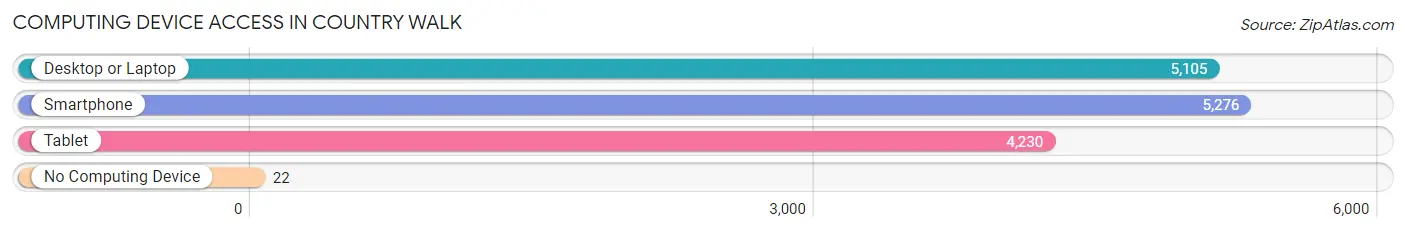
| Device Type | # Households | % Households |
| Desktop or Laptop | 5,105 | 93.2% |
| Smartphone | 5,276 | 96.4% |
| Tablet | 4,230 | 77.3% |
| No Computing Device | 22 | 0.4% |
| Total | 5,475 | 100.0% |
Internet Access in Country Walk
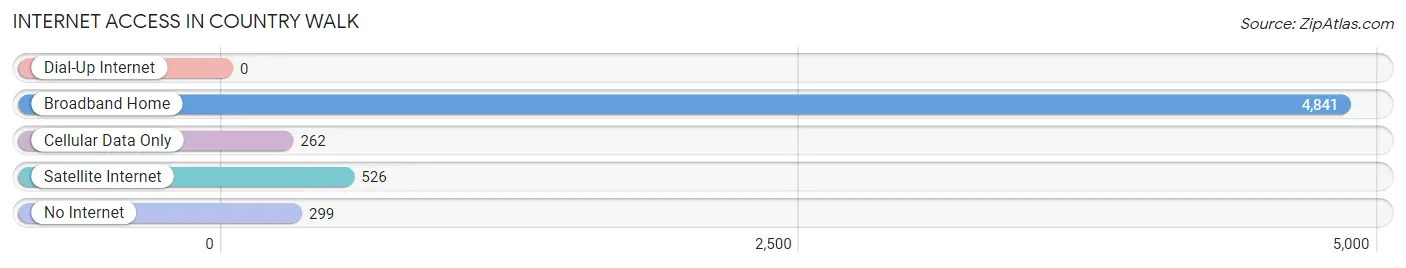
| Internet Type | # Households | % Households |
| Dial-Up Internet | 0 | 0.0% |
| Broadband Home | 4,841 | 88.4% |
| Cellular Data Only | 262 | 4.8% |
| Satellite Internet | 526 | 9.6% |
| No Internet | 299 | 5.5% |
| Total | 5,475 | 100.0% |
Country Walk Summary
Introduction
Located in Miami-Dade County, Florida, the census-designated place of Country Walk is a suburban community with a population of 8,945 as of the 2010 census. The community is located in the southern part of the county, just north of the Everglades and is bordered by the cities of Cutler Bay and Palmetto Bay. Country Walk is a relatively new community, having been established in the late 1970s. The community is known for its quiet, family-friendly atmosphere and its close proximity to the city of Miami.
History
Country Walk was established in the late 1970s by developer William J. Levitt. Levitt was a pioneer in the development of suburban communities in the United States, having developed the first Levittown in Long Island, New York in 1947. Levitt's development of Country Walk was part of a larger plan to develop the area south of Miami, which included the development of the nearby communities of Cutler Bay and Palmetto Bay.
The community was originally planned as a master-planned community, with a variety of housing options, including single-family homes, townhomes, and condominiums. The community was designed to be a self-contained community, with its own shopping center, schools, and recreational facilities.
Geography
Country Walk is located in the southern part of Miami-Dade County, just north of the Everglades. The community is bordered by the cities of Cutler Bay and Palmetto Bay. The community is located approximately 20 miles south of downtown Miami and is accessible via the Florida Turnpike and US 1.
The community is located on a flat, low-lying area, with an elevation of just 10 feet above sea level. The area is prone to flooding during the rainy season, and the community has implemented a variety of flood control measures, including the installation of drainage canals and pumps.
Economy
The economy of Country Walk is largely driven by the tourism industry, as the community is located in close proximity to the city of Miami and its many attractions. The community is also home to a variety of retail establishments, including a shopping center, restaurants, and other businesses.
The community is also home to a variety of professional services, including medical and legal services. The community is also home to a variety of educational institutions, including a public elementary school, a middle school, and a high school.
Demographics
As of the 2010 census, the population of Country Walk was 8,945. The population is largely Hispanic, with a majority of the population being of Cuban descent. The median household income in the community is $50,945, and the median home value is $220,000.
Conclusion
Country Walk is a suburban community located in Miami-Dade County, Florida. The community was established in the late 1970s and is known for its quiet, family-friendly atmosphere and its close proximity to the city of Miami. The economy of the community is largely driven by the tourism industry, and the population is largely Hispanic, with a majority of the population being of Cuban descent.
Common Questions
What is Per Capita Income in Country Walk?
Per Capita income in Country Walk is $40,543.
What is the Median Family Income in Country Walk?
Median Family Income in Country Walk is $116,360.
What is the Median Household income in Country Walk?
Median Household Income in Country Walk is $106,510.
What is Income or Wage Gap in Country Walk?
Income or Wage Gap in Country Walk is 21.1%.
Women in Country Walk earn 78.9 cents for every dollar earned by a man.
What is Inequality or Gini Index in Country Walk?
Inequality or Gini Index in Country Walk is 0.38.
What is the Total Population of Country Walk?
Total Population of Country Walk is 18,719.
What is the Total Male Population of Country Walk?
Total Male Population of Country Walk is 9,635.
What is the Total Female Population of Country Walk?
Total Female Population of Country Walk is 9,084.
What is the Ratio of Males per 100 Females in Country Walk?
There are 106.07 Males per 100 Females in Country Walk.
What is the Ratio of Females per 100 Males in Country Walk?
There are 94.28 Females per 100 Males in Country Walk.
What is the Median Population Age in Country Walk?
Median Population Age in Country Walk is 38.0 Years.
What is the Average Family Size in Country Walk
Average Family Size in Country Walk is 3.6 People.
What is the Average Household Size in Country Walk
Average Household Size in Country Walk is 3.4 People.
How Large is the Labor Force in Country Walk?
There are 9,796 People in the Labor Forcein in Country Walk.
What is the Percentage of People in the Labor Force in Country Walk?
66.8% of People are in the Labor Force in Country Walk.
What is the Unemployment Rate in Country Walk?
Unemployment Rate in Country Walk is 3.4%.