Dillon, CO Map & Demographics
Dillon Map
Dillon Overview
$56,864
PER CAPITA INCOME
$115,677
AVG FAMILY INCOME
$79,792
AVG HOUSEHOLD INCOME
34.7%
WAGE / INCOME GAP [ % ]
65.3¢/ $1
WAGE / INCOME GAP [ $ ]
0.44
INEQUALITY / GINI INDEX
831
TOTAL POPULATION
465
MALE POPULATION
366
FEMALE POPULATION
127.05
MALES / 100 FEMALES
78.71
FEMALES / 100 MALES
49.9
MEDIAN AGE
2.4
AVG FAMILY SIZE
2.2
AVG HOUSEHOLD SIZE
500
LABOR FORCE [ PEOPLE ]
61.3%
PERCENT IN LABOR FORCE
4.6%
UNEMPLOYMENT RATE
Dillon Zip Codes
Dillon Area Codes
Income in Dillon
Income Overview in Dillon
Per Capita Income in Dillon is $56,864, while median incomes of families and households are $115,677 and $79,792 respectively.
| Characteristic | Number | Measure |
| Per Capita Income | 831 | $56,864 |
| Median Family Income | 155 | $115,677 |
| Mean Family Income | 155 | $129,541 |
| Median Household Income | 379 | $79,792 |
| Mean Household Income | 379 | $100,025 |
| Income Deficit | 155 | $0 |
| Wage / Income Gap (%) | 831 | 34.65% |
| Wage / Income Gap ($) | 831 | 65.35¢ per $1 |
| Gini / Inequality Index | 831 | 0.44 |
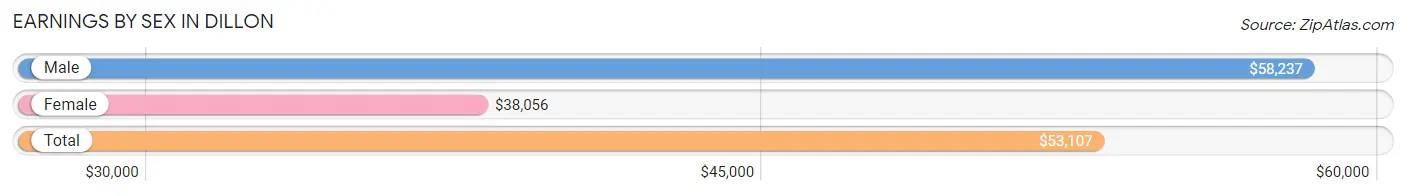
Earnings by Sex in Dillon
Average Earnings in Dillon are $53,107, $58,237 for men and $38,056 for women, a difference of 34.6%.
| Sex | Number | Average Earnings |
| Male | 315 (62.9%) | $58,237 |
| Female | 186 (37.1%) | $38,056 |
| Total | 501 (100.0%) | $53,107 |
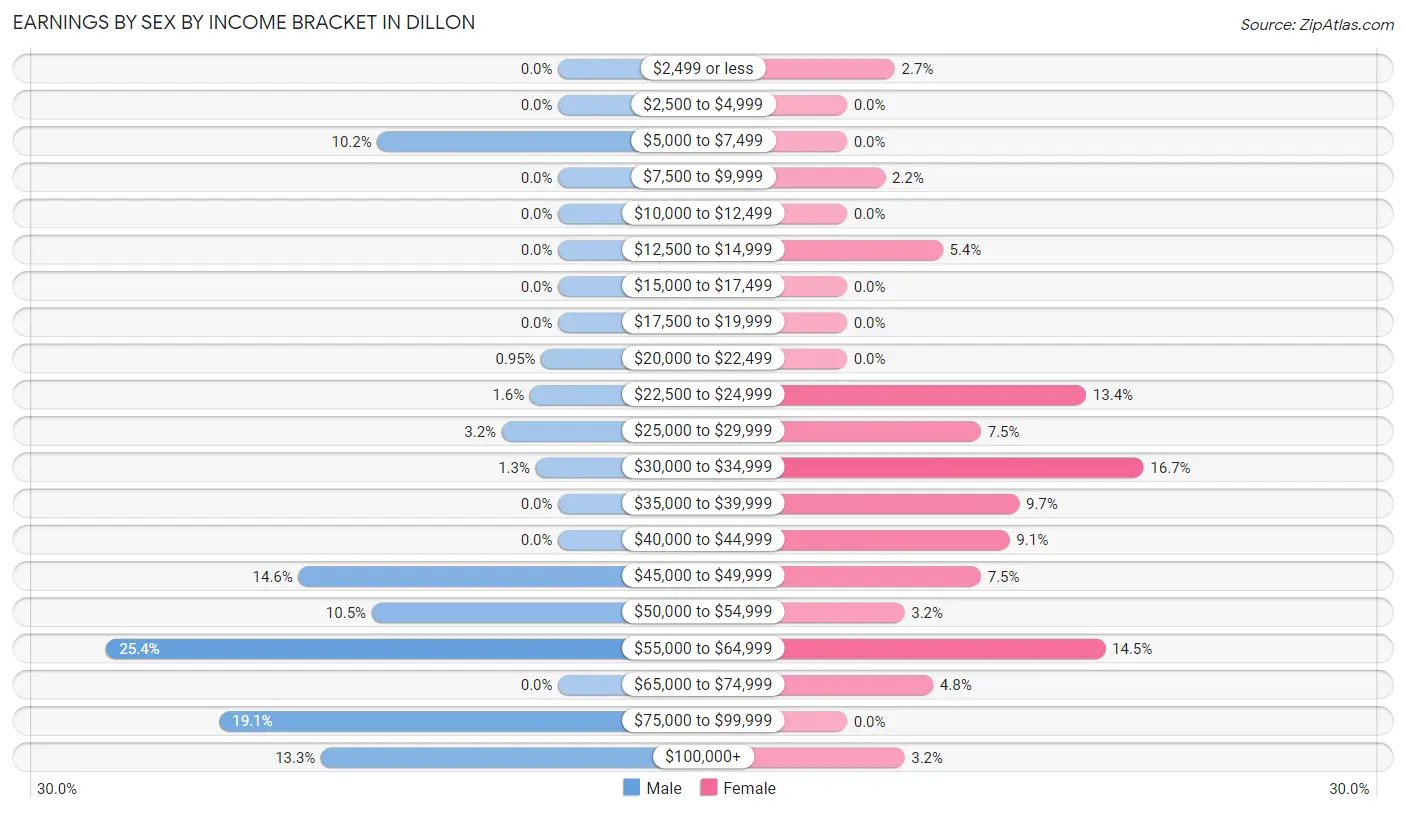
Earnings by Sex by Income Bracket in Dillon
The most common earnings brackets in Dillon are $55,000 to $64,999 for men (80 | 25.4%) and $30,000 to $34,999 for women (31 | 16.7%).
| Income | Male | Female |
| $2,499 or less | 0 (0.0%) | 5 (2.7%) |
| $2,500 to $4,999 | 0 (0.0%) | 0 (0.0%) |
| $5,000 to $7,499 | 32 (10.2%) | 0 (0.0%) |
| $7,500 to $9,999 | 0 (0.0%) | 4 (2.1%) |
| $10,000 to $12,499 | 0 (0.0%) | 0 (0.0%) |
| $12,500 to $14,999 | 0 (0.0%) | 10 (5.4%) |
| $15,000 to $17,499 | 0 (0.0%) | 0 (0.0%) |
| $17,500 to $19,999 | 0 (0.0%) | 0 (0.0%) |
| $20,000 to $22,499 | 3 (0.9%) | 0 (0.0%) |
| $22,500 to $24,999 | 5 (1.6%) | 25 (13.4%) |
| $25,000 to $29,999 | 10 (3.2%) | 14 (7.5%) |
| $30,000 to $34,999 | 4 (1.3%) | 31 (16.7%) |
| $35,000 to $39,999 | 0 (0.0%) | 18 (9.7%) |
| $40,000 to $44,999 | 0 (0.0%) | 17 (9.1%) |
| $45,000 to $49,999 | 46 (14.6%) | 14 (7.5%) |
| $50,000 to $54,999 | 33 (10.5%) | 6 (3.2%) |
| $55,000 to $64,999 | 80 (25.4%) | 27 (14.5%) |
| $65,000 to $74,999 | 0 (0.0%) | 9 (4.8%) |
| $75,000 to $99,999 | 60 (19.1%) | 0 (0.0%) |
| $100,000+ | 42 (13.3%) | 6 (3.2%) |
| Total | 315 (100.0%) | 186 (100.0%) |
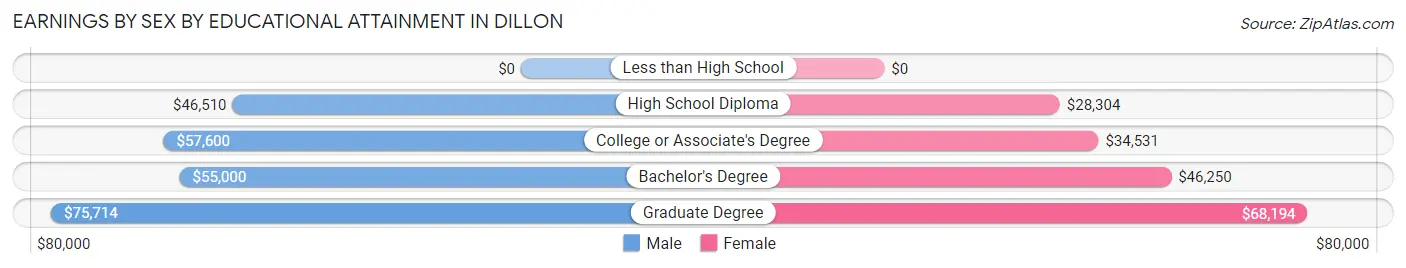
Earnings by Sex by Educational Attainment in Dillon
Average earnings in Dillon are $58,144 for men and $38,472 for women, a difference of 33.8%. Men with an educational attainment of graduate degree enjoy the highest average annual earnings of $75,714, while those with high school diploma education earn the least with $46,510. Women with an educational attainment of graduate degree earn the most with the average annual earnings of $68,194, while those with high school diploma education have the smallest earnings of $28,304.
| Educational Attainment | Male Income | Female Income |
| Less than High School | - | - |
| High School Diploma | $46,510 | $28,304 |
| College or Associate's Degree | $57,600 | $34,531 |
| Bachelor's Degree | $55,000 | $46,250 |
| Graduate Degree | $75,714 | $68,194 |
| Total | $58,144 | $38,472 |
Family Income in Dillon
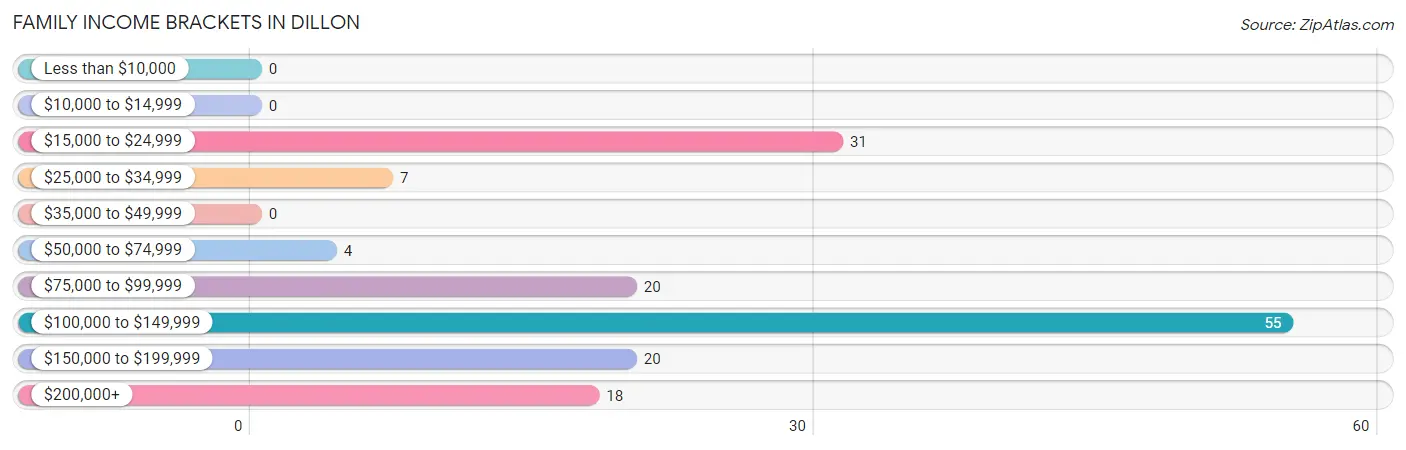
Family Income Brackets in Dillon
According to the Dillon family income data, there are 55 families falling into the $100,000 to $149,999 income range, which is the most common income bracket and makes up 35.5% of all families.
| Income Bracket | # Families | % Families |
| Less than $10,000 | 0 | 0.0% |
| $10,000 to $14,999 | 0 | 0.0% |
| $15,000 to $24,999 | 31 | 20.0% |
| $25,000 to $34,999 | 7 | 4.5% |
| $35,000 to $49,999 | 0 | 0.0% |
| $50,000 to $74,999 | 4 | 2.6% |
| $75,000 to $99,999 | 20 | 12.9% |
| $100,000 to $149,999 | 55 | 35.5% |
| $150,000 to $199,999 | 20 | 12.9% |
| $200,000+ | 18 | 11.6% |
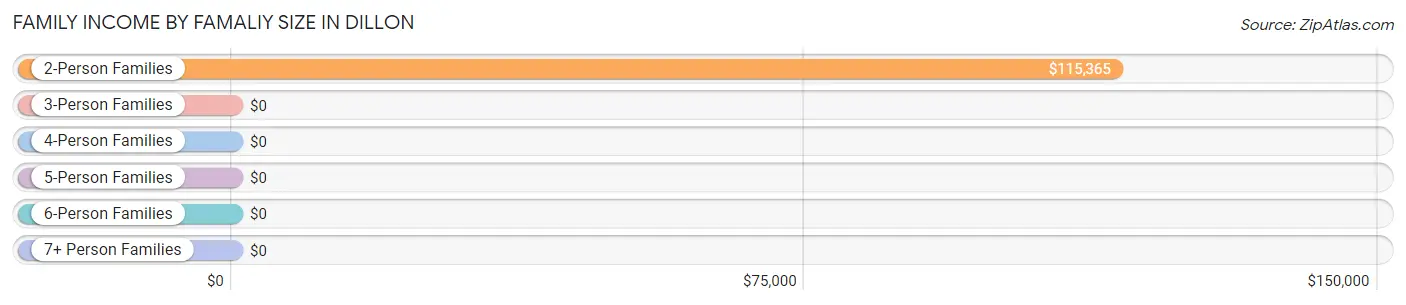
Family Income by Famaliy Size in Dillon
2-person families (141 | 91.0%) account for the highest median family income in Dillon with $115,365 per family, while 2-person families (141 | 91.0%) have the highest median income of $57,682 per family member.
| Income Bracket | # Families | Median Income |
| 2-Person Families | 141 (91.0%) | $115,365 |
| 3-Person Families | 4 (2.6%) | $0 |
| 4-Person Families | 10 (6.5%) | $0 |
| 5-Person Families | 0 (0.0%) | $0 |
| 6-Person Families | 0 (0.0%) | $0 |
| 7+ Person Families | 0 (0.0%) | $0 |
| Total | 155 (100.0%) | $115,677 |
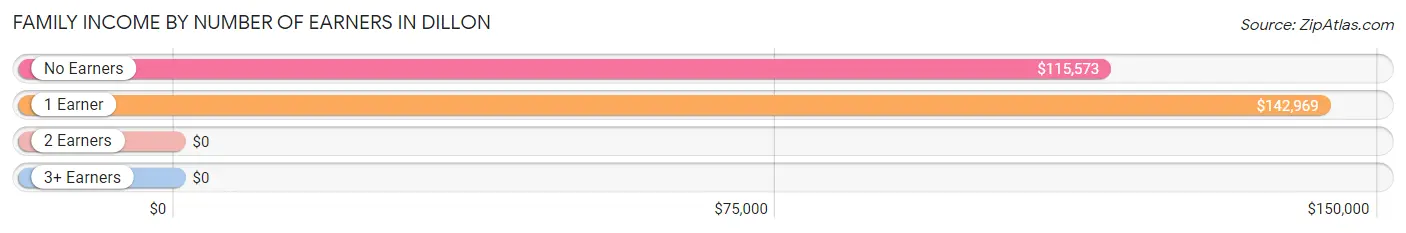
Family Income by Number of Earners in Dillon
| Number of Earners | # Families | Median Income |
| No Earners | 85 (54.8%) | $115,573 |
| 1 Earner | 21 (13.6%) | $142,969 |
| 2 Earners | 39 (25.2%) | $0 |
| 3+ Earners | 10 (6.5%) | $0 |
| Total | 155 (100.0%) | $115,677 |
Household Income in Dillon
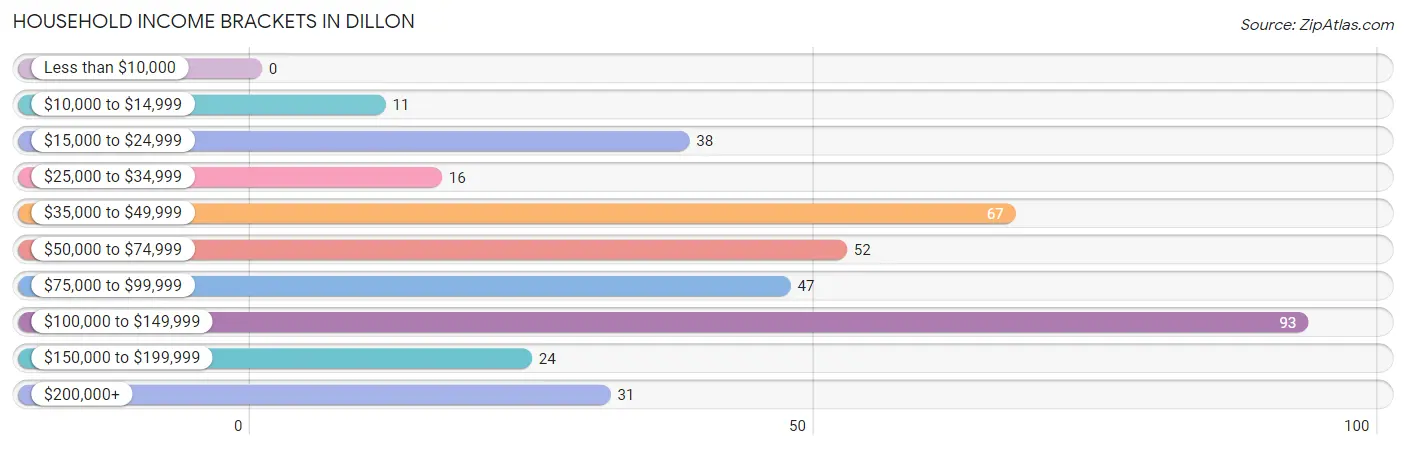
Household Income Brackets in Dillon
With 93 households falling in the category, the $100,000 to $149,999 income range is the most frequent in Dillon, accounting for 24.5% of all households.
| Income Bracket | # Households | % Households |
| Less than $10,000 | 0 | 0.0% |
| $10,000 to $14,999 | 11 | 2.9% |
| $15,000 to $24,999 | 38 | 10.0% |
| $25,000 to $34,999 | 16 | 4.2% |
| $35,000 to $49,999 | 67 | 17.7% |
| $50,000 to $74,999 | 52 | 13.7% |
| $75,000 to $99,999 | 47 | 12.4% |
| $100,000 to $149,999 | 93 | 24.5% |
| $150,000 to $199,999 | 24 | 6.3% |
| $200,000+ | 31 | 8.2% |
Household Income by Householder Age in Dillon
The median household income in Dillon is $79,792, with the highest median household income of $91,964 found in the 45 to 64 years age bracket for the primary householder. A total of 128 households (33.8%) fall into this category. Meanwhile, the 15 to 24 years age bracket for the primary householder has the lowest median household income of $0, with 6 households (1.6%) in this group.
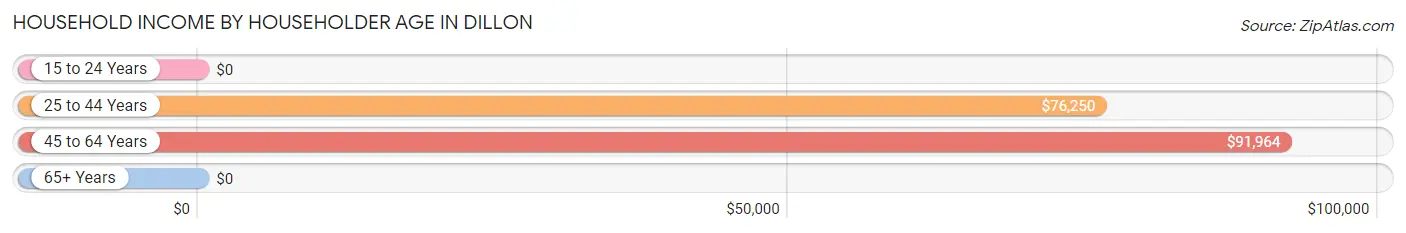
| Income Bracket | # Households | Median Income |
| 15 to 24 Years | 6 (1.6%) | $0 |
| 25 to 44 Years | 112 (29.5%) | $76,250 |
| 45 to 64 Years | 128 (33.8%) | $91,964 |
| 65+ Years | 133 (35.1%) | $0 |
| Total | 379 (100.0%) | $79,792 |
Poverty in Dillon
Income Below Poverty by Sex and Age in Dillon
With 12.5% poverty level for males and 2.7% for females among the residents of Dillon, 55 to 64 year old males and 25 to 34 year old females are the most vulnerable to poverty, with 26 males (30.9%) and 10 females (10.1%) in their respective age groups living below the poverty level.
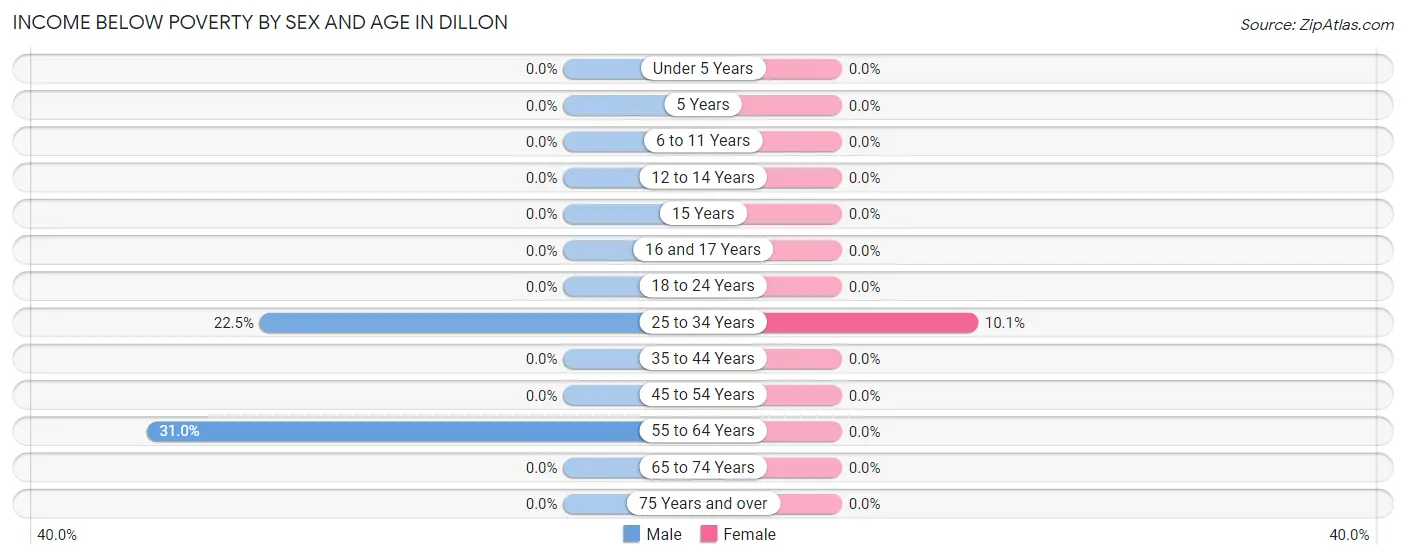
| Age Bracket | Male | Female |
| Under 5 Years | 0 (0.0%) | 0 (0.0%) |
| 5 Years | 0 (0.0%) | 0 (0.0%) |
| 6 to 11 Years | 0 (0.0%) | 0 (0.0%) |
| 12 to 14 Years | 0 (0.0%) | 0 (0.0%) |
| 15 Years | 0 (0.0%) | 0 (0.0%) |
| 16 and 17 Years | 0 (0.0%) | 0 (0.0%) |
| 18 to 24 Years | 0 (0.0%) | 0 (0.0%) |
| 25 to 34 Years | 32 (22.5%) | 10 (10.1%) |
| 35 to 44 Years | 0 (0.0%) | 0 (0.0%) |
| 45 to 54 Years | 0 (0.0%) | 0 (0.0%) |
| 55 to 64 Years | 26 (30.9%) | 0 (0.0%) |
| 65 to 74 Years | 0 (0.0%) | 0 (0.0%) |
| 75 Years and over | 0 (0.0%) | 0 (0.0%) |
| Total | 58 (12.5%) | 10 (2.7%) |
Income Above Poverty by Sex and Age in Dillon
According to the poverty statistics in Dillon, males aged 6 to 11 years and females aged under 5 years are the age groups that are most secure financially, with 100.0% of males and 100.0% of females in these age groups living above the poverty line.
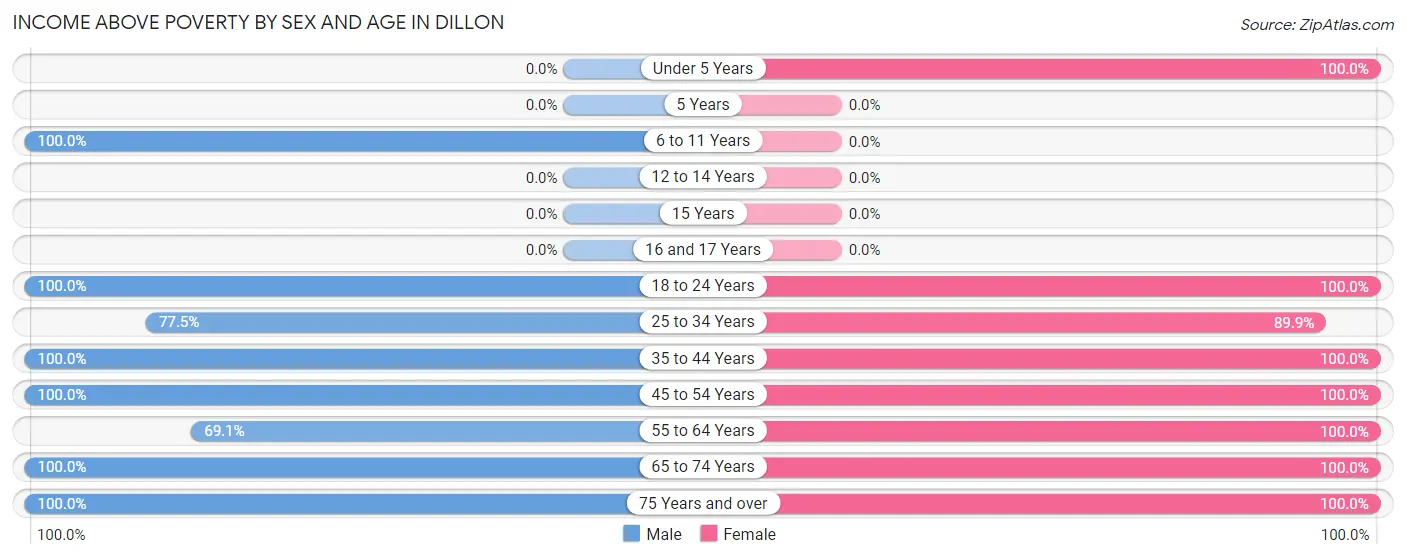
| Age Bracket | Male | Female |
| Under 5 Years | 0 (0.0%) | 8 (100.0%) |
| 5 Years | 0 (0.0%) | 0 (0.0%) |
| 6 to 11 Years | 8 (100.0%) | 0 (0.0%) |
| 12 to 14 Years | 0 (0.0%) | 0 (0.0%) |
| 15 Years | 0 (0.0%) | 0 (0.0%) |
| 16 and 17 Years | 0 (0.0%) | 0 (0.0%) |
| 18 to 24 Years | 6 (100.0%) | 6 (100.0%) |
| 25 to 34 Years | 110 (77.5%) | 89 (89.9%) |
| 35 to 44 Years | 71 (100.0%) | 16 (100.0%) |
| 45 to 54 Years | 58 (100.0%) | 38 (100.0%) |
| 55 to 64 Years | 58 (69.1%) | 103 (100.0%) |
| 65 to 74 Years | 34 (100.0%) | 58 (100.0%) |
| 75 Years and over | 62 (100.0%) | 38 (100.0%) |
| Total | 407 (87.5%) | 356 (97.3%) |
Income Below Poverty Among Married-Couple Families in Dillon
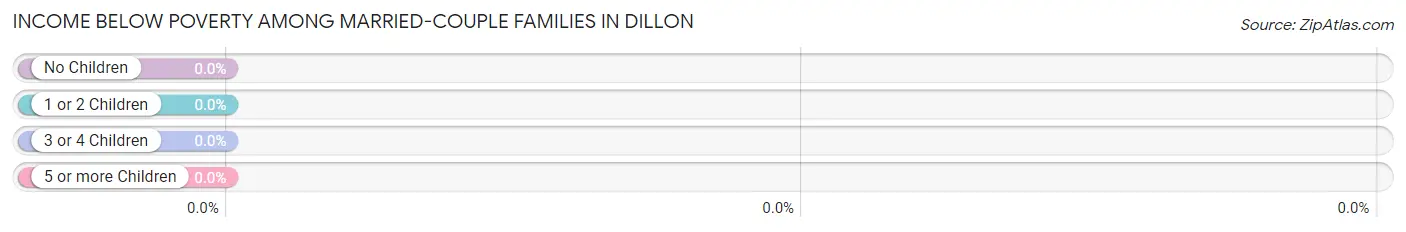
| Children | Above Poverty | Below Poverty |
| No Children | 128 (100.0%) | 0 (0.0%) |
| 1 or 2 Children | 4 (100.0%) | 0 (0.0%) |
| 3 or 4 Children | 0 (0.0%) | 0 (0.0%) |
| 5 or more Children | 0 (0.0%) | 0 (0.0%) |
| Total | 132 (100.0%) | 0 (0.0%) |
Income Below Poverty Among Single-Parent Households in Dillon
| Children | Single Father | Single Mother |
| No Children | 0 (0.0%) | 0 (0.0%) |
| 1 or 2 Children | 0 (0.0%) | 0 (0.0%) |
| 3 or 4 Children | 0 (0.0%) | 0 (0.0%) |
| 5 or more Children | 0 (0.0%) | 0 (0.0%) |
| Total | 0 (0.0%) | 0 (0.0%) |
Income Below Poverty Among Married-Couple vs Single-Parent Households in Dillon
| Children | Married-Couple Families | Single-Parent Households |
| No Children | 0 (0.0%) | 0 (0.0%) |
| 1 or 2 Children | 0 (0.0%) | 0 (0.0%) |
| 3 or 4 Children | 0 (0.0%) | 0 (0.0%) |
| 5 or more Children | 0 (0.0%) | 0 (0.0%) |
| Total | 0 (0.0%) | 0 (0.0%) |
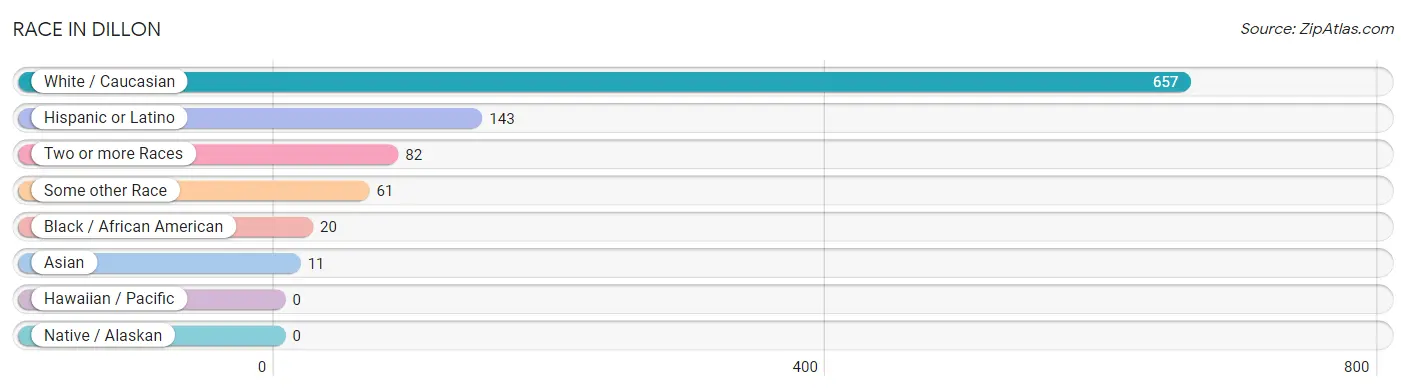
Race in Dillon
The most populous races in Dillon are White / Caucasian (657 | 79.1%), Hispanic or Latino (143 | 17.2%), and Two or more Races (82 | 9.9%).
| Race | # Population | % Population |
| Asian | 11 | 1.3% |
| Black / African American | 20 | 2.4% |
| Hawaiian / Pacific | 0 | 0.0% |
| Hispanic or Latino | 143 | 17.2% |
| Native / Alaskan | 0 | 0.0% |
| White / Caucasian | 657 | 79.1% |
| Two or more Races | 82 | 9.9% |
| Some other Race | 61 | 7.3% |
| Total | 831 | 100.0% |
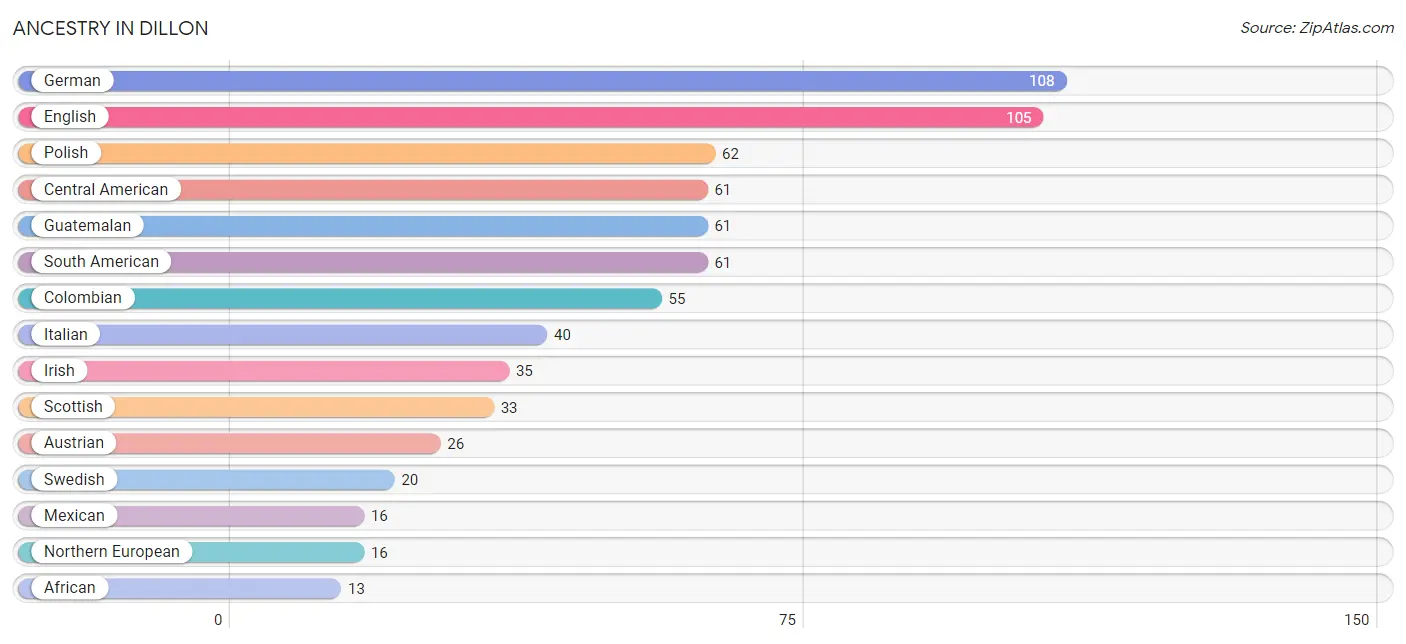
Ancestry in Dillon
The most populous ancestries reported in Dillon are German (108 | 13.0%), English (105 | 12.6%), Polish (62 | 7.5%), Central American (61 | 7.3%), and Guatemalan (61 | 7.3%), together accounting for 47.8% of all Dillon residents.
| Ancestry | # Population | % Population |
| African | 13 | 1.6% |
| American | 7 | 0.8% |
| Austrian | 26 | 3.1% |
| Central American | 61 | 7.3% |
| Colombian | 55 | 6.6% |
| Czech | 11 | 1.3% |
| Danish | 2 | 0.2% |
| Dutch | 10 | 1.2% |
| English | 105 | 12.6% |
| Finnish | 10 | 1.2% |
| French Canadian | 8 | 1.0% |
| German | 108 | 13.0% |
| Guatemalan | 61 | 7.3% |
| Hungarian | 6 | 0.7% |
| Irish | 35 | 4.2% |
| Italian | 40 | 4.8% |
| Mexican | 16 | 1.9% |
| Northern European | 16 | 1.9% |
| Norwegian | 10 | 1.2% |
| Peruvian | 6 | 0.7% |
| Polish | 62 | 7.5% |
| Scottish | 33 | 4.0% |
| South American | 61 | 7.3% |
| Spaniard | 5 | 0.6% |
| Sri Lankan | 11 | 1.3% |
| Subsaharan African | 13 | 1.6% |
| Swedish | 20 | 2.4% |
| Welsh | 12 | 1.4% | View All 28 Rows |
Immigrants in Dillon
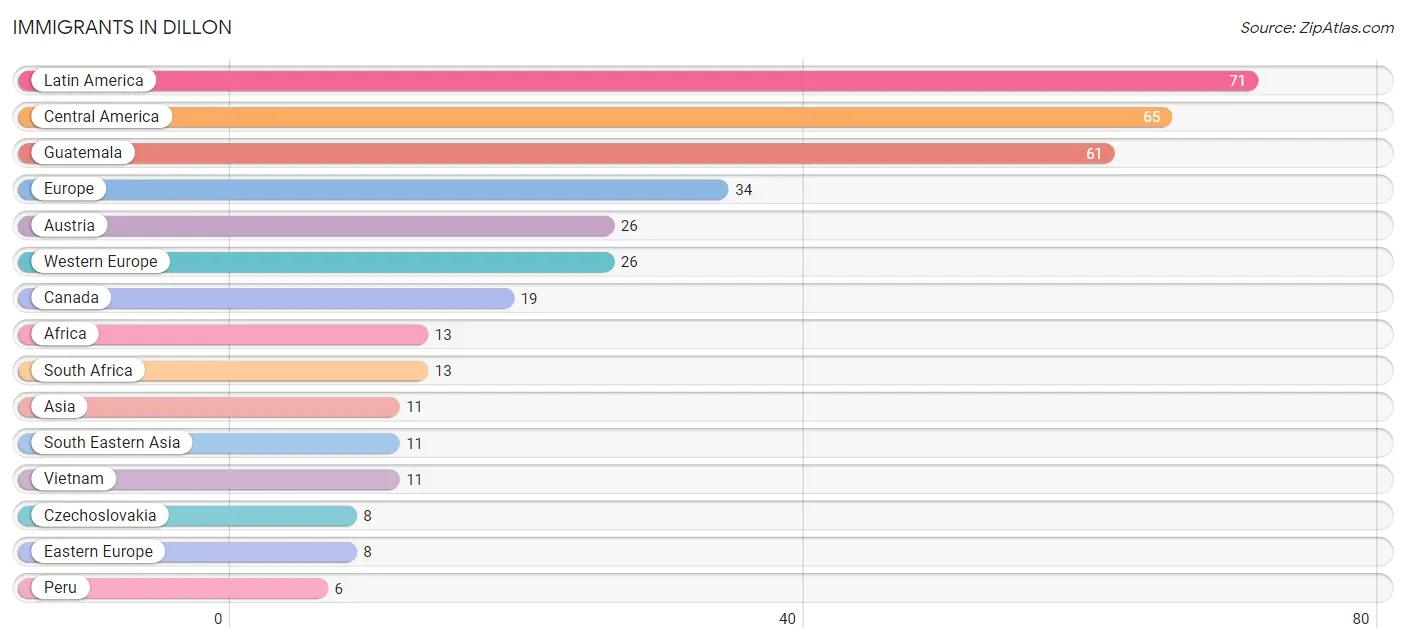
The most numerous immigrant groups reported in Dillon came from Latin America (71 | 8.5%), Central America (65 | 7.8%), Guatemala (61 | 7.3%), Europe (34 | 4.1%), and Austria (26 | 3.1%), together accounting for 30.9% of all Dillon residents.
| Immigration Origin | # Population | % Population |
| Africa | 13 | 1.6% |
| Asia | 11 | 1.3% |
| Austria | 26 | 3.1% |
| Canada | 19 | 2.3% |
| Central America | 65 | 7.8% |
| Czechoslovakia | 8 | 1.0% |
| Eastern Europe | 8 | 1.0% |
| Europe | 34 | 4.1% |
| Guatemala | 61 | 7.3% |
| Latin America | 71 | 8.5% |
| Mexico | 4 | 0.5% |
| Peru | 6 | 0.7% |
| South Africa | 13 | 1.6% |
| South America | 6 | 0.7% |
| South Eastern Asia | 11 | 1.3% |
| Vietnam | 11 | 1.3% |
| Western Europe | 26 | 3.1% | View All 17 Rows |
Sex and Age in Dillon
Sex and Age in Dillon
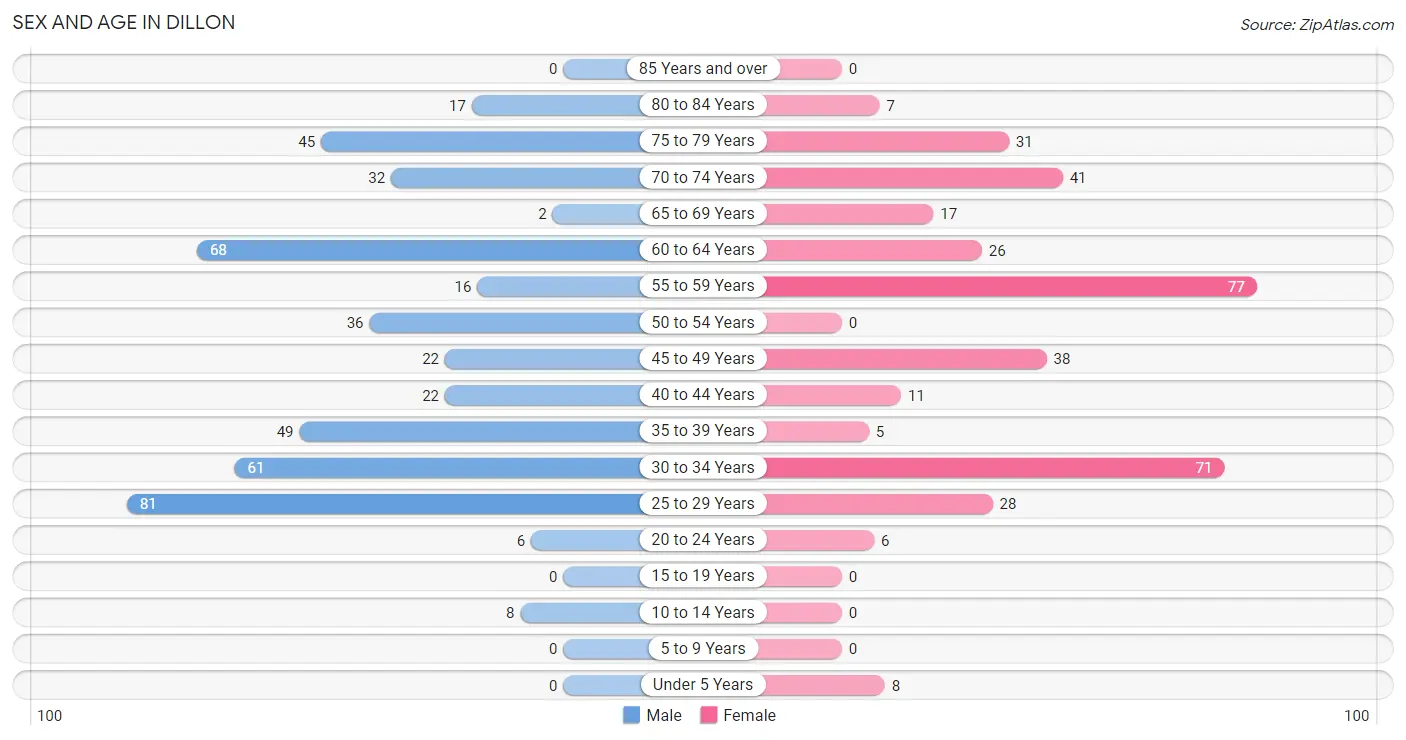
The most populous age groups in Dillon are 25 to 29 Years (81 | 17.4%) for men and 55 to 59 Years (77 | 21.0%) for women.
| Age Bracket | Male | Female |
| Under 5 Years | 0 (0.0%) | 8 (2.2%) |
| 5 to 9 Years | 0 (0.0%) | 0 (0.0%) |
| 10 to 14 Years | 8 (1.7%) | 0 (0.0%) |
| 15 to 19 Years | 0 (0.0%) | 0 (0.0%) |
| 20 to 24 Years | 6 (1.3%) | 6 (1.6%) |
| 25 to 29 Years | 81 (17.4%) | 28 (7.6%) |
| 30 to 34 Years | 61 (13.1%) | 71 (19.4%) |
| 35 to 39 Years | 49 (10.5%) | 5 (1.4%) |
| 40 to 44 Years | 22 (4.7%) | 11 (3.0%) |
| 45 to 49 Years | 22 (4.7%) | 38 (10.4%) |
| 50 to 54 Years | 36 (7.7%) | 0 (0.0%) |
| 55 to 59 Years | 16 (3.4%) | 77 (21.0%) |
| 60 to 64 Years | 68 (14.6%) | 26 (7.1%) |
| 65 to 69 Years | 2 (0.4%) | 17 (4.6%) |
| 70 to 74 Years | 32 (6.9%) | 41 (11.2%) |
| 75 to 79 Years | 45 (9.7%) | 31 (8.5%) |
| 80 to 84 Years | 17 (3.7%) | 7 (1.9%) |
| 85 Years and over | 0 (0.0%) | 0 (0.0%) |
| Total | 465 (100.0%) | 366 (100.0%) |
Families and Households in Dillon
Median Family Size in Dillon
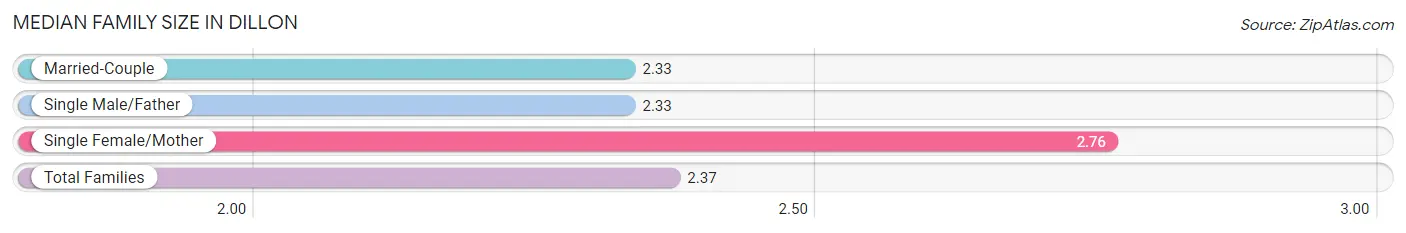
The median family size in Dillon is 2.37 persons per family, with single female/mother families (17 | 11.0%) accounting for the largest median family size of 2.76 persons per family. On the other hand, married-couple families (132 | 85.2%) represent the smallest median family size with 2.33 persons per family.
| Family Type | # Families | Family Size |
| Married-Couple | 132 (85.2%) | 2.33 |
| Single Male/Father | 6 (3.9%) | 2.33 |
| Single Female/Mother | 17 (11.0%) | 2.76 |
| Total Families | 155 (100.0%) | 2.37 |
Median Household Size in Dillon
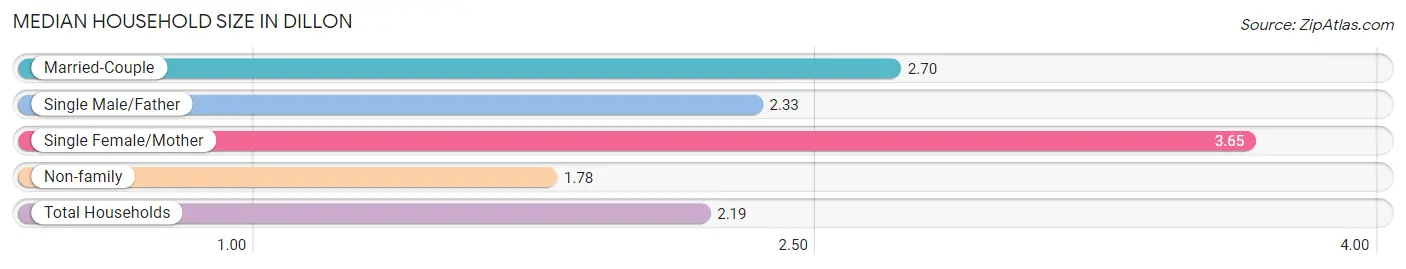
The median household size in Dillon is 2.19 persons per household, with single female/mother households (17 | 4.5%) accounting for the largest median household size of 3.65 persons per household. non-family households (224 | 59.1%) represent the smallest median household size with 1.78 persons per household.
| Household Type | # Households | Household Size |
| Married-Couple | 132 (34.8%) | 2.70 |
| Single Male/Father | 6 (1.6%) | 2.33 |
| Single Female/Mother | 17 (4.5%) | 3.65 |
| Non-family | 224 (59.1%) | 1.78 |
| Total Households | 379 (100.0%) | 2.19 |
Household Size by Marriage Status in Dillon
Out of a total of 379 households in Dillon, 155 (40.9%) are family households, while 224 (59.1%) are nonfamily households. The most numerous type of family households are 2-person households, comprising 109, and the most common type of nonfamily households are 1-person households, comprising 182.
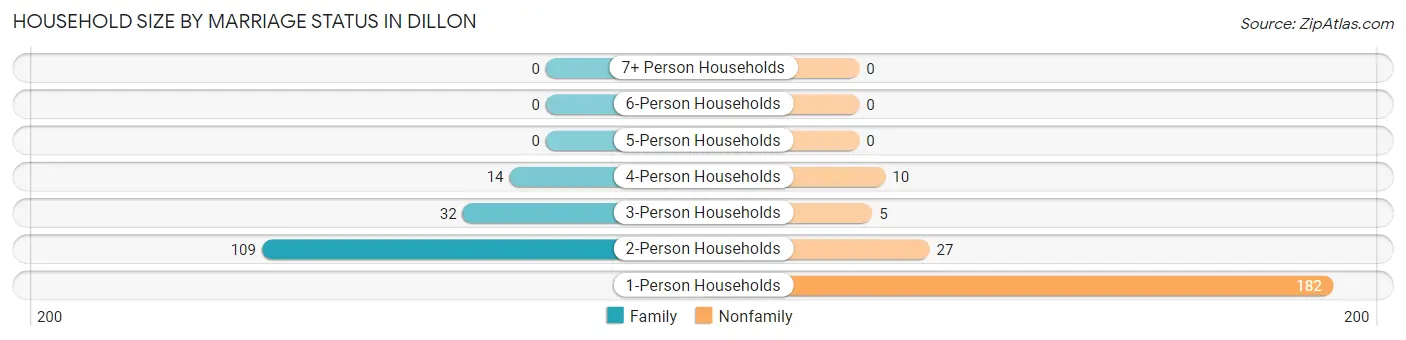
| Household Size | Family Households | Nonfamily Households |
| 1-Person Households | - | 182 (48.0%) |
| 2-Person Households | 109 (28.8%) | 27 (7.1%) |
| 3-Person Households | 32 (8.4%) | 5 (1.3%) |
| 4-Person Households | 14 (3.7%) | 10 (2.6%) |
| 5-Person Households | 0 (0.0%) | 0 (0.0%) |
| 6-Person Households | 0 (0.0%) | 0 (0.0%) |
| 7+ Person Households | 0 (0.0%) | 0 (0.0%) |
| Total | 155 (40.9%) | 224 (59.1%) |
Female Fertility in Dillon
Fertility by Age in Dillon
Average fertility rate in Dillon is 38.0 births per 1,000 women. Women in the age bracket of 20 to 34 years have the highest fertility rate with 57.0 births per 1,000 women. Women in the age bracket of 20 to 34 years acount for 100.0% of all women with births.
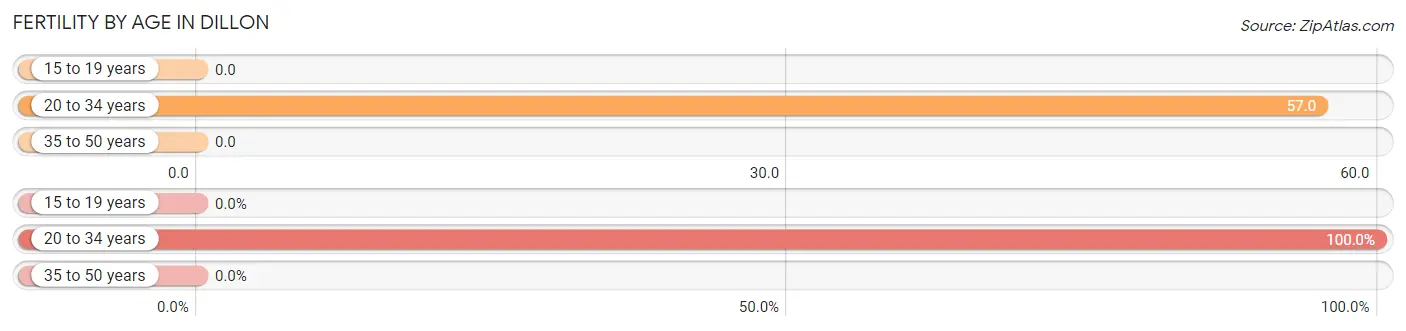
| Age Bracket | Women with Births | Births / 1,000 Women |
| 15 to 19 years | 0 (0.0%) | 0.0 |
| 20 to 34 years | 6 (100.0%) | 57.0 |
| 35 to 50 years | 0 (0.0%) | 0.0 |
| Total | 6 (100.0%) | 38.0 |
Fertility by Age by Marriage Status in Dillon
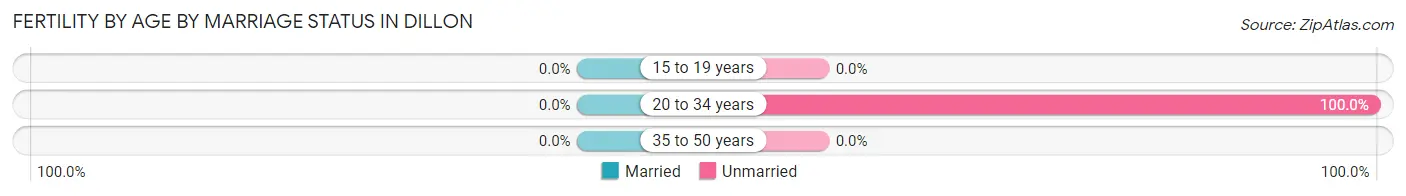
| Age Bracket | Married | Unmarried |
| 15 to 19 years | 0 (0.0%) | 0 (0.0%) |
| 20 to 34 years | 0 (0.0%) | 6 (100.0%) |
| 35 to 50 years | 0 (0.0%) | 0 (0.0%) |
| Total | 0 (0.0%) | 6 (100.0%) |
Fertility by Education in Dillon
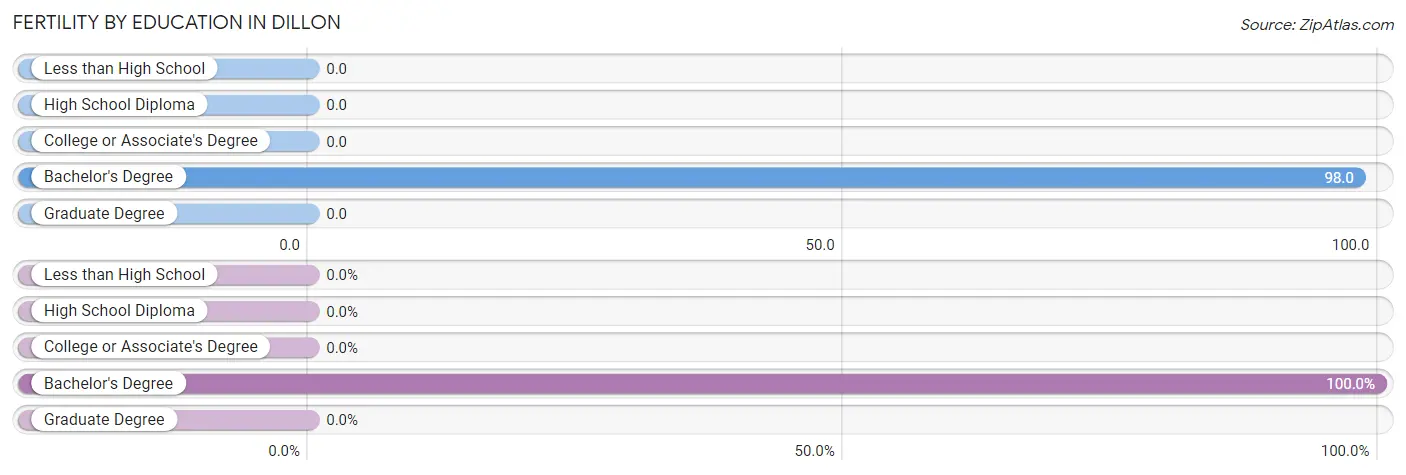
| Educational Attainment | Women with Births | Births / 1,000 Women |
| Less than High School | 0 (0.0%) | 0.0 |
| High School Diploma | 0 (0.0%) | 0.0 |
| College or Associate's Degree | 0 (0.0%) | 0.0 |
| Bachelor's Degree | 6 (100.0%) | 98.0 |
| Graduate Degree | 0 (0.0%) | 0.0 |
| Total | 6 (100.0%) | 38.0 |
Fertility by Education by Marriage Status in Dillon
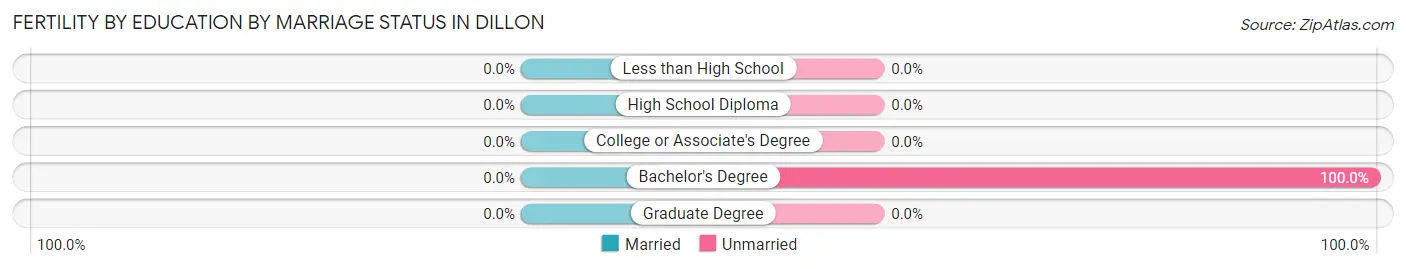
| Educational Attainment | Married | Unmarried |
| Less than High School | 0 (0.0%) | 0 (0.0%) |
| High School Diploma | 0 (0.0%) | 0 (0.0%) |
| College or Associate's Degree | 0 (0.0%) | 0 (0.0%) |
| Bachelor's Degree | 0 (0.0%) | 6 (100.0%) |
| Graduate Degree | 0 (0.0%) | 0 (0.0%) |
| Total | 0 (0.0%) | 6 (100.0%) |
Employment Characteristics in Dillon
Employment by Class of Employer in Dillon
Among the 445 employed individuals in Dillon, private company employees (368 | 82.7%), not-for-profit organizations (39 | 8.8%), and local government employees (23 | 5.2%) make up the most common classes of employment.
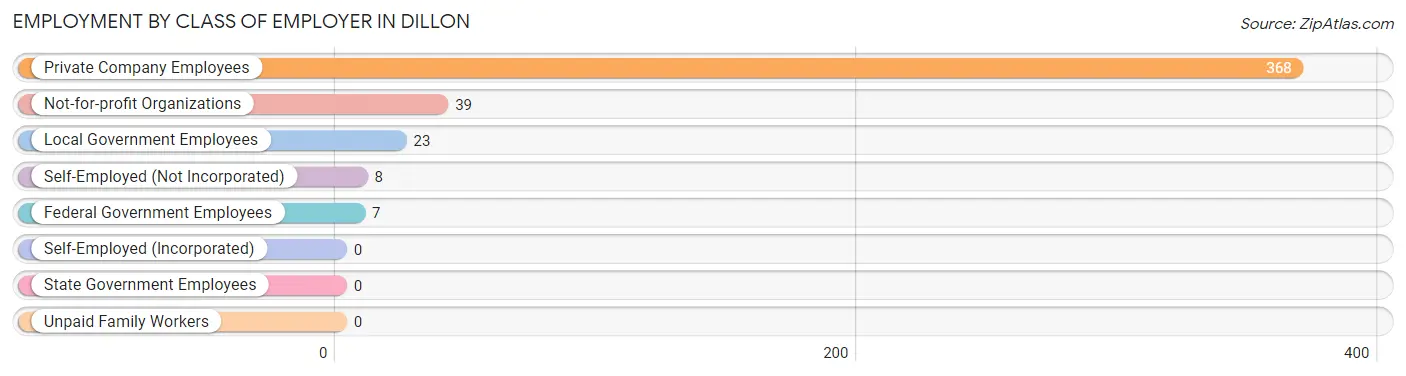
| Employer Class | # Employees | % Employees |
| Private Company Employees | 368 | 82.7% |
| Self-Employed (Incorporated) | 0 | 0.0% |
| Self-Employed (Not Incorporated) | 8 | 1.8% |
| Not-for-profit Organizations | 39 | 8.8% |
| Local Government Employees | 23 | 5.2% |
| State Government Employees | 0 | 0.0% |
| Federal Government Employees | 7 | 1.6% |
| Unpaid Family Workers | 0 | 0.0% |
| Total | 445 | 100.0% |
Employment Status by Age in Dillon
According to the labor force statistics for Dillon, out of the total population over 16 years of age (815), 61.3% or 500 individuals are in the labor force, with 4.6% or 23 of them unemployed. The age group with the highest labor force participation rate is 20 to 24 years, with 100.0% or 12 individuals in the labor force. Within the labor force, the 45 to 54 years age range has the highest percentage of unemployed individuals, with 24.0% or 23 of them being unemployed.
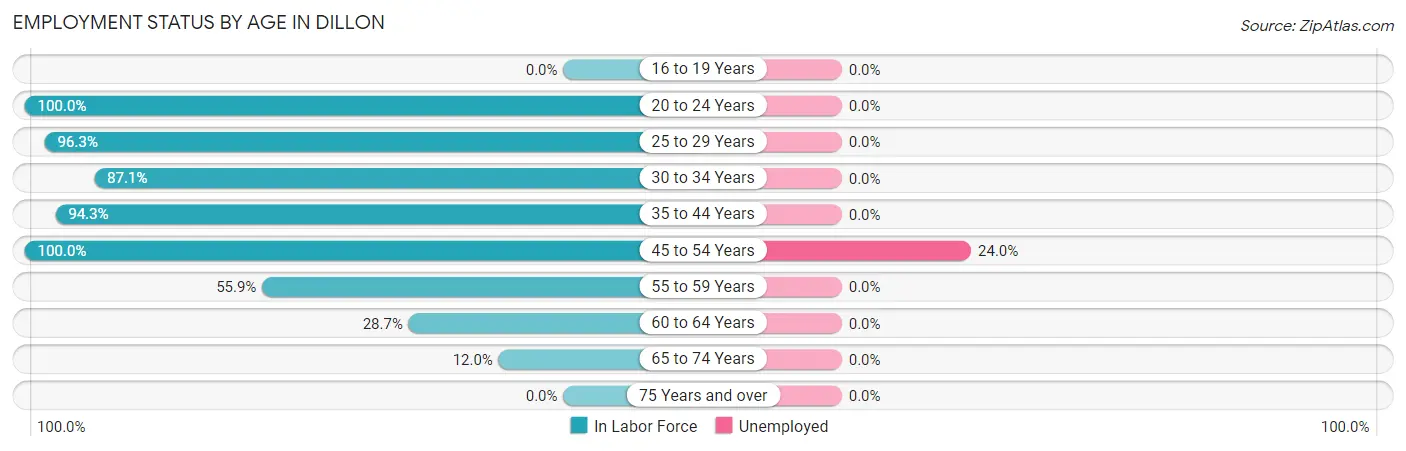
| Age Bracket | In Labor Force | Unemployed |
| 16 to 19 Years | 0 (0.0%) | 0 (0.0%) |
| 20 to 24 Years | 12 (100.0%) | 0 (0.0%) |
| 25 to 29 Years | 105 (96.3%) | 0 (0.0%) |
| 30 to 34 Years | 115 (87.1%) | 0 (0.0%) |
| 35 to 44 Years | 82 (94.3%) | 0 (0.0%) |
| 45 to 54 Years | 96 (100.0%) | 23 (24.0%) |
| 55 to 59 Years | 52 (55.9%) | 0 (0.0%) |
| 60 to 64 Years | 27 (28.7%) | 0 (0.0%) |
| 65 to 74 Years | 11 (12.0%) | 0 (0.0%) |
| 75 Years and over | 0 (0.0%) | 0 (0.0%) |
| Total | 500 (61.3%) | 23 (4.6%) |
Employment Status by Educational Attainment in Dillon
According to labor force statistics for Dillon, 78.1% of individuals (477) out of the total population between 25 and 64 years of age (611) are in the labor force, with 4.8% or 23 of them being unemployed. The group with the highest labor force participation rate are those with the educational attainment of bachelor's degree or higher, with 84.0% or 279 individuals in the labor force. Within the labor force, individuals with bachelor's degree or higher education have the highest percentage of unemployment, with 8.2% or 23 of them being unemployed.
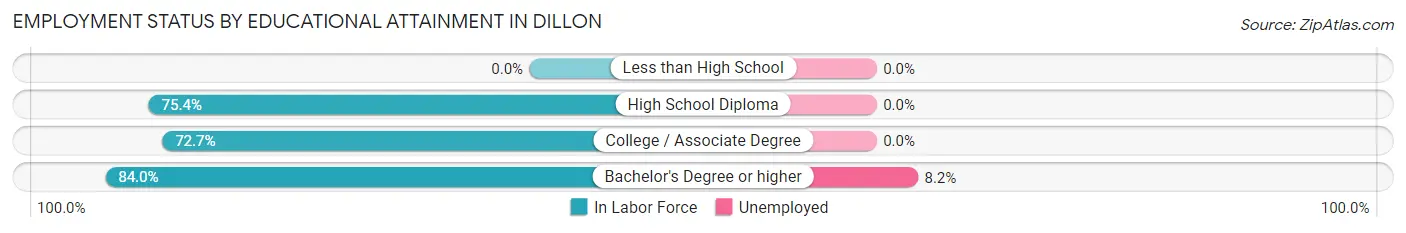
| Educational Attainment | In Labor Force | Unemployed |
| Less than High School | 0 (0.0%) | 0 (0.0%) |
| High School Diploma | 86 (75.4%) | 0 (0.0%) |
| College / Associate Degree | 112 (72.7%) | 0 (0.0%) |
| Bachelor's Degree or higher | 279 (84.0%) | 27 (8.2%) |
| Total | 477 (78.1%) | 29 (4.8%) |
Employment Occupations by Sex in Dillon
Management, Business, Science and Arts Occupations
The most common Management, Business, Science and Arts occupations in Dillon are Management (65 | 13.6%), Community & Social Service (64 | 13.4%), Computers, Engineering & Science (60 | 12.6%), Computers & Mathematics (47 | 9.9%), and Legal Services & Support (29 | 6.1%).
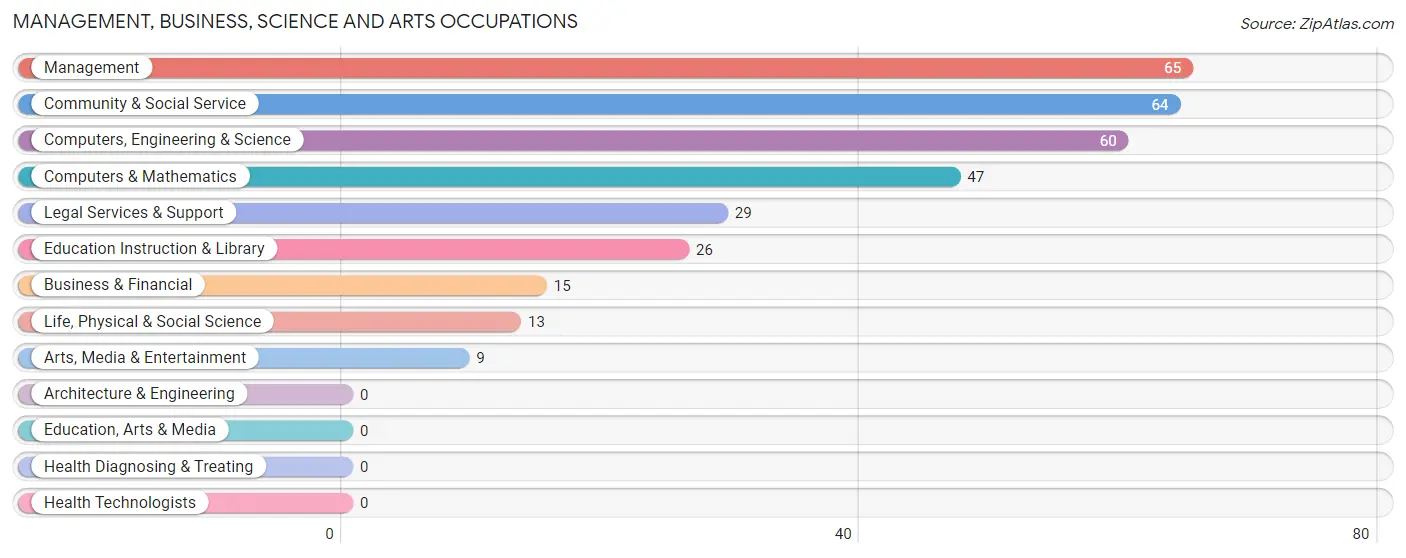
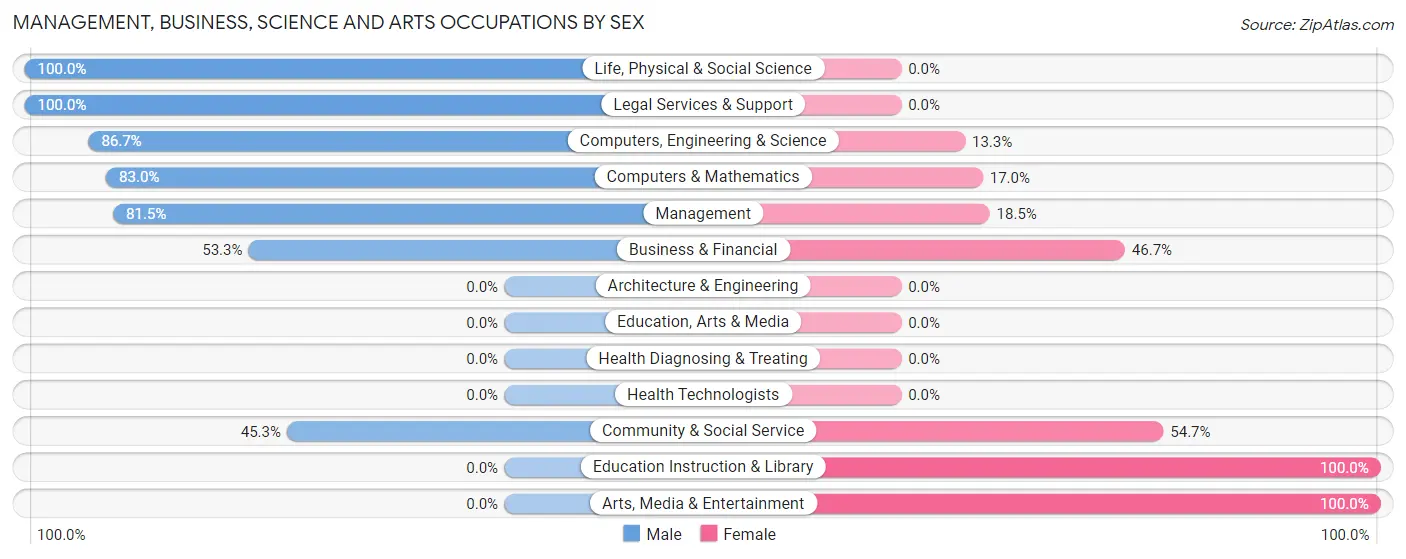
Management, Business, Science and Arts Occupations by Sex
Within the Management, Business, Science and Arts occupations in Dillon, the most male-oriented occupations are Life, Physical & Social Science (100.0%), Legal Services & Support (100.0%), and Computers, Engineering & Science (86.7%), while the most female-oriented occupations are Education Instruction & Library (100.0%), Arts, Media & Entertainment (100.0%), and Community & Social Service (54.7%).
| Occupation | Male | Female |
| Management | 53 (81.5%) | 12 (18.5%) |
| Business & Financial | 8 (53.3%) | 7 (46.7%) |
| Computers, Engineering & Science | 52 (86.7%) | 8 (13.3%) |
| Computers & Mathematics | 39 (83.0%) | 8 (17.0%) |
| Architecture & Engineering | 0 (0.0%) | 0 (0.0%) |
| Life, Physical & Social Science | 13 (100.0%) | 0 (0.0%) |
| Community & Social Service | 29 (45.3%) | 35 (54.7%) |
| Education, Arts & Media | 0 (0.0%) | 0 (0.0%) |
| Legal Services & Support | 29 (100.0%) | 0 (0.0%) |
| Education Instruction & Library | 0 (0.0%) | 26 (100.0%) |
| Arts, Media & Entertainment | 0 (0.0%) | 9 (100.0%) |
| Health Diagnosing & Treating | 0 (0.0%) | 0 (0.0%) |
| Health Technologists | 0 (0.0%) | 0 (0.0%) |
| Total (Category) | 142 (69.6%) | 62 (30.4%) |
| Total (Overall) | 315 (66.0%) | 162 (34.0%) |
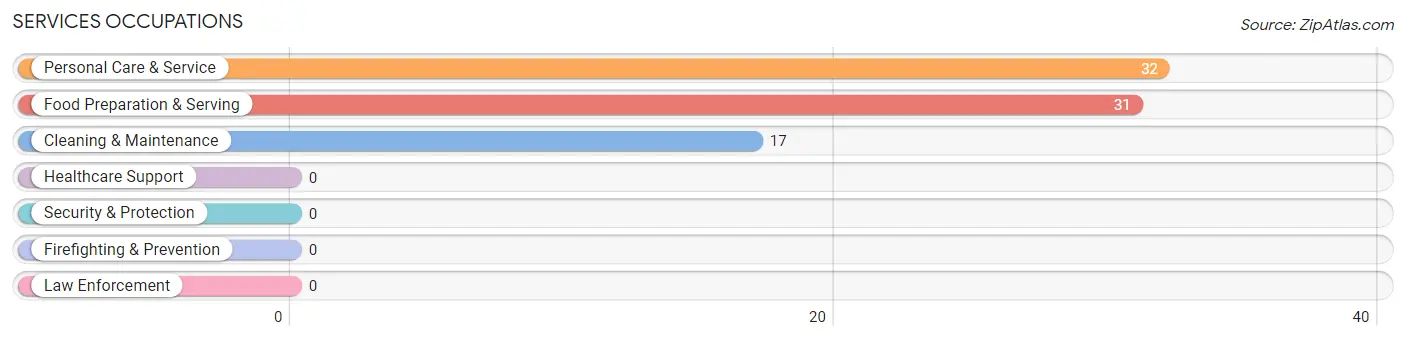
Services Occupations
The most common Services occupations in Dillon are Personal Care & Service (32 | 6.7%), Food Preparation & Serving (31 | 6.5%), and Cleaning & Maintenance (17 | 3.6%).
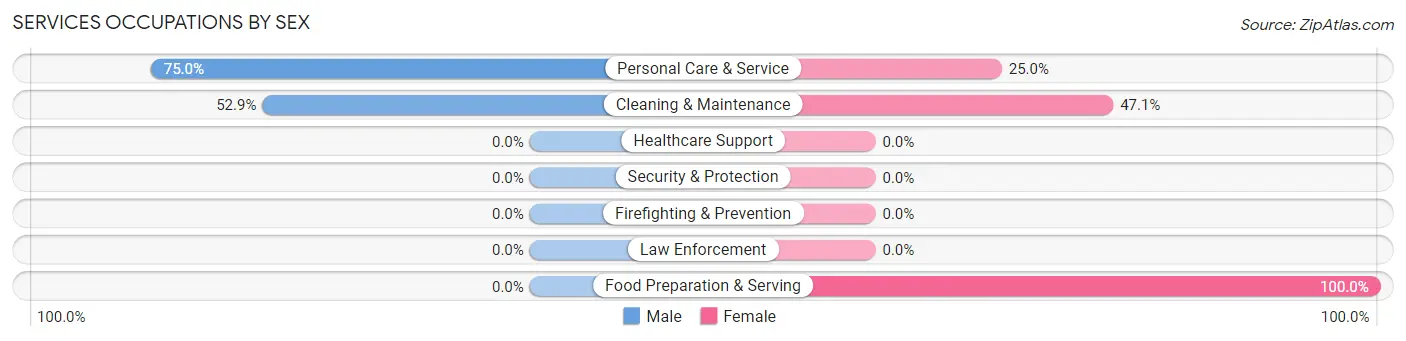
Services Occupations by Sex
Within the Services occupations in Dillon, the most male-oriented occupations are Personal Care & Service (75.0%), and Cleaning & Maintenance (52.9%), while the most female-oriented occupations are Food Preparation & Serving (100.0%), Cleaning & Maintenance (47.1%), and Personal Care & Service (25.0%).
| Occupation | Male | Female |
| Healthcare Support | 0 (0.0%) | 0 (0.0%) |
| Security & Protection | 0 (0.0%) | 0 (0.0%) |
| Firefighting & Prevention | 0 (0.0%) | 0 (0.0%) |
| Law Enforcement | 0 (0.0%) | 0 (0.0%) |
| Food Preparation & Serving | 0 (0.0%) | 31 (100.0%) |
| Cleaning & Maintenance | 9 (52.9%) | 8 (47.1%) |
| Personal Care & Service | 24 (75.0%) | 8 (25.0%) |
| Total (Category) | 33 (41.2%) | 47 (58.8%) |
| Total (Overall) | 315 (66.0%) | 162 (34.0%) |
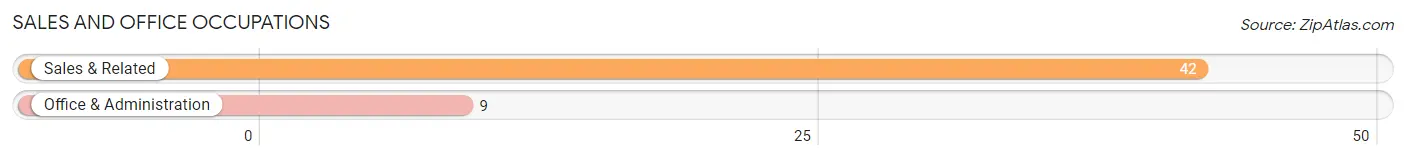
Sales and Office Occupations
The most common Sales and Office occupations in Dillon are Sales & Related (42 | 8.8%), and Office & Administration (9 | 1.9%).
Sales and Office Occupations by Sex
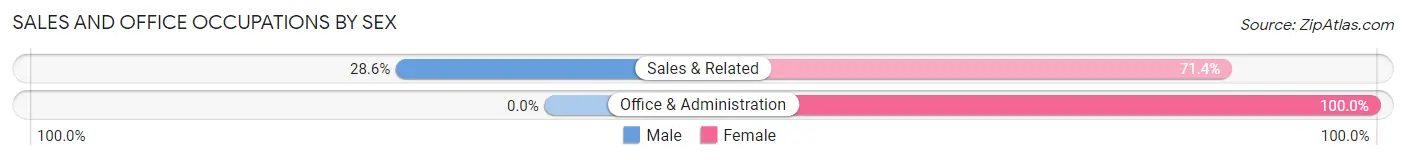
| Occupation | Male | Female |
| Sales & Related | 12 (28.6%) | 30 (71.4%) |
| Office & Administration | 0 (0.0%) | 9 (100.0%) |
| Total (Category) | 12 (23.5%) | 39 (76.5%) |
| Total (Overall) | 315 (66.0%) | 162 (34.0%) |
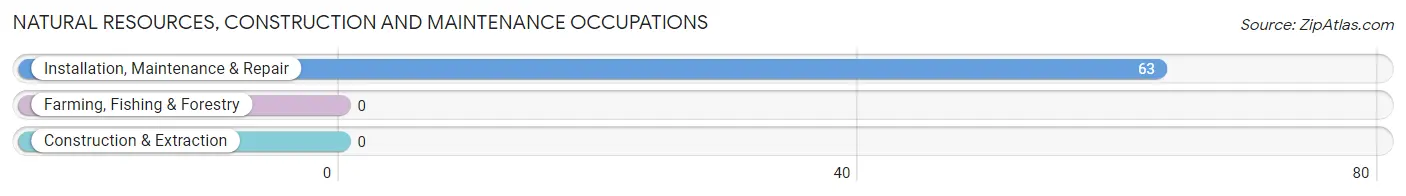
Natural Resources, Construction and Maintenance Occupations
The most common Natural Resources, Construction and Maintenance occupations in Dillon are , and Installation, Maintenance & Repair (63 | 13.2%).
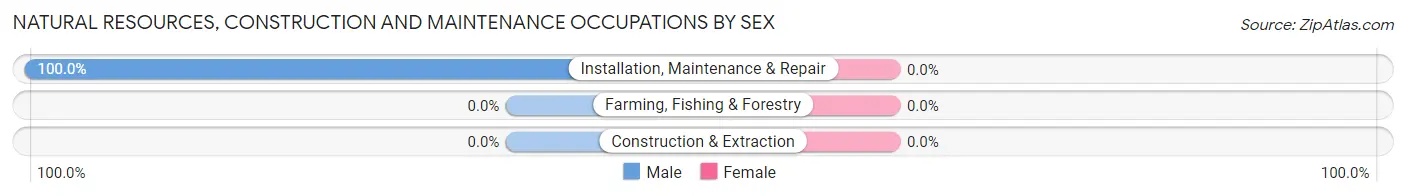
Natural Resources, Construction and Maintenance Occupations by Sex
| Occupation | Male | Female |
| Farming, Fishing & Forestry | 0 (0.0%) | 0 (0.0%) |
| Construction & Extraction | 0 (0.0%) | 0 (0.0%) |
| Installation, Maintenance & Repair | 63 (100.0%) | 0 (0.0%) |
| Total (Category) | 63 (100.0%) | 0 (0.0%) |
| Total (Overall) | 315 (66.0%) | 162 (34.0%) |
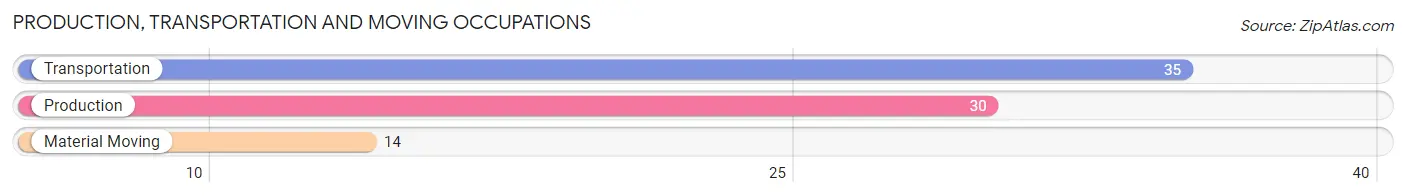
Production, Transportation and Moving Occupations
The most common Production, Transportation and Moving occupations in Dillon are Transportation (35 | 7.3%), Production (30 | 6.3%), and Material Moving (14 | 2.9%).
Production, Transportation and Moving Occupations by Sex
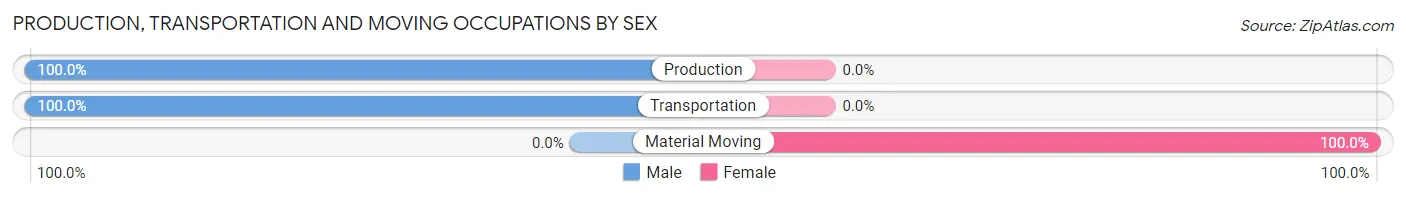
| Occupation | Male | Female |
| Production | 30 (100.0%) | 0 (0.0%) |
| Transportation | 35 (100.0%) | 0 (0.0%) |
| Material Moving | 0 (0.0%) | 14 (100.0%) |
| Total (Category) | 65 (82.3%) | 14 (17.7%) |
| Total (Overall) | 315 (66.0%) | 162 (34.0%) |
Employment Industries by Sex in Dillon
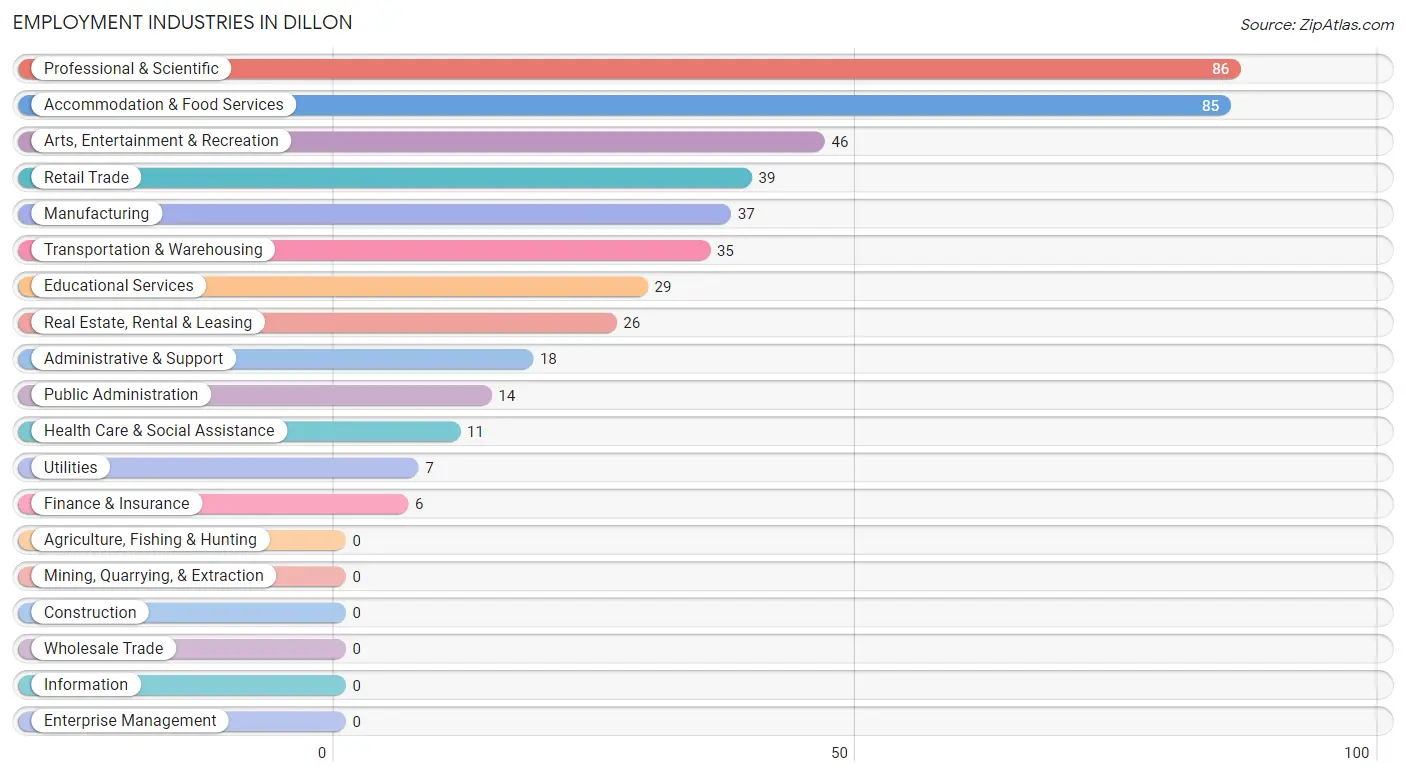
Employment Industries in Dillon
The major employment industries in Dillon include Professional & Scientific (86 | 18.0%), Accommodation & Food Services (85 | 17.8%), Arts, Entertainment & Recreation (46 | 9.6%), Retail Trade (39 | 8.2%), and Manufacturing (37 | 7.8%).
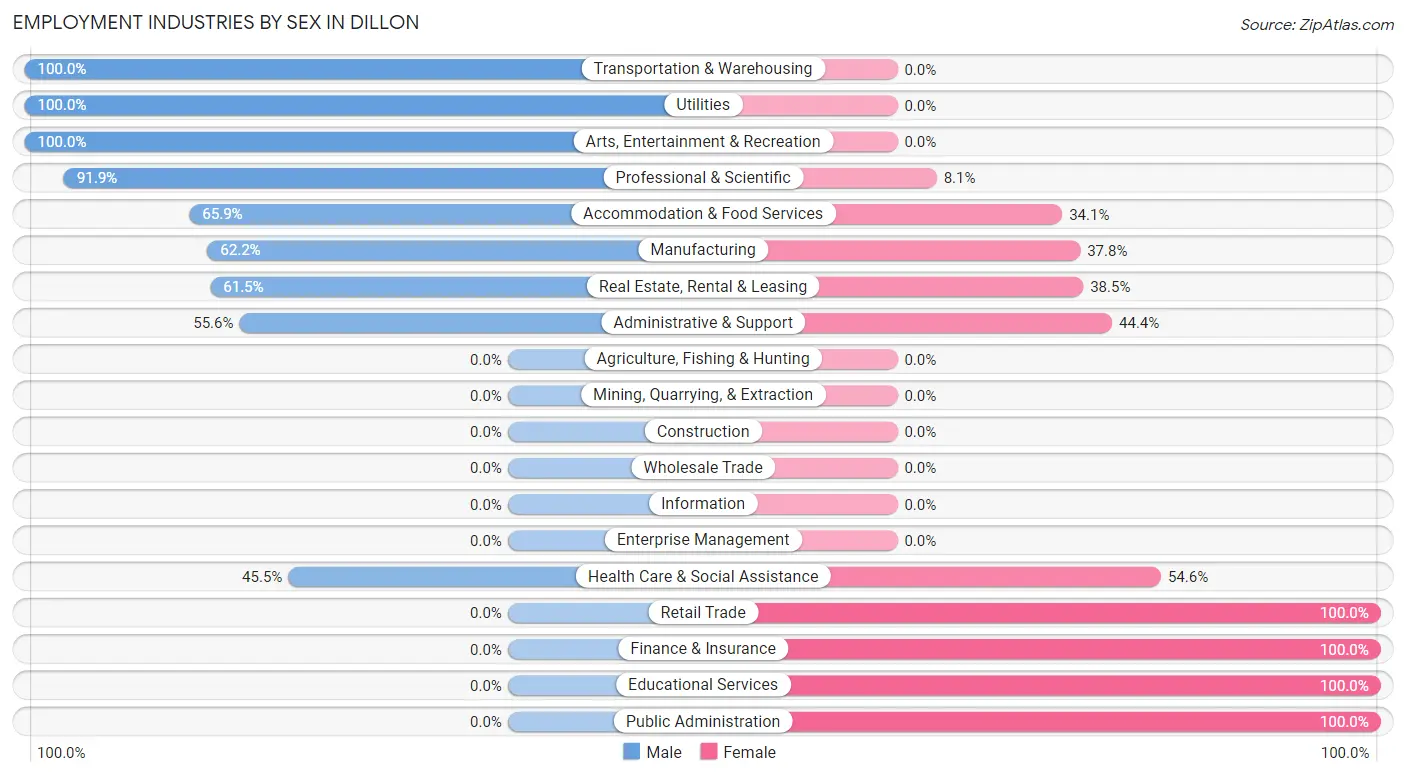
Employment Industries by Sex in Dillon
The Dillon industries that see more men than women are Transportation & Warehousing (100.0%), Utilities (100.0%), and Arts, Entertainment & Recreation (100.0%), whereas the industries that tend to have a higher number of women are Retail Trade (100.0%), Finance & Insurance (100.0%), and Educational Services (100.0%).
| Industry | Male | Female |
| Agriculture, Fishing & Hunting | 0 (0.0%) | 0 (0.0%) |
| Mining, Quarrying, & Extraction | 0 (0.0%) | 0 (0.0%) |
| Construction | 0 (0.0%) | 0 (0.0%) |
| Manufacturing | 23 (62.2%) | 14 (37.8%) |
| Wholesale Trade | 0 (0.0%) | 0 (0.0%) |
| Retail Trade | 0 (0.0%) | 39 (100.0%) |
| Transportation & Warehousing | 35 (100.0%) | 0 (0.0%) |
| Utilities | 7 (100.0%) | 0 (0.0%) |
| Information | 0 (0.0%) | 0 (0.0%) |
| Finance & Insurance | 0 (0.0%) | 6 (100.0%) |
| Real Estate, Rental & Leasing | 16 (61.5%) | 10 (38.5%) |
| Professional & Scientific | 79 (91.9%) | 7 (8.1%) |
| Enterprise Management | 0 (0.0%) | 0 (0.0%) |
| Administrative & Support | 10 (55.6%) | 8 (44.4%) |
| Educational Services | 0 (0.0%) | 29 (100.0%) |
| Health Care & Social Assistance | 5 (45.5%) | 6 (54.5%) |
| Arts, Entertainment & Recreation | 46 (100.0%) | 0 (0.0%) |
| Accommodation & Food Services | 56 (65.9%) | 29 (34.1%) |
| Public Administration | 0 (0.0%) | 14 (100.0%) |
| Total | 315 (66.0%) | 162 (34.0%) |
Education in Dillon
School Enrollment in Dillon
The most common levels of schooling among the 23 students in Dillon are nursery / preschool (8 | 34.8%), middle school (8 | 34.8%), and college / undergraduate (4 | 17.4%).
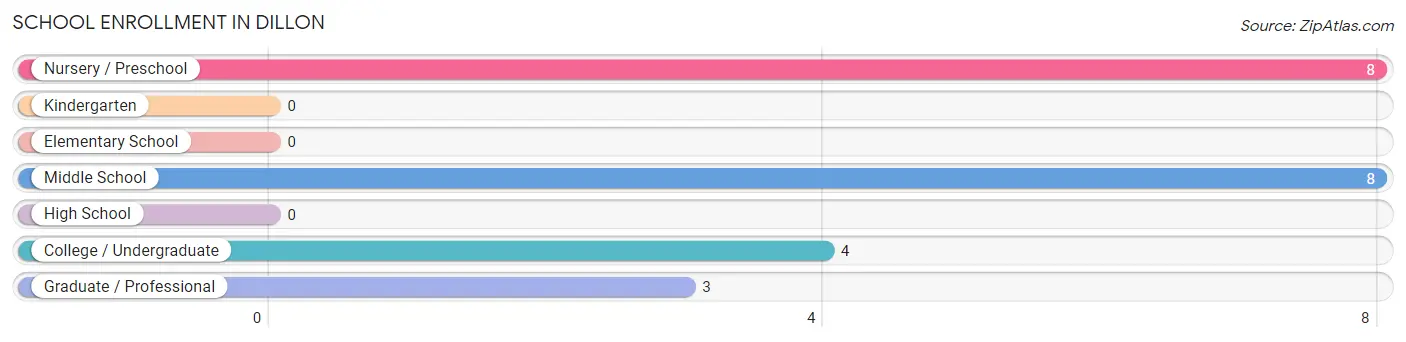
| School Level | # Students | % Students |
| Nursery / Preschool | 8 | 34.8% |
| Kindergarten | 0 | 0.0% |
| Elementary School | 0 | 0.0% |
| Middle School | 8 | 34.8% |
| High School | 0 | 0.0% |
| College / Undergraduate | 4 | 17.4% |
| Graduate / Professional | 3 | 13.0% |
| Total | 23 | 100.0% |
School Enrollment by Age by Funding Source in Dillon
Out of a total of 23 students who are enrolled in schools in Dillon, 3 (13.0%) attend a private institution, while the remaining 20 (87.0%) are enrolled in public schools. The age group of 35 years and over has the highest likelihood of being enrolled in private schools, with 3 (100.0% in the age bracket) enrolled. Conversely, the age group of 3 to 4 year olds has the lowest likelihood of being enrolled in a private school, with 8 (100.0% in the age bracket) attending a public institution.
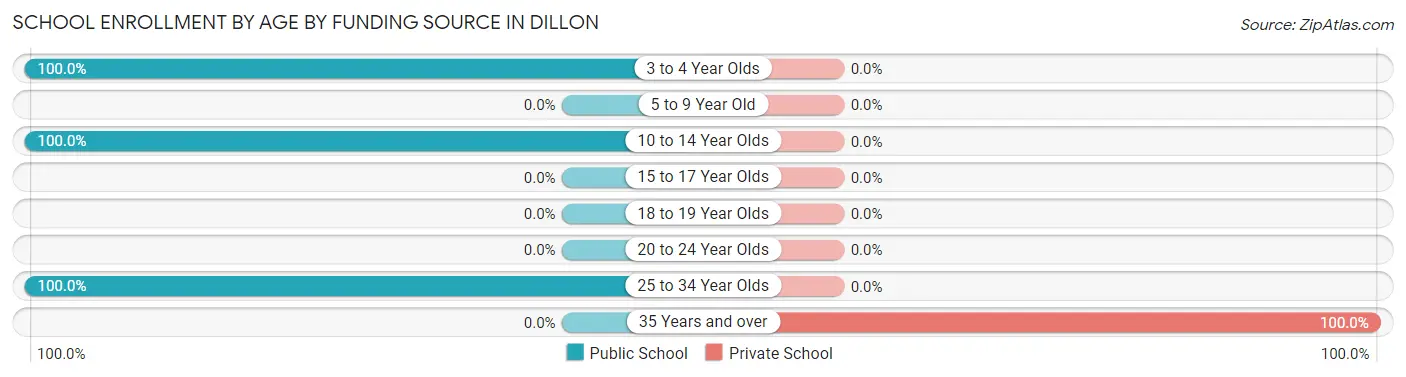
| Age Bracket | Public School | Private School |
| 3 to 4 Year Olds | 8 (100.0%) | 0 (0.0%) |
| 5 to 9 Year Old | 0 (0.0%) | 0 (0.0%) |
| 10 to 14 Year Olds | 8 (100.0%) | 0 (0.0%) |
| 15 to 17 Year Olds | 0 (0.0%) | 0 (0.0%) |
| 18 to 19 Year Olds | 0 (0.0%) | 0 (0.0%) |
| 20 to 24 Year Olds | 0 (0.0%) | 0 (0.0%) |
| 25 to 34 Year Olds | 4 (100.0%) | 0 (0.0%) |
| 35 Years and over | 0 (0.0%) | 3 (100.0%) |
| Total | 20 (87.0%) | 3 (13.0%) |
Educational Attainment by Field of Study in Dillon
Bio, nature & agricultural (77 | 15.3%), business (69 | 13.8%), psychology (61 | 12.1%), engineering (58 | 11.6%), and education (54 | 10.8%) are the most common fields of study among 502 individuals in Dillon who have obtained a bachelor's degree or higher.
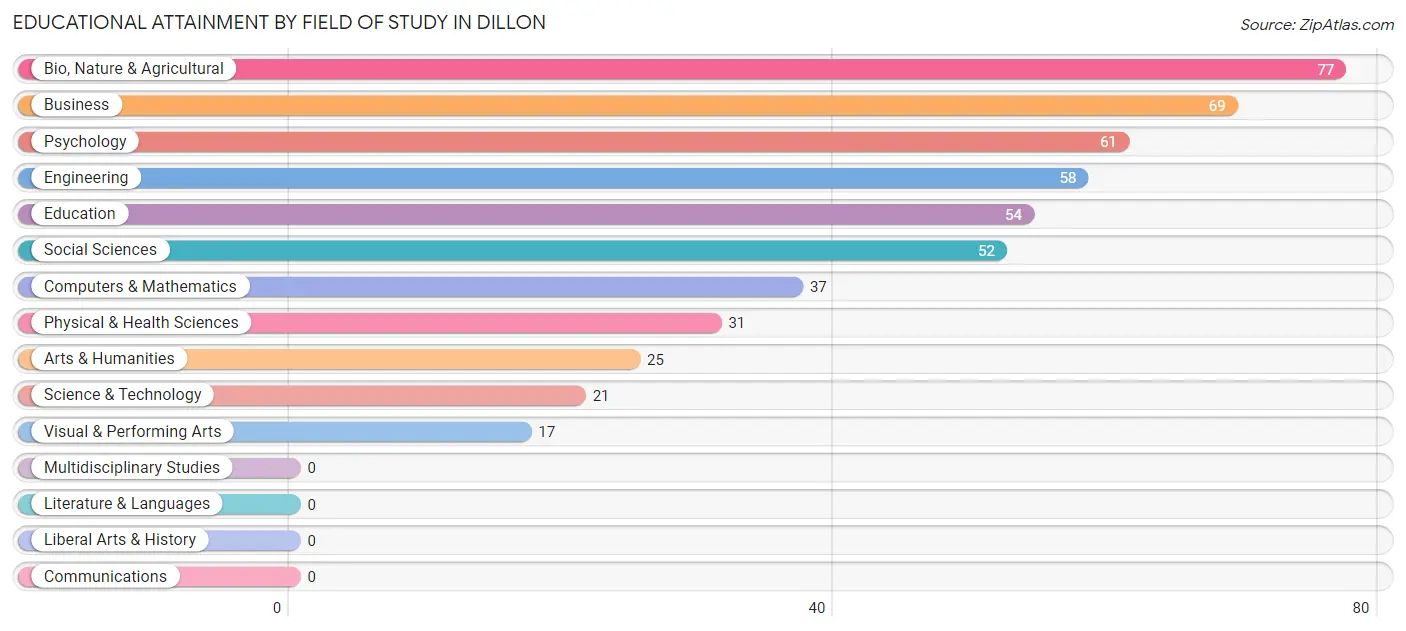
| Field of Study | # Graduates | % Graduates |
| Computers & Mathematics | 37 | 7.4% |
| Bio, Nature & Agricultural | 77 | 15.3% |
| Physical & Health Sciences | 31 | 6.2% |
| Psychology | 61 | 12.1% |
| Social Sciences | 52 | 10.4% |
| Engineering | 58 | 11.6% |
| Multidisciplinary Studies | 0 | 0.0% |
| Science & Technology | 21 | 4.2% |
| Business | 69 | 13.8% |
| Education | 54 | 10.8% |
| Literature & Languages | 0 | 0.0% |
| Liberal Arts & History | 0 | 0.0% |
| Visual & Performing Arts | 17 | 3.4% |
| Communications | 0 | 0.0% |
| Arts & Humanities | 25 | 5.0% |
| Total | 502 | 100.0% |
Transportation & Commute in Dillon
Vehicle Availability by Sex in Dillon
The most prevalent vehicle ownership categories in Dillon are males with 3 vehicles (80, accounting for 28.3%) and females with 3 vehicles (60, making up 49.4%).
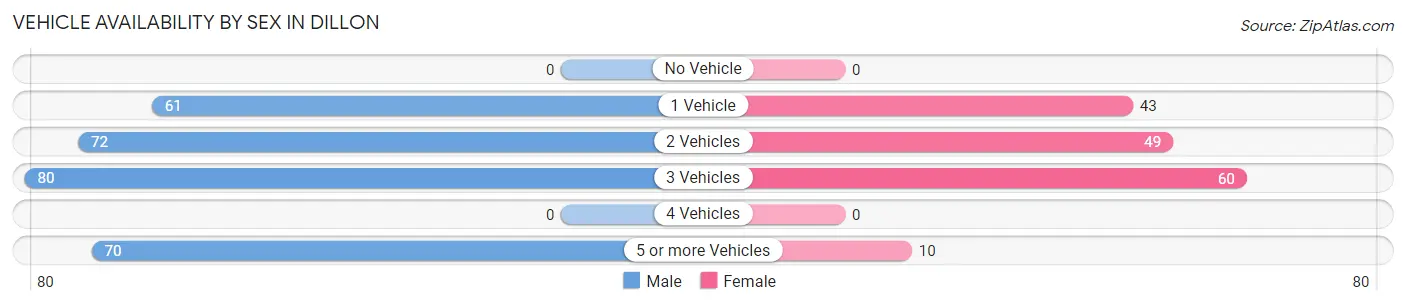
| Vehicles Available | Male | Female |
| No Vehicle | 0 (0.0%) | 0 (0.0%) |
| 1 Vehicle | 61 (21.5%) | 43 (26.5%) |
| 2 Vehicles | 72 (25.4%) | 49 (30.2%) |
| 3 Vehicles | 80 (28.3%) | 60 (37.0%) |
| 4 Vehicles | 0 (0.0%) | 0 (0.0%) |
| 5 or more Vehicles | 70 (24.7%) | 10 (6.2%) |
| Total | 283 (100.0%) | 162 (100.0%) |
Commute Time in Dillon
The most frequently occuring commute durations in Dillon are 10 to 14 minutes (123 commuters, 33.4%), 5 to 9 minutes (93 commuters, 25.3%), and 15 to 19 minutes (60 commuters, 16.3%).
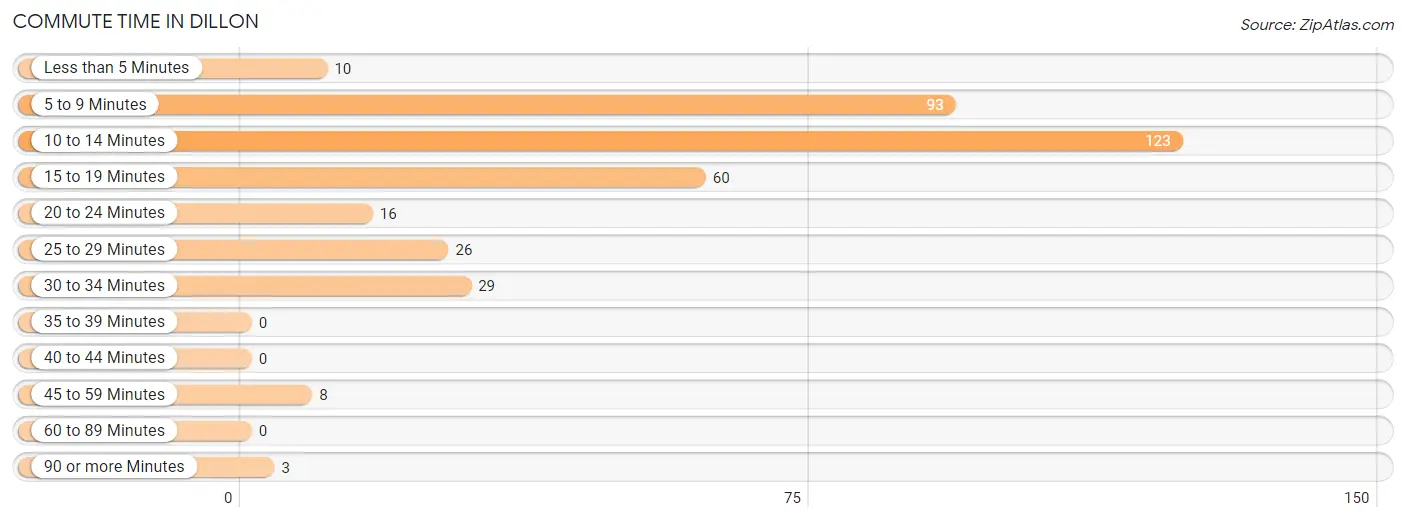
| Commute Time | # Commuters | % Commuters |
| Less than 5 Minutes | 10 | 2.7% |
| 5 to 9 Minutes | 93 | 25.3% |
| 10 to 14 Minutes | 123 | 33.4% |
| 15 to 19 Minutes | 60 | 16.3% |
| 20 to 24 Minutes | 16 | 4.3% |
| 25 to 29 Minutes | 26 | 7.1% |
| 30 to 34 Minutes | 29 | 7.9% |
| 35 to 39 Minutes | 0 | 0.0% |
| 40 to 44 Minutes | 0 | 0.0% |
| 45 to 59 Minutes | 8 | 2.2% |
| 60 to 89 Minutes | 0 | 0.0% |
| 90 or more Minutes | 3 | 0.8% |
Commute Time by Sex in Dillon
The most common commute times in Dillon are 10 to 14 minutes (88 commuters, 38.3%) for males and 5 to 9 minutes (36 commuters, 26.1%) for females.
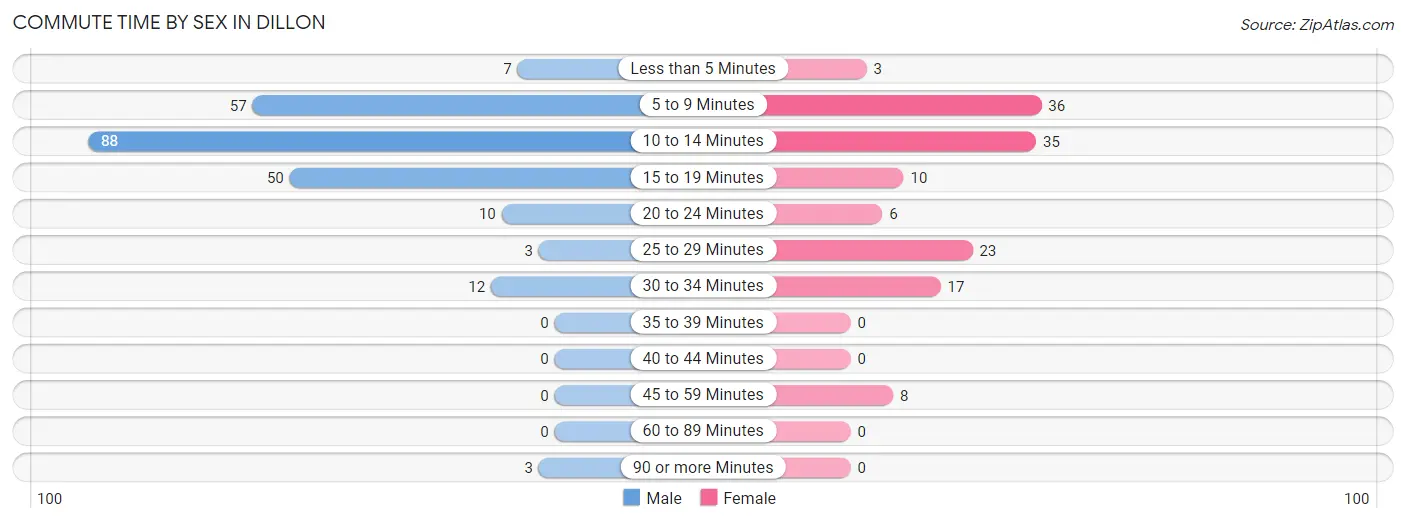
| Commute Time | Male | Female |
| Less than 5 Minutes | 7 (3.0%) | 3 (2.2%) |
| 5 to 9 Minutes | 57 (24.8%) | 36 (26.1%) |
| 10 to 14 Minutes | 88 (38.3%) | 35 (25.4%) |
| 15 to 19 Minutes | 50 (21.7%) | 10 (7.2%) |
| 20 to 24 Minutes | 10 (4.3%) | 6 (4.3%) |
| 25 to 29 Minutes | 3 (1.3%) | 23 (16.7%) |
| 30 to 34 Minutes | 12 (5.2%) | 17 (12.3%) |
| 35 to 39 Minutes | 0 (0.0%) | 0 (0.0%) |
| 40 to 44 Minutes | 0 (0.0%) | 0 (0.0%) |
| 45 to 59 Minutes | 0 (0.0%) | 8 (5.8%) |
| 60 to 89 Minutes | 0 (0.0%) | 0 (0.0%) |
| 90 or more Minutes | 3 (1.3%) | 0 (0.0%) |
Time of Departure to Work by Sex in Dillon
The most frequent times of departure to work in Dillon are 7:00 AM to 7:29 AM (105, 45.7%) for males and 9:00 AM to 9:59 AM (42, 30.4%) for females.
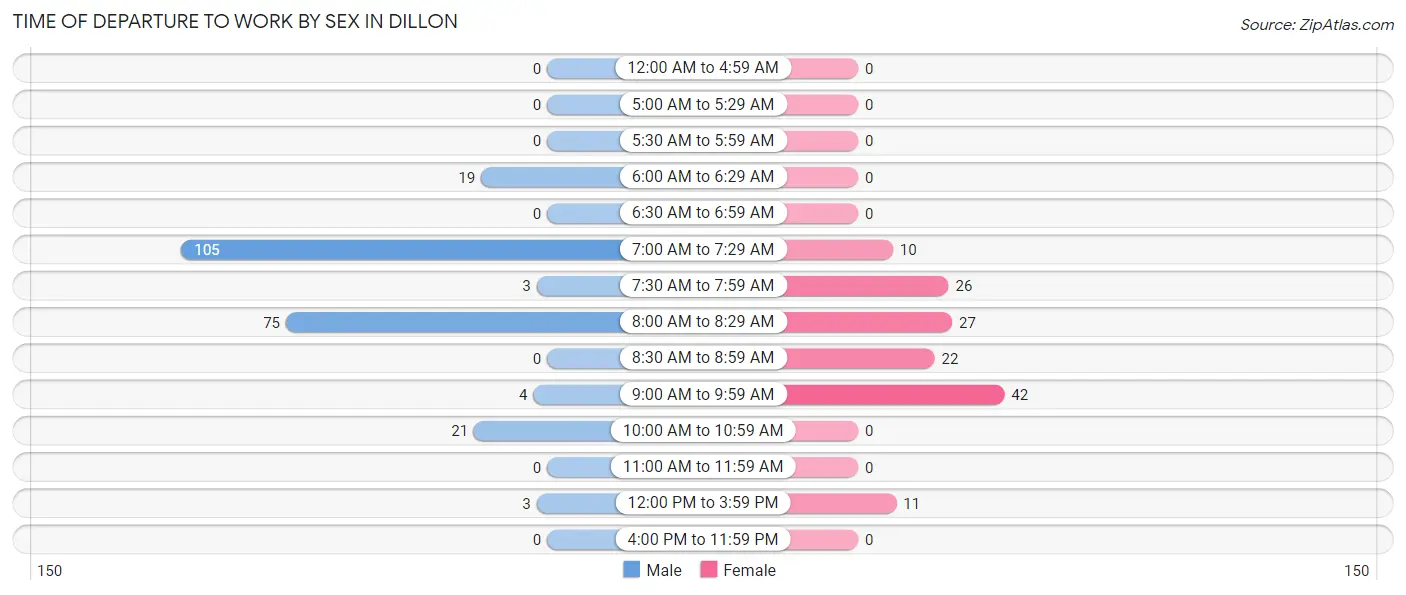
| Time of Departure | Male | Female |
| 12:00 AM to 4:59 AM | 0 (0.0%) | 0 (0.0%) |
| 5:00 AM to 5:29 AM | 0 (0.0%) | 0 (0.0%) |
| 5:30 AM to 5:59 AM | 0 (0.0%) | 0 (0.0%) |
| 6:00 AM to 6:29 AM | 19 (8.3%) | 0 (0.0%) |
| 6:30 AM to 6:59 AM | 0 (0.0%) | 0 (0.0%) |
| 7:00 AM to 7:29 AM | 105 (45.7%) | 10 (7.2%) |
| 7:30 AM to 7:59 AM | 3 (1.3%) | 26 (18.8%) |
| 8:00 AM to 8:29 AM | 75 (32.6%) | 27 (19.6%) |
| 8:30 AM to 8:59 AM | 0 (0.0%) | 22 (15.9%) |
| 9:00 AM to 9:59 AM | 4 (1.7%) | 42 (30.4%) |
| 10:00 AM to 10:59 AM | 21 (9.1%) | 0 (0.0%) |
| 11:00 AM to 11:59 AM | 0 (0.0%) | 0 (0.0%) |
| 12:00 PM to 3:59 PM | 3 (1.3%) | 11 (8.0%) |
| 4:00 PM to 11:59 PM | 0 (0.0%) | 0 (0.0%) |
| Total | 230 (100.0%) | 138 (100.0%) |
Housing Occupancy in Dillon
Occupancy by Ownership in Dillon
Of the total 379 dwellings in Dillon, owner-occupied units account for 209 (55.1%), while renter-occupied units make up 170 (44.9%).
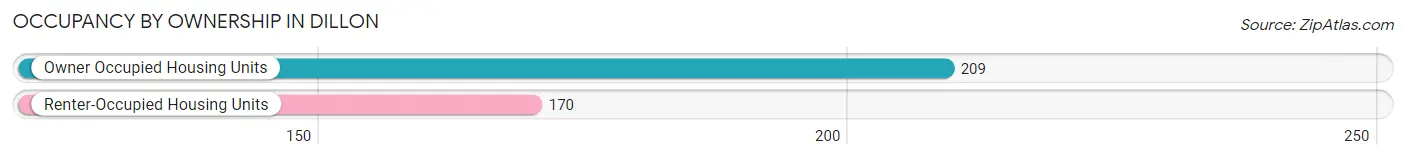
| Occupancy | # Housing Units | % Housing Units |
| Owner Occupied Housing Units | 209 | 55.1% |
| Renter-Occupied Housing Units | 170 | 44.9% |
| Total Occupied Housing Units | 379 | 100.0% |
Occupancy by Household Size in Dillon
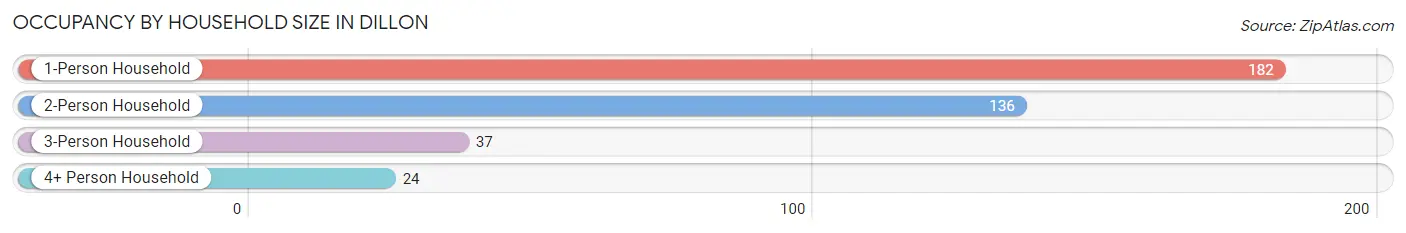
| Household Size | # Housing Units | % Housing Units |
| 1-Person Household | 182 | 48.0% |
| 2-Person Household | 136 | 35.9% |
| 3-Person Household | 37 | 9.8% |
| 4+ Person Household | 24 | 6.3% |
| Total Housing Units | 379 | 100.0% |
Occupancy by Ownership by Household Size in Dillon
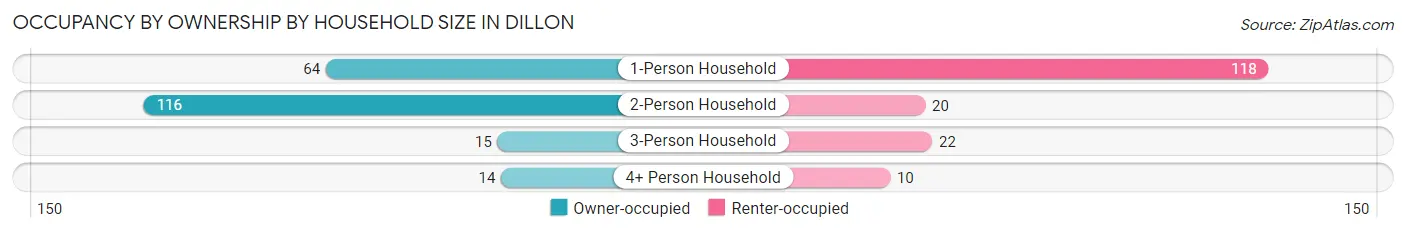
| Household Size | Owner-occupied | Renter-occupied |
| 1-Person Household | 64 (35.2%) | 118 (64.8%) |
| 2-Person Household | 116 (85.3%) | 20 (14.7%) |
| 3-Person Household | 15 (40.5%) | 22 (59.5%) |
| 4+ Person Household | 14 (58.3%) | 10 (41.7%) |
| Total Housing Units | 209 (55.1%) | 170 (44.9%) |
Occupancy by Educational Attainment in Dillon
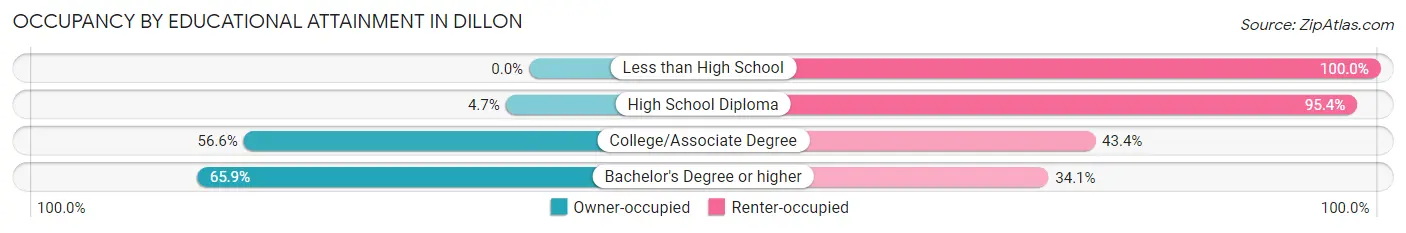
| Household Size | Owner-occupied | Renter-occupied |
| Less than High School | 0 (0.0%) | 11 (100.0%) |
| High School Diploma | 2 (4.6%) | 41 (95.4%) |
| College/Associate Degree | 43 (56.6%) | 33 (43.4%) |
| Bachelor's Degree or higher | 164 (65.9%) | 85 (34.1%) |
Occupancy by Age of Householder in Dillon
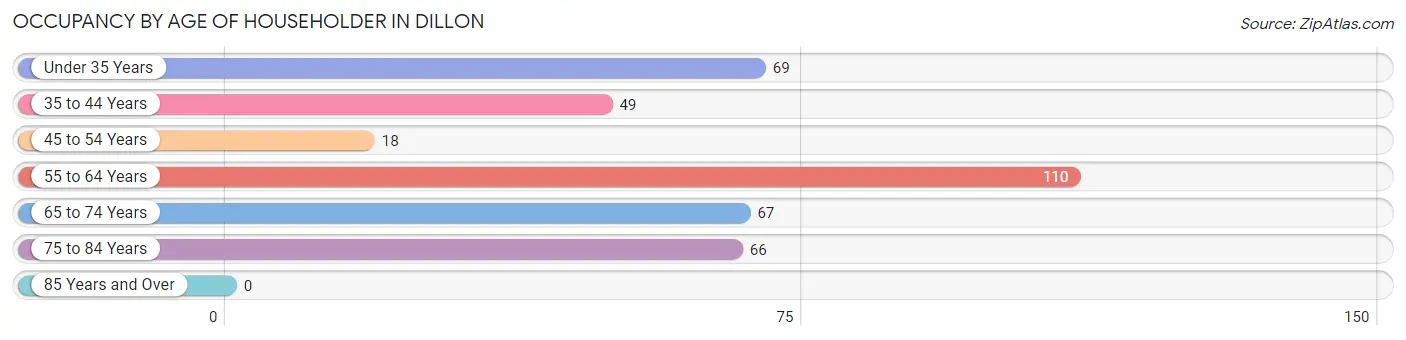
| Age Bracket | # Households | % Households |
| Under 35 Years | 69 | 18.2% |
| 35 to 44 Years | 49 | 12.9% |
| 45 to 54 Years | 18 | 4.8% |
| 55 to 64 Years | 110 | 29.0% |
| 65 to 74 Years | 67 | 17.7% |
| 75 to 84 Years | 66 | 17.4% |
| 85 Years and Over | 0 | 0.0% |
| Total | 379 | 100.0% |
Housing Finances in Dillon
Median Income by Occupancy in Dillon
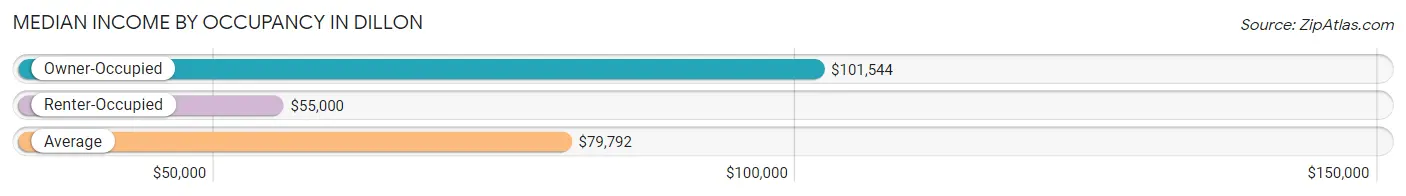
| Occupancy Type | # Households | Median Income |
| Owner-Occupied | 209 (55.1%) | $101,544 |
| Renter-Occupied | 170 (44.9%) | $55,000 |
| Average | 379 (100.0%) | $79,792 |
Occupancy by Householder Income Bracket in Dillon
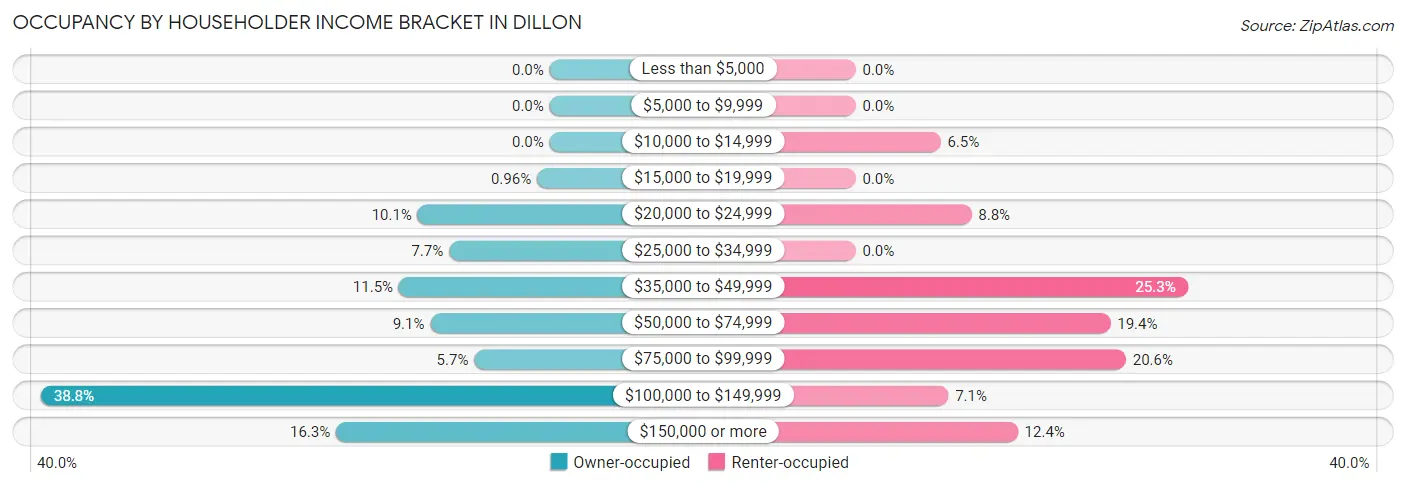
| Income Bracket | Owner-occupied | Renter-occupied |
| Less than $5,000 | 0 (0.0%) | 0 (0.0%) |
| $5,000 to $9,999 | 0 (0.0%) | 0 (0.0%) |
| $10,000 to $14,999 | 0 (0.0%) | 11 (6.5%) |
| $15,000 to $19,999 | 2 (1.0%) | 0 (0.0%) |
| $20,000 to $24,999 | 21 (10.1%) | 15 (8.8%) |
| $25,000 to $34,999 | 16 (7.7%) | 0 (0.0%) |
| $35,000 to $49,999 | 24 (11.5%) | 43 (25.3%) |
| $50,000 to $74,999 | 19 (9.1%) | 33 (19.4%) |
| $75,000 to $99,999 | 12 (5.7%) | 35 (20.6%) |
| $100,000 to $149,999 | 81 (38.8%) | 12 (7.1%) |
| $150,000 or more | 34 (16.3%) | 21 (12.3%) |
| Total | 209 (100.0%) | 170 (100.0%) |
Monthly Housing Cost Tiers in Dillon
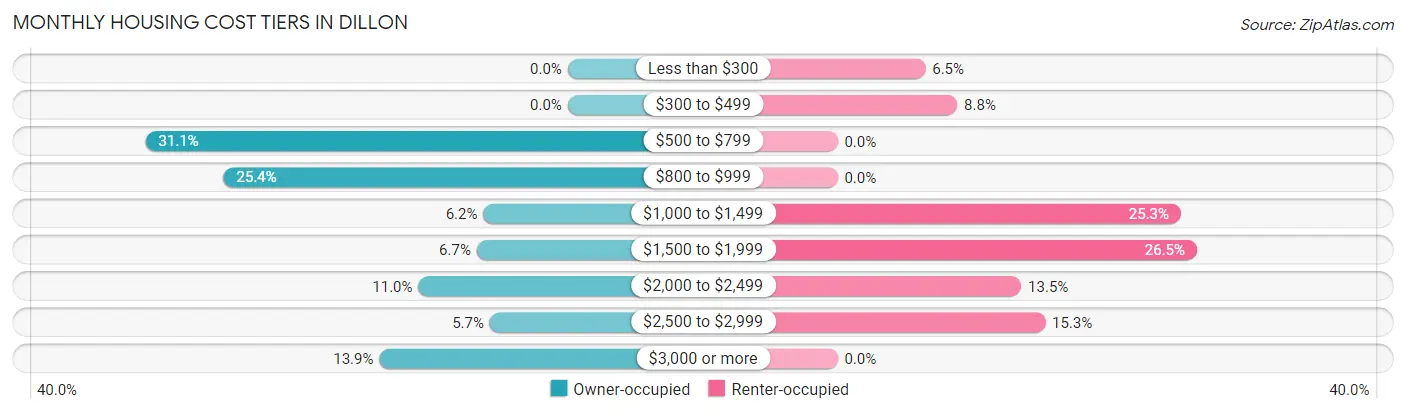
| Monthly Cost | Owner-occupied | Renter-occupied |
| Less than $300 | 0 (0.0%) | 11 (6.5%) |
| $300 to $499 | 0 (0.0%) | 15 (8.8%) |
| $500 to $799 | 65 (31.1%) | 0 (0.0%) |
| $800 to $999 | 53 (25.4%) | 0 (0.0%) |
| $1,000 to $1,499 | 13 (6.2%) | 43 (25.3%) |
| $1,500 to $1,999 | 14 (6.7%) | 45 (26.5%) |
| $2,000 to $2,499 | 23 (11.0%) | 23 (13.5%) |
| $2,500 to $2,999 | 12 (5.7%) | 26 (15.3%) |
| $3,000 or more | 29 (13.9%) | 0 (0.0%) |
| Total | 209 (100.0%) | 170 (100.0%) |
Physical Housing Characteristics in Dillon
Housing Structures in Dillon
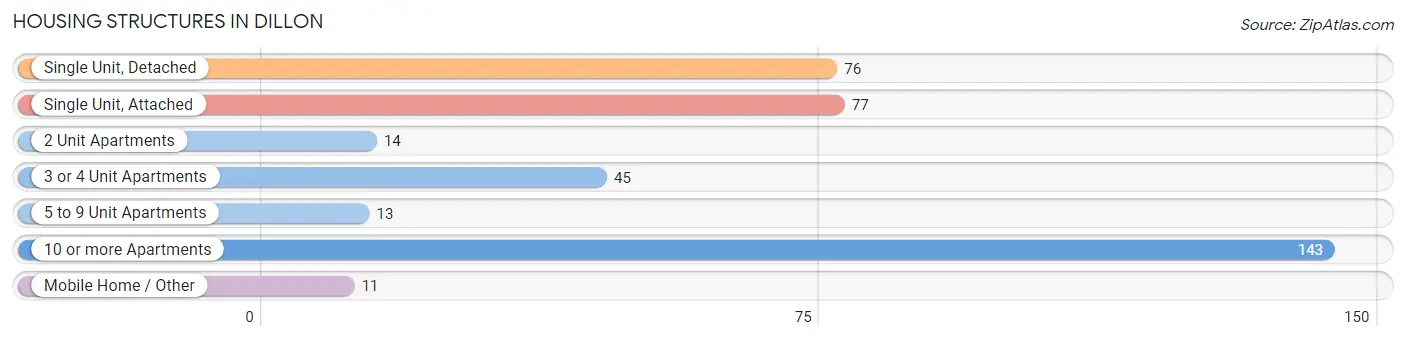
| Structure Type | # Housing Units | % Housing Units |
| Single Unit, Detached | 76 | 20.1% |
| Single Unit, Attached | 77 | 20.3% |
| 2 Unit Apartments | 14 | 3.7% |
| 3 or 4 Unit Apartments | 45 | 11.9% |
| 5 to 9 Unit Apartments | 13 | 3.4% |
| 10 or more Apartments | 143 | 37.7% |
| Mobile Home / Other | 11 | 2.9% |
| Total | 379 | 100.0% |
Housing Structures by Occupancy in Dillon
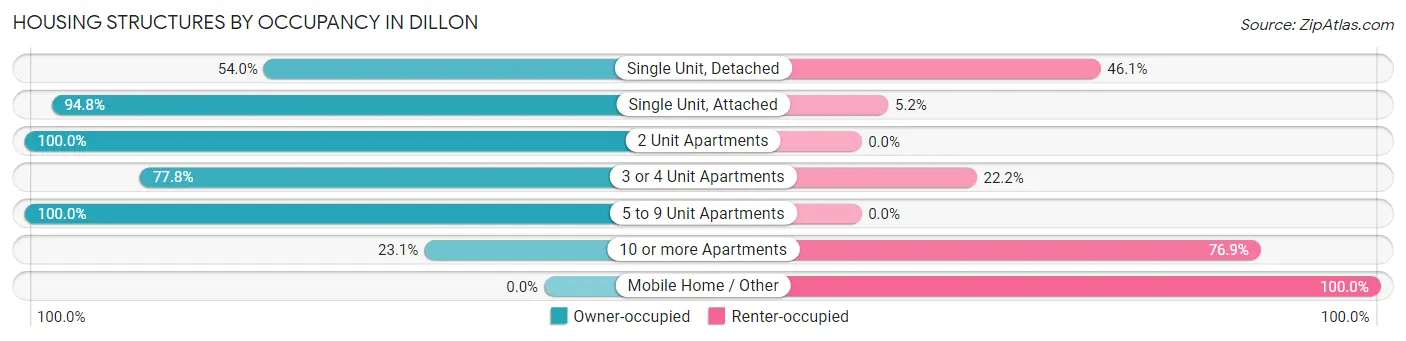
| Structure Type | Owner-occupied | Renter-occupied |
| Single Unit, Detached | 41 (53.9%) | 35 (46.1%) |
| Single Unit, Attached | 73 (94.8%) | 4 (5.2%) |
| 2 Unit Apartments | 14 (100.0%) | 0 (0.0%) |
| 3 or 4 Unit Apartments | 35 (77.8%) | 10 (22.2%) |
| 5 to 9 Unit Apartments | 13 (100.0%) | 0 (0.0%) |
| 10 or more Apartments | 33 (23.1%) | 110 (76.9%) |
| Mobile Home / Other | 0 (0.0%) | 11 (100.0%) |
| Total | 209 (55.1%) | 170 (44.9%) |
Housing Structures by Number of Rooms in Dillon
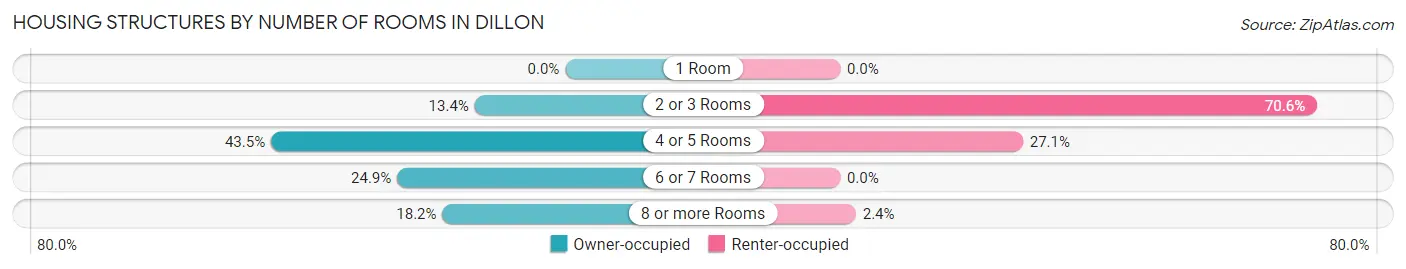
| Number of Rooms | Owner-occupied | Renter-occupied |
| 1 Room | 0 (0.0%) | 0 (0.0%) |
| 2 or 3 Rooms | 28 (13.4%) | 120 (70.6%) |
| 4 or 5 Rooms | 91 (43.5%) | 46 (27.1%) |
| 6 or 7 Rooms | 52 (24.9%) | 0 (0.0%) |
| 8 or more Rooms | 38 (18.2%) | 4 (2.4%) |
| Total | 209 (100.0%) | 170 (100.0%) |
Housing Structure by Heating Type in Dillon
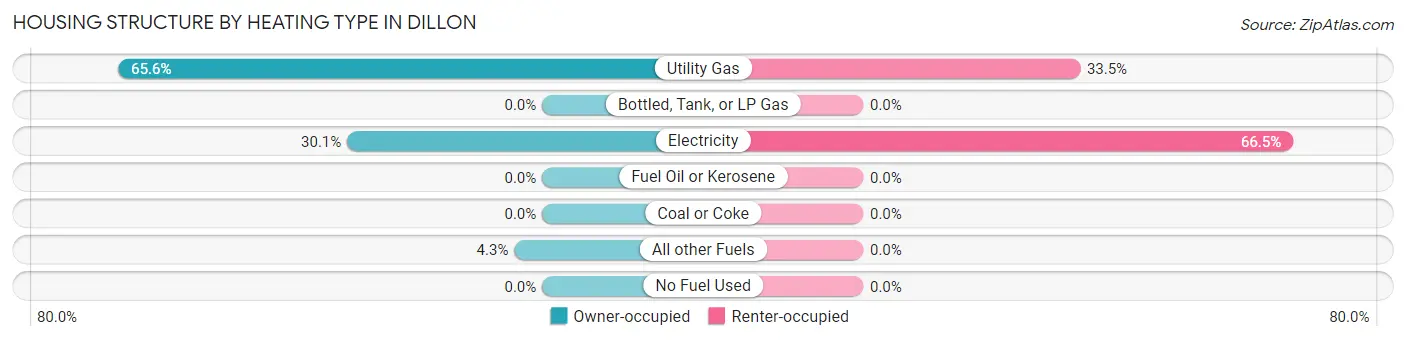
| Heating Type | Owner-occupied | Renter-occupied |
| Utility Gas | 137 (65.5%) | 57 (33.5%) |
| Bottled, Tank, or LP Gas | 0 (0.0%) | 0 (0.0%) |
| Electricity | 63 (30.1%) | 113 (66.5%) |
| Fuel Oil or Kerosene | 0 (0.0%) | 0 (0.0%) |
| Coal or Coke | 0 (0.0%) | 0 (0.0%) |
| All other Fuels | 9 (4.3%) | 0 (0.0%) |
| No Fuel Used | 0 (0.0%) | 0 (0.0%) |
| Total | 209 (100.0%) | 170 (100.0%) |
Household Vehicle Usage in Dillon
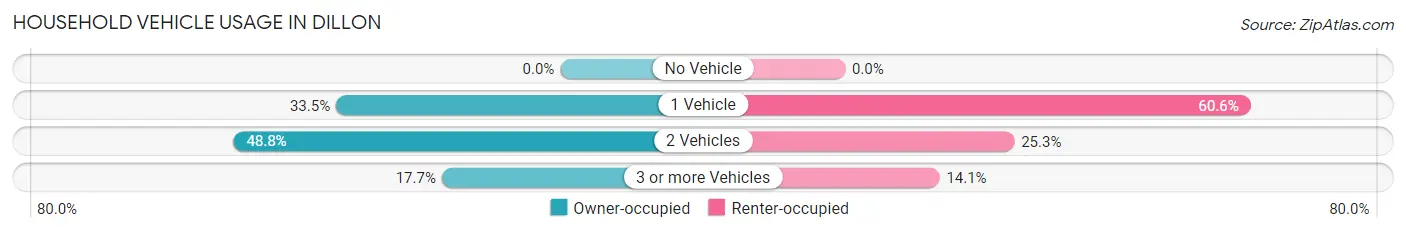
| Vehicles per Household | Owner-occupied | Renter-occupied |
| No Vehicle | 0 (0.0%) | 0 (0.0%) |
| 1 Vehicle | 70 (33.5%) | 103 (60.6%) |
| 2 Vehicles | 102 (48.8%) | 43 (25.3%) |
| 3 or more Vehicles | 37 (17.7%) | 24 (14.1%) |
| Total | 209 (100.0%) | 170 (100.0%) |
Real Estate & Mortgages in Dillon
Real Estate and Mortgage Overview in Dillon
| Characteristic | Without Mortgage | With Mortgage |
| Housing Units | 131 | 78 |
| Median Property Value | $766,400 | $833,300 |
| Median Household Income | $77,708 | $24 |
| Monthly Housing Costs | $801 | $29 |
| Real Estate Taxes | $2,265 | $0 |
Property Value by Mortgage Status in Dillon
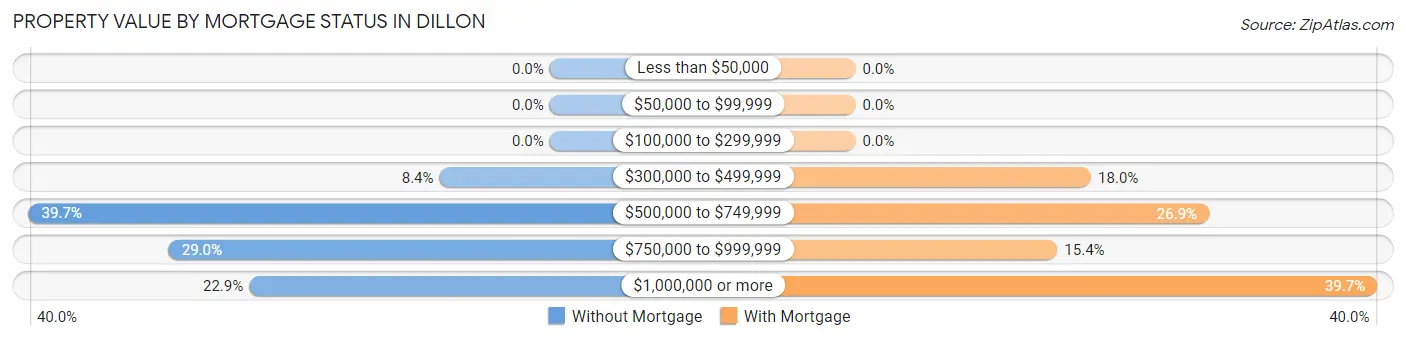
| Property Value | Without Mortgage | With Mortgage |
| Less than $50,000 | 0 (0.0%) | 0 (0.0%) |
| $50,000 to $99,999 | 0 (0.0%) | 0 (0.0%) |
| $100,000 to $299,999 | 0 (0.0%) | 0 (0.0%) |
| $300,000 to $499,999 | 11 (8.4%) | 14 (17.9%) |
| $500,000 to $749,999 | 52 (39.7%) | 21 (26.9%) |
| $750,000 to $999,999 | 38 (29.0%) | 12 (15.4%) |
| $1,000,000 or more | 30 (22.9%) | 31 (39.7%) |
| Total | 131 (100.0%) | 78 (100.0%) |
Household Income by Mortgage Status in Dillon
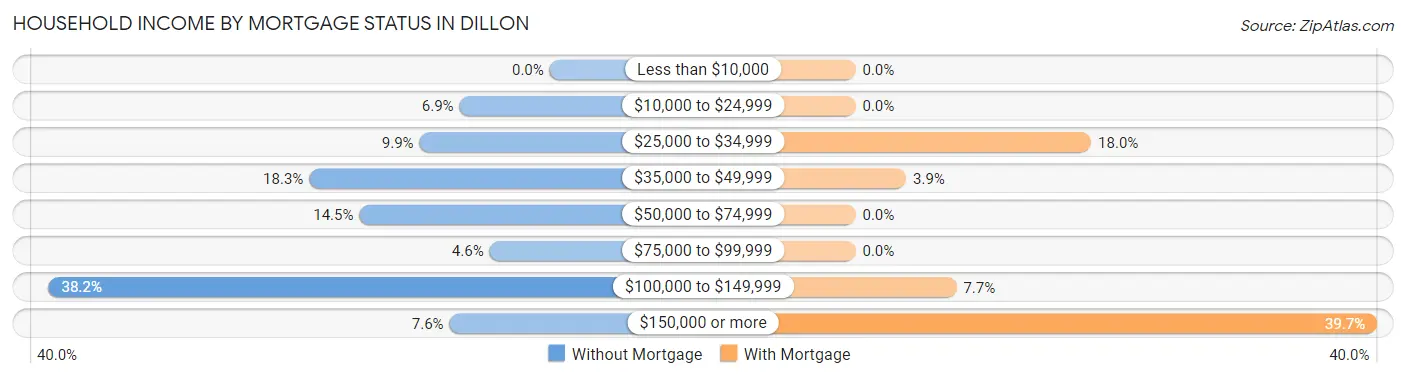
| Household Income | Without Mortgage | With Mortgage |
| Less than $10,000 | 0 (0.0%) | 0 (0.0%) |
| $10,000 to $24,999 | 9 (6.9%) | 0 (0.0%) |
| $25,000 to $34,999 | 13 (9.9%) | 14 (17.9%) |
| $35,000 to $49,999 | 24 (18.3%) | 3 (3.8%) |
| $50,000 to $74,999 | 19 (14.5%) | 0 (0.0%) |
| $75,000 to $99,999 | 6 (4.6%) | 0 (0.0%) |
| $100,000 to $149,999 | 50 (38.2%) | 6 (7.7%) |
| $150,000 or more | 10 (7.6%) | 31 (39.7%) |
| Total | 131 (100.0%) | 78 (100.0%) |
Property Value to Household Income Ratio in Dillon
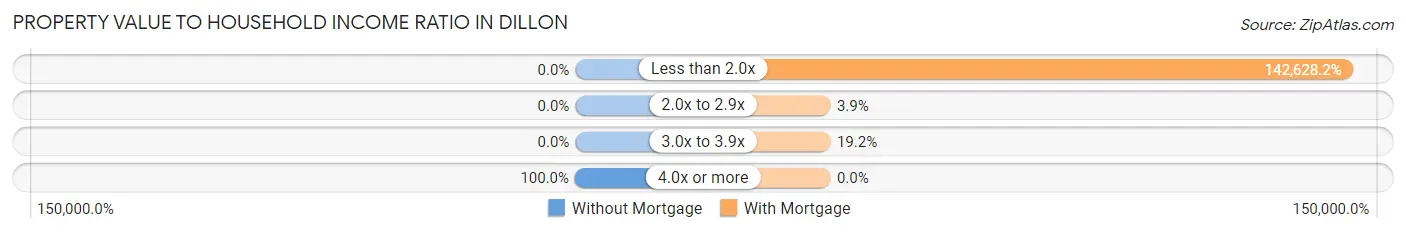
| Value-to-Income Ratio | Without Mortgage | With Mortgage |
| Less than 2.0x | 0 (0.0%) | 111,250 (142,628.2%) |
| 2.0x to 2.9x | 0 (0.0%) | 3 (3.8%) |
| 3.0x to 3.9x | 0 (0.0%) | 15 (19.2%) |
| 4.0x or more | 131 (100.0%) | 0 (0.0%) |
| Total | 131 (100.0%) | 78 (100.0%) |
Real Estate Taxes by Mortgage Status in Dillon
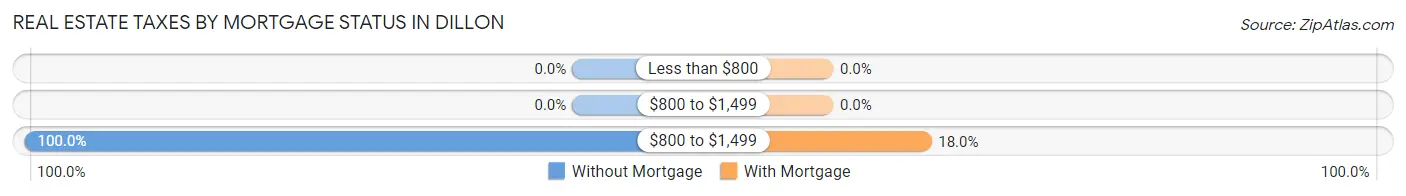
| Property Taxes | Without Mortgage | With Mortgage |
| Less than $800 | 0 (0.0%) | 0 (0.0%) |
| $800 to $1,499 | 0 (0.0%) | 0 (0.0%) |
| $800 to $1,499 | 131 (100.0%) | 14 (17.9%) |
| Total | 131 (100.0%) | 78 (100.0%) |
Health & Disability in Dillon
Health Insurance Coverage by Age in Dillon
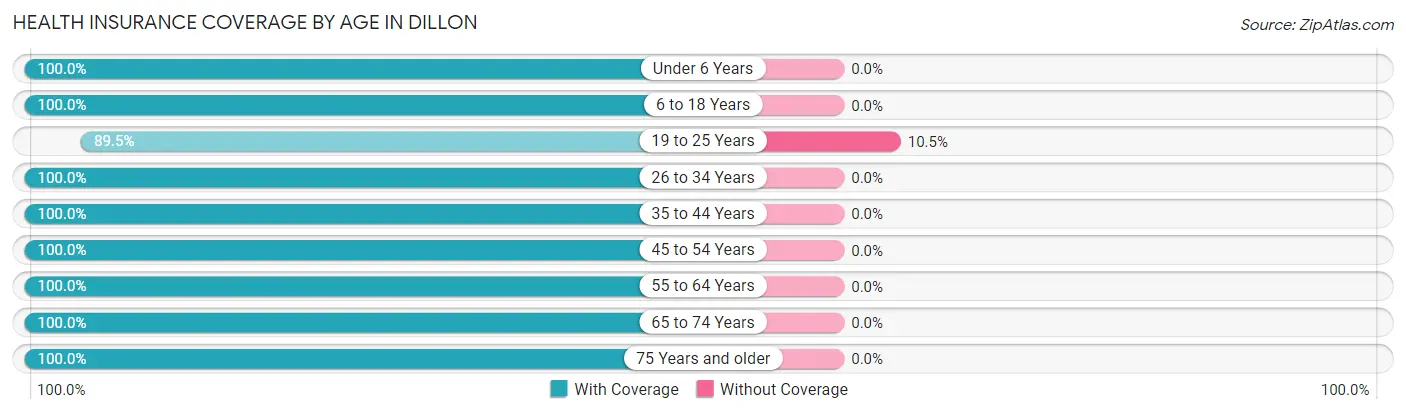
| Age Bracket | With Coverage | Without Coverage |
| Under 6 Years | 8 (100.0%) | 0 (0.0%) |
| 6 to 18 Years | 8 (100.0%) | 0 (0.0%) |
| 19 to 25 Years | 34 (89.5%) | 4 (10.5%) |
| 26 to 34 Years | 215 (100.0%) | 0 (0.0%) |
| 35 to 44 Years | 87 (100.0%) | 0 (0.0%) |
| 45 to 54 Years | 96 (100.0%) | 0 (0.0%) |
| 55 to 64 Years | 187 (100.0%) | 0 (0.0%) |
| 65 to 74 Years | 92 (100.0%) | 0 (0.0%) |
| 75 Years and older | 100 (100.0%) | 0 (0.0%) |
| Total | 827 (99.5%) | 4 (0.5%) |
Health Insurance Coverage by Citizenship Status in Dillon
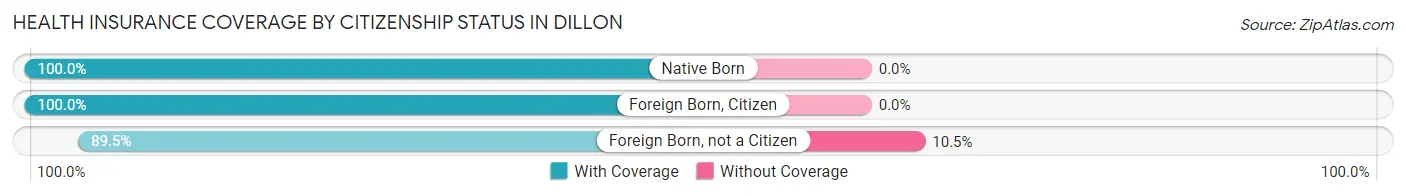
| Citizenship Status | With Coverage | Without Coverage |
| Native Born | 8 (100.0%) | 0 (0.0%) |
| Foreign Born, Citizen | 8 (100.0%) | 0 (0.0%) |
| Foreign Born, not a Citizen | 34 (89.5%) | 4 (10.5%) |
Health Insurance Coverage by Household Income in Dillon
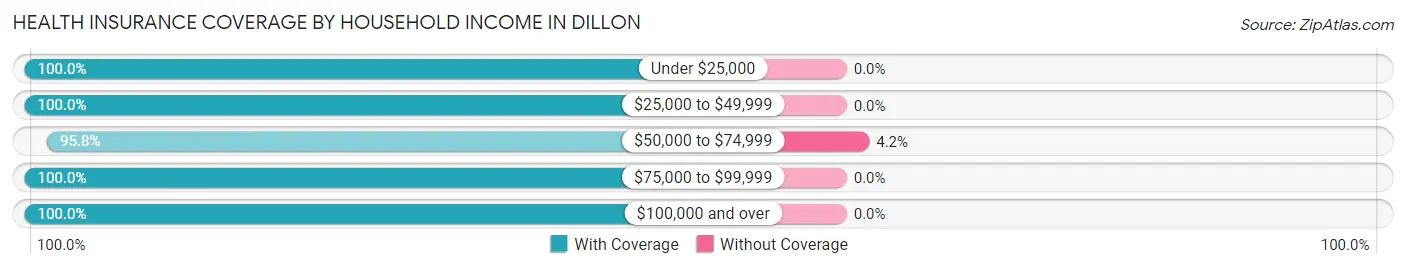
| Household Income | With Coverage | Without Coverage |
| Under $25,000 | 72 (100.0%) | 0 (0.0%) |
| $25,000 to $49,999 | 91 (100.0%) | 0 (0.0%) |
| $50,000 to $74,999 | 91 (95.8%) | 4 (4.2%) |
| $75,000 to $99,999 | 137 (100.0%) | 0 (0.0%) |
| $100,000 and over | 436 (100.0%) | 0 (0.0%) |
Public vs Private Health Insurance Coverage by Age in Dillon
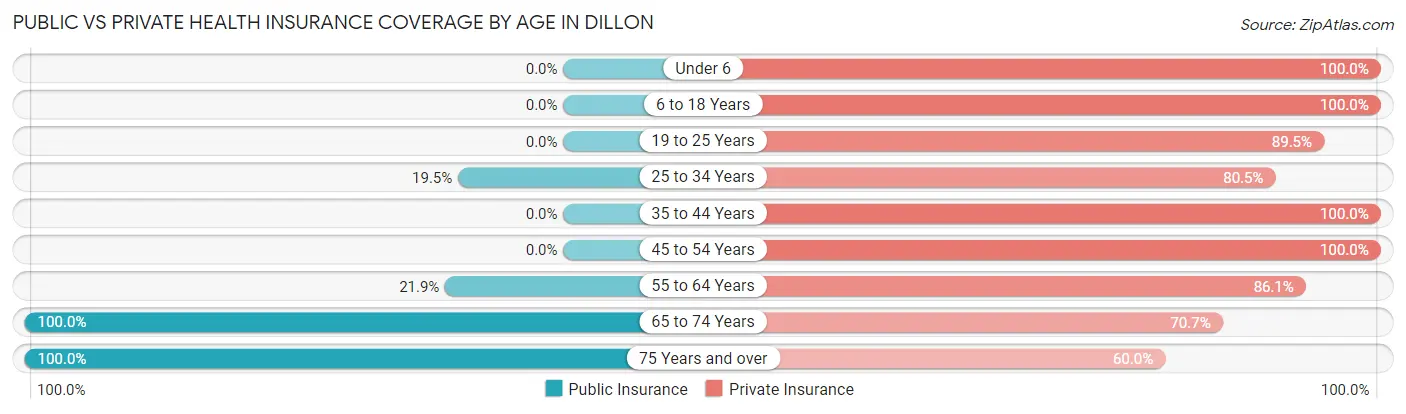
| Age Bracket | Public Insurance | Private Insurance |
| Under 6 | 0 (0.0%) | 8 (100.0%) |
| 6 to 18 Years | 0 (0.0%) | 8 (100.0%) |
| 19 to 25 Years | 0 (0.0%) | 34 (89.5%) |
| 25 to 34 Years | 42 (19.5%) | 173 (80.5%) |
| 35 to 44 Years | 0 (0.0%) | 87 (100.0%) |
| 45 to 54 Years | 0 (0.0%) | 96 (100.0%) |
| 55 to 64 Years | 41 (21.9%) | 161 (86.1%) |
| 65 to 74 Years | 92 (100.0%) | 65 (70.7%) |
| 75 Years and over | 100 (100.0%) | 60 (60.0%) |
| Total | 275 (33.1%) | 692 (83.3%) |
Disability Status by Sex by Age in Dillon
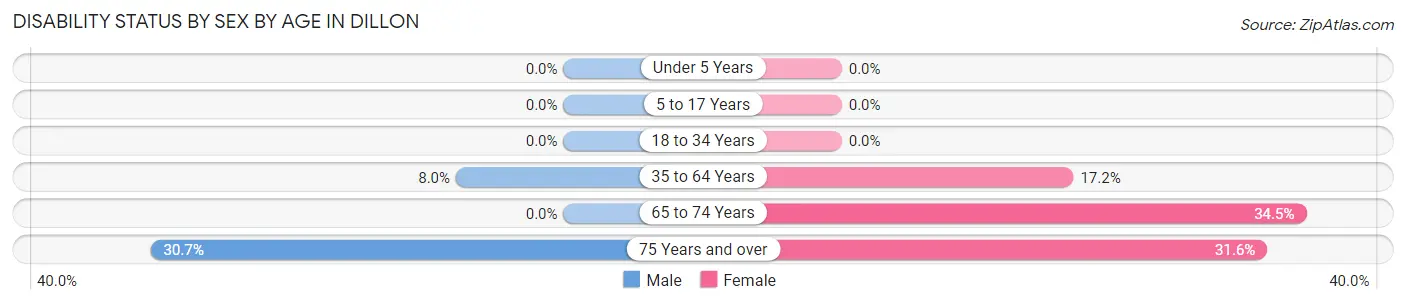
| Age Bracket | Male | Female |
| Under 5 Years | 0 (0.0%) | 0 (0.0%) |
| 5 to 17 Years | 0 (0.0%) | 0 (0.0%) |
| 18 to 34 Years | 0 (0.0%) | 0 (0.0%) |
| 35 to 64 Years | 17 (8.0%) | 27 (17.2%) |
| 65 to 74 Years | 0 (0.0%) | 20 (34.5%) |
| 75 Years and over | 19 (30.6%) | 12 (31.6%) |
Disability Class by Sex by Age in Dillon
Disability Class: Hearing Difficulty
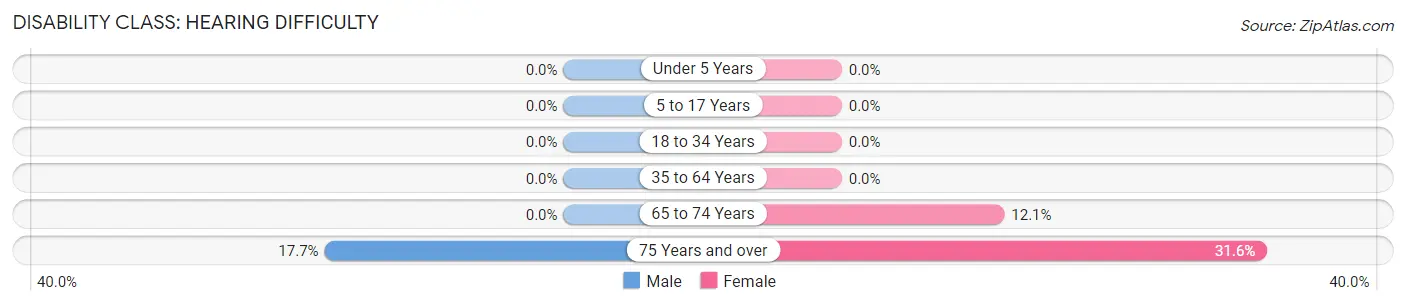
| Age Bracket | Male | Female |
| Under 5 Years | 0 (0.0%) | 0 (0.0%) |
| 5 to 17 Years | 0 (0.0%) | 0 (0.0%) |
| 18 to 34 Years | 0 (0.0%) | 0 (0.0%) |
| 35 to 64 Years | 0 (0.0%) | 0 (0.0%) |
| 65 to 74 Years | 0 (0.0%) | 7 (12.1%) |
| 75 Years and over | 11 (17.7%) | 12 (31.6%) |
Disability Class: Vision Difficulty
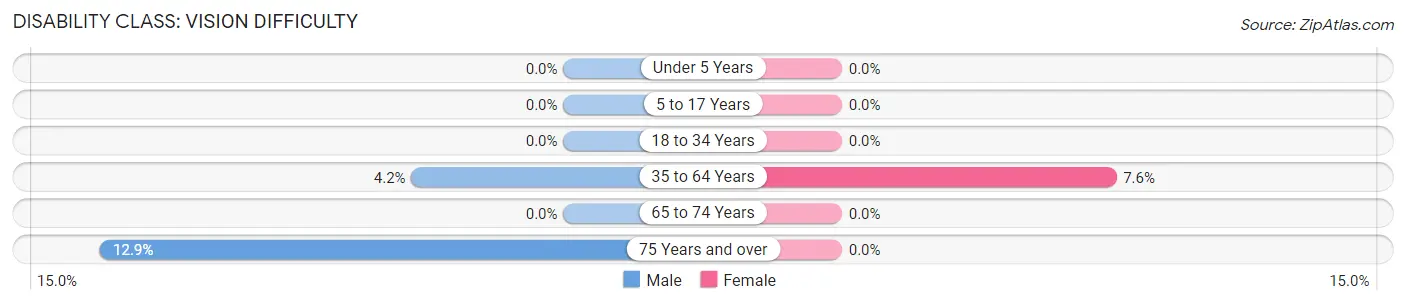
| Age Bracket | Male | Female |
| Under 5 Years | 0 (0.0%) | 0 (0.0%) |
| 5 to 17 Years | 0 (0.0%) | 0 (0.0%) |
| 18 to 34 Years | 0 (0.0%) | 0 (0.0%) |
| 35 to 64 Years | 9 (4.2%) | 12 (7.6%) |
| 65 to 74 Years | 0 (0.0%) | 0 (0.0%) |
| 75 Years and over | 8 (12.9%) | 0 (0.0%) |
Disability Class: Cognitive Difficulty
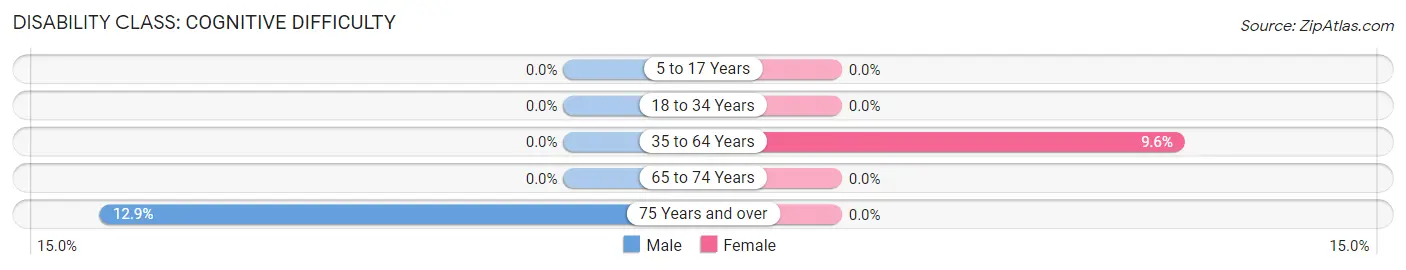
| Age Bracket | Male | Female |
| 5 to 17 Years | 0 (0.0%) | 0 (0.0%) |
| 18 to 34 Years | 0 (0.0%) | 0 (0.0%) |
| 35 to 64 Years | 0 (0.0%) | 15 (9.6%) |
| 65 to 74 Years | 0 (0.0%) | 0 (0.0%) |
| 75 Years and over | 8 (12.9%) | 0 (0.0%) |
Disability Class: Ambulatory Difficulty
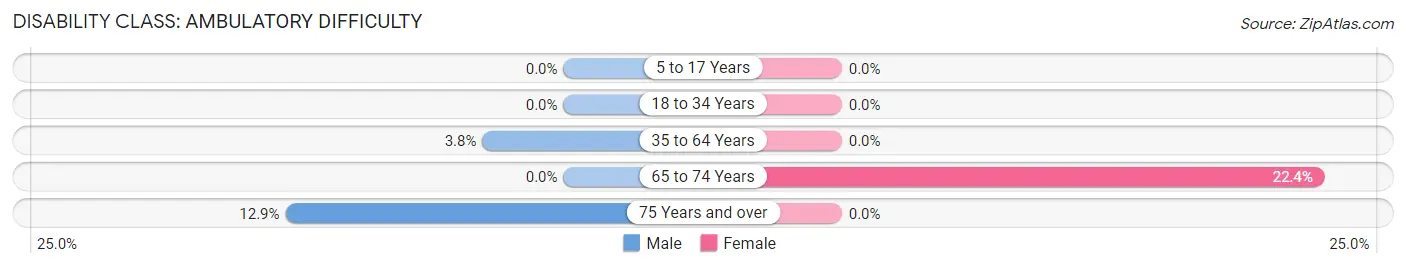
| Age Bracket | Male | Female |
| 5 to 17 Years | 0 (0.0%) | 0 (0.0%) |
| 18 to 34 Years | 0 (0.0%) | 0 (0.0%) |
| 35 to 64 Years | 8 (3.8%) | 0 (0.0%) |
| 65 to 74 Years | 0 (0.0%) | 13 (22.4%) |
| 75 Years and over | 8 (12.9%) | 0 (0.0%) |
Disability Class: Self-Care Difficulty
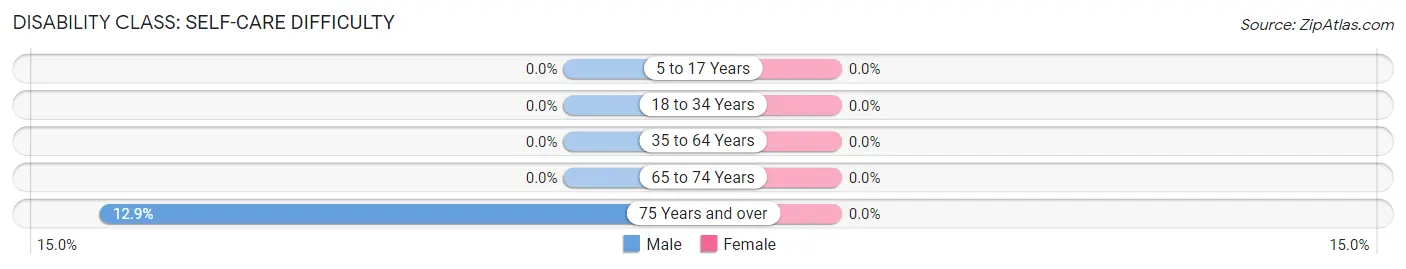
| Age Bracket | Male | Female |
| 5 to 17 Years | 0 (0.0%) | 0 (0.0%) |
| 18 to 34 Years | 0 (0.0%) | 0 (0.0%) |
| 35 to 64 Years | 0 (0.0%) | 0 (0.0%) |
| 65 to 74 Years | 0 (0.0%) | 0 (0.0%) |
| 75 Years and over | 8 (12.9%) | 0 (0.0%) |
Technology Access in Dillon
Computing Device Access in Dillon
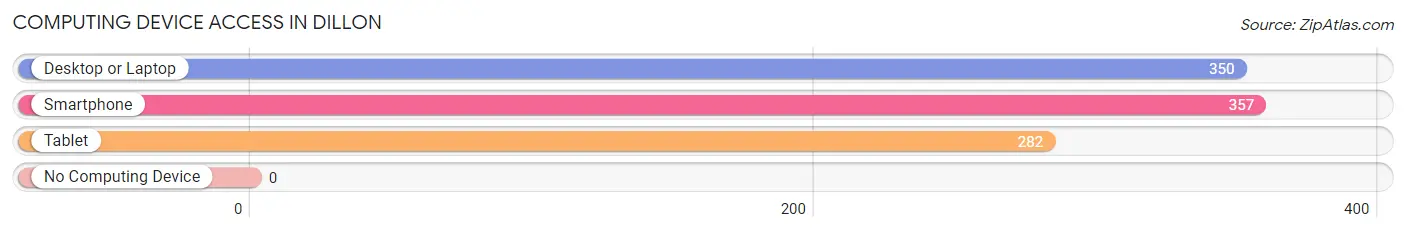
| Device Type | # Households | % Households |
| Desktop or Laptop | 350 | 92.3% |
| Smartphone | 357 | 94.2% |
| Tablet | 282 | 74.4% |
| No Computing Device | 0 | 0.0% |
| Total | 379 | 100.0% |
Internet Access in Dillon
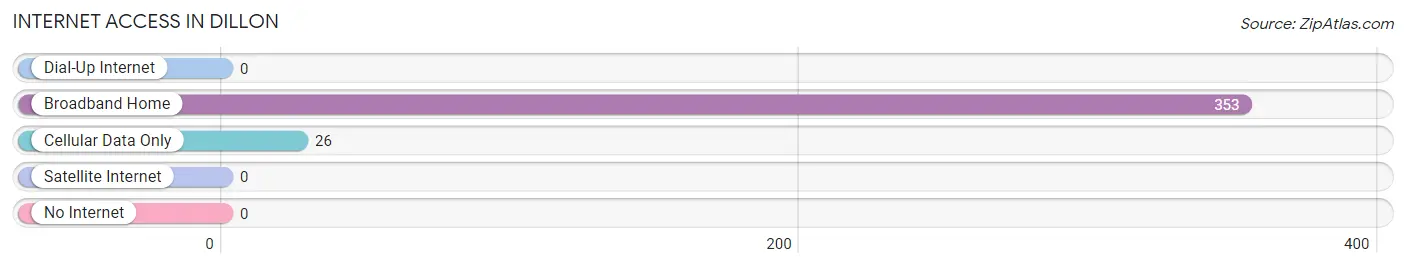
| Internet Type | # Households | % Households |
| Dial-Up Internet | 0 | 0.0% |
| Broadband Home | 353 | 93.1% |
| Cellular Data Only | 26 | 6.9% |
| Satellite Internet | 0 | 0.0% |
| No Internet | 0 | 0.0% |
| Total | 379 | 100.0% |
Dillon Summary
Dillon, Colorado is a small town located in Summit County, Colorado. It is situated in the heart of the Rocky Mountains, just west of the Continental Divide. The town is located at an elevation of 9,017 feet and is surrounded by the White River National Forest. The town was founded in 1881 and is named after the nearby Dillon Reservoir.
History
Dillon, Colorado was founded in 1881 by a group of prospectors who were searching for gold in the area. The town was originally called Summit City, but was later changed to Dillon in honor of the nearby Dillon Reservoir. The reservoir was named after George Dillon, a prospector who discovered gold in the area in 1879.
The town quickly grew and by the early 1900s, it had become a popular destination for tourists and outdoor enthusiasts. The town was home to several hotels, restaurants, and stores. In the 1920s, the town was connected to Denver by a railroad line, which further increased its popularity.
In the 1950s, the town began to decline as the railroad line was abandoned and the tourist industry shifted to other areas. However, in the 1970s, the town began to experience a resurgence as people began to move to the area for its outdoor recreation opportunities.
Geography
Dillon, Colorado is located in Summit County, Colorado. It is situated in the heart of the Rocky Mountains, just west of the Continental Divide. The town is located at an elevation of 9,017 feet and is surrounded by the White River National Forest. The town is located near several ski resorts, including Keystone, Breckenridge, and Arapahoe Basin.
The town is located on the shores of the Dillon Reservoir, which is the largest body of water in Summit County. The reservoir is fed by the Blue River and is a popular destination for fishing, boating, and other water activities.
Economy
The economy of Dillon, Colorado is largely based on tourism and outdoor recreation. The town is home to several ski resorts, including Keystone, Breckenridge, and Arapahoe Basin. The town is also home to several restaurants, bars, and shops.
The town is also home to several businesses that provide services to the local community, such as construction companies, real estate agencies, and medical offices. The town is also home to several manufacturing companies, including a brewery and a distillery.
Demographics
As of the 2010 census, the population of Dillon, Colorado was 945. The town is predominantly white, with 87.3% of the population identifying as white. The town also has a small Hispanic population, with 8.2% of the population identifying as Hispanic or Latino.
The median household income in Dillon, Colorado is $63,750, which is higher than the national average. The median home value in the town is $521,400, which is also higher than the national average. The town has a low unemployment rate of 3.2%.
Conclusion
Dillon, Colorado is a small town located in Summit County, Colorado. It is situated in the heart of the Rocky Mountains, just west of the Continental Divide. The town was founded in 1881 and is named after the nearby Dillon Reservoir. The town is home to several ski resorts, restaurants, and shops. The economy of Dillon is largely based on tourism and outdoor recreation. The town has a predominantly white population, with a median household income of $63,750 and a median home value of $521,400.
Common Questions
What is Per Capita Income in Dillon?
Per Capita income in Dillon is $56,864.
What is the Median Family Income in Dillon?
Median Family Income in Dillon is $115,677.
What is the Median Household income in Dillon?
Median Household Income in Dillon is $79,792.
What is Income or Wage Gap in Dillon?
Income or Wage Gap in Dillon is 34.7%.
Women in Dillon earn 65.3 cents for every dollar earned by a man.
What is Inequality or Gini Index in Dillon?
Inequality or Gini Index in Dillon is 0.44.
What is the Total Population of Dillon?
Total Population of Dillon is 831.
What is the Total Male Population of Dillon?
Total Male Population of Dillon is 465.
What is the Total Female Population of Dillon?
Total Female Population of Dillon is 366.
What is the Ratio of Males per 100 Females in Dillon?
There are 127.05 Males per 100 Females in Dillon.
What is the Ratio of Females per 100 Males in Dillon?
There are 78.71 Females per 100 Males in Dillon.
What is the Median Population Age in Dillon?
Median Population Age in Dillon is 49.9 Years.
What is the Average Family Size in Dillon
Average Family Size in Dillon is 2.4 People.
What is the Average Household Size in Dillon
Average Household Size in Dillon is 2.2 People.
How Large is the Labor Force in Dillon?
There are 500 People in the Labor Forcein in Dillon.
What is the Percentage of People in the Labor Force in Dillon?
61.3% of People are in the Labor Force in Dillon.
What is the Unemployment Rate in Dillon?
Unemployment Rate in Dillon is 4.6%.