Tuscaloosa, AL Map & Demographics
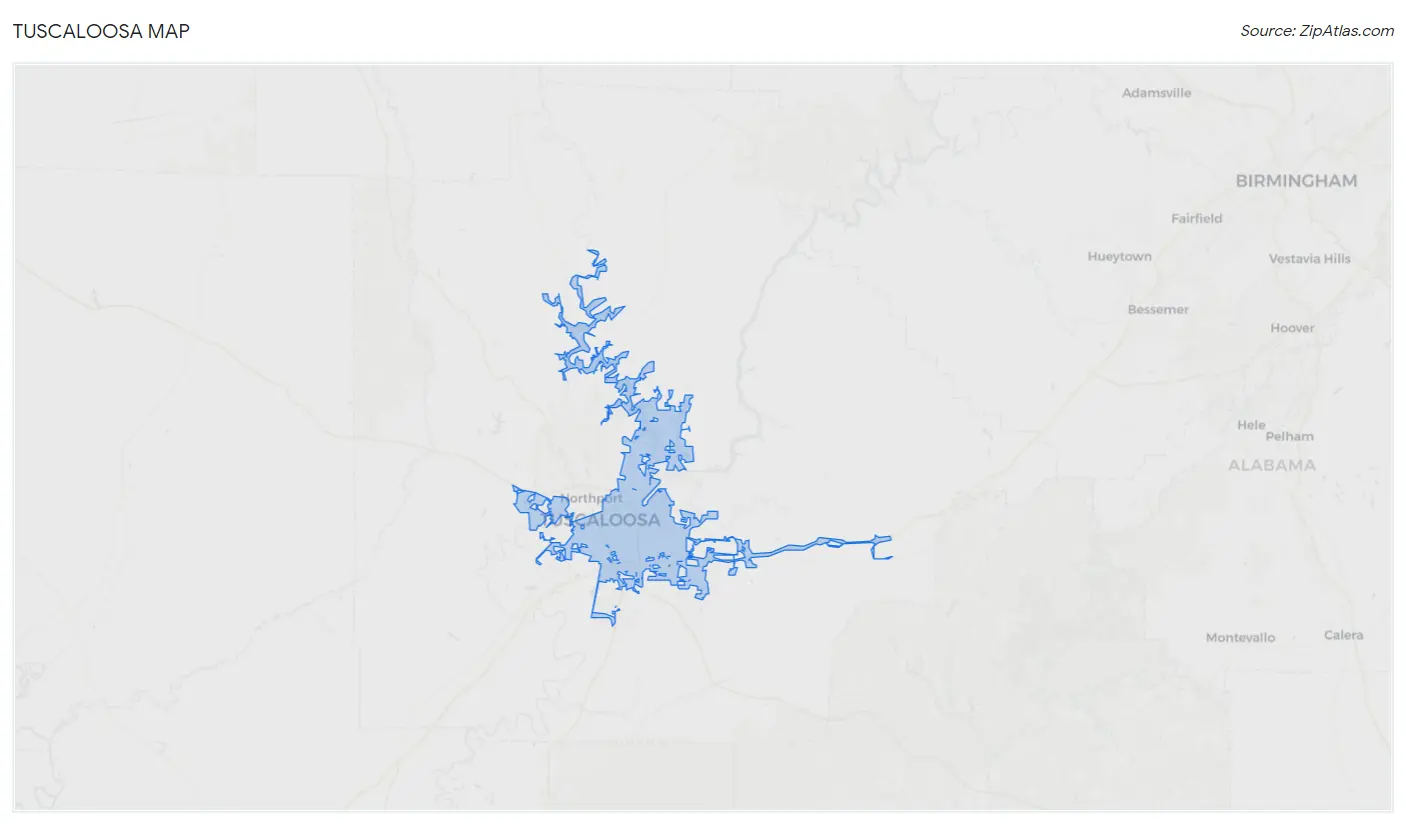
Tuscaloosa Map
Tuscaloosa Overview
$30,761
PER CAPITA INCOME
$77,126
AVG FAMILY INCOME
$47,257
AVG HOUSEHOLD INCOME
29.5%
WAGE / INCOME GAP [ % ]
70.5¢/ $1
WAGE / INCOME GAP [ $ ]
$10,069
FAMILY INCOME DEFICIT
0.54
INEQUALITY / GINI INDEX
105,797
TOTAL POPULATION
50,375
MALE POPULATION
55,422
FEMALE POPULATION
90.89
MALES / 100 FEMALES
110.02
FEMALES / 100 MALES
28.8
MEDIAN AGE
3.2
AVG FAMILY SIZE
2.4
AVG HOUSEHOLD SIZE
52,133
LABOR FORCE [ PEOPLE ]
58.2%
PERCENT IN LABOR FORCE
6.8%
UNEMPLOYMENT RATE
Tuscaloosa Area Codes
Income in Tuscaloosa
Income Overview in Tuscaloosa
Per Capita Income in Tuscaloosa is $30,761, while median incomes of families and households are $77,126 and $47,257 respectively.
| Characteristic | Number | Measure |
| Per Capita Income | 105,797 | $30,761 |
| Median Family Income | 20,546 | $77,126 |
| Mean Family Income | 20,546 | $105,895 |
| Median Household Income | 39,097 | $47,257 |
| Mean Household Income | 39,097 | $77,686 |
| Income Deficit | 20,546 | $10,069 |
| Wage / Income Gap (%) | 105,797 | 29.53% |
| Wage / Income Gap ($) | 105,797 | 70.47¢ per $1 |
| Gini / Inequality Index | 105,797 | 0.54 |
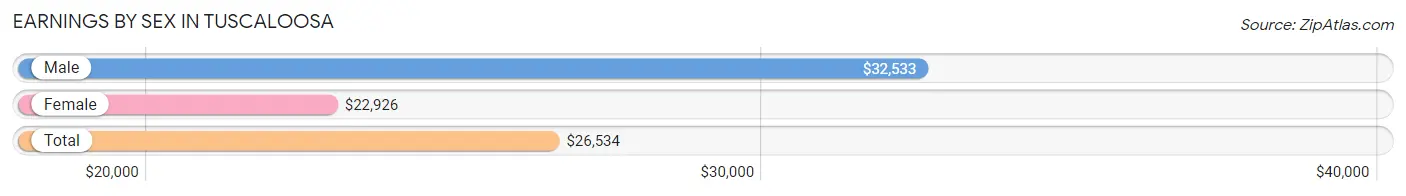
Earnings by Sex in Tuscaloosa
Average Earnings in Tuscaloosa are $26,534, $32,533 for men and $22,926 for women, a difference of 29.5%.
| Sex | Number | Average Earnings |
| Male | 29,602 (49.2%) | $32,533 |
| Female | 30,580 (50.8%) | $22,926 |
| Total | 60,182 (100.0%) | $26,534 |
Earnings by Sex by Income Bracket in Tuscaloosa
The most common earnings brackets in Tuscaloosa are $100,000+ for men (3,715 | 12.6%) and $2,499 or less for women (3,297 | 10.8%).
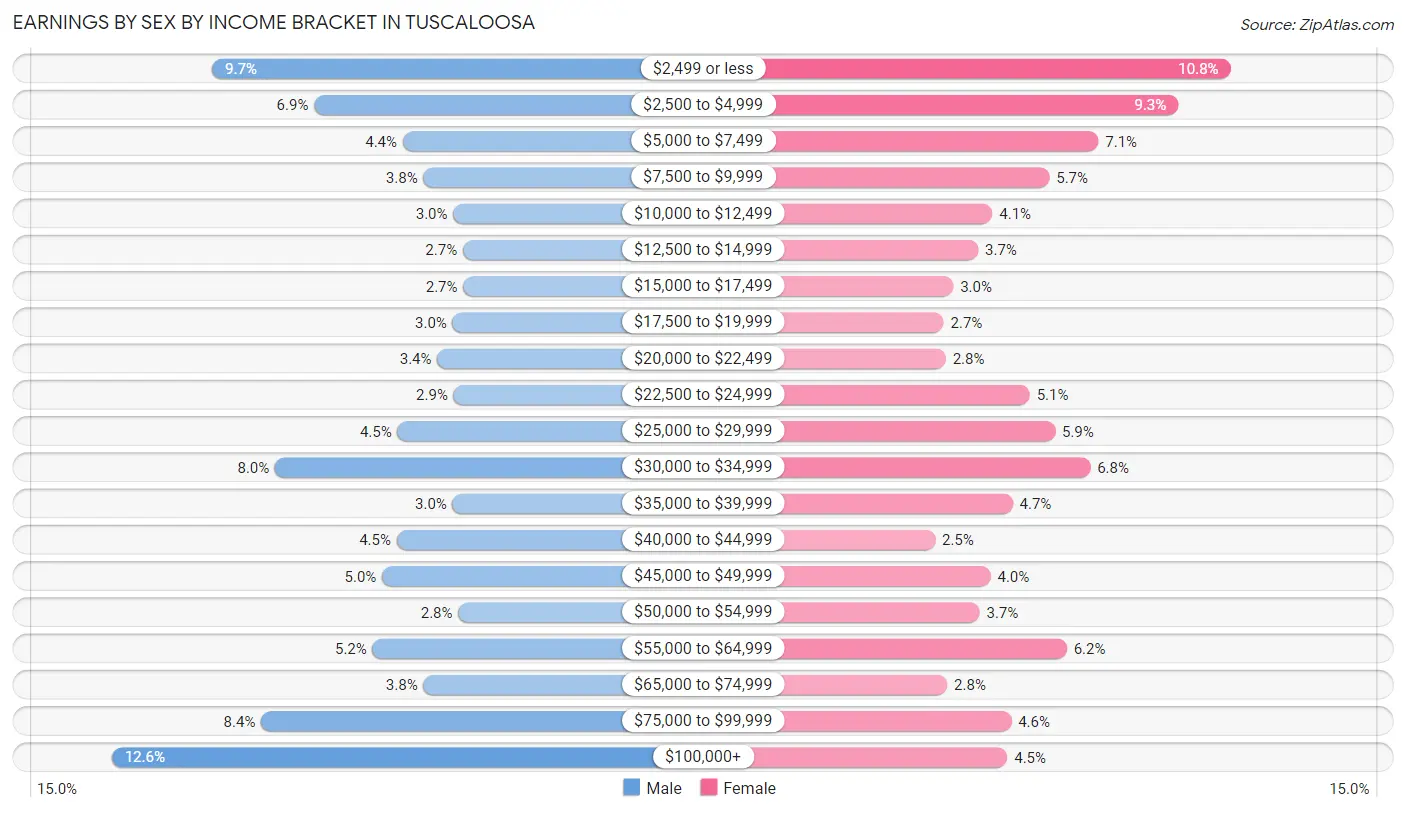
| Income | Male | Female |
| $2,499 or less | 2,880 (9.7%) | 3,297 (10.8%) |
| $2,500 to $4,999 | 2,030 (6.9%) | 2,847 (9.3%) |
| $5,000 to $7,499 | 1,294 (4.4%) | 2,161 (7.1%) |
| $7,500 to $9,999 | 1,121 (3.8%) | 1,739 (5.7%) |
| $10,000 to $12,499 | 874 (2.9%) | 1,252 (4.1%) |
| $12,500 to $14,999 | 792 (2.7%) | 1,129 (3.7%) |
| $15,000 to $17,499 | 789 (2.7%) | 914 (3.0%) |
| $17,500 to $19,999 | 879 (3.0%) | 833 (2.7%) |
| $20,000 to $22,499 | 1,005 (3.4%) | 850 (2.8%) |
| $22,500 to $24,999 | 870 (2.9%) | 1,573 (5.1%) |
| $25,000 to $29,999 | 1,338 (4.5%) | 1,790 (5.9%) |
| $30,000 to $34,999 | 2,356 (8.0%) | 2,091 (6.8%) |
| $35,000 to $39,999 | 880 (3.0%) | 1,424 (4.7%) |
| $40,000 to $44,999 | 1,343 (4.5%) | 757 (2.5%) |
| $45,000 to $49,999 | 1,465 (5.0%) | 1,236 (4.0%) |
| $50,000 to $54,999 | 831 (2.8%) | 1,141 (3.7%) |
| $55,000 to $64,999 | 1,546 (5.2%) | 1,890 (6.2%) |
| $65,000 to $74,999 | 1,122 (3.8%) | 862 (2.8%) |
| $75,000 to $99,999 | 2,472 (8.4%) | 1,414 (4.6%) |
| $100,000+ | 3,715 (12.6%) | 1,380 (4.5%) |
| Total | 29,602 (100.0%) | 30,580 (100.0%) |
Earnings by Sex by Educational Attainment in Tuscaloosa
Average earnings in Tuscaloosa are $46,427 for men and $35,606 for women, a difference of 23.3%. Men with an educational attainment of graduate degree enjoy the highest average annual earnings of $84,359, while those with less than high school education earn the least with $31,816. Women with an educational attainment of graduate degree earn the most with the average annual earnings of $57,457, while those with less than high school education have the smallest earnings of $24,902.
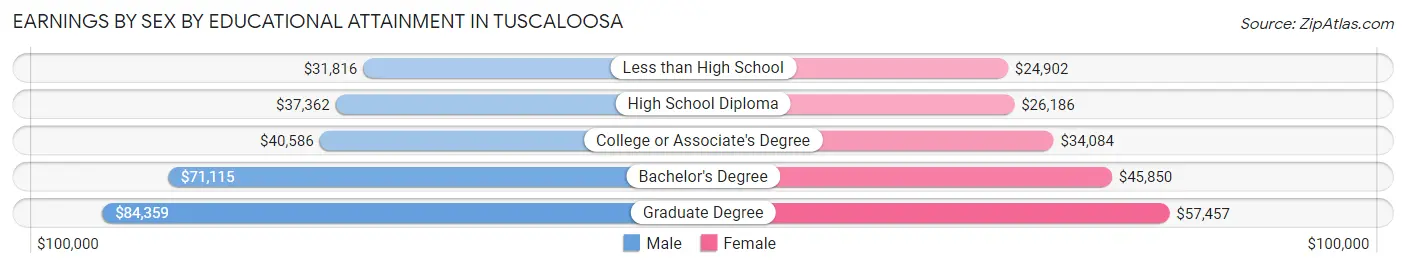
| Educational Attainment | Male Income | Female Income |
| Less than High School | $31,816 | $24,902 |
| High School Diploma | $37,362 | $26,186 |
| College or Associate's Degree | $40,586 | $34,084 |
| Bachelor's Degree | $71,115 | $45,850 |
| Graduate Degree | $84,359 | $57,457 |
| Total | $46,427 | $35,606 |
Family Income in Tuscaloosa
Family Income Brackets in Tuscaloosa
According to the Tuscaloosa family income data, there are 3,657 families falling into the $100,000 to $149,999 income range, which is the most common income bracket and makes up 17.8% of all families. Conversely, the $10,000 to $14,999 income bracket is the least frequent group with only 534 families (2.6%) belonging to this category.
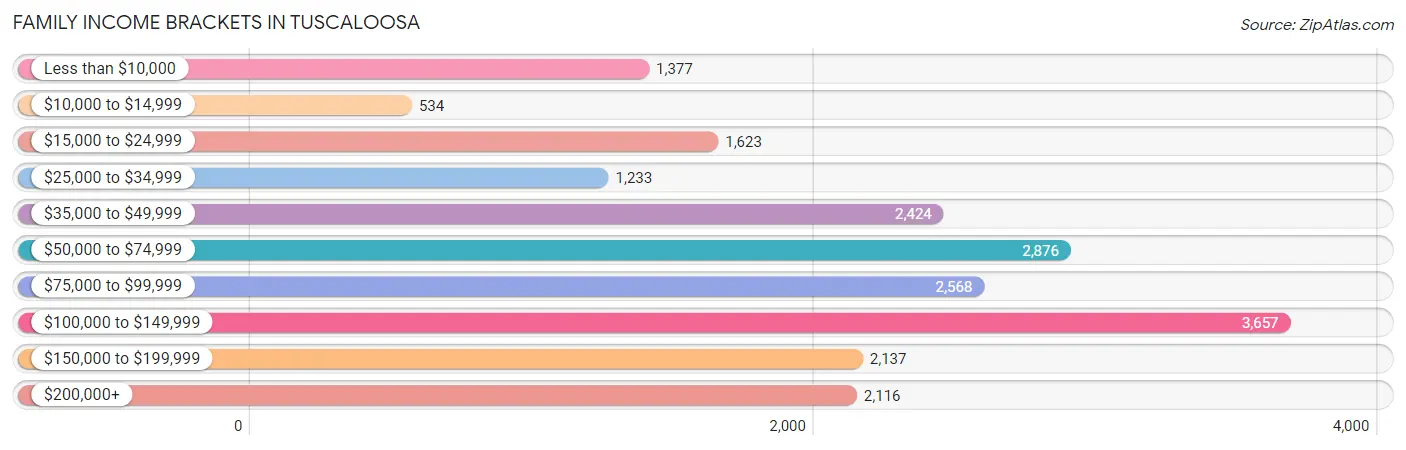
| Income Bracket | # Families | % Families |
| Less than $10,000 | 1,377 | 6.7% |
| $10,000 to $14,999 | 534 | 2.6% |
| $15,000 to $24,999 | 1,623 | 7.9% |
| $25,000 to $34,999 | 1,233 | 6.0% |
| $35,000 to $49,999 | 2,424 | 11.8% |
| $50,000 to $74,999 | 2,876 | 14.0% |
| $75,000 to $99,999 | 2,568 | 12.5% |
| $100,000 to $149,999 | 3,657 | 17.8% |
| $150,000 to $199,999 | 2,137 | 10.4% |
| $200,000+ | 2,116 | 10.3% |
Family Income by Famaliy Size in Tuscaloosa
6-person families (527 | 2.6%) account for the highest median family income in Tuscaloosa with $158,151 per family, while 2-person families (10,881 | 53.0%) have the highest median income of $36,349 per family member.
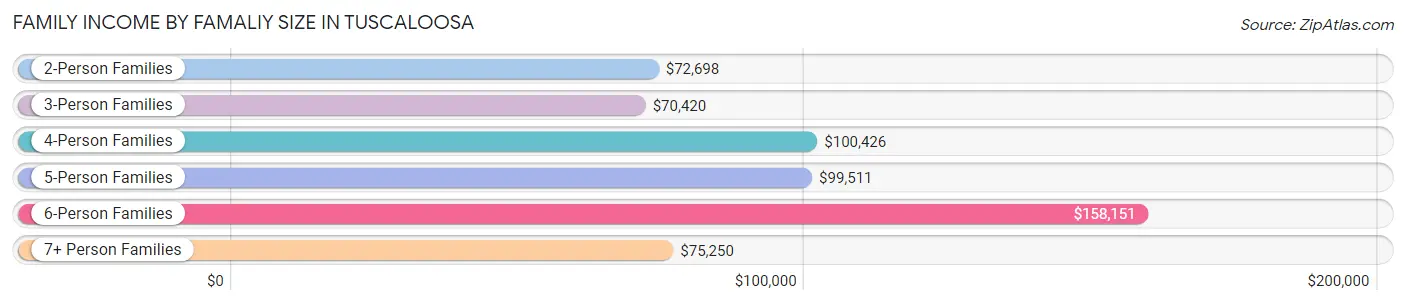
| Income Bracket | # Families | Median Income |
| 2-Person Families | 10,881 (53.0%) | $72,698 |
| 3-Person Families | 4,334 (21.1%) | $70,420 |
| 4-Person Families | 2,851 (13.9%) | $100,426 |
| 5-Person Families | 1,695 (8.3%) | $99,511 |
| 6-Person Families | 527 (2.6%) | $158,151 |
| 7+ Person Families | 258 (1.3%) | $75,250 |
| Total | 20,546 (100.0%) | $77,126 |
Family Income by Number of Earners in Tuscaloosa
The median family income in Tuscaloosa is $77,126, with families comprising 3+ earners (1,459) having the highest median family income of $127,964, while families with no earners (3,226) have the lowest median family income of $40,529, accounting for 7.1% and 15.7% of families, respectively.
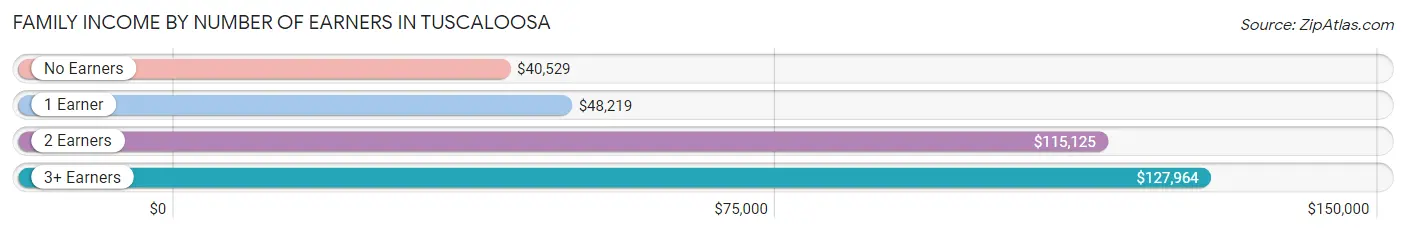
| Number of Earners | # Families | Median Income |
| No Earners | 3,226 (15.7%) | $40,529 |
| 1 Earner | 7,337 (35.7%) | $48,219 |
| 2 Earners | 8,524 (41.5%) | $115,125 |
| 3+ Earners | 1,459 (7.1%) | $127,964 |
| Total | 20,546 (100.0%) | $77,126 |
Household Income in Tuscaloosa
Household Income Brackets in Tuscaloosa
With 5,200 households falling in the category, the $50,000 to $74,999 income range is the most frequent in Tuscaloosa, accounting for 13.3% of all households. In contrast, only 2,307 households (5.9%) fall into the $10,000 to $14,999 income bracket, making it the least populous group.
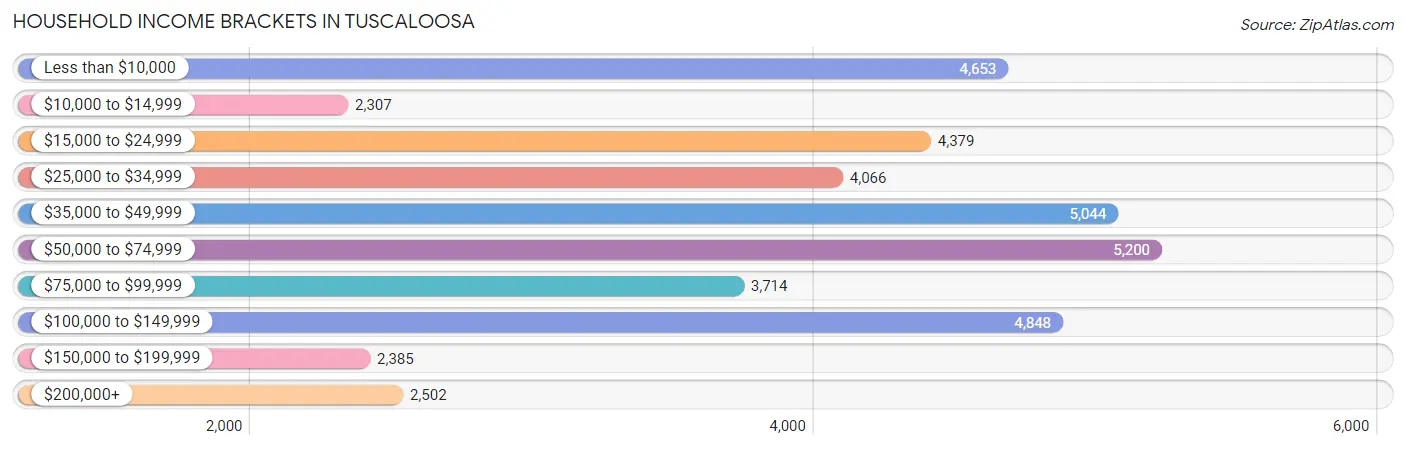
| Income Bracket | # Households | % Households |
| Less than $10,000 | 4,653 | 11.9% |
| $10,000 to $14,999 | 2,307 | 5.9% |
| $15,000 to $24,999 | 4,379 | 11.2% |
| $25,000 to $34,999 | 4,066 | 10.4% |
| $35,000 to $49,999 | 5,044 | 12.9% |
| $50,000 to $74,999 | 5,200 | 13.3% |
| $75,000 to $99,999 | 3,714 | 9.5% |
| $100,000 to $149,999 | 4,848 | 12.4% |
| $150,000 to $199,999 | 2,385 | 6.1% |
| $200,000+ | 2,502 | 6.4% |
Household Income by Householder Age in Tuscaloosa
The median household income in Tuscaloosa is $47,257, with the highest median household income of $67,562 found in the 45 to 64 years age bracket for the primary householder. A total of 11,359 households (29.0%) fall into this category. Meanwhile, the 15 to 24 years age bracket for the primary householder has the lowest median household income of $15,352, with 5,387 households (13.8%) in this group.
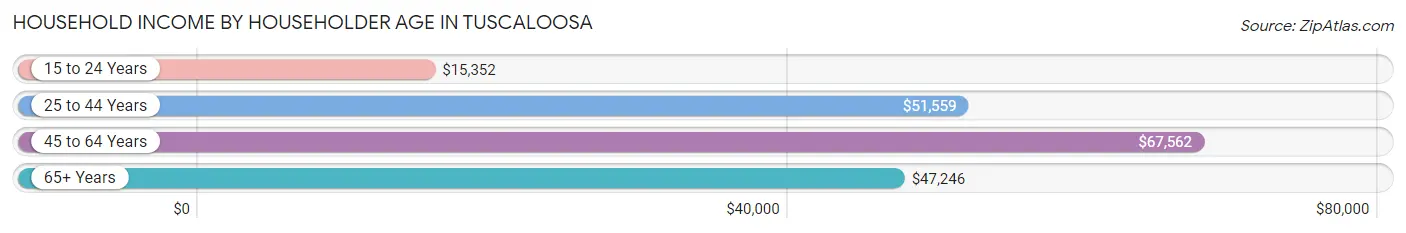
| Income Bracket | # Households | Median Income |
| 15 to 24 Years | 5,387 (13.8%) | $15,352 |
| 25 to 44 Years | 13,095 (33.5%) | $51,559 |
| 45 to 64 Years | 11,359 (29.0%) | $67,562 |
| 65+ Years | 9,256 (23.7%) | $47,246 |
| Total | 39,097 (100.0%) | $47,257 |
Poverty in Tuscaloosa
Income Below Poverty by Sex and Age in Tuscaloosa
With 21.2% poverty level for males and 24.9% for females among the residents of Tuscaloosa, 18 to 24 year old males and 18 to 24 year old females are the most vulnerable to poverty, with 3,604 males (41.9%) and 5,103 females (56.3%) in their respective age groups living below the poverty level.
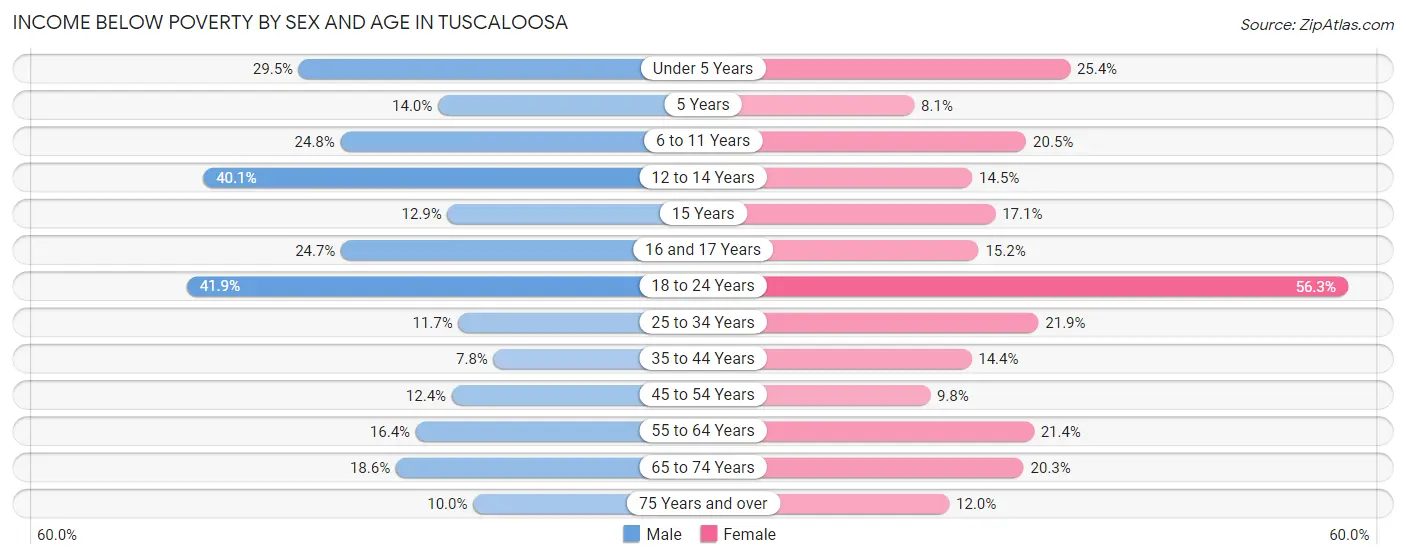
| Age Bracket | Male | Female |
| Under 5 Years | 879 (29.4%) | 615 (25.4%) |
| 5 Years | 54 (14.0%) | 51 (8.1%) |
| 6 to 11 Years | 789 (24.8%) | 576 (20.5%) |
| 12 to 14 Years | 470 (40.1%) | 235 (14.5%) |
| 15 Years | 58 (12.9%) | 67 (17.1%) |
| 16 and 17 Years | 235 (24.7%) | 137 (15.2%) |
| 18 to 24 Years | 3,604 (41.9%) | 5,103 (56.3%) |
| 25 to 34 Years | 834 (11.7%) | 1,488 (21.9%) |
| 35 to 44 Years | 420 (7.8%) | 808 (14.4%) |
| 45 to 54 Years | 543 (12.4%) | 463 (9.8%) |
| 55 to 64 Years | 805 (16.4%) | 1,143 (21.4%) |
| 65 to 74 Years | 683 (18.6%) | 986 (20.3%) |
| 75 Years and over | 194 (10.0%) | 390 (11.9%) |
| Total | 9,568 (21.2%) | 12,062 (24.9%) |
Income Above Poverty by Sex and Age in Tuscaloosa
According to the poverty statistics in Tuscaloosa, males aged 35 to 44 years and females aged 5 years are the age groups that are most secure financially, with 92.2% of males and 91.9% of females in these age groups living above the poverty line.
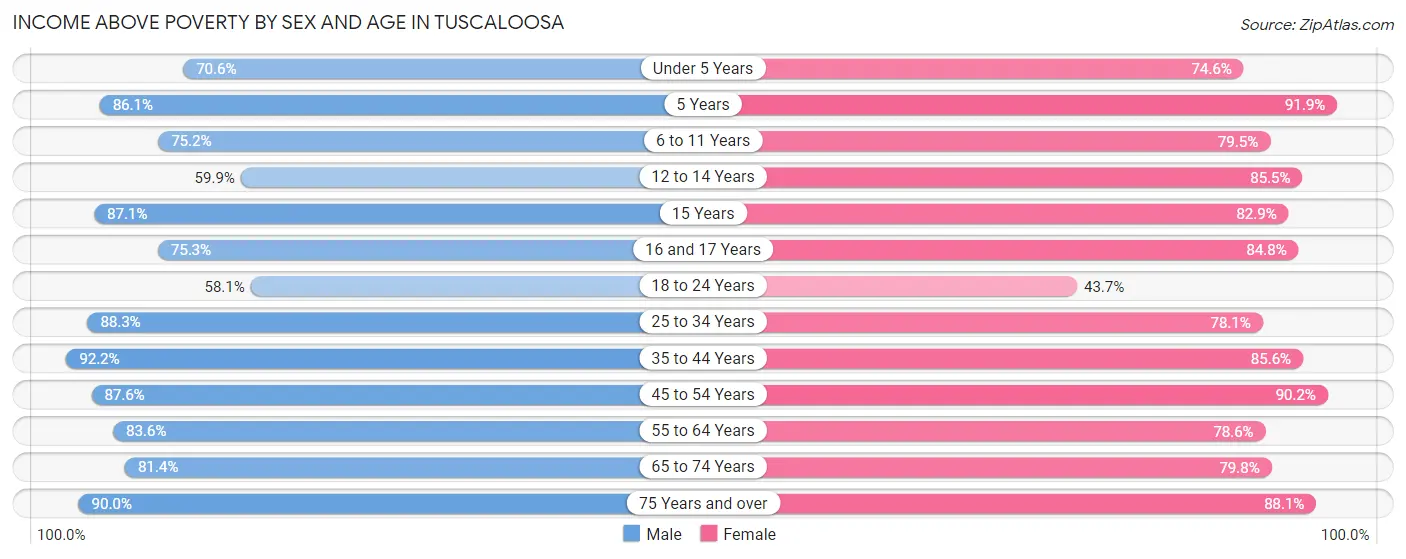
| Age Bracket | Male | Female |
| Under 5 Years | 2,106 (70.6%) | 1,805 (74.6%) |
| 5 Years | 333 (86.1%) | 582 (91.9%) |
| 6 to 11 Years | 2,391 (75.2%) | 2,229 (79.5%) |
| 12 to 14 Years | 702 (59.9%) | 1,384 (85.5%) |
| 15 Years | 392 (87.1%) | 325 (82.9%) |
| 16 and 17 Years | 715 (75.3%) | 763 (84.8%) |
| 18 to 24 Years | 4,990 (58.1%) | 3,955 (43.7%) |
| 25 to 34 Years | 6,314 (88.3%) | 5,311 (78.1%) |
| 35 to 44 Years | 4,989 (92.2%) | 4,796 (85.6%) |
| 45 to 54 Years | 3,832 (87.6%) | 4,253 (90.2%) |
| 55 to 64 Years | 4,097 (83.6%) | 4,206 (78.6%) |
| 65 to 74 Years | 2,982 (81.4%) | 3,884 (79.7%) |
| 75 Years and over | 1,741 (90.0%) | 2,873 (88.0%) |
| Total | 35,584 (78.8%) | 36,366 (75.1%) |
Income Below Poverty Among Married-Couple Families in Tuscaloosa
The poverty statistics for married-couple families in Tuscaloosa show that 7.0% or 942 of the total 13,376 families live below the poverty line. Families with 5 or more children have the highest poverty rate of 32.8%, comprising of 42 families. On the other hand, families with 3 or 4 children have the lowest poverty rate of 2.5%, which includes 31 families.
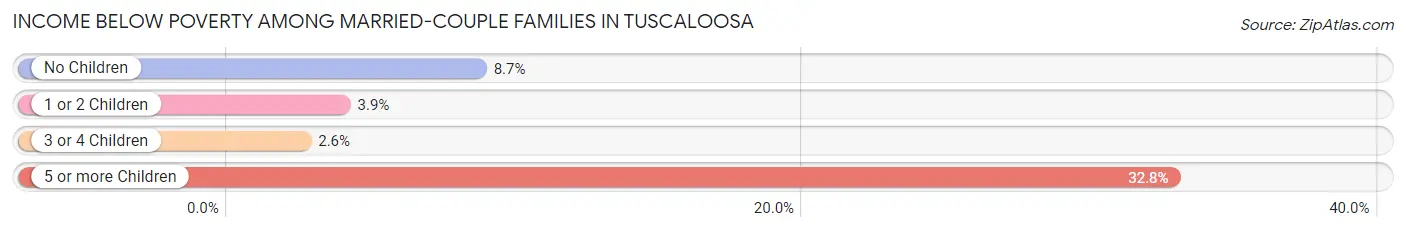
| Children | Above Poverty | Below Poverty |
| No Children | 7,660 (91.3%) | 726 (8.7%) |
| 1 or 2 Children | 3,501 (96.1%) | 143 (3.9%) |
| 3 or 4 Children | 1,187 (97.5%) | 31 (2.5%) |
| 5 or more Children | 86 (67.2%) | 42 (32.8%) |
| Total | 12,434 (93.0%) | 942 (7.0%) |
Income Below Poverty Among Single-Parent Households in Tuscaloosa
According to the poverty data in Tuscaloosa, 12.2% or 163 single-father households and 33.7% or 1,967 single-mother households are living below the poverty line. Among single-father households, those with 3 or 4 children have the highest poverty rate, with 14 households (31.1%) experiencing poverty. Likewise, among single-mother households, those with 5 or more children have the highest poverty rate, with 63 households (87.5%) falling below the poverty line.
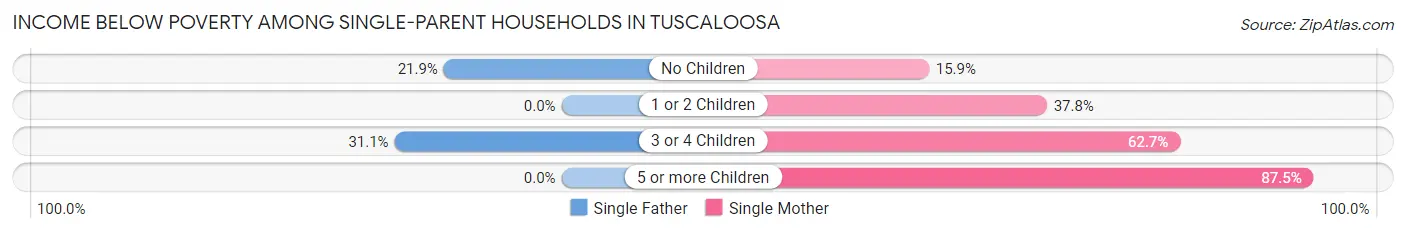
| Children | Single Father | Single Mother |
| No Children | 149 (21.9%) | 329 (15.9%) |
| 1 or 2 Children | 0 (0.0%) | 1,122 (37.8%) |
| 3 or 4 Children | 14 (31.1%) | 453 (62.7%) |
| 5 or more Children | 0 (0.0%) | 63 (87.5%) |
| Total | 163 (12.2%) | 1,967 (33.7%) |
Income Below Poverty Among Married-Couple vs Single-Parent Households in Tuscaloosa
The poverty data for Tuscaloosa shows that 942 of the married-couple family households (7.0%) and 2,130 of the single-parent households (29.7%) are living below the poverty level. Within the married-couple family households, those with 5 or more children have the highest poverty rate, with 42 households (32.8%) falling below the poverty line. Among the single-parent households, those with 5 or more children have the highest poverty rate, with 63 household (87.5%) living below poverty.
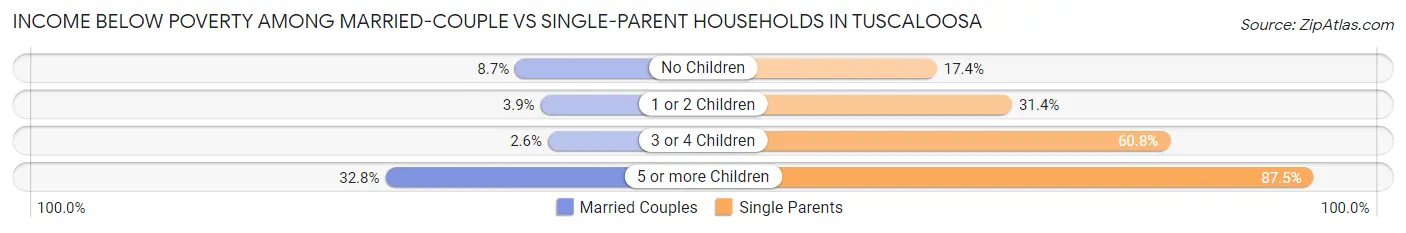
| Children | Married-Couple Families | Single-Parent Households |
| No Children | 726 (8.7%) | 478 (17.3%) |
| 1 or 2 Children | 143 (3.9%) | 1,122 (31.4%) |
| 3 or 4 Children | 31 (2.5%) | 467 (60.8%) |
| 5 or more Children | 42 (32.8%) | 63 (87.5%) |
| Total | 942 (7.0%) | 2,130 (29.7%) |
Race in Tuscaloosa
The most populous races in Tuscaloosa are White / Caucasian (53,530 | 50.6%), Black / African American (45,340 | 42.9%), and Hispanic or Latino (4,418 | 4.2%).
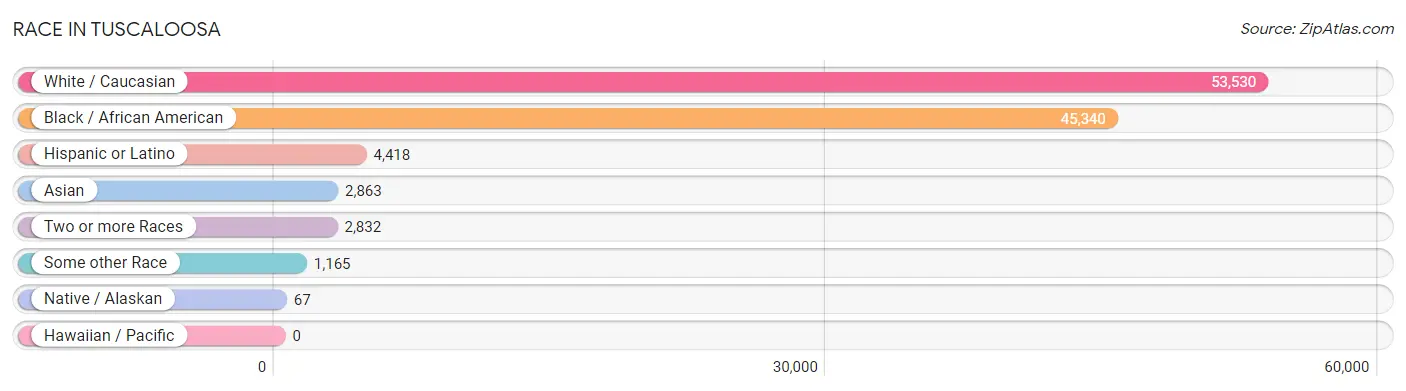
| Race | # Population | % Population |
| Asian | 2,863 | 2.7% |
| Black / African American | 45,340 | 42.9% |
| Hawaiian / Pacific | 0 | 0.0% |
| Hispanic or Latino | 4,418 | 4.2% |
| Native / Alaskan | 67 | 0.1% |
| White / Caucasian | 53,530 | 50.6% |
| Two or more Races | 2,832 | 2.7% |
| Some other Race | 1,165 | 1.1% |
| Total | 105,797 | 100.0% |
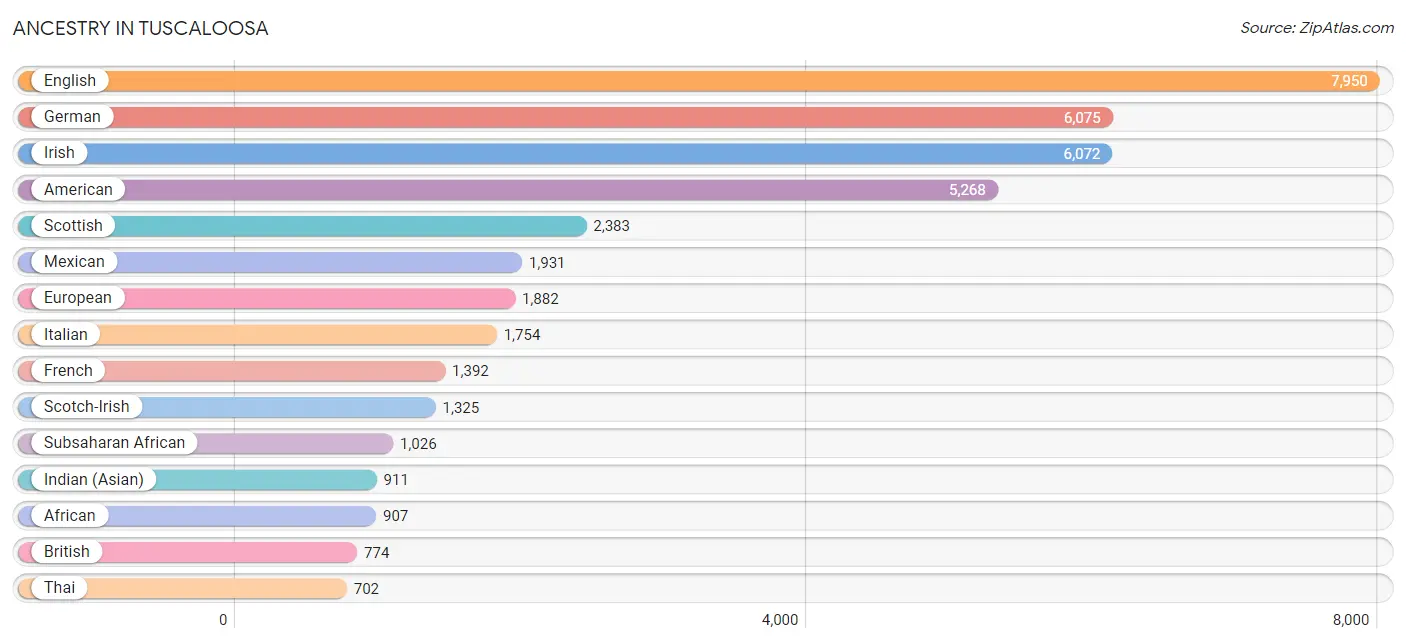
Ancestry in Tuscaloosa
The most populous ancestries reported in Tuscaloosa are English (7,950 | 7.5%), German (6,075 | 5.7%), Irish (6,072 | 5.7%), American (5,268 | 5.0%), and Scottish (2,383 | 2.2%), together accounting for 26.2% of all Tuscaloosa residents.
| Ancestry | # Population | % Population |
| African | 907 | 0.9% |
| American | 5,268 | 5.0% |
| Arab | 325 | 0.3% |
| Argentinean | 222 | 0.2% |
| Australian | 12 | 0.0% |
| Austrian | 27 | 0.0% |
| Bahamian | 8 | 0.0% |
| Barbadian | 34 | 0.0% |
| Belgian | 8 | 0.0% |
| Bermudan | 5 | 0.0% |
| Bhutanese | 352 | 0.3% |
| Blackfeet | 1 | 0.0% |
| Bolivian | 4 | 0.0% |
| British | 774 | 0.7% |
| British West Indian | 20 | 0.0% |
| Burmese | 325 | 0.3% |
| Canadian | 54 | 0.1% |
| Central American | 579 | 0.5% |
| Central American Indian | 9 | 0.0% |
| Cherokee | 33 | 0.0% |
| Chickasaw | 57 | 0.1% |
| Colombian | 38 | 0.0% |
| Costa Rican | 18 | 0.0% |
| Creek | 29 | 0.0% |
| Cuban | 367 | 0.4% |
| Czech | 111 | 0.1% |
| Danish | 94 | 0.1% |
| Dominican | 252 | 0.2% |
| Dutch | 448 | 0.4% |
| Eastern European | 139 | 0.1% |
| Egyptian | 65 | 0.1% |
| English | 7,950 | 7.5% |
| European | 1,882 | 1.8% |
| Filipino | 47 | 0.0% |
| Finnish | 122 | 0.1% |
| French | 1,392 | 1.3% |
| French Canadian | 31 | 0.0% |
| German | 6,075 | 5.7% |
| Ghanaian | 25 | 0.0% |
| Greek | 175 | 0.2% |
| Guatemalan | 361 | 0.3% |
| Guyanese | 13 | 0.0% |
| Haitian | 32 | 0.0% |
| Honduran | 97 | 0.1% |
| Hungarian | 162 | 0.2% |
| Indian (Asian) | 911 | 0.9% |
| Indonesian | 9 | 0.0% |
| Iranian | 168 | 0.2% |
| Irish | 6,072 | 5.7% |
| Iroquois | 32 | 0.0% |
| Italian | 1,754 | 1.7% |
| Jamaican | 77 | 0.1% |
| Korean | 224 | 0.2% |
| Lebanese | 95 | 0.1% |
| Lithuanian | 131 | 0.1% |
| Macedonian | 14 | 0.0% |
| Menominee | 9 | 0.0% |
| Mexican | 1,931 | 1.8% |
| Mexican American Indian | 103 | 0.1% |
| Native Hawaiian | 64 | 0.1% |
| Nigerian | 84 | 0.1% |
| Northern European | 95 | 0.1% |
| Norwegian | 267 | 0.3% |
| Pakistani | 11 | 0.0% |
| Palestinian | 40 | 0.0% |
| Panamanian | 14 | 0.0% |
| Pennsylvania German | 25 | 0.0% |
| Peruvian | 126 | 0.1% |
| Polish | 596 | 0.6% |
| Portuguese | 147 | 0.1% |
| Puerto Rican | 640 | 0.6% |
| Romanian | 73 | 0.1% |
| Russian | 243 | 0.2% |
| Salvadoran | 89 | 0.1% |
| Scandinavian | 105 | 0.1% |
| Scotch-Irish | 1,325 | 1.3% |
| Scottish | 2,383 | 2.2% |
| Slovak | 27 | 0.0% |
| Slovene | 15 | 0.0% |
| South African | 10 | 0.0% |
| South American | 423 | 0.4% |
| Spaniard | 60 | 0.1% |
| Spanish | 86 | 0.1% |
| Spanish American | 30 | 0.0% |
| Spanish American Indian | 19 | 0.0% |
| Sri Lankan | 641 | 0.6% |
| Subsaharan African | 1,026 | 1.0% |
| Swedish | 226 | 0.2% |
| Swiss | 225 | 0.2% |
| Thai | 702 | 0.7% |
| Trinidadian and Tobagonian | 17 | 0.0% |
| Turkish | 7 | 0.0% |
| U.S. Virgin Islander | 13 | 0.0% |
| Ukrainian | 39 | 0.0% |
| Venezuelan | 33 | 0.0% |
| Vietnamese | 80 | 0.1% |
| Welsh | 299 | 0.3% |
| West Indian | 64 | 0.1% |
| Yugoslavian | 40 | 0.0% | View All 99 Rows |
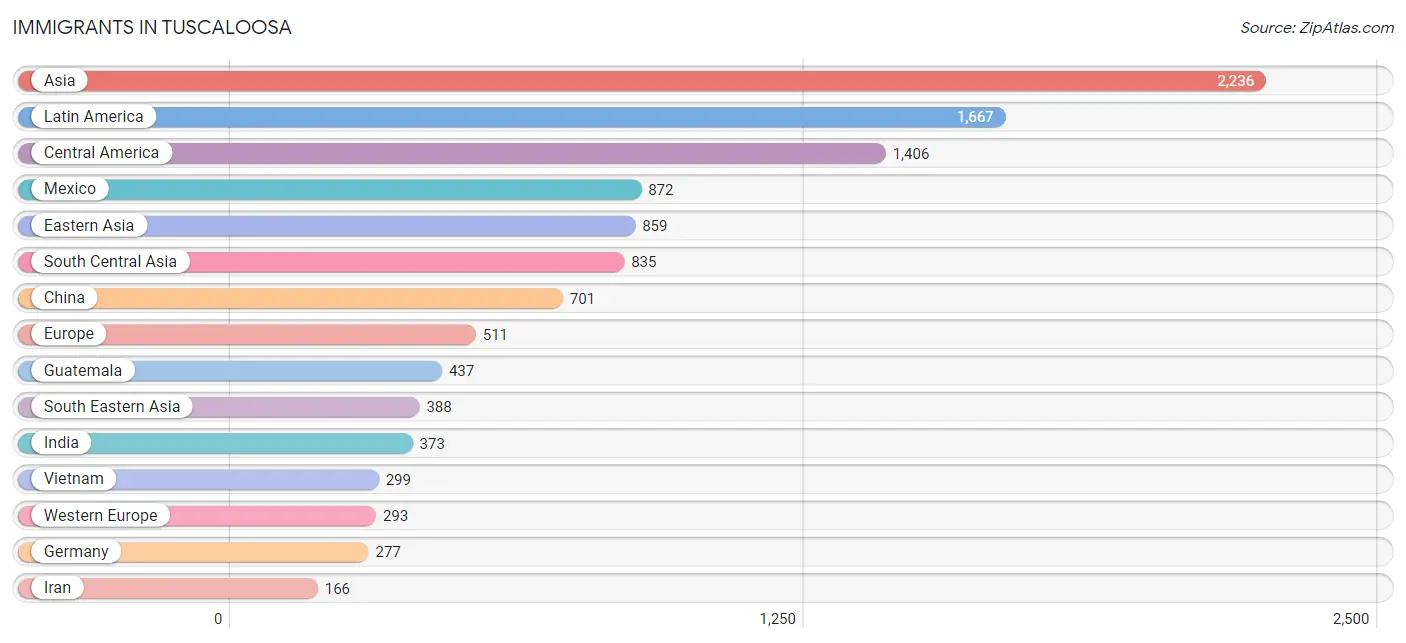
Immigrants in Tuscaloosa
The most numerous immigrant groups reported in Tuscaloosa came from Asia (2,236 | 2.1%), Latin America (1,667 | 1.6%), Central America (1,406 | 1.3%), Mexico (872 | 0.8%), and Eastern Asia (859 | 0.8%), together accounting for 6.7% of all Tuscaloosa residents.
| Immigration Origin | # Population | % Population |
| Afghanistan | 13 | 0.0% |
| Africa | 113 | 0.1% |
| Argentina | 19 | 0.0% |
| Asia | 2,236 | 2.1% |
| Australia | 14 | 0.0% |
| Bangladesh | 119 | 0.1% |
| Barbados | 34 | 0.0% |
| Bolivia | 4 | 0.0% |
| Brazil | 25 | 0.0% |
| Canada | 102 | 0.1% |
| Caribbean | 160 | 0.2% |
| Central America | 1,406 | 1.3% |
| China | 701 | 0.7% |
| Colombia | 16 | 0.0% |
| Costa Rica | 5 | 0.0% |
| Cuba | 54 | 0.1% |
| Eastern Africa | 16 | 0.0% |
| Eastern Asia | 859 | 0.8% |
| Eastern Europe | 76 | 0.1% |
| El Salvador | 56 | 0.1% |
| England | 38 | 0.0% |
| Europe | 511 | 0.5% |
| Germany | 277 | 0.3% |
| Ghana | 33 | 0.0% |
| Guatemala | 437 | 0.4% |
| Haiti | 22 | 0.0% |
| Honduras | 36 | 0.0% |
| India | 373 | 0.4% |
| Iran | 166 | 0.2% |
| Ireland | 13 | 0.0% |
| Jamaica | 30 | 0.0% |
| Japan | 63 | 0.1% |
| Jordan | 20 | 0.0% |
| Korea | 95 | 0.1% |
| Latin America | 1,667 | 1.6% |
| Malaysia | 7 | 0.0% |
| Mexico | 872 | 0.8% |
| Middle Africa | 13 | 0.0% |
| Nepal | 66 | 0.1% |
| Netherlands | 16 | 0.0% |
| Nigeria | 41 | 0.0% |
| Northern Africa | 10 | 0.0% |
| Northern Europe | 90 | 0.1% |
| Oceania | 22 | 0.0% |
| Pakistan | 73 | 0.1% |
| Peru | 30 | 0.0% |
| Philippines | 62 | 0.1% |
| Romania | 10 | 0.0% |
| Russia | 66 | 0.1% |
| Saudi Arabia | 62 | 0.1% |
| South America | 101 | 0.1% |
| South Central Asia | 835 | 0.8% |
| South Eastern Asia | 388 | 0.4% |
| Southern Europe | 52 | 0.1% |
| Spain | 52 | 0.1% |
| Sri Lanka | 10 | 0.0% |
| Taiwan | 30 | 0.0% |
| Thailand | 11 | 0.0% |
| Turkey | 7 | 0.0% |
| Venezuela | 7 | 0.0% |
| Vietnam | 299 | 0.3% |
| Western Africa | 74 | 0.1% |
| Western Asia | 114 | 0.1% |
| Western Europe | 293 | 0.3% |
| Yemen | 11 | 0.0% |
| Zimbabwe | 8 | 0.0% | View All 66 Rows |
Sex and Age in Tuscaloosa
Sex and Age in Tuscaloosa
The most populous age groups in Tuscaloosa are 20 to 24 Years (8,418 | 16.7%) for men and 15 to 19 Years (8,788 | 15.9%) for women.
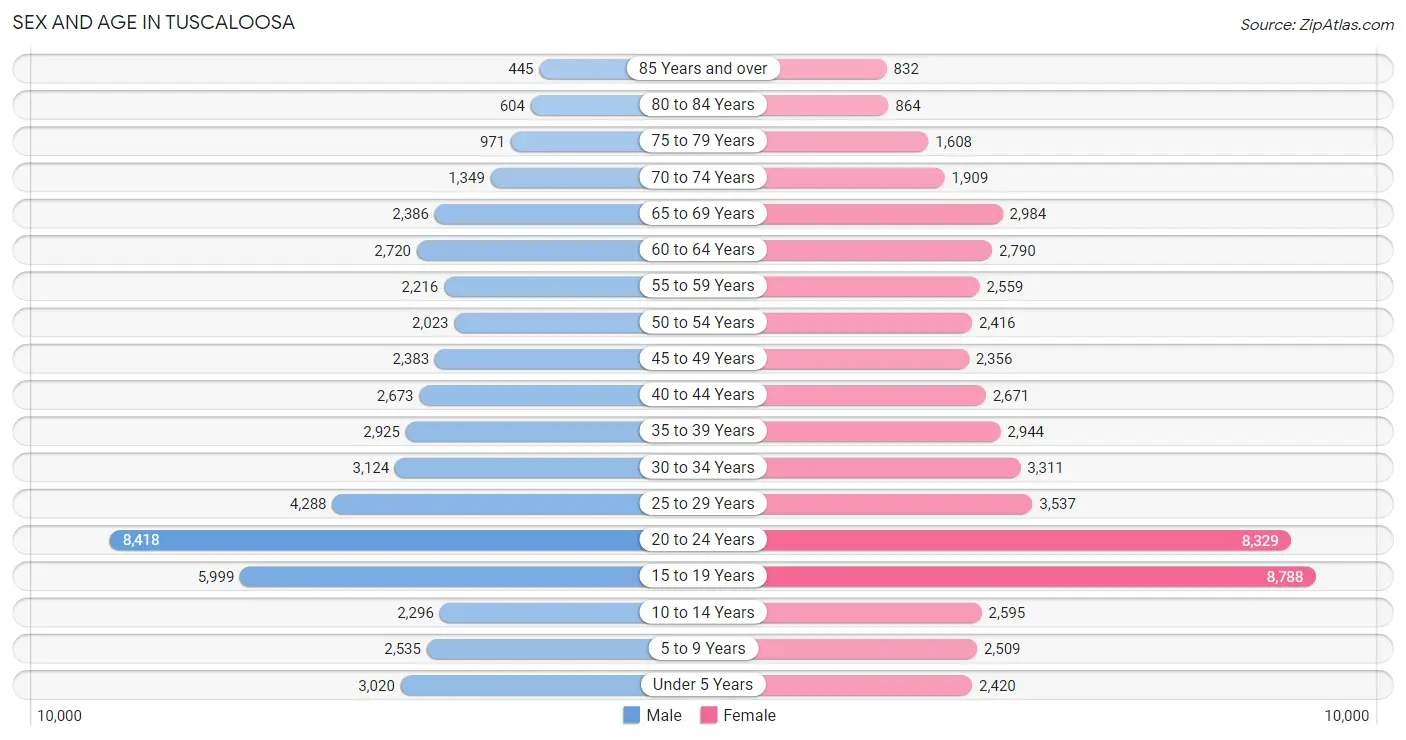
| Age Bracket | Male | Female |
| Under 5 Years | 3,020 (6.0%) | 2,420 (4.4%) |
| 5 to 9 Years | 2,535 (5.0%) | 2,509 (4.5%) |
| 10 to 14 Years | 2,296 (4.6%) | 2,595 (4.7%) |
| 15 to 19 Years | 5,999 (11.9%) | 8,788 (15.9%) |
| 20 to 24 Years | 8,418 (16.7%) | 8,329 (15.0%) |
| 25 to 29 Years | 4,288 (8.5%) | 3,537 (6.4%) |
| 30 to 34 Years | 3,124 (6.2%) | 3,311 (6.0%) |
| 35 to 39 Years | 2,925 (5.8%) | 2,944 (5.3%) |
| 40 to 44 Years | 2,673 (5.3%) | 2,671 (4.8%) |
| 45 to 49 Years | 2,383 (4.7%) | 2,356 (4.3%) |
| 50 to 54 Years | 2,023 (4.0%) | 2,416 (4.4%) |
| 55 to 59 Years | 2,216 (4.4%) | 2,559 (4.6%) |
| 60 to 64 Years | 2,720 (5.4%) | 2,790 (5.0%) |
| 65 to 69 Years | 2,386 (4.7%) | 2,984 (5.4%) |
| 70 to 74 Years | 1,349 (2.7%) | 1,909 (3.4%) |
| 75 to 79 Years | 971 (1.9%) | 1,608 (2.9%) |
| 80 to 84 Years | 604 (1.2%) | 864 (1.6%) |
| 85 Years and over | 445 (0.9%) | 832 (1.5%) |
| Total | 50,375 (100.0%) | 55,422 (100.0%) |
Families and Households in Tuscaloosa
Median Family Size in Tuscaloosa
The median family size in Tuscaloosa is 3.17 persons per family, with single female/mother families (5,838 | 28.4%) accounting for the largest median family size of 3.37 persons per family. On the other hand, single male/father families (1,332 | 6.5%) represent the smallest median family size with 2.92 persons per family.
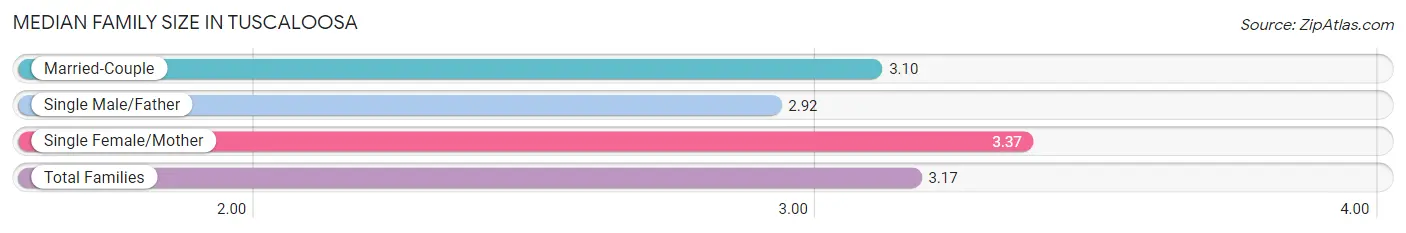
| Family Type | # Families | Family Size |
| Married-Couple | 13,376 (65.1%) | 3.10 |
| Single Male/Father | 1,332 (6.5%) | 2.92 |
| Single Female/Mother | 5,838 (28.4%) | 3.37 |
| Total Families | 20,546 (100.0%) | 3.17 |
Median Household Size in Tuscaloosa
The median household size in Tuscaloosa is 2.39 persons per household, with single female/mother households (5,838 | 14.9%) accounting for the largest median household size of 3.54 persons per household. non-family households (18,551 | 47.4%) represent the smallest median household size with 1.44 persons per household.
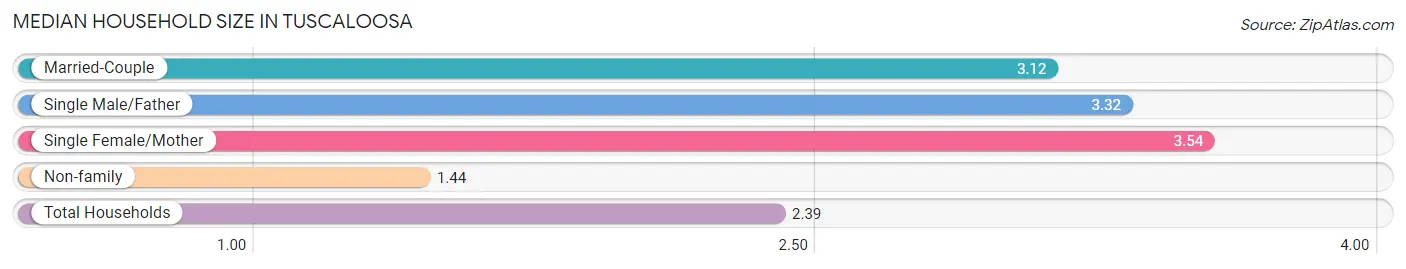
| Household Type | # Households | Household Size |
| Married-Couple | 13,376 (34.2%) | 3.12 |
| Single Male/Father | 1,332 (3.4%) | 3.32 |
| Single Female/Mother | 5,838 (14.9%) | 3.54 |
| Non-family | 18,551 (47.4%) | 1.44 |
| Total Households | 39,097 (100.0%) | 2.39 |
Household Size by Marriage Status in Tuscaloosa
Out of a total of 39,097 households in Tuscaloosa, 20,546 (52.5%) are family households, while 18,551 (47.4%) are nonfamily households. The most numerous type of family households are 2-person households, comprising 10,232, and the most common type of nonfamily households are 1-person households, comprising 14,529.
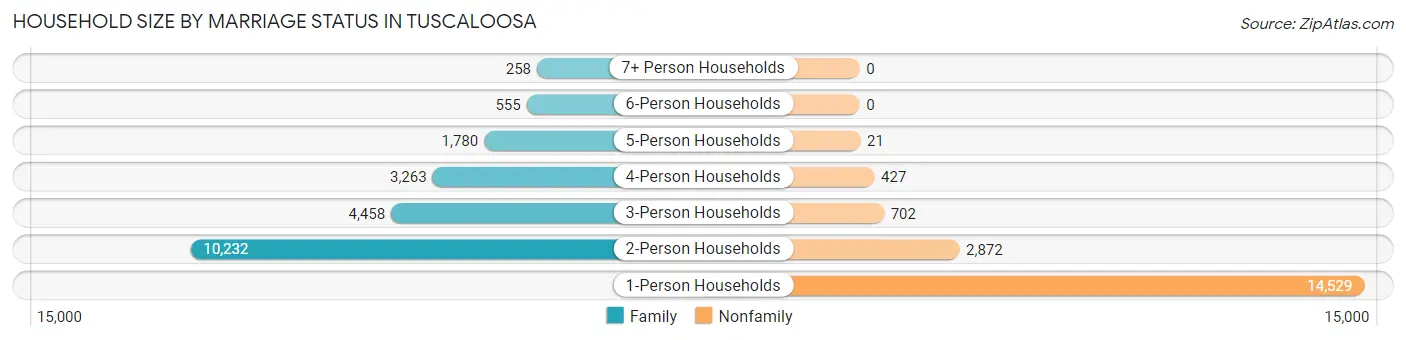
| Household Size | Family Households | Nonfamily Households |
| 1-Person Households | - | 14,529 (37.2%) |
| 2-Person Households | 10,232 (26.2%) | 2,872 (7.3%) |
| 3-Person Households | 4,458 (11.4%) | 702 (1.8%) |
| 4-Person Households | 3,263 (8.4%) | 427 (1.1%) |
| 5-Person Households | 1,780 (4.5%) | 21 (0.1%) |
| 6-Person Households | 555 (1.4%) | 0 (0.0%) |
| 7+ Person Households | 258 (0.7%) | 0 (0.0%) |
| Total | 20,546 (52.5%) | 18,551 (47.4%) |
Female Fertility in Tuscaloosa
Fertility by Age in Tuscaloosa
Average fertility rate in Tuscaloosa is 43.0 births per 1,000 women. Women in the age bracket of 20 to 34 years have the highest fertility rate with 80.0 births per 1,000 women. Women in the age bracket of 20 to 34 years acount for 86.6% of all women with births.
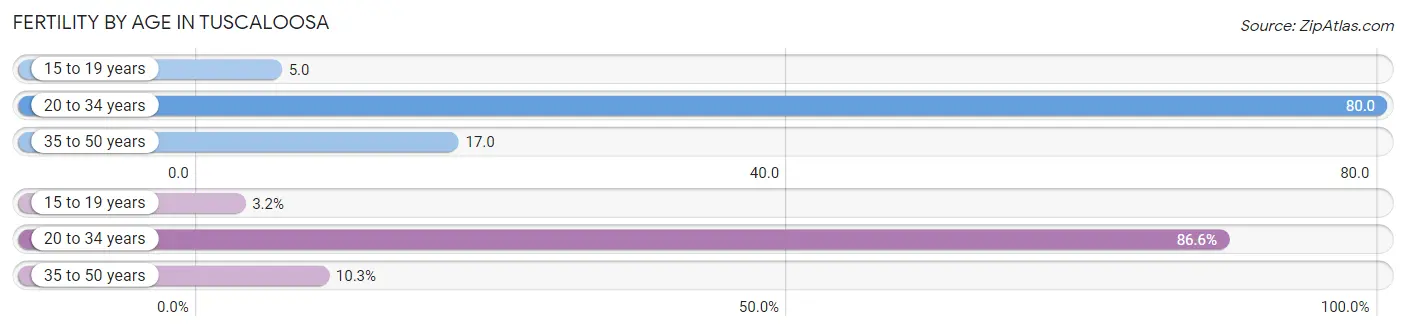
| Age Bracket | Women with Births | Births / 1,000 Women |
| 15 to 19 years | 44 (3.2%) | 5.0 |
| 20 to 34 years | 1,208 (86.6%) | 80.0 |
| 35 to 50 years | 143 (10.2%) | 17.0 |
| Total | 1,395 (100.0%) | 43.0 |
Fertility by Age by Marriage Status in Tuscaloosa
43.6% of women with births (1,395) in Tuscaloosa are married. The highest percentage of unmarried women with births falls into 15 to 19 years age bracket with 100.0% of them unmarried at the time of birth, while the lowest percentage of unmarried women with births belong to 35 to 50 years age bracket with 35.0% of them unmarried.
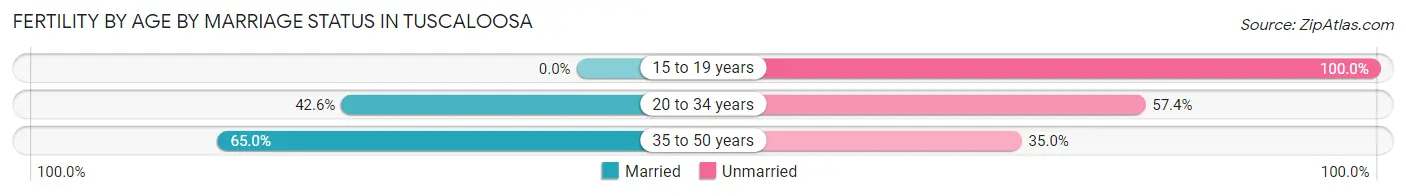
| Age Bracket | Married | Unmarried |
| 15 to 19 years | 0 (0.0%) | 44 (100.0%) |
| 20 to 34 years | 515 (42.6%) | 693 (57.4%) |
| 35 to 50 years | 93 (65.0%) | 50 (35.0%) |
| Total | 608 (43.6%) | 787 (56.4%) |
Fertility by Education in Tuscaloosa
Average fertility rate in Tuscaloosa is 43.0 births per 1,000 women. Women with the education attainment of bachelor's degree have the highest fertility rate of 79.0 births per 1,000 women, while women with the education attainment of college or associate's degree have the lowest fertility at 29.0 births per 1,000 women. Women with the education attainment of high school diploma represent 29.0% of all women with births.
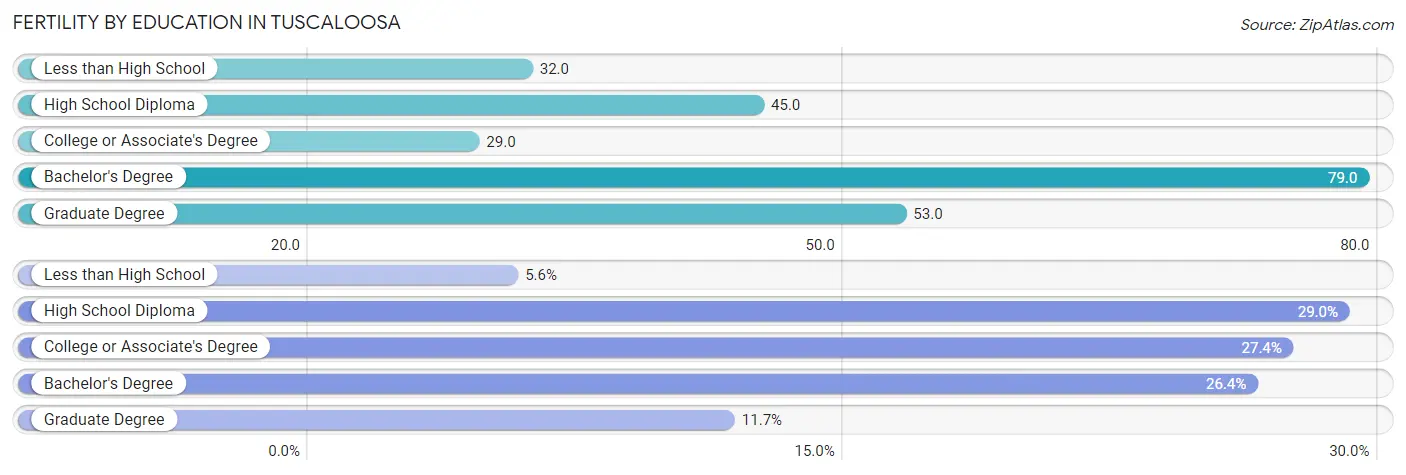
| Educational Attainment | Women with Births | Births / 1,000 Women |
| Less than High School | 78 (5.6%) | 32.0 |
| High School Diploma | 404 (29.0%) | 45.0 |
| College or Associate's Degree | 382 (27.4%) | 29.0 |
| Bachelor's Degree | 368 (26.4%) | 79.0 |
| Graduate Degree | 163 (11.7%) | 53.0 |
| Total | 1,395 (100.0%) | 43.0 |
Fertility by Education by Marriage Status in Tuscaloosa
56.4% of women with births in Tuscaloosa are unmarried. Women with the educational attainment of graduate degree are most likely to be married with 100.0% of them married at childbirth, while women with the educational attainment of less than high school are least likely to be married with 100.0% of them unmarried at childbirth.
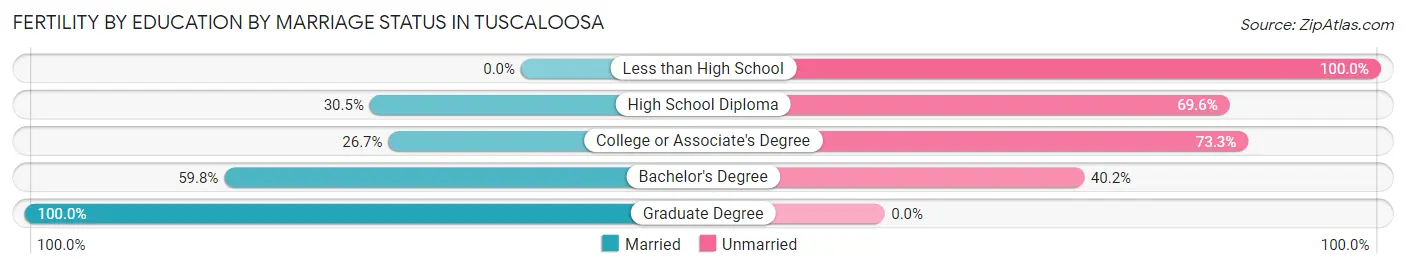
| Educational Attainment | Married | Unmarried |
| Less than High School | 0 (0.0%) | 78 (100.0%) |
| High School Diploma | 123 (30.4%) | 281 (69.6%) |
| College or Associate's Degree | 102 (26.7%) | 280 (73.3%) |
| Bachelor's Degree | 220 (59.8%) | 148 (40.2%) |
| Graduate Degree | 163 (100.0%) | 0 (0.0%) |
| Total | 608 (43.6%) | 787 (56.4%) |
Employment Characteristics in Tuscaloosa
Employment by Class of Employer in Tuscaloosa
Among the 47,444 employed individuals in Tuscaloosa, private company employees (31,454 | 66.3%), state government employees (6,069 | 12.8%), and not-for-profit organizations (3,207 | 6.8%) make up the most common classes of employment.
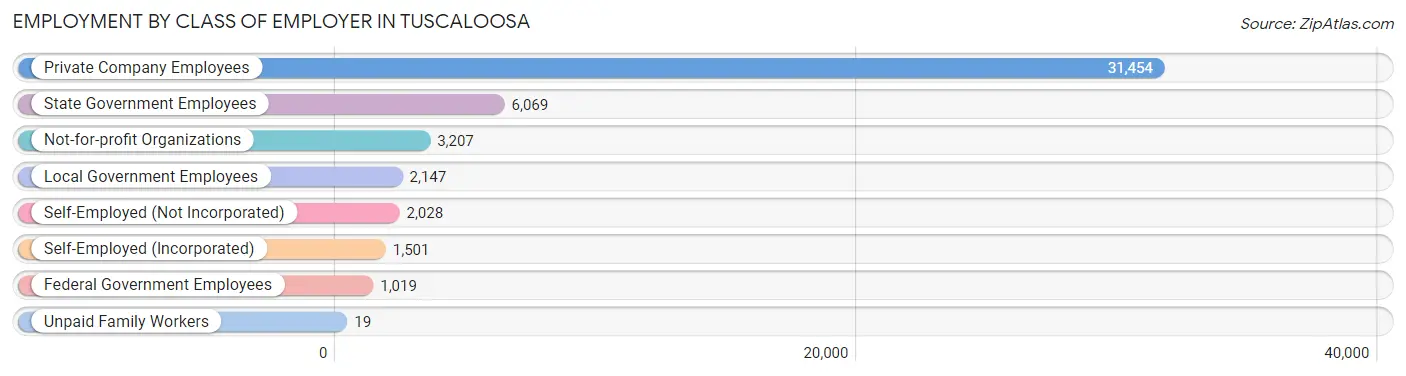
| Employer Class | # Employees | % Employees |
| Private Company Employees | 31,454 | 66.3% |
| Self-Employed (Incorporated) | 1,501 | 3.2% |
| Self-Employed (Not Incorporated) | 2,028 | 4.3% |
| Not-for-profit Organizations | 3,207 | 6.8% |
| Local Government Employees | 2,147 | 4.5% |
| State Government Employees | 6,069 | 12.8% |
| Federal Government Employees | 1,019 | 2.1% |
| Unpaid Family Workers | 19 | 0.0% |
| Total | 47,444 | 100.0% |
Employment Status by Age in Tuscaloosa
According to the labor force statistics for Tuscaloosa, out of the total population over 16 years of age (89,575), 58.2% or 52,133 individuals are in the labor force, with 6.8% or 3,545 of them unemployed. The age group with the highest labor force participation rate is 25 to 29 years, with 84.5% or 6,612 individuals in the labor force. Within the labor force, the 16 to 19 years age range has the highest percentage of unemployed individuals, with 26.0% or 1,069 of them being unemployed.
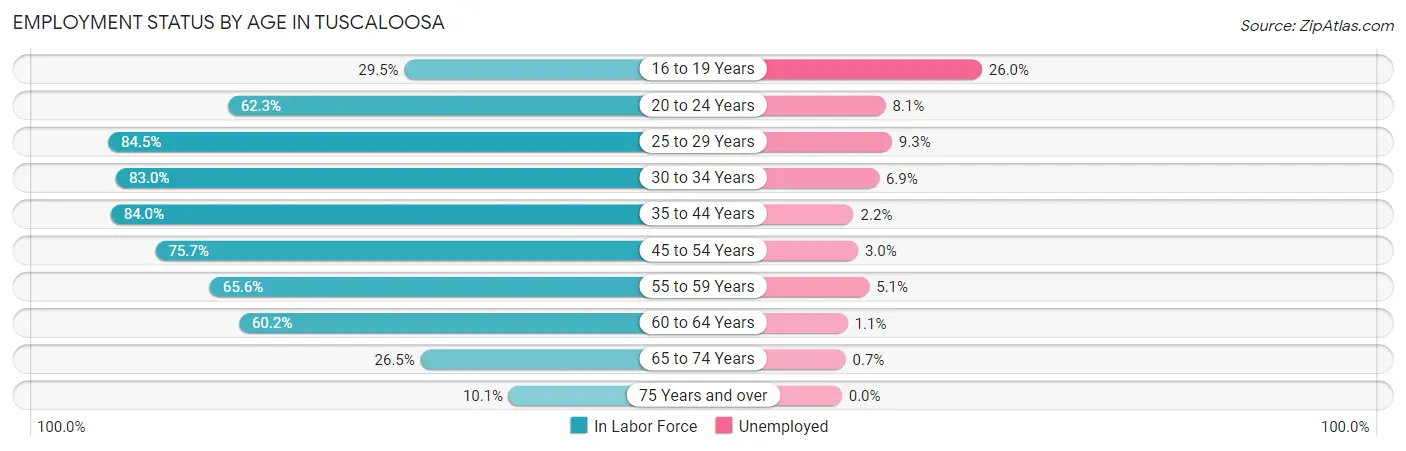
| Age Bracket | In Labor Force | Unemployed |
| 16 to 19 Years | 4,112 (29.5%) | 1,069 (26.0%) |
| 20 to 24 Years | 10,433 (62.3%) | 845 (8.1%) |
| 25 to 29 Years | 6,612 (84.5%) | 615 (9.3%) |
| 30 to 34 Years | 5,341 (83.0%) | 369 (6.9%) |
| 35 to 44 Years | 9,419 (84.0%) | 207 (2.2%) |
| 45 to 54 Years | 6,948 (75.7%) | 208 (3.0%) |
| 55 to 59 Years | 3,132 (65.6%) | 160 (5.1%) |
| 60 to 64 Years | 3,317 (60.2%) | 36 (1.1%) |
| 65 to 74 Years | 2,286 (26.5%) | 16 (0.7%) |
| 75 Years and over | 538 (10.1%) | 0 (0.0%) |
| Total | 52,133 (58.2%) | 3,545 (6.8%) |
Employment Status by Educational Attainment in Tuscaloosa
According to labor force statistics for Tuscaloosa, 77.4% of individuals (34,780) out of the total population between 25 and 64 years of age (44,936) are in the labor force, with 4.6% or 1,600 of them being unemployed. The group with the highest labor force participation rate are those with the educational attainment of bachelor's degree or higher, with 85.9% or 14,617 individuals in the labor force. Within the labor force, individuals with less than high school education have the highest percentage of unemployment, with 21.4% or 383 of them being unemployed.
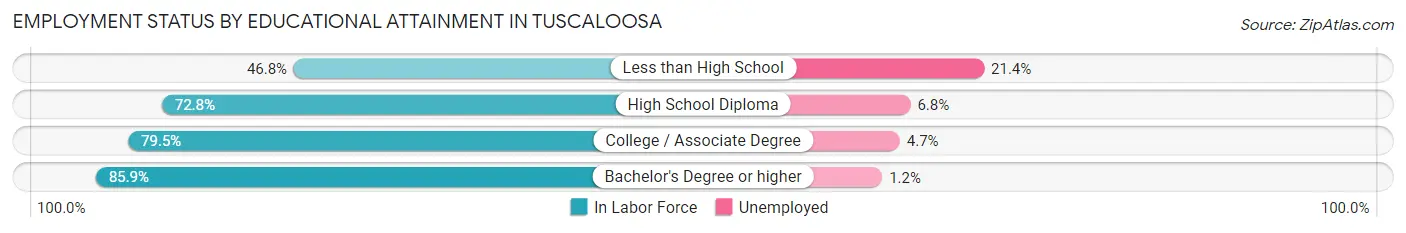
| Educational Attainment | In Labor Force | Unemployed |
| Less than High School | 1,788 (46.8%) | 817 (21.4%) |
| High School Diploma | 8,639 (72.8%) | 807 (6.8%) |
| College / Associate Degree | 9,725 (79.5%) | 575 (4.7%) |
| Bachelor's Degree or higher | 14,617 (85.9%) | 204 (1.2%) |
| Total | 34,780 (77.4%) | 2,067 (4.6%) |
Employment Occupations by Sex in Tuscaloosa
Management, Business, Science and Arts Occupations
The most common Management, Business, Science and Arts occupations in Tuscaloosa are Community & Social Service (6,852 | 14.1%), Education Instruction & Library (4,735 | 9.8%), Management (4,560 | 9.4%), Health Diagnosing & Treating (3,031 | 6.2%), and Computers, Engineering & Science (2,386 | 4.9%).
Management, Business, Science and Arts Occupations by Sex
Within the Management, Business, Science and Arts occupations in Tuscaloosa, the most male-oriented occupations are Architecture & Engineering (84.0%), Computers & Mathematics (80.9%), and Computers, Engineering & Science (76.4%), while the most female-oriented occupations are Education, Arts & Media (80.1%), Health Diagnosing & Treating (75.8%), and Health Technologists (71.6%).
| Occupation | Male | Female |
| Management | 2,445 (53.6%) | 2,115 (46.4%) |
| Business & Financial | 670 (36.3%) | 1,174 (63.7%) |
| Computers, Engineering & Science | 1,823 (76.4%) | 563 (23.6%) |
| Computers & Mathematics | 748 (80.9%) | 177 (19.1%) |
| Architecture & Engineering | 744 (84.0%) | 142 (16.0%) |
| Life, Physical & Social Science | 331 (57.6%) | 244 (42.4%) |
| Community & Social Service | 2,896 (42.3%) | 3,956 (57.7%) |
| Education, Arts & Media | 144 (19.9%) | 579 (80.1%) |
| Legal Services & Support | 232 (65.0%) | 125 (35.0%) |
| Education Instruction & Library | 2,010 (42.4%) | 2,725 (57.6%) |
| Arts, Media & Entertainment | 510 (49.2%) | 527 (50.8%) |
| Health Diagnosing & Treating | 732 (24.1%) | 2,299 (75.8%) |
| Health Technologists | 635 (28.4%) | 1,597 (71.6%) |
| Total (Category) | 8,566 (45.9%) | 10,107 (54.1%) |
| Total (Overall) | 23,695 (48.8%) | 24,820 (51.2%) |
Services Occupations
The most common Services occupations in Tuscaloosa are Food Preparation & Serving (3,584 | 7.4%), Cleaning & Maintenance (1,571 | 3.2%), Healthcare Support (1,387 | 2.9%), Personal Care & Service (1,044 | 2.1%), and Security & Protection (825 | 1.7%).
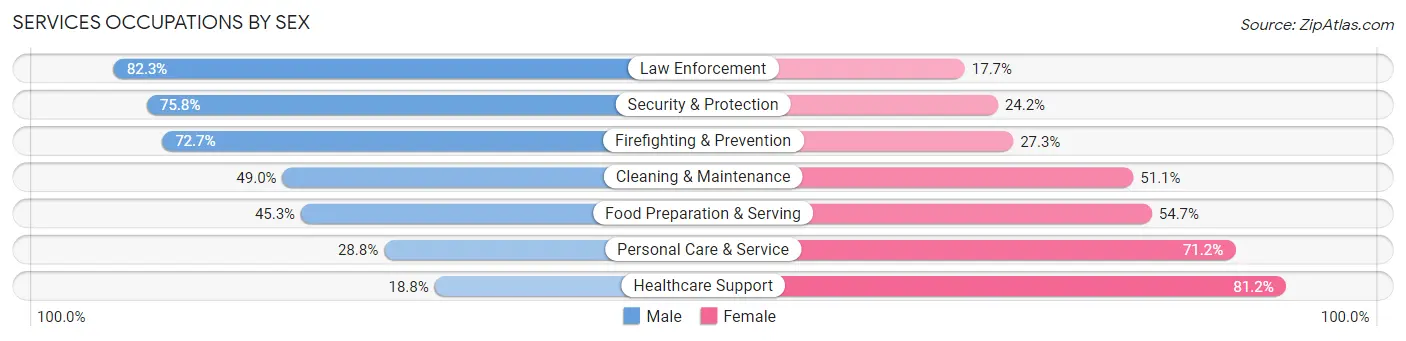
Services Occupations by Sex
Within the Services occupations in Tuscaloosa, the most male-oriented occupations are Law Enforcement (82.3%), Security & Protection (75.8%), and Firefighting & Prevention (72.7%), while the most female-oriented occupations are Healthcare Support (81.2%), Personal Care & Service (71.2%), and Food Preparation & Serving (54.7%).
| Occupation | Male | Female |
| Healthcare Support | 261 (18.8%) | 1,126 (81.2%) |
| Security & Protection | 625 (75.8%) | 200 (24.2%) |
| Firefighting & Prevention | 411 (72.7%) | 154 (27.3%) |
| Law Enforcement | 214 (82.3%) | 46 (17.7%) |
| Food Preparation & Serving | 1,623 (45.3%) | 1,961 (54.7%) |
| Cleaning & Maintenance | 769 (48.9%) | 802 (51.0%) |
| Personal Care & Service | 301 (28.8%) | 743 (71.2%) |
| Total (Category) | 3,579 (42.5%) | 4,832 (57.5%) |
| Total (Overall) | 23,695 (48.8%) | 24,820 (51.2%) |
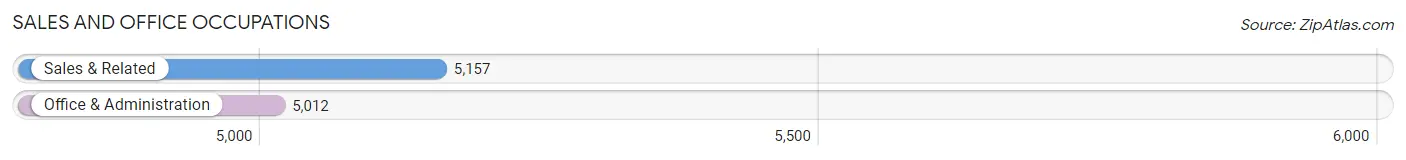
Sales and Office Occupations
The most common Sales and Office occupations in Tuscaloosa are Sales & Related (5,157 | 10.6%), and Office & Administration (5,012 | 10.3%).
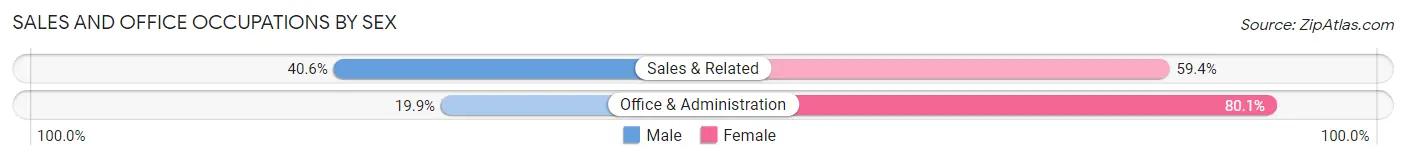
Sales and Office Occupations by Sex
| Occupation | Male | Female |
| Sales & Related | 2,092 (40.6%) | 3,065 (59.4%) |
| Office & Administration | 999 (19.9%) | 4,013 (80.1%) |
| Total (Category) | 3,091 (30.4%) | 7,078 (69.6%) |
| Total (Overall) | 23,695 (48.8%) | 24,820 (51.2%) |
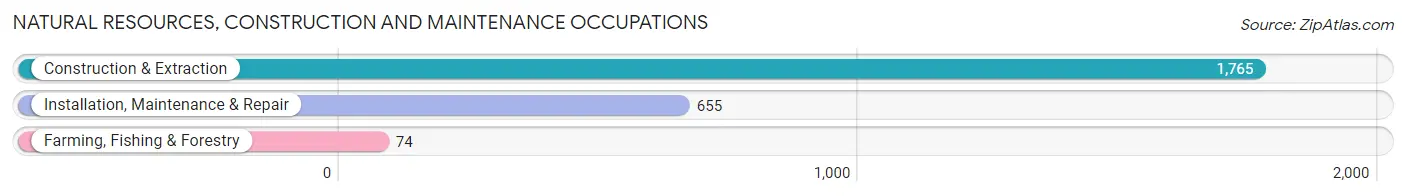
Natural Resources, Construction and Maintenance Occupations
The most common Natural Resources, Construction and Maintenance occupations in Tuscaloosa are Construction & Extraction (1,765 | 3.6%), Installation, Maintenance & Repair (655 | 1.3%), and Farming, Fishing & Forestry (74 | 0.2%).
Natural Resources, Construction and Maintenance Occupations by Sex
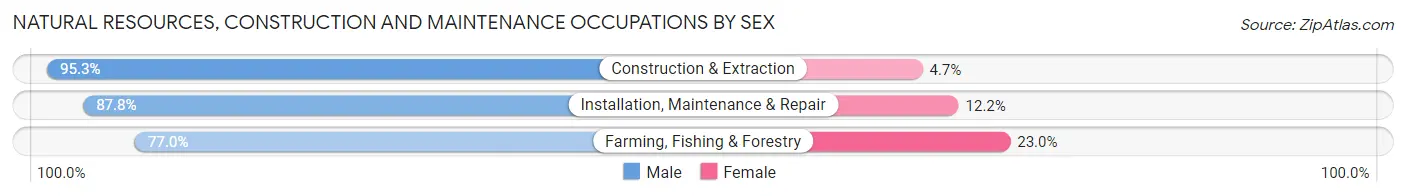
| Occupation | Male | Female |
| Farming, Fishing & Forestry | 57 (77.0%) | 17 (23.0%) |
| Construction & Extraction | 1,682 (95.3%) | 83 (4.7%) |
| Installation, Maintenance & Repair | 575 (87.8%) | 80 (12.2%) |
| Total (Category) | 2,314 (92.8%) | 180 (7.2%) |
| Total (Overall) | 23,695 (48.8%) | 24,820 (51.2%) |
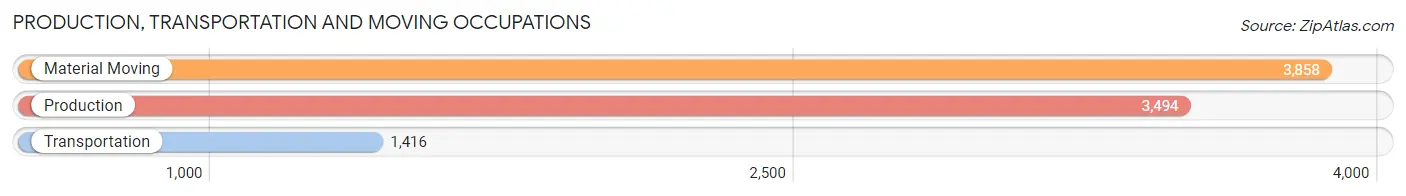
Production, Transportation and Moving Occupations
The most common Production, Transportation and Moving occupations in Tuscaloosa are Material Moving (3,858 | 8.0%), Production (3,494 | 7.2%), and Transportation (1,416 | 2.9%).
Production, Transportation and Moving Occupations by Sex
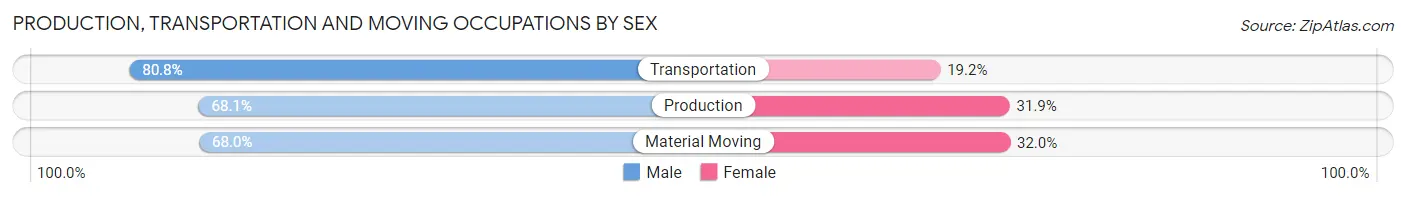
| Occupation | Male | Female |
| Production | 2,378 (68.1%) | 1,116 (31.9%) |
| Transportation | 1,144 (80.8%) | 272 (19.2%) |
| Material Moving | 2,623 (68.0%) | 1,235 (32.0%) |
| Total (Category) | 6,145 (70.1%) | 2,623 (29.9%) |
| Total (Overall) | 23,695 (48.8%) | 24,820 (51.2%) |
Employment Industries by Sex in Tuscaloosa
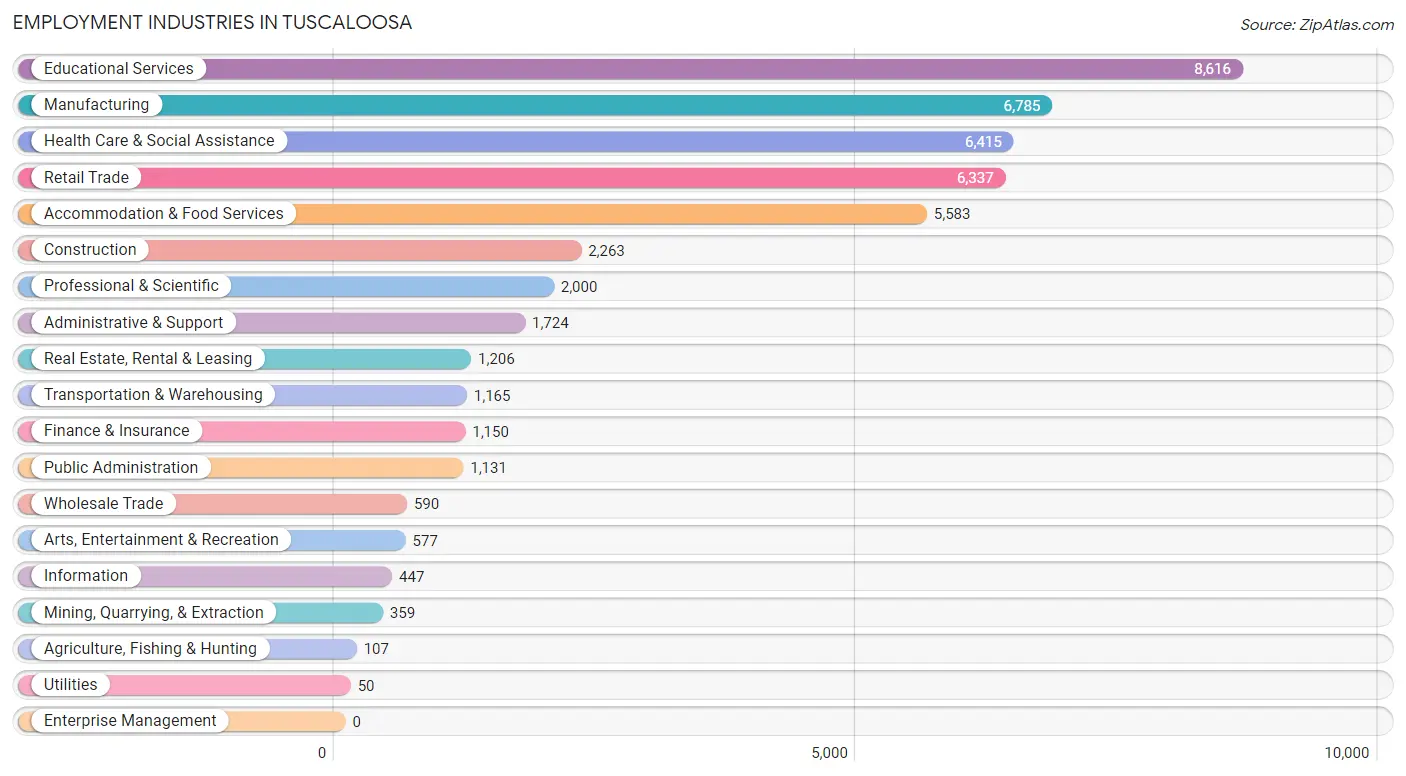
Employment Industries in Tuscaloosa
The major employment industries in Tuscaloosa include Educational Services (8,616 | 17.8%), Manufacturing (6,785 | 14.0%), Health Care & Social Assistance (6,415 | 13.2%), Retail Trade (6,337 | 13.1%), and Accommodation & Food Services (5,583 | 11.5%).
Employment Industries by Sex in Tuscaloosa
The Tuscaloosa industries that see more men than women are Mining, Quarrying, & Extraction (100.0%), Agriculture, Fishing & Hunting (94.4%), and Construction (92.9%), whereas the industries that tend to have a higher number of women are Health Care & Social Assistance (78.0%), Finance & Insurance (66.3%), and Real Estate, Rental & Leasing (59.4%).
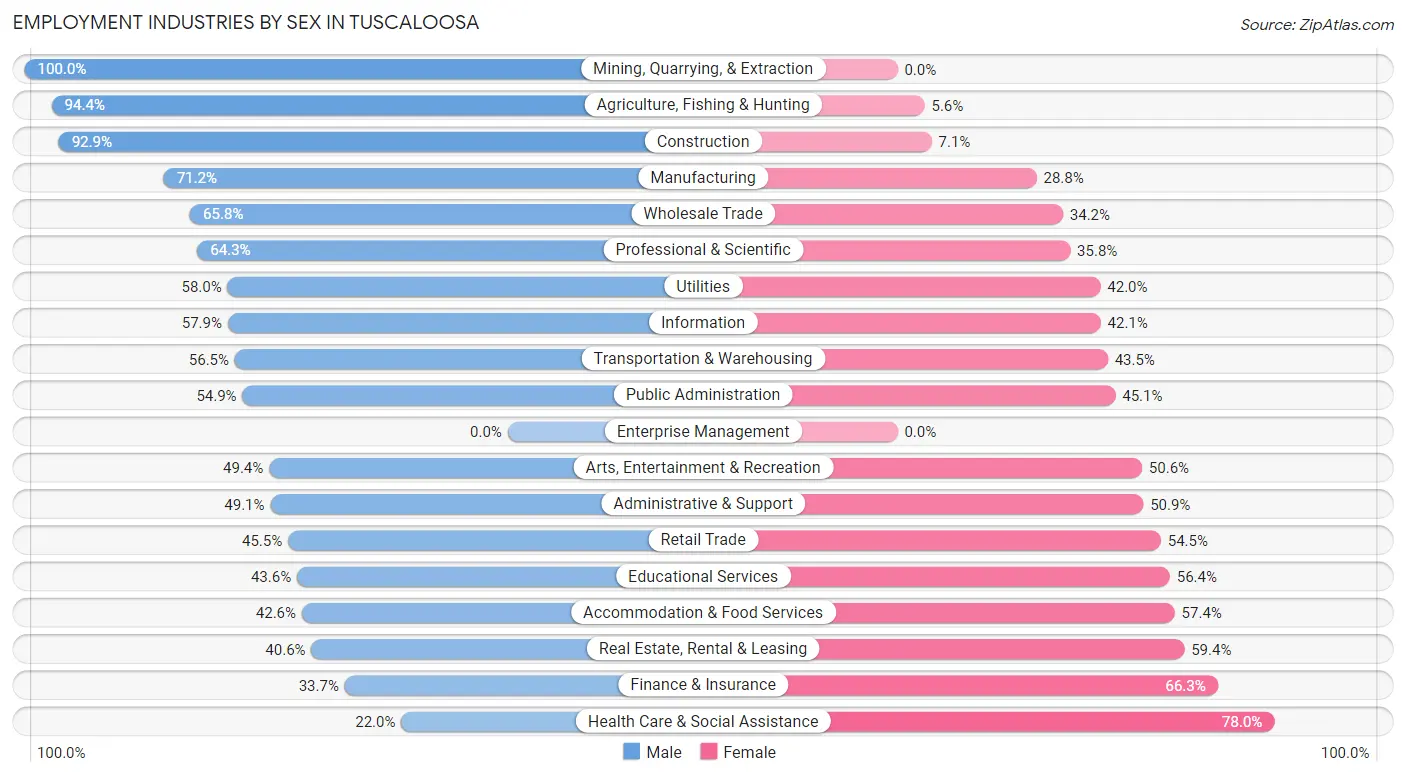
| Industry | Male | Female |
| Agriculture, Fishing & Hunting | 101 (94.4%) | 6 (5.6%) |
| Mining, Quarrying, & Extraction | 359 (100.0%) | 0 (0.0%) |
| Construction | 2,103 (92.9%) | 160 (7.1%) |
| Manufacturing | 4,831 (71.2%) | 1,954 (28.8%) |
| Wholesale Trade | 388 (65.8%) | 202 (34.2%) |
| Retail Trade | 2,882 (45.5%) | 3,455 (54.5%) |
| Transportation & Warehousing | 658 (56.5%) | 507 (43.5%) |
| Utilities | 29 (58.0%) | 21 (42.0%) |
| Information | 259 (57.9%) | 188 (42.1%) |
| Finance & Insurance | 388 (33.7%) | 762 (66.3%) |
| Real Estate, Rental & Leasing | 490 (40.6%) | 716 (59.4%) |
| Professional & Scientific | 1,285 (64.2%) | 715 (35.7%) |
| Enterprise Management | 0 (0.0%) | 0 (0.0%) |
| Administrative & Support | 847 (49.1%) | 877 (50.9%) |
| Educational Services | 3,758 (43.6%) | 4,858 (56.4%) |
| Health Care & Social Assistance | 1,413 (22.0%) | 5,002 (78.0%) |
| Arts, Entertainment & Recreation | 285 (49.4%) | 292 (50.6%) |
| Accommodation & Food Services | 2,379 (42.6%) | 3,204 (57.4%) |
| Public Administration | 621 (54.9%) | 510 (45.1%) |
| Total | 23,695 (48.8%) | 24,820 (51.2%) |
Education in Tuscaloosa
School Enrollment in Tuscaloosa
The most common levels of schooling among the 38,990 students in Tuscaloosa are college / undergraduate (23,155 | 59.4%), middle school (4,009 | 10.3%), and elementary school (3,804 | 9.8%).
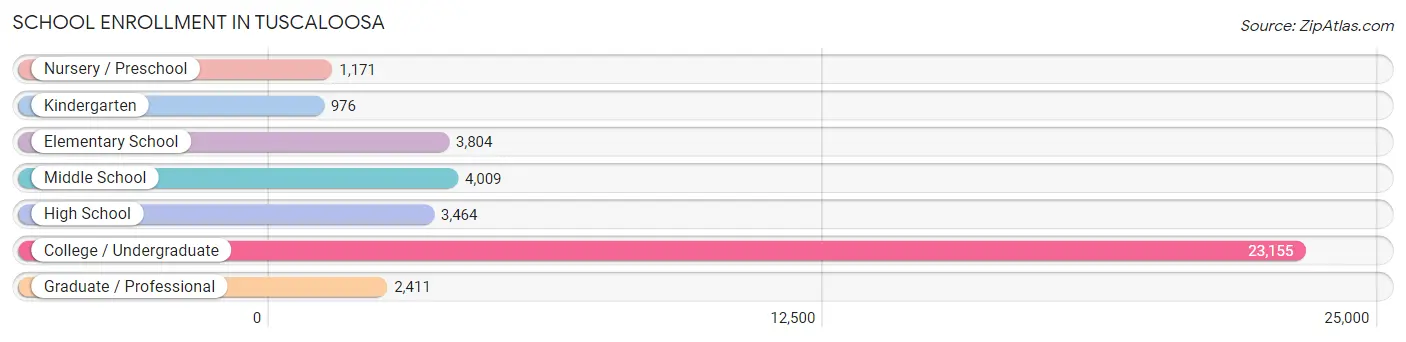
| School Level | # Students | % Students |
| Nursery / Preschool | 1,171 | 3.0% |
| Kindergarten | 976 | 2.5% |
| Elementary School | 3,804 | 9.8% |
| Middle School | 4,009 | 10.3% |
| High School | 3,464 | 8.9% |
| College / Undergraduate | 23,155 | 59.4% |
| Graduate / Professional | 2,411 | 6.2% |
| Total | 38,990 | 100.0% |
School Enrollment by Age by Funding Source in Tuscaloosa
Out of a total of 38,990 students who are enrolled in schools in Tuscaloosa, 3,080 (7.9%) attend a private institution, while the remaining 35,910 (92.1%) are enrolled in public schools. The age group of 35 years and over has the highest likelihood of being enrolled in private schools, with 258 (25.2% in the age bracket) enrolled. Conversely, the age group of 18 to 19 year olds has the lowest likelihood of being enrolled in a private school, with 10,473 (95.4% in the age bracket) attending a public institution.
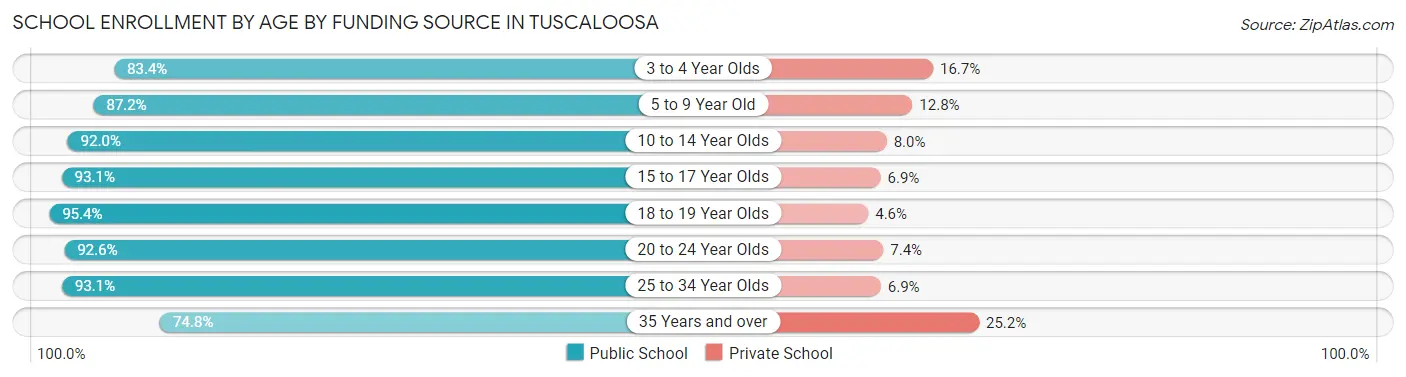
| Age Bracket | Public School | Private School |
| 3 to 4 Year Olds | 786 (83.4%) | 157 (16.7%) |
| 5 to 9 Year Old | 4,082 (87.2%) | 599 (12.8%) |
| 10 to 14 Year Olds | 4,255 (92.0%) | 371 (8.0%) |
| 15 to 17 Year Olds | 2,814 (93.1%) | 208 (6.9%) |
| 18 to 19 Year Olds | 10,473 (95.4%) | 504 (4.6%) |
| 20 to 24 Year Olds | 10,257 (92.6%) | 819 (7.4%) |
| 25 to 34 Year Olds | 2,459 (93.1%) | 183 (6.9%) |
| 35 Years and over | 765 (74.8%) | 258 (25.2%) |
| Total | 35,910 (92.1%) | 3,080 (7.9%) |
Educational Attainment by Field of Study in Tuscaloosa
Business (4,924 | 20.6%), education (3,273 | 13.7%), science & technology (2,855 | 11.9%), arts & humanities (1,908 | 8.0%), and engineering (1,881 | 7.9%) are the most common fields of study among 23,944 individuals in Tuscaloosa who have obtained a bachelor's degree or higher.
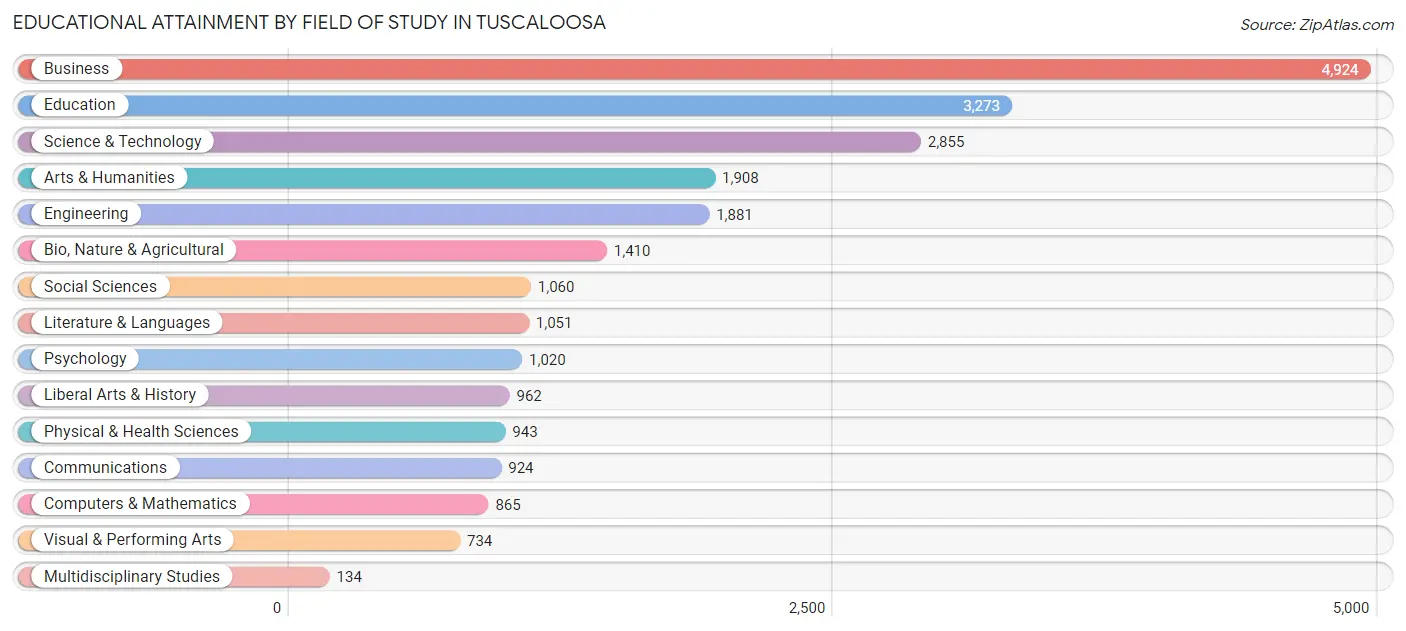
| Field of Study | # Graduates | % Graduates |
| Computers & Mathematics | 865 | 3.6% |
| Bio, Nature & Agricultural | 1,410 | 5.9% |
| Physical & Health Sciences | 943 | 3.9% |
| Psychology | 1,020 | 4.3% |
| Social Sciences | 1,060 | 4.4% |
| Engineering | 1,881 | 7.9% |
| Multidisciplinary Studies | 134 | 0.6% |
| Science & Technology | 2,855 | 11.9% |
| Business | 4,924 | 20.6% |
| Education | 3,273 | 13.7% |
| Literature & Languages | 1,051 | 4.4% |
| Liberal Arts & History | 962 | 4.0% |
| Visual & Performing Arts | 734 | 3.1% |
| Communications | 924 | 3.9% |
| Arts & Humanities | 1,908 | 8.0% |
| Total | 23,944 | 100.0% |
Transportation & Commute in Tuscaloosa
Vehicle Availability by Sex in Tuscaloosa
The most prevalent vehicle ownership categories in Tuscaloosa are males with 2 vehicles (9,805, accounting for 42.7%) and females with 2 vehicles (9,305, making up 44.0%).
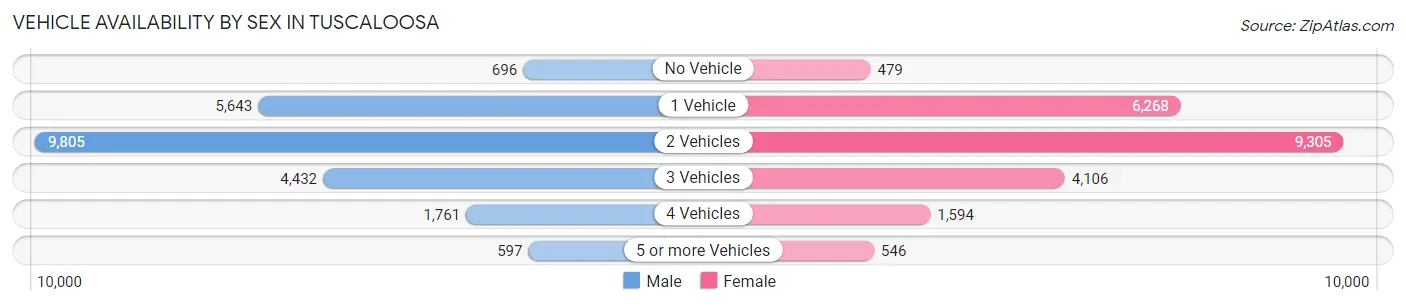
| Vehicles Available | Male | Female |
| No Vehicle | 696 (3.0%) | 479 (2.1%) |
| 1 Vehicle | 5,643 (24.6%) | 6,268 (28.1%) |
| 2 Vehicles | 9,805 (42.7%) | 9,305 (41.7%) |
| 3 Vehicles | 4,432 (19.3%) | 4,106 (18.4%) |
| 4 Vehicles | 1,761 (7.7%) | 1,594 (7.1%) |
| 5 or more Vehicles | 597 (2.6%) | 546 (2.5%) |
| Total | 22,934 (100.0%) | 22,298 (100.0%) |
Commute Time in Tuscaloosa
The most frequently occuring commute durations in Tuscaloosa are 15 to 19 minutes (10,409 commuters, 23.3%), 10 to 14 minutes (10,014 commuters, 22.4%), and 5 to 9 minutes (7,365 commuters, 16.5%).
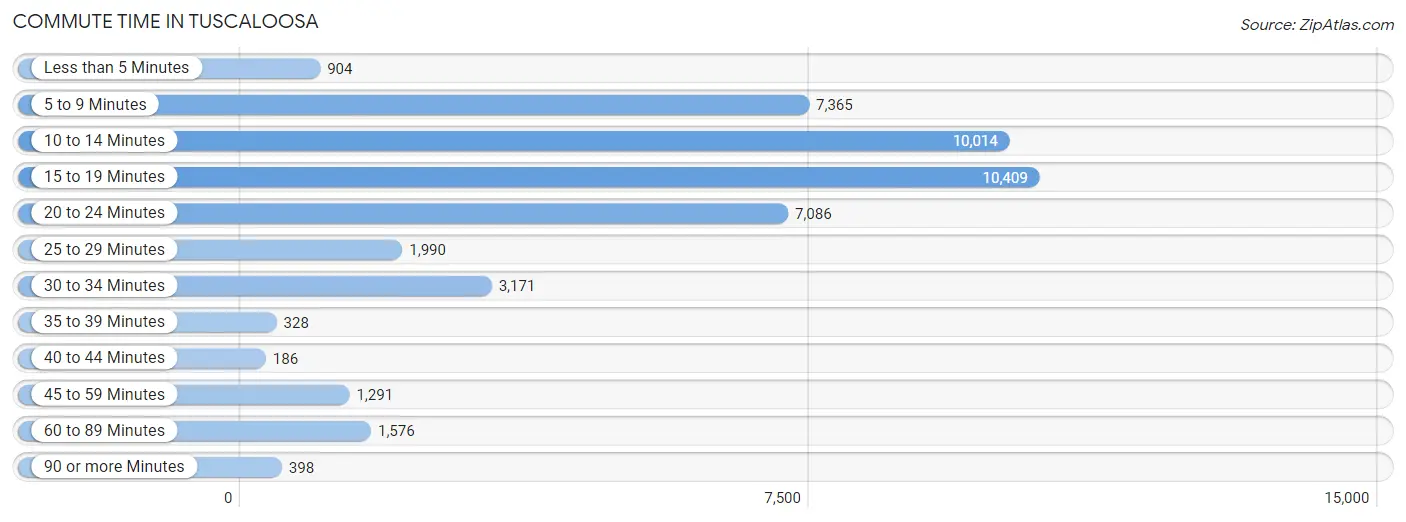
| Commute Time | # Commuters | % Commuters |
| Less than 5 Minutes | 904 | 2.0% |
| 5 to 9 Minutes | 7,365 | 16.5% |
| 10 to 14 Minutes | 10,014 | 22.4% |
| 15 to 19 Minutes | 10,409 | 23.3% |
| 20 to 24 Minutes | 7,086 | 15.9% |
| 25 to 29 Minutes | 1,990 | 4.4% |
| 30 to 34 Minutes | 3,171 | 7.1% |
| 35 to 39 Minutes | 328 | 0.7% |
| 40 to 44 Minutes | 186 | 0.4% |
| 45 to 59 Minutes | 1,291 | 2.9% |
| 60 to 89 Minutes | 1,576 | 3.5% |
| 90 or more Minutes | 398 | 0.9% |
Commute Time by Sex in Tuscaloosa
The most common commute times in Tuscaloosa are 10 to 14 minutes (5,239 commuters, 23.5%) for males and 15 to 19 minutes (5,214 commuters, 23.3%) for females.
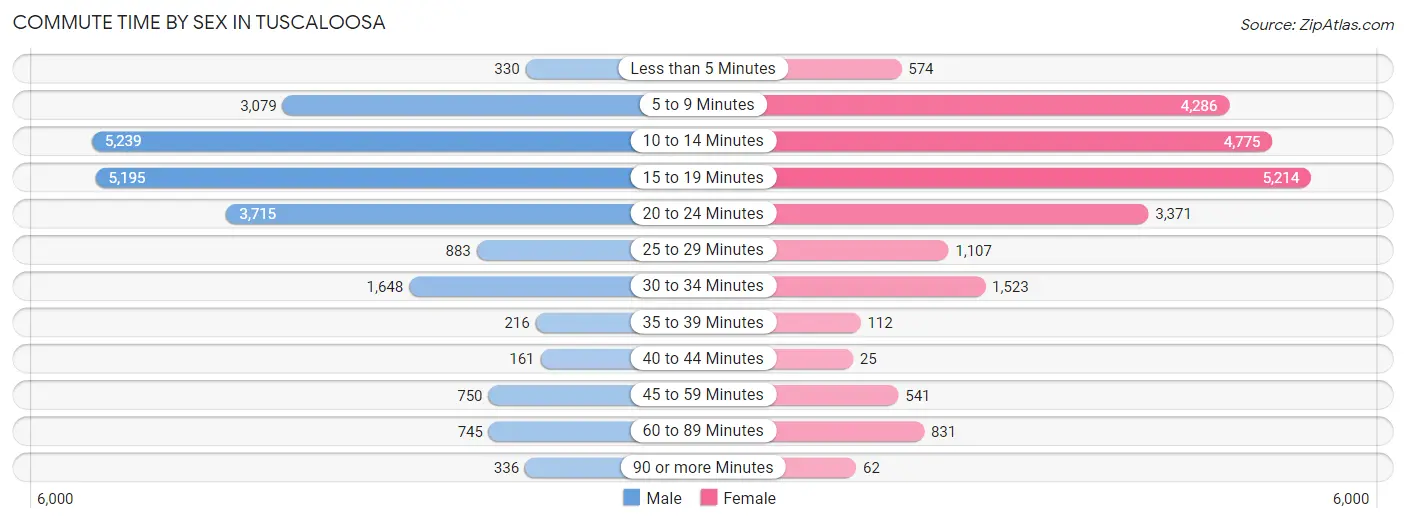
| Commute Time | Male | Female |
| Less than 5 Minutes | 330 (1.5%) | 574 (2.6%) |
| 5 to 9 Minutes | 3,079 (13.8%) | 4,286 (19.1%) |
| 10 to 14 Minutes | 5,239 (23.5%) | 4,775 (21.3%) |
| 15 to 19 Minutes | 5,195 (23.3%) | 5,214 (23.3%) |
| 20 to 24 Minutes | 3,715 (16.7%) | 3,371 (15.0%) |
| 25 to 29 Minutes | 883 (4.0%) | 1,107 (4.9%) |
| 30 to 34 Minutes | 1,648 (7.4%) | 1,523 (6.8%) |
| 35 to 39 Minutes | 216 (1.0%) | 112 (0.5%) |
| 40 to 44 Minutes | 161 (0.7%) | 25 (0.1%) |
| 45 to 59 Minutes | 750 (3.4%) | 541 (2.4%) |
| 60 to 89 Minutes | 745 (3.3%) | 831 (3.7%) |
| 90 or more Minutes | 336 (1.5%) | 62 (0.3%) |
Time of Departure to Work by Sex in Tuscaloosa
The most frequent times of departure to work in Tuscaloosa are 7:00 AM to 7:29 AM (3,267, 14.6%) for males and 7:30 AM to 7:59 AM (4,396, 19.6%) for females.
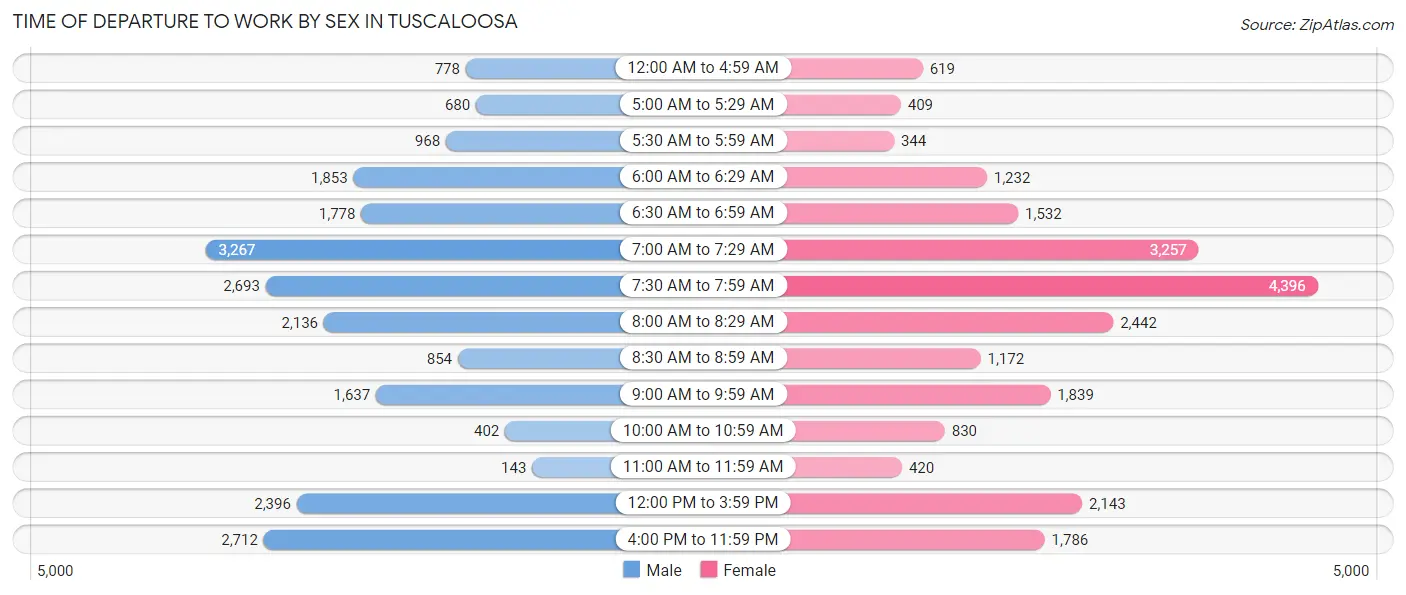
| Time of Departure | Male | Female |
| 12:00 AM to 4:59 AM | 778 (3.5%) | 619 (2.8%) |
| 5:00 AM to 5:29 AM | 680 (3.0%) | 409 (1.8%) |
| 5:30 AM to 5:59 AM | 968 (4.3%) | 344 (1.5%) |
| 6:00 AM to 6:29 AM | 1,853 (8.3%) | 1,232 (5.5%) |
| 6:30 AM to 6:59 AM | 1,778 (8.0%) | 1,532 (6.8%) |
| 7:00 AM to 7:29 AM | 3,267 (14.6%) | 3,257 (14.5%) |
| 7:30 AM to 7:59 AM | 2,693 (12.1%) | 4,396 (19.6%) |
| 8:00 AM to 8:29 AM | 2,136 (9.6%) | 2,442 (10.9%) |
| 8:30 AM to 8:59 AM | 854 (3.8%) | 1,172 (5.2%) |
| 9:00 AM to 9:59 AM | 1,637 (7.3%) | 1,839 (8.2%) |
| 10:00 AM to 10:59 AM | 402 (1.8%) | 830 (3.7%) |
| 11:00 AM to 11:59 AM | 143 (0.6%) | 420 (1.9%) |
| 12:00 PM to 3:59 PM | 2,396 (10.7%) | 2,143 (9.6%) |
| 4:00 PM to 11:59 PM | 2,712 (12.2%) | 1,786 (8.0%) |
| Total | 22,297 (100.0%) | 22,421 (100.0%) |
Housing Occupancy in Tuscaloosa
Occupancy by Ownership in Tuscaloosa
Of the total 39,097 dwellings in Tuscaloosa, owner-occupied units account for 17,852 (45.7%), while renter-occupied units make up 21,245 (54.3%).
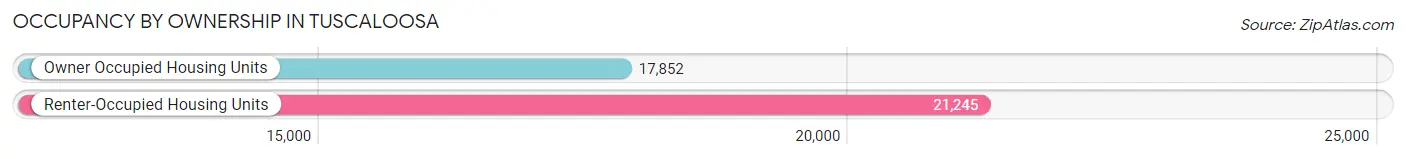
| Occupancy | # Housing Units | % Housing Units |
| Owner Occupied Housing Units | 17,852 | 45.7% |
| Renter-Occupied Housing Units | 21,245 | 54.3% |
| Total Occupied Housing Units | 39,097 | 100.0% |
Occupancy by Household Size in Tuscaloosa
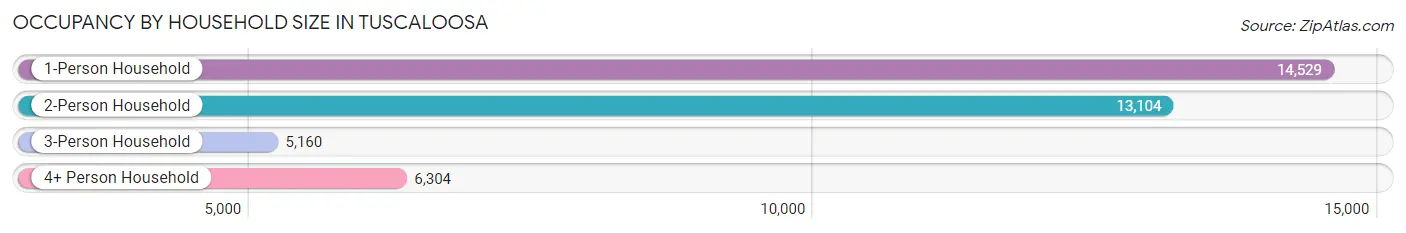
| Household Size | # Housing Units | % Housing Units |
| 1-Person Household | 14,529 | 37.2% |
| 2-Person Household | 13,104 | 33.5% |
| 3-Person Household | 5,160 | 13.2% |
| 4+ Person Household | 6,304 | 16.1% |
| Total Housing Units | 39,097 | 100.0% |
Occupancy by Ownership by Household Size in Tuscaloosa
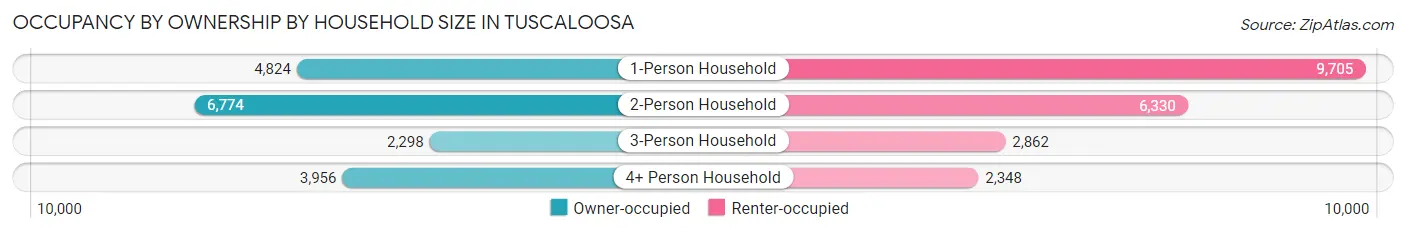
| Household Size | Owner-occupied | Renter-occupied |
| 1-Person Household | 4,824 (33.2%) | 9,705 (66.8%) |
| 2-Person Household | 6,774 (51.7%) | 6,330 (48.3%) |
| 3-Person Household | 2,298 (44.5%) | 2,862 (55.5%) |
| 4+ Person Household | 3,956 (62.7%) | 2,348 (37.2%) |
| Total Housing Units | 17,852 (45.7%) | 21,245 (54.3%) |
Occupancy by Educational Attainment in Tuscaloosa
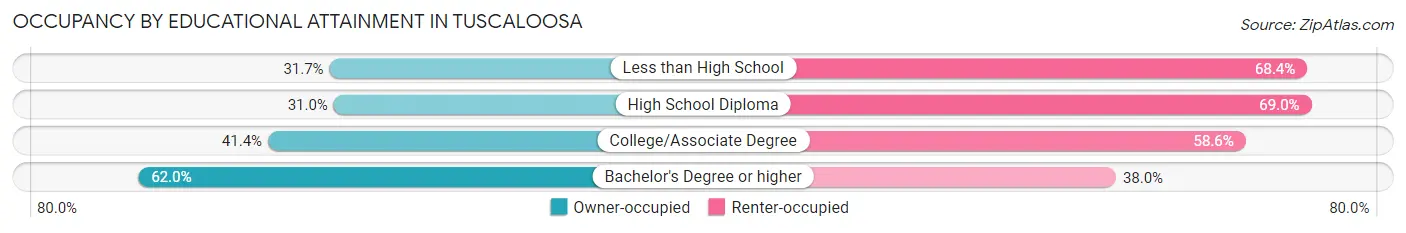
| Household Size | Owner-occupied | Renter-occupied |
| Less than High School | 783 (31.7%) | 1,691 (68.3%) |
| High School Diploma | 3,189 (31.0%) | 7,108 (69.0%) |
| College/Associate Degree | 4,903 (41.4%) | 6,937 (58.6%) |
| Bachelor's Degree or higher | 8,977 (62.0%) | 5,509 (38.0%) |
Occupancy by Age of Householder in Tuscaloosa
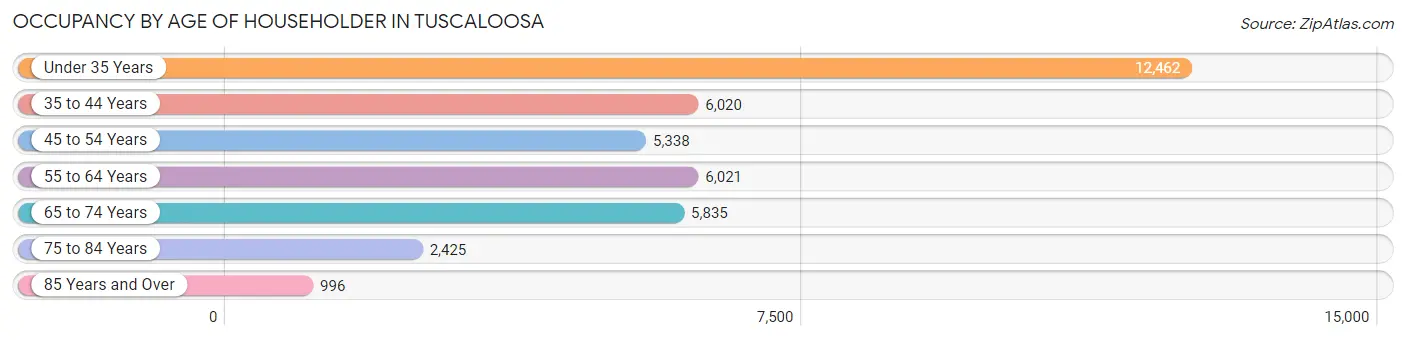
| Age Bracket | # Households | % Households |
| Under 35 Years | 12,462 | 31.9% |
| 35 to 44 Years | 6,020 | 15.4% |
| 45 to 54 Years | 5,338 | 13.7% |
| 55 to 64 Years | 6,021 | 15.4% |
| 65 to 74 Years | 5,835 | 14.9% |
| 75 to 84 Years | 2,425 | 6.2% |
| 85 Years and Over | 996 | 2.5% |
| Total | 39,097 | 100.0% |
Housing Finances in Tuscaloosa
Median Income by Occupancy in Tuscaloosa
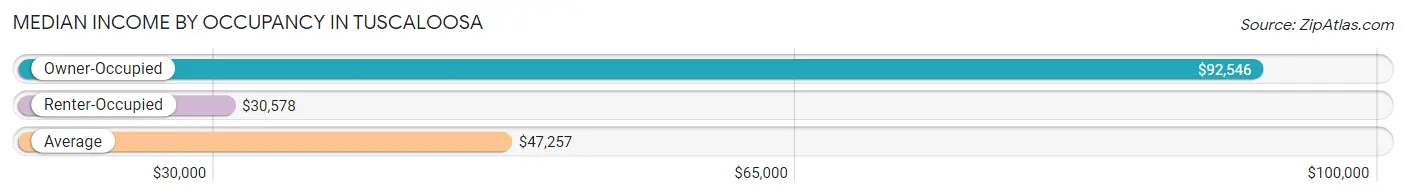
| Occupancy Type | # Households | Median Income |
| Owner-Occupied | 17,852 (45.7%) | $92,546 |
| Renter-Occupied | 21,245 (54.3%) | $30,578 |
| Average | 39,097 (100.0%) | $47,257 |
Occupancy by Householder Income Bracket in Tuscaloosa
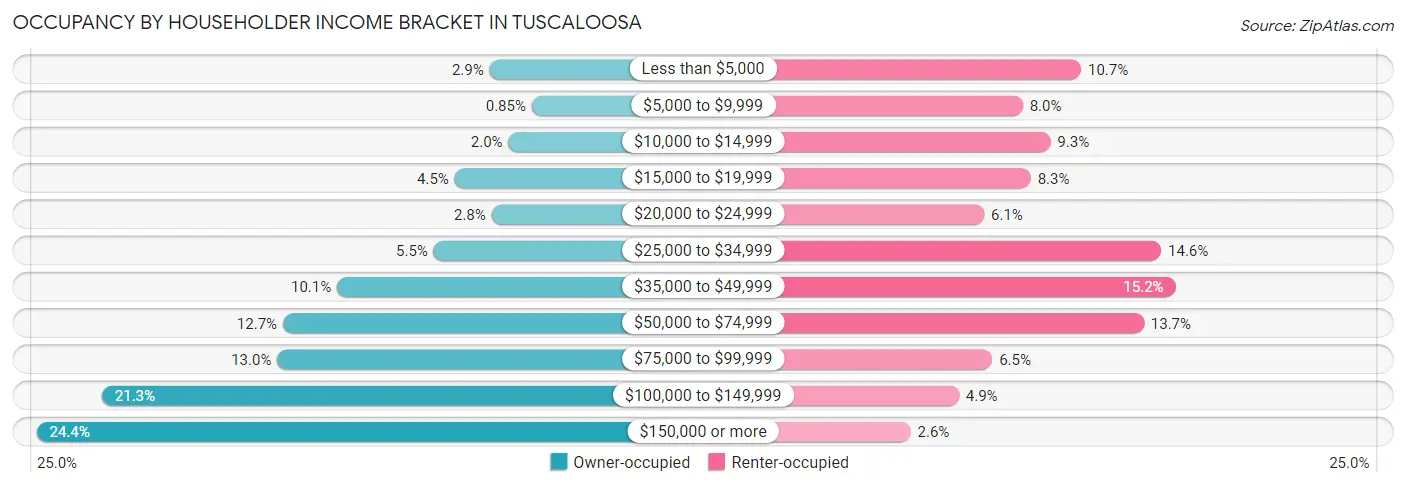
| Income Bracket | Owner-occupied | Renter-occupied |
| Less than $5,000 | 510 (2.9%) | 2,281 (10.7%) |
| $5,000 to $9,999 | 151 (0.9%) | 1,692 (8.0%) |
| $10,000 to $14,999 | 350 (2.0%) | 1,971 (9.3%) |
| $15,000 to $19,999 | 807 (4.5%) | 1,772 (8.3%) |
| $20,000 to $24,999 | 493 (2.8%) | 1,300 (6.1%) |
| $25,000 to $34,999 | 985 (5.5%) | 3,091 (14.5%) |
| $35,000 to $49,999 | 1,806 (10.1%) | 3,235 (15.2%) |
| $50,000 to $74,999 | 2,268 (12.7%) | 2,917 (13.7%) |
| $75,000 to $99,999 | 2,315 (13.0%) | 1,384 (6.5%) |
| $100,000 to $149,999 | 3,806 (21.3%) | 1,046 (4.9%) |
| $150,000 or more | 4,361 (24.4%) | 556 (2.6%) |
| Total | 17,852 (100.0%) | 21,245 (100.0%) |
Monthly Housing Cost Tiers in Tuscaloosa
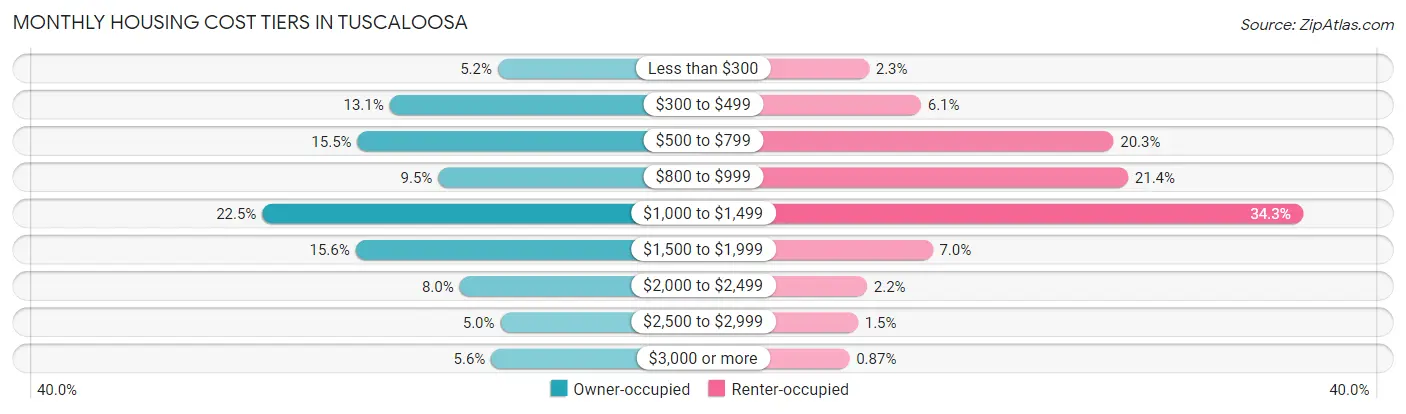
| Monthly Cost | Owner-occupied | Renter-occupied |
| Less than $300 | 919 (5.1%) | 490 (2.3%) |
| $300 to $499 | 2,342 (13.1%) | 1,305 (6.1%) |
| $500 to $799 | 2,766 (15.5%) | 4,317 (20.3%) |
| $800 to $999 | 1,703 (9.5%) | 4,544 (21.4%) |
| $1,000 to $1,499 | 4,017 (22.5%) | 7,277 (34.3%) |
| $1,500 to $1,999 | 2,791 (15.6%) | 1,487 (7.0%) |
| $2,000 to $2,499 | 1,422 (8.0%) | 460 (2.2%) |
| $2,500 to $2,999 | 885 (5.0%) | 318 (1.5%) |
| $3,000 or more | 1,007 (5.6%) | 184 (0.9%) |
| Total | 17,852 (100.0%) | 21,245 (100.0%) |
Physical Housing Characteristics in Tuscaloosa
Housing Structures in Tuscaloosa
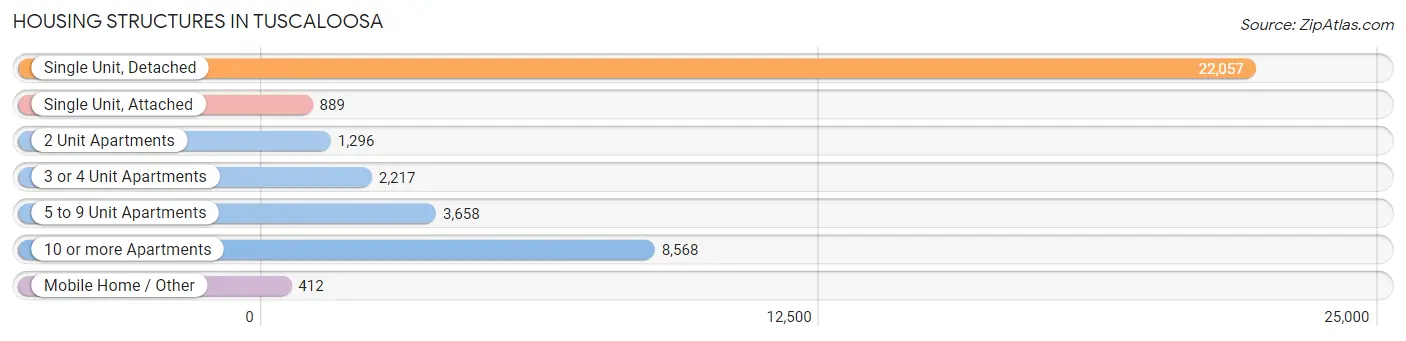
| Structure Type | # Housing Units | % Housing Units |
| Single Unit, Detached | 22,057 | 56.4% |
| Single Unit, Attached | 889 | 2.3% |
| 2 Unit Apartments | 1,296 | 3.3% |
| 3 or 4 Unit Apartments | 2,217 | 5.7% |
| 5 to 9 Unit Apartments | 3,658 | 9.4% |
| 10 or more Apartments | 8,568 | 21.9% |
| Mobile Home / Other | 412 | 1.1% |
| Total | 39,097 | 100.0% |
Housing Structures by Occupancy in Tuscaloosa
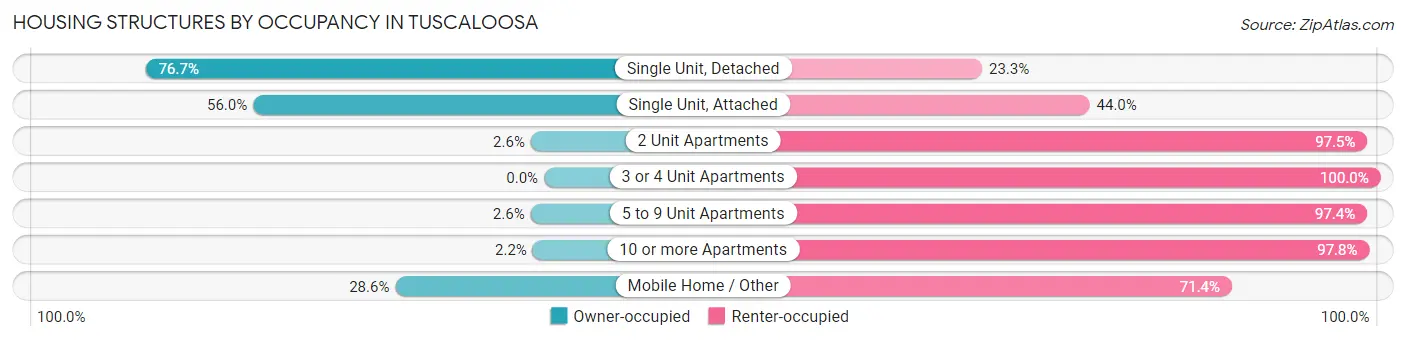
| Structure Type | Owner-occupied | Renter-occupied |
| Single Unit, Detached | 16,922 (76.7%) | 5,135 (23.3%) |
| Single Unit, Attached | 498 (56.0%) | 391 (44.0%) |
| 2 Unit Apartments | 33 (2.5%) | 1,263 (97.5%) |
| 3 or 4 Unit Apartments | 0 (0.0%) | 2,217 (100.0%) |
| 5 to 9 Unit Apartments | 95 (2.6%) | 3,563 (97.4%) |
| 10 or more Apartments | 186 (2.2%) | 8,382 (97.8%) |
| Mobile Home / Other | 118 (28.6%) | 294 (71.4%) |
| Total | 17,852 (45.7%) | 21,245 (54.3%) |
Housing Structures by Number of Rooms in Tuscaloosa
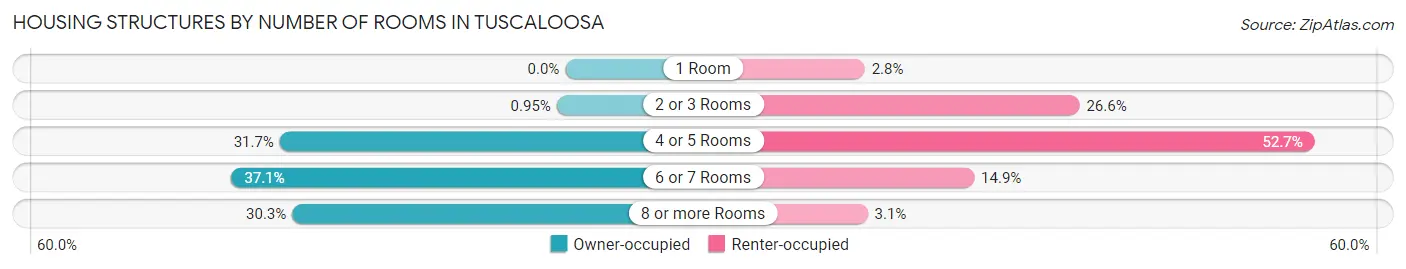
| Number of Rooms | Owner-occupied | Renter-occupied |
| 1 Room | 0 (0.0%) | 585 (2.8%) |
| 2 or 3 Rooms | 169 (0.9%) | 5,650 (26.6%) |
| 4 or 5 Rooms | 5,658 (31.7%) | 11,192 (52.7%) |
| 6 or 7 Rooms | 6,614 (37.0%) | 3,166 (14.9%) |
| 8 or more Rooms | 5,411 (30.3%) | 652 (3.1%) |
| Total | 17,852 (100.0%) | 21,245 (100.0%) |
Housing Structure by Heating Type in Tuscaloosa
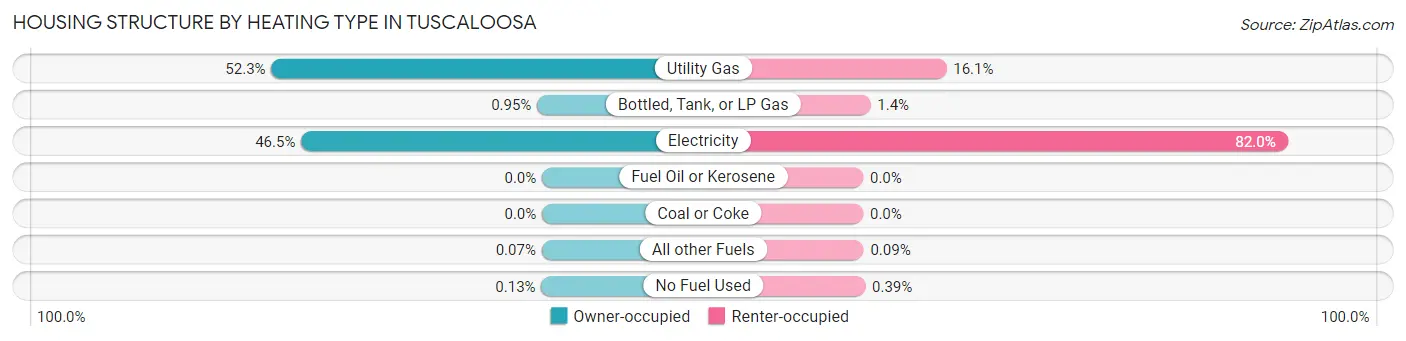
| Heating Type | Owner-occupied | Renter-occupied |
| Utility Gas | 9,338 (52.3%) | 3,417 (16.1%) |
| Bottled, Tank, or LP Gas | 170 (0.9%) | 300 (1.4%) |
| Electricity | 8,308 (46.5%) | 17,427 (82.0%) |
| Fuel Oil or Kerosene | 0 (0.0%) | 0 (0.0%) |
| Coal or Coke | 0 (0.0%) | 0 (0.0%) |
| All other Fuels | 13 (0.1%) | 19 (0.1%) |
| No Fuel Used | 23 (0.1%) | 82 (0.4%) |
| Total | 17,852 (100.0%) | 21,245 (100.0%) |
Household Vehicle Usage in Tuscaloosa
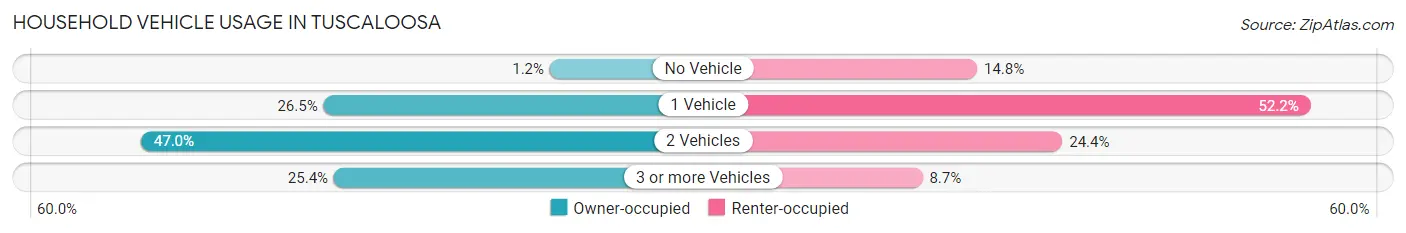
| Vehicles per Household | Owner-occupied | Renter-occupied |
| No Vehicle | 207 (1.2%) | 3,144 (14.8%) |
| 1 Vehicle | 4,734 (26.5%) | 11,082 (52.2%) |
| 2 Vehicles | 8,385 (47.0%) | 5,173 (24.3%) |
| 3 or more Vehicles | 4,526 (25.4%) | 1,846 (8.7%) |
| Total | 17,852 (100.0%) | 21,245 (100.0%) |
Real Estate & Mortgages in Tuscaloosa
Real Estate and Mortgage Overview in Tuscaloosa
| Characteristic | Without Mortgage | With Mortgage |
| Housing Units | 6,254 | 11,598 |
| Median Property Value | $208,800 | $240,400 |
| Median Household Income | $66,641 | $3,387 |
| Monthly Housing Costs | $496 | $1,000 |
| Real Estate Taxes | $1,025 | $1,235 |
Property Value by Mortgage Status in Tuscaloosa
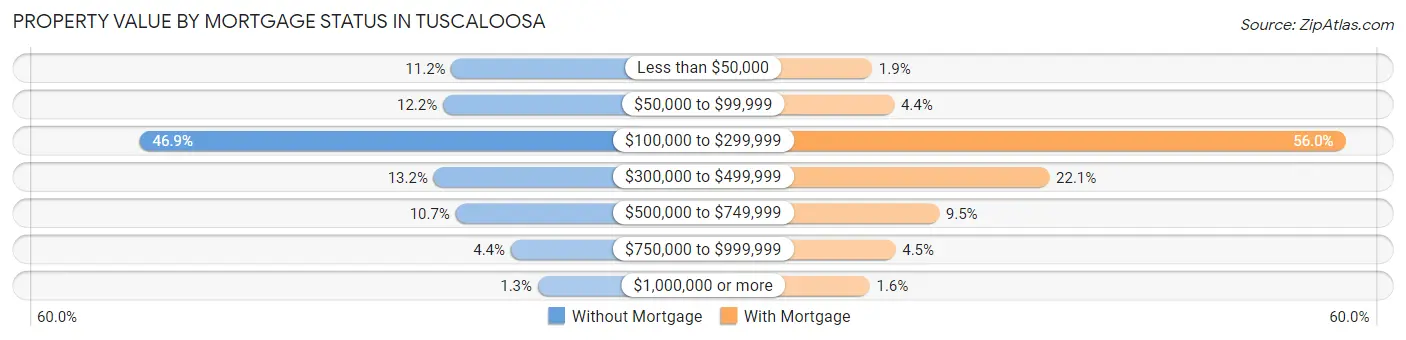
| Property Value | Without Mortgage | With Mortgage |
| Less than $50,000 | 702 (11.2%) | 217 (1.9%) |
| $50,000 to $99,999 | 762 (12.2%) | 509 (4.4%) |
| $100,000 to $299,999 | 2,930 (46.9%) | 6,492 (56.0%) |
| $300,000 to $499,999 | 828 (13.2%) | 2,565 (22.1%) |
| $500,000 to $749,999 | 671 (10.7%) | 1,104 (9.5%) |
| $750,000 to $999,999 | 277 (4.4%) | 526 (4.5%) |
| $1,000,000 or more | 84 (1.3%) | 185 (1.6%) |
| Total | 6,254 (100.0%) | 11,598 (100.0%) |
Household Income by Mortgage Status in Tuscaloosa
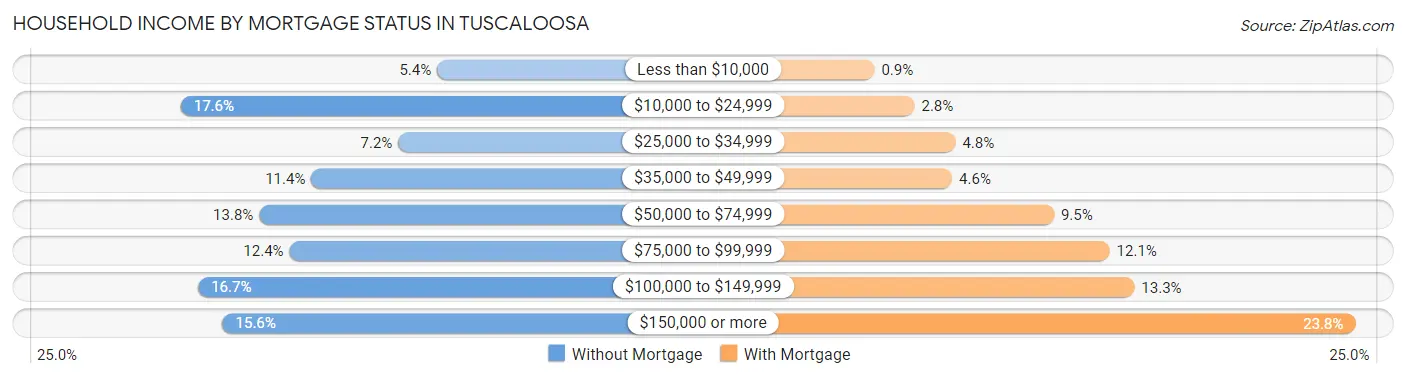
| Household Income | Without Mortgage | With Mortgage |
| Less than $10,000 | 335 (5.4%) | 104 (0.9%) |
| $10,000 to $24,999 | 1,098 (17.6%) | 326 (2.8%) |
| $25,000 to $34,999 | 451 (7.2%) | 552 (4.8%) |
| $35,000 to $49,999 | 710 (11.4%) | 534 (4.6%) |
| $50,000 to $74,999 | 865 (13.8%) | 1,096 (9.5%) |
| $75,000 to $99,999 | 775 (12.4%) | 1,403 (12.1%) |
| $100,000 to $149,999 | 1,046 (16.7%) | 1,540 (13.3%) |
| $150,000 or more | 974 (15.6%) | 2,760 (23.8%) |
| Total | 6,254 (100.0%) | 11,598 (100.0%) |
Property Value to Household Income Ratio in Tuscaloosa
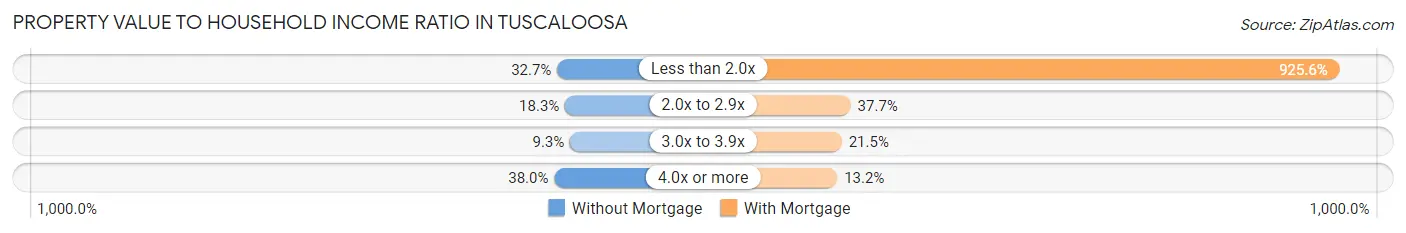
| Value-to-Income Ratio | Without Mortgage | With Mortgage |
| Less than 2.0x | 2,047 (32.7%) | 107,355 (925.6%) |
| 2.0x to 2.9x | 1,146 (18.3%) | 4,373 (37.7%) |
| 3.0x to 3.9x | 583 (9.3%) | 2,489 (21.5%) |
| 4.0x or more | 2,379 (38.0%) | 1,533 (13.2%) |
| Total | 6,254 (100.0%) | 11,598 (100.0%) |
Real Estate Taxes by Mortgage Status in Tuscaloosa
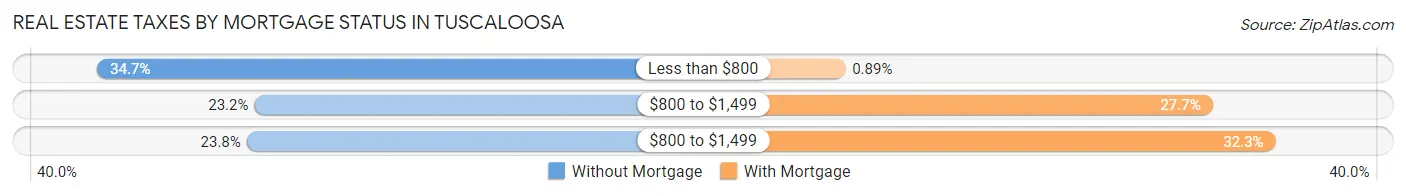
| Property Taxes | Without Mortgage | With Mortgage |
| Less than $800 | 2,170 (34.7%) | 103 (0.9%) |
| $800 to $1,499 | 1,452 (23.2%) | 3,215 (27.7%) |
| $800 to $1,499 | 1,487 (23.8%) | 3,749 (32.3%) |
| Total | 6,254 (100.0%) | 11,598 (100.0%) |
Health & Disability in Tuscaloosa
Health Insurance Coverage by Age in Tuscaloosa
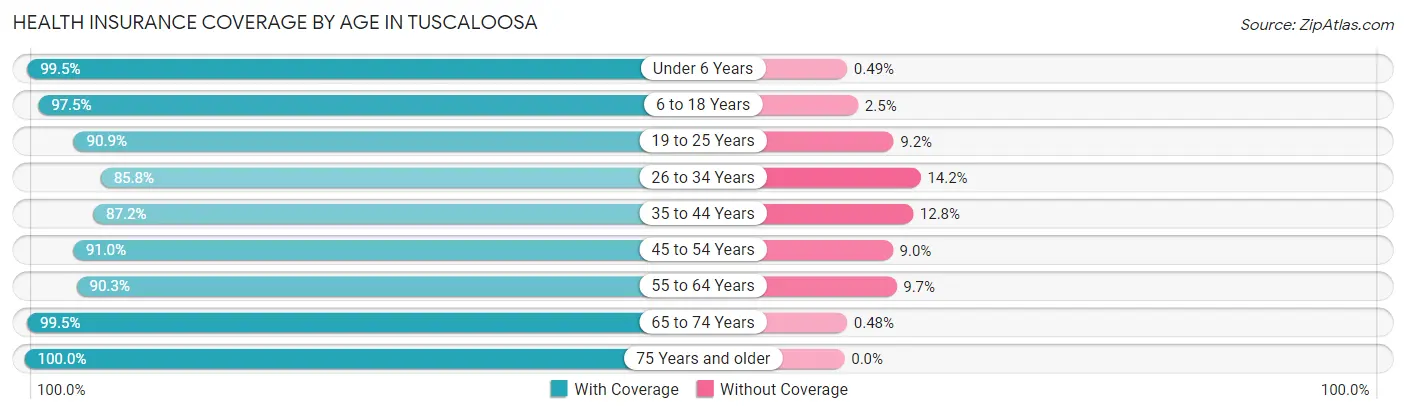
| Age Bracket | With Coverage | Without Coverage |
| Under 6 Years | 6,437 (99.5%) | 32 (0.5%) |
| 6 to 18 Years | 17,246 (97.5%) | 450 (2.5%) |
| 19 to 25 Years | 22,750 (90.8%) | 2,290 (9.1%) |
| 26 to 34 Years | 9,826 (85.8%) | 1,626 (14.2%) |
| 35 to 44 Years | 9,604 (87.2%) | 1,409 (12.8%) |
| 45 to 54 Years | 8,218 (91.0%) | 813 (9.0%) |
| 55 to 64 Years | 9,243 (90.3%) | 992 (9.7%) |
| 65 to 74 Years | 8,494 (99.5%) | 41 (0.5%) |
| 75 Years and older | 5,198 (100.0%) | 0 (0.0%) |
| Total | 97,016 (92.7%) | 7,653 (7.3%) |
Health Insurance Coverage by Citizenship Status in Tuscaloosa
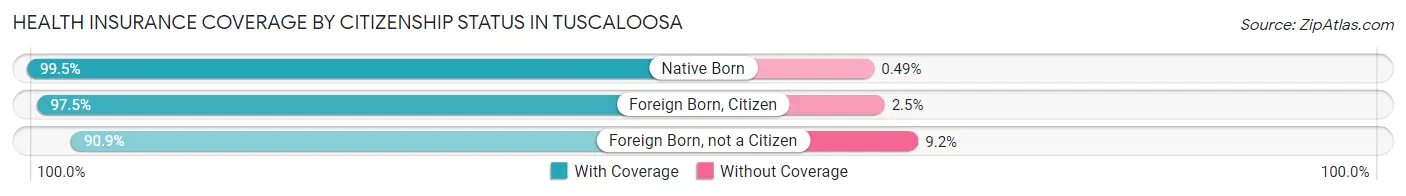
| Citizenship Status | With Coverage | Without Coverage |
| Native Born | 6,437 (99.5%) | 32 (0.5%) |
| Foreign Born, Citizen | 17,246 (97.5%) | 450 (2.5%) |
| Foreign Born, not a Citizen | 22,750 (90.8%) | 2,290 (9.1%) |
Health Insurance Coverage by Household Income in Tuscaloosa
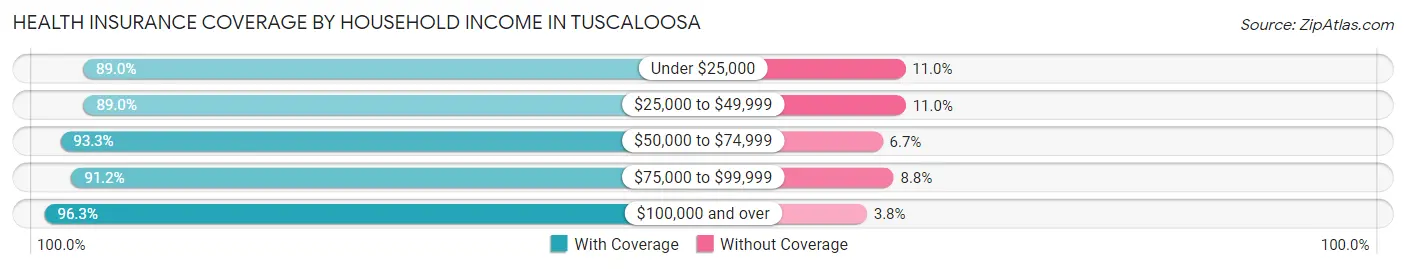
| Household Income | With Coverage | Without Coverage |
| Under $25,000 | 18,491 (89.0%) | 2,275 (11.0%) |
| $25,000 to $49,999 | 18,234 (89.0%) | 2,264 (11.0%) |
| $50,000 to $74,999 | 11,475 (93.3%) | 826 (6.7%) |
| $75,000 to $99,999 | 8,764 (91.2%) | 841 (8.8%) |
| $100,000 and over | 29,127 (96.3%) | 1,136 (3.7%) |
Public vs Private Health Insurance Coverage by Age in Tuscaloosa
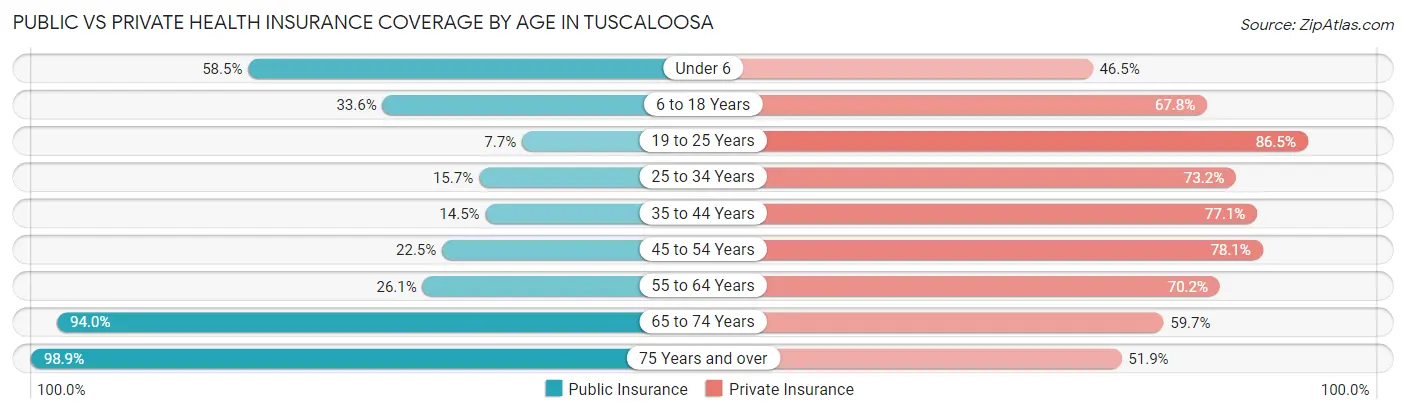
| Age Bracket | Public Insurance | Private Insurance |
| Under 6 | 3,784 (58.5%) | 3,010 (46.5%) |
| 6 to 18 Years | 5,940 (33.6%) | 11,997 (67.8%) |
| 19 to 25 Years | 1,922 (7.7%) | 21,654 (86.5%) |
| 25 to 34 Years | 1,793 (15.7%) | 8,381 (73.2%) |
| 35 to 44 Years | 1,594 (14.5%) | 8,490 (77.1%) |
| 45 to 54 Years | 2,032 (22.5%) | 7,055 (78.1%) |
| 55 to 64 Years | 2,674 (26.1%) | 7,180 (70.2%) |
| 65 to 74 Years | 8,020 (94.0%) | 5,094 (59.7%) |
| 75 Years and over | 5,138 (98.9%) | 2,698 (51.9%) |
| Total | 32,897 (31.4%) | 75,559 (72.2%) |
Disability Status by Sex by Age in Tuscaloosa
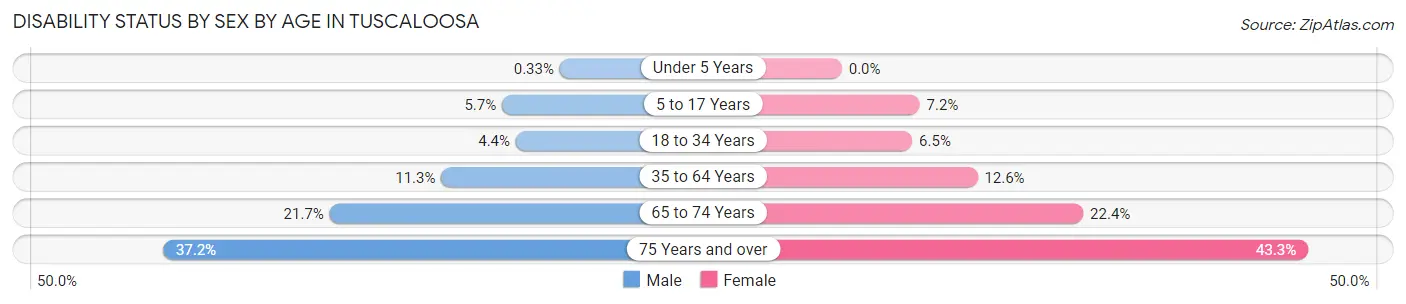
| Age Bracket | Male | Female |
| Under 5 Years | 10 (0.3%) | 0 (0.0%) |
| 5 to 17 Years | 362 (5.7%) | 483 (7.2%) |
| 18 to 34 Years | 877 (4.4%) | 1,455 (6.5%) |
| 35 to 64 Years | 1,655 (11.3%) | 1,972 (12.6%) |
| 65 to 74 Years | 795 (21.7%) | 1,091 (22.4%) |
| 75 Years and over | 719 (37.2%) | 1,412 (43.3%) |
Disability Class by Sex by Age in Tuscaloosa
Disability Class: Hearing Difficulty
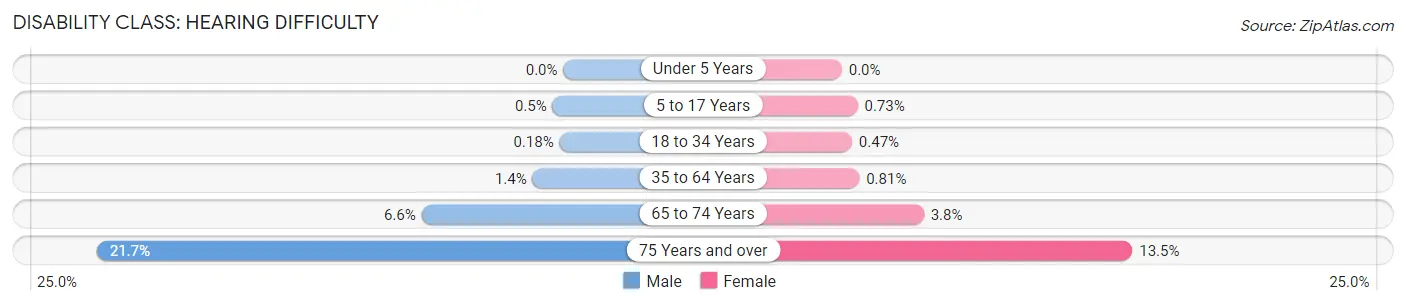
| Age Bracket | Male | Female |
| Under 5 Years | 0 (0.0%) | 0 (0.0%) |
| 5 to 17 Years | 32 (0.5%) | 49 (0.7%) |
| 18 to 34 Years | 35 (0.2%) | 105 (0.5%) |
| 35 to 64 Years | 209 (1.4%) | 127 (0.8%) |
| 65 to 74 Years | 241 (6.6%) | 185 (3.8%) |
| 75 Years and over | 419 (21.6%) | 440 (13.5%) |
Disability Class: Vision Difficulty
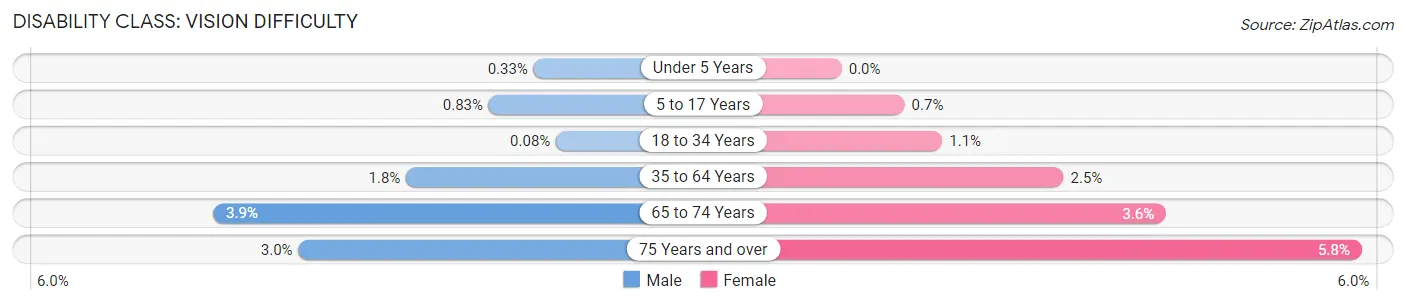
| Age Bracket | Male | Female |
| Under 5 Years | 10 (0.3%) | 0 (0.0%) |
| 5 to 17 Years | 53 (0.8%) | 47 (0.7%) |
| 18 to 34 Years | 16 (0.1%) | 249 (1.1%) |
| 35 to 64 Years | 255 (1.8%) | 387 (2.5%) |
| 65 to 74 Years | 143 (3.9%) | 176 (3.6%) |
| 75 Years and over | 57 (2.9%) | 189 (5.8%) |
Disability Class: Cognitive Difficulty
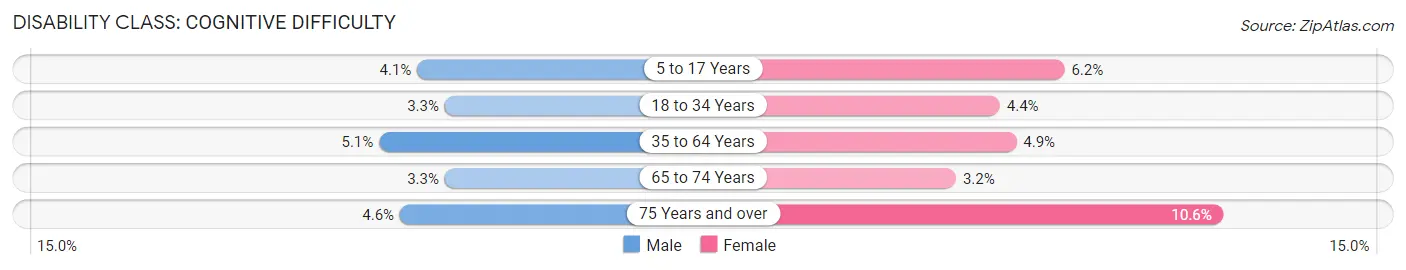
| Age Bracket | Male | Female |
| 5 to 17 Years | 259 (4.1%) | 415 (6.2%) |
| 18 to 34 Years | 655 (3.3%) | 981 (4.4%) |
| 35 to 64 Years | 749 (5.1%) | 761 (4.9%) |
| 65 to 74 Years | 121 (3.3%) | 155 (3.2%) |
| 75 Years and over | 88 (4.5%) | 347 (10.6%) |
Disability Class: Ambulatory Difficulty
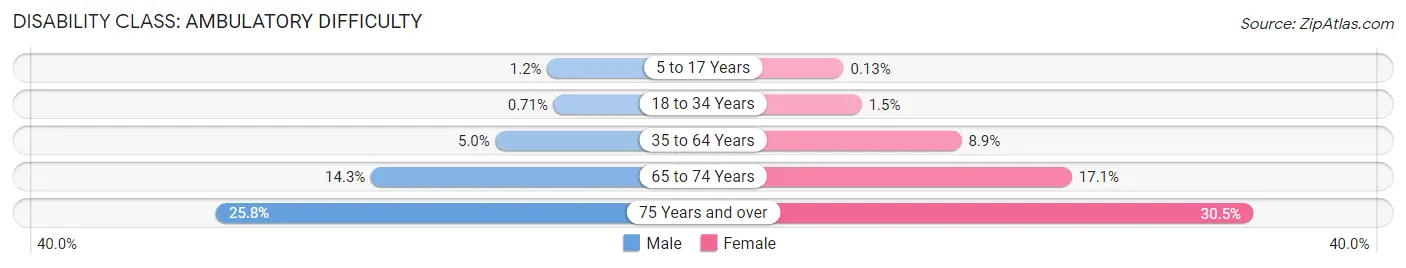
| Age Bracket | Male | Female |
| 5 to 17 Years | 75 (1.2%) | 9 (0.1%) |
| 18 to 34 Years | 142 (0.7%) | 330 (1.5%) |
| 35 to 64 Years | 735 (5.0%) | 1,393 (8.9%) |
| 65 to 74 Years | 523 (14.3%) | 832 (17.1%) |
| 75 Years and over | 499 (25.8%) | 996 (30.5%) |
Disability Class: Self-Care Difficulty
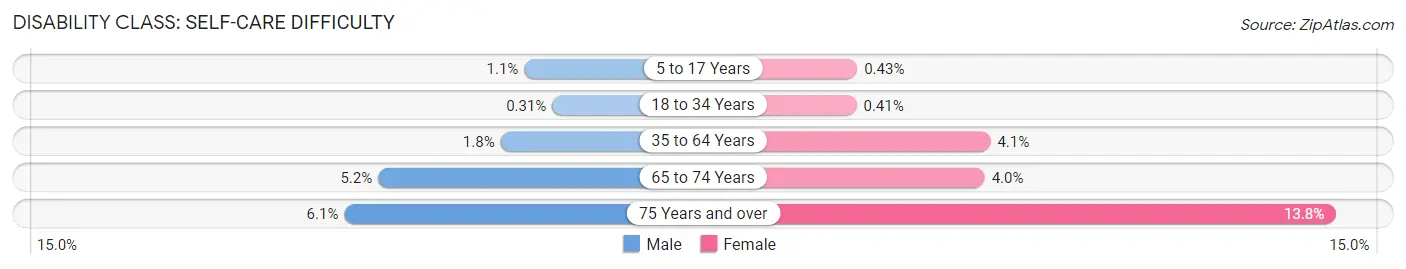
| Age Bracket | Male | Female |
| 5 to 17 Years | 69 (1.1%) | 29 (0.4%) |
| 18 to 34 Years | 62 (0.3%) | 92 (0.4%) |
| 35 to 64 Years | 256 (1.8%) | 649 (4.1%) |
| 65 to 74 Years | 189 (5.2%) | 194 (4.0%) |
| 75 Years and over | 118 (6.1%) | 449 (13.8%) |
Technology Access in Tuscaloosa
Computing Device Access in Tuscaloosa
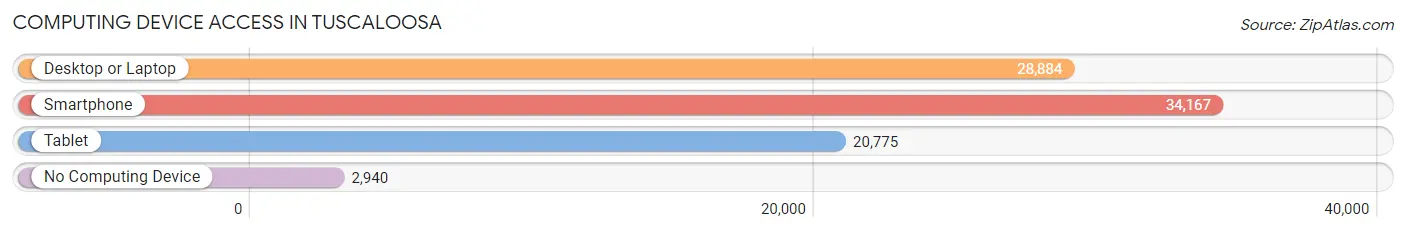
| Device Type | # Households | % Households |
| Desktop or Laptop | 28,884 | 73.9% |
| Smartphone | 34,167 | 87.4% |
| Tablet | 20,775 | 53.1% |
| No Computing Device | 2,940 | 7.5% |
| Total | 39,097 | 100.0% |
Internet Access in Tuscaloosa
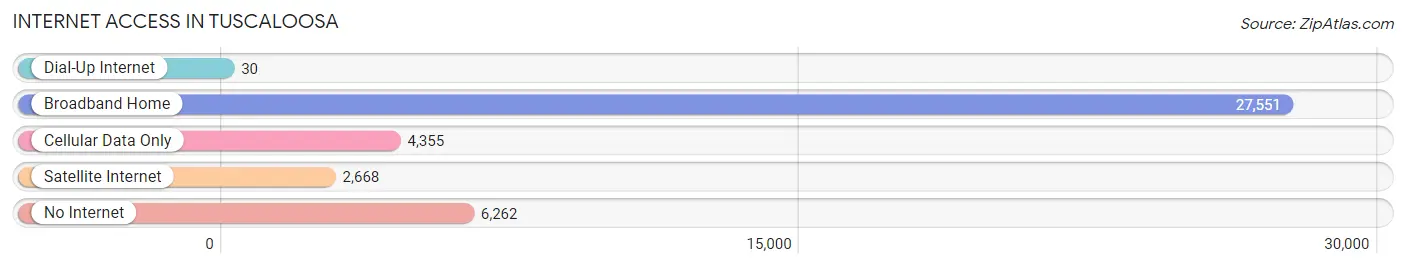
| Internet Type | # Households | % Households |
| Dial-Up Internet | 30 | 0.1% |
| Broadband Home | 27,551 | 70.5% |
| Cellular Data Only | 4,355 | 11.1% |
| Satellite Internet | 2,668 | 6.8% |
| No Internet | 6,262 | 16.0% |
| Total | 39,097 | 100.0% |
Tuscaloosa Summary
Tuscaloosa, Alabama is a city located in the west-central part of the state, in the Black Warrior River Valley. It is the fifth-largest city in Alabama, with a population of 99,543 as of the 2019 U.S. Census. It is the county seat of Tuscaloosa County and is the principal city of the Tuscaloosa Metropolitan Statistical Area, which includes Tuscaloosa, Hale, and Pickens counties.
History
Tuscaloosa was founded in 1819 by the Alabama Legislature as the county seat of Tuscaloosa County. The city was named after the Choctaw Chief Tuskaloosa, who was killed in battle in 1540 by the Spanish explorer Hernando de Soto. The city was incorporated in 1825 and was the state capital from 1826 to 1846.
Tuscaloosa was a major center of the cotton industry in the 19th century, and the city was home to several cotton mills. The city was also a major center of the Civil War, with several battles taking place in the area. After the war, the city experienced a period of growth and development, with the University of Alabama being established in 1831.
Geography
Tuscaloosa is located in the west-central part of Alabama, in the Black Warrior River Valley. The city is situated on the banks of the Black Warrior River, and is bordered by the cities of Northport and Holt to the north, and by the cities of Cottondale and Vance to the south. The city is located approximately 60 miles southwest of Birmingham and approximately 90 miles northwest of Montgomery.
The city has a total area of 79.2 square miles, of which 77.2 square miles is land and 2.0 square miles is water. The city is located at an elevation of approximately 500 feet above sea level.
Economy
Tuscaloosa is a major economic center in the state of Alabama. The city is home to several major employers, including the University of Alabama, Mercedes-Benz U.S. International, and the West Alabama Regional Airport. The city is also home to several major industries, including automotive manufacturing, steel production, and paper production.
The city has a strong tourism industry, with several attractions, including the University of Alabama, the Paul W. Bryant Museum, and the Tuscaloosa Amphitheater. The city is also home to several major events, including the Tuscaloosa Arts and Crafts Festival, the Tuscaloosa Half Marathon, and the Tuscaloosa Riverfest.
Demographics
As of the 2019 U.S. Census, Tuscaloosa had a population of 99,543. The city has a population density of 1,265 people per square mile. The racial makeup of the city is 63.2% White, 32.2% Black or African American, 0.5% Native American, 1.7% Asian, 0.1% Pacific Islander, 1.2% from other races, and 1.3% from two or more races.
The median household income in Tuscaloosa is $45,845, and the median family income is $54,845. The per capita income in the city is $25,845. The city has a poverty rate of 22.3%.
Conclusion
Tuscaloosa, Alabama is a city located in the west-central part of the state, in the Black Warrior River Valley. It is the fifth-largest city in Alabama, with a population of 99,543 as of the 2019 U.S. Census. The city has a strong economy, with several major employers and industries, and a strong tourism industry. The city has a diverse population, with a median household income of $45,845 and a poverty rate of 22.3%. Tuscaloosa is a major economic center in the state of Alabama and is home to several attractions and events.
Common Questions
What is Per Capita Income in Tuscaloosa?
Per Capita income in Tuscaloosa is $30,761.
What is the Median Family Income in Tuscaloosa?
Median Family Income in Tuscaloosa is $77,126.
What is the Median Household income in Tuscaloosa?
Median Household Income in Tuscaloosa is $47,257.
What is Income or Wage Gap in Tuscaloosa?
Income or Wage Gap in Tuscaloosa is 29.5%.
Women in Tuscaloosa earn 70.5 cents for every dollar earned by a man.
What is Family Income Deficit in Tuscaloosa?
Family Income Deficit in Tuscaloosa is $10,069.
Families that are below poverty line in Tuscaloosa earn $10,069 less on average than the poverty threshold level.
What is Inequality or Gini Index in Tuscaloosa?
Inequality or Gini Index in Tuscaloosa is 0.54.
What is the Total Population of Tuscaloosa?
Total Population of Tuscaloosa is 105,797.
What is the Total Male Population of Tuscaloosa?
Total Male Population of Tuscaloosa is 50,375.
What is the Total Female Population of Tuscaloosa?
Total Female Population of Tuscaloosa is 55,422.
What is the Ratio of Males per 100 Females in Tuscaloosa?
There are 90.89 Males per 100 Females in Tuscaloosa.
What is the Ratio of Females per 100 Males in Tuscaloosa?
There are 110.02 Females per 100 Males in Tuscaloosa.
What is the Median Population Age in Tuscaloosa?
Median Population Age in Tuscaloosa is 28.8 Years.
What is the Average Family Size in Tuscaloosa
Average Family Size in Tuscaloosa is 3.2 People.
What is the Average Household Size in Tuscaloosa
Average Household Size in Tuscaloosa is 2.4 People.
How Large is the Labor Force in Tuscaloosa?
There are 52,133 People in the Labor Forcein in Tuscaloosa.
What is the Percentage of People in the Labor Force in Tuscaloosa?
58.2% of People are in the Labor Force in Tuscaloosa.
What is the Unemployment Rate in Tuscaloosa?
Unemployment Rate in Tuscaloosa is 6.8%.