Winooski, VT Map & Demographics
Winooski Map
Winooski Overview
$38,554
PER CAPITA INCOME
$97,870
AVG FAMILY INCOME
$69,783
AVG HOUSEHOLD INCOME
7.5%
WAGE / INCOME GAP [ % ]
92.5¢/ $1
WAGE / INCOME GAP [ $ ]
$8,282
FAMILY INCOME DEFICIT
0.43
INEQUALITY / GINI INDEX
8,122
TOTAL POPULATION
4,595
MALE POPULATION
3,527
FEMALE POPULATION
130.28
MALES / 100 FEMALES
76.76
FEMALES / 100 MALES
32.3
MEDIAN AGE
3.2
AVG FAMILY SIZE
2.2
AVG HOUSEHOLD SIZE
5,452
LABOR FORCE [ PEOPLE ]
77.8%
PERCENT IN LABOR FORCE
1.9%
UNEMPLOYMENT RATE
Winooski Zip Codes
Winooski Area Codes
Income in Winooski
Income Overview in Winooski
Per Capita Income in Winooski is $38,554, while median incomes of families and households are $97,870 and $69,783 respectively.
| Characteristic | Number | Measure |
| Per Capita Income | 8,122 | $38,554 |
| Median Family Income | 1,408 | $97,870 |
| Mean Family Income | 1,408 | $107,205 |
| Median Household Income | 3,688 | $69,783 |
| Mean Household Income | 3,688 | $82,502 |
| Income Deficit | 1,408 | $8,282 |
| Wage / Income Gap (%) | 8,122 | 7.50% |
| Wage / Income Gap ($) | 8,122 | 92.50¢ per $1 |
| Gini / Inequality Index | 8,122 | 0.43 |
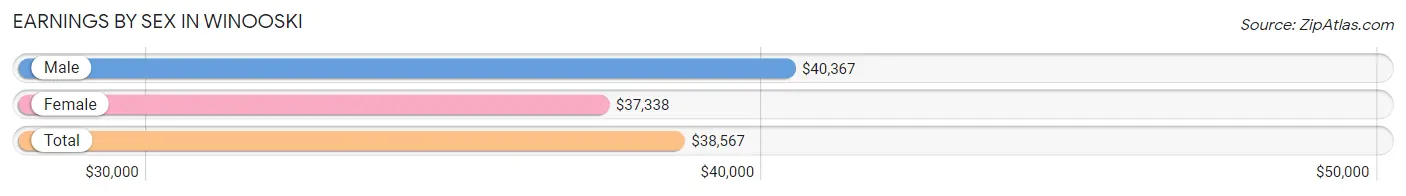
Earnings by Sex in Winooski
Average Earnings in Winooski are $38,567, $40,367 for men and $37,338 for women, a difference of 7.5%.
| Sex | Number | Average Earnings |
| Male | 3,270 (59.3%) | $40,367 |
| Female | 2,244 (40.7%) | $37,338 |
| Total | 5,514 (100.0%) | $38,567 |
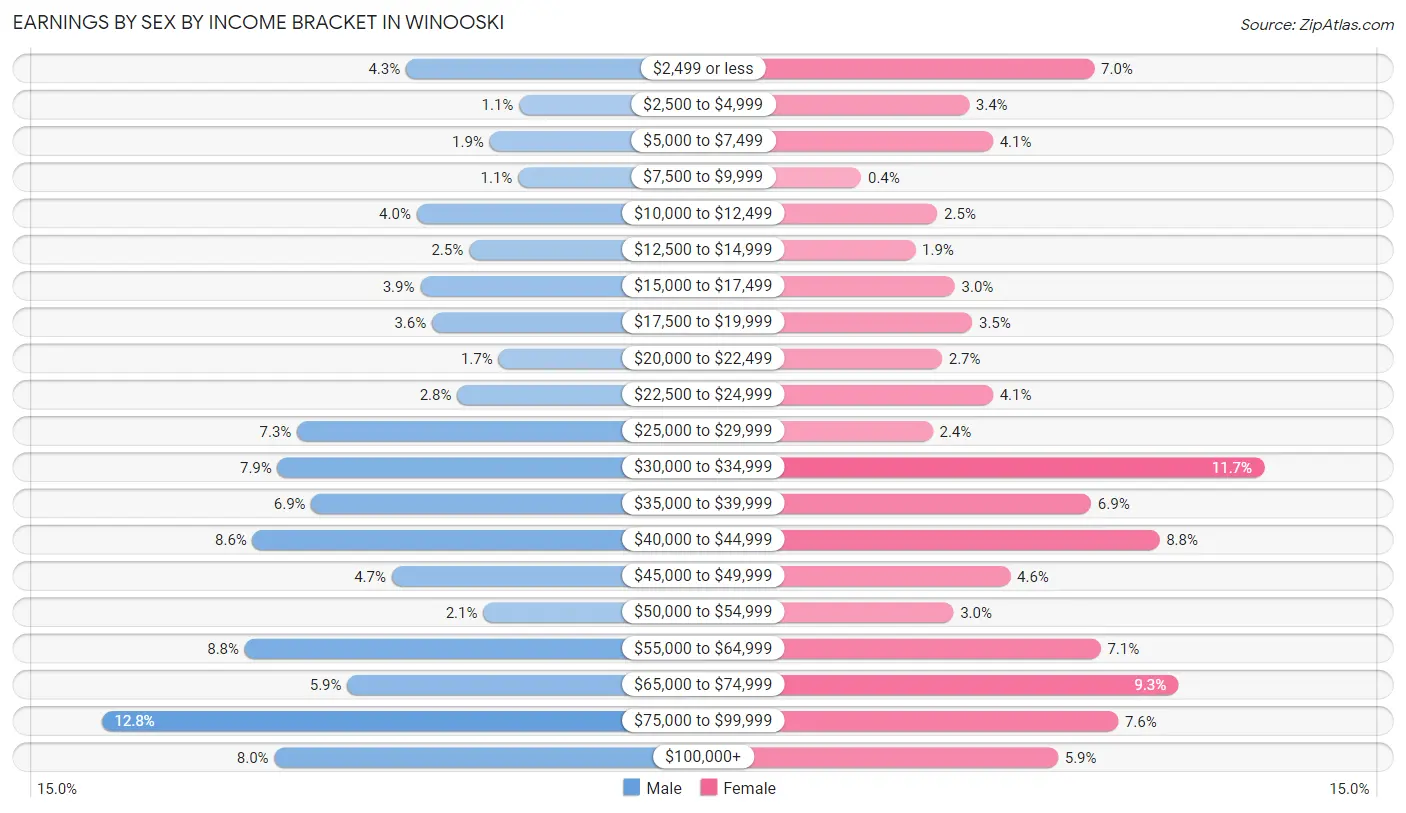
Earnings by Sex by Income Bracket in Winooski
The most common earnings brackets in Winooski are $75,000 to $99,999 for men (420 | 12.8%) and $30,000 to $34,999 for women (263 | 11.7%).
| Income | Male | Female |
| $2,499 or less | 140 (4.3%) | 156 (7.0%) |
| $2,500 to $4,999 | 36 (1.1%) | 77 (3.4%) |
| $5,000 to $7,499 | 63 (1.9%) | 92 (4.1%) |
| $7,500 to $9,999 | 37 (1.1%) | 9 (0.4%) |
| $10,000 to $12,499 | 130 (4.0%) | 57 (2.5%) |
| $12,500 to $14,999 | 82 (2.5%) | 43 (1.9%) |
| $15,000 to $17,499 | 127 (3.9%) | 68 (3.0%) |
| $17,500 to $19,999 | 116 (3.5%) | 79 (3.5%) |
| $20,000 to $22,499 | 55 (1.7%) | 60 (2.7%) |
| $22,500 to $24,999 | 93 (2.8%) | 92 (4.1%) |
| $25,000 to $29,999 | 240 (7.3%) | 54 (2.4%) |
| $30,000 to $34,999 | 258 (7.9%) | 263 (11.7%) |
| $35,000 to $39,999 | 227 (6.9%) | 154 (6.9%) |
| $40,000 to $44,999 | 281 (8.6%) | 197 (8.8%) |
| $45,000 to $49,999 | 153 (4.7%) | 103 (4.6%) |
| $50,000 to $54,999 | 69 (2.1%) | 67 (3.0%) |
| $55,000 to $64,999 | 288 (8.8%) | 160 (7.1%) |
| $65,000 to $74,999 | 194 (5.9%) | 209 (9.3%) |
| $75,000 to $99,999 | 420 (12.8%) | 171 (7.6%) |
| $100,000+ | 261 (8.0%) | 133 (5.9%) |
| Total | 3,270 (100.0%) | 2,244 (100.0%) |
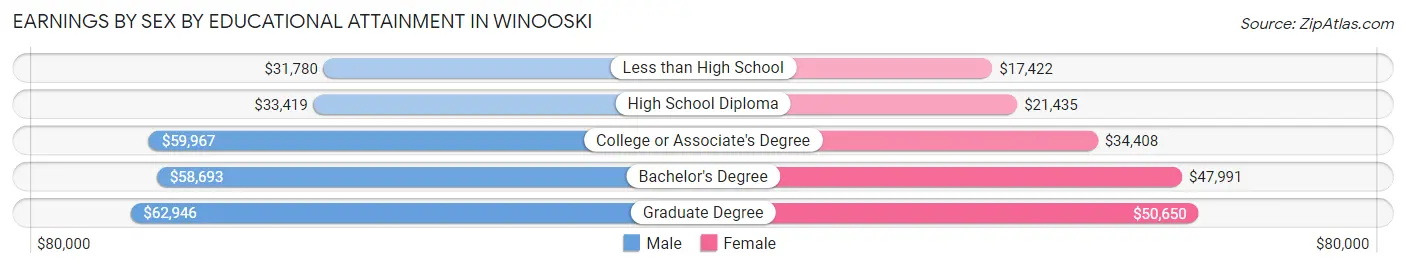
Earnings by Sex by Educational Attainment in Winooski
Average earnings in Winooski are $49,318 for men and $43,790 for women, a difference of 11.2%. Men with an educational attainment of graduate degree enjoy the highest average annual earnings of $62,946, while those with less than high school education earn the least with $31,780. Women with an educational attainment of graduate degree earn the most with the average annual earnings of $50,650, while those with less than high school education have the smallest earnings of $17,422.
| Educational Attainment | Male Income | Female Income |
| Less than High School | $31,780 | $17,422 |
| High School Diploma | $33,419 | $21,435 |
| College or Associate's Degree | $59,967 | $34,408 |
| Bachelor's Degree | $58,693 | $47,991 |
| Graduate Degree | $62,946 | $50,650 |
| Total | $49,318 | $43,790 |
Family Income in Winooski
Family Income Brackets in Winooski
According to the Winooski family income data, there are 387 families falling into the $100,000 to $149,999 income range, which is the most common income bracket and makes up 27.5% of all families. Conversely, the $10,000 to $14,999 income bracket is the least frequent group with only 30 families (2.1%) belonging to this category.
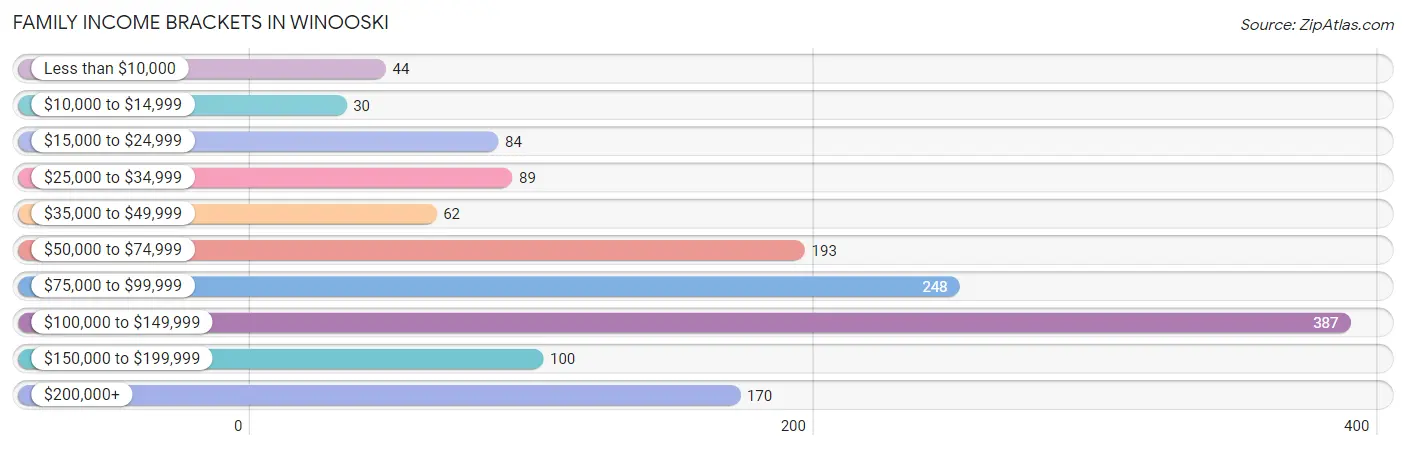
| Income Bracket | # Families | % Families |
| Less than $10,000 | 44 | 3.1% |
| $10,000 to $14,999 | 30 | 2.1% |
| $15,000 to $24,999 | 84 | 6.0% |
| $25,000 to $34,999 | 89 | 6.3% |
| $35,000 to $49,999 | 62 | 4.4% |
| $50,000 to $74,999 | 193 | 13.7% |
| $75,000 to $99,999 | 248 | 17.6% |
| $100,000 to $149,999 | 387 | 27.5% |
| $150,000 to $199,999 | 100 | 7.1% |
| $200,000+ | 170 | 12.1% |
Family Income by Famaliy Size in Winooski
3-person families (272 | 19.3%) account for the highest median family income in Winooski with $155,536 per family, while 3-person families (272 | 19.3%) have the highest median income of $51,845 per family member.
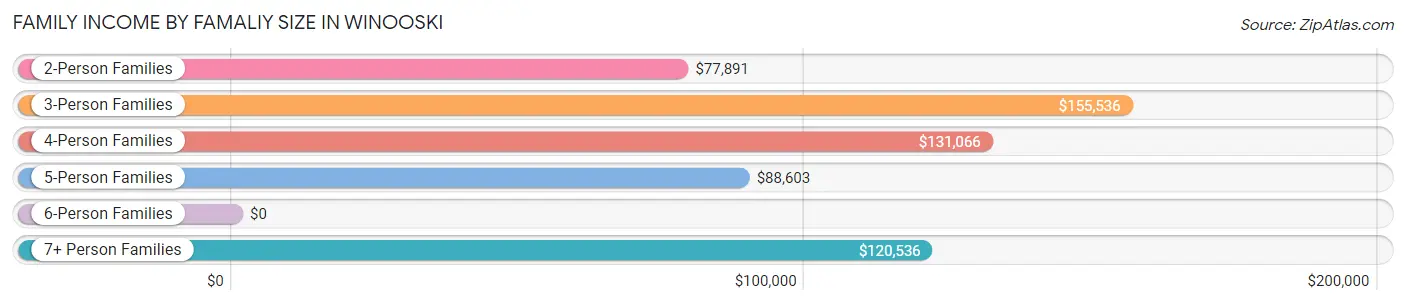
| Income Bracket | # Families | Median Income |
| 2-Person Families | 725 (51.5%) | $77,891 |
| 3-Person Families | 272 (19.3%) | $155,536 |
| 4-Person Families | 164 (11.7%) | $131,066 |
| 5-Person Families | 165 (11.7%) | $88,603 |
| 6-Person Families | 41 (2.9%) | $0 |
| 7+ Person Families | 41 (2.9%) | $120,536 |
| Total | 1,408 (100.0%) | $97,870 |
Family Income by Number of Earners in Winooski
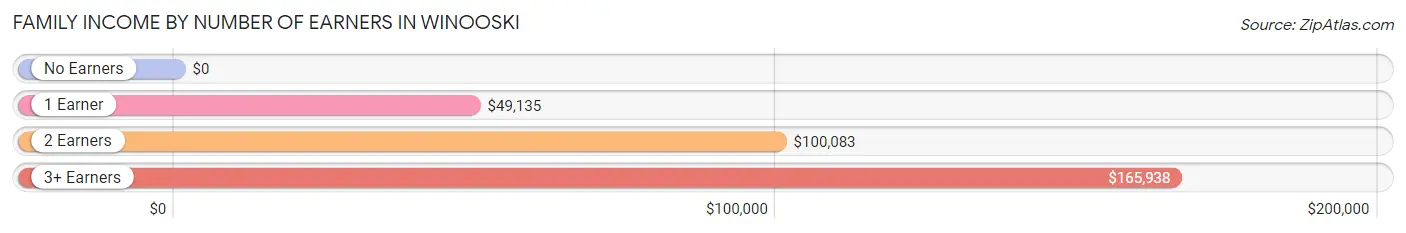
| Number of Earners | # Families | Median Income |
| No Earners | 194 (13.8%) | $0 |
| 1 Earner | 250 (17.8%) | $49,135 |
| 2 Earners | 781 (55.5%) | $100,083 |
| 3+ Earners | 183 (13.0%) | $165,938 |
| Total | 1,408 (100.0%) | $97,870 |
Household Income in Winooski
Household Income Brackets in Winooski
With 745 households falling in the category, the $50,000 to $74,999 income range is the most frequent in Winooski, accounting for 20.2% of all households. In contrast, only 151 households (4.1%) fall into the $150,000 to $199,999 income bracket, making it the least populous group.
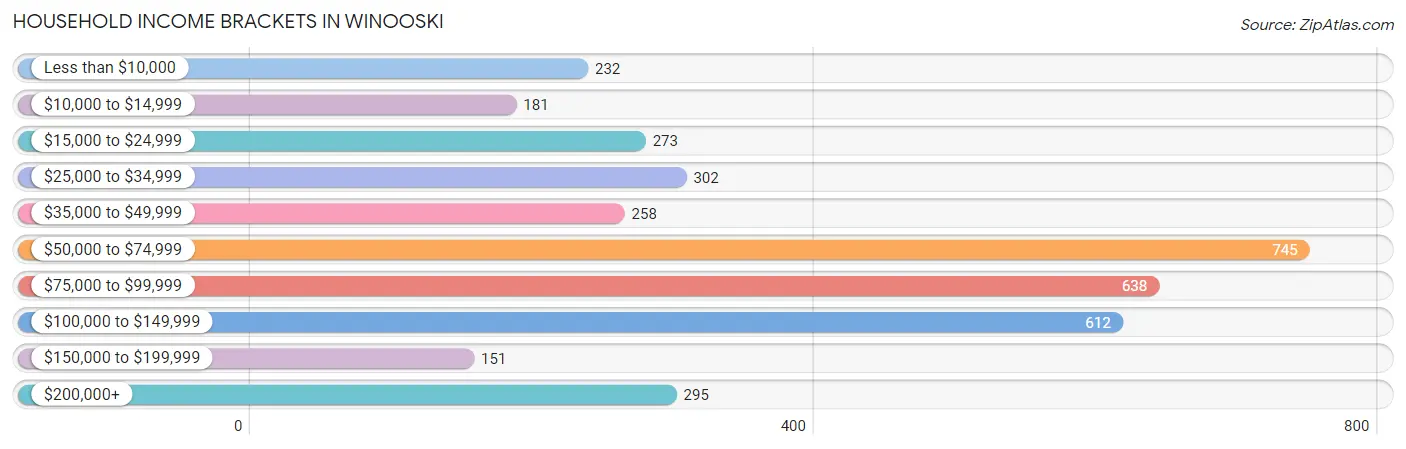
| Income Bracket | # Households | % Households |
| Less than $10,000 | 232 | 6.3% |
| $10,000 to $14,999 | 181 | 4.9% |
| $15,000 to $24,999 | 273 | 7.4% |
| $25,000 to $34,999 | 302 | 8.2% |
| $35,000 to $49,999 | 258 | 7.0% |
| $50,000 to $74,999 | 745 | 20.2% |
| $75,000 to $99,999 | 638 | 17.3% |
| $100,000 to $149,999 | 612 | 16.6% |
| $150,000 to $199,999 | 151 | 4.1% |
| $200,000+ | 295 | 8.0% |
Household Income by Householder Age in Winooski
The median household income in Winooski is $69,783, with the highest median household income of $83,424 found in the 45 to 64 years age bracket for the primary householder. A total of 963 households (26.1%) fall into this category. Meanwhile, the 65+ years age bracket for the primary householder has the lowest median household income of $31,667, with 620 households (16.8%) in this group.
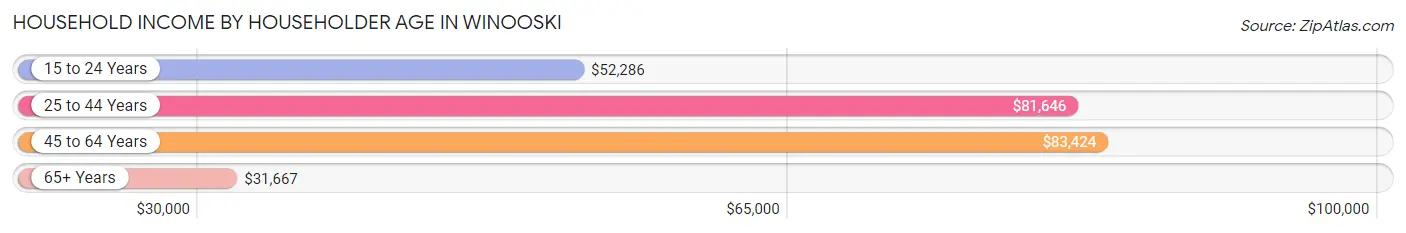
| Income Bracket | # Households | Median Income |
| 15 to 24 Years | 412 (11.2%) | $52,286 |
| 25 to 44 Years | 1,693 (45.9%) | $81,646 |
| 45 to 64 Years | 963 (26.1%) | $83,424 |
| 65+ Years | 620 (16.8%) | $31,667 |
| Total | 3,688 (100.0%) | $69,783 |
Poverty in Winooski
Income Below Poverty by Sex and Age in Winooski
With 18.0% poverty level for males and 20.5% for females among the residents of Winooski, 16 and 17 year old males and 12 to 14 year old females are the most vulnerable to poverty, with 8 males (100.0%) and 58 females (44.6%) in their respective age groups living below the poverty level.
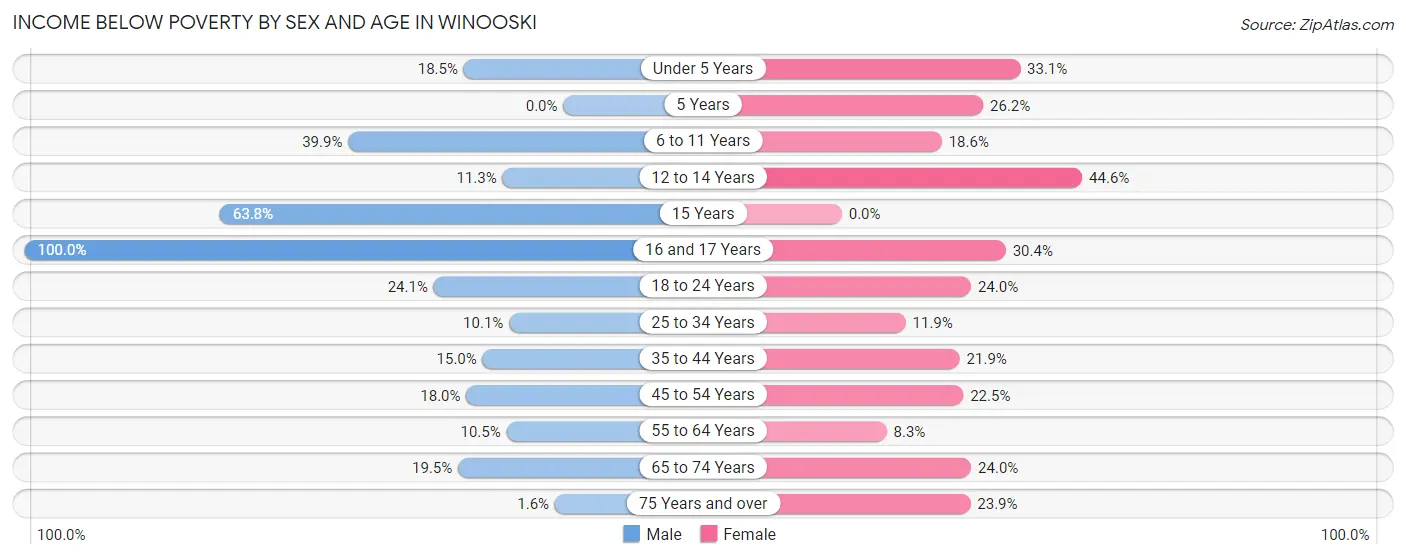
| Age Bracket | Male | Female |
| Under 5 Years | 34 (18.5%) | 47 (33.1%) |
| 5 Years | 0 (0.0%) | 16 (26.2%) |
| 6 to 11 Years | 113 (39.9%) | 23 (18.5%) |
| 12 to 14 Years | 7 (11.3%) | 58 (44.6%) |
| 15 Years | 51 (63.7%) | 0 (0.0%) |
| 16 and 17 Years | 8 (100.0%) | 21 (30.4%) |
| 18 to 24 Years | 230 (24.1%) | 117 (24.0%) |
| 25 to 34 Years | 106 (10.1%) | 89 (11.8%) |
| 35 to 44 Years | 100 (15.0%) | 128 (21.9%) |
| 45 to 54 Years | 83 (18.0%) | 80 (22.5%) |
| 55 to 64 Years | 43 (10.5%) | 28 (8.3%) |
| 65 to 74 Years | 50 (19.5%) | 67 (24.0%) |
| 75 Years and over | 2 (1.6%) | 42 (23.9%) |
| Total | 827 (18.0%) | 716 (20.5%) |
Income Above Poverty by Sex and Age in Winooski
According to the poverty statistics in Winooski, males aged 5 years and females aged 55 to 64 years are the age groups that are most secure financially, with 100.0% of males and 91.7% of females in these age groups living above the poverty line.
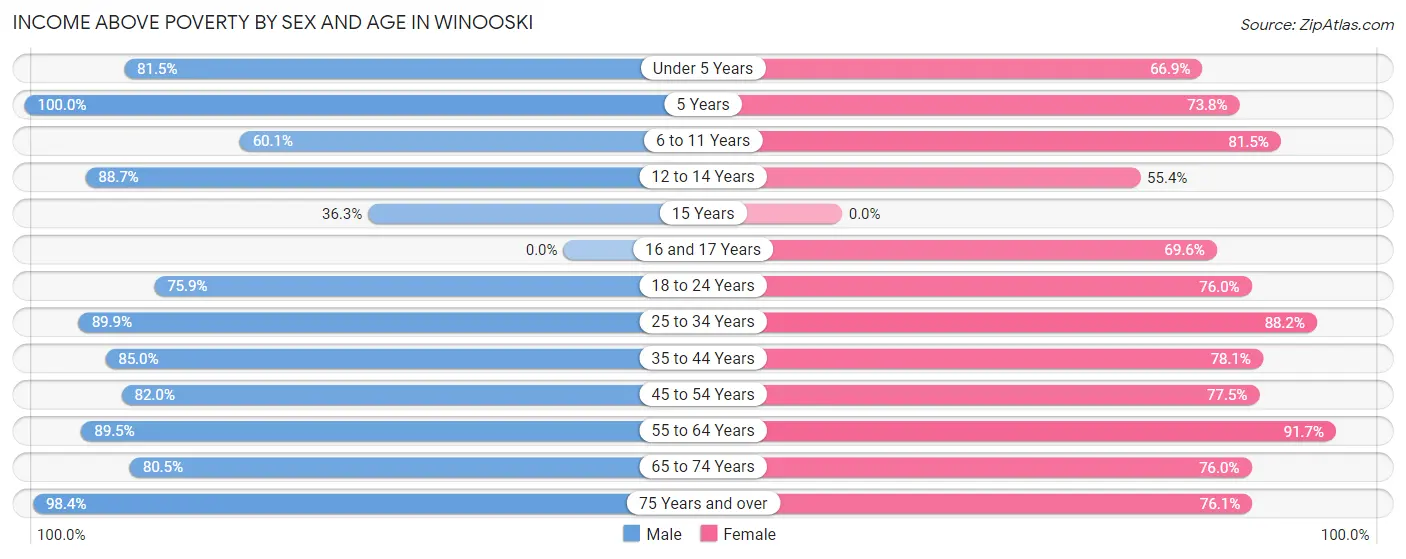
| Age Bracket | Male | Female |
| Under 5 Years | 150 (81.5%) | 95 (66.9%) |
| 5 Years | 48 (100.0%) | 45 (73.8%) |
| 6 to 11 Years | 170 (60.1%) | 101 (81.5%) |
| 12 to 14 Years | 55 (88.7%) | 72 (55.4%) |
| 15 Years | 29 (36.2%) | 0 (0.0%) |
| 16 and 17 Years | 0 (0.0%) | 48 (69.6%) |
| 18 to 24 Years | 726 (75.9%) | 371 (76.0%) |
| 25 to 34 Years | 948 (89.9%) | 662 (88.1%) |
| 35 to 44 Years | 567 (85.0%) | 457 (78.1%) |
| 45 to 54 Years | 378 (82.0%) | 275 (77.5%) |
| 55 to 64 Years | 365 (89.5%) | 309 (91.7%) |
| 65 to 74 Years | 206 (80.5%) | 212 (76.0%) |
| 75 Years and over | 126 (98.4%) | 134 (76.1%) |
| Total | 3,768 (82.0%) | 2,781 (79.5%) |
Income Below Poverty Among Married-Couple Families in Winooski
The poverty statistics for married-couple families in Winooski show that 14.1% or 146 of the total 1,036 families live below the poverty line. Families with 5 or more children have the highest poverty rate of 75.0%, comprising of 12 families. On the other hand, families with 3 or 4 children have the lowest poverty rate of 0.0%, which includes 0 families.
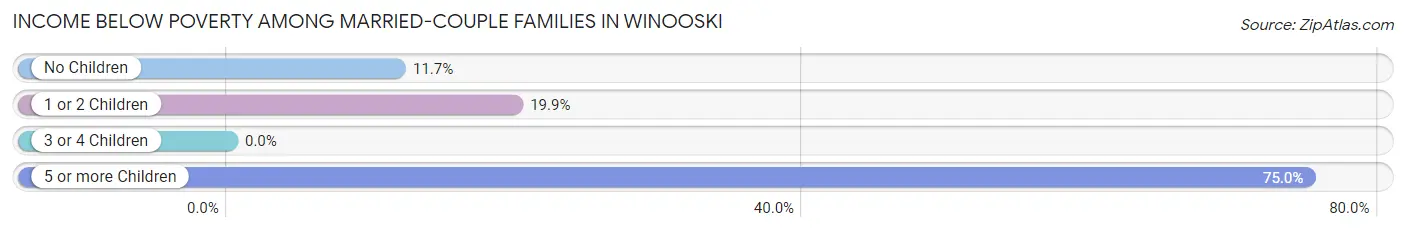
| Children | Above Poverty | Below Poverty |
| No Children | 581 (88.3%) | 77 (11.7%) |
| 1 or 2 Children | 230 (80.1%) | 57 (19.9%) |
| 3 or 4 Children | 75 (100.0%) | 0 (0.0%) |
| 5 or more Children | 4 (25.0%) | 12 (75.0%) |
| Total | 890 (85.9%) | 146 (14.1%) |
Income Below Poverty Among Single-Parent Households in Winooski
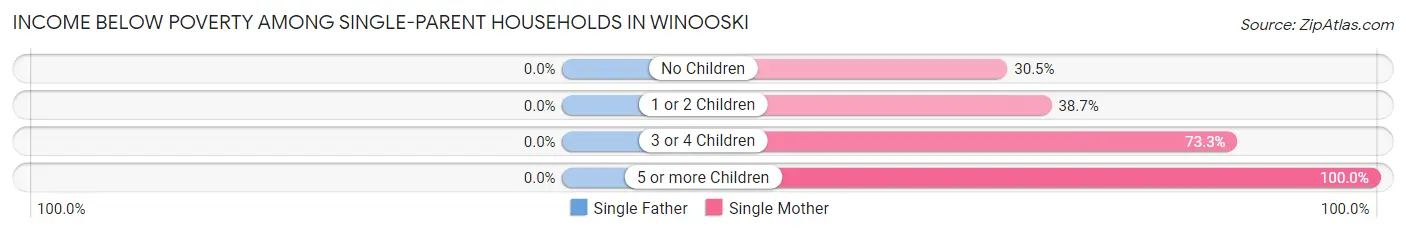
| Children | Single Father | Single Mother |
| No Children | 0 (0.0%) | 25 (30.5%) |
| 1 or 2 Children | 0 (0.0%) | 24 (38.7%) |
| 3 or 4 Children | 0 (0.0%) | 11 (73.3%) |
| 5 or more Children | 0 (0.0%) | 21 (100.0%) |
| Total | 0 (0.0%) | 81 (45.0%) |
Income Below Poverty Among Married-Couple vs Single-Parent Households in Winooski
The poverty data for Winooski shows that 146 of the married-couple family households (14.1%) and 81 of the single-parent households (21.8%) are living below the poverty level. Within the married-couple family households, those with 5 or more children have the highest poverty rate, with 12 households (75.0%) falling below the poverty line. Among the single-parent households, those with 5 or more children have the highest poverty rate, with 21 household (100.0%) living below poverty.
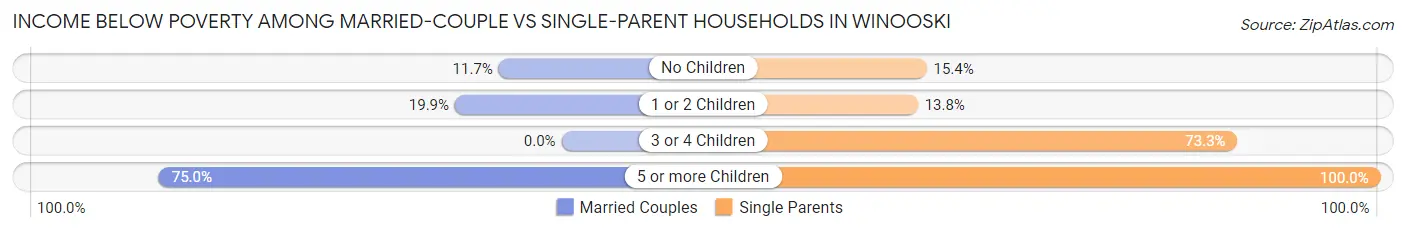
| Children | Married-Couple Families | Single-Parent Households |
| No Children | 77 (11.7%) | 25 (15.4%) |
| 1 or 2 Children | 57 (19.9%) | 24 (13.8%) |
| 3 or 4 Children | 0 (0.0%) | 11 (73.3%) |
| 5 or more Children | 12 (75.0%) | 21 (100.0%) |
| Total | 146 (14.1%) | 81 (21.8%) |
Race in Winooski
The most populous races in Winooski are White / Caucasian (6,602 | 81.3%), Asian (917 | 11.3%), and Black / African American (395 | 4.9%).
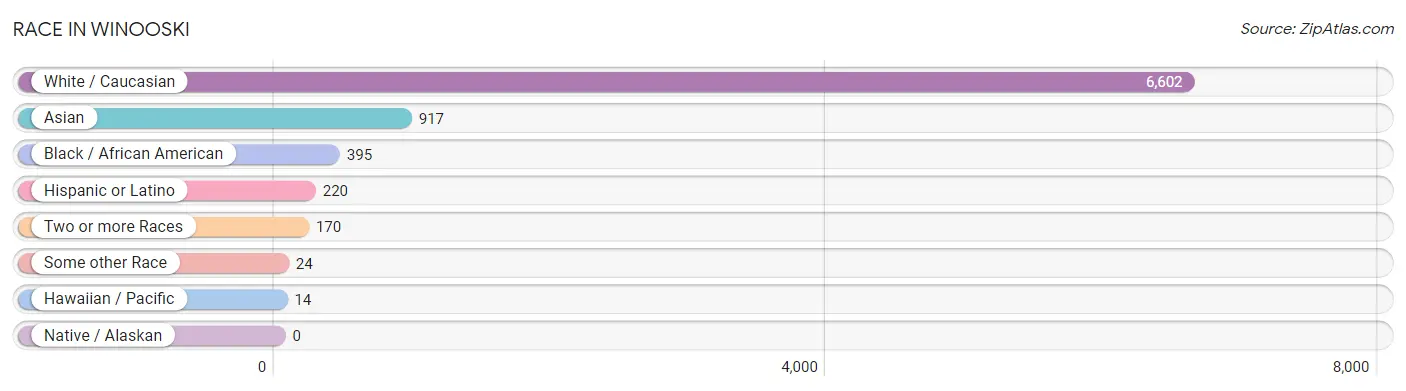
| Race | # Population | % Population |
| Asian | 917 | 11.3% |
| Black / African American | 395 | 4.9% |
| Hawaiian / Pacific | 14 | 0.2% |
| Hispanic or Latino | 220 | 2.7% |
| Native / Alaskan | 0 | 0.0% |
| White / Caucasian | 6,602 | 81.3% |
| Two or more Races | 170 | 2.1% |
| Some other Race | 24 | 0.3% |
| Total | 8,122 | 100.0% |
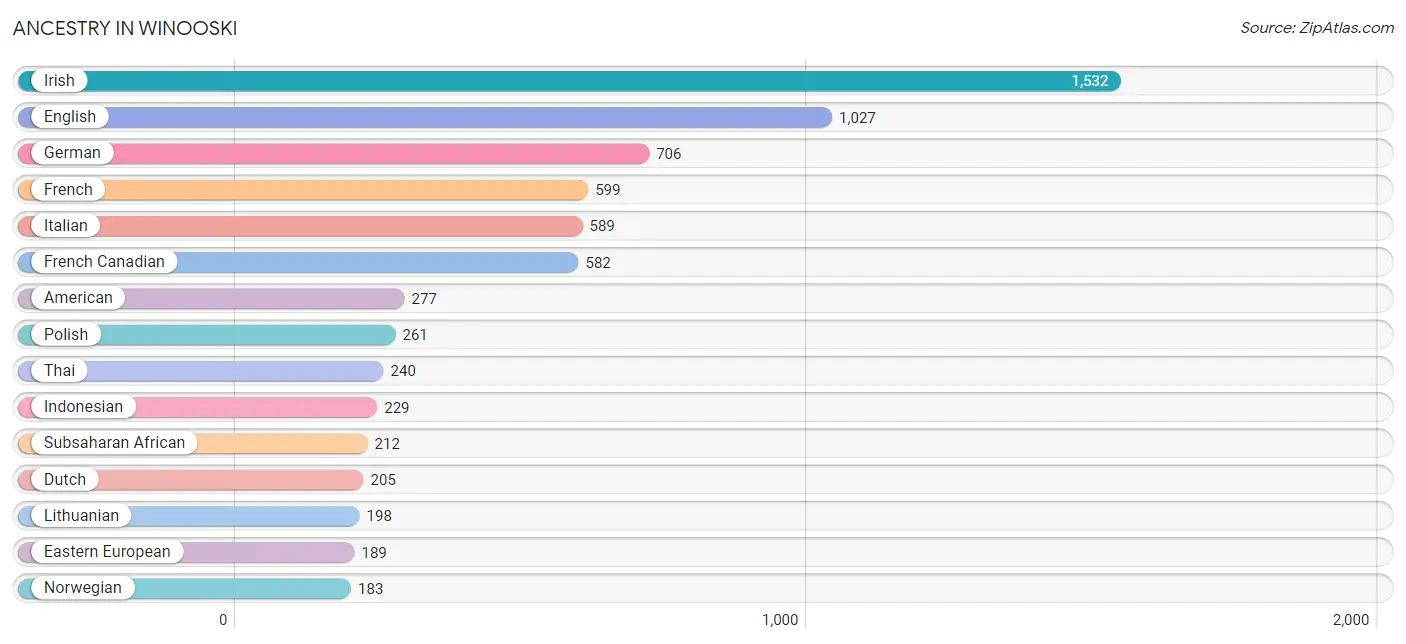
Ancestry in Winooski
The most populous ancestries reported in Winooski are Irish (1,532 | 18.9%), English (1,027 | 12.6%), German (706 | 8.7%), French (599 | 7.4%), and Italian (589 | 7.2%), together accounting for 54.8% of all Winooski residents.
| Ancestry | # Population | % Population |
| African | 10 | 0.1% |
| American | 277 | 3.4% |
| Arab | 39 | 0.5% |
| Bhutanese | 18 | 0.2% |
| British | 41 | 0.5% |
| Canadian | 36 | 0.4% |
| Central American | 23 | 0.3% |
| Cherokee | 3 | 0.0% |
| Croatian | 23 | 0.3% |
| Czech | 57 | 0.7% |
| Dutch | 205 | 2.5% |
| Eastern European | 189 | 2.3% |
| English | 1,027 | 12.6% |
| European | 152 | 1.9% |
| Finnish | 7 | 0.1% |
| French | 599 | 7.4% |
| French American Indian | 5 | 0.1% |
| French Canadian | 582 | 7.2% |
| German | 706 | 8.7% |
| Greek | 117 | 1.4% |
| Hungarian | 1 | 0.0% |
| Indian (Asian) | 16 | 0.2% |
| Indonesian | 229 | 2.8% |
| Iraqi | 20 | 0.3% |
| Irish | 1,532 | 18.9% |
| Italian | 589 | 7.2% |
| Jamaican | 13 | 0.2% |
| Korean | 73 | 0.9% |
| Lebanese | 10 | 0.1% |
| Lithuanian | 198 | 2.4% |
| Mexican | 63 | 0.8% |
| Nicaraguan | 23 | 0.3% |
| Nigerian | 7 | 0.1% |
| Northern European | 75 | 0.9% |
| Norwegian | 183 | 2.2% |
| Polish | 261 | 3.2% |
| Portuguese | 12 | 0.2% |
| Puerto Rican | 52 | 0.6% |
| Romanian | 39 | 0.5% |
| Russian | 174 | 2.1% |
| Samoan | 14 | 0.2% |
| Scotch-Irish | 16 | 0.2% |
| Scottish | 141 | 1.7% |
| Slovak | 175 | 2.1% |
| Slovene | 12 | 0.2% |
| Somali | 134 | 1.7% |
| South American | 31 | 0.4% |
| Spanish | 15 | 0.2% |
| Sri Lankan | 102 | 1.3% |
| Subsaharan African | 212 | 2.6% |
| Swedish | 69 | 0.9% |
| Syrian | 9 | 0.1% |
| Thai | 240 | 2.9% |
| Ukrainian | 21 | 0.3% |
| Venezuelan | 31 | 0.4% |
| Welsh | 33 | 0.4% | View All 56 Rows |
Immigrants in Winooski
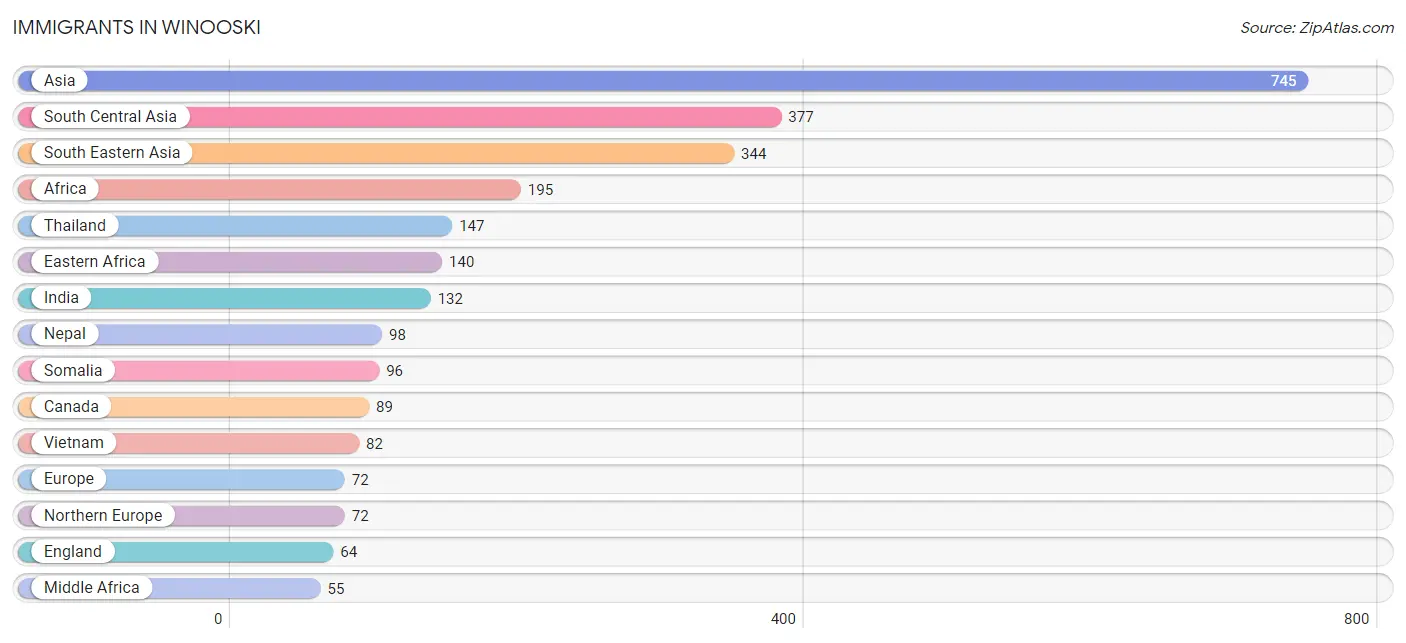
The most numerous immigrant groups reported in Winooski came from Asia (745 | 9.2%), South Central Asia (377 | 4.6%), South Eastern Asia (344 | 4.2%), Africa (195 | 2.4%), and Thailand (147 | 1.8%), together accounting for 22.3% of all Winooski residents.
| Immigration Origin | # Population | % Population |
| Africa | 195 | 2.4% |
| Asia | 745 | 9.2% |
| Canada | 89 | 1.1% |
| Caribbean | 13 | 0.2% |
| Central America | 2 | 0.0% |
| Eastern Africa | 140 | 1.7% |
| Eastern Asia | 4 | 0.1% |
| England | 64 | 0.8% |
| Europe | 72 | 0.9% |
| India | 132 | 1.6% |
| Iraq | 20 | 0.3% |
| Jamaica | 13 | 0.2% |
| Kenya | 38 | 0.5% |
| Korea | 4 | 0.1% |
| Latin America | 15 | 0.2% |
| Middle Africa | 55 | 0.7% |
| Nepal | 98 | 1.2% |
| Nicaragua | 2 | 0.0% |
| Northern Europe | 72 | 0.9% |
| Philippines | 33 | 0.4% |
| Somalia | 96 | 1.2% |
| South Central Asia | 377 | 4.6% |
| South Eastern Asia | 344 | 4.2% |
| Thailand | 147 | 1.8% |
| Vietnam | 82 | 1.0% |
| Western Asia | 20 | 0.3% |
| Zaire | 55 | 0.7% | View All 27 Rows |
Sex and Age in Winooski
Sex and Age in Winooski
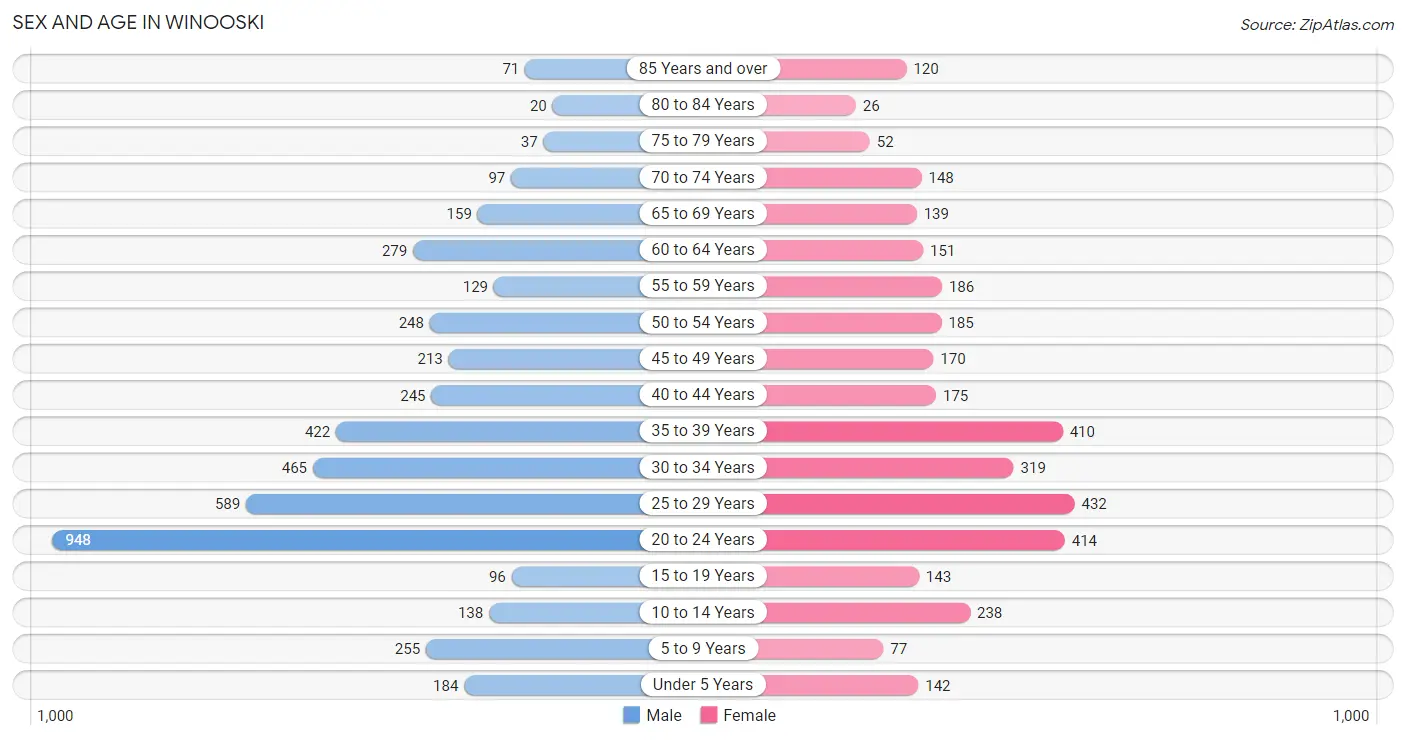
The most populous age groups in Winooski are 20 to 24 Years (948 | 20.6%) for men and 25 to 29 Years (432 | 12.2%) for women.
| Age Bracket | Male | Female |
| Under 5 Years | 184 (4.0%) | 142 (4.0%) |
| 5 to 9 Years | 255 (5.6%) | 77 (2.2%) |
| 10 to 14 Years | 138 (3.0%) | 238 (6.8%) |
| 15 to 19 Years | 96 (2.1%) | 143 (4.1%) |
| 20 to 24 Years | 948 (20.6%) | 414 (11.7%) |
| 25 to 29 Years | 589 (12.8%) | 432 (12.2%) |
| 30 to 34 Years | 465 (10.1%) | 319 (9.0%) |
| 35 to 39 Years | 422 (9.2%) | 410 (11.6%) |
| 40 to 44 Years | 245 (5.3%) | 175 (5.0%) |
| 45 to 49 Years | 213 (4.6%) | 170 (4.8%) |
| 50 to 54 Years | 248 (5.4%) | 185 (5.2%) |
| 55 to 59 Years | 129 (2.8%) | 186 (5.3%) |
| 60 to 64 Years | 279 (6.1%) | 151 (4.3%) |
| 65 to 69 Years | 159 (3.5%) | 139 (3.9%) |
| 70 to 74 Years | 97 (2.1%) | 148 (4.2%) |
| 75 to 79 Years | 37 (0.8%) | 52 (1.5%) |
| 80 to 84 Years | 20 (0.4%) | 26 (0.7%) |
| 85 Years and over | 71 (1.5%) | 120 (3.4%) |
| Total | 4,595 (100.0%) | 3,527 (100.0%) |
Families and Households in Winooski
Median Family Size in Winooski
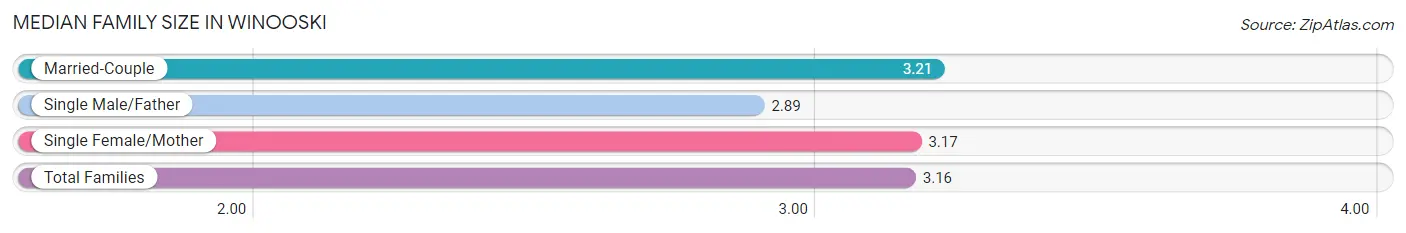
The median family size in Winooski is 3.16 persons per family, with married-couple families (1,036 | 73.6%) accounting for the largest median family size of 3.21 persons per family. On the other hand, single male/father families (192 | 13.6%) represent the smallest median family size with 2.89 persons per family.
| Family Type | # Families | Family Size |
| Married-Couple | 1,036 (73.6%) | 3.21 |
| Single Male/Father | 192 (13.6%) | 2.89 |
| Single Female/Mother | 180 (12.8%) | 3.17 |
| Total Families | 1,408 (100.0%) | 3.16 |
Median Household Size in Winooski
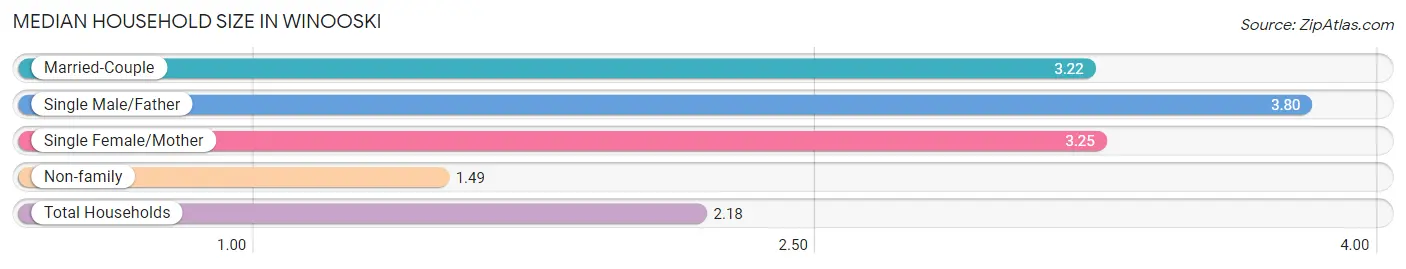
The median household size in Winooski is 2.18 persons per household, with single male/father households (192 | 5.2%) accounting for the largest median household size of 3.8 persons per household. non-family households (2,280 | 61.8%) represent the smallest median household size with 1.49 persons per household.
| Household Type | # Households | Household Size |
| Married-Couple | 1,036 (28.1%) | 3.22 |
| Single Male/Father | 192 (5.2%) | 3.80 |
| Single Female/Mother | 180 (4.9%) | 3.25 |
| Non-family | 2,280 (61.8%) | 1.49 |
| Total Households | 3,688 (100.0%) | 2.18 |
Household Size by Marriage Status in Winooski
Out of a total of 3,688 households in Winooski, 1,408 (38.2%) are family households, while 2,280 (61.8%) are nonfamily households. The most numerous type of family households are 2-person households, comprising 638, and the most common type of nonfamily households are 1-person households, comprising 1,462.
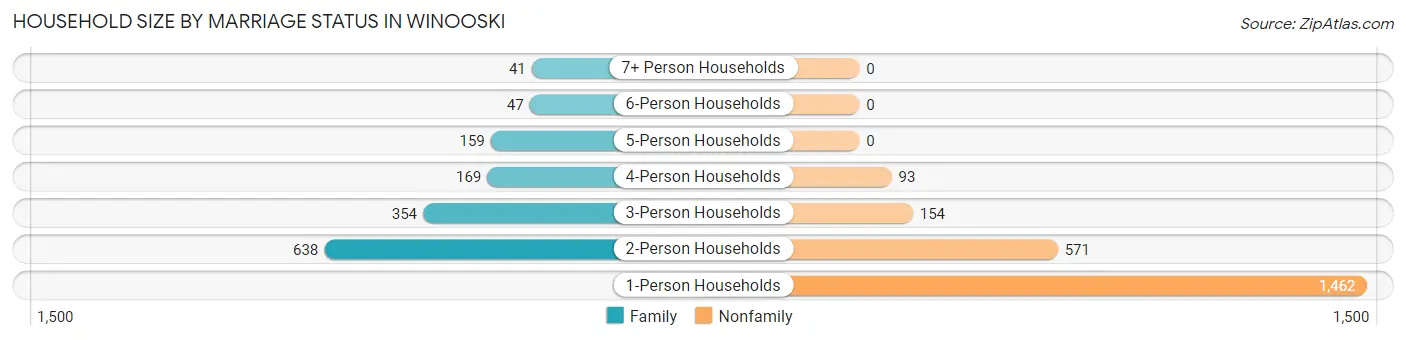
| Household Size | Family Households | Nonfamily Households |
| 1-Person Households | - | 1,462 (39.6%) |
| 2-Person Households | 638 (17.3%) | 571 (15.5%) |
| 3-Person Households | 354 (9.6%) | 154 (4.2%) |
| 4-Person Households | 169 (4.6%) | 93 (2.5%) |
| 5-Person Households | 159 (4.3%) | 0 (0.0%) |
| 6-Person Households | 47 (1.3%) | 0 (0.0%) |
| 7+ Person Households | 41 (1.1%) | 0 (0.0%) |
| Total | 1,408 (38.2%) | 2,280 (61.8%) |
Female Fertility in Winooski
Fertility by Age in Winooski
Average fertility rate in Winooski is 47.0 births per 1,000 women. Women in the age bracket of 35 to 50 years have the highest fertility rate with 70.0 births per 1,000 women. Women in the age bracket of 35 to 50 years acount for 56.6% of all women with births.
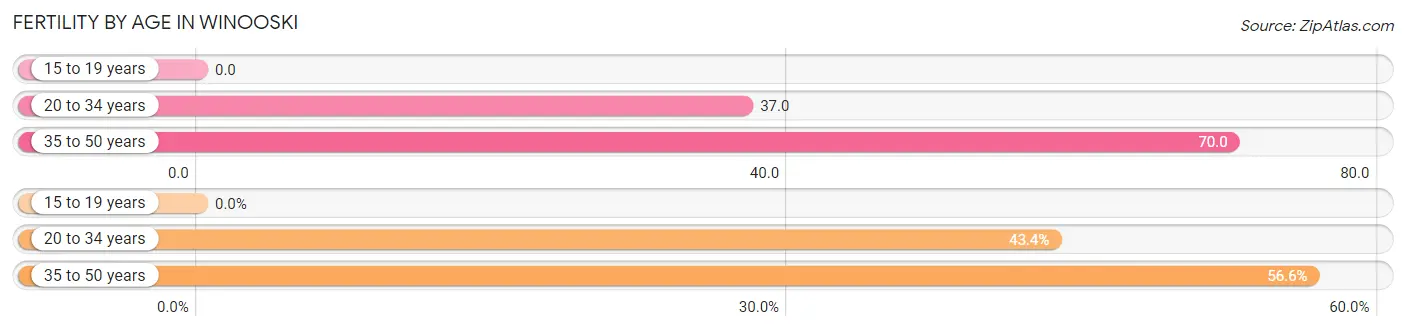
| Age Bracket | Women with Births | Births / 1,000 Women |
| 15 to 19 years | 0 (0.0%) | 0.0 |
| 20 to 34 years | 43 (43.4%) | 37.0 |
| 35 to 50 years | 56 (56.6%) | 70.0 |
| Total | 99 (100.0%) | 47.0 |
Fertility by Age by Marriage Status in Winooski
84.8% of women with births (99) in Winooski are married. The highest percentage of unmarried women with births falls into 35 to 50 years age bracket with 26.8% of them unmarried at the time of birth, while the lowest percentage of unmarried women with births belong to 20 to 34 years age bracket with 0.0% of them unmarried.
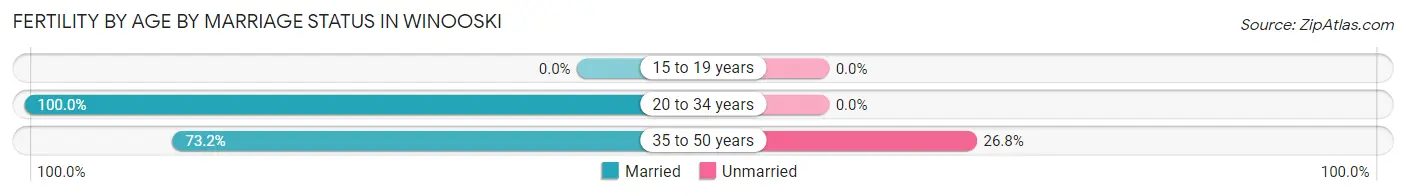
| Age Bracket | Married | Unmarried |
| 15 to 19 years | 0 (0.0%) | 0 (0.0%) |
| 20 to 34 years | 43 (100.0%) | 0 (0.0%) |
| 35 to 50 years | 41 (73.2%) | 15 (26.8%) |
| Total | 84 (84.9%) | 15 (15.1%) |
Fertility by Education in Winooski
Average fertility rate in Winooski is 47.0 births per 1,000 women. Women with the education attainment of high school diploma have the highest fertility rate of 123.0 births per 1,000 women, while women with the education attainment of bachelor's degree have the lowest fertility at 26.0 births per 1,000 women. Women with the education attainment of high school diploma represent 24.2% of all women with births.
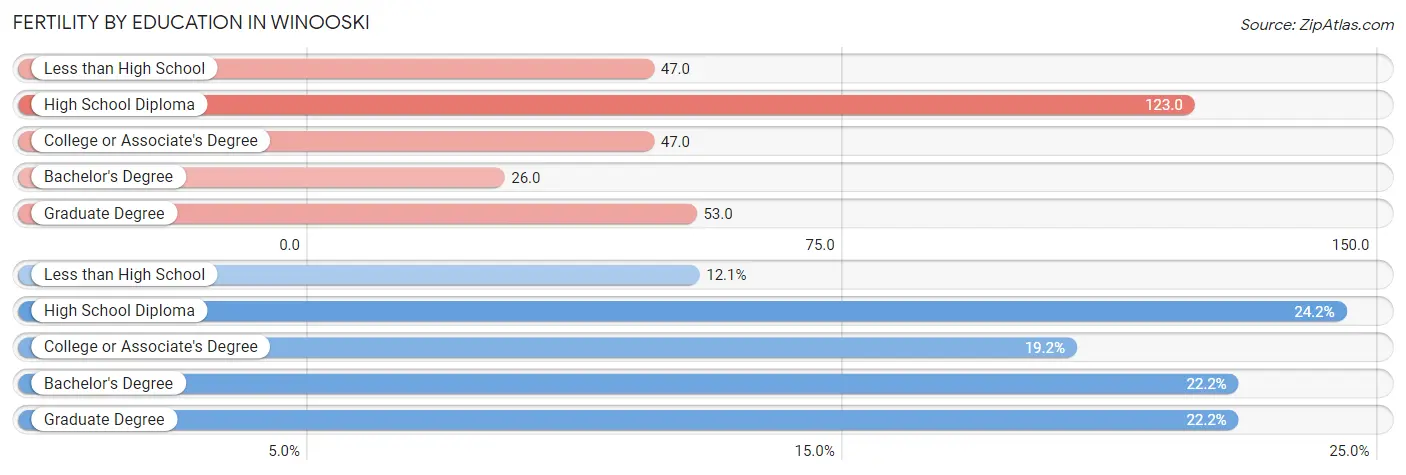
| Educational Attainment | Women with Births | Births / 1,000 Women |
| Less than High School | 12 (12.1%) | 47.0 |
| High School Diploma | 24 (24.2%) | 123.0 |
| College or Associate's Degree | 19 (19.2%) | 47.0 |
| Bachelor's Degree | 22 (22.2%) | 26.0 |
| Graduate Degree | 22 (22.2%) | 53.0 |
| Total | 99 (100.0%) | 47.0 |
Fertility by Education by Marriage Status in Winooski
15.1% of women with births in Winooski are unmarried. Women with the educational attainment of less than high school are most likely to be married with 100.0% of them married at childbirth, while women with the educational attainment of graduate degree are least likely to be married with 68.2% of them unmarried at childbirth.
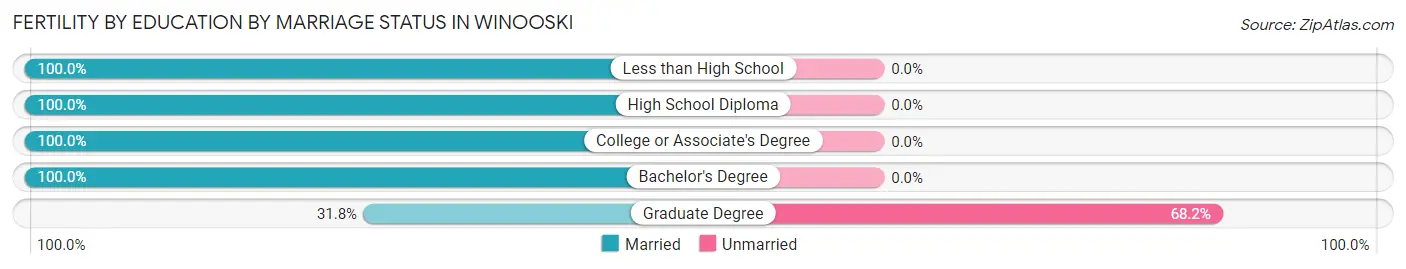
| Educational Attainment | Married | Unmarried |
| Less than High School | 12 (100.0%) | 0 (0.0%) |
| High School Diploma | 24 (100.0%) | 0 (0.0%) |
| College or Associate's Degree | 19 (100.0%) | 0 (0.0%) |
| Bachelor's Degree | 22 (100.0%) | 0 (0.0%) |
| Graduate Degree | 7 (31.8%) | 15 (68.2%) |
| Total | 84 (84.9%) | 15 (15.1%) |
Employment Characteristics in Winooski
Employment by Class of Employer in Winooski
Among the 5,295 employed individuals in Winooski, private company employees (3,323 | 62.8%), not-for-profit organizations (935 | 17.7%), and local government employees (521 | 9.8%) make up the most common classes of employment.
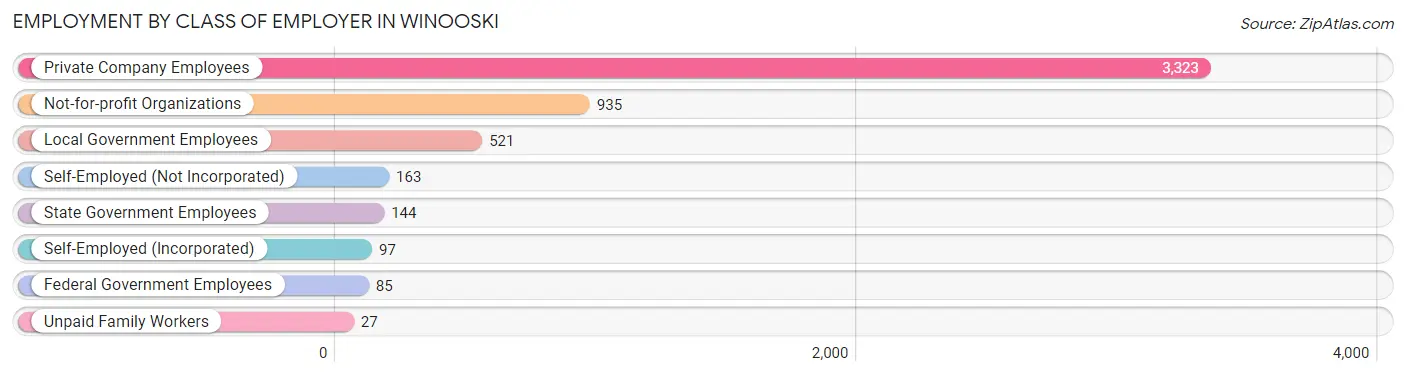
| Employer Class | # Employees | % Employees |
| Private Company Employees | 3,323 | 62.8% |
| Self-Employed (Incorporated) | 97 | 1.8% |
| Self-Employed (Not Incorporated) | 163 | 3.1% |
| Not-for-profit Organizations | 935 | 17.7% |
| Local Government Employees | 521 | 9.8% |
| State Government Employees | 144 | 2.7% |
| Federal Government Employees | 85 | 1.6% |
| Unpaid Family Workers | 27 | 0.5% |
| Total | 5,295 | 100.0% |
Employment Status by Age in Winooski
According to the labor force statistics for Winooski, out of the total population over 16 years of age (7,008), 77.8% or 5,452 individuals are in the labor force, with 1.9% or 104 of them unemployed. The age group with the highest labor force participation rate is 20 to 24 years, with 97.3% or 1,325 individuals in the labor force. Within the labor force, the 45 to 54 years age range has the highest percentage of unemployed individuals, with 8.5% or 58 of them being unemployed.
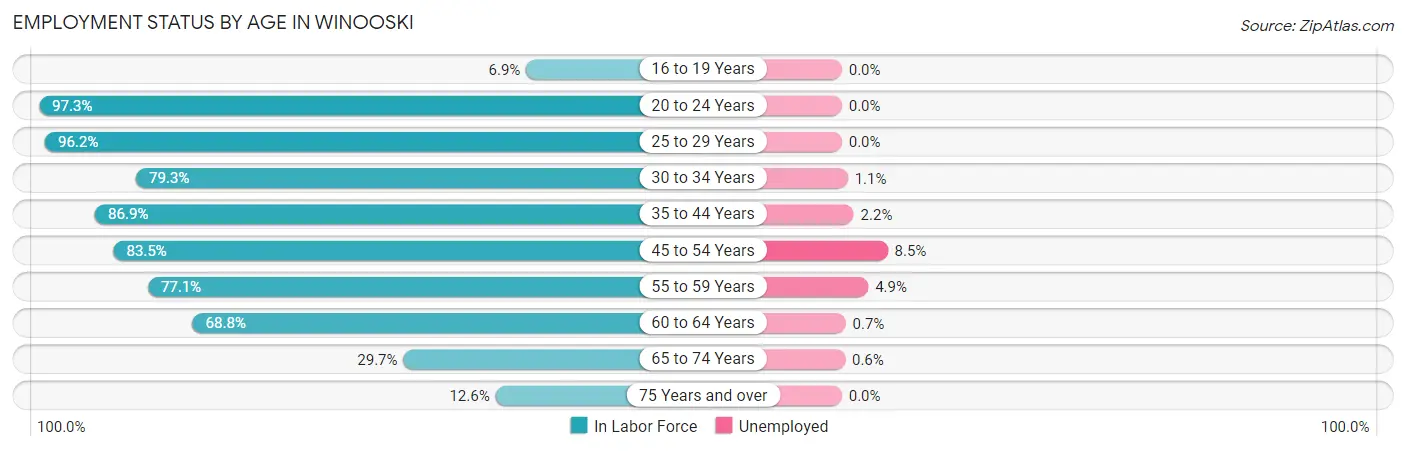
| Age Bracket | In Labor Force | Unemployed |
| 16 to 19 Years | 11 (6.9%) | 0 (0.0%) |
| 20 to 24 Years | 1,325 (97.3%) | 0 (0.0%) |
| 25 to 29 Years | 982 (96.2%) | 0 (0.0%) |
| 30 to 34 Years | 622 (79.3%) | 7 (1.1%) |
| 35 to 44 Years | 1,088 (86.9%) | 24 (2.2%) |
| 45 to 54 Years | 681 (83.5%) | 58 (8.5%) |
| 55 to 59 Years | 243 (77.1%) | 12 (4.9%) |
| 60 to 64 Years | 296 (68.8%) | 2 (0.7%) |
| 65 to 74 Years | 161 (29.7%) | 1 (0.6%) |
| 75 Years and over | 41 (12.6%) | 0 (0.0%) |
| Total | 5,452 (77.8%) | 104 (1.9%) |
Employment Status by Educational Attainment in Winooski
According to labor force statistics for Winooski, 84.7% of individuals (3,911) out of the total population between 25 and 64 years of age (4,618) are in the labor force, with 2.6% or 102 of them being unemployed. The group with the highest labor force participation rate are those with the educational attainment of bachelor's degree or higher, with 90.1% or 2,433 individuals in the labor force. Within the labor force, individuals with high school diploma education have the highest percentage of unemployment, with 15.6% or 72 of them being unemployed.
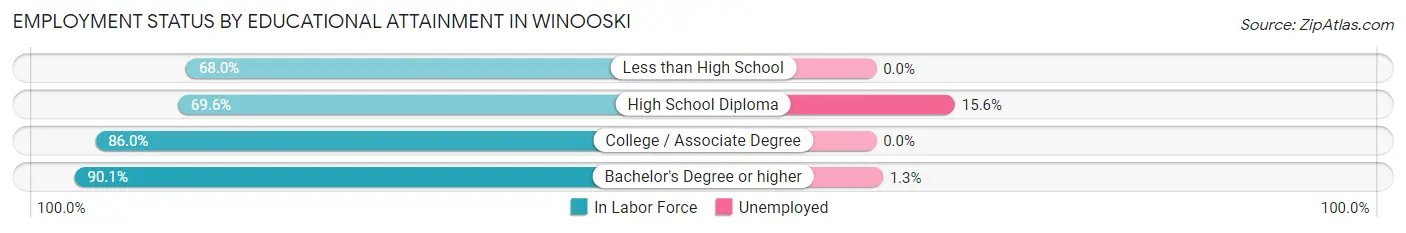
| Educational Attainment | In Labor Force | Unemployed |
| Less than High School | 234 (68.0%) | 0 (0.0%) |
| High School Diploma | 461 (69.6%) | 103 (15.6%) |
| College / Associate Degree | 784 (86.0%) | 0 (0.0%) |
| Bachelor's Degree or higher | 2,433 (90.1%) | 35 (1.3%) |
| Total | 3,911 (84.7%) | 120 (2.6%) |
Employment Occupations by Sex in Winooski
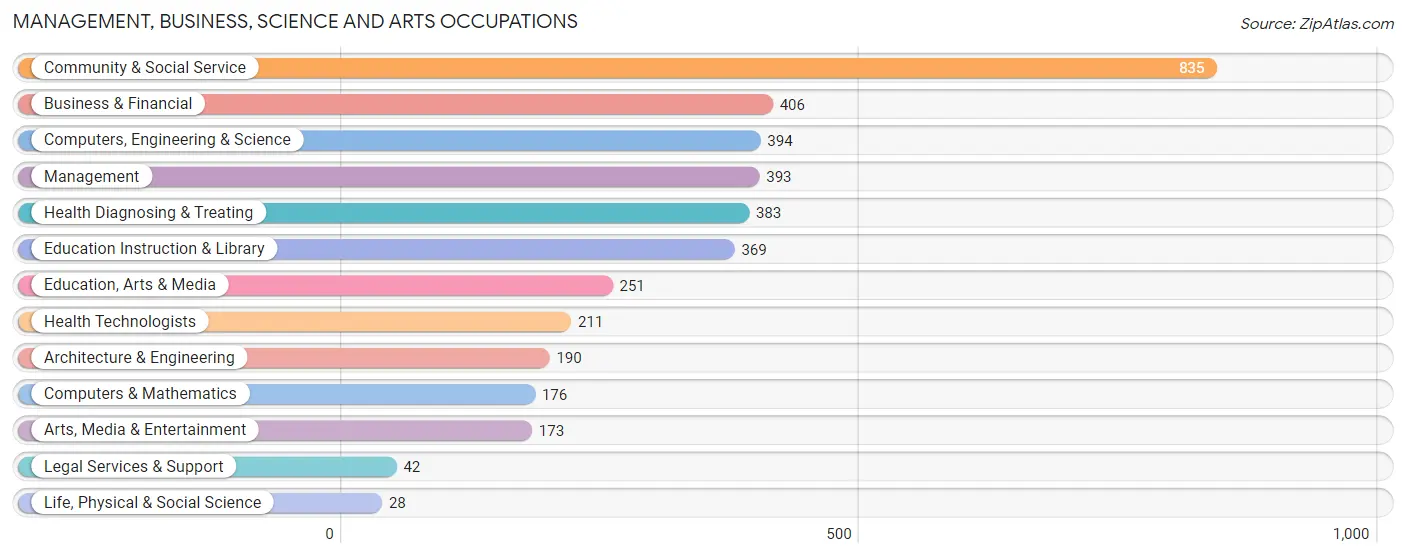
Management, Business, Science and Arts Occupations
The most common Management, Business, Science and Arts occupations in Winooski are Community & Social Service (835 | 15.6%), Business & Financial (406 | 7.6%), Computers, Engineering & Science (394 | 7.4%), Management (393 | 7.3%), and Health Diagnosing & Treating (383 | 7.2%).
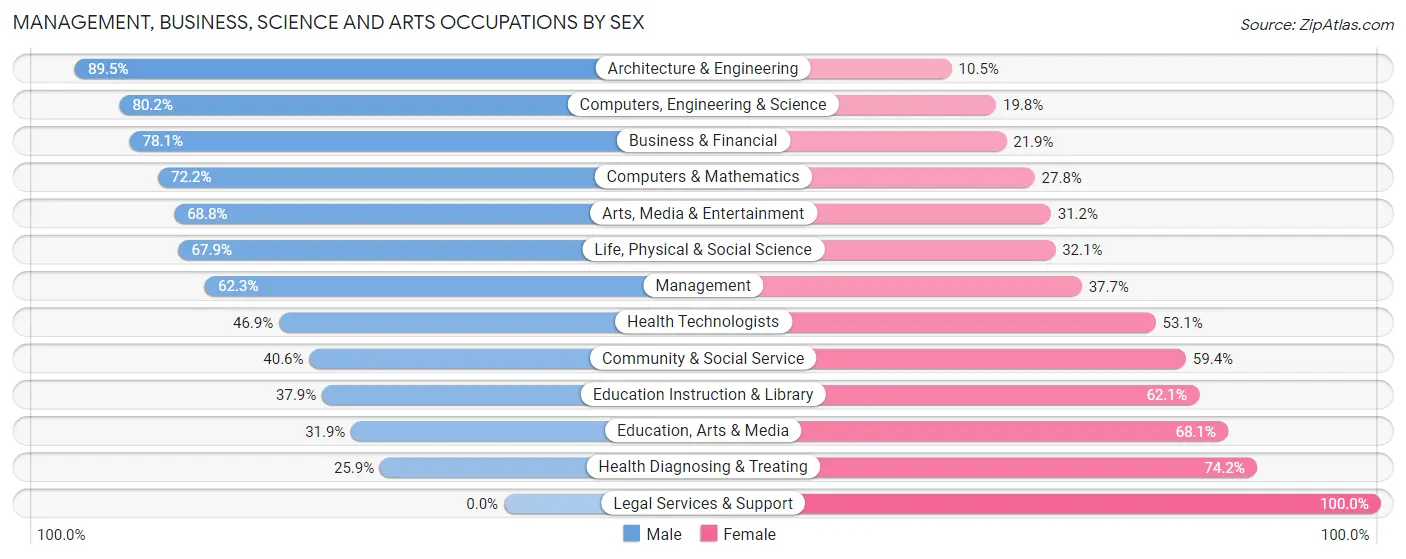
Management, Business, Science and Arts Occupations by Sex
Within the Management, Business, Science and Arts occupations in Winooski, the most male-oriented occupations are Architecture & Engineering (89.5%), Computers, Engineering & Science (80.2%), and Business & Financial (78.1%), while the most female-oriented occupations are Legal Services & Support (100.0%), Health Diagnosing & Treating (74.2%), and Education, Arts & Media (68.1%).
| Occupation | Male | Female |
| Management | 245 (62.3%) | 148 (37.7%) |
| Business & Financial | 317 (78.1%) | 89 (21.9%) |
| Computers, Engineering & Science | 316 (80.2%) | 78 (19.8%) |
| Computers & Mathematics | 127 (72.2%) | 49 (27.8%) |
| Architecture & Engineering | 170 (89.5%) | 20 (10.5%) |
| Life, Physical & Social Science | 19 (67.9%) | 9 (32.1%) |
| Community & Social Service | 339 (40.6%) | 496 (59.4%) |
| Education, Arts & Media | 80 (31.9%) | 171 (68.1%) |
| Legal Services & Support | 0 (0.0%) | 42 (100.0%) |
| Education Instruction & Library | 140 (37.9%) | 229 (62.1%) |
| Arts, Media & Entertainment | 119 (68.8%) | 54 (31.2%) |
| Health Diagnosing & Treating | 99 (25.9%) | 284 (74.2%) |
| Health Technologists | 99 (46.9%) | 112 (53.1%) |
| Total (Category) | 1,316 (54.6%) | 1,095 (45.4%) |
| Total (Overall) | 3,204 (59.9%) | 2,142 (40.1%) |
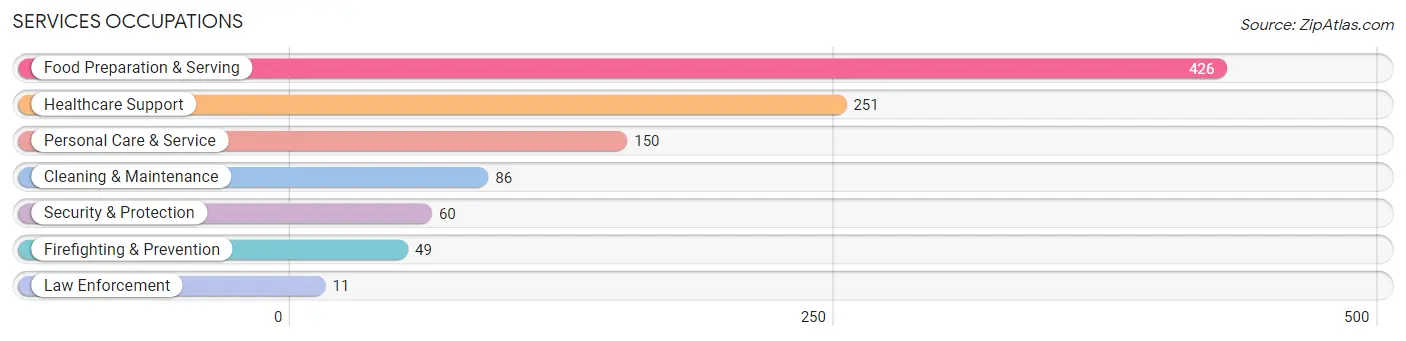
Services Occupations
The most common Services occupations in Winooski are Food Preparation & Serving (426 | 8.0%), Healthcare Support (251 | 4.7%), Personal Care & Service (150 | 2.8%), Cleaning & Maintenance (86 | 1.6%), and Security & Protection (60 | 1.1%).
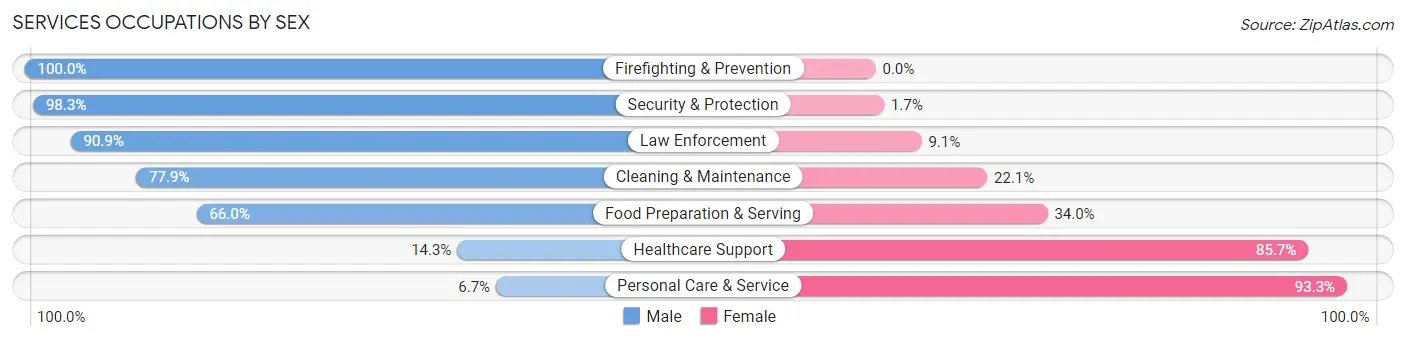
Services Occupations by Sex
Within the Services occupations in Winooski, the most male-oriented occupations are Firefighting & Prevention (100.0%), Security & Protection (98.3%), and Law Enforcement (90.9%), while the most female-oriented occupations are Personal Care & Service (93.3%), Healthcare Support (85.7%), and Food Preparation & Serving (34.0%).
| Occupation | Male | Female |
| Healthcare Support | 36 (14.3%) | 215 (85.7%) |
| Security & Protection | 59 (98.3%) | 1 (1.7%) |
| Firefighting & Prevention | 49 (100.0%) | 0 (0.0%) |
| Law Enforcement | 10 (90.9%) | 1 (9.1%) |
| Food Preparation & Serving | 281 (66.0%) | 145 (34.0%) |
| Cleaning & Maintenance | 67 (77.9%) | 19 (22.1%) |
| Personal Care & Service | 10 (6.7%) | 140 (93.3%) |
| Total (Category) | 453 (46.6%) | 520 (53.4%) |
| Total (Overall) | 3,204 (59.9%) | 2,142 (40.1%) |
Sales and Office Occupations
The most common Sales and Office occupations in Winooski are Office & Administration (623 | 11.7%), and Sales & Related (544 | 10.2%).
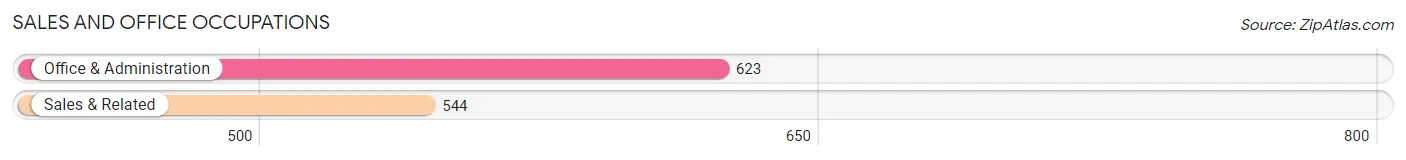
Sales and Office Occupations by Sex

| Occupation | Male | Female |
| Sales & Related | 442 (81.2%) | 102 (18.8%) |
| Office & Administration | 371 (59.6%) | 252 (40.5%) |
| Total (Category) | 813 (69.7%) | 354 (30.3%) |
| Total (Overall) | 3,204 (59.9%) | 2,142 (40.1%) |
Natural Resources, Construction and Maintenance Occupations
The most common Natural Resources, Construction and Maintenance occupations in Winooski are Construction & Extraction (110 | 2.1%), and Installation, Maintenance & Repair (12 | 0.2%).
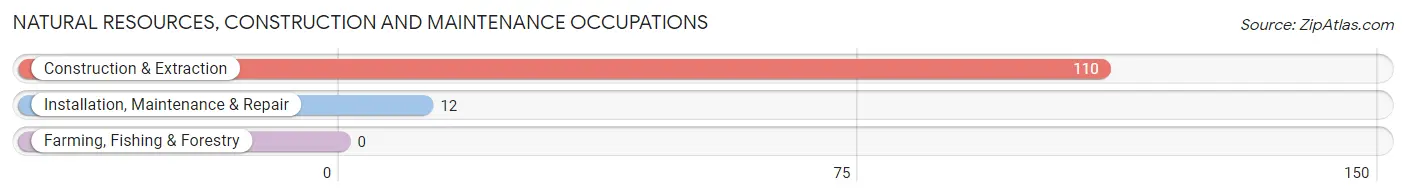
Natural Resources, Construction and Maintenance Occupations by Sex
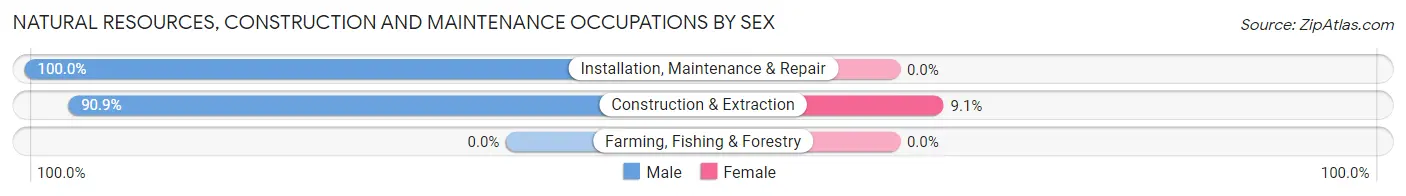
| Occupation | Male | Female |
| Farming, Fishing & Forestry | 0 (0.0%) | 0 (0.0%) |
| Construction & Extraction | 100 (90.9%) | 10 (9.1%) |
| Installation, Maintenance & Repair | 12 (100.0%) | 0 (0.0%) |
| Total (Category) | 112 (91.8%) | 10 (8.2%) |
| Total (Overall) | 3,204 (59.9%) | 2,142 (40.1%) |
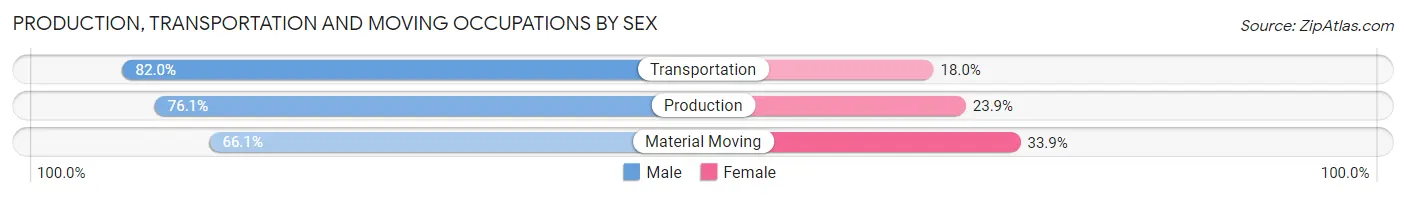
Production, Transportation and Moving Occupations
The most common Production, Transportation and Moving occupations in Winooski are Production (414 | 7.7%), Transportation (150 | 2.8%), and Material Moving (109 | 2.0%).
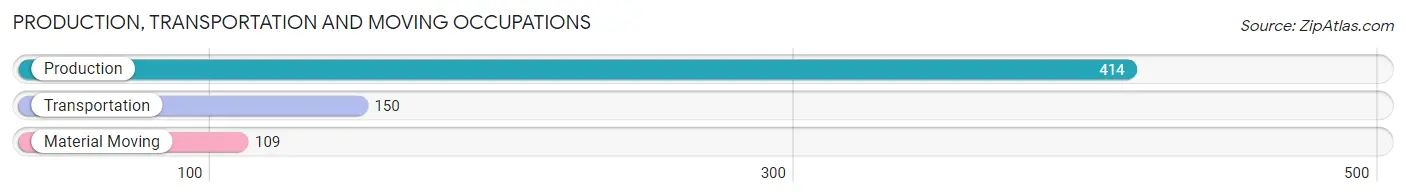
Production, Transportation and Moving Occupations by Sex
| Occupation | Male | Female |
| Production | 315 (76.1%) | 99 (23.9%) |
| Transportation | 123 (82.0%) | 27 (18.0%) |
| Material Moving | 72 (66.1%) | 37 (33.9%) |
| Total (Category) | 510 (75.8%) | 163 (24.2%) |
| Total (Overall) | 3,204 (59.9%) | 2,142 (40.1%) |
Employment Industries by Sex in Winooski
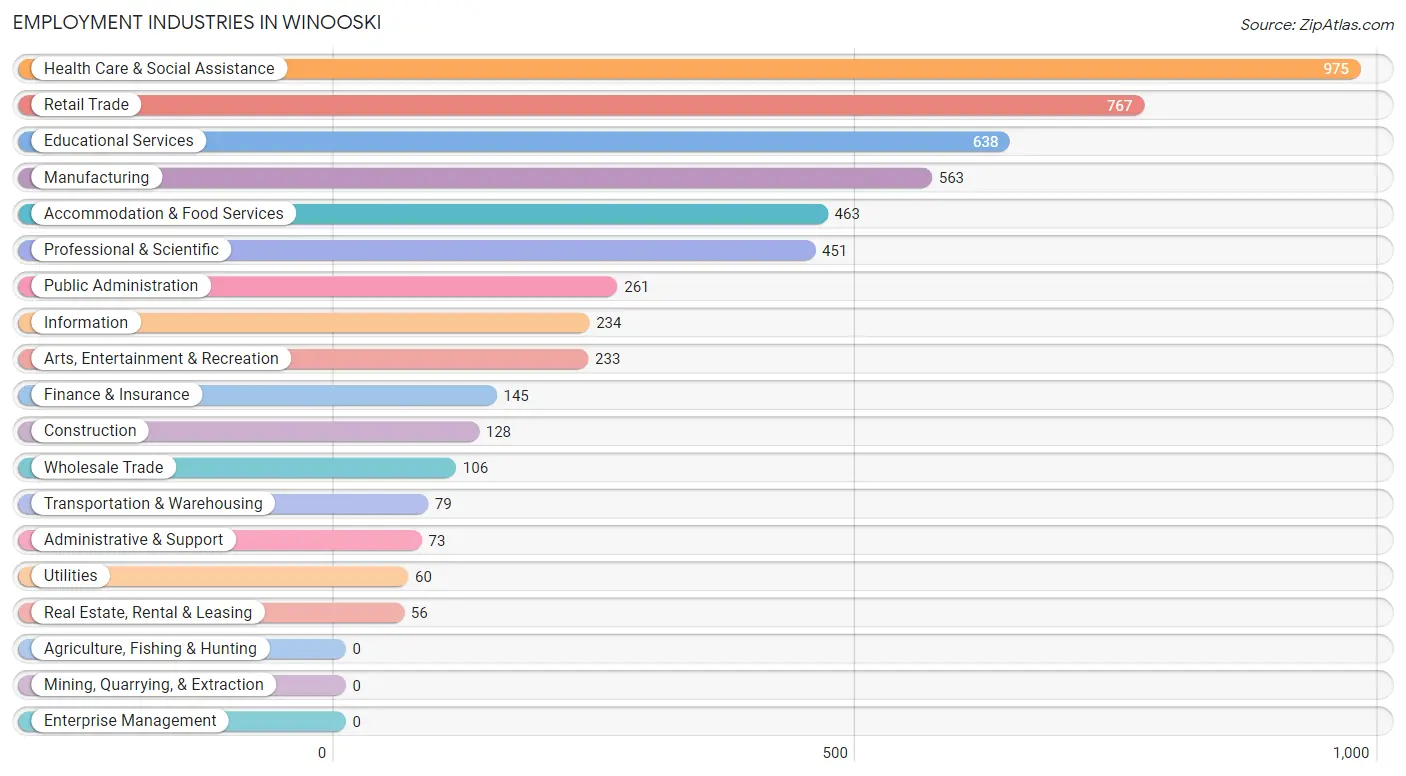
Employment Industries in Winooski
The major employment industries in Winooski include Health Care & Social Assistance (975 | 18.2%), Retail Trade (767 | 14.3%), Educational Services (638 | 11.9%), Manufacturing (563 | 10.5%), and Accommodation & Food Services (463 | 8.7%).
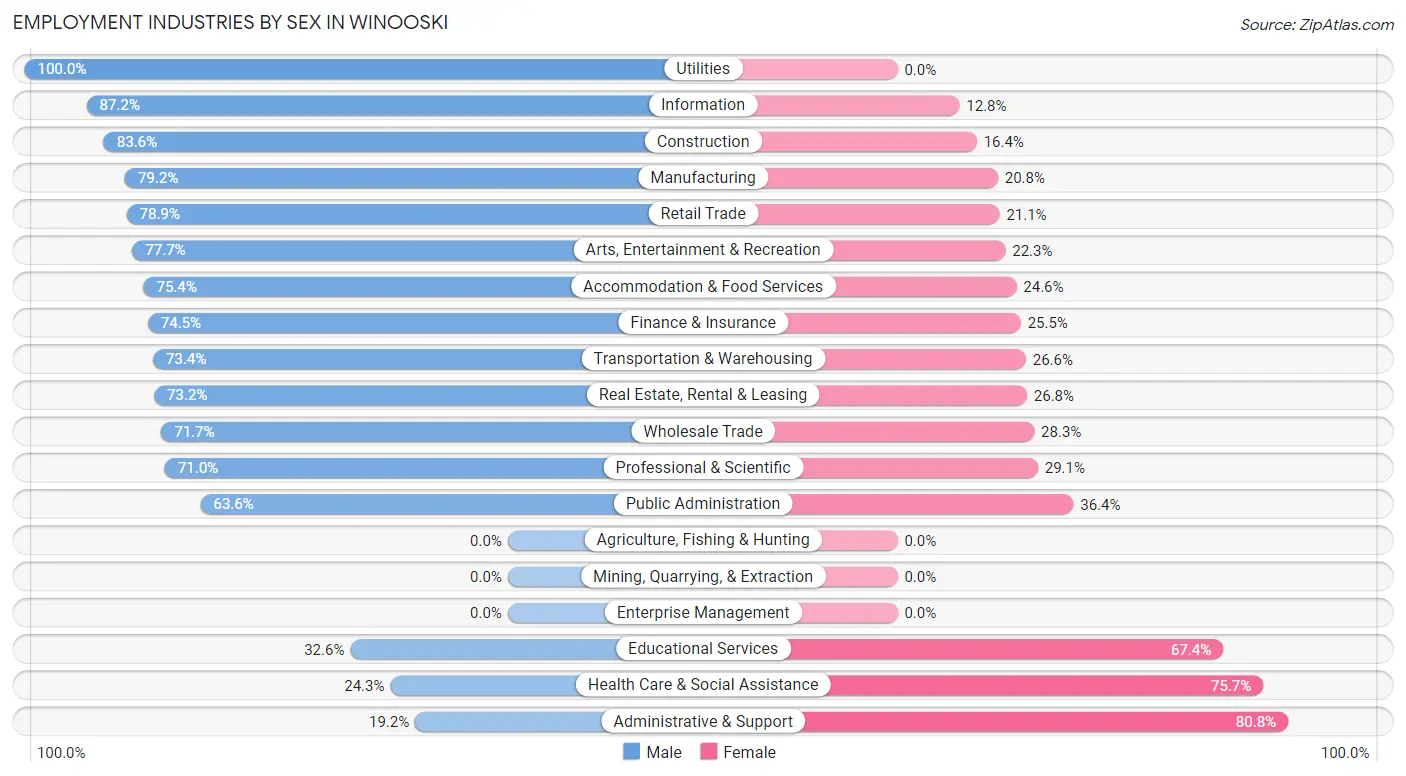
Employment Industries by Sex in Winooski
The Winooski industries that see more men than women are Utilities (100.0%), Information (87.2%), and Construction (83.6%), whereas the industries that tend to have a higher number of women are Administrative & Support (80.8%), Health Care & Social Assistance (75.7%), and Educational Services (67.4%).
| Industry | Male | Female |
| Agriculture, Fishing & Hunting | 0 (0.0%) | 0 (0.0%) |
| Mining, Quarrying, & Extraction | 0 (0.0%) | 0 (0.0%) |
| Construction | 107 (83.6%) | 21 (16.4%) |
| Manufacturing | 446 (79.2%) | 117 (20.8%) |
| Wholesale Trade | 76 (71.7%) | 30 (28.3%) |
| Retail Trade | 605 (78.9%) | 162 (21.1%) |
| Transportation & Warehousing | 58 (73.4%) | 21 (26.6%) |
| Utilities | 60 (100.0%) | 0 (0.0%) |
| Information | 204 (87.2%) | 30 (12.8%) |
| Finance & Insurance | 108 (74.5%) | 37 (25.5%) |
| Real Estate, Rental & Leasing | 41 (73.2%) | 15 (26.8%) |
| Professional & Scientific | 320 (71.0%) | 131 (29.0%) |
| Enterprise Management | 0 (0.0%) | 0 (0.0%) |
| Administrative & Support | 14 (19.2%) | 59 (80.8%) |
| Educational Services | 208 (32.6%) | 430 (67.4%) |
| Health Care & Social Assistance | 237 (24.3%) | 738 (75.7%) |
| Arts, Entertainment & Recreation | 181 (77.7%) | 52 (22.3%) |
| Accommodation & Food Services | 349 (75.4%) | 114 (24.6%) |
| Public Administration | 166 (63.6%) | 95 (36.4%) |
| Total | 3,204 (59.9%) | 2,142 (40.1%) |
Education in Winooski
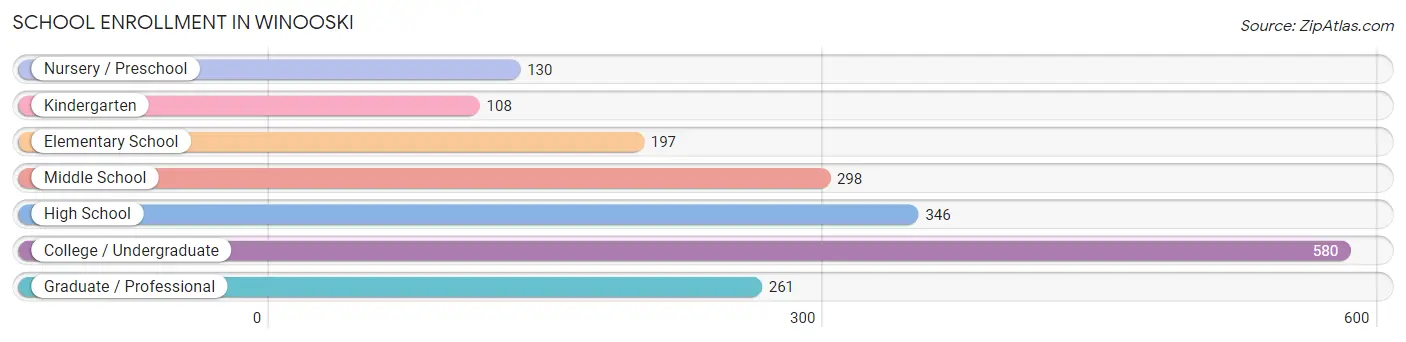
School Enrollment in Winooski
The most common levels of schooling among the 1,920 students in Winooski are college / undergraduate (580 | 30.2%), high school (346 | 18.0%), and middle school (298 | 15.5%).
| School Level | # Students | % Students |
| Nursery / Preschool | 130 | 6.8% |
| Kindergarten | 108 | 5.6% |
| Elementary School | 197 | 10.3% |
| Middle School | 298 | 15.5% |
| High School | 346 | 18.0% |
| College / Undergraduate | 580 | 30.2% |
| Graduate / Professional | 261 | 13.6% |
| Total | 1,920 | 100.0% |
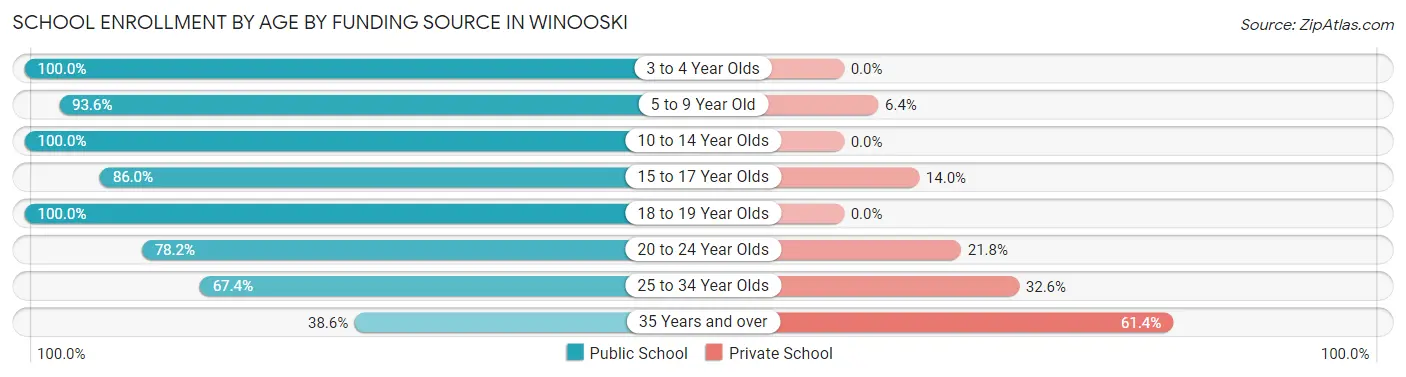
School Enrollment by Age by Funding Source in Winooski
Out of a total of 1,920 students who are enrolled in schools in Winooski, 286 (14.9%) attend a private institution, while the remaining 1,634 (85.1%) are enrolled in public schools. The age group of 35 years and over has the highest likelihood of being enrolled in private schools, with 27 (61.4% in the age bracket) enrolled. Conversely, the age group of 3 to 4 year olds has the lowest likelihood of being enrolled in a private school, with 108 (100.0% in the age bracket) attending a public institution.
| Age Bracket | Public School | Private School |
| 3 to 4 Year Olds | 108 (100.0%) | 0 (0.0%) |
| 5 to 9 Year Old | 306 (93.6%) | 21 (6.4%) |
| 10 to 14 Year Olds | 376 (100.0%) | 0 (0.0%) |
| 15 to 17 Year Olds | 135 (86.0%) | 22 (14.0%) |
| 18 to 19 Year Olds | 82 (100.0%) | 0 (0.0%) |
| 20 to 24 Year Olds | 387 (78.2%) | 108 (21.8%) |
| 25 to 34 Year Olds | 223 (67.4%) | 108 (32.6%) |
| 35 Years and over | 17 (38.6%) | 27 (61.4%) |
| Total | 1,634 (85.1%) | 286 (14.9%) |
Educational Attainment by Field of Study in Winooski
Arts & humanities (366 | 10.4%), bio, nature & agricultural (364 | 10.3%), visual & performing arts (364 | 10.3%), literature & languages (328 | 9.3%), and science & technology (323 | 9.2%) are the most common fields of study among 3,518 individuals in Winooski who have obtained a bachelor's degree or higher.
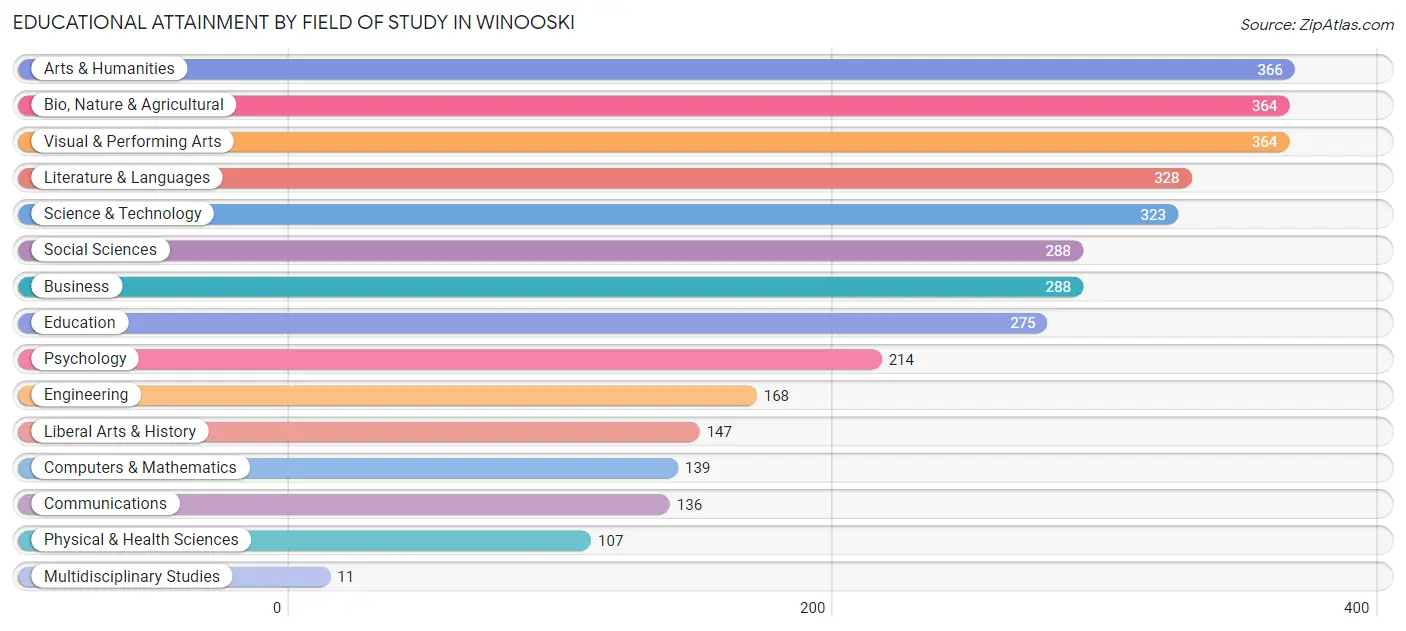
| Field of Study | # Graduates | % Graduates |
| Computers & Mathematics | 139 | 4.0% |
| Bio, Nature & Agricultural | 364 | 10.3% |
| Physical & Health Sciences | 107 | 3.0% |
| Psychology | 214 | 6.1% |
| Social Sciences | 288 | 8.2% |
| Engineering | 168 | 4.8% |
| Multidisciplinary Studies | 11 | 0.3% |
| Science & Technology | 323 | 9.2% |
| Business | 288 | 8.2% |
| Education | 275 | 7.8% |
| Literature & Languages | 328 | 9.3% |
| Liberal Arts & History | 147 | 4.2% |
| Visual & Performing Arts | 364 | 10.3% |
| Communications | 136 | 3.9% |
| Arts & Humanities | 366 | 10.4% |
| Total | 3,518 | 100.0% |
Transportation & Commute in Winooski
Vehicle Availability by Sex in Winooski
The most prevalent vehicle ownership categories in Winooski are males with 2 vehicles (1,107, accounting for 34.5%) and females with 2 vehicles (1,002, making up 52.9%).
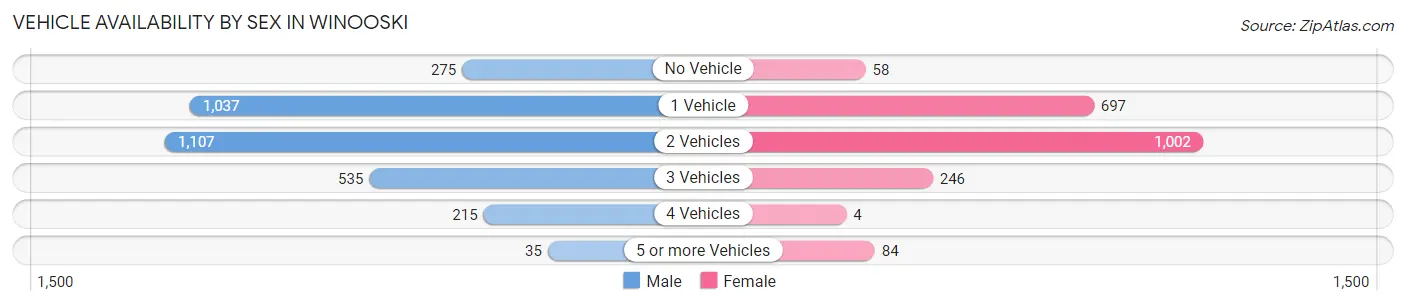
| Vehicles Available | Male | Female |
| No Vehicle | 275 (8.6%) | 58 (2.8%) |
| 1 Vehicle | 1,037 (32.4%) | 697 (33.3%) |
| 2 Vehicles | 1,107 (34.5%) | 1,002 (47.9%) |
| 3 Vehicles | 535 (16.7%) | 246 (11.8%) |
| 4 Vehicles | 215 (6.7%) | 4 (0.2%) |
| 5 or more Vehicles | 35 (1.1%) | 84 (4.0%) |
| Total | 3,204 (100.0%) | 2,091 (100.0%) |
Commute Time in Winooski
The most frequently occuring commute durations in Winooski are 10 to 14 minutes (1,134 commuters, 24.0%), 15 to 19 minutes (965 commuters, 20.4%), and 20 to 24 minutes (625 commuters, 13.2%).
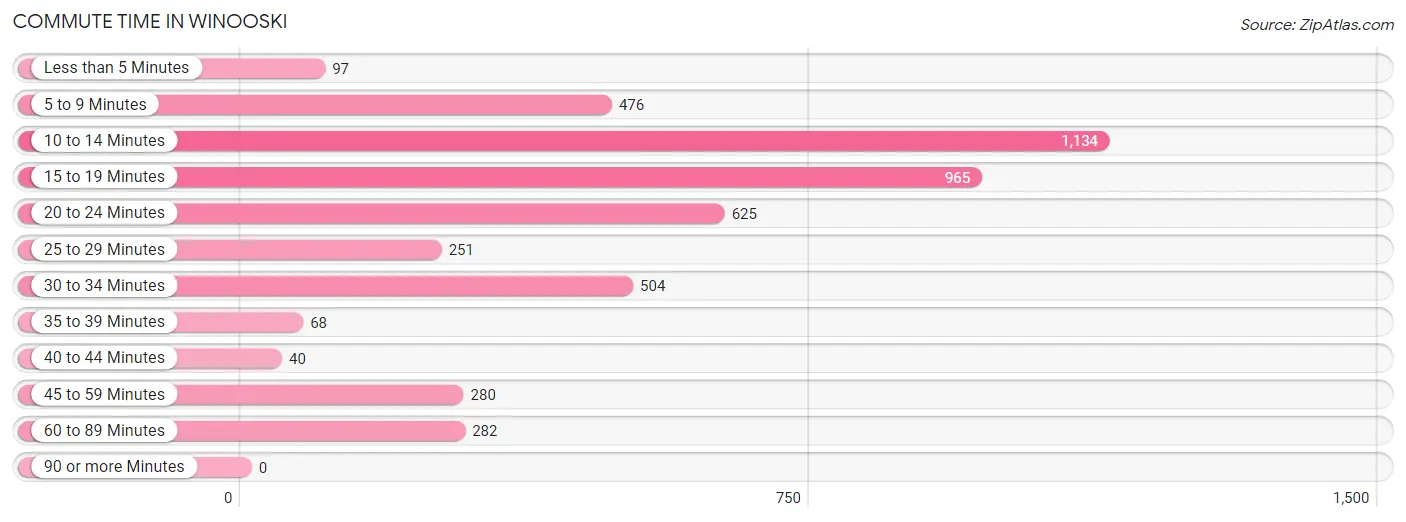
| Commute Time | # Commuters | % Commuters |
| Less than 5 Minutes | 97 | 2.1% |
| 5 to 9 Minutes | 476 | 10.1% |
| 10 to 14 Minutes | 1,134 | 24.0% |
| 15 to 19 Minutes | 965 | 20.4% |
| 20 to 24 Minutes | 625 | 13.2% |
| 25 to 29 Minutes | 251 | 5.3% |
| 30 to 34 Minutes | 504 | 10.7% |
| 35 to 39 Minutes | 68 | 1.4% |
| 40 to 44 Minutes | 40 | 0.9% |
| 45 to 59 Minutes | 280 | 5.9% |
| 60 to 89 Minutes | 282 | 6.0% |
| 90 or more Minutes | 0 | 0.0% |
Commute Time by Sex in Winooski
The most common commute times in Winooski are 10 to 14 minutes (749 commuters, 25.8%) for males and 10 to 14 minutes (385 commuters, 21.2%) for females.
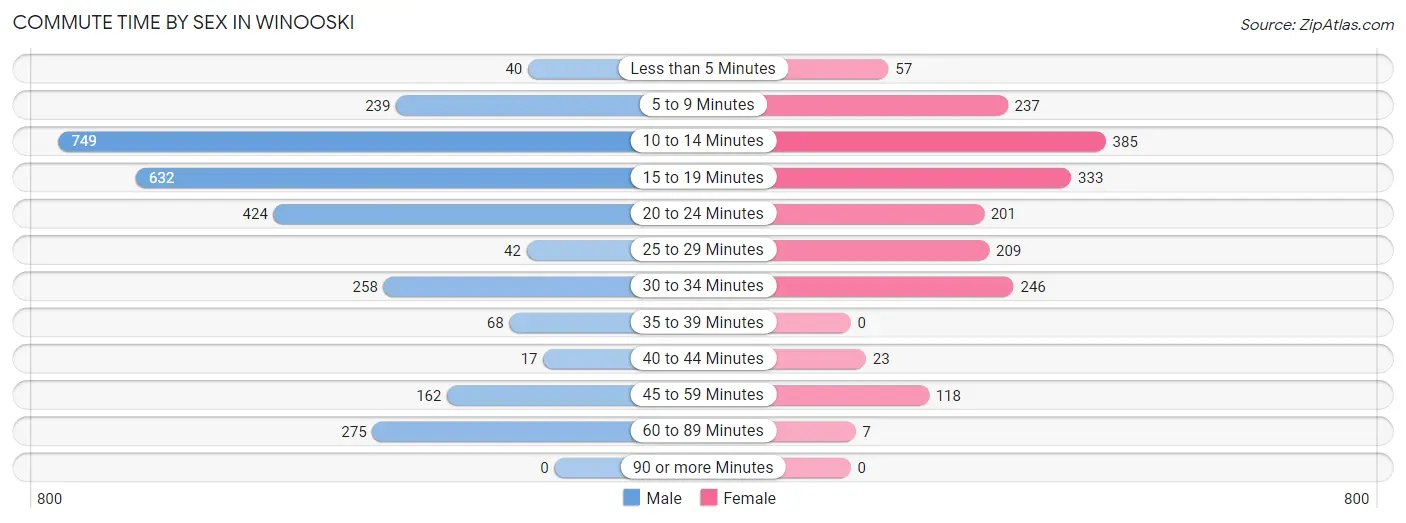
| Commute Time | Male | Female |
| Less than 5 Minutes | 40 (1.4%) | 57 (3.1%) |
| 5 to 9 Minutes | 239 (8.2%) | 237 (13.1%) |
| 10 to 14 Minutes | 749 (25.8%) | 385 (21.2%) |
| 15 to 19 Minutes | 632 (21.7%) | 333 (18.3%) |
| 20 to 24 Minutes | 424 (14.6%) | 201 (11.1%) |
| 25 to 29 Minutes | 42 (1.5%) | 209 (11.5%) |
| 30 to 34 Minutes | 258 (8.9%) | 246 (13.6%) |
| 35 to 39 Minutes | 68 (2.3%) | 0 (0.0%) |
| 40 to 44 Minutes | 17 (0.6%) | 23 (1.3%) |
| 45 to 59 Minutes | 162 (5.6%) | 118 (6.5%) |
| 60 to 89 Minutes | 275 (9.5%) | 7 (0.4%) |
| 90 or more Minutes | 0 (0.0%) | 0 (0.0%) |
Time of Departure to Work by Sex in Winooski
The most frequent times of departure to work in Winooski are 12:00 PM to 3:59 PM (415, 14.3%) for males and 7:30 AM to 7:59 AM (368, 20.3%) for females.
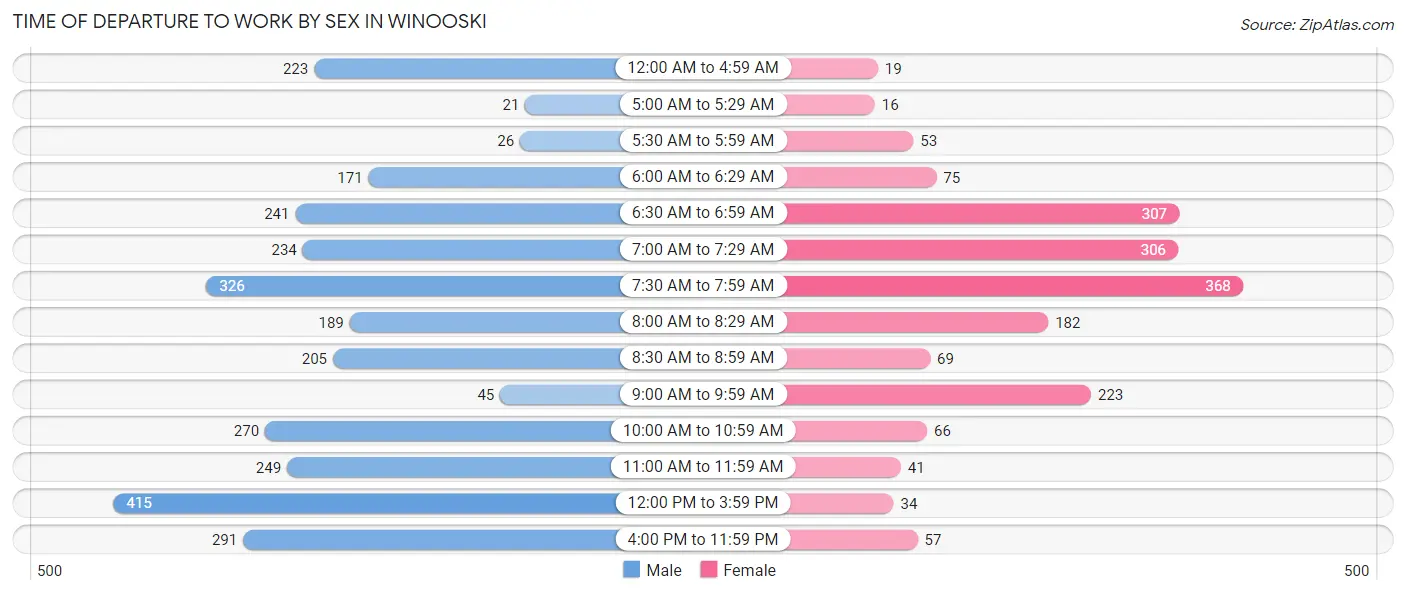
| Time of Departure | Male | Female |
| 12:00 AM to 4:59 AM | 223 (7.7%) | 19 (1.1%) |
| 5:00 AM to 5:29 AM | 21 (0.7%) | 16 (0.9%) |
| 5:30 AM to 5:59 AM | 26 (0.9%) | 53 (2.9%) |
| 6:00 AM to 6:29 AM | 171 (5.9%) | 75 (4.1%) |
| 6:30 AM to 6:59 AM | 241 (8.3%) | 307 (16.9%) |
| 7:00 AM to 7:29 AM | 234 (8.1%) | 306 (16.9%) |
| 7:30 AM to 7:59 AM | 326 (11.2%) | 368 (20.3%) |
| 8:00 AM to 8:29 AM | 189 (6.5%) | 182 (10.0%) |
| 8:30 AM to 8:59 AM | 205 (7.0%) | 69 (3.8%) |
| 9:00 AM to 9:59 AM | 45 (1.5%) | 223 (12.3%) |
| 10:00 AM to 10:59 AM | 270 (9.3%) | 66 (3.6%) |
| 11:00 AM to 11:59 AM | 249 (8.6%) | 41 (2.3%) |
| 12:00 PM to 3:59 PM | 415 (14.3%) | 34 (1.9%) |
| 4:00 PM to 11:59 PM | 291 (10.0%) | 57 (3.1%) |
| Total | 2,906 (100.0%) | 1,816 (100.0%) |
Housing Occupancy in Winooski
Occupancy by Ownership in Winooski
Of the total 3,688 dwellings in Winooski, owner-occupied units account for 1,318 (35.7%), while renter-occupied units make up 2,370 (64.3%).
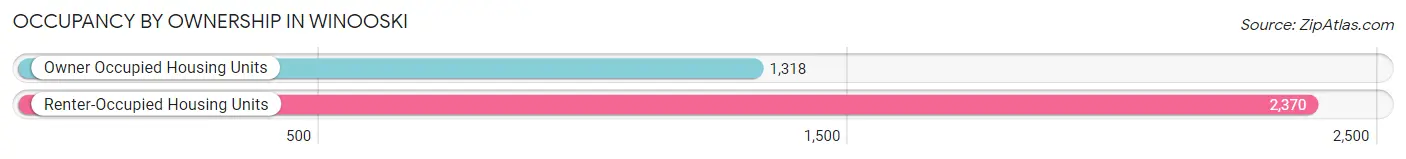
| Occupancy | # Housing Units | % Housing Units |
| Owner Occupied Housing Units | 1,318 | 35.7% |
| Renter-Occupied Housing Units | 2,370 | 64.3% |
| Total Occupied Housing Units | 3,688 | 100.0% |
Occupancy by Household Size in Winooski
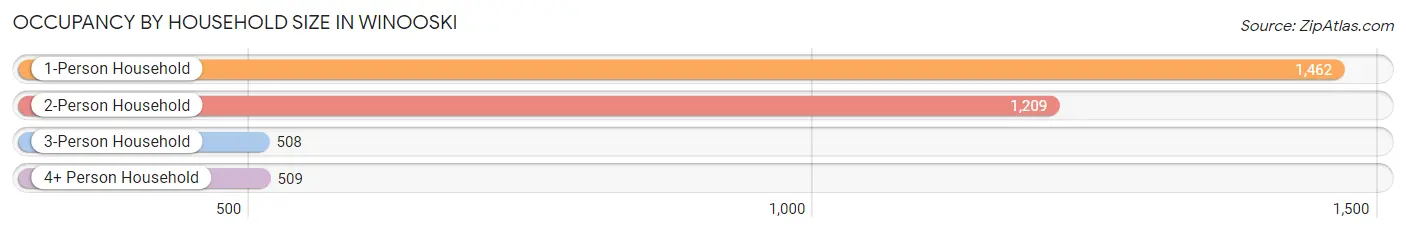
| Household Size | # Housing Units | % Housing Units |
| 1-Person Household | 1,462 | 39.6% |
| 2-Person Household | 1,209 | 32.8% |
| 3-Person Household | 508 | 13.8% |
| 4+ Person Household | 509 | 13.8% |
| Total Housing Units | 3,688 | 100.0% |
Occupancy by Ownership by Household Size in Winooski
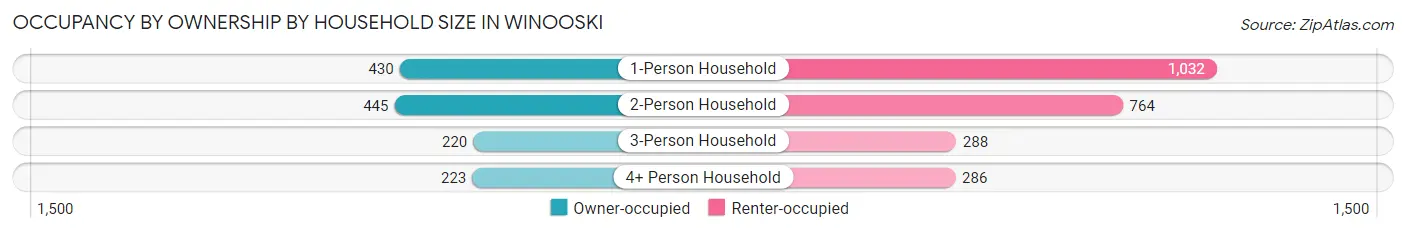
| Household Size | Owner-occupied | Renter-occupied |
| 1-Person Household | 430 (29.4%) | 1,032 (70.6%) |
| 2-Person Household | 445 (36.8%) | 764 (63.2%) |
| 3-Person Household | 220 (43.3%) | 288 (56.7%) |
| 4+ Person Household | 223 (43.8%) | 286 (56.2%) |
| Total Housing Units | 1,318 (35.7%) | 2,370 (64.3%) |
Occupancy by Educational Attainment in Winooski
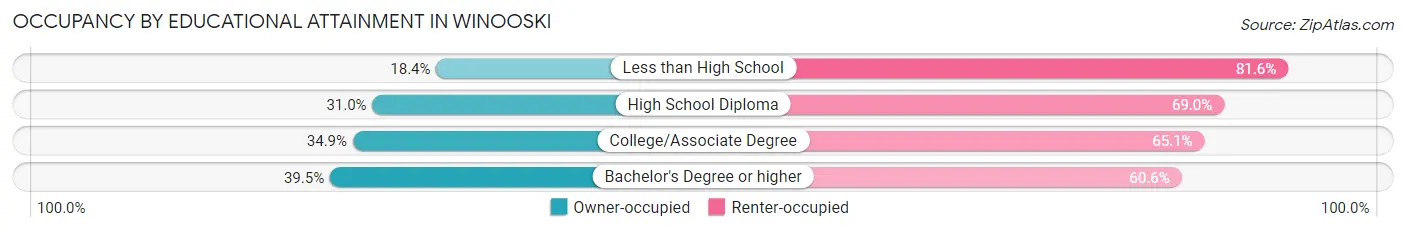
| Household Size | Owner-occupied | Renter-occupied |
| Less than High School | 56 (18.4%) | 249 (81.6%) |
| High School Diploma | 117 (31.0%) | 260 (69.0%) |
| College/Associate Degree | 315 (34.9%) | 587 (65.1%) |
| Bachelor's Degree or higher | 830 (39.5%) | 1,274 (60.6%) |
Occupancy by Age of Householder in Winooski
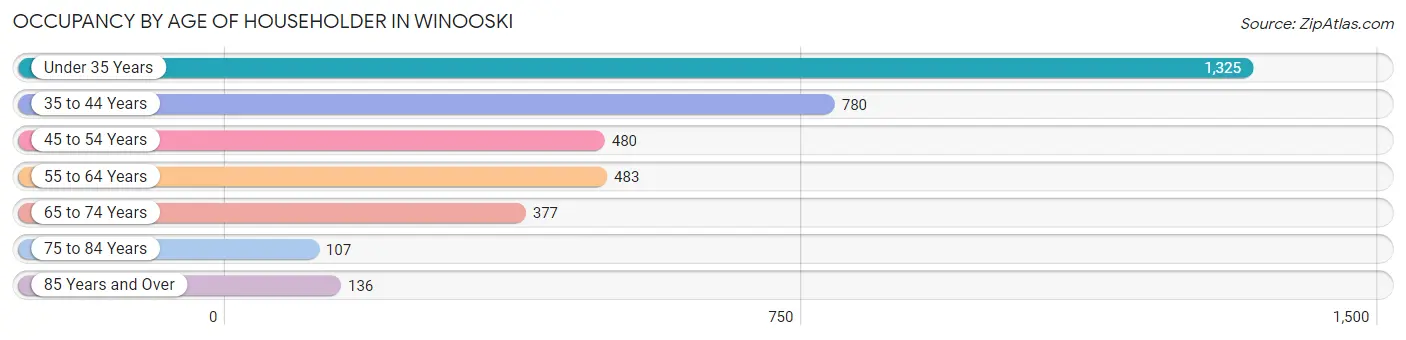
| Age Bracket | # Households | % Households |
| Under 35 Years | 1,325 | 35.9% |
| 35 to 44 Years | 780 | 21.1% |
| 45 to 54 Years | 480 | 13.0% |
| 55 to 64 Years | 483 | 13.1% |
| 65 to 74 Years | 377 | 10.2% |
| 75 to 84 Years | 107 | 2.9% |
| 85 Years and Over | 136 | 3.7% |
| Total | 3,688 | 100.0% |
Housing Finances in Winooski
Median Income by Occupancy in Winooski
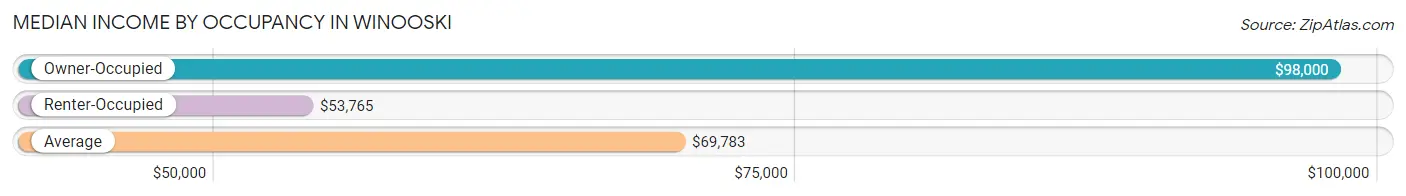
| Occupancy Type | # Households | Median Income |
| Owner-Occupied | 1,318 (35.7%) | $98,000 |
| Renter-Occupied | 2,370 (64.3%) | $53,765 |
| Average | 3,688 (100.0%) | $69,783 |
Occupancy by Householder Income Bracket in Winooski
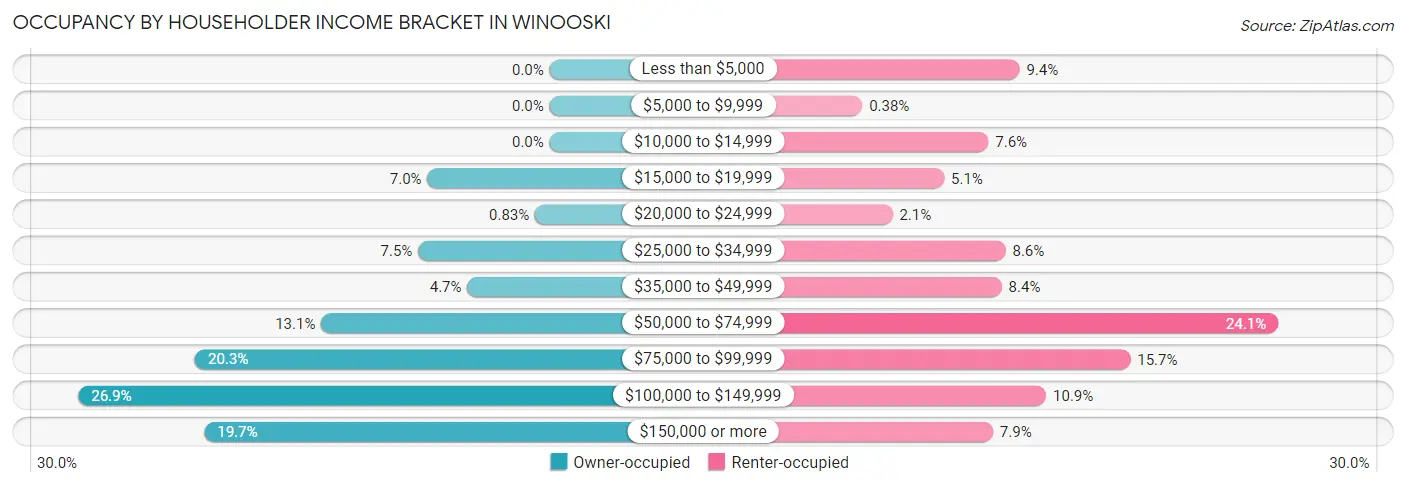
| Income Bracket | Owner-occupied | Renter-occupied |
| Less than $5,000 | 0 (0.0%) | 222 (9.4%) |
| $5,000 to $9,999 | 0 (0.0%) | 9 (0.4%) |
| $10,000 to $14,999 | 0 (0.0%) | 180 (7.6%) |
| $15,000 to $19,999 | 92 (7.0%) | 120 (5.1%) |
| $20,000 to $24,999 | 11 (0.8%) | 50 (2.1%) |
| $25,000 to $34,999 | 99 (7.5%) | 203 (8.6%) |
| $35,000 to $49,999 | 62 (4.7%) | 198 (8.4%) |
| $50,000 to $74,999 | 172 (13.1%) | 572 (24.1%) |
| $75,000 to $99,999 | 267 (20.3%) | 372 (15.7%) |
| $100,000 to $149,999 | 355 (26.9%) | 258 (10.9%) |
| $150,000 or more | 260 (19.7%) | 186 (7.9%) |
| Total | 1,318 (100.0%) | 2,370 (100.0%) |
Monthly Housing Cost Tiers in Winooski
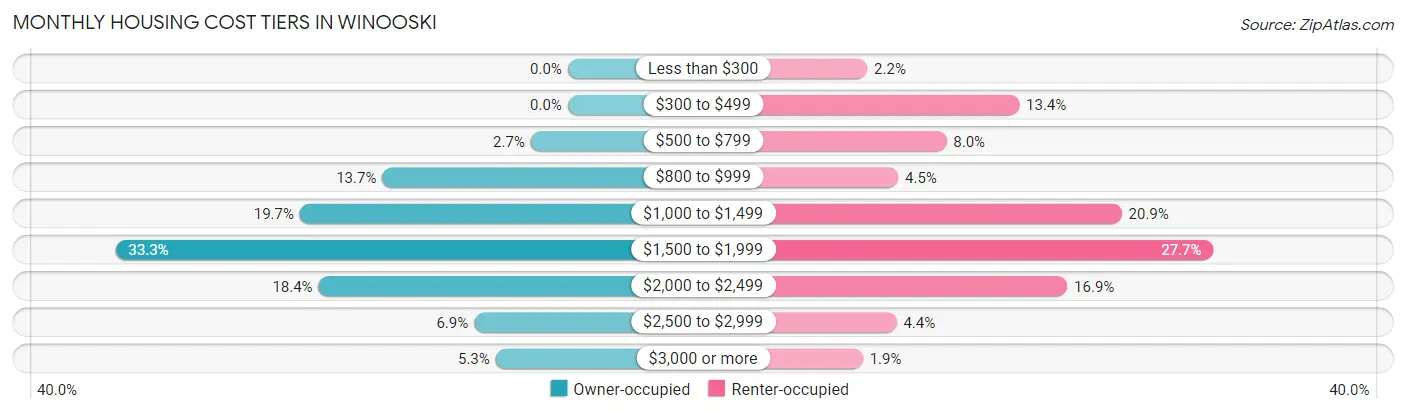
| Monthly Cost | Owner-occupied | Renter-occupied |
| Less than $300 | 0 (0.0%) | 52 (2.2%) |
| $300 to $499 | 0 (0.0%) | 317 (13.4%) |
| $500 to $799 | 36 (2.7%) | 190 (8.0%) |
| $800 to $999 | 180 (13.7%) | 106 (4.5%) |
| $1,000 to $1,499 | 260 (19.7%) | 496 (20.9%) |
| $1,500 to $1,999 | 439 (33.3%) | 656 (27.7%) |
| $2,000 to $2,499 | 242 (18.4%) | 401 (16.9%) |
| $2,500 to $2,999 | 91 (6.9%) | 103 (4.3%) |
| $3,000 or more | 70 (5.3%) | 44 (1.9%) |
| Total | 1,318 (100.0%) | 2,370 (100.0%) |
Physical Housing Characteristics in Winooski
Housing Structures in Winooski
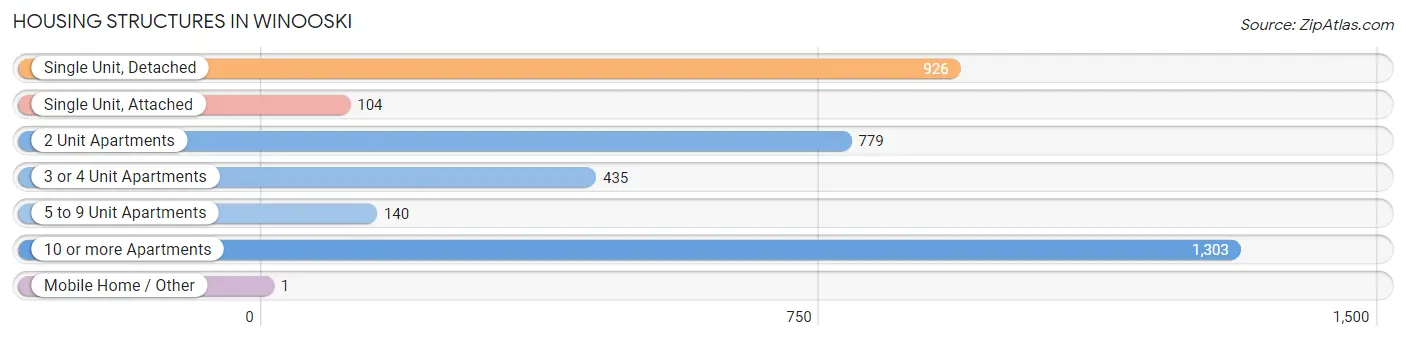
| Structure Type | # Housing Units | % Housing Units |
| Single Unit, Detached | 926 | 25.1% |
| Single Unit, Attached | 104 | 2.8% |
| 2 Unit Apartments | 779 | 21.1% |
| 3 or 4 Unit Apartments | 435 | 11.8% |
| 5 to 9 Unit Apartments | 140 | 3.8% |
| 10 or more Apartments | 1,303 | 35.3% |
| Mobile Home / Other | 1 | 0.0% |
| Total | 3,688 | 100.0% |
Housing Structures by Occupancy in Winooski
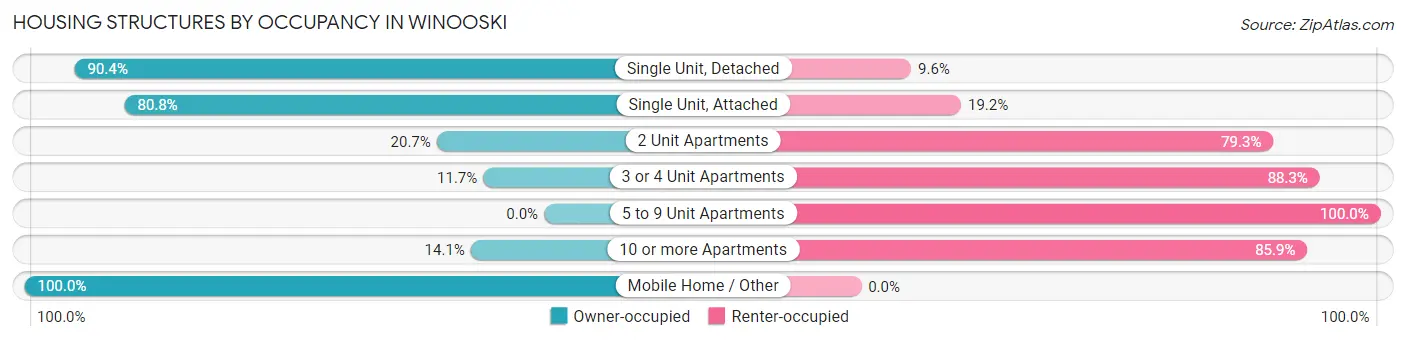
| Structure Type | Owner-occupied | Renter-occupied |
| Single Unit, Detached | 837 (90.4%) | 89 (9.6%) |
| Single Unit, Attached | 84 (80.8%) | 20 (19.2%) |
| 2 Unit Apartments | 161 (20.7%) | 618 (79.3%) |
| 3 or 4 Unit Apartments | 51 (11.7%) | 384 (88.3%) |
| 5 to 9 Unit Apartments | 0 (0.0%) | 140 (100.0%) |
| 10 or more Apartments | 184 (14.1%) | 1,119 (85.9%) |
| Mobile Home / Other | 1 (100.0%) | 0 (0.0%) |
| Total | 1,318 (35.7%) | 2,370 (64.3%) |
Housing Structures by Number of Rooms in Winooski
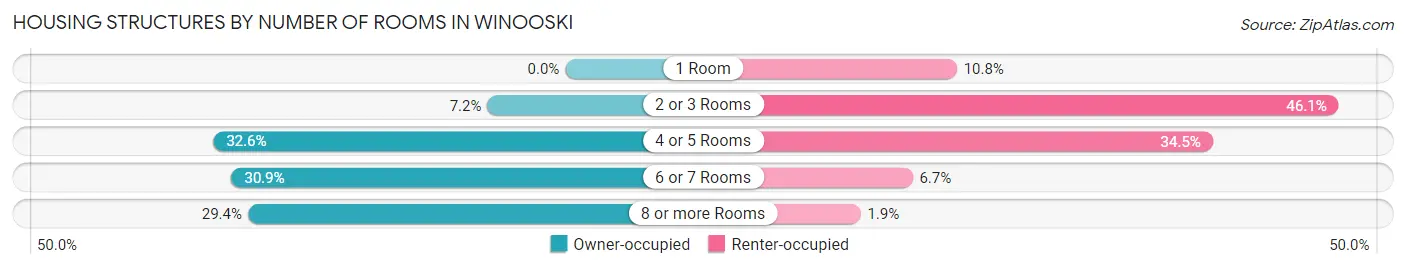
| Number of Rooms | Owner-occupied | Renter-occupied |
| 1 Room | 0 (0.0%) | 256 (10.8%) |
| 2 or 3 Rooms | 95 (7.2%) | 1,093 (46.1%) |
| 4 or 5 Rooms | 429 (32.6%) | 817 (34.5%) |
| 6 or 7 Rooms | 407 (30.9%) | 159 (6.7%) |
| 8 or more Rooms | 387 (29.4%) | 45 (1.9%) |
| Total | 1,318 (100.0%) | 2,370 (100.0%) |
Housing Structure by Heating Type in Winooski
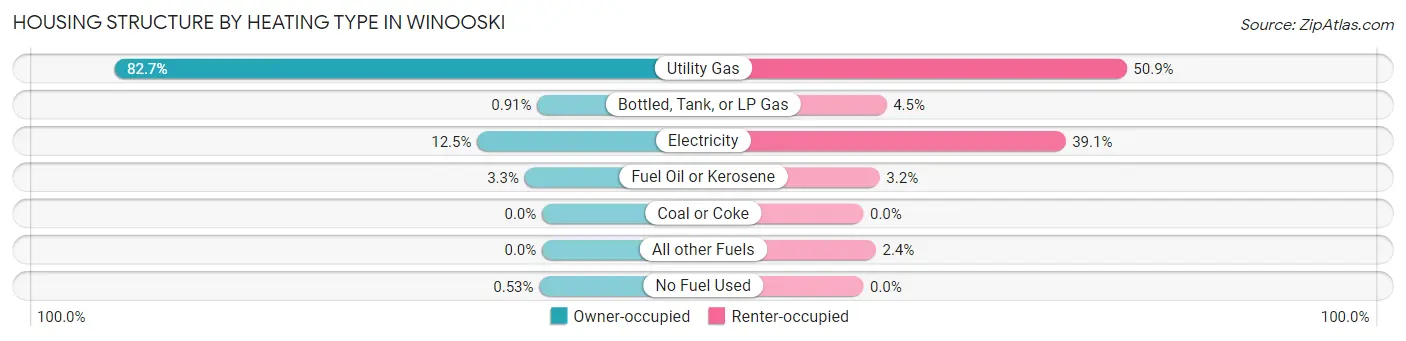
| Heating Type | Owner-occupied | Renter-occupied |
| Utility Gas | 1,090 (82.7%) | 1,206 (50.9%) |
| Bottled, Tank, or LP Gas | 12 (0.9%) | 106 (4.5%) |
| Electricity | 165 (12.5%) | 926 (39.1%) |
| Fuel Oil or Kerosene | 44 (3.3%) | 75 (3.2%) |
| Coal or Coke | 0 (0.0%) | 0 (0.0%) |
| All other Fuels | 0 (0.0%) | 57 (2.4%) |
| No Fuel Used | 7 (0.5%) | 0 (0.0%) |
| Total | 1,318 (100.0%) | 2,370 (100.0%) |
Household Vehicle Usage in Winooski
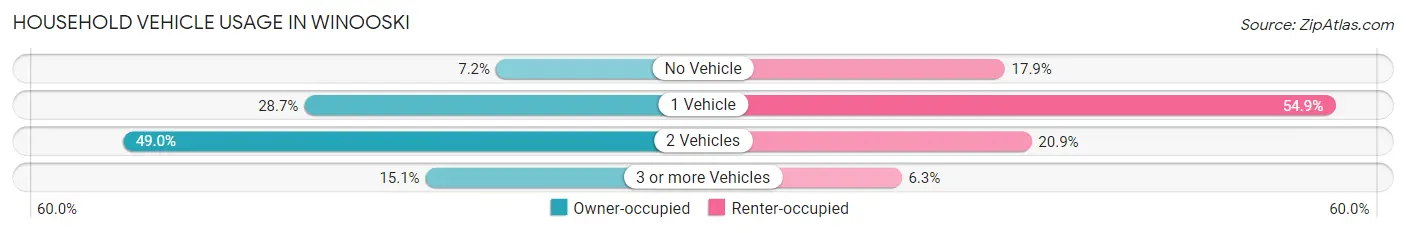
| Vehicles per Household | Owner-occupied | Renter-occupied |
| No Vehicle | 95 (7.2%) | 424 (17.9%) |
| 1 Vehicle | 378 (28.7%) | 1,301 (54.9%) |
| 2 Vehicles | 646 (49.0%) | 495 (20.9%) |
| 3 or more Vehicles | 199 (15.1%) | 150 (6.3%) |
| Total | 1,318 (100.0%) | 2,370 (100.0%) |
Real Estate & Mortgages in Winooski
Real Estate and Mortgage Overview in Winooski
| Characteristic | Without Mortgage | With Mortgage |
| Housing Units | 353 | 965 |
| Median Property Value | $366,500 | $319,400 |
| Median Household Income | $59,438 | $202 |
| Monthly Housing Costs | $973 | $70 |
| Real Estate Taxes | $7,448 | $0 |
Property Value by Mortgage Status in Winooski
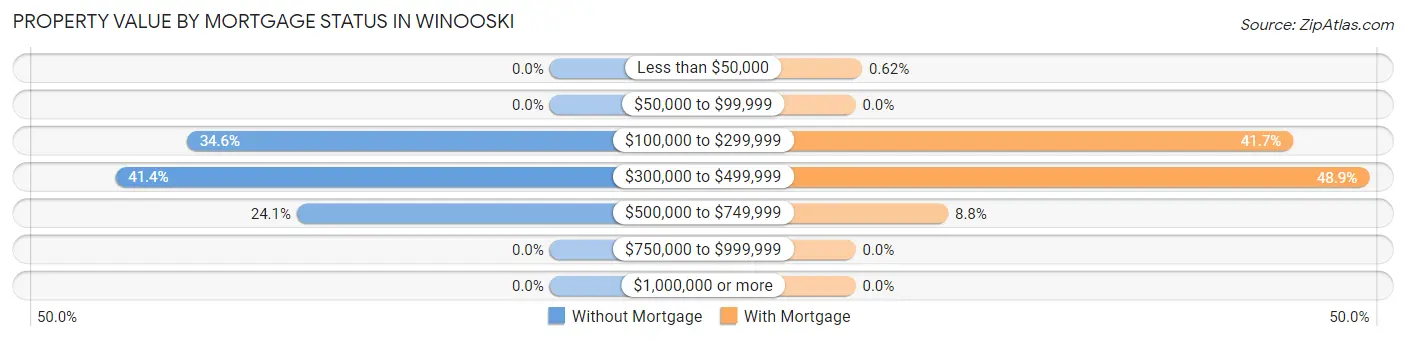
| Property Value | Without Mortgage | With Mortgage |
| Less than $50,000 | 0 (0.0%) | 6 (0.6%) |
| $50,000 to $99,999 | 0 (0.0%) | 0 (0.0%) |
| $100,000 to $299,999 | 122 (34.6%) | 402 (41.7%) |
| $300,000 to $499,999 | 146 (41.4%) | 472 (48.9%) |
| $500,000 to $749,999 | 85 (24.1%) | 85 (8.8%) |
| $750,000 to $999,999 | 0 (0.0%) | 0 (0.0%) |
| $1,000,000 or more | 0 (0.0%) | 0 (0.0%) |
| Total | 353 (100.0%) | 965 (100.0%) |
Household Income by Mortgage Status in Winooski
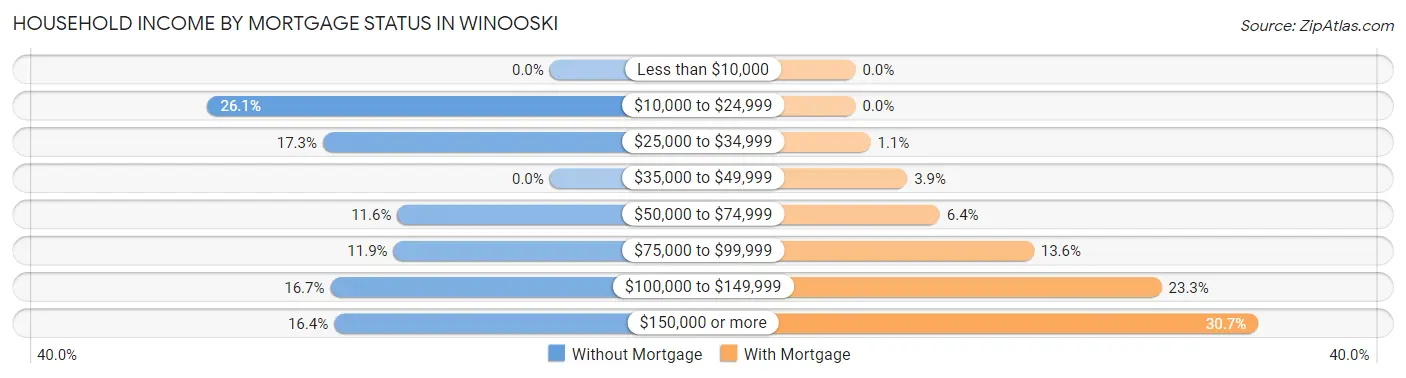
| Household Income | Without Mortgage | With Mortgage |
| Less than $10,000 | 0 (0.0%) | 0 (0.0%) |
| $10,000 to $24,999 | 92 (26.1%) | 0 (0.0%) |
| $25,000 to $34,999 | 61 (17.3%) | 11 (1.1%) |
| $35,000 to $49,999 | 0 (0.0%) | 38 (3.9%) |
| $50,000 to $74,999 | 41 (11.6%) | 62 (6.4%) |
| $75,000 to $99,999 | 42 (11.9%) | 131 (13.6%) |
| $100,000 to $149,999 | 59 (16.7%) | 225 (23.3%) |
| $150,000 or more | 58 (16.4%) | 296 (30.7%) |
| Total | 353 (100.0%) | 965 (100.0%) |
Property Value to Household Income Ratio in Winooski
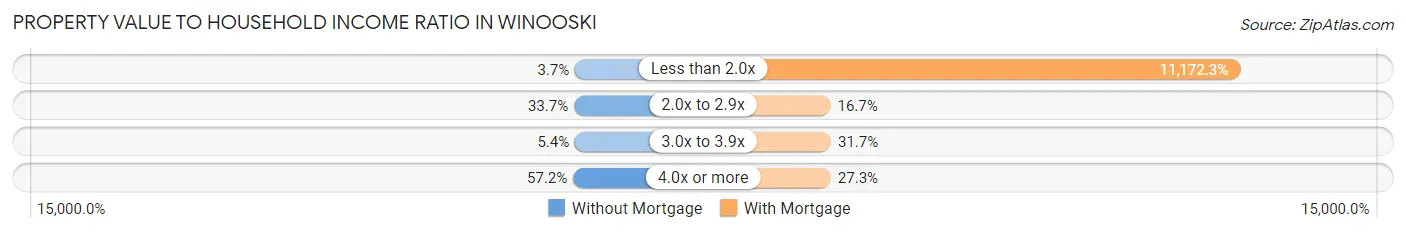
| Value-to-Income Ratio | Without Mortgage | With Mortgage |
| Less than 2.0x | 13 (3.7%) | 107,813 (11,172.3%) |
| 2.0x to 2.9x | 119 (33.7%) | 161 (16.7%) |
| 3.0x to 3.9x | 19 (5.4%) | 306 (31.7%) |
| 4.0x or more | 202 (57.2%) | 263 (27.3%) |
| Total | 353 (100.0%) | 965 (100.0%) |
Real Estate Taxes by Mortgage Status in Winooski

| Property Taxes | Without Mortgage | With Mortgage |
| Less than $800 | 0 (0.0%) | 0 (0.0%) |
| $800 to $1,499 | 0 (0.0%) | 0 (0.0%) |
| $800 to $1,499 | 353 (100.0%) | 15 (1.5%) |
| Total | 353 (100.0%) | 965 (100.0%) |
Health & Disability in Winooski
Health Insurance Coverage by Age in Winooski
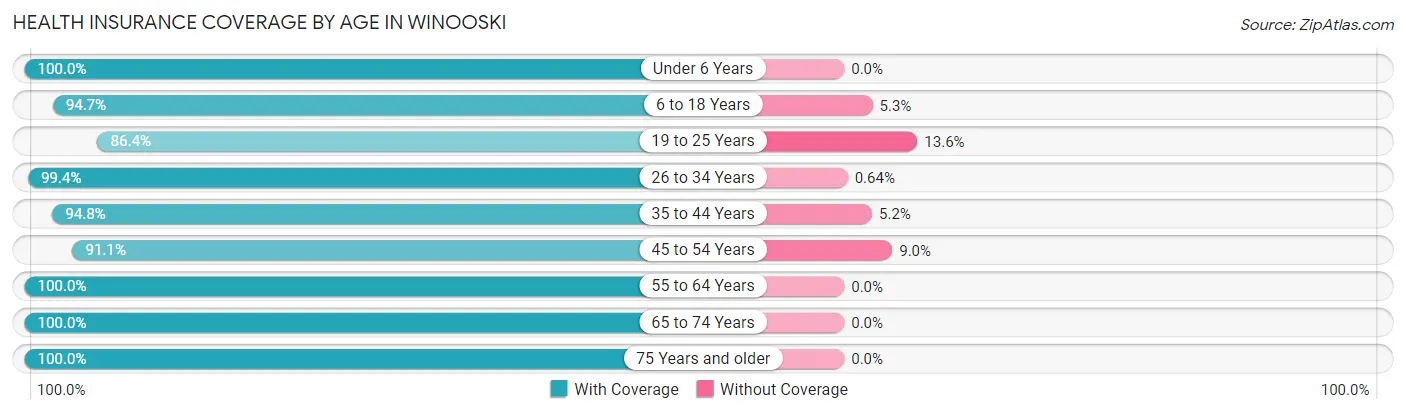
| Age Bracket | With Coverage | Without Coverage |
| Under 6 Years | 435 (100.0%) | 0 (0.0%) |
| 6 to 18 Years | 790 (94.7%) | 44 (5.3%) |
| 19 to 25 Years | 1,381 (86.4%) | 218 (13.6%) |
| 26 to 34 Years | 1,562 (99.4%) | 10 (0.6%) |
| 35 to 44 Years | 1,187 (94.8%) | 65 (5.2%) |
| 45 to 54 Years | 743 (91.0%) | 73 (8.9%) |
| 55 to 64 Years | 745 (100.0%) | 0 (0.0%) |
| 65 to 74 Years | 535 (100.0%) | 0 (0.0%) |
| 75 Years and older | 304 (100.0%) | 0 (0.0%) |
| Total | 7,682 (94.9%) | 410 (5.1%) |
Health Insurance Coverage by Citizenship Status in Winooski
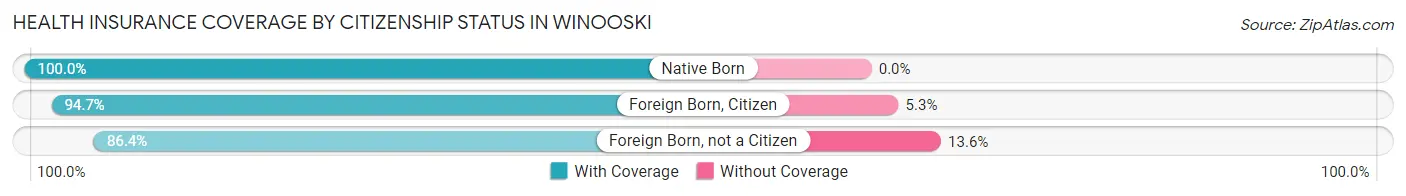
| Citizenship Status | With Coverage | Without Coverage |
| Native Born | 435 (100.0%) | 0 (0.0%) |
| Foreign Born, Citizen | 790 (94.7%) | 44 (5.3%) |
| Foreign Born, not a Citizen | 1,381 (86.4%) | 218 (13.6%) |
Health Insurance Coverage by Household Income in Winooski
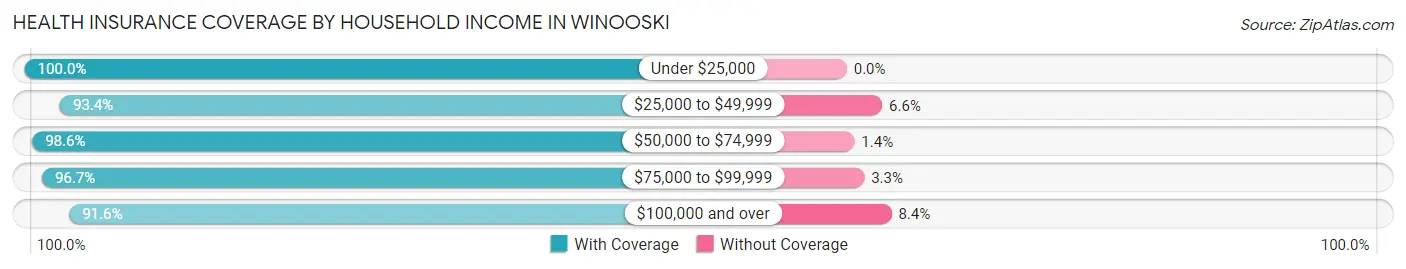
| Household Income | With Coverage | Without Coverage |
| Under $25,000 | 1,017 (100.0%) | 0 (0.0%) |
| $25,000 to $49,999 | 1,084 (93.4%) | 77 (6.6%) |
| $50,000 to $74,999 | 1,168 (98.6%) | 17 (1.4%) |
| $75,000 to $99,999 | 1,454 (96.7%) | 49 (3.3%) |
| $100,000 and over | 2,922 (91.6%) | 267 (8.4%) |
Public vs Private Health Insurance Coverage by Age in Winooski
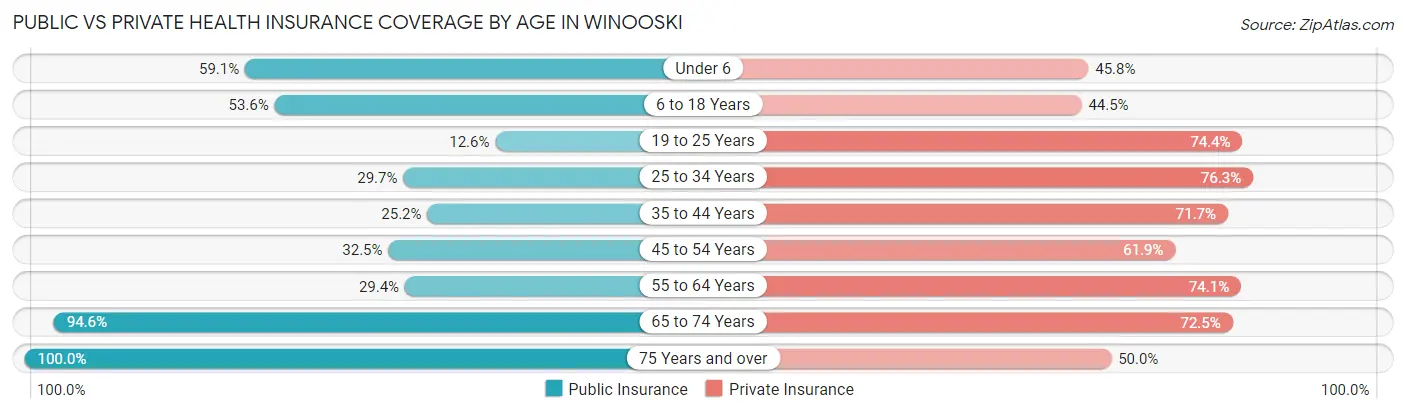
| Age Bracket | Public Insurance | Private Insurance |
| Under 6 | 257 (59.1%) | 199 (45.8%) |
| 6 to 18 Years | 447 (53.6%) | 371 (44.5%) |
| 19 to 25 Years | 202 (12.6%) | 1,189 (74.4%) |
| 25 to 34 Years | 467 (29.7%) | 1,200 (76.3%) |
| 35 to 44 Years | 316 (25.2%) | 897 (71.7%) |
| 45 to 54 Years | 265 (32.5%) | 505 (61.9%) |
| 55 to 64 Years | 219 (29.4%) | 552 (74.1%) |
| 65 to 74 Years | 506 (94.6%) | 388 (72.5%) |
| 75 Years and over | 304 (100.0%) | 152 (50.0%) |
| Total | 2,983 (36.9%) | 5,453 (67.4%) |
Disability Status by Sex by Age in Winooski
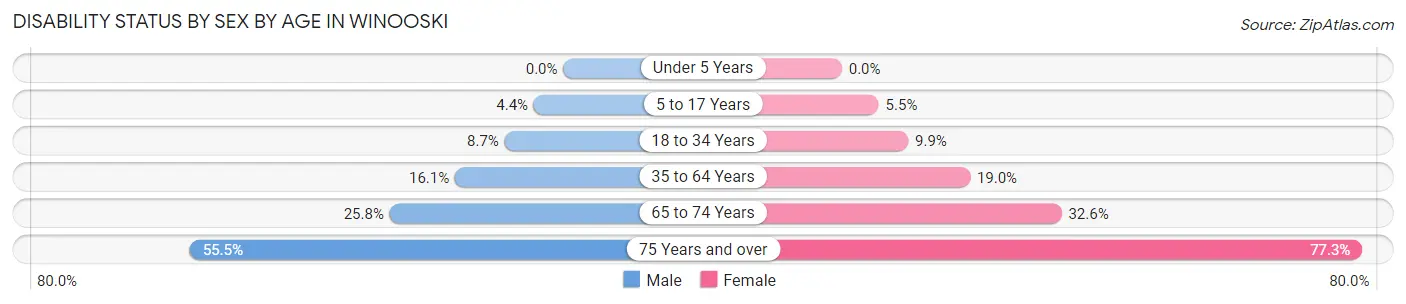
| Age Bracket | Male | Female |
| Under 5 Years | 0 (0.0%) | 0 (0.0%) |
| 5 to 17 Years | 21 (4.4%) | 21 (5.5%) |
| 18 to 34 Years | 175 (8.7%) | 122 (9.9%) |
| 35 to 64 Years | 247 (16.1%) | 243 (19.0%) |
| 65 to 74 Years | 66 (25.8%) | 91 (32.6%) |
| 75 Years and over | 71 (55.5%) | 136 (77.3%) |
Disability Class by Sex by Age in Winooski
Disability Class: Hearing Difficulty
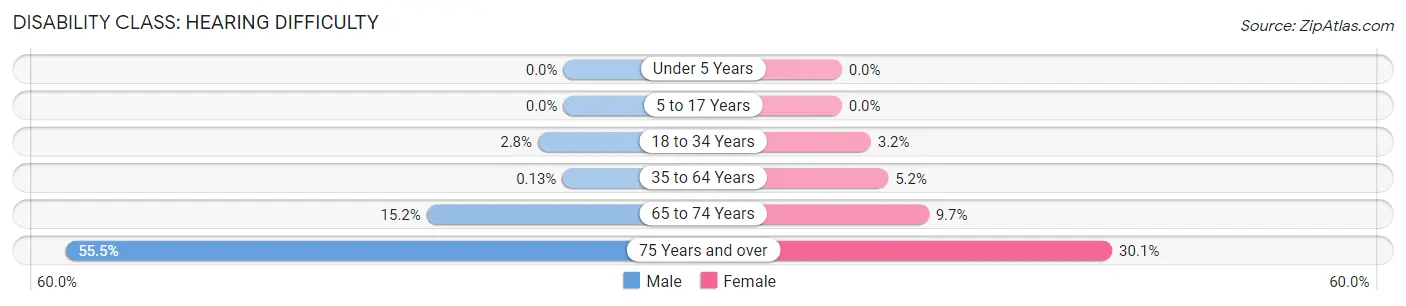
| Age Bracket | Male | Female |
| Under 5 Years | 0 (0.0%) | 0 (0.0%) |
| 5 to 17 Years | 0 (0.0%) | 0 (0.0%) |
| 18 to 34 Years | 57 (2.8%) | 40 (3.2%) |
| 35 to 64 Years | 2 (0.1%) | 66 (5.2%) |
| 65 to 74 Years | 39 (15.2%) | 27 (9.7%) |
| 75 Years and over | 71 (55.5%) | 53 (30.1%) |
Disability Class: Vision Difficulty
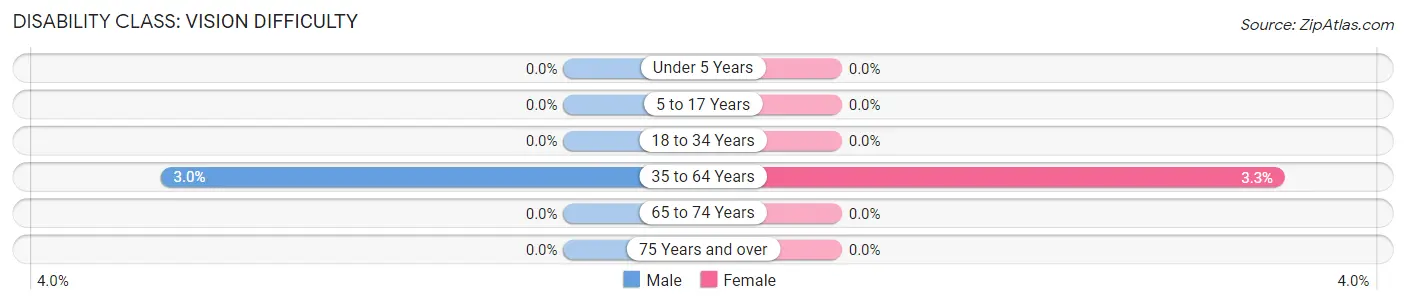
| Age Bracket | Male | Female |
| Under 5 Years | 0 (0.0%) | 0 (0.0%) |
| 5 to 17 Years | 0 (0.0%) | 0 (0.0%) |
| 18 to 34 Years | 0 (0.0%) | 0 (0.0%) |
| 35 to 64 Years | 46 (3.0%) | 42 (3.3%) |
| 65 to 74 Years | 0 (0.0%) | 0 (0.0%) |
| 75 Years and over | 0 (0.0%) | 0 (0.0%) |
Disability Class: Cognitive Difficulty
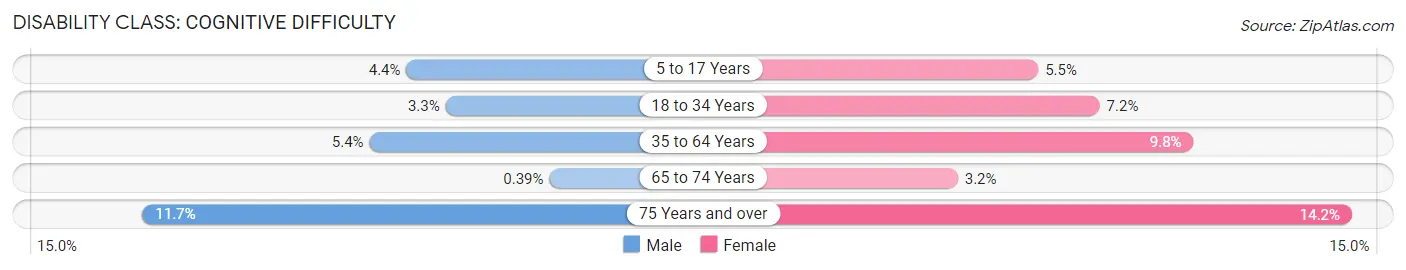
| Age Bracket | Male | Female |
| 5 to 17 Years | 21 (4.4%) | 21 (5.5%) |
| 18 to 34 Years | 66 (3.3%) | 89 (7.2%) |
| 35 to 64 Years | 83 (5.4%) | 125 (9.8%) |
| 65 to 74 Years | 1 (0.4%) | 9 (3.2%) |
| 75 Years and over | 15 (11.7%) | 25 (14.2%) |
Disability Class: Ambulatory Difficulty
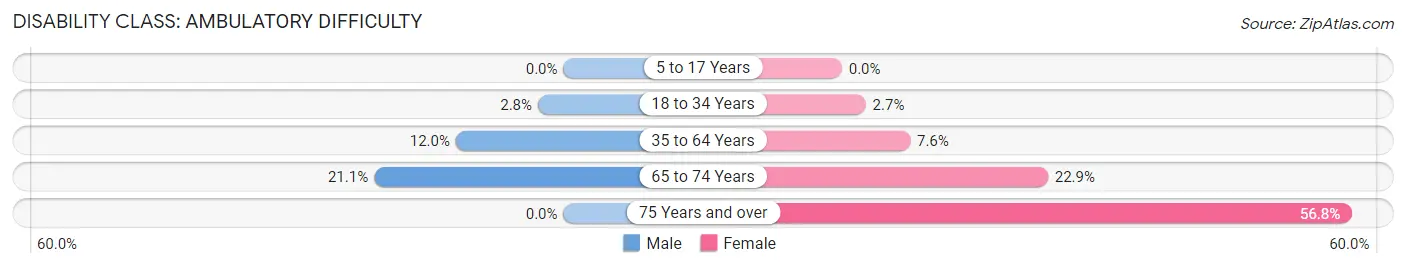
| Age Bracket | Male | Female |
| 5 to 17 Years | 0 (0.0%) | 0 (0.0%) |
| 18 to 34 Years | 57 (2.8%) | 33 (2.7%) |
| 35 to 64 Years | 184 (12.0%) | 97 (7.6%) |
| 65 to 74 Years | 54 (21.1%) | 64 (22.9%) |
| 75 Years and over | 0 (0.0%) | 100 (56.8%) |
Disability Class: Self-Care Difficulty
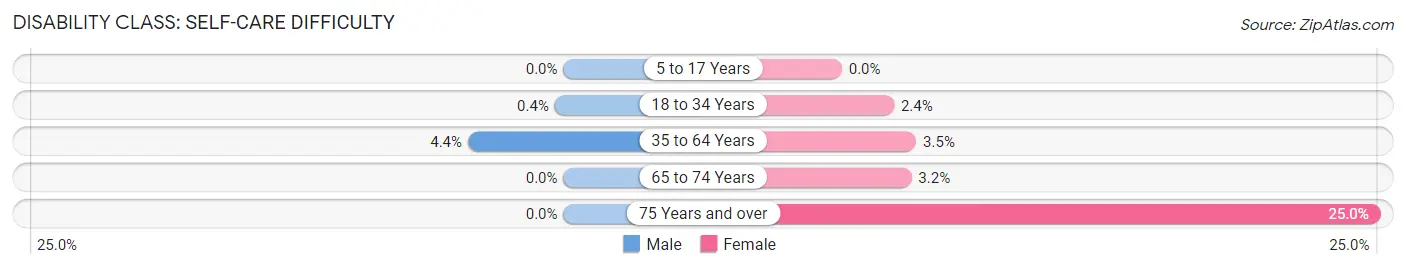
| Age Bracket | Male | Female |
| 5 to 17 Years | 0 (0.0%) | 0 (0.0%) |
| 18 to 34 Years | 8 (0.4%) | 30 (2.4%) |
| 35 to 64 Years | 68 (4.4%) | 44 (3.5%) |
| 65 to 74 Years | 0 (0.0%) | 9 (3.2%) |
| 75 Years and over | 0 (0.0%) | 44 (25.0%) |
Technology Access in Winooski
Computing Device Access in Winooski
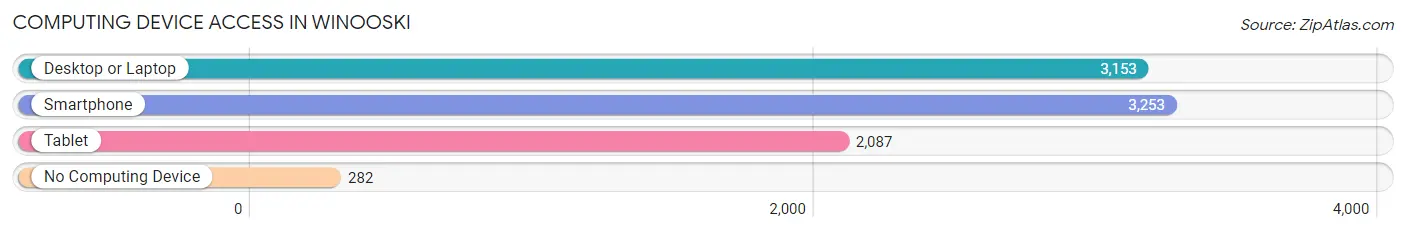
| Device Type | # Households | % Households |
| Desktop or Laptop | 3,153 | 85.5% |
| Smartphone | 3,253 | 88.2% |
| Tablet | 2,087 | 56.6% |
| No Computing Device | 282 | 7.6% |
| Total | 3,688 | 100.0% |
Internet Access in Winooski
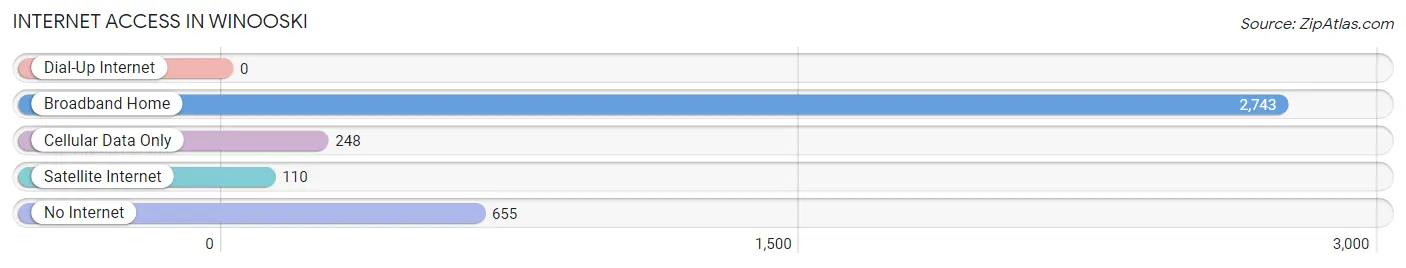
| Internet Type | # Households | % Households |
| Dial-Up Internet | 0 | 0.0% |
| Broadband Home | 2,743 | 74.4% |
| Cellular Data Only | 248 | 6.7% |
| Satellite Internet | 110 | 3.0% |
| No Internet | 655 | 17.8% |
| Total | 3,688 | 100.0% |
Winooski Summary
Winooski, Vermont is a small city located in Chittenden County, in the northwestern part of the state. It is situated on the Winooski River, which flows into Lake Champlain. The city is bordered by the towns of Colchester, Essex, and Williston. As of the 2010 census, the population of Winooski was 7,267.
History
The area that is now Winooski was originally inhabited by the Abenaki people, who called it “Osskonk”, meaning “wild onion”. The first European settlers arrived in the area in the late 1700s, and the town was officially incorporated in 1763. The town was named after the Winooski River, which was named by the Abenaki for the wild onions that grew along its banks.
In the early 1800s, Winooski was a thriving mill town, with several mills located along the river. The mills were powered by the river’s water, and produced a variety of goods, including lumber, paper, and textiles. The mills were a major source of employment for the town’s residents, and the town grew rapidly.
In the mid-1800s, Winooski was a major stop on the Underground Railroad, with many escaped slaves passing through the town on their way to freedom. The town was also home to a number of abolitionists, including the prominent Reverend William Slade.
In the late 1800s, Winooski was a major center of the woolen industry, with several mills producing woolen goods. The town was also home to a number of other industries, including a brewery, a tannery, and a brickyard.
Geography
Winooski is located in northwestern Vermont, in Chittenden County. It is situated on the Winooski River, which flows into Lake Champlain. The city is bordered by the towns of Colchester, Essex, and Williston.
The city has a total area of 2.3 square miles, all of which is land. The terrain is mostly flat, with some hills in the northern part of the city. The highest point in the city is located at an elevation of 545 feet.
Economy
Winooski’s economy is largely based on services and retail. The city is home to a number of businesses, including restaurants, banks, and retail stores. The city is also home to a number of government offices, including the Chittenden County Courthouse and the Winooski City Hall.
The city is also home to a number of manufacturing companies, including a paper mill, a printing company, and a plastics manufacturer. The city is also home to a number of technology companies, including a software development firm and a web design company.
Demographics
As of the 2010 census, the population of Winooski was 7,267. The racial makeup of the city was 87.3% White, 5.2% African American, 0.7% Native American, 2.2% Asian, 0.1% Pacific Islander, 1.2% from other races, and 3.3% from two or more races. Hispanic or Latino of any race were 3.7% of the population.
The median household income in Winooski was $41,945, and the median family income was $50,945. The per capita income in the city was $22,945. About 11.3% of the population was below the poverty line.
Common Questions
What is Per Capita Income in Winooski?
Per Capita income in Winooski is $38,554.
What is the Median Family Income in Winooski?
Median Family Income in Winooski is $97,870.
What is the Median Household income in Winooski?
Median Household Income in Winooski is $69,783.
What is Income or Wage Gap in Winooski?
Income or Wage Gap in Winooski is 7.5%.
Women in Winooski earn 92.5 cents for every dollar earned by a man.
What is Family Income Deficit in Winooski?
Family Income Deficit in Winooski is $8,282.
Families that are below poverty line in Winooski earn $8,282 less on average than the poverty threshold level.
What is Inequality or Gini Index in Winooski?
Inequality or Gini Index in Winooski is 0.43.
What is the Total Population of Winooski?
Total Population of Winooski is 8,122.
What is the Total Male Population of Winooski?
Total Male Population of Winooski is 4,595.
What is the Total Female Population of Winooski?
Total Female Population of Winooski is 3,527.
What is the Ratio of Males per 100 Females in Winooski?
There are 130.28 Males per 100 Females in Winooski.
What is the Ratio of Females per 100 Males in Winooski?
There are 76.76 Females per 100 Males in Winooski.
What is the Median Population Age in Winooski?
Median Population Age in Winooski is 32.3 Years.
What is the Average Family Size in Winooski
Average Family Size in Winooski is 3.2 People.
What is the Average Household Size in Winooski
Average Household Size in Winooski is 2.2 People.
How Large is the Labor Force in Winooski?
There are 5,452 People in the Labor Forcein in Winooski.
What is the Percentage of People in the Labor Force in Winooski?
77.8% of People are in the Labor Force in Winooski.
What is the Unemployment Rate in Winooski?
Unemployment Rate in Winooski is 1.9%.