Alice, TX Map & Demographics
Alice Map
Alice Overview
$23,251
PER CAPITA INCOME
$51,892
AVG FAMILY INCOME
$43,017
AVG HOUSEHOLD INCOME
41.0%
WAGE / INCOME GAP [ % ]
59.0¢/ $1
WAGE / INCOME GAP [ $ ]
0.48
INEQUALITY / GINI INDEX
17,916
TOTAL POPULATION
8,450
MALE POPULATION
9,466
FEMALE POPULATION
89.27
MALES / 100 FEMALES
112.02
FEMALES / 100 MALES
35.0
MEDIAN AGE
3.5
AVG FAMILY SIZE
3.0
AVG HOUSEHOLD SIZE
7,166
LABOR FORCE [ PEOPLE ]
54.0%
PERCENT IN LABOR FORCE
3.3%
UNEMPLOYMENT RATE
Alice Zip Codes
Alice Area Codes
Income in Alice
Income Overview in Alice
Per Capita Income in Alice is $23,251, while median incomes of families and households are $51,892 and $43,017 respectively.
| Characteristic | Number | Measure |
| Per Capita Income | 17,916 | $23,251 |
| Median Family Income | 4,535 | $51,892 |
| Mean Family Income | 4,535 | $72,391 |
| Median Household Income | 5,955 | $43,017 |
| Mean Household Income | 5,955 | $62,809 |
| Income Deficit | 4,535 | $0 |
| Wage / Income Gap (%) | 17,916 | 41.00% |
| Wage / Income Gap ($) | 17,916 | 59.00¢ per $1 |
| Gini / Inequality Index | 17,916 | 0.48 |
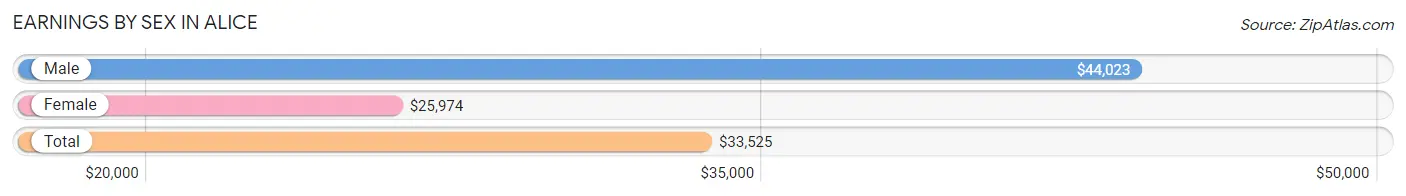
Earnings by Sex in Alice
Average Earnings in Alice are $33,525, $44,023 for men and $25,974 for women, a difference of 41.0%.
| Sex | Number | Average Earnings |
| Male | 3,685 (49.5%) | $44,023 |
| Female | 3,760 (50.5%) | $25,974 |
| Total | 7,445 (100.0%) | $33,525 |
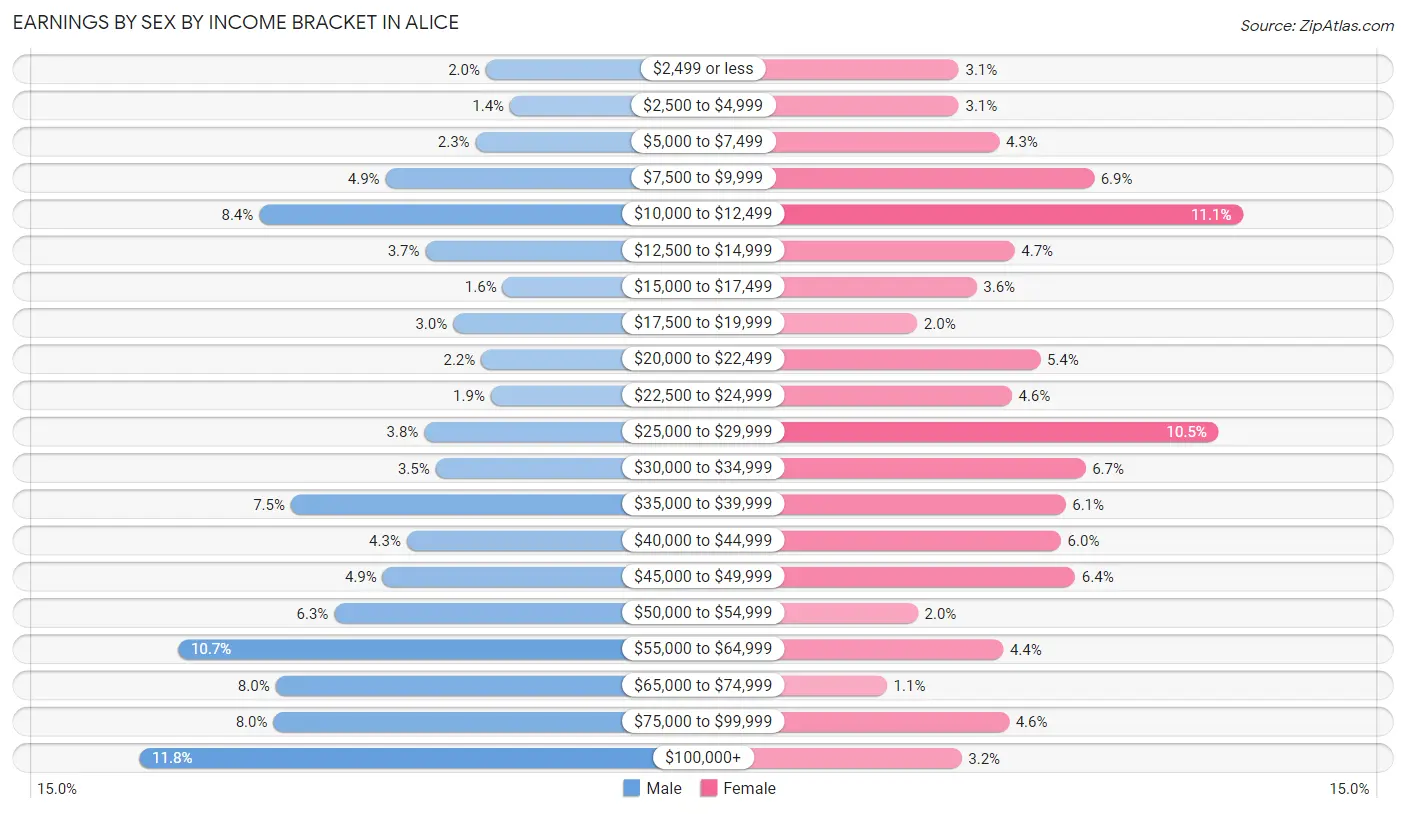
Earnings by Sex by Income Bracket in Alice
The most common earnings brackets in Alice are $100,000+ for men (434 | 11.8%) and $10,000 to $12,499 for women (419 | 11.1%).
| Income | Male | Female |
| $2,499 or less | 75 (2.0%) | 118 (3.1%) |
| $2,500 to $4,999 | 50 (1.4%) | 118 (3.1%) |
| $5,000 to $7,499 | 86 (2.3%) | 161 (4.3%) |
| $7,500 to $9,999 | 179 (4.9%) | 261 (6.9%) |
| $10,000 to $12,499 | 310 (8.4%) | 419 (11.1%) |
| $12,500 to $14,999 | 138 (3.7%) | 177 (4.7%) |
| $15,000 to $17,499 | 58 (1.6%) | 137 (3.6%) |
| $17,500 to $19,999 | 109 (3.0%) | 74 (2.0%) |
| $20,000 to $22,499 | 80 (2.2%) | 204 (5.4%) |
| $22,500 to $24,999 | 70 (1.9%) | 174 (4.6%) |
| $25,000 to $29,999 | 139 (3.8%) | 393 (10.4%) |
| $30,000 to $34,999 | 127 (3.5%) | 252 (6.7%) |
| $35,000 to $39,999 | 277 (7.5%) | 231 (6.1%) |
| $40,000 to $44,999 | 157 (4.3%) | 226 (6.0%) |
| $45,000 to $49,999 | 182 (4.9%) | 241 (6.4%) |
| $50,000 to $54,999 | 232 (6.3%) | 75 (2.0%) |
| $55,000 to $64,999 | 394 (10.7%) | 165 (4.4%) |
| $65,000 to $74,999 | 293 (8.0%) | 42 (1.1%) |
| $75,000 to $99,999 | 295 (8.0%) | 171 (4.5%) |
| $100,000+ | 434 (11.8%) | 121 (3.2%) |
| Total | 3,685 (100.0%) | 3,760 (100.0%) |
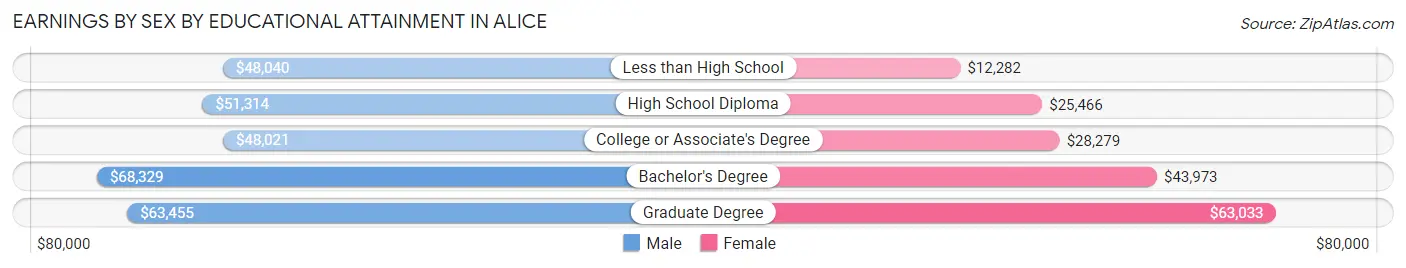
Earnings by Sex by Educational Attainment in Alice
Average earnings in Alice are $50,188 for men and $27,580 for women, a difference of 45.1%. Men with an educational attainment of bachelor's degree enjoy the highest average annual earnings of $68,329, while those with college or associate's degree education earn the least with $48,021. Women with an educational attainment of graduate degree earn the most with the average annual earnings of $63,033, while those with less than high school education have the smallest earnings of $12,282.
| Educational Attainment | Male Income | Female Income |
| Less than High School | $48,040 | $12,282 |
| High School Diploma | $51,314 | $25,466 |
| College or Associate's Degree | $48,021 | $28,279 |
| Bachelor's Degree | $68,329 | $43,973 |
| Graduate Degree | $63,455 | $63,033 |
| Total | $50,188 | $27,580 |
Family Income in Alice
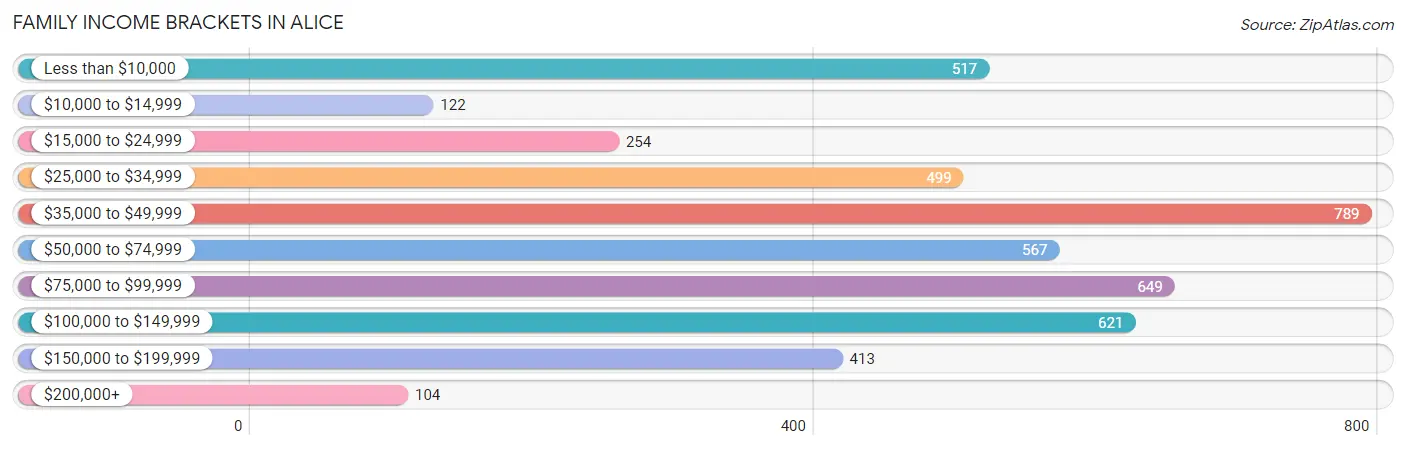
Family Income Brackets in Alice
According to the Alice family income data, there are 789 families falling into the $35,000 to $49,999 income range, which is the most common income bracket and makes up 17.4% of all families. Conversely, the $200,000+ income bracket is the least frequent group with only 104 families (2.3%) belonging to this category.
| Income Bracket | # Families | % Families |
| Less than $10,000 | 517 | 11.4% |
| $10,000 to $14,999 | 122 | 2.7% |
| $15,000 to $24,999 | 254 | 5.6% |
| $25,000 to $34,999 | 499 | 11.0% |
| $35,000 to $49,999 | 789 | 17.4% |
| $50,000 to $74,999 | 567 | 12.5% |
| $75,000 to $99,999 | 649 | 14.3% |
| $100,000 to $149,999 | 621 | 13.7% |
| $150,000 to $199,999 | 413 | 9.1% |
| $200,000+ | 104 | 2.3% |
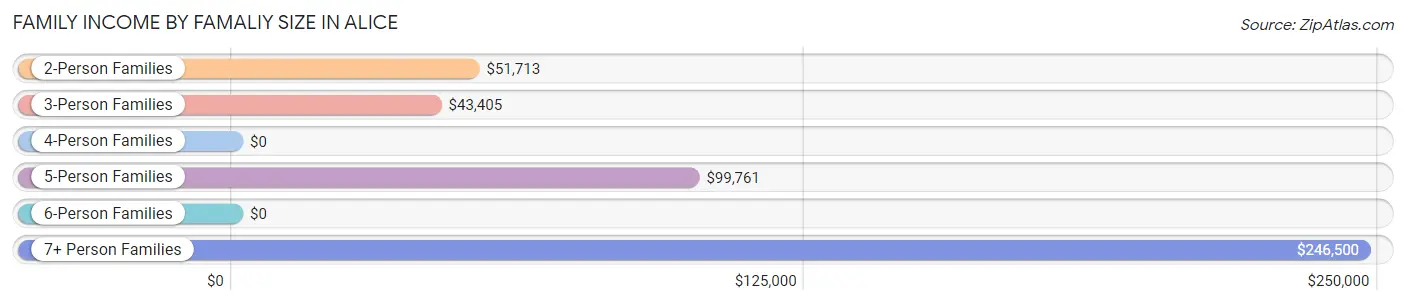
Family Income by Famaliy Size in Alice
7+ person families (66 | 1.5%) account for the highest median family income in Alice with $246,500 per family, while 7+ person families (66 | 1.5%) have the highest median income of $35,214 per family member.
| Income Bracket | # Families | Median Income |
| 2-Person Families | 1,937 (42.7%) | $51,713 |
| 3-Person Families | 1,063 (23.4%) | $43,405 |
| 4-Person Families | 610 (13.5%) | $0 |
| 5-Person Families | 466 (10.3%) | $99,761 |
| 6-Person Families | 393 (8.7%) | $0 |
| 7+ Person Families | 66 (1.5%) | $246,500 |
| Total | 4,535 (100.0%) | $51,892 |
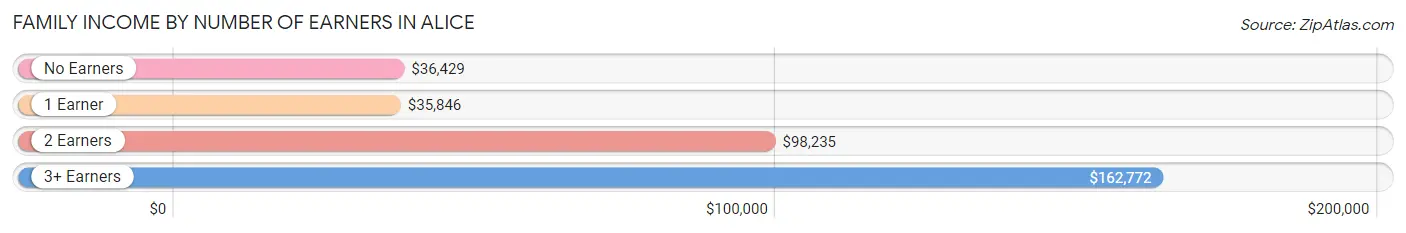
Family Income by Number of Earners in Alice
The median family income in Alice is $51,892, with families comprising 3+ earners (329) having the highest median family income of $162,772, while families with 1 earner (2,136) have the lowest median family income of $35,846, accounting for 7.2% and 47.1% of families, respectively.
| Number of Earners | # Families | Median Income |
| No Earners | 680 (15.0%) | $36,429 |
| 1 Earner | 2,136 (47.1%) | $35,846 |
| 2 Earners | 1,390 (30.6%) | $98,235 |
| 3+ Earners | 329 (7.2%) | $162,772 |
| Total | 4,535 (100.0%) | $51,892 |
Household Income in Alice
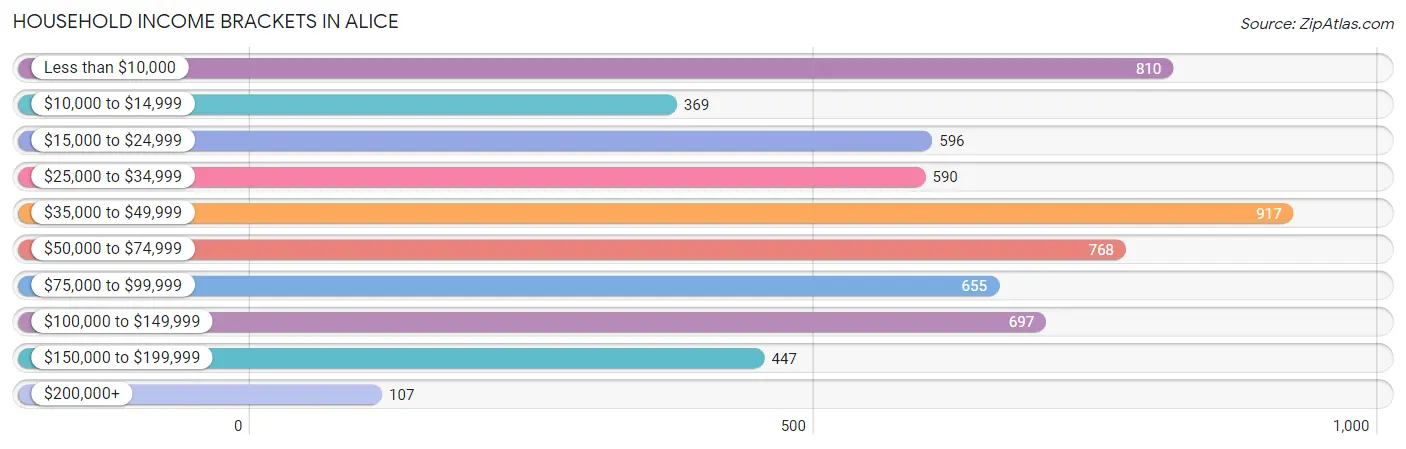
Household Income Brackets in Alice
With 917 households falling in the category, the $35,000 to $49,999 income range is the most frequent in Alice, accounting for 15.4% of all households. In contrast, only 107 households (1.8%) fall into the $200,000+ income bracket, making it the least populous group.
| Income Bracket | # Households | % Households |
| Less than $10,000 | 810 | 13.6% |
| $10,000 to $14,999 | 369 | 6.2% |
| $15,000 to $24,999 | 596 | 10.0% |
| $25,000 to $34,999 | 590 | 9.9% |
| $35,000 to $49,999 | 917 | 15.4% |
| $50,000 to $74,999 | 768 | 12.9% |
| $75,000 to $99,999 | 655 | 11.0% |
| $100,000 to $149,999 | 697 | 11.7% |
| $150,000 to $199,999 | 447 | 7.5% |
| $200,000+ | 107 | 1.8% |
Household Income by Householder Age in Alice
The median household income in Alice is $43,017, with the highest median household income of $58,560 found in the 45 to 64 years age bracket for the primary householder. A total of 1,909 households (32.1%) fall into this category. Meanwhile, the 15 to 24 years age bracket for the primary householder has the lowest median household income of $21,620, with 295 households (5.0%) in this group.
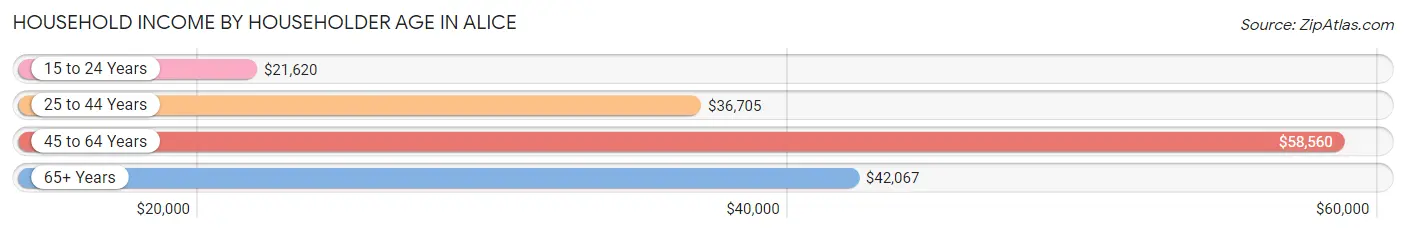
| Income Bracket | # Households | Median Income |
| 15 to 24 Years | 295 (5.0%) | $21,620 |
| 25 to 44 Years | 2,185 (36.7%) | $36,705 |
| 45 to 64 Years | 1,909 (32.1%) | $58,560 |
| 65+ Years | 1,566 (26.3%) | $42,067 |
| Total | 5,955 (100.0%) | $43,017 |
Poverty in Alice
Income Below Poverty by Sex and Age in Alice
With 19.5% poverty level for males and 35.0% for females among the residents of Alice, 6 to 11 year old males and 15 year old females are the most vulnerable to poverty, with 522 males (45.8%) and 283 females (78.2%) in their respective age groups living below the poverty level.
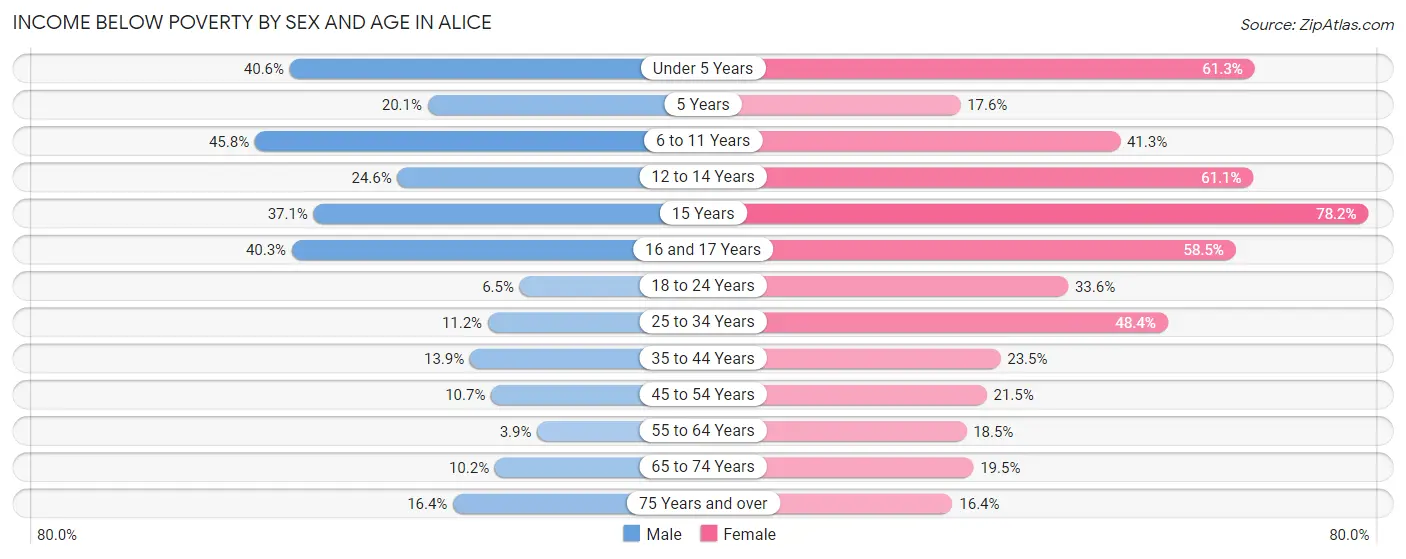
| Age Bracket | Male | Female |
| Under 5 Years | 160 (40.6%) | 396 (61.3%) |
| 5 Years | 30 (20.1%) | 16 (17.6%) |
| 6 to 11 Years | 522 (45.8%) | 321 (41.3%) |
| 12 to 14 Years | 113 (24.6%) | 253 (61.1%) |
| 15 Years | 76 (37.1%) | 283 (78.2%) |
| 16 and 17 Years | 135 (40.3%) | 162 (58.5%) |
| 18 to 24 Years | 60 (6.5%) | 257 (33.6%) |
| 25 to 34 Years | 84 (11.2%) | 598 (48.4%) |
| 35 to 44 Years | 163 (13.9%) | 308 (23.5%) |
| 45 to 54 Years | 98 (10.7%) | 242 (21.5%) |
| 55 to 64 Years | 25 (3.9%) | 169 (18.5%) |
| 65 to 74 Years | 67 (10.2%) | 169 (19.5%) |
| 75 Years and over | 88 (16.4%) | 87 (16.4%) |
| Total | 1,621 (19.5%) | 3,261 (35.0%) |
Income Above Poverty by Sex and Age in Alice
According to the poverty statistics in Alice, males aged 55 to 64 years and females aged 75 years and over are the age groups that are most secure financially, with 96.1% of males and 83.6% of females in these age groups living above the poverty line.
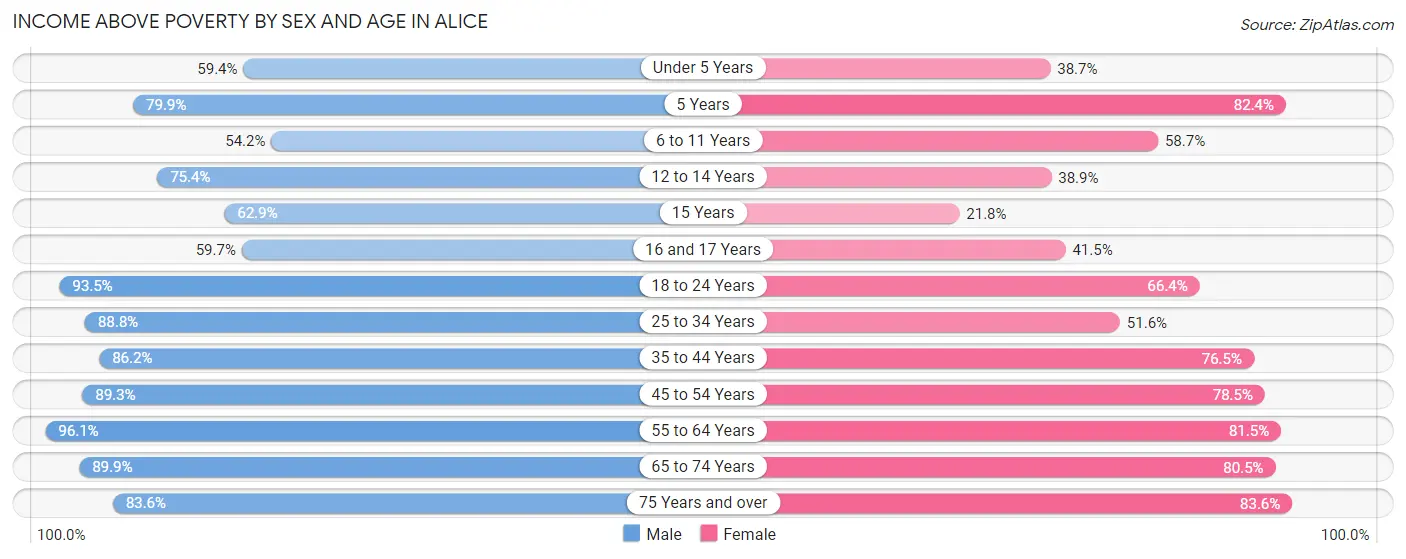
| Age Bracket | Male | Female |
| Under 5 Years | 234 (59.4%) | 250 (38.7%) |
| 5 Years | 119 (79.9%) | 75 (82.4%) |
| 6 to 11 Years | 618 (54.2%) | 456 (58.7%) |
| 12 to 14 Years | 346 (75.4%) | 161 (38.9%) |
| 15 Years | 129 (62.9%) | 79 (21.8%) |
| 16 and 17 Years | 200 (59.7%) | 115 (41.5%) |
| 18 to 24 Years | 867 (93.5%) | 508 (66.4%) |
| 25 to 34 Years | 666 (88.8%) | 638 (51.6%) |
| 35 to 44 Years | 1,014 (86.2%) | 1,001 (76.5%) |
| 45 to 54 Years | 817 (89.3%) | 884 (78.5%) |
| 55 to 64 Years | 621 (96.1%) | 746 (81.5%) |
| 65 to 74 Years | 593 (89.8%) | 697 (80.5%) |
| 75 Years and over | 450 (83.6%) | 443 (83.6%) |
| Total | 6,674 (80.5%) | 6,053 (65.0%) |
Income Below Poverty Among Married-Couple Families in Alice
The poverty statistics for married-couple families in Alice show that 7.9% or 215 of the total 2,716 families live below the poverty line. Families with 3 or 4 children have the highest poverty rate of 19.6%, comprising of 73 families. On the other hand, families with no children have the lowest poverty rate of 5.6%, which includes 94 families.
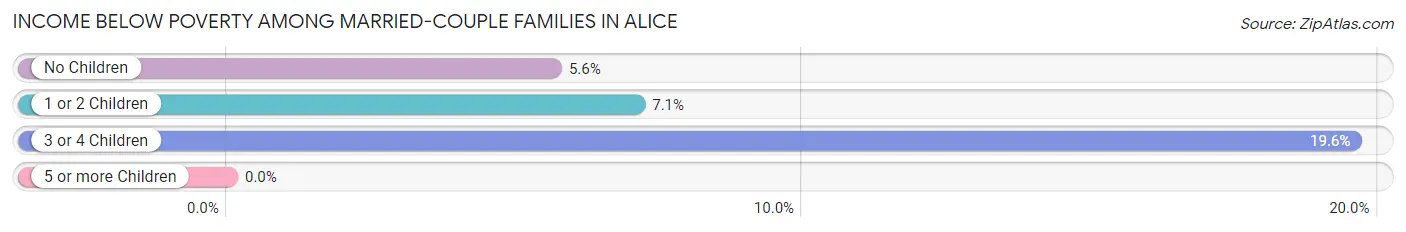
| Children | Above Poverty | Below Poverty |
| No Children | 1,572 (94.4%) | 94 (5.6%) |
| 1 or 2 Children | 629 (92.9%) | 48 (7.1%) |
| 3 or 4 Children | 300 (80.4%) | 73 (19.6%) |
| 5 or more Children | 0 (0.0%) | 0 (0.0%) |
| Total | 2,501 (92.1%) | 215 (7.9%) |
Income Below Poverty Among Single-Parent Households in Alice
According to the poverty data in Alice, 4.7% or 19 single-father households and 55.1% or 780 single-mother households are living below the poverty line. Among single-father households, those with no children have the highest poverty rate, with 15 households (5.3%) experiencing poverty. Likewise, among single-mother households, those with 5 or more children have the highest poverty rate, with 192 households (100.0%) falling below the poverty line.
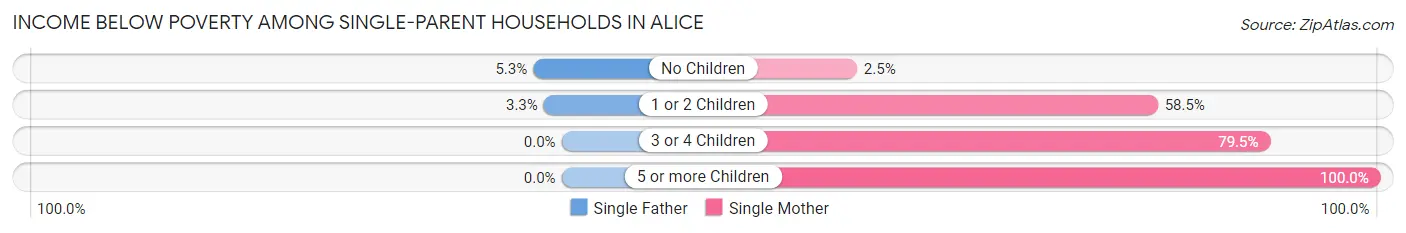
| Children | Single Father | Single Mother |
| No Children | 15 (5.3%) | 7 (2.5%) |
| 1 or 2 Children | 4 (3.3%) | 465 (58.5%) |
| 3 or 4 Children | 0 (0.0%) | 116 (79.4%) |
| 5 or more Children | 0 (0.0%) | 192 (100.0%) |
| Total | 19 (4.7%) | 780 (55.1%) |
Income Below Poverty Among Married-Couple vs Single-Parent Households in Alice
The poverty data for Alice shows that 215 of the married-couple family households (7.9%) and 799 of the single-parent households (43.9%) are living below the poverty level. Within the married-couple family households, those with 3 or 4 children have the highest poverty rate, with 73 households (19.6%) falling below the poverty line. Among the single-parent households, those with 5 or more children have the highest poverty rate, with 192 household (100.0%) living below poverty.
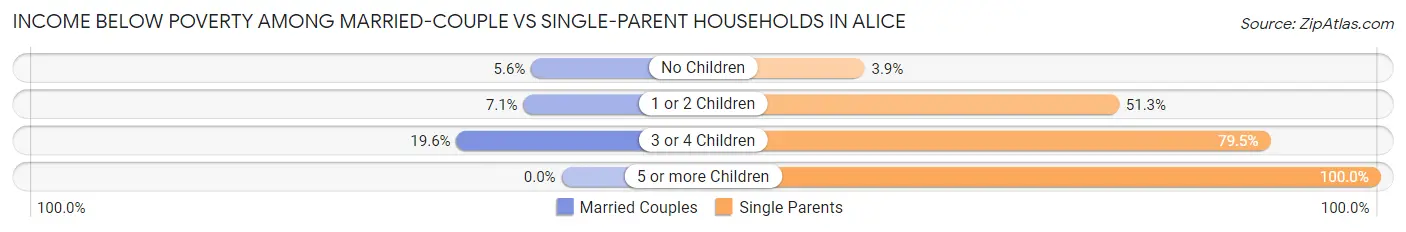
| Children | Married-Couple Families | Single-Parent Households |
| No Children | 94 (5.6%) | 22 (3.9%) |
| 1 or 2 Children | 48 (7.1%) | 469 (51.3%) |
| 3 or 4 Children | 73 (19.6%) | 116 (79.4%) |
| 5 or more Children | 0 (0.0%) | 192 (100.0%) |
| Total | 215 (7.9%) | 799 (43.9%) |
Race in Alice
The most populous races in Alice are Hispanic or Latino (15,780 | 88.1%), White / Caucasian (14,922 | 83.3%), and Two or more Races (1,705 | 9.5%).
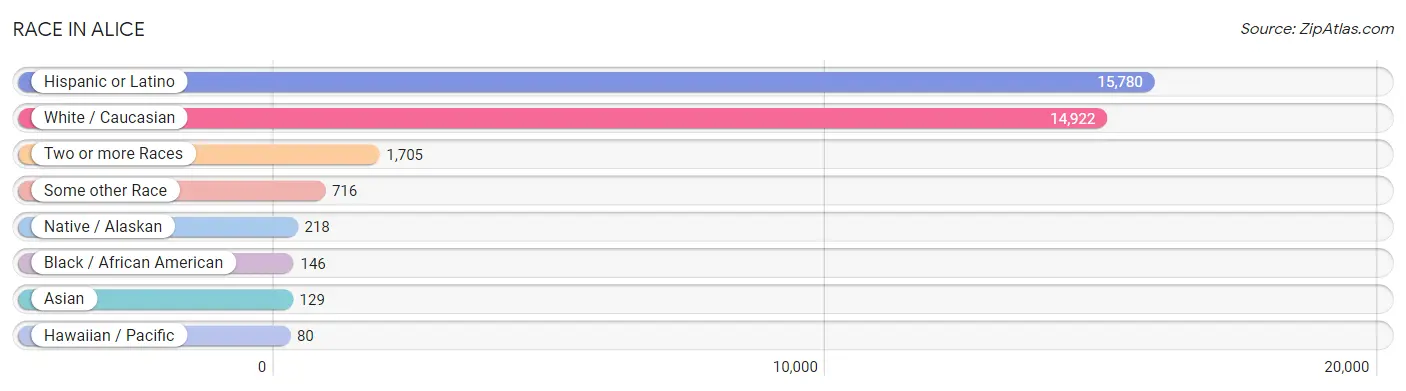
| Race | # Population | % Population |
| Asian | 129 | 0.7% |
| Black / African American | 146 | 0.8% |
| Hawaiian / Pacific | 80 | 0.4% |
| Hispanic or Latino | 15,780 | 88.1% |
| Native / Alaskan | 218 | 1.2% |
| White / Caucasian | 14,922 | 83.3% |
| Two or more Races | 1,705 | 9.5% |
| Some other Race | 716 | 4.0% |
| Total | 17,916 | 100.0% |
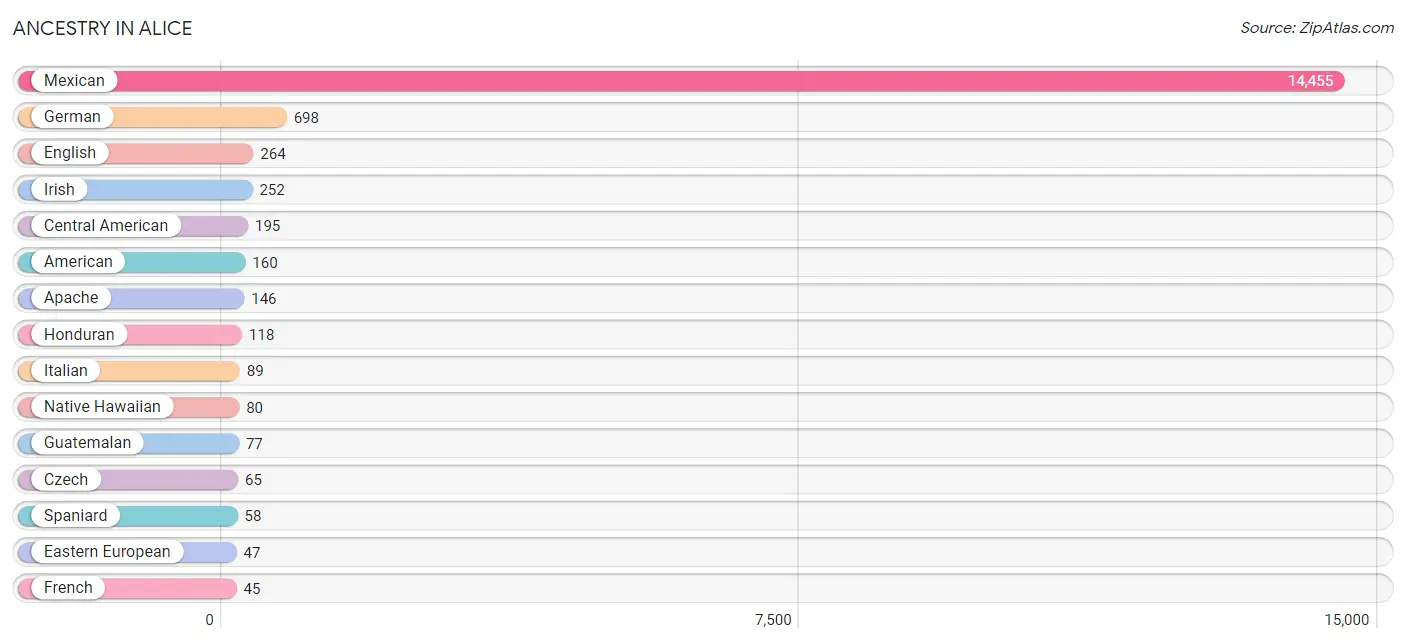
Ancestry in Alice
The most populous ancestries reported in Alice are Mexican (14,455 | 80.7%), German (698 | 3.9%), English (264 | 1.5%), Irish (252 | 1.4%), and Central American (195 | 1.1%), together accounting for 88.6% of all Alice residents.
| Ancestry | # Population | % Population |
| Albanian | 8 | 0.0% |
| American | 160 | 0.9% |
| Apache | 146 | 0.8% |
| Arab | 5 | 0.0% |
| Argentinean | 6 | 0.0% |
| British | 4 | 0.0% |
| Central American | 195 | 1.1% |
| Cherokee | 33 | 0.2% |
| Comanche | 20 | 0.1% |
| Czech | 65 | 0.4% |
| Dutch | 23 | 0.1% |
| Eastern European | 47 | 0.3% |
| English | 264 | 1.5% |
| European | 5 | 0.0% |
| French | 45 | 0.3% |
| German | 698 | 3.9% |
| Greek | 21 | 0.1% |
| Guatemalan | 77 | 0.4% |
| Honduran | 118 | 0.7% |
| Irish | 252 | 1.4% |
| Italian | 89 | 0.5% |
| Korean | 17 | 0.1% |
| Lebanese | 5 | 0.0% |
| Mexican | 14,455 | 80.7% |
| Native Hawaiian | 80 | 0.4% |
| Paraguayan | 13 | 0.1% |
| Pennsylvania German | 33 | 0.2% |
| Polish | 21 | 0.1% |
| Puerto Rican | 5 | 0.0% |
| Russian | 12 | 0.1% |
| Scotch-Irish | 13 | 0.1% |
| Scottish | 36 | 0.2% |
| Serbian | 18 | 0.1% |
| South American | 19 | 0.1% |
| Spaniard | 58 | 0.3% |
| Spanish | 18 | 0.1% | View All 36 Rows |
Immigrants in Alice
The most numerous immigrant groups reported in Alice came from Latin America (732 | 4.1%), Central America (713 | 4.0%), Mexico (531 | 3.0%), Honduras (105 | 0.6%), and Guatemala (77 | 0.4%), together accounting for 12.0% of all Alice residents.
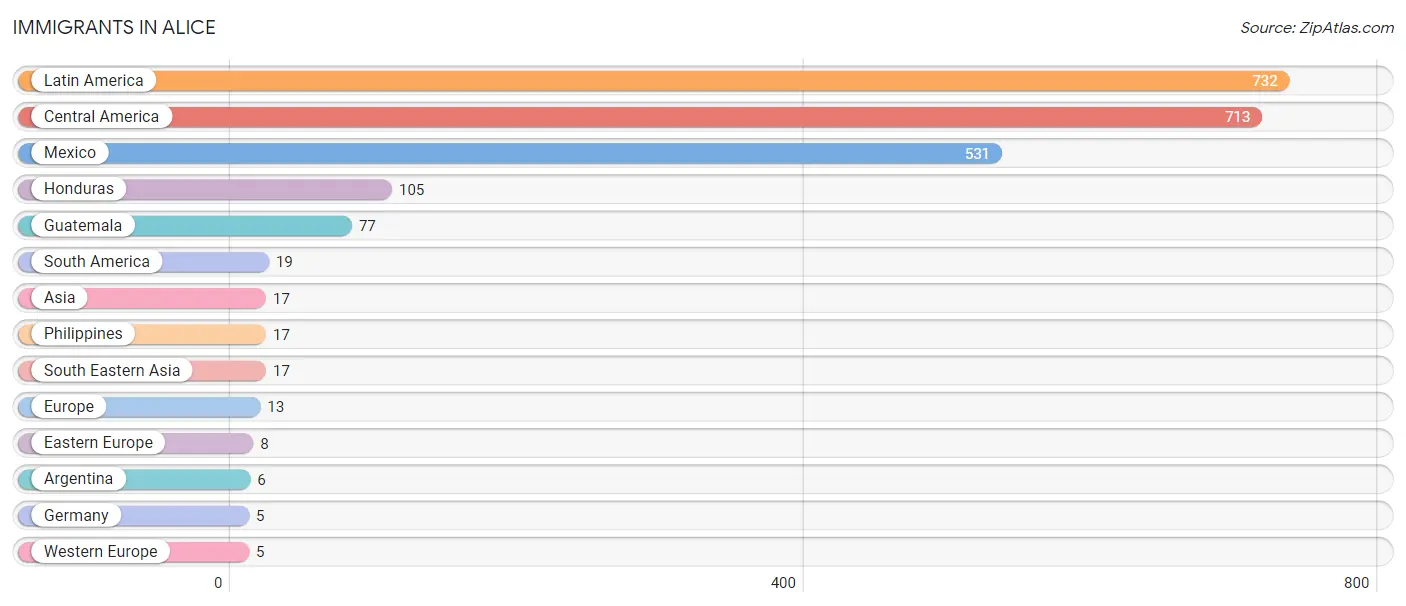
| Immigration Origin | # Population | % Population |
| Argentina | 6 | 0.0% |
| Asia | 17 | 0.1% |
| Central America | 713 | 4.0% |
| Eastern Europe | 8 | 0.0% |
| Europe | 13 | 0.1% |
| Germany | 5 | 0.0% |
| Guatemala | 77 | 0.4% |
| Honduras | 105 | 0.6% |
| Latin America | 732 | 4.1% |
| Mexico | 531 | 3.0% |
| Philippines | 17 | 0.1% |
| South America | 19 | 0.1% |
| South Eastern Asia | 17 | 0.1% |
| Western Europe | 5 | 0.0% | View All 14 Rows |
Sex and Age in Alice
Sex and Age in Alice
The most populous age groups in Alice are 5 to 9 Years (887 | 10.5%) for men and 15 to 19 Years (910 | 9.6%) for women.
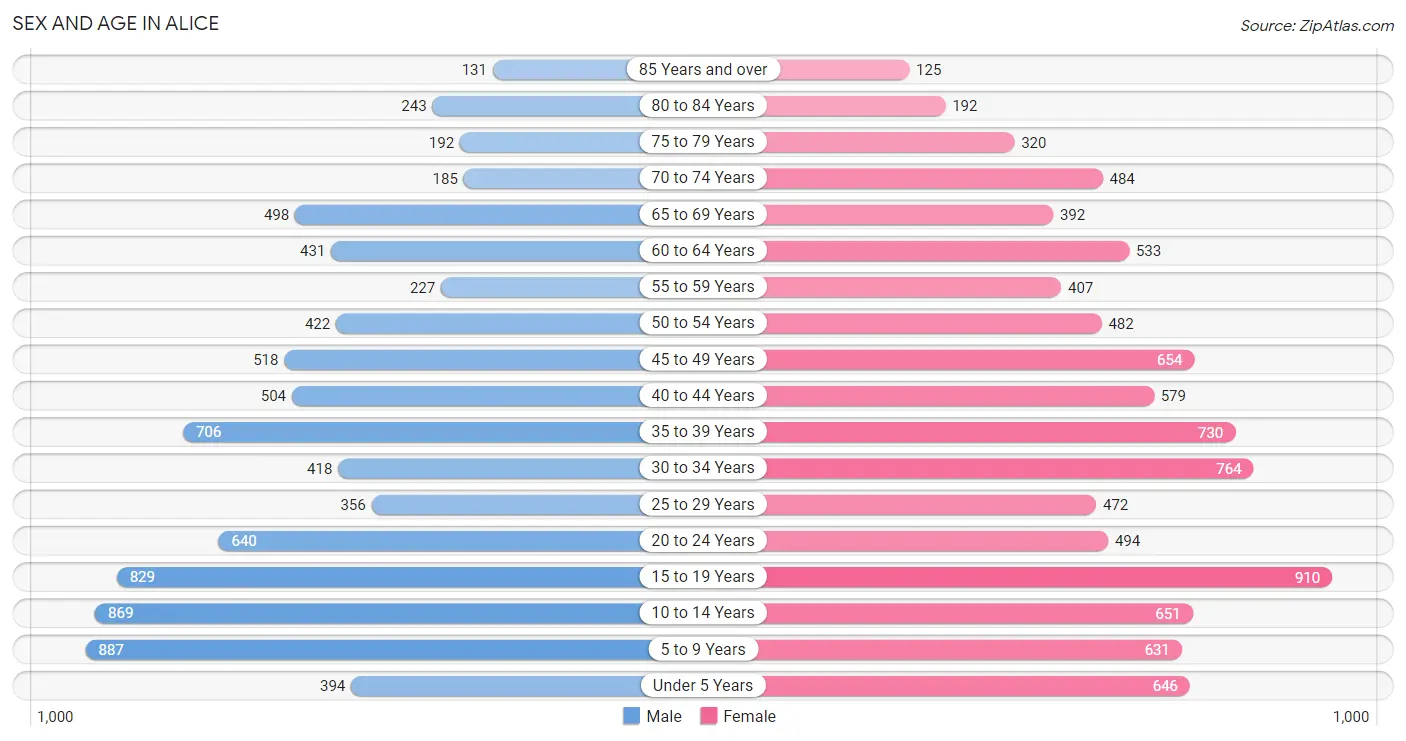
| Age Bracket | Male | Female |
| Under 5 Years | 394 (4.7%) | 646 (6.8%) |
| 5 to 9 Years | 887 (10.5%) | 631 (6.7%) |
| 10 to 14 Years | 869 (10.3%) | 651 (6.9%) |
| 15 to 19 Years | 829 (9.8%) | 910 (9.6%) |
| 20 to 24 Years | 640 (7.6%) | 494 (5.2%) |
| 25 to 29 Years | 356 (4.2%) | 472 (5.0%) |
| 30 to 34 Years | 418 (5.0%) | 764 (8.1%) |
| 35 to 39 Years | 706 (8.4%) | 730 (7.7%) |
| 40 to 44 Years | 504 (6.0%) | 579 (6.1%) |
| 45 to 49 Years | 518 (6.1%) | 654 (6.9%) |
| 50 to 54 Years | 422 (5.0%) | 482 (5.1%) |
| 55 to 59 Years | 227 (2.7%) | 407 (4.3%) |
| 60 to 64 Years | 431 (5.1%) | 533 (5.6%) |
| 65 to 69 Years | 498 (5.9%) | 392 (4.1%) |
| 70 to 74 Years | 185 (2.2%) | 484 (5.1%) |
| 75 to 79 Years | 192 (2.3%) | 320 (3.4%) |
| 80 to 84 Years | 243 (2.9%) | 192 (2.0%) |
| 85 Years and over | 131 (1.5%) | 125 (1.3%) |
| Total | 8,450 (100.0%) | 9,466 (100.0%) |
Families and Households in Alice
Median Family Size in Alice
The median family size in Alice is 3.45 persons per family, with single female/mother families (1,416 | 31.2%) accounting for the largest median family size of 3.87 persons per family. On the other hand, single male/father families (403 | 8.9%) represent the smallest median family size with 2.28 persons per family.
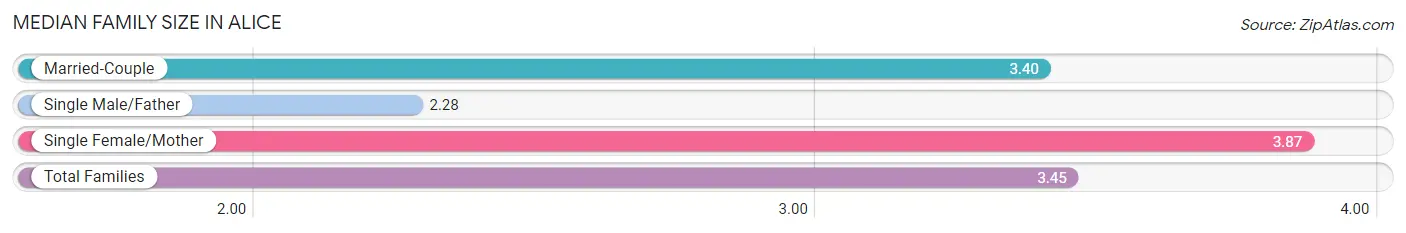
| Family Type | # Families | Family Size |
| Married-Couple | 2,716 (59.9%) | 3.40 |
| Single Male/Father | 403 (8.9%) | 2.28 |
| Single Female/Mother | 1,416 (31.2%) | 3.87 |
| Total Families | 4,535 (100.0%) | 3.45 |
Median Household Size in Alice
The median household size in Alice is 2.95 persons per household, with single female/mother households (1,416 | 23.8%) accounting for the largest median household size of 3.98 persons per household. non-family households (1,420 | 23.8%) represent the smallest median household size with 1.16 persons per household.
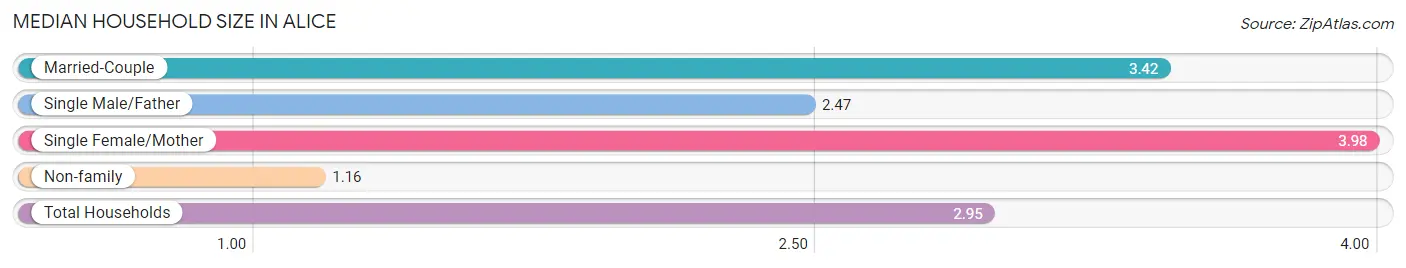
| Household Type | # Households | Household Size |
| Married-Couple | 2,716 (45.6%) | 3.42 |
| Single Male/Father | 403 (6.8%) | 2.47 |
| Single Female/Mother | 1,416 (23.8%) | 3.98 |
| Non-family | 1,420 (23.8%) | 1.16 |
| Total Households | 5,955 (100.0%) | 2.95 |
Household Size by Marriage Status in Alice
Out of a total of 5,955 households in Alice, 4,535 (76.1%) are family households, while 1,420 (23.8%) are nonfamily households. The most numerous type of family households are 2-person households, comprising 1,892, and the most common type of nonfamily households are 1-person households, comprising 1,222.
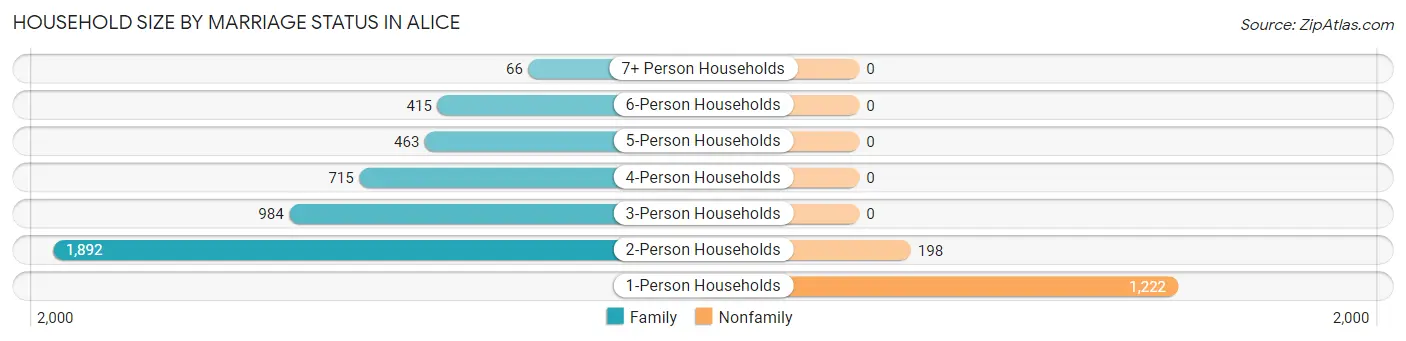
| Household Size | Family Households | Nonfamily Households |
| 1-Person Households | - | 1,222 (20.5%) |
| 2-Person Households | 1,892 (31.8%) | 198 (3.3%) |
| 3-Person Households | 984 (16.5%) | 0 (0.0%) |
| 4-Person Households | 715 (12.0%) | 0 (0.0%) |
| 5-Person Households | 463 (7.8%) | 0 (0.0%) |
| 6-Person Households | 415 (7.0%) | 0 (0.0%) |
| 7+ Person Households | 66 (1.1%) | 0 (0.0%) |
| Total | 4,535 (76.1%) | 1,420 (23.8%) |
Female Fertility in Alice
Fertility by Age in Alice
Average fertility rate in Alice is 85.0 births per 1,000 women. Women in the age bracket of 15 to 19 years have the highest fertility rate with 227.0 births per 1,000 women. Women in the age bracket of 15 to 19 years acount for 52.7% of all women with births.
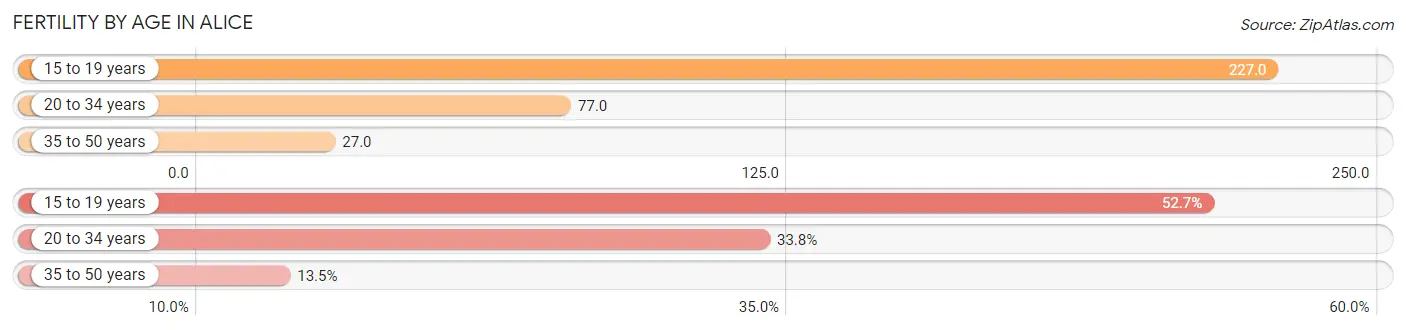
| Age Bracket | Women with Births | Births / 1,000 Women |
| 15 to 19 years | 207 (52.7%) | 227.0 |
| 20 to 34 years | 133 (33.8%) | 77.0 |
| 35 to 50 years | 53 (13.5%) | 27.0 |
| Total | 393 (100.0%) | 85.0 |
Fertility by Age by Marriage Status in Alice
26.0% of women with births (393) in Alice are married. The highest percentage of unmarried women with births falls into 15 to 19 years age bracket with 100.0% of them unmarried at the time of birth, while the lowest percentage of unmarried women with births belong to 35 to 50 years age bracket with 0.0% of them unmarried.
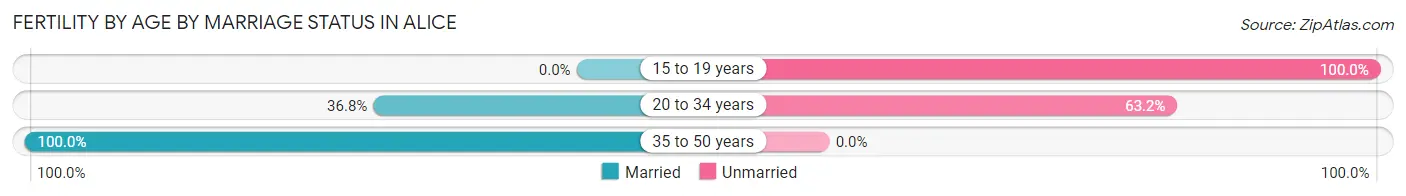
| Age Bracket | Married | Unmarried |
| 15 to 19 years | 0 (0.0%) | 207 (100.0%) |
| 20 to 34 years | 49 (36.8%) | 84 (63.2%) |
| 35 to 50 years | 53 (100.0%) | 0 (0.0%) |
| Total | 102 (26.0%) | 291 (74.1%) |
Fertility by Education in Alice
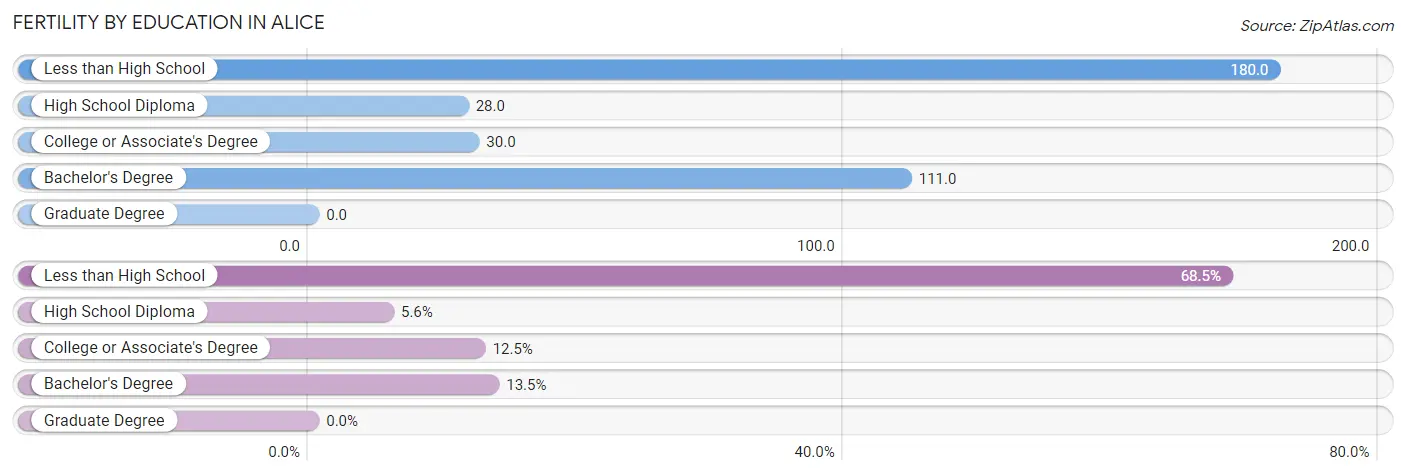
| Educational Attainment | Women with Births | Births / 1,000 Women |
| Less than High School | 269 (68.4%) | 180.0 |
| High School Diploma | 22 (5.6%) | 28.0 |
| College or Associate's Degree | 49 (12.5%) | 30.0 |
| Bachelor's Degree | 53 (13.5%) | 111.0 |
| Graduate Degree | 0 (0.0%) | 0.0 |
| Total | 393 (100.0%) | 85.0 |
Fertility by Education by Marriage Status in Alice
74.1% of women with births in Alice are unmarried. Women with the educational attainment of college or associate's degree are most likely to be married with 100.0% of them married at childbirth, while women with the educational attainment of less than high school are least likely to be married with 100.0% of them unmarried at childbirth.
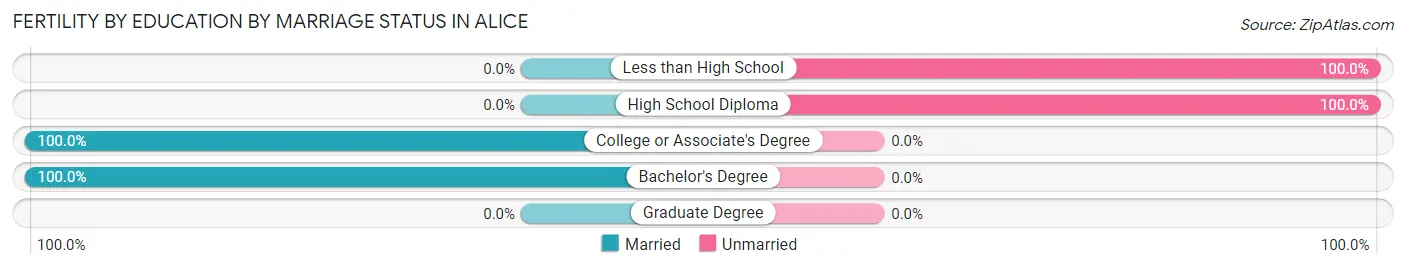
| Educational Attainment | Married | Unmarried |
| Less than High School | 0 (0.0%) | 269 (100.0%) |
| High School Diploma | 0 (0.0%) | 22 (100.0%) |
| College or Associate's Degree | 49 (100.0%) | 0 (0.0%) |
| Bachelor's Degree | 53 (100.0%) | 0 (0.0%) |
| Graduate Degree | 0 (0.0%) | 0 (0.0%) |
| Total | 102 (26.0%) | 291 (74.1%) |
Employment Characteristics in Alice
Employment by Class of Employer in Alice
Among the 6,733 employed individuals in Alice, private company employees (4,598 | 68.3%), local government employees (738 | 11.0%), and self-employed (not incorporated) (606 | 9.0%) make up the most common classes of employment.
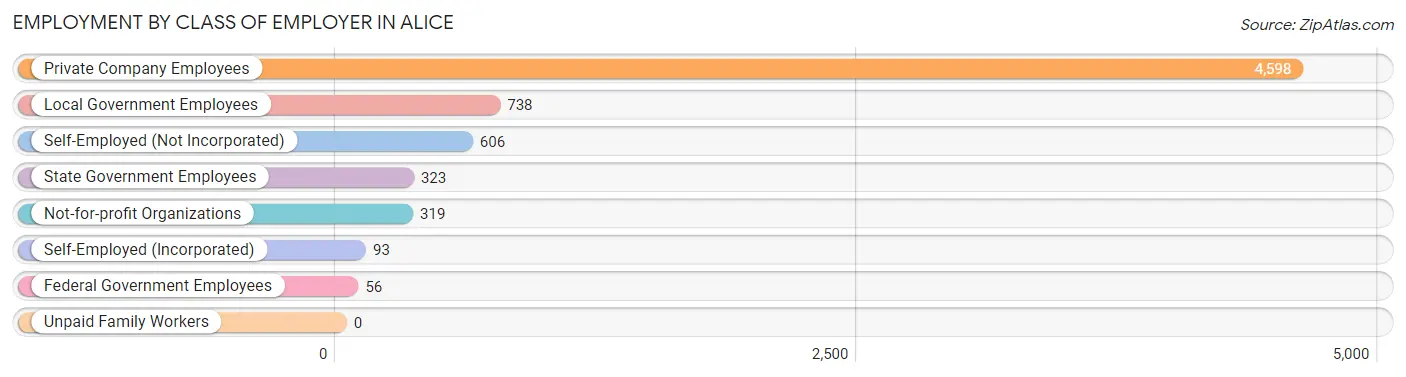
| Employer Class | # Employees | % Employees |
| Private Company Employees | 4,598 | 68.3% |
| Self-Employed (Incorporated) | 93 | 1.4% |
| Self-Employed (Not Incorporated) | 606 | 9.0% |
| Not-for-profit Organizations | 319 | 4.7% |
| Local Government Employees | 738 | 11.0% |
| State Government Employees | 323 | 4.8% |
| Federal Government Employees | 56 | 0.8% |
| Unpaid Family Workers | 0 | 0.0% |
| Total | 6,733 | 100.0% |
Employment Status by Age in Alice
According to the labor force statistics for Alice, out of the total population over 16 years of age (13,271), 54.0% or 7,166 individuals are in the labor force, with 3.3% or 236 of them unemployed. The age group with the highest labor force participation rate is 35 to 44 years, with 83.6% or 2,106 individuals in the labor force. Within the labor force, the 25 to 29 years age range has the highest percentage of unemployed individuals, with 12.6% or 74 of them being unemployed.
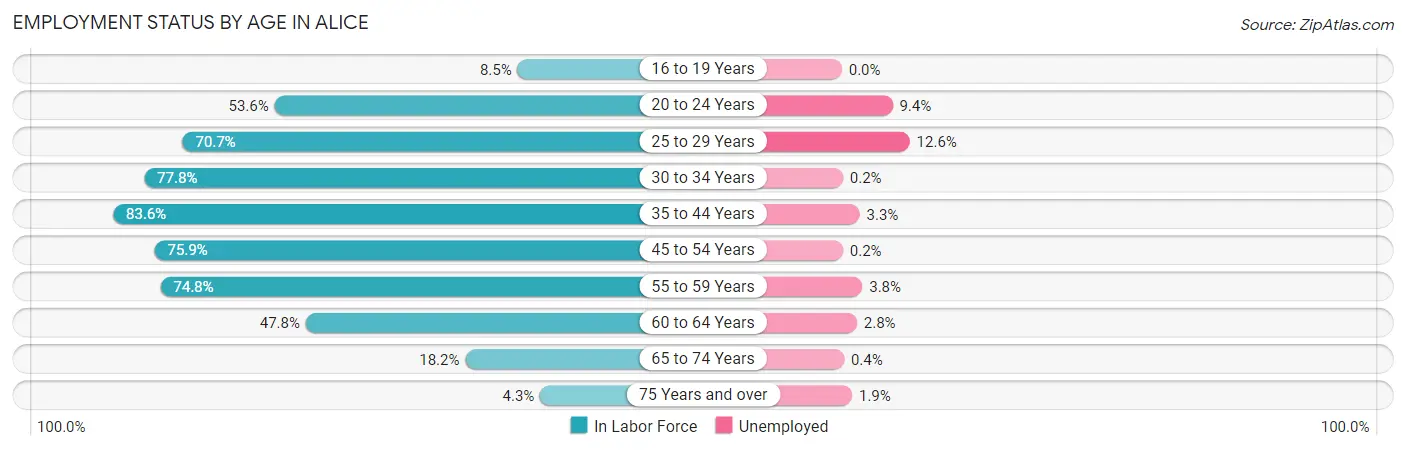
| Age Bracket | In Labor Force | Unemployed |
| 16 to 19 Years | 100 (8.5%) | 0 (0.0%) |
| 20 to 24 Years | 608 (53.6%) | 57 (9.4%) |
| 25 to 29 Years | 585 (70.7%) | 74 (12.6%) |
| 30 to 34 Years | 920 (77.8%) | 2 (0.2%) |
| 35 to 44 Years | 2,106 (83.6%) | 69 (3.3%) |
| 45 to 54 Years | 1,576 (75.9%) | 3 (0.2%) |
| 55 to 59 Years | 474 (74.8%) | 18 (3.8%) |
| 60 to 64 Years | 461 (47.8%) | 13 (2.8%) |
| 65 to 74 Years | 284 (18.2%) | 1 (0.4%) |
| 75 Years and over | 52 (4.3%) | 1 (1.9%) |
| Total | 7,166 (54.0%) | 236 (3.3%) |
Employment Status by Educational Attainment in Alice
According to labor force statistics for Alice, 74.6% of individuals (6,119) out of the total population between 25 and 64 years of age (8,203) are in the labor force, with 2.9% or 177 of them being unemployed. The group with the highest labor force participation rate are those with the educational attainment of bachelor's degree or higher, with 93.5% or 1,066 individuals in the labor force. Within the labor force, individuals with less than high school education have the highest percentage of unemployment, with 4.0% or 40 of them being unemployed.
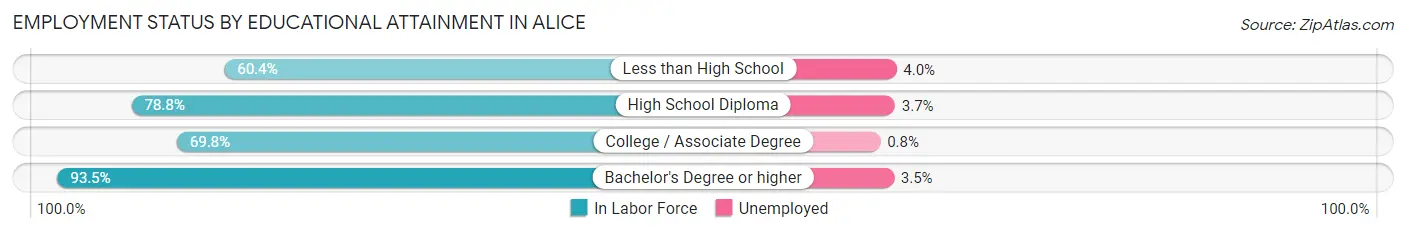
| Educational Attainment | In Labor Force | Unemployed |
| Less than High School | 1,000 (60.4%) | 66 (4.0%) |
| High School Diploma | 2,462 (78.8%) | 116 (3.7%) |
| College / Associate Degree | 1,593 (69.8%) | 18 (0.8%) |
| Bachelor's Degree or higher | 1,066 (93.5%) | 40 (3.5%) |
| Total | 6,119 (74.6%) | 238 (2.9%) |
Employment Occupations by Sex in Alice
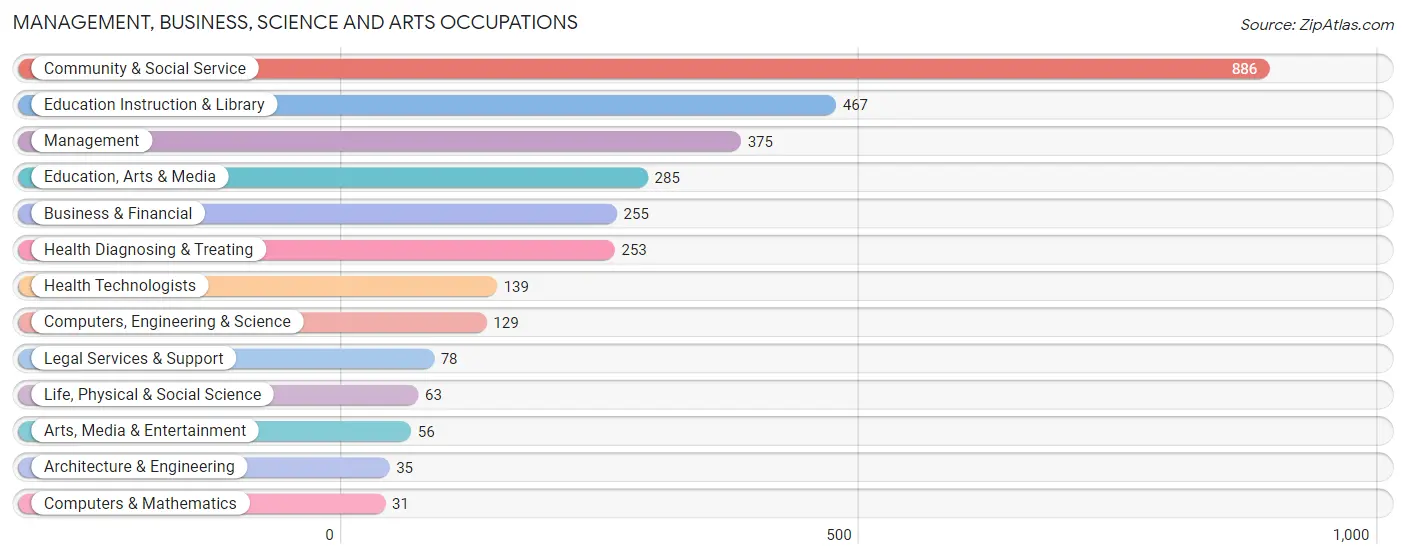
Management, Business, Science and Arts Occupations
The most common Management, Business, Science and Arts occupations in Alice are Community & Social Service (886 | 12.8%), Education Instruction & Library (467 | 6.7%), Management (375 | 5.4%), Education, Arts & Media (285 | 4.1%), and Business & Financial (255 | 3.7%).
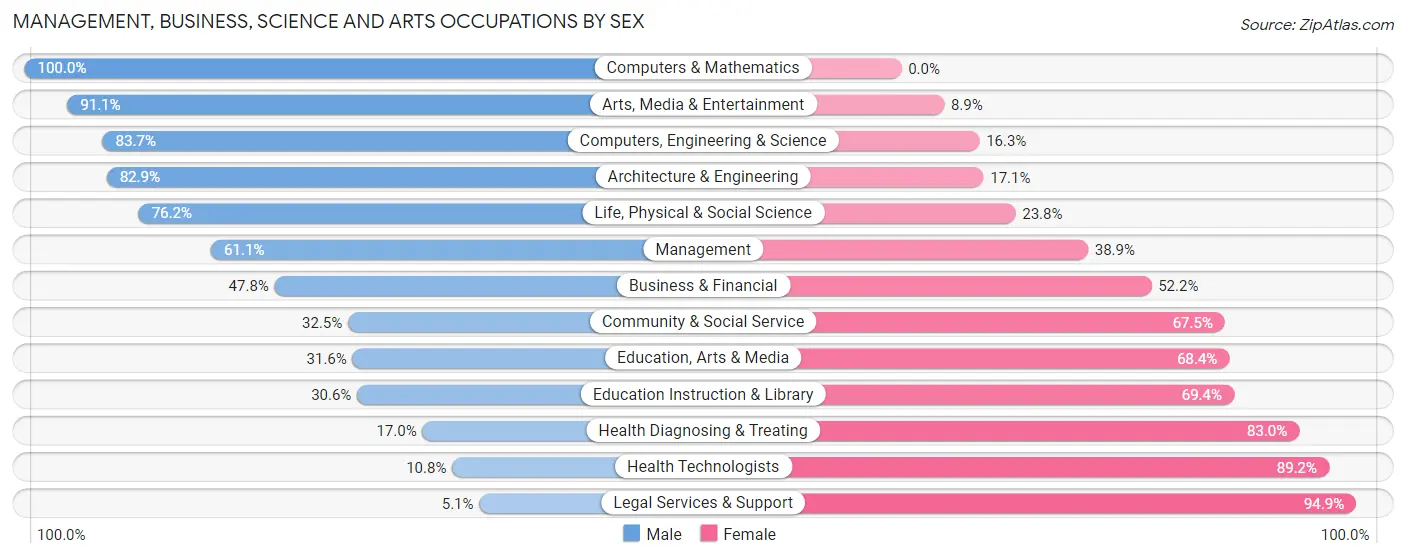
Management, Business, Science and Arts Occupations by Sex
Within the Management, Business, Science and Arts occupations in Alice, the most male-oriented occupations are Computers & Mathematics (100.0%), Arts, Media & Entertainment (91.1%), and Computers, Engineering & Science (83.7%), while the most female-oriented occupations are Legal Services & Support (94.9%), Health Technologists (89.2%), and Health Diagnosing & Treating (83.0%).
| Occupation | Male | Female |
| Management | 229 (61.1%) | 146 (38.9%) |
| Business & Financial | 122 (47.8%) | 133 (52.2%) |
| Computers, Engineering & Science | 108 (83.7%) | 21 (16.3%) |
| Computers & Mathematics | 31 (100.0%) | 0 (0.0%) |
| Architecture & Engineering | 29 (82.9%) | 6 (17.1%) |
| Life, Physical & Social Science | 48 (76.2%) | 15 (23.8%) |
| Community & Social Service | 288 (32.5%) | 598 (67.5%) |
| Education, Arts & Media | 90 (31.6%) | 195 (68.4%) |
| Legal Services & Support | 4 (5.1%) | 74 (94.9%) |
| Education Instruction & Library | 143 (30.6%) | 324 (69.4%) |
| Arts, Media & Entertainment | 51 (91.1%) | 5 (8.9%) |
| Health Diagnosing & Treating | 43 (17.0%) | 210 (83.0%) |
| Health Technologists | 15 (10.8%) | 124 (89.2%) |
| Total (Category) | 790 (41.6%) | 1,108 (58.4%) |
| Total (Overall) | 3,367 (48.6%) | 3,560 (51.4%) |
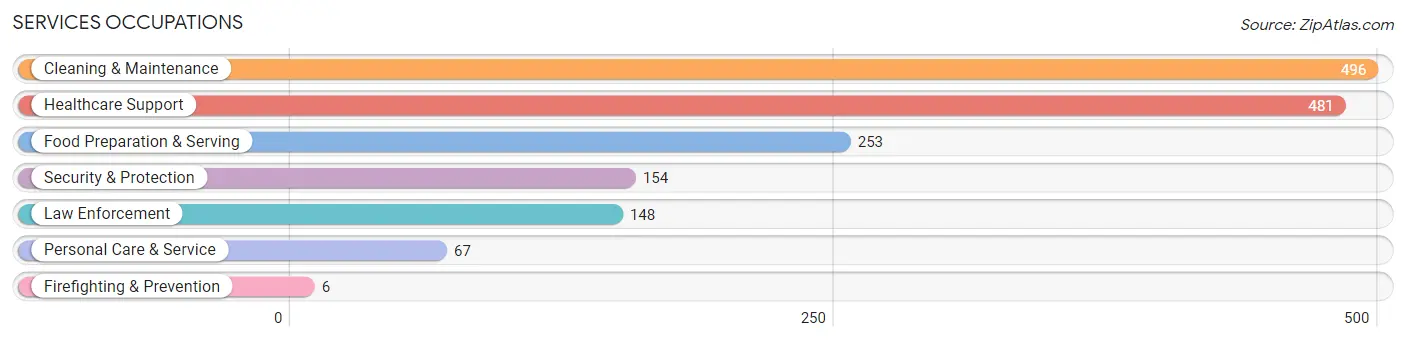
Services Occupations
The most common Services occupations in Alice are Cleaning & Maintenance (496 | 7.2%), Healthcare Support (481 | 6.9%), Food Preparation & Serving (253 | 3.6%), Security & Protection (154 | 2.2%), and Law Enforcement (148 | 2.1%).
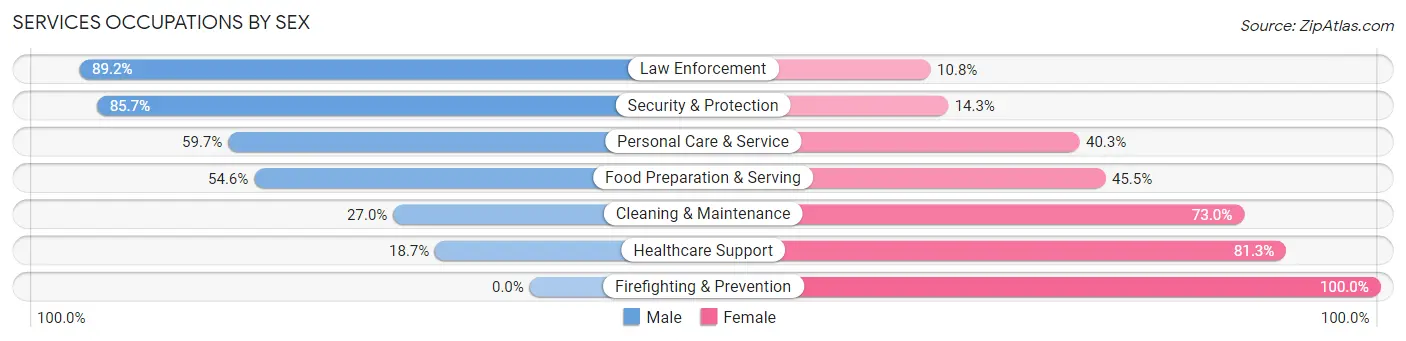
Services Occupations by Sex
Within the Services occupations in Alice, the most male-oriented occupations are Law Enforcement (89.2%), Security & Protection (85.7%), and Personal Care & Service (59.7%), while the most female-oriented occupations are Firefighting & Prevention (100.0%), Healthcare Support (81.3%), and Cleaning & Maintenance (73.0%).
| Occupation | Male | Female |
| Healthcare Support | 90 (18.7%) | 391 (81.3%) |
| Security & Protection | 132 (85.7%) | 22 (14.3%) |
| Firefighting & Prevention | 0 (0.0%) | 6 (100.0%) |
| Law Enforcement | 132 (89.2%) | 16 (10.8%) |
| Food Preparation & Serving | 138 (54.5%) | 115 (45.5%) |
| Cleaning & Maintenance | 134 (27.0%) | 362 (73.0%) |
| Personal Care & Service | 40 (59.7%) | 27 (40.3%) |
| Total (Category) | 534 (36.8%) | 917 (63.2%) |
| Total (Overall) | 3,367 (48.6%) | 3,560 (51.4%) |
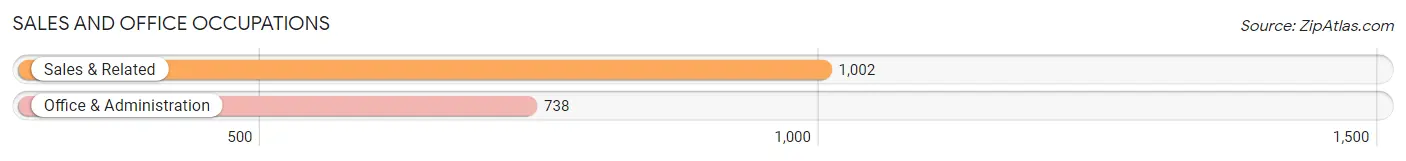
Sales and Office Occupations
The most common Sales and Office occupations in Alice are Sales & Related (1,002 | 14.5%), and Office & Administration (738 | 10.6%).
Sales and Office Occupations by Sex
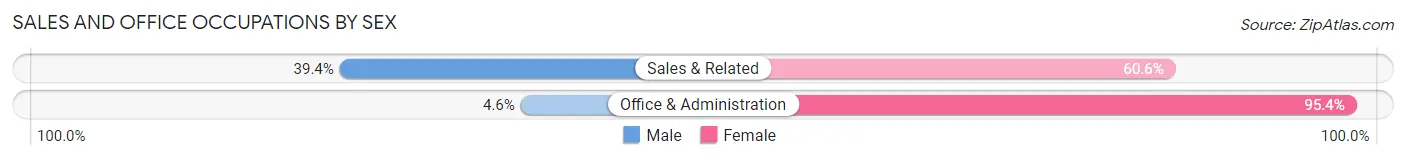
| Occupation | Male | Female |
| Sales & Related | 395 (39.4%) | 607 (60.6%) |
| Office & Administration | 34 (4.6%) | 704 (95.4%) |
| Total (Category) | 429 (24.7%) | 1,311 (75.3%) |
| Total (Overall) | 3,367 (48.6%) | 3,560 (51.4%) |
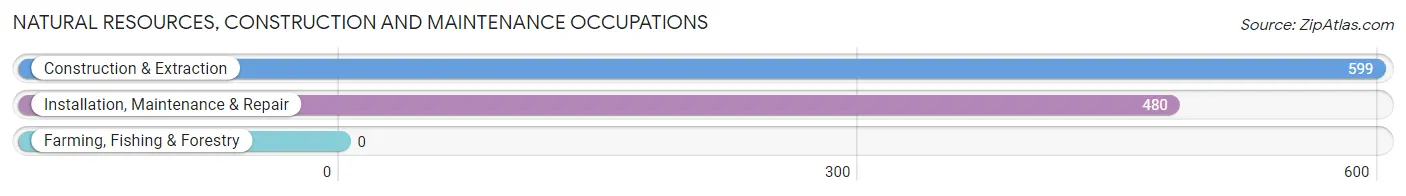
Natural Resources, Construction and Maintenance Occupations
The most common Natural Resources, Construction and Maintenance occupations in Alice are Construction & Extraction (599 | 8.6%), and Installation, Maintenance & Repair (480 | 6.9%).
Natural Resources, Construction and Maintenance Occupations by Sex
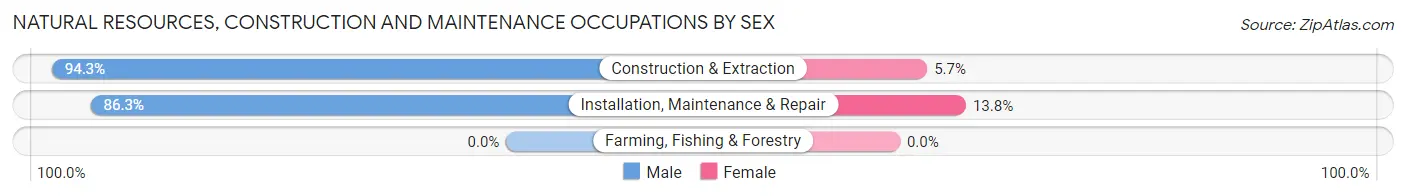
| Occupation | Male | Female |
| Farming, Fishing & Forestry | 0 (0.0%) | 0 (0.0%) |
| Construction & Extraction | 565 (94.3%) | 34 (5.7%) |
| Installation, Maintenance & Repair | 414 (86.3%) | 66 (13.8%) |
| Total (Category) | 979 (90.7%) | 100 (9.3%) |
| Total (Overall) | 3,367 (48.6%) | 3,560 (51.4%) |
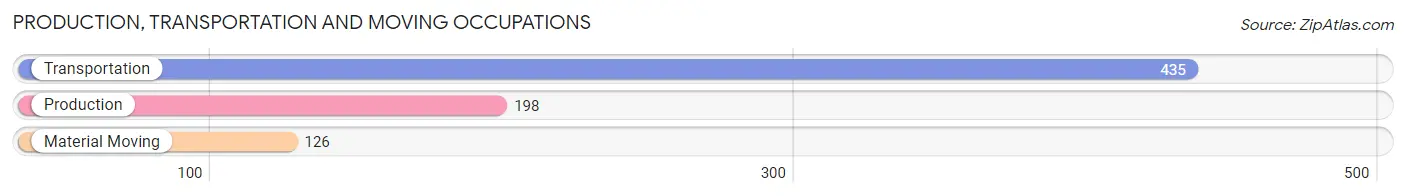
Production, Transportation and Moving Occupations
The most common Production, Transportation and Moving occupations in Alice are Transportation (435 | 6.3%), Production (198 | 2.9%), and Material Moving (126 | 1.8%).
Production, Transportation and Moving Occupations by Sex
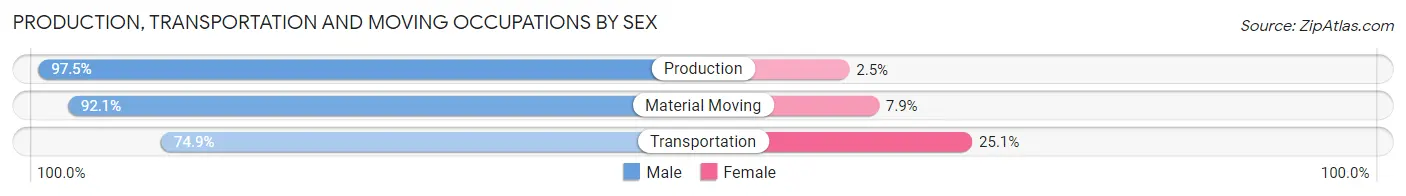
| Occupation | Male | Female |
| Production | 193 (97.5%) | 5 (2.5%) |
| Transportation | 326 (74.9%) | 109 (25.1%) |
| Material Moving | 116 (92.1%) | 10 (7.9%) |
| Total (Category) | 635 (83.7%) | 124 (16.3%) |
| Total (Overall) | 3,367 (48.6%) | 3,560 (51.4%) |
Employment Industries by Sex in Alice
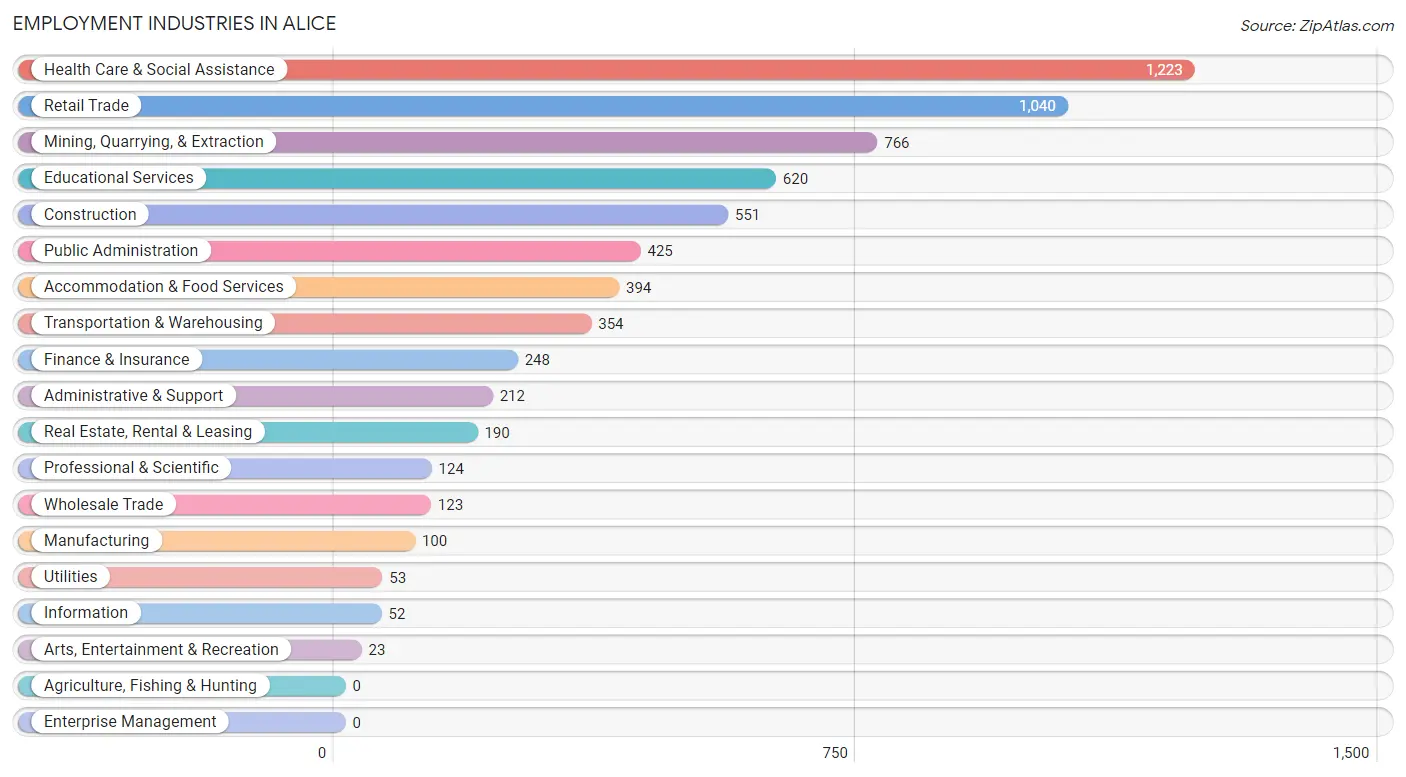
Employment Industries in Alice
The major employment industries in Alice include Health Care & Social Assistance (1,223 | 17.7%), Retail Trade (1,040 | 15.0%), Mining, Quarrying, & Extraction (766 | 11.1%), Educational Services (620 | 8.9%), and Construction (551 | 8.0%).
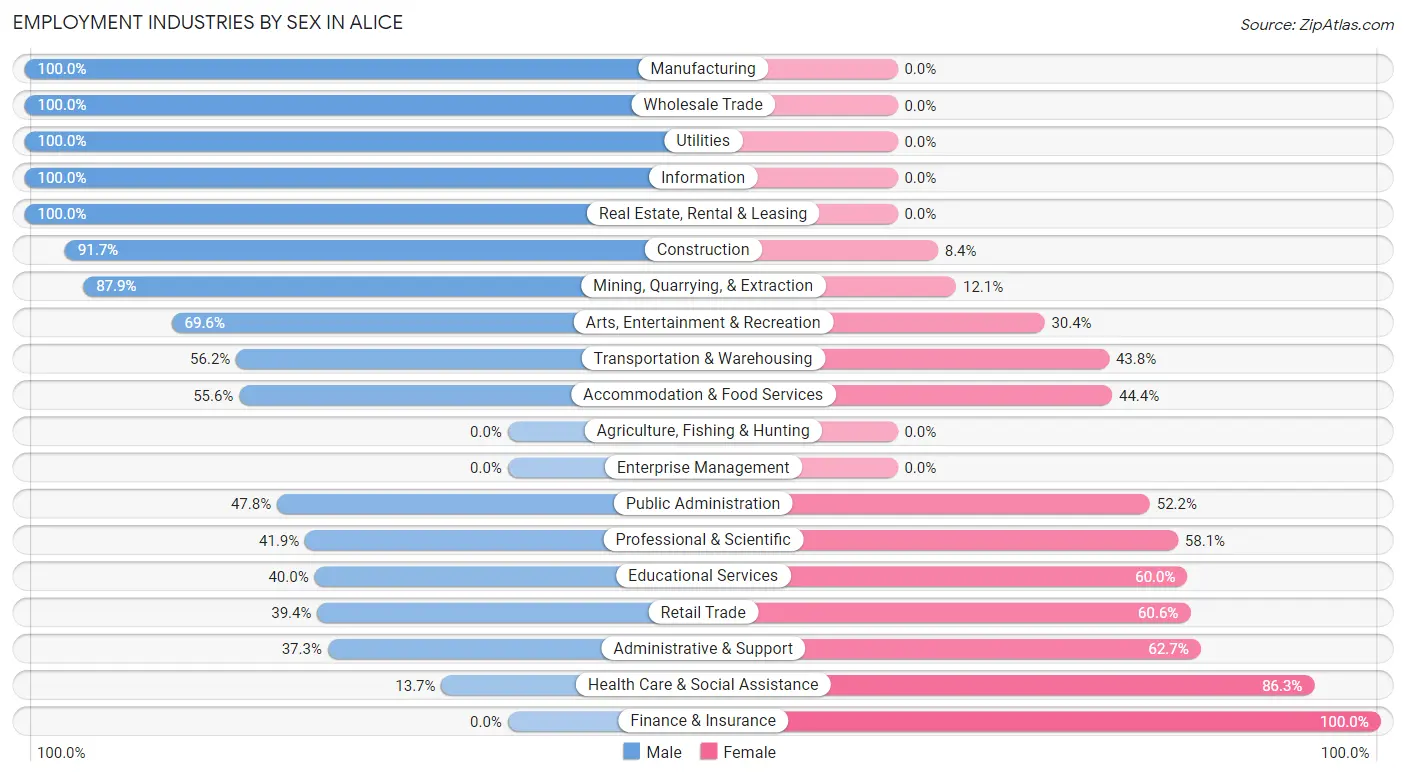
Employment Industries by Sex in Alice
The Alice industries that see more men than women are Manufacturing (100.0%), Wholesale Trade (100.0%), and Utilities (100.0%), whereas the industries that tend to have a higher number of women are Finance & Insurance (100.0%), Health Care & Social Assistance (86.3%), and Administrative & Support (62.7%).
| Industry | Male | Female |
| Agriculture, Fishing & Hunting | 0 (0.0%) | 0 (0.0%) |
| Mining, Quarrying, & Extraction | 673 (87.9%) | 93 (12.1%) |
| Construction | 505 (91.6%) | 46 (8.4%) |
| Manufacturing | 100 (100.0%) | 0 (0.0%) |
| Wholesale Trade | 123 (100.0%) | 0 (0.0%) |
| Retail Trade | 410 (39.4%) | 630 (60.6%) |
| Transportation & Warehousing | 199 (56.2%) | 155 (43.8%) |
| Utilities | 53 (100.0%) | 0 (0.0%) |
| Information | 52 (100.0%) | 0 (0.0%) |
| Finance & Insurance | 0 (0.0%) | 248 (100.0%) |
| Real Estate, Rental & Leasing | 190 (100.0%) | 0 (0.0%) |
| Professional & Scientific | 52 (41.9%) | 72 (58.1%) |
| Enterprise Management | 0 (0.0%) | 0 (0.0%) |
| Administrative & Support | 79 (37.3%) | 133 (62.7%) |
| Educational Services | 248 (40.0%) | 372 (60.0%) |
| Health Care & Social Assistance | 168 (13.7%) | 1,055 (86.3%) |
| Arts, Entertainment & Recreation | 16 (69.6%) | 7 (30.4%) |
| Accommodation & Food Services | 219 (55.6%) | 175 (44.4%) |
| Public Administration | 203 (47.8%) | 222 (52.2%) |
| Total | 3,367 (48.6%) | 3,560 (51.4%) |
Education in Alice
School Enrollment in Alice
The most common levels of schooling among the 5,422 students in Alice are high school (1,773 | 32.7%), middle school (1,302 | 24.0%), and elementary school (950 | 17.5%).
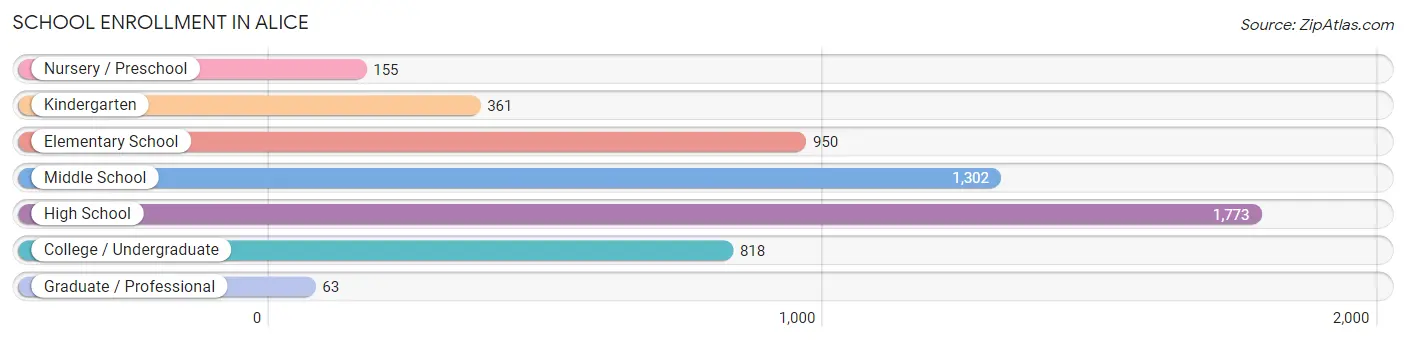
| School Level | # Students | % Students |
| Nursery / Preschool | 155 | 2.9% |
| Kindergarten | 361 | 6.7% |
| Elementary School | 950 | 17.5% |
| Middle School | 1,302 | 24.0% |
| High School | 1,773 | 32.7% |
| College / Undergraduate | 818 | 15.1% |
| Graduate / Professional | 63 | 1.2% |
| Total | 5,422 | 100.0% |
School Enrollment by Age by Funding Source in Alice
Out of a total of 5,422 students who are enrolled in schools in Alice, 878 (16.2%) attend a private institution, while the remaining 4,544 (83.8%) are enrolled in public schools. The age group of 3 to 4 year olds has the highest likelihood of being enrolled in private schools, with 77 (49.7% in the age bracket) enrolled. Conversely, the age group of 25 to 34 year olds has the lowest likelihood of being enrolled in a private school, with 234 (98.7% in the age bracket) attending a public institution.
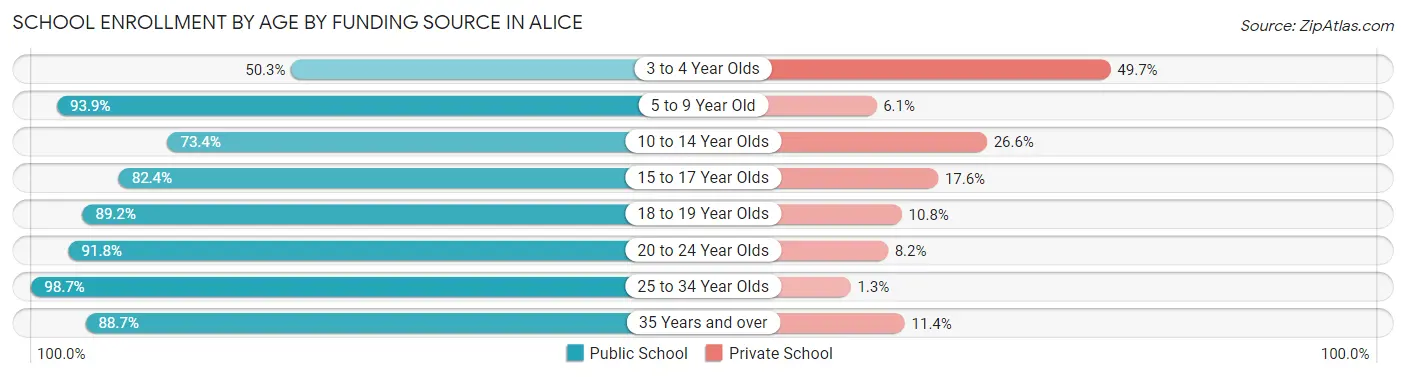
| Age Bracket | Public School | Private School |
| 3 to 4 Year Olds | 78 (50.3%) | 77 (49.7%) |
| 5 to 9 Year Old | 1,210 (93.9%) | 78 (6.1%) |
| 10 to 14 Year Olds | 1,115 (73.4%) | 405 (26.6%) |
| 15 to 17 Year Olds | 972 (82.4%) | 207 (17.6%) |
| 18 to 19 Year Olds | 322 (89.2%) | 39 (10.8%) |
| 20 to 24 Year Olds | 246 (91.8%) | 22 (8.2%) |
| 25 to 34 Year Olds | 234 (98.7%) | 3 (1.3%) |
| 35 Years and over | 367 (88.6%) | 47 (11.4%) |
| Total | 4,544 (83.8%) | 878 (16.2%) |
Educational Attainment by Field of Study in Alice
Education (491 | 30.5%), business (318 | 19.8%), liberal arts & history (169 | 10.5%), science & technology (162 | 10.1%), and psychology (142 | 8.8%) are the most common fields of study among 1,609 individuals in Alice who have obtained a bachelor's degree or higher.
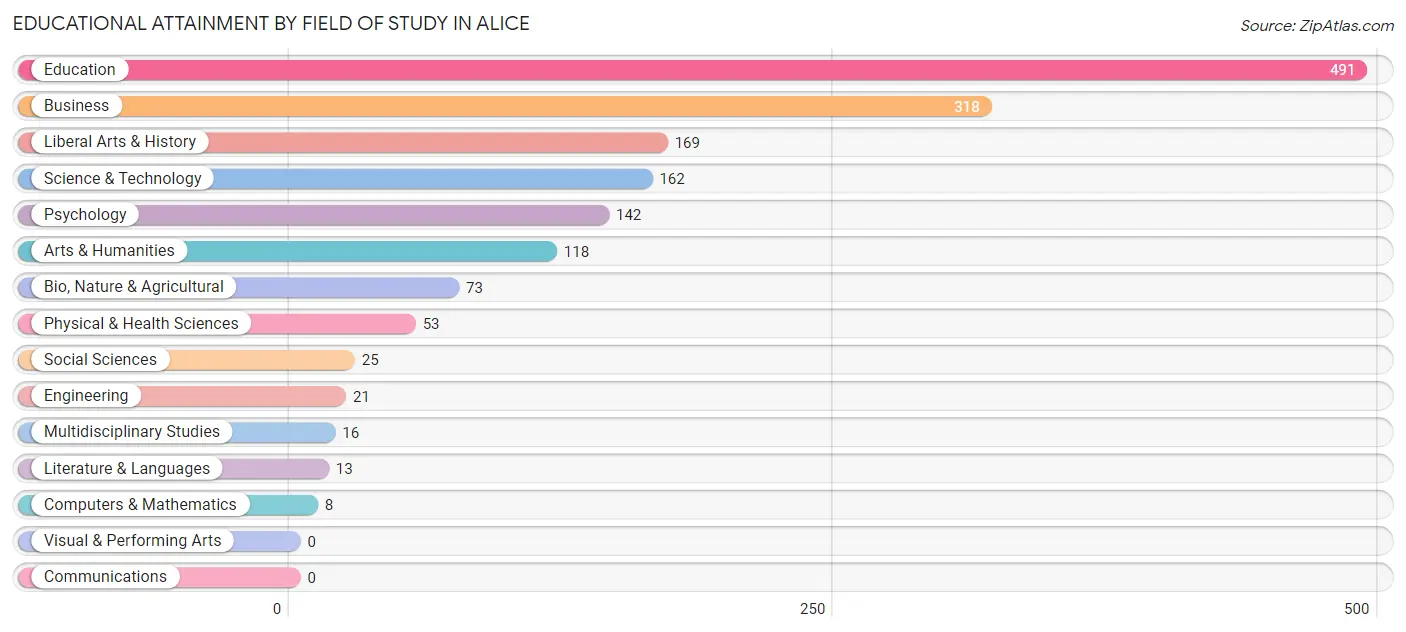
| Field of Study | # Graduates | % Graduates |
| Computers & Mathematics | 8 | 0.5% |
| Bio, Nature & Agricultural | 73 | 4.5% |
| Physical & Health Sciences | 53 | 3.3% |
| Psychology | 142 | 8.8% |
| Social Sciences | 25 | 1.5% |
| Engineering | 21 | 1.3% |
| Multidisciplinary Studies | 16 | 1.0% |
| Science & Technology | 162 | 10.1% |
| Business | 318 | 19.8% |
| Education | 491 | 30.5% |
| Literature & Languages | 13 | 0.8% |
| Liberal Arts & History | 169 | 10.5% |
| Visual & Performing Arts | 0 | 0.0% |
| Communications | 0 | 0.0% |
| Arts & Humanities | 118 | 7.3% |
| Total | 1,609 | 100.0% |
Transportation & Commute in Alice
Vehicle Availability by Sex in Alice
The most prevalent vehicle ownership categories in Alice are males with 2 vehicles (1,453, accounting for 44.5%) and females with 2 vehicles (1,225, making up 41.9%).
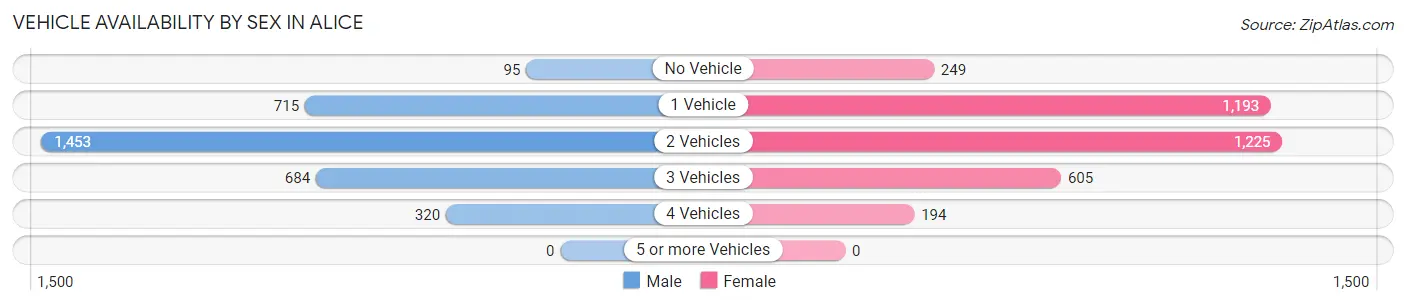
| Vehicles Available | Male | Female |
| No Vehicle | 95 (2.9%) | 249 (7.2%) |
| 1 Vehicle | 715 (21.9%) | 1,193 (34.4%) |
| 2 Vehicles | 1,453 (44.5%) | 1,225 (35.3%) |
| 3 Vehicles | 684 (20.9%) | 605 (17.5%) |
| 4 Vehicles | 320 (9.8%) | 194 (5.6%) |
| 5 or more Vehicles | 0 (0.0%) | 0 (0.0%) |
| Total | 3,267 (100.0%) | 3,466 (100.0%) |
Commute Time in Alice
The most frequently occuring commute durations in Alice are 15 to 19 minutes (1,248 commuters, 19.5%), 10 to 14 minutes (1,234 commuters, 19.3%), and 5 to 9 minutes (946 commuters, 14.8%).
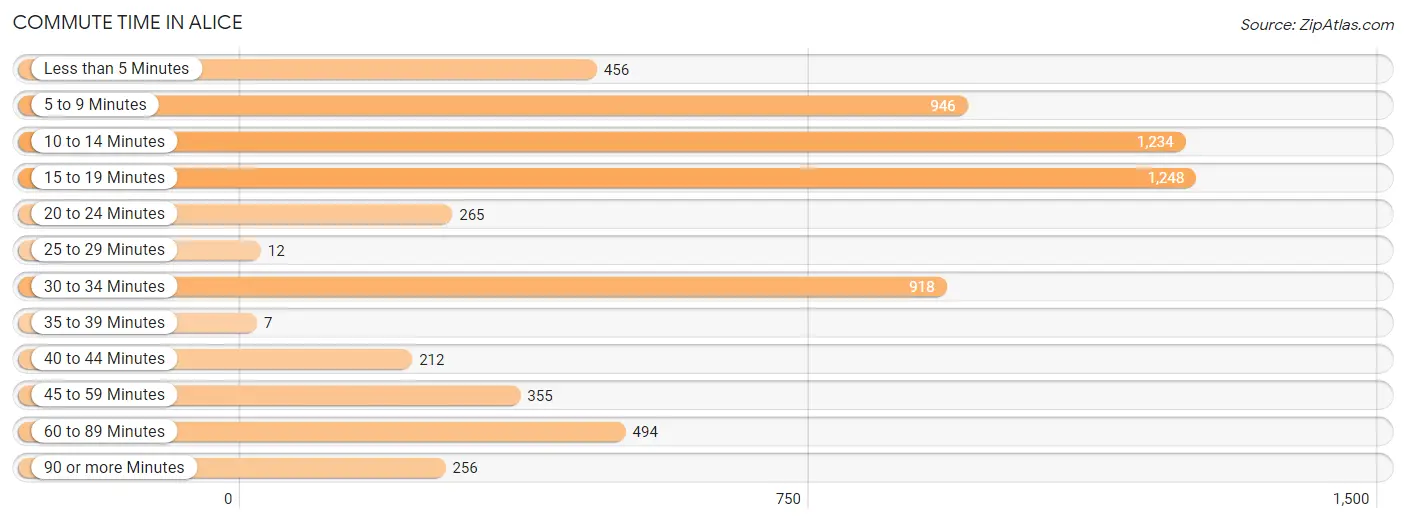
| Commute Time | # Commuters | % Commuters |
| Less than 5 Minutes | 456 | 7.1% |
| 5 to 9 Minutes | 946 | 14.8% |
| 10 to 14 Minutes | 1,234 | 19.3% |
| 15 to 19 Minutes | 1,248 | 19.5% |
| 20 to 24 Minutes | 265 | 4.1% |
| 25 to 29 Minutes | 12 | 0.2% |
| 30 to 34 Minutes | 918 | 14.3% |
| 35 to 39 Minutes | 7 | 0.1% |
| 40 to 44 Minutes | 212 | 3.3% |
| 45 to 59 Minutes | 355 | 5.5% |
| 60 to 89 Minutes | 494 | 7.7% |
| 90 or more Minutes | 256 | 4.0% |
Commute Time by Sex in Alice
The most common commute times in Alice are 30 to 34 minutes (553 commuters, 17.6%) for males and 10 to 14 minutes (775 commuters, 23.8%) for females.
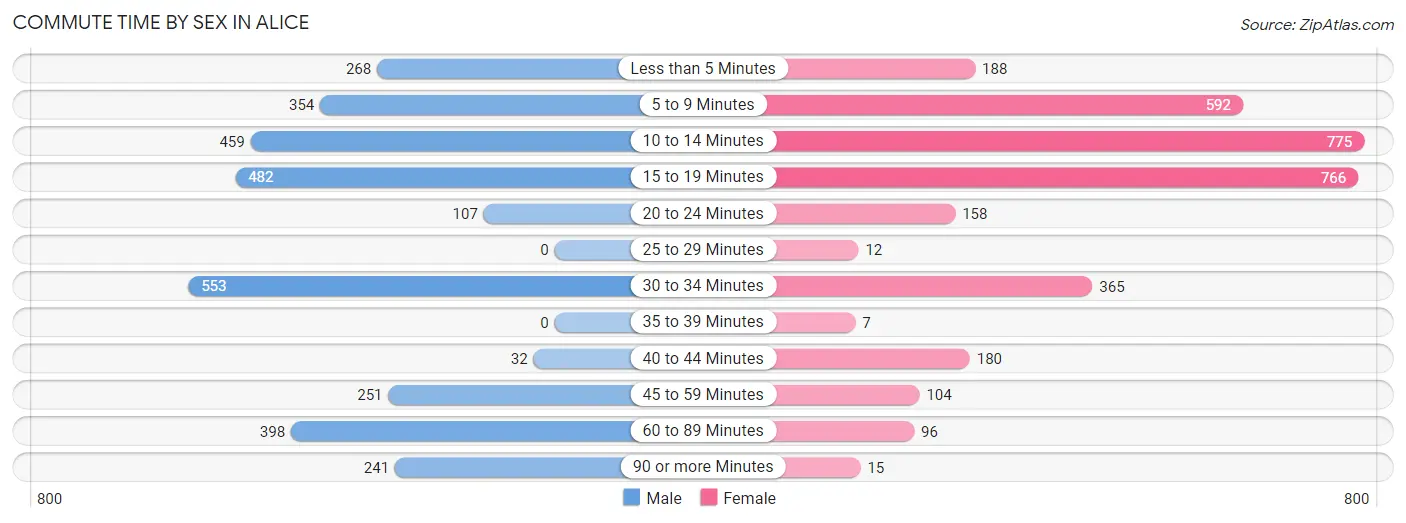
| Commute Time | Male | Female |
| Less than 5 Minutes | 268 (8.5%) | 188 (5.8%) |
| 5 to 9 Minutes | 354 (11.3%) | 592 (18.2%) |
| 10 to 14 Minutes | 459 (14.6%) | 775 (23.8%) |
| 15 to 19 Minutes | 482 (15.3%) | 766 (23.5%) |
| 20 to 24 Minutes | 107 (3.4%) | 158 (4.9%) |
| 25 to 29 Minutes | 0 (0.0%) | 12 (0.4%) |
| 30 to 34 Minutes | 553 (17.6%) | 365 (11.2%) |
| 35 to 39 Minutes | 0 (0.0%) | 7 (0.2%) |
| 40 to 44 Minutes | 32 (1.0%) | 180 (5.5%) |
| 45 to 59 Minutes | 251 (8.0%) | 104 (3.2%) |
| 60 to 89 Minutes | 398 (12.7%) | 96 (2.9%) |
| 90 or more Minutes | 241 (7.7%) | 15 (0.5%) |
Time of Departure to Work by Sex in Alice
The most frequent times of departure to work in Alice are 7:00 AM to 7:29 AM (609, 19.4%) for males and 7:30 AM to 7:59 AM (1,081, 33.2%) for females.
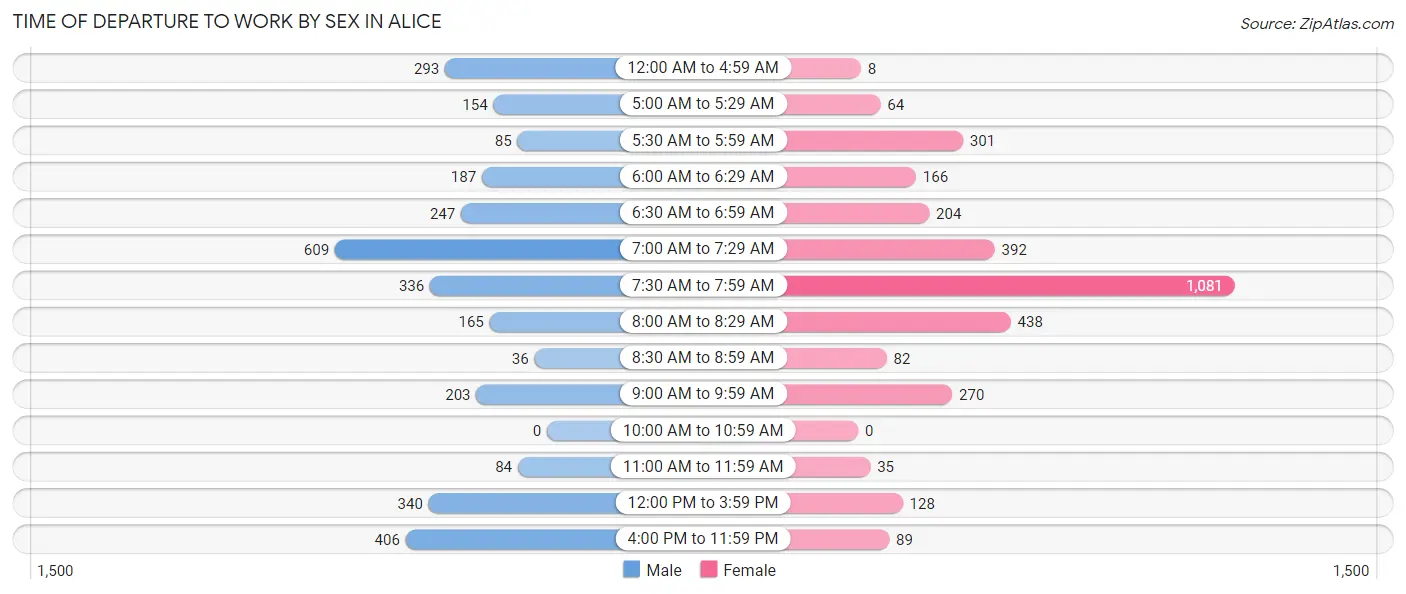
| Time of Departure | Male | Female |
| 12:00 AM to 4:59 AM | 293 (9.3%) | 8 (0.3%) |
| 5:00 AM to 5:29 AM | 154 (4.9%) | 64 (2.0%) |
| 5:30 AM to 5:59 AM | 85 (2.7%) | 301 (9.2%) |
| 6:00 AM to 6:29 AM | 187 (5.9%) | 166 (5.1%) |
| 6:30 AM to 6:59 AM | 247 (7.9%) | 204 (6.3%) |
| 7:00 AM to 7:29 AM | 609 (19.4%) | 392 (12.0%) |
| 7:30 AM to 7:59 AM | 336 (10.7%) | 1,081 (33.2%) |
| 8:00 AM to 8:29 AM | 165 (5.2%) | 438 (13.4%) |
| 8:30 AM to 8:59 AM | 36 (1.1%) | 82 (2.5%) |
| 9:00 AM to 9:59 AM | 203 (6.5%) | 270 (8.3%) |
| 10:00 AM to 10:59 AM | 0 (0.0%) | 0 (0.0%) |
| 11:00 AM to 11:59 AM | 84 (2.7%) | 35 (1.1%) |
| 12:00 PM to 3:59 PM | 340 (10.8%) | 128 (3.9%) |
| 4:00 PM to 11:59 PM | 406 (12.9%) | 89 (2.7%) |
| Total | 3,145 (100.0%) | 3,258 (100.0%) |
Housing Occupancy in Alice
Occupancy by Ownership in Alice
Of the total 5,955 dwellings in Alice, owner-occupied units account for 3,280 (55.1%), while renter-occupied units make up 2,675 (44.9%).
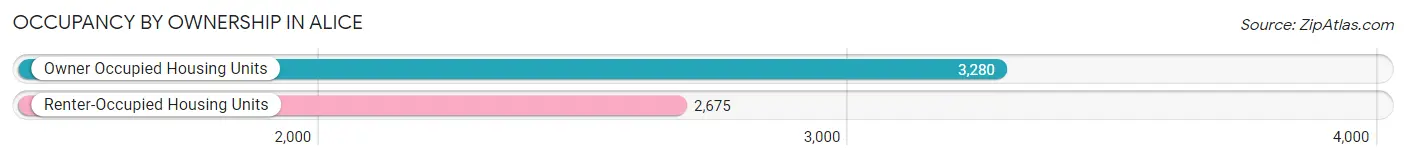
| Occupancy | # Housing Units | % Housing Units |
| Owner Occupied Housing Units | 3,280 | 55.1% |
| Renter-Occupied Housing Units | 2,675 | 44.9% |
| Total Occupied Housing Units | 5,955 | 100.0% |
Occupancy by Household Size in Alice
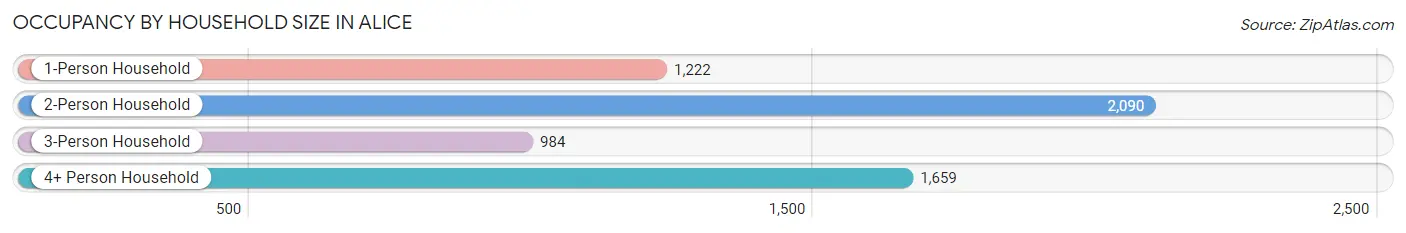
| Household Size | # Housing Units | % Housing Units |
| 1-Person Household | 1,222 | 20.5% |
| 2-Person Household | 2,090 | 35.1% |
| 3-Person Household | 984 | 16.5% |
| 4+ Person Household | 1,659 | 27.9% |
| Total Housing Units | 5,955 | 100.0% |
Occupancy by Ownership by Household Size in Alice
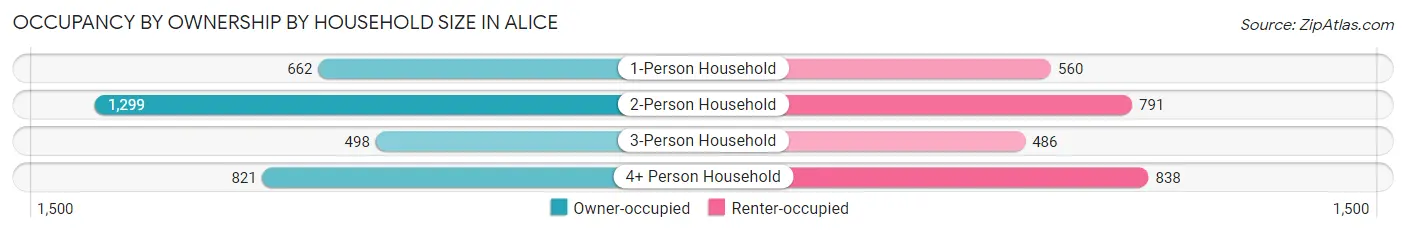
| Household Size | Owner-occupied | Renter-occupied |
| 1-Person Household | 662 (54.2%) | 560 (45.8%) |
| 2-Person Household | 1,299 (62.2%) | 791 (37.9%) |
| 3-Person Household | 498 (50.6%) | 486 (49.4%) |
| 4+ Person Household | 821 (49.5%) | 838 (50.5%) |
| Total Housing Units | 3,280 (55.1%) | 2,675 (44.9%) |
Occupancy by Educational Attainment in Alice
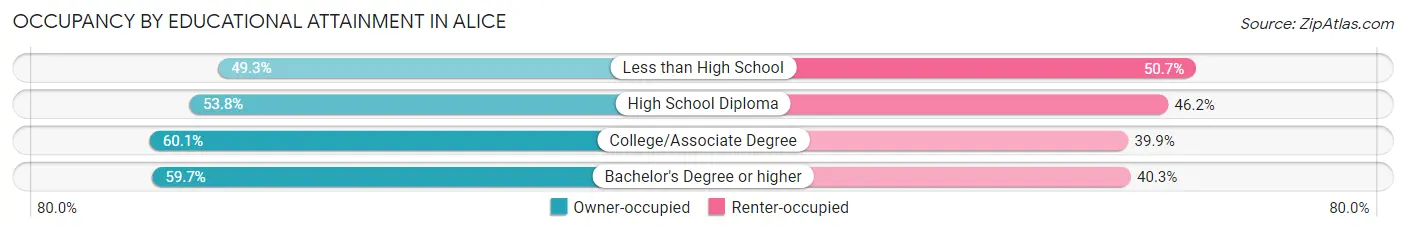
| Household Size | Owner-occupied | Renter-occupied |
| Less than High School | 755 (49.3%) | 777 (50.7%) |
| High School Diploma | 1,106 (53.8%) | 951 (46.2%) |
| College/Associate Degree | 903 (60.1%) | 599 (39.9%) |
| Bachelor's Degree or higher | 516 (59.7%) | 348 (40.3%) |
Occupancy by Age of Householder in Alice
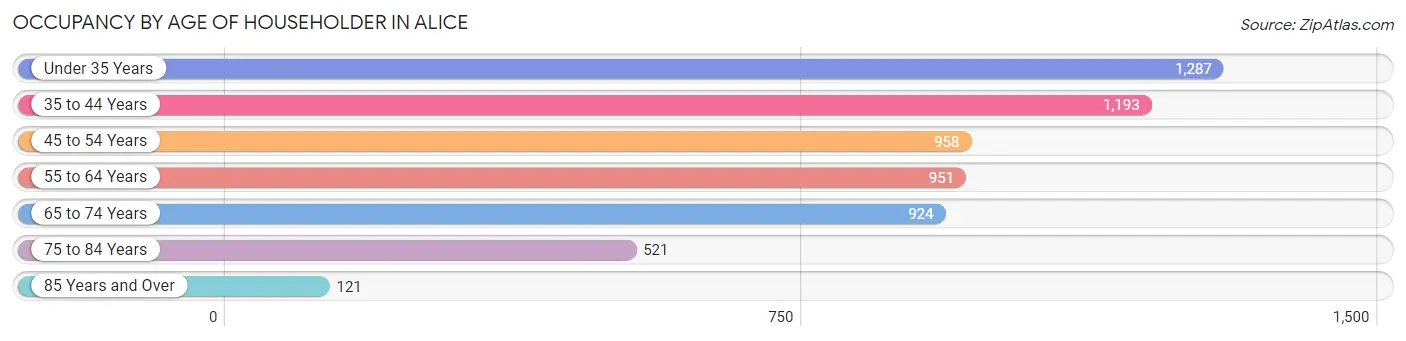
| Age Bracket | # Households | % Households |
| Under 35 Years | 1,287 | 21.6% |
| 35 to 44 Years | 1,193 | 20.0% |
| 45 to 54 Years | 958 | 16.1% |
| 55 to 64 Years | 951 | 16.0% |
| 65 to 74 Years | 924 | 15.5% |
| 75 to 84 Years | 521 | 8.7% |
| 85 Years and Over | 121 | 2.0% |
| Total | 5,955 | 100.0% |
Housing Finances in Alice
Median Income by Occupancy in Alice
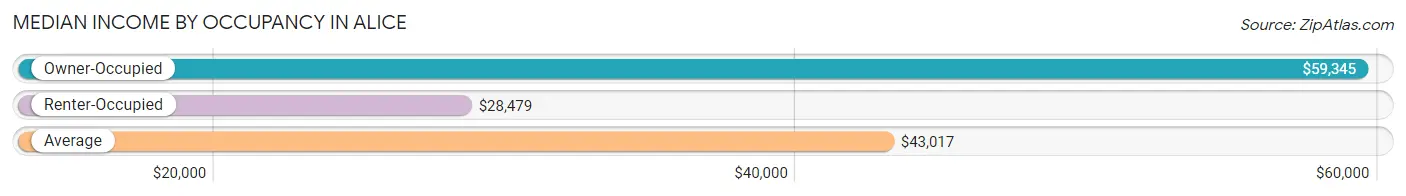
| Occupancy Type | # Households | Median Income |
| Owner-Occupied | 3,280 (55.1%) | $59,345 |
| Renter-Occupied | 2,675 (44.9%) | $28,479 |
| Average | 5,955 (100.0%) | $43,017 |
Occupancy by Householder Income Bracket in Alice
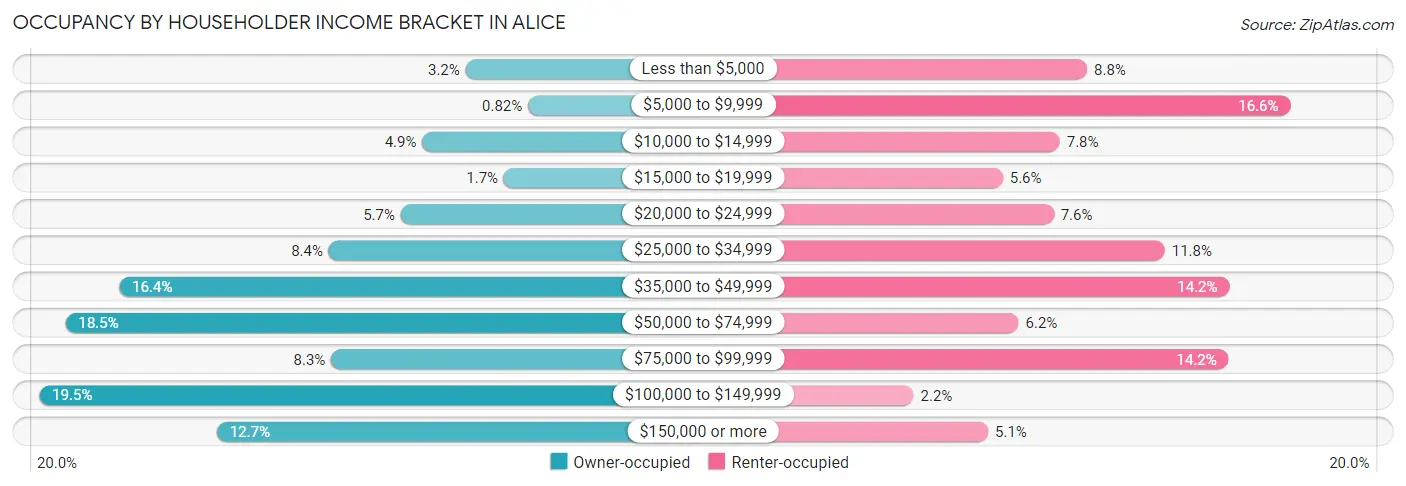
| Income Bracket | Owner-occupied | Renter-occupied |
| Less than $5,000 | 105 (3.2%) | 236 (8.8%) |
| $5,000 to $9,999 | 27 (0.8%) | 443 (16.6%) |
| $10,000 to $14,999 | 159 (4.9%) | 208 (7.8%) |
| $15,000 to $19,999 | 57 (1.7%) | 150 (5.6%) |
| $20,000 to $24,999 | 186 (5.7%) | 202 (7.5%) |
| $25,000 to $34,999 | 276 (8.4%) | 315 (11.8%) |
| $35,000 to $49,999 | 538 (16.4%) | 381 (14.2%) |
| $50,000 to $74,999 | 605 (18.4%) | 166 (6.2%) |
| $75,000 to $99,999 | 273 (8.3%) | 380 (14.2%) |
| $100,000 to $149,999 | 638 (19.5%) | 59 (2.2%) |
| $150,000 or more | 416 (12.7%) | 135 (5.1%) |
| Total | 3,280 (100.0%) | 2,675 (100.0%) |
Monthly Housing Cost Tiers in Alice
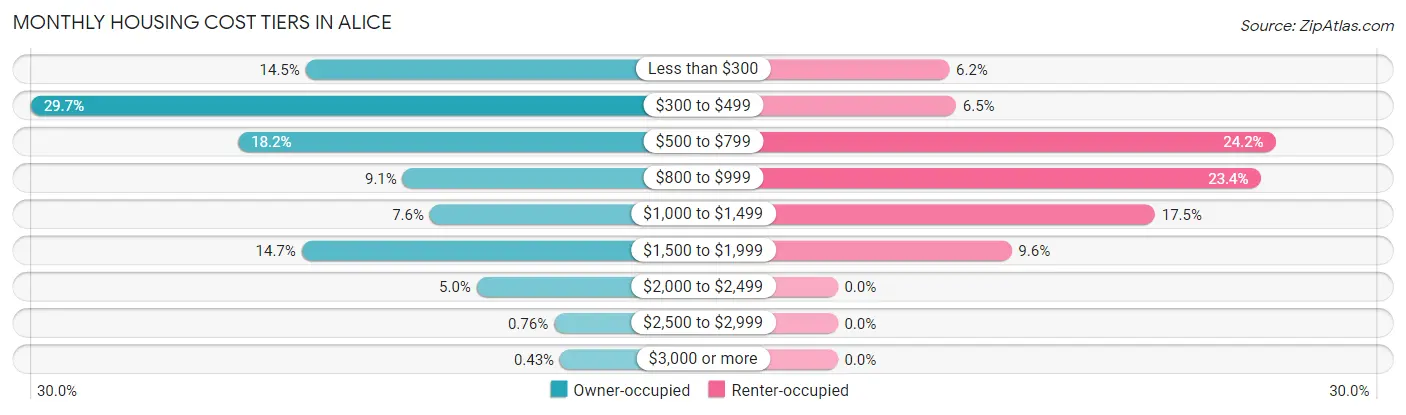
| Monthly Cost | Owner-occupied | Renter-occupied |
| Less than $300 | 475 (14.5%) | 165 (6.2%) |
| $300 to $499 | 973 (29.7%) | 175 (6.5%) |
| $500 to $799 | 597 (18.2%) | 647 (24.2%) |
| $800 to $999 | 299 (9.1%) | 625 (23.4%) |
| $1,000 to $1,499 | 250 (7.6%) | 469 (17.5%) |
| $1,500 to $1,999 | 482 (14.7%) | 257 (9.6%) |
| $2,000 to $2,499 | 165 (5.0%) | 0 (0.0%) |
| $2,500 to $2,999 | 25 (0.8%) | 0 (0.0%) |
| $3,000 or more | 14 (0.4%) | 0 (0.0%) |
| Total | 3,280 (100.0%) | 2,675 (100.0%) |
Physical Housing Characteristics in Alice
Housing Structures in Alice
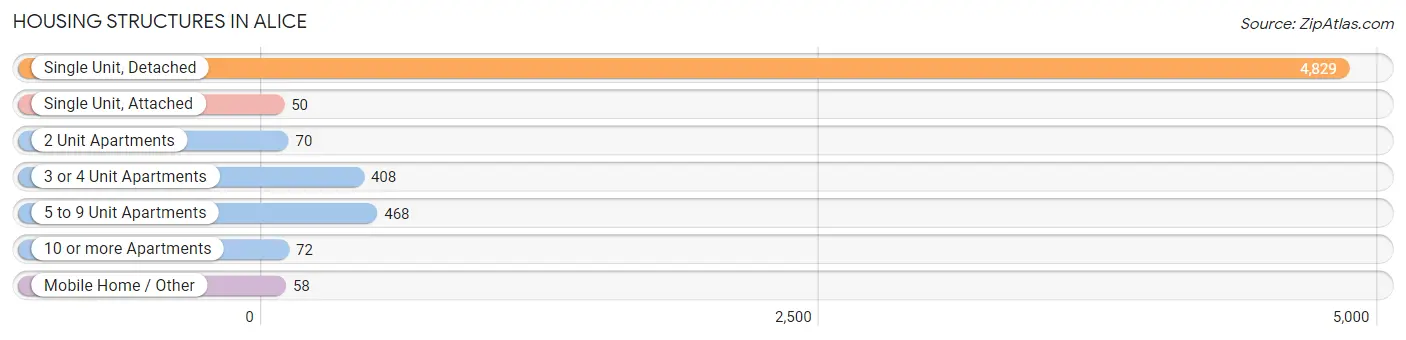
| Structure Type | # Housing Units | % Housing Units |
| Single Unit, Detached | 4,829 | 81.1% |
| Single Unit, Attached | 50 | 0.8% |
| 2 Unit Apartments | 70 | 1.2% |
| 3 or 4 Unit Apartments | 408 | 6.9% |
| 5 to 9 Unit Apartments | 468 | 7.9% |
| 10 or more Apartments | 72 | 1.2% |
| Mobile Home / Other | 58 | 1.0% |
| Total | 5,955 | 100.0% |
Housing Structures by Occupancy in Alice
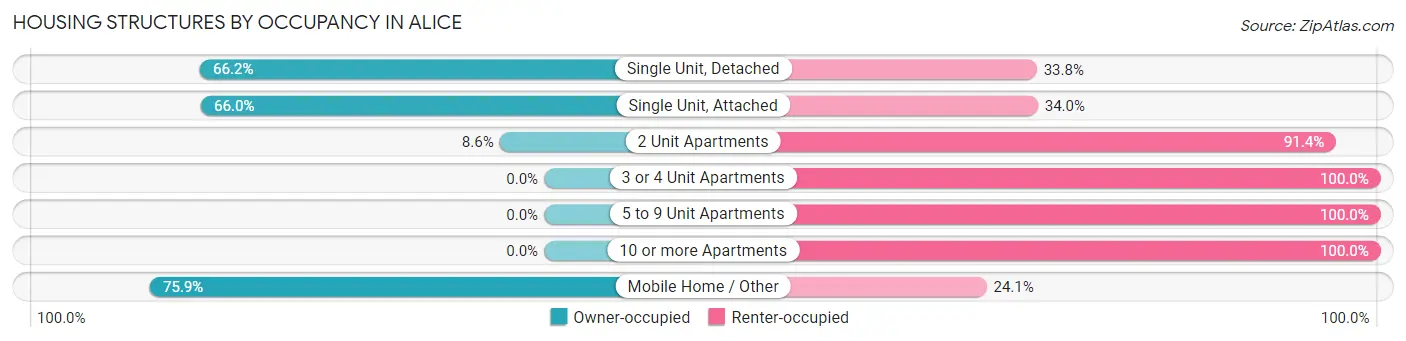
| Structure Type | Owner-occupied | Renter-occupied |
| Single Unit, Detached | 3,197 (66.2%) | 1,632 (33.8%) |
| Single Unit, Attached | 33 (66.0%) | 17 (34.0%) |
| 2 Unit Apartments | 6 (8.6%) | 64 (91.4%) |
| 3 or 4 Unit Apartments | 0 (0.0%) | 408 (100.0%) |
| 5 to 9 Unit Apartments | 0 (0.0%) | 468 (100.0%) |
| 10 or more Apartments | 0 (0.0%) | 72 (100.0%) |
| Mobile Home / Other | 44 (75.9%) | 14 (24.1%) |
| Total | 3,280 (55.1%) | 2,675 (44.9%) |
Housing Structures by Number of Rooms in Alice
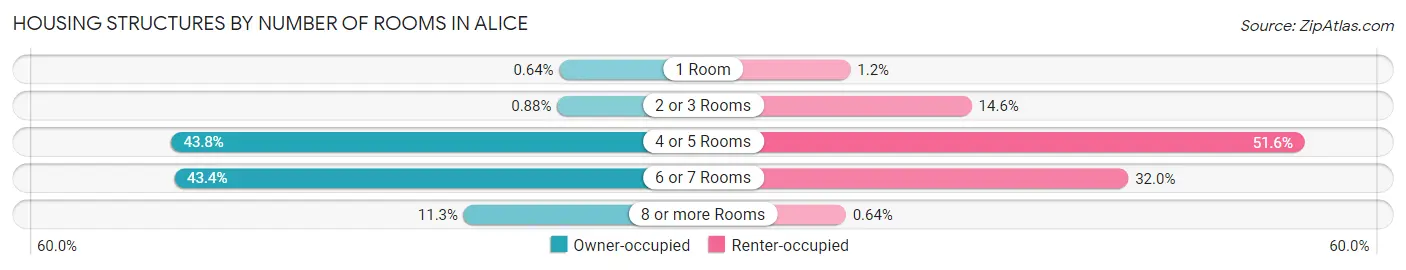
| Number of Rooms | Owner-occupied | Renter-occupied |
| 1 Room | 21 (0.6%) | 31 (1.2%) |
| 2 or 3 Rooms | 29 (0.9%) | 391 (14.6%) |
| 4 or 5 Rooms | 1,437 (43.8%) | 1,380 (51.6%) |
| 6 or 7 Rooms | 1,424 (43.4%) | 856 (32.0%) |
| 8 or more Rooms | 369 (11.3%) | 17 (0.6%) |
| Total | 3,280 (100.0%) | 2,675 (100.0%) |
Housing Structure by Heating Type in Alice
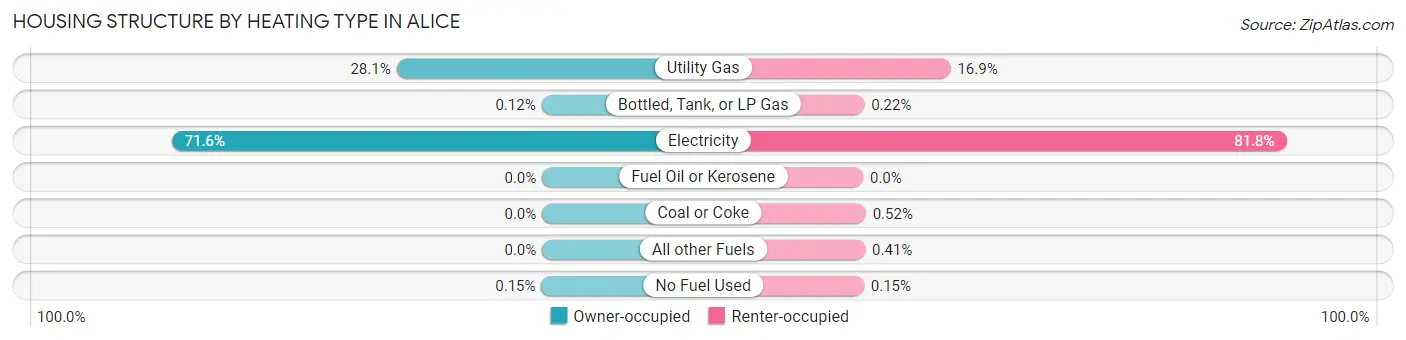
| Heating Type | Owner-occupied | Renter-occupied |
| Utility Gas | 923 (28.1%) | 452 (16.9%) |
| Bottled, Tank, or LP Gas | 4 (0.1%) | 6 (0.2%) |
| Electricity | 2,348 (71.6%) | 2,188 (81.8%) |
| Fuel Oil or Kerosene | 0 (0.0%) | 0 (0.0%) |
| Coal or Coke | 0 (0.0%) | 14 (0.5%) |
| All other Fuels | 0 (0.0%) | 11 (0.4%) |
| No Fuel Used | 5 (0.2%) | 4 (0.2%) |
| Total | 3,280 (100.0%) | 2,675 (100.0%) |
Household Vehicle Usage in Alice
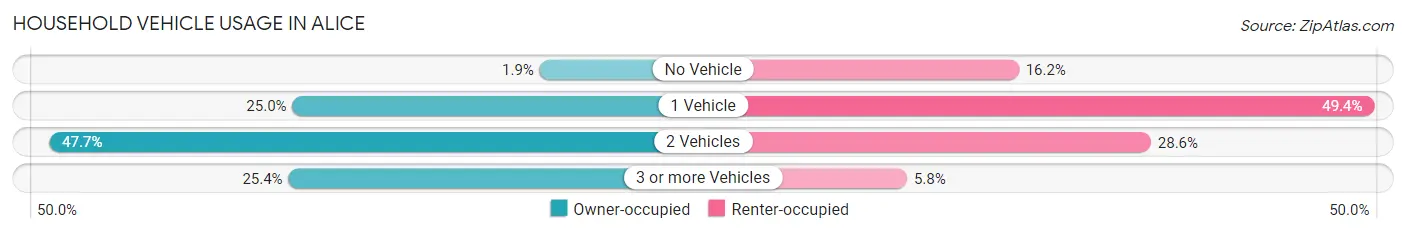
| Vehicles per Household | Owner-occupied | Renter-occupied |
| No Vehicle | 63 (1.9%) | 434 (16.2%) |
| 1 Vehicle | 820 (25.0%) | 1,322 (49.4%) |
| 2 Vehicles | 1,565 (47.7%) | 764 (28.6%) |
| 3 or more Vehicles | 832 (25.4%) | 155 (5.8%) |
| Total | 3,280 (100.0%) | 2,675 (100.0%) |
Real Estate & Mortgages in Alice
Real Estate and Mortgage Overview in Alice
| Characteristic | Without Mortgage | With Mortgage |
| Housing Units | 2,087 | 1,193 |
| Median Property Value | $77,200 | $138,400 |
| Median Household Income | $43,518 | $210 |
| Monthly Housing Costs | $414 | $14 |
| Real Estate Taxes | $913 | $154 |
Property Value by Mortgage Status in Alice
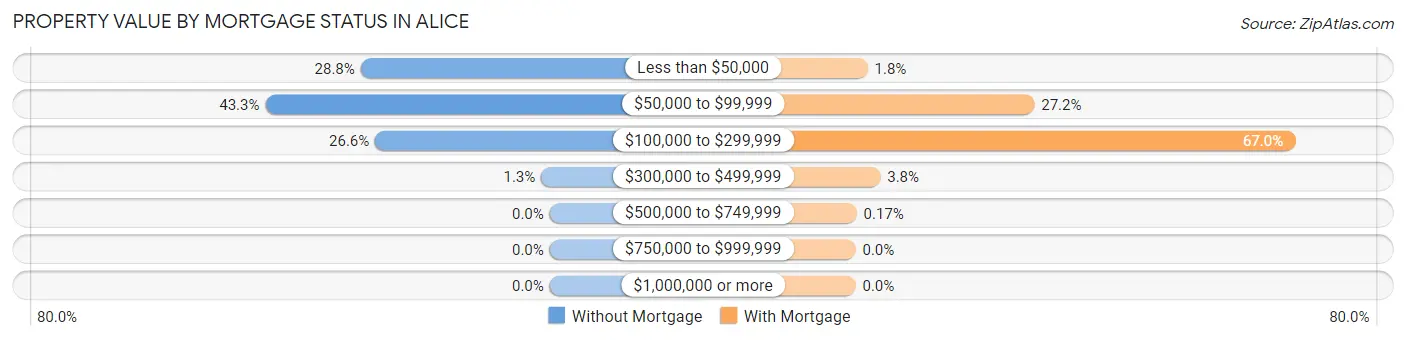
| Property Value | Without Mortgage | With Mortgage |
| Less than $50,000 | 601 (28.8%) | 22 (1.8%) |
| $50,000 to $99,999 | 904 (43.3%) | 325 (27.2%) |
| $100,000 to $299,999 | 555 (26.6%) | 799 (67.0%) |
| $300,000 to $499,999 | 27 (1.3%) | 45 (3.8%) |
| $500,000 to $749,999 | 0 (0.0%) | 2 (0.2%) |
| $750,000 to $999,999 | 0 (0.0%) | 0 (0.0%) |
| $1,000,000 or more | 0 (0.0%) | 0 (0.0%) |
| Total | 2,087 (100.0%) | 1,193 (100.0%) |
Household Income by Mortgage Status in Alice
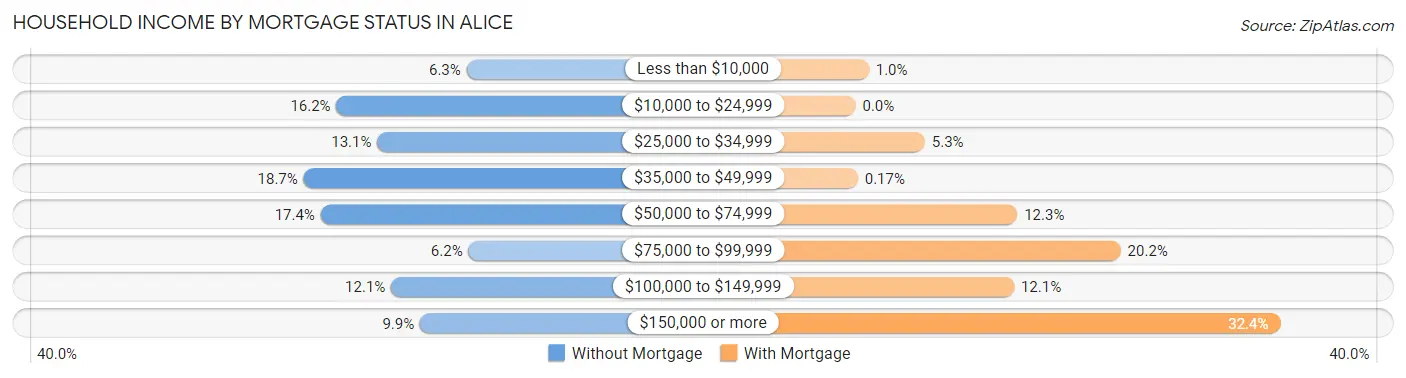
| Household Income | Without Mortgage | With Mortgage |
| Less than $10,000 | 132 (6.3%) | 12 (1.0%) |
| $10,000 to $24,999 | 339 (16.2%) | 0 (0.0%) |
| $25,000 to $34,999 | 274 (13.1%) | 63 (5.3%) |
| $35,000 to $49,999 | 391 (18.7%) | 2 (0.2%) |
| $50,000 to $74,999 | 364 (17.4%) | 147 (12.3%) |
| $75,000 to $99,999 | 129 (6.2%) | 241 (20.2%) |
| $100,000 to $149,999 | 252 (12.1%) | 144 (12.1%) |
| $150,000 or more | 206 (9.9%) | 386 (32.4%) |
| Total | 2,087 (100.0%) | 1,193 (100.0%) |
Property Value to Household Income Ratio in Alice
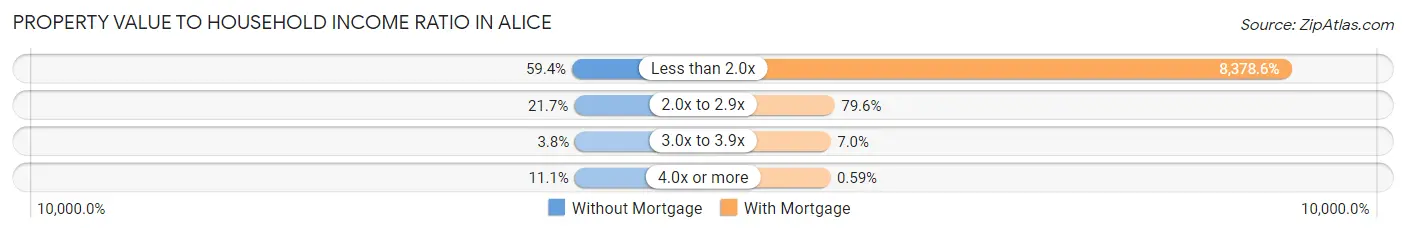
| Value-to-Income Ratio | Without Mortgage | With Mortgage |
| Less than 2.0x | 1,240 (59.4%) | 99,957 (8,378.6%) |
| 2.0x to 2.9x | 453 (21.7%) | 949 (79.5%) |
| 3.0x to 3.9x | 79 (3.8%) | 84 (7.0%) |
| 4.0x or more | 231 (11.1%) | 7 (0.6%) |
| Total | 2,087 (100.0%) | 1,193 (100.0%) |
Real Estate Taxes by Mortgage Status in Alice
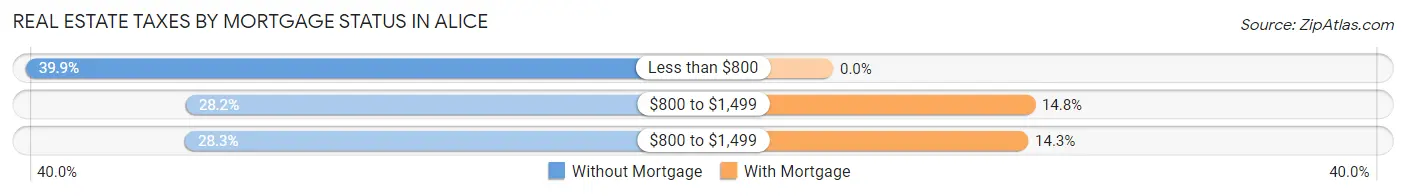
| Property Taxes | Without Mortgage | With Mortgage |
| Less than $800 | 833 (39.9%) | 0 (0.0%) |
| $800 to $1,499 | 589 (28.2%) | 176 (14.7%) |
| $800 to $1,499 | 590 (28.3%) | 170 (14.2%) |
| Total | 2,087 (100.0%) | 1,193 (100.0%) |
Health & Disability in Alice
Health Insurance Coverage by Age in Alice
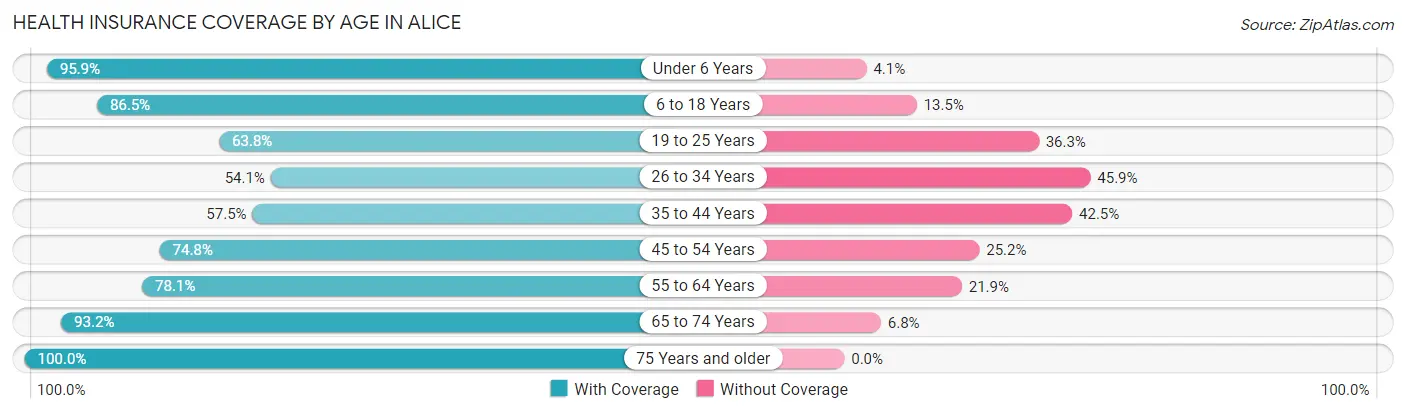
| Age Bracket | With Coverage | Without Coverage |
| Under 6 Years | 1,227 (95.9%) | 53 (4.1%) |
| 6 to 18 Years | 3,761 (86.5%) | 587 (13.5%) |
| 19 to 25 Years | 897 (63.7%) | 510 (36.2%) |
| 26 to 34 Years | 1,028 (54.1%) | 872 (45.9%) |
| 35 to 44 Years | 1,430 (57.5%) | 1,056 (42.5%) |
| 45 to 54 Years | 1,527 (74.8%) | 514 (25.2%) |
| 55 to 64 Years | 1,219 (78.1%) | 342 (21.9%) |
| 65 to 74 Years | 1,422 (93.2%) | 104 (6.8%) |
| 75 Years and older | 1,068 (100.0%) | 0 (0.0%) |
| Total | 13,579 (77.1%) | 4,038 (22.9%) |
Health Insurance Coverage by Citizenship Status in Alice
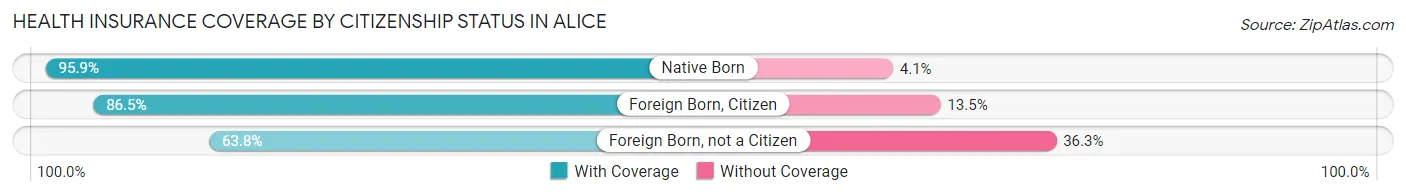
| Citizenship Status | With Coverage | Without Coverage |
| Native Born | 1,227 (95.9%) | 53 (4.1%) |
| Foreign Born, Citizen | 3,761 (86.5%) | 587 (13.5%) |
| Foreign Born, not a Citizen | 897 (63.7%) | 510 (36.2%) |
Health Insurance Coverage by Household Income in Alice
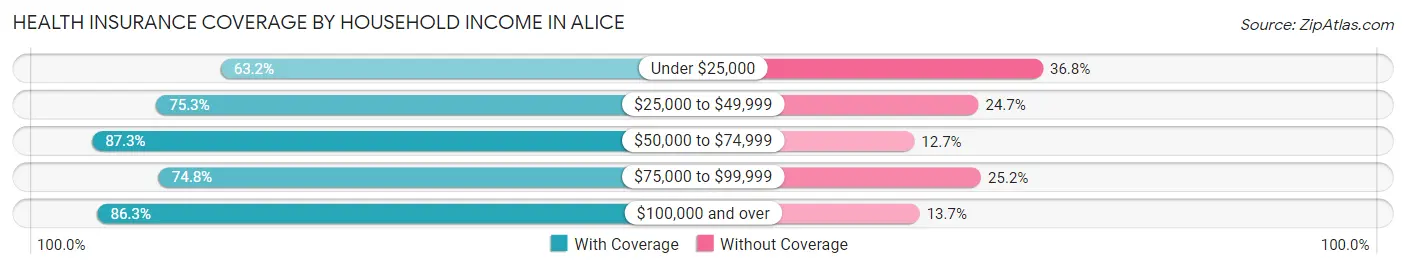
| Household Income | With Coverage | Without Coverage |
| Under $25,000 | 2,703 (63.2%) | 1,572 (36.8%) |
| $25,000 to $49,999 | 3,249 (75.3%) | 1,065 (24.7%) |
| $50,000 to $74,999 | 2,048 (87.3%) | 297 (12.7%) |
| $75,000 to $99,999 | 1,237 (74.8%) | 416 (25.2%) |
| $100,000 and over | 4,321 (86.3%) | 684 (13.7%) |
Public vs Private Health Insurance Coverage by Age in Alice
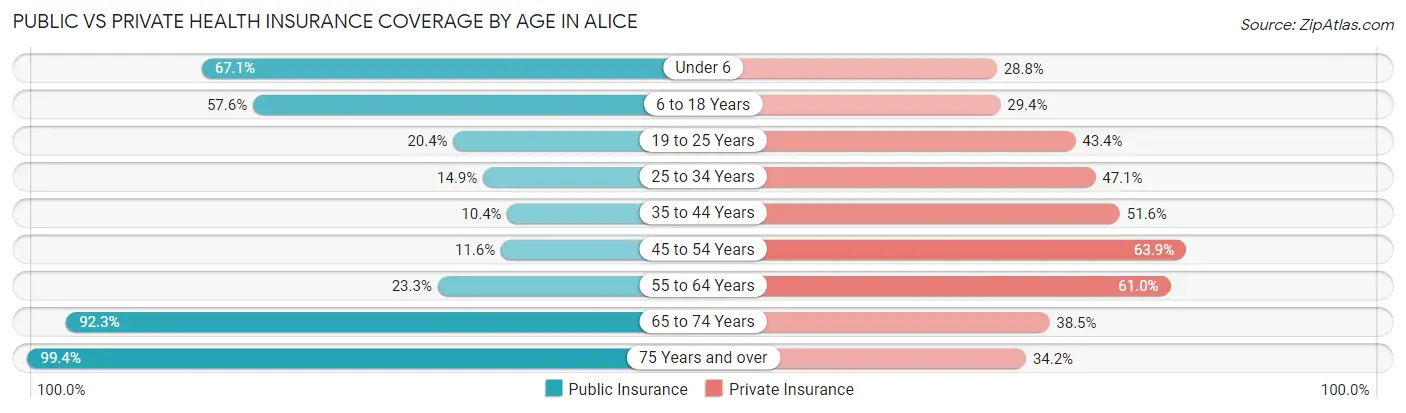
| Age Bracket | Public Insurance | Private Insurance |
| Under 6 | 859 (67.1%) | 368 (28.7%) |
| 6 to 18 Years | 2,505 (57.6%) | 1,279 (29.4%) |
| 19 to 25 Years | 287 (20.4%) | 610 (43.3%) |
| 25 to 34 Years | 283 (14.9%) | 894 (47.0%) |
| 35 to 44 Years | 258 (10.4%) | 1,283 (51.6%) |
| 45 to 54 Years | 236 (11.6%) | 1,304 (63.9%) |
| 55 to 64 Years | 364 (23.3%) | 952 (61.0%) |
| 65 to 74 Years | 1,408 (92.3%) | 588 (38.5%) |
| 75 Years and over | 1,062 (99.4%) | 365 (34.2%) |
| Total | 7,262 (41.2%) | 7,643 (43.4%) |
Disability Status by Sex by Age in Alice
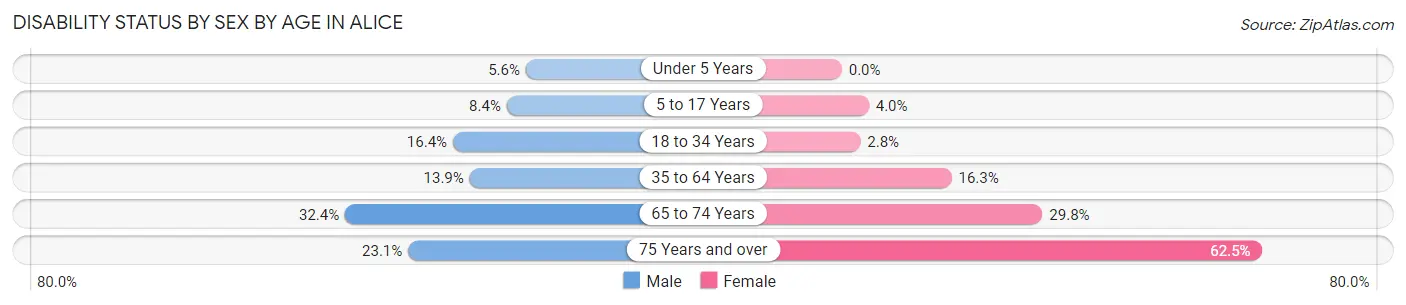
| Age Bracket | Male | Female |
| Under 5 Years | 22 (5.6%) | 0 (0.0%) |
| 5 to 17 Years | 193 (8.4%) | 77 (4.0%) |
| 18 to 34 Years | 275 (16.4%) | 55 (2.8%) |
| 35 to 64 Years | 381 (13.9%) | 546 (16.3%) |
| 65 to 74 Years | 214 (32.4%) | 258 (29.8%) |
| 75 Years and over | 124 (23.1%) | 331 (62.5%) |
Disability Class by Sex by Age in Alice
Disability Class: Hearing Difficulty
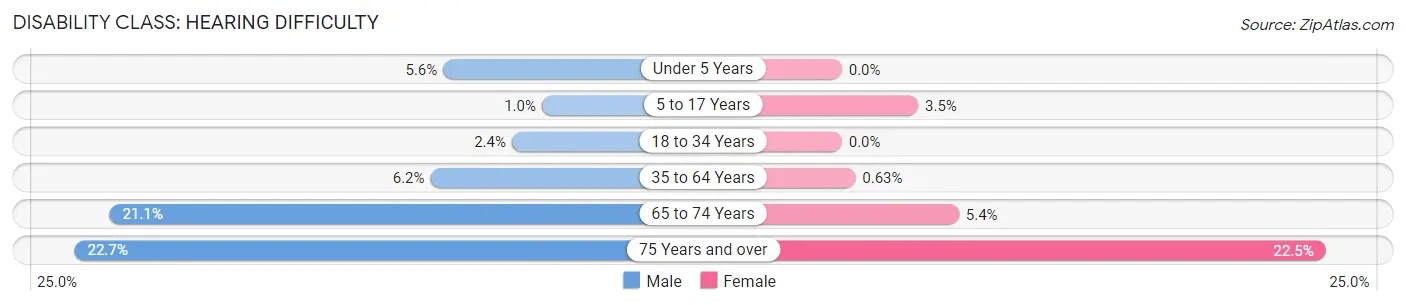
| Age Bracket | Male | Female |
| Under 5 Years | 22 (5.6%) | 0 (0.0%) |
| 5 to 17 Years | 23 (1.0%) | 68 (3.5%) |
| 18 to 34 Years | 40 (2.4%) | 0 (0.0%) |
| 35 to 64 Years | 169 (6.2%) | 21 (0.6%) |
| 65 to 74 Years | 139 (21.1%) | 47 (5.4%) |
| 75 Years and over | 122 (22.7%) | 119 (22.5%) |
Disability Class: Vision Difficulty
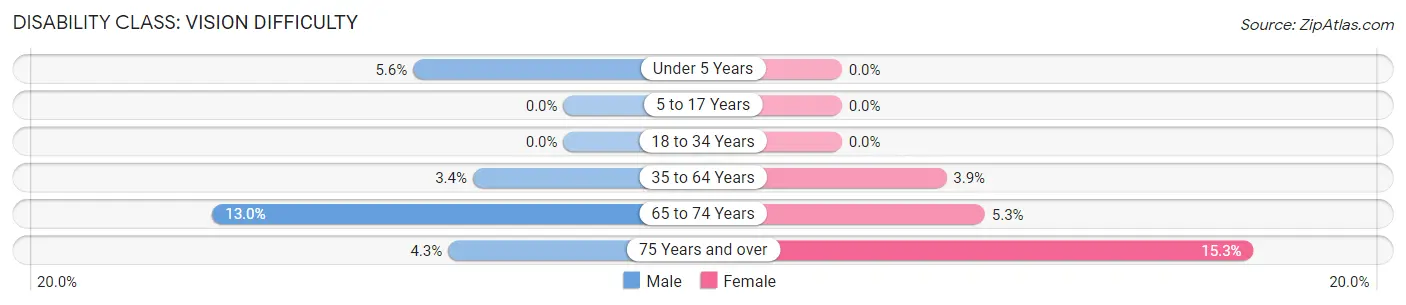
| Age Bracket | Male | Female |
| Under 5 Years | 22 (5.6%) | 0 (0.0%) |
| 5 to 17 Years | 0 (0.0%) | 0 (0.0%) |
| 18 to 34 Years | 0 (0.0%) | 0 (0.0%) |
| 35 to 64 Years | 92 (3.4%) | 130 (3.9%) |
| 65 to 74 Years | 86 (13.0%) | 46 (5.3%) |
| 75 Years and over | 23 (4.3%) | 81 (15.3%) |
Disability Class: Cognitive Difficulty
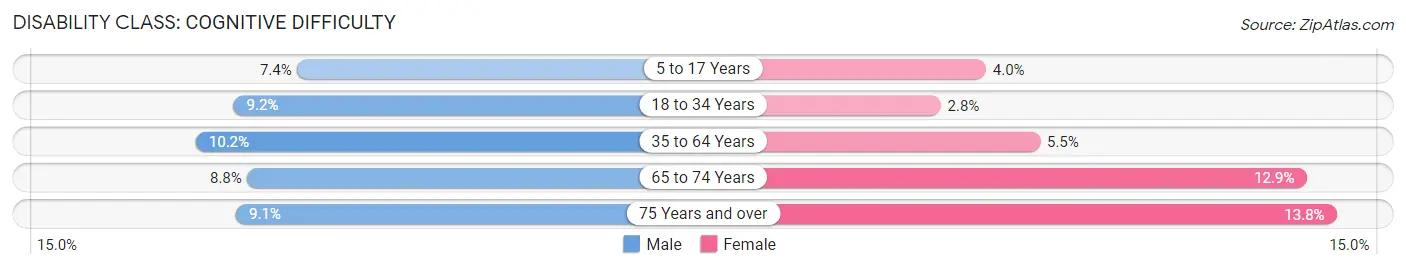
| Age Bracket | Male | Female |
| 5 to 17 Years | 170 (7.4%) | 77 (4.0%) |
| 18 to 34 Years | 154 (9.2%) | 55 (2.8%) |
| 35 to 64 Years | 280 (10.2%) | 185 (5.5%) |
| 65 to 74 Years | 58 (8.8%) | 112 (12.9%) |
| 75 Years and over | 49 (9.1%) | 73 (13.8%) |
Disability Class: Ambulatory Difficulty
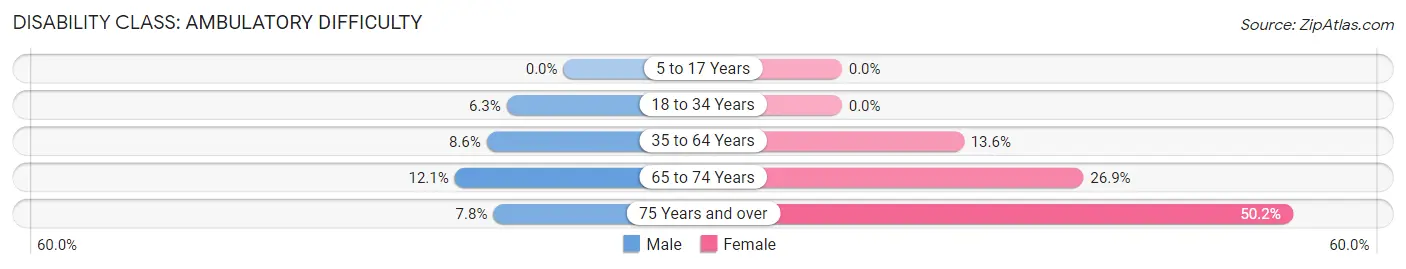
| Age Bracket | Male | Female |
| 5 to 17 Years | 0 (0.0%) | 0 (0.0%) |
| 18 to 34 Years | 106 (6.3%) | 0 (0.0%) |
| 35 to 64 Years | 234 (8.6%) | 455 (13.6%) |
| 65 to 74 Years | 80 (12.1%) | 233 (26.9%) |
| 75 Years and over | 42 (7.8%) | 266 (50.2%) |
Disability Class: Self-Care Difficulty
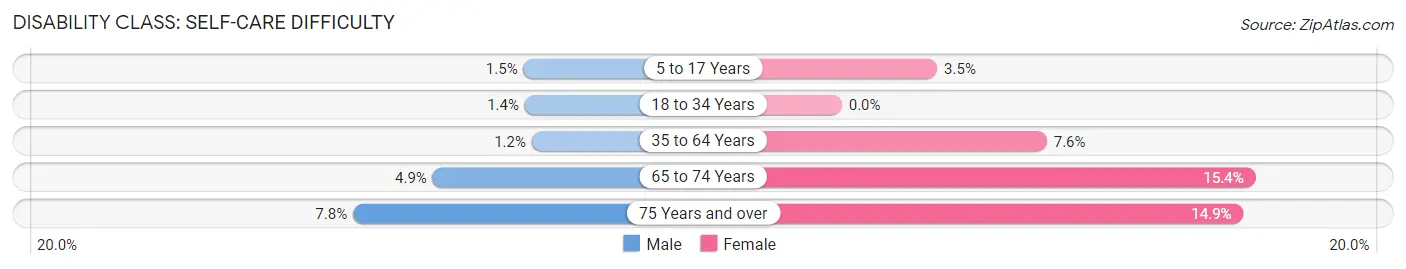
| Age Bracket | Male | Female |
| 5 to 17 Years | 34 (1.5%) | 68 (3.5%) |
| 18 to 34 Years | 24 (1.4%) | 0 (0.0%) |
| 35 to 64 Years | 32 (1.2%) | 255 (7.6%) |
| 65 to 74 Years | 32 (4.9%) | 133 (15.4%) |
| 75 Years and over | 42 (7.8%) | 79 (14.9%) |
Technology Access in Alice
Computing Device Access in Alice
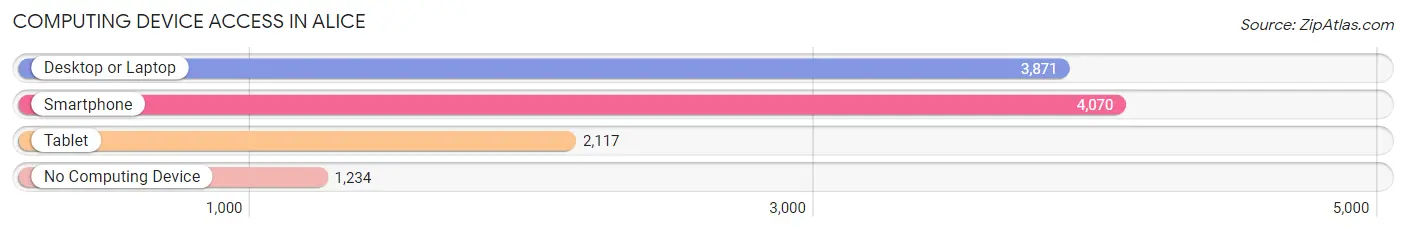
| Device Type | # Households | % Households |
| Desktop or Laptop | 3,871 | 65.0% |
| Smartphone | 4,070 | 68.3% |
| Tablet | 2,117 | 35.5% |
| No Computing Device | 1,234 | 20.7% |
| Total | 5,955 | 100.0% |
Internet Access in Alice
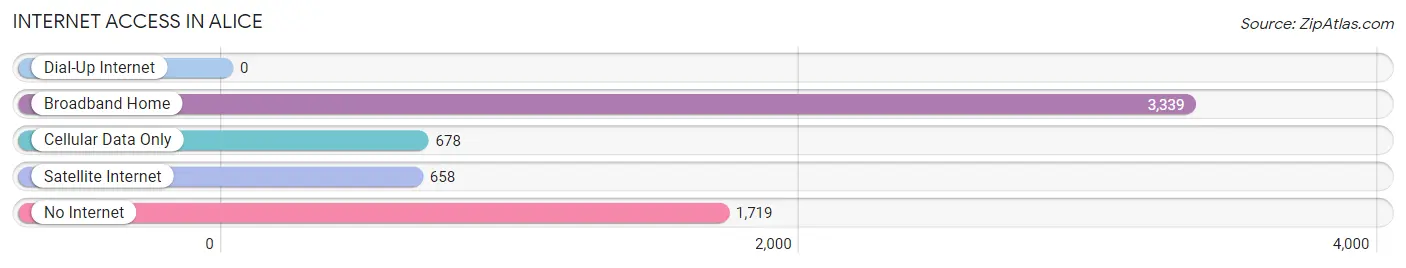
| Internet Type | # Households | % Households |
| Dial-Up Internet | 0 | 0.0% |
| Broadband Home | 3,339 | 56.1% |
| Cellular Data Only | 678 | 11.4% |
| Satellite Internet | 658 | 11.1% |
| No Internet | 1,719 | 28.9% |
| Total | 5,955 | 100.0% |
Alice Summary
Alice, Texas is a city located in Jim Wells County in the South Texas region of the United States. The city is located about 30 miles from Corpus Christi and is part of the larger Corpus Christi-Kingsville-Alice Combined Statistical Area. As of the 2010 census, the population of Alice was 19,104, making it the largest city in Jim Wells County.
History
Alice was founded in 1888 by the Alice Town and Improvement Company, which was formed by the South Texas Land Company. The town was named after Alice Gertrudis King Kleberg, the daughter of Richard King, the founder of the King Ranch. The town was originally intended to be a stop on the San Antonio and Aransas Pass Railway, but the railroad bypassed Alice and instead went through nearby Orange Grove.
Alice was officially incorporated in 1911 and quickly became a center for the surrounding agricultural industry. The city was also home to several oil and gas companies, which helped to fuel the local economy.
Geography
Alice is located at 28°44'N 98°04'W (28.7333, -98.0667). The city is situated in the Coastal Plains region of South Texas, about 30 miles from Corpus Christi. Alice is located at the intersection of U.S. Highway 281 and State Highway 44.
Alice has a total area of 8.3 square miles, all of which is land. The city is located in the Nueces River watershed and is home to several creeks and streams, including the San Diego Creek, the San Antonio Creek, and the Nueces River.
Economy
Alice is a major center for the agricultural industry in South Texas. The city is home to several large farms and ranches, including the King Ranch, which is one of the largest ranches in the United States. The city is also home to several oil and gas companies, which help to fuel the local economy.
Alice is also home to several manufacturing companies, including the Alice Manufacturing Company, which produces a variety of products, including furniture, clothing, and automotive parts. The city is also home to several retail stores, restaurants, and other businesses.
Demographics
As of the 2010 census, the population of Alice was 19,104. The racial makeup of the city was 75.3% White, 0.9% African American, 0.7% Native American, 0.4% Asian, 0.1% Pacific Islander, 20.2% from other races, and 2.4% from two or more races. Hispanic or Latino of any race were 78.2% of the population.
The median household income in Alice was $30,945, and the median family income was $35,945. The per capita income for the city was $14,945. About 22.2% of the population was below the poverty line.
Common Questions
What is Per Capita Income in Alice?
Per Capita income in Alice is $23,251.
What is the Median Family Income in Alice?
Median Family Income in Alice is $51,892.
What is the Median Household income in Alice?
Median Household Income in Alice is $43,017.
What is Income or Wage Gap in Alice?
Income or Wage Gap in Alice is 41.0%.
Women in Alice earn 59.0 cents for every dollar earned by a man.
What is Inequality or Gini Index in Alice?
Inequality or Gini Index in Alice is 0.48.
What is the Total Population of Alice?
Total Population of Alice is 17,916.
What is the Total Male Population of Alice?
Total Male Population of Alice is 8,450.
What is the Total Female Population of Alice?
Total Female Population of Alice is 9,466.
What is the Ratio of Males per 100 Females in Alice?
There are 89.27 Males per 100 Females in Alice.
What is the Ratio of Females per 100 Males in Alice?
There are 112.02 Females per 100 Males in Alice.
What is the Median Population Age in Alice?
Median Population Age in Alice is 35.0 Years.
What is the Average Family Size in Alice
Average Family Size in Alice is 3.5 People.
What is the Average Household Size in Alice
Average Household Size in Alice is 3.0 People.
How Large is the Labor Force in Alice?
There are 7,166 People in the Labor Forcein in Alice.
What is the Percentage of People in the Labor Force in Alice?
54.0% of People are in the Labor Force in Alice.
What is the Unemployment Rate in Alice?
Unemployment Rate in Alice is 3.3%.