Auburn, AL Map & Demographics
Auburn Map
Auburn Overview
$35,115
PER CAPITA INCOME
$104,540
AVG FAMILY INCOME
$55,509
AVG HOUSEHOLD INCOME
19.5%
WAGE / INCOME GAP [ % ]
80.5¢/ $1
WAGE / INCOME GAP [ $ ]
$11,795
FAMILY INCOME DEFICIT
0.57
INEQUALITY / GINI INDEX
76,660
TOTAL POPULATION
37,387
MALE POPULATION
39,273
FEMALE POPULATION
95.20
MALES / 100 FEMALES
105.04
FEMALES / 100 MALES
25.9
MEDIAN AGE
3.2
AVG FAMILY SIZE
2.5
AVG HOUSEHOLD SIZE
37,828
LABOR FORCE [ PEOPLE ]
59.1%
PERCENT IN LABOR FORCE
3.0%
UNEMPLOYMENT RATE
Income in Auburn
Income Overview in Auburn
Per Capita Income in Auburn is $35,115, while median incomes of families and households are $104,540 and $55,509 respectively.
| Characteristic | Number | Measure |
| Per Capita Income | 76,660 | $35,115 |
| Median Family Income | 15,208 | $104,540 |
| Mean Family Income | 15,208 | $138,297 |
| Median Household Income | 28,310 | $55,509 |
| Mean Household Income | 28,310 | $91,972 |
| Income Deficit | 15,208 | $11,795 |
| Wage / Income Gap (%) | 76,660 | 19.53% |
| Wage / Income Gap ($) | 76,660 | 80.47¢ per $1 |
| Gini / Inequality Index | 76,660 | 0.57 |
Earnings by Sex in Auburn
Average Earnings in Auburn are $28,148, $31,670 for men and $25,484 for women, a difference of 19.5%.
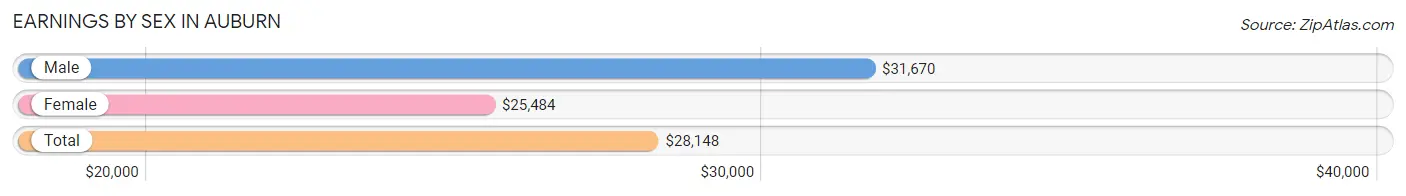
| Sex | Number | Average Earnings |
| Male | 22,220 (50.5%) | $31,670 |
| Female | 21,757 (49.5%) | $25,484 |
| Total | 43,977 (100.0%) | $28,148 |
Earnings by Sex by Income Bracket in Auburn
The most common earnings brackets in Auburn are $100,000+ for men (4,149 | 18.7%) and $2,499 or less for women (2,888 | 13.3%).
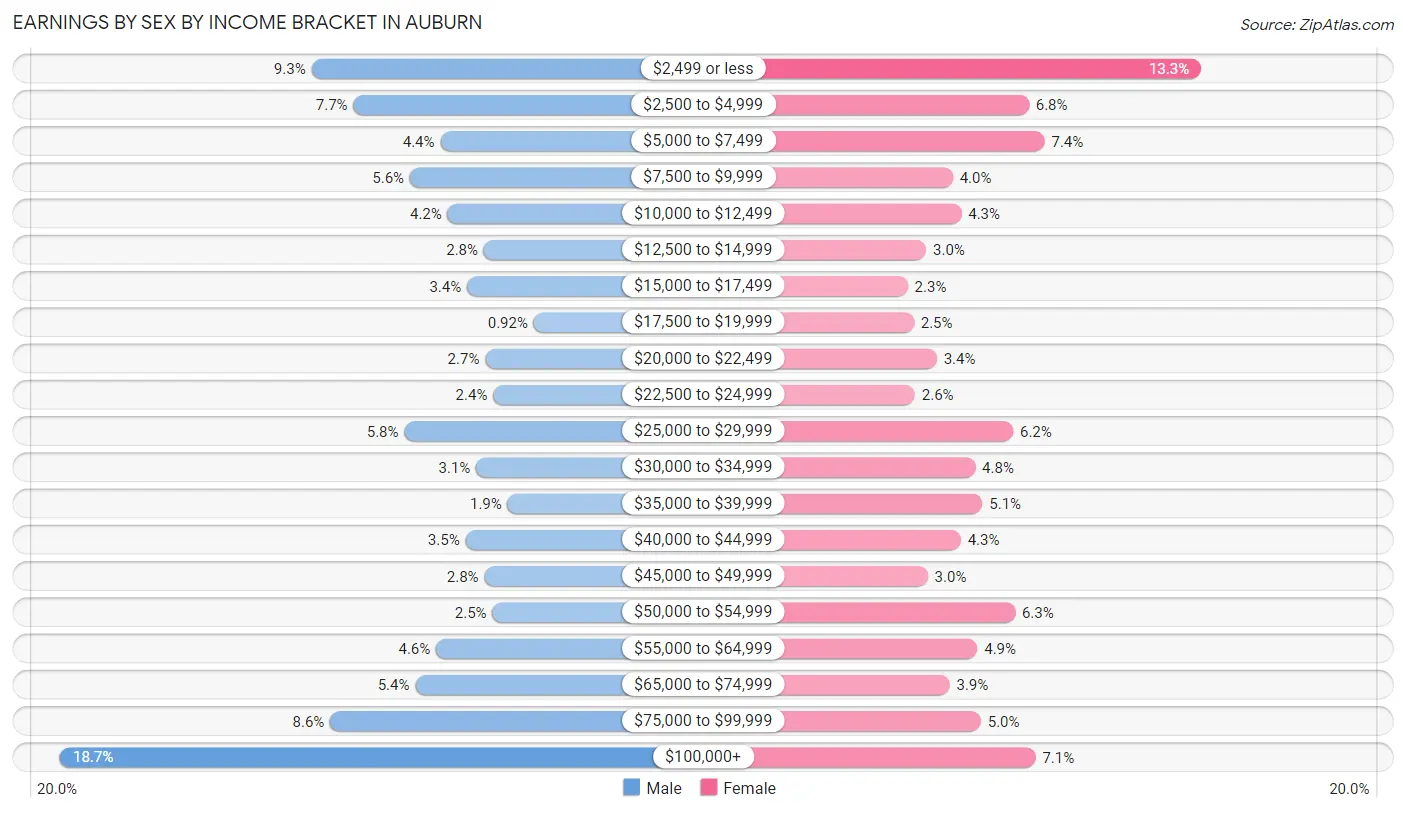
| Income | Male | Female |
| $2,499 or less | 2,056 (9.2%) | 2,888 (13.3%) |
| $2,500 to $4,999 | 1,707 (7.7%) | 1,484 (6.8%) |
| $5,000 to $7,499 | 982 (4.4%) | 1,612 (7.4%) |
| $7,500 to $9,999 | 1,236 (5.6%) | 864 (4.0%) |
| $10,000 to $12,499 | 922 (4.2%) | 934 (4.3%) |
| $12,500 to $14,999 | 620 (2.8%) | 647 (3.0%) |
| $15,000 to $17,499 | 760 (3.4%) | 495 (2.3%) |
| $17,500 to $19,999 | 204 (0.9%) | 546 (2.5%) |
| $20,000 to $22,499 | 608 (2.7%) | 734 (3.4%) |
| $22,500 to $24,999 | 543 (2.4%) | 555 (2.5%) |
| $25,000 to $29,999 | 1,281 (5.8%) | 1,355 (6.2%) |
| $30,000 to $34,999 | 685 (3.1%) | 1,046 (4.8%) |
| $35,000 to $39,999 | 422 (1.9%) | 1,105 (5.1%) |
| $40,000 to $44,999 | 773 (3.5%) | 930 (4.3%) |
| $45,000 to $49,999 | 615 (2.8%) | 660 (3.0%) |
| $50,000 to $54,999 | 549 (2.5%) | 1,370 (6.3%) |
| $55,000 to $64,999 | 1,018 (4.6%) | 1,063 (4.9%) |
| $65,000 to $74,999 | 1,191 (5.4%) | 838 (3.8%) |
| $75,000 to $99,999 | 1,899 (8.6%) | 1,092 (5.0%) |
| $100,000+ | 4,149 (18.7%) | 1,539 (7.1%) |
| Total | 22,220 (100.0%) | 21,757 (100.0%) |
Earnings by Sex by Educational Attainment in Auburn
Average earnings in Auburn are $60,291 for men and $41,237 for women, a difference of 31.6%. Men with an educational attainment of graduate degree enjoy the highest average annual earnings of $86,472, while those with college or associate's degree education earn the least with $36,821. Women with an educational attainment of graduate degree earn the most with the average annual earnings of $54,035, while those with high school diploma education have the smallest earnings of $30,921.
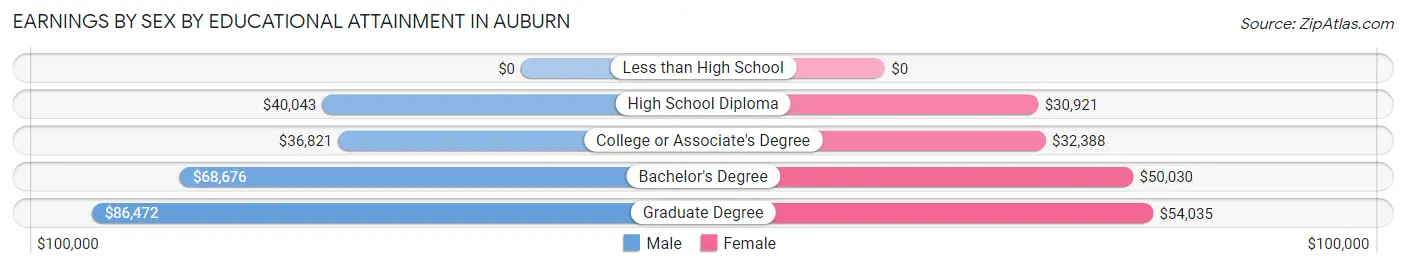
| Educational Attainment | Male Income | Female Income |
| Less than High School | - | - |
| High School Diploma | $40,043 | $30,921 |
| College or Associate's Degree | $36,821 | $32,388 |
| Bachelor's Degree | $68,676 | $50,030 |
| Graduate Degree | $86,472 | $54,035 |
| Total | $60,291 | $41,237 |
Family Income in Auburn
Family Income Brackets in Auburn
According to the Auburn family income data, there are 3,513 families falling into the $100,000 to $149,999 income range, which is the most common income bracket and makes up 23.1% of all families. Conversely, the $10,000 to $14,999 income bracket is the least frequent group with only 259 families (1.7%) belonging to this category.
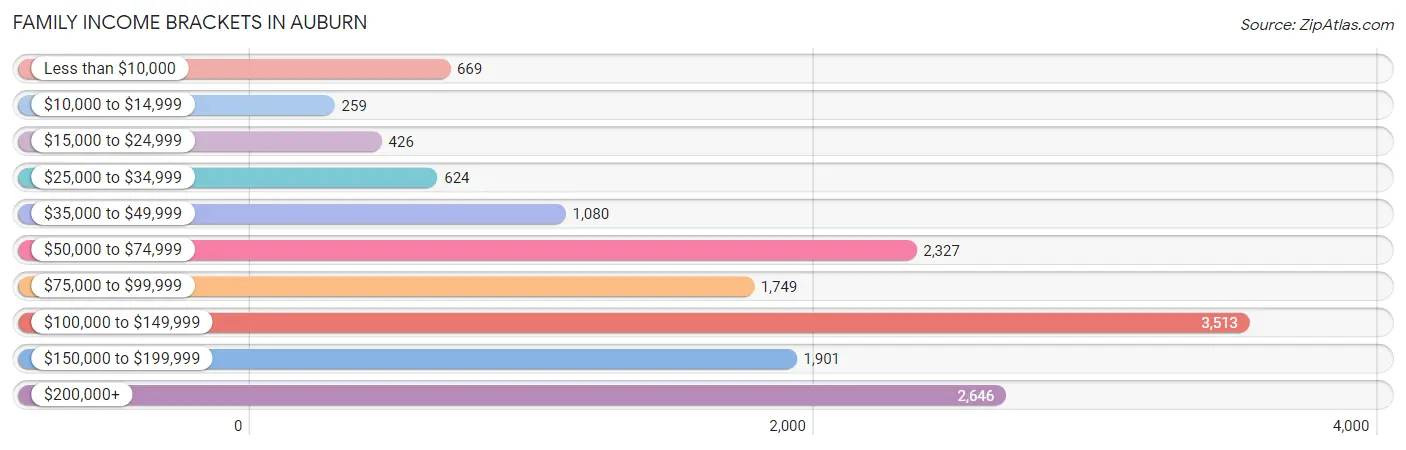
| Income Bracket | # Families | % Families |
| Less than $10,000 | 669 | 4.4% |
| $10,000 to $14,999 | 259 | 1.7% |
| $15,000 to $24,999 | 426 | 2.8% |
| $25,000 to $34,999 | 624 | 4.1% |
| $35,000 to $49,999 | 1,080 | 7.1% |
| $50,000 to $74,999 | 2,327 | 15.3% |
| $75,000 to $99,999 | 1,749 | 11.5% |
| $100,000 to $149,999 | 3,513 | 23.1% |
| $150,000 to $199,999 | 1,901 | 12.5% |
| $200,000+ | 2,646 | 17.4% |
Family Income by Famaliy Size in Auburn
7+ person families (23 | 0.2%) account for the highest median family income in Auburn with $194,464 per family, while 2-person families (6,656 | 43.8%) have the highest median income of $41,793 per family member.
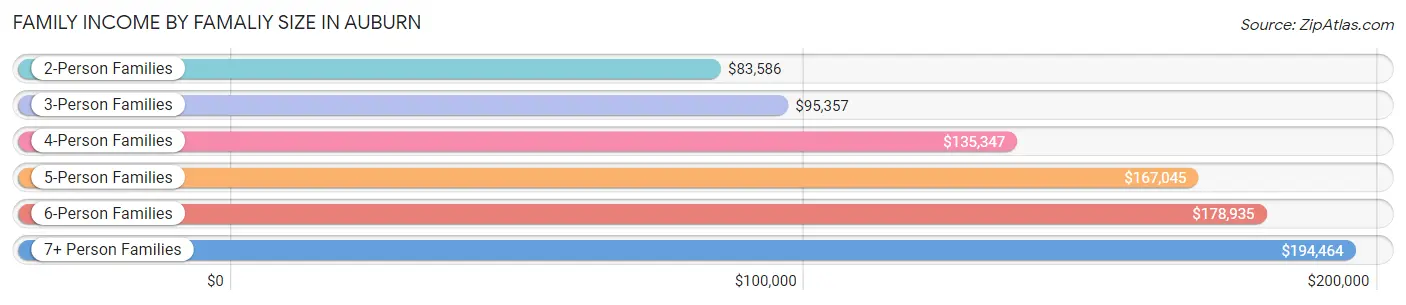
| Income Bracket | # Families | Median Income |
| 2-Person Families | 6,656 (43.8%) | $83,586 |
| 3-Person Families | 3,916 (25.8%) | $95,357 |
| 4-Person Families | 3,456 (22.7%) | $135,347 |
| 5-Person Families | 918 (6.0%) | $167,045 |
| 6-Person Families | 239 (1.6%) | $178,935 |
| 7+ Person Families | 23 (0.2%) | $194,464 |
| Total | 15,208 (100.0%) | $104,540 |
Family Income by Number of Earners in Auburn
The median family income in Auburn is $104,540, with families comprising 3+ earners (1,372) having the highest median family income of $165,682, while families with 1 earner (4,491) have the lowest median family income of $68,227, accounting for 9.0% and 29.5% of families, respectively.
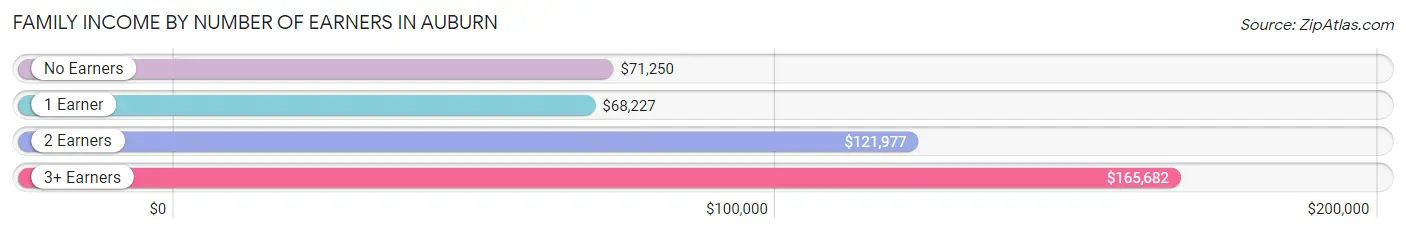
| Number of Earners | # Families | Median Income |
| No Earners | 1,488 (9.8%) | $71,250 |
| 1 Earner | 4,491 (29.5%) | $68,227 |
| 2 Earners | 7,857 (51.7%) | $121,977 |
| 3+ Earners | 1,372 (9.0%) | $165,682 |
| Total | 15,208 (100.0%) | $104,540 |
Household Income in Auburn
Household Income Brackets in Auburn
With 4,756 households falling in the category, the less than $10,000 income range is the most frequent in Auburn, accounting for 16.8% of all households. In contrast, only 1,387 households (4.9%) fall into the $10,000 to $14,999 income bracket, making it the least populous group.
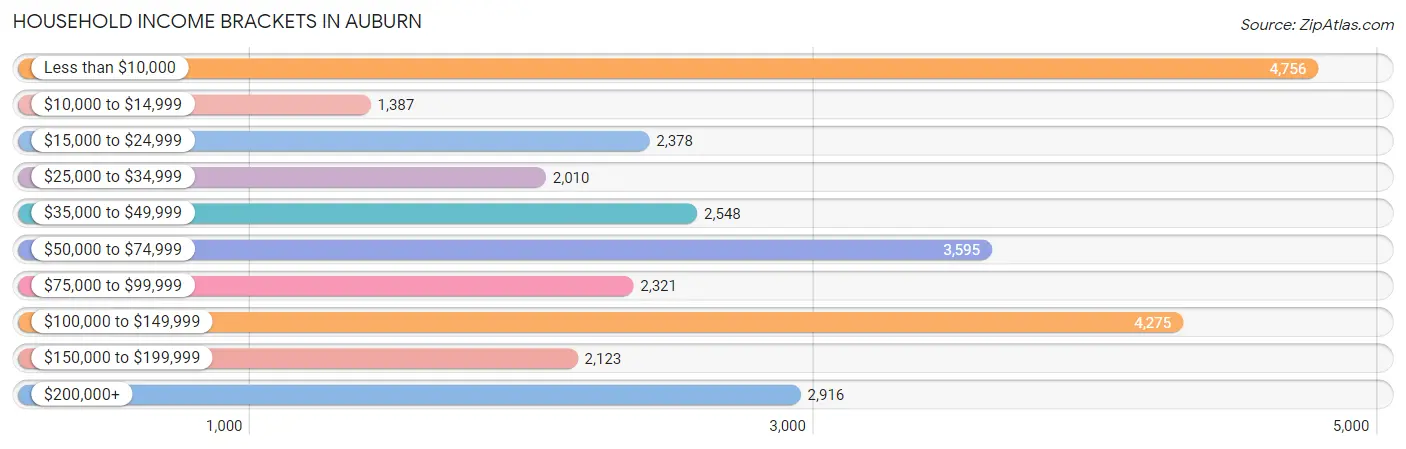
| Income Bracket | # Households | % Households |
| Less than $10,000 | 4,756 | 16.8% |
| $10,000 to $14,999 | 1,387 | 4.9% |
| $15,000 to $24,999 | 2,378 | 8.4% |
| $25,000 to $34,999 | 2,010 | 7.1% |
| $35,000 to $49,999 | 2,548 | 9.0% |
| $50,000 to $74,999 | 3,595 | 12.7% |
| $75,000 to $99,999 | 2,321 | 8.2% |
| $100,000 to $149,999 | 4,275 | 15.1% |
| $150,000 to $199,999 | 2,123 | 7.5% |
| $200,000+ | 2,916 | 10.3% |
Household Income by Householder Age in Auburn
The median household income in Auburn is $55,509, with the highest median household income of $108,964 found in the 45 to 64 years age bracket for the primary householder. A total of 8,037 households (28.4%) fall into this category. Meanwhile, the 15 to 24 years age bracket for the primary householder has the lowest median household income of $9,959, with 5,549 households (19.6%) in this group.
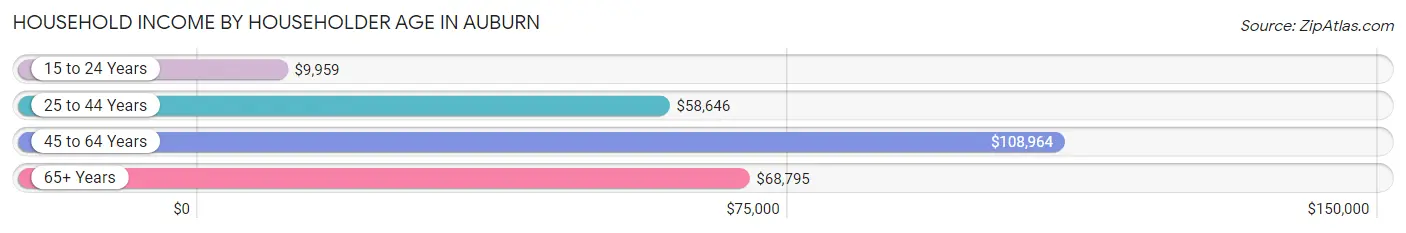
| Income Bracket | # Households | Median Income |
| 15 to 24 Years | 5,549 (19.6%) | $9,959 |
| 25 to 44 Years | 10,752 (38.0%) | $58,646 |
| 45 to 64 Years | 8,037 (28.4%) | $108,964 |
| 65+ Years | 3,972 (14.0%) | $68,795 |
| Total | 28,310 (100.0%) | $55,509 |
Poverty in Auburn
Income Below Poverty by Sex and Age in Auburn
With 26.1% poverty level for males and 23.2% for females among the residents of Auburn, 18 to 24 year old males and 18 to 24 year old females are the most vulnerable to poverty, with 6,319 males (69.3%) and 4,536 females (66.6%) in their respective age groups living below the poverty level.
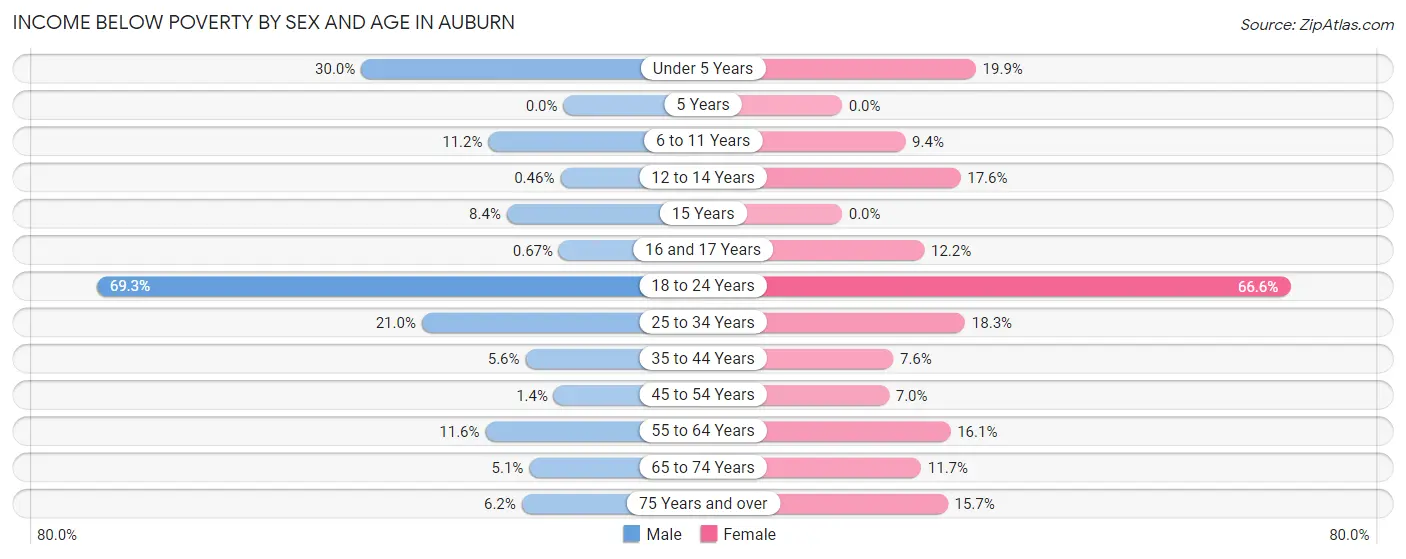
| Age Bracket | Male | Female |
| Under 5 Years | 658 (30.0%) | 306 (19.9%) |
| 5 Years | 0 (0.0%) | 0 (0.0%) |
| 6 to 11 Years | 262 (11.2%) | 245 (9.4%) |
| 12 to 14 Years | 6 (0.5%) | 266 (17.6%) |
| 15 Years | 36 (8.4%) | 0 (0.0%) |
| 16 and 17 Years | 5 (0.7%) | 111 (12.2%) |
| 18 to 24 Years | 6,319 (69.3%) | 4,536 (66.6%) |
| 25 to 34 Years | 1,096 (21.0%) | 979 (18.3%) |
| 35 to 44 Years | 220 (5.6%) | 342 (7.6%) |
| 45 to 54 Years | 56 (1.4%) | 306 (7.0%) |
| 55 to 64 Years | 319 (11.6%) | 486 (16.1%) |
| 65 to 74 Years | 87 (5.1%) | 244 (11.7%) |
| 75 Years and over | 74 (6.2%) | 247 (15.7%) |
| Total | 9,138 (26.1%) | 8,068 (23.2%) |
Income Above Poverty by Sex and Age in Auburn
According to the poverty statistics in Auburn, males aged 5 years and females aged 5 years are the age groups that are most secure financially, with 100.0% of males and 100.0% of females in these age groups living above the poverty line.
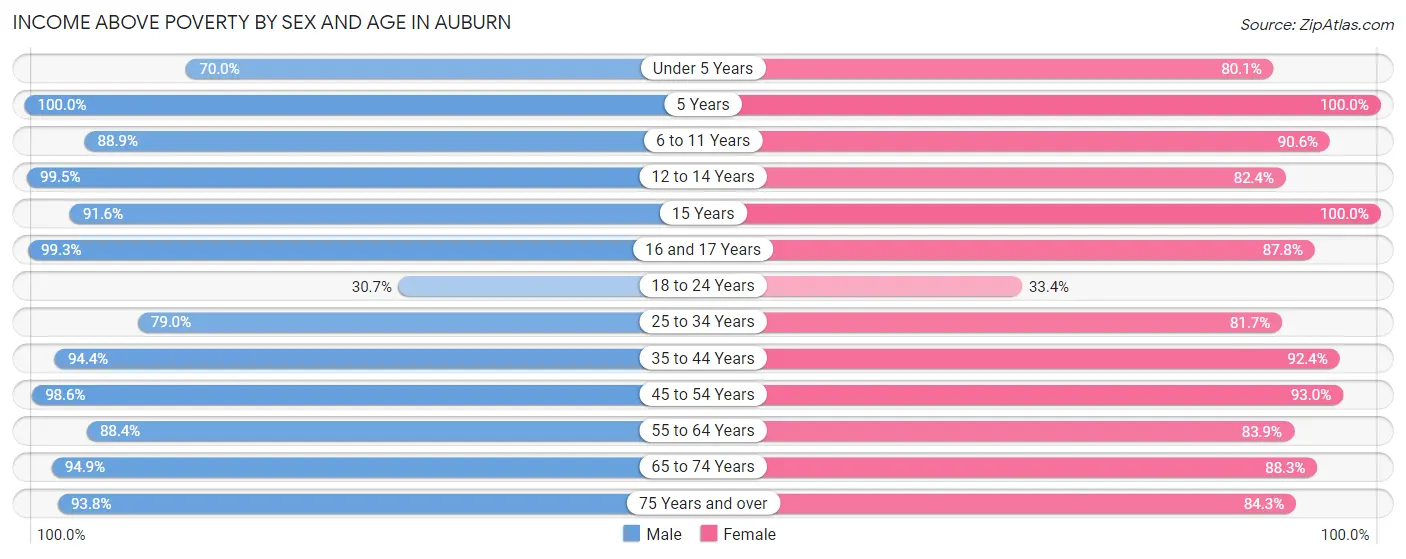
| Age Bracket | Male | Female |
| Under 5 Years | 1,533 (70.0%) | 1,233 (80.1%) |
| 5 Years | 201 (100.0%) | 305 (100.0%) |
| 6 to 11 Years | 2,088 (88.8%) | 2,358 (90.6%) |
| 12 to 14 Years | 1,308 (99.5%) | 1,245 (82.4%) |
| 15 Years | 392 (91.6%) | 212 (100.0%) |
| 16 and 17 Years | 744 (99.3%) | 798 (87.8%) |
| 18 to 24 Years | 2,803 (30.7%) | 2,279 (33.4%) |
| 25 to 34 Years | 4,115 (79.0%) | 4,376 (81.7%) |
| 35 to 44 Years | 3,683 (94.4%) | 4,150 (92.4%) |
| 45 to 54 Years | 3,886 (98.6%) | 4,080 (93.0%) |
| 55 to 64 Years | 2,435 (88.4%) | 2,532 (83.9%) |
| 65 to 74 Years | 1,630 (94.9%) | 1,834 (88.3%) |
| 75 Years and over | 1,119 (93.8%) | 1,326 (84.3%) |
| Total | 25,937 (74.0%) | 26,728 (76.8%) |
Income Below Poverty Among Married-Couple Families in Auburn
The poverty statistics for married-couple families in Auburn show that 3.9% or 461 of the total 11,833 families live below the poverty line. Families with no children have the highest poverty rate of 4.9%, comprising of 298 families. On the other hand, families with 5 or more children have the lowest poverty rate of 0.0%, which includes 0 families.
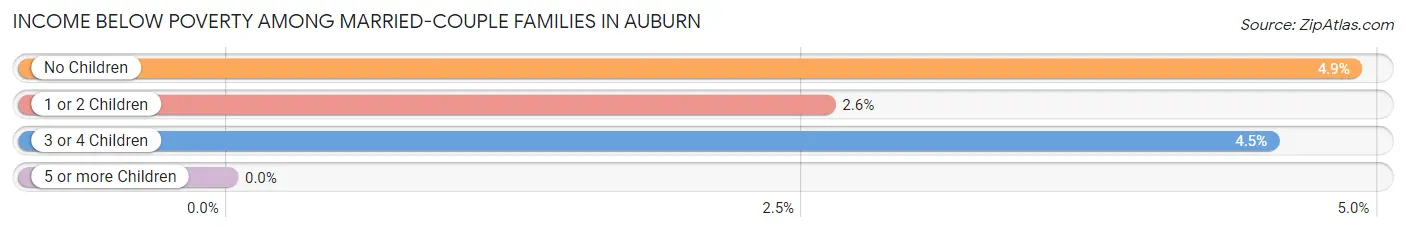
| Children | Above Poverty | Below Poverty |
| No Children | 5,793 (95.1%) | 298 (4.9%) |
| 1 or 2 Children | 4,877 (97.4%) | 130 (2.6%) |
| 3 or 4 Children | 696 (95.5%) | 33 (4.5%) |
| 5 or more Children | 6 (100.0%) | 0 (0.0%) |
| Total | 11,372 (96.1%) | 461 (3.9%) |
Income Below Poverty Among Single-Parent Households in Auburn
According to the poverty data in Auburn, 16.6% or 107 single-father households and 25.9% or 707 single-mother households are living below the poverty line. Among single-father households, those with no children have the highest poverty rate, with 67 households (21.5%) experiencing poverty. Likewise, among single-mother households, those with 3 or 4 children have the highest poverty rate, with 100 households (100.0%) falling below the poverty line.
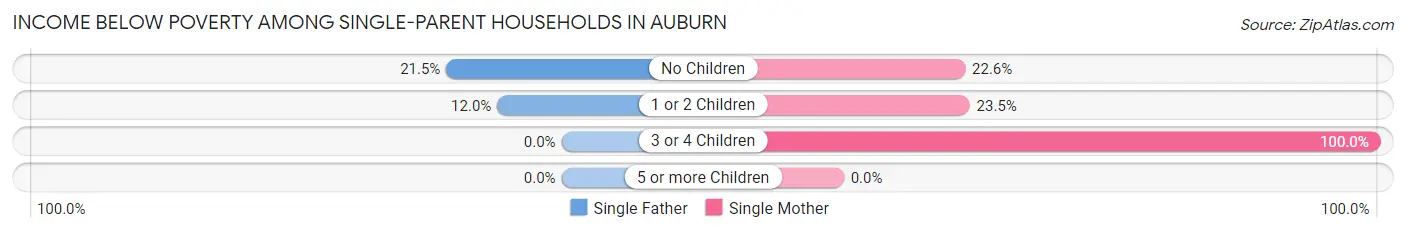
| Children | Single Father | Single Mother |
| No Children | 67 (21.5%) | 266 (22.6%) |
| 1 or 2 Children | 40 (12.0%) | 341 (23.5%) |
| 3 or 4 Children | 0 (0.0%) | 100 (100.0%) |
| 5 or more Children | 0 (0.0%) | 0 (0.0%) |
| Total | 107 (16.6%) | 707 (25.9%) |
Income Below Poverty Among Married-Couple vs Single-Parent Households in Auburn
The poverty data for Auburn shows that 461 of the married-couple family households (3.9%) and 814 of the single-parent households (24.1%) are living below the poverty level. Within the married-couple family households, those with no children have the highest poverty rate, with 298 households (4.9%) falling below the poverty line. Among the single-parent households, those with 3 or 4 children have the highest poverty rate, with 100 household (100.0%) living below poverty.
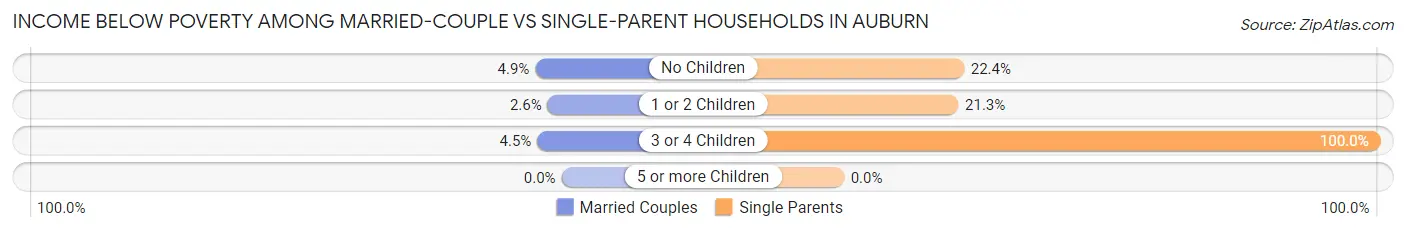
| Children | Married-Couple Families | Single-Parent Households |
| No Children | 298 (4.9%) | 333 (22.4%) |
| 1 or 2 Children | 130 (2.6%) | 381 (21.3%) |
| 3 or 4 Children | 33 (4.5%) | 100 (100.0%) |
| 5 or more Children | 0 (0.0%) | 0 (0.0%) |
| Total | 461 (3.9%) | 814 (24.1%) |
Race in Auburn
The most populous races in Auburn are White / Caucasian (52,910 | 69.0%), Black / African American (13,729 | 17.9%), and Asian (6,256 | 8.2%).
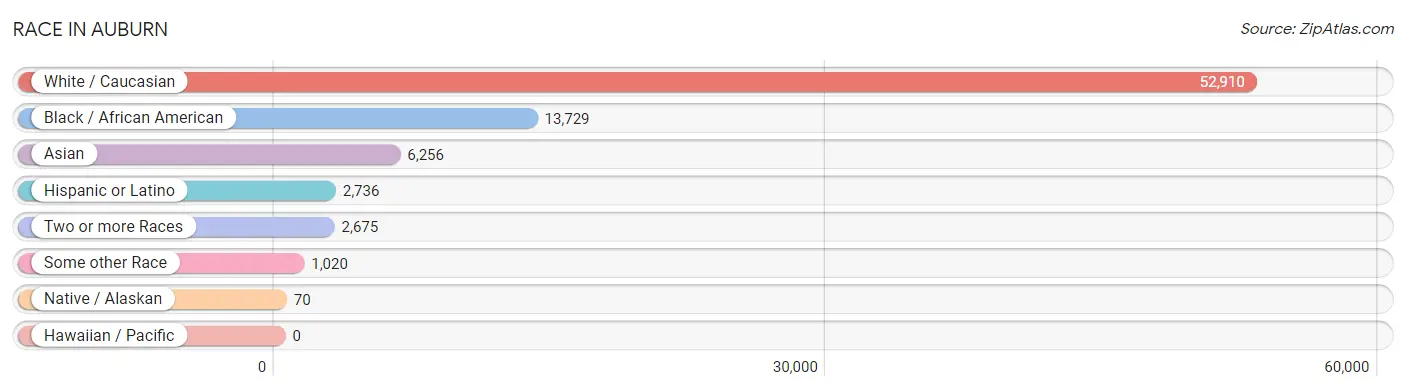
| Race | # Population | % Population |
| Asian | 6,256 | 8.2% |
| Black / African American | 13,729 | 17.9% |
| Hawaiian / Pacific | 0 | 0.0% |
| Hispanic or Latino | 2,736 | 3.6% |
| Native / Alaskan | 70 | 0.1% |
| White / Caucasian | 52,910 | 69.0% |
| Two or more Races | 2,675 | 3.5% |
| Some other Race | 1,020 | 1.3% |
| Total | 76,660 | 100.0% |
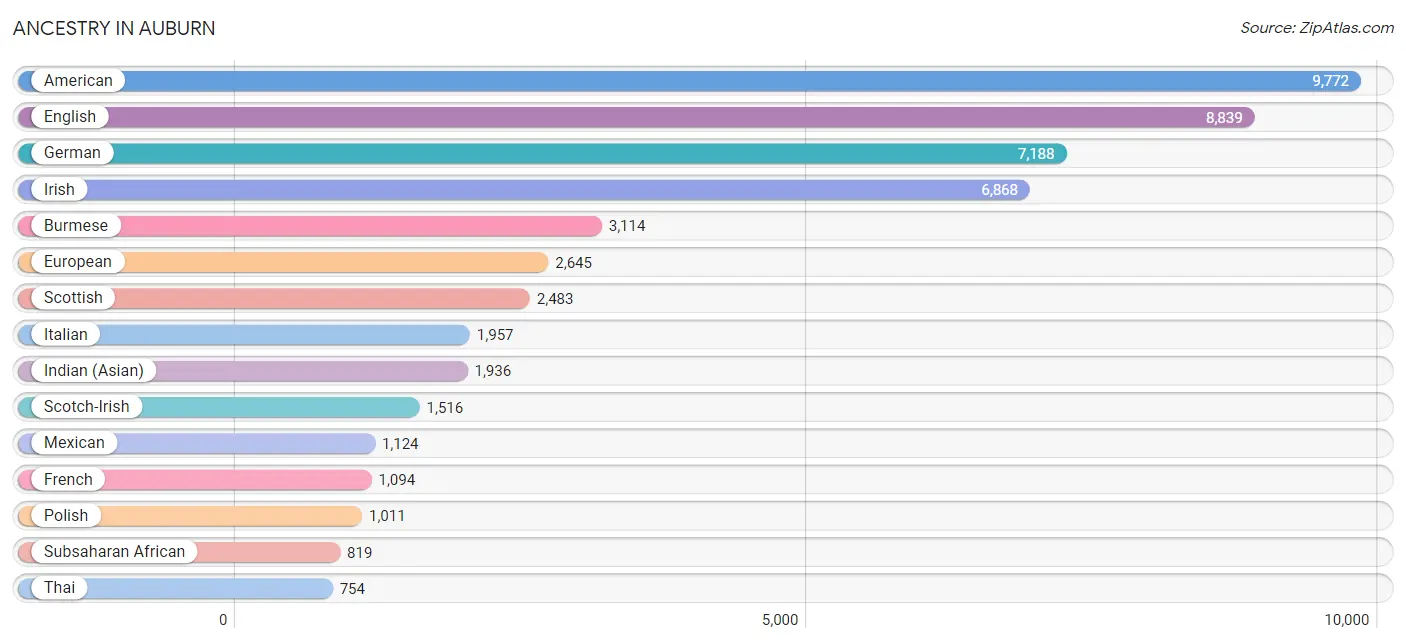
Ancestry in Auburn
The most populous ancestries reported in Auburn are American (9,772 | 12.8%), English (8,839 | 11.5%), German (7,188 | 9.4%), Irish (6,868 | 9.0%), and Burmese (3,114 | 4.1%), together accounting for 46.7% of all Auburn residents.
| Ancestry | # Population | % Population |
| African | 244 | 0.3% |
| American | 9,772 | 12.8% |
| Arab | 461 | 0.6% |
| Argentinean | 78 | 0.1% |
| Armenian | 50 | 0.1% |
| Australian | 19 | 0.0% |
| Austrian | 180 | 0.2% |
| Belgian | 10 | 0.0% |
| Bermudan | 18 | 0.0% |
| Bhutanese | 275 | 0.4% |
| Bolivian | 21 | 0.0% |
| Brazilian | 82 | 0.1% |
| British | 675 | 0.9% |
| Burmese | 3,114 | 4.1% |
| Canadian | 232 | 0.3% |
| Central American | 247 | 0.3% |
| Central American Indian | 82 | 0.1% |
| Cherokee | 68 | 0.1% |
| Chilean | 25 | 0.0% |
| Chippewa | 1 | 0.0% |
| Choctaw | 16 | 0.0% |
| Colombian | 49 | 0.1% |
| Costa Rican | 66 | 0.1% |
| Creek | 44 | 0.1% |
| Croatian | 12 | 0.0% |
| Cuban | 101 | 0.1% |
| Czech | 193 | 0.3% |
| Czechoslovakian | 9 | 0.0% |
| Danish | 49 | 0.1% |
| Dominican | 11 | 0.0% |
| Dutch | 567 | 0.7% |
| Ecuadorian | 41 | 0.1% |
| Egyptian | 89 | 0.1% |
| English | 8,839 | 11.5% |
| European | 2,645 | 3.5% |
| Filipino | 17 | 0.0% |
| Finnish | 44 | 0.1% |
| French | 1,094 | 1.4% |
| French Canadian | 181 | 0.2% |
| German | 7,188 | 9.4% |
| German Russian | 39 | 0.1% |
| Ghanaian | 53 | 0.1% |
| Greek | 258 | 0.3% |
| Guamanian / Chamorro | 24 | 0.0% |
| Guatemalan | 9 | 0.0% |
| Haitian | 36 | 0.1% |
| Honduran | 82 | 0.1% |
| Hungarian | 148 | 0.2% |
| Indian (Asian) | 1,936 | 2.5% |
| Iranian | 146 | 0.2% |
| Irish | 6,868 | 9.0% |
| Italian | 1,957 | 2.5% |
| Jamaican | 45 | 0.1% |
| Korean | 223 | 0.3% |
| Laotian | 29 | 0.0% |
| Lebanese | 23 | 0.0% |
| Malaysian | 13 | 0.0% |
| Mexican | 1,124 | 1.5% |
| Moroccan | 14 | 0.0% |
| Native Hawaiian | 10 | 0.0% |
| Nigerian | 237 | 0.3% |
| Northern European | 91 | 0.1% |
| Norwegian | 500 | 0.6% |
| Ottawa | 1 | 0.0% |
| Pakistani | 37 | 0.1% |
| Panamanian | 65 | 0.1% |
| Peruvian | 357 | 0.5% |
| Polish | 1,011 | 1.3% |
| Portuguese | 171 | 0.2% |
| Puerto Rican | 298 | 0.4% |
| Russian | 272 | 0.4% |
| Salvadoran | 25 | 0.0% |
| Scandinavian | 169 | 0.2% |
| Scotch-Irish | 1,516 | 2.0% |
| Scottish | 2,483 | 3.2% |
| Slavic | 47 | 0.1% |
| Slovak | 32 | 0.0% |
| South American | 595 | 0.8% |
| South American Indian | 56 | 0.1% |
| Spaniard | 54 | 0.1% |
| Spanish | 90 | 0.1% |
| Sri Lankan | 292 | 0.4% |
| Subsaharan African | 819 | 1.1% |
| Swedish | 676 | 0.9% |
| Swiss | 79 | 0.1% |
| Thai | 754 | 1.0% |
| Turkish | 220 | 0.3% |
| Ukrainian | 23 | 0.0% |
| Venezuelan | 24 | 0.0% |
| Vietnamese | 84 | 0.1% |
| Welsh | 328 | 0.4% |
| West Indian | 10 | 0.0% | View All 92 Rows |
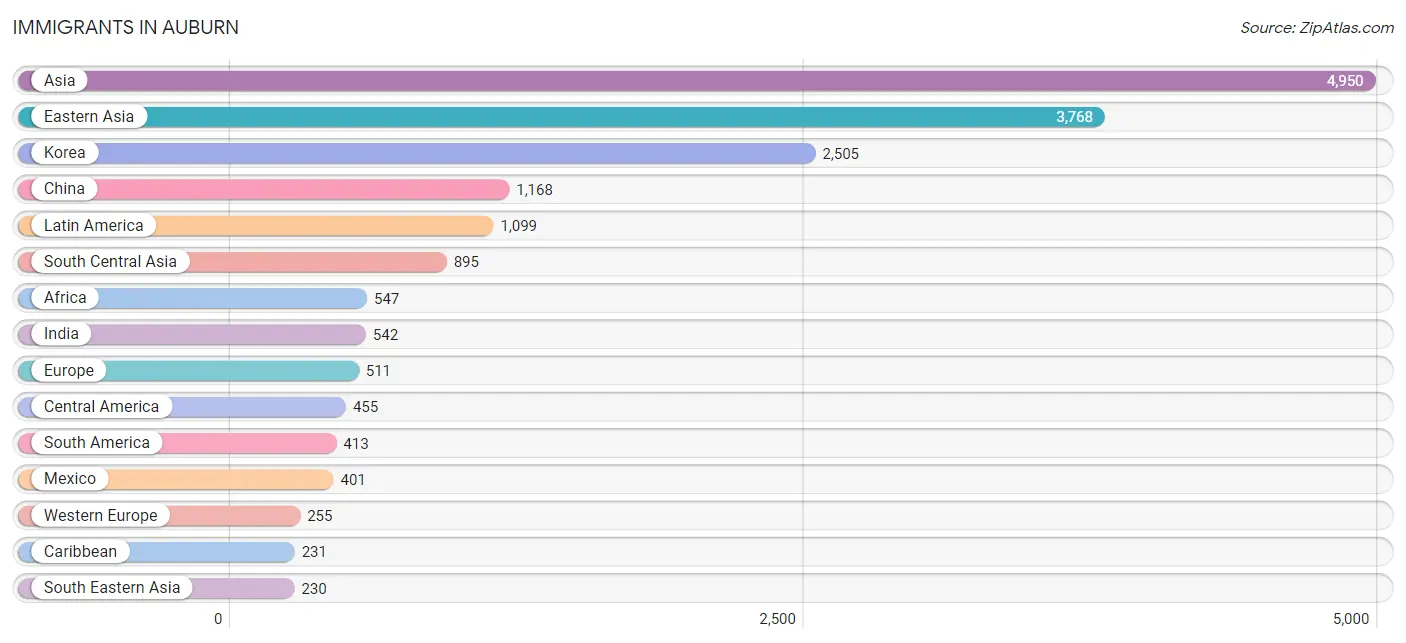
Immigrants in Auburn
The most numerous immigrant groups reported in Auburn came from Asia (4,950 | 6.5%), Eastern Asia (3,768 | 4.9%), Korea (2,505 | 3.3%), China (1,168 | 1.5%), and Latin America (1,099 | 1.4%), together accounting for 17.6% of all Auburn residents.
| Immigration Origin | # Population | % Population |
| Africa | 547 | 0.7% |
| Armenia | 19 | 0.0% |
| Asia | 4,950 | 6.5% |
| Austria | 60 | 0.1% |
| Bahamas | 22 | 0.0% |
| Bangladesh | 106 | 0.1% |
| Bolivia | 2 | 0.0% |
| Brazil | 150 | 0.2% |
| Cameroon | 77 | 0.1% |
| Canada | 9 | 0.0% |
| Caribbean | 231 | 0.3% |
| Central America | 455 | 0.6% |
| Chile | 25 | 0.0% |
| China | 1,168 | 1.5% |
| Colombia | 57 | 0.1% |
| Costa Rica | 35 | 0.1% |
| Croatia | 31 | 0.0% |
| Cuba | 16 | 0.0% |
| Czechoslovakia | 13 | 0.0% |
| Dominican Republic | 71 | 0.1% |
| Eastern Africa | 151 | 0.2% |
| Eastern Asia | 3,768 | 4.9% |
| Eastern Europe | 144 | 0.2% |
| Ecuador | 41 | 0.1% |
| Egypt | 54 | 0.1% |
| England | 9 | 0.0% |
| Europe | 511 | 0.7% |
| France | 153 | 0.2% |
| Germany | 42 | 0.1% |
| Ghana | 41 | 0.1% |
| Guatemala | 9 | 0.0% |
| Honduras | 10 | 0.0% |
| Hong Kong | 22 | 0.0% |
| India | 542 | 0.7% |
| Indonesia | 17 | 0.0% |
| Iran | 104 | 0.1% |
| Italy | 29 | 0.0% |
| Jamaica | 73 | 0.1% |
| Japan | 81 | 0.1% |
| Korea | 2,505 | 3.3% |
| Latin America | 1,099 | 1.4% |
| Mexico | 401 | 0.5% |
| Middle Africa | 145 | 0.2% |
| Nepal | 48 | 0.1% |
| Nigeria | 77 | 0.1% |
| Northern Africa | 54 | 0.1% |
| Northern Europe | 78 | 0.1% |
| Pakistan | 85 | 0.1% |
| Peru | 127 | 0.2% |
| Philippines | 28 | 0.0% |
| Poland | 5 | 0.0% |
| Russia | 95 | 0.1% |
| Saudi Arabia | 38 | 0.1% |
| South Africa | 40 | 0.1% |
| South America | 413 | 0.5% |
| South Central Asia | 895 | 1.2% |
| South Eastern Asia | 230 | 0.3% |
| Southern Europe | 34 | 0.0% |
| Spain | 5 | 0.0% |
| Sri Lanka | 10 | 0.0% |
| Sweden | 10 | 0.0% |
| Taiwan | 35 | 0.1% |
| Thailand | 19 | 0.0% |
| Trinidad and Tobago | 39 | 0.1% |
| Venezuela | 11 | 0.0% |
| Vietnam | 166 | 0.2% |
| Western Africa | 157 | 0.2% |
| Western Asia | 57 | 0.1% |
| Western Europe | 255 | 0.3% |
| Zaire | 68 | 0.1% |
| Zimbabwe | 31 | 0.0% | View All 71 Rows |
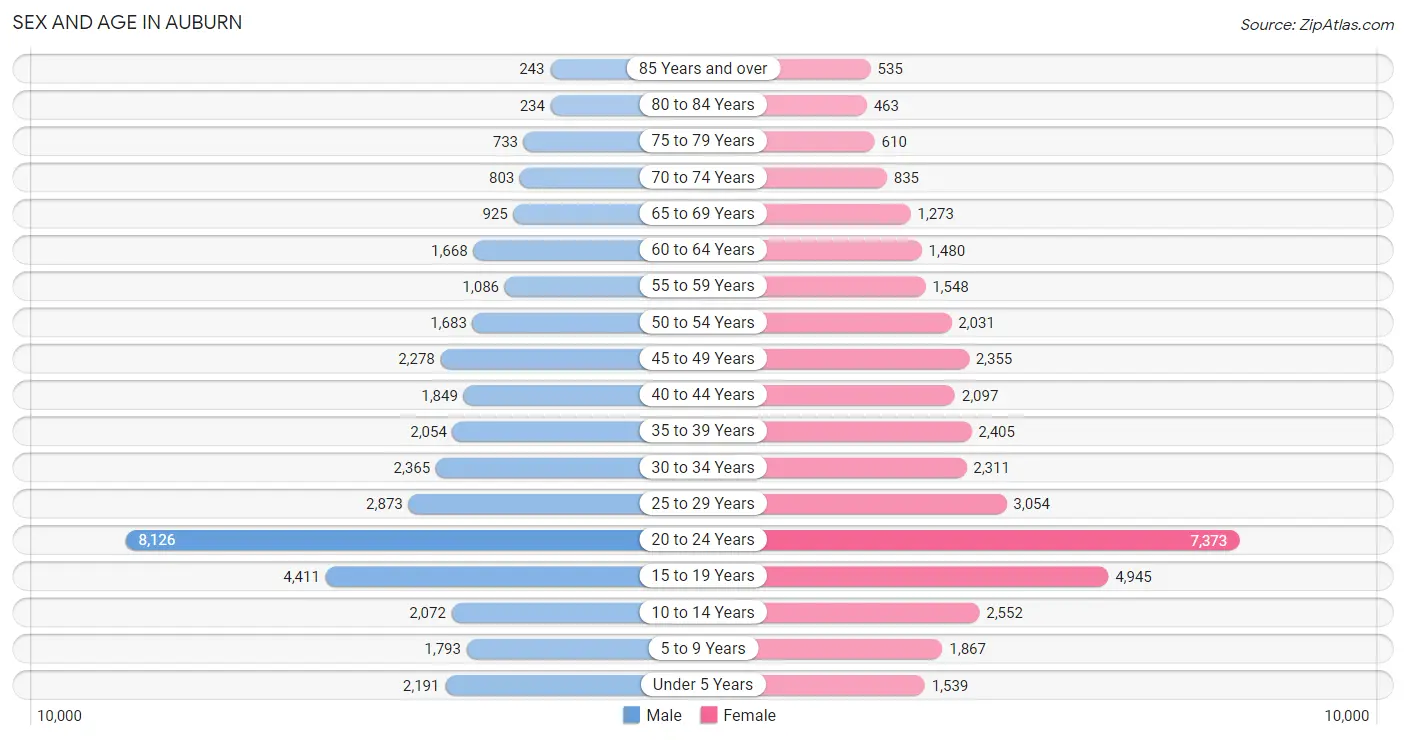
Sex and Age in Auburn
Sex and Age in Auburn
The most populous age groups in Auburn are 20 to 24 Years (8,126 | 21.7%) for men and 20 to 24 Years (7,373 | 18.8%) for women.
| Age Bracket | Male | Female |
| Under 5 Years | 2,191 (5.9%) | 1,539 (3.9%) |
| 5 to 9 Years | 1,793 (4.8%) | 1,867 (4.8%) |
| 10 to 14 Years | 2,072 (5.5%) | 2,552 (6.5%) |
| 15 to 19 Years | 4,411 (11.8%) | 4,945 (12.6%) |
| 20 to 24 Years | 8,126 (21.7%) | 7,373 (18.8%) |
| 25 to 29 Years | 2,873 (7.7%) | 3,054 (7.8%) |
| 30 to 34 Years | 2,365 (6.3%) | 2,311 (5.9%) |
| 35 to 39 Years | 2,054 (5.5%) | 2,405 (6.1%) |
| 40 to 44 Years | 1,849 (5.0%) | 2,097 (5.3%) |
| 45 to 49 Years | 2,278 (6.1%) | 2,355 (6.0%) |
| 50 to 54 Years | 1,683 (4.5%) | 2,031 (5.2%) |
| 55 to 59 Years | 1,086 (2.9%) | 1,548 (3.9%) |
| 60 to 64 Years | 1,668 (4.5%) | 1,480 (3.8%) |
| 65 to 69 Years | 925 (2.5%) | 1,273 (3.2%) |
| 70 to 74 Years | 803 (2.1%) | 835 (2.1%) |
| 75 to 79 Years | 733 (2.0%) | 610 (1.5%) |
| 80 to 84 Years | 234 (0.6%) | 463 (1.2%) |
| 85 Years and over | 243 (0.6%) | 535 (1.4%) |
| Total | 37,387 (100.0%) | 39,273 (100.0%) |
Families and Households in Auburn
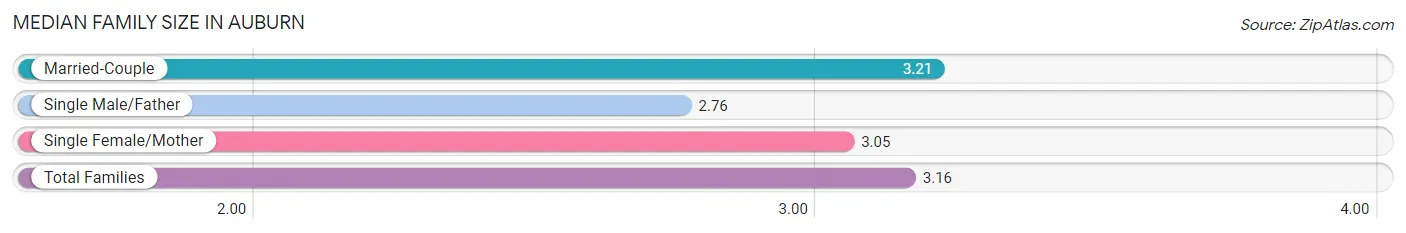
Median Family Size in Auburn
The median family size in Auburn is 3.16 persons per family, with married-couple families (11,833 | 77.8%) accounting for the largest median family size of 3.21 persons per family. On the other hand, single male/father families (646 | 4.3%) represent the smallest median family size with 2.76 persons per family.
| Family Type | # Families | Family Size |
| Married-Couple | 11,833 (77.8%) | 3.21 |
| Single Male/Father | 646 (4.3%) | 2.76 |
| Single Female/Mother | 2,729 (17.9%) | 3.05 |
| Total Families | 15,208 (100.0%) | 3.16 |
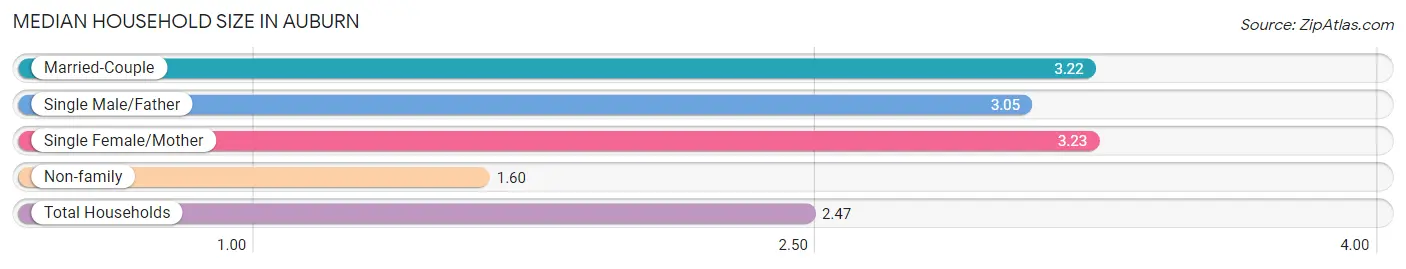
Median Household Size in Auburn
The median household size in Auburn is 2.47 persons per household, with single female/mother households (2,729 | 9.6%) accounting for the largest median household size of 3.23 persons per household. non-family households (13,102 | 46.3%) represent the smallest median household size with 1.60 persons per household.
| Household Type | # Households | Household Size |
| Married-Couple | 11,833 (41.8%) | 3.22 |
| Single Male/Father | 646 (2.3%) | 3.05 |
| Single Female/Mother | 2,729 (9.6%) | 3.23 |
| Non-family | 13,102 (46.3%) | 1.60 |
| Total Households | 28,310 (100.0%) | 2.47 |
Household Size by Marriage Status in Auburn
Out of a total of 28,310 households in Auburn, 15,208 (53.7%) are family households, while 13,102 (46.3%) are nonfamily households. The most numerous type of family households are 2-person households, comprising 6,283, and the most common type of nonfamily households are 1-person households, comprising 9,331.
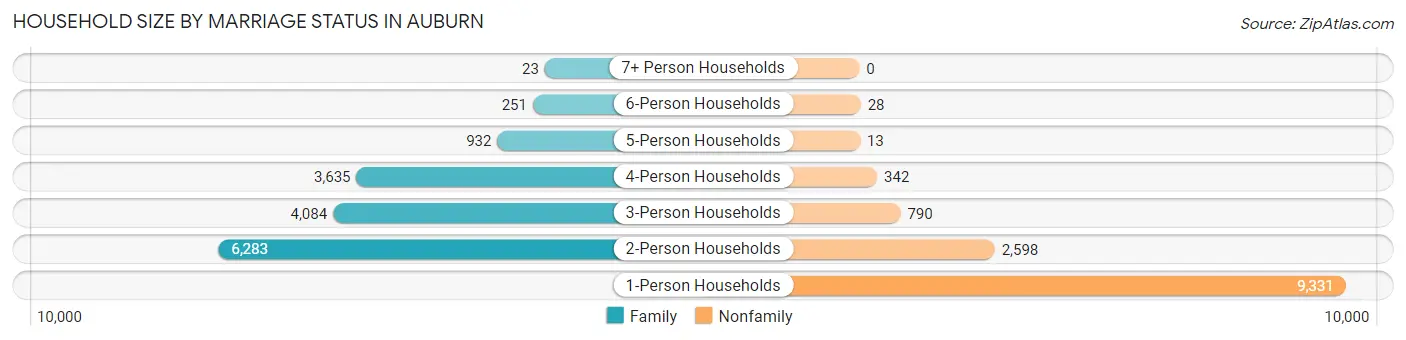
| Household Size | Family Households | Nonfamily Households |
| 1-Person Households | - | 9,331 (33.0%) |
| 2-Person Households | 6,283 (22.2%) | 2,598 (9.2%) |
| 3-Person Households | 4,084 (14.4%) | 790 (2.8%) |
| 4-Person Households | 3,635 (12.8%) | 342 (1.2%) |
| 5-Person Households | 932 (3.3%) | 13 (0.1%) |
| 6-Person Households | 251 (0.9%) | 28 (0.1%) |
| 7+ Person Households | 23 (0.1%) | 0 (0.0%) |
| Total | 15,208 (53.7%) | 13,102 (46.3%) |
Female Fertility in Auburn
Fertility by Age in Auburn
Average fertility rate in Auburn is 29.0 births per 1,000 women. Women in the age bracket of 20 to 34 years have the highest fertility rate with 33.0 births per 1,000 women. Women in the age bracket of 20 to 34 years acount for 59.8% of all women with births.
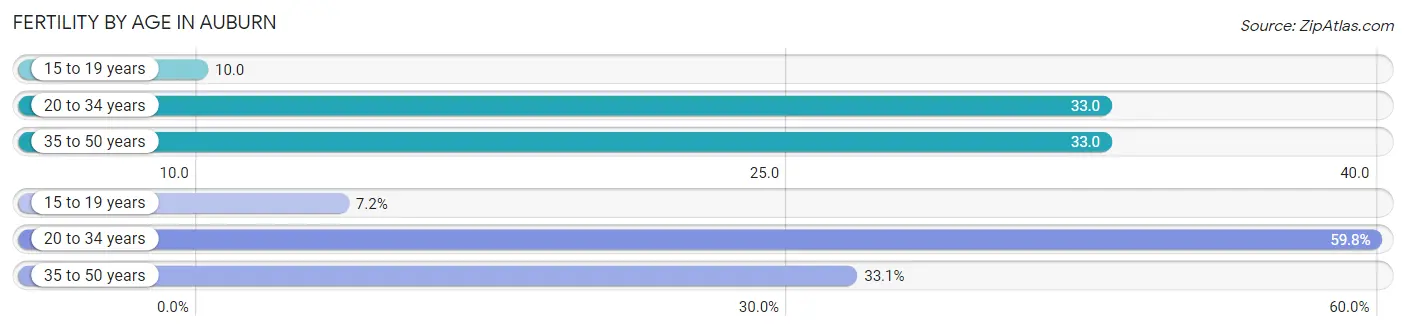
| Age Bracket | Women with Births | Births / 1,000 Women |
| 15 to 19 years | 51 (7.2%) | 10.0 |
| 20 to 34 years | 425 (59.8%) | 33.0 |
| 35 to 50 years | 235 (33.1%) | 33.0 |
| Total | 711 (100.0%) | 29.0 |
Fertility by Age by Marriage Status in Auburn
76.8% of women with births (711) in Auburn are married. The highest percentage of unmarried women with births falls into 15 to 19 years age bracket with 100.0% of them unmarried at the time of birth, while the lowest percentage of unmarried women with births belong to 35 to 50 years age bracket with 0.0% of them unmarried.
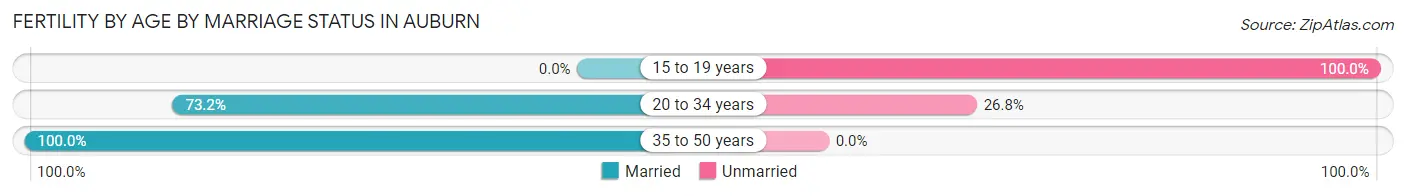
| Age Bracket | Married | Unmarried |
| 15 to 19 years | 0 (0.0%) | 51 (100.0%) |
| 20 to 34 years | 311 (73.2%) | 114 (26.8%) |
| 35 to 50 years | 235 (100.0%) | 0 (0.0%) |
| Total | 546 (76.8%) | 165 (23.2%) |
Fertility by Education in Auburn
Average fertility rate in Auburn is 29.0 births per 1,000 women. Women with the education attainment of bachelor's degree have the highest fertility rate of 54.0 births per 1,000 women, while women with the education attainment of college or associate's degree have the lowest fertility at 13.0 births per 1,000 women. Women with the education attainment of bachelor's degree represent 43.7% of all women with births.
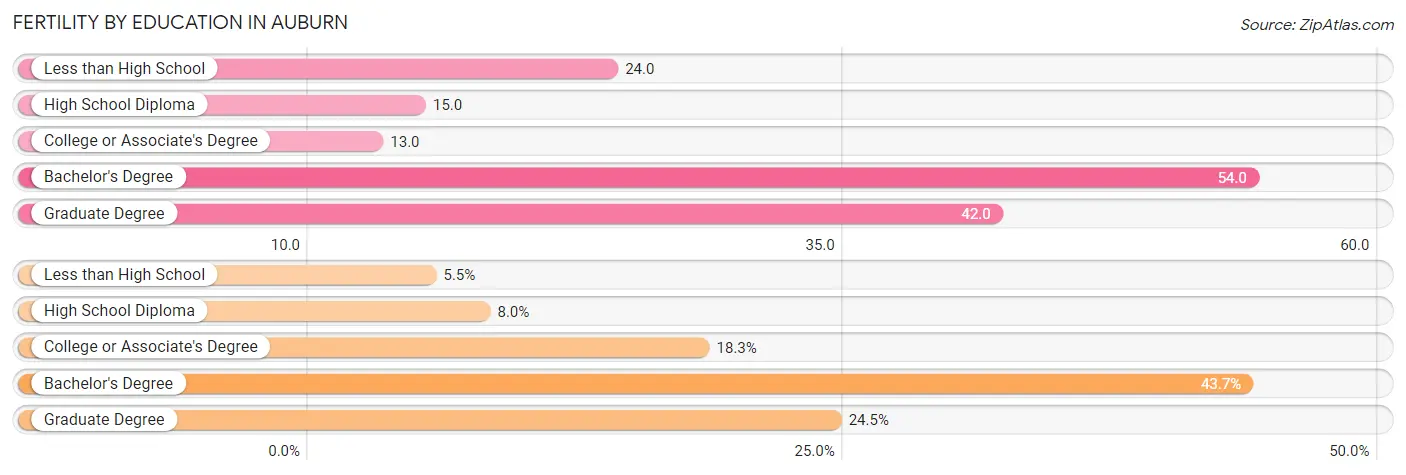
| Educational Attainment | Women with Births | Births / 1,000 Women |
| Less than High School | 39 (5.5%) | 24.0 |
| High School Diploma | 57 (8.0%) | 15.0 |
| College or Associate's Degree | 130 (18.3%) | 13.0 |
| Bachelor's Degree | 311 (43.7%) | 54.0 |
| Graduate Degree | 174 (24.5%) | 42.0 |
| Total | 711 (100.0%) | 29.0 |
Fertility by Education by Marriage Status in Auburn
23.2% of women with births in Auburn are unmarried. Women with the educational attainment of high school diploma are most likely to be married with 100.0% of them married at childbirth, while women with the educational attainment of less than high school are least likely to be married with 100.0% of them unmarried at childbirth.
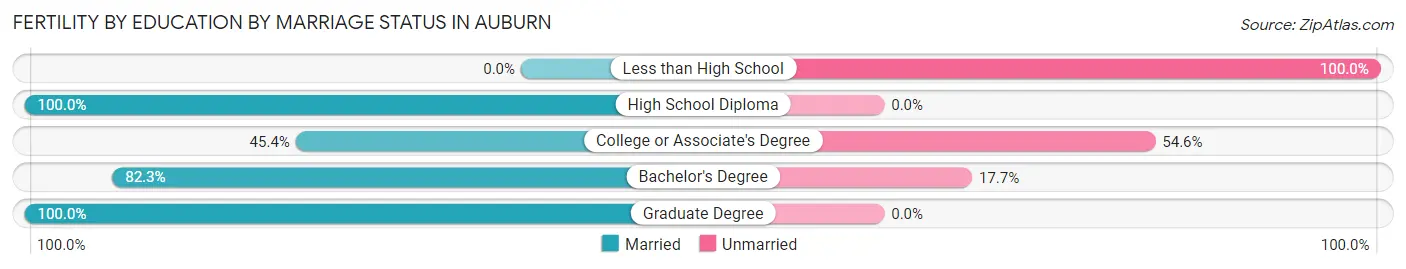
| Educational Attainment | Married | Unmarried |
| Less than High School | 0 (0.0%) | 39 (100.0%) |
| High School Diploma | 57 (100.0%) | 0 (0.0%) |
| College or Associate's Degree | 59 (45.4%) | 71 (54.6%) |
| Bachelor's Degree | 256 (82.3%) | 55 (17.7%) |
| Graduate Degree | 174 (100.0%) | 0 (0.0%) |
| Total | 546 (76.8%) | 165 (23.2%) |
Employment Characteristics in Auburn
Employment by Class of Employer in Auburn
Among the 35,829 employed individuals in Auburn, private company employees (21,773 | 60.8%), state government employees (5,609 | 15.7%), and not-for-profit organizations (2,565 | 7.2%) make up the most common classes of employment.
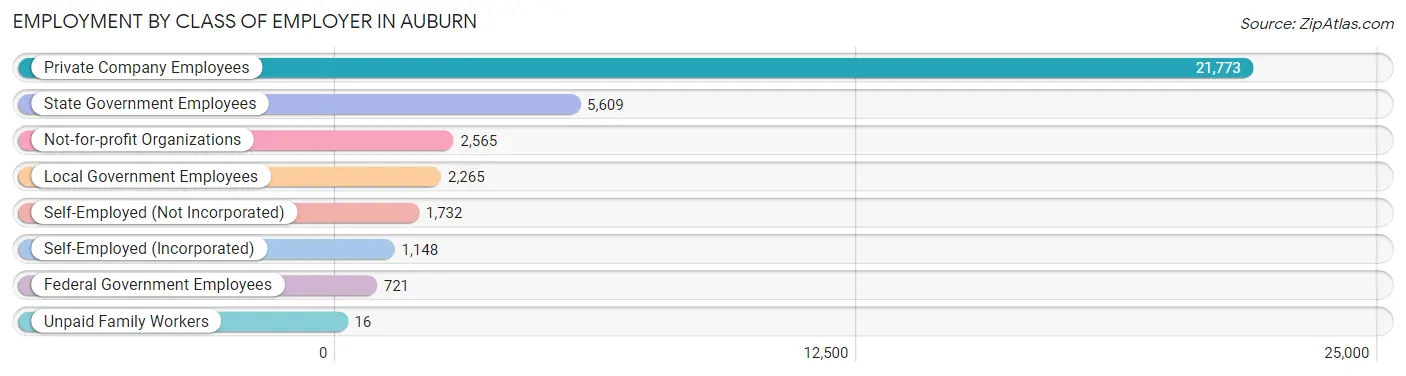
| Employer Class | # Employees | % Employees |
| Private Company Employees | 21,773 | 60.8% |
| Self-Employed (Incorporated) | 1,148 | 3.2% |
| Self-Employed (Not Incorporated) | 1,732 | 4.8% |
| Not-for-profit Organizations | 2,565 | 7.2% |
| Local Government Employees | 2,265 | 6.3% |
| State Government Employees | 5,609 | 15.7% |
| Federal Government Employees | 721 | 2.0% |
| Unpaid Family Workers | 16 | 0.0% |
| Total | 35,829 | 100.0% |
Employment Status by Age in Auburn
According to the labor force statistics for Auburn, out of the total population over 16 years of age (64,006), 59.1% or 37,828 individuals are in the labor force, with 3.0% or 1,135 of them unemployed. The age group with the highest labor force participation rate is 30 to 34 years, with 87.1% or 4,073 individuals in the labor force. Within the labor force, the 16 to 19 years age range has the highest percentage of unemployed individuals, with 10.6% or 257 of them being unemployed.
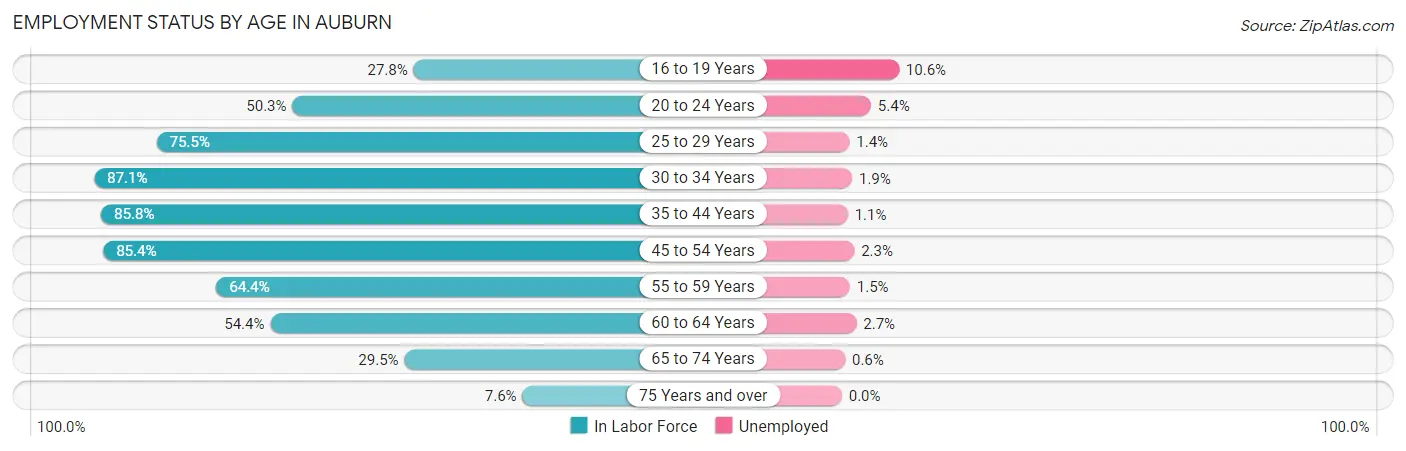
| Age Bracket | In Labor Force | Unemployed |
| 16 to 19 Years | 2,423 (27.8%) | 257 (10.6%) |
| 20 to 24 Years | 7,796 (50.3%) | 421 (5.4%) |
| 25 to 29 Years | 4,475 (75.5%) | 63 (1.4%) |
| 30 to 34 Years | 4,073 (87.1%) | 77 (1.9%) |
| 35 to 44 Years | 7,211 (85.8%) | 79 (1.1%) |
| 45 to 54 Years | 7,128 (85.4%) | 164 (2.3%) |
| 55 to 59 Years | 1,696 (64.4%) | 25 (1.5%) |
| 60 to 64 Years | 1,713 (54.4%) | 46 (2.7%) |
| 65 to 74 Years | 1,132 (29.5%) | 7 (0.6%) |
| 75 Years and over | 214 (7.6%) | 0 (0.0%) |
| Total | 37,828 (59.1%) | 1,135 (3.0%) |
Employment Status by Educational Attainment in Auburn
According to labor force statistics for Auburn, 79.3% of individuals (26,278) out of the total population between 25 and 64 years of age (33,137) are in the labor force, with 1.7% or 447 of them being unemployed. The group with the highest labor force participation rate are those with the educational attainment of bachelor's degree or higher, with 85.6% or 17,746 individuals in the labor force. Within the labor force, individuals with college / associate degree education have the highest percentage of unemployment, with 3.9% or 214 of them being unemployed.
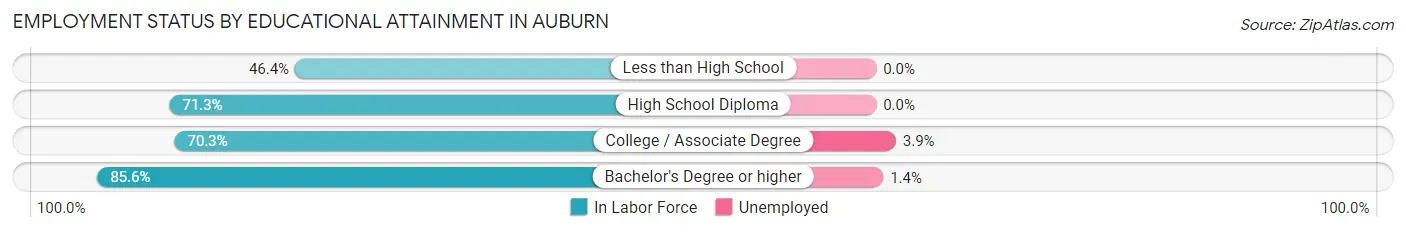
| Educational Attainment | In Labor Force | Unemployed |
| Less than High School | 429 (46.4%) | 0 (0.0%) |
| High School Diploma | 2,634 (71.3%) | 0 (0.0%) |
| College / Associate Degree | 5,475 (70.3%) | 304 (3.9%) |
| Bachelor's Degree or higher | 17,746 (85.6%) | 290 (1.4%) |
| Total | 26,278 (79.3%) | 563 (1.7%) |
Employment Occupations by Sex in Auburn
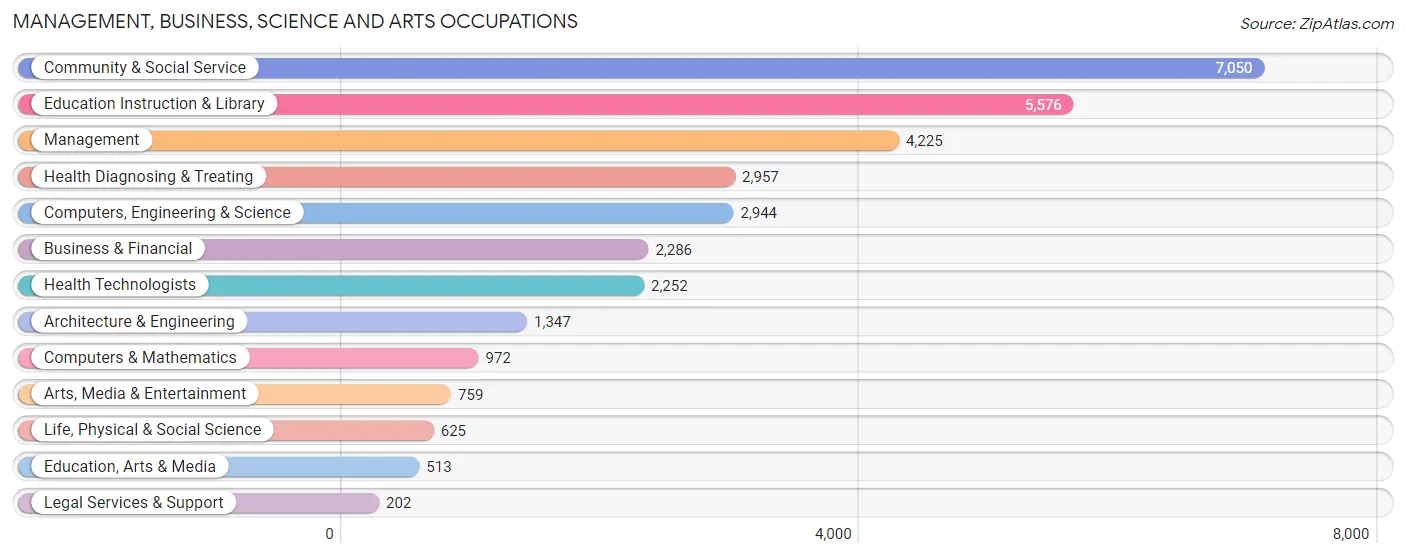
Management, Business, Science and Arts Occupations
The most common Management, Business, Science and Arts occupations in Auburn are Community & Social Service (7,050 | 19.3%), Education Instruction & Library (5,576 | 15.2%), Management (4,225 | 11.6%), Health Diagnosing & Treating (2,957 | 8.1%), and Computers, Engineering & Science (2,944 | 8.1%).
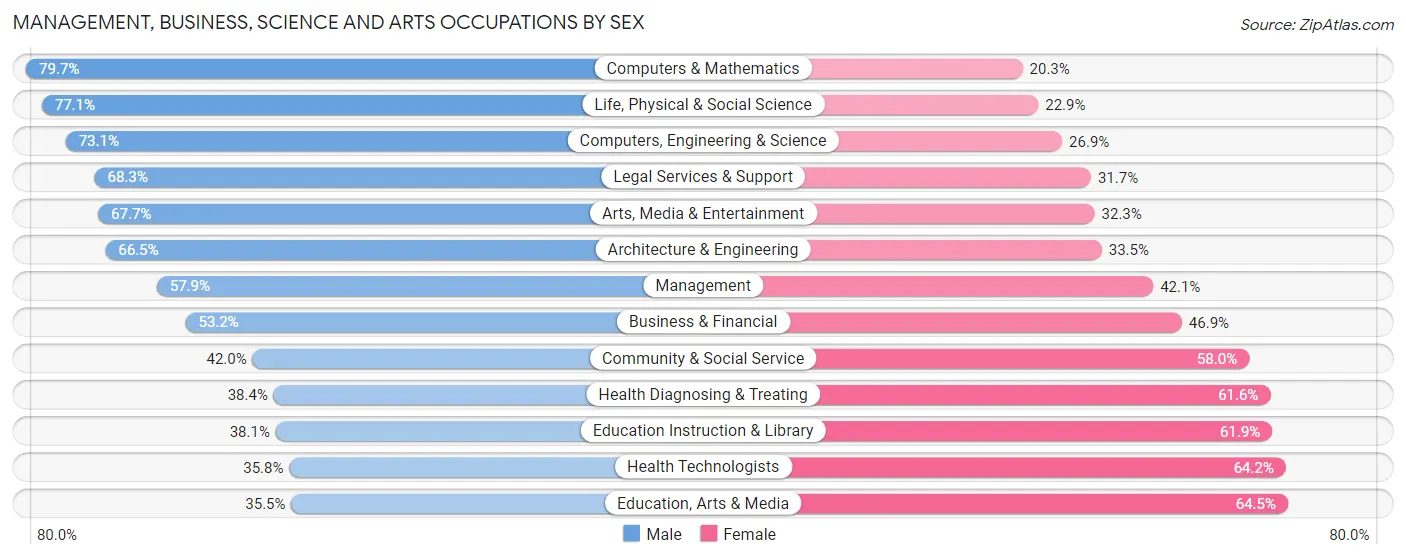
Management, Business, Science and Arts Occupations by Sex
Within the Management, Business, Science and Arts occupations in Auburn, the most male-oriented occupations are Computers & Mathematics (79.7%), Life, Physical & Social Science (77.1%), and Computers, Engineering & Science (73.1%), while the most female-oriented occupations are Education, Arts & Media (64.5%), Health Technologists (64.2%), and Education Instruction & Library (61.9%).
| Occupation | Male | Female |
| Management | 2,448 (57.9%) | 1,777 (42.1%) |
| Business & Financial | 1,215 (53.1%) | 1,071 (46.9%) |
| Computers, Engineering & Science | 2,153 (73.1%) | 791 (26.9%) |
| Computers & Mathematics | 775 (79.7%) | 197 (20.3%) |
| Architecture & Engineering | 896 (66.5%) | 451 (33.5%) |
| Life, Physical & Social Science | 482 (77.1%) | 143 (22.9%) |
| Community & Social Service | 2,958 (42.0%) | 4,092 (58.0%) |
| Education, Arts & Media | 182 (35.5%) | 331 (64.5%) |
| Legal Services & Support | 138 (68.3%) | 64 (31.7%) |
| Education Instruction & Library | 2,124 (38.1%) | 3,452 (61.9%) |
| Arts, Media & Entertainment | 514 (67.7%) | 245 (32.3%) |
| Health Diagnosing & Treating | 1,136 (38.4%) | 1,821 (61.6%) |
| Health Technologists | 807 (35.8%) | 1,445 (64.2%) |
| Total (Category) | 9,910 (50.9%) | 9,552 (49.1%) |
| Total (Overall) | 18,558 (50.7%) | 18,027 (49.3%) |
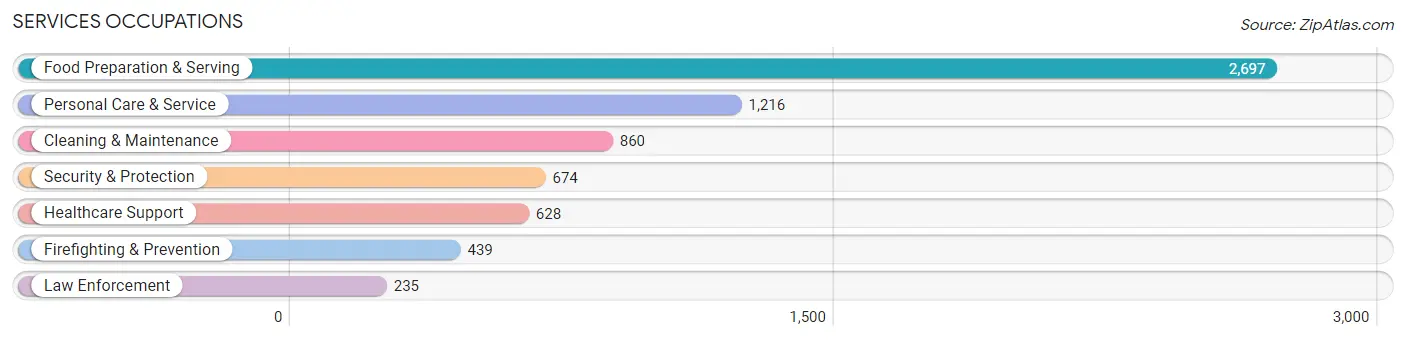
Services Occupations
The most common Services occupations in Auburn are Food Preparation & Serving (2,697 | 7.4%), Personal Care & Service (1,216 | 3.3%), Cleaning & Maintenance (860 | 2.4%), Security & Protection (674 | 1.8%), and Healthcare Support (628 | 1.7%).
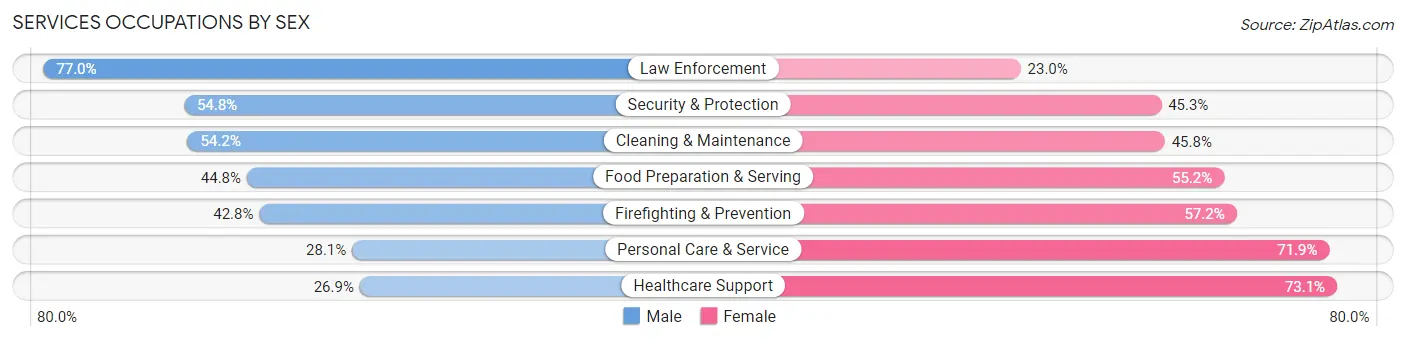
Services Occupations by Sex
Within the Services occupations in Auburn, the most male-oriented occupations are Law Enforcement (77.0%), Security & Protection (54.7%), and Cleaning & Maintenance (54.2%), while the most female-oriented occupations are Healthcare Support (73.1%), Personal Care & Service (71.9%), and Firefighting & Prevention (57.2%).
| Occupation | Male | Female |
| Healthcare Support | 169 (26.9%) | 459 (73.1%) |
| Security & Protection | 369 (54.7%) | 305 (45.3%) |
| Firefighting & Prevention | 188 (42.8%) | 251 (57.2%) |
| Law Enforcement | 181 (77.0%) | 54 (23.0%) |
| Food Preparation & Serving | 1,208 (44.8%) | 1,489 (55.2%) |
| Cleaning & Maintenance | 466 (54.2%) | 394 (45.8%) |
| Personal Care & Service | 342 (28.1%) | 874 (71.9%) |
| Total (Category) | 2,554 (42.0%) | 3,521 (58.0%) |
| Total (Overall) | 18,558 (50.7%) | 18,027 (49.3%) |
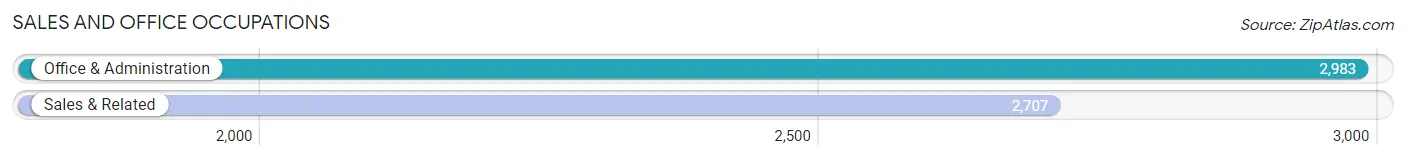
Sales and Office Occupations
The most common Sales and Office occupations in Auburn are Office & Administration (2,983 | 8.2%), and Sales & Related (2,707 | 7.4%).
Sales and Office Occupations by Sex
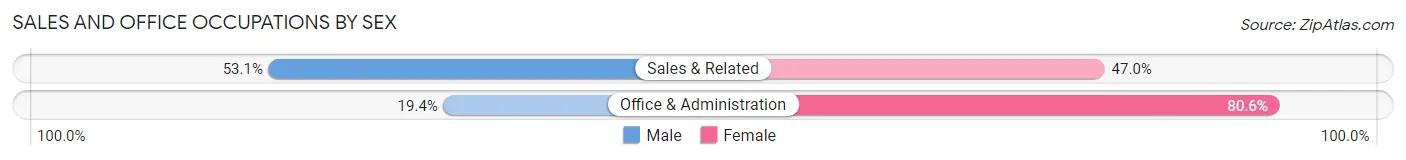
| Occupation | Male | Female |
| Sales & Related | 1,436 (53.0%) | 1,271 (46.9%) |
| Office & Administration | 579 (19.4%) | 2,404 (80.6%) |
| Total (Category) | 2,015 (35.4%) | 3,675 (64.6%) |
| Total (Overall) | 18,558 (50.7%) | 18,027 (49.3%) |
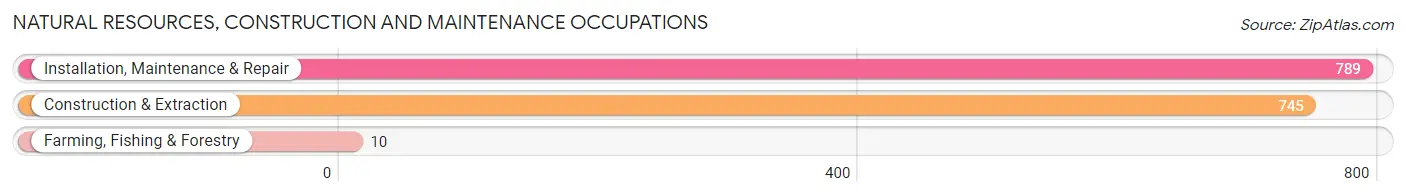
Natural Resources, Construction and Maintenance Occupations
The most common Natural Resources, Construction and Maintenance occupations in Auburn are Installation, Maintenance & Repair (789 | 2.2%), Construction & Extraction (745 | 2.0%), and Farming, Fishing & Forestry (10 | 0.0%).
Natural Resources, Construction and Maintenance Occupations by Sex
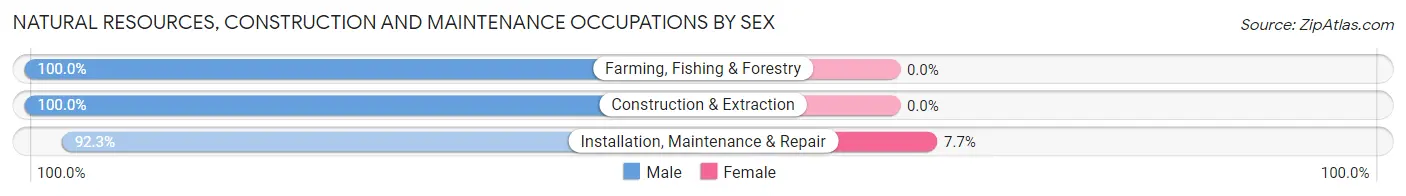
| Occupation | Male | Female |
| Farming, Fishing & Forestry | 10 (100.0%) | 0 (0.0%) |
| Construction & Extraction | 745 (100.0%) | 0 (0.0%) |
| Installation, Maintenance & Repair | 728 (92.3%) | 61 (7.7%) |
| Total (Category) | 1,483 (96.1%) | 61 (4.0%) |
| Total (Overall) | 18,558 (50.7%) | 18,027 (49.3%) |
Production, Transportation and Moving Occupations
The most common Production, Transportation and Moving occupations in Auburn are Material Moving (1,445 | 4.0%), Production (1,423 | 3.9%), and Transportation (946 | 2.6%).
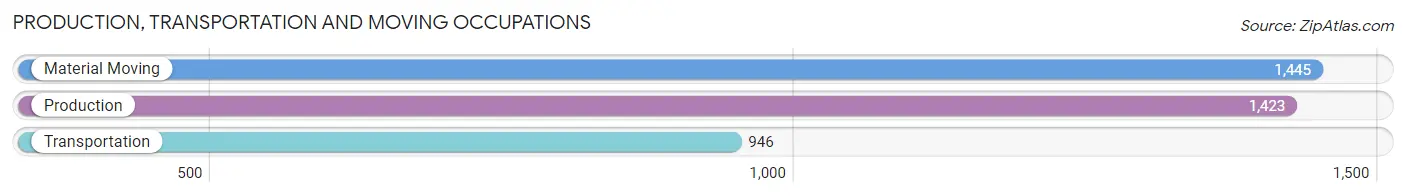
Production, Transportation and Moving Occupations by Sex
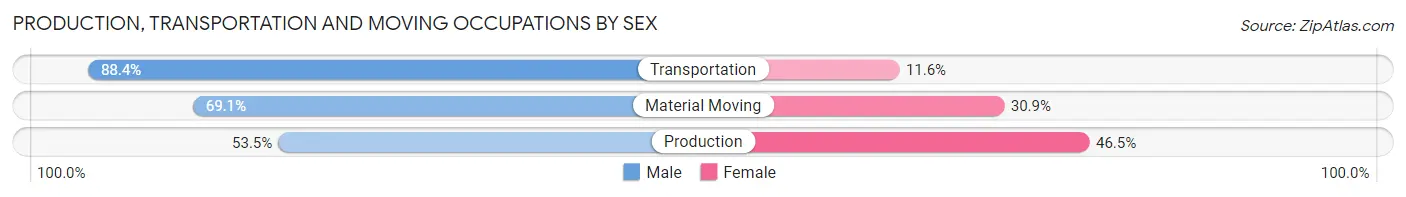
| Occupation | Male | Female |
| Production | 761 (53.5%) | 662 (46.5%) |
| Transportation | 836 (88.4%) | 110 (11.6%) |
| Material Moving | 999 (69.1%) | 446 (30.9%) |
| Total (Category) | 2,596 (68.1%) | 1,218 (31.9%) |
| Total (Overall) | 18,558 (50.7%) | 18,027 (49.3%) |
Employment Industries by Sex in Auburn
Employment Industries in Auburn
The major employment industries in Auburn include Educational Services (10,141 | 27.7%), Manufacturing (4,012 | 11.0%), Retail Trade (3,623 | 9.9%), Health Care & Social Assistance (3,301 | 9.0%), and Accommodation & Food Services (2,977 | 8.1%).
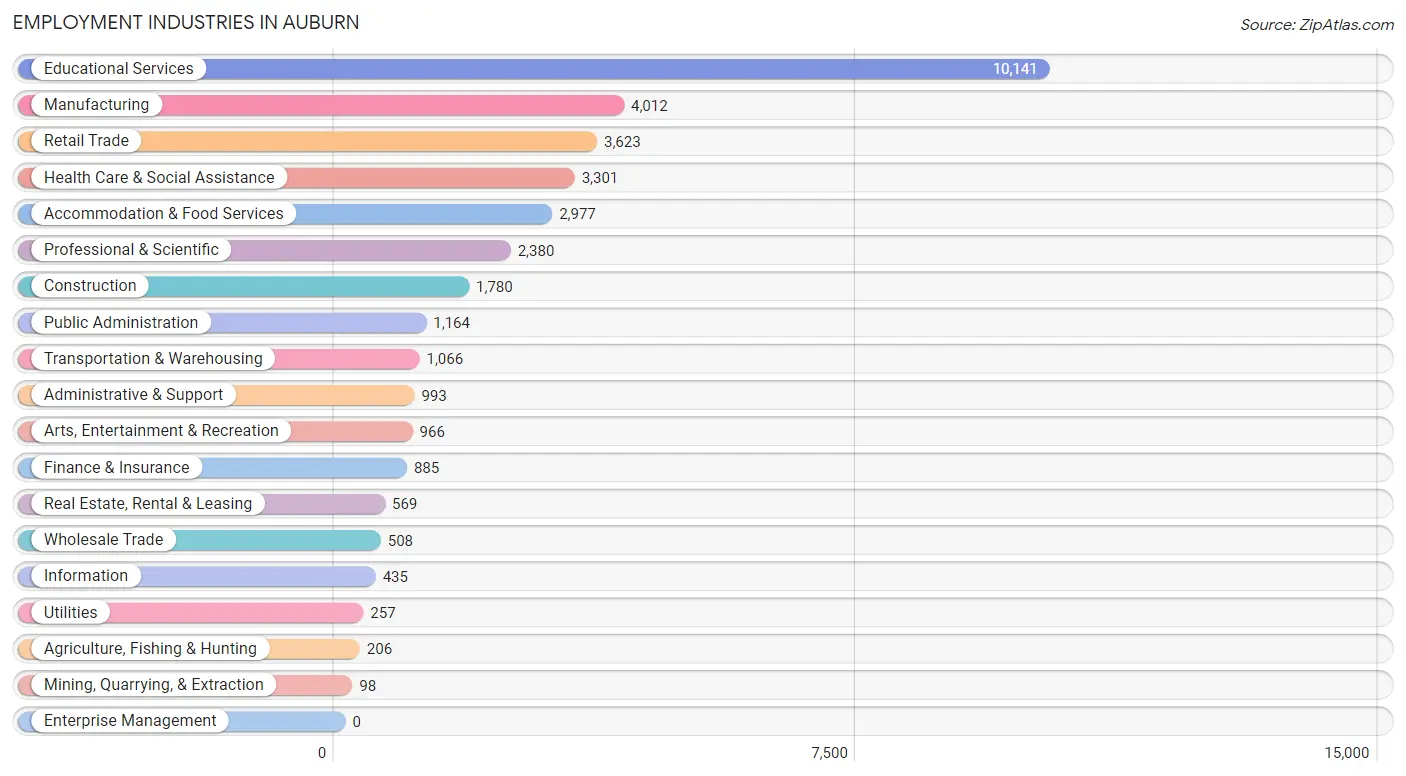
Employment Industries by Sex in Auburn
The Auburn industries that see more men than women are Mining, Quarrying, & Extraction (100.0%), Construction (93.0%), and Utilities (90.7%), whereas the industries that tend to have a higher number of women are Health Care & Social Assistance (71.8%), Real Estate, Rental & Leasing (65.2%), and Arts, Entertainment & Recreation (64.5%).
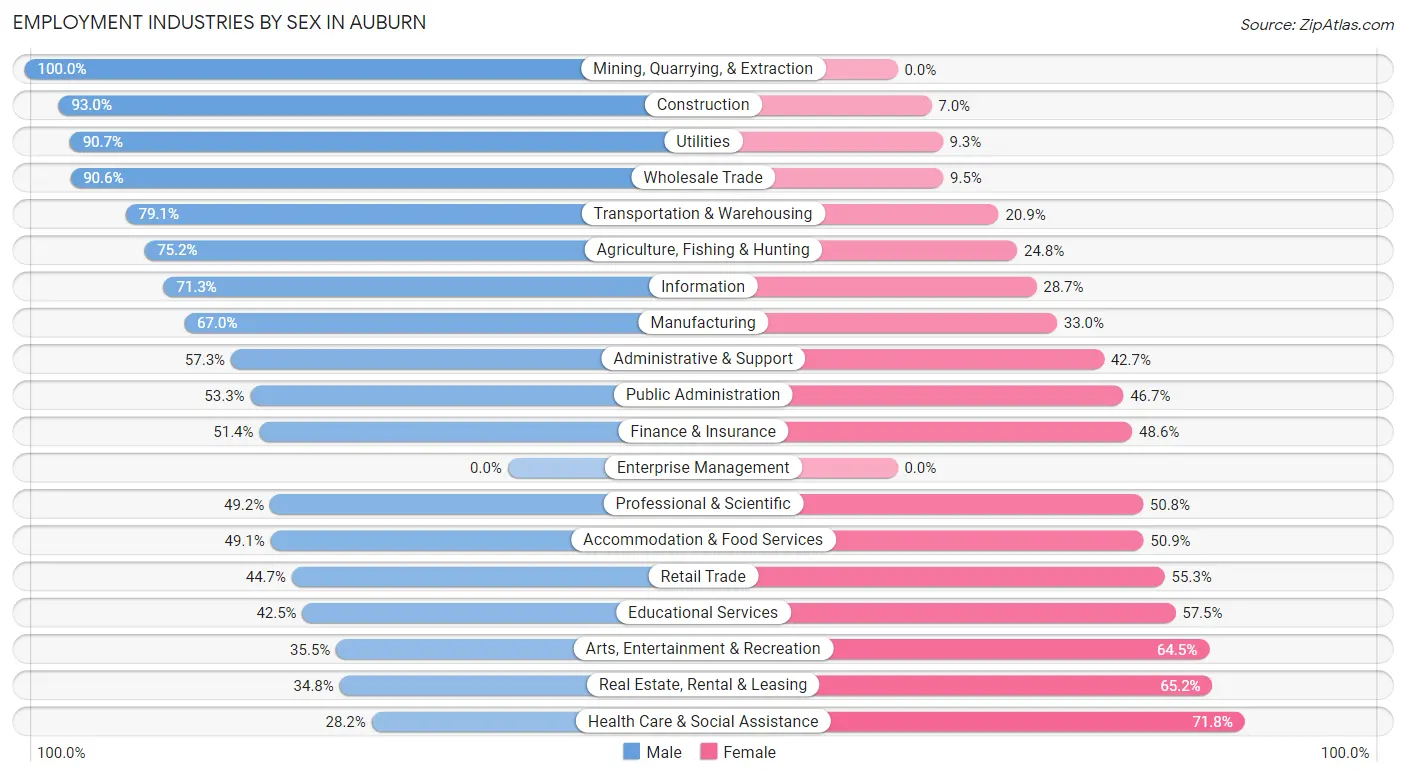
| Industry | Male | Female |
| Agriculture, Fishing & Hunting | 155 (75.2%) | 51 (24.8%) |
| Mining, Quarrying, & Extraction | 98 (100.0%) | 0 (0.0%) |
| Construction | 1,655 (93.0%) | 125 (7.0%) |
| Manufacturing | 2,688 (67.0%) | 1,324 (33.0%) |
| Wholesale Trade | 460 (90.5%) | 48 (9.5%) |
| Retail Trade | 1,619 (44.7%) | 2,004 (55.3%) |
| Transportation & Warehousing | 843 (79.1%) | 223 (20.9%) |
| Utilities | 233 (90.7%) | 24 (9.3%) |
| Information | 310 (71.3%) | 125 (28.7%) |
| Finance & Insurance | 455 (51.4%) | 430 (48.6%) |
| Real Estate, Rental & Leasing | 198 (34.8%) | 371 (65.2%) |
| Professional & Scientific | 1,171 (49.2%) | 1,209 (50.8%) |
| Enterprise Management | 0 (0.0%) | 0 (0.0%) |
| Administrative & Support | 569 (57.3%) | 424 (42.7%) |
| Educational Services | 4,309 (42.5%) | 5,832 (57.5%) |
| Health Care & Social Assistance | 930 (28.2%) | 2,371 (71.8%) |
| Arts, Entertainment & Recreation | 343 (35.5%) | 623 (64.5%) |
| Accommodation & Food Services | 1,461 (49.1%) | 1,516 (50.9%) |
| Public Administration | 620 (53.3%) | 544 (46.7%) |
| Total | 18,558 (50.7%) | 18,027 (49.3%) |
Education in Auburn
School Enrollment in Auburn
The most common levels of schooling among the 36,581 students in Auburn are college / undergraduate (20,200 | 55.2%), graduate / professional (4,246 | 11.6%), and middle school (3,765 | 10.3%).
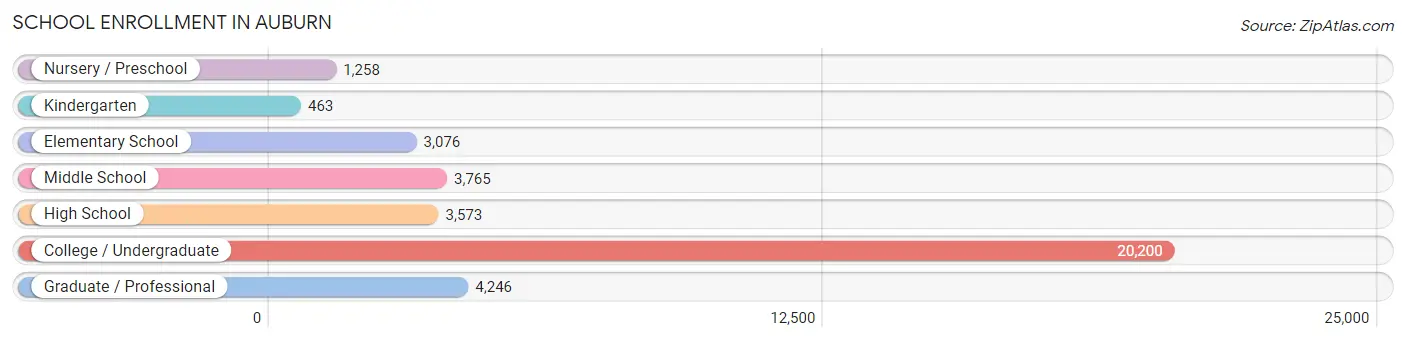
| School Level | # Students | % Students |
| Nursery / Preschool | 1,258 | 3.4% |
| Kindergarten | 463 | 1.3% |
| Elementary School | 3,076 | 8.4% |
| Middle School | 3,765 | 10.3% |
| High School | 3,573 | 9.8% |
| College / Undergraduate | 20,200 | 55.2% |
| Graduate / Professional | 4,246 | 11.6% |
| Total | 36,581 | 100.0% |
School Enrollment by Age by Funding Source in Auburn
Out of a total of 36,581 students who are enrolled in schools in Auburn, 5,268 (14.4%) attend a private institution, while the remaining 31,313 (85.6%) are enrolled in public schools. The age group of 3 to 4 year olds has the highest likelihood of being enrolled in private schools, with 719 (73.3% in the age bracket) enrolled. Conversely, the age group of 15 to 17 year olds has the lowest likelihood of being enrolled in a private school, with 2,074 (92.1% in the age bracket) attending a public institution.
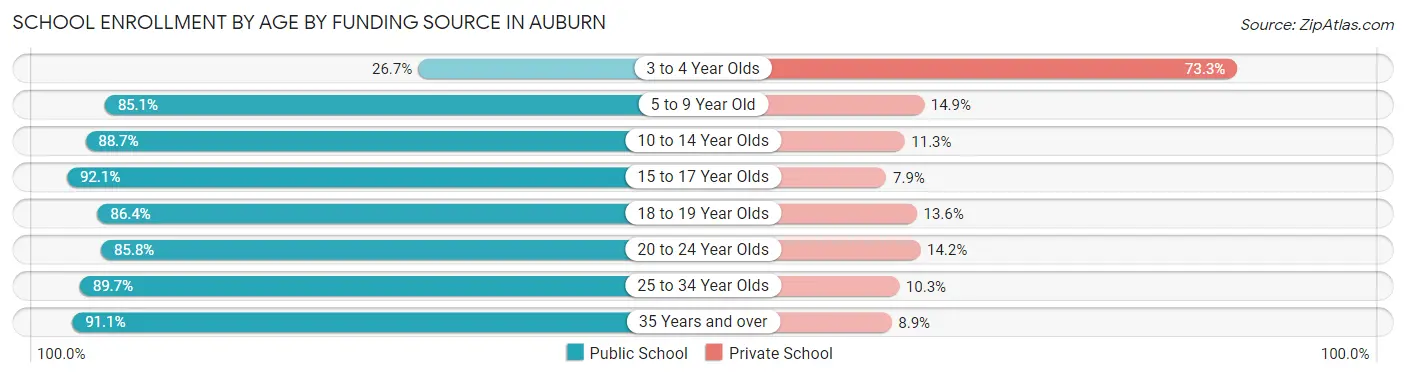
| Age Bracket | Public School | Private School |
| 3 to 4 Year Olds | 262 (26.7%) | 719 (73.3%) |
| 5 to 9 Year Old | 3,088 (85.1%) | 542 (14.9%) |
| 10 to 14 Year Olds | 4,101 (88.7%) | 523 (11.3%) |
| 15 to 17 Year Olds | 2,074 (92.1%) | 178 (7.9%) |
| 18 to 19 Year Olds | 5,840 (86.4%) | 917 (13.6%) |
| 20 to 24 Year Olds | 11,532 (85.8%) | 1,913 (14.2%) |
| 25 to 34 Year Olds | 3,348 (89.7%) | 384 (10.3%) |
| 35 Years and over | 1,057 (91.1%) | 103 (8.9%) |
| Total | 31,313 (85.6%) | 5,268 (14.4%) |
Educational Attainment by Field of Study in Auburn
Business (4,528 | 17.3%), education (3,019 | 11.5%), science & technology (2,770 | 10.6%), bio, nature & agricultural (2,689 | 10.3%), and engineering (2,579 | 9.9%) are the most common fields of study among 26,188 individuals in Auburn who have obtained a bachelor's degree or higher.
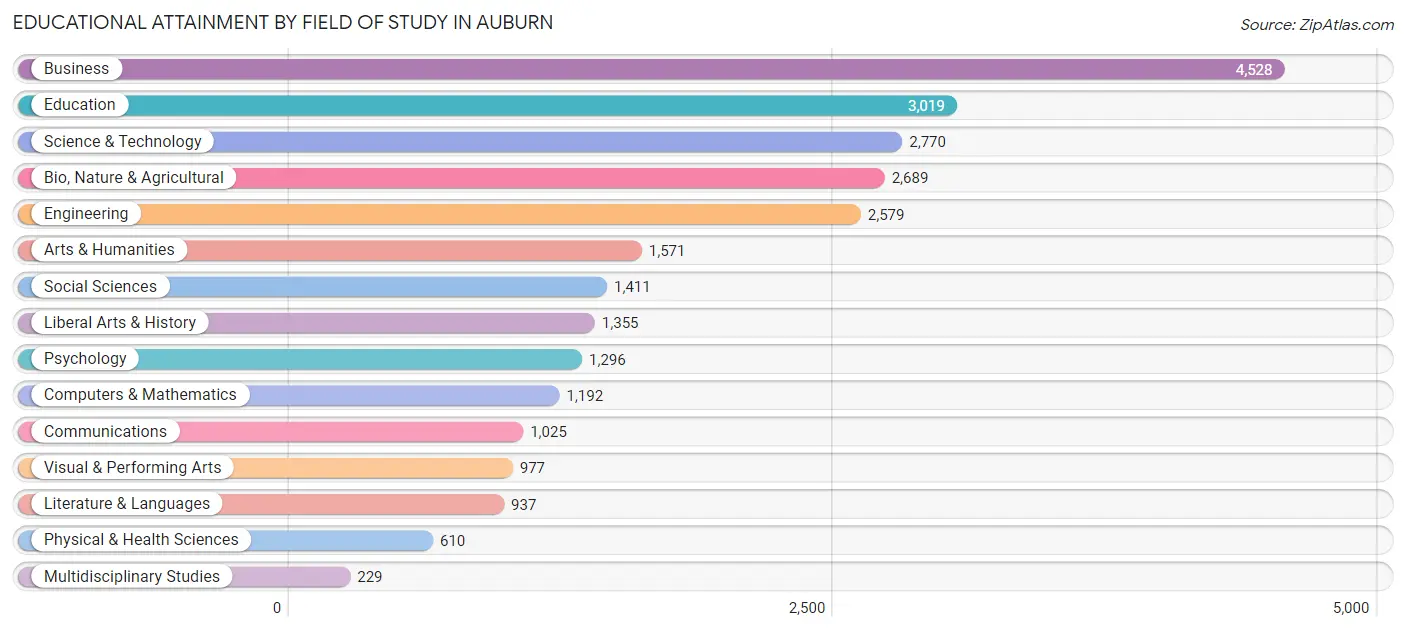
| Field of Study | # Graduates | % Graduates |
| Computers & Mathematics | 1,192 | 4.5% |
| Bio, Nature & Agricultural | 2,689 | 10.3% |
| Physical & Health Sciences | 610 | 2.3% |
| Psychology | 1,296 | 5.0% |
| Social Sciences | 1,411 | 5.4% |
| Engineering | 2,579 | 9.9% |
| Multidisciplinary Studies | 229 | 0.9% |
| Science & Technology | 2,770 | 10.6% |
| Business | 4,528 | 17.3% |
| Education | 3,019 | 11.5% |
| Literature & Languages | 937 | 3.6% |
| Liberal Arts & History | 1,355 | 5.2% |
| Visual & Performing Arts | 977 | 3.7% |
| Communications | 1,025 | 3.9% |
| Arts & Humanities | 1,571 | 6.0% |
| Total | 26,188 | 100.0% |
Transportation & Commute in Auburn
Vehicle Availability by Sex in Auburn
The most prevalent vehicle ownership categories in Auburn are males with 2 vehicles (7,922, accounting for 44.8%) and females with 2 vehicles (7,007, making up 47.9%).
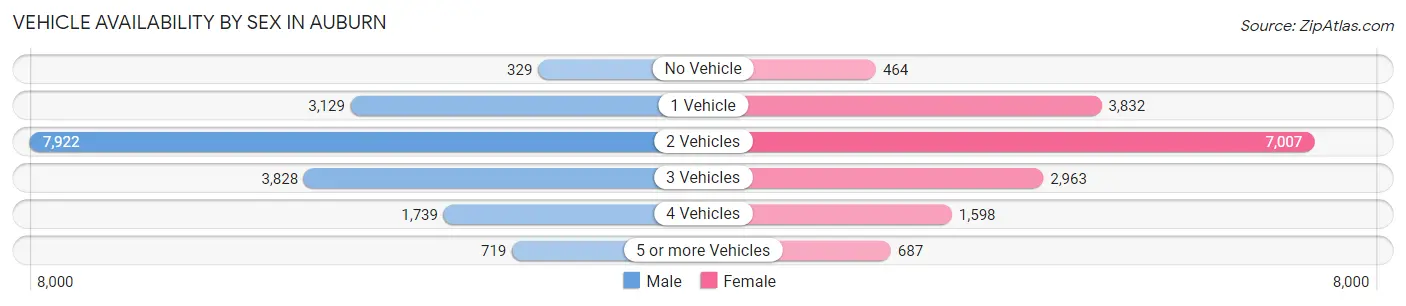
| Vehicles Available | Male | Female |
| No Vehicle | 329 (1.9%) | 464 (2.8%) |
| 1 Vehicle | 3,129 (17.7%) | 3,832 (23.2%) |
| 2 Vehicles | 7,922 (44.8%) | 7,007 (42.3%) |
| 3 Vehicles | 3,828 (21.7%) | 2,963 (17.9%) |
| 4 Vehicles | 1,739 (9.8%) | 1,598 (9.7%) |
| 5 or more Vehicles | 719 (4.1%) | 687 (4.2%) |
| Total | 17,666 (100.0%) | 16,551 (100.0%) |
Commute Time in Auburn
The most frequently occuring commute durations in Auburn are 10 to 14 minutes (8,656 commuters, 26.3%), 15 to 19 minutes (7,773 commuters, 23.6%), and 5 to 9 minutes (5,074 commuters, 15.4%).
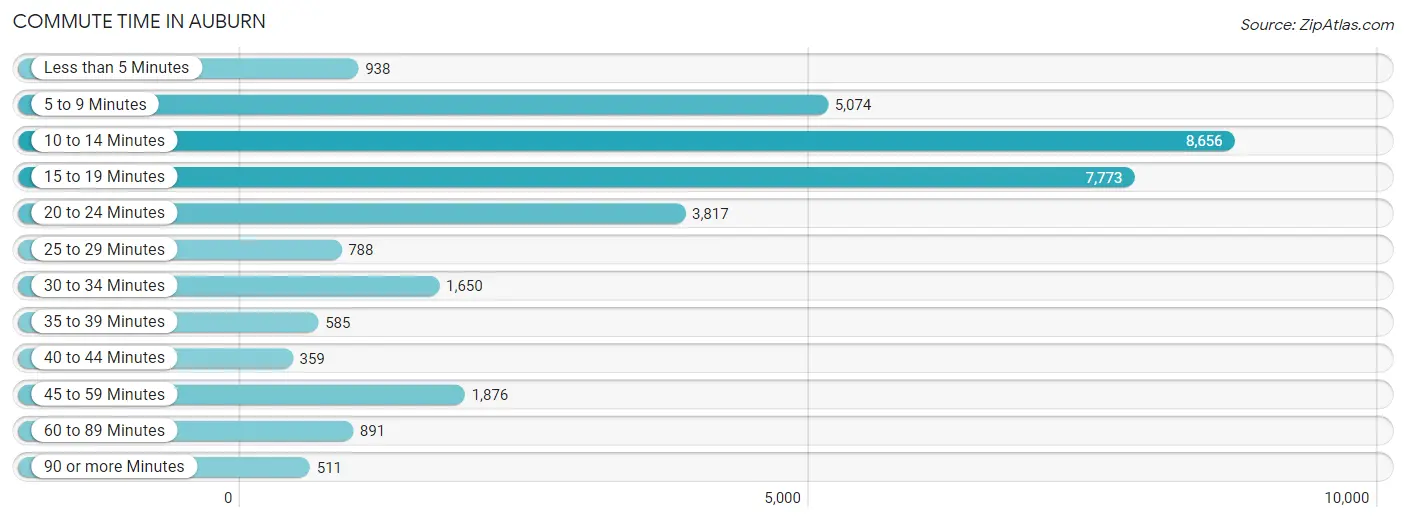
| Commute Time | # Commuters | % Commuters |
| Less than 5 Minutes | 938 | 2.9% |
| 5 to 9 Minutes | 5,074 | 15.4% |
| 10 to 14 Minutes | 8,656 | 26.3% |
| 15 to 19 Minutes | 7,773 | 23.6% |
| 20 to 24 Minutes | 3,817 | 11.6% |
| 25 to 29 Minutes | 788 | 2.4% |
| 30 to 34 Minutes | 1,650 | 5.0% |
| 35 to 39 Minutes | 585 | 1.8% |
| 40 to 44 Minutes | 359 | 1.1% |
| 45 to 59 Minutes | 1,876 | 5.7% |
| 60 to 89 Minutes | 891 | 2.7% |
| 90 or more Minutes | 511 | 1.5% |
Commute Time by Sex in Auburn
The most common commute times in Auburn are 10 to 14 minutes (4,109 commuters, 25.0%) for males and 10 to 14 minutes (4,547 commuters, 27.6%) for females.
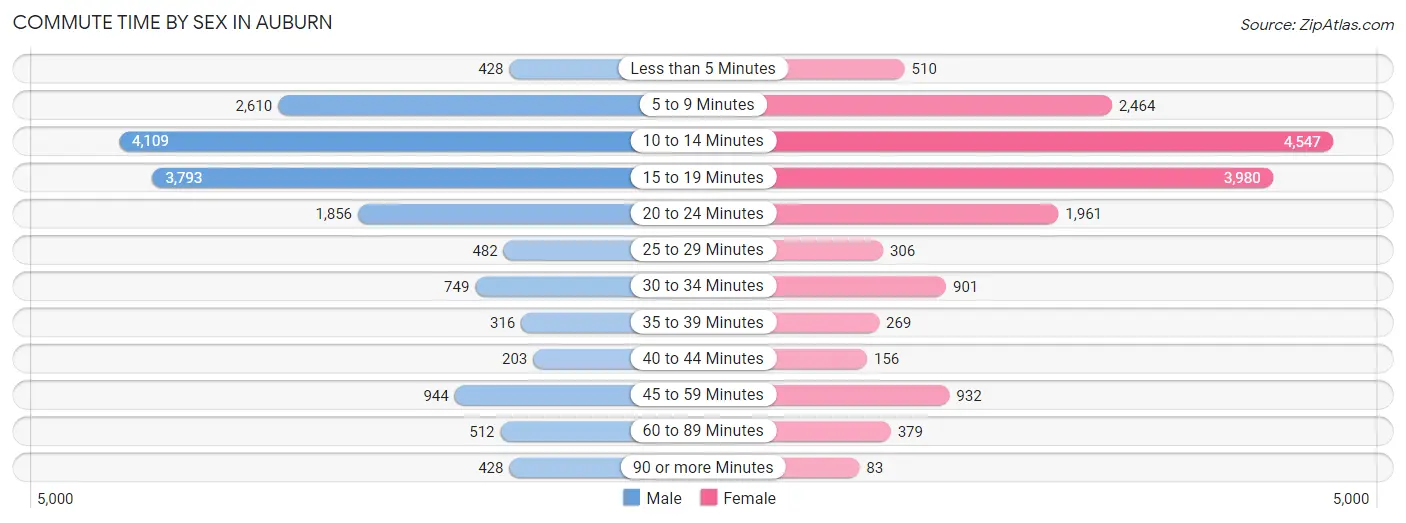
| Commute Time | Male | Female |
| Less than 5 Minutes | 428 (2.6%) | 510 (3.1%) |
| 5 to 9 Minutes | 2,610 (15.9%) | 2,464 (14.9%) |
| 10 to 14 Minutes | 4,109 (25.0%) | 4,547 (27.6%) |
| 15 to 19 Minutes | 3,793 (23.1%) | 3,980 (24.1%) |
| 20 to 24 Minutes | 1,856 (11.3%) | 1,961 (11.9%) |
| 25 to 29 Minutes | 482 (2.9%) | 306 (1.9%) |
| 30 to 34 Minutes | 749 (4.6%) | 901 (5.5%) |
| 35 to 39 Minutes | 316 (1.9%) | 269 (1.6%) |
| 40 to 44 Minutes | 203 (1.2%) | 156 (0.9%) |
| 45 to 59 Minutes | 944 (5.8%) | 932 (5.7%) |
| 60 to 89 Minutes | 512 (3.1%) | 379 (2.3%) |
| 90 or more Minutes | 428 (2.6%) | 83 (0.5%) |
Time of Departure to Work by Sex in Auburn
The most frequent times of departure to work in Auburn are 7:30 AM to 7:59 AM (3,099, 18.9%) for males and 7:00 AM to 7:29 AM (2,984, 18.1%) for females.
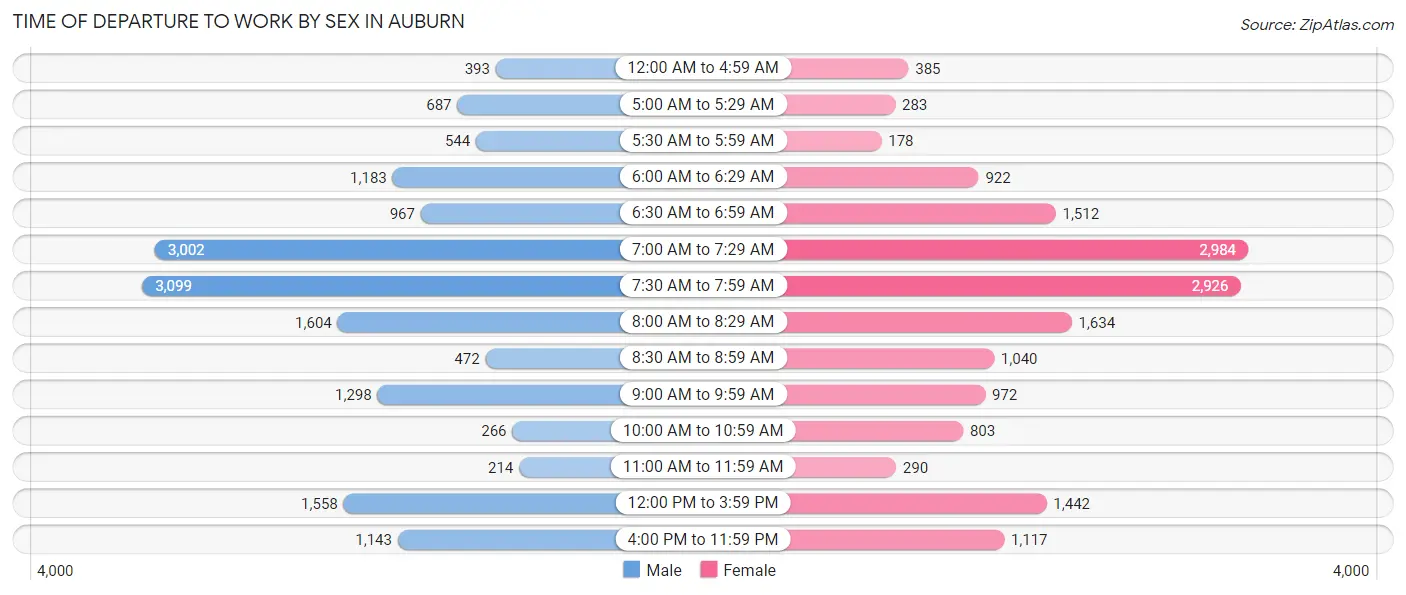
| Time of Departure | Male | Female |
| 12:00 AM to 4:59 AM | 393 (2.4%) | 385 (2.3%) |
| 5:00 AM to 5:29 AM | 687 (4.2%) | 283 (1.7%) |
| 5:30 AM to 5:59 AM | 544 (3.3%) | 178 (1.1%) |
| 6:00 AM to 6:29 AM | 1,183 (7.2%) | 922 (5.6%) |
| 6:30 AM to 6:59 AM | 967 (5.9%) | 1,512 (9.2%) |
| 7:00 AM to 7:29 AM | 3,002 (18.3%) | 2,984 (18.1%) |
| 7:30 AM to 7:59 AM | 3,099 (18.9%) | 2,926 (17.7%) |
| 8:00 AM to 8:29 AM | 1,604 (9.8%) | 1,634 (9.9%) |
| 8:30 AM to 8:59 AM | 472 (2.9%) | 1,040 (6.3%) |
| 9:00 AM to 9:59 AM | 1,298 (7.9%) | 972 (5.9%) |
| 10:00 AM to 10:59 AM | 266 (1.6%) | 803 (4.9%) |
| 11:00 AM to 11:59 AM | 214 (1.3%) | 290 (1.8%) |
| 12:00 PM to 3:59 PM | 1,558 (9.5%) | 1,442 (8.7%) |
| 4:00 PM to 11:59 PM | 1,143 (7.0%) | 1,117 (6.8%) |
| Total | 16,430 (100.0%) | 16,488 (100.0%) |
Housing Occupancy in Auburn
Occupancy by Ownership in Auburn
Of the total 28,310 dwellings in Auburn, owner-occupied units account for 14,532 (51.3%), while renter-occupied units make up 13,778 (48.7%).
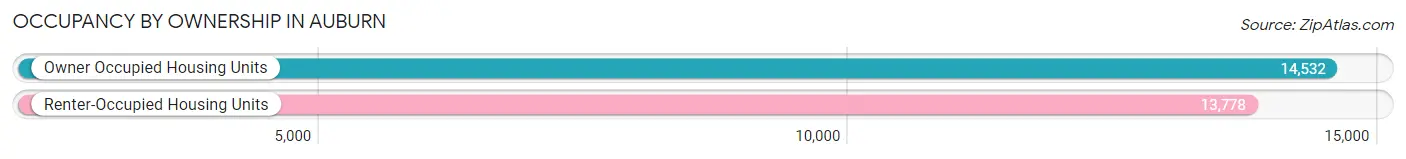
| Occupancy | # Housing Units | % Housing Units |
| Owner Occupied Housing Units | 14,532 | 51.3% |
| Renter-Occupied Housing Units | 13,778 | 48.7% |
| Total Occupied Housing Units | 28,310 | 100.0% |
Occupancy by Household Size in Auburn
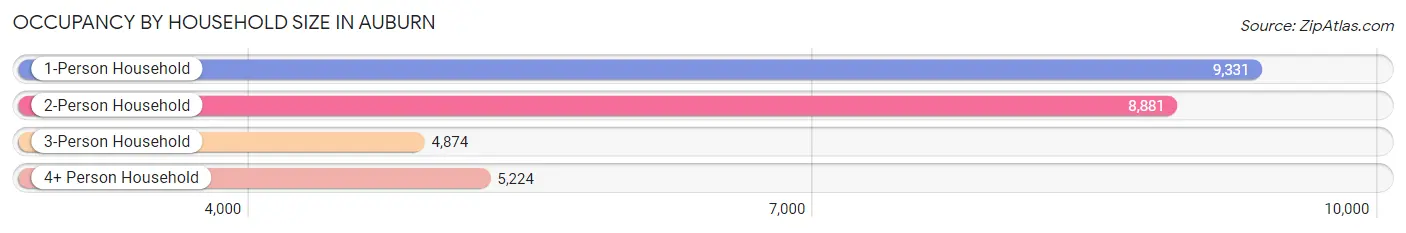
| Household Size | # Housing Units | % Housing Units |
| 1-Person Household | 9,331 | 33.0% |
| 2-Person Household | 8,881 | 31.4% |
| 3-Person Household | 4,874 | 17.2% |
| 4+ Person Household | 5,224 | 18.4% |
| Total Housing Units | 28,310 | 100.0% |
Occupancy by Ownership by Household Size in Auburn
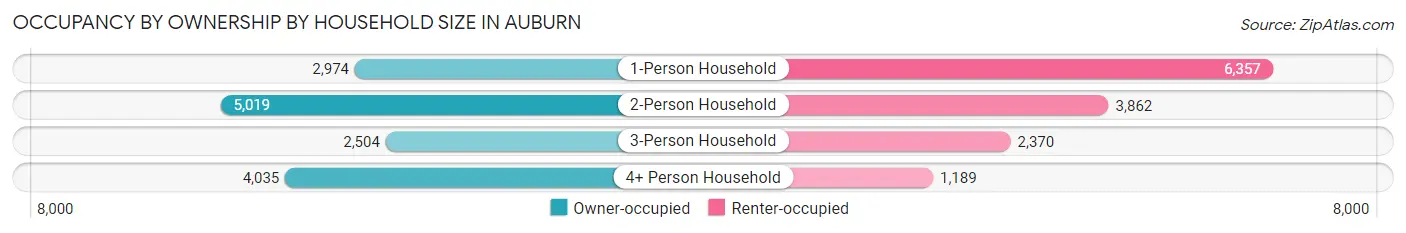
| Household Size | Owner-occupied | Renter-occupied |
| 1-Person Household | 2,974 (31.9%) | 6,357 (68.1%) |
| 2-Person Household | 5,019 (56.5%) | 3,862 (43.5%) |
| 3-Person Household | 2,504 (51.4%) | 2,370 (48.6%) |
| 4+ Person Household | 4,035 (77.2%) | 1,189 (22.8%) |
| Total Housing Units | 14,532 (51.3%) | 13,778 (48.7%) |
Occupancy by Educational Attainment in Auburn
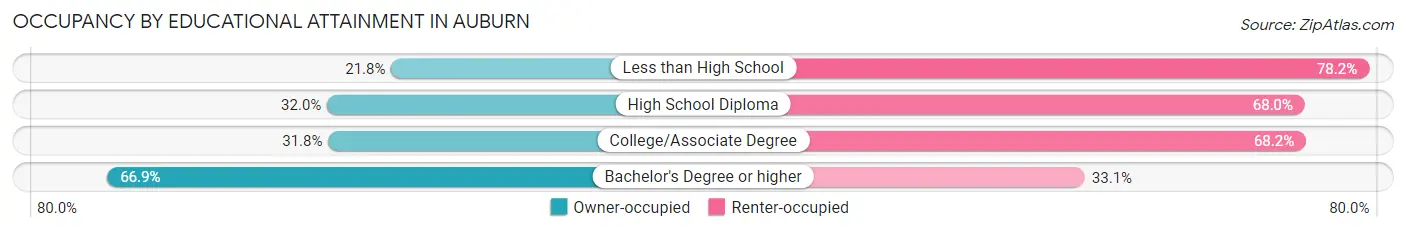
| Household Size | Owner-occupied | Renter-occupied |
| Less than High School | 152 (21.8%) | 544 (78.2%) |
| High School Diploma | 1,049 (32.0%) | 2,228 (68.0%) |
| College/Associate Degree | 2,677 (31.8%) | 5,732 (68.2%) |
| Bachelor's Degree or higher | 10,654 (66.9%) | 5,274 (33.1%) |
Occupancy by Age of Householder in Auburn
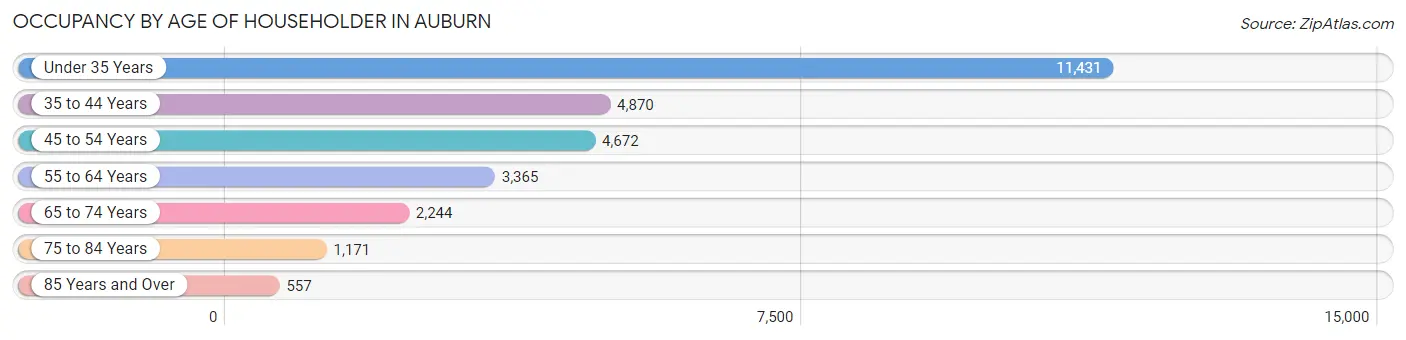
| Age Bracket | # Households | % Households |
| Under 35 Years | 11,431 | 40.4% |
| 35 to 44 Years | 4,870 | 17.2% |
| 45 to 54 Years | 4,672 | 16.5% |
| 55 to 64 Years | 3,365 | 11.9% |
| 65 to 74 Years | 2,244 | 7.9% |
| 75 to 84 Years | 1,171 | 4.1% |
| 85 Years and Over | 557 | 2.0% |
| Total | 28,310 | 100.0% |
Housing Finances in Auburn
Median Income by Occupancy in Auburn
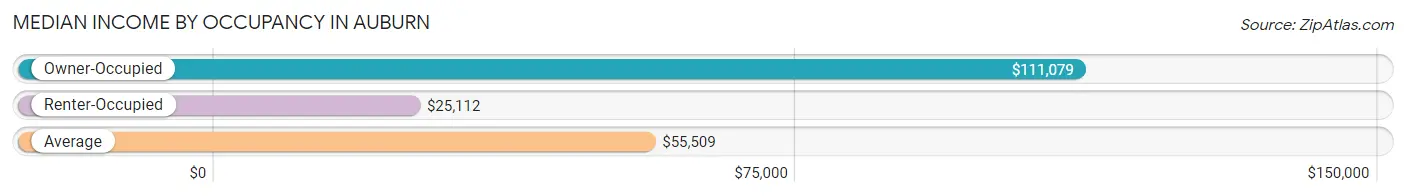
| Occupancy Type | # Households | Median Income |
| Owner-Occupied | 14,532 (51.3%) | $111,079 |
| Renter-Occupied | 13,778 (48.7%) | $25,112 |
| Average | 28,310 (100.0%) | $55,509 |
Occupancy by Householder Income Bracket in Auburn
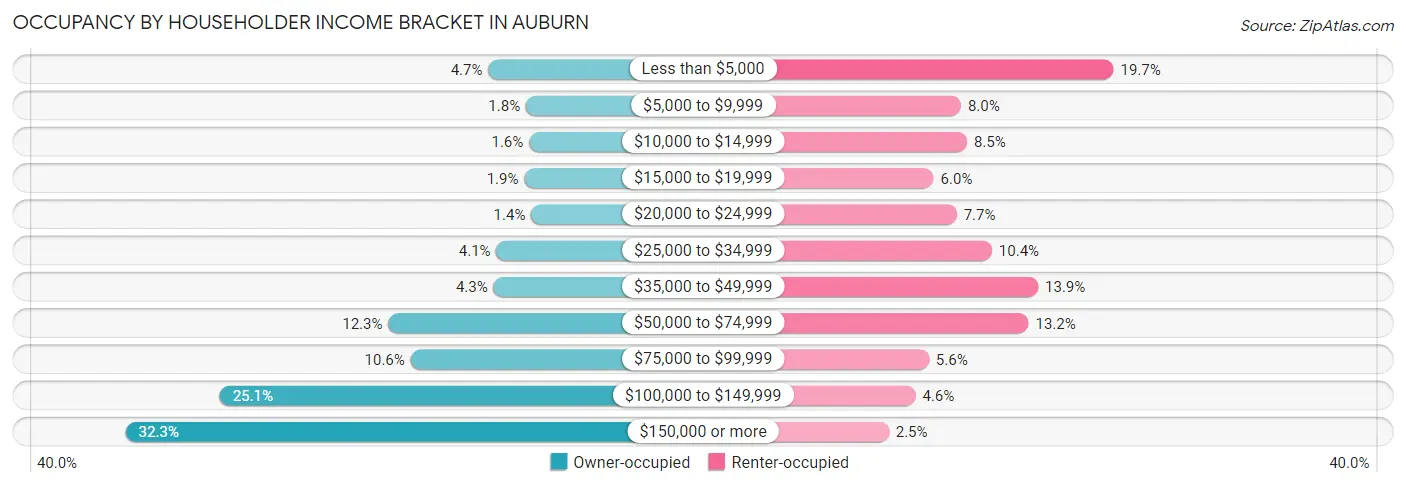
| Income Bracket | Owner-occupied | Renter-occupied |
| Less than $5,000 | 679 (4.7%) | 2,709 (19.7%) |
| $5,000 to $9,999 | 262 (1.8%) | 1,107 (8.0%) |
| $10,000 to $14,999 | 226 (1.6%) | 1,170 (8.5%) |
| $15,000 to $19,999 | 281 (1.9%) | 820 (5.9%) |
| $20,000 to $24,999 | 204 (1.4%) | 1,062 (7.7%) |
| $25,000 to $34,999 | 589 (4.1%) | 1,431 (10.4%) |
| $35,000 to $49,999 | 620 (4.3%) | 1,916 (13.9%) |
| $50,000 to $74,999 | 1,786 (12.3%) | 1,816 (13.2%) |
| $75,000 to $99,999 | 1,539 (10.6%) | 770 (5.6%) |
| $100,000 to $149,999 | 3,652 (25.1%) | 629 (4.6%) |
| $150,000 or more | 4,694 (32.3%) | 348 (2.5%) |
| Total | 14,532 (100.0%) | 13,778 (100.0%) |
Monthly Housing Cost Tiers in Auburn
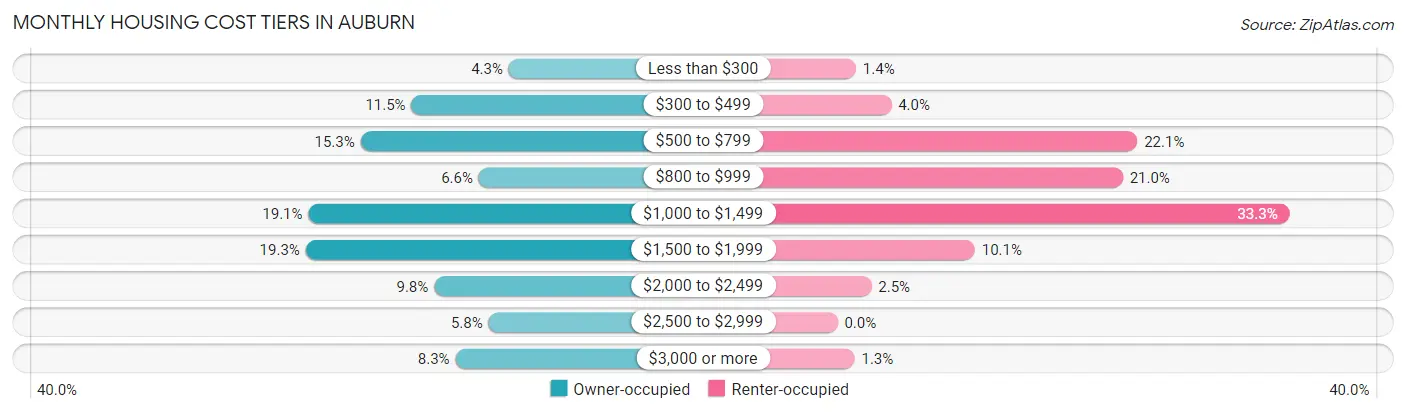
| Monthly Cost | Owner-occupied | Renter-occupied |
| Less than $300 | 630 (4.3%) | 187 (1.4%) |
| $300 to $499 | 1,673 (11.5%) | 546 (4.0%) |
| $500 to $799 | 2,217 (15.3%) | 3,042 (22.1%) |
| $800 to $999 | 952 (6.6%) | 2,895 (21.0%) |
| $1,000 to $1,499 | 2,776 (19.1%) | 4,587 (33.3%) |
| $1,500 to $1,999 | 2,805 (19.3%) | 1,394 (10.1%) |
| $2,000 to $2,499 | 1,430 (9.8%) | 344 (2.5%) |
| $2,500 to $2,999 | 847 (5.8%) | 0 (0.0%) |
| $3,000 or more | 1,202 (8.3%) | 173 (1.3%) |
| Total | 14,532 (100.0%) | 13,778 (100.0%) |
Physical Housing Characteristics in Auburn
Housing Structures in Auburn
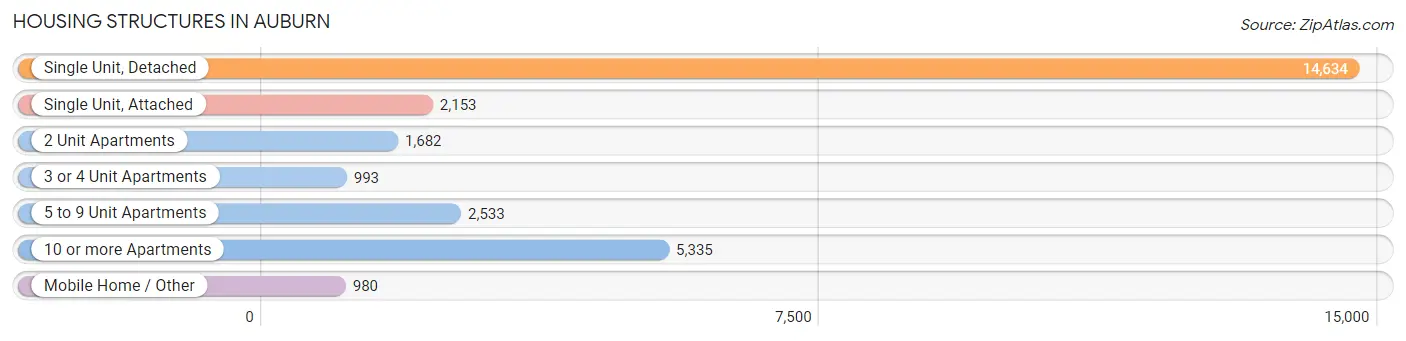
| Structure Type | # Housing Units | % Housing Units |
| Single Unit, Detached | 14,634 | 51.7% |
| Single Unit, Attached | 2,153 | 7.6% |
| 2 Unit Apartments | 1,682 | 5.9% |
| 3 or 4 Unit Apartments | 993 | 3.5% |
| 5 to 9 Unit Apartments | 2,533 | 8.9% |
| 10 or more Apartments | 5,335 | 18.8% |
| Mobile Home / Other | 980 | 3.5% |
| Total | 28,310 | 100.0% |
Housing Structures by Occupancy in Auburn
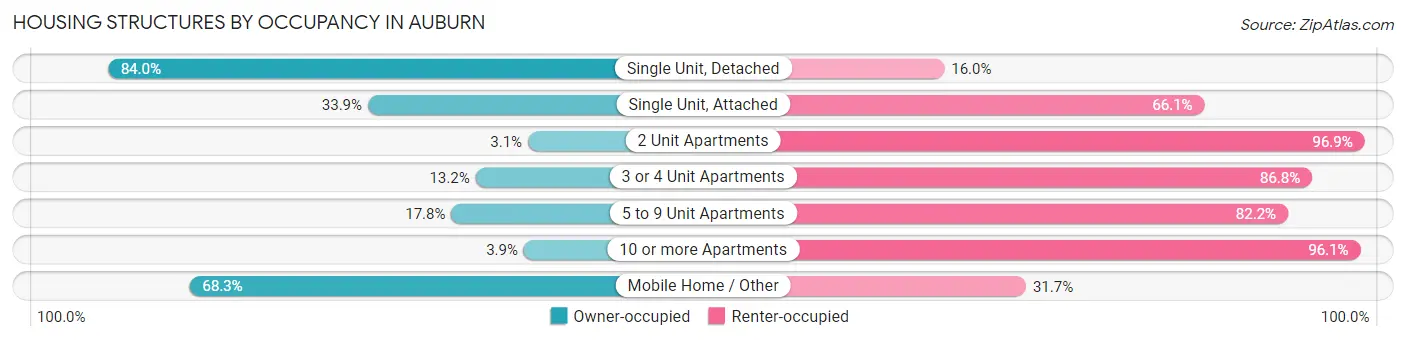
| Structure Type | Owner-occupied | Renter-occupied |
| Single Unit, Detached | 12,291 (84.0%) | 2,343 (16.0%) |
| Single Unit, Attached | 730 (33.9%) | 1,423 (66.1%) |
| 2 Unit Apartments | 52 (3.1%) | 1,630 (96.9%) |
| 3 or 4 Unit Apartments | 131 (13.2%) | 862 (86.8%) |
| 5 to 9 Unit Apartments | 452 (17.8%) | 2,081 (82.2%) |
| 10 or more Apartments | 207 (3.9%) | 5,128 (96.1%) |
| Mobile Home / Other | 669 (68.3%) | 311 (31.7%) |
| Total | 14,532 (51.3%) | 13,778 (48.7%) |
Housing Structures by Number of Rooms in Auburn
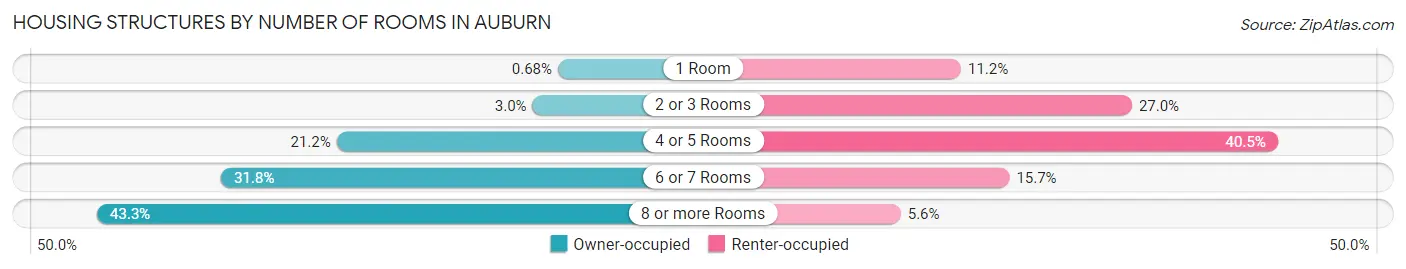
| Number of Rooms | Owner-occupied | Renter-occupied |
| 1 Room | 99 (0.7%) | 1,543 (11.2%) |
| 2 or 3 Rooms | 440 (3.0%) | 3,722 (27.0%) |
| 4 or 5 Rooms | 3,073 (21.1%) | 5,577 (40.5%) |
| 6 or 7 Rooms | 4,626 (31.8%) | 2,160 (15.7%) |
| 8 or more Rooms | 6,294 (43.3%) | 776 (5.6%) |
| Total | 14,532 (100.0%) | 13,778 (100.0%) |
Housing Structure by Heating Type in Auburn
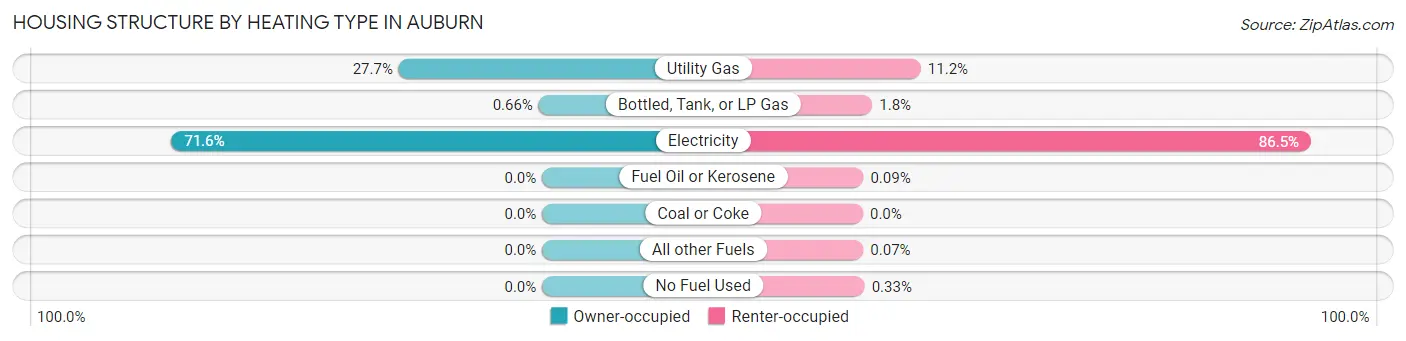
| Heating Type | Owner-occupied | Renter-occupied |
| Utility Gas | 4,026 (27.7%) | 1,540 (11.2%) |
| Bottled, Tank, or LP Gas | 96 (0.7%) | 247 (1.8%) |
| Electricity | 10,410 (71.6%) | 11,924 (86.5%) |
| Fuel Oil or Kerosene | 0 (0.0%) | 13 (0.1%) |
| Coal or Coke | 0 (0.0%) | 0 (0.0%) |
| All other Fuels | 0 (0.0%) | 9 (0.1%) |
| No Fuel Used | 0 (0.0%) | 45 (0.3%) |
| Total | 14,532 (100.0%) | 13,778 (100.0%) |
Household Vehicle Usage in Auburn
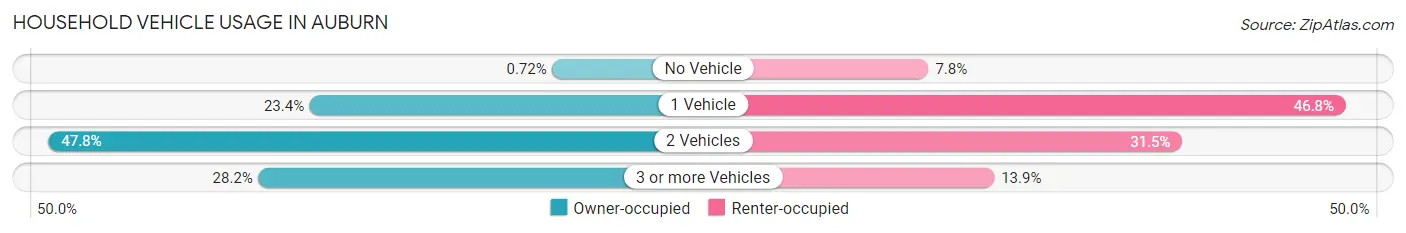
| Vehicles per Household | Owner-occupied | Renter-occupied |
| No Vehicle | 104 (0.7%) | 1,075 (7.8%) |
| 1 Vehicle | 3,394 (23.4%) | 6,443 (46.8%) |
| 2 Vehicles | 6,943 (47.8%) | 4,339 (31.5%) |
| 3 or more Vehicles | 4,091 (28.1%) | 1,921 (13.9%) |
| Total | 14,532 (100.0%) | 13,778 (100.0%) |
Real Estate & Mortgages in Auburn
Real Estate and Mortgage Overview in Auburn
| Characteristic | Without Mortgage | With Mortgage |
| Housing Units | 4,720 | 9,812 |
| Median Property Value | $298,600 | $336,900 |
| Median Household Income | $86,722 | $3,407 |
| Monthly Housing Costs | $517 | $1,202 |
| Real Estate Taxes | $1,452 | $302 |
Property Value by Mortgage Status in Auburn
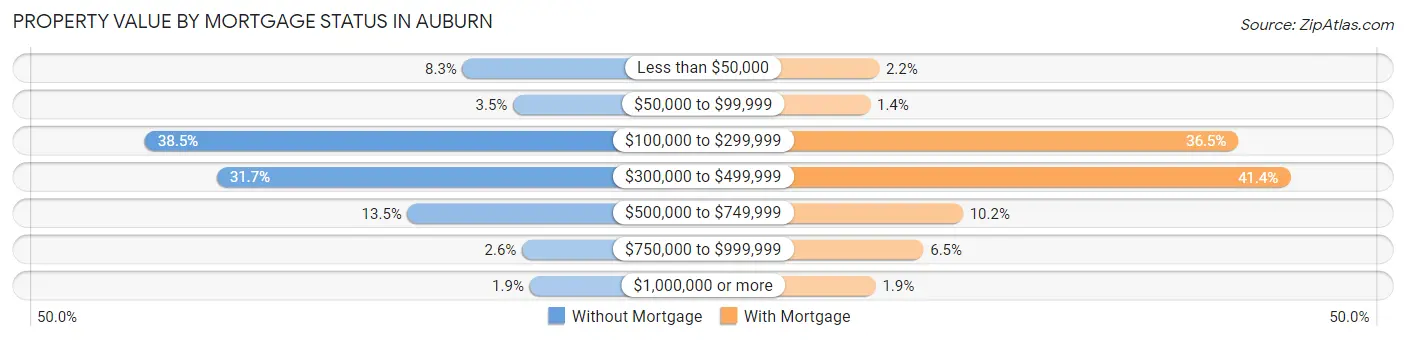
| Property Value | Without Mortgage | With Mortgage |
| Less than $50,000 | 391 (8.3%) | 219 (2.2%) |
| $50,000 to $99,999 | 164 (3.5%) | 135 (1.4%) |
| $100,000 to $299,999 | 1,819 (38.5%) | 3,576 (36.4%) |
| $300,000 to $499,999 | 1,496 (31.7%) | 4,061 (41.4%) |
| $500,000 to $749,999 | 638 (13.5%) | 1,002 (10.2%) |
| $750,000 to $999,999 | 123 (2.6%) | 633 (6.5%) |
| $1,000,000 or more | 89 (1.9%) | 186 (1.9%) |
| Total | 4,720 (100.0%) | 9,812 (100.0%) |
Household Income by Mortgage Status in Auburn
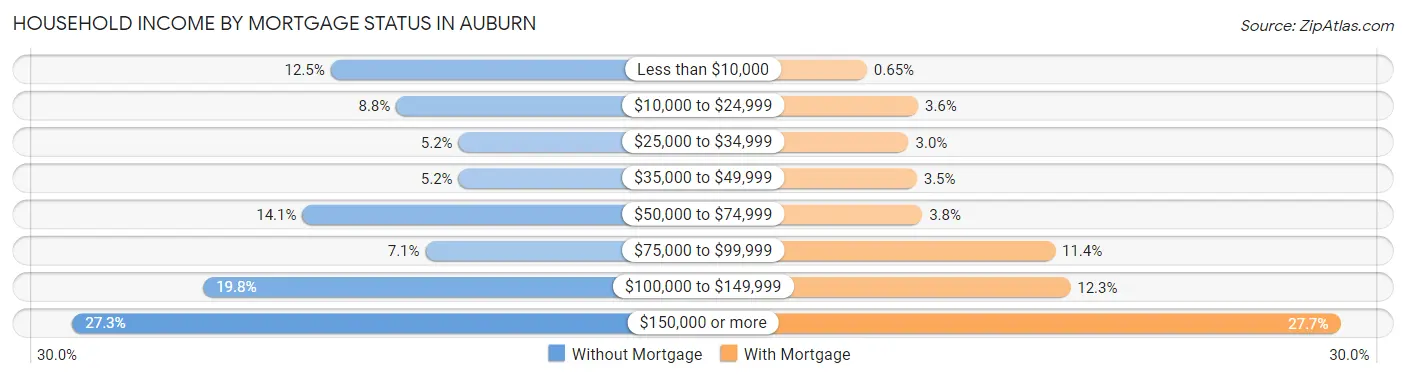
| Household Income | Without Mortgage | With Mortgage |
| Less than $10,000 | 591 (12.5%) | 64 (0.6%) |
| $10,000 to $24,999 | 414 (8.8%) | 350 (3.6%) |
| $25,000 to $34,999 | 246 (5.2%) | 297 (3.0%) |
| $35,000 to $49,999 | 246 (5.2%) | 343 (3.5%) |
| $50,000 to $74,999 | 667 (14.1%) | 374 (3.8%) |
| $75,000 to $99,999 | 335 (7.1%) | 1,119 (11.4%) |
| $100,000 to $149,999 | 934 (19.8%) | 1,204 (12.3%) |
| $150,000 or more | 1,287 (27.3%) | 2,718 (27.7%) |
| Total | 4,720 (100.0%) | 9,812 (100.0%) |
Property Value to Household Income Ratio in Auburn
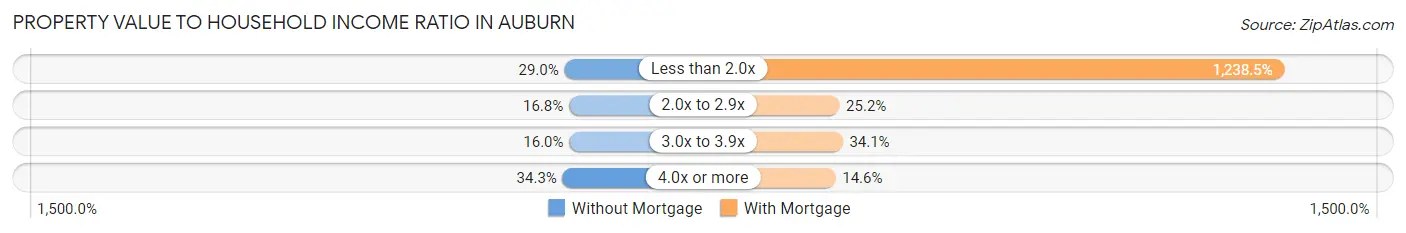
| Value-to-Income Ratio | Without Mortgage | With Mortgage |
| Less than 2.0x | 1,370 (29.0%) | 121,522 (1,238.5%) |
| 2.0x to 2.9x | 794 (16.8%) | 2,468 (25.2%) |
| 3.0x to 3.9x | 756 (16.0%) | 3,347 (34.1%) |
| 4.0x or more | 1,619 (34.3%) | 1,429 (14.6%) |
| Total | 4,720 (100.0%) | 9,812 (100.0%) |
Real Estate Taxes by Mortgage Status in Auburn
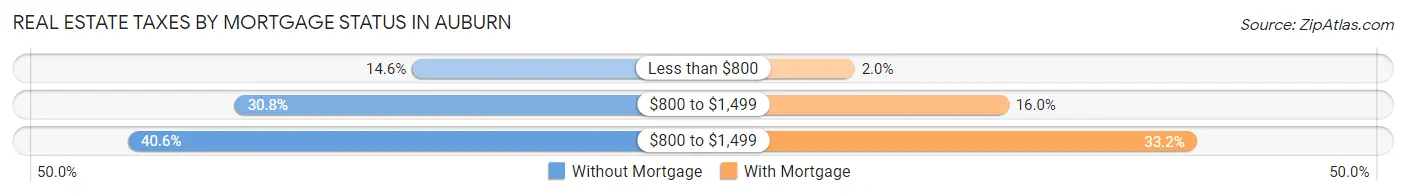
| Property Taxes | Without Mortgage | With Mortgage |
| Less than $800 | 690 (14.6%) | 194 (2.0%) |
| $800 to $1,499 | 1,454 (30.8%) | 1,574 (16.0%) |
| $800 to $1,499 | 1,914 (40.6%) | 3,257 (33.2%) |
| Total | 4,720 (100.0%) | 9,812 (100.0%) |
Health & Disability in Auburn
Health Insurance Coverage by Age in Auburn
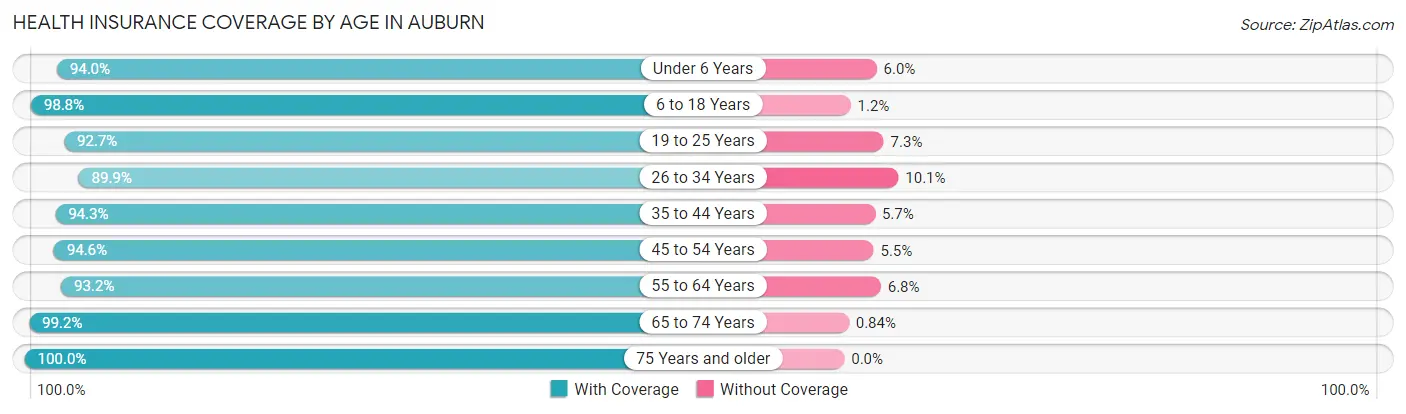
| Age Bracket | With Coverage | Without Coverage |
| Under 6 Years | 3,981 (94.0%) | 255 (6.0%) |
| 6 to 18 Years | 12,809 (98.8%) | 151 (1.2%) |
| 19 to 25 Years | 19,734 (92.7%) | 1,564 (7.3%) |
| 26 to 34 Years | 8,068 (89.9%) | 904 (10.1%) |
| 35 to 44 Years | 7,865 (94.3%) | 477 (5.7%) |
| 45 to 54 Years | 7,802 (94.6%) | 450 (5.4%) |
| 55 to 64 Years | 5,379 (93.2%) | 393 (6.8%) |
| 65 to 74 Years | 3,763 (99.2%) | 32 (0.8%) |
| 75 Years and older | 2,766 (100.0%) | 0 (0.0%) |
| Total | 72,167 (94.5%) | 4,226 (5.5%) |
Health Insurance Coverage by Citizenship Status in Auburn
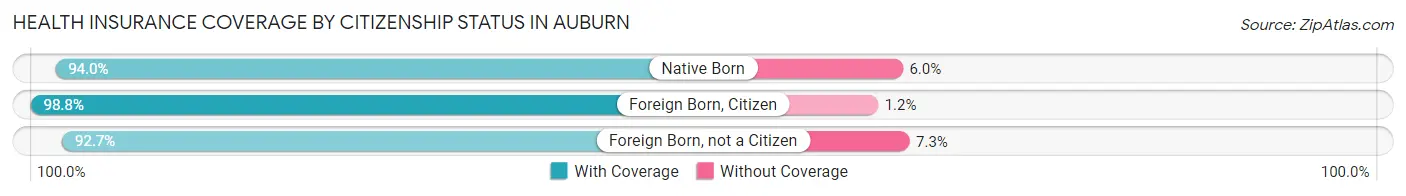
| Citizenship Status | With Coverage | Without Coverage |
| Native Born | 3,981 (94.0%) | 255 (6.0%) |
| Foreign Born, Citizen | 12,809 (98.8%) | 151 (1.2%) |
| Foreign Born, not a Citizen | 19,734 (92.7%) | 1,564 (7.3%) |
Health Insurance Coverage by Household Income in Auburn
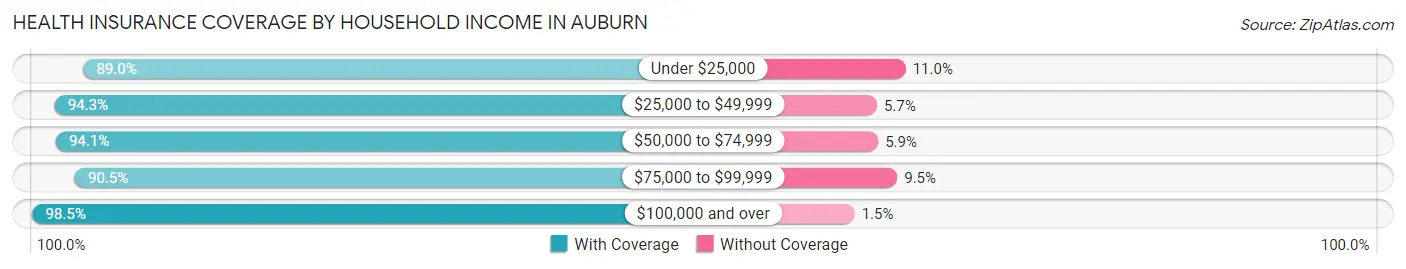
| Household Income | With Coverage | Without Coverage |
| Under $25,000 | 14,371 (89.0%) | 1,783 (11.0%) |
| $25,000 to $49,999 | 9,273 (94.3%) | 556 (5.7%) |
| $50,000 to $74,999 | 7,840 (94.1%) | 491 (5.9%) |
| $75,000 to $99,999 | 5,721 (90.5%) | 598 (9.5%) |
| $100,000 and over | 28,647 (98.5%) | 429 (1.5%) |
Public vs Private Health Insurance Coverage by Age in Auburn
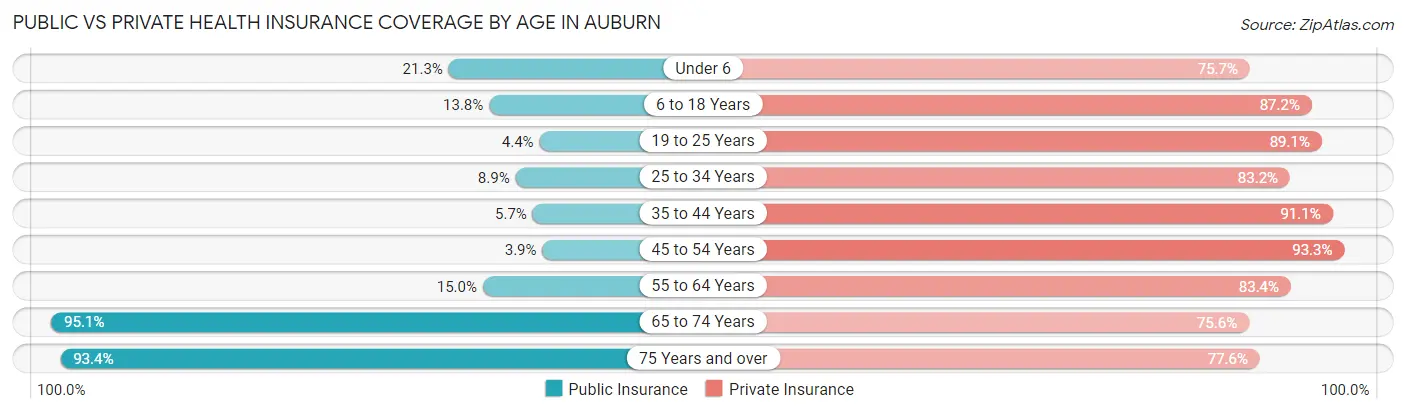
| Age Bracket | Public Insurance | Private Insurance |
| Under 6 | 902 (21.3%) | 3,208 (75.7%) |
| 6 to 18 Years | 1,786 (13.8%) | 11,304 (87.2%) |
| 19 to 25 Years | 946 (4.4%) | 18,972 (89.1%) |
| 25 to 34 Years | 797 (8.9%) | 7,462 (83.2%) |
| 35 to 44 Years | 475 (5.7%) | 7,597 (91.1%) |
| 45 to 54 Years | 321 (3.9%) | 7,696 (93.3%) |
| 55 to 64 Years | 863 (14.9%) | 4,811 (83.4%) |
| 65 to 74 Years | 3,608 (95.1%) | 2,868 (75.6%) |
| 75 Years and over | 2,583 (93.4%) | 2,146 (77.6%) |
| Total | 12,281 (16.1%) | 66,064 (86.5%) |
Disability Status by Sex by Age in Auburn
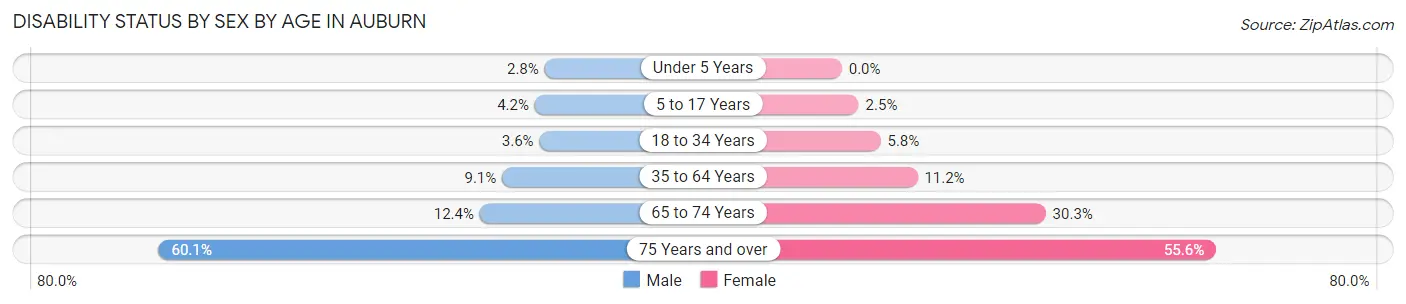
| Age Bracket | Male | Female |
| Under 5 Years | 61 (2.8%) | 0 (0.0%) |
| 5 to 17 Years | 214 (4.2%) | 139 (2.5%) |
| 18 to 34 Years | 589 (3.5%) | 951 (5.8%) |
| 35 to 64 Years | 952 (9.1%) | 1,336 (11.2%) |
| 65 to 74 Years | 213 (12.4%) | 629 (30.3%) |
| 75 Years and over | 717 (60.1%) | 874 (55.6%) |
Disability Class by Sex by Age in Auburn
Disability Class: Hearing Difficulty
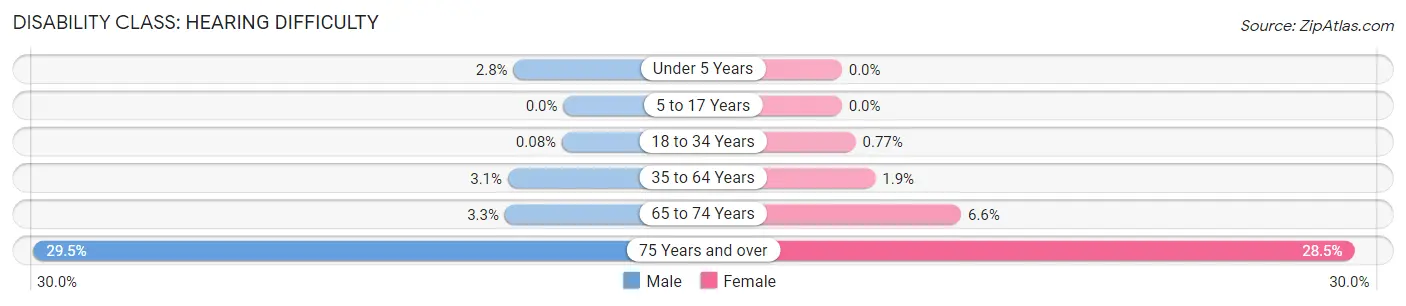
| Age Bracket | Male | Female |
| Under 5 Years | 61 (2.8%) | 0 (0.0%) |
| 5 to 17 Years | 0 (0.0%) | 0 (0.0%) |
| 18 to 34 Years | 14 (0.1%) | 127 (0.8%) |
| 35 to 64 Years | 323 (3.1%) | 222 (1.9%) |
| 65 to 74 Years | 56 (3.3%) | 138 (6.6%) |
| 75 Years and over | 352 (29.5%) | 449 (28.5%) |
Disability Class: Vision Difficulty
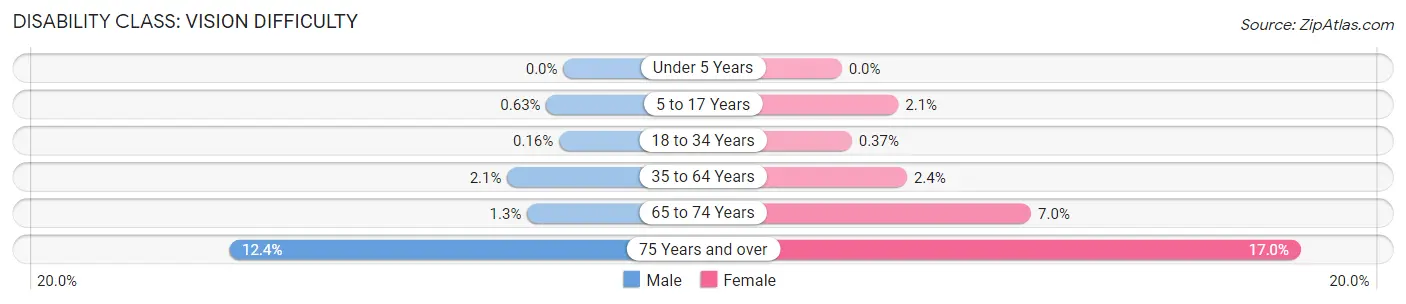
| Age Bracket | Male | Female |
| Under 5 Years | 0 (0.0%) | 0 (0.0%) |
| 5 to 17 Years | 32 (0.6%) | 117 (2.1%) |
| 18 to 34 Years | 26 (0.2%) | 62 (0.4%) |
| 35 to 64 Years | 218 (2.1%) | 288 (2.4%) |
| 65 to 74 Years | 23 (1.3%) | 146 (7.0%) |
| 75 Years and over | 148 (12.4%) | 268 (17.0%) |
Disability Class: Cognitive Difficulty
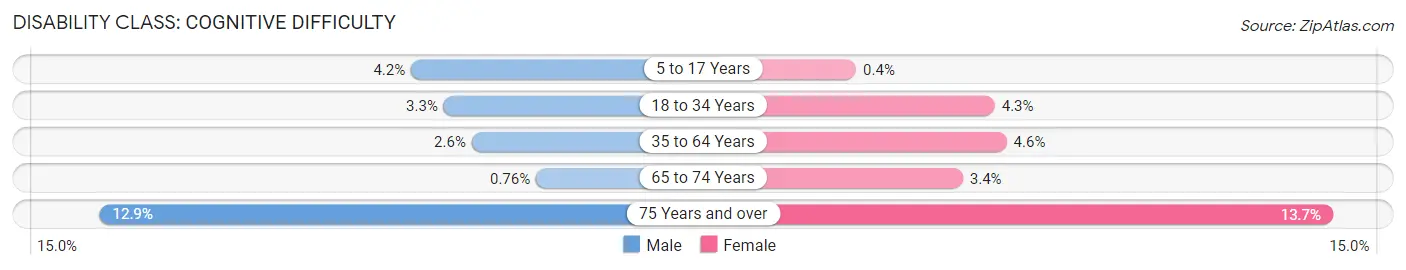
| Age Bracket | Male | Female |
| 5 to 17 Years | 214 (4.2%) | 22 (0.4%) |
| 18 to 34 Years | 553 (3.3%) | 704 (4.3%) |
| 35 to 64 Years | 267 (2.5%) | 546 (4.6%) |
| 65 to 74 Years | 13 (0.8%) | 70 (3.4%) |
| 75 Years and over | 154 (12.9%) | 215 (13.7%) |
Disability Class: Ambulatory Difficulty
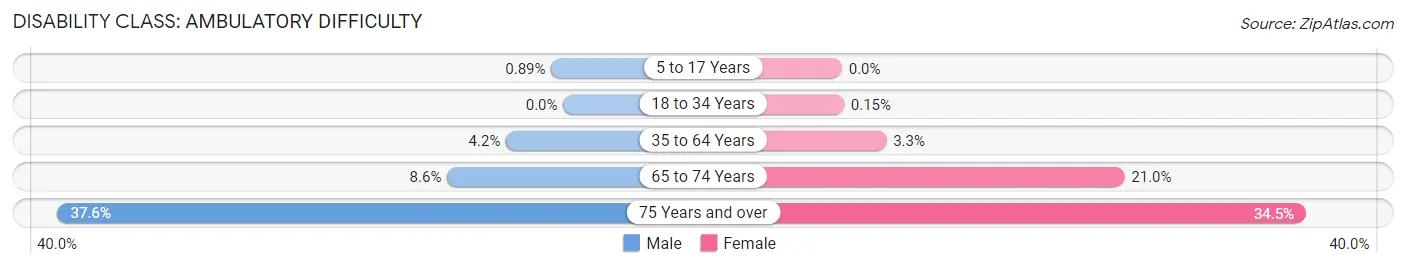
| Age Bracket | Male | Female |
| 5 to 17 Years | 45 (0.9%) | 0 (0.0%) |
| 18 to 34 Years | 0 (0.0%) | 24 (0.2%) |
| 35 to 64 Years | 444 (4.2%) | 392 (3.3%) |
| 65 to 74 Years | 148 (8.6%) | 436 (21.0%) |
| 75 Years and over | 448 (37.6%) | 542 (34.5%) |
Disability Class: Self-Care Difficulty
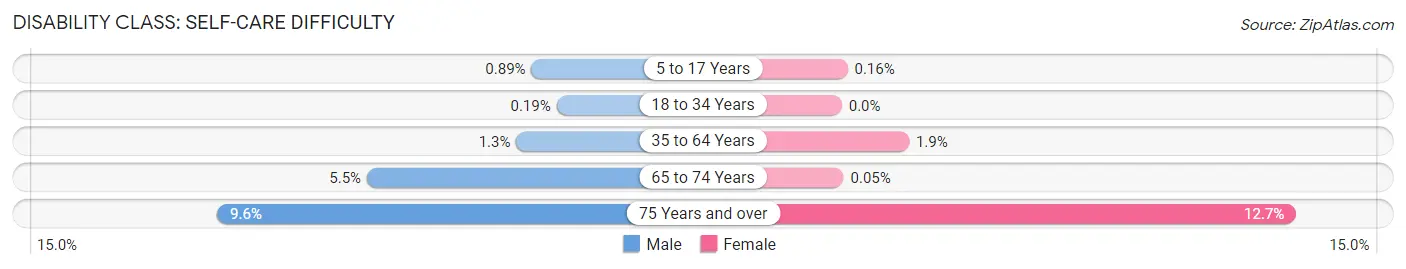
| Age Bracket | Male | Female |
| 5 to 17 Years | 45 (0.9%) | 9 (0.2%) |
| 18 to 34 Years | 32 (0.2%) | 0 (0.0%) |
| 35 to 64 Years | 137 (1.3%) | 223 (1.9%) |
| 65 to 74 Years | 94 (5.5%) | 1 (0.1%) |
| 75 Years and over | 115 (9.6%) | 199 (12.7%) |
Technology Access in Auburn
Computing Device Access in Auburn
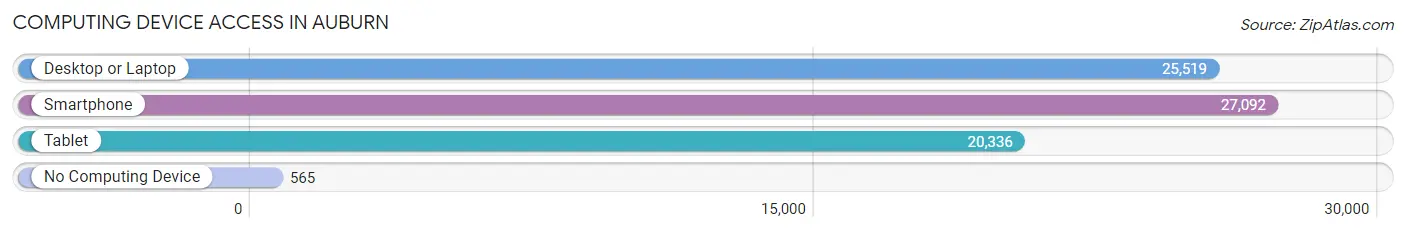
| Device Type | # Households | % Households |
| Desktop or Laptop | 25,519 | 90.1% |
| Smartphone | 27,092 | 95.7% |
| Tablet | 20,336 | 71.8% |
| No Computing Device | 565 | 2.0% |
| Total | 28,310 | 100.0% |
Internet Access in Auburn
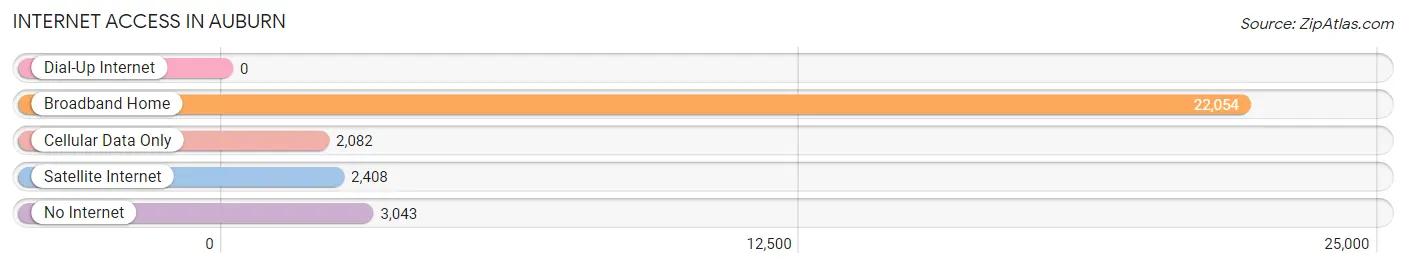
| Internet Type | # Households | % Households |
| Dial-Up Internet | 0 | 0.0% |
| Broadband Home | 22,054 | 77.9% |
| Cellular Data Only | 2,082 | 7.3% |
| Satellite Internet | 2,408 | 8.5% |
| No Internet | 3,043 | 10.7% |
| Total | 28,310 | 100.0% |
Auburn Summary
Auburn, Alabama is a city located in Lee County, Alabama, United States. It is the county seat of Lee County and is located in the east-central part of the state. Auburn is the largest city in the county and is home to Auburn University, one of the largest universities in the state. The city has a population of approximately 63,000 people, making it the tenth-largest city in Alabama.
History
Auburn was founded in 1836 by John Harper, a settler from Georgia. The city was originally named "Harper's Station" after Harper, but was later changed to "Auburn" in 1839. The name was chosen in honor of the poet Oliver Goldsmith's poem "The Deserted Village," which contains the line "sweet Auburn, loveliest village of the plain."
The city was incorporated in 1839 and quickly became a center of commerce and industry. The city was home to several cotton mills and other manufacturing businesses. Auburn was also a major railroad hub, with several lines running through the city.
In the late 19th century, Auburn became a center of education, with the founding of Auburn University in 1856. The university has grown to become one of the largest in the state and is now a major economic driver for the city.
Geography
Auburn is located in east-central Alabama, approximately 50 miles east of Montgomery and 100 miles southwest of Atlanta, Georgia. The city is situated in the foothills of the Appalachian Mountains and is surrounded by rolling hills and forests. The city is located on the banks of the Tallapoosa River, which flows through the city.
The city has a total area of 33.2 square miles, of which 32.9 square miles is land and 0.3 square miles is water. The city has a humid subtropical climate, with hot, humid summers and mild winters.
Economy
Auburn's economy is largely driven by the presence of Auburn University. The university is the largest employer in the city, with over 10,000 employees. The university also contributes significantly to the city's economy through its research and development activities.
In addition to the university, Auburn is home to several large companies, including Auburn Manufacturing, Inc., Auburn Pharmaceuticals, and Auburn Automotive. The city is also home to several small businesses, including restaurants, retail stores, and professional services.
Demographics
As of the 2010 census, Auburn had a population of 63,118 people. The racial makeup of the city was 73.3% White, 17.2% Black or African American, 0.3% Native American, 5.2% Asian, 0.1% Pacific Islander, 1.2% from other races, and 2.7% from two or more races. Hispanic or Latino of any race were 4.2% of the population.
The median income for a household in the city was $37,837, and the median income for a family was $50,945. The per capita income for the city was $21,845. About 15.2% of the population was below the poverty line.
Common Questions
What is Per Capita Income in Auburn?
Per Capita income in Auburn is $35,115.
What is the Median Family Income in Auburn?
Median Family Income in Auburn is $104,540.
What is the Median Household income in Auburn?
Median Household Income in Auburn is $55,509.
What is Income or Wage Gap in Auburn?
Income or Wage Gap in Auburn is 19.5%.
Women in Auburn earn 80.5 cents for every dollar earned by a man.
What is Family Income Deficit in Auburn?
Family Income Deficit in Auburn is $11,795.
Families that are below poverty line in Auburn earn $11,795 less on average than the poverty threshold level.
What is Inequality or Gini Index in Auburn?
Inequality or Gini Index in Auburn is 0.57.
What is the Total Population of Auburn?
Total Population of Auburn is 76,660.
What is the Total Male Population of Auburn?
Total Male Population of Auburn is 37,387.
What is the Total Female Population of Auburn?
Total Female Population of Auburn is 39,273.
What is the Ratio of Males per 100 Females in Auburn?
There are 95.20 Males per 100 Females in Auburn.
What is the Ratio of Females per 100 Males in Auburn?
There are 105.04 Females per 100 Males in Auburn.
What is the Median Population Age in Auburn?
Median Population Age in Auburn is 25.9 Years.
What is the Average Family Size in Auburn
Average Family Size in Auburn is 3.2 People.
What is the Average Household Size in Auburn
Average Household Size in Auburn is 2.5 People.
How Large is the Labor Force in Auburn?
There are 37,828 People in the Labor Forcein in Auburn.
What is the Percentage of People in the Labor Force in Auburn?
59.1% of People are in the Labor Force in Auburn.
What is the Unemployment Rate in Auburn?
Unemployment Rate in Auburn is 3.0%.