Campbellsville, KY Map & Demographics
Campbellsville Map
Campbellsville Overview
$31,588
PER CAPITA INCOME
$67,037
AVG FAMILY INCOME
$53,254
AVG HOUSEHOLD INCOME
19.6%
WAGE / INCOME GAP [ % ]
80.4¢/ $1
WAGE / INCOME GAP [ $ ]
0.53
INEQUALITY / GINI INDEX
11,434
TOTAL POPULATION
5,554
MALE POPULATION
5,880
FEMALE POPULATION
94.46
MALES / 100 FEMALES
105.87
FEMALES / 100 MALES
36.3
MEDIAN AGE
3.0
AVG FAMILY SIZE
2.2
AVG HOUSEHOLD SIZE
5,176
LABOR FORCE [ PEOPLE ]
56.5%
PERCENT IN LABOR FORCE
8.1%
UNEMPLOYMENT RATE
Campbellsville Zip Codes
Campbellsville Area Codes
Income in Campbellsville
Income Overview in Campbellsville
Per Capita Income in Campbellsville is $31,588, while median incomes of families and households are $67,037 and $53,254 respectively.
| Characteristic | Number | Measure |
| Per Capita Income | 11,434 | $31,588 |
| Median Family Income | 2,601 | $67,037 |
| Mean Family Income | 2,601 | $91,846 |
| Median Household Income | 4,678 | $53,254 |
| Mean Household Income | 4,678 | $75,209 |
| Income Deficit | 2,601 | $0 |
| Wage / Income Gap (%) | 11,434 | 19.63% |
| Wage / Income Gap ($) | 11,434 | 80.37¢ per $1 |
| Gini / Inequality Index | 11,434 | 0.53 |
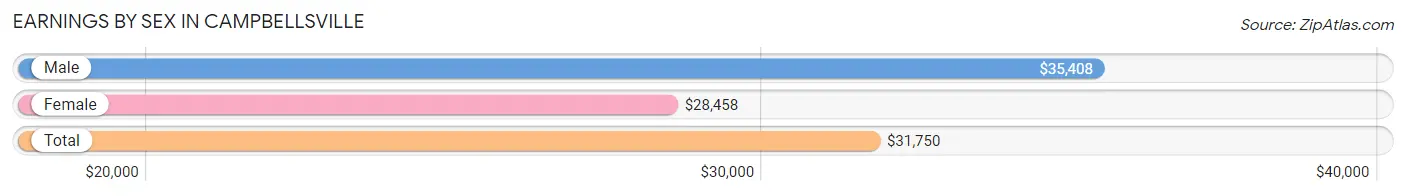
Earnings by Sex in Campbellsville
Average Earnings in Campbellsville are $31,750, $35,408 for men and $28,458 for women, a difference of 19.6%.
| Sex | Number | Average Earnings |
| Male | 3,014 (55.2%) | $35,408 |
| Female | 2,447 (44.8%) | $28,458 |
| Total | 5,461 (100.0%) | $31,750 |
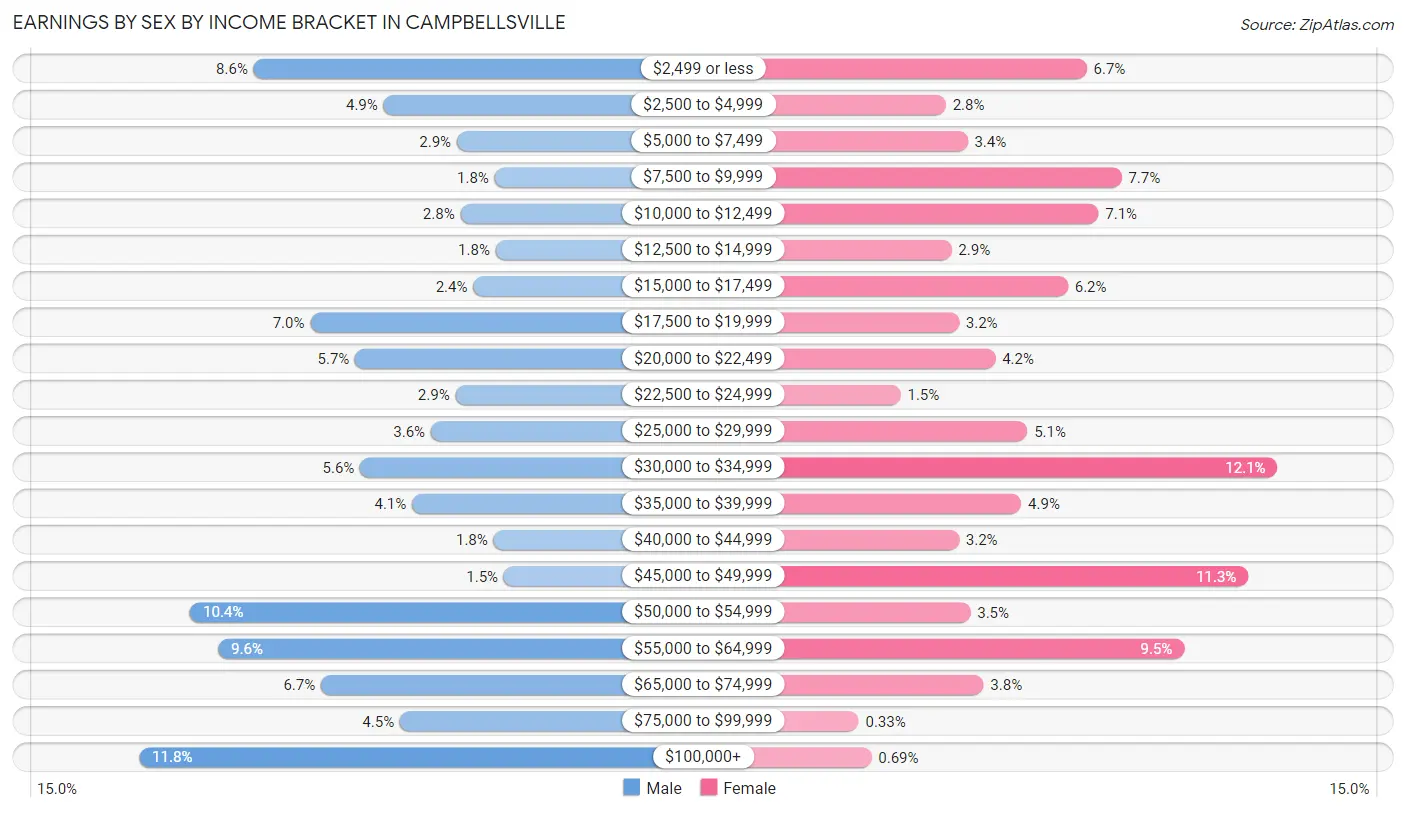
Earnings by Sex by Income Bracket in Campbellsville
The most common earnings brackets in Campbellsville are $100,000+ for men (355 | 11.8%) and $30,000 to $34,999 for women (296 | 12.1%).
| Income | Male | Female |
| $2,499 or less | 258 (8.6%) | 165 (6.7%) |
| $2,500 to $4,999 | 148 (4.9%) | 68 (2.8%) |
| $5,000 to $7,499 | 86 (2.9%) | 83 (3.4%) |
| $7,500 to $9,999 | 54 (1.8%) | 189 (7.7%) |
| $10,000 to $12,499 | 83 (2.8%) | 173 (7.1%) |
| $12,500 to $14,999 | 53 (1.8%) | 72 (2.9%) |
| $15,000 to $17,499 | 72 (2.4%) | 152 (6.2%) |
| $17,500 to $19,999 | 210 (7.0%) | 77 (3.2%) |
| $20,000 to $22,499 | 172 (5.7%) | 102 (4.2%) |
| $22,500 to $24,999 | 87 (2.9%) | 37 (1.5%) |
| $25,000 to $29,999 | 108 (3.6%) | 124 (5.1%) |
| $30,000 to $34,999 | 168 (5.6%) | 296 (12.1%) |
| $35,000 to $39,999 | 124 (4.1%) | 120 (4.9%) |
| $40,000 to $44,999 | 55 (1.8%) | 77 (3.2%) |
| $45,000 to $49,999 | 46 (1.5%) | 276 (11.3%) |
| $50,000 to $54,999 | 312 (10.3%) | 85 (3.5%) |
| $55,000 to $64,999 | 288 (9.6%) | 232 (9.5%) |
| $65,000 to $74,999 | 201 (6.7%) | 94 (3.8%) |
| $75,000 to $99,999 | 134 (4.4%) | 8 (0.3%) |
| $100,000+ | 355 (11.8%) | 17 (0.7%) |
| Total | 3,014 (100.0%) | 2,447 (100.0%) |
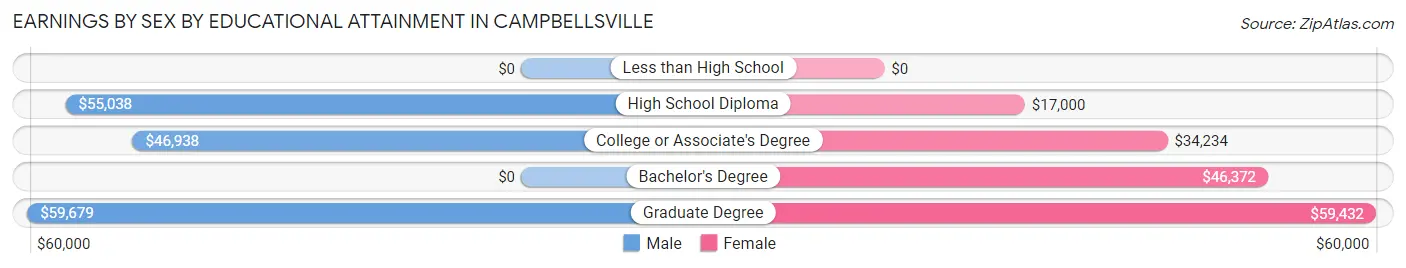
Earnings by Sex by Educational Attainment in Campbellsville
Average earnings in Campbellsville are $51,103 for men and $37,604 for women, a difference of 26.4%. Men with an educational attainment of graduate degree enjoy the highest average annual earnings of $59,679, while those with college or associate's degree education earn the least with $46,938. Women with an educational attainment of graduate degree earn the most with the average annual earnings of $59,432, while those with high school diploma education have the smallest earnings of $17,000.
| Educational Attainment | Male Income | Female Income |
| Less than High School | - | - |
| High School Diploma | $55,038 | $17,000 |
| College or Associate's Degree | $46,938 | $34,234 |
| Bachelor's Degree | - | - |
| Graduate Degree | $59,679 | $59,432 |
| Total | $51,103 | $37,604 |
Family Income in Campbellsville
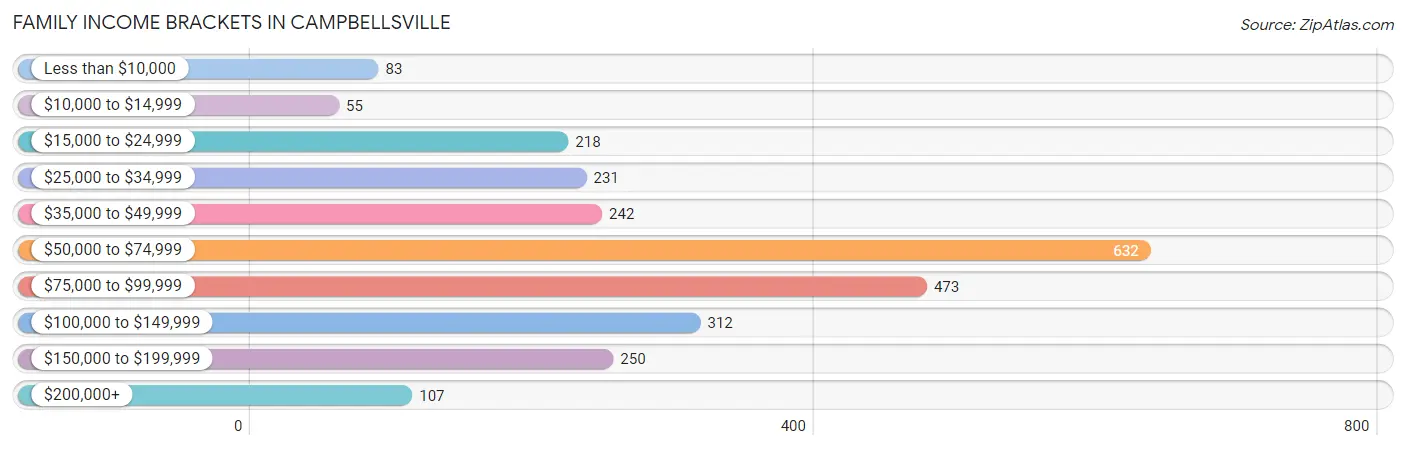
Family Income Brackets in Campbellsville
According to the Campbellsville family income data, there are 632 families falling into the $50,000 to $74,999 income range, which is the most common income bracket and makes up 24.3% of all families. Conversely, the $10,000 to $14,999 income bracket is the least frequent group with only 55 families (2.1%) belonging to this category.
| Income Bracket | # Families | % Families |
| Less than $10,000 | 83 | 3.2% |
| $10,000 to $14,999 | 55 | 2.1% |
| $15,000 to $24,999 | 218 | 8.4% |
| $25,000 to $34,999 | 231 | 8.9% |
| $35,000 to $49,999 | 242 | 9.3% |
| $50,000 to $74,999 | 632 | 24.3% |
| $75,000 to $99,999 | 473 | 18.2% |
| $100,000 to $149,999 | 312 | 12.0% |
| $150,000 to $199,999 | 250 | 9.6% |
| $200,000+ | 107 | 4.1% |
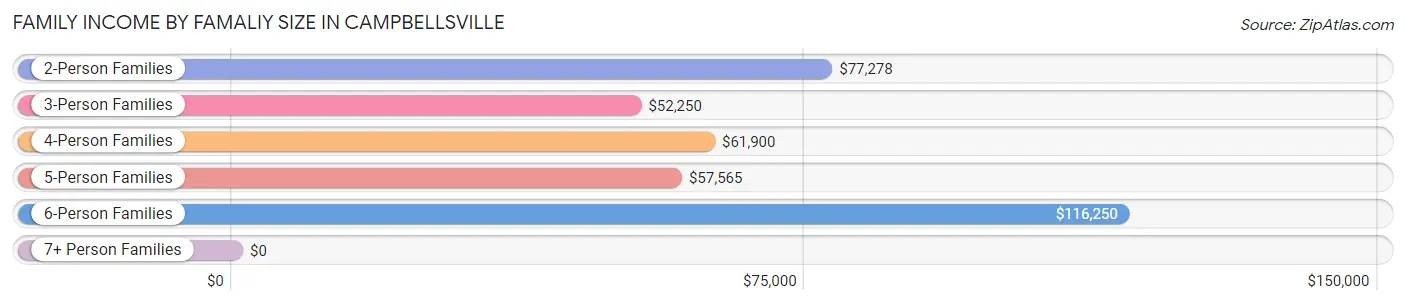
Family Income by Famaliy Size in Campbellsville
6-person families (84 | 3.2%) account for the highest median family income in Campbellsville with $116,250 per family, while 2-person families (1,562 | 60.1%) have the highest median income of $38,639 per family member.
| Income Bracket | # Families | Median Income |
| 2-Person Families | 1,562 (60.1%) | $77,278 |
| 3-Person Families | 438 (16.8%) | $52,250 |
| 4-Person Families | 378 (14.5%) | $61,900 |
| 5-Person Families | 139 (5.3%) | $57,565 |
| 6-Person Families | 84 (3.2%) | $116,250 |
| 7+ Person Families | 0 (0.0%) | $0 |
| Total | 2,601 (100.0%) | $67,037 |
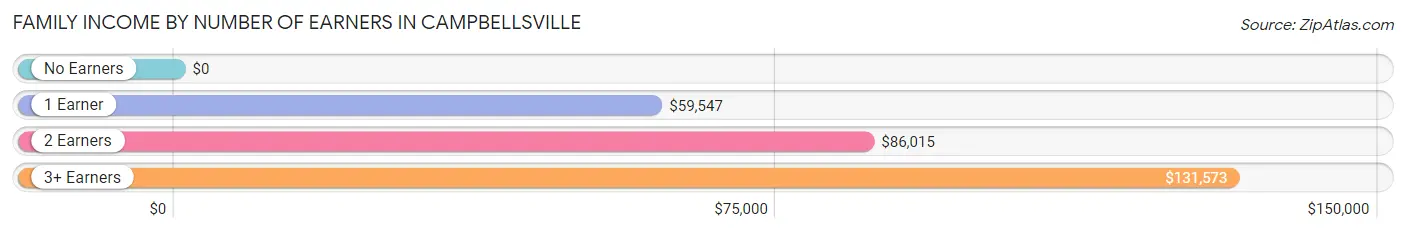
Family Income by Number of Earners in Campbellsville
| Number of Earners | # Families | Median Income |
| No Earners | 301 (11.6%) | $0 |
| 1 Earner | 1,233 (47.4%) | $59,547 |
| 2 Earners | 934 (35.9%) | $86,015 |
| 3+ Earners | 133 (5.1%) | $131,573 |
| Total | 2,601 (100.0%) | $67,037 |
Household Income in Campbellsville
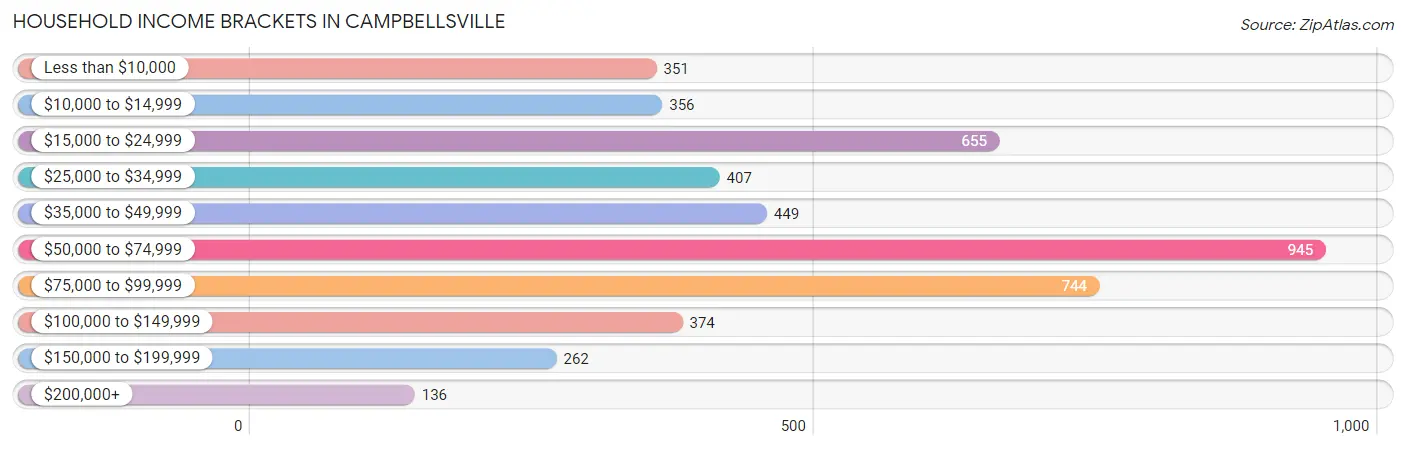
Household Income Brackets in Campbellsville
With 945 households falling in the category, the $50,000 to $74,999 income range is the most frequent in Campbellsville, accounting for 20.2% of all households. In contrast, only 136 households (2.9%) fall into the $200,000+ income bracket, making it the least populous group.
| Income Bracket | # Households | % Households |
| Less than $10,000 | 351 | 7.5% |
| $10,000 to $14,999 | 356 | 7.6% |
| $15,000 to $24,999 | 655 | 14.0% |
| $25,000 to $34,999 | 407 | 8.7% |
| $35,000 to $49,999 | 449 | 9.6% |
| $50,000 to $74,999 | 945 | 20.2% |
| $75,000 to $99,999 | 744 | 15.9% |
| $100,000 to $149,999 | 374 | 8.0% |
| $150,000 to $199,999 | 262 | 5.6% |
| $200,000+ | 136 | 2.9% |
Household Income by Householder Age in Campbellsville
The median household income in Campbellsville is $53,254, with the highest median household income of $67,668 found in the 65+ years age bracket for the primary householder. A total of 1,482 households (31.7%) fall into this category. Meanwhile, the 25 to 44 years age bracket for the primary householder has the lowest median household income of $42,371, with 1,149 households (24.6%) in this group.
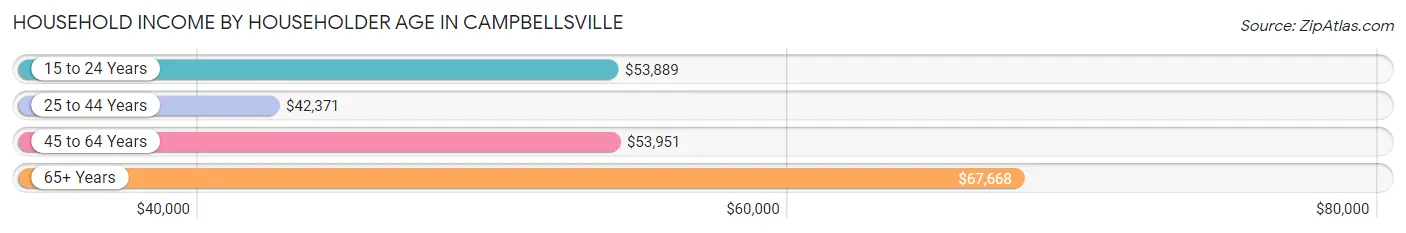
| Income Bracket | # Households | Median Income |
| 15 to 24 Years | 396 (8.5%) | $53,889 |
| 25 to 44 Years | 1,149 (24.6%) | $42,371 |
| 45 to 64 Years | 1,651 (35.3%) | $53,951 |
| 65+ Years | 1,482 (31.7%) | $67,668 |
| Total | 4,678 (100.0%) | $53,254 |
Poverty in Campbellsville
Income Below Poverty by Sex and Age in Campbellsville
With 14.9% poverty level for males and 25.7% for females among the residents of Campbellsville, 15 year old males and 6 to 11 year old females are the most vulnerable to poverty, with 48 males (100.0%) and 221 females (52.4%) in their respective age groups living below the poverty level.
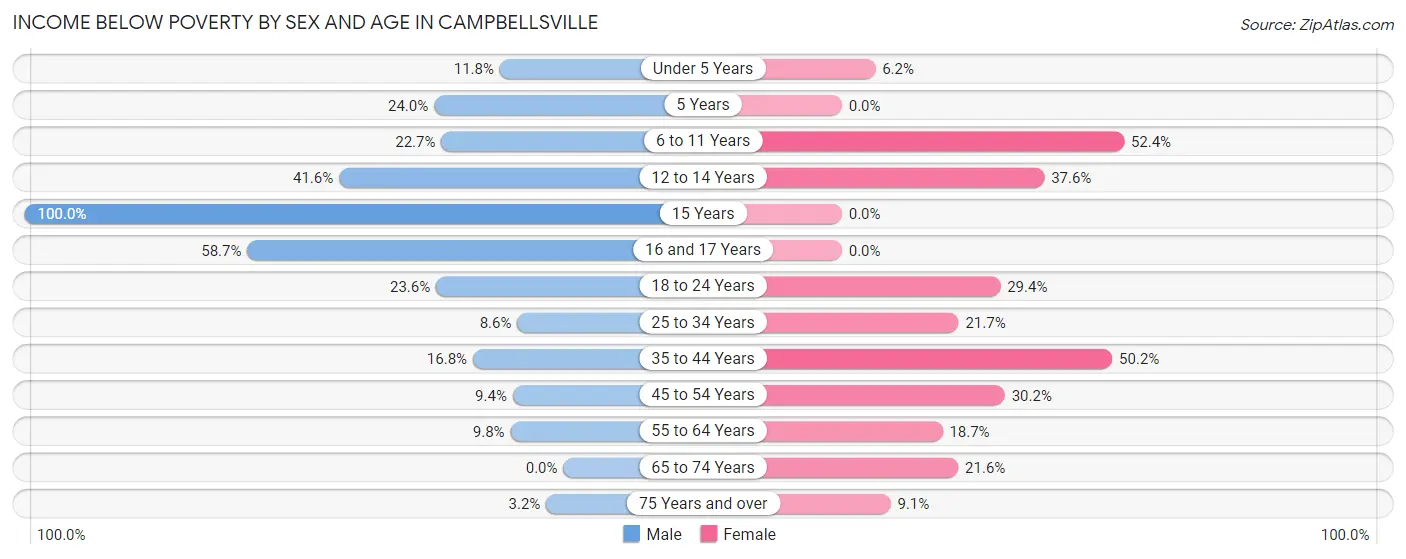
| Age Bracket | Male | Female |
| Under 5 Years | 54 (11.8%) | 21 (6.2%) |
| 5 Years | 18 (24.0%) | 0 (0.0%) |
| 6 to 11 Years | 89 (22.7%) | 221 (52.4%) |
| 12 to 14 Years | 107 (41.6%) | 68 (37.6%) |
| 15 Years | 48 (100.0%) | 0 (0.0%) |
| 16 and 17 Years | 44 (58.7%) | 0 (0.0%) |
| 18 to 24 Years | 129 (23.6%) | 150 (29.4%) |
| 25 to 34 Years | 52 (8.6%) | 164 (21.7%) |
| 35 to 44 Years | 69 (16.8%) | 273 (50.2%) |
| 45 to 54 Years | 40 (9.4%) | 153 (30.2%) |
| 55 to 64 Years | 69 (9.8%) | 147 (18.7%) |
| 65 to 74 Years | 0 (0.0%) | 146 (21.6%) |
| 75 Years and over | 9 (3.2%) | 59 (9.0%) |
| Total | 728 (14.9%) | 1,402 (25.7%) |
Income Above Poverty by Sex and Age in Campbellsville
According to the poverty statistics in Campbellsville, males aged 65 to 74 years and females aged 5 years are the age groups that are most secure financially, with 100.0% of males and 100.0% of females in these age groups living above the poverty line.
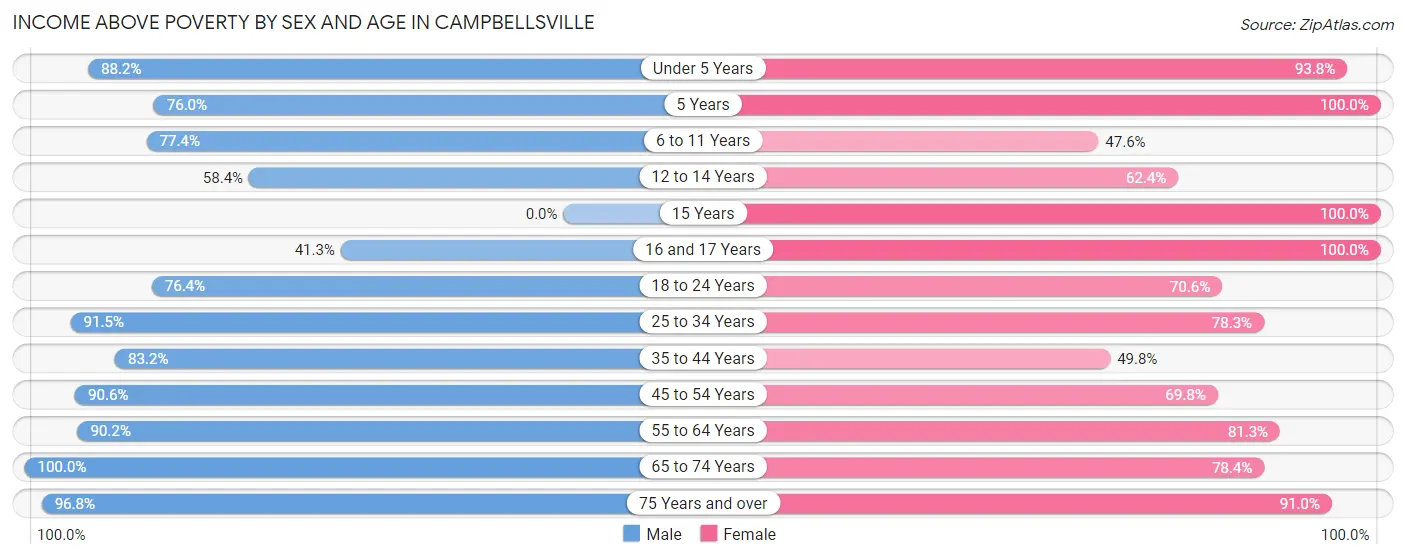
| Age Bracket | Male | Female |
| Under 5 Years | 404 (88.2%) | 317 (93.8%) |
| 5 Years | 57 (76.0%) | 9 (100.0%) |
| 6 to 11 Years | 304 (77.3%) | 201 (47.6%) |
| 12 to 14 Years | 150 (58.4%) | 113 (62.4%) |
| 15 Years | 0 (0.0%) | 50 (100.0%) |
| 16 and 17 Years | 31 (41.3%) | 17 (100.0%) |
| 18 to 24 Years | 417 (76.4%) | 360 (70.6%) |
| 25 to 34 Years | 556 (91.4%) | 593 (78.3%) |
| 35 to 44 Years | 342 (83.2%) | 271 (49.8%) |
| 45 to 54 Years | 386 (90.6%) | 353 (69.8%) |
| 55 to 64 Years | 634 (90.2%) | 640 (81.3%) |
| 65 to 74 Years | 611 (100.0%) | 530 (78.4%) |
| 75 Years and over | 274 (96.8%) | 593 (90.9%) |
| Total | 4,166 (85.1%) | 4,047 (74.3%) |
Income Below Poverty Among Married-Couple Families in Campbellsville
The poverty statistics for married-couple families in Campbellsville show that 3.7% or 59 of the total 1,598 families live below the poverty line. Families with 3 or 4 children have the highest poverty rate of 14.4%, comprising of 21 families. On the other hand, families with 1 or 2 children have the lowest poverty rate of 0.0%, which includes 0 families.
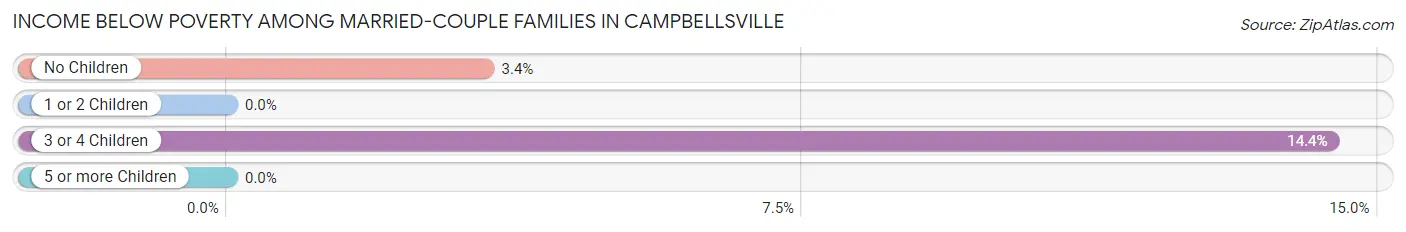
| Children | Above Poverty | Below Poverty |
| No Children | 1,098 (96.7%) | 38 (3.4%) |
| 1 or 2 Children | 316 (100.0%) | 0 (0.0%) |
| 3 or 4 Children | 125 (85.6%) | 21 (14.4%) |
| 5 or more Children | 0 (0.0%) | 0 (0.0%) |
| Total | 1,539 (96.3%) | 59 (3.7%) |
Income Below Poverty Among Single-Parent Households in Campbellsville
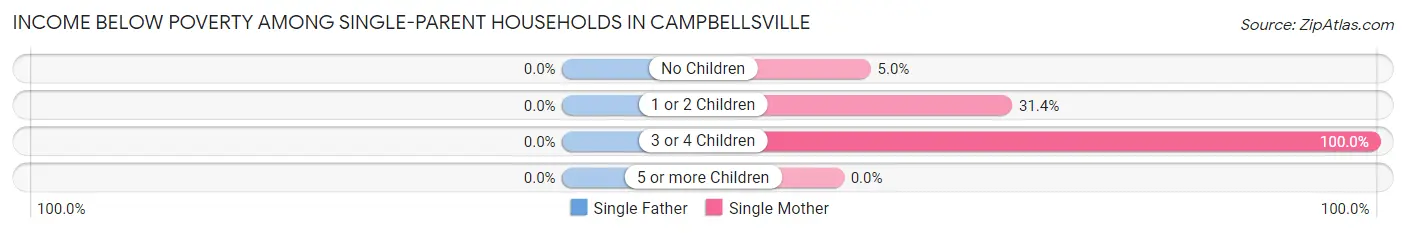
| Children | Single Father | Single Mother |
| No Children | 0 (0.0%) | 11 (5.0%) |
| 1 or 2 Children | 0 (0.0%) | 148 (31.4%) |
| 3 or 4 Children | 0 (0.0%) | 74 (100.0%) |
| 5 or more Children | 0 (0.0%) | 0 (0.0%) |
| Total | 0 (0.0%) | 233 (30.5%) |
Income Below Poverty Among Married-Couple vs Single-Parent Households in Campbellsville
The poverty data for Campbellsville shows that 59 of the married-couple family households (3.7%) and 233 of the single-parent households (23.2%) are living below the poverty level. Within the married-couple family households, those with 3 or 4 children have the highest poverty rate, with 21 households (14.4%) falling below the poverty line. Among the single-parent households, those with 3 or 4 children have the highest poverty rate, with 74 household (74.8%) living below poverty.
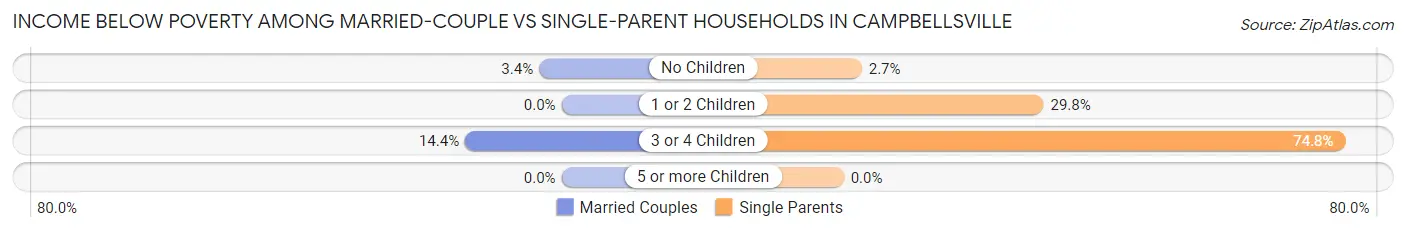
| Children | Married-Couple Families | Single-Parent Households |
| No Children | 38 (3.4%) | 11 (2.7%) |
| 1 or 2 Children | 0 (0.0%) | 148 (29.8%) |
| 3 or 4 Children | 21 (14.4%) | 74 (74.8%) |
| 5 or more Children | 0 (0.0%) | 0 (0.0%) |
| Total | 59 (3.7%) | 233 (23.2%) |
Race in Campbellsville
The most populous races in Campbellsville are White / Caucasian (9,627 | 84.2%), Black / African American (1,062 | 9.3%), and Two or more Races (597 | 5.2%).
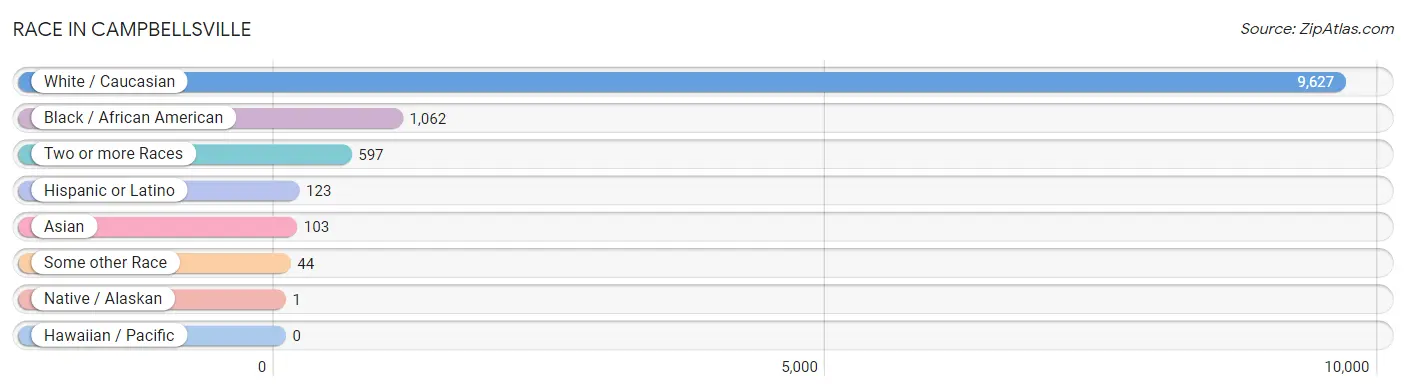
| Race | # Population | % Population |
| Asian | 103 | 0.9% |
| Black / African American | 1,062 | 9.3% |
| Hawaiian / Pacific | 0 | 0.0% |
| Hispanic or Latino | 123 | 1.1% |
| Native / Alaskan | 1 | 0.0% |
| White / Caucasian | 9,627 | 84.2% |
| Two or more Races | 597 | 5.2% |
| Some other Race | 44 | 0.4% |
| Total | 11,434 | 100.0% |
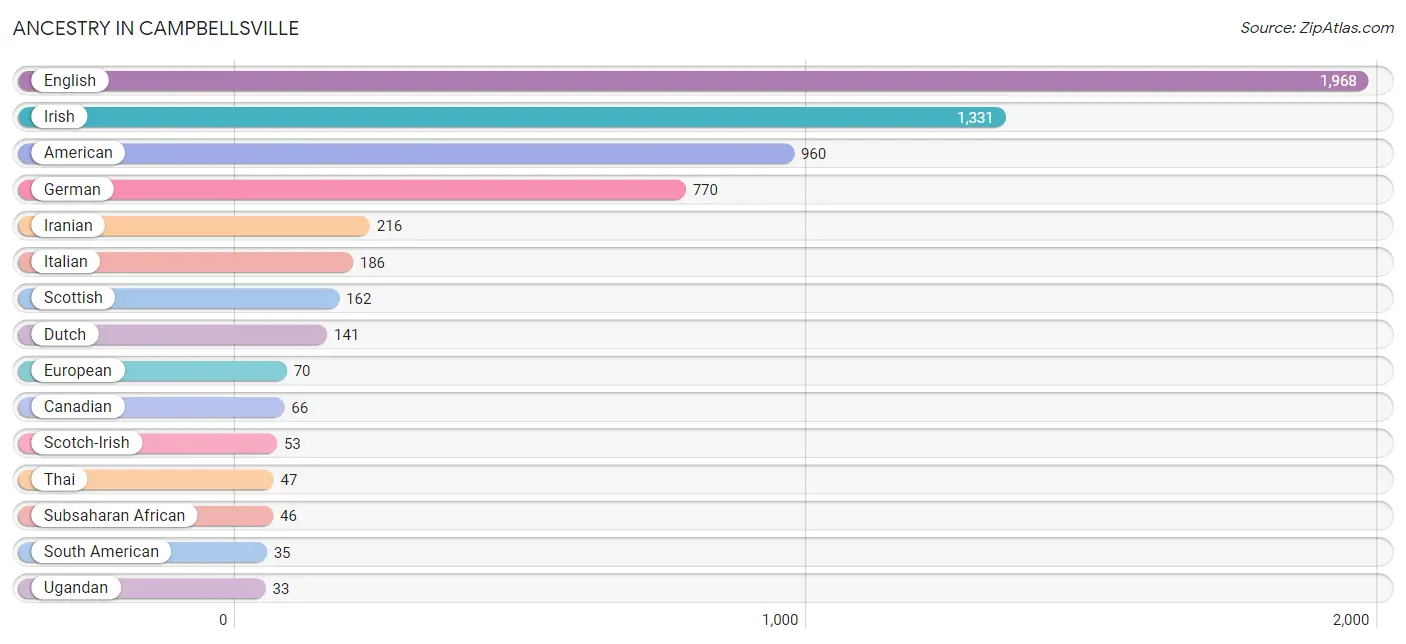
Ancestry in Campbellsville
The most populous ancestries reported in Campbellsville are English (1,968 | 17.2%), Irish (1,331 | 11.6%), American (960 | 8.4%), German (770 | 6.7%), and Iranian (216 | 1.9%), together accounting for 45.9% of all Campbellsville residents.
| Ancestry | # Population | % Population |
| African | 13 | 0.1% |
| American | 960 | 8.4% |
| British | 17 | 0.2% |
| Burmese | 10 | 0.1% |
| Canadian | 66 | 0.6% |
| Cherokee | 2 | 0.0% |
| Colombian | 3 | 0.0% |
| Croatian | 8 | 0.1% |
| Czech | 5 | 0.0% |
| Dutch | 141 | 1.2% |
| English | 1,968 | 17.2% |
| European | 70 | 0.6% |
| Finnish | 5 | 0.0% |
| French | 19 | 0.2% |
| German | 770 | 6.7% |
| Haitian | 7 | 0.1% |
| Hungarian | 28 | 0.2% |
| Indian (Asian) | 2 | 0.0% |
| Iranian | 216 | 1.9% |
| Irish | 1,331 | 11.6% |
| Italian | 186 | 1.6% |
| Korean | 24 | 0.2% |
| Mexican | 21 | 0.2% |
| Pakistani | 20 | 0.2% |
| Pennsylvania German | 31 | 0.3% |
| Polish | 27 | 0.2% |
| Russian | 10 | 0.1% |
| Scotch-Irish | 53 | 0.5% |
| Scottish | 162 | 1.4% |
| South American | 35 | 0.3% |
| Spaniard | 19 | 0.2% |
| Subsaharan African | 46 | 0.4% |
| Swedish | 5 | 0.0% |
| Thai | 47 | 0.4% |
| Ugandan | 33 | 0.3% |
| Ukrainian | 19 | 0.2% |
| Venezuelan | 32 | 0.3% | View All 37 Rows |
Immigrants in Campbellsville
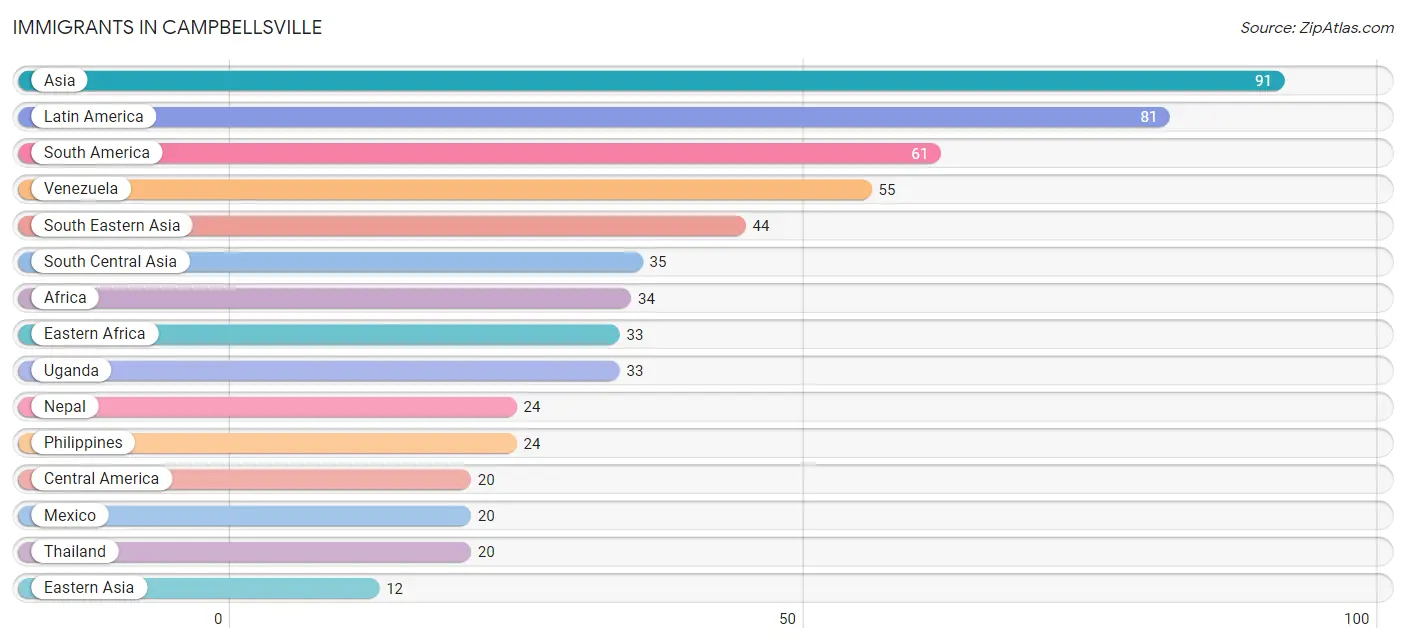
The most numerous immigrant groups reported in Campbellsville came from Asia (91 | 0.8%), Latin America (81 | 0.7%), South America (61 | 0.5%), Venezuela (55 | 0.5%), and South Eastern Asia (44 | 0.4%), together accounting for 2.9% of all Campbellsville residents.
| Immigration Origin | # Population | % Population |
| Africa | 34 | 0.3% |
| Asia | 91 | 0.8% |
| Central America | 20 | 0.2% |
| China | 2 | 0.0% |
| Colombia | 6 | 0.1% |
| Eastern Africa | 33 | 0.3% |
| Eastern Asia | 12 | 0.1% |
| Eastern Europe | 2 | 0.0% |
| Europe | 2 | 0.0% |
| Hong Kong | 2 | 0.0% |
| India | 7 | 0.1% |
| Iran | 4 | 0.0% |
| Korea | 10 | 0.1% |
| Latin America | 81 | 0.7% |
| Mexico | 20 | 0.2% |
| Nepal | 24 | 0.2% |
| Nigeria | 1 | 0.0% |
| Philippines | 24 | 0.2% |
| Russia | 2 | 0.0% |
| South America | 61 | 0.5% |
| South Central Asia | 35 | 0.3% |
| South Eastern Asia | 44 | 0.4% |
| Thailand | 20 | 0.2% |
| Uganda | 33 | 0.3% |
| Venezuela | 55 | 0.5% |
| Western Africa | 1 | 0.0% | View All 26 Rows |
Sex and Age in Campbellsville
Sex and Age in Campbellsville
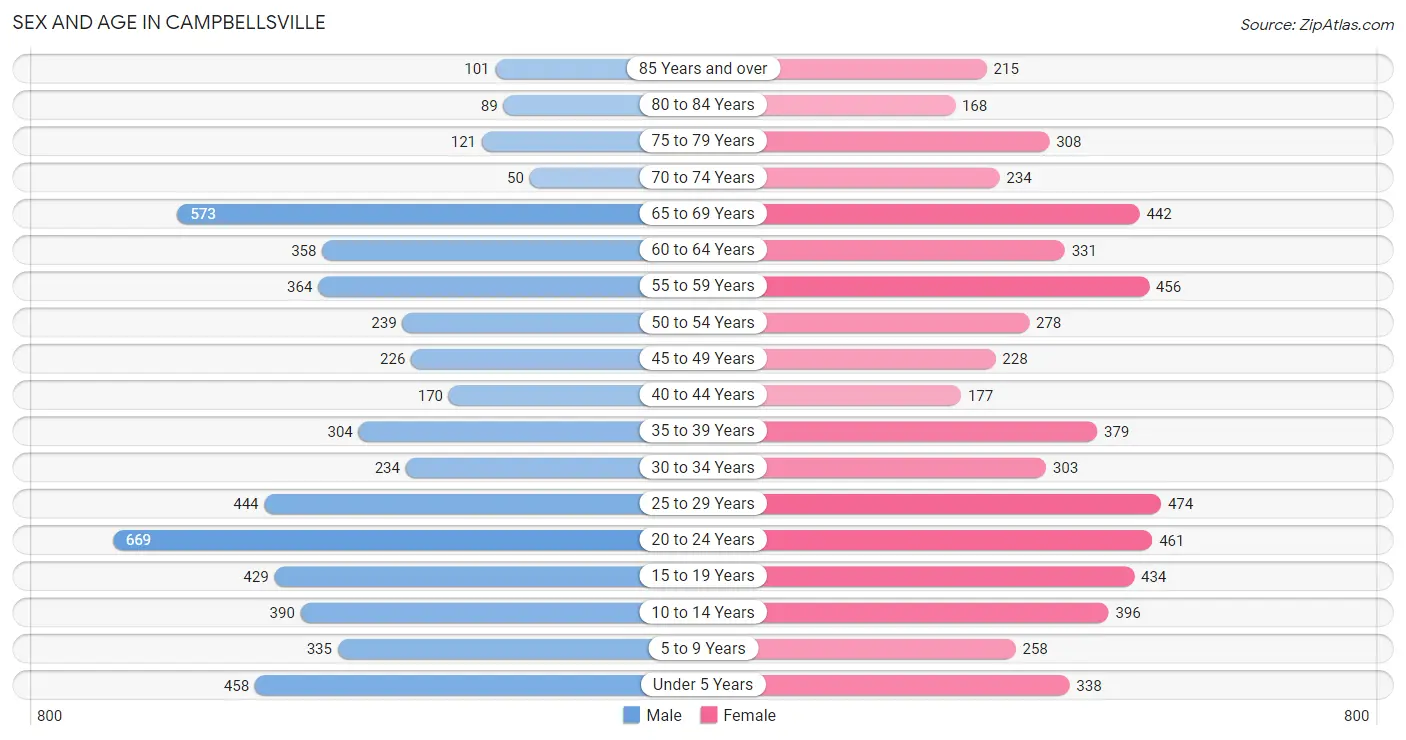
The most populous age groups in Campbellsville are 20 to 24 Years (669 | 12.0%) for men and 25 to 29 Years (474 | 8.1%) for women.
| Age Bracket | Male | Female |
| Under 5 Years | 458 (8.3%) | 338 (5.8%) |
| 5 to 9 Years | 335 (6.0%) | 258 (4.4%) |
| 10 to 14 Years | 390 (7.0%) | 396 (6.7%) |
| 15 to 19 Years | 429 (7.7%) | 434 (7.4%) |
| 20 to 24 Years | 669 (12.0%) | 461 (7.8%) |
| 25 to 29 Years | 444 (8.0%) | 474 (8.1%) |
| 30 to 34 Years | 234 (4.2%) | 303 (5.1%) |
| 35 to 39 Years | 304 (5.5%) | 379 (6.5%) |
| 40 to 44 Years | 170 (3.1%) | 177 (3.0%) |
| 45 to 49 Years | 226 (4.1%) | 228 (3.9%) |
| 50 to 54 Years | 239 (4.3%) | 278 (4.7%) |
| 55 to 59 Years | 364 (6.6%) | 456 (7.8%) |
| 60 to 64 Years | 358 (6.5%) | 331 (5.6%) |
| 65 to 69 Years | 573 (10.3%) | 442 (7.5%) |
| 70 to 74 Years | 50 (0.9%) | 234 (4.0%) |
| 75 to 79 Years | 121 (2.2%) | 308 (5.2%) |
| 80 to 84 Years | 89 (1.6%) | 168 (2.9%) |
| 85 Years and over | 101 (1.8%) | 215 (3.7%) |
| Total | 5,554 (100.0%) | 5,880 (100.0%) |
Families and Households in Campbellsville
Median Family Size in Campbellsville
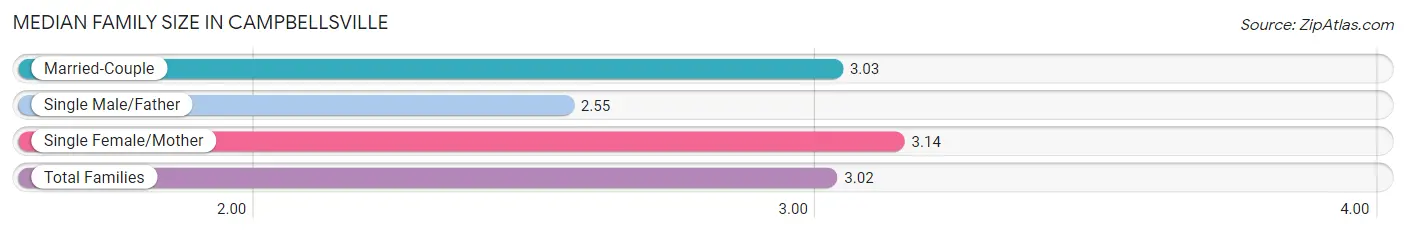
The median family size in Campbellsville is 3.02 persons per family, with single female/mother families (765 | 29.4%) accounting for the largest median family size of 3.14 persons per family. On the other hand, single male/father families (238 | 9.1%) represent the smallest median family size with 2.55 persons per family.
| Family Type | # Families | Family Size |
| Married-Couple | 1,598 (61.4%) | 3.03 |
| Single Male/Father | 238 (9.1%) | 2.55 |
| Single Female/Mother | 765 (29.4%) | 3.14 |
| Total Families | 2,601 (100.0%) | 3.02 |
Median Household Size in Campbellsville
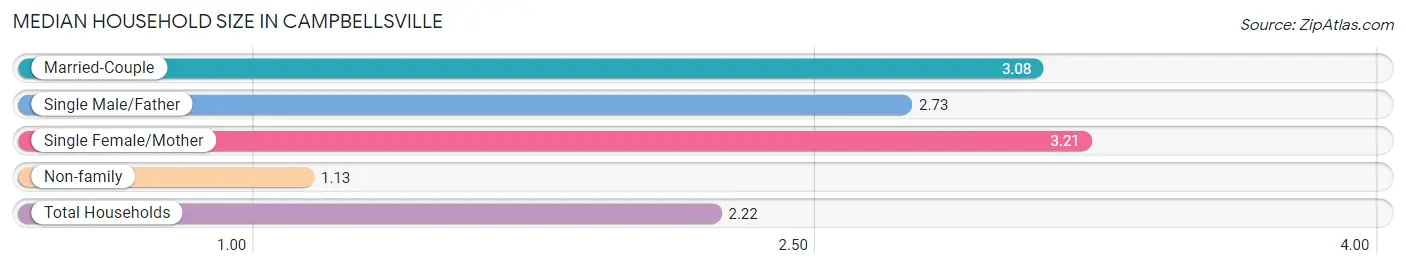
The median household size in Campbellsville is 2.22 persons per household, with single female/mother households (765 | 16.4%) accounting for the largest median household size of 3.21 persons per household. non-family households (2,077 | 44.4%) represent the smallest median household size with 1.13 persons per household.
| Household Type | # Households | Household Size |
| Married-Couple | 1,598 (34.2%) | 3.08 |
| Single Male/Father | 238 (5.1%) | 2.73 |
| Single Female/Mother | 765 (16.4%) | 3.21 |
| Non-family | 2,077 (44.4%) | 1.13 |
| Total Households | 4,678 (100.0%) | 2.22 |
Household Size by Marriage Status in Campbellsville
Out of a total of 4,678 households in Campbellsville, 2,601 (55.6%) are family households, while 2,077 (44.4%) are nonfamily households. The most numerous type of family households are 2-person households, comprising 1,517, and the most common type of nonfamily households are 1-person households, comprising 1,851.
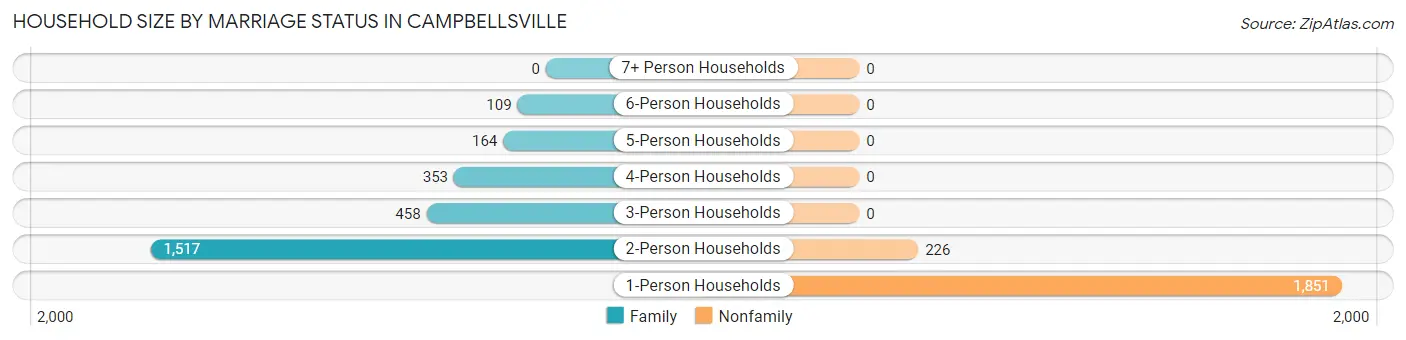
| Household Size | Family Households | Nonfamily Households |
| 1-Person Households | - | 1,851 (39.6%) |
| 2-Person Households | 1,517 (32.4%) | 226 (4.8%) |
| 3-Person Households | 458 (9.8%) | 0 (0.0%) |
| 4-Person Households | 353 (7.5%) | 0 (0.0%) |
| 5-Person Households | 164 (3.5%) | 0 (0.0%) |
| 6-Person Households | 109 (2.3%) | 0 (0.0%) |
| 7+ Person Households | 0 (0.0%) | 0 (0.0%) |
| Total | 2,601 (55.6%) | 2,077 (44.4%) |
Female Fertility in Campbellsville
Fertility by Age in Campbellsville
Average fertility rate in Campbellsville is 52.0 births per 1,000 women. Women in the age bracket of 20 to 34 years have the highest fertility rate with 91.0 births per 1,000 women. Women in the age bracket of 20 to 34 years acount for 84.3% of all women with births.
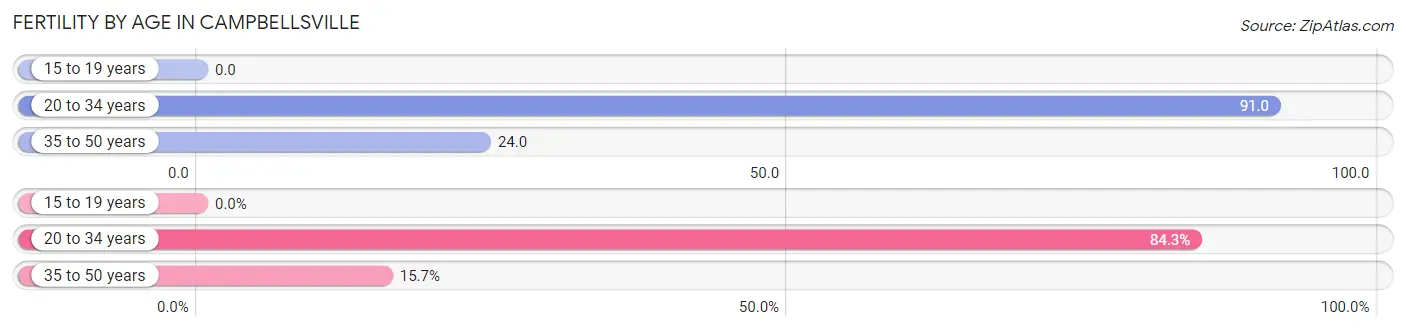
| Age Bracket | Women with Births | Births / 1,000 Women |
| 15 to 19 years | 0 (0.0%) | 0.0 |
| 20 to 34 years | 113 (84.3%) | 91.0 |
| 35 to 50 years | 21 (15.7%) | 24.0 |
| Total | 134 (100.0%) | 52.0 |
Fertility by Age by Marriage Status in Campbellsville
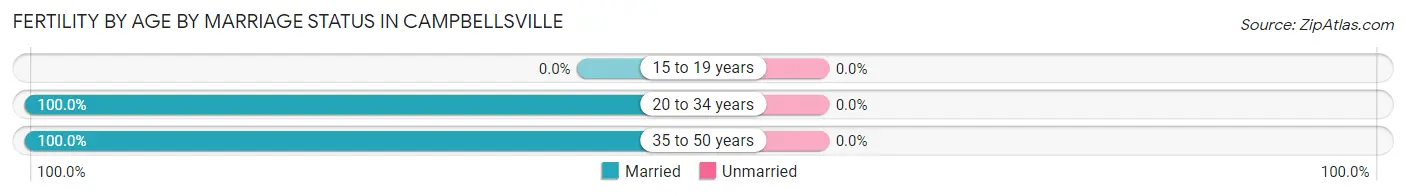
| Age Bracket | Married | Unmarried |
| 15 to 19 years | 0 (0.0%) | 0 (0.0%) |
| 20 to 34 years | 113 (100.0%) | 0 (0.0%) |
| 35 to 50 years | 21 (100.0%) | 0 (0.0%) |
| Total | 134 (100.0%) | 0 (0.0%) |
Fertility by Education in Campbellsville
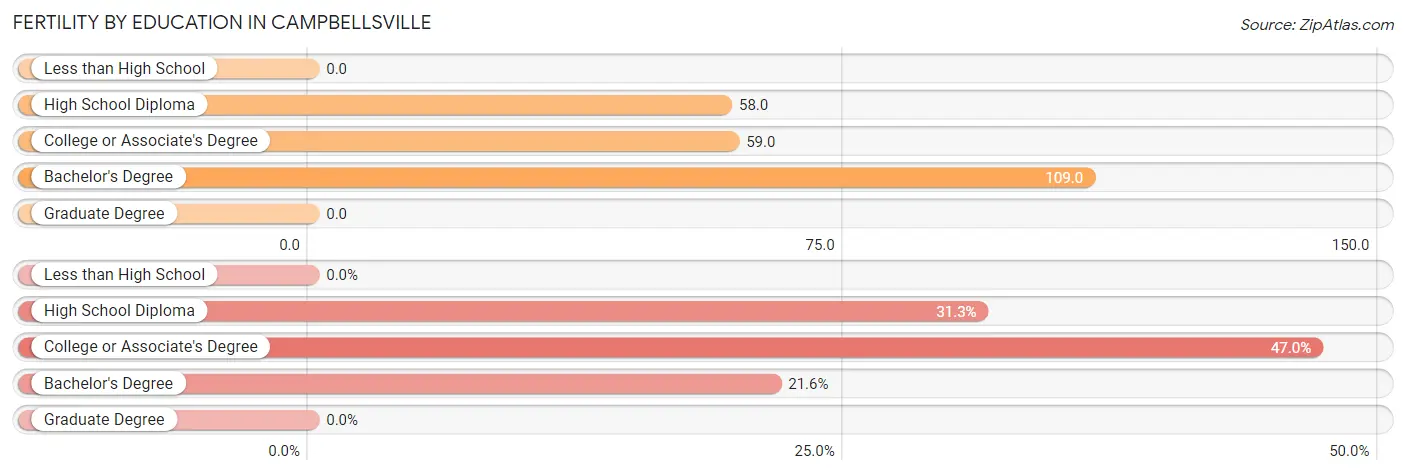
| Educational Attainment | Women with Births | Births / 1,000 Women |
| Less than High School | 0 (0.0%) | 0.0 |
| High School Diploma | 42 (31.3%) | 58.0 |
| College or Associate's Degree | 63 (47.0%) | 59.0 |
| Bachelor's Degree | 29 (21.6%) | 109.0 |
| Graduate Degree | 0 (0.0%) | 0.0 |
| Total | 134 (100.0%) | 52.0 |
Fertility by Education by Marriage Status in Campbellsville
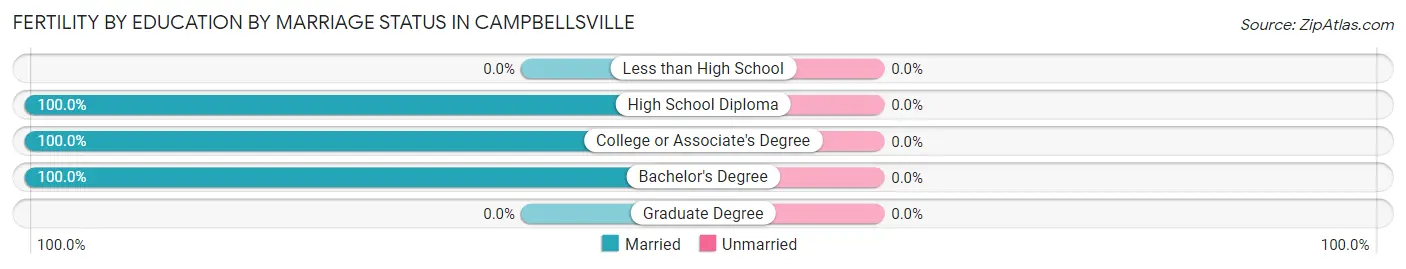
| Educational Attainment | Married | Unmarried |
| Less than High School | 0 (0.0%) | 0 (0.0%) |
| High School Diploma | 42 (100.0%) | 0 (0.0%) |
| College or Associate's Degree | 63 (100.0%) | 0 (0.0%) |
| Bachelor's Degree | 29 (100.0%) | 0 (0.0%) |
| Graduate Degree | 0 (0.0%) | 0 (0.0%) |
| Total | 134 (100.0%) | 0 (0.0%) |
Employment Characteristics in Campbellsville
Employment by Class of Employer in Campbellsville
Among the 4,439 employed individuals in Campbellsville, private company employees (3,085 | 69.5%), not-for-profit organizations (661 | 14.9%), and state government employees (249 | 5.6%) make up the most common classes of employment.
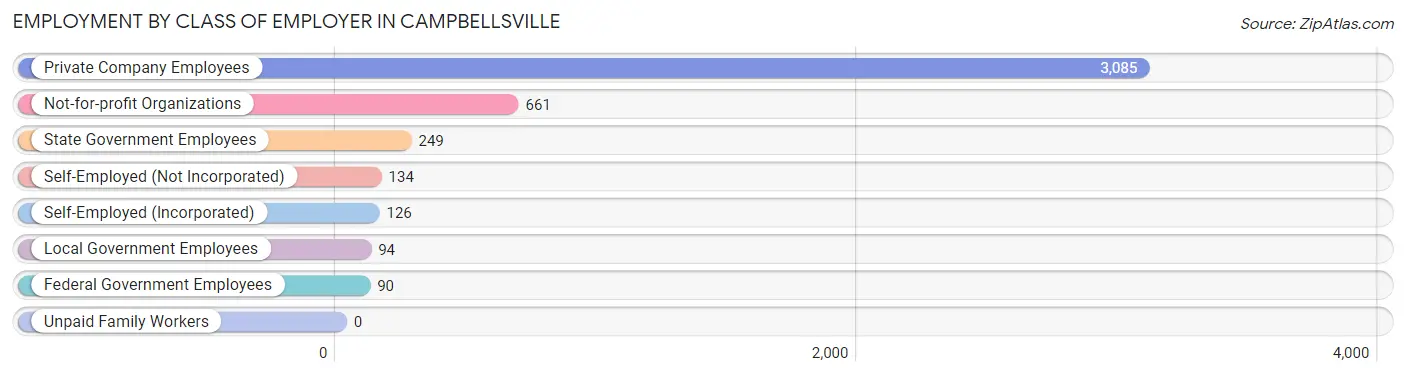
| Employer Class | # Employees | % Employees |
| Private Company Employees | 3,085 | 69.5% |
| Self-Employed (Incorporated) | 126 | 2.8% |
| Self-Employed (Not Incorporated) | 134 | 3.0% |
| Not-for-profit Organizations | 661 | 14.9% |
| Local Government Employees | 94 | 2.1% |
| State Government Employees | 249 | 5.6% |
| Federal Government Employees | 90 | 2.0% |
| Unpaid Family Workers | 0 | 0.0% |
| Total | 4,439 | 100.0% |
Employment Status by Age in Campbellsville
According to the labor force statistics for Campbellsville, out of the total population over 16 years of age (9,161), 56.5% or 5,176 individuals are in the labor force, with 8.1% or 419 of them unemployed. The age group with the highest labor force participation rate is 20 to 24 years, with 84.2% or 951 individuals in the labor force. Within the labor force, the 16 to 19 years age range has the highest percentage of unemployed individuals, with 20.8% or 80 of them being unemployed.
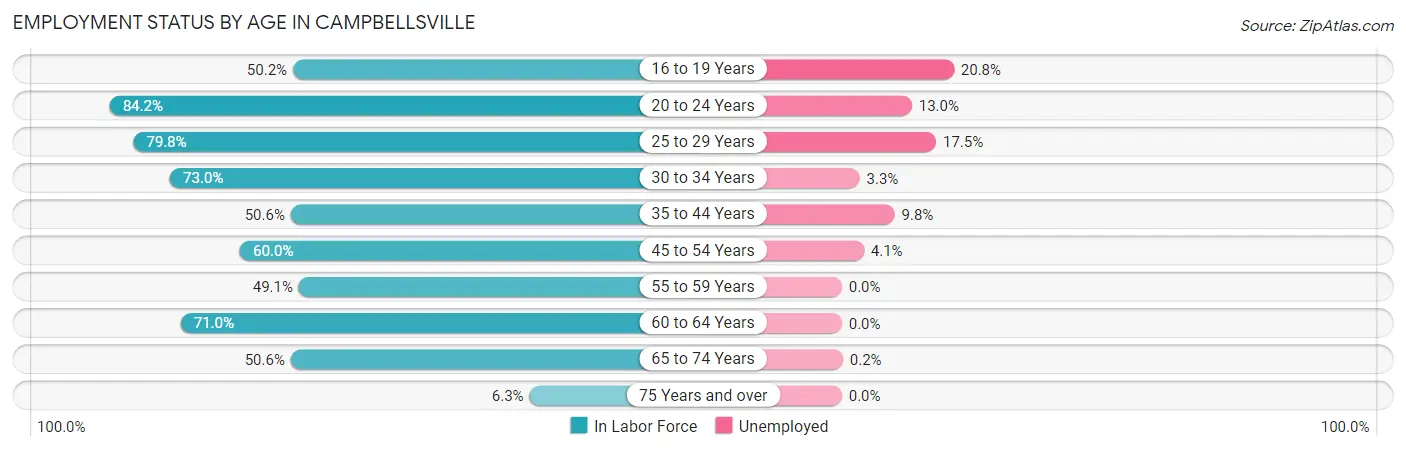
| Age Bracket | In Labor Force | Unemployed |
| 16 to 19 Years | 384 (50.2%) | 80 (20.8%) |
| 20 to 24 Years | 951 (84.2%) | 124 (13.0%) |
| 25 to 29 Years | 733 (79.8%) | 128 (17.5%) |
| 30 to 34 Years | 392 (73.0%) | 13 (3.3%) |
| 35 to 44 Years | 521 (50.6%) | 51 (9.8%) |
| 45 to 54 Years | 583 (60.0%) | 24 (4.1%) |
| 55 to 59 Years | 403 (49.1%) | 0 (0.0%) |
| 60 to 64 Years | 489 (71.0%) | 0 (0.0%) |
| 65 to 74 Years | 657 (50.6%) | 1 (0.2%) |
| 75 Years and over | 63 (6.3%) | 0 (0.0%) |
| Total | 5,176 (56.5%) | 419 (8.1%) |
Employment Status by Educational Attainment in Campbellsville
According to labor force statistics for Campbellsville, 62.9% of individuals (3,123) out of the total population between 25 and 64 years of age (4,965) are in the labor force, with 6.9% or 215 of them being unemployed. The group with the highest labor force participation rate are those with the educational attainment of bachelor's degree or higher, with 87.3% or 971 individuals in the labor force. Within the labor force, individuals with less than high school education have the highest percentage of unemployment, with 36.1% or 95 of them being unemployed.
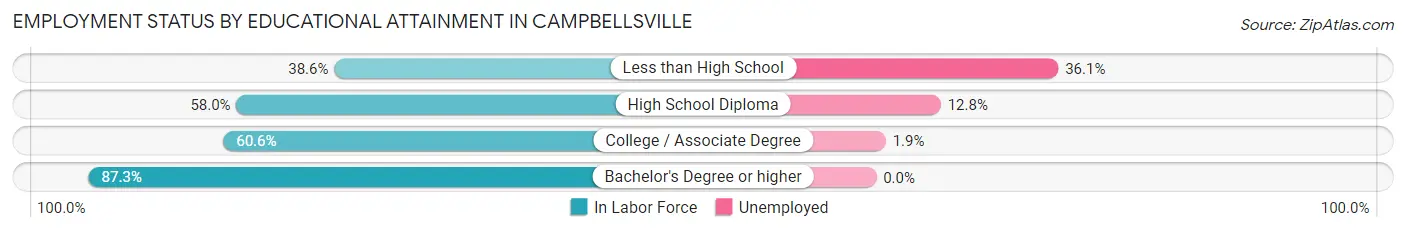
| Educational Attainment | In Labor Force | Unemployed |
| Less than High School | 263 (38.6%) | 246 (36.1%) |
| High School Diploma | 780 (58.0%) | 172 (12.8%) |
| College / Associate Degree | 1,108 (60.6%) | 35 (1.9%) |
| Bachelor's Degree or higher | 971 (87.3%) | 0 (0.0%) |
| Total | 3,123 (62.9%) | 343 (6.9%) |
Employment Occupations by Sex in Campbellsville
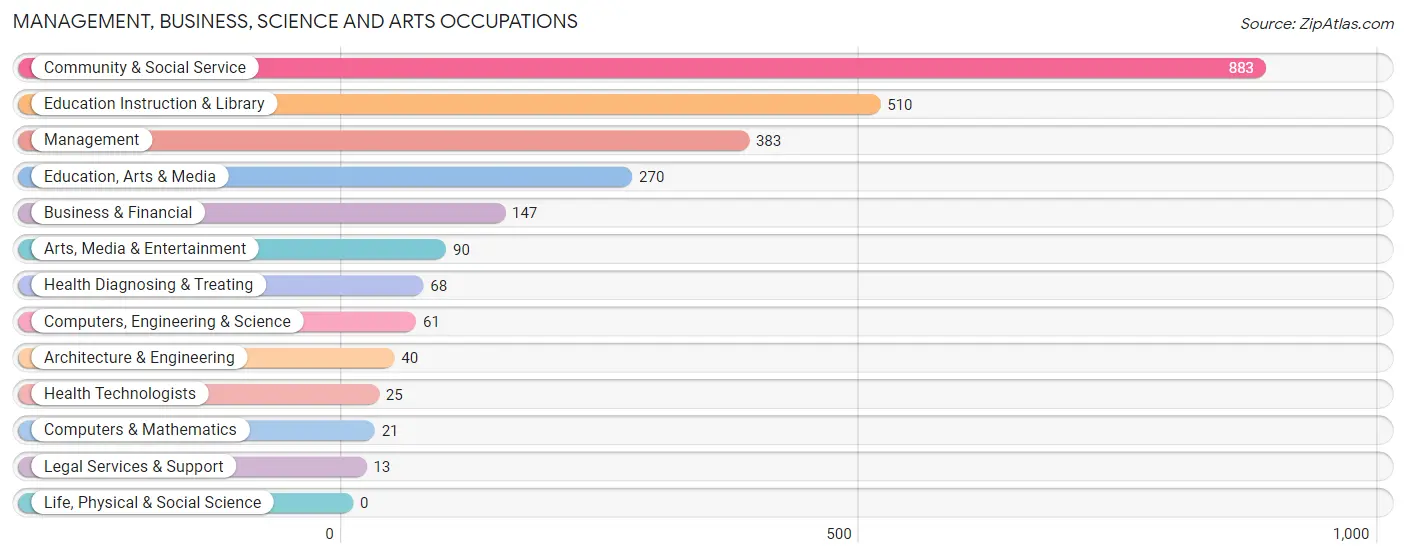
Management, Business, Science and Arts Occupations
The most common Management, Business, Science and Arts occupations in Campbellsville are Community & Social Service (883 | 18.6%), Education Instruction & Library (510 | 10.7%), Management (383 | 8.1%), Education, Arts & Media (270 | 5.7%), and Business & Financial (147 | 3.1%).
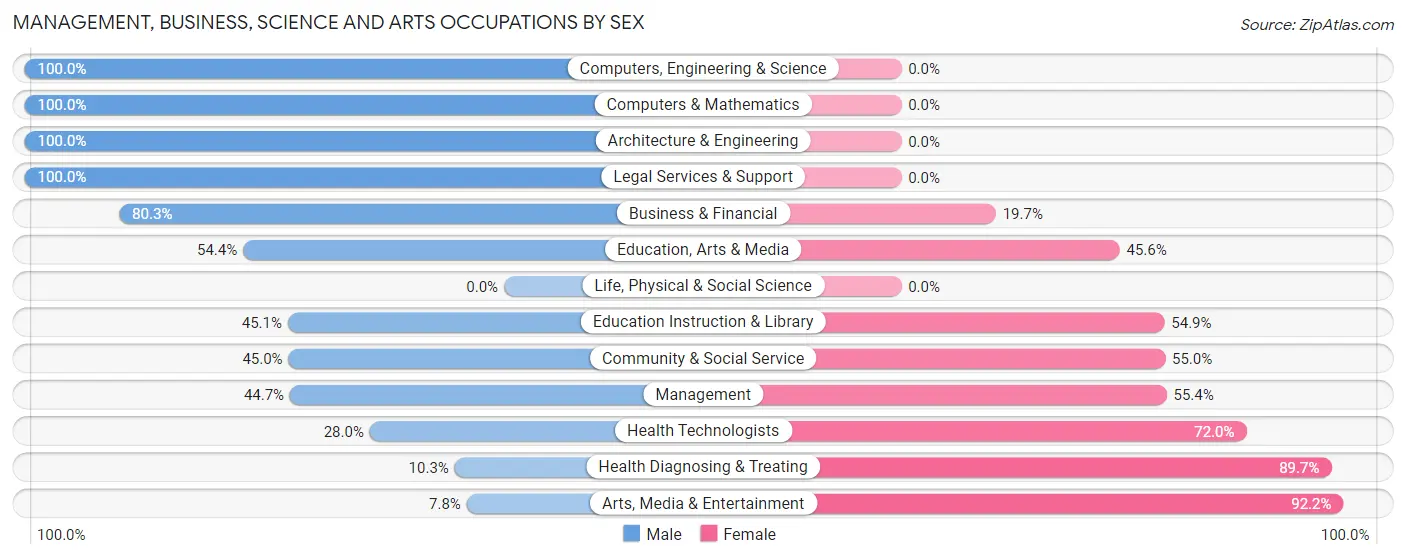
Management, Business, Science and Arts Occupations by Sex
Within the Management, Business, Science and Arts occupations in Campbellsville, the most male-oriented occupations are Computers, Engineering & Science (100.0%), Computers & Mathematics (100.0%), and Architecture & Engineering (100.0%), while the most female-oriented occupations are Arts, Media & Entertainment (92.2%), Health Diagnosing & Treating (89.7%), and Health Technologists (72.0%).
| Occupation | Male | Female |
| Management | 171 (44.7%) | 212 (55.3%) |
| Business & Financial | 118 (80.3%) | 29 (19.7%) |
| Computers, Engineering & Science | 61 (100.0%) | 0 (0.0%) |
| Computers & Mathematics | 21 (100.0%) | 0 (0.0%) |
| Architecture & Engineering | 40 (100.0%) | 0 (0.0%) |
| Life, Physical & Social Science | 0 (0.0%) | 0 (0.0%) |
| Community & Social Service | 397 (45.0%) | 486 (55.0%) |
| Education, Arts & Media | 147 (54.4%) | 123 (45.6%) |
| Legal Services & Support | 13 (100.0%) | 0 (0.0%) |
| Education Instruction & Library | 230 (45.1%) | 280 (54.9%) |
| Arts, Media & Entertainment | 7 (7.8%) | 83 (92.2%) |
| Health Diagnosing & Treating | 7 (10.3%) | 61 (89.7%) |
| Health Technologists | 7 (28.0%) | 18 (72.0%) |
| Total (Category) | 754 (48.9%) | 788 (51.1%) |
| Total (Overall) | 2,707 (56.9%) | 2,048 (43.1%) |
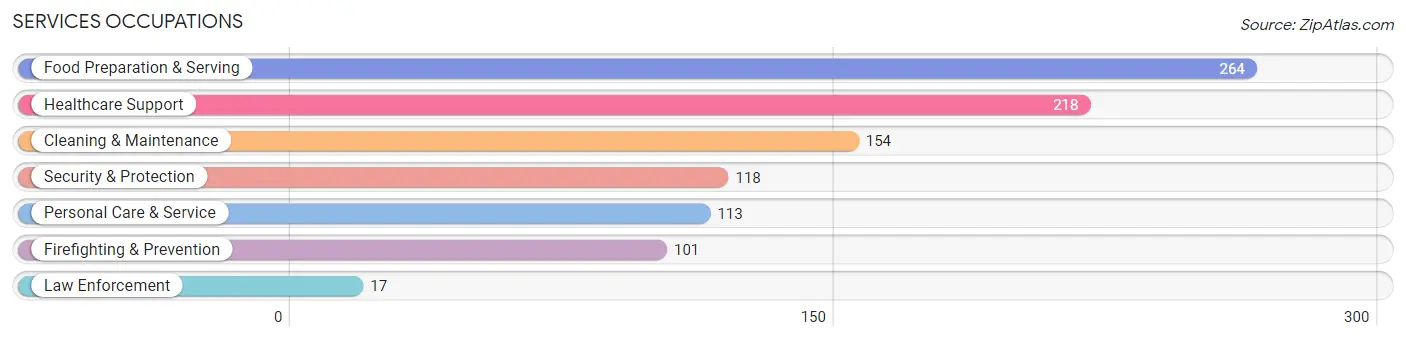
Services Occupations
The most common Services occupations in Campbellsville are Food Preparation & Serving (264 | 5.6%), Healthcare Support (218 | 4.6%), Cleaning & Maintenance (154 | 3.2%), Security & Protection (118 | 2.5%), and Personal Care & Service (113 | 2.4%).
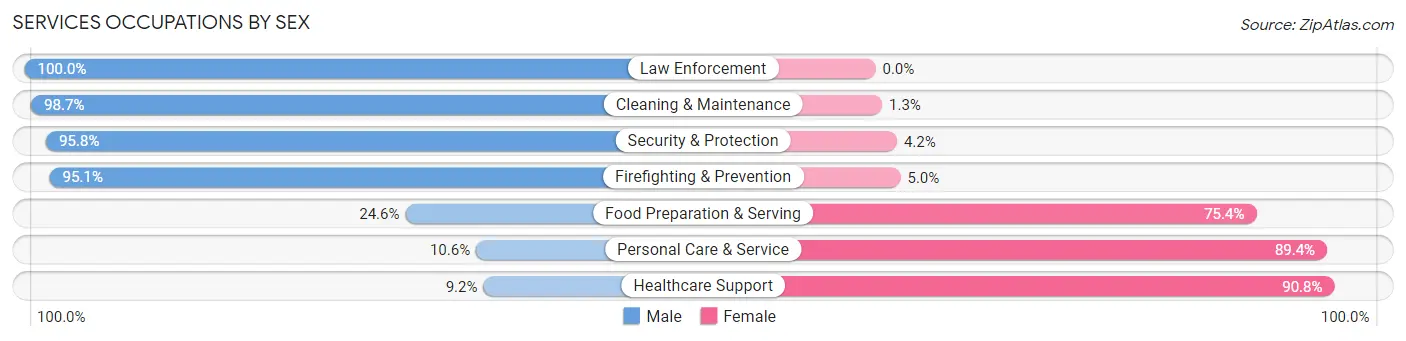
Services Occupations by Sex
Within the Services occupations in Campbellsville, the most male-oriented occupations are Law Enforcement (100.0%), Cleaning & Maintenance (98.7%), and Security & Protection (95.8%), while the most female-oriented occupations are Healthcare Support (90.8%), Personal Care & Service (89.4%), and Food Preparation & Serving (75.4%).
| Occupation | Male | Female |
| Healthcare Support | 20 (9.2%) | 198 (90.8%) |
| Security & Protection | 113 (95.8%) | 5 (4.2%) |
| Firefighting & Prevention | 96 (95.1%) | 5 (5.0%) |
| Law Enforcement | 17 (100.0%) | 0 (0.0%) |
| Food Preparation & Serving | 65 (24.6%) | 199 (75.4%) |
| Cleaning & Maintenance | 152 (98.7%) | 2 (1.3%) |
| Personal Care & Service | 12 (10.6%) | 101 (89.4%) |
| Total (Category) | 362 (41.7%) | 505 (58.3%) |
| Total (Overall) | 2,707 (56.9%) | 2,048 (43.1%) |
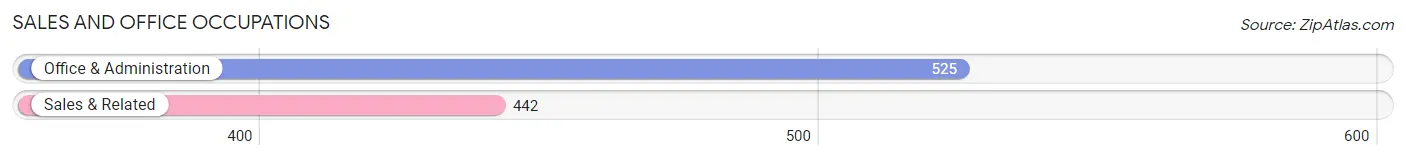
Sales and Office Occupations
The most common Sales and Office occupations in Campbellsville are Office & Administration (525 | 11.0%), and Sales & Related (442 | 9.3%).
Sales and Office Occupations by Sex
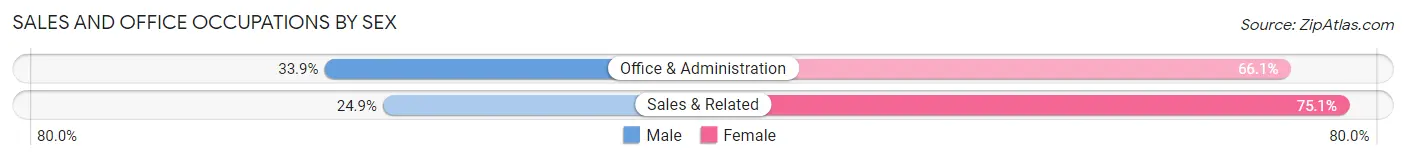
| Occupation | Male | Female |
| Sales & Related | 110 (24.9%) | 332 (75.1%) |
| Office & Administration | 178 (33.9%) | 347 (66.1%) |
| Total (Category) | 288 (29.8%) | 679 (70.2%) |
| Total (Overall) | 2,707 (56.9%) | 2,048 (43.1%) |
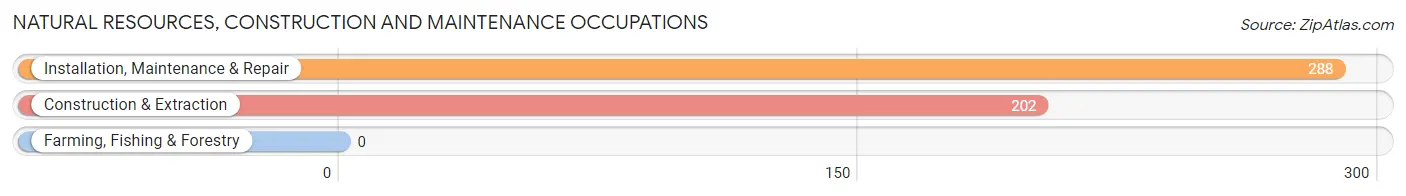
Natural Resources, Construction and Maintenance Occupations
The most common Natural Resources, Construction and Maintenance occupations in Campbellsville are Installation, Maintenance & Repair (288 | 6.1%), and Construction & Extraction (202 | 4.3%).
Natural Resources, Construction and Maintenance Occupations by Sex
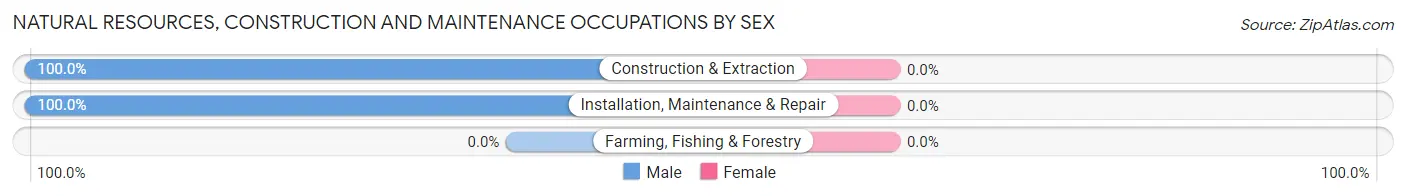
| Occupation | Male | Female |
| Farming, Fishing & Forestry | 0 (0.0%) | 0 (0.0%) |
| Construction & Extraction | 202 (100.0%) | 0 (0.0%) |
| Installation, Maintenance & Repair | 288 (100.0%) | 0 (0.0%) |
| Total (Category) | 490 (100.0%) | 0 (0.0%) |
| Total (Overall) | 2,707 (56.9%) | 2,048 (43.1%) |
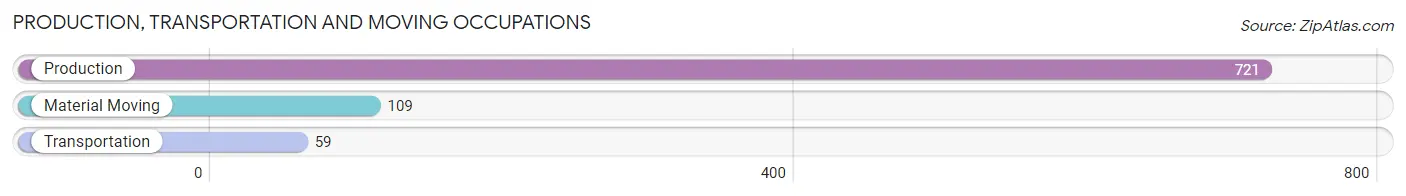
Production, Transportation and Moving Occupations
The most common Production, Transportation and Moving occupations in Campbellsville are Production (721 | 15.2%), Material Moving (109 | 2.3%), and Transportation (59 | 1.2%).
Production, Transportation and Moving Occupations by Sex
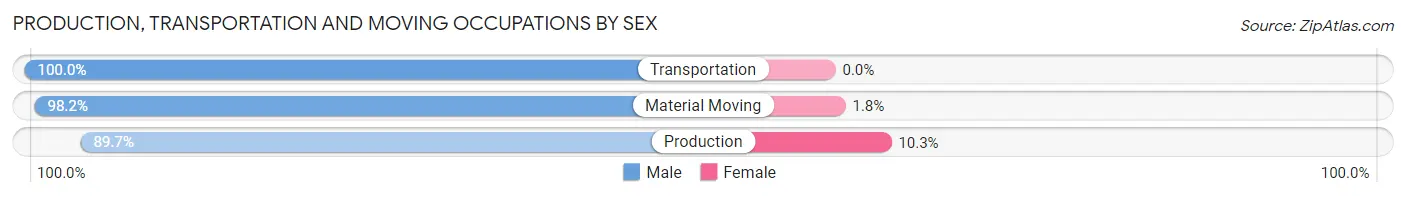
| Occupation | Male | Female |
| Production | 647 (89.7%) | 74 (10.3%) |
| Transportation | 59 (100.0%) | 0 (0.0%) |
| Material Moving | 107 (98.2%) | 2 (1.8%) |
| Total (Category) | 813 (91.4%) | 76 (8.6%) |
| Total (Overall) | 2,707 (56.9%) | 2,048 (43.1%) |
Employment Industries by Sex in Campbellsville
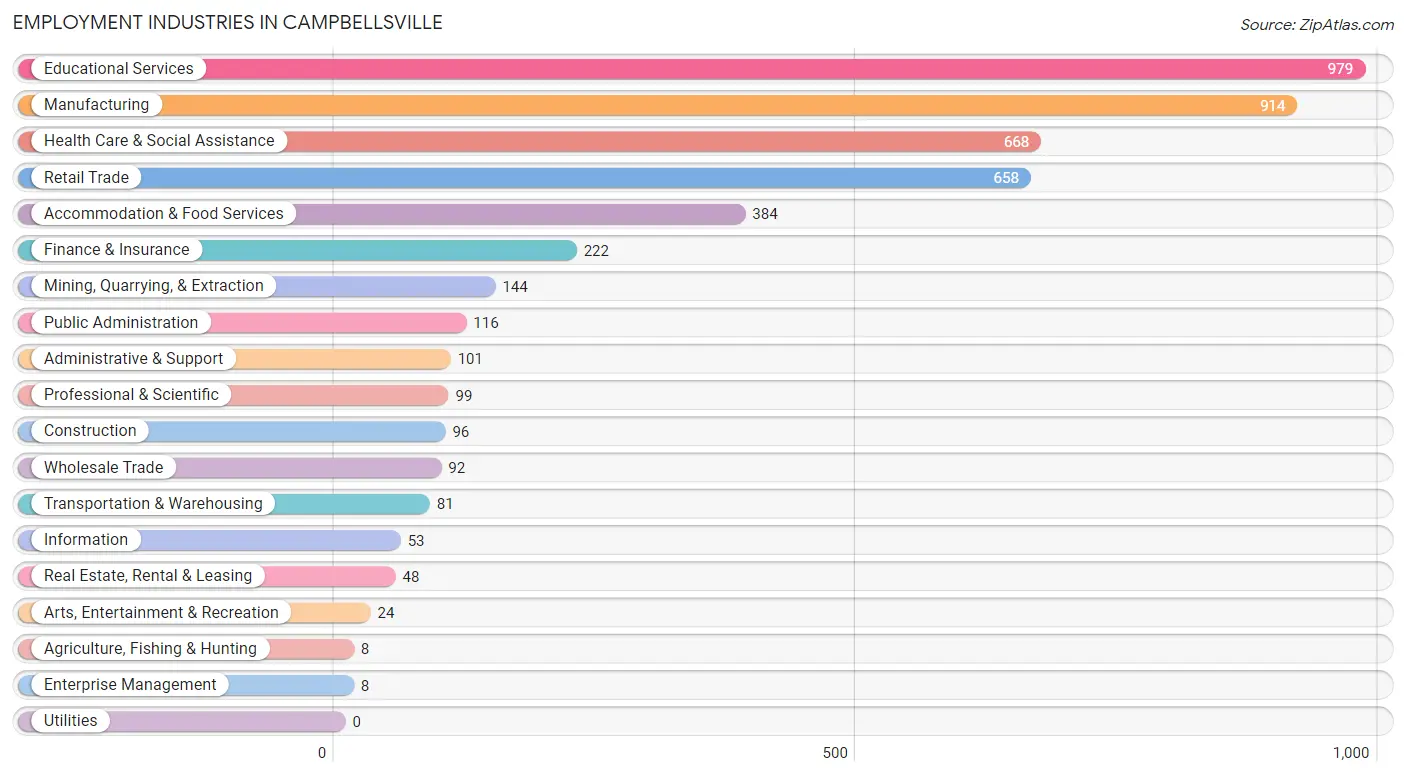
Employment Industries in Campbellsville
The major employment industries in Campbellsville include Educational Services (979 | 20.6%), Manufacturing (914 | 19.2%), Health Care & Social Assistance (668 | 14.1%), Retail Trade (658 | 13.8%), and Accommodation & Food Services (384 | 8.1%).
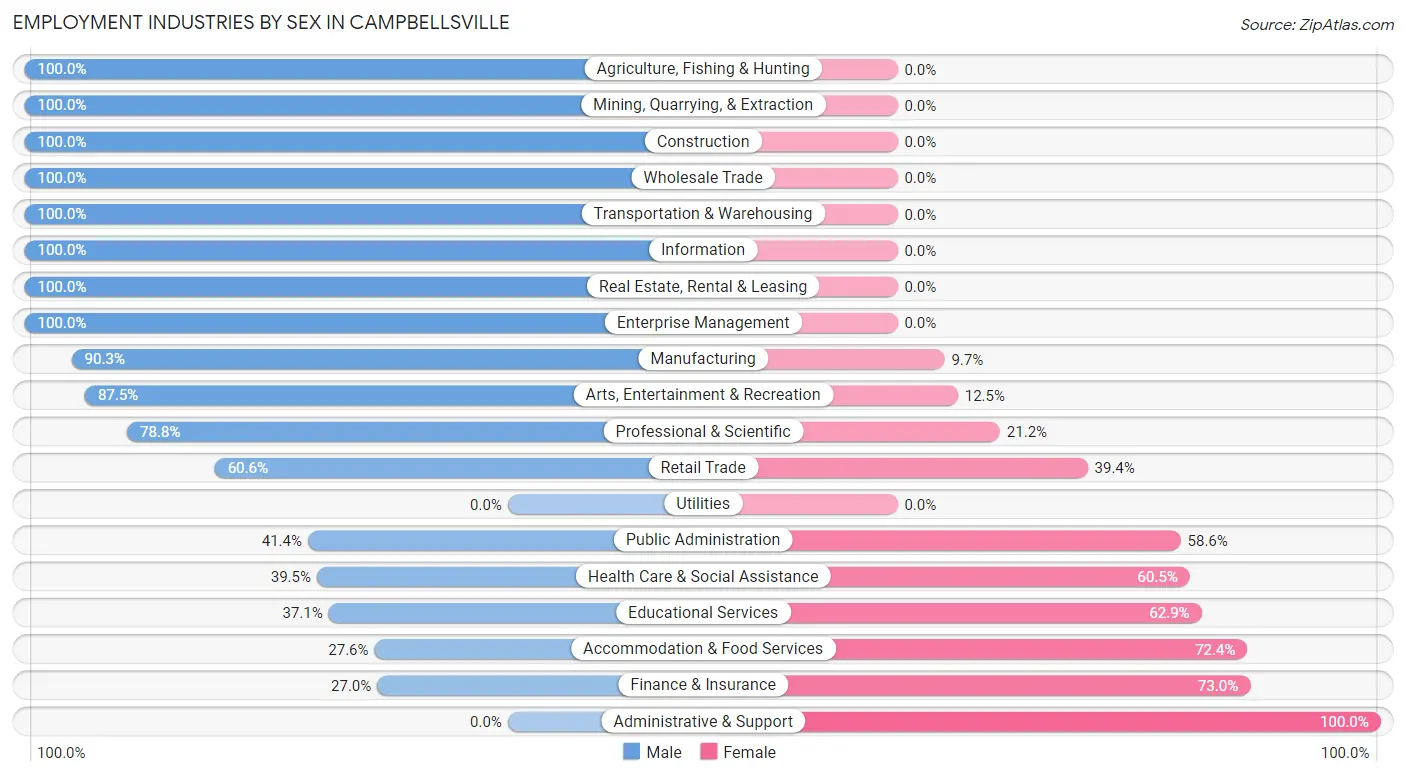
Employment Industries by Sex in Campbellsville
The Campbellsville industries that see more men than women are Agriculture, Fishing & Hunting (100.0%), Mining, Quarrying, & Extraction (100.0%), and Construction (100.0%), whereas the industries that tend to have a higher number of women are Administrative & Support (100.0%), Finance & Insurance (73.0%), and Accommodation & Food Services (72.4%).
| Industry | Male | Female |
| Agriculture, Fishing & Hunting | 8 (100.0%) | 0 (0.0%) |
| Mining, Quarrying, & Extraction | 144 (100.0%) | 0 (0.0%) |
| Construction | 96 (100.0%) | 0 (0.0%) |
| Manufacturing | 825 (90.3%) | 89 (9.7%) |
| Wholesale Trade | 92 (100.0%) | 0 (0.0%) |
| Retail Trade | 399 (60.6%) | 259 (39.4%) |
| Transportation & Warehousing | 81 (100.0%) | 0 (0.0%) |
| Utilities | 0 (0.0%) | 0 (0.0%) |
| Information | 53 (100.0%) | 0 (0.0%) |
| Finance & Insurance | 60 (27.0%) | 162 (73.0%) |
| Real Estate, Rental & Leasing | 48 (100.0%) | 0 (0.0%) |
| Professional & Scientific | 78 (78.8%) | 21 (21.2%) |
| Enterprise Management | 8 (100.0%) | 0 (0.0%) |
| Administrative & Support | 0 (0.0%) | 101 (100.0%) |
| Educational Services | 363 (37.1%) | 616 (62.9%) |
| Health Care & Social Assistance | 264 (39.5%) | 404 (60.5%) |
| Arts, Entertainment & Recreation | 21 (87.5%) | 3 (12.5%) |
| Accommodation & Food Services | 106 (27.6%) | 278 (72.4%) |
| Public Administration | 48 (41.4%) | 68 (58.6%) |
| Total | 2,707 (56.9%) | 2,048 (43.1%) |
Education in Campbellsville
School Enrollment in Campbellsville
The most common levels of schooling among the 2,989 students in Campbellsville are college / undergraduate (1,175 | 39.3%), middle school (693 | 23.2%), and elementary school (464 | 15.5%).
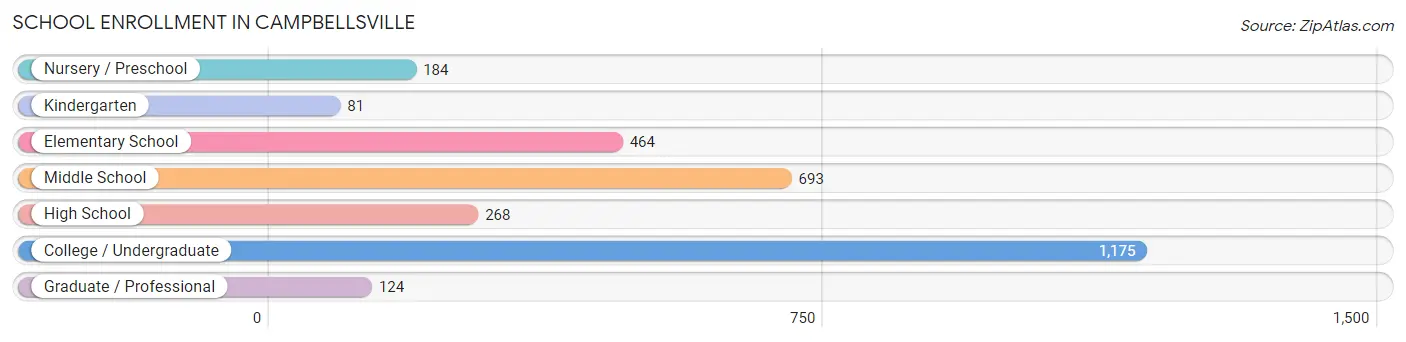
| School Level | # Students | % Students |
| Nursery / Preschool | 184 | 6.2% |
| Kindergarten | 81 | 2.7% |
| Elementary School | 464 | 15.5% |
| Middle School | 693 | 23.2% |
| High School | 268 | 9.0% |
| College / Undergraduate | 1,175 | 39.3% |
| Graduate / Professional | 124 | 4.2% |
| Total | 2,989 | 100.0% |
School Enrollment by Age by Funding Source in Campbellsville
Out of a total of 2,989 students who are enrolled in schools in Campbellsville, 953 (31.9%) attend a private institution, while the remaining 2,036 (68.1%) are enrolled in public schools. The age group of 25 to 34 year olds has the highest likelihood of being enrolled in private schools, with 153 (77.7% in the age bracket) enrolled. Conversely, the age group of 35 years and over has the lowest likelihood of being enrolled in a private school, with 63 (94.0% in the age bracket) attending a public institution.
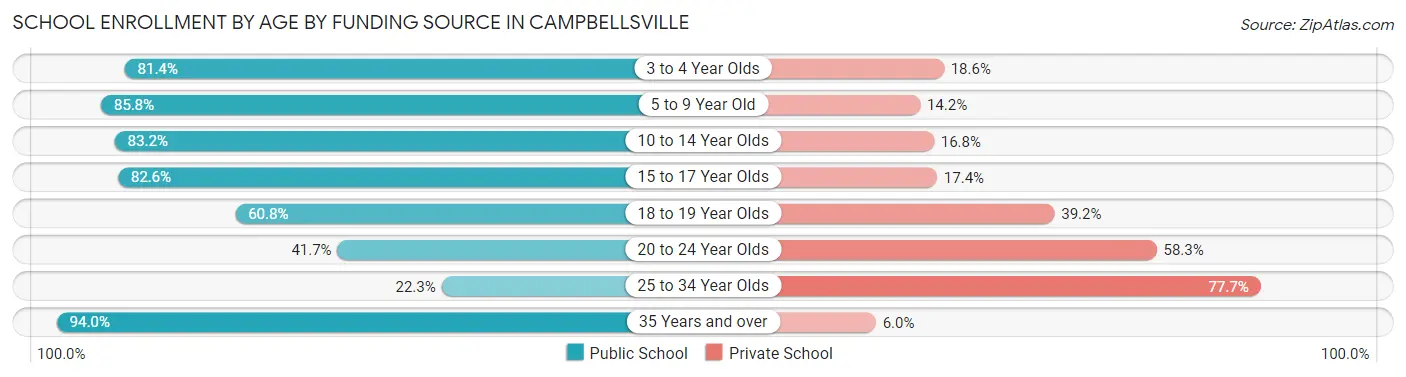
| Age Bracket | Public School | Private School |
| 3 to 4 Year Olds | 96 (81.4%) | 22 (18.6%) |
| 5 to 9 Year Old | 477 (85.8%) | 79 (14.2%) |
| 10 to 14 Year Olds | 640 (83.2%) | 129 (16.8%) |
| 15 to 17 Year Olds | 157 (82.6%) | 33 (17.4%) |
| 18 to 19 Year Olds | 333 (60.8%) | 215 (39.2%) |
| 20 to 24 Year Olds | 227 (41.7%) | 317 (58.3%) |
| 25 to 34 Year Olds | 44 (22.3%) | 153 (77.7%) |
| 35 Years and over | 63 (94.0%) | 4 (6.0%) |
| Total | 2,036 (68.1%) | 953 (31.9%) |
Educational Attainment by Field of Study in Campbellsville
Business (528 | 26.1%), education (447 | 22.1%), communications (293 | 14.5%), arts & humanities (182 | 9.0%), and computers & mathematics (99 | 4.9%) are the most common fields of study among 2,023 individuals in Campbellsville who have obtained a bachelor's degree or higher.
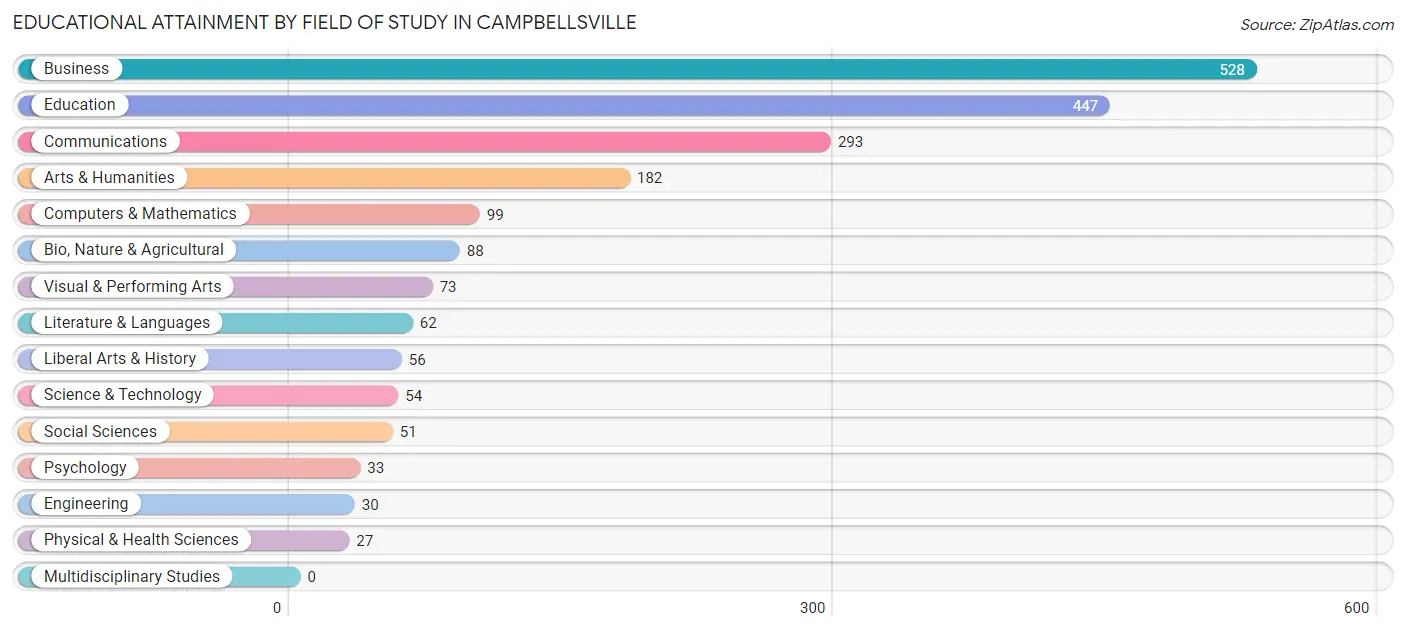
| Field of Study | # Graduates | % Graduates |
| Computers & Mathematics | 99 | 4.9% |
| Bio, Nature & Agricultural | 88 | 4.3% |
| Physical & Health Sciences | 27 | 1.3% |
| Psychology | 33 | 1.6% |
| Social Sciences | 51 | 2.5% |
| Engineering | 30 | 1.5% |
| Multidisciplinary Studies | 0 | 0.0% |
| Science & Technology | 54 | 2.7% |
| Business | 528 | 26.1% |
| Education | 447 | 22.1% |
| Literature & Languages | 62 | 3.1% |
| Liberal Arts & History | 56 | 2.8% |
| Visual & Performing Arts | 73 | 3.6% |
| Communications | 293 | 14.5% |
| Arts & Humanities | 182 | 9.0% |
| Total | 2,023 | 100.0% |
Transportation & Commute in Campbellsville
Vehicle Availability by Sex in Campbellsville
The most prevalent vehicle ownership categories in Campbellsville are males with 2 vehicles (955, accounting for 42.0%) and females with 2 vehicles (646, making up 52.8%).
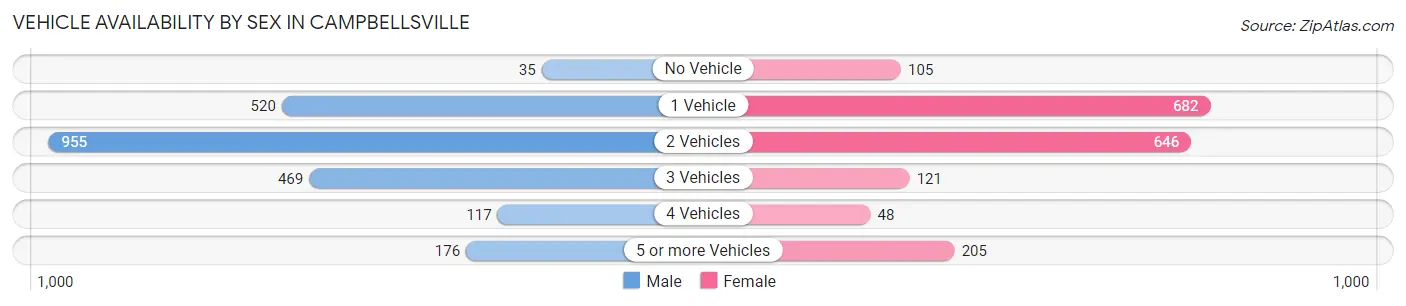
| Vehicles Available | Male | Female |
| No Vehicle | 35 (1.5%) | 105 (5.8%) |
| 1 Vehicle | 520 (22.9%) | 682 (37.7%) |
| 2 Vehicles | 955 (42.0%) | 646 (35.7%) |
| 3 Vehicles | 469 (20.6%) | 121 (6.7%) |
| 4 Vehicles | 117 (5.1%) | 48 (2.7%) |
| 5 or more Vehicles | 176 (7.7%) | 205 (11.3%) |
| Total | 2,272 (100.0%) | 1,807 (100.0%) |
Commute Time in Campbellsville
The most frequently occuring commute durations in Campbellsville are 5 to 9 minutes (1,474 commuters, 39.7%), 10 to 14 minutes (706 commuters, 19.0%), and less than 5 minutes (339 commuters, 9.1%).
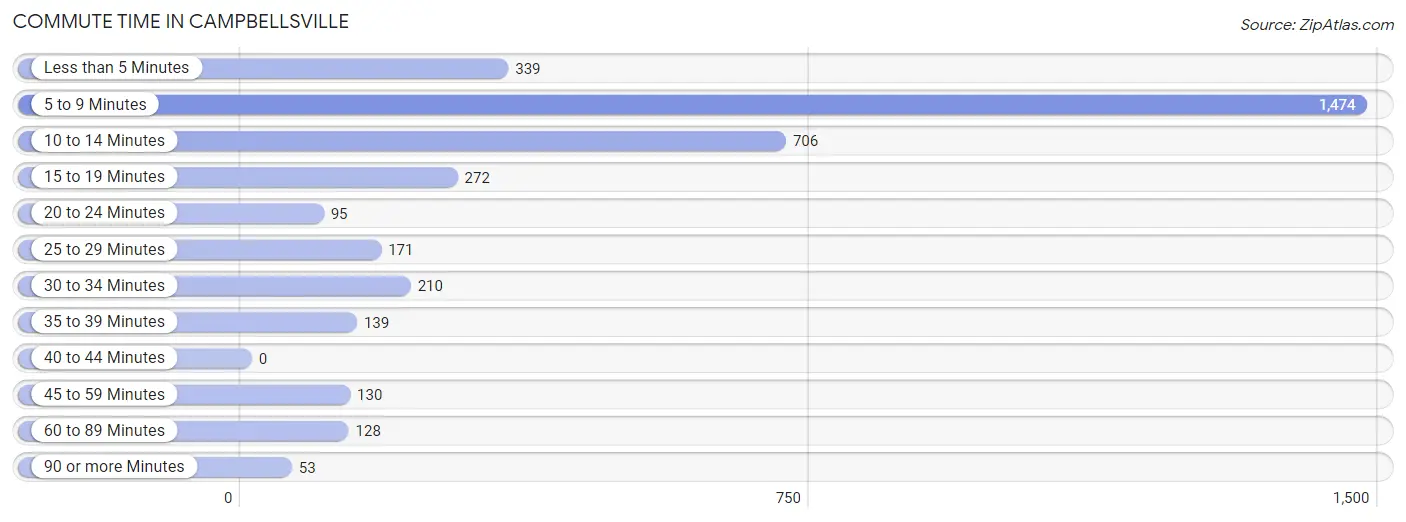
| Commute Time | # Commuters | % Commuters |
| Less than 5 Minutes | 339 | 9.1% |
| 5 to 9 Minutes | 1,474 | 39.7% |
| 10 to 14 Minutes | 706 | 19.0% |
| 15 to 19 Minutes | 272 | 7.3% |
| 20 to 24 Minutes | 95 | 2.6% |
| 25 to 29 Minutes | 171 | 4.6% |
| 30 to 34 Minutes | 210 | 5.7% |
| 35 to 39 Minutes | 139 | 3.7% |
| 40 to 44 Minutes | 0 | 0.0% |
| 45 to 59 Minutes | 130 | 3.5% |
| 60 to 89 Minutes | 128 | 3.4% |
| 90 or more Minutes | 53 | 1.4% |
Commute Time by Sex in Campbellsville
The most common commute times in Campbellsville are 5 to 9 minutes (801 commuters, 39.2%) for males and 5 to 9 minutes (673 commuters, 40.3%) for females.
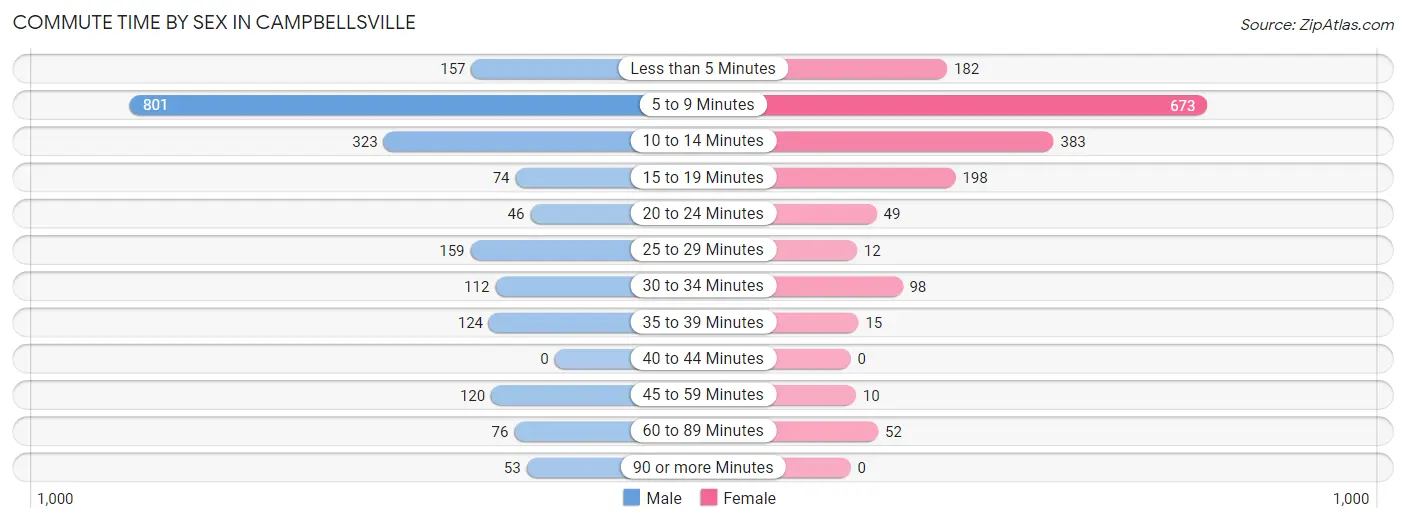
| Commute Time | Male | Female |
| Less than 5 Minutes | 157 (7.7%) | 182 (10.9%) |
| 5 to 9 Minutes | 801 (39.2%) | 673 (40.3%) |
| 10 to 14 Minutes | 323 (15.8%) | 383 (22.9%) |
| 15 to 19 Minutes | 74 (3.6%) | 198 (11.8%) |
| 20 to 24 Minutes | 46 (2.2%) | 49 (2.9%) |
| 25 to 29 Minutes | 159 (7.8%) | 12 (0.7%) |
| 30 to 34 Minutes | 112 (5.5%) | 98 (5.9%) |
| 35 to 39 Minutes | 124 (6.1%) | 15 (0.9%) |
| 40 to 44 Minutes | 0 (0.0%) | 0 (0.0%) |
| 45 to 59 Minutes | 120 (5.9%) | 10 (0.6%) |
| 60 to 89 Minutes | 76 (3.7%) | 52 (3.1%) |
| 90 or more Minutes | 53 (2.6%) | 0 (0.0%) |
Time of Departure to Work by Sex in Campbellsville
The most frequent times of departure to work in Campbellsville are 12:00 AM to 4:59 AM (396, 19.4%) for males and 12:00 PM to 3:59 PM (375, 22.4%) for females.
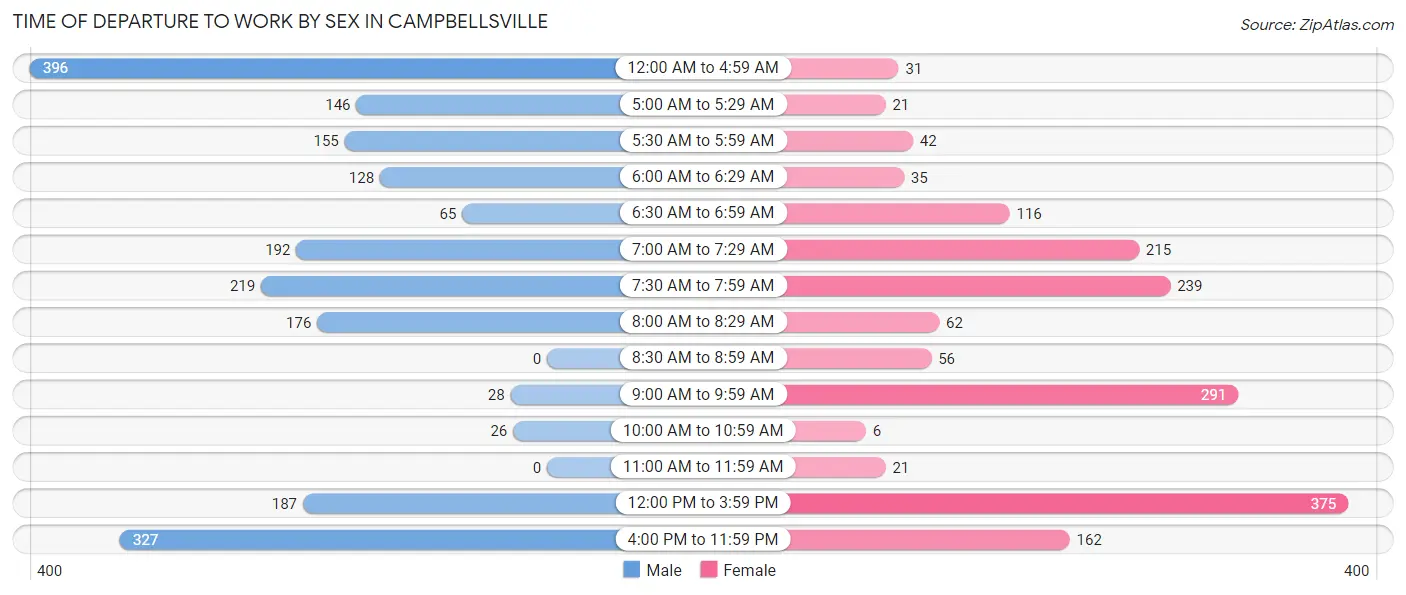
| Time of Departure | Male | Female |
| 12:00 AM to 4:59 AM | 396 (19.4%) | 31 (1.8%) |
| 5:00 AM to 5:29 AM | 146 (7.1%) | 21 (1.3%) |
| 5:30 AM to 5:59 AM | 155 (7.6%) | 42 (2.5%) |
| 6:00 AM to 6:29 AM | 128 (6.3%) | 35 (2.1%) |
| 6:30 AM to 6:59 AM | 65 (3.2%) | 116 (6.9%) |
| 7:00 AM to 7:29 AM | 192 (9.4%) | 215 (12.9%) |
| 7:30 AM to 7:59 AM | 219 (10.7%) | 239 (14.3%) |
| 8:00 AM to 8:29 AM | 176 (8.6%) | 62 (3.7%) |
| 8:30 AM to 8:59 AM | 0 (0.0%) | 56 (3.4%) |
| 9:00 AM to 9:59 AM | 28 (1.4%) | 291 (17.4%) |
| 10:00 AM to 10:59 AM | 26 (1.3%) | 6 (0.4%) |
| 11:00 AM to 11:59 AM | 0 (0.0%) | 21 (1.3%) |
| 12:00 PM to 3:59 PM | 187 (9.1%) | 375 (22.4%) |
| 4:00 PM to 11:59 PM | 327 (16.0%) | 162 (9.7%) |
| Total | 2,045 (100.0%) | 1,672 (100.0%) |
Housing Occupancy in Campbellsville
Occupancy by Ownership in Campbellsville
Of the total 4,678 dwellings in Campbellsville, owner-occupied units account for 2,224 (47.5%), while renter-occupied units make up 2,454 (52.5%).
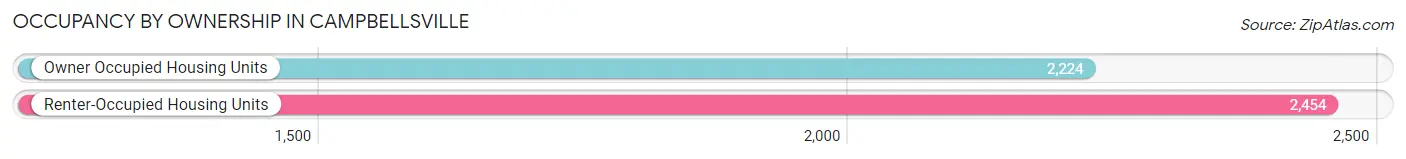
| Occupancy | # Housing Units | % Housing Units |
| Owner Occupied Housing Units | 2,224 | 47.5% |
| Renter-Occupied Housing Units | 2,454 | 52.5% |
| Total Occupied Housing Units | 4,678 | 100.0% |
Occupancy by Household Size in Campbellsville
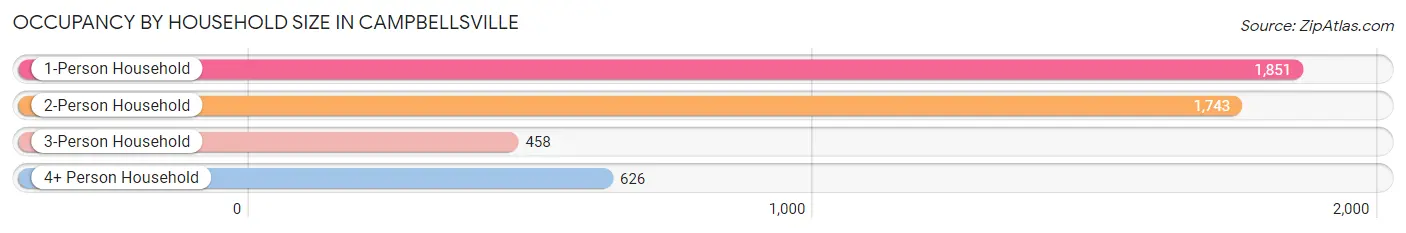
| Household Size | # Housing Units | % Housing Units |
| 1-Person Household | 1,851 | 39.6% |
| 2-Person Household | 1,743 | 37.3% |
| 3-Person Household | 458 | 9.8% |
| 4+ Person Household | 626 | 13.4% |
| Total Housing Units | 4,678 | 100.0% |
Occupancy by Ownership by Household Size in Campbellsville
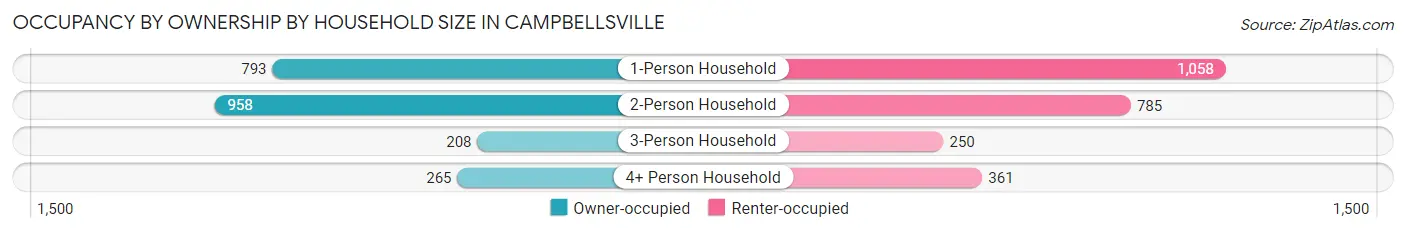
| Household Size | Owner-occupied | Renter-occupied |
| 1-Person Household | 793 (42.8%) | 1,058 (57.2%) |
| 2-Person Household | 958 (55.0%) | 785 (45.0%) |
| 3-Person Household | 208 (45.4%) | 250 (54.6%) |
| 4+ Person Household | 265 (42.3%) | 361 (57.7%) |
| Total Housing Units | 2,224 (47.5%) | 2,454 (52.5%) |
Occupancy by Educational Attainment in Campbellsville
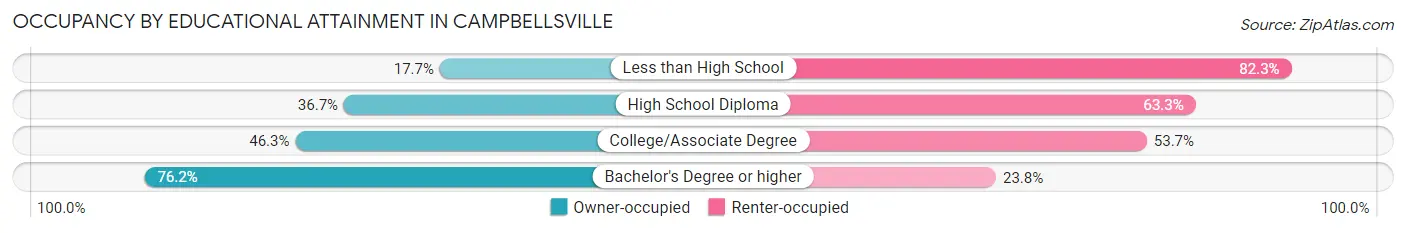
| Household Size | Owner-occupied | Renter-occupied |
| Less than High School | 113 (17.7%) | 526 (82.3%) |
| High School Diploma | 524 (36.7%) | 904 (63.3%) |
| College/Associate Degree | 625 (46.3%) | 724 (53.7%) |
| Bachelor's Degree or higher | 962 (76.2%) | 300 (23.8%) |
Occupancy by Age of Householder in Campbellsville
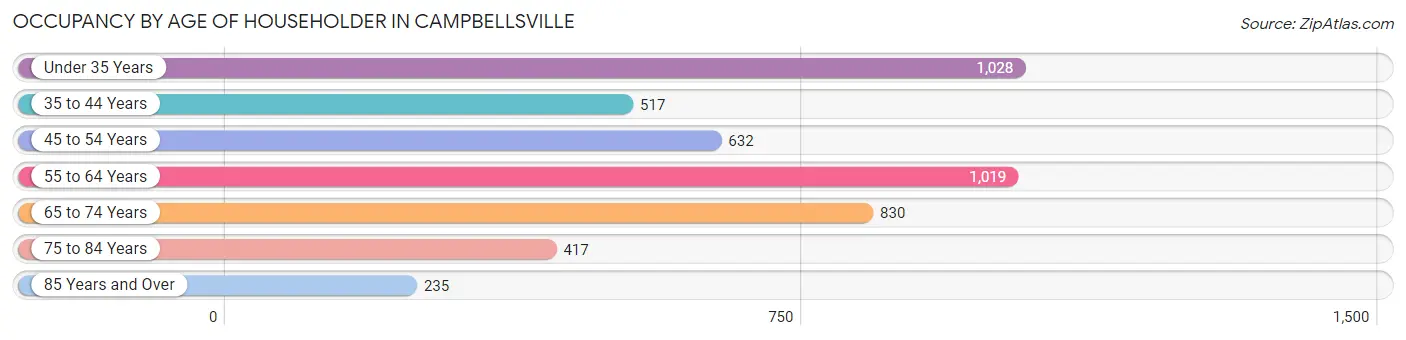
| Age Bracket | # Households | % Households |
| Under 35 Years | 1,028 | 22.0% |
| 35 to 44 Years | 517 | 11.1% |
| 45 to 54 Years | 632 | 13.5% |
| 55 to 64 Years | 1,019 | 21.8% |
| 65 to 74 Years | 830 | 17.7% |
| 75 to 84 Years | 417 | 8.9% |
| 85 Years and Over | 235 | 5.0% |
| Total | 4,678 | 100.0% |
Housing Finances in Campbellsville
Median Income by Occupancy in Campbellsville
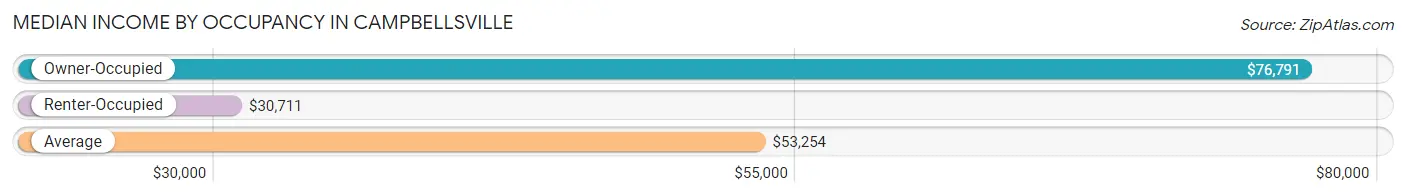
| Occupancy Type | # Households | Median Income |
| Owner-Occupied | 2,224 (47.5%) | $76,791 |
| Renter-Occupied | 2,454 (52.5%) | $30,711 |
| Average | 4,678 (100.0%) | $53,254 |
Occupancy by Householder Income Bracket in Campbellsville
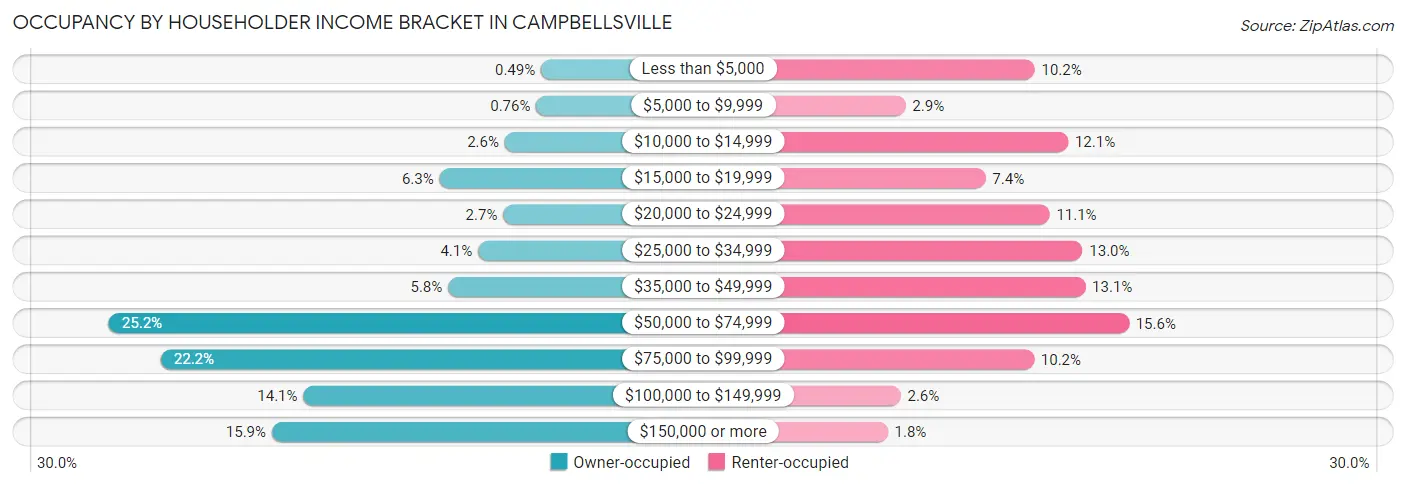
| Income Bracket | Owner-occupied | Renter-occupied |
| Less than $5,000 | 11 (0.5%) | 251 (10.2%) |
| $5,000 to $9,999 | 17 (0.8%) | 70 (2.9%) |
| $10,000 to $14,999 | 57 (2.6%) | 298 (12.1%) |
| $15,000 to $19,999 | 140 (6.3%) | 182 (7.4%) |
| $20,000 to $24,999 | 59 (2.6%) | 272 (11.1%) |
| $25,000 to $34,999 | 91 (4.1%) | 318 (13.0%) |
| $35,000 to $49,999 | 129 (5.8%) | 322 (13.1%) |
| $50,000 to $74,999 | 560 (25.2%) | 383 (15.6%) |
| $75,000 to $99,999 | 494 (22.2%) | 250 (10.2%) |
| $100,000 to $149,999 | 313 (14.1%) | 63 (2.6%) |
| $150,000 or more | 353 (15.9%) | 45 (1.8%) |
| Total | 2,224 (100.0%) | 2,454 (100.0%) |
Monthly Housing Cost Tiers in Campbellsville
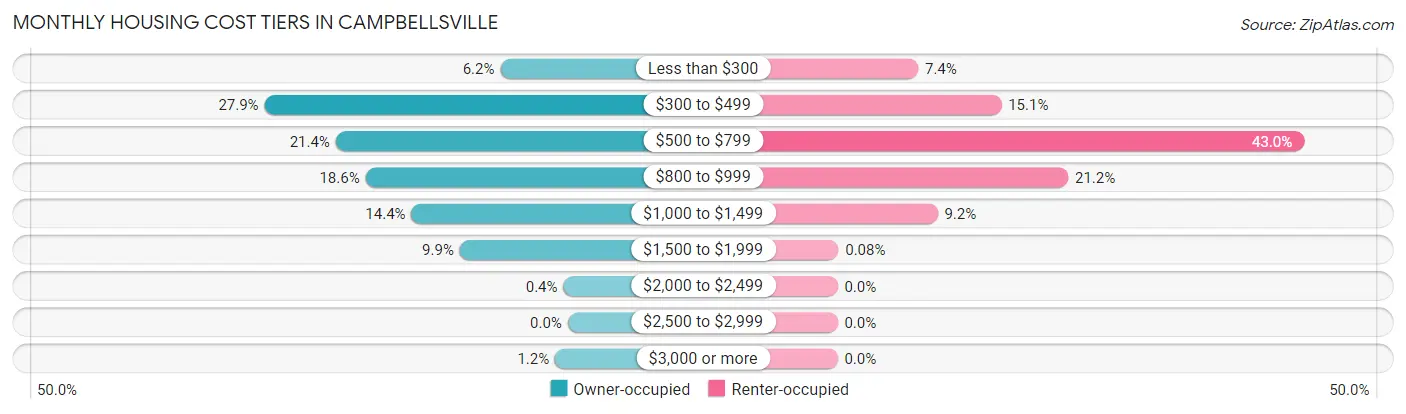
| Monthly Cost | Owner-occupied | Renter-occupied |
| Less than $300 | 138 (6.2%) | 182 (7.4%) |
| $300 to $499 | 621 (27.9%) | 370 (15.1%) |
| $500 to $799 | 475 (21.4%) | 1,054 (42.9%) |
| $800 to $999 | 414 (18.6%) | 521 (21.2%) |
| $1,000 to $1,499 | 320 (14.4%) | 226 (9.2%) |
| $1,500 to $1,999 | 221 (9.9%) | 2 (0.1%) |
| $2,000 to $2,499 | 9 (0.4%) | 0 (0.0%) |
| $2,500 to $2,999 | 0 (0.0%) | 0 (0.0%) |
| $3,000 or more | 26 (1.2%) | 0 (0.0%) |
| Total | 2,224 (100.0%) | 2,454 (100.0%) |
Physical Housing Characteristics in Campbellsville
Housing Structures in Campbellsville
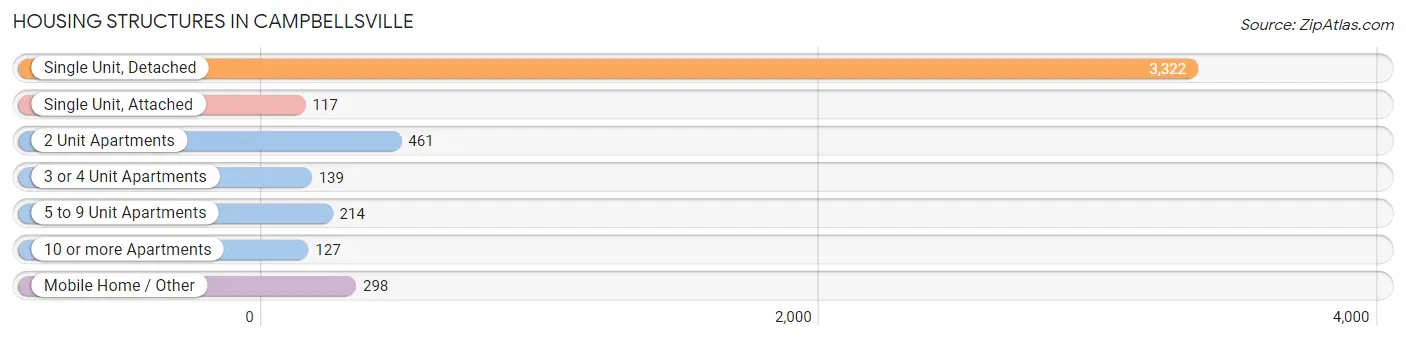
| Structure Type | # Housing Units | % Housing Units |
| Single Unit, Detached | 3,322 | 71.0% |
| Single Unit, Attached | 117 | 2.5% |
| 2 Unit Apartments | 461 | 9.9% |
| 3 or 4 Unit Apartments | 139 | 3.0% |
| 5 to 9 Unit Apartments | 214 | 4.6% |
| 10 or more Apartments | 127 | 2.7% |
| Mobile Home / Other | 298 | 6.4% |
| Total | 4,678 | 100.0% |
Housing Structures by Occupancy in Campbellsville
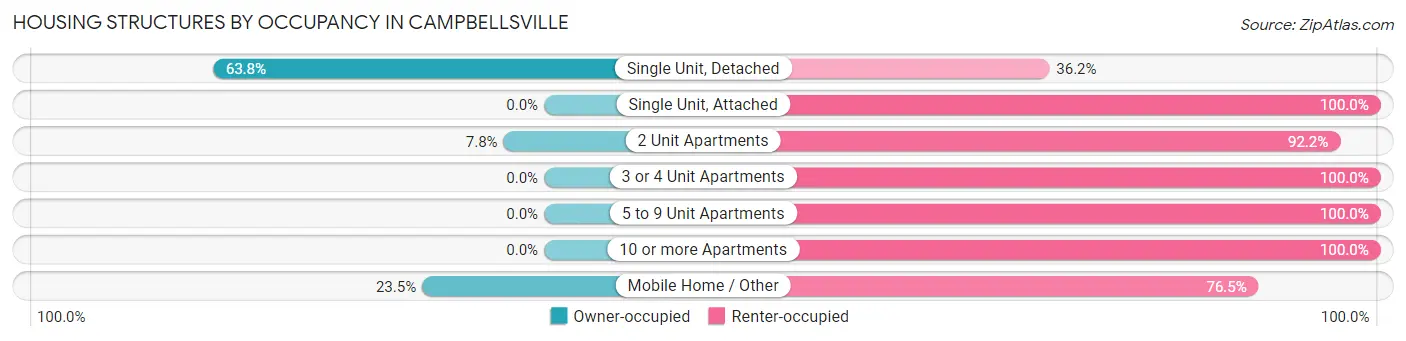
| Structure Type | Owner-occupied | Renter-occupied |
| Single Unit, Detached | 2,118 (63.8%) | 1,204 (36.2%) |
| Single Unit, Attached | 0 (0.0%) | 117 (100.0%) |
| 2 Unit Apartments | 36 (7.8%) | 425 (92.2%) |
| 3 or 4 Unit Apartments | 0 (0.0%) | 139 (100.0%) |
| 5 to 9 Unit Apartments | 0 (0.0%) | 214 (100.0%) |
| 10 or more Apartments | 0 (0.0%) | 127 (100.0%) |
| Mobile Home / Other | 70 (23.5%) | 228 (76.5%) |
| Total | 2,224 (47.5%) | 2,454 (52.5%) |
Housing Structures by Number of Rooms in Campbellsville
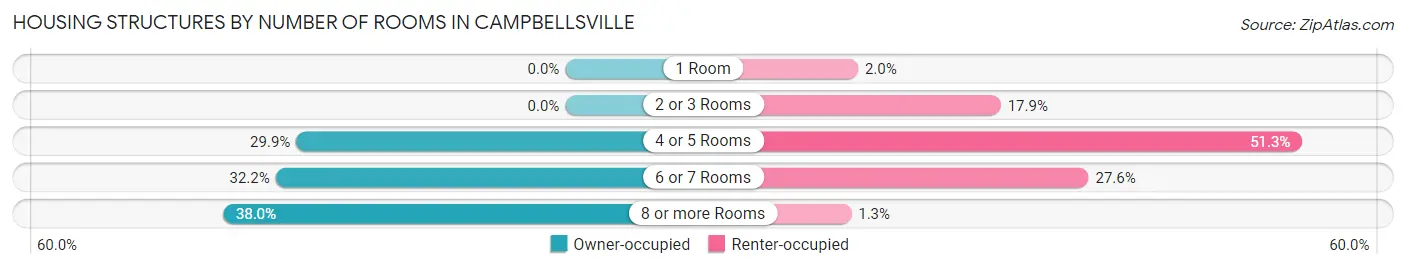
| Number of Rooms | Owner-occupied | Renter-occupied |
| 1 Room | 0 (0.0%) | 49 (2.0%) |
| 2 or 3 Rooms | 0 (0.0%) | 438 (17.8%) |
| 4 or 5 Rooms | 664 (29.9%) | 1,259 (51.3%) |
| 6 or 7 Rooms | 715 (32.2%) | 677 (27.6%) |
| 8 or more Rooms | 845 (38.0%) | 31 (1.3%) |
| Total | 2,224 (100.0%) | 2,454 (100.0%) |
Housing Structure by Heating Type in Campbellsville
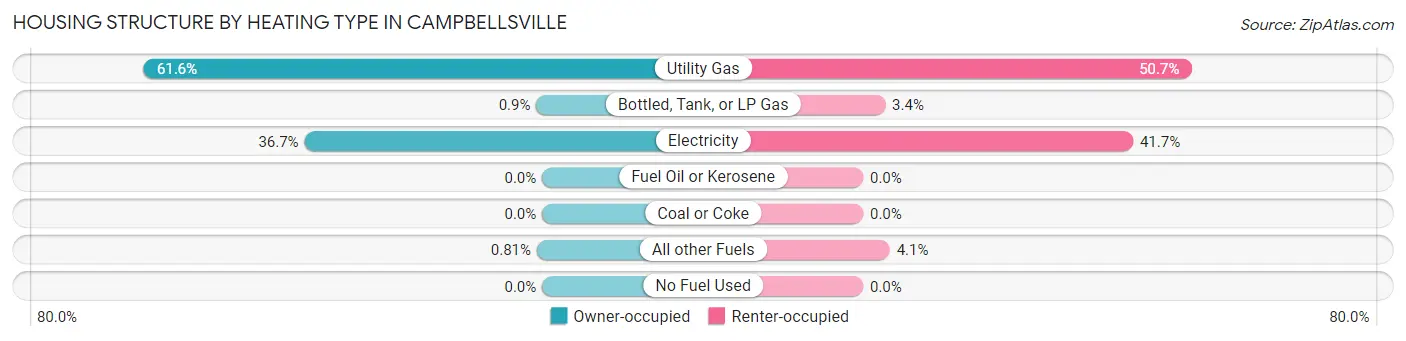
| Heating Type | Owner-occupied | Renter-occupied |
| Utility Gas | 1,369 (61.6%) | 1,245 (50.7%) |
| Bottled, Tank, or LP Gas | 20 (0.9%) | 84 (3.4%) |
| Electricity | 817 (36.7%) | 1,024 (41.7%) |
| Fuel Oil or Kerosene | 0 (0.0%) | 0 (0.0%) |
| Coal or Coke | 0 (0.0%) | 0 (0.0%) |
| All other Fuels | 18 (0.8%) | 101 (4.1%) |
| No Fuel Used | 0 (0.0%) | 0 (0.0%) |
| Total | 2,224 (100.0%) | 2,454 (100.0%) |
Household Vehicle Usage in Campbellsville
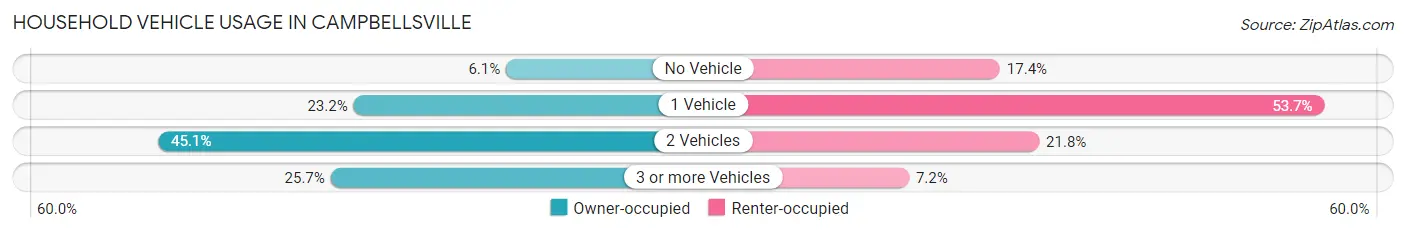
| Vehicles per Household | Owner-occupied | Renter-occupied |
| No Vehicle | 135 (6.1%) | 426 (17.4%) |
| 1 Vehicle | 515 (23.2%) | 1,318 (53.7%) |
| 2 Vehicles | 1,002 (45.1%) | 534 (21.8%) |
| 3 or more Vehicles | 572 (25.7%) | 176 (7.2%) |
| Total | 2,224 (100.0%) | 2,454 (100.0%) |
Real Estate & Mortgages in Campbellsville
Real Estate and Mortgage Overview in Campbellsville
| Characteristic | Without Mortgage | With Mortgage |
| Housing Units | 966 | 1,258 |
| Median Property Value | $160,300 | $144,800 |
| Median Household Income | $83,149 | $257 |
| Monthly Housing Costs | $430 | $26 |
| Real Estate Taxes | $1,243 | $24 |
Property Value by Mortgage Status in Campbellsville
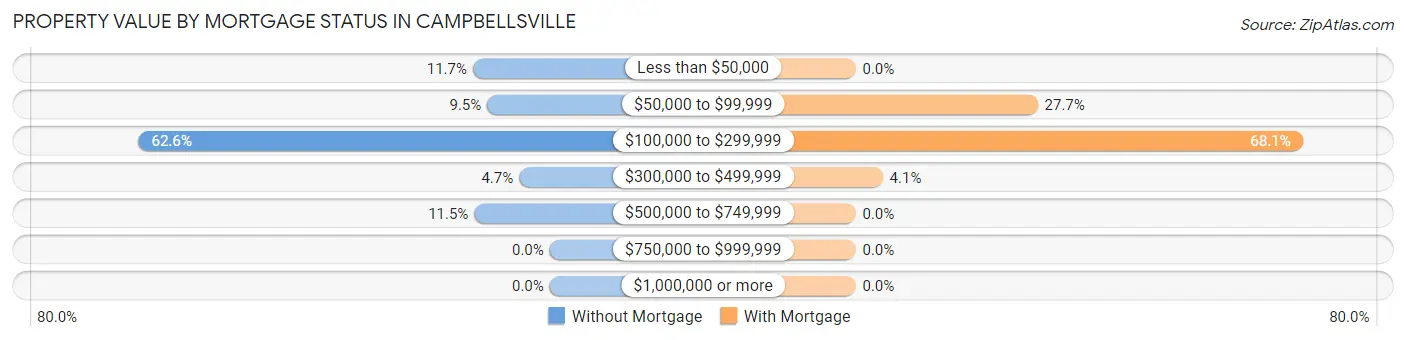
| Property Value | Without Mortgage | With Mortgage |
| Less than $50,000 | 113 (11.7%) | 0 (0.0%) |
| $50,000 to $99,999 | 92 (9.5%) | 349 (27.7%) |
| $100,000 to $299,999 | 605 (62.6%) | 857 (68.1%) |
| $300,000 to $499,999 | 45 (4.7%) | 52 (4.1%) |
| $500,000 to $749,999 | 111 (11.5%) | 0 (0.0%) |
| $750,000 to $999,999 | 0 (0.0%) | 0 (0.0%) |
| $1,000,000 or more | 0 (0.0%) | 0 (0.0%) |
| Total | 966 (100.0%) | 1,258 (100.0%) |
Household Income by Mortgage Status in Campbellsville
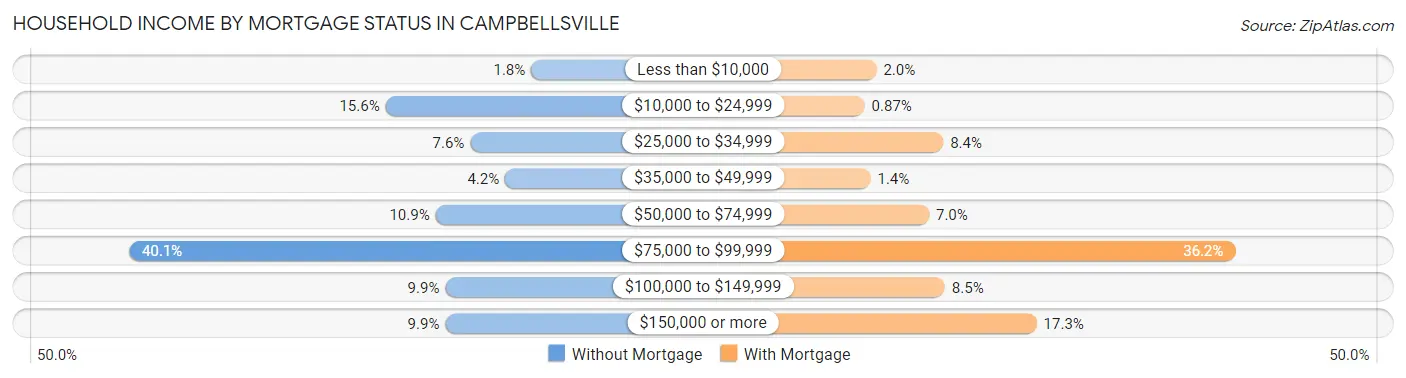
| Household Income | Without Mortgage | With Mortgage |
| Less than $10,000 | 17 (1.8%) | 25 (2.0%) |
| $10,000 to $24,999 | 151 (15.6%) | 11 (0.9%) |
| $25,000 to $34,999 | 73 (7.6%) | 105 (8.4%) |
| $35,000 to $49,999 | 41 (4.2%) | 18 (1.4%) |
| $50,000 to $74,999 | 105 (10.9%) | 88 (7.0%) |
| $75,000 to $99,999 | 387 (40.1%) | 455 (36.2%) |
| $100,000 to $149,999 | 96 (9.9%) | 107 (8.5%) |
| $150,000 or more | 96 (9.9%) | 217 (17.2%) |
| Total | 966 (100.0%) | 1,258 (100.0%) |
Property Value to Household Income Ratio in Campbellsville
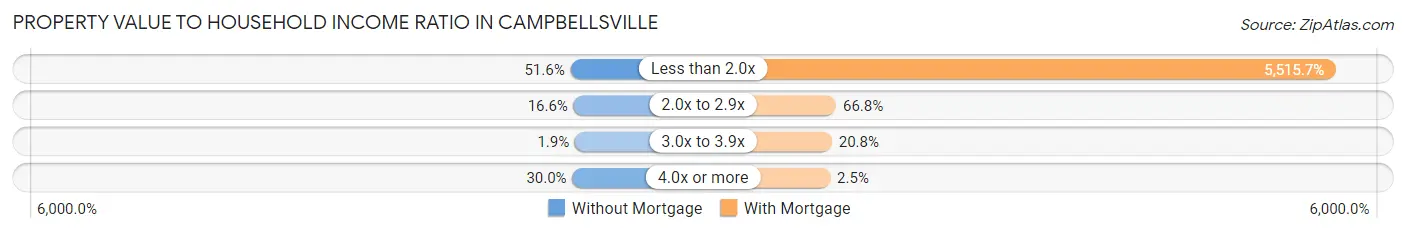
| Value-to-Income Ratio | Without Mortgage | With Mortgage |
| Less than 2.0x | 498 (51.5%) | 69,388 (5,515.7%) |
| 2.0x to 2.9x | 160 (16.6%) | 840 (66.8%) |
| 3.0x to 3.9x | 18 (1.9%) | 262 (20.8%) |
| 4.0x or more | 290 (30.0%) | 31 (2.5%) |
| Total | 966 (100.0%) | 1,258 (100.0%) |
Real Estate Taxes by Mortgage Status in Campbellsville
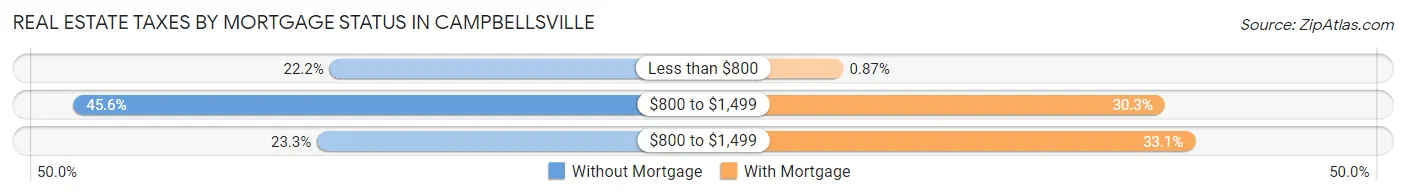
| Property Taxes | Without Mortgage | With Mortgage |
| Less than $800 | 214 (22.2%) | 11 (0.9%) |
| $800 to $1,499 | 440 (45.6%) | 381 (30.3%) |
| $800 to $1,499 | 225 (23.3%) | 416 (33.1%) |
| Total | 966 (100.0%) | 1,258 (100.0%) |
Health & Disability in Campbellsville
Health Insurance Coverage by Age in Campbellsville
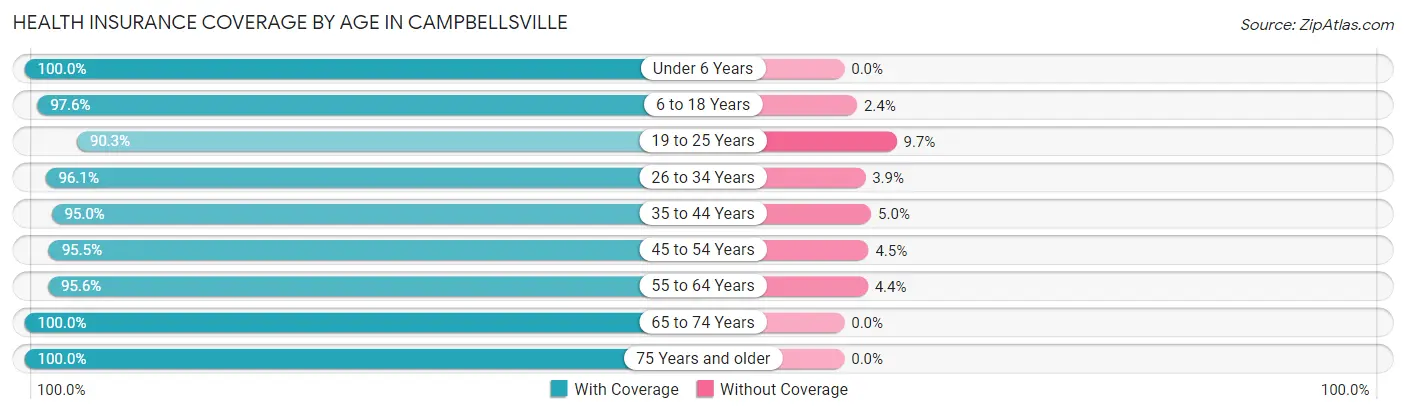
| Age Bracket | With Coverage | Without Coverage |
| Under 6 Years | 880 (100.0%) | 0 (0.0%) |
| 6 to 18 Years | 1,658 (97.6%) | 40 (2.4%) |
| 19 to 25 Years | 1,566 (90.3%) | 169 (9.7%) |
| 26 to 34 Years | 1,157 (96.1%) | 47 (3.9%) |
| 35 to 44 Years | 911 (95.0%) | 48 (5.0%) |
| 45 to 54 Years | 890 (95.5%) | 42 (4.5%) |
| 55 to 64 Years | 1,425 (95.6%) | 65 (4.4%) |
| 65 to 74 Years | 1,287 (100.0%) | 0 (0.0%) |
| 75 Years and older | 935 (100.0%) | 0 (0.0%) |
| Total | 10,709 (96.3%) | 411 (3.7%) |
Health Insurance Coverage by Citizenship Status in Campbellsville
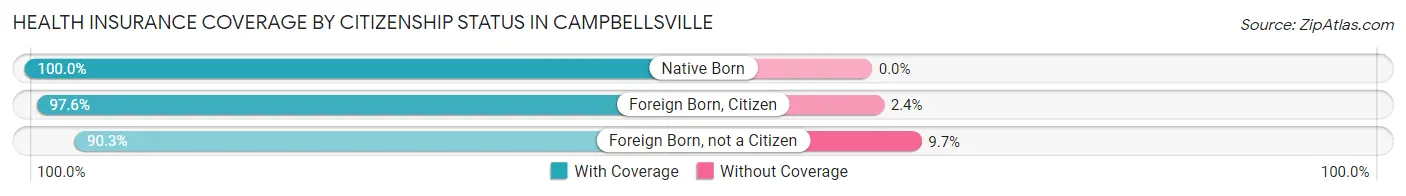
| Citizenship Status | With Coverage | Without Coverage |
| Native Born | 880 (100.0%) | 0 (0.0%) |
| Foreign Born, Citizen | 1,658 (97.6%) | 40 (2.4%) |
| Foreign Born, not a Citizen | 1,566 (90.3%) | 169 (9.7%) |
Health Insurance Coverage by Household Income in Campbellsville
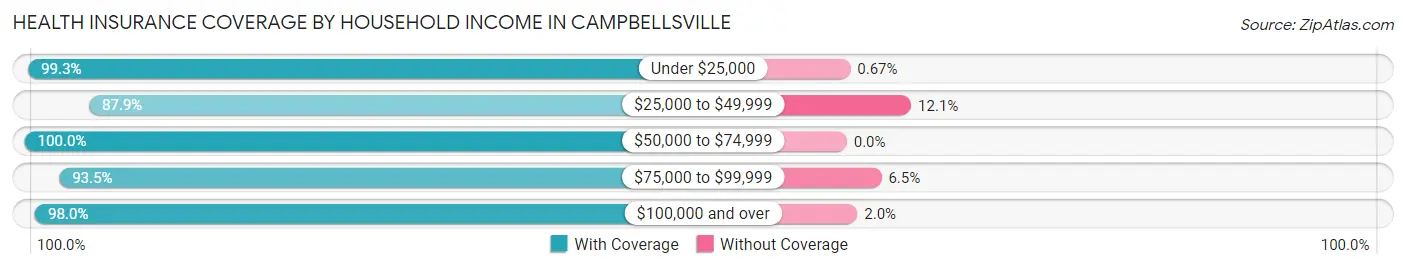
| Household Income | With Coverage | Without Coverage |
| Under $25,000 | 2,384 (99.3%) | 16 (0.7%) |
| $25,000 to $49,999 | 1,713 (87.9%) | 235 (12.1%) |
| $50,000 to $74,999 | 2,240 (100.0%) | 0 (0.0%) |
| $75,000 to $99,999 | 1,542 (93.5%) | 107 (6.5%) |
| $100,000 and over | 2,088 (98.0%) | 42 (2.0%) |
Public vs Private Health Insurance Coverage by Age in Campbellsville
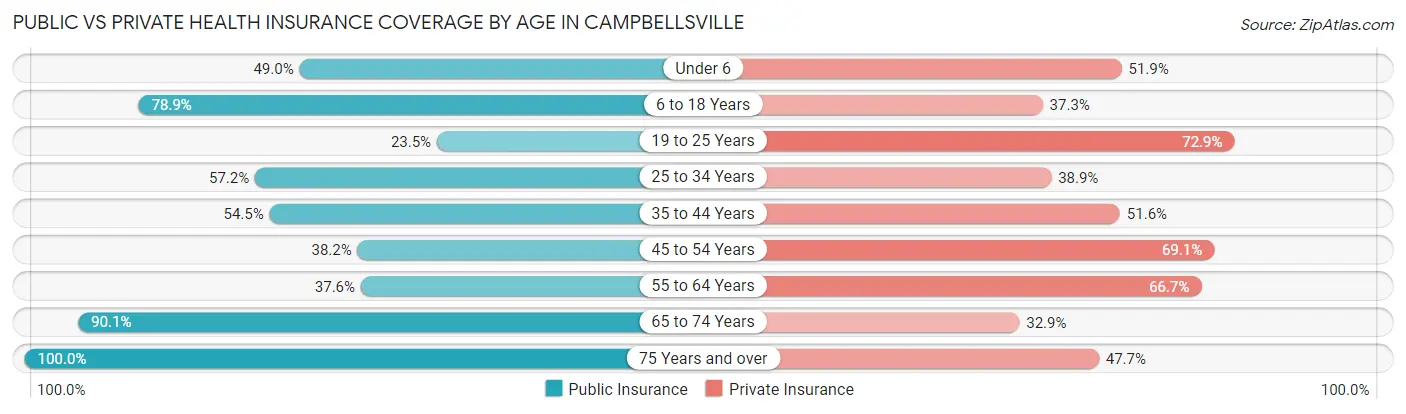
| Age Bracket | Public Insurance | Private Insurance |
| Under 6 | 431 (49.0%) | 457 (51.9%) |
| 6 to 18 Years | 1,339 (78.9%) | 633 (37.3%) |
| 19 to 25 Years | 407 (23.5%) | 1,264 (72.9%) |
| 25 to 34 Years | 689 (57.2%) | 468 (38.9%) |
| 35 to 44 Years | 523 (54.5%) | 495 (51.6%) |
| 45 to 54 Years | 356 (38.2%) | 644 (69.1%) |
| 55 to 64 Years | 560 (37.6%) | 994 (66.7%) |
| 65 to 74 Years | 1,159 (90.0%) | 424 (32.9%) |
| 75 Years and over | 935 (100.0%) | 446 (47.7%) |
| Total | 6,399 (57.5%) | 5,825 (52.4%) |
Disability Status by Sex by Age in Campbellsville
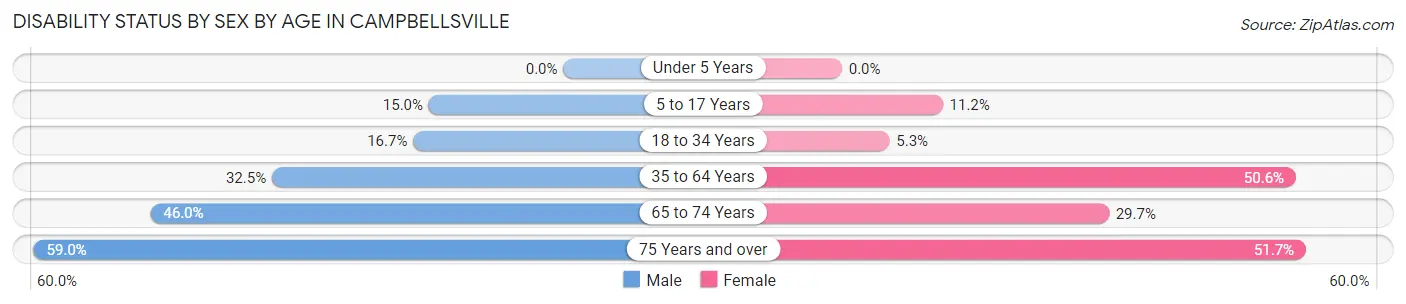
| Age Bracket | Male | Female |
| Under 5 Years | 0 (0.0%) | 0 (0.0%) |
| 5 to 17 Years | 127 (15.0%) | 81 (11.2%) |
| 18 to 34 Years | 262 (16.7%) | 84 (5.3%) |
| 35 to 64 Years | 501 (32.5%) | 929 (50.6%) |
| 65 to 74 Years | 281 (46.0%) | 201 (29.7%) |
| 75 Years and over | 167 (59.0%) | 337 (51.7%) |
Disability Class by Sex by Age in Campbellsville
Disability Class: Hearing Difficulty
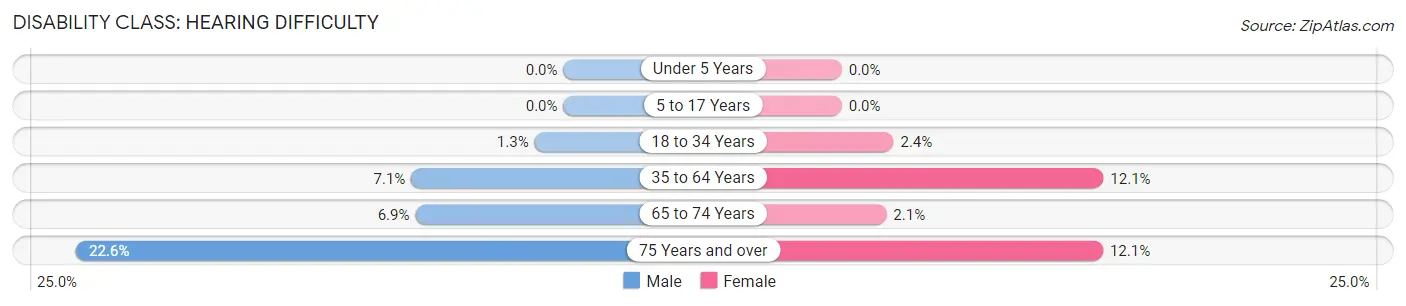
| Age Bracket | Male | Female |
| Under 5 Years | 0 (0.0%) | 0 (0.0%) |
| 5 to 17 Years | 0 (0.0%) | 0 (0.0%) |
| 18 to 34 Years | 21 (1.3%) | 38 (2.4%) |
| 35 to 64 Years | 109 (7.1%) | 223 (12.1%) |
| 65 to 74 Years | 42 (6.9%) | 14 (2.1%) |
| 75 Years and over | 64 (22.6%) | 79 (12.1%) |
Disability Class: Vision Difficulty
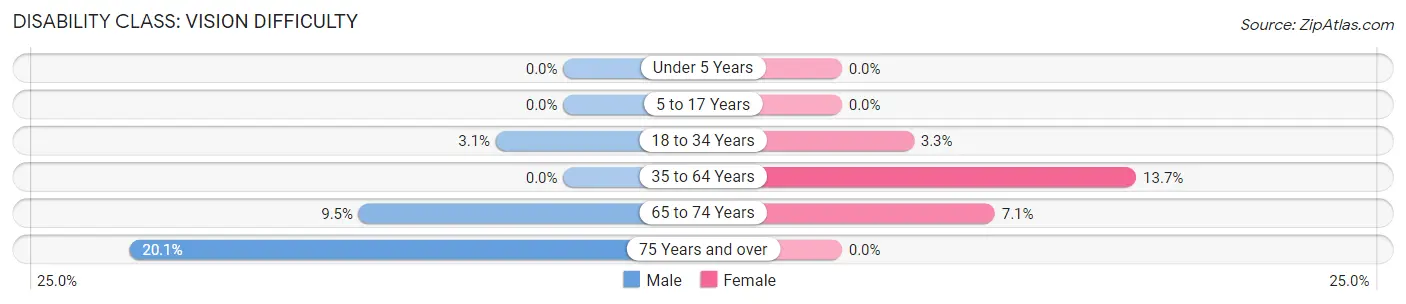
| Age Bracket | Male | Female |
| Under 5 Years | 0 (0.0%) | 0 (0.0%) |
| 5 to 17 Years | 0 (0.0%) | 0 (0.0%) |
| 18 to 34 Years | 49 (3.1%) | 53 (3.3%) |
| 35 to 64 Years | 0 (0.0%) | 251 (13.7%) |
| 65 to 74 Years | 58 (9.5%) | 48 (7.1%) |
| 75 Years and over | 57 (20.1%) | 0 (0.0%) |
Disability Class: Cognitive Difficulty
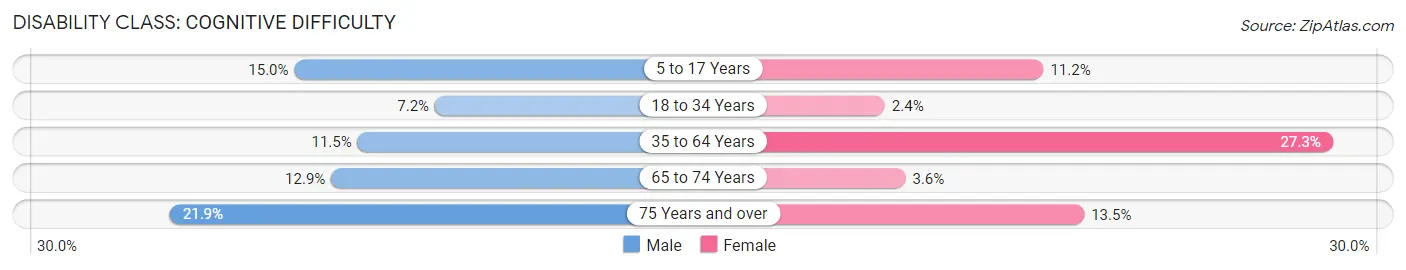
| Age Bracket | Male | Female |
| 5 to 17 Years | 127 (15.0%) | 81 (11.2%) |
| 18 to 34 Years | 112 (7.1%) | 38 (2.4%) |
| 35 to 64 Years | 177 (11.5%) | 502 (27.3%) |
| 65 to 74 Years | 79 (12.9%) | 24 (3.5%) |
| 75 Years and over | 62 (21.9%) | 88 (13.5%) |
Disability Class: Ambulatory Difficulty
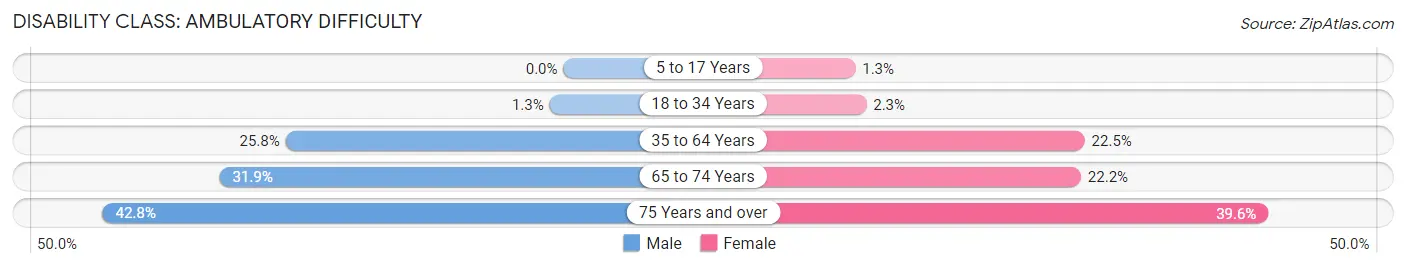
| Age Bracket | Male | Female |
| 5 to 17 Years | 0 (0.0%) | 9 (1.3%) |
| 18 to 34 Years | 20 (1.3%) | 36 (2.3%) |
| 35 to 64 Years | 398 (25.8%) | 414 (22.5%) |
| 65 to 74 Years | 195 (31.9%) | 150 (22.2%) |
| 75 Years and over | 121 (42.8%) | 258 (39.6%) |
Disability Class: Self-Care Difficulty
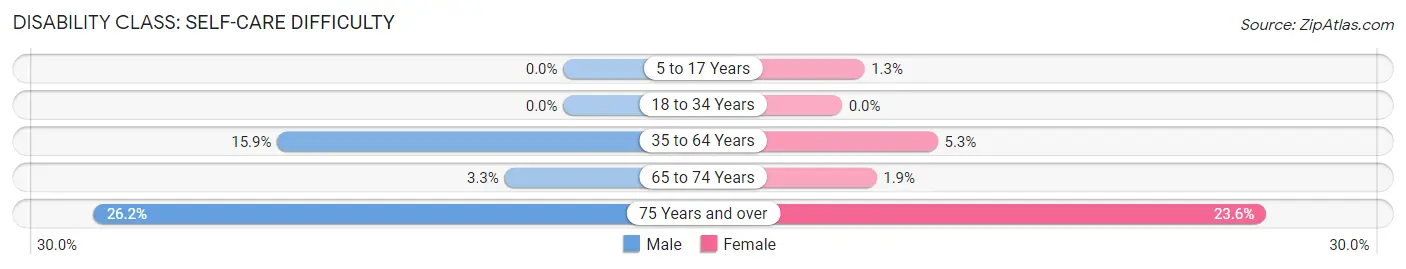
| Age Bracket | Male | Female |
| 5 to 17 Years | 0 (0.0%) | 9 (1.3%) |
| 18 to 34 Years | 0 (0.0%) | 0 (0.0%) |
| 35 to 64 Years | 246 (15.9%) | 98 (5.3%) |
| 65 to 74 Years | 20 (3.3%) | 13 (1.9%) |
| 75 Years and over | 74 (26.2%) | 154 (23.6%) |
Technology Access in Campbellsville
Computing Device Access in Campbellsville
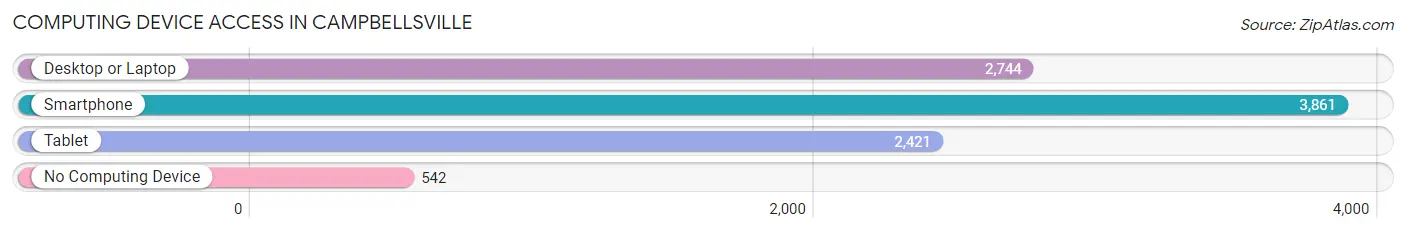
| Device Type | # Households | % Households |
| Desktop or Laptop | 2,744 | 58.7% |
| Smartphone | 3,861 | 82.5% |
| Tablet | 2,421 | 51.7% |
| No Computing Device | 542 | 11.6% |
| Total | 4,678 | 100.0% |
Internet Access in Campbellsville
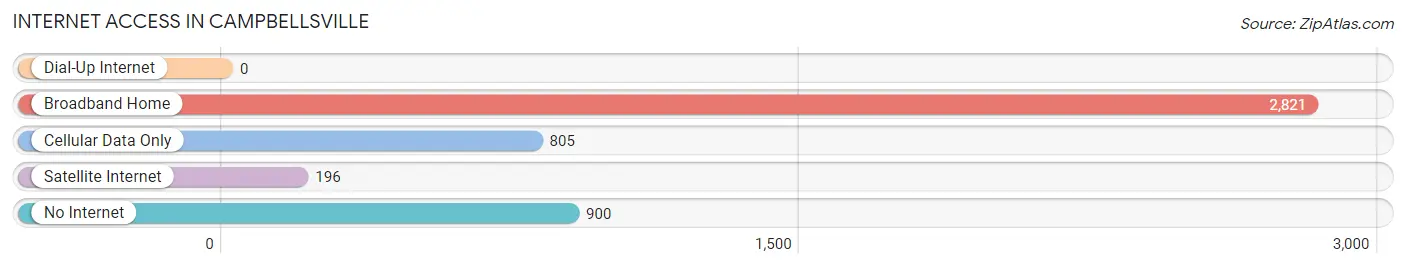
| Internet Type | # Households | % Households |
| Dial-Up Internet | 0 | 0.0% |
| Broadband Home | 2,821 | 60.3% |
| Cellular Data Only | 805 | 17.2% |
| Satellite Internet | 196 | 4.2% |
| No Internet | 900 | 19.2% |
| Total | 4,678 | 100.0% |
Campbellsville Summary
Campbellsville, Kentucky is a small city located in the heart of the Bluegrass region of the state. It is the county seat of Taylor County and is situated in the rolling hills of central Kentucky. The city has a population of 11,912 as of the 2020 census and is the largest city in the county.
History
Campbellsville was founded in 1817 by Andrew Campbell, a Revolutionary War veteran. He purchased the land from the local Native Americans and named the town after himself. The town was incorporated in 1820 and quickly became a center of commerce and industry. The town was home to a number of businesses, including a grist mill, a sawmill, a tannery, and a distillery.
In the late 19th century, Campbellsville became a major stop on the Louisville and Nashville Railroad. This allowed the town to become a major shipping center for the region. The railroad also brought new industry to the area, including a tobacco warehouse and a cotton mill.
In the early 20th century, Campbellsville experienced a period of growth and prosperity. The town was home to a number of businesses, including a furniture factory, a shoe factory, and a canning factory. The town also had a number of churches, schools, and other civic organizations.
Geography
Campbellsville is located in the rolling hills of central Kentucky. The city is situated in Taylor County, which is part of the Bluegrass region of the state. The city is located at the intersection of US Route 68 and KY Route 210. The city is approximately 70 miles south of Louisville and 60 miles north of Nashville.
The city is situated on the banks of the Green River, which is a tributary of the Ohio River. The city is surrounded by farmland and is home to a number of parks and recreational areas. The city is also home to a number of historic sites, including the Campbellsville Historic District and the Taylor County Courthouse.
Economy
Campbellsville’s economy is largely based on agriculture and manufacturing. The city is home to a number of agricultural businesses, including a number of dairy farms and a large poultry processing plant. The city is also home to a number of manufacturing businesses, including a furniture factory, a shoe factory, and a canning factory.
The city is also home to a number of retail businesses, including a number of restaurants, shops, and other businesses. The city is also home to a number of healthcare facilities, including a hospital and a number of medical clinics.
Demographics
As of the 2020 census, Campbellsville had a population of 11,912. The city has a median age of 38.7 and a median household income of $37,945. The city is predominantly white (90.2%) and has a small African American population (4.2%). The city also has a small Hispanic population (2.2%) and a small Asian population (1.2%).
Conclusion
Campbellsville, Kentucky is a small city located in the heart of the Bluegrass region of the state. It is the county seat of Taylor County and is situated in the rolling hills of central Kentucky. The city has a population of 11,912 as of the 2020 census and is the largest city in the county. The city’s economy is largely based on agriculture and manufacturing, and the city is home to a number of retail businesses, healthcare facilities, and other businesses. The city is predominantly white and has a small African American, Hispanic, and Asian population.
Common Questions
What is Per Capita Income in Campbellsville?
Per Capita income in Campbellsville is $31,588.
What is the Median Family Income in Campbellsville?
Median Family Income in Campbellsville is $67,037.
What is the Median Household income in Campbellsville?
Median Household Income in Campbellsville is $53,254.
What is Income or Wage Gap in Campbellsville?
Income or Wage Gap in Campbellsville is 19.6%.
Women in Campbellsville earn 80.4 cents for every dollar earned by a man.
What is Inequality or Gini Index in Campbellsville?
Inequality or Gini Index in Campbellsville is 0.53.
What is the Total Population of Campbellsville?
Total Population of Campbellsville is 11,434.
What is the Total Male Population of Campbellsville?
Total Male Population of Campbellsville is 5,554.
What is the Total Female Population of Campbellsville?
Total Female Population of Campbellsville is 5,880.
What is the Ratio of Males per 100 Females in Campbellsville?
There are 94.46 Males per 100 Females in Campbellsville.
What is the Ratio of Females per 100 Males in Campbellsville?
There are 105.87 Females per 100 Males in Campbellsville.
What is the Median Population Age in Campbellsville?
Median Population Age in Campbellsville is 36.3 Years.
What is the Average Family Size in Campbellsville
Average Family Size in Campbellsville is 3.0 People.
What is the Average Household Size in Campbellsville
Average Household Size in Campbellsville is 2.2 People.
How Large is the Labor Force in Campbellsville?
There are 5,176 People in the Labor Forcein in Campbellsville.
What is the Percentage of People in the Labor Force in Campbellsville?
56.5% of People are in the Labor Force in Campbellsville.
What is the Unemployment Rate in Campbellsville?
Unemployment Rate in Campbellsville is 8.1%.