Minot, ND Map & Demographics
Minot Map
Minot Overview
$41,662
PER CAPITA INCOME
$100,138
AVG FAMILY INCOME
$75,545
AVG HOUSEHOLD INCOME
34.4%
WAGE / INCOME GAP [ % ]
65.6¢/ $1
WAGE / INCOME GAP [ $ ]
$9,212
FAMILY INCOME DEFICIT
0.45
INEQUALITY / GINI INDEX
48,038
TOTAL POPULATION
25,072
MALE POPULATION
22,966
FEMALE POPULATION
109.17
MALES / 100 FEMALES
91.60
FEMALES / 100 MALES
33.0
MEDIAN AGE
3.0
AVG FAMILY SIZE
2.2
AVG HOUSEHOLD SIZE
28,740
LABOR FORCE [ PEOPLE ]
73.1%
PERCENT IN LABOR FORCE
3.7%
UNEMPLOYMENT RATE
Minot Area Codes
Income in Minot
Income Overview in Minot
Per Capita Income in Minot is $41,662, while median incomes of families and households are $100,138 and $75,545 respectively.
| Characteristic | Number | Measure |
| Per Capita Income | 48,038 | $41,662 |
| Median Family Income | 11,194 | $100,138 |
| Mean Family Income | 11,194 | $120,079 |
| Median Household Income | 21,161 | $75,545 |
| Mean Household Income | 21,161 | $92,271 |
| Income Deficit | 11,194 | $9,212 |
| Wage / Income Gap (%) | 48,038 | 34.38% |
| Wage / Income Gap ($) | 48,038 | 65.62¢ per $1 |
| Gini / Inequality Index | 48,038 | 0.45 |
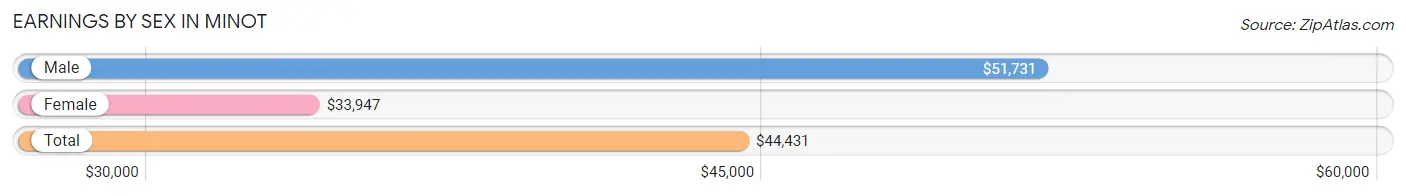
Earnings by Sex in Minot
Average Earnings in Minot are $44,431, $51,731 for men and $33,947 for women, a difference of 34.4%.
| Sex | Number | Average Earnings |
| Male | 17,126 (56.9%) | $51,731 |
| Female | 12,996 (43.1%) | $33,947 |
| Total | 30,122 (100.0%) | $44,431 |
Earnings by Sex by Income Bracket in Minot
The most common earnings brackets in Minot are $100,000+ for men (2,664 | 15.6%) and $55,000 to $64,999 for women (1,088 | 8.4%).
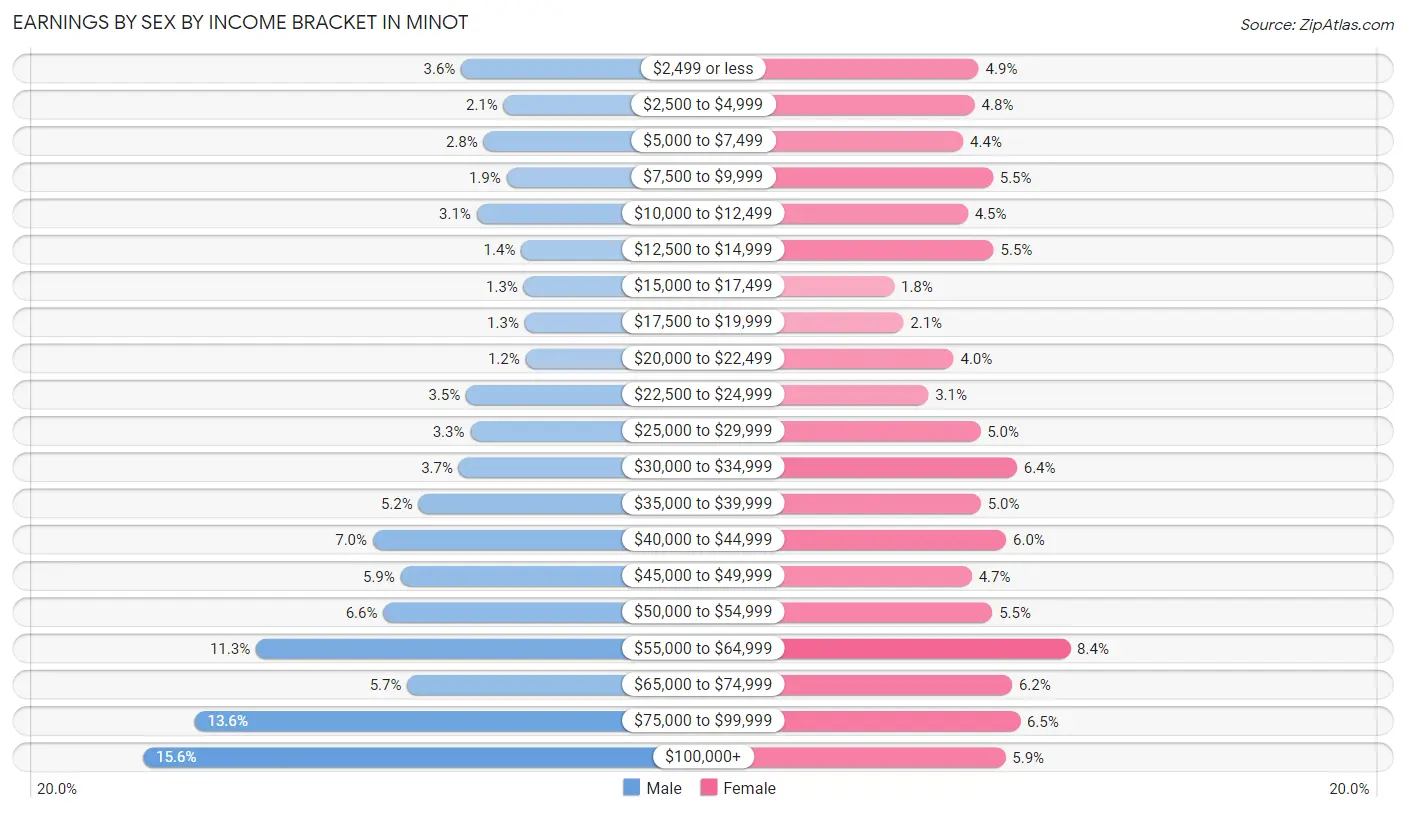
| Income | Male | Female |
| $2,499 or less | 623 (3.6%) | 642 (4.9%) |
| $2,500 to $4,999 | 351 (2.1%) | 622 (4.8%) |
| $5,000 to $7,499 | 480 (2.8%) | 566 (4.4%) |
| $7,500 to $9,999 | 333 (1.9%) | 711 (5.5%) |
| $10,000 to $12,499 | 524 (3.1%) | 589 (4.5%) |
| $12,500 to $14,999 | 238 (1.4%) | 715 (5.5%) |
| $15,000 to $17,499 | 223 (1.3%) | 230 (1.8%) |
| $17,500 to $19,999 | 216 (1.3%) | 275 (2.1%) |
| $20,000 to $22,499 | 211 (1.2%) | 520 (4.0%) |
| $22,500 to $24,999 | 593 (3.5%) | 396 (3.0%) |
| $25,000 to $29,999 | 565 (3.3%) | 650 (5.0%) |
| $30,000 to $34,999 | 638 (3.7%) | 828 (6.4%) |
| $35,000 to $39,999 | 897 (5.2%) | 652 (5.0%) |
| $40,000 to $44,999 | 1,191 (7.0%) | 776 (6.0%) |
| $45,000 to $49,999 | 1,012 (5.9%) | 608 (4.7%) |
| $50,000 to $54,999 | 1,123 (6.6%) | 708 (5.4%) |
| $55,000 to $64,999 | 1,940 (11.3%) | 1,088 (8.4%) |
| $65,000 to $74,999 | 969 (5.7%) | 804 (6.2%) |
| $75,000 to $99,999 | 2,335 (13.6%) | 844 (6.5%) |
| $100,000+ | 2,664 (15.6%) | 772 (5.9%) |
| Total | 17,126 (100.0%) | 12,996 (100.0%) |
Earnings by Sex by Educational Attainment in Minot
Average earnings in Minot are $58,813 for men and $43,530 for women, a difference of 26.0%. Men with an educational attainment of graduate degree enjoy the highest average annual earnings of $92,000, while those with less than high school education earn the least with $32,314. Women with an educational attainment of graduate degree earn the most with the average annual earnings of $72,798, while those with less than high school education have the smallest earnings of $21,056.
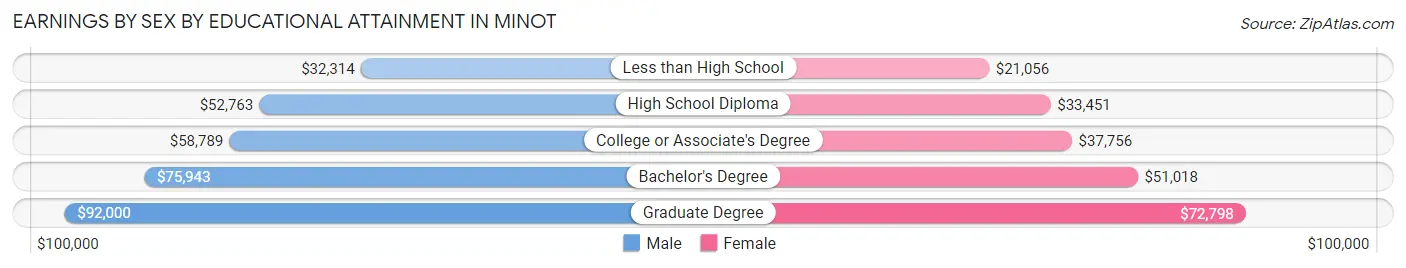
| Educational Attainment | Male Income | Female Income |
| Less than High School | $32,314 | $21,056 |
| High School Diploma | $52,763 | $33,451 |
| College or Associate's Degree | $58,789 | $37,756 |
| Bachelor's Degree | $75,943 | $51,018 |
| Graduate Degree | $92,000 | $72,798 |
| Total | $58,813 | $43,530 |
Family Income in Minot
Family Income Brackets in Minot
According to the Minot family income data, there are 2,854 families falling into the $100,000 to $149,999 income range, which is the most common income bracket and makes up 25.5% of all families. Conversely, the $10,000 to $14,999 income bracket is the least frequent group with only 168 families (1.5%) belonging to this category.
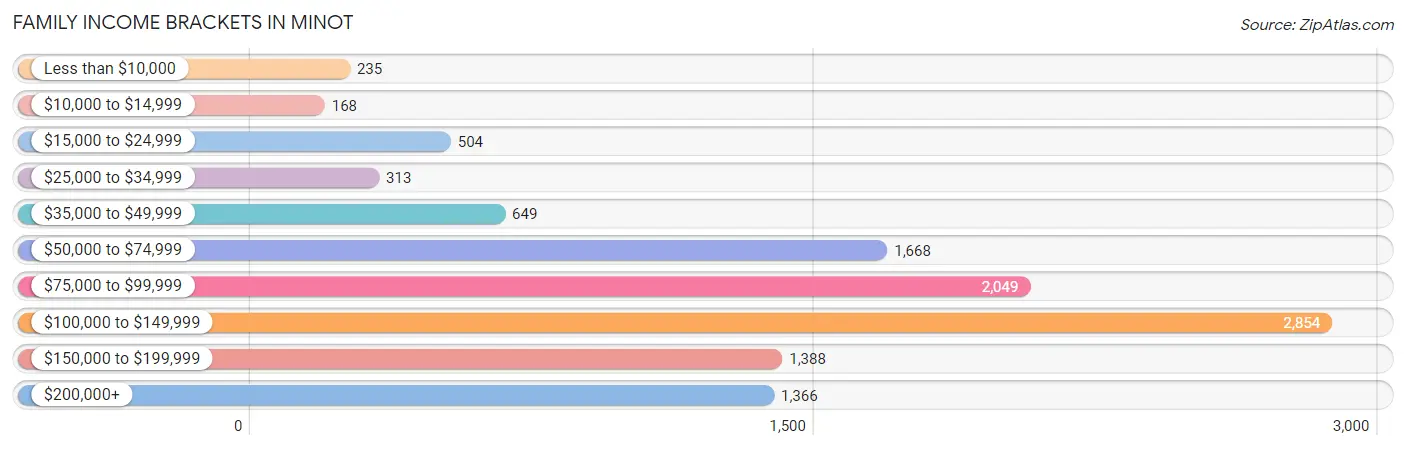
| Income Bracket | # Families | % Families |
| Less than $10,000 | 235 | 2.1% |
| $10,000 to $14,999 | 168 | 1.5% |
| $15,000 to $24,999 | 504 | 4.5% |
| $25,000 to $34,999 | 313 | 2.8% |
| $35,000 to $49,999 | 649 | 5.8% |
| $50,000 to $74,999 | 1,668 | 14.9% |
| $75,000 to $99,999 | 2,049 | 18.3% |
| $100,000 to $149,999 | 2,854 | 25.5% |
| $150,000 to $199,999 | 1,388 | 12.4% |
| $200,000+ | 1,366 | 12.2% |
Family Income by Famaliy Size in Minot
6-person families (210 | 1.9%) account for the highest median family income in Minot with $197,772 per family, while 2-person families (5,764 | 51.5%) have the highest median income of $41,864 per family member.
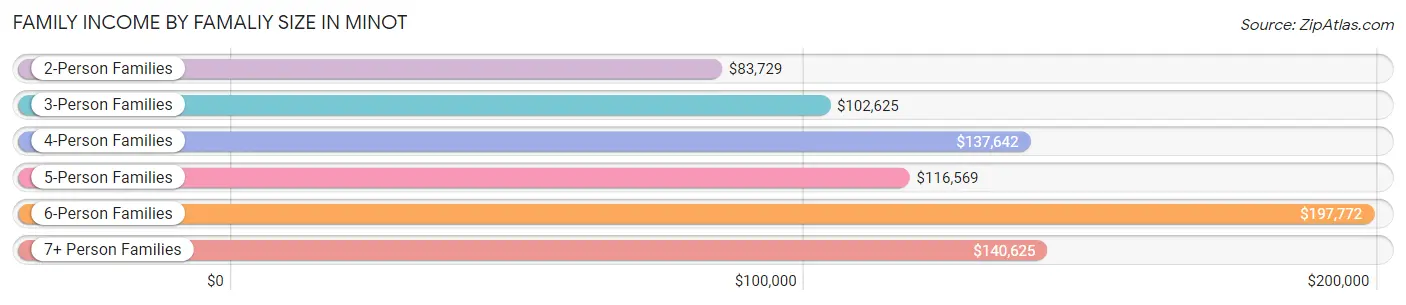
| Income Bracket | # Families | Median Income |
| 2-Person Families | 5,764 (51.5%) | $83,729 |
| 3-Person Families | 2,427 (21.7%) | $102,625 |
| 4-Person Families | 1,613 (14.4%) | $137,642 |
| 5-Person Families | 1,059 (9.5%) | $116,569 |
| 6-Person Families | 210 (1.9%) | $197,772 |
| 7+ Person Families | 121 (1.1%) | $140,625 |
| Total | 11,194 (100.0%) | $100,138 |
Family Income by Number of Earners in Minot
The median family income in Minot is $100,138, with families comprising 3+ earners (1,232) having the highest median family income of $151,986, while families with no earners (1,021) have the lowest median family income of $44,364, accounting for 11.0% and 9.1% of families, respectively.
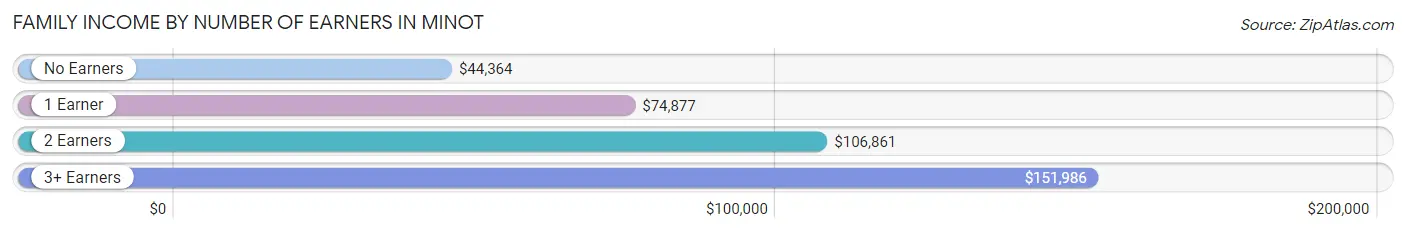
| Number of Earners | # Families | Median Income |
| No Earners | 1,021 (9.1%) | $44,364 |
| 1 Earner | 2,593 (23.2%) | $74,877 |
| 2 Earners | 6,348 (56.7%) | $106,861 |
| 3+ Earners | 1,232 (11.0%) | $151,986 |
| Total | 11,194 (100.0%) | $100,138 |
Household Income in Minot
Household Income Brackets in Minot
With 3,872 households falling in the category, the $100,000 to $149,999 income range is the most frequent in Minot, accounting for 18.3% of all households. In contrast, only 1,100 households (5.2%) fall into the $10,000 to $14,999 income bracket, making it the least populous group.
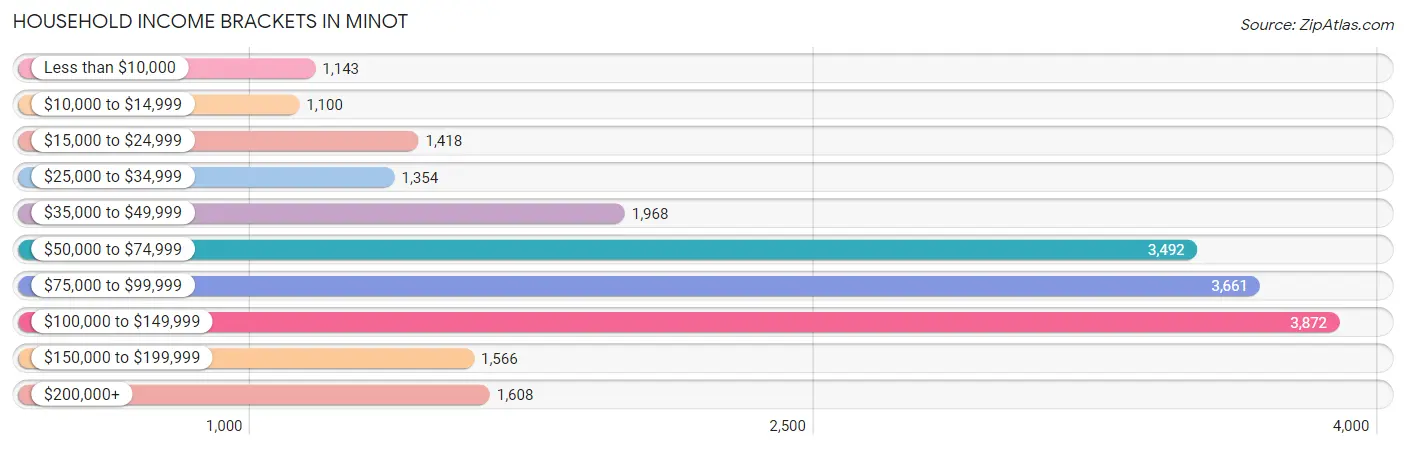
| Income Bracket | # Households | % Households |
| Less than $10,000 | 1,143 | 5.4% |
| $10,000 to $14,999 | 1,100 | 5.2% |
| $15,000 to $24,999 | 1,418 | 6.7% |
| $25,000 to $34,999 | 1,354 | 6.4% |
| $35,000 to $49,999 | 1,968 | 9.3% |
| $50,000 to $74,999 | 3,492 | 16.5% |
| $75,000 to $99,999 | 3,661 | 17.3% |
| $100,000 to $149,999 | 3,872 | 18.3% |
| $150,000 to $199,999 | 1,566 | 7.4% |
| $200,000+ | 1,608 | 7.6% |
Household Income by Householder Age in Minot
The median household income in Minot is $75,545, with the highest median household income of $89,443 found in the 45 to 64 years age bracket for the primary householder. A total of 5,900 households (27.9%) fall into this category. Meanwhile, the 65+ years age bracket for the primary householder has the lowest median household income of $46,307, with 4,266 households (20.2%) in this group.
| Income Bracket | # Households | Median Income |
| 15 to 24 Years | 2,432 (11.5%) | $47,000 |
| 25 to 44 Years | 8,563 (40.5%) | $82,901 |
| 45 to 64 Years | 5,900 (27.9%) | $89,443 |
| 65+ Years | 4,266 (20.2%) | $46,307 |
| Total | 21,161 (100.0%) | $75,545 |
Poverty in Minot
Income Below Poverty by Sex and Age in Minot
With 8.7% poverty level for males and 14.2% for females among the residents of Minot, 18 to 24 year old males and 18 to 24 year old females are the most vulnerable to poverty, with 508 males (15.3%) and 815 females (30.5%) in their respective age groups living below the poverty level.
| Age Bracket | Male | Female |
| Under 5 Years | 180 (11.8%) | 199 (13.5%) |
| 5 Years | 6 (2.2%) | 12 (4.3%) |
| 6 to 11 Years | 80 (4.8%) | 44 (2.8%) |
| 12 to 14 Years | 35 (4.8%) | 88 (13.5%) |
| 15 Years | 16 (5.3%) | 0 (0.0%) |
| 16 and 17 Years | 14 (2.4%) | 18 (3.1%) |
| 18 to 24 Years | 508 (15.3%) | 815 (30.5%) |
| 25 to 34 Years | 546 (10.3%) | 501 (12.6%) |
| 35 to 44 Years | 169 (4.9%) | 297 (10.7%) |
| 45 to 54 Years | 283 (12.6%) | 129 (6.1%) |
| 55 to 64 Years | 145 (6.2%) | 347 (13.0%) |
| 65 to 74 Years | 99 (5.7%) | 389 (23.0%) |
| 75 Years and over | 51 (4.9%) | 331 (19.0%) |
| Total | 2,132 (8.7%) | 3,170 (14.2%) |
Income Above Poverty by Sex and Age in Minot
According to the poverty statistics in Minot, males aged 5 years and females aged 15 years are the age groups that are most secure financially, with 97.8% of males and 100.0% of females in these age groups living above the poverty line.
| Age Bracket | Male | Female |
| Under 5 Years | 1,340 (88.2%) | 1,277 (86.5%) |
| 5 Years | 271 (97.8%) | 265 (95.7%) |
| 6 to 11 Years | 1,581 (95.2%) | 1,528 (97.2%) |
| 12 to 14 Years | 698 (95.2%) | 566 (86.5%) |
| 15 Years | 286 (94.7%) | 182 (100.0%) |
| 16 and 17 Years | 577 (97.6%) | 569 (96.9%) |
| 18 to 24 Years | 2,809 (84.7%) | 1,853 (69.5%) |
| 25 to 34 Years | 4,772 (89.7%) | 3,463 (87.4%) |
| 35 to 44 Years | 3,293 (95.1%) | 2,468 (89.3%) |
| 45 to 54 Years | 1,966 (87.4%) | 1,985 (93.9%) |
| 55 to 64 Years | 2,175 (93.8%) | 2,320 (87.0%) |
| 65 to 74 Years | 1,643 (94.3%) | 1,300 (77.0%) |
| 75 Years and over | 981 (95.1%) | 1,409 (81.0%) |
| Total | 22,392 (91.3%) | 19,185 (85.8%) |
Income Below Poverty Among Married-Couple Families in Minot
The poverty statistics for married-couple families in Minot show that 4.0% or 346 of the total 8,750 families live below the poverty line. Families with 1 or 2 children have the highest poverty rate of 5.1%, comprising of 144 families. On the other hand, families with 5 or more children have the lowest poverty rate of 0.0%, which includes 0 families.
| Children | Above Poverty | Below Poverty |
| No Children | 4,791 (96.3%) | 184 (3.7%) |
| 1 or 2 Children | 2,678 (94.9%) | 144 (5.1%) |
| 3 or 4 Children | 860 (98.0%) | 18 (2.1%) |
| 5 or more Children | 75 (100.0%) | 0 (0.0%) |
| Total | 8,404 (96.1%) | 346 (4.0%) |
Income Below Poverty Among Single-Parent Households in Minot
According to the poverty data in Minot, 14.3% or 162 single-father households and 15.6% or 205 single-mother households are living below the poverty line. Among single-father households, those with no children have the highest poverty rate, with 106 households (16.7%) experiencing poverty. Likewise, among single-mother households, those with 3 or 4 children have the highest poverty rate, with 113 households (72.4%) falling below the poverty line.
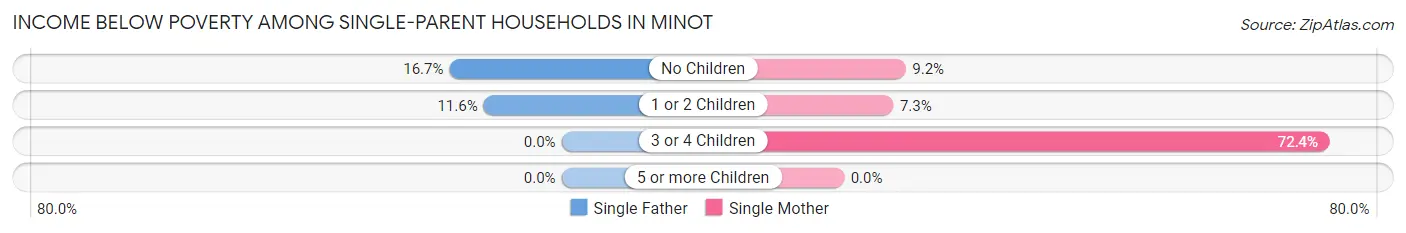
| Children | Single Father | Single Mother |
| No Children | 106 (16.7%) | 35 (9.2%) |
| 1 or 2 Children | 56 (11.6%) | 57 (7.3%) |
| 3 or 4 Children | 0 (0.0%) | 113 (72.4%) |
| 5 or more Children | 0 (0.0%) | 0 (0.0%) |
| Total | 162 (14.3%) | 205 (15.6%) |
Income Below Poverty Among Married-Couple vs Single-Parent Households in Minot
The poverty data for Minot shows that 346 of the married-couple family households (4.0%) and 367 of the single-parent households (15.0%) are living below the poverty level. Within the married-couple family households, those with 1 or 2 children have the highest poverty rate, with 144 households (5.1%) falling below the poverty line. Among the single-parent households, those with 3 or 4 children have the highest poverty rate, with 113 household (66.5%) living below poverty.
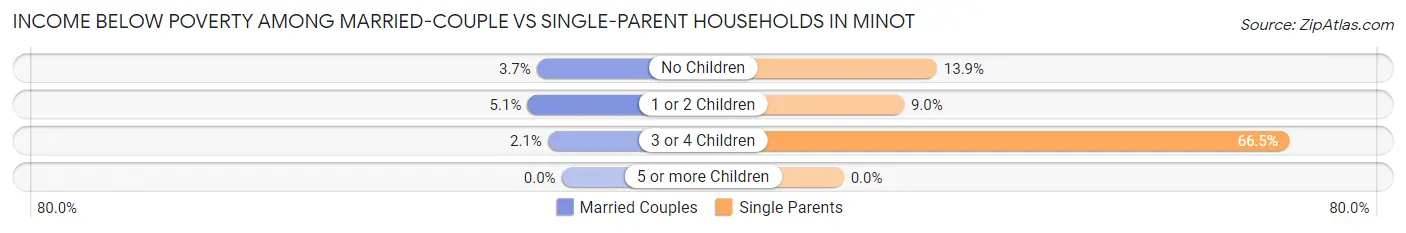
| Children | Married-Couple Families | Single-Parent Households |
| No Children | 184 (3.7%) | 141 (13.9%) |
| 1 or 2 Children | 144 (5.1%) | 113 (9.0%) |
| 3 or 4 Children | 18 (2.1%) | 113 (66.5%) |
| 5 or more Children | 0 (0.0%) | 0 (0.0%) |
| Total | 346 (4.0%) | 367 (15.0%) |
Race in Minot
The most populous races in Minot are White / Caucasian (39,494 | 82.2%), Hispanic or Latino (3,569 | 7.4%), and Two or more Races (3,550 | 7.4%).
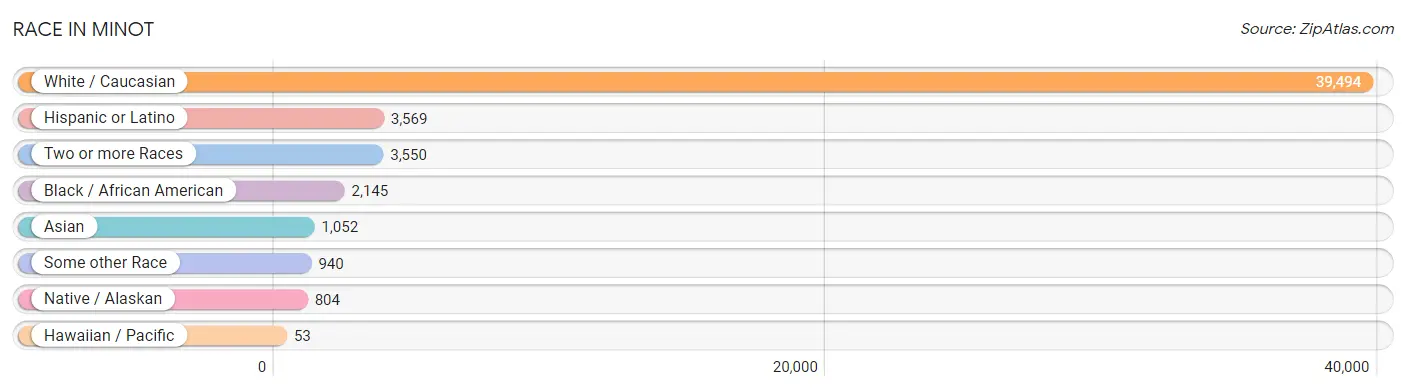
| Race | # Population | % Population |
| Asian | 1,052 | 2.2% |
| Black / African American | 2,145 | 4.5% |
| Hawaiian / Pacific | 53 | 0.1% |
| Hispanic or Latino | 3,569 | 7.4% |
| Native / Alaskan | 804 | 1.7% |
| White / Caucasian | 39,494 | 82.2% |
| Two or more Races | 3,550 | 7.4% |
| Some other Race | 940 | 2.0% |
| Total | 48,038 | 100.0% |
Ancestry in Minot
The most populous ancestries reported in Minot are German (13,684 | 28.5%), Norwegian (9,729 | 20.3%), Irish (3,733 | 7.8%), English (2,545 | 5.3%), and Mexican (1,884 | 3.9%), together accounting for 65.7% of all Minot residents.
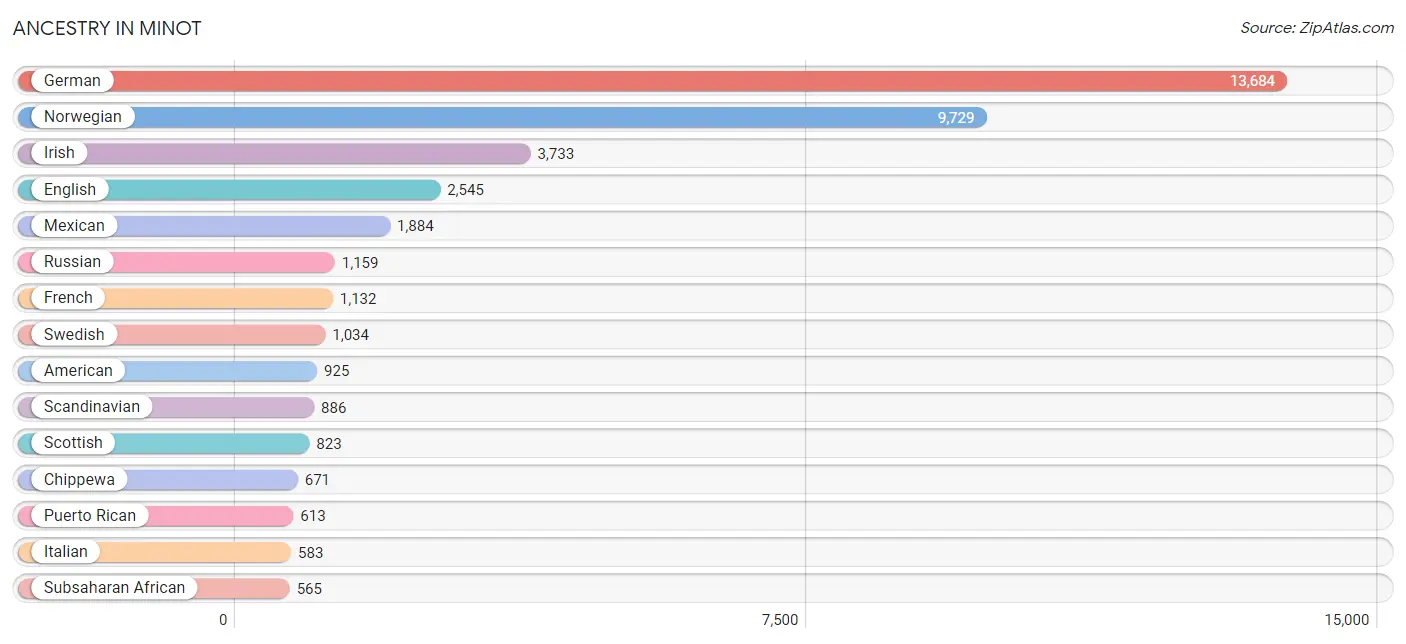
| Ancestry | # Population | % Population |
| African | 154 | 0.3% |
| American | 925 | 1.9% |
| Apache | 21 | 0.0% |
| Arab | 282 | 0.6% |
| Assyrian / Chaldean / Syriac | 14 | 0.0% |
| Australian | 24 | 0.1% |
| Austrian | 138 | 0.3% |
| Belgian | 37 | 0.1% |
| Bhutanese | 326 | 0.7% |
| Blackfeet | 85 | 0.2% |
| British | 355 | 0.7% |
| Burmese | 84 | 0.2% |
| Canadian | 100 | 0.2% |
| Celtic | 10 | 0.0% |
| Central American | 404 | 0.8% |
| Central American Indian | 129 | 0.3% |
| Cherokee | 57 | 0.1% |
| Chippewa | 671 | 1.4% |
| Colombian | 16 | 0.0% |
| Cree | 28 | 0.1% |
| Creek | 68 | 0.1% |
| Cuban | 50 | 0.1% |
| Czech | 216 | 0.4% |
| Czechoslovakian | 7 | 0.0% |
| Danish | 454 | 0.9% |
| Dominican | 20 | 0.0% |
| Dutch | 489 | 1.0% |
| Eastern European | 34 | 0.1% |
| Ecuadorian | 47 | 0.1% |
| English | 2,545 | 5.3% |
| European | 545 | 1.1% |
| Fijian | 2 | 0.0% |
| Finnish | 208 | 0.4% |
| French | 1,132 | 2.4% |
| French American Indian | 3 | 0.0% |
| French Canadian | 291 | 0.6% |
| German | 13,684 | 28.5% |
| German Russian | 53 | 0.1% |
| Greek | 123 | 0.3% |
| Guamanian / Chamorro | 28 | 0.1% |
| Guatemalan | 40 | 0.1% |
| Haitian | 2 | 0.0% |
| Hungarian | 68 | 0.1% |
| Icelander | 93 | 0.2% |
| Indian (Asian) | 92 | 0.2% |
| Inupiat | 19 | 0.0% |
| Irish | 3,733 | 7.8% |
| Italian | 583 | 1.2% |
| Jamaican | 104 | 0.2% |
| Korean | 441 | 0.9% |
| Laotian | 123 | 0.3% |
| Lebanese | 30 | 0.1% |
| Liberian | 36 | 0.1% |
| Lithuanian | 101 | 0.2% |
| Luxembourger | 15 | 0.0% |
| Mexican | 1,884 | 3.9% |
| Native Hawaiian | 93 | 0.2% |
| Nicaraguan | 159 | 0.3% |
| Nigerian | 18 | 0.0% |
| Northern European | 174 | 0.4% |
| Norwegian | 9,729 | 20.3% |
| Pakistani | 54 | 0.1% |
| Panamanian | 152 | 0.3% |
| Polish | 482 | 1.0% |
| Portuguese | 52 | 0.1% |
| Pueblo | 21 | 0.0% |
| Puerto Rican | 613 | 1.3% |
| Romanian | 97 | 0.2% |
| Russian | 1,159 | 2.4% |
| Salvadoran | 53 | 0.1% |
| Samoan | 2 | 0.0% |
| Scandinavian | 886 | 1.8% |
| Scotch-Irish | 481 | 1.0% |
| Scottish | 823 | 1.7% |
| Senegalese | 67 | 0.1% |
| Sioux | 236 | 0.5% |
| Slovak | 64 | 0.1% |
| Somali | 139 | 0.3% |
| South American | 63 | 0.1% |
| Spaniard | 175 | 0.4% |
| Spanish | 54 | 0.1% |
| Sri Lankan | 31 | 0.1% |
| Subsaharan African | 565 | 1.2% |
| Swedish | 1,034 | 2.1% |
| Swiss | 122 | 0.3% |
| Syrian | 26 | 0.1% |
| Thai | 116 | 0.2% |
| Tongan | 23 | 0.1% |
| Ukrainian | 318 | 0.7% |
| Welsh | 69 | 0.1% |
| Yup'ik | 29 | 0.1% | View All 91 Rows |
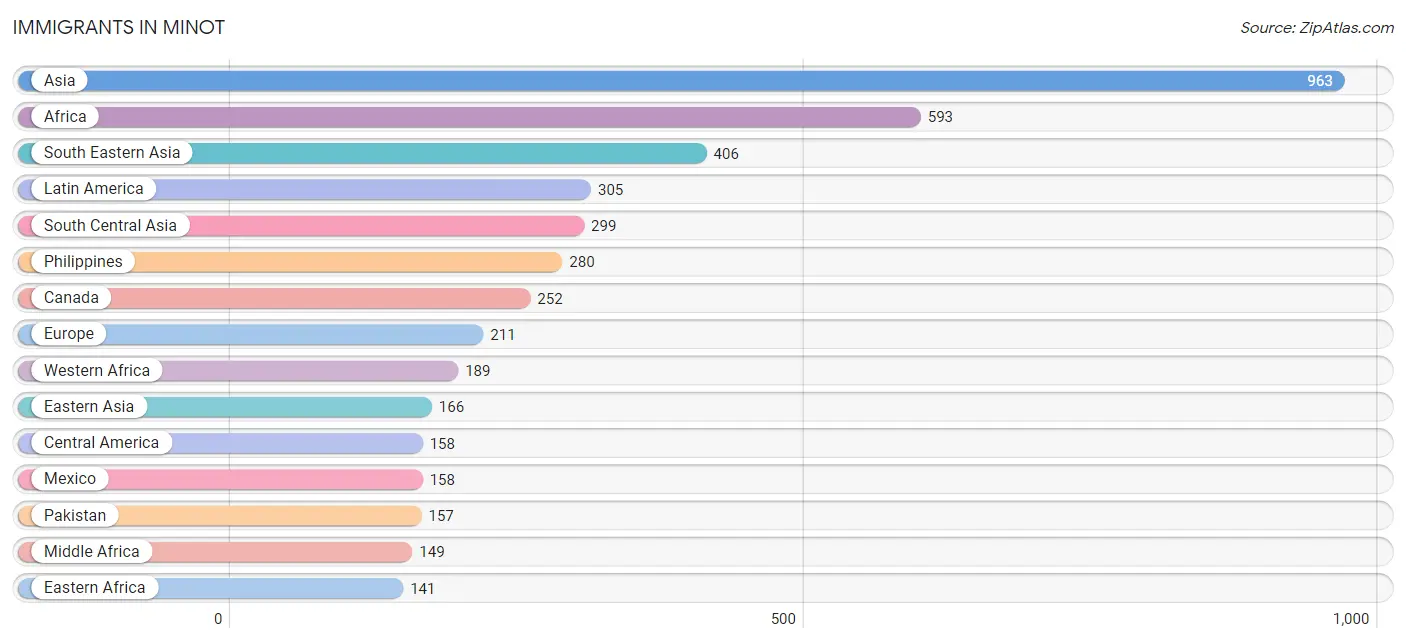
Immigrants in Minot
The most numerous immigrant groups reported in Minot came from Asia (963 | 2.0%), Africa (593 | 1.2%), South Eastern Asia (406 | 0.9%), Latin America (305 | 0.6%), and South Central Asia (299 | 0.6%), together accounting for 5.3% of all Minot residents.
| Immigration Origin | # Population | % Population |
| Africa | 593 | 1.2% |
| Asia | 963 | 2.0% |
| Australia | 24 | 0.1% |
| Bangladesh | 3 | 0.0% |
| Cameroon | 138 | 0.3% |
| Canada | 252 | 0.5% |
| Caribbean | 50 | 0.1% |
| Central America | 158 | 0.3% |
| Chile | 70 | 0.2% |
| China | 63 | 0.1% |
| Colombia | 16 | 0.0% |
| Congo | 11 | 0.0% |
| Cuba | 50 | 0.1% |
| Eastern Africa | 141 | 0.3% |
| Eastern Asia | 166 | 0.4% |
| Eastern Europe | 57 | 0.1% |
| Ecuador | 11 | 0.0% |
| Egypt | 51 | 0.1% |
| England | 89 | 0.2% |
| Europe | 211 | 0.4% |
| Germany | 41 | 0.1% |
| Greece | 8 | 0.0% |
| Indonesia | 63 | 0.1% |
| Iran | 18 | 0.0% |
| Israel | 3 | 0.0% |
| Japan | 92 | 0.2% |
| Korea | 11 | 0.0% |
| Latin America | 305 | 0.6% |
| Lebanon | 3 | 0.0% |
| Liberia | 71 | 0.2% |
| Lithuania | 28 | 0.1% |
| Mexico | 158 | 0.3% |
| Middle Africa | 149 | 0.3% |
| Nepal | 82 | 0.2% |
| Nigeria | 35 | 0.1% |
| Northern Africa | 51 | 0.1% |
| Northern Europe | 105 | 0.2% |
| Oceania | 26 | 0.1% |
| Pakistan | 157 | 0.3% |
| Philippines | 280 | 0.6% |
| Poland | 18 | 0.0% |
| Romania | 11 | 0.0% |
| Saudi Arabia | 44 | 0.1% |
| Senegal | 43 | 0.1% |
| Somalia | 141 | 0.3% |
| South America | 97 | 0.2% |
| South Central Asia | 299 | 0.6% |
| South Eastern Asia | 406 | 0.9% |
| Southern Europe | 8 | 0.0% |
| Syria | 42 | 0.1% |
| Thailand | 40 | 0.1% |
| Vietnam | 23 | 0.1% |
| Western Africa | 189 | 0.4% |
| Western Asia | 92 | 0.2% |
| Western Europe | 41 | 0.1% | View All 55 Rows |
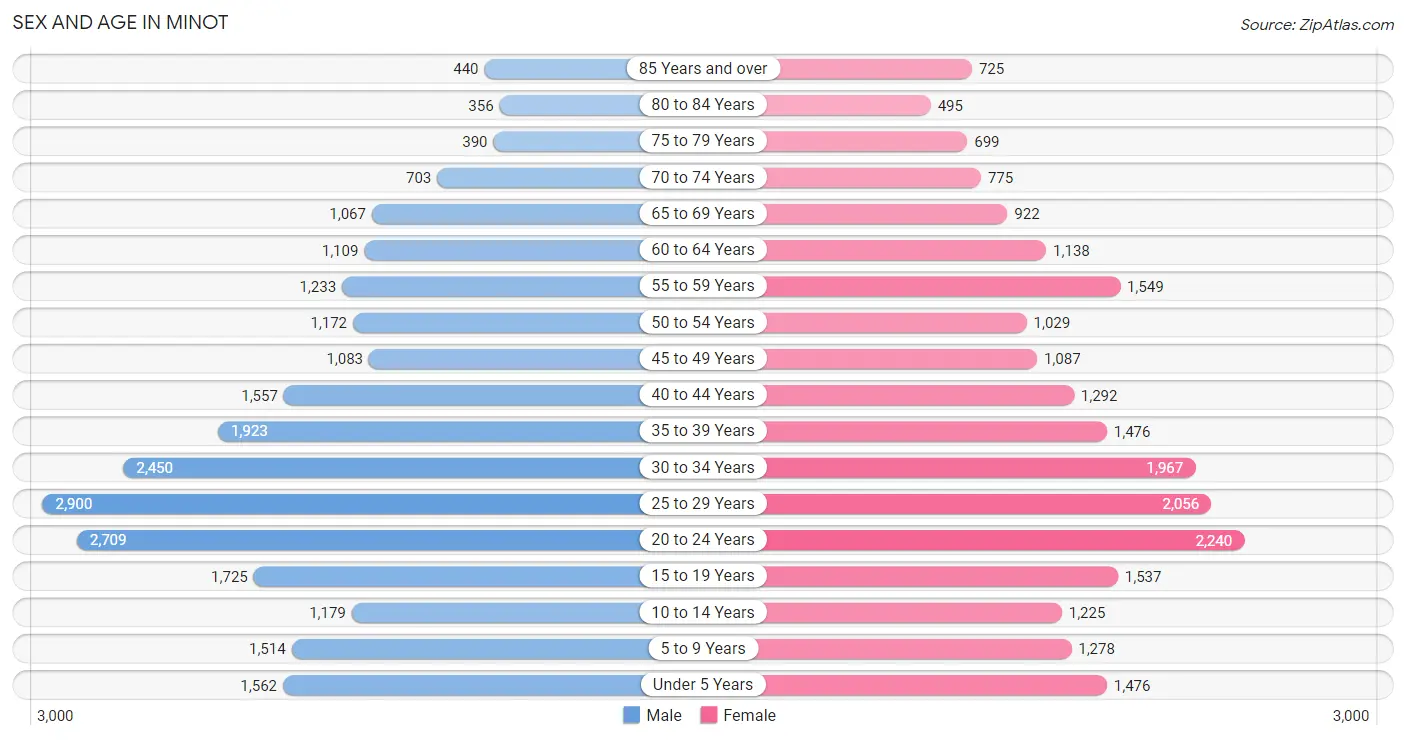
Sex and Age in Minot
Sex and Age in Minot
The most populous age groups in Minot are 25 to 29 Years (2,900 | 11.6%) for men and 20 to 24 Years (2,240 | 9.8%) for women.
| Age Bracket | Male | Female |
| Under 5 Years | 1,562 (6.2%) | 1,476 (6.4%) |
| 5 to 9 Years | 1,514 (6.0%) | 1,278 (5.6%) |
| 10 to 14 Years | 1,179 (4.7%) | 1,225 (5.3%) |
| 15 to 19 Years | 1,725 (6.9%) | 1,537 (6.7%) |
| 20 to 24 Years | 2,709 (10.8%) | 2,240 (9.8%) |
| 25 to 29 Years | 2,900 (11.6%) | 2,056 (8.9%) |
| 30 to 34 Years | 2,450 (9.8%) | 1,967 (8.6%) |
| 35 to 39 Years | 1,923 (7.7%) | 1,476 (6.4%) |
| 40 to 44 Years | 1,557 (6.2%) | 1,292 (5.6%) |
| 45 to 49 Years | 1,083 (4.3%) | 1,087 (4.7%) |
| 50 to 54 Years | 1,172 (4.7%) | 1,029 (4.5%) |
| 55 to 59 Years | 1,233 (4.9%) | 1,549 (6.7%) |
| 60 to 64 Years | 1,109 (4.4%) | 1,138 (5.0%) |
| 65 to 69 Years | 1,067 (4.3%) | 922 (4.0%) |
| 70 to 74 Years | 703 (2.8%) | 775 (3.4%) |
| 75 to 79 Years | 390 (1.6%) | 699 (3.0%) |
| 80 to 84 Years | 356 (1.4%) | 495 (2.2%) |
| 85 Years and over | 440 (1.8%) | 725 (3.2%) |
| Total | 25,072 (100.0%) | 22,966 (100.0%) |
Families and Households in Minot
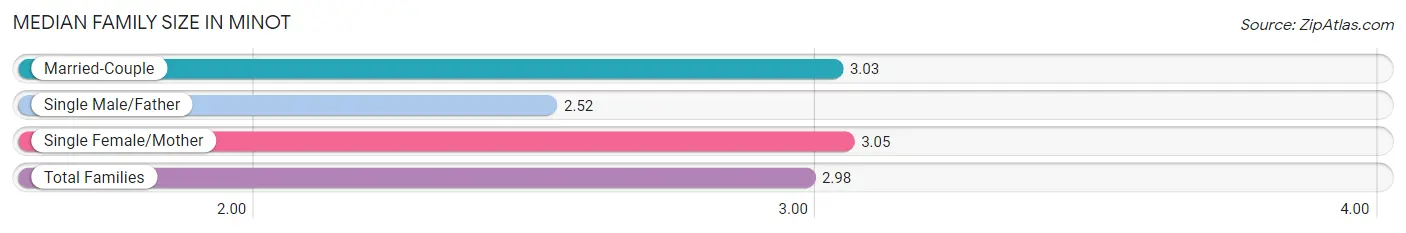
Median Family Size in Minot
The median family size in Minot is 2.98 persons per family, with single female/mother families (1,314 | 11.7%) accounting for the largest median family size of 3.05 persons per family. On the other hand, single male/father families (1,130 | 10.1%) represent the smallest median family size with 2.52 persons per family.
| Family Type | # Families | Family Size |
| Married-Couple | 8,750 (78.2%) | 3.03 |
| Single Male/Father | 1,130 (10.1%) | 2.52 |
| Single Female/Mother | 1,314 (11.7%) | 3.05 |
| Total Families | 11,194 (100.0%) | 2.98 |
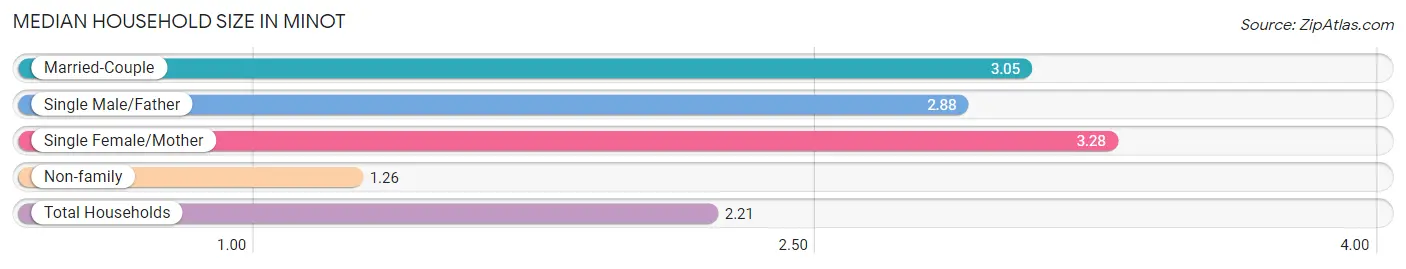
Median Household Size in Minot
The median household size in Minot is 2.21 persons per household, with single female/mother households (1,314 | 6.2%) accounting for the largest median household size of 3.28 persons per household. non-family households (9,967 | 47.1%) represent the smallest median household size with 1.26 persons per household.
| Household Type | # Households | Household Size |
| Married-Couple | 8,750 (41.3%) | 3.05 |
| Single Male/Father | 1,130 (5.3%) | 2.88 |
| Single Female/Mother | 1,314 (6.2%) | 3.28 |
| Non-family | 9,967 (47.1%) | 1.26 |
| Total Households | 21,161 (100.0%) | 2.21 |
Household Size by Marriage Status in Minot
Out of a total of 21,161 households in Minot, 11,194 (52.9%) are family households, while 9,967 (47.1%) are nonfamily households. The most numerous type of family households are 2-person households, comprising 5,366, and the most common type of nonfamily households are 1-person households, comprising 7,821.
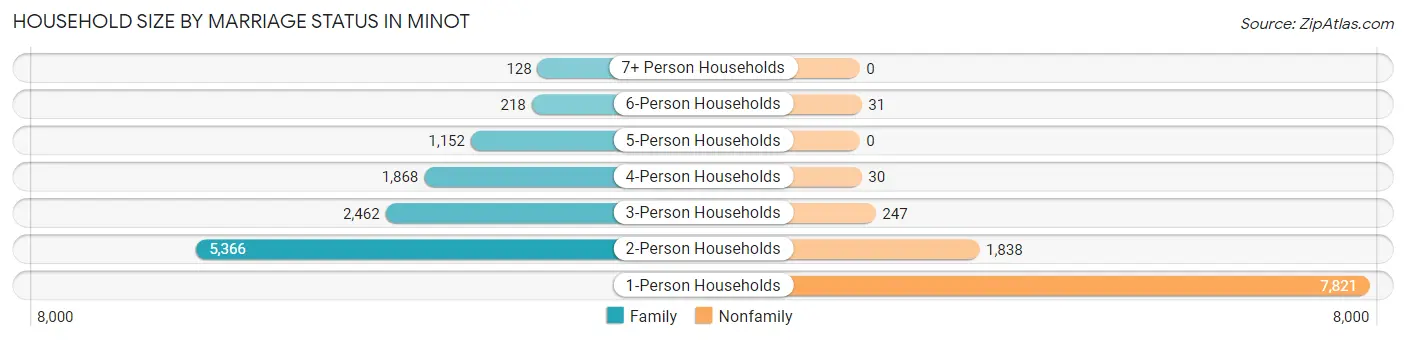
| Household Size | Family Households | Nonfamily Households |
| 1-Person Households | - | 7,821 (37.0%) |
| 2-Person Households | 5,366 (25.4%) | 1,838 (8.7%) |
| 3-Person Households | 2,462 (11.6%) | 247 (1.2%) |
| 4-Person Households | 1,868 (8.8%) | 30 (0.1%) |
| 5-Person Households | 1,152 (5.4%) | 0 (0.0%) |
| 6-Person Households | 218 (1.0%) | 31 (0.2%) |
| 7+ Person Households | 128 (0.6%) | 0 (0.0%) |
| Total | 11,194 (52.9%) | 9,967 (47.1%) |
Female Fertility in Minot
Fertility by Age in Minot
Average fertility rate in Minot is 51.0 births per 1,000 women. Women in the age bracket of 20 to 34 years have the highest fertility rate with 74.0 births per 1,000 women. Women in the age bracket of 20 to 34 years acount for 77.0% of all women with births.
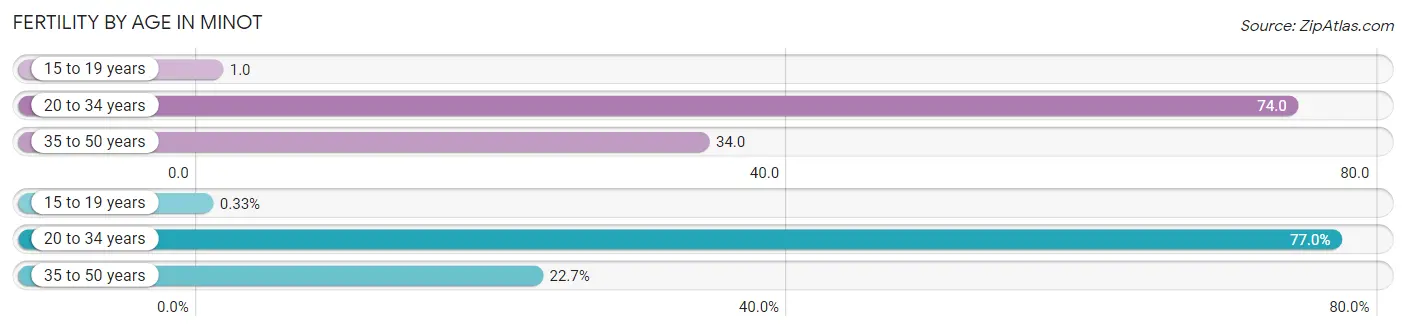
| Age Bracket | Women with Births | Births / 1,000 Women |
| 15 to 19 years | 2 (0.3%) | 1.0 |
| 20 to 34 years | 461 (77.0%) | 74.0 |
| 35 to 50 years | 136 (22.7%) | 34.0 |
| Total | 599 (100.0%) | 51.0 |
Fertility by Age by Marriage Status in Minot
74.5% of women with births (599) in Minot are married. The highest percentage of unmarried women with births falls into 15 to 19 years age bracket with 100.0% of them unmarried at the time of birth, while the lowest percentage of unmarried women with births belong to 35 to 50 years age bracket with 0.0% of them unmarried.
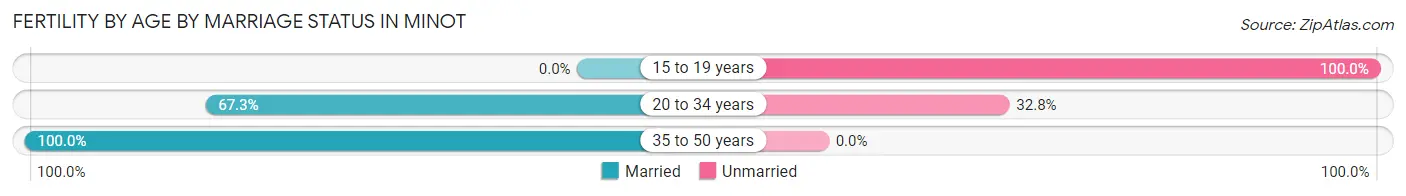
| Age Bracket | Married | Unmarried |
| 15 to 19 years | 0 (0.0%) | 2 (100.0%) |
| 20 to 34 years | 310 (67.2%) | 151 (32.8%) |
| 35 to 50 years | 136 (100.0%) | 0 (0.0%) |
| Total | 446 (74.5%) | 153 (25.5%) |
Fertility by Education in Minot
Average fertility rate in Minot is 51.0 births per 1,000 women. Women with the education attainment of bachelor's degree have the highest fertility rate of 99.0 births per 1,000 women, while women with the education attainment of college or associate's degree have the lowest fertility at 16.0 births per 1,000 women. Women with the education attainment of bachelor's degree represent 49.2% of all women with births.
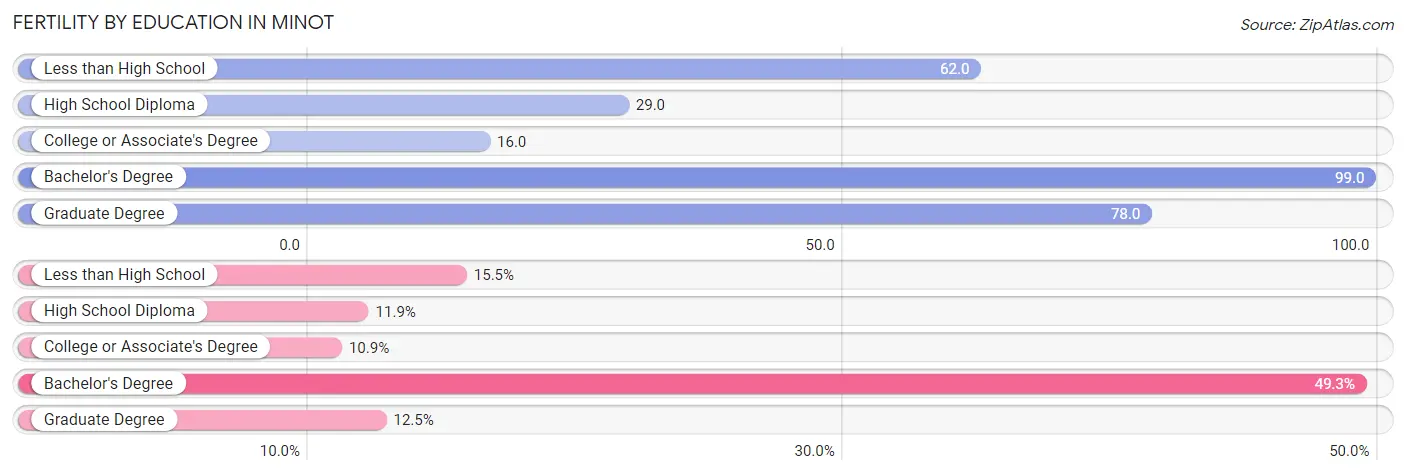
| Educational Attainment | Women with Births | Births / 1,000 Women |
| Less than High School | 93 (15.5%) | 62.0 |
| High School Diploma | 71 (11.8%) | 29.0 |
| College or Associate's Degree | 65 (10.8%) | 16.0 |
| Bachelor's Degree | 295 (49.2%) | 99.0 |
| Graduate Degree | 75 (12.5%) | 78.0 |
| Total | 599 (100.0%) | 51.0 |
Fertility by Education by Marriage Status in Minot
25.5% of women with births in Minot are unmarried. Women with the educational attainment of bachelor's degree are most likely to be married with 95.3% of them married at childbirth, while women with the educational attainment of high school diploma are least likely to be married with 60.6% of them unmarried at childbirth.
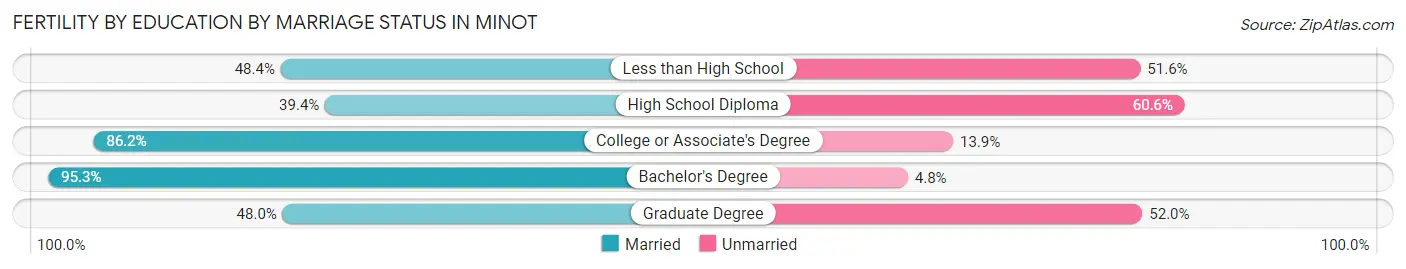
| Educational Attainment | Married | Unmarried |
| Less than High School | 45 (48.4%) | 48 (51.6%) |
| High School Diploma | 28 (39.4%) | 43 (60.6%) |
| College or Associate's Degree | 56 (86.2%) | 9 (13.9%) |
| Bachelor's Degree | 281 (95.3%) | 14 (4.8%) |
| Graduate Degree | 36 (48.0%) | 39 (52.0%) |
| Total | 446 (74.5%) | 153 (25.5%) |
Employment Characteristics in Minot
Employment by Class of Employer in Minot
Among the 26,841 employed individuals in Minot, private company employees (15,208 | 56.7%), federal government employees (3,488 | 13.0%), and not-for-profit organizations (2,731 | 10.2%) make up the most common classes of employment.
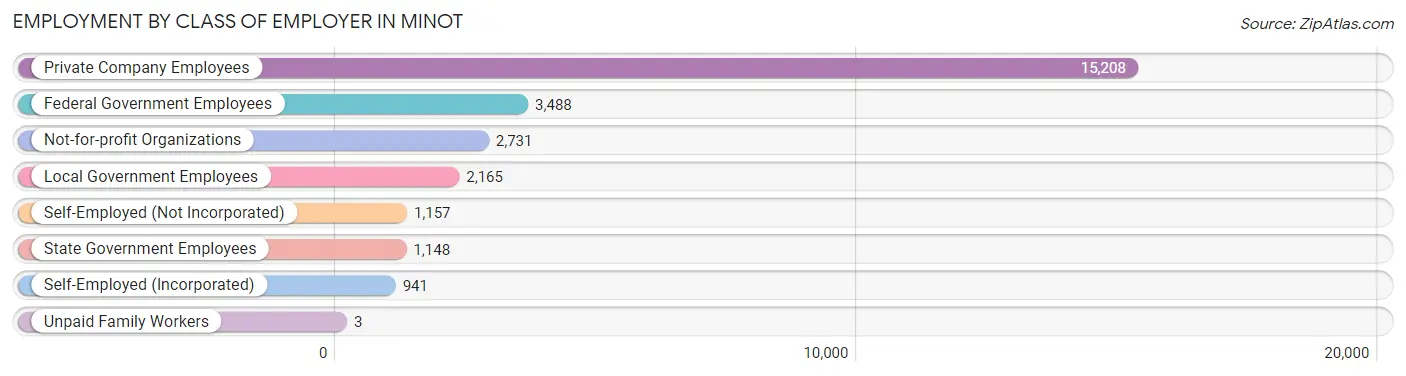
| Employer Class | # Employees | % Employees |
| Private Company Employees | 15,208 | 56.7% |
| Self-Employed (Incorporated) | 941 | 3.5% |
| Self-Employed (Not Incorporated) | 1,157 | 4.3% |
| Not-for-profit Organizations | 2,731 | 10.2% |
| Local Government Employees | 2,165 | 8.1% |
| State Government Employees | 1,148 | 4.3% |
| Federal Government Employees | 3,488 | 13.0% |
| Unpaid Family Workers | 3 | 0.0% |
| Total | 26,841 | 100.0% |
Employment Status by Age in Minot
According to the labor force statistics for Minot, out of the total population over 16 years of age (39,316), 73.1% or 28,740 individuals are in the labor force, with 3.7% or 1,063 of them unemployed. The age group with the highest labor force participation rate is 35 to 44 years, with 89.8% or 5,611 individuals in the labor force. Within the labor force, the 20 to 24 years age range has the highest percentage of unemployed individuals, with 13.8% or 605 of them being unemployed.
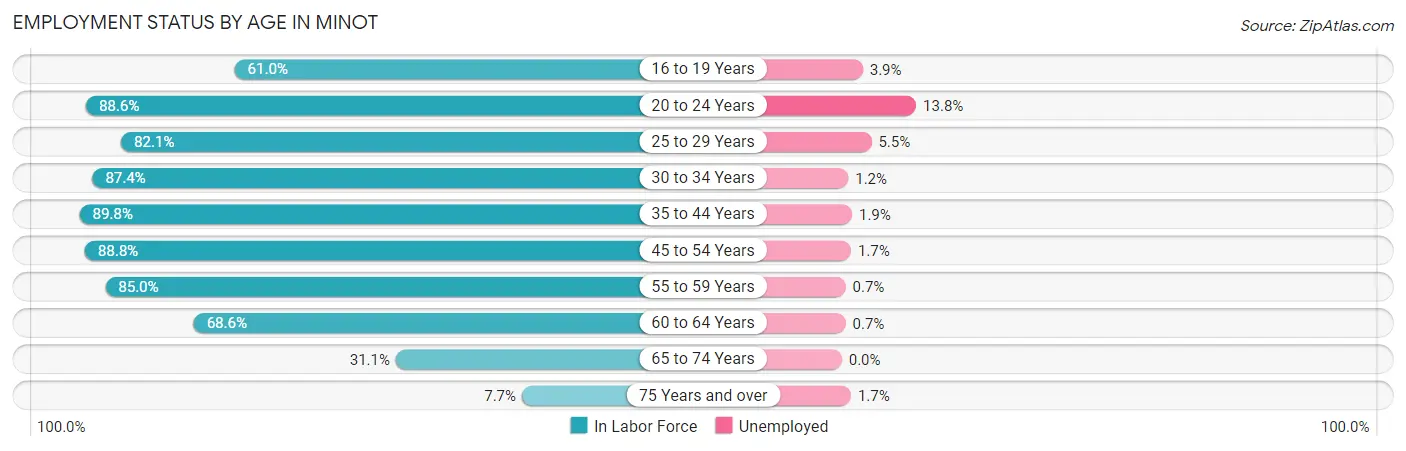
| Age Bracket | In Labor Force | Unemployed |
| 16 to 19 Years | 1,692 (61.0%) | 66 (3.9%) |
| 20 to 24 Years | 4,385 (88.6%) | 605 (13.8%) |
| 25 to 29 Years | 4,069 (82.1%) | 224 (5.5%) |
| 30 to 34 Years | 3,860 (87.4%) | 46 (1.2%) |
| 35 to 44 Years | 5,611 (89.8%) | 107 (1.9%) |
| 45 to 54 Years | 3,881 (88.8%) | 66 (1.7%) |
| 55 to 59 Years | 2,365 (85.0%) | 17 (0.7%) |
| 60 to 64 Years | 1,541 (68.6%) | 11 (0.7%) |
| 65 to 74 Years | 1,078 (31.1%) | 0 (0.0%) |
| 75 Years and over | 239 (7.7%) | 4 (1.7%) |
| Total | 28,740 (73.1%) | 1,063 (3.7%) |
Employment Status by Educational Attainment in Minot
According to labor force statistics for Minot, 85.2% of individuals (21,318) out of the total population between 25 and 64 years of age (25,021) are in the labor force, with 2.1% or 448 of them being unemployed. The group with the highest labor force participation rate are those with the educational attainment of bachelor's degree or higher, with 90.6% or 7,228 individuals in the labor force. Within the labor force, individuals with less than high school education have the highest percentage of unemployment, with 9.7% or 104 of them being unemployed.
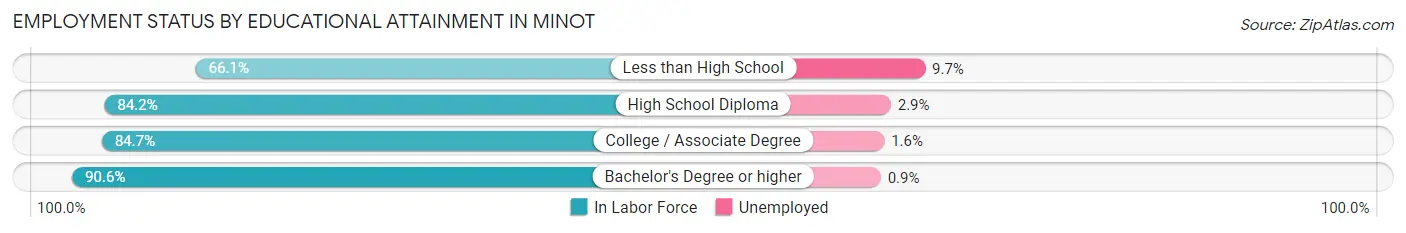
| Educational Attainment | In Labor Force | Unemployed |
| Less than High School | 1,071 (66.1%) | 157 (9.7%) |
| High School Diploma | 5,534 (84.2%) | 191 (2.9%) |
| College / Associate Degree | 7,495 (84.7%) | 142 (1.6%) |
| Bachelor's Degree or higher | 7,228 (90.6%) | 72 (0.9%) |
| Total | 21,318 (85.2%) | 525 (2.1%) |
Employment Occupations by Sex in Minot
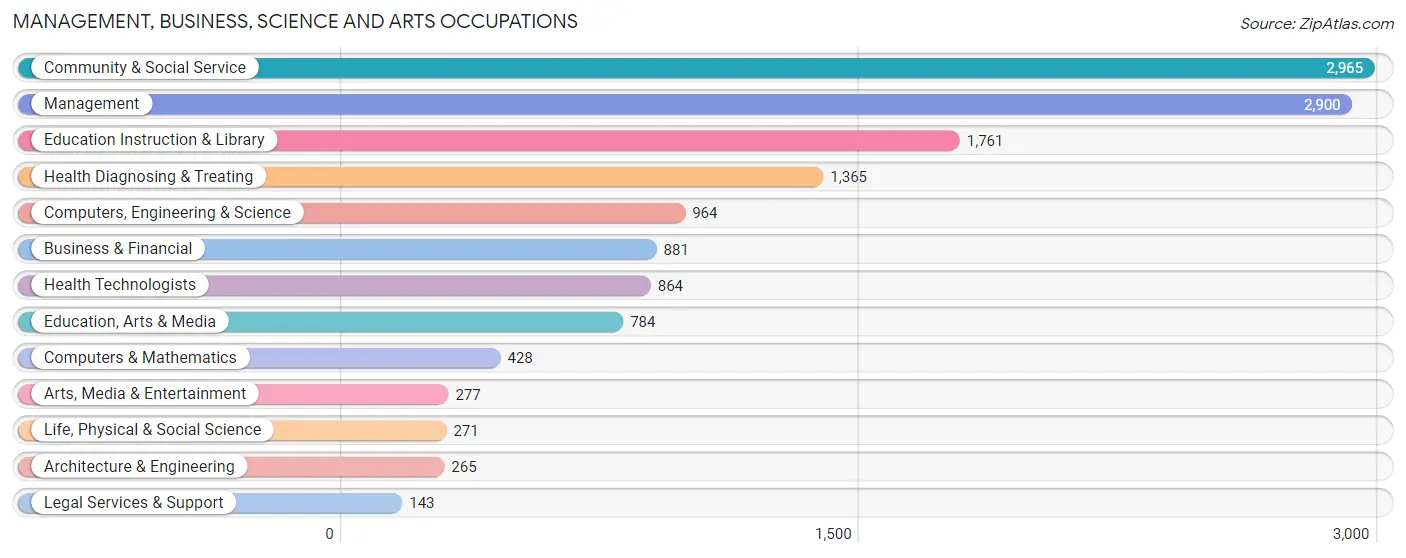
Management, Business, Science and Arts Occupations
The most common Management, Business, Science and Arts occupations in Minot are Community & Social Service (2,965 | 11.8%), Management (2,900 | 11.5%), Education Instruction & Library (1,761 | 7.0%), Health Diagnosing & Treating (1,365 | 5.4%), and Computers, Engineering & Science (964 | 3.8%).
Management, Business, Science and Arts Occupations by Sex
Within the Management, Business, Science and Arts occupations in Minot, the most male-oriented occupations are Architecture & Engineering (89.4%), Life, Physical & Social Science (72.3%), and Management (66.2%), while the most female-oriented occupations are Education Instruction & Library (83.6%), Health Technologists (79.2%), and Health Diagnosing & Treating (76.8%).
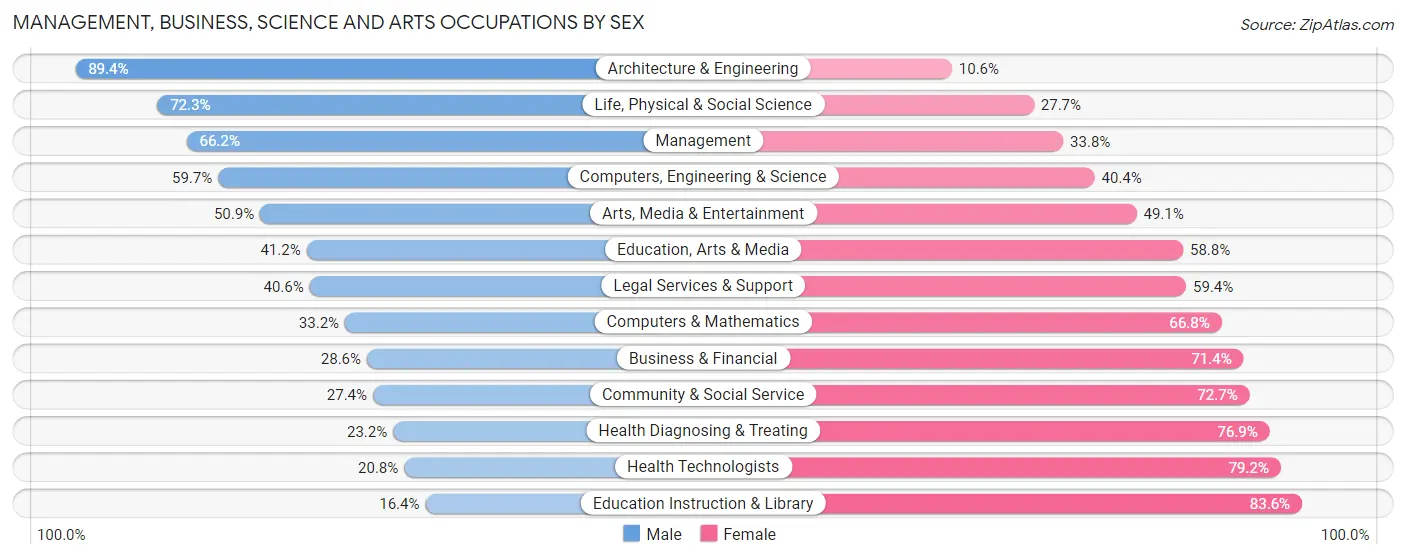
| Occupation | Male | Female |
| Management | 1,920 (66.2%) | 980 (33.8%) |
| Business & Financial | 252 (28.6%) | 629 (71.4%) |
| Computers, Engineering & Science | 575 (59.7%) | 389 (40.4%) |
| Computers & Mathematics | 142 (33.2%) | 286 (66.8%) |
| Architecture & Engineering | 237 (89.4%) | 28 (10.6%) |
| Life, Physical & Social Science | 196 (72.3%) | 75 (27.7%) |
| Community & Social Service | 811 (27.4%) | 2,154 (72.7%) |
| Education, Arts & Media | 323 (41.2%) | 461 (58.8%) |
| Legal Services & Support | 58 (40.6%) | 85 (59.4%) |
| Education Instruction & Library | 289 (16.4%) | 1,472 (83.6%) |
| Arts, Media & Entertainment | 141 (50.9%) | 136 (49.1%) |
| Health Diagnosing & Treating | 316 (23.2%) | 1,049 (76.8%) |
| Health Technologists | 180 (20.8%) | 684 (79.2%) |
| Total (Category) | 3,874 (42.7%) | 5,201 (57.3%) |
| Total (Overall) | 13,677 (54.2%) | 11,539 (45.8%) |
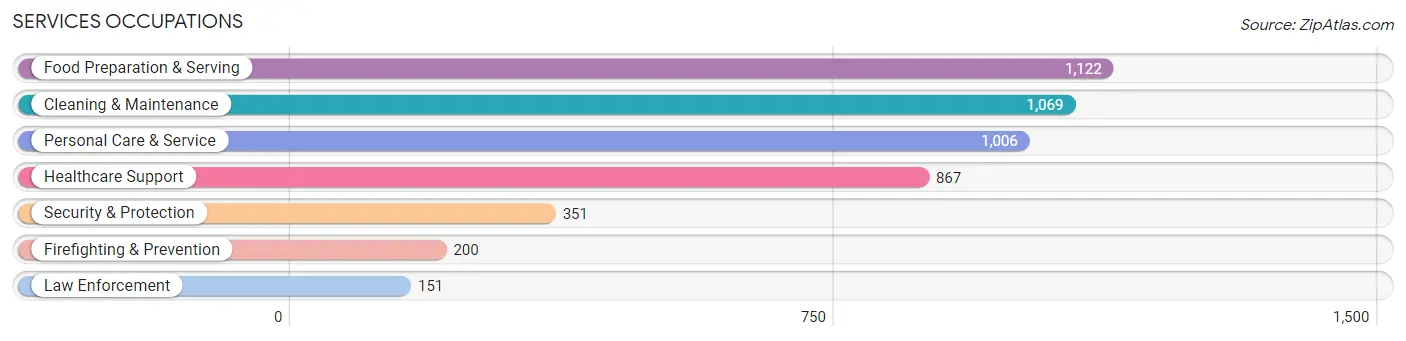
Services Occupations
The most common Services occupations in Minot are Food Preparation & Serving (1,122 | 4.4%), Cleaning & Maintenance (1,069 | 4.2%), Personal Care & Service (1,006 | 4.0%), Healthcare Support (867 | 3.4%), and Security & Protection (351 | 1.4%).
Services Occupations by Sex
Within the Services occupations in Minot, the most male-oriented occupations are Security & Protection (100.0%), Firefighting & Prevention (100.0%), and Law Enforcement (100.0%), while the most female-oriented occupations are Healthcare Support (94.1%), Personal Care & Service (90.6%), and Food Preparation & Serving (58.6%).
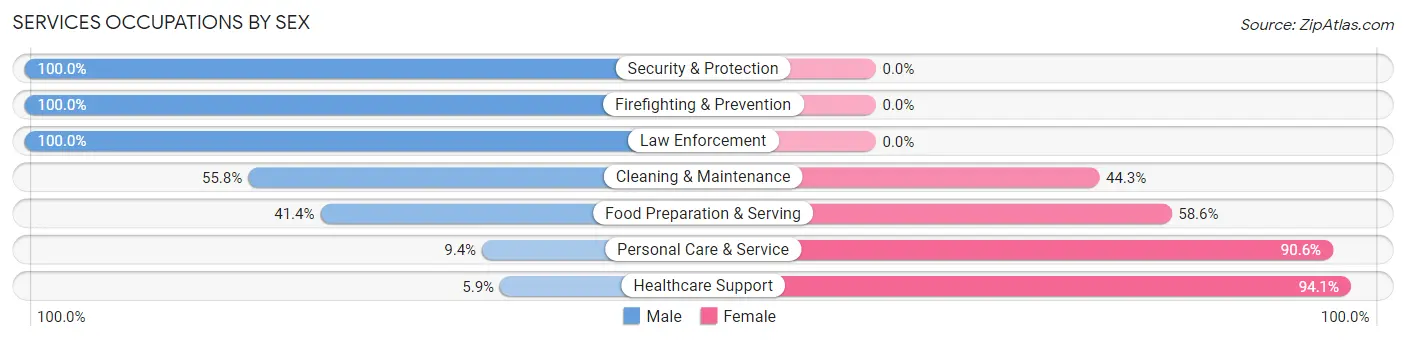
| Occupation | Male | Female |
| Healthcare Support | 51 (5.9%) | 816 (94.1%) |
| Security & Protection | 351 (100.0%) | 0 (0.0%) |
| Firefighting & Prevention | 200 (100.0%) | 0 (0.0%) |
| Law Enforcement | 151 (100.0%) | 0 (0.0%) |
| Food Preparation & Serving | 465 (41.4%) | 657 (58.6%) |
| Cleaning & Maintenance | 596 (55.7%) | 473 (44.3%) |
| Personal Care & Service | 95 (9.4%) | 911 (90.6%) |
| Total (Category) | 1,558 (35.3%) | 2,857 (64.7%) |
| Total (Overall) | 13,677 (54.2%) | 11,539 (45.8%) |
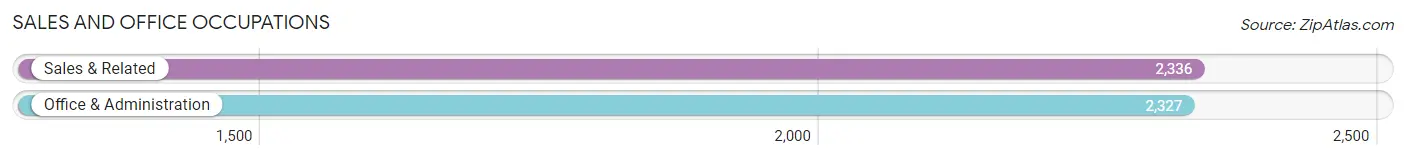
Sales and Office Occupations
The most common Sales and Office occupations in Minot are Sales & Related (2,336 | 9.3%), and Office & Administration (2,327 | 9.2%).
Sales and Office Occupations by Sex
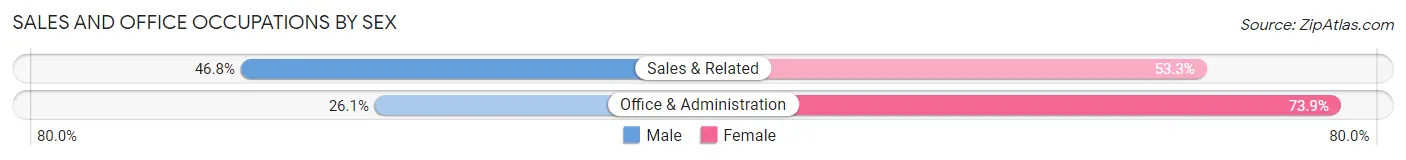
| Occupation | Male | Female |
| Sales & Related | 1,092 (46.8%) | 1,244 (53.2%) |
| Office & Administration | 608 (26.1%) | 1,719 (73.9%) |
| Total (Category) | 1,700 (36.5%) | 2,963 (63.5%) |
| Total (Overall) | 13,677 (54.2%) | 11,539 (45.8%) |
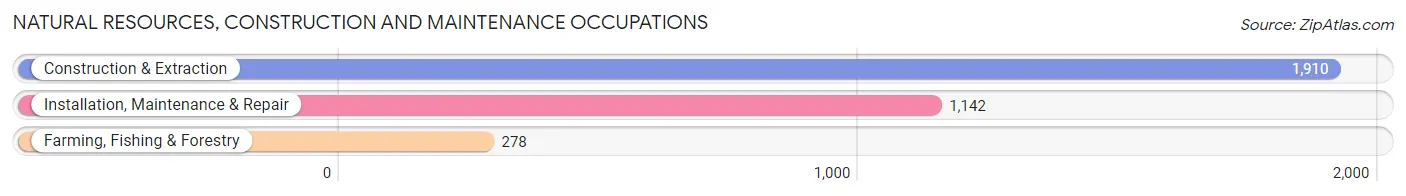
Natural Resources, Construction and Maintenance Occupations
The most common Natural Resources, Construction and Maintenance occupations in Minot are Construction & Extraction (1,910 | 7.6%), Installation, Maintenance & Repair (1,142 | 4.5%), and Farming, Fishing & Forestry (278 | 1.1%).
Natural Resources, Construction and Maintenance Occupations by Sex
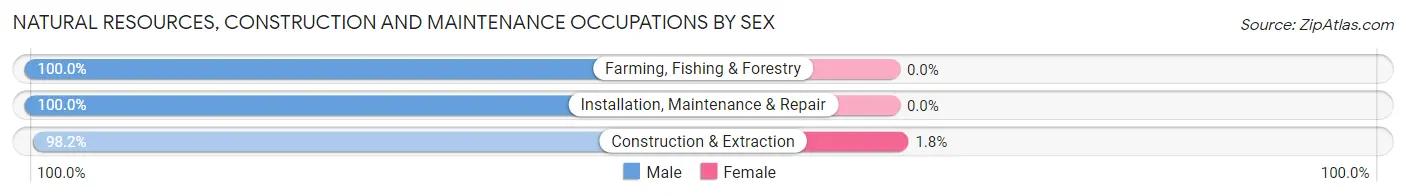
| Occupation | Male | Female |
| Farming, Fishing & Forestry | 278 (100.0%) | 0 (0.0%) |
| Construction & Extraction | 1,876 (98.2%) | 34 (1.8%) |
| Installation, Maintenance & Repair | 1,142 (100.0%) | 0 (0.0%) |
| Total (Category) | 3,296 (99.0%) | 34 (1.0%) |
| Total (Overall) | 13,677 (54.2%) | 11,539 (45.8%) |
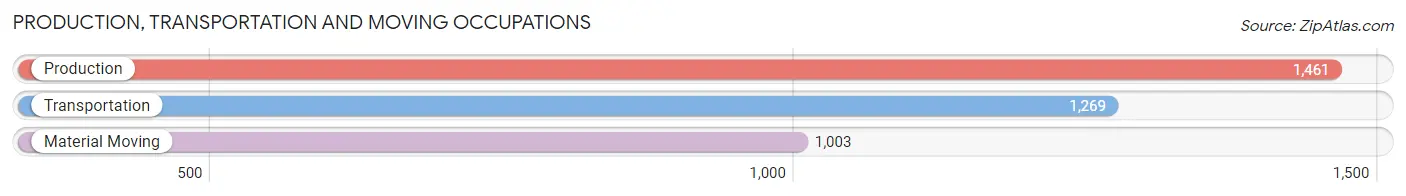
Production, Transportation and Moving Occupations
The most common Production, Transportation and Moving occupations in Minot are Production (1,461 | 5.8%), Transportation (1,269 | 5.0%), and Material Moving (1,003 | 4.0%).
Production, Transportation and Moving Occupations by Sex
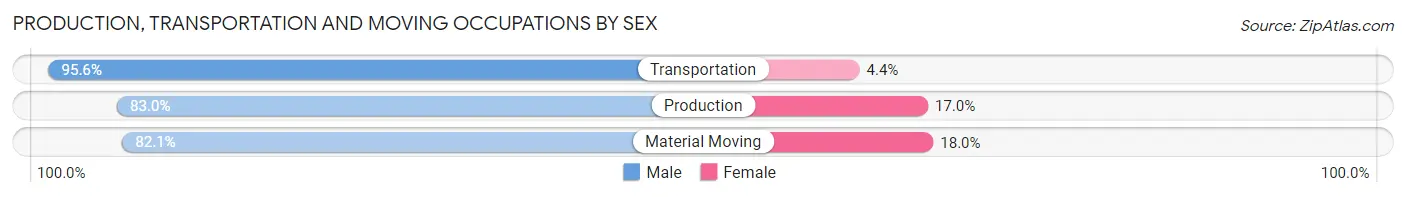
| Occupation | Male | Female |
| Production | 1,213 (83.0%) | 248 (17.0%) |
| Transportation | 1,213 (95.6%) | 56 (4.4%) |
| Material Moving | 823 (82.1%) | 180 (17.9%) |
| Total (Category) | 3,249 (87.0%) | 484 (13.0%) |
| Total (Overall) | 13,677 (54.2%) | 11,539 (45.8%) |
Employment Industries by Sex in Minot
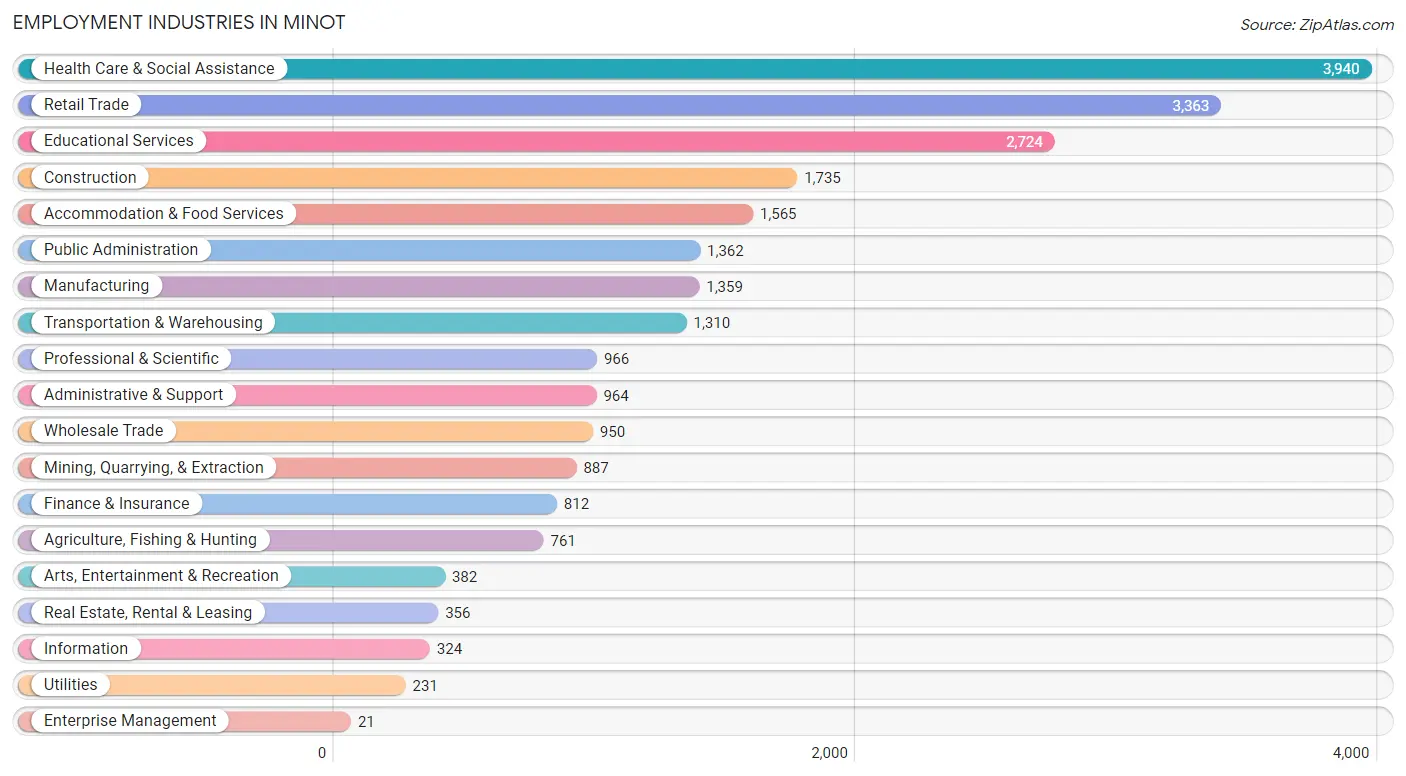
Employment Industries in Minot
The major employment industries in Minot include Health Care & Social Assistance (3,940 | 15.6%), Retail Trade (3,363 | 13.3%), Educational Services (2,724 | 10.8%), Construction (1,735 | 6.9%), and Accommodation & Food Services (1,565 | 6.2%).
Employment Industries by Sex in Minot
The Minot industries that see more men than women are Utilities (100.0%), Construction (98.4%), and Wholesale Trade (91.2%), whereas the industries that tend to have a higher number of women are Enterprise Management (100.0%), Health Care & Social Assistance (80.3%), and Finance & Insurance (79.1%).
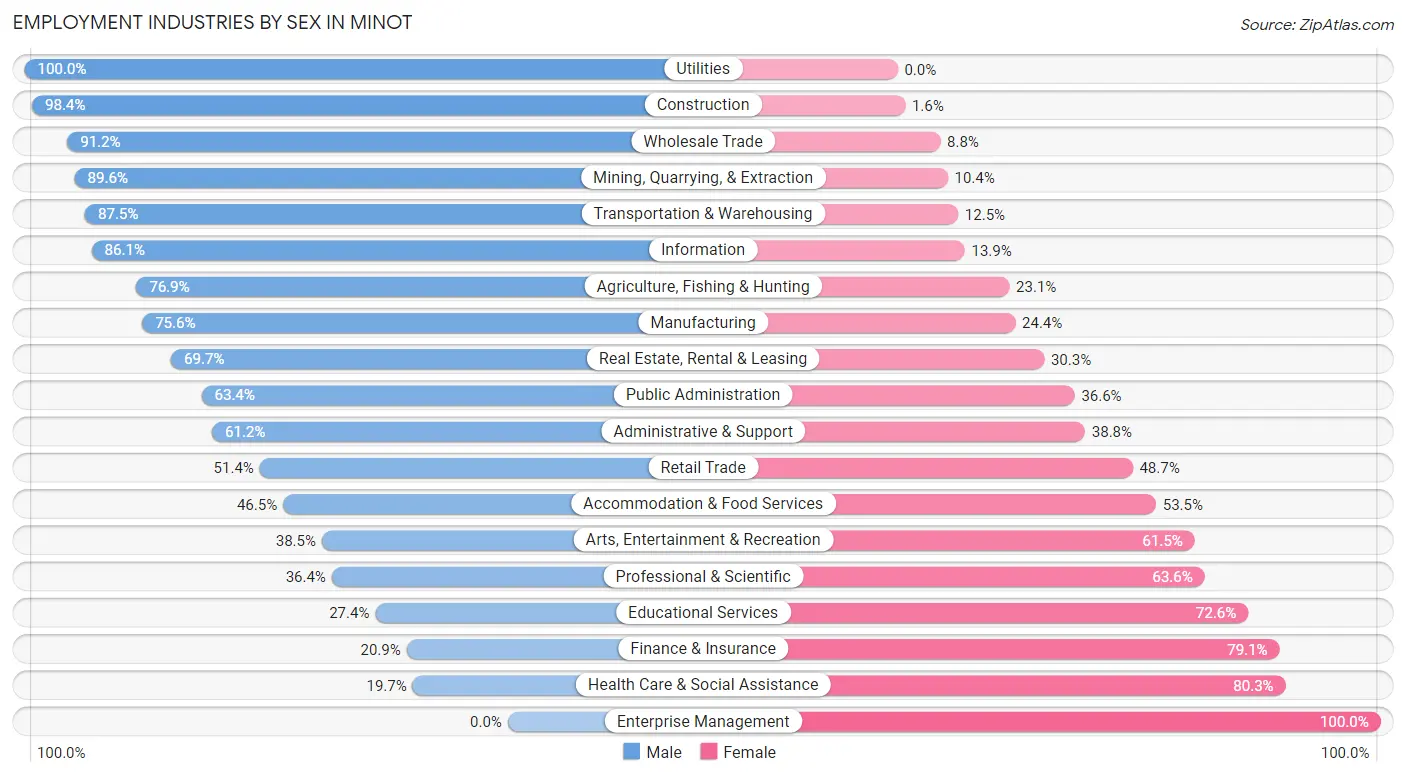
| Industry | Male | Female |
| Agriculture, Fishing & Hunting | 585 (76.9%) | 176 (23.1%) |
| Mining, Quarrying, & Extraction | 795 (89.6%) | 92 (10.4%) |
| Construction | 1,708 (98.4%) | 27 (1.6%) |
| Manufacturing | 1,028 (75.6%) | 331 (24.4%) |
| Wholesale Trade | 866 (91.2%) | 84 (8.8%) |
| Retail Trade | 1,727 (51.3%) | 1,636 (48.6%) |
| Transportation & Warehousing | 1,146 (87.5%) | 164 (12.5%) |
| Utilities | 231 (100.0%) | 0 (0.0%) |
| Information | 279 (86.1%) | 45 (13.9%) |
| Finance & Insurance | 170 (20.9%) | 642 (79.1%) |
| Real Estate, Rental & Leasing | 248 (69.7%) | 108 (30.3%) |
| Professional & Scientific | 352 (36.4%) | 614 (63.6%) |
| Enterprise Management | 0 (0.0%) | 21 (100.0%) |
| Administrative & Support | 590 (61.2%) | 374 (38.8%) |
| Educational Services | 747 (27.4%) | 1,977 (72.6%) |
| Health Care & Social Assistance | 776 (19.7%) | 3,164 (80.3%) |
| Arts, Entertainment & Recreation | 147 (38.5%) | 235 (61.5%) |
| Accommodation & Food Services | 728 (46.5%) | 837 (53.5%) |
| Public Administration | 863 (63.4%) | 499 (36.6%) |
| Total | 13,677 (54.2%) | 11,539 (45.8%) |
Education in Minot
School Enrollment in Minot
The most common levels of schooling among the 10,594 students in Minot are college / undergraduate (2,867 | 27.1%), middle school (2,102 | 19.8%), and high school (2,021 | 19.1%).
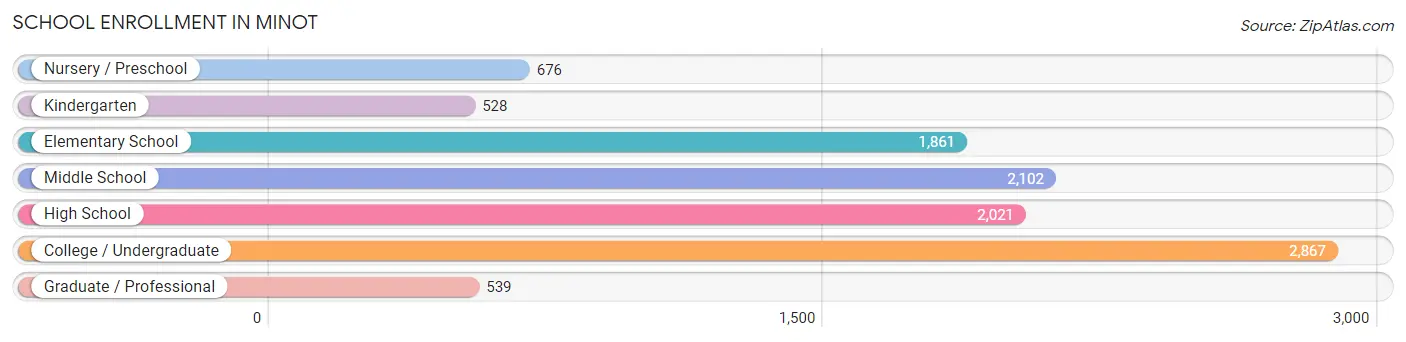
| School Level | # Students | % Students |
| Nursery / Preschool | 676 | 6.4% |
| Kindergarten | 528 | 5.0% |
| Elementary School | 1,861 | 17.6% |
| Middle School | 2,102 | 19.8% |
| High School | 2,021 | 19.1% |
| College / Undergraduate | 2,867 | 27.1% |
| Graduate / Professional | 539 | 5.1% |
| Total | 10,594 | 100.0% |
School Enrollment by Age by Funding Source in Minot
Out of a total of 10,594 students who are enrolled in schools in Minot, 1,176 (11.1%) attend a private institution, while the remaining 9,418 (88.9%) are enrolled in public schools. The age group of 3 to 4 year olds has the highest likelihood of being enrolled in private schools, with 156 (48.9% in the age bracket) enrolled. Conversely, the age group of 20 to 24 year olds has the lowest likelihood of being enrolled in a private school, with 1,474 (98.0% in the age bracket) attending a public institution.
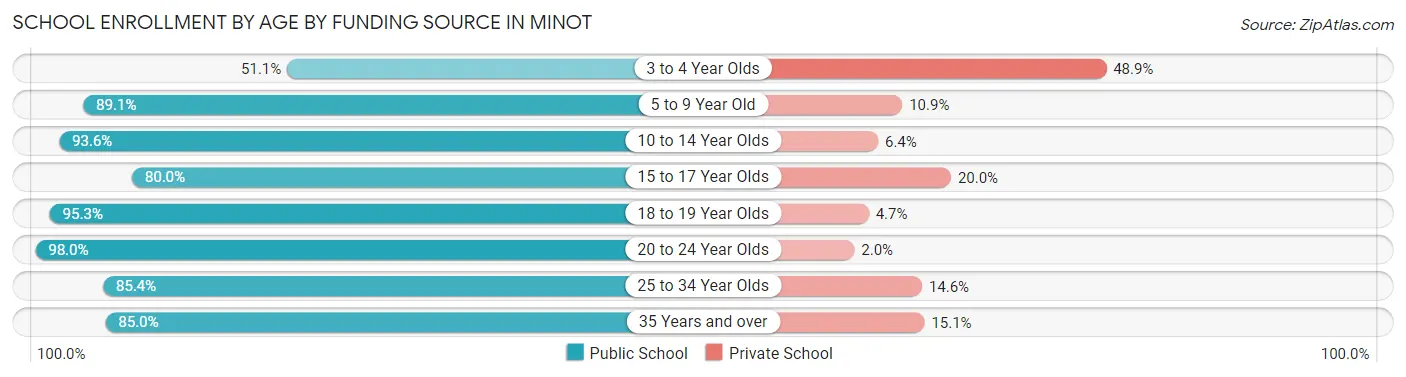
| Age Bracket | Public School | Private School |
| 3 to 4 Year Olds | 163 (51.1%) | 156 (48.9%) |
| 5 to 9 Year Old | 2,262 (89.1%) | 277 (10.9%) |
| 10 to 14 Year Olds | 2,209 (93.6%) | 151 (6.4%) |
| 15 to 17 Year Olds | 1,330 (80.0%) | 332 (20.0%) |
| 18 to 19 Year Olds | 918 (95.3%) | 45 (4.7%) |
| 20 to 24 Year Olds | 1,474 (98.0%) | 30 (2.0%) |
| 25 to 34 Year Olds | 668 (85.4%) | 114 (14.6%) |
| 35 Years and over | 395 (85.0%) | 70 (15.0%) |
| Total | 9,418 (88.9%) | 1,176 (11.1%) |
Educational Attainment by Field of Study in Minot
Education (2,158 | 20.6%), business (1,738 | 16.6%), science & technology (1,310 | 12.5%), arts & humanities (1,220 | 11.6%), and bio, nature & agricultural (830 | 7.9%) are the most common fields of study among 10,478 individuals in Minot who have obtained a bachelor's degree or higher.
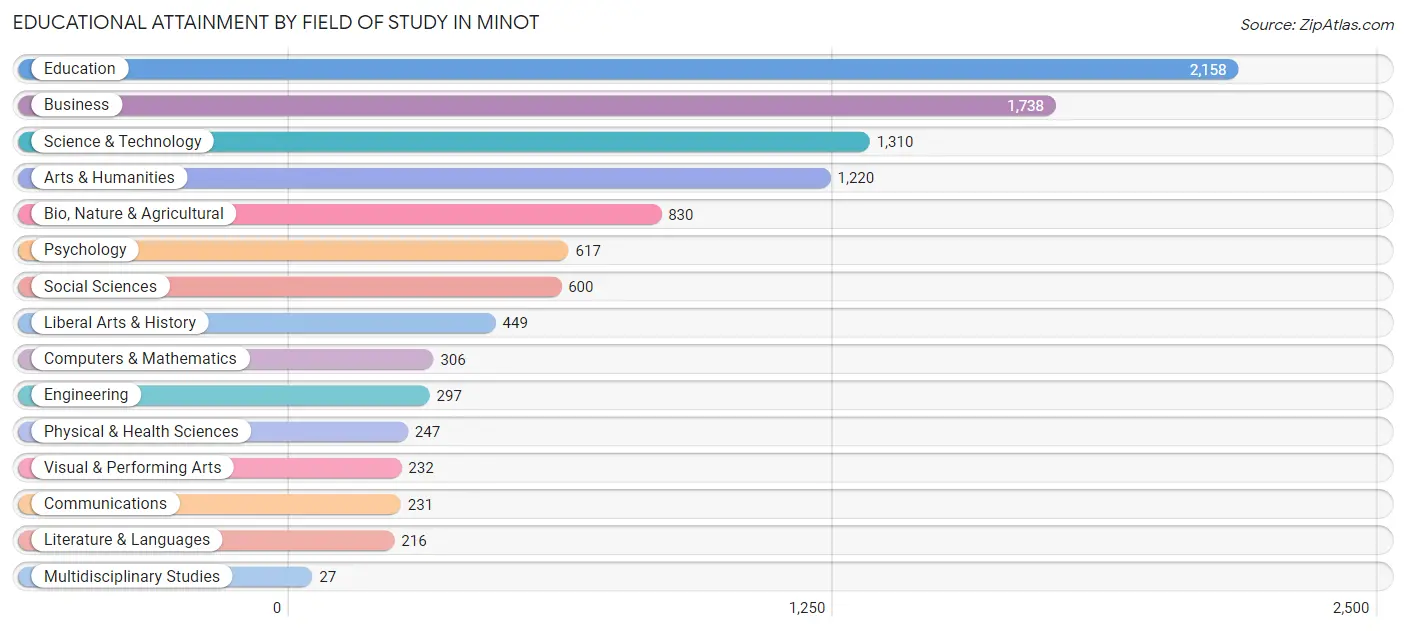
| Field of Study | # Graduates | % Graduates |
| Computers & Mathematics | 306 | 2.9% |
| Bio, Nature & Agricultural | 830 | 7.9% |
| Physical & Health Sciences | 247 | 2.4% |
| Psychology | 617 | 5.9% |
| Social Sciences | 600 | 5.7% |
| Engineering | 297 | 2.8% |
| Multidisciplinary Studies | 27 | 0.3% |
| Science & Technology | 1,310 | 12.5% |
| Business | 1,738 | 16.6% |
| Education | 2,158 | 20.6% |
| Literature & Languages | 216 | 2.1% |
| Liberal Arts & History | 449 | 4.3% |
| Visual & Performing Arts | 232 | 2.2% |
| Communications | 231 | 2.2% |
| Arts & Humanities | 1,220 | 11.6% |
| Total | 10,478 | 100.0% |
Transportation & Commute in Minot
Vehicle Availability by Sex in Minot
The most prevalent vehicle ownership categories in Minot are males with 2 vehicles (6,906, accounting for 45.2%) and females with 2 vehicles (4,730, making up 61.1%).
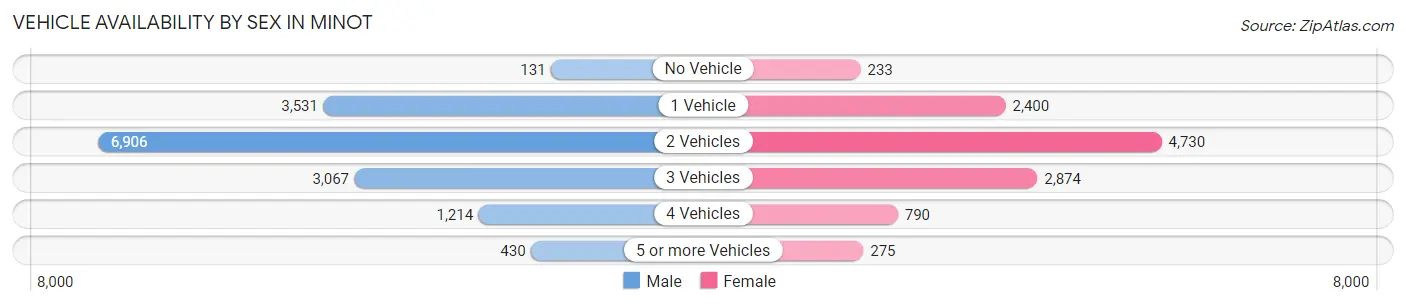
| Vehicles Available | Male | Female |
| No Vehicle | 131 (0.9%) | 233 (2.1%) |
| 1 Vehicle | 3,531 (23.1%) | 2,400 (21.2%) |
| 2 Vehicles | 6,906 (45.2%) | 4,730 (41.8%) |
| 3 Vehicles | 3,067 (20.1%) | 2,874 (25.4%) |
| 4 Vehicles | 1,214 (8.0%) | 790 (7.0%) |
| 5 or more Vehicles | 430 (2.8%) | 275 (2.4%) |
| Total | 15,279 (100.0%) | 11,302 (100.0%) |
Commute Time in Minot
The most frequently occuring commute durations in Minot are 10 to 14 minutes (7,364 commuters, 28.7%), 5 to 9 minutes (5,559 commuters, 21.7%), and 15 to 19 minutes (4,445 commuters, 17.3%).
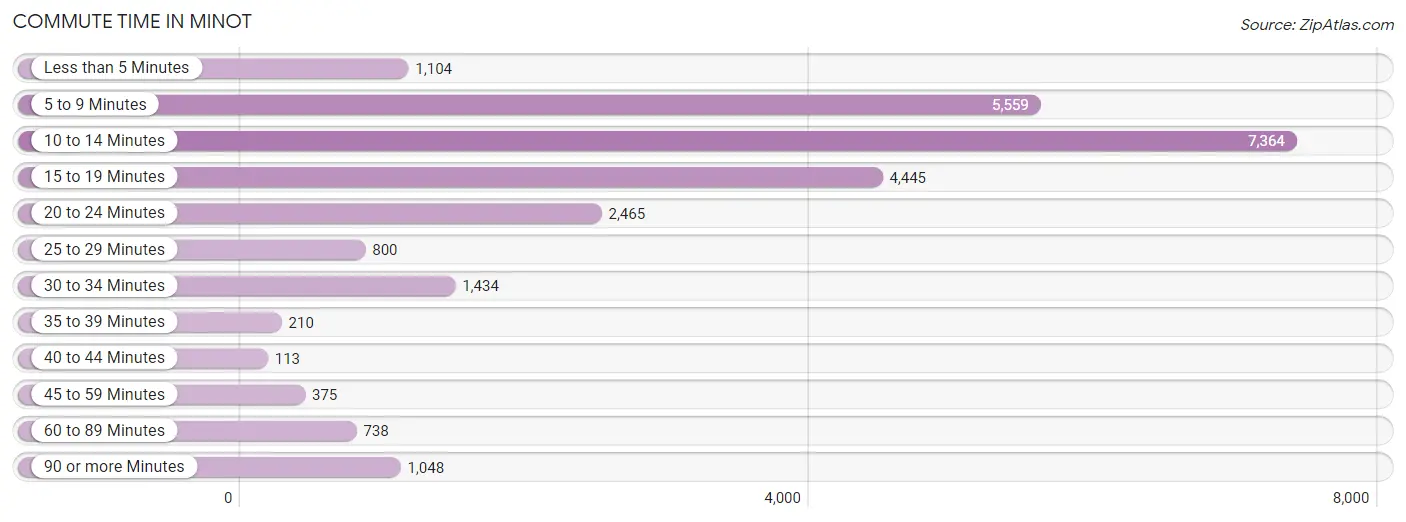
| Commute Time | # Commuters | % Commuters |
| Less than 5 Minutes | 1,104 | 4.3% |
| 5 to 9 Minutes | 5,559 | 21.7% |
| 10 to 14 Minutes | 7,364 | 28.7% |
| 15 to 19 Minutes | 4,445 | 17.3% |
| 20 to 24 Minutes | 2,465 | 9.6% |
| 25 to 29 Minutes | 800 | 3.1% |
| 30 to 34 Minutes | 1,434 | 5.6% |
| 35 to 39 Minutes | 210 | 0.8% |
| 40 to 44 Minutes | 113 | 0.4% |
| 45 to 59 Minutes | 375 | 1.5% |
| 60 to 89 Minutes | 738 | 2.9% |
| 90 or more Minutes | 1,048 | 4.1% |
Commute Time by Sex in Minot
The most common commute times in Minot are 10 to 14 minutes (3,677 commuters, 24.6%) for males and 10 to 14 minutes (3,687 commuters, 34.4%) for females.
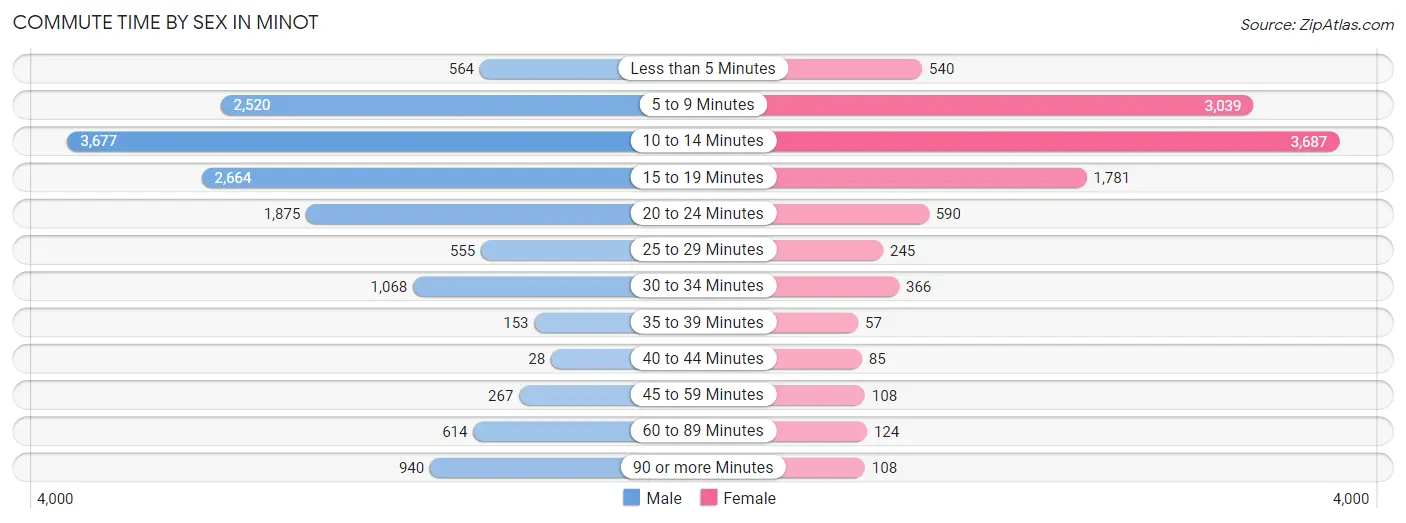
| Commute Time | Male | Female |
| Less than 5 Minutes | 564 (3.8%) | 540 (5.0%) |
| 5 to 9 Minutes | 2,520 (16.9%) | 3,039 (28.3%) |
| 10 to 14 Minutes | 3,677 (24.6%) | 3,687 (34.4%) |
| 15 to 19 Minutes | 2,664 (17.8%) | 1,781 (16.6%) |
| 20 to 24 Minutes | 1,875 (12.6%) | 590 (5.5%) |
| 25 to 29 Minutes | 555 (3.7%) | 245 (2.3%) |
| 30 to 34 Minutes | 1,068 (7.2%) | 366 (3.4%) |
| 35 to 39 Minutes | 153 (1.0%) | 57 (0.5%) |
| 40 to 44 Minutes | 28 (0.2%) | 85 (0.8%) |
| 45 to 59 Minutes | 267 (1.8%) | 108 (1.0%) |
| 60 to 89 Minutes | 614 (4.1%) | 124 (1.2%) |
| 90 or more Minutes | 940 (6.3%) | 108 (1.0%) |
Time of Departure to Work by Sex in Minot
The most frequent times of departure to work in Minot are 7:30 AM to 7:59 AM (2,961, 19.8%) for males and 7:30 AM to 7:59 AM (3,034, 28.3%) for females.
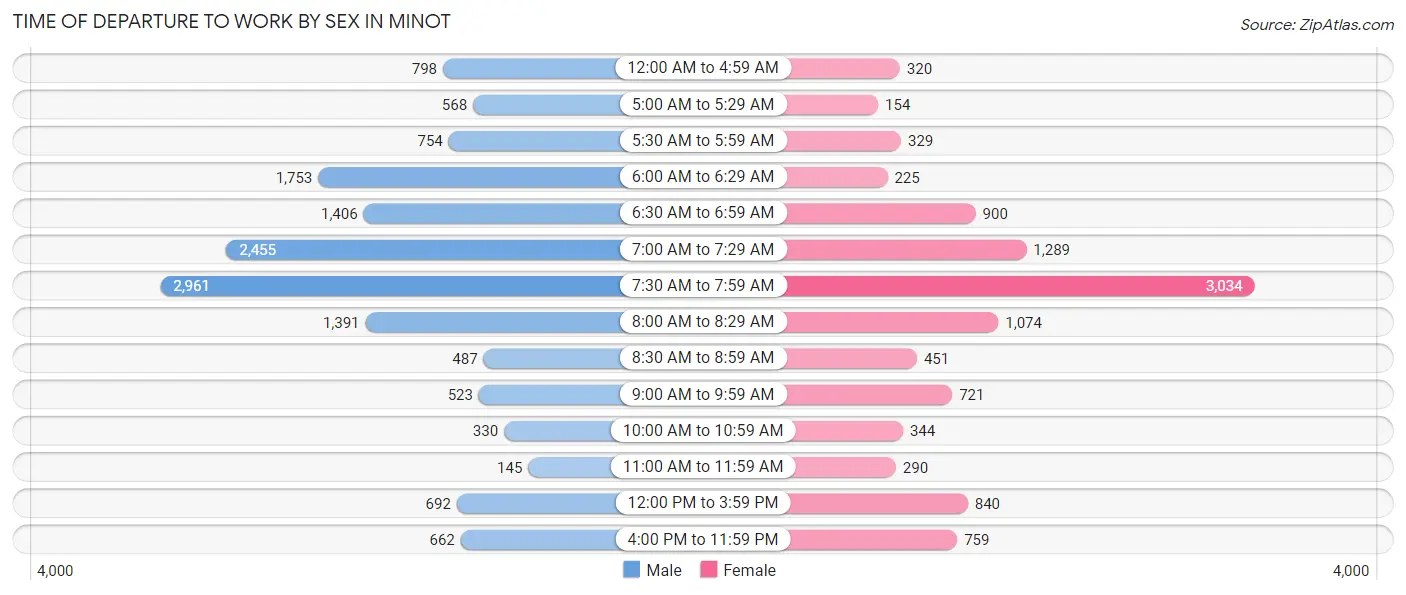
| Time of Departure | Male | Female |
| 12:00 AM to 4:59 AM | 798 (5.3%) | 320 (3.0%) |
| 5:00 AM to 5:29 AM | 568 (3.8%) | 154 (1.4%) |
| 5:30 AM to 5:59 AM | 754 (5.1%) | 329 (3.1%) |
| 6:00 AM to 6:29 AM | 1,753 (11.7%) | 225 (2.1%) |
| 6:30 AM to 6:59 AM | 1,406 (9.4%) | 900 (8.4%) |
| 7:00 AM to 7:29 AM | 2,455 (16.5%) | 1,289 (12.0%) |
| 7:30 AM to 7:59 AM | 2,961 (19.8%) | 3,034 (28.3%) |
| 8:00 AM to 8:29 AM | 1,391 (9.3%) | 1,074 (10.0%) |
| 8:30 AM to 8:59 AM | 487 (3.3%) | 451 (4.2%) |
| 9:00 AM to 9:59 AM | 523 (3.5%) | 721 (6.7%) |
| 10:00 AM to 10:59 AM | 330 (2.2%) | 344 (3.2%) |
| 11:00 AM to 11:59 AM | 145 (1.0%) | 290 (2.7%) |
| 12:00 PM to 3:59 PM | 692 (4.6%) | 840 (7.8%) |
| 4:00 PM to 11:59 PM | 662 (4.4%) | 759 (7.1%) |
| Total | 14,925 (100.0%) | 10,730 (100.0%) |
Housing Occupancy in Minot
Occupancy by Ownership in Minot
Of the total 21,161 dwellings in Minot, owner-occupied units account for 11,979 (56.6%), while renter-occupied units make up 9,182 (43.4%).
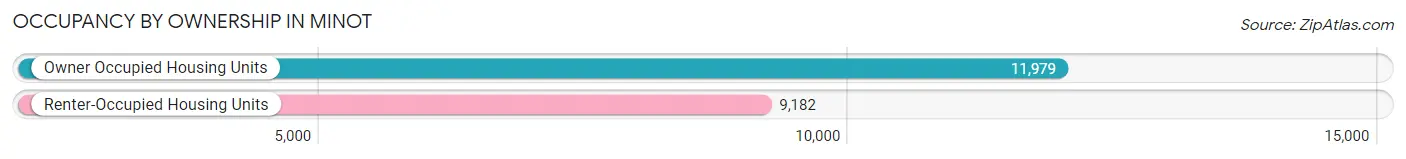
| Occupancy | # Housing Units | % Housing Units |
| Owner Occupied Housing Units | 11,979 | 56.6% |
| Renter-Occupied Housing Units | 9,182 | 43.4% |
| Total Occupied Housing Units | 21,161 | 100.0% |
Occupancy by Household Size in Minot
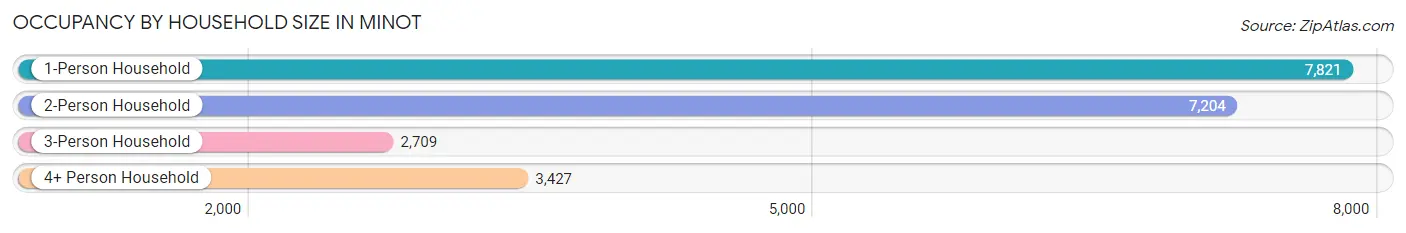
| Household Size | # Housing Units | % Housing Units |
| 1-Person Household | 7,821 | 37.0% |
| 2-Person Household | 7,204 | 34.0% |
| 3-Person Household | 2,709 | 12.8% |
| 4+ Person Household | 3,427 | 16.2% |
| Total Housing Units | 21,161 | 100.0% |
Occupancy by Ownership by Household Size in Minot
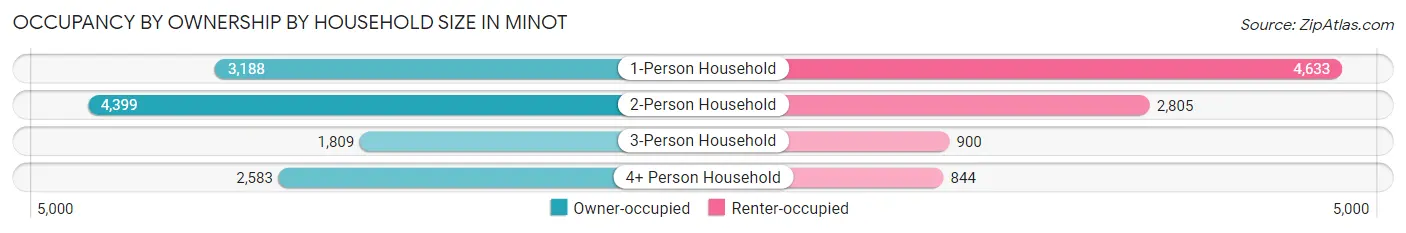
| Household Size | Owner-occupied | Renter-occupied |
| 1-Person Household | 3,188 (40.8%) | 4,633 (59.2%) |
| 2-Person Household | 4,399 (61.1%) | 2,805 (38.9%) |
| 3-Person Household | 1,809 (66.8%) | 900 (33.2%) |
| 4+ Person Household | 2,583 (75.4%) | 844 (24.6%) |
| Total Housing Units | 11,979 (56.6%) | 9,182 (43.4%) |
Occupancy by Educational Attainment in Minot
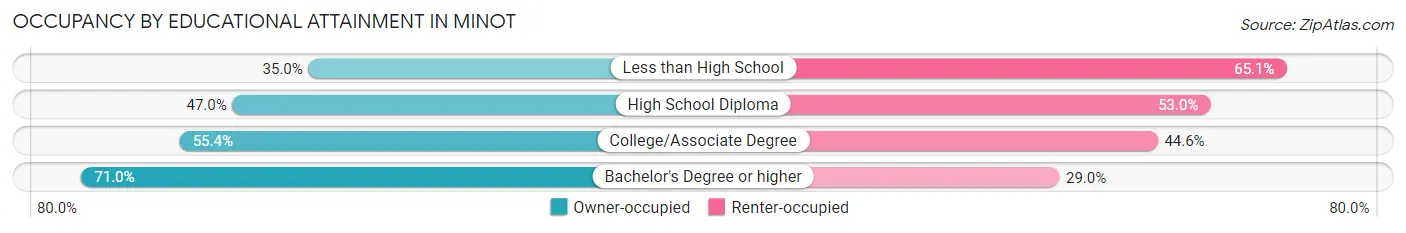
| Household Size | Owner-occupied | Renter-occupied |
| Less than High School | 346 (34.9%) | 644 (65.0%) |
| High School Diploma | 2,756 (47.0%) | 3,105 (53.0%) |
| College/Associate Degree | 4,550 (55.4%) | 3,665 (44.6%) |
| Bachelor's Degree or higher | 4,327 (71.0%) | 1,768 (29.0%) |
Occupancy by Age of Householder in Minot
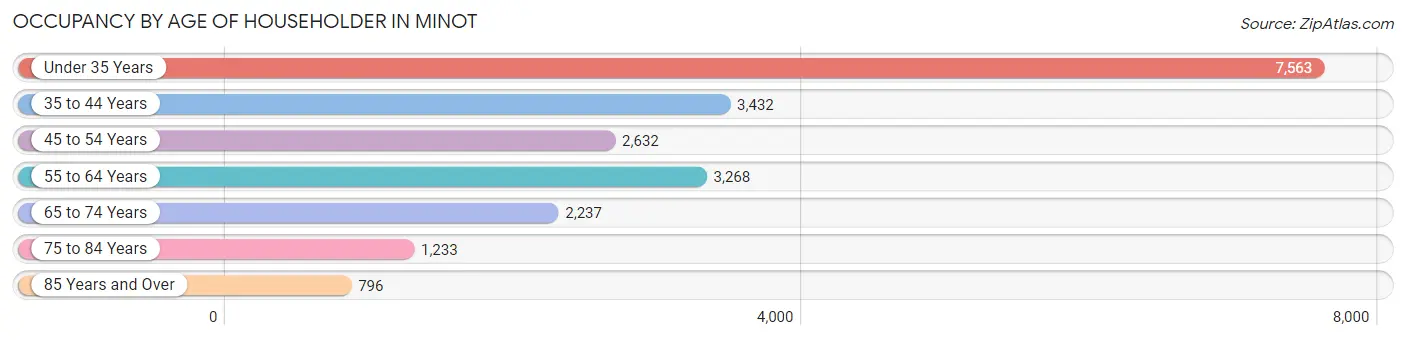
| Age Bracket | # Households | % Households |
| Under 35 Years | 7,563 | 35.7% |
| 35 to 44 Years | 3,432 | 16.2% |
| 45 to 54 Years | 2,632 | 12.4% |
| 55 to 64 Years | 3,268 | 15.4% |
| 65 to 74 Years | 2,237 | 10.6% |
| 75 to 84 Years | 1,233 | 5.8% |
| 85 Years and Over | 796 | 3.8% |
| Total | 21,161 | 100.0% |
Housing Finances in Minot
Median Income by Occupancy in Minot
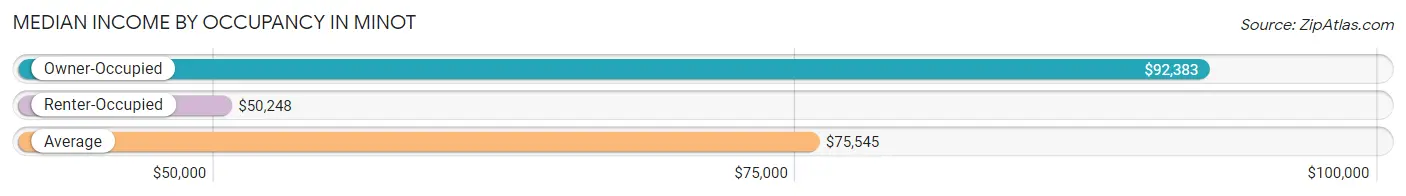
| Occupancy Type | # Households | Median Income |
| Owner-Occupied | 11,979 (56.6%) | $92,383 |
| Renter-Occupied | 9,182 (43.4%) | $50,248 |
| Average | 21,161 (100.0%) | $75,545 |
Occupancy by Householder Income Bracket in Minot
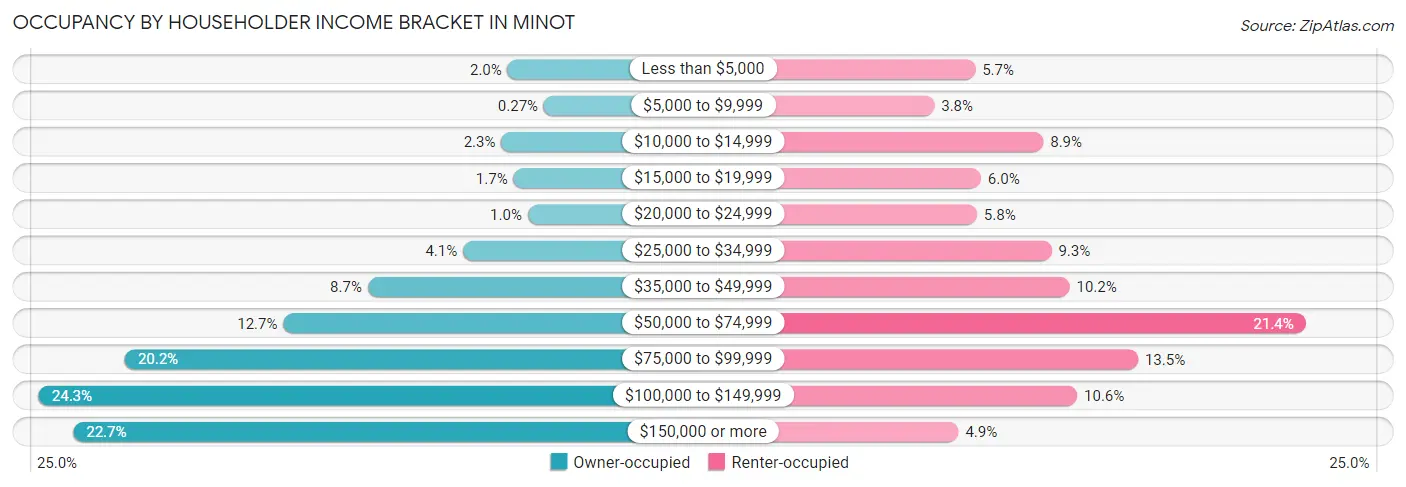
| Income Bracket | Owner-occupied | Renter-occupied |
| Less than $5,000 | 240 (2.0%) | 523 (5.7%) |
| $5,000 to $9,999 | 32 (0.3%) | 344 (3.7%) |
| $10,000 to $14,999 | 275 (2.3%) | 821 (8.9%) |
| $15,000 to $19,999 | 206 (1.7%) | 548 (6.0%) |
| $20,000 to $24,999 | 125 (1.0%) | 531 (5.8%) |
| $25,000 to $34,999 | 493 (4.1%) | 857 (9.3%) |
| $35,000 to $49,999 | 1,037 (8.7%) | 936 (10.2%) |
| $50,000 to $74,999 | 1,519 (12.7%) | 1,968 (21.4%) |
| $75,000 to $99,999 | 2,422 (20.2%) | 1,235 (13.5%) |
| $100,000 to $149,999 | 2,913 (24.3%) | 969 (10.5%) |
| $150,000 or more | 2,717 (22.7%) | 450 (4.9%) |
| Total | 11,979 (100.0%) | 9,182 (100.0%) |
Monthly Housing Cost Tiers in Minot
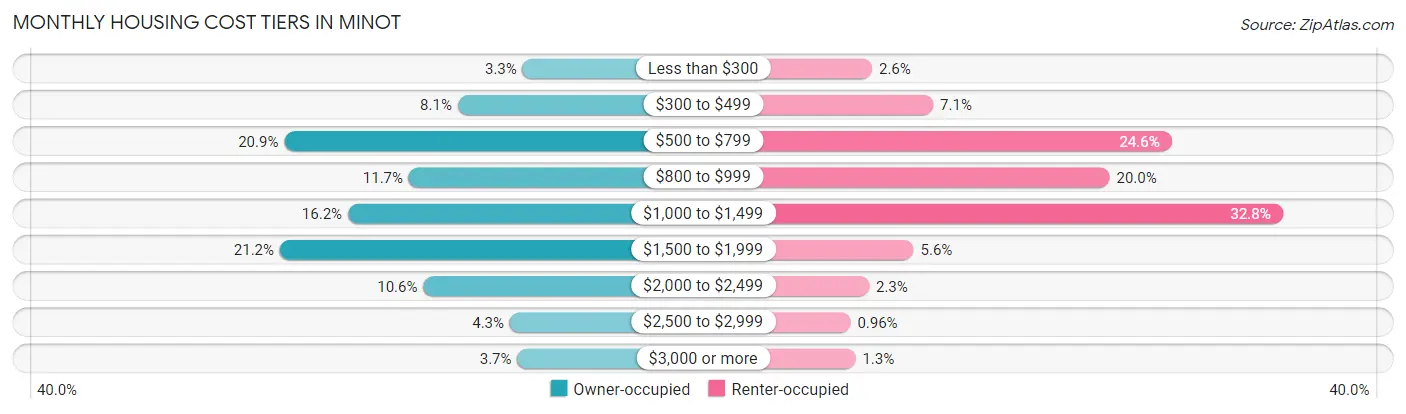
| Monthly Cost | Owner-occupied | Renter-occupied |
| Less than $300 | 398 (3.3%) | 234 (2.5%) |
| $300 to $499 | 970 (8.1%) | 647 (7.0%) |
| $500 to $799 | 2,501 (20.9%) | 2,259 (24.6%) |
| $800 to $999 | 1,402 (11.7%) | 1,840 (20.0%) |
| $1,000 to $1,499 | 1,939 (16.2%) | 3,010 (32.8%) |
| $1,500 to $1,999 | 2,540 (21.2%) | 515 (5.6%) |
| $2,000 to $2,499 | 1,275 (10.6%) | 214 (2.3%) |
| $2,500 to $2,999 | 510 (4.3%) | 88 (1.0%) |
| $3,000 or more | 444 (3.7%) | 122 (1.3%) |
| Total | 11,979 (100.0%) | 9,182 (100.0%) |
Physical Housing Characteristics in Minot
Housing Structures in Minot
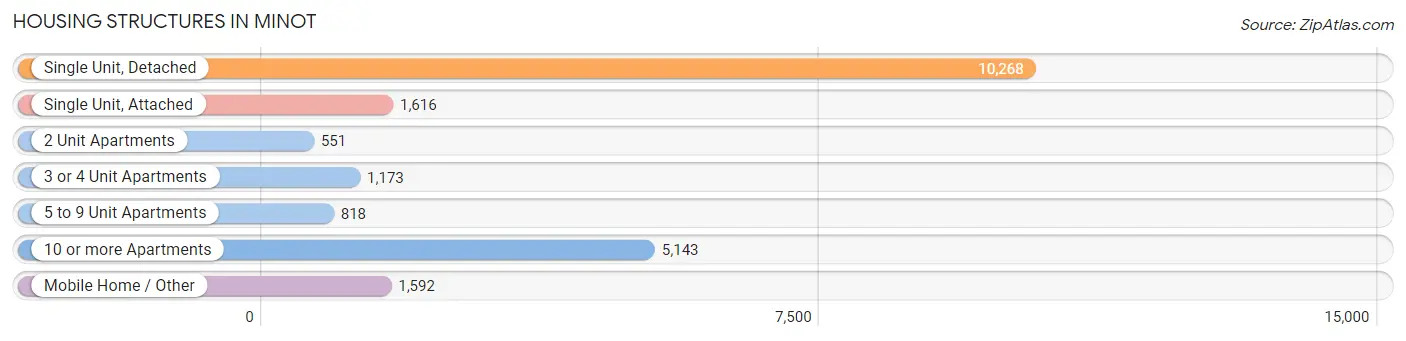
| Structure Type | # Housing Units | % Housing Units |
| Single Unit, Detached | 10,268 | 48.5% |
| Single Unit, Attached | 1,616 | 7.6% |
| 2 Unit Apartments | 551 | 2.6% |
| 3 or 4 Unit Apartments | 1,173 | 5.5% |
| 5 to 9 Unit Apartments | 818 | 3.9% |
| 10 or more Apartments | 5,143 | 24.3% |
| Mobile Home / Other | 1,592 | 7.5% |
| Total | 21,161 | 100.0% |
Housing Structures by Occupancy in Minot
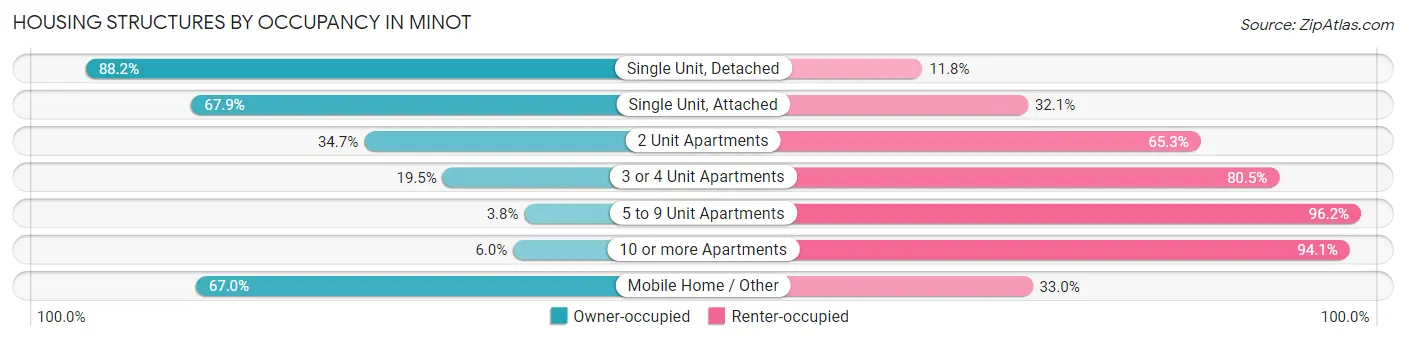
| Structure Type | Owner-occupied | Renter-occupied |
| Single Unit, Detached | 9,058 (88.2%) | 1,210 (11.8%) |
| Single Unit, Attached | 1,097 (67.9%) | 519 (32.1%) |
| 2 Unit Apartments | 191 (34.7%) | 360 (65.3%) |
| 3 or 4 Unit Apartments | 229 (19.5%) | 944 (80.5%) |
| 5 to 9 Unit Apartments | 31 (3.8%) | 787 (96.2%) |
| 10 or more Apartments | 306 (5.9%) | 4,837 (94.1%) |
| Mobile Home / Other | 1,067 (67.0%) | 525 (33.0%) |
| Total | 11,979 (56.6%) | 9,182 (43.4%) |
Housing Structures by Number of Rooms in Minot
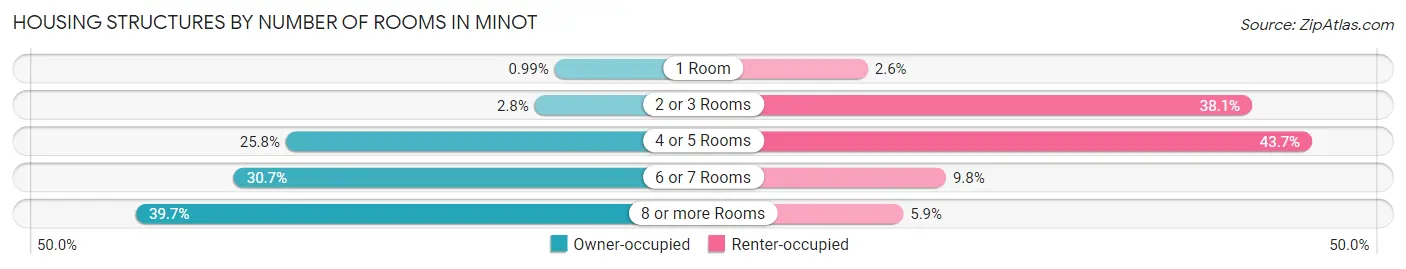
| Number of Rooms | Owner-occupied | Renter-occupied |
| 1 Room | 118 (1.0%) | 237 (2.6%) |
| 2 or 3 Rooms | 339 (2.8%) | 3,498 (38.1%) |
| 4 or 5 Rooms | 3,095 (25.8%) | 4,008 (43.6%) |
| 6 or 7 Rooms | 3,672 (30.6%) | 901 (9.8%) |
| 8 or more Rooms | 4,755 (39.7%) | 538 (5.9%) |
| Total | 11,979 (100.0%) | 9,182 (100.0%) |
Housing Structure by Heating Type in Minot
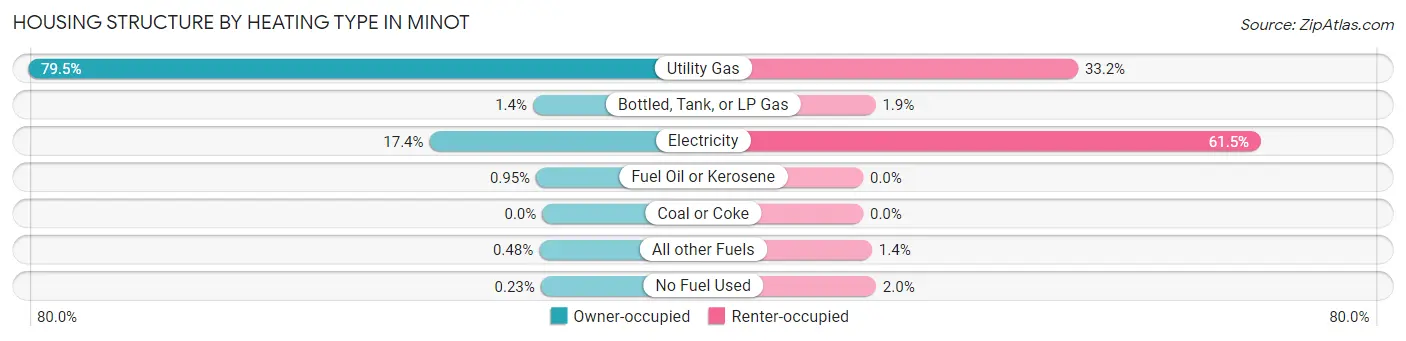
| Heating Type | Owner-occupied | Renter-occupied |
| Utility Gas | 9,520 (79.5%) | 3,050 (33.2%) |
| Bottled, Tank, or LP Gas | 172 (1.4%) | 176 (1.9%) |
| Electricity | 2,088 (17.4%) | 5,647 (61.5%) |
| Fuel Oil or Kerosene | 114 (0.9%) | 0 (0.0%) |
| Coal or Coke | 0 (0.0%) | 0 (0.0%) |
| All other Fuels | 57 (0.5%) | 126 (1.4%) |
| No Fuel Used | 28 (0.2%) | 183 (2.0%) |
| Total | 11,979 (100.0%) | 9,182 (100.0%) |
Household Vehicle Usage in Minot
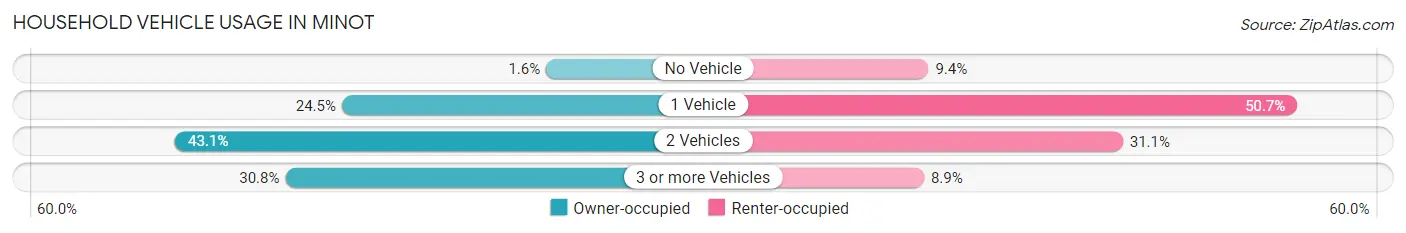
| Vehicles per Household | Owner-occupied | Renter-occupied |
| No Vehicle | 191 (1.6%) | 859 (9.4%) |
| 1 Vehicle | 2,931 (24.5%) | 4,652 (50.7%) |
| 2 Vehicles | 5,168 (43.1%) | 2,858 (31.1%) |
| 3 or more Vehicles | 3,689 (30.8%) | 813 (8.8%) |
| Total | 11,979 (100.0%) | 9,182 (100.0%) |
Real Estate & Mortgages in Minot
Real Estate and Mortgage Overview in Minot
| Characteristic | Without Mortgage | With Mortgage |
| Housing Units | 4,544 | 7,435 |
| Median Property Value | $211,000 | $255,300 |
| Median Household Income | $78,366 | $1,845 |
| Monthly Housing Costs | $608 | $434 |
| Real Estate Taxes | $2,524 | $160 |
Property Value by Mortgage Status in Minot
| Property Value | Without Mortgage | With Mortgage |
| Less than $50,000 | 723 (15.9%) | 187 (2.5%) |
| $50,000 to $99,999 | 411 (9.0%) | 220 (3.0%) |
| $100,000 to $299,999 | 2,491 (54.8%) | 4,624 (62.2%) |
| $300,000 to $499,999 | 681 (15.0%) | 2,082 (28.0%) |
| $500,000 to $749,999 | 98 (2.2%) | 264 (3.5%) |
| $750,000 to $999,999 | 130 (2.9%) | 27 (0.4%) |
| $1,000,000 or more | 10 (0.2%) | 31 (0.4%) |
| Total | 4,544 (100.0%) | 7,435 (100.0%) |
Household Income by Mortgage Status in Minot
| Household Income | Without Mortgage | With Mortgage |
| Less than $10,000 | 165 (3.6%) | 62 (0.8%) |
| $10,000 to $24,999 | 373 (8.2%) | 107 (1.4%) |
| $25,000 to $34,999 | 314 (6.9%) | 233 (3.1%) |
| $35,000 to $49,999 | 570 (12.5%) | 179 (2.4%) |
| $50,000 to $74,999 | 665 (14.6%) | 467 (6.3%) |
| $75,000 to $99,999 | 732 (16.1%) | 854 (11.5%) |
| $100,000 to $149,999 | 853 (18.8%) | 1,690 (22.7%) |
| $150,000 or more | 872 (19.2%) | 2,060 (27.7%) |
| Total | 4,544 (100.0%) | 7,435 (100.0%) |
Property Value to Household Income Ratio in Minot
| Value-to-Income Ratio | Without Mortgage | With Mortgage |
| Less than 2.0x | 2,059 (45.3%) | 103,531 (1,392.5%) |
| 2.0x to 2.9x | 816 (18.0%) | 2,524 (34.0%) |
| 3.0x to 3.9x | 532 (11.7%) | 2,513 (33.8%) |
| 4.0x or more | 1,080 (23.8%) | 1,141 (15.3%) |
| Total | 4,544 (100.0%) | 7,435 (100.0%) |
Real Estate Taxes by Mortgage Status in Minot
| Property Taxes | Without Mortgage | With Mortgage |
| Less than $800 | 768 (16.9%) | 8 (0.1%) |
| $800 to $1,499 | 555 (12.2%) | 320 (4.3%) |
| $800 to $1,499 | 2,928 (64.4%) | 695 (9.3%) |
| Total | 4,544 (100.0%) | 7,435 (100.0%) |
Health & Disability in Minot
Health Insurance Coverage by Age in Minot
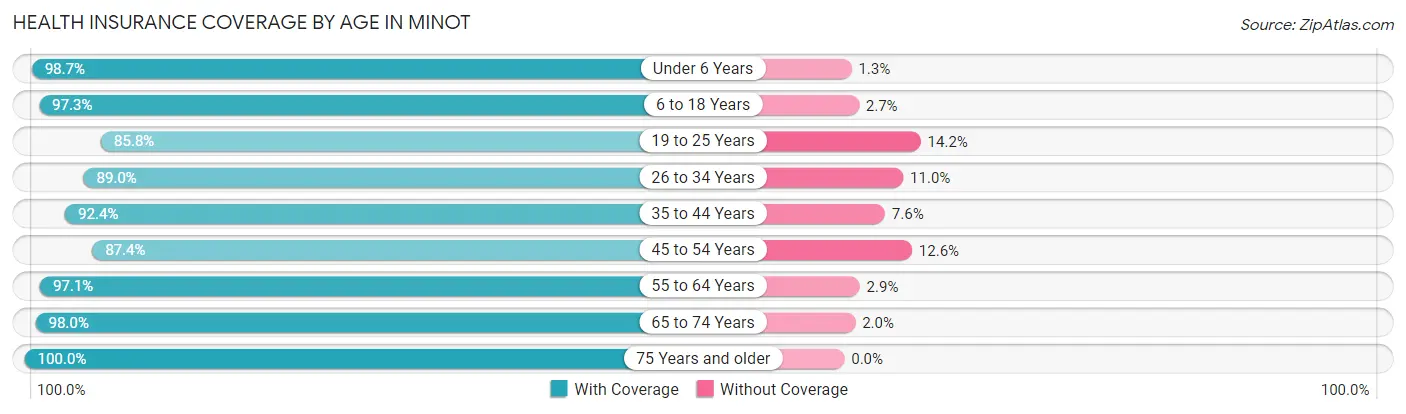
| Age Bracket | With Coverage | Without Coverage |
| Under 6 Years | 3,556 (98.7%) | 48 (1.3%) |
| 6 to 18 Years | 6,704 (97.3%) | 187 (2.7%) |
| 19 to 25 Years | 5,174 (85.8%) | 859 (14.2%) |
| 26 to 34 Years | 6,245 (89.0%) | 770 (11.0%) |
| 35 to 44 Years | 5,533 (92.4%) | 453 (7.6%) |
| 45 to 54 Years | 3,728 (87.4%) | 538 (12.6%) |
| 55 to 64 Years | 4,844 (97.1%) | 143 (2.9%) |
| 65 to 74 Years | 3,361 (98.0%) | 70 (2.0%) |
| 75 Years and older | 2,772 (100.0%) | 0 (0.0%) |
| Total | 41,917 (93.2%) | 3,068 (6.8%) |
Health Insurance Coverage by Citizenship Status in Minot
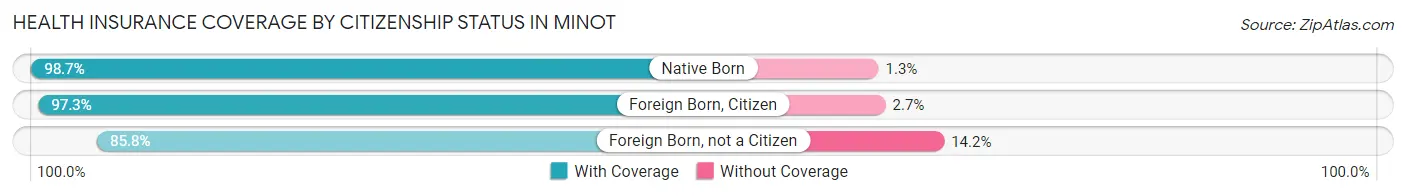
| Citizenship Status | With Coverage | Without Coverage |
| Native Born | 3,556 (98.7%) | 48 (1.3%) |
| Foreign Born, Citizen | 6,704 (97.3%) | 187 (2.7%) |
| Foreign Born, not a Citizen | 5,174 (85.8%) | 859 (14.2%) |
Health Insurance Coverage by Household Income in Minot
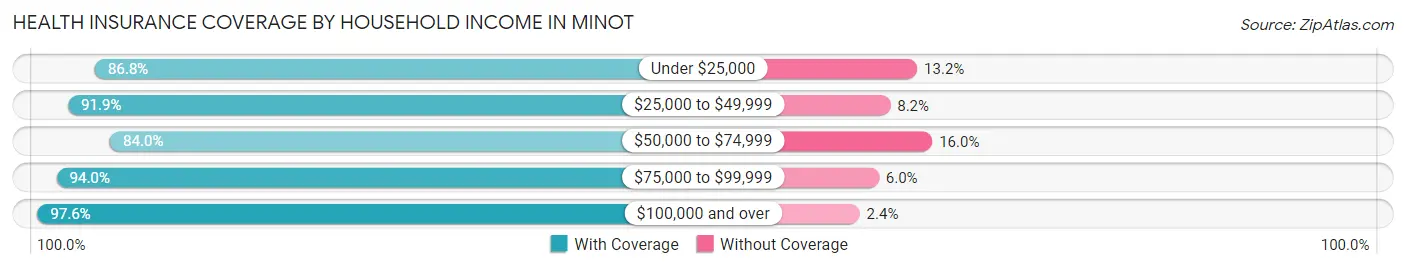
| Household Income | With Coverage | Without Coverage |
| Under $25,000 | 4,454 (86.8%) | 676 (13.2%) |
| $25,000 to $49,999 | 4,316 (91.8%) | 383 (8.2%) |
| $50,000 to $74,999 | 4,909 (84.0%) | 936 (16.0%) |
| $75,000 to $99,999 | 7,488 (94.0%) | 478 (6.0%) |
| $100,000 and over | 20,074 (97.6%) | 496 (2.4%) |
Public vs Private Health Insurance Coverage by Age in Minot
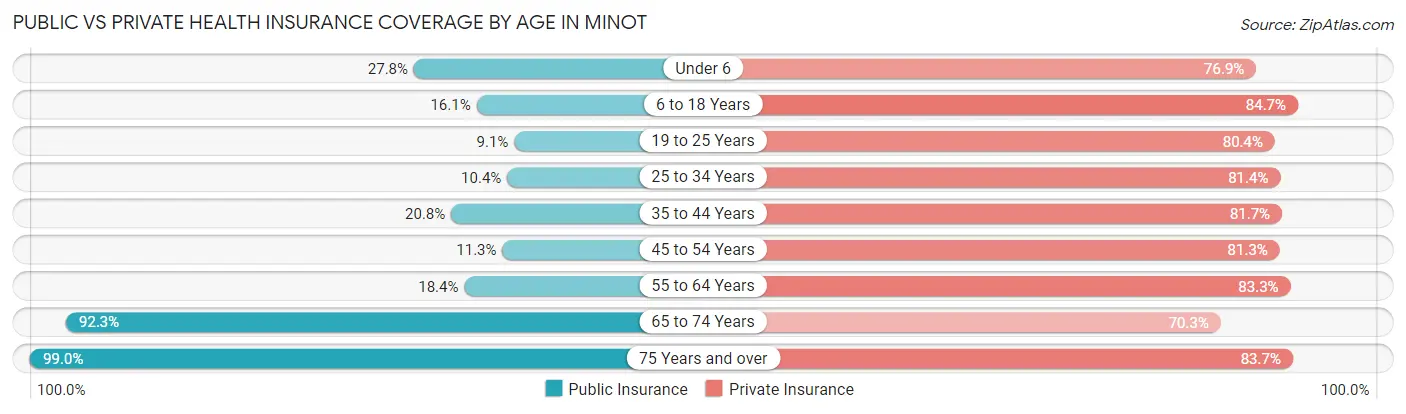
| Age Bracket | Public Insurance | Private Insurance |
| Under 6 | 1,000 (27.8%) | 2,772 (76.9%) |
| 6 to 18 Years | 1,111 (16.1%) | 5,833 (84.7%) |
| 19 to 25 Years | 551 (9.1%) | 4,849 (80.4%) |
| 25 to 34 Years | 732 (10.4%) | 5,708 (81.4%) |
| 35 to 44 Years | 1,247 (20.8%) | 4,890 (81.7%) |
| 45 to 54 Years | 483 (11.3%) | 3,467 (81.3%) |
| 55 to 64 Years | 917 (18.4%) | 4,152 (83.3%) |
| 65 to 74 Years | 3,168 (92.3%) | 2,413 (70.3%) |
| 75 Years and over | 2,744 (99.0%) | 2,320 (83.7%) |
| Total | 11,953 (26.6%) | 36,404 (80.9%) |
Disability Status by Sex by Age in Minot
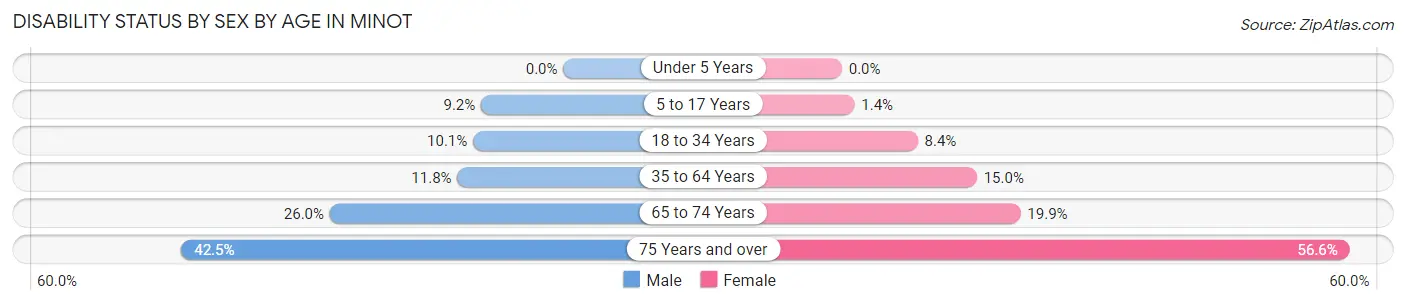
| Age Bracket | Male | Female |
| Under 5 Years | 0 (0.0%) | 0 (0.0%) |
| 5 to 17 Years | 328 (9.2%) | 46 (1.4%) |
| 18 to 34 Years | 701 (10.1%) | 563 (8.4%) |
| 35 to 64 Years | 911 (11.8%) | 1,130 (15.0%) |
| 65 to 74 Years | 453 (26.0%) | 336 (19.9%) |
| 75 Years and over | 439 (42.5%) | 984 (56.6%) |
Disability Class by Sex by Age in Minot
Disability Class: Hearing Difficulty
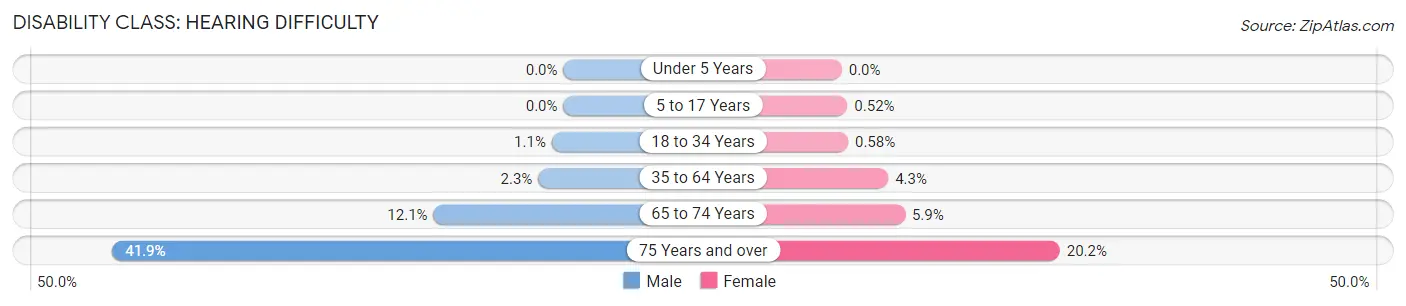
| Age Bracket | Male | Female |
| Under 5 Years | 0 (0.0%) | 0 (0.0%) |
| 5 to 17 Years | 0 (0.0%) | 17 (0.5%) |
| 18 to 34 Years | 75 (1.1%) | 39 (0.6%) |
| 35 to 64 Years | 181 (2.3%) | 324 (4.3%) |
| 65 to 74 Years | 210 (12.1%) | 99 (5.9%) |
| 75 Years and over | 432 (41.9%) | 352 (20.2%) |
Disability Class: Vision Difficulty
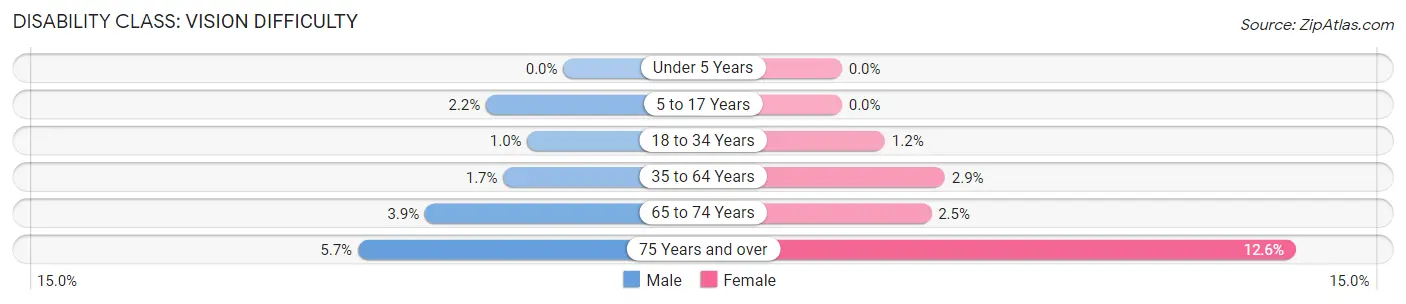
| Age Bracket | Male | Female |
| Under 5 Years | 0 (0.0%) | 0 (0.0%) |
| 5 to 17 Years | 77 (2.1%) | 0 (0.0%) |
| 18 to 34 Years | 70 (1.0%) | 80 (1.2%) |
| 35 to 64 Years | 129 (1.7%) | 216 (2.9%) |
| 65 to 74 Years | 67 (3.8%) | 42 (2.5%) |
| 75 Years and over | 59 (5.7%) | 220 (12.6%) |
Disability Class: Cognitive Difficulty
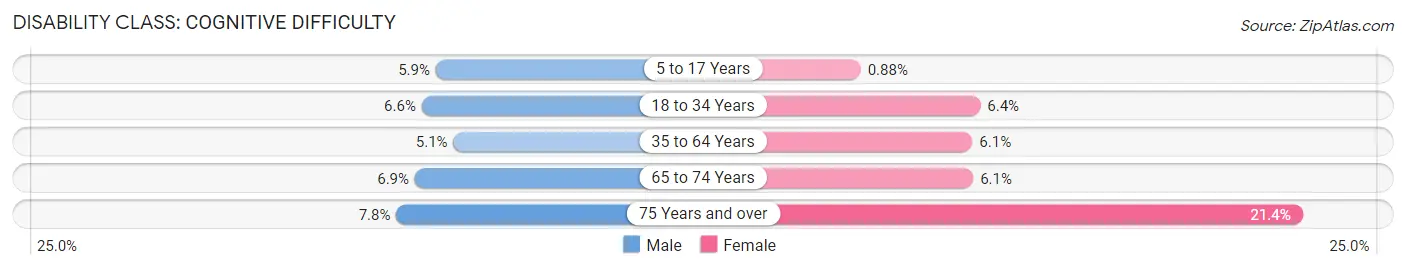
| Age Bracket | Male | Female |
| 5 to 17 Years | 212 (5.9%) | 29 (0.9%) |
| 18 to 34 Years | 458 (6.6%) | 429 (6.4%) |
| 35 to 64 Years | 394 (5.1%) | 456 (6.1%) |
| 65 to 74 Years | 120 (6.9%) | 103 (6.1%) |
| 75 Years and over | 80 (7.7%) | 372 (21.4%) |
Disability Class: Ambulatory Difficulty
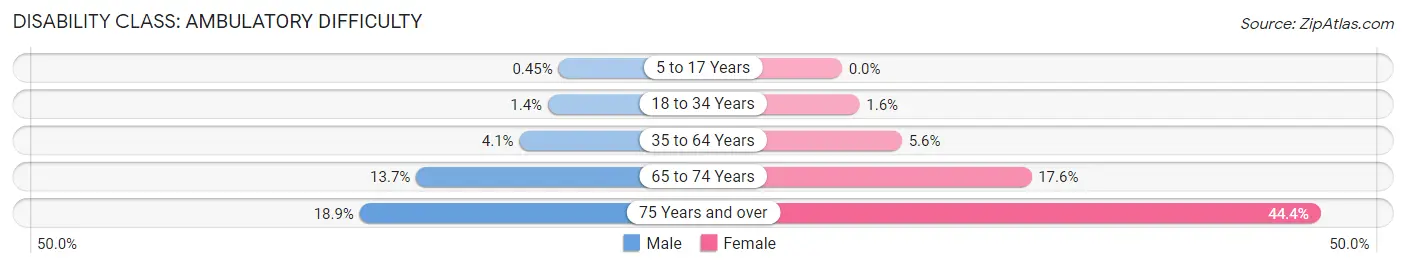
| Age Bracket | Male | Female |
| 5 to 17 Years | 16 (0.4%) | 0 (0.0%) |
| 18 to 34 Years | 100 (1.4%) | 109 (1.6%) |
| 35 to 64 Years | 315 (4.1%) | 418 (5.6%) |
| 65 to 74 Years | 238 (13.7%) | 297 (17.6%) |
| 75 Years and over | 195 (18.9%) | 773 (44.4%) |
Disability Class: Self-Care Difficulty
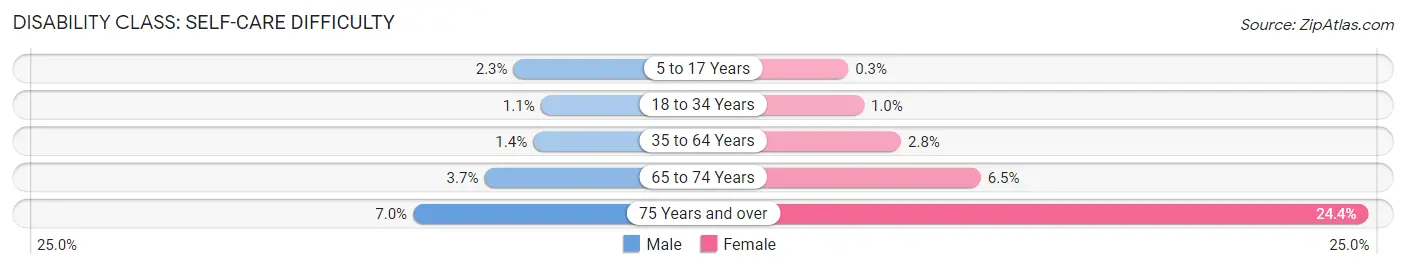
| Age Bracket | Male | Female |
| 5 to 17 Years | 83 (2.3%) | 10 (0.3%) |
| 18 to 34 Years | 74 (1.1%) | 69 (1.0%) |
| 35 to 64 Years | 109 (1.4%) | 207 (2.8%) |
| 65 to 74 Years | 64 (3.7%) | 109 (6.5%) |
| 75 Years and over | 72 (7.0%) | 425 (24.4%) |
Technology Access in Minot
Computing Device Access in Minot
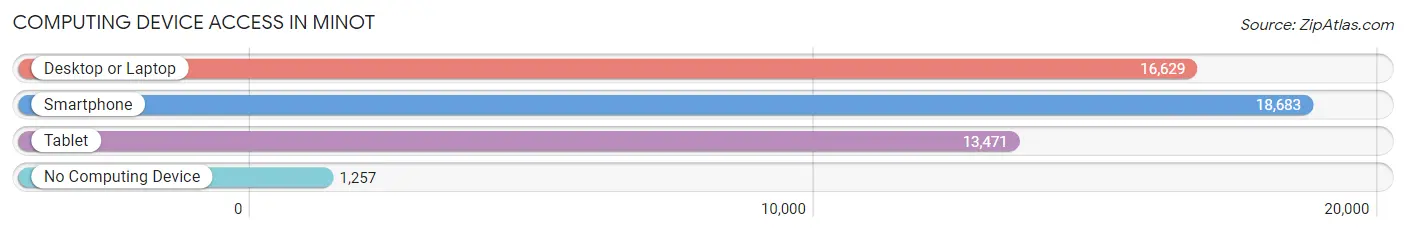
| Device Type | # Households | % Households |
| Desktop or Laptop | 16,629 | 78.6% |
| Smartphone | 18,683 | 88.3% |
| Tablet | 13,471 | 63.7% |
| No Computing Device | 1,257 | 5.9% |
| Total | 21,161 | 100.0% |
Internet Access in Minot
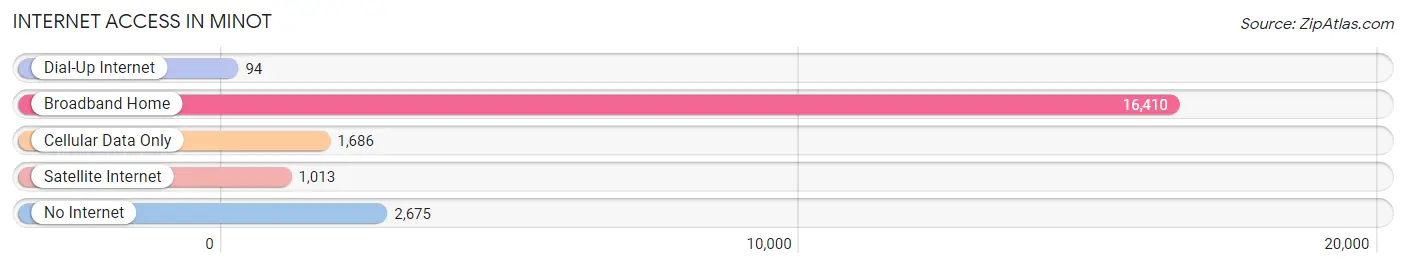
| Internet Type | # Households | % Households |
| Dial-Up Internet | 94 | 0.4% |
| Broadband Home | 16,410 | 77.5% |
| Cellular Data Only | 1,686 | 8.0% |
| Satellite Internet | 1,013 | 4.8% |
| No Internet | 2,675 | 12.6% |
| Total | 21,161 | 100.0% |
Minot Summary
Minot, North Dakota is a city located in the north-central part of the state, near the Canadian border. It is the county seat of Ward County and the fourth-largest city in the state. The city has a population of approximately 40,888 people as of 2019.
Minot has a rich history that dates back to the late 1800s. The city was founded in 1886 by the Great Northern Railway, and was named after Henry D. Minot, a railroad official. The city quickly grew and became an important hub for the railroad industry. In the early 1900s, Minot was a major center for the agricultural industry, and the city was home to several large grain elevators.
The city experienced a major economic boom in the 1950s and 1960s, when the Air Force Base was built nearby. This brought a large influx of military personnel and their families to the area, and the city’s population grew rapidly. The base was closed in the 1990s, but the city has continued to grow and thrive.
Geographically, Minot is located in the north-central part of North Dakota, near the Canadian border. The city is situated on the Souris River, and is surrounded by rolling hills and prairies. The city has a total area of 24.2 square miles, and is located at an elevation of 1,845 feet.
The climate in Minot is classified as a humid continental climate, with cold winters and hot summers. The average annual temperature is 44.2 degrees Fahrenheit, and the average annual precipitation is 17.3 inches.
The economy of Minot is largely based on the service industry, with healthcare, retail, and education being the largest employers. The city is also home to several large manufacturing companies, including a large paper mill and a large food processing plant. The city is also home to the Minot Air Force Base, which is a major employer in the area.
Demographically, Minot is a diverse city. The population is approximately 40,888 people, with a median age of 35.7 years. The racial makeup of the city is 79.2% White, 8.2% African American, 4.2% Native American, 2.2% Asian, and 6.2% from other races. The median household income is $50,945, and the median home value is $164,400.
Minot is a vibrant city with a rich history and a diverse population. The city has a strong economy and is home to several large employers. The city is also home to a variety of cultural attractions, including museums, galleries, and theaters. Minot is a great place to live, work, and play.
Common Questions
What is Per Capita Income in Minot?
Per Capita income in Minot is $41,662.
What is the Median Family Income in Minot?
Median Family Income in Minot is $100,138.
What is the Median Household income in Minot?
Median Household Income in Minot is $75,545.
What is Income or Wage Gap in Minot?
Income or Wage Gap in Minot is 34.4%.
Women in Minot earn 65.6 cents for every dollar earned by a man.
What is Family Income Deficit in Minot?
Family Income Deficit in Minot is $9,212.
Families that are below poverty line in Minot earn $9,212 less on average than the poverty threshold level.
What is Inequality or Gini Index in Minot?
Inequality or Gini Index in Minot is 0.45.
What is the Total Population of Minot?
Total Population of Minot is 48,038.
What is the Total Male Population of Minot?
Total Male Population of Minot is 25,072.
What is the Total Female Population of Minot?
Total Female Population of Minot is 22,966.
What is the Ratio of Males per 100 Females in Minot?
There are 109.17 Males per 100 Females in Minot.
What is the Ratio of Females per 100 Males in Minot?
There are 91.60 Females per 100 Males in Minot.
What is the Median Population Age in Minot?
Median Population Age in Minot is 33.0 Years.
What is the Average Family Size in Minot
Average Family Size in Minot is 3.0 People.
What is the Average Household Size in Minot
Average Household Size in Minot is 2.2 People.
How Large is the Labor Force in Minot?
There are 28,740 People in the Labor Forcein in Minot.
What is the Percentage of People in the Labor Force in Minot?
73.1% of People are in the Labor Force in Minot.
What is the Unemployment Rate in Minot?
Unemployment Rate in Minot is 3.7%.