Mount Pleasant, WI Map & Demographics
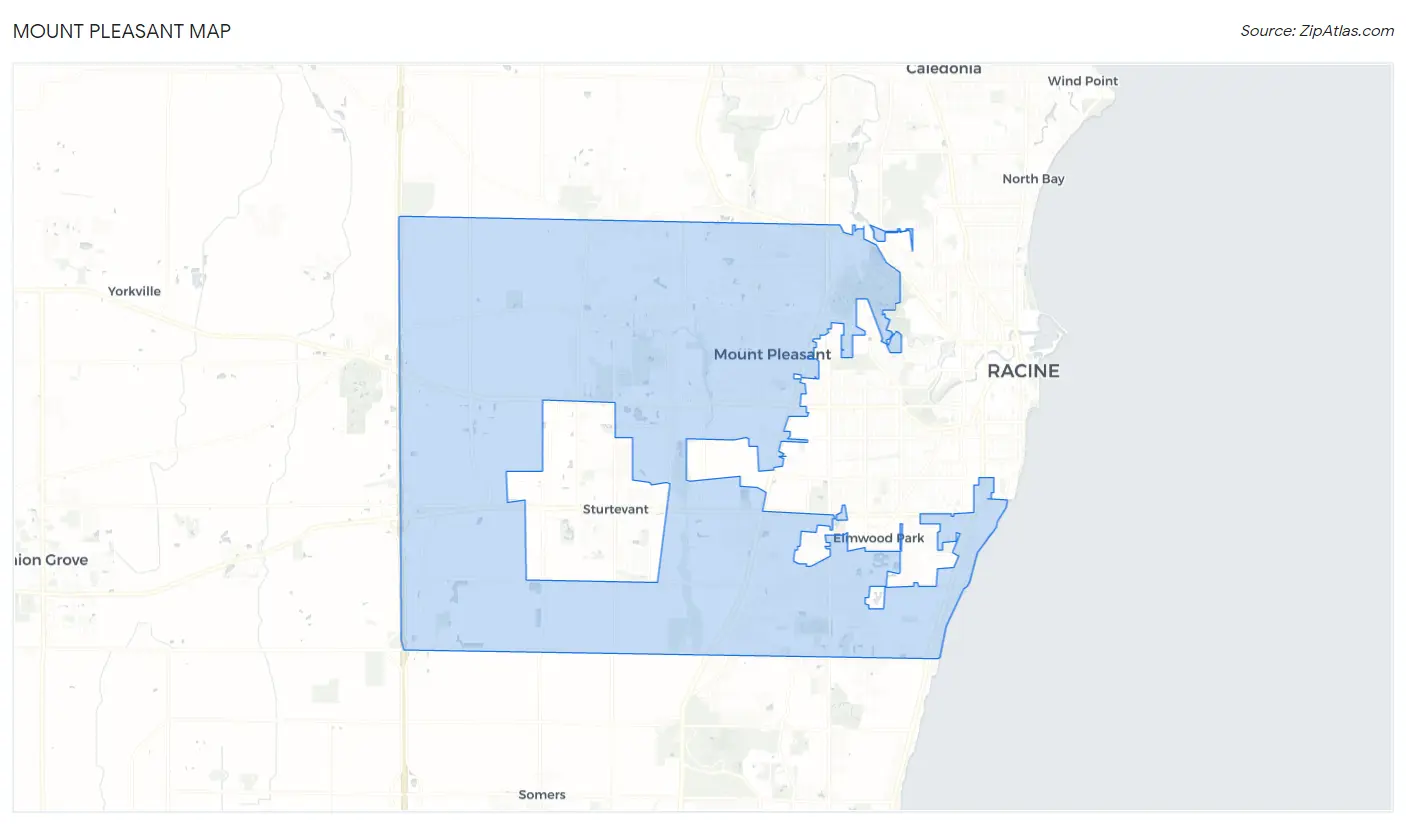
Mount Pleasant Map
Mount Pleasant Overview
$45,359
PER CAPITA INCOME
$102,328
AVG FAMILY INCOME
$83,827
AVG HOUSEHOLD INCOME
28.9%
WAGE / INCOME GAP [ % ]
71.1¢/ $1
WAGE / INCOME GAP [ $ ]
0.41
INEQUALITY / GINI INDEX
27,640
TOTAL POPULATION
13,646
MALE POPULATION
13,994
FEMALE POPULATION
97.51
MALES / 100 FEMALES
102.55
FEMALES / 100 MALES
46.7
MEDIAN AGE
2.9
AVG FAMILY SIZE
2.3
AVG HOUSEHOLD SIZE
14,176
LABOR FORCE [ PEOPLE ]
62.0%
PERCENT IN LABOR FORCE
3.0%
UNEMPLOYMENT RATE
Mount Pleasant Area Codes
Income in Mount Pleasant
Income Overview in Mount Pleasant
Per Capita Income in Mount Pleasant is $45,359, while median incomes of families and households are $102,328 and $83,827 respectively.
| Characteristic | Number | Measure |
| Per Capita Income | 27,640 | $45,359 |
| Median Family Income | 7,348 | $102,328 |
| Mean Family Income | 7,348 | $126,034 |
| Median Household Income | 11,709 | $83,827 |
| Mean Household Income | 11,709 | $104,392 |
| Income Deficit | 7,348 | $0 |
| Wage / Income Gap (%) | 27,640 | 28.94% |
| Wage / Income Gap ($) | 27,640 | 71.06¢ per $1 |
| Gini / Inequality Index | 27,640 | 0.41 |
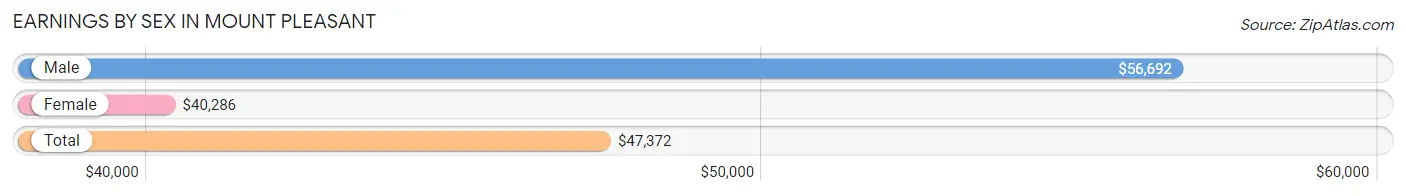
Earnings by Sex in Mount Pleasant
Average Earnings in Mount Pleasant are $47,372, $56,692 for men and $40,286 for women, a difference of 28.9%.
| Sex | Number | Average Earnings |
| Male | 8,066 (54.5%) | $56,692 |
| Female | 6,741 (45.5%) | $40,286 |
| Total | 14,807 (100.0%) | $47,372 |
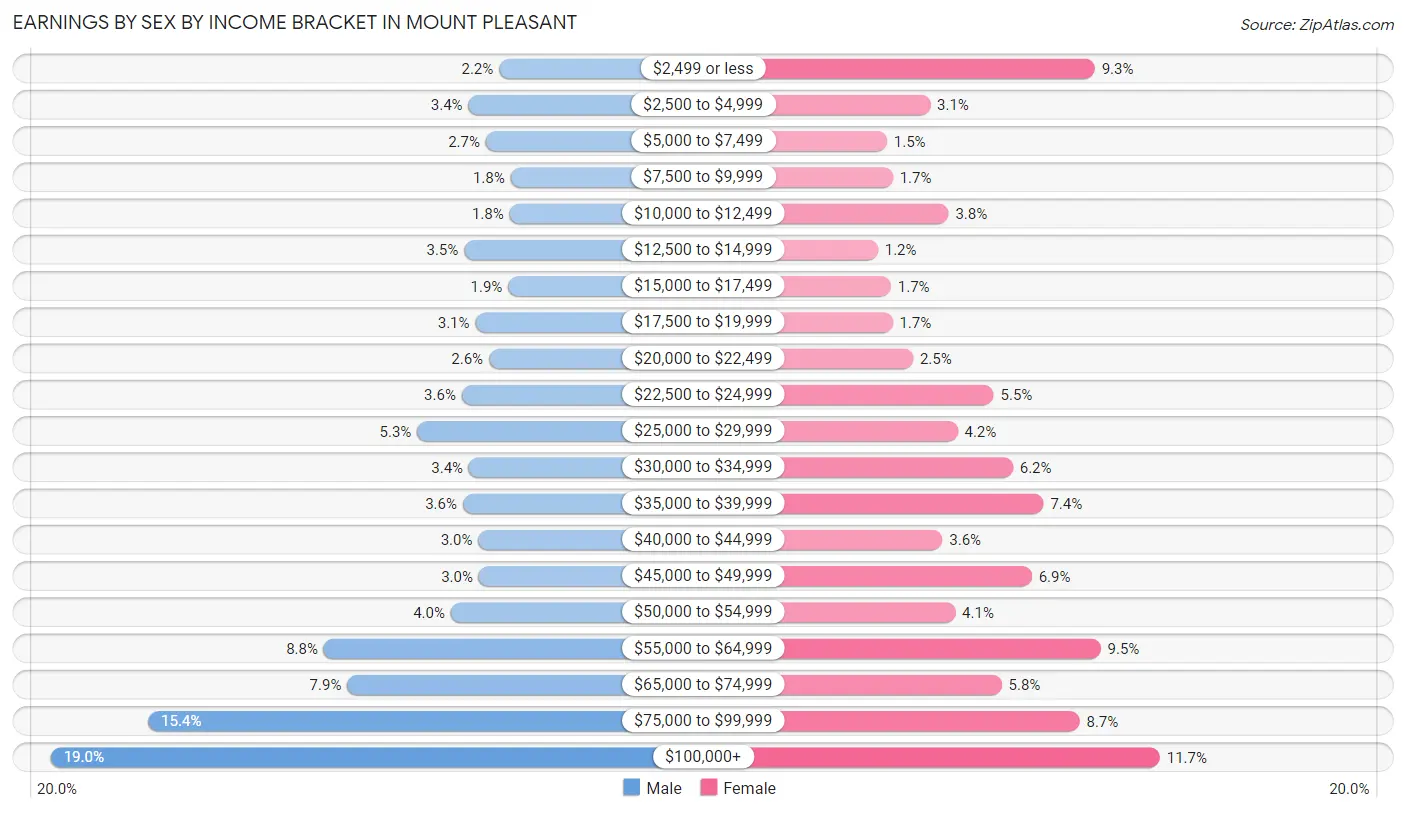
Earnings by Sex by Income Bracket in Mount Pleasant
The most common earnings brackets in Mount Pleasant are $100,000+ for men (1,534 | 19.0%) and $100,000+ for women (791 | 11.7%).
| Income | Male | Female |
| $2,499 or less | 179 (2.2%) | 626 (9.3%) |
| $2,500 to $4,999 | 272 (3.4%) | 210 (3.1%) |
| $5,000 to $7,499 | 219 (2.7%) | 101 (1.5%) |
| $7,500 to $9,999 | 144 (1.8%) | 116 (1.7%) |
| $10,000 to $12,499 | 148 (1.8%) | 257 (3.8%) |
| $12,500 to $14,999 | 285 (3.5%) | 78 (1.2%) |
| $15,000 to $17,499 | 152 (1.9%) | 111 (1.7%) |
| $17,500 to $19,999 | 251 (3.1%) | 115 (1.7%) |
| $20,000 to $22,499 | 210 (2.6%) | 167 (2.5%) |
| $22,500 to $24,999 | 292 (3.6%) | 371 (5.5%) |
| $25,000 to $29,999 | 427 (5.3%) | 280 (4.2%) |
| $30,000 to $34,999 | 270 (3.4%) | 419 (6.2%) |
| $35,000 to $39,999 | 289 (3.6%) | 497 (7.4%) |
| $40,000 to $44,999 | 242 (3.0%) | 241 (3.6%) |
| $45,000 to $49,999 | 240 (3.0%) | 467 (6.9%) |
| $50,000 to $54,999 | 325 (4.0%) | 274 (4.1%) |
| $55,000 to $64,999 | 709 (8.8%) | 641 (9.5%) |
| $65,000 to $74,999 | 638 (7.9%) | 391 (5.8%) |
| $75,000 to $99,999 | 1,240 (15.4%) | 588 (8.7%) |
| $100,000+ | 1,534 (19.0%) | 791 (11.7%) |
| Total | 8,066 (100.0%) | 6,741 (100.0%) |
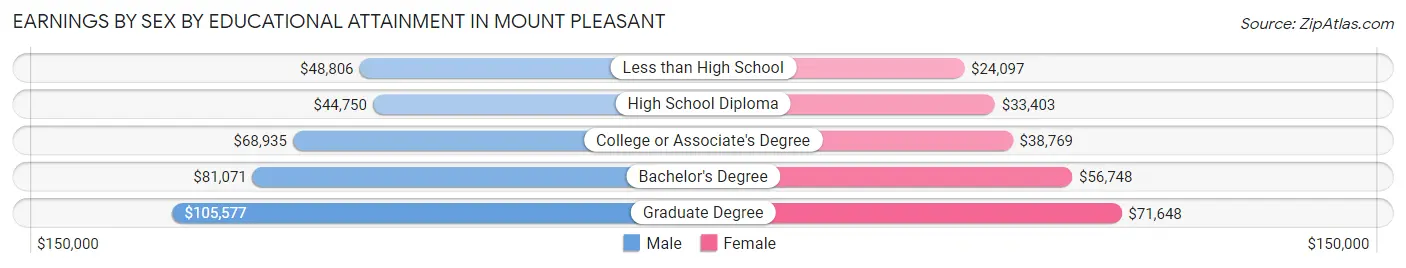
Earnings by Sex by Educational Attainment in Mount Pleasant
Average earnings in Mount Pleasant are $65,466 for men and $45,558 for women, a difference of 30.4%. Men with an educational attainment of graduate degree enjoy the highest average annual earnings of $105,577, while those with high school diploma education earn the least with $44,750. Women with an educational attainment of graduate degree earn the most with the average annual earnings of $71,648, while those with less than high school education have the smallest earnings of $24,097.
| Educational Attainment | Male Income | Female Income |
| Less than High School | $48,806 | $24,097 |
| High School Diploma | $44,750 | $33,403 |
| College or Associate's Degree | $68,935 | $38,769 |
| Bachelor's Degree | $81,071 | $56,748 |
| Graduate Degree | $105,577 | $71,648 |
| Total | $65,466 | $45,558 |
Family Income in Mount Pleasant
Family Income Brackets in Mount Pleasant
According to the Mount Pleasant family income data, there are 1,712 families falling into the $100,000 to $149,999 income range, which is the most common income bracket and makes up 23.3% of all families. Conversely, the $10,000 to $14,999 income bracket is the least frequent group with only 66 families (0.9%) belonging to this category.
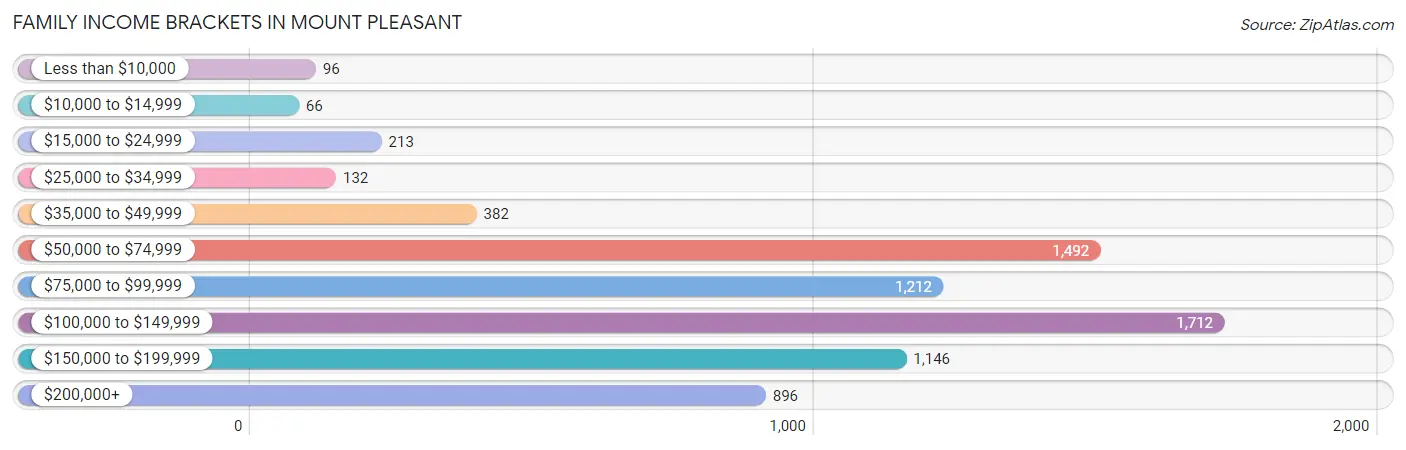
| Income Bracket | # Families | % Families |
| Less than $10,000 | 96 | 1.3% |
| $10,000 to $14,999 | 66 | 0.9% |
| $15,000 to $24,999 | 213 | 2.9% |
| $25,000 to $34,999 | 132 | 1.8% |
| $35,000 to $49,999 | 382 | 5.2% |
| $50,000 to $74,999 | 1,492 | 20.3% |
| $75,000 to $99,999 | 1,212 | 16.5% |
| $100,000 to $149,999 | 1,712 | 23.3% |
| $150,000 to $199,999 | 1,146 | 15.6% |
| $200,000+ | 896 | 12.2% |
Family Income by Famaliy Size in Mount Pleasant
5-person families (617 | 8.4%) account for the highest median family income in Mount Pleasant with $143,860 per family, while 2-person families (4,111 | 55.9%) have the highest median income of $44,658 per family member.
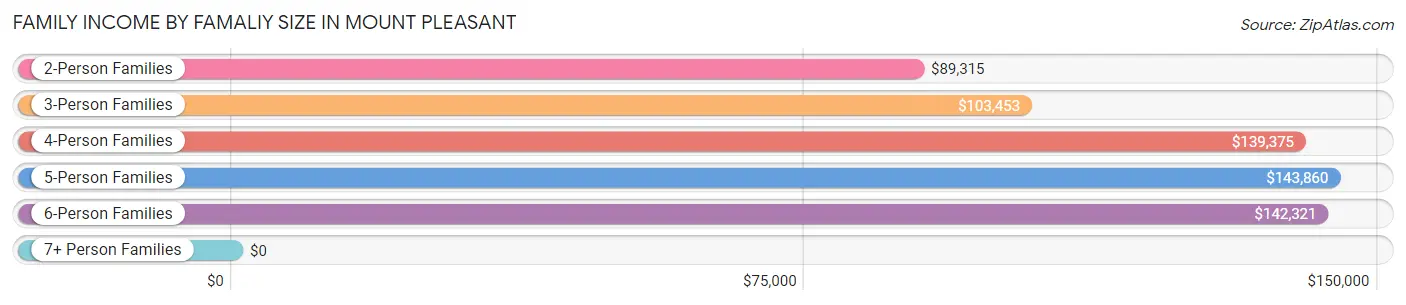
| Income Bracket | # Families | Median Income |
| 2-Person Families | 4,111 (55.9%) | $89,315 |
| 3-Person Families | 1,285 (17.5%) | $103,453 |
| 4-Person Families | 1,211 (16.5%) | $139,375 |
| 5-Person Families | 617 (8.4%) | $143,860 |
| 6-Person Families | 47 (0.6%) | $142,321 |
| 7+ Person Families | 77 (1.1%) | $0 |
| Total | 7,348 (100.0%) | $102,328 |
Family Income by Number of Earners in Mount Pleasant
The median family income in Mount Pleasant is $102,328, with families comprising 3+ earners (800) having the highest median family income of $146,250, while families with no earners (1,382) have the lowest median family income of $70,417, accounting for 10.9% and 18.8% of families, respectively.
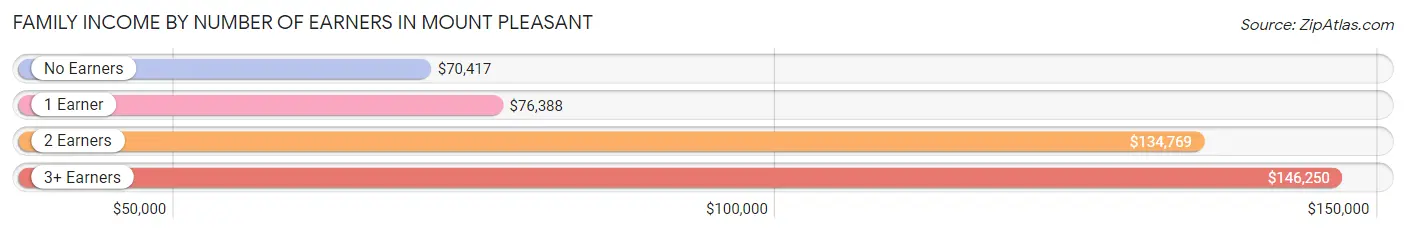
| Number of Earners | # Families | Median Income |
| No Earners | 1,382 (18.8%) | $70,417 |
| 1 Earner | 2,375 (32.3%) | $76,388 |
| 2 Earners | 2,791 (38.0%) | $134,769 |
| 3+ Earners | 800 (10.9%) | $146,250 |
| Total | 7,348 (100.0%) | $102,328 |
Household Income in Mount Pleasant
Household Income Brackets in Mount Pleasant
With 2,400 households falling in the category, the $100,000 to $149,999 income range is the most frequent in Mount Pleasant, accounting for 20.5% of all households. In contrast, only 258 households (2.2%) fall into the $10,000 to $14,999 income bracket, making it the least populous group.
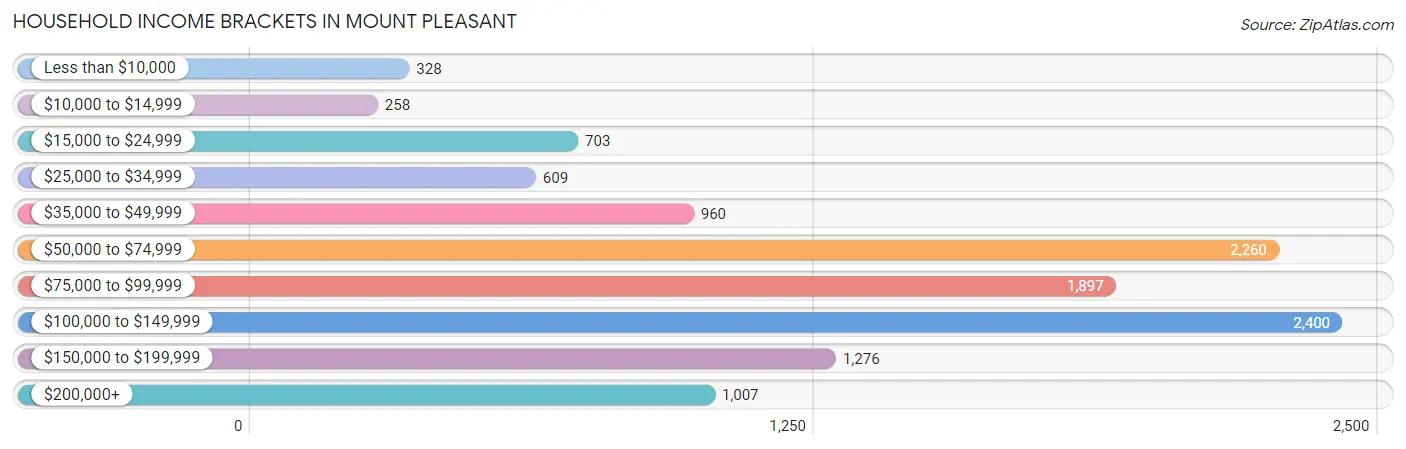
| Income Bracket | # Households | % Households |
| Less than $10,000 | 328 | 2.8% |
| $10,000 to $14,999 | 258 | 2.2% |
| $15,000 to $24,999 | 703 | 6.0% |
| $25,000 to $34,999 | 609 | 5.2% |
| $35,000 to $49,999 | 960 | 8.2% |
| $50,000 to $74,999 | 2,260 | 19.3% |
| $75,000 to $99,999 | 1,897 | 16.2% |
| $100,000 to $149,999 | 2,400 | 20.5% |
| $150,000 to $199,999 | 1,276 | 10.9% |
| $200,000+ | 1,007 | 8.6% |
Household Income by Householder Age in Mount Pleasant
The median household income in Mount Pleasant is $83,827, with the highest median household income of $108,955 found in the 45 to 64 years age bracket for the primary householder. A total of 4,295 households (36.7%) fall into this category. Meanwhile, the 65+ years age bracket for the primary householder has the lowest median household income of $57,402, with 4,112 households (35.1%) in this group.
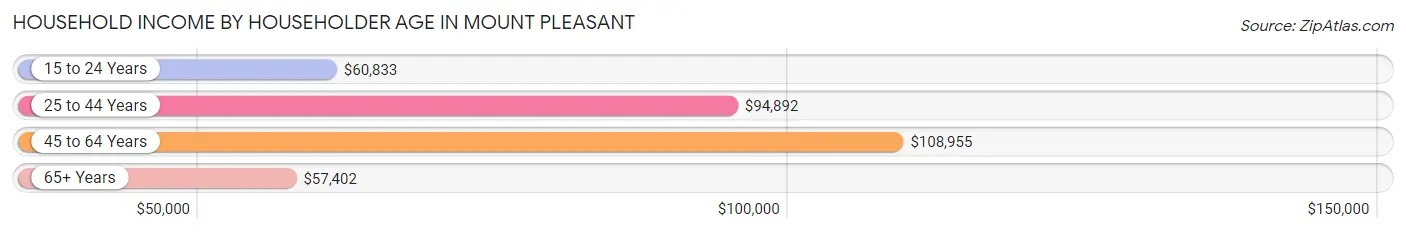
| Income Bracket | # Households | Median Income |
| 15 to 24 Years | 362 (3.1%) | $60,833 |
| 25 to 44 Years | 2,940 (25.1%) | $94,892 |
| 45 to 64 Years | 4,295 (36.7%) | $108,955 |
| 65+ Years | 4,112 (35.1%) | $57,402 |
| Total | 11,709 (100.0%) | $83,827 |
Poverty in Mount Pleasant
Income Below Poverty by Sex and Age in Mount Pleasant
With 5.6% poverty level for males and 8.6% for females among the residents of Mount Pleasant, 15 year old males and 15 year old females are the most vulnerable to poverty, with 9 males (20.4%) and 53 females (35.6%) in their respective age groups living below the poverty level.
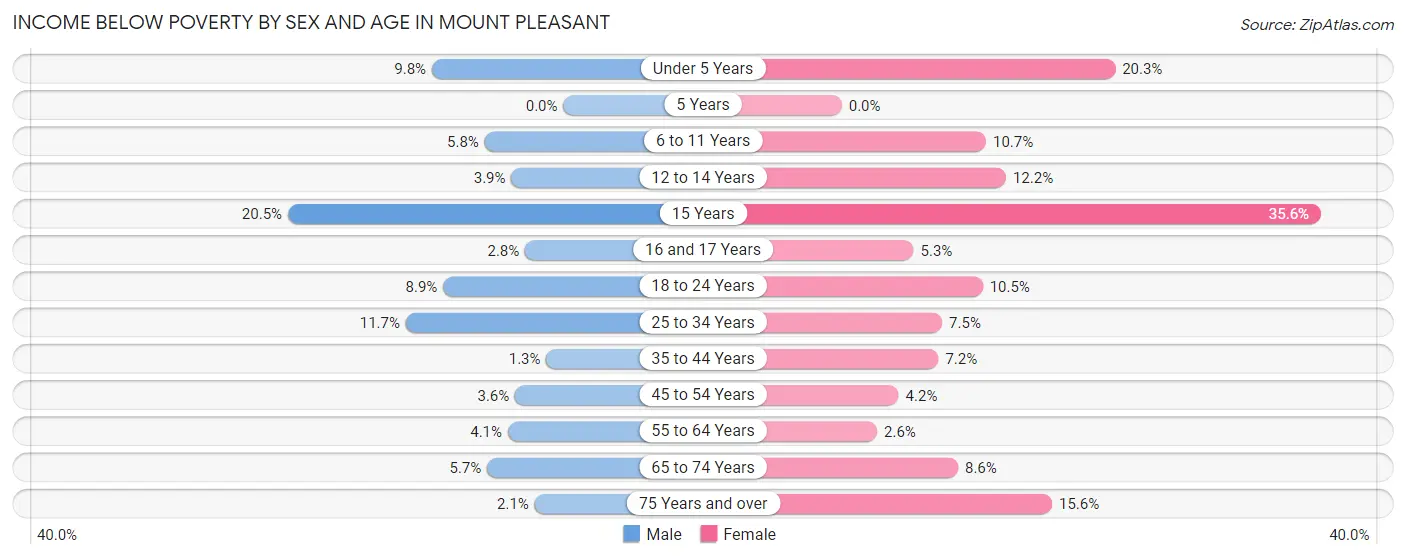
| Age Bracket | Male | Female |
| Under 5 Years | 81 (9.8%) | 163 (20.3%) |
| 5 Years | 0 (0.0%) | 0 (0.0%) |
| 6 to 11 Years | 42 (5.8%) | 109 (10.7%) |
| 12 to 14 Years | 16 (3.9%) | 49 (12.2%) |
| 15 Years | 9 (20.4%) | 53 (35.6%) |
| 16 and 17 Years | 12 (2.8%) | 9 (5.3%) |
| 18 to 24 Years | 123 (8.9%) | 82 (10.5%) |
| 25 to 34 Years | 187 (11.7%) | 119 (7.4%) |
| 35 to 44 Years | 19 (1.3%) | 80 (7.2%) |
| 45 to 54 Years | 55 (3.6%) | 69 (4.2%) |
| 55 to 64 Years | 86 (4.1%) | 67 (2.6%) |
| 65 to 74 Years | 95 (5.7%) | 176 (8.6%) |
| 75 Years and over | 23 (2.1%) | 216 (15.6%) |
| Total | 748 (5.6%) | 1,192 (8.6%) |
Income Above Poverty by Sex and Age in Mount Pleasant
According to the poverty statistics in Mount Pleasant, males aged 5 years and females aged 5 years are the age groups that are most secure financially, with 100.0% of males and 100.0% of females in these age groups living above the poverty line.
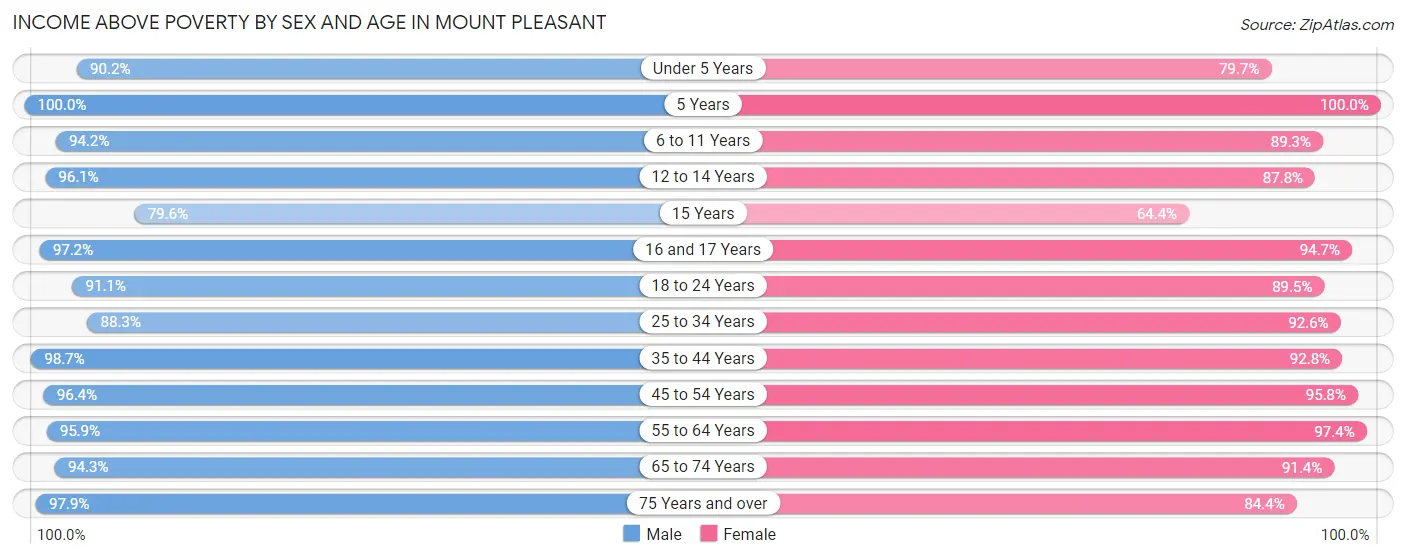
| Age Bracket | Male | Female |
| Under 5 Years | 749 (90.2%) | 640 (79.7%) |
| 5 Years | 126 (100.0%) | 235 (100.0%) |
| 6 to 11 Years | 677 (94.2%) | 909 (89.3%) |
| 12 to 14 Years | 398 (96.1%) | 353 (87.8%) |
| 15 Years | 35 (79.5%) | 96 (64.4%) |
| 16 and 17 Years | 411 (97.2%) | 160 (94.7%) |
| 18 to 24 Years | 1,256 (91.1%) | 702 (89.5%) |
| 25 to 34 Years | 1,411 (88.3%) | 1,479 (92.5%) |
| 35 to 44 Years | 1,490 (98.7%) | 1,034 (92.8%) |
| 45 to 54 Years | 1,483 (96.4%) | 1,567 (95.8%) |
| 55 to 64 Years | 2,000 (95.9%) | 2,488 (97.4%) |
| 65 to 74 Years | 1,584 (94.3%) | 1,863 (91.4%) |
| 75 Years and over | 1,056 (97.9%) | 1,168 (84.4%) |
| Total | 12,676 (94.4%) | 12,694 (91.4%) |
Income Below Poverty Among Married-Couple Families in Mount Pleasant
The poverty statistics for married-couple families in Mount Pleasant show that 2.4% or 137 of the total 5,824 families live below the poverty line. Families with 3 or 4 children have the highest poverty rate of 8.6%, comprising of 31 families. On the other hand, families with no children have the lowest poverty rate of 1.8%, which includes 70 families.
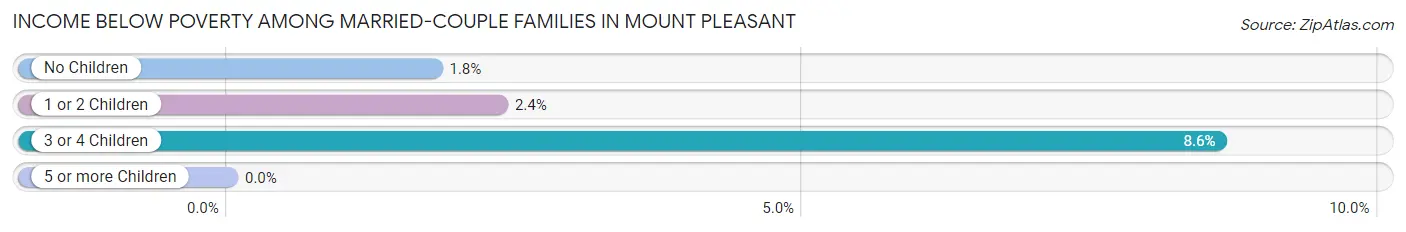
| Children | Above Poverty | Below Poverty |
| No Children | 3,864 (98.2%) | 70 (1.8%) |
| 1 or 2 Children | 1,494 (97.7%) | 36 (2.4%) |
| 3 or 4 Children | 329 (91.4%) | 31 (8.6%) |
| 5 or more Children | 0 (0.0%) | 0 (0.0%) |
| Total | 5,687 (97.7%) | 137 (2.4%) |
Income Below Poverty Among Single-Parent Households in Mount Pleasant
According to the poverty data in Mount Pleasant, 2.5% or 10 single-father households and 15.7% or 176 single-mother households are living below the poverty line. Among single-father households, those with 1 or 2 children have the highest poverty rate, with 10 households (3.2%) experiencing poverty. Likewise, among single-mother households, those with 3 or 4 children have the highest poverty rate, with 64 households (56.6%) falling below the poverty line.
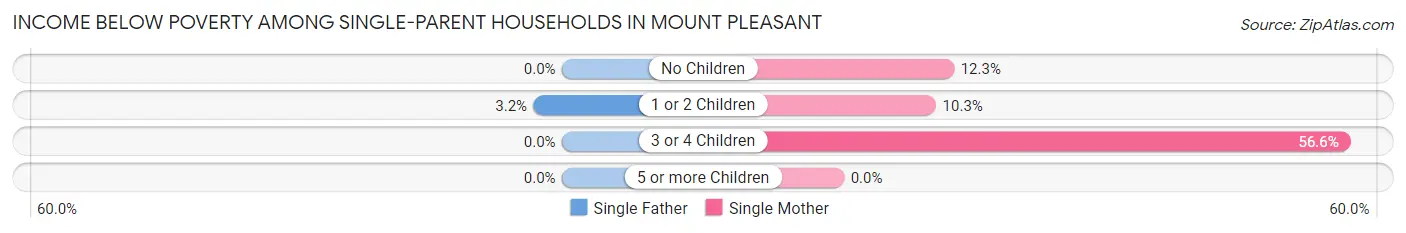
| Children | Single Father | Single Mother |
| No Children | 0 (0.0%) | 53 (12.3%) |
| 1 or 2 Children | 10 (3.2%) | 59 (10.3%) |
| 3 or 4 Children | 0 (0.0%) | 64 (56.6%) |
| 5 or more Children | 0 (0.0%) | 0 (0.0%) |
| Total | 10 (2.5%) | 176 (15.7%) |
Income Below Poverty Among Married-Couple vs Single-Parent Households in Mount Pleasant
The poverty data for Mount Pleasant shows that 137 of the married-couple family households (2.4%) and 186 of the single-parent households (12.2%) are living below the poverty level. Within the married-couple family households, those with 3 or 4 children have the highest poverty rate, with 31 households (8.6%) falling below the poverty line. Among the single-parent households, those with 3 or 4 children have the highest poverty rate, with 64 household (49.6%) living below poverty.
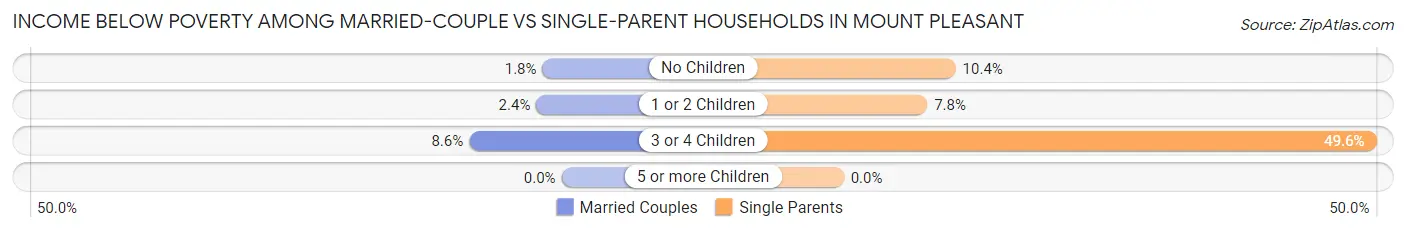
| Children | Married-Couple Families | Single-Parent Households |
| No Children | 70 (1.8%) | 53 (10.4%) |
| 1 or 2 Children | 36 (2.4%) | 69 (7.8%) |
| 3 or 4 Children | 31 (8.6%) | 64 (49.6%) |
| 5 or more Children | 0 (0.0%) | 0 (0.0%) |
| Total | 137 (2.4%) | 186 (12.2%) |
Race in Mount Pleasant
The most populous races in Mount Pleasant are White / Caucasian (21,750 | 78.7%), Hispanic or Latino (3,408 | 12.3%), and Black / African American (2,348 | 8.5%).
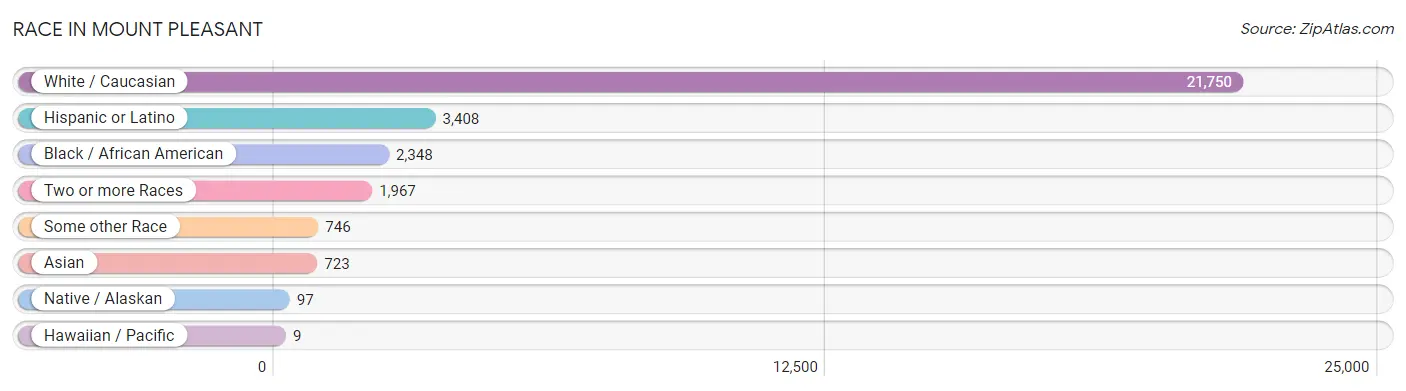
| Race | # Population | % Population |
| Asian | 723 | 2.6% |
| Black / African American | 2,348 | 8.5% |
| Hawaiian / Pacific | 9 | 0.0% |
| Hispanic or Latino | 3,408 | 12.3% |
| Native / Alaskan | 97 | 0.4% |
| White / Caucasian | 21,750 | 78.7% |
| Two or more Races | 1,967 | 7.1% |
| Some other Race | 746 | 2.7% |
| Total | 27,640 | 100.0% |
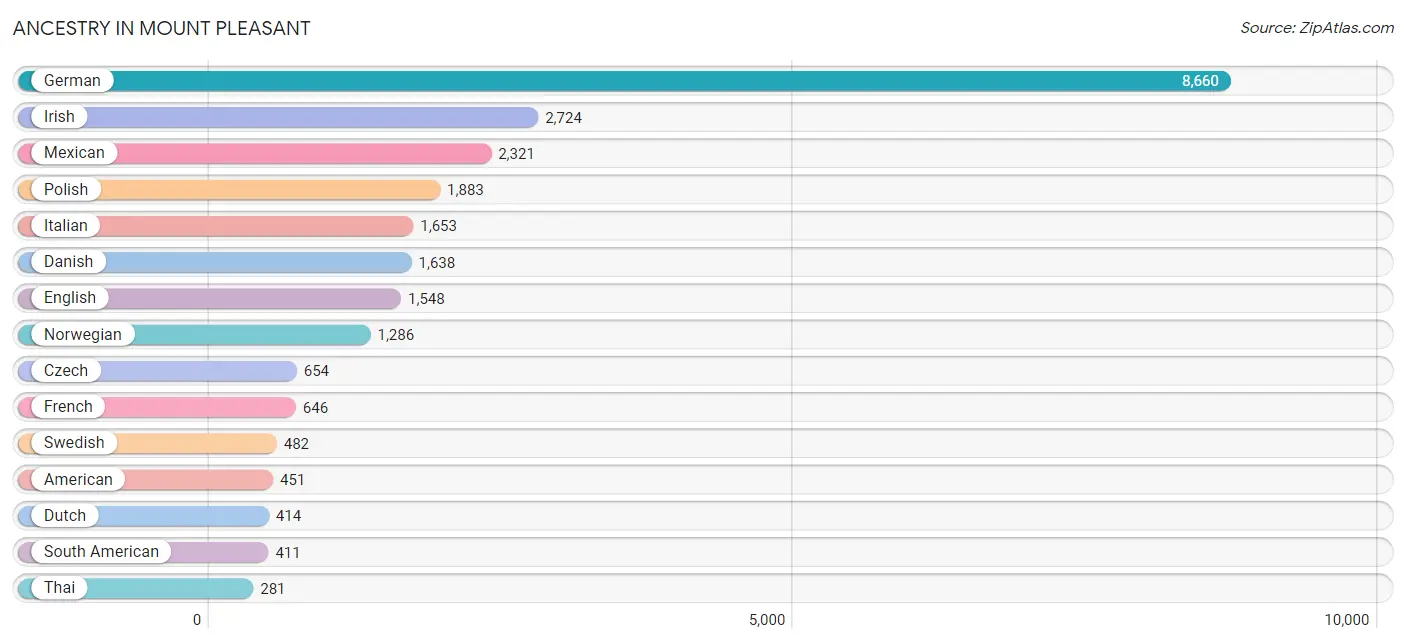
Ancestry in Mount Pleasant
The most populous ancestries reported in Mount Pleasant are German (8,660 | 31.3%), Irish (2,724 | 9.9%), Mexican (2,321 | 8.4%), Polish (1,883 | 6.8%), and Italian (1,653 | 6.0%), together accounting for 62.4% of all Mount Pleasant residents.
| Ancestry | # Population | % Population |
| African | 18 | 0.1% |
| American | 451 | 1.6% |
| Apache | 18 | 0.1% |
| Arab | 211 | 0.8% |
| Argentinean | 205 | 0.7% |
| Armenian | 67 | 0.2% |
| Australian | 145 | 0.5% |
| Austrian | 127 | 0.5% |
| Belgian | 96 | 0.4% |
| Bhutanese | 30 | 0.1% |
| British | 94 | 0.3% |
| Burmese | 34 | 0.1% |
| Canadian | 27 | 0.1% |
| Carpatho Rusyn | 7 | 0.0% |
| Central American | 68 | 0.3% |
| Central American Indian | 49 | 0.2% |
| Cherokee | 53 | 0.2% |
| Chippewa | 2 | 0.0% |
| Colombian | 56 | 0.2% |
| Croatian | 174 | 0.6% |
| Cuban | 22 | 0.1% |
| Czech | 654 | 2.4% |
| Czechoslovakian | 44 | 0.2% |
| Danish | 1,638 | 5.9% |
| Dutch | 414 | 1.5% |
| Eastern European | 36 | 0.1% |
| Egyptian | 37 | 0.1% |
| English | 1,548 | 5.6% |
| Ethiopian | 22 | 0.1% |
| European | 263 | 0.9% |
| Filipino | 28 | 0.1% |
| Finnish | 28 | 0.1% |
| French | 646 | 2.3% |
| French American Indian | 52 | 0.2% |
| French Canadian | 194 | 0.7% |
| German | 8,660 | 31.3% |
| Greek | 74 | 0.3% |
| Guatemalan | 48 | 0.2% |
| Hungarian | 222 | 0.8% |
| Icelander | 11 | 0.0% |
| Indian (Asian) | 194 | 0.7% |
| Inupiat | 46 | 0.2% |
| Irish | 2,724 | 9.9% |
| Iroquois | 2 | 0.0% |
| Italian | 1,653 | 6.0% |
| Jamaican | 17 | 0.1% |
| Korean | 264 | 1.0% |
| Lithuanian | 166 | 0.6% |
| Luxembourger | 11 | 0.0% |
| Mexican | 2,321 | 8.4% |
| Native Hawaiian | 95 | 0.3% |
| Navajo | 9 | 0.0% |
| Northern European | 23 | 0.1% |
| Norwegian | 1,286 | 4.6% |
| Pakistani | 10 | 0.0% |
| Pennsylvania German | 11 | 0.0% |
| Peruvian | 150 | 0.5% |
| Polish | 1,883 | 6.8% |
| Portuguese | 32 | 0.1% |
| Puerto Rican | 216 | 0.8% |
| Romanian | 11 | 0.0% |
| Russian | 151 | 0.5% |
| Salvadoran | 20 | 0.1% |
| Scandinavian | 88 | 0.3% |
| Scotch-Irish | 48 | 0.2% |
| Scottish | 216 | 0.8% |
| Serbian | 90 | 0.3% |
| Slavic | 15 | 0.1% |
| Slovak | 121 | 0.4% |
| Slovene | 14 | 0.1% |
| South American | 411 | 1.5% |
| Spaniard | 10 | 0.0% |
| Spanish | 29 | 0.1% |
| Sri Lankan | 18 | 0.1% |
| Subsaharan African | 40 | 0.1% |
| Swedish | 482 | 1.7% |
| Swiss | 101 | 0.4% |
| Syrian | 9 | 0.0% |
| Thai | 281 | 1.0% |
| Trinidadian and Tobagonian | 1 | 0.0% |
| Ukrainian | 50 | 0.2% |
| Welsh | 121 | 0.4% |
| West Indian | 15 | 0.1% |
| Yugoslavian | 7 | 0.0% | View All 84 Rows |
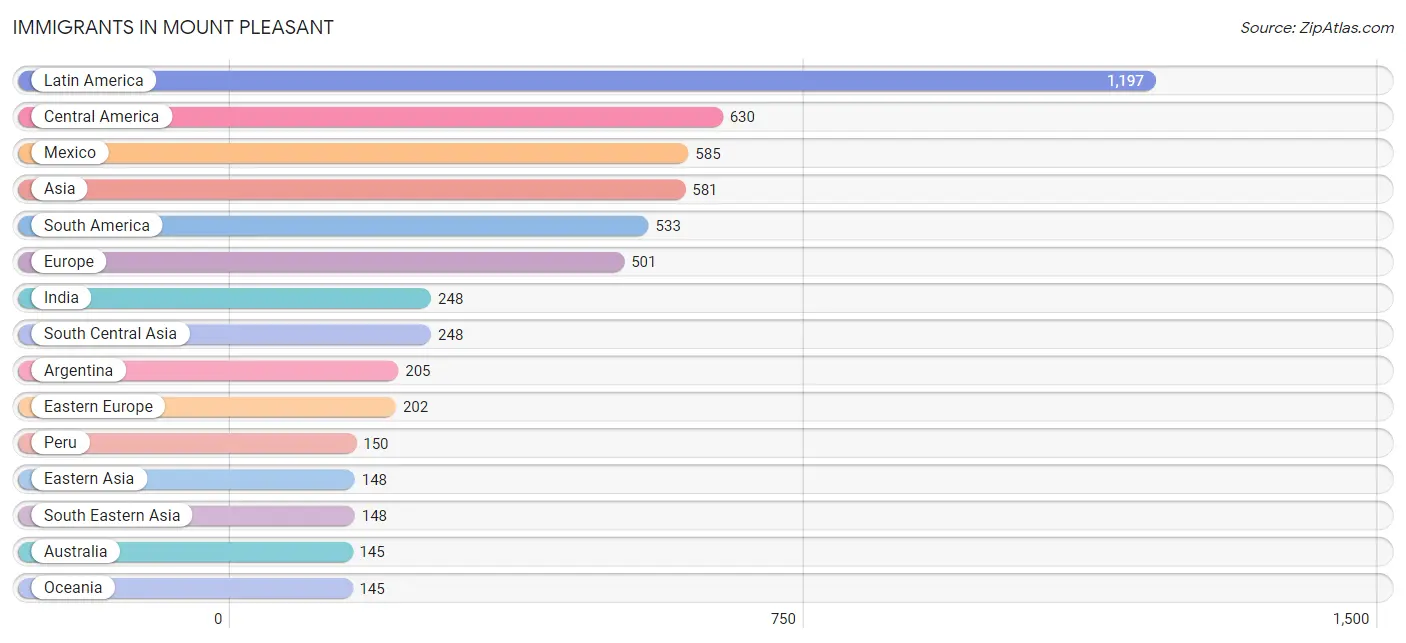
Immigrants in Mount Pleasant
The most numerous immigrant groups reported in Mount Pleasant came from Latin America (1,197 | 4.3%), Central America (630 | 2.3%), Mexico (585 | 2.1%), Asia (581 | 2.1%), and South America (533 | 1.9%), together accounting for 12.8% of all Mount Pleasant residents.
| Immigration Origin | # Population | % Population |
| Africa | 63 | 0.2% |
| Argentina | 205 | 0.7% |
| Asia | 581 | 2.1% |
| Australia | 145 | 0.5% |
| Canada | 61 | 0.2% |
| Caribbean | 34 | 0.1% |
| Central America | 630 | 2.3% |
| China | 128 | 0.5% |
| Colombia | 48 | 0.2% |
| Cuba | 8 | 0.0% |
| Czechoslovakia | 22 | 0.1% |
| Eastern Africa | 46 | 0.2% |
| Eastern Asia | 148 | 0.5% |
| Eastern Europe | 202 | 0.7% |
| Egypt | 17 | 0.1% |
| El Salvador | 20 | 0.1% |
| Ethiopia | 46 | 0.2% |
| Europe | 501 | 1.8% |
| France | 26 | 0.1% |
| Germany | 53 | 0.2% |
| Greece | 23 | 0.1% |
| Guatemala | 25 | 0.1% |
| Hong Kong | 14 | 0.1% |
| India | 248 | 0.9% |
| Italy | 17 | 0.1% |
| Jordan | 28 | 0.1% |
| Korea | 20 | 0.1% |
| Latin America | 1,197 | 4.3% |
| Mexico | 585 | 2.1% |
| Netherlands | 15 | 0.1% |
| Northern Africa | 17 | 0.1% |
| Northern Europe | 70 | 0.3% |
| Oceania | 145 | 0.5% |
| Peru | 150 | 0.5% |
| Philippines | 137 | 0.5% |
| Poland | 78 | 0.3% |
| Romania | 11 | 0.0% |
| Serbia | 73 | 0.3% |
| South America | 533 | 1.9% |
| South Central Asia | 248 | 0.9% |
| South Eastern Asia | 148 | 0.5% |
| Southern Europe | 135 | 0.5% |
| Spain | 95 | 0.3% |
| Syria | 9 | 0.0% |
| Taiwan | 28 | 0.1% |
| Trinidad and Tobago | 26 | 0.1% |
| Ukraine | 8 | 0.0% |
| Venezuela | 130 | 0.5% |
| Vietnam | 11 | 0.0% |
| Western Asia | 37 | 0.1% |
| Western Europe | 94 | 0.3% | View All 51 Rows |
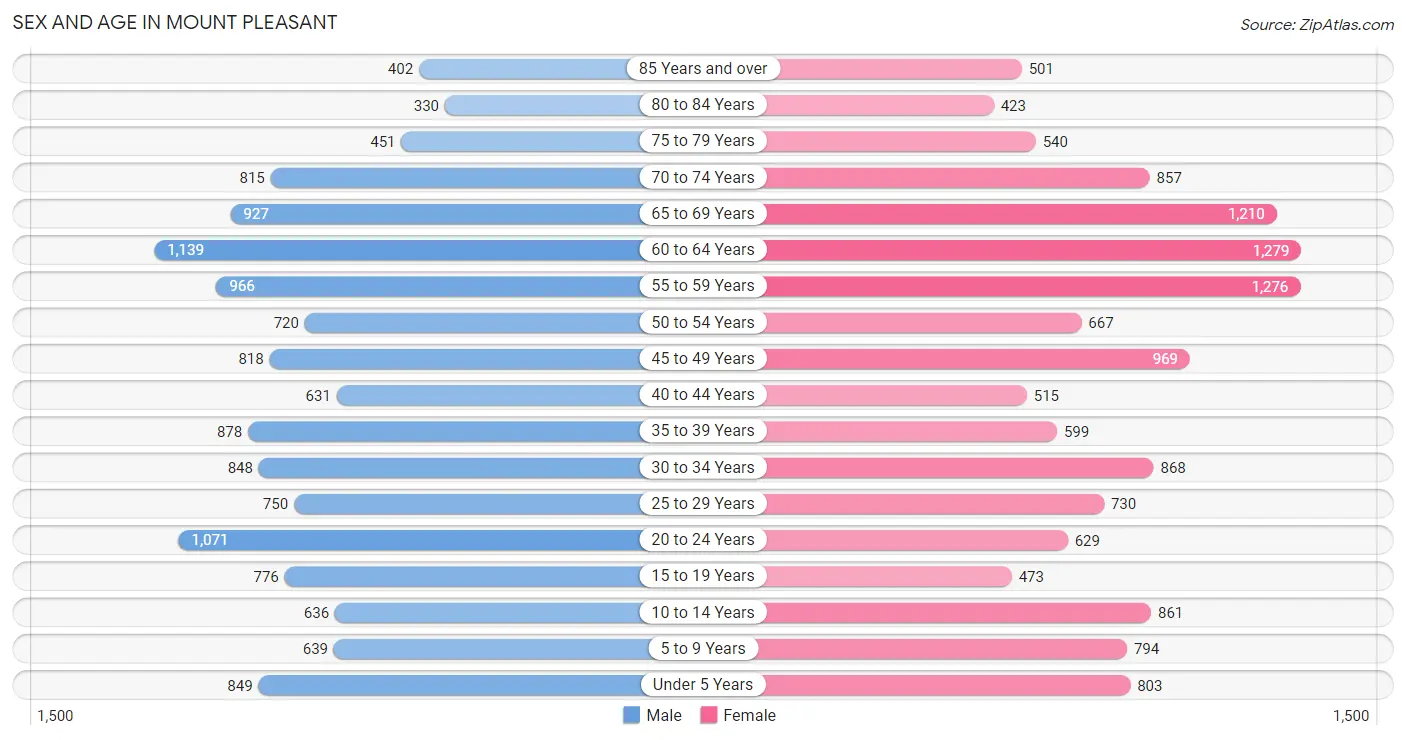
Sex and Age in Mount Pleasant
Sex and Age in Mount Pleasant
The most populous age groups in Mount Pleasant are 60 to 64 Years (1,139 | 8.4%) for men and 60 to 64 Years (1,279 | 9.1%) for women.
| Age Bracket | Male | Female |
| Under 5 Years | 849 (6.2%) | 803 (5.7%) |
| 5 to 9 Years | 639 (4.7%) | 794 (5.7%) |
| 10 to 14 Years | 636 (4.7%) | 861 (6.1%) |
| 15 to 19 Years | 776 (5.7%) | 473 (3.4%) |
| 20 to 24 Years | 1,071 (7.9%) | 629 (4.5%) |
| 25 to 29 Years | 750 (5.5%) | 730 (5.2%) |
| 30 to 34 Years | 848 (6.2%) | 868 (6.2%) |
| 35 to 39 Years | 878 (6.4%) | 599 (4.3%) |
| 40 to 44 Years | 631 (4.6%) | 515 (3.7%) |
| 45 to 49 Years | 818 (6.0%) | 969 (6.9%) |
| 50 to 54 Years | 720 (5.3%) | 667 (4.8%) |
| 55 to 59 Years | 966 (7.1%) | 1,276 (9.1%) |
| 60 to 64 Years | 1,139 (8.4%) | 1,279 (9.1%) |
| 65 to 69 Years | 927 (6.8%) | 1,210 (8.6%) |
| 70 to 74 Years | 815 (6.0%) | 857 (6.1%) |
| 75 to 79 Years | 451 (3.3%) | 540 (3.9%) |
| 80 to 84 Years | 330 (2.4%) | 423 (3.0%) |
| 85 Years and over | 402 (2.9%) | 501 (3.6%) |
| Total | 13,646 (100.0%) | 13,994 (100.0%) |
Families and Households in Mount Pleasant
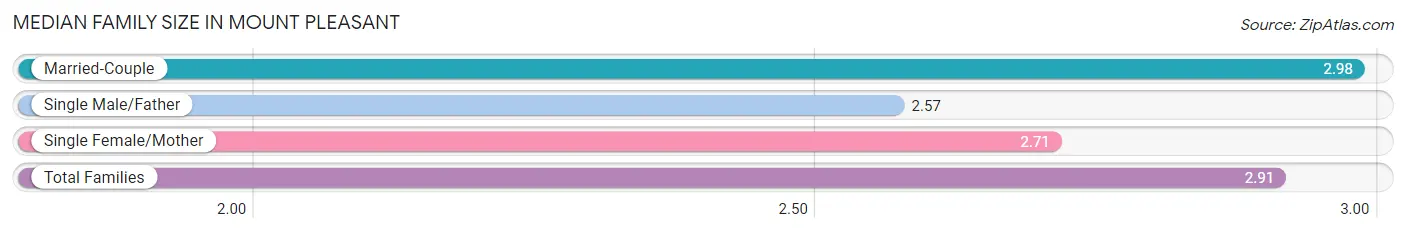
Median Family Size in Mount Pleasant
The median family size in Mount Pleasant is 2.91 persons per family, with married-couple families (5,824 | 79.3%) accounting for the largest median family size of 2.98 persons per family. On the other hand, single male/father families (406 | 5.5%) represent the smallest median family size with 2.57 persons per family.
| Family Type | # Families | Family Size |
| Married-Couple | 5,824 (79.3%) | 2.98 |
| Single Male/Father | 406 (5.5%) | 2.57 |
| Single Female/Mother | 1,118 (15.2%) | 2.71 |
| Total Families | 7,348 (100.0%) | 2.91 |
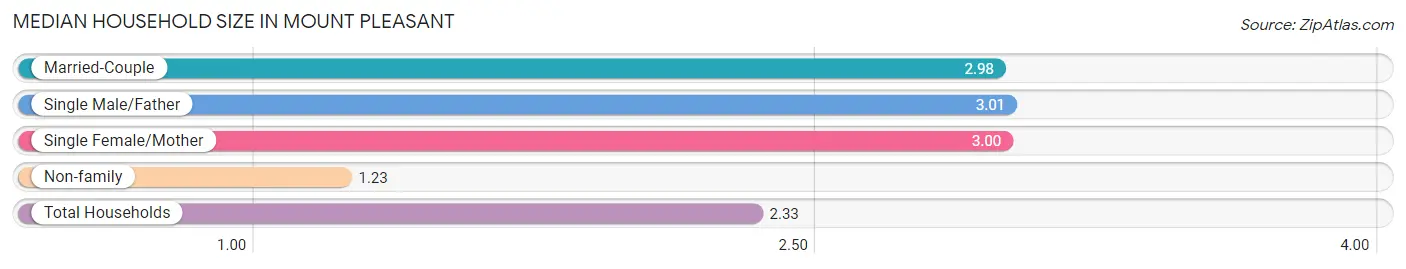
Median Household Size in Mount Pleasant
The median household size in Mount Pleasant is 2.33 persons per household, with single male/father households (406 | 3.5%) accounting for the largest median household size of 3.01 persons per household. non-family households (4,361 | 37.2%) represent the smallest median household size with 1.23 persons per household.
| Household Type | # Households | Household Size |
| Married-Couple | 5,824 (49.7%) | 2.98 |
| Single Male/Father | 406 (3.5%) | 3.01 |
| Single Female/Mother | 1,118 (9.6%) | 3.00 |
| Non-family | 4,361 (37.2%) | 1.23 |
| Total Households | 11,709 (100.0%) | 2.33 |
Household Size by Marriage Status in Mount Pleasant
Out of a total of 11,709 households in Mount Pleasant, 7,348 (62.8%) are family households, while 4,361 (37.2%) are nonfamily households. The most numerous type of family households are 2-person households, comprising 3,752, and the most common type of nonfamily households are 1-person households, comprising 3,637.
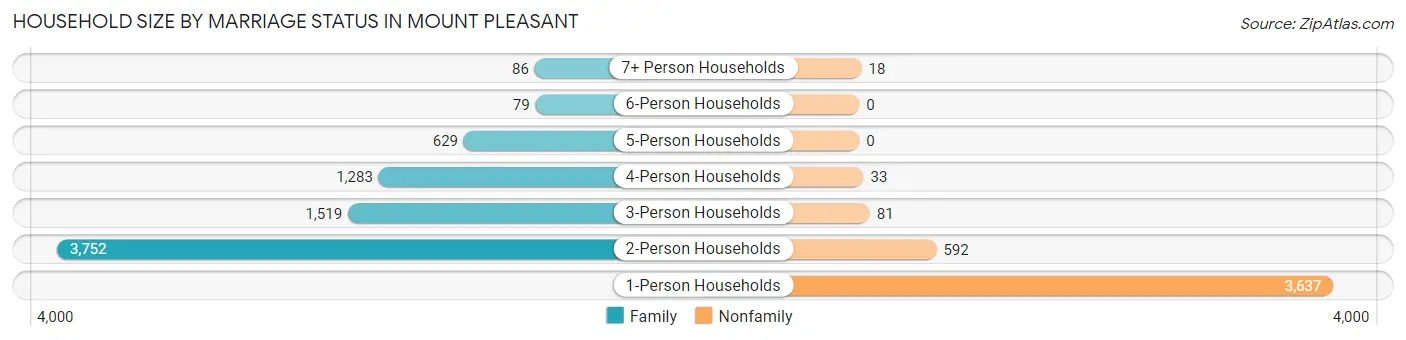
| Household Size | Family Households | Nonfamily Households |
| 1-Person Households | - | 3,637 (31.1%) |
| 2-Person Households | 3,752 (32.0%) | 592 (5.1%) |
| 3-Person Households | 1,519 (13.0%) | 81 (0.7%) |
| 4-Person Households | 1,283 (11.0%) | 33 (0.3%) |
| 5-Person Households | 629 (5.4%) | 0 (0.0%) |
| 6-Person Households | 79 (0.7%) | 0 (0.0%) |
| 7+ Person Households | 86 (0.7%) | 18 (0.2%) |
| Total | 7,348 (62.8%) | 4,361 (37.2%) |
Female Fertility in Mount Pleasant
Fertility by Age in Mount Pleasant
Average fertility rate in Mount Pleasant is 76.0 births per 1,000 women. Women in the age bracket of 20 to 34 years have the highest fertility rate with 107.0 births per 1,000 women. Women in the age bracket of 20 to 34 years acount for 64.3% of all women with births.
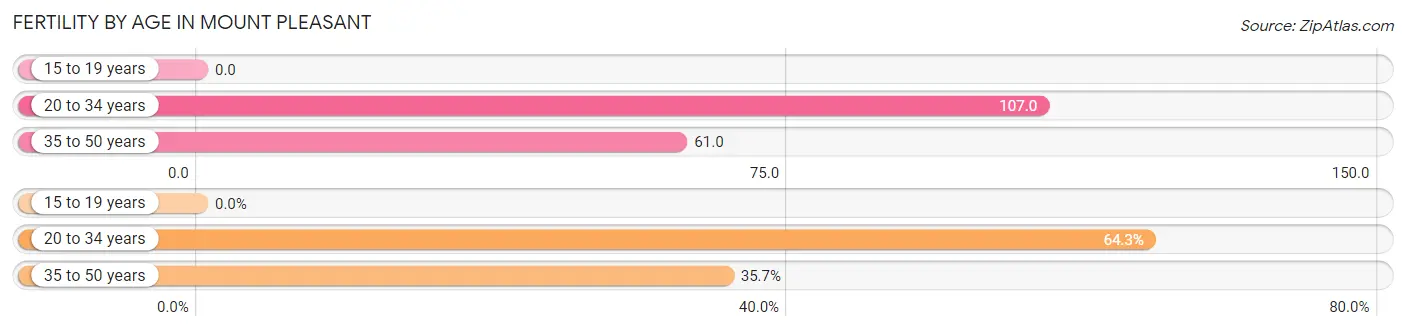
| Age Bracket | Women with Births | Births / 1,000 Women |
| 15 to 19 years | 0 (0.0%) | 0.0 |
| 20 to 34 years | 238 (64.3%) | 107.0 |
| 35 to 50 years | 132 (35.7%) | 61.0 |
| Total | 370 (100.0%) | 76.0 |
Fertility by Age by Marriage Status in Mount Pleasant
84.1% of women with births (370) in Mount Pleasant are married. The highest percentage of unmarried women with births falls into 20 to 34 years age bracket with 18.5% of them unmarried at the time of birth, while the lowest percentage of unmarried women with births belong to 35 to 50 years age bracket with 11.4% of them unmarried.
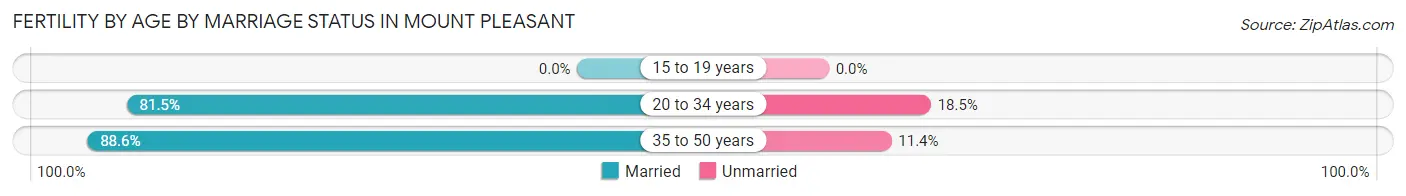
| Age Bracket | Married | Unmarried |
| 15 to 19 years | 0 (0.0%) | 0 (0.0%) |
| 20 to 34 years | 194 (81.5%) | 44 (18.5%) |
| 35 to 50 years | 117 (88.6%) | 15 (11.4%) |
| Total | 311 (84.1%) | 59 (16.0%) |
Fertility by Education in Mount Pleasant
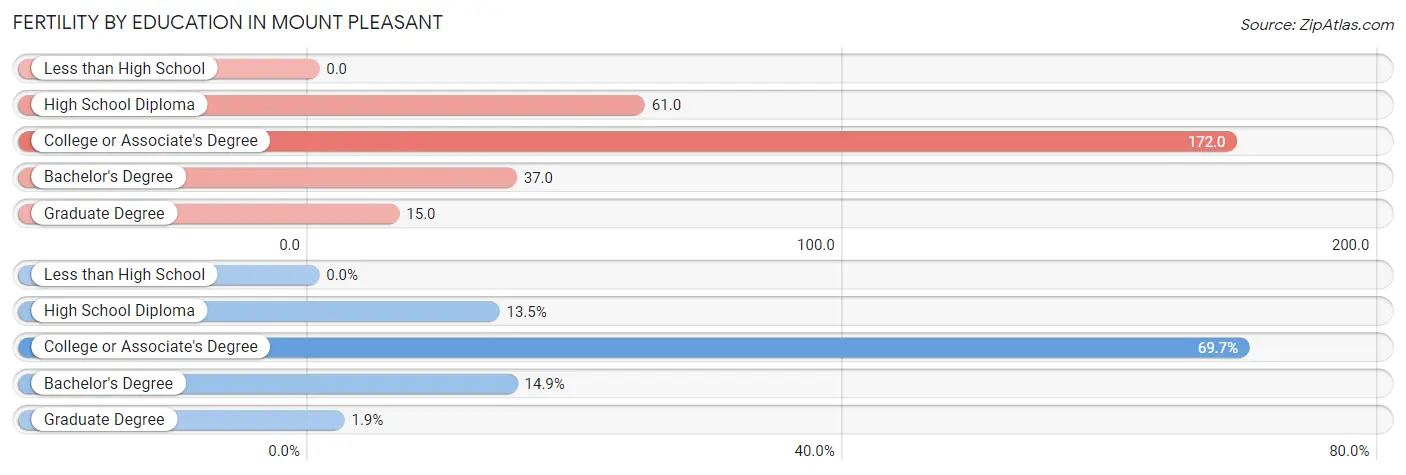
| Educational Attainment | Women with Births | Births / 1,000 Women |
| Less than High School | 0 (0.0%) | 0.0 |
| High School Diploma | 50 (13.5%) | 61.0 |
| College or Associate's Degree | 258 (69.7%) | 172.0 |
| Bachelor's Degree | 55 (14.9%) | 37.0 |
| Graduate Degree | 7 (1.9%) | 15.0 |
| Total | 370 (100.0%) | 76.0 |
Fertility by Education by Marriage Status in Mount Pleasant
16.0% of women with births in Mount Pleasant are unmarried. Women with the educational attainment of college or associate's degree are most likely to be married with 100.0% of them married at childbirth, while women with the educational attainment of high school diploma are least likely to be married with 88.0% of them unmarried at childbirth.
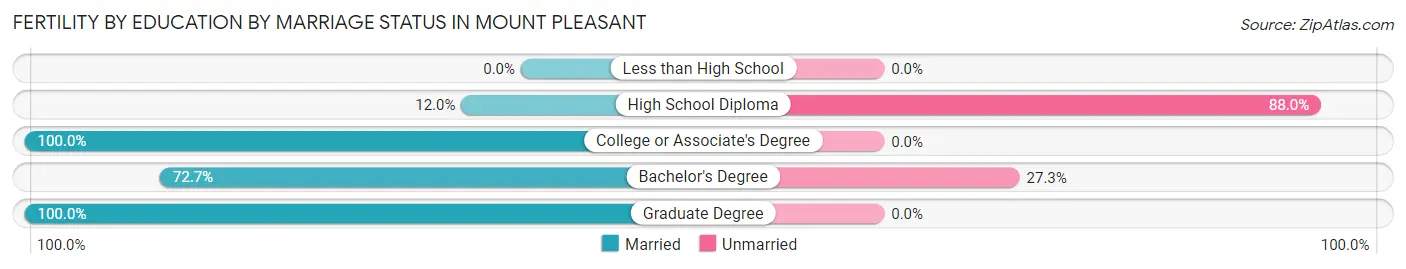
| Educational Attainment | Married | Unmarried |
| Less than High School | 0 (0.0%) | 0 (0.0%) |
| High School Diploma | 6 (12.0%) | 44 (88.0%) |
| College or Associate's Degree | 258 (100.0%) | 0 (0.0%) |
| Bachelor's Degree | 40 (72.7%) | 15 (27.3%) |
| Graduate Degree | 7 (100.0%) | 0 (0.0%) |
| Total | 311 (84.1%) | 59 (16.0%) |
Employment Characteristics in Mount Pleasant
Employment by Class of Employer in Mount Pleasant
Among the 13,504 employed individuals in Mount Pleasant, private company employees (9,336 | 69.1%), not-for-profit organizations (1,199 | 8.9%), and local government employees (1,141 | 8.5%) make up the most common classes of employment.
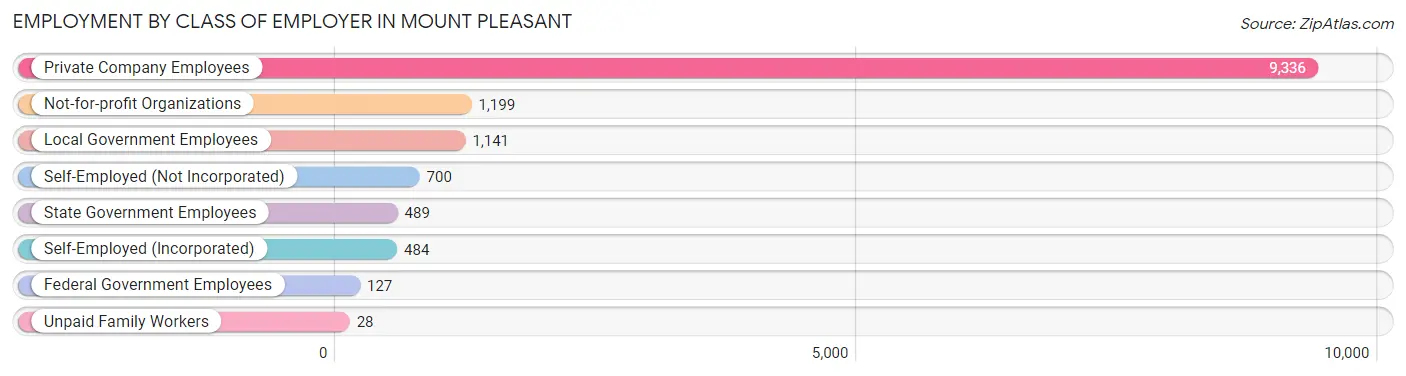
| Employer Class | # Employees | % Employees |
| Private Company Employees | 9,336 | 69.1% |
| Self-Employed (Incorporated) | 484 | 3.6% |
| Self-Employed (Not Incorporated) | 700 | 5.2% |
| Not-for-profit Organizations | 1,199 | 8.9% |
| Local Government Employees | 1,141 | 8.5% |
| State Government Employees | 489 | 3.6% |
| Federal Government Employees | 127 | 0.9% |
| Unpaid Family Workers | 28 | 0.2% |
| Total | 13,504 | 100.0% |
Employment Status by Age in Mount Pleasant
According to the labor force statistics for Mount Pleasant, out of the total population over 16 years of age (22,865), 62.0% or 14,176 individuals are in the labor force, with 3.0% or 425 of them unemployed. The age group with the highest labor force participation rate is 25 to 29 years, with 89.2% or 1,320 individuals in the labor force. Within the labor force, the 16 to 19 years age range has the highest percentage of unemployed individuals, with 9.3% or 45 of them being unemployed.
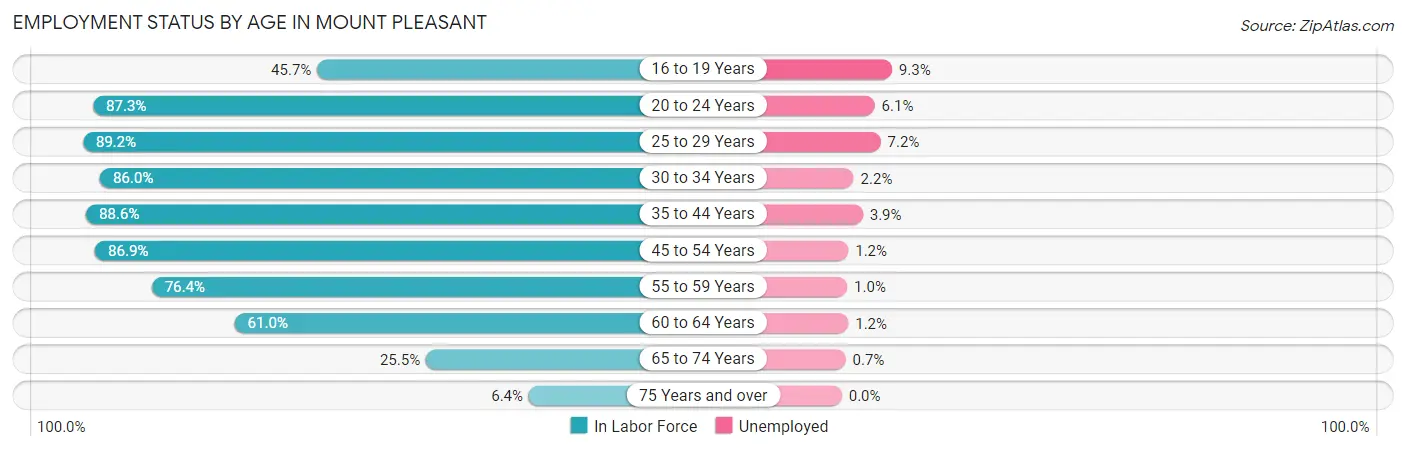
| Age Bracket | In Labor Force | Unemployed |
| 16 to 19 Years | 483 (45.7%) | 45 (9.3%) |
| 20 to 24 Years | 1,484 (87.3%) | 91 (6.1%) |
| 25 to 29 Years | 1,320 (89.2%) | 95 (7.2%) |
| 30 to 34 Years | 1,476 (86.0%) | 32 (2.2%) |
| 35 to 44 Years | 2,324 (88.6%) | 91 (3.9%) |
| 45 to 54 Years | 2,758 (86.9%) | 33 (1.2%) |
| 55 to 59 Years | 1,713 (76.4%) | 17 (1.0%) |
| 60 to 64 Years | 1,475 (61.0%) | 18 (1.2%) |
| 65 to 74 Years | 971 (25.5%) | 7 (0.7%) |
| 75 Years and over | 169 (6.4%) | 0 (0.0%) |
| Total | 14,176 (62.0%) | 425 (3.0%) |
Employment Status by Educational Attainment in Mount Pleasant
According to labor force statistics for Mount Pleasant, 81.0% of individuals (11,059) out of the total population between 25 and 64 years of age (13,653) are in the labor force, with 2.6% or 288 of them being unemployed. The group with the highest labor force participation rate are those with the educational attainment of bachelor's degree or higher, with 87.2% or 4,593 individuals in the labor force. Within the labor force, individuals with high school diploma education have the highest percentage of unemployment, with 7.4% or 155 of them being unemployed.
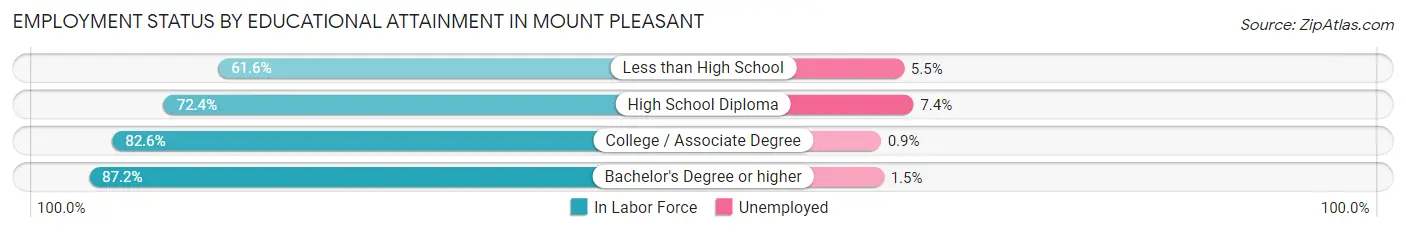
| Educational Attainment | In Labor Force | Unemployed |
| Less than High School | 473 (61.6%) | 42 (5.5%) |
| High School Diploma | 2,092 (72.4%) | 214 (7.4%) |
| College / Associate Degree | 3,906 (82.6%) | 43 (0.9%) |
| Bachelor's Degree or higher | 4,593 (87.2%) | 79 (1.5%) |
| Total | 11,059 (81.0%) | 355 (2.6%) |
Employment Occupations by Sex in Mount Pleasant
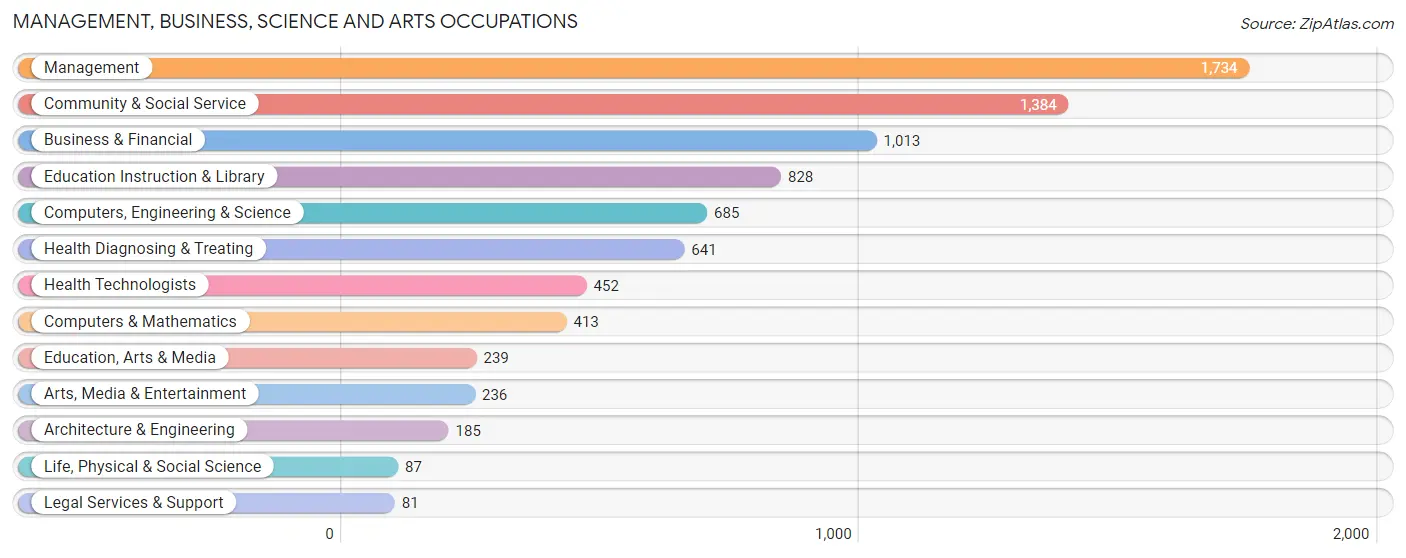
Management, Business, Science and Arts Occupations
The most common Management, Business, Science and Arts occupations in Mount Pleasant are Management (1,734 | 12.7%), Community & Social Service (1,384 | 10.1%), Business & Financial (1,013 | 7.4%), Education Instruction & Library (828 | 6.0%), and Computers, Engineering & Science (685 | 5.0%).
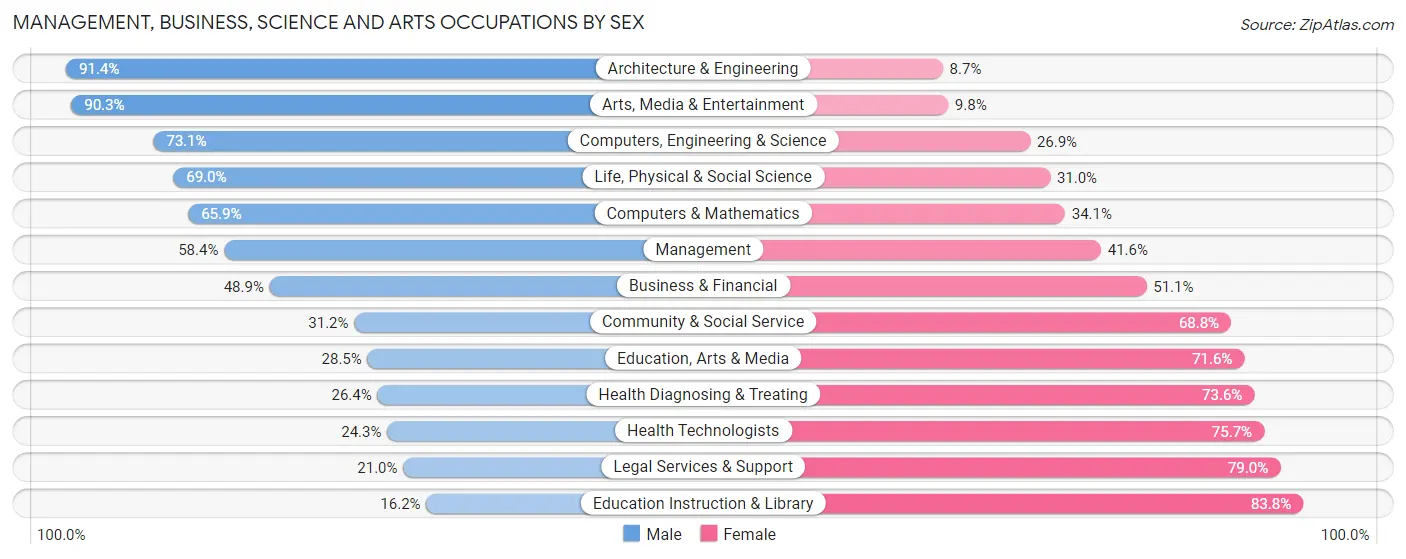
Management, Business, Science and Arts Occupations by Sex
Within the Management, Business, Science and Arts occupations in Mount Pleasant, the most male-oriented occupations are Architecture & Engineering (91.3%), Arts, Media & Entertainment (90.2%), and Computers, Engineering & Science (73.1%), while the most female-oriented occupations are Education Instruction & Library (83.8%), Legal Services & Support (79.0%), and Health Technologists (75.7%).
| Occupation | Male | Female |
| Management | 1,012 (58.4%) | 722 (41.6%) |
| Business & Financial | 495 (48.9%) | 518 (51.1%) |
| Computers, Engineering & Science | 501 (73.1%) | 184 (26.9%) |
| Computers & Mathematics | 272 (65.9%) | 141 (34.1%) |
| Architecture & Engineering | 169 (91.3%) | 16 (8.6%) |
| Life, Physical & Social Science | 60 (69.0%) | 27 (31.0%) |
| Community & Social Service | 432 (31.2%) | 952 (68.8%) |
| Education, Arts & Media | 68 (28.4%) | 171 (71.6%) |
| Legal Services & Support | 17 (21.0%) | 64 (79.0%) |
| Education Instruction & Library | 134 (16.2%) | 694 (83.8%) |
| Arts, Media & Entertainment | 213 (90.2%) | 23 (9.8%) |
| Health Diagnosing & Treating | 169 (26.4%) | 472 (73.6%) |
| Health Technologists | 110 (24.3%) | 342 (75.7%) |
| Total (Category) | 2,609 (47.8%) | 2,848 (52.2%) |
| Total (Overall) | 7,391 (53.9%) | 6,309 (46.1%) |
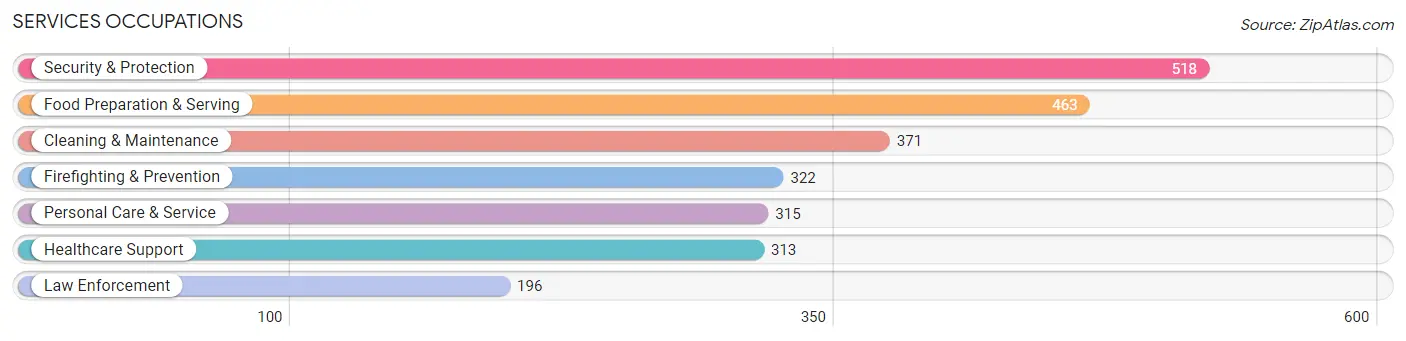
Services Occupations
The most common Services occupations in Mount Pleasant are Security & Protection (518 | 3.8%), Food Preparation & Serving (463 | 3.4%), Cleaning & Maintenance (371 | 2.7%), Firefighting & Prevention (322 | 2.4%), and Personal Care & Service (315 | 2.3%).
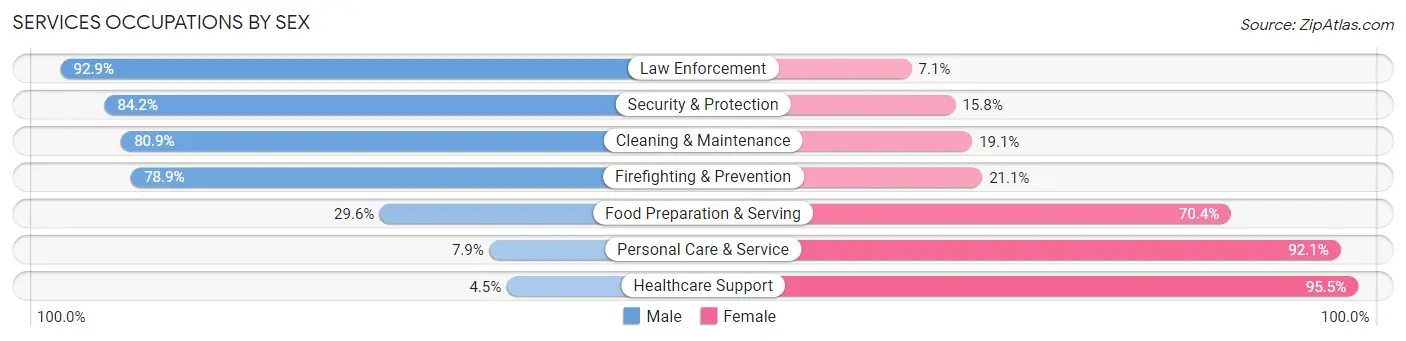
Services Occupations by Sex
Within the Services occupations in Mount Pleasant, the most male-oriented occupations are Law Enforcement (92.9%), Security & Protection (84.2%), and Cleaning & Maintenance (80.9%), while the most female-oriented occupations are Healthcare Support (95.5%), Personal Care & Service (92.1%), and Food Preparation & Serving (70.4%).
| Occupation | Male | Female |
| Healthcare Support | 14 (4.5%) | 299 (95.5%) |
| Security & Protection | 436 (84.2%) | 82 (15.8%) |
| Firefighting & Prevention | 254 (78.9%) | 68 (21.1%) |
| Law Enforcement | 182 (92.9%) | 14 (7.1%) |
| Food Preparation & Serving | 137 (29.6%) | 326 (70.4%) |
| Cleaning & Maintenance | 300 (80.9%) | 71 (19.1%) |
| Personal Care & Service | 25 (7.9%) | 290 (92.1%) |
| Total (Category) | 912 (46.1%) | 1,068 (53.9%) |
| Total (Overall) | 7,391 (53.9%) | 6,309 (46.1%) |
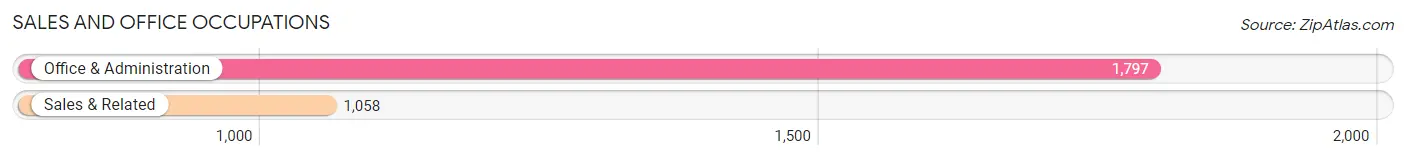
Sales and Office Occupations
The most common Sales and Office occupations in Mount Pleasant are Office & Administration (1,797 | 13.1%), and Sales & Related (1,058 | 7.7%).
Sales and Office Occupations by Sex
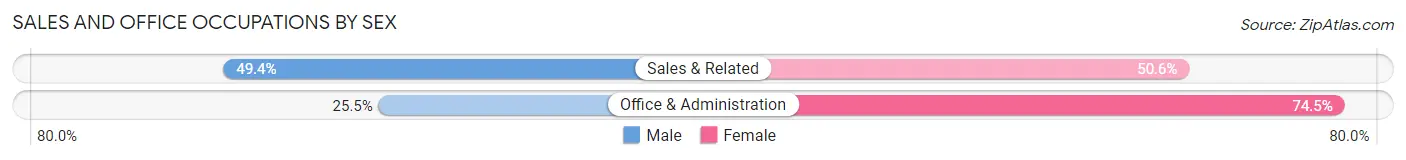
| Occupation | Male | Female |
| Sales & Related | 523 (49.4%) | 535 (50.6%) |
| Office & Administration | 459 (25.5%) | 1,338 (74.5%) |
| Total (Category) | 982 (34.4%) | 1,873 (65.6%) |
| Total (Overall) | 7,391 (53.9%) | 6,309 (46.1%) |
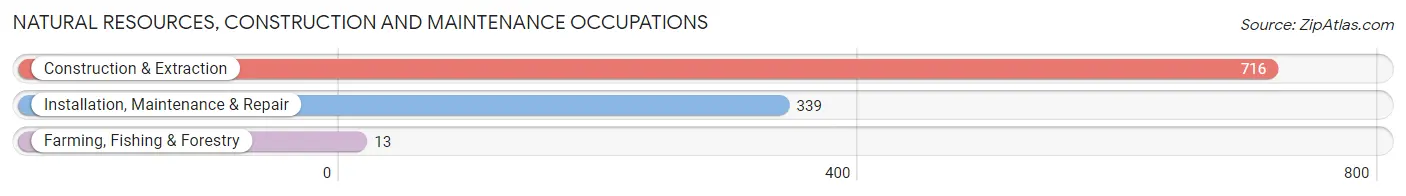
Natural Resources, Construction and Maintenance Occupations
The most common Natural Resources, Construction and Maintenance occupations in Mount Pleasant are Construction & Extraction (716 | 5.2%), Installation, Maintenance & Repair (339 | 2.5%), and Farming, Fishing & Forestry (13 | 0.1%).
Natural Resources, Construction and Maintenance Occupations by Sex
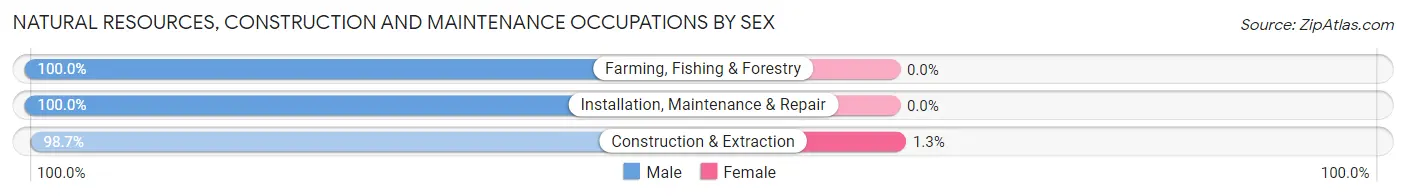
| Occupation | Male | Female |
| Farming, Fishing & Forestry | 13 (100.0%) | 0 (0.0%) |
| Construction & Extraction | 707 (98.7%) | 9 (1.3%) |
| Installation, Maintenance & Repair | 339 (100.0%) | 0 (0.0%) |
| Total (Category) | 1,059 (99.2%) | 9 (0.8%) |
| Total (Overall) | 7,391 (53.9%) | 6,309 (46.1%) |
Production, Transportation and Moving Occupations
The most common Production, Transportation and Moving occupations in Mount Pleasant are Production (992 | 7.2%), Material Moving (691 | 5.0%), and Transportation (657 | 4.8%).
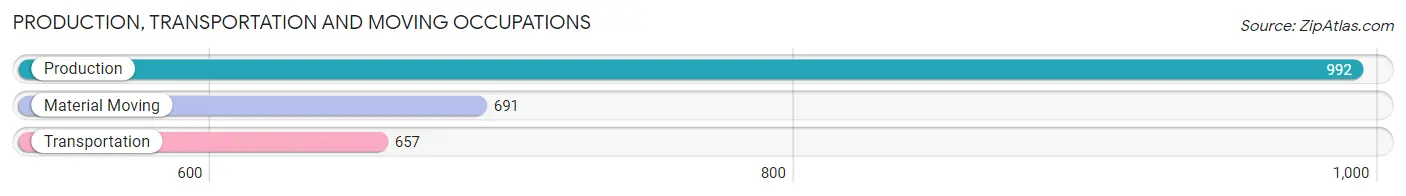
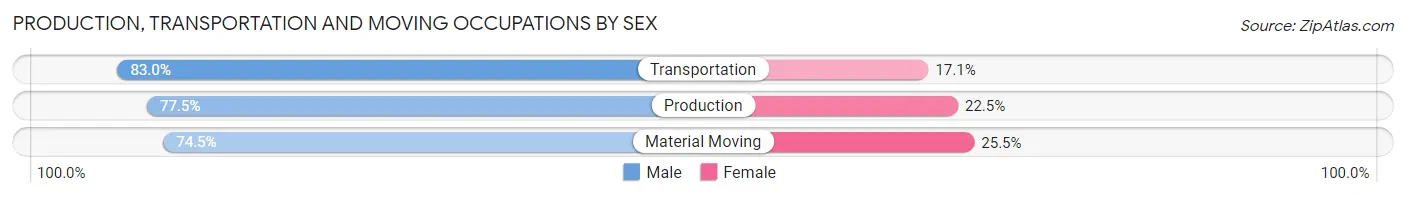
Production, Transportation and Moving Occupations by Sex
| Occupation | Male | Female |
| Production | 769 (77.5%) | 223 (22.5%) |
| Transportation | 545 (83.0%) | 112 (17.1%) |
| Material Moving | 515 (74.5%) | 176 (25.5%) |
| Total (Category) | 1,829 (78.2%) | 511 (21.8%) |
| Total (Overall) | 7,391 (53.9%) | 6,309 (46.1%) |
Employment Industries by Sex in Mount Pleasant
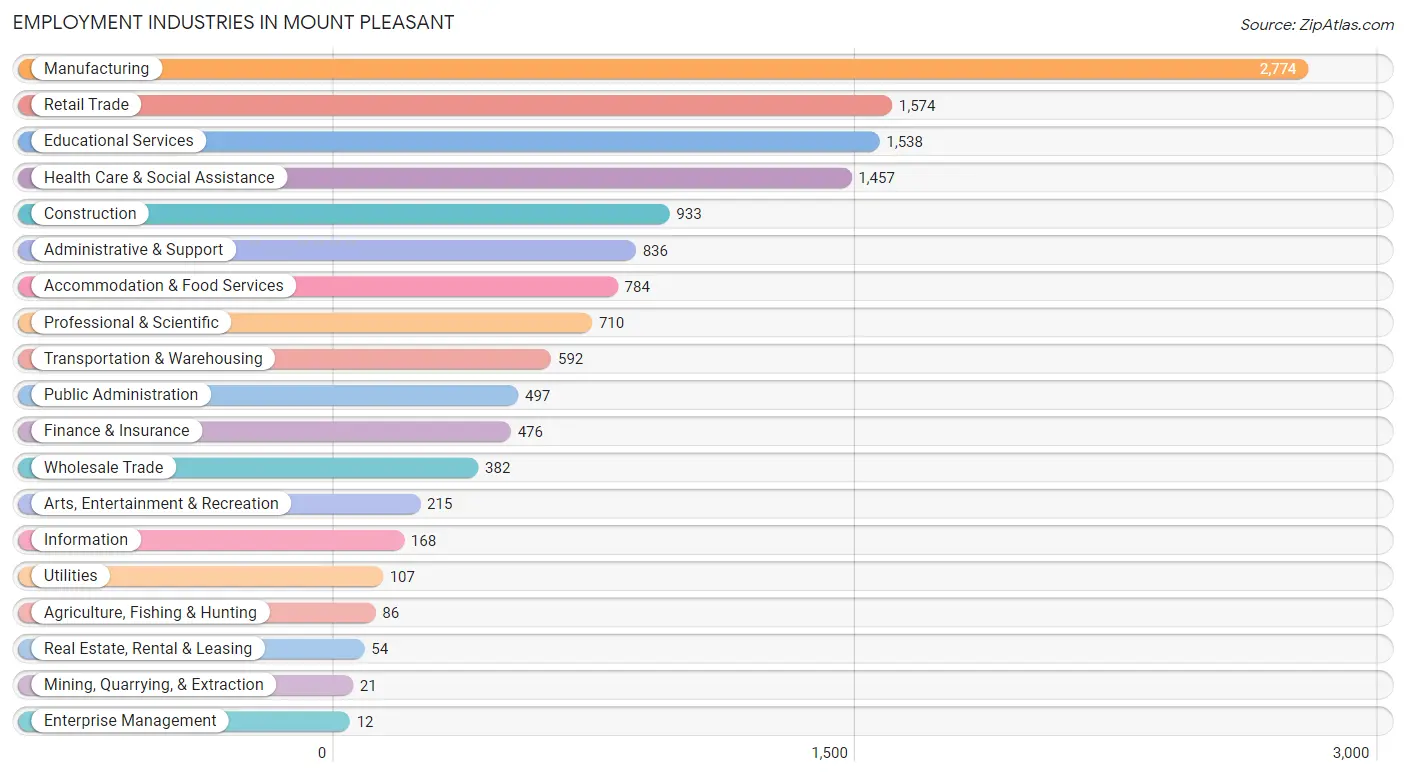
Employment Industries in Mount Pleasant
The major employment industries in Mount Pleasant include Manufacturing (2,774 | 20.3%), Retail Trade (1,574 | 11.5%), Educational Services (1,538 | 11.2%), Health Care & Social Assistance (1,457 | 10.6%), and Construction (933 | 6.8%).
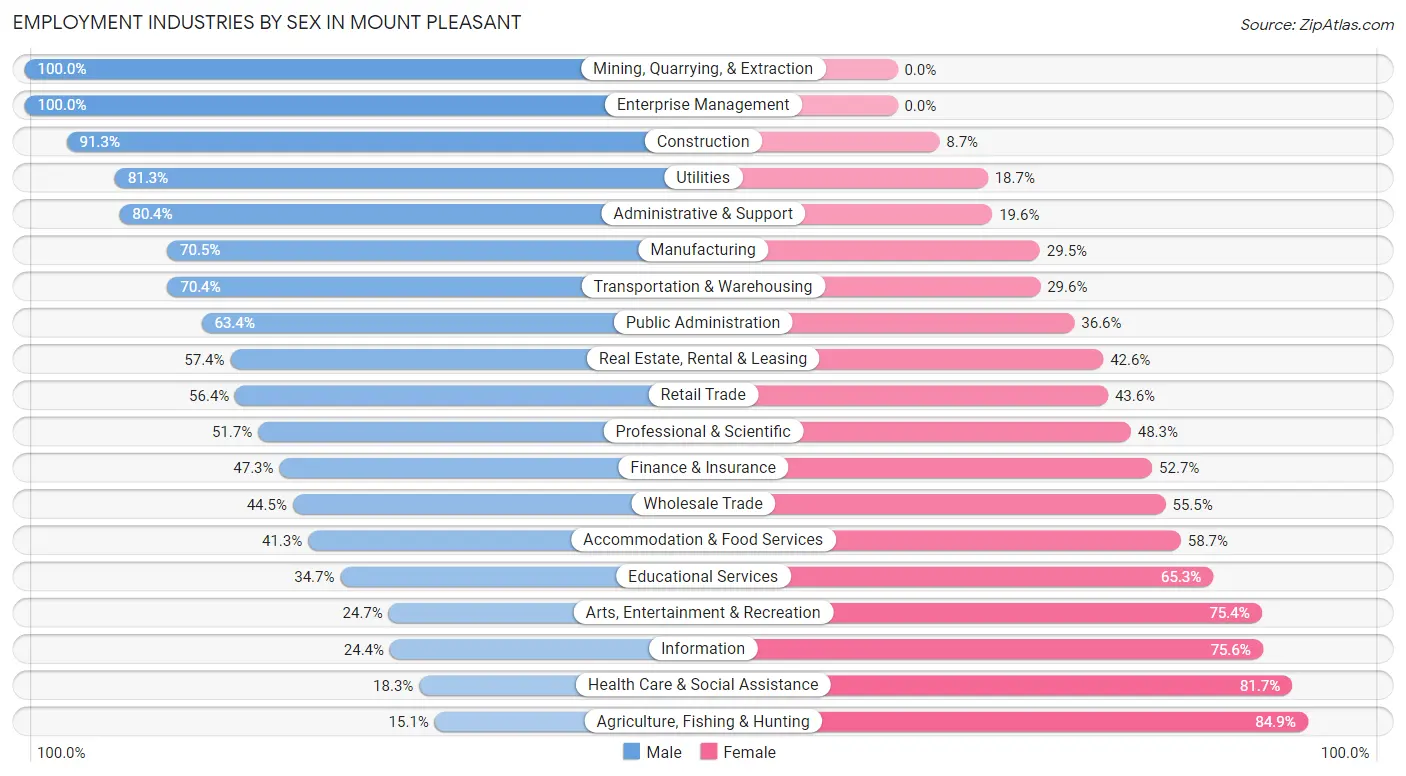
Employment Industries by Sex in Mount Pleasant
The Mount Pleasant industries that see more men than women are Mining, Quarrying, & Extraction (100.0%), Enterprise Management (100.0%), and Construction (91.3%), whereas the industries that tend to have a higher number of women are Agriculture, Fishing & Hunting (84.9%), Health Care & Social Assistance (81.7%), and Information (75.6%).
| Industry | Male | Female |
| Agriculture, Fishing & Hunting | 13 (15.1%) | 73 (84.9%) |
| Mining, Quarrying, & Extraction | 21 (100.0%) | 0 (0.0%) |
| Construction | 852 (91.3%) | 81 (8.7%) |
| Manufacturing | 1,956 (70.5%) | 818 (29.5%) |
| Wholesale Trade | 170 (44.5%) | 212 (55.5%) |
| Retail Trade | 888 (56.4%) | 686 (43.6%) |
| Transportation & Warehousing | 417 (70.4%) | 175 (29.6%) |
| Utilities | 87 (81.3%) | 20 (18.7%) |
| Information | 41 (24.4%) | 127 (75.6%) |
| Finance & Insurance | 225 (47.3%) | 251 (52.7%) |
| Real Estate, Rental & Leasing | 31 (57.4%) | 23 (42.6%) |
| Professional & Scientific | 367 (51.7%) | 343 (48.3%) |
| Enterprise Management | 12 (100.0%) | 0 (0.0%) |
| Administrative & Support | 672 (80.4%) | 164 (19.6%) |
| Educational Services | 533 (34.7%) | 1,005 (65.3%) |
| Health Care & Social Assistance | 267 (18.3%) | 1,190 (81.7%) |
| Arts, Entertainment & Recreation | 53 (24.6%) | 162 (75.3%) |
| Accommodation & Food Services | 324 (41.3%) | 460 (58.7%) |
| Public Administration | 315 (63.4%) | 182 (36.6%) |
| Total | 7,391 (53.9%) | 6,309 (46.1%) |
Education in Mount Pleasant
School Enrollment in Mount Pleasant
The most common levels of schooling among the 5,421 students in Mount Pleasant are middle school (1,324 | 24.4%), high school (1,041 | 19.2%), and college / undergraduate (905 | 16.7%).
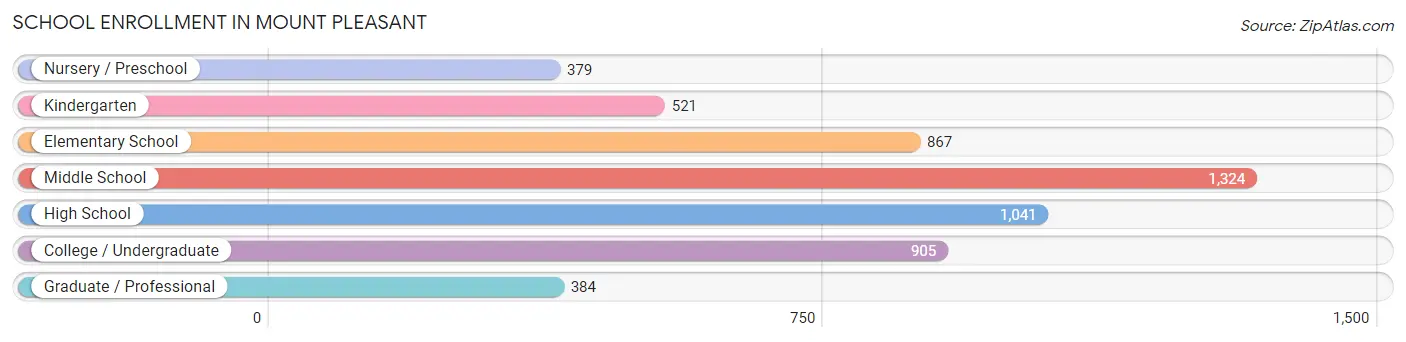
| School Level | # Students | % Students |
| Nursery / Preschool | 379 | 7.0% |
| Kindergarten | 521 | 9.6% |
| Elementary School | 867 | 16.0% |
| Middle School | 1,324 | 24.4% |
| High School | 1,041 | 19.2% |
| College / Undergraduate | 905 | 16.7% |
| Graduate / Professional | 384 | 7.1% |
| Total | 5,421 | 100.0% |
School Enrollment by Age by Funding Source in Mount Pleasant
Out of a total of 5,421 students who are enrolled in schools in Mount Pleasant, 1,306 (24.1%) attend a private institution, while the remaining 4,115 (75.9%) are enrolled in public schools. The age group of 3 to 4 year olds has the highest likelihood of being enrolled in private schools, with 116 (35.6% in the age bracket) enrolled. Conversely, the age group of 25 to 34 year olds has the lowest likelihood of being enrolled in a private school, with 338 (84.3% in the age bracket) attending a public institution.
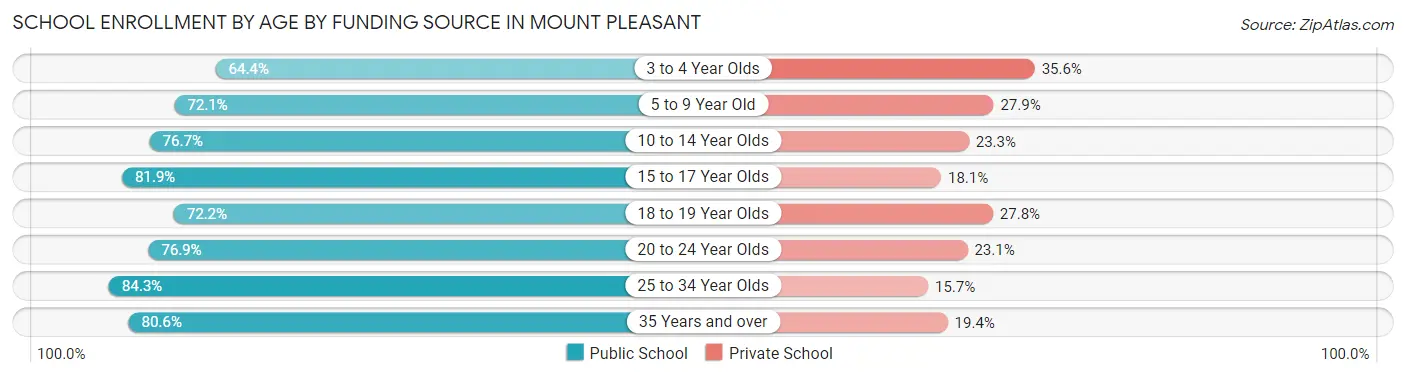
| Age Bracket | Public School | Private School |
| 3 to 4 Year Olds | 210 (64.4%) | 116 (35.6%) |
| 5 to 9 Year Old | 1,033 (72.1%) | 400 (27.9%) |
| 10 to 14 Year Olds | 1,139 (76.7%) | 346 (23.3%) |
| 15 to 17 Year Olds | 555 (81.9%) | 123 (18.1%) |
| 18 to 19 Year Olds | 200 (72.2%) | 77 (27.8%) |
| 20 to 24 Year Olds | 437 (76.9%) | 131 (23.1%) |
| 25 to 34 Year Olds | 338 (84.3%) | 63 (15.7%) |
| 35 Years and over | 204 (80.6%) | 49 (19.4%) |
| Total | 4,115 (75.9%) | 1,306 (24.1%) |
Educational Attainment by Field of Study in Mount Pleasant
Business (2,250 | 29.4%), education (1,147 | 15.0%), science & technology (682 | 8.9%), arts & humanities (576 | 7.5%), and social sciences (453 | 5.9%) are the most common fields of study among 7,664 individuals in Mount Pleasant who have obtained a bachelor's degree or higher.
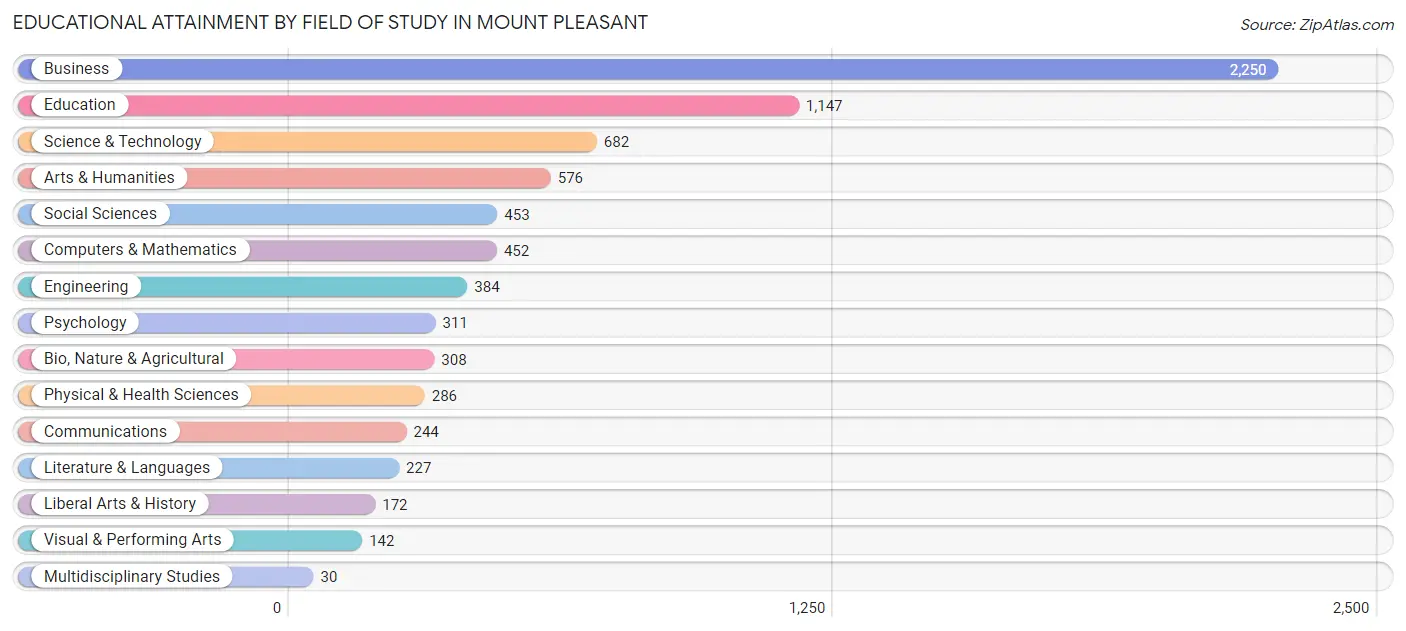
| Field of Study | # Graduates | % Graduates |
| Computers & Mathematics | 452 | 5.9% |
| Bio, Nature & Agricultural | 308 | 4.0% |
| Physical & Health Sciences | 286 | 3.7% |
| Psychology | 311 | 4.1% |
| Social Sciences | 453 | 5.9% |
| Engineering | 384 | 5.0% |
| Multidisciplinary Studies | 30 | 0.4% |
| Science & Technology | 682 | 8.9% |
| Business | 2,250 | 29.4% |
| Education | 1,147 | 15.0% |
| Literature & Languages | 227 | 3.0% |
| Liberal Arts & History | 172 | 2.2% |
| Visual & Performing Arts | 142 | 1.8% |
| Communications | 244 | 3.2% |
| Arts & Humanities | 576 | 7.5% |
| Total | 7,664 | 100.0% |
Transportation & Commute in Mount Pleasant
Vehicle Availability by Sex in Mount Pleasant
The most prevalent vehicle ownership categories in Mount Pleasant are males with 2 vehicles (3,381, accounting for 46.8%) and females with 2 vehicles (2,808, making up 54.0%).
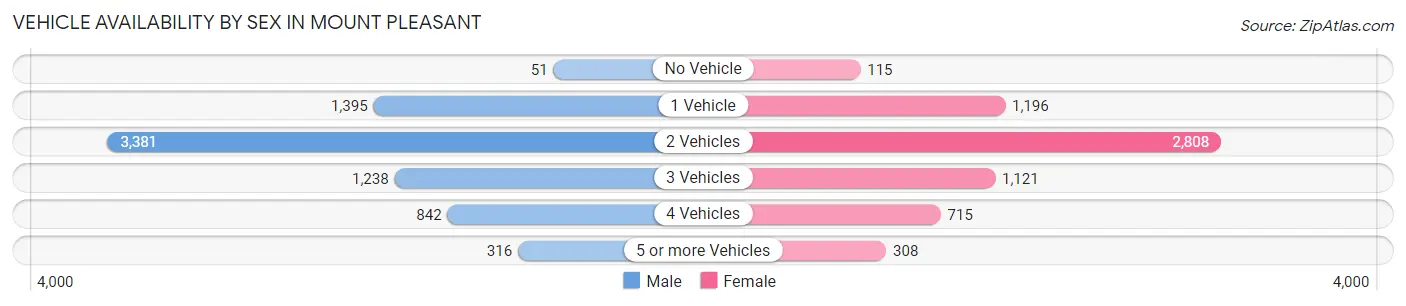
| Vehicles Available | Male | Female |
| No Vehicle | 51 (0.7%) | 115 (1.8%) |
| 1 Vehicle | 1,395 (19.3%) | 1,196 (19.1%) |
| 2 Vehicles | 3,381 (46.8%) | 2,808 (44.8%) |
| 3 Vehicles | 1,238 (17.1%) | 1,121 (17.9%) |
| 4 Vehicles | 842 (11.7%) | 715 (11.4%) |
| 5 or more Vehicles | 316 (4.4%) | 308 (4.9%) |
| Total | 7,223 (100.0%) | 6,263 (100.0%) |
Commute Time in Mount Pleasant
The most frequently occuring commute durations in Mount Pleasant are 10 to 14 minutes (2,489 commuters, 20.4%), 15 to 19 minutes (2,327 commuters, 19.1%), and 5 to 9 minutes (2,087 commuters, 17.1%).
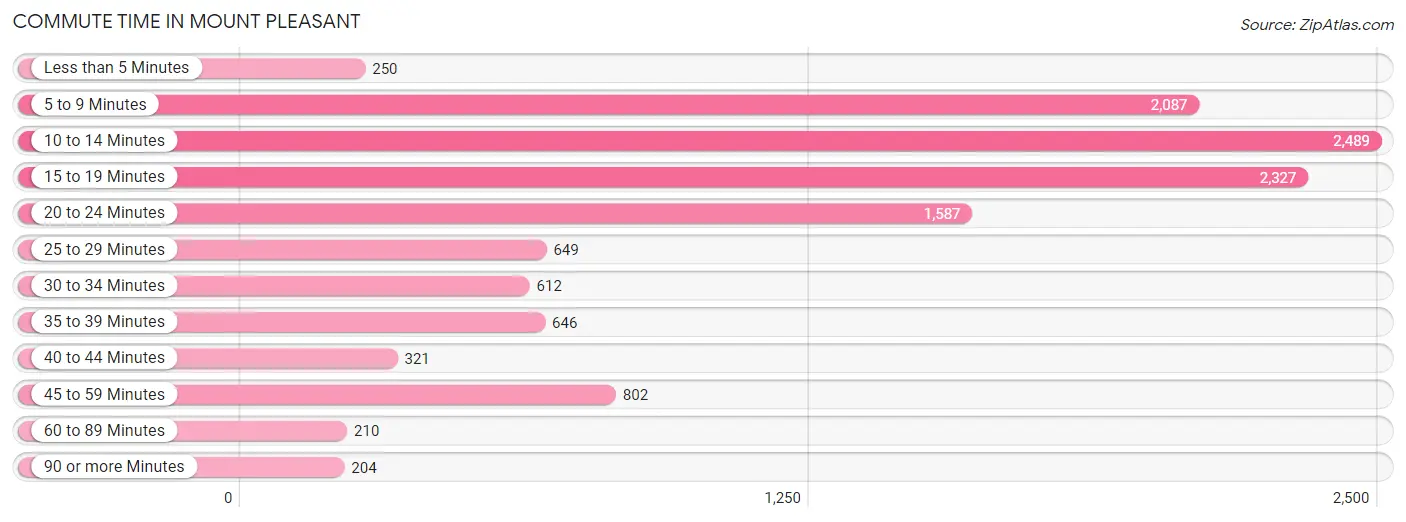
| Commute Time | # Commuters | % Commuters |
| Less than 5 Minutes | 250 | 2.1% |
| 5 to 9 Minutes | 2,087 | 17.1% |
| 10 to 14 Minutes | 2,489 | 20.4% |
| 15 to 19 Minutes | 2,327 | 19.1% |
| 20 to 24 Minutes | 1,587 | 13.0% |
| 25 to 29 Minutes | 649 | 5.3% |
| 30 to 34 Minutes | 612 | 5.0% |
| 35 to 39 Minutes | 646 | 5.3% |
| 40 to 44 Minutes | 321 | 2.6% |
| 45 to 59 Minutes | 802 | 6.6% |
| 60 to 89 Minutes | 210 | 1.7% |
| 90 or more Minutes | 204 | 1.7% |
Commute Time by Sex in Mount Pleasant
The most common commute times in Mount Pleasant are 15 to 19 minutes (1,325 commuters, 20.3%) for males and 10 to 14 minutes (1,347 commuters, 23.8%) for females.
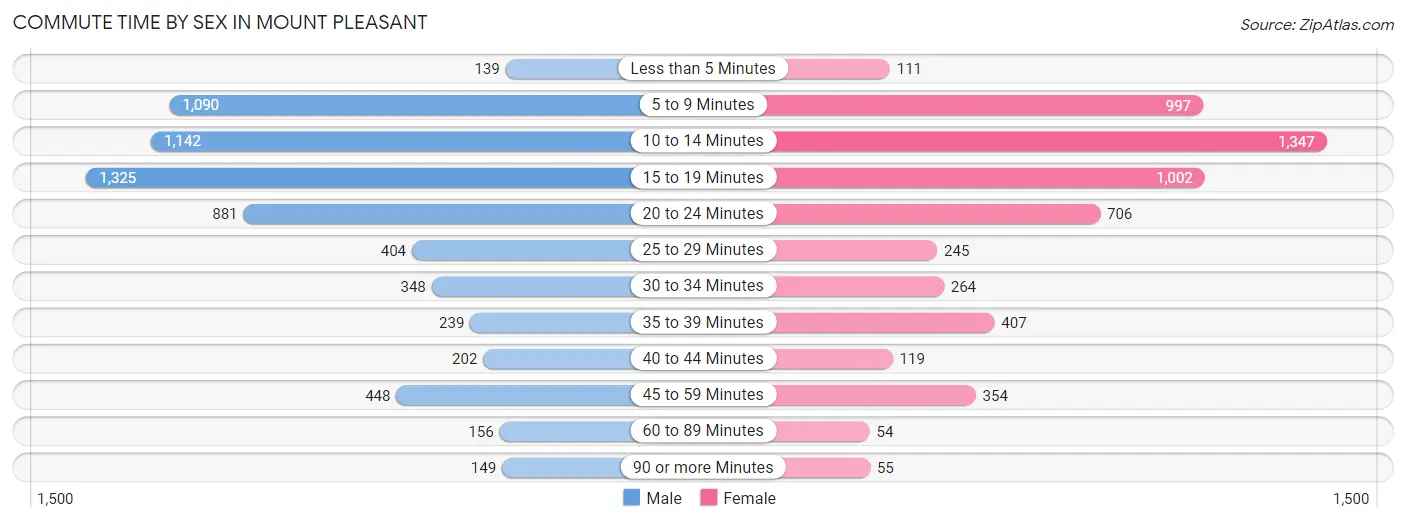
| Commute Time | Male | Female |
| Less than 5 Minutes | 139 (2.1%) | 111 (2.0%) |
| 5 to 9 Minutes | 1,090 (16.7%) | 997 (17.6%) |
| 10 to 14 Minutes | 1,142 (17.5%) | 1,347 (23.8%) |
| 15 to 19 Minutes | 1,325 (20.3%) | 1,002 (17.7%) |
| 20 to 24 Minutes | 881 (13.5%) | 706 (12.5%) |
| 25 to 29 Minutes | 404 (6.2%) | 245 (4.3%) |
| 30 to 34 Minutes | 348 (5.3%) | 264 (4.7%) |
| 35 to 39 Minutes | 239 (3.7%) | 407 (7.2%) |
| 40 to 44 Minutes | 202 (3.1%) | 119 (2.1%) |
| 45 to 59 Minutes | 448 (6.9%) | 354 (6.2%) |
| 60 to 89 Minutes | 156 (2.4%) | 54 (0.9%) |
| 90 or more Minutes | 149 (2.3%) | 55 (1.0%) |
Time of Departure to Work by Sex in Mount Pleasant
The most frequent times of departure to work in Mount Pleasant are 6:30 AM to 6:59 AM (1,194, 18.3%) for males and 7:00 AM to 7:29 AM (944, 16.7%) for females.
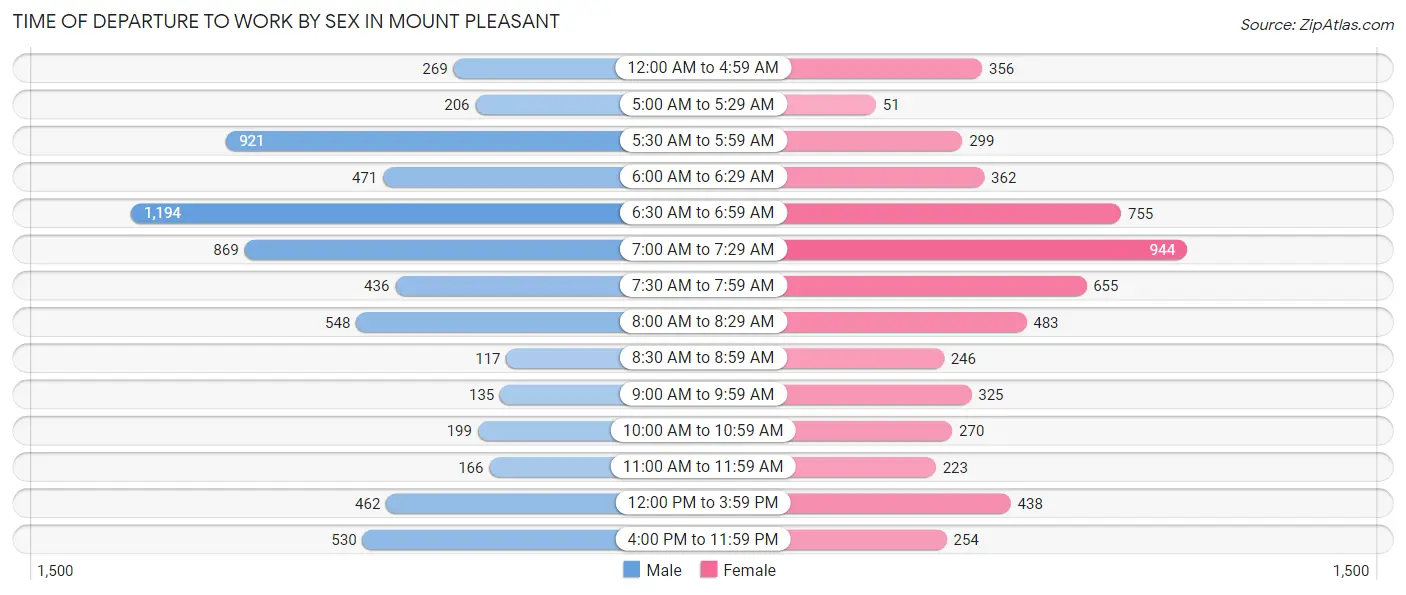
| Time of Departure | Male | Female |
| 12:00 AM to 4:59 AM | 269 (4.1%) | 356 (6.3%) |
| 5:00 AM to 5:29 AM | 206 (3.2%) | 51 (0.9%) |
| 5:30 AM to 5:59 AM | 921 (14.1%) | 299 (5.3%) |
| 6:00 AM to 6:29 AM | 471 (7.2%) | 362 (6.4%) |
| 6:30 AM to 6:59 AM | 1,194 (18.3%) | 755 (13.3%) |
| 7:00 AM to 7:29 AM | 869 (13.3%) | 944 (16.7%) |
| 7:30 AM to 7:59 AM | 436 (6.7%) | 655 (11.6%) |
| 8:00 AM to 8:29 AM | 548 (8.4%) | 483 (8.5%) |
| 8:30 AM to 8:59 AM | 117 (1.8%) | 246 (4.3%) |
| 9:00 AM to 9:59 AM | 135 (2.1%) | 325 (5.7%) |
| 10:00 AM to 10:59 AM | 199 (3.0%) | 270 (4.8%) |
| 11:00 AM to 11:59 AM | 166 (2.5%) | 223 (3.9%) |
| 12:00 PM to 3:59 PM | 462 (7.1%) | 438 (7.7%) |
| 4:00 PM to 11:59 PM | 530 (8.1%) | 254 (4.5%) |
| Total | 6,523 (100.0%) | 5,661 (100.0%) |
Housing Occupancy in Mount Pleasant
Occupancy by Ownership in Mount Pleasant
Of the total 11,709 dwellings in Mount Pleasant, owner-occupied units account for 9,218 (78.7%), while renter-occupied units make up 2,491 (21.3%).
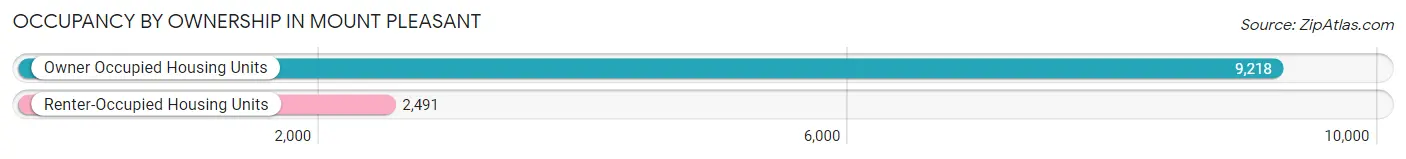
| Occupancy | # Housing Units | % Housing Units |
| Owner Occupied Housing Units | 9,218 | 78.7% |
| Renter-Occupied Housing Units | 2,491 | 21.3% |
| Total Occupied Housing Units | 11,709 | 100.0% |
Occupancy by Household Size in Mount Pleasant
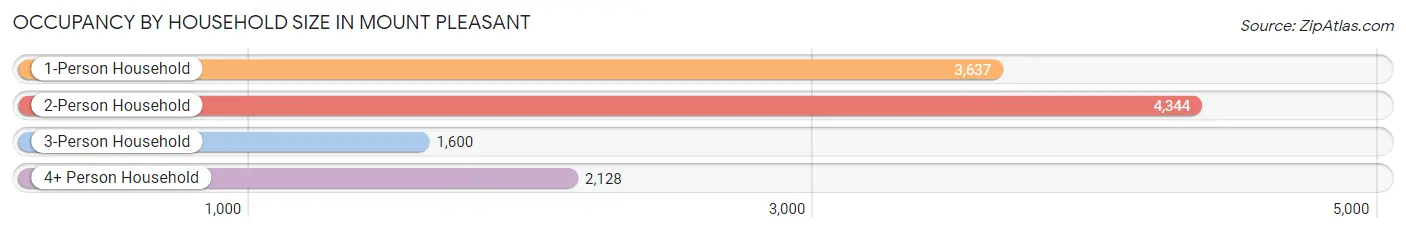
| Household Size | # Housing Units | % Housing Units |
| 1-Person Household | 3,637 | 31.1% |
| 2-Person Household | 4,344 | 37.1% |
| 3-Person Household | 1,600 | 13.7% |
| 4+ Person Household | 2,128 | 18.2% |
| Total Housing Units | 11,709 | 100.0% |
Occupancy by Ownership by Household Size in Mount Pleasant
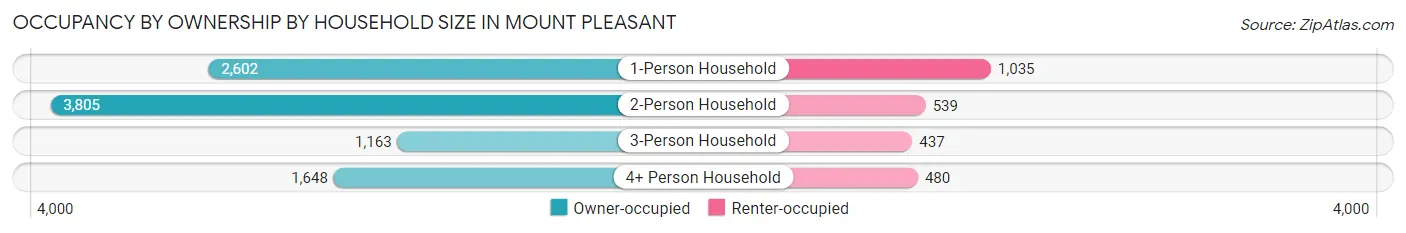
| Household Size | Owner-occupied | Renter-occupied |
| 1-Person Household | 2,602 (71.5%) | 1,035 (28.5%) |
| 2-Person Household | 3,805 (87.6%) | 539 (12.4%) |
| 3-Person Household | 1,163 (72.7%) | 437 (27.3%) |
| 4+ Person Household | 1,648 (77.4%) | 480 (22.6%) |
| Total Housing Units | 9,218 (78.7%) | 2,491 (21.3%) |
Occupancy by Educational Attainment in Mount Pleasant
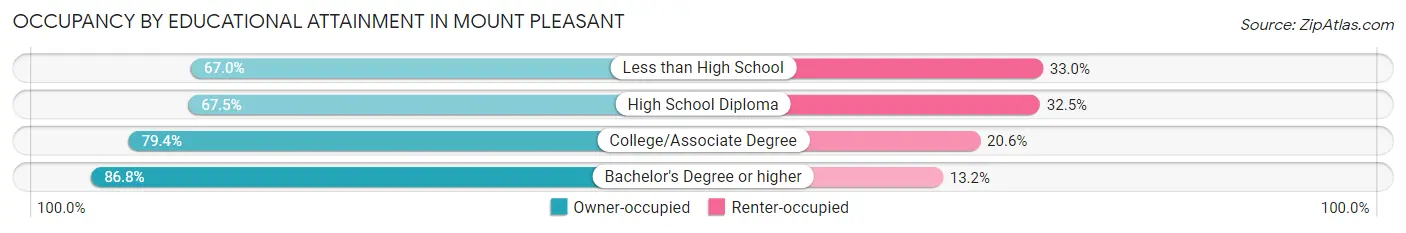
| Household Size | Owner-occupied | Renter-occupied |
| Less than High School | 440 (67.0%) | 217 (33.0%) |
| High School Diploma | 1,831 (67.5%) | 880 (32.5%) |
| College/Associate Degree | 3,130 (79.4%) | 813 (20.6%) |
| Bachelor's Degree or higher | 3,817 (86.8%) | 581 (13.2%) |
Occupancy by Age of Householder in Mount Pleasant
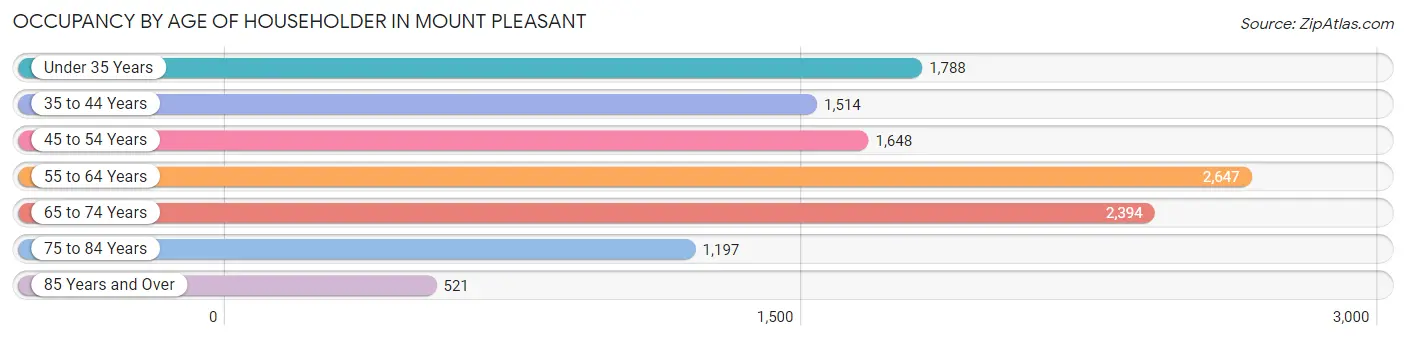
| Age Bracket | # Households | % Households |
| Under 35 Years | 1,788 | 15.3% |
| 35 to 44 Years | 1,514 | 12.9% |
| 45 to 54 Years | 1,648 | 14.1% |
| 55 to 64 Years | 2,647 | 22.6% |
| 65 to 74 Years | 2,394 | 20.4% |
| 75 to 84 Years | 1,197 | 10.2% |
| 85 Years and Over | 521 | 4.4% |
| Total | 11,709 | 100.0% |
Housing Finances in Mount Pleasant
Median Income by Occupancy in Mount Pleasant
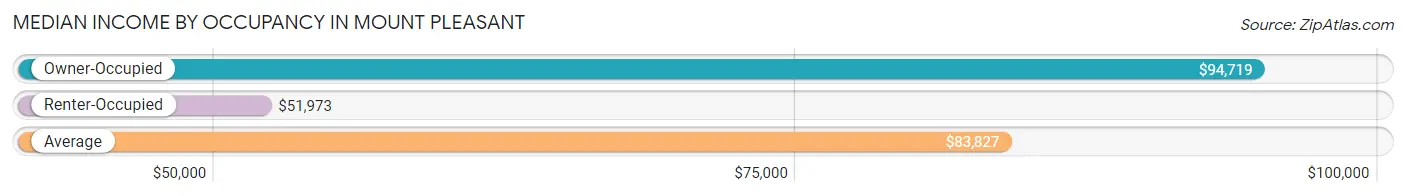
| Occupancy Type | # Households | Median Income |
| Owner-Occupied | 9,218 (78.7%) | $94,719 |
| Renter-Occupied | 2,491 (21.3%) | $51,973 |
| Average | 11,709 (100.0%) | $83,827 |
Occupancy by Householder Income Bracket in Mount Pleasant
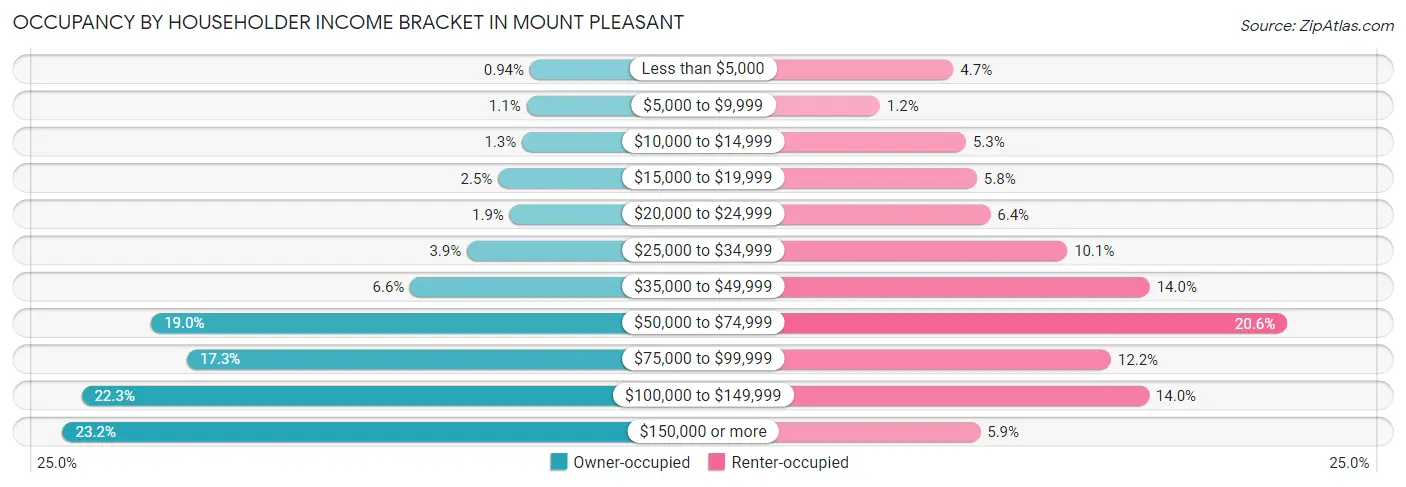
| Income Bracket | Owner-occupied | Renter-occupied |
| Less than $5,000 | 87 (0.9%) | 116 (4.7%) |
| $5,000 to $9,999 | 101 (1.1%) | 29 (1.2%) |
| $10,000 to $14,999 | 121 (1.3%) | 131 (5.3%) |
| $15,000 to $19,999 | 226 (2.5%) | 144 (5.8%) |
| $20,000 to $24,999 | 175 (1.9%) | 160 (6.4%) |
| $25,000 to $34,999 | 362 (3.9%) | 251 (10.1%) |
| $35,000 to $49,999 | 612 (6.6%) | 349 (14.0%) |
| $50,000 to $74,999 | 1,749 (19.0%) | 512 (20.5%) |
| $75,000 to $99,999 | 1,592 (17.3%) | 303 (12.2%) |
| $100,000 to $149,999 | 2,055 (22.3%) | 348 (14.0%) |
| $150,000 or more | 2,138 (23.2%) | 148 (5.9%) |
| Total | 9,218 (100.0%) | 2,491 (100.0%) |
Monthly Housing Cost Tiers in Mount Pleasant
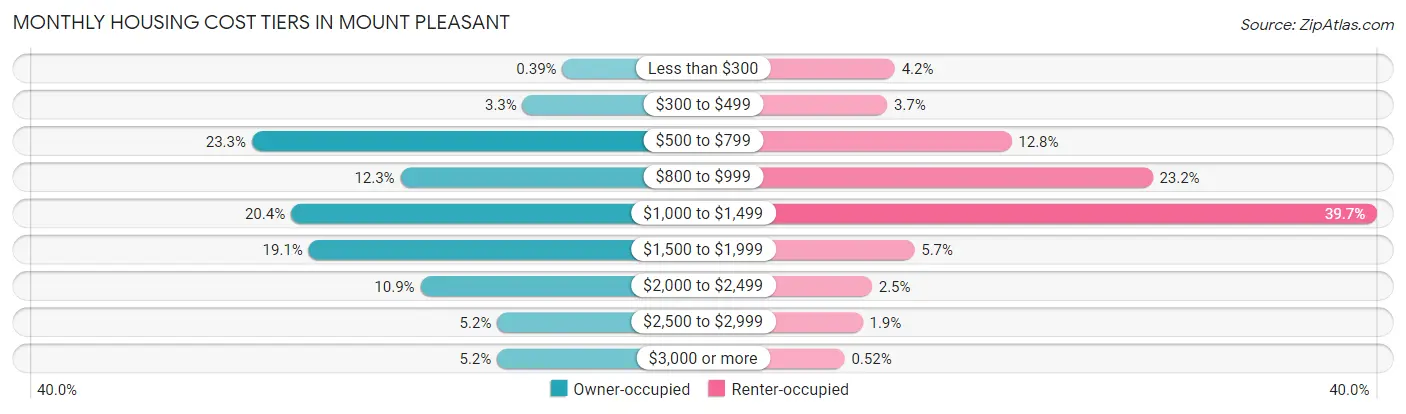
| Monthly Cost | Owner-occupied | Renter-occupied |
| Less than $300 | 36 (0.4%) | 105 (4.2%) |
| $300 to $499 | 306 (3.3%) | 91 (3.6%) |
| $500 to $799 | 2,145 (23.3%) | 319 (12.8%) |
| $800 to $999 | 1,136 (12.3%) | 578 (23.2%) |
| $1,000 to $1,499 | 1,879 (20.4%) | 990 (39.7%) |
| $1,500 to $1,999 | 1,759 (19.1%) | 141 (5.7%) |
| $2,000 to $2,499 | 1,000 (10.8%) | 63 (2.5%) |
| $2,500 to $2,999 | 478 (5.2%) | 46 (1.8%) |
| $3,000 or more | 479 (5.2%) | 13 (0.5%) |
| Total | 9,218 (100.0%) | 2,491 (100.0%) |
Physical Housing Characteristics in Mount Pleasant
Housing Structures in Mount Pleasant
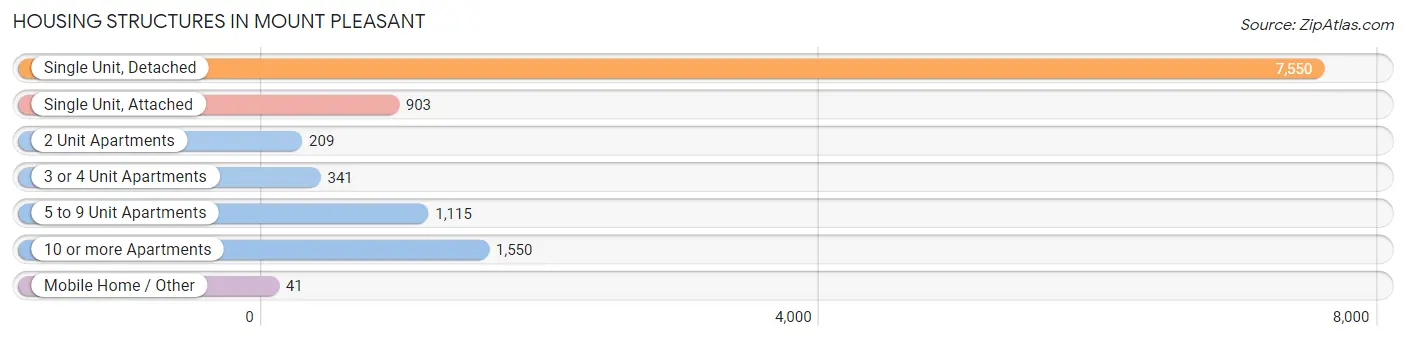
| Structure Type | # Housing Units | % Housing Units |
| Single Unit, Detached | 7,550 | 64.5% |
| Single Unit, Attached | 903 | 7.7% |
| 2 Unit Apartments | 209 | 1.8% |
| 3 or 4 Unit Apartments | 341 | 2.9% |
| 5 to 9 Unit Apartments | 1,115 | 9.5% |
| 10 or more Apartments | 1,550 | 13.2% |
| Mobile Home / Other | 41 | 0.4% |
| Total | 11,709 | 100.0% |
Housing Structures by Occupancy in Mount Pleasant
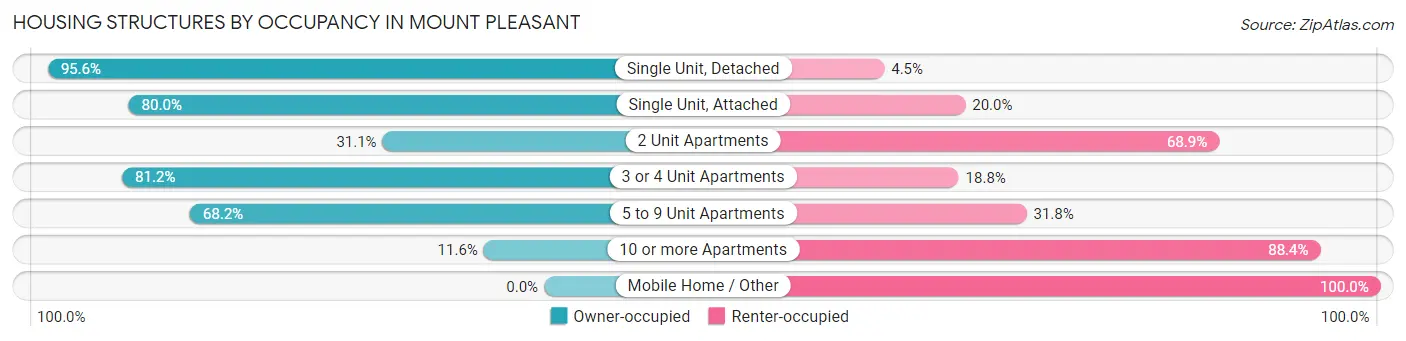
| Structure Type | Owner-occupied | Renter-occupied |
| Single Unit, Detached | 7,214 (95.6%) | 336 (4.4%) |
| Single Unit, Attached | 722 (80.0%) | 181 (20.0%) |
| 2 Unit Apartments | 65 (31.1%) | 144 (68.9%) |
| 3 or 4 Unit Apartments | 277 (81.2%) | 64 (18.8%) |
| 5 to 9 Unit Apartments | 760 (68.2%) | 355 (31.8%) |
| 10 or more Apartments | 180 (11.6%) | 1,370 (88.4%) |
| Mobile Home / Other | 0 (0.0%) | 41 (100.0%) |
| Total | 9,218 (78.7%) | 2,491 (21.3%) |
Housing Structures by Number of Rooms in Mount Pleasant
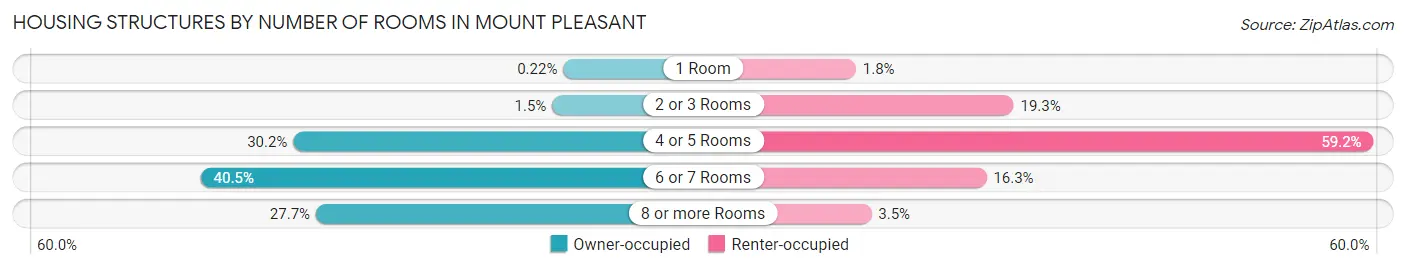
| Number of Rooms | Owner-occupied | Renter-occupied |
| 1 Room | 20 (0.2%) | 44 (1.8%) |
| 2 or 3 Rooms | 134 (1.5%) | 480 (19.3%) |
| 4 or 5 Rooms | 2,783 (30.2%) | 1,475 (59.2%) |
| 6 or 7 Rooms | 3,730 (40.5%) | 405 (16.3%) |
| 8 or more Rooms | 2,551 (27.7%) | 87 (3.5%) |
| Total | 9,218 (100.0%) | 2,491 (100.0%) |
Housing Structure by Heating Type in Mount Pleasant
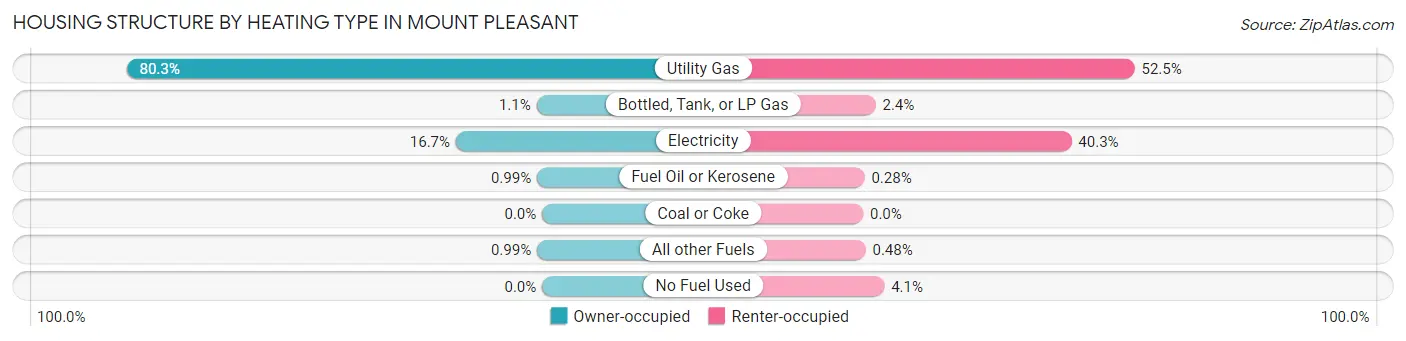
| Heating Type | Owner-occupied | Renter-occupied |
| Utility Gas | 7,401 (80.3%) | 1,307 (52.5%) |
| Bottled, Tank, or LP Gas | 99 (1.1%) | 60 (2.4%) |
| Electricity | 1,536 (16.7%) | 1,003 (40.3%) |
| Fuel Oil or Kerosene | 91 (1.0%) | 7 (0.3%) |
| Coal or Coke | 0 (0.0%) | 0 (0.0%) |
| All other Fuels | 91 (1.0%) | 12 (0.5%) |
| No Fuel Used | 0 (0.0%) | 102 (4.1%) |
| Total | 9,218 (100.0%) | 2,491 (100.0%) |
Household Vehicle Usage in Mount Pleasant
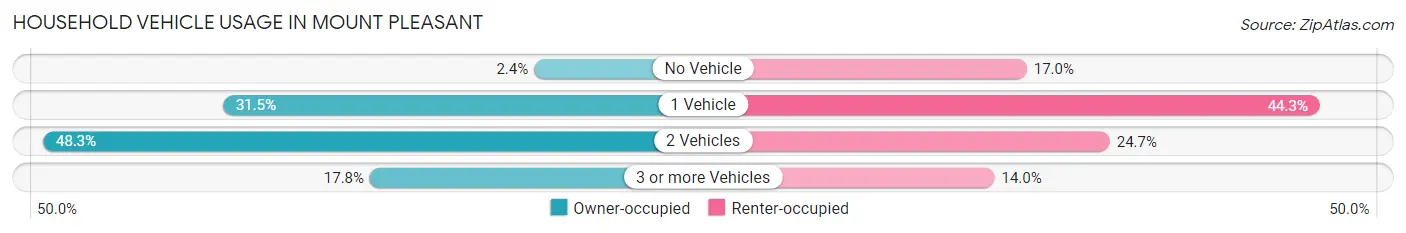
| Vehicles per Household | Owner-occupied | Renter-occupied |
| No Vehicle | 225 (2.4%) | 423 (17.0%) |
| 1 Vehicle | 2,904 (31.5%) | 1,104 (44.3%) |
| 2 Vehicles | 4,451 (48.3%) | 616 (24.7%) |
| 3 or more Vehicles | 1,638 (17.8%) | 348 (14.0%) |
| Total | 9,218 (100.0%) | 2,491 (100.0%) |
Real Estate & Mortgages in Mount Pleasant
Real Estate and Mortgage Overview in Mount Pleasant
| Characteristic | Without Mortgage | With Mortgage |
| Housing Units | 3,366 | 5,852 |
| Median Property Value | $239,700 | $266,500 |
| Median Household Income | $74,700 | $1,586 |
| Monthly Housing Costs | $690 | $479 |
| Real Estate Taxes | $4,153 | $53 |
Property Value by Mortgage Status in Mount Pleasant
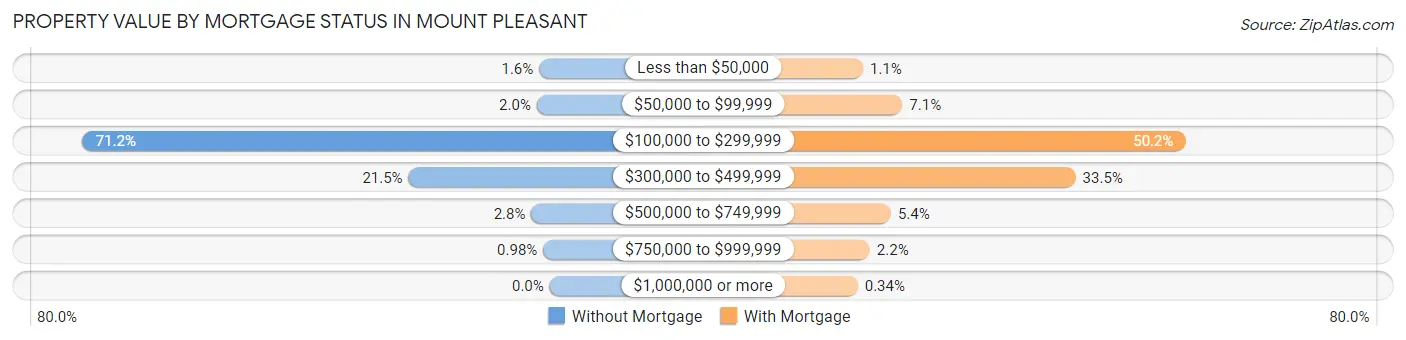
| Property Value | Without Mortgage | With Mortgage |
| Less than $50,000 | 54 (1.6%) | 67 (1.1%) |
| $50,000 to $99,999 | 66 (2.0%) | 418 (7.1%) |
| $100,000 to $299,999 | 2,395 (71.2%) | 2,940 (50.2%) |
| $300,000 to $499,999 | 724 (21.5%) | 1,963 (33.5%) |
| $500,000 to $749,999 | 94 (2.8%) | 316 (5.4%) |
| $750,000 to $999,999 | 33 (1.0%) | 128 (2.2%) |
| $1,000,000 or more | 0 (0.0%) | 20 (0.3%) |
| Total | 3,366 (100.0%) | 5,852 (100.0%) |
Household Income by Mortgage Status in Mount Pleasant
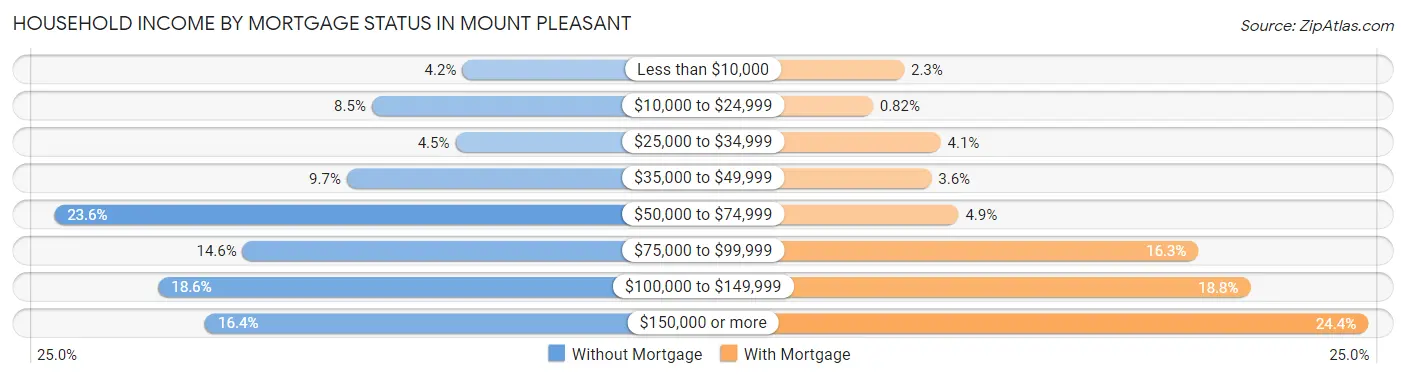
| Household Income | Without Mortgage | With Mortgage |
| Less than $10,000 | 140 (4.2%) | 135 (2.3%) |
| $10,000 to $24,999 | 285 (8.5%) | 48 (0.8%) |
| $25,000 to $34,999 | 151 (4.5%) | 237 (4.1%) |
| $35,000 to $49,999 | 325 (9.7%) | 211 (3.6%) |
| $50,000 to $74,999 | 794 (23.6%) | 287 (4.9%) |
| $75,000 to $99,999 | 492 (14.6%) | 955 (16.3%) |
| $100,000 to $149,999 | 627 (18.6%) | 1,100 (18.8%) |
| $150,000 or more | 552 (16.4%) | 1,428 (24.4%) |
| Total | 3,366 (100.0%) | 5,852 (100.0%) |
Property Value to Household Income Ratio in Mount Pleasant
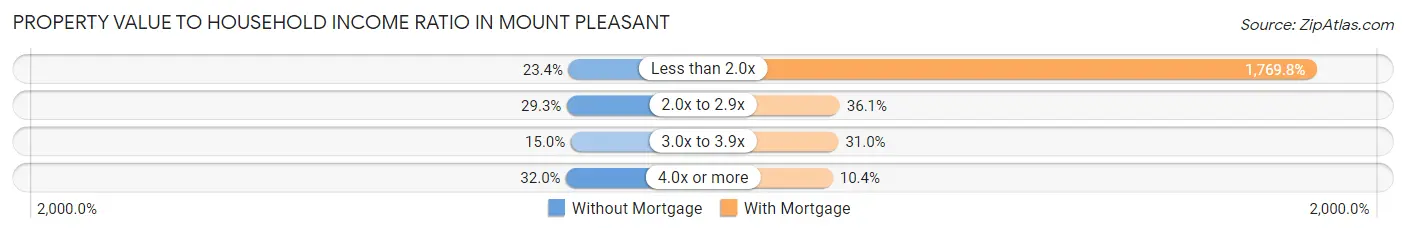
| Value-to-Income Ratio | Without Mortgage | With Mortgage |
| Less than 2.0x | 788 (23.4%) | 103,571 (1,769.8%) |
| 2.0x to 2.9x | 985 (29.3%) | 2,111 (36.1%) |
| 3.0x to 3.9x | 506 (15.0%) | 1,811 (30.9%) |
| 4.0x or more | 1,077 (32.0%) | 609 (10.4%) |
| Total | 3,366 (100.0%) | 5,852 (100.0%) |
Real Estate Taxes by Mortgage Status in Mount Pleasant
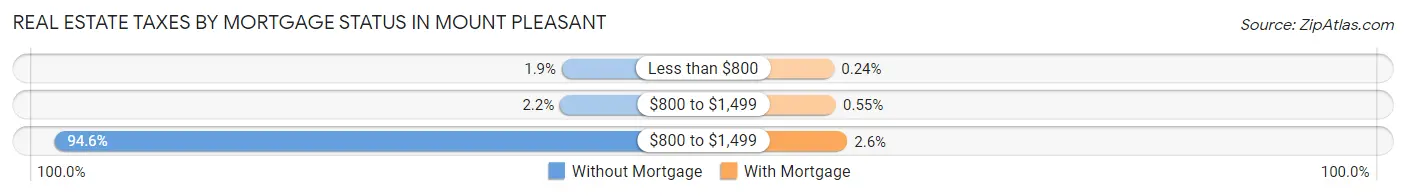
| Property Taxes | Without Mortgage | With Mortgage |
| Less than $800 | 63 (1.9%) | 14 (0.2%) |
| $800 to $1,499 | 74 (2.2%) | 32 (0.5%) |
| $800 to $1,499 | 3,183 (94.6%) | 153 (2.6%) |
| Total | 3,366 (100.0%) | 5,852 (100.0%) |
Health & Disability in Mount Pleasant
Health Insurance Coverage by Age in Mount Pleasant
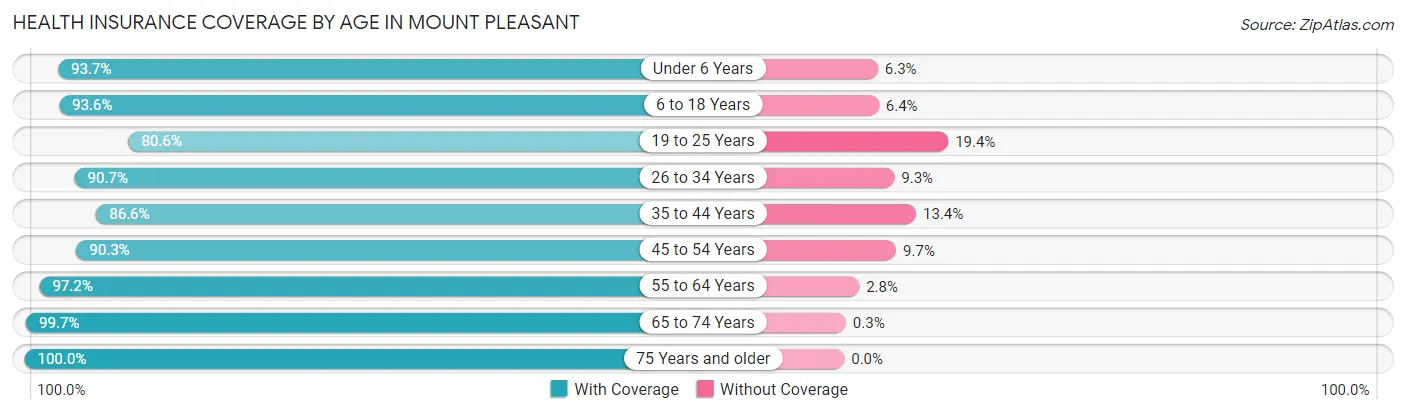
| Age Bracket | With Coverage | Without Coverage |
| Under 6 Years | 1,887 (93.7%) | 126 (6.3%) |
| 6 to 18 Years | 3,444 (93.6%) | 237 (6.4%) |
| 19 to 25 Years | 1,668 (80.6%) | 401 (19.4%) |
| 26 to 34 Years | 2,664 (90.7%) | 274 (9.3%) |
| 35 to 44 Years | 2,250 (86.6%) | 348 (13.4%) |
| 45 to 54 Years | 2,867 (90.3%) | 307 (9.7%) |
| 55 to 64 Years | 4,512 (97.2%) | 129 (2.8%) |
| 65 to 74 Years | 3,707 (99.7%) | 11 (0.3%) |
| 75 Years and older | 2,463 (100.0%) | 0 (0.0%) |
| Total | 25,462 (93.3%) | 1,833 (6.7%) |
Health Insurance Coverage by Citizenship Status in Mount Pleasant
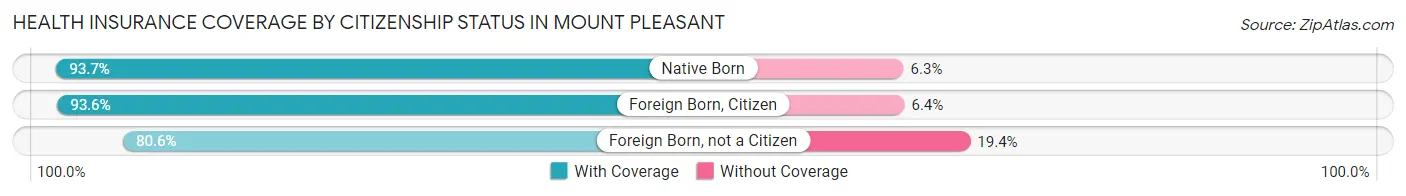
| Citizenship Status | With Coverage | Without Coverage |
| Native Born | 1,887 (93.7%) | 126 (6.3%) |
| Foreign Born, Citizen | 3,444 (93.6%) | 237 (6.4%) |
| Foreign Born, not a Citizen | 1,668 (80.6%) | 401 (19.4%) |
Health Insurance Coverage by Household Income in Mount Pleasant
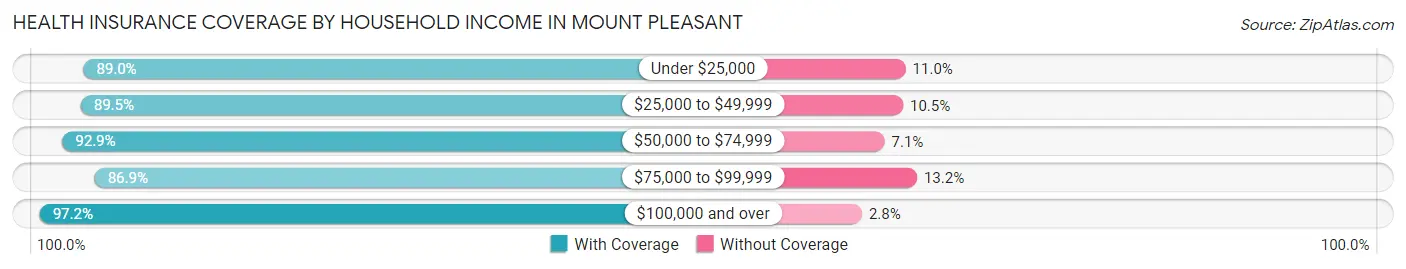
| Household Income | With Coverage | Without Coverage |
| Under $25,000 | 1,694 (89.0%) | 210 (11.0%) |
| $25,000 to $49,999 | 2,333 (89.5%) | 275 (10.5%) |
| $50,000 to $74,999 | 4,110 (92.9%) | 313 (7.1%) |
| $75,000 to $99,999 | 4,228 (86.9%) | 640 (13.2%) |
| $100,000 and over | 13,064 (97.2%) | 382 (2.8%) |
Public vs Private Health Insurance Coverage by Age in Mount Pleasant
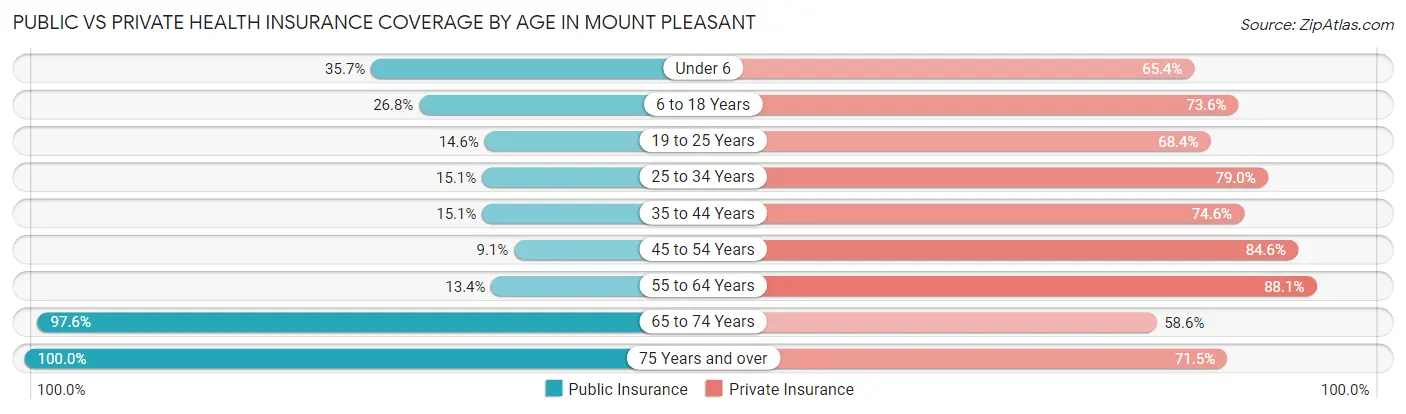
| Age Bracket | Public Insurance | Private Insurance |
| Under 6 | 718 (35.7%) | 1,317 (65.4%) |
| 6 to 18 Years | 985 (26.8%) | 2,710 (73.6%) |
| 19 to 25 Years | 302 (14.6%) | 1,415 (68.4%) |
| 25 to 34 Years | 443 (15.1%) | 2,322 (79.0%) |
| 35 to 44 Years | 391 (15.0%) | 1,939 (74.6%) |
| 45 to 54 Years | 290 (9.1%) | 2,686 (84.6%) |
| 55 to 64 Years | 620 (13.4%) | 4,087 (88.1%) |
| 65 to 74 Years | 3,628 (97.6%) | 2,177 (58.6%) |
| 75 Years and over | 2,463 (100.0%) | 1,761 (71.5%) |
| Total | 9,840 (36.0%) | 20,414 (74.8%) |
Disability Status by Sex by Age in Mount Pleasant
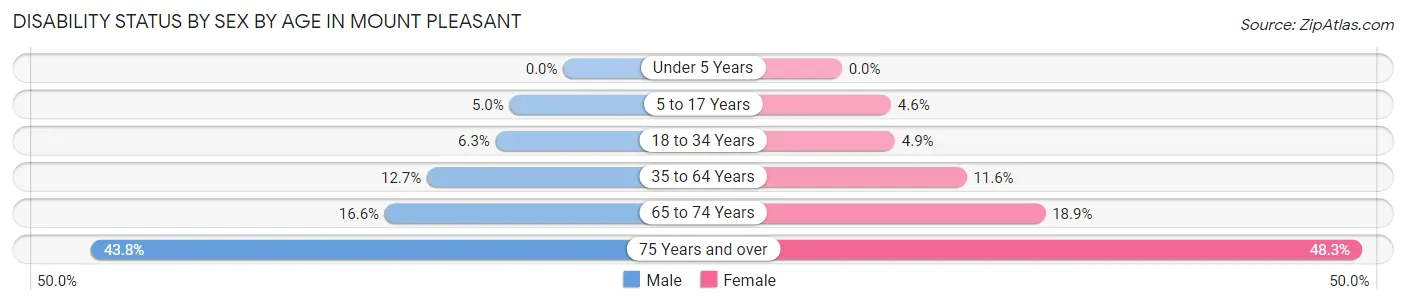
| Age Bracket | Male | Female |
| Under 5 Years | 0 (0.0%) | 0 (0.0%) |
| 5 to 17 Years | 87 (5.0%) | 90 (4.6%) |
| 18 to 34 Years | 187 (6.3%) | 116 (4.9%) |
| 35 to 64 Years | 646 (12.7%) | 614 (11.6%) |
| 65 to 74 Years | 278 (16.6%) | 385 (18.9%) |
| 75 Years and over | 473 (43.8%) | 668 (48.3%) |
Disability Class by Sex by Age in Mount Pleasant
Disability Class: Hearing Difficulty
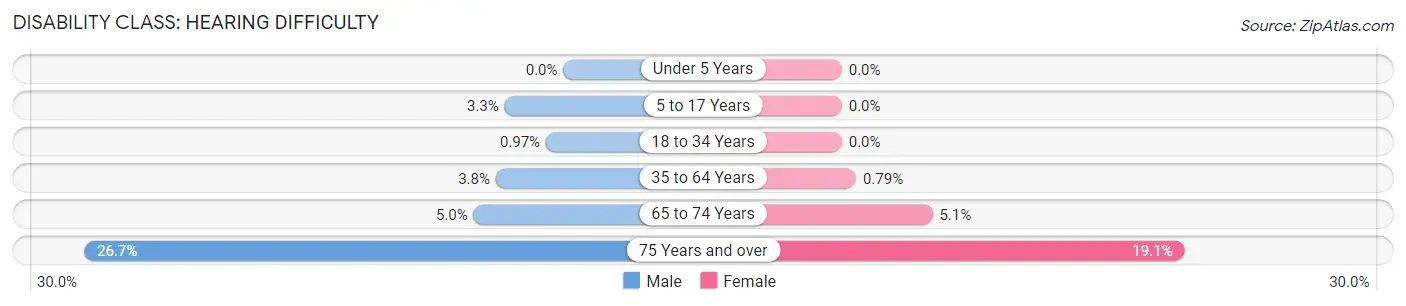
| Age Bracket | Male | Female |
| Under 5 Years | 0 (0.0%) | 0 (0.0%) |
| 5 to 17 Years | 57 (3.3%) | 0 (0.0%) |
| 18 to 34 Years | 29 (1.0%) | 0 (0.0%) |
| 35 to 64 Years | 192 (3.8%) | 42 (0.8%) |
| 65 to 74 Years | 84 (5.0%) | 103 (5.1%) |
| 75 Years and over | 288 (26.7%) | 264 (19.1%) |
Disability Class: Vision Difficulty
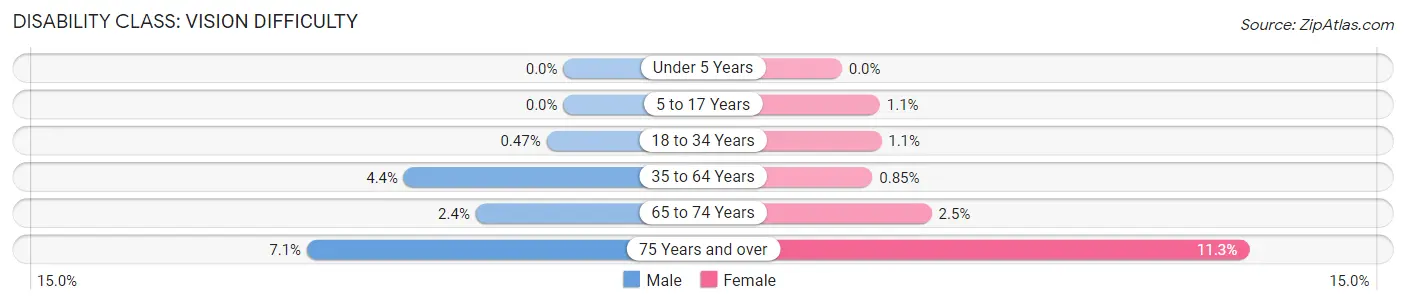
| Age Bracket | Male | Female |
| Under 5 Years | 0 (0.0%) | 0 (0.0%) |
| 5 to 17 Years | 0 (0.0%) | 21 (1.1%) |
| 18 to 34 Years | 14 (0.5%) | 26 (1.1%) |
| 35 to 64 Years | 227 (4.4%) | 45 (0.9%) |
| 65 to 74 Years | 41 (2.4%) | 51 (2.5%) |
| 75 Years and over | 77 (7.1%) | 157 (11.3%) |
Disability Class: Cognitive Difficulty
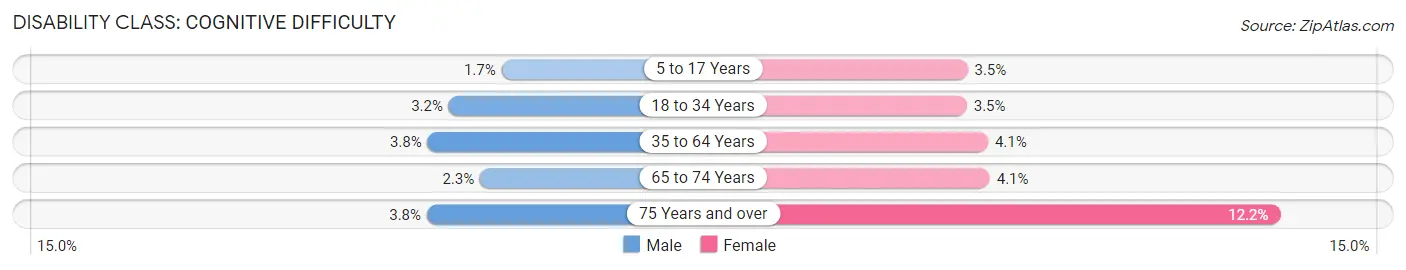
| Age Bracket | Male | Female |
| 5 to 17 Years | 30 (1.7%) | 69 (3.5%) |
| 18 to 34 Years | 95 (3.2%) | 82 (3.5%) |
| 35 to 64 Years | 193 (3.8%) | 216 (4.1%) |
| 65 to 74 Years | 39 (2.3%) | 84 (4.1%) |
| 75 Years and over | 41 (3.8%) | 169 (12.2%) |
Disability Class: Ambulatory Difficulty
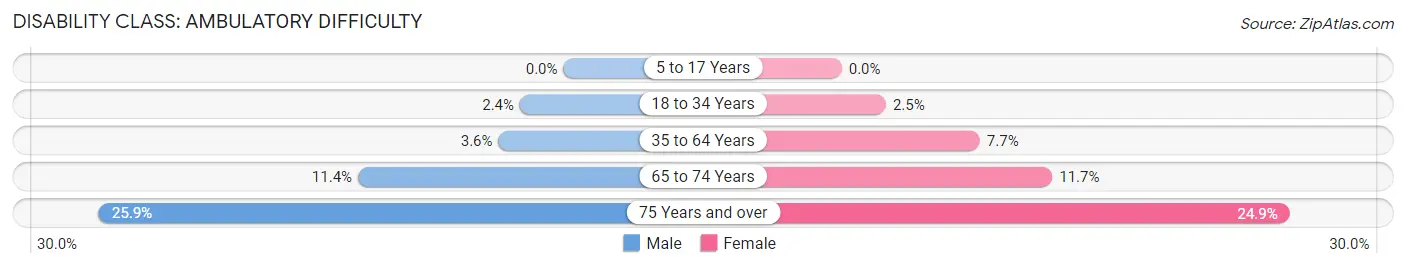
| Age Bracket | Male | Female |
| 5 to 17 Years | 0 (0.0%) | 0 (0.0%) |
| 18 to 34 Years | 72 (2.4%) | 58 (2.5%) |
| 35 to 64 Years | 185 (3.6%) | 408 (7.7%) |
| 65 to 74 Years | 192 (11.4%) | 239 (11.7%) |
| 75 Years and over | 279 (25.9%) | 345 (24.9%) |
Disability Class: Self-Care Difficulty
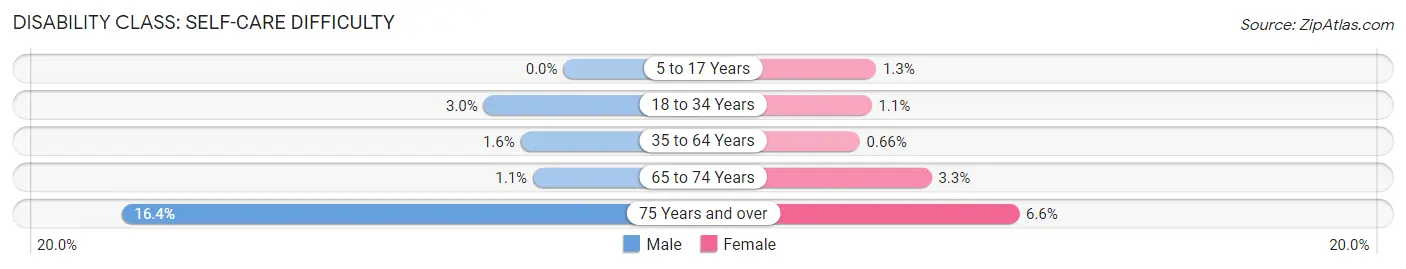
| Age Bracket | Male | Female |
| 5 to 17 Years | 0 (0.0%) | 25 (1.3%) |
| 18 to 34 Years | 88 (3.0%) | 26 (1.1%) |
| 35 to 64 Years | 81 (1.6%) | 35 (0.7%) |
| 65 to 74 Years | 19 (1.1%) | 68 (3.3%) |
| 75 Years and over | 177 (16.4%) | 91 (6.6%) |
Technology Access in Mount Pleasant
Computing Device Access in Mount Pleasant
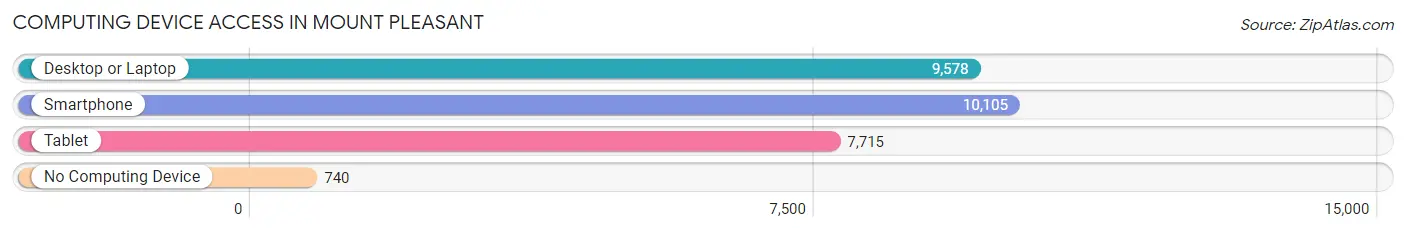
| Device Type | # Households | % Households |
| Desktop or Laptop | 9,578 | 81.8% |
| Smartphone | 10,105 | 86.3% |
| Tablet | 7,715 | 65.9% |
| No Computing Device | 740 | 6.3% |
| Total | 11,709 | 100.0% |
Internet Access in Mount Pleasant
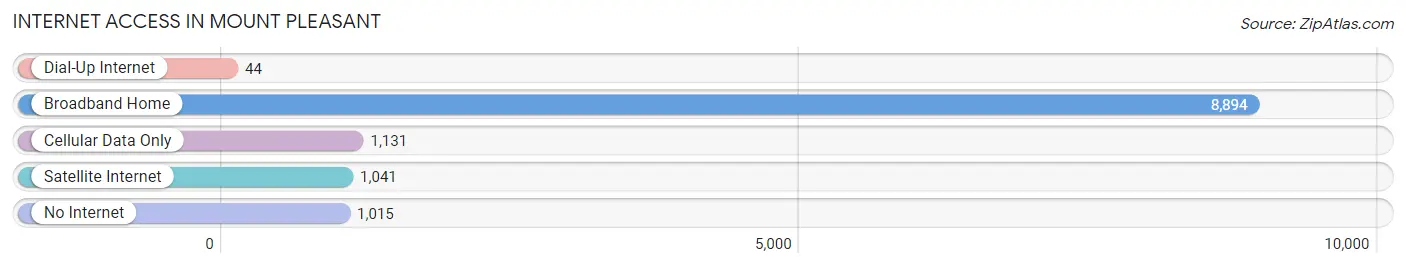
| Internet Type | # Households | % Households |
| Dial-Up Internet | 44 | 0.4% |
| Broadband Home | 8,894 | 76.0% |
| Cellular Data Only | 1,131 | 9.7% |
| Satellite Internet | 1,041 | 8.9% |
| No Internet | 1,015 | 8.7% |
| Total | 11,709 | 100.0% |
Mount Pleasant Summary
Introduction
Mount Pleasant is a village located in Racine County, Wisconsin, United States. It is part of the Milwaukee metropolitan area and is located just south of the city of Racine. The village has a population of approximately 25,000 people and is the second largest village in Wisconsin. The village is known for its strong sense of community and its commitment to preserving its history and culture.
History
Mount Pleasant was first settled in 1836 by a group of settlers from New York. The village was originally known as “Racine Prairie” and was later renamed “Mount Pleasant” in 1839. The village was incorporated in 1842 and was the first village in Racine County.
The village was originally a farming community and was known for its dairy farms and orchards. In the late 19th century, the village began to industrialize and became a major center for manufacturing. The village was home to several factories, including the Racine Iron Works, the Racine Carriage Company, and the Racine Foundry.
In the early 20th century, the village experienced a period of growth and development. The village was home to several schools, churches, and businesses. The village also became a popular tourist destination, with several resorts and amusement parks located in the area.
Geography
Mount Pleasant is located in southeastern Wisconsin, just south of the city of Racine. The village is situated on the banks of the Root River and is surrounded by rolling hills and farmland. The village is located in the Central Plain region of Wisconsin and is part of the Milwaukee metropolitan area.
The village has a total area of 8.3 square miles, of which 8.2 square miles is land and 0.1 square miles is water. The village is located at an elevation of 745 feet above sea level.
Economy
Mount Pleasant is a major center for manufacturing and industry. The village is home to several factories, including the Racine Iron Works, the Racine Carriage Company, and the Racine Foundry. The village is also home to several retail stores, restaurants, and other businesses.
The village is also home to several educational institutions, including the University of Wisconsin-Parkside, Gateway Technical College, and the Racine County Technical College. The village is also home to several parks and recreational facilities, including the Root River Parkway, the Racine Zoo, and the Racine County Fairgrounds.
Demographics
As of the 2010 census, the village had a population of 24,973. The racial makeup of the village was 79.3% White, 11.3% African American, 0.4% Native American, 2.2% Asian, 0.1% Pacific Islander, 4.2% from other races, and 2.5% from two or more races. Hispanic or Latino of any race were 8.3% of the population.
The median income for a household in the village was $50,945, and the median income for a family was $60,945. The per capita income for the village was $24,973. About 6.2% of families and 8.3% of the population were below the poverty line, including 10.3% of those under age 18 and 6.2% of those age 65 or over.
Conclusion
Mount Pleasant is a village located in Racine County, Wisconsin. The village has a population of approximately 25,000 people and is the second largest village in Wisconsin. The village is known for its strong sense of community and its commitment to preserving its history and culture. The village is a major center for manufacturing and industry and is home to several educational institutions, parks, and recreational facilities. The village has a diverse population and a median income of $50,945.
Common Questions
What is Per Capita Income in Mount Pleasant?
Per Capita income in Mount Pleasant is $45,359.
What is the Median Family Income in Mount Pleasant?
Median Family Income in Mount Pleasant is $102,328.
What is the Median Household income in Mount Pleasant?
Median Household Income in Mount Pleasant is $83,827.
What is Income or Wage Gap in Mount Pleasant?
Income or Wage Gap in Mount Pleasant is 28.9%.
Women in Mount Pleasant earn 71.1 cents for every dollar earned by a man.
What is Inequality or Gini Index in Mount Pleasant?
Inequality or Gini Index in Mount Pleasant is 0.41.
What is the Total Population of Mount Pleasant?
Total Population of Mount Pleasant is 27,640.
What is the Total Male Population of Mount Pleasant?
Total Male Population of Mount Pleasant is 13,646.
What is the Total Female Population of Mount Pleasant?
Total Female Population of Mount Pleasant is 13,994.
What is the Ratio of Males per 100 Females in Mount Pleasant?
There are 97.51 Males per 100 Females in Mount Pleasant.
What is the Ratio of Females per 100 Males in Mount Pleasant?
There are 102.55 Females per 100 Males in Mount Pleasant.
What is the Median Population Age in Mount Pleasant?
Median Population Age in Mount Pleasant is 46.7 Years.
What is the Average Family Size in Mount Pleasant
Average Family Size in Mount Pleasant is 2.9 People.
What is the Average Household Size in Mount Pleasant
Average Household Size in Mount Pleasant is 2.3 People.
How Large is the Labor Force in Mount Pleasant?
There are 14,176 People in the Labor Forcein in Mount Pleasant.
What is the Percentage of People in the Labor Force in Mount Pleasant?
62.0% of People are in the Labor Force in Mount Pleasant.
What is the Unemployment Rate in Mount Pleasant?
Unemployment Rate in Mount Pleasant is 3.0%.