Collierville, TN Map & Demographics
Collierville Map
Collierville Overview
$59,856
PER CAPITA INCOME
$143,894
AVG FAMILY INCOME
$129,729
AVG HOUSEHOLD INCOME
54.2%
WAGE / INCOME GAP [ % ]
45.8¢/ $1
WAGE / INCOME GAP [ $ ]
$10,682
FAMILY INCOME DEFICIT
0.42
INEQUALITY / GINI INDEX
51,170
TOTAL POPULATION
24,458
MALE POPULATION
26,712
FEMALE POPULATION
91.56
MALES / 100 FEMALES
109.22
FEMALES / 100 MALES
40.2
MEDIAN AGE
3.3
AVG FAMILY SIZE
2.9
AVG HOUSEHOLD SIZE
26,344
LABOR FORCE [ PEOPLE ]
66.6%
PERCENT IN LABOR FORCE
2.6%
UNEMPLOYMENT RATE
Collierville Zip Codes
Collierville Area Codes
Income in Collierville
Income Overview in Collierville
Per Capita Income in Collierville is $59,856, while median incomes of families and households are $143,894 and $129,729 respectively.
| Characteristic | Number | Measure |
| Per Capita Income | 51,170 | $59,856 |
| Median Family Income | 14,195 | $143,894 |
| Mean Family Income | 14,195 | $187,232 |
| Median Household Income | 17,755 | $129,729 |
| Mean Household Income | 17,755 | $170,648 |
| Income Deficit | 14,195 | $10,682 |
| Wage / Income Gap (%) | 51,170 | 54.21% |
| Wage / Income Gap ($) | 51,170 | 45.79¢ per $1 |
| Gini / Inequality Index | 51,170 | 0.42 |
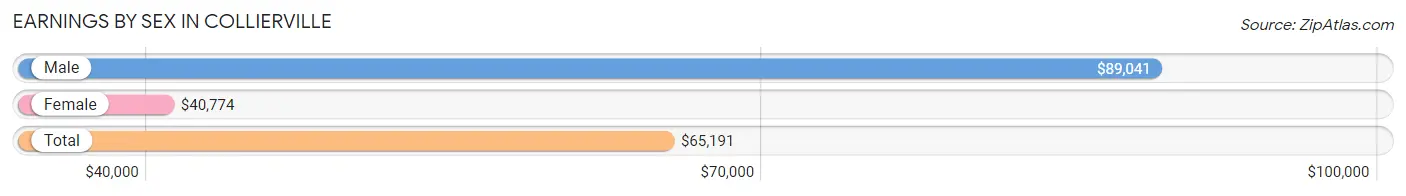
Earnings by Sex in Collierville
Average Earnings in Collierville are $65,191, $89,041 for men and $40,774 for women, a difference of 54.2%.
| Sex | Number | Average Earnings |
| Male | 14,650 (54.0%) | $89,041 |
| Female | 12,455 (46.0%) | $40,774 |
| Total | 27,105 (100.0%) | $65,191 |
Earnings by Sex by Income Bracket in Collierville
The most common earnings brackets in Collierville are $100,000+ for men (6,585 | 45.0%) and $100,000+ for women (1,841 | 14.8%).
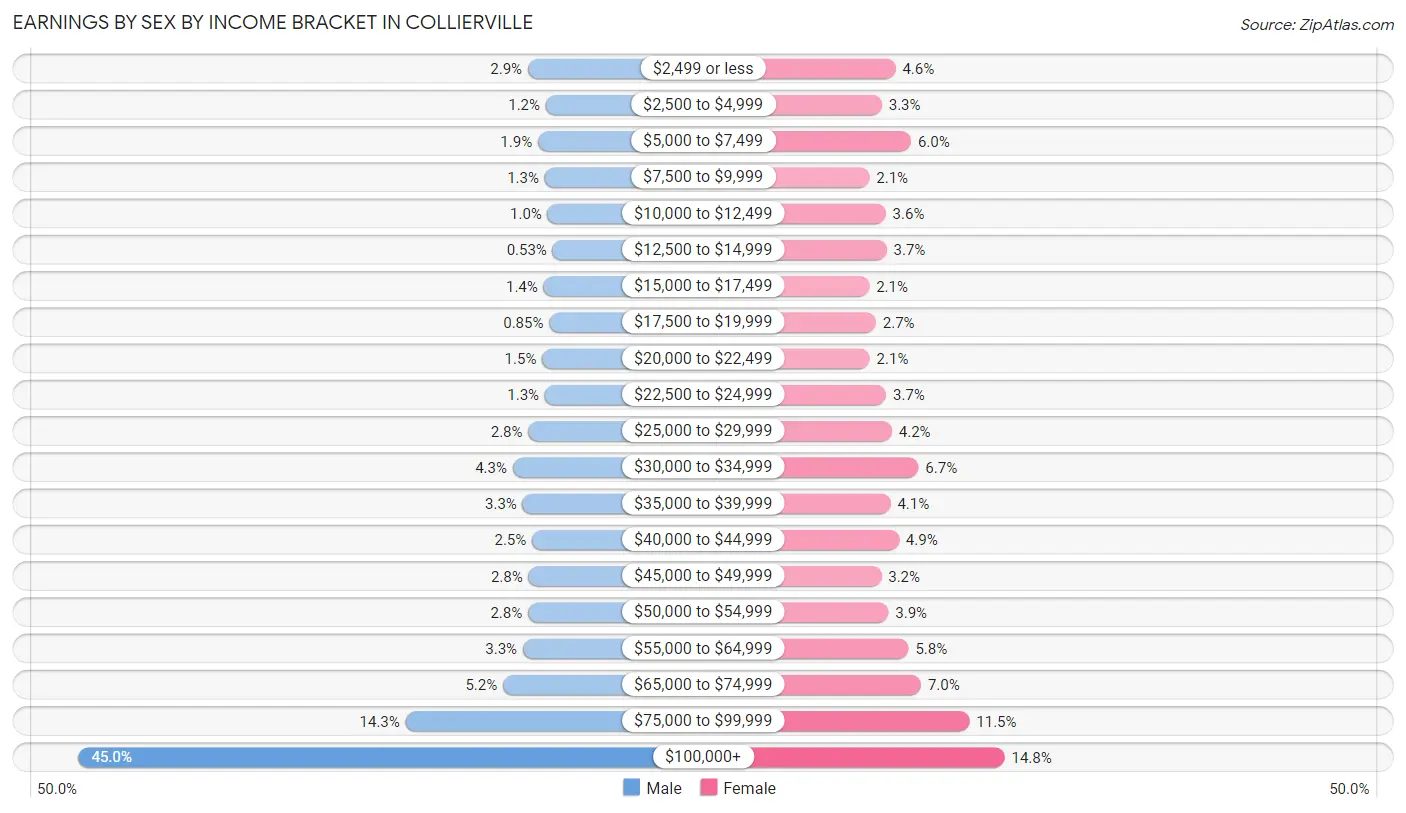
| Income | Male | Female |
| $2,499 or less | 417 (2.9%) | 568 (4.6%) |
| $2,500 to $4,999 | 171 (1.2%) | 408 (3.3%) |
| $5,000 to $7,499 | 280 (1.9%) | 749 (6.0%) |
| $7,500 to $9,999 | 186 (1.3%) | 263 (2.1%) |
| $10,000 to $12,499 | 146 (1.0%) | 453 (3.6%) |
| $12,500 to $14,999 | 77 (0.5%) | 465 (3.7%) |
| $15,000 to $17,499 | 202 (1.4%) | 262 (2.1%) |
| $17,500 to $19,999 | 125 (0.9%) | 339 (2.7%) |
| $20,000 to $22,499 | 221 (1.5%) | 267 (2.1%) |
| $22,500 to $24,999 | 184 (1.3%) | 458 (3.7%) |
| $25,000 to $29,999 | 412 (2.8%) | 526 (4.2%) |
| $30,000 to $34,999 | 626 (4.3%) | 836 (6.7%) |
| $35,000 to $39,999 | 490 (3.3%) | 509 (4.1%) |
| $40,000 to $44,999 | 361 (2.5%) | 608 (4.9%) |
| $45,000 to $49,999 | 409 (2.8%) | 402 (3.2%) |
| $50,000 to $54,999 | 416 (2.8%) | 485 (3.9%) |
| $55,000 to $64,999 | 486 (3.3%) | 720 (5.8%) |
| $65,000 to $74,999 | 759 (5.2%) | 866 (7.0%) |
| $75,000 to $99,999 | 2,097 (14.3%) | 1,430 (11.5%) |
| $100,000+ | 6,585 (45.0%) | 1,841 (14.8%) |
| Total | 14,650 (100.0%) | 12,455 (100.0%) |
Earnings by Sex by Educational Attainment in Collierville
Average earnings in Collierville are $99,447 for men and $49,943 for women, a difference of 49.8%. Men with an educational attainment of graduate degree enjoy the highest average annual earnings of $127,848, while those with less than high school education earn the least with $41,198. Women with an educational attainment of graduate degree earn the most with the average annual earnings of $85,944, while those with high school diploma education have the smallest earnings of $30,701.
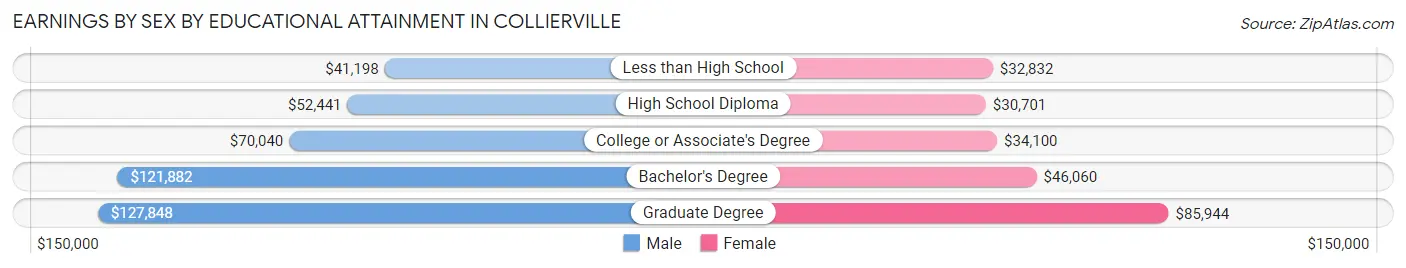
| Educational Attainment | Male Income | Female Income |
| Less than High School | $41,198 | $32,832 |
| High School Diploma | $52,441 | $30,701 |
| College or Associate's Degree | $70,040 | $34,100 |
| Bachelor's Degree | $121,882 | $46,060 |
| Graduate Degree | $127,848 | $85,944 |
| Total | $99,447 | $49,943 |
Family Income in Collierville
Family Income Brackets in Collierville
According to the Collierville family income data, there are 4,500 families falling into the $200,000+ income range, which is the most common income bracket and makes up 31.7% of all families. Conversely, the $10,000 to $14,999 income bracket is the least frequent group with only 43 families (0.3%) belonging to this category.
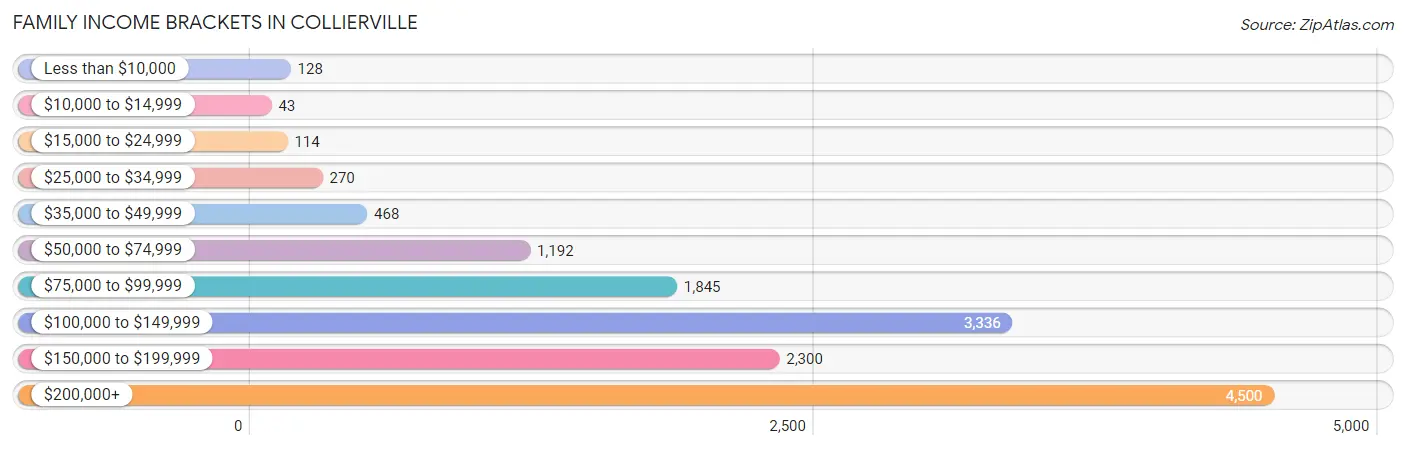
| Income Bracket | # Families | % Families |
| Less than $10,000 | 128 | 0.9% |
| $10,000 to $14,999 | 43 | 0.3% |
| $15,000 to $24,999 | 114 | 0.8% |
| $25,000 to $34,999 | 270 | 1.9% |
| $35,000 to $49,999 | 468 | 3.3% |
| $50,000 to $74,999 | 1,192 | 8.4% |
| $75,000 to $99,999 | 1,845 | 13.0% |
| $100,000 to $149,999 | 3,336 | 23.5% |
| $150,000 to $199,999 | 2,300 | 16.2% |
| $200,000+ | 4,500 | 31.7% |
Family Income by Famaliy Size in Collierville
7+ person families (281 | 2.0%) account for the highest median family income in Collierville with $250,001 per family, while 2-person families (5,966 | 42.0%) have the highest median income of $63,003 per family member.
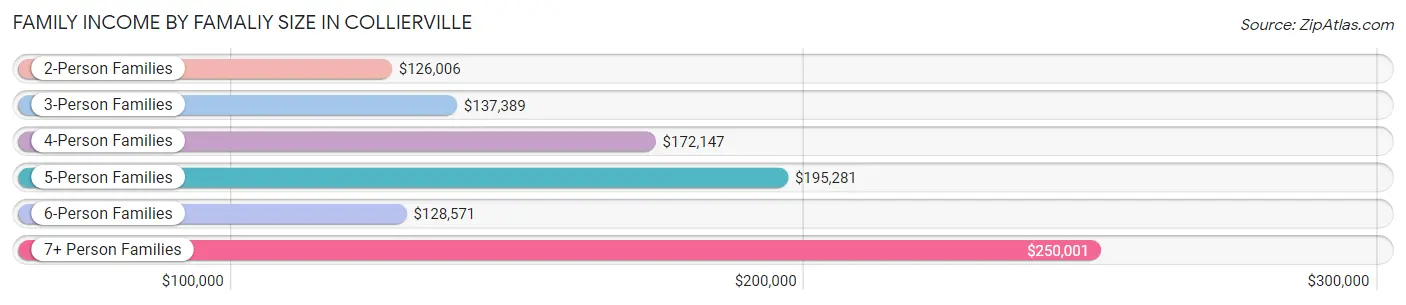
| Income Bracket | # Families | Median Income |
| 2-Person Families | 5,966 (42.0%) | $126,006 |
| 3-Person Families | 2,938 (20.7%) | $137,389 |
| 4-Person Families | 3,569 (25.1%) | $172,147 |
| 5-Person Families | 1,167 (8.2%) | $195,281 |
| 6-Person Families | 274 (1.9%) | $128,571 |
| 7+ Person Families | 281 (2.0%) | $250,001 |
| Total | 14,195 (100.0%) | $143,894 |
Family Income by Number of Earners in Collierville
The median family income in Collierville is $143,894, with families comprising 3+ earners (1,840) having the highest median family income of $206,071, while families with no earners (1,431) have the lowest median family income of $87,450, accounting for 13.0% and 10.1% of families, respectively.
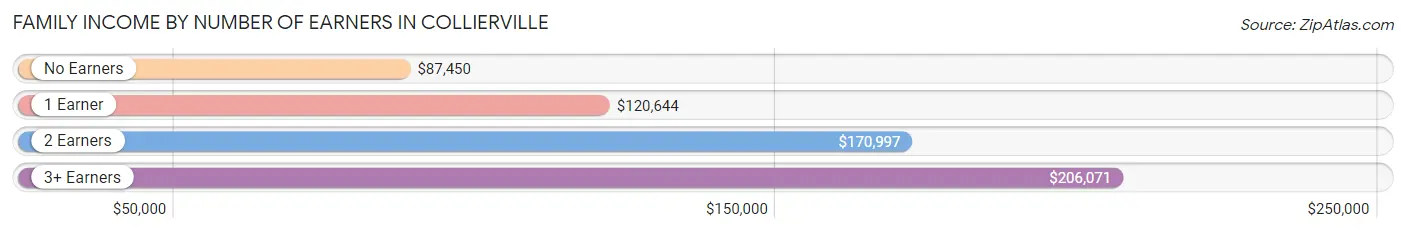
| Number of Earners | # Families | Median Income |
| No Earners | 1,431 (10.1%) | $87,450 |
| 1 Earner | 4,467 (31.5%) | $120,644 |
| 2 Earners | 6,457 (45.5%) | $170,997 |
| 3+ Earners | 1,840 (13.0%) | $206,071 |
| Total | 14,195 (100.0%) | $143,894 |
Household Income in Collierville
Household Income Brackets in Collierville
With 4,847 households falling in the category, the $200,000+ income range is the most frequent in Collierville, accounting for 27.3% of all households. In contrast, only 142 households (0.8%) fall into the $10,000 to $14,999 income bracket, making it the least populous group.
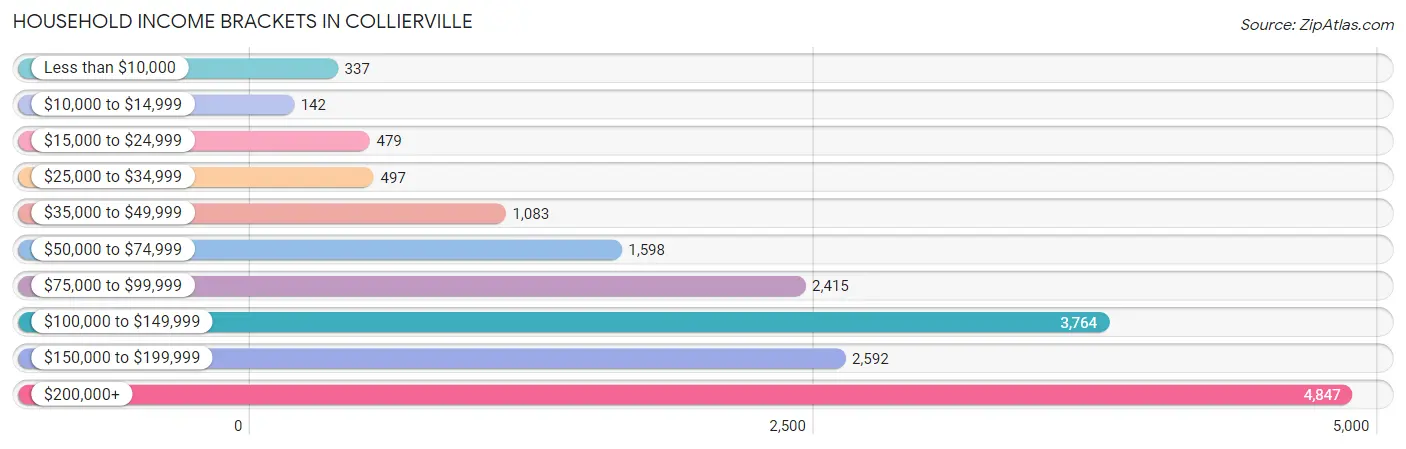
| Income Bracket | # Households | % Households |
| Less than $10,000 | 337 | 1.9% |
| $10,000 to $14,999 | 142 | 0.8% |
| $15,000 to $24,999 | 479 | 2.7% |
| $25,000 to $34,999 | 497 | 2.8% |
| $35,000 to $49,999 | 1,083 | 6.1% |
| $50,000 to $74,999 | 1,598 | 9.0% |
| $75,000 to $99,999 | 2,415 | 13.6% |
| $100,000 to $149,999 | 3,764 | 21.2% |
| $150,000 to $199,999 | 2,592 | 14.6% |
| $200,000+ | 4,847 | 27.3% |
Household Income by Householder Age in Collierville
The median household income in Collierville is $129,729, with the highest median household income of $162,774 found in the 45 to 64 years age bracket for the primary householder. A total of 8,176 households (46.1%) fall into this category. Meanwhile, the 15 to 24 years age bracket for the primary householder has the lowest median household income of $59,831, with 278 households (1.6%) in this group.
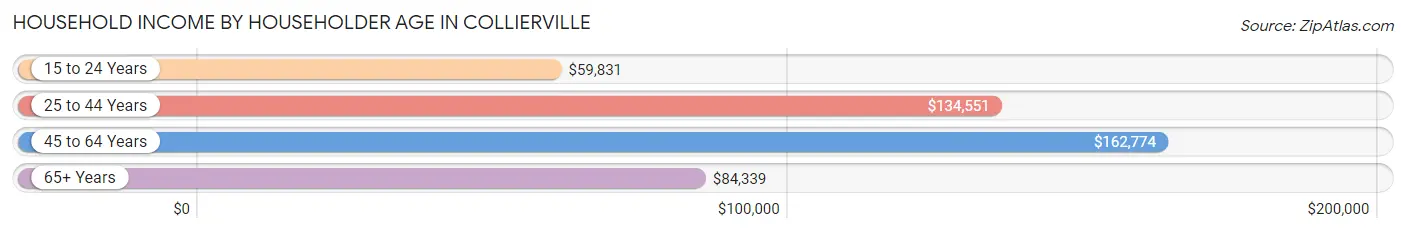
| Income Bracket | # Households | Median Income |
| 15 to 24 Years | 278 (1.6%) | $59,831 |
| 25 to 44 Years | 4,852 (27.3%) | $134,551 |
| 45 to 64 Years | 8,176 (46.1%) | $162,774 |
| 65+ Years | 4,449 (25.1%) | $84,339 |
| Total | 17,755 (100.0%) | $129,729 |
Poverty in Collierville
Income Below Poverty by Sex and Age in Collierville
With 1.8% poverty level for males and 3.4% for females among the residents of Collierville, 16 and 17 year old males and 75 year old and over females are the most vulnerable to poverty, with 45 males (5.1%) and 158 females (9.8%) in their respective age groups living below the poverty level.
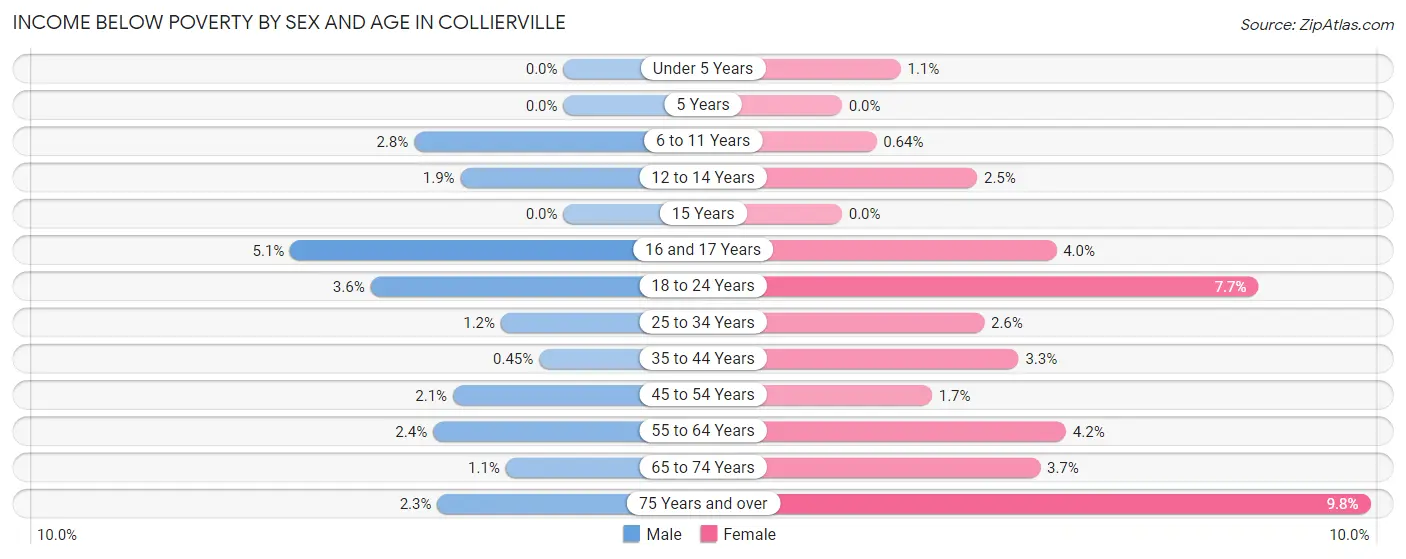
| Age Bracket | Male | Female |
| Under 5 Years | 0 (0.0%) | 17 (1.1%) |
| 5 Years | 0 (0.0%) | 0 (0.0%) |
| 6 to 11 Years | 66 (2.8%) | 13 (0.6%) |
| 12 to 14 Years | 31 (1.9%) | 38 (2.5%) |
| 15 Years | 0 (0.0%) | 0 (0.0%) |
| 16 and 17 Years | 45 (5.1%) | 46 (4.0%) |
| 18 to 24 Years | 59 (3.6%) | 135 (7.7%) |
| 25 to 34 Years | 25 (1.2%) | 75 (2.6%) |
| 35 to 44 Years | 15 (0.4%) | 112 (3.3%) |
| 45 to 54 Years | 83 (2.1%) | 65 (1.7%) |
| 55 to 64 Years | 81 (2.4%) | 147 (4.2%) |
| 65 to 74 Years | 23 (1.1%) | 101 (3.7%) |
| 75 Years and over | 22 (2.3%) | 158 (9.8%) |
| Total | 450 (1.8%) | 907 (3.4%) |
Income Above Poverty by Sex and Age in Collierville
According to the poverty statistics in Collierville, males aged under 5 years and females aged 5 years are the age groups that are most secure financially, with 100.0% of males and 100.0% of females in these age groups living above the poverty line.
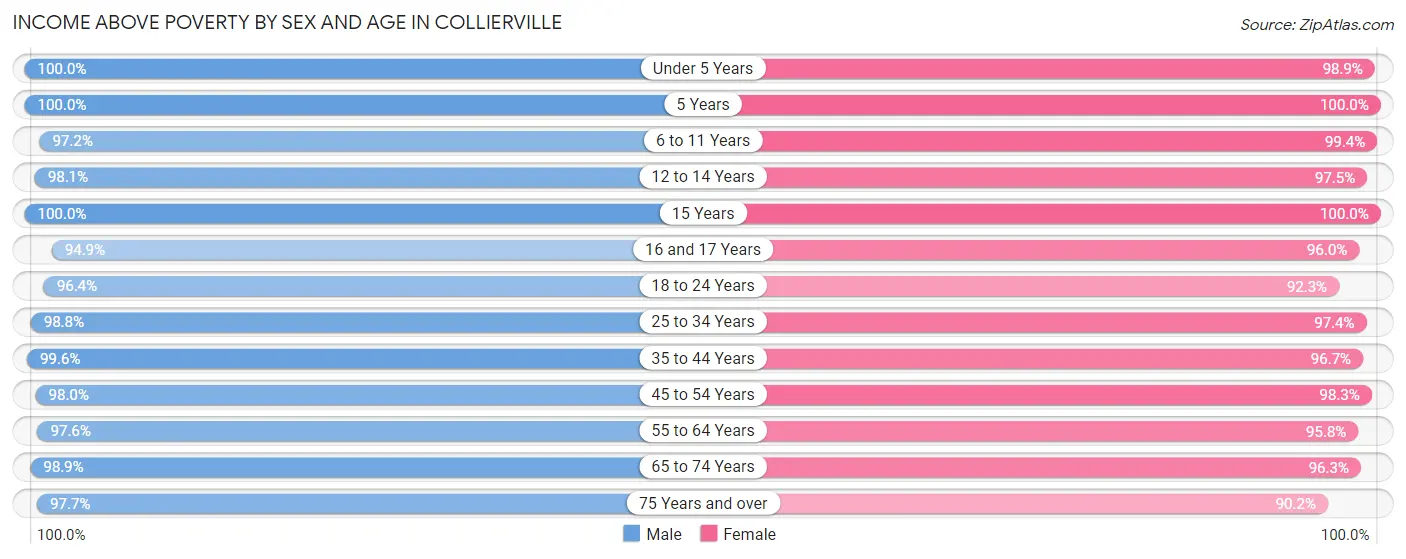
| Age Bracket | Male | Female |
| Under 5 Years | 1,276 (100.0%) | 1,546 (98.9%) |
| 5 Years | 250 (100.0%) | 319 (100.0%) |
| 6 to 11 Years | 2,317 (97.2%) | 2,030 (99.4%) |
| 12 to 14 Years | 1,589 (98.1%) | 1,475 (97.5%) |
| 15 Years | 380 (100.0%) | 244 (100.0%) |
| 16 and 17 Years | 842 (94.9%) | 1,110 (96.0%) |
| 18 to 24 Years | 1,590 (96.4%) | 1,611 (92.3%) |
| 25 to 34 Years | 2,127 (98.8%) | 2,767 (97.4%) |
| 35 to 44 Years | 3,319 (99.6%) | 3,305 (96.7%) |
| 45 to 54 Years | 3,956 (98.0%) | 3,830 (98.3%) |
| 55 to 64 Years | 3,269 (97.6%) | 3,386 (95.8%) |
| 65 to 74 Years | 2,119 (98.9%) | 2,643 (96.3%) |
| 75 Years and over | 918 (97.7%) | 1,453 (90.2%) |
| Total | 23,952 (98.2%) | 25,719 (96.6%) |
Income Below Poverty Among Married-Couple Families in Collierville
The poverty statistics for married-couple families in Collierville show that 0.5% or 63 of the total 12,238 families live below the poverty line. Families with 1 or 2 children have the highest poverty rate of 0.8%, comprising of 39 families. On the other hand, families with 3 or 4 children have the lowest poverty rate of 0.0%, which includes 0 families.
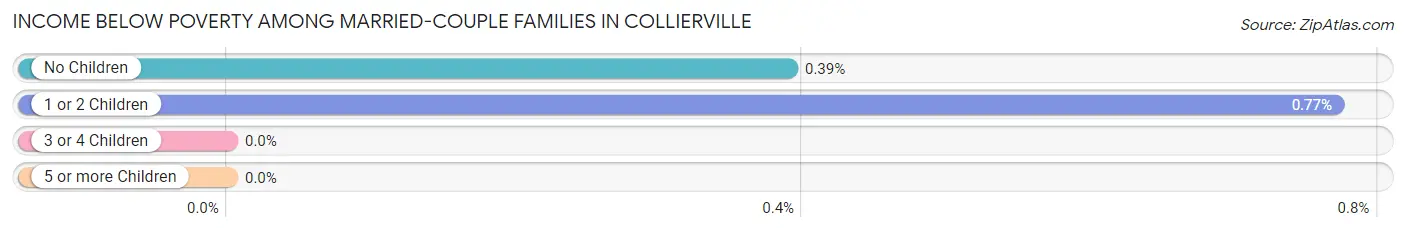
| Children | Above Poverty | Below Poverty |
| No Children | 6,066 (99.6%) | 24 (0.4%) |
| 1 or 2 Children | 5,009 (99.2%) | 39 (0.8%) |
| 3 or 4 Children | 1,071 (100.0%) | 0 (0.0%) |
| 5 or more Children | 29 (100.0%) | 0 (0.0%) |
| Total | 12,175 (99.5%) | 63 (0.5%) |
Income Below Poverty Among Single-Parent Households in Collierville
According to the poverty data in Collierville, 4.6% or 29 single-father households and 15.1% or 200 single-mother households are living below the poverty line. Among single-father households, those with no children have the highest poverty rate, with 18 households (7.4%) experiencing poverty. Likewise, among single-mother households, those with 3 or 4 children have the highest poverty rate, with 27 households (32.9%) falling below the poverty line.
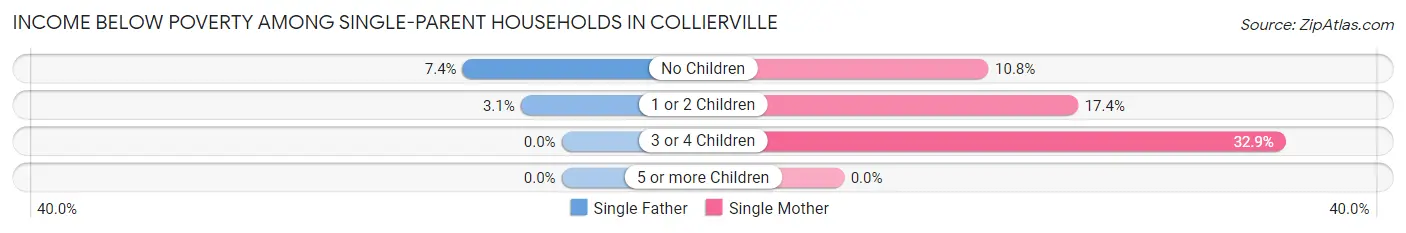
| Children | Single Father | Single Mother |
| No Children | 18 (7.4%) | 71 (10.8%) |
| 1 or 2 Children | 11 (3.0%) | 102 (17.4%) |
| 3 or 4 Children | 0 (0.0%) | 27 (32.9%) |
| 5 or more Children | 0 (0.0%) | 0 (0.0%) |
| Total | 29 (4.6%) | 200 (15.1%) |
Income Below Poverty Among Married-Couple vs Single-Parent Households in Collierville
The poverty data for Collierville shows that 63 of the married-couple family households (0.5%) and 229 of the single-parent households (11.7%) are living below the poverty level. Within the married-couple family households, those with 1 or 2 children have the highest poverty rate, with 39 households (0.8%) falling below the poverty line. Among the single-parent households, those with 3 or 4 children have the highest poverty rate, with 27 household (25.2%) living below poverty.
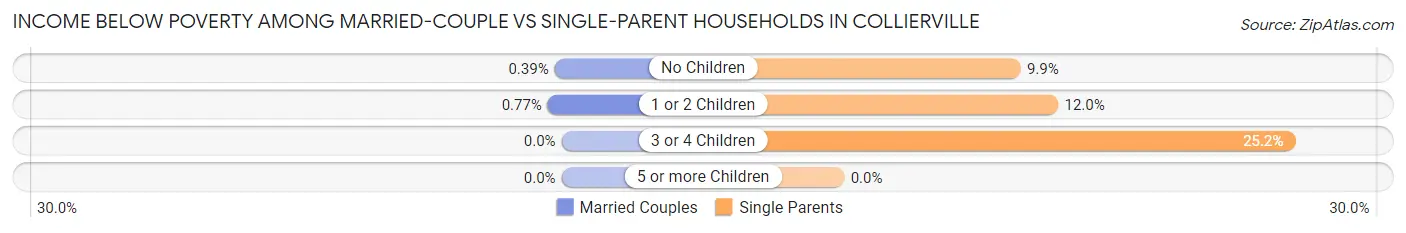
| Children | Married-Couple Families | Single-Parent Households |
| No Children | 24 (0.4%) | 89 (9.9%) |
| 1 or 2 Children | 39 (0.8%) | 113 (11.9%) |
| 3 or 4 Children | 0 (0.0%) | 27 (25.2%) |
| 5 or more Children | 0 (0.0%) | 0 (0.0%) |
| Total | 63 (0.5%) | 229 (11.7%) |
Race in Collierville
The most populous races in Collierville are White / Caucasian (36,456 | 71.2%), Asian (7,057 | 13.8%), and Black / African American (5,028 | 9.8%).
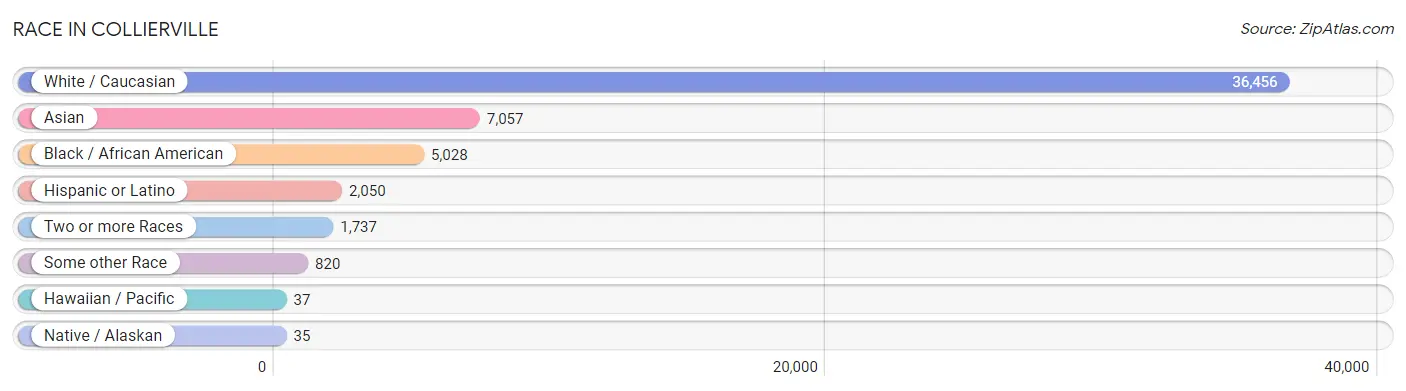
| Race | # Population | % Population |
| Asian | 7,057 | 13.8% |
| Black / African American | 5,028 | 9.8% |
| Hawaiian / Pacific | 37 | 0.1% |
| Hispanic or Latino | 2,050 | 4.0% |
| Native / Alaskan | 35 | 0.1% |
| White / Caucasian | 36,456 | 71.2% |
| Two or more Races | 1,737 | 3.4% |
| Some other Race | 820 | 1.6% |
| Total | 51,170 | 100.0% |
Ancestry in Collierville
The most populous ancestries reported in Collierville are English (6,804 | 13.3%), American (6,081 | 11.9%), Irish (5,366 | 10.5%), Thai (4,994 | 9.8%), and German (4,480 | 8.8%), together accounting for 54.2% of all Collierville residents.
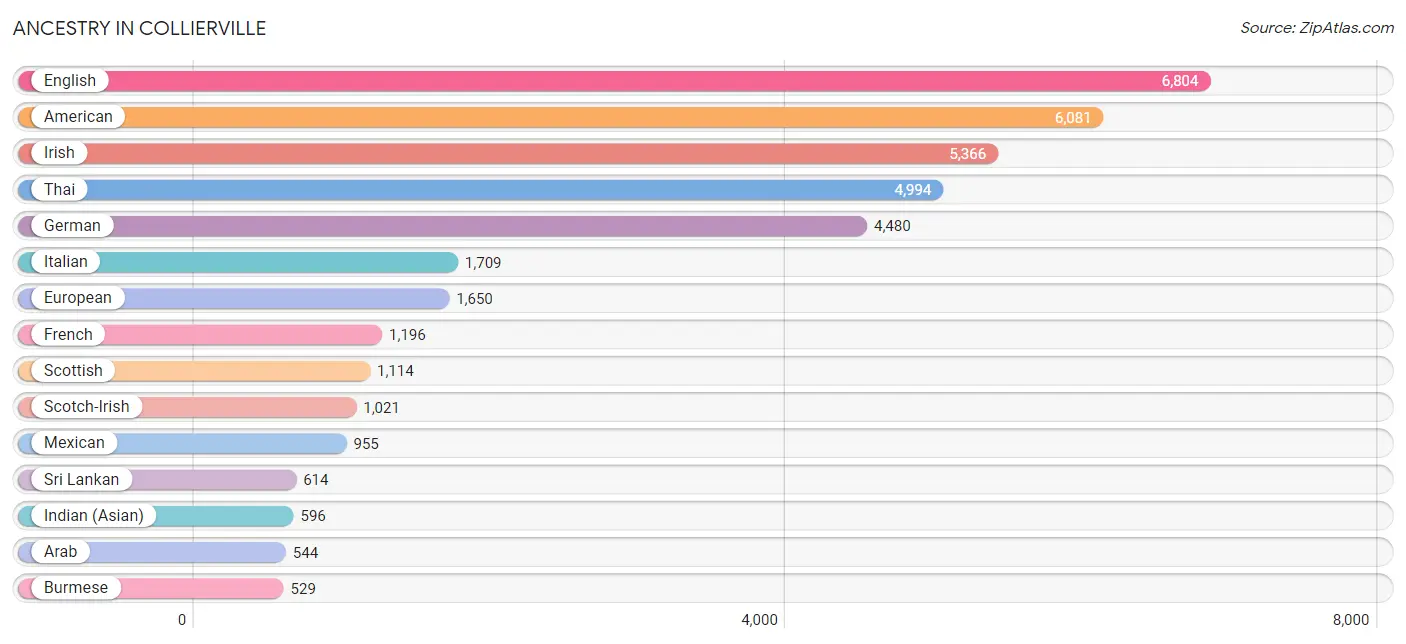
| Ancestry | # Population | % Population |
| African | 23 | 0.0% |
| Alaskan Athabascan | 5 | 0.0% |
| American | 6,081 | 11.9% |
| Arab | 544 | 1.1% |
| Argentinean | 27 | 0.1% |
| Australian | 53 | 0.1% |
| Austrian | 104 | 0.2% |
| Belgian | 18 | 0.0% |
| Belizean | 23 | 0.0% |
| Bhutanese | 135 | 0.3% |
| Brazilian | 10 | 0.0% |
| British | 403 | 0.8% |
| Burmese | 529 | 1.0% |
| Canadian | 48 | 0.1% |
| Central American | 475 | 0.9% |
| Central American Indian | 6 | 0.0% |
| Cherokee | 98 | 0.2% |
| Chilean | 223 | 0.4% |
| Choctaw | 18 | 0.0% |
| Colombian | 14 | 0.0% |
| Croatian | 52 | 0.1% |
| Cuban | 99 | 0.2% |
| Czech | 148 | 0.3% |
| Danish | 47 | 0.1% |
| Dutch | 340 | 0.7% |
| Eastern European | 249 | 0.5% |
| Ecuadorian | 7 | 0.0% |
| Egyptian | 176 | 0.3% |
| English | 6,804 | 13.3% |
| European | 1,650 | 3.2% |
| Finnish | 17 | 0.0% |
| French | 1,196 | 2.3% |
| French Canadian | 101 | 0.2% |
| German | 4,480 | 8.8% |
| Greek | 136 | 0.3% |
| Guamanian / Chamorro | 37 | 0.1% |
| Guatemalan | 407 | 0.8% |
| Hungarian | 89 | 0.2% |
| Indian (Asian) | 596 | 1.2% |
| Irish | 5,366 | 10.5% |
| Italian | 1,709 | 3.3% |
| Jamaican | 88 | 0.2% |
| Kenyan | 30 | 0.1% |
| Korean | 340 | 0.7% |
| Laotian | 29 | 0.1% |
| Latvian | 8 | 0.0% |
| Lebanese | 25 | 0.1% |
| Lithuanian | 40 | 0.1% |
| Mexican | 955 | 1.9% |
| Mexican American Indian | 17 | 0.0% |
| Moroccan | 71 | 0.1% |
| Navajo | 1 | 0.0% |
| Nicaraguan | 68 | 0.1% |
| Nigerian | 379 | 0.7% |
| Northern European | 30 | 0.1% |
| Norwegian | 363 | 0.7% |
| Palestinian | 58 | 0.1% |
| Polish | 508 | 1.0% |
| Portuguese | 198 | 0.4% |
| Puerto Rican | 98 | 0.2% |
| Russian | 61 | 0.1% |
| Scandinavian | 69 | 0.1% |
| Scotch-Irish | 1,021 | 2.0% |
| Scottish | 1,114 | 2.2% |
| Slovak | 13 | 0.0% |
| South American | 284 | 0.6% |
| Spaniard | 28 | 0.1% |
| Spanish | 97 | 0.2% |
| Sri Lankan | 614 | 1.2% |
| Subsaharan African | 479 | 0.9% |
| Swedish | 301 | 0.6% |
| Swiss | 181 | 0.4% |
| Syrian | 66 | 0.1% |
| Thai | 4,994 | 9.8% |
| Tlingit-Haida | 8 | 0.0% |
| Trinidadian and Tobagonian | 10 | 0.0% |
| Uruguayan | 13 | 0.0% |
| Welsh | 340 | 0.7% |
| Yugoslavian | 13 | 0.0% | View All 79 Rows |
Immigrants in Collierville
The most numerous immigrant groups reported in Collierville came from Asia (5,155 | 10.1%), South Central Asia (3,825 | 7.5%), India (3,256 | 6.4%), Eastern Asia (633 | 1.2%), and South Eastern Asia (620 | 1.2%), together accounting for 26.4% of all Collierville residents.
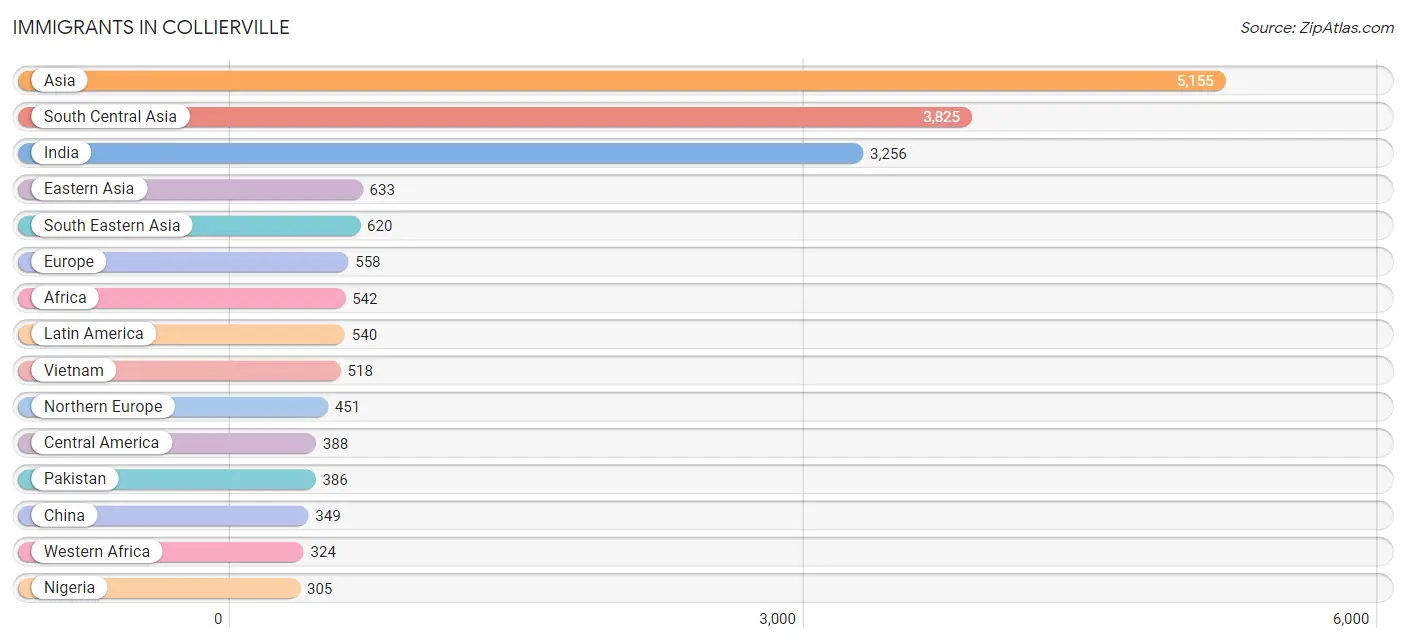
| Immigration Origin | # Population | % Population |
| Africa | 542 | 1.1% |
| Argentina | 19 | 0.0% |
| Asia | 5,155 | 10.1% |
| Austria | 20 | 0.0% |
| Belize | 23 | 0.0% |
| Brazil | 10 | 0.0% |
| Cameroon | 18 | 0.0% |
| Canada | 74 | 0.1% |
| Caribbean | 58 | 0.1% |
| Central America | 388 | 0.8% |
| Chile | 44 | 0.1% |
| China | 349 | 0.7% |
| Colombia | 9 | 0.0% |
| Cuba | 7 | 0.0% |
| Eastern Africa | 14 | 0.0% |
| Eastern Asia | 633 | 1.2% |
| Eastern Europe | 5 | 0.0% |
| Egypt | 176 | 0.3% |
| England | 43 | 0.1% |
| Europe | 558 | 1.1% |
| Germany | 41 | 0.1% |
| Honduras | 74 | 0.1% |
| India | 3,256 | 6.4% |
| Indonesia | 29 | 0.1% |
| Iran | 68 | 0.1% |
| Ireland | 120 | 0.2% |
| Italy | 30 | 0.1% |
| Jamaica | 51 | 0.1% |
| Japan | 36 | 0.1% |
| Kenya | 14 | 0.0% |
| Korea | 248 | 0.5% |
| Latin America | 540 | 1.1% |
| Mexico | 291 | 0.6% |
| Middle Africa | 18 | 0.0% |
| Nepal | 115 | 0.2% |
| Nigeria | 305 | 0.6% |
| Northern Africa | 176 | 0.3% |
| Northern Europe | 451 | 0.9% |
| Pakistan | 386 | 0.7% |
| Philippines | 73 | 0.1% |
| Poland | 5 | 0.0% |
| Scotland | 4 | 0.0% |
| Sierra Leone | 19 | 0.0% |
| South Africa | 10 | 0.0% |
| South America | 94 | 0.2% |
| South Central Asia | 3,825 | 7.5% |
| South Eastern Asia | 620 | 1.2% |
| Southern Europe | 41 | 0.1% |
| Spain | 11 | 0.0% |
| Syria | 27 | 0.1% |
| Taiwan | 26 | 0.1% |
| Venezuela | 12 | 0.0% |
| Vietnam | 518 | 1.0% |
| Western Africa | 324 | 0.6% |
| Western Asia | 77 | 0.2% |
| Western Europe | 61 | 0.1% |
| Yemen | 50 | 0.1% | View All 57 Rows |
Sex and Age in Collierville
Sex and Age in Collierville
The most populous age groups in Collierville are 10 to 14 Years (2,394 | 9.8%) for men and 45 to 49 Years (2,271 | 8.5%) for women.
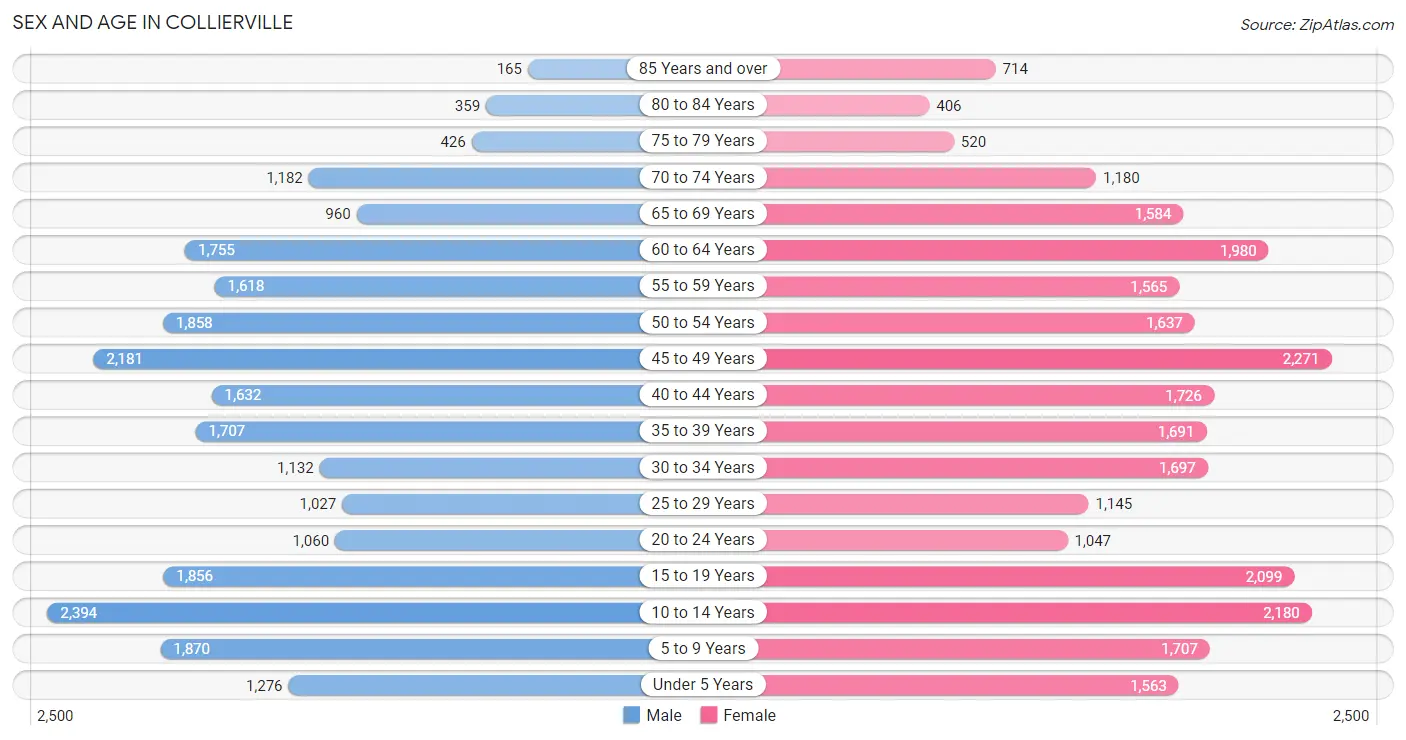
| Age Bracket | Male | Female |
| Under 5 Years | 1,276 (5.2%) | 1,563 (5.9%) |
| 5 to 9 Years | 1,870 (7.6%) | 1,707 (6.4%) |
| 10 to 14 Years | 2,394 (9.8%) | 2,180 (8.2%) |
| 15 to 19 Years | 1,856 (7.6%) | 2,099 (7.9%) |
| 20 to 24 Years | 1,060 (4.3%) | 1,047 (3.9%) |
| 25 to 29 Years | 1,027 (4.2%) | 1,145 (4.3%) |
| 30 to 34 Years | 1,132 (4.6%) | 1,697 (6.4%) |
| 35 to 39 Years | 1,707 (7.0%) | 1,691 (6.3%) |
| 40 to 44 Years | 1,632 (6.7%) | 1,726 (6.5%) |
| 45 to 49 Years | 2,181 (8.9%) | 2,271 (8.5%) |
| 50 to 54 Years | 1,858 (7.6%) | 1,637 (6.1%) |
| 55 to 59 Years | 1,618 (6.6%) | 1,565 (5.9%) |
| 60 to 64 Years | 1,755 (7.2%) | 1,980 (7.4%) |
| 65 to 69 Years | 960 (3.9%) | 1,584 (5.9%) |
| 70 to 74 Years | 1,182 (4.8%) | 1,180 (4.4%) |
| 75 to 79 Years | 426 (1.7%) | 520 (1.9%) |
| 80 to 84 Years | 359 (1.5%) | 406 (1.5%) |
| 85 Years and over | 165 (0.7%) | 714 (2.7%) |
| Total | 24,458 (100.0%) | 26,712 (100.0%) |
Families and Households in Collierville
Median Family Size in Collierville
The median family size in Collierville is 3.28 persons per family, with married-couple families (12,238 | 86.2%) accounting for the largest median family size of 3.34 persons per family. On the other hand, single male/father families (630 | 4.4%) represent the smallest median family size with 2.53 persons per family.
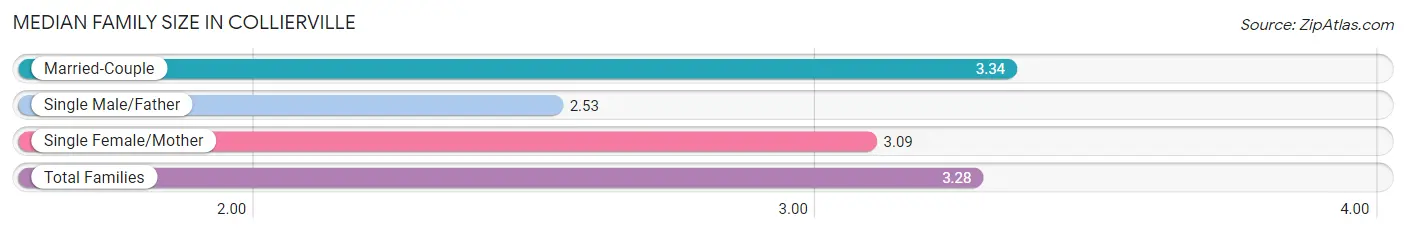
| Family Type | # Families | Family Size |
| Married-Couple | 12,238 (86.2%) | 3.34 |
| Single Male/Father | 630 (4.4%) | 2.53 |
| Single Female/Mother | 1,327 (9.3%) | 3.09 |
| Total Families | 14,195 (100.0%) | 3.28 |
Median Household Size in Collierville
The median household size in Collierville is 2.88 persons per household, with married-couple households (12,238 | 68.9%) accounting for the largest median household size of 3.34 persons per household. non-family households (3,560 | 20.1%) represent the smallest median household size with 1.13 persons per household.
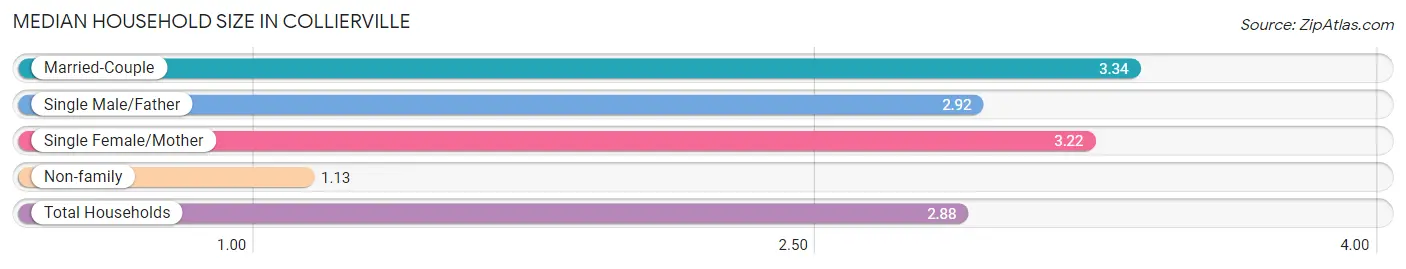
| Household Type | # Households | Household Size |
| Married-Couple | 12,238 (68.9%) | 3.34 |
| Single Male/Father | 630 (3.5%) | 2.92 |
| Single Female/Mother | 1,327 (7.5%) | 3.22 |
| Non-family | 3,560 (20.1%) | 1.13 |
| Total Households | 17,755 (100.0%) | 2.88 |
Household Size by Marriage Status in Collierville
Out of a total of 17,755 households in Collierville, 14,195 (79.9%) are family households, while 3,560 (20.1%) are nonfamily households. The most numerous type of family households are 2-person households, comprising 5,805, and the most common type of nonfamily households are 1-person households, comprising 3,179.
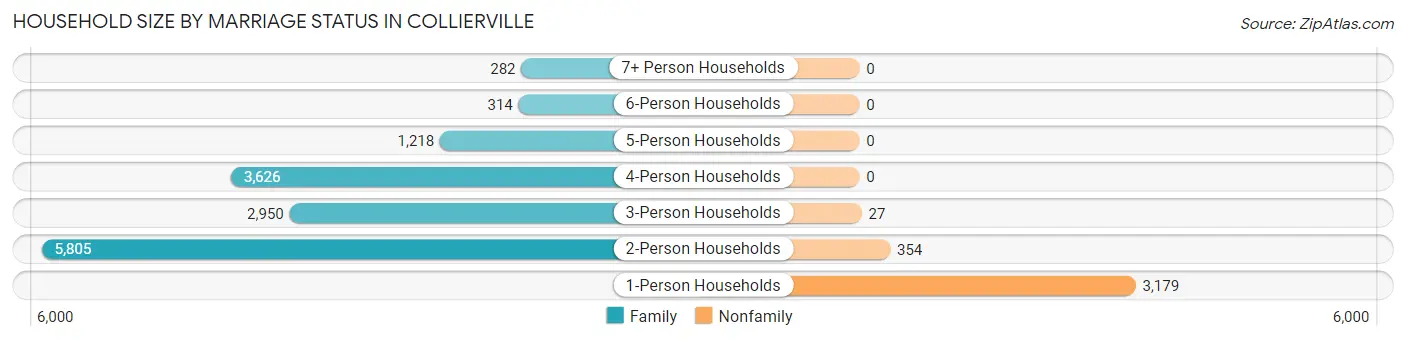
| Household Size | Family Households | Nonfamily Households |
| 1-Person Households | - | 3,179 (17.9%) |
| 2-Person Households | 5,805 (32.7%) | 354 (2.0%) |
| 3-Person Households | 2,950 (16.6%) | 27 (0.2%) |
| 4-Person Households | 3,626 (20.4%) | 0 (0.0%) |
| 5-Person Households | 1,218 (6.9%) | 0 (0.0%) |
| 6-Person Households | 314 (1.8%) | 0 (0.0%) |
| 7+ Person Households | 282 (1.6%) | 0 (0.0%) |
| Total | 14,195 (79.9%) | 3,560 (20.1%) |
Female Fertility in Collierville
Fertility by Age in Collierville
Average fertility rate in Collierville is 28.0 births per 1,000 women. Women in the age bracket of 20 to 34 years have the highest fertility rate with 60.0 births per 1,000 women. Women in the age bracket of 20 to 34 years acount for 68.3% of all women with births.
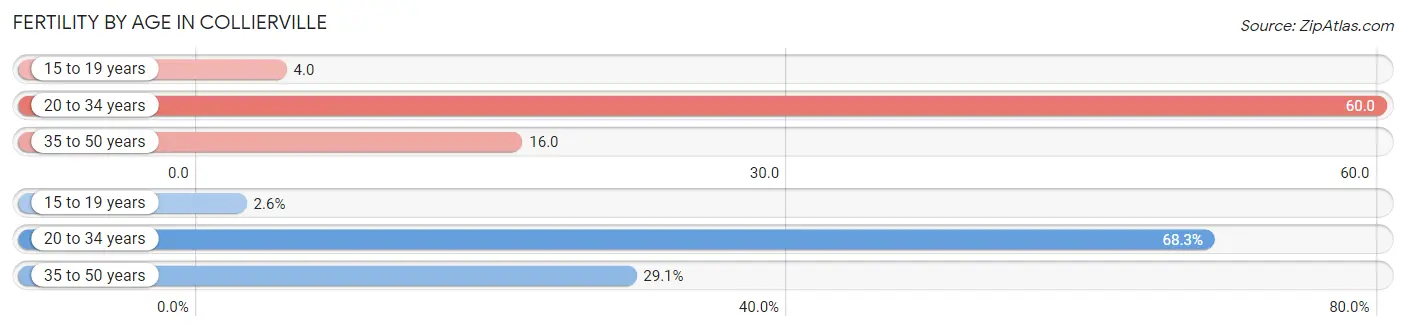
| Age Bracket | Women with Births | Births / 1,000 Women |
| 15 to 19 years | 9 (2.6%) | 4.0 |
| 20 to 34 years | 235 (68.3%) | 60.0 |
| 35 to 50 years | 100 (29.1%) | 16.0 |
| Total | 344 (100.0%) | 28.0 |
Fertility by Age by Marriage Status in Collierville
94.2% of women with births (344) in Collierville are married. The highest percentage of unmarried women with births falls into 15 to 19 years age bracket with 100.0% of them unmarried at the time of birth, while the lowest percentage of unmarried women with births belong to 20 to 34 years age bracket with 0.0% of them unmarried.
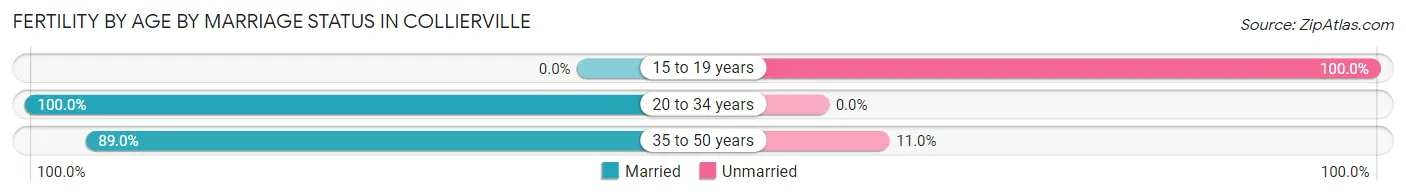
| Age Bracket | Married | Unmarried |
| 15 to 19 years | 0 (0.0%) | 9 (100.0%) |
| 20 to 34 years | 235 (100.0%) | 0 (0.0%) |
| 35 to 50 years | 89 (89.0%) | 11 (11.0%) |
| Total | 324 (94.2%) | 20 (5.8%) |
Fertility by Education in Collierville
Average fertility rate in Collierville is 28.0 births per 1,000 women. Women with the education attainment of bachelor's degree have the highest fertility rate of 49.0 births per 1,000 women, while women with the education attainment of less than high school have the lowest fertility at 5.0 births per 1,000 women. Women with the education attainment of bachelor's degree represent 61.1% of all women with births.
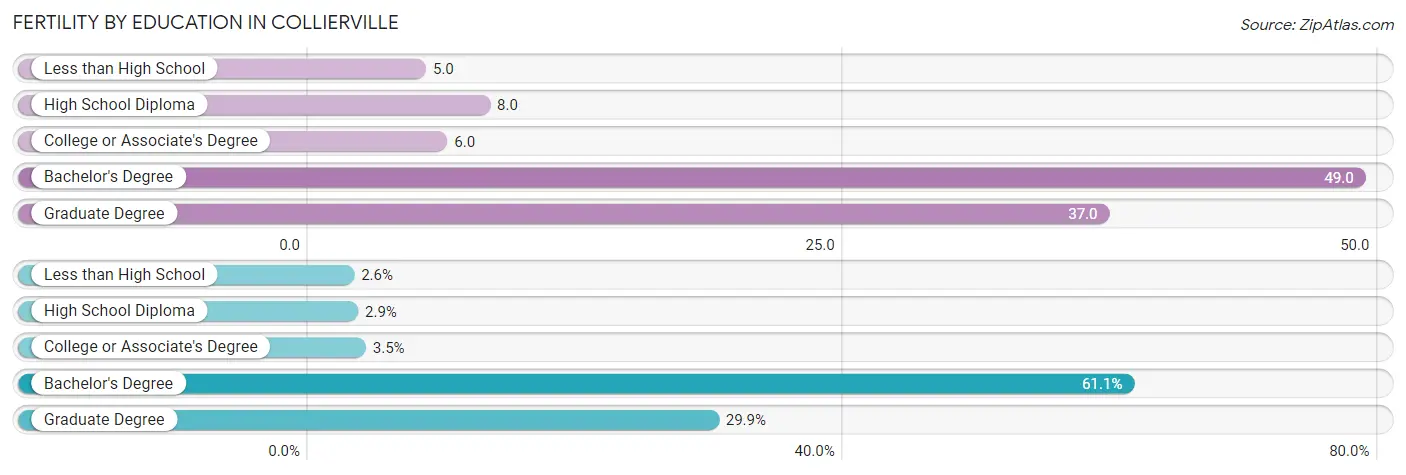
| Educational Attainment | Women with Births | Births / 1,000 Women |
| Less than High School | 9 (2.6%) | 5.0 |
| High School Diploma | 10 (2.9%) | 8.0 |
| College or Associate's Degree | 12 (3.5%) | 6.0 |
| Bachelor's Degree | 210 (61.1%) | 49.0 |
| Graduate Degree | 103 (29.9%) | 37.0 |
| Total | 344 (100.0%) | 28.0 |
Fertility by Education by Marriage Status in Collierville
5.8% of women with births in Collierville are unmarried. Women with the educational attainment of high school diploma are most likely to be married with 100.0% of them married at childbirth, while women with the educational attainment of less than high school are least likely to be married with 100.0% of them unmarried at childbirth.
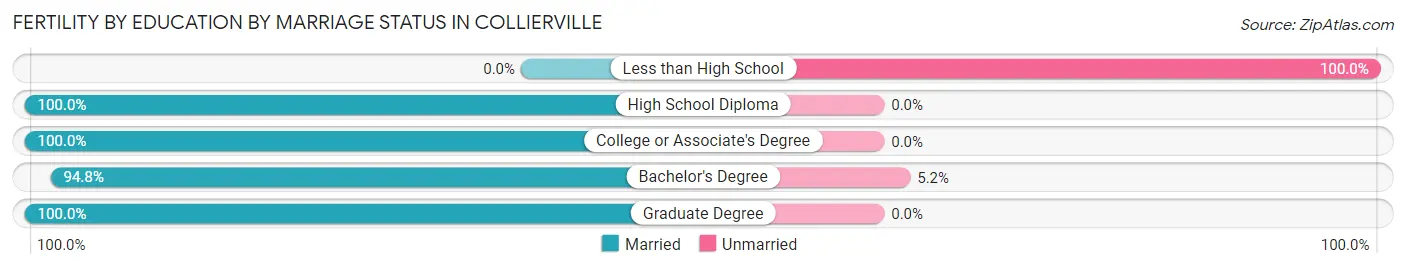
| Educational Attainment | Married | Unmarried |
| Less than High School | 0 (0.0%) | 9 (100.0%) |
| High School Diploma | 10 (100.0%) | 0 (0.0%) |
| College or Associate's Degree | 12 (100.0%) | 0 (0.0%) |
| Bachelor's Degree | 199 (94.8%) | 11 (5.2%) |
| Graduate Degree | 103 (100.0%) | 0 (0.0%) |
| Total | 324 (94.2%) | 20 (5.8%) |
Employment Characteristics in Collierville
Employment by Class of Employer in Collierville
Among the 25,222 employed individuals in Collierville, private company employees (18,172 | 72.1%), not-for-profit organizations (2,243 | 8.9%), and local government employees (1,774 | 7.0%) make up the most common classes of employment.
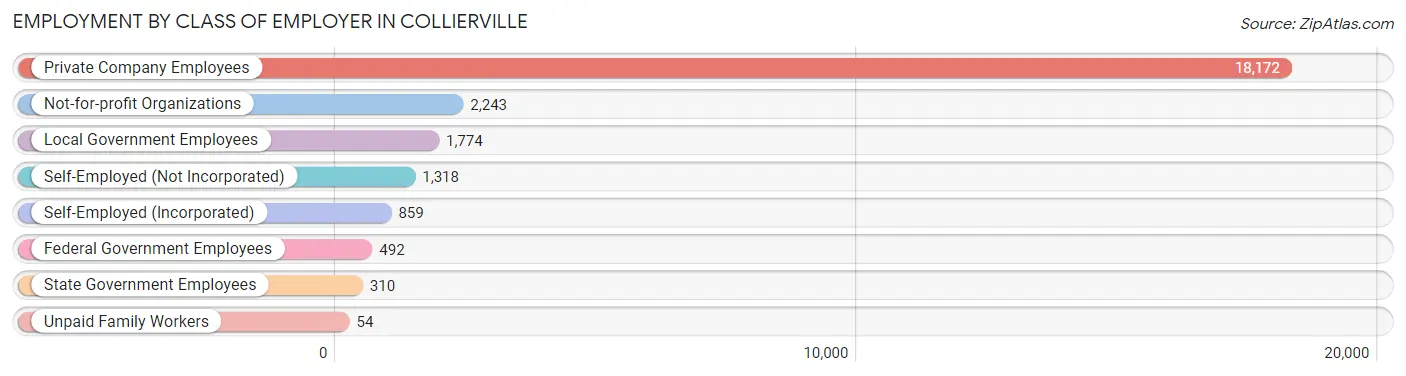
| Employer Class | # Employees | % Employees |
| Private Company Employees | 18,172 | 72.1% |
| Self-Employed (Incorporated) | 859 | 3.4% |
| Self-Employed (Not Incorporated) | 1,318 | 5.2% |
| Not-for-profit Organizations | 2,243 | 8.9% |
| Local Government Employees | 1,774 | 7.0% |
| State Government Employees | 310 | 1.2% |
| Federal Government Employees | 492 | 1.9% |
| Unpaid Family Workers | 54 | 0.2% |
| Total | 25,222 | 100.0% |
Employment Status by Age in Collierville
According to the labor force statistics for Collierville, out of the total population over 16 years of age (39,556), 66.6% or 26,344 individuals are in the labor force, with 2.6% or 685 of them unemployed. The age group with the highest labor force participation rate is 45 to 54 years, with 87.9% or 6,985 individuals in the labor force. Within the labor force, the 20 to 24 years age range has the highest percentage of unemployed individuals, with 10.5% or 161 of them being unemployed.
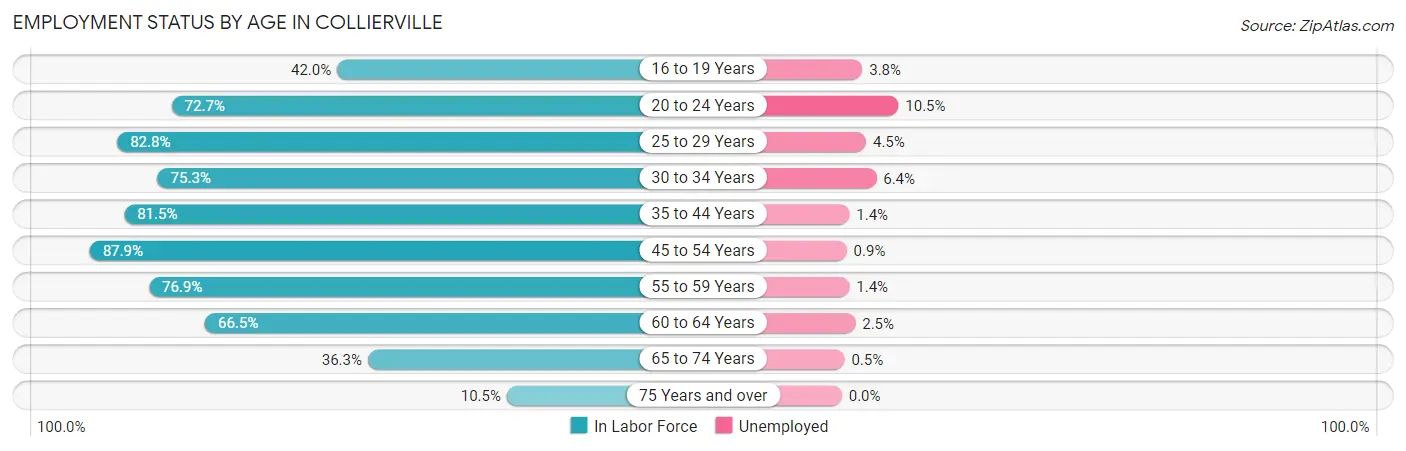
| Age Bracket | In Labor Force | Unemployed |
| 16 to 19 Years | 1,399 (42.0%) | 53 (3.8%) |
| 20 to 24 Years | 1,532 (72.7%) | 161 (10.5%) |
| 25 to 29 Years | 1,798 (82.8%) | 81 (4.5%) |
| 30 to 34 Years | 2,130 (75.3%) | 136 (6.4%) |
| 35 to 44 Years | 5,506 (81.5%) | 77 (1.4%) |
| 45 to 54 Years | 6,985 (87.9%) | 63 (0.9%) |
| 55 to 59 Years | 2,448 (76.9%) | 34 (1.4%) |
| 60 to 64 Years | 2,484 (66.5%) | 62 (2.5%) |
| 65 to 74 Years | 1,781 (36.3%) | 9 (0.5%) |
| 75 Years and over | 272 (10.5%) | 0 (0.0%) |
| Total | 26,344 (66.6%) | 685 (2.6%) |
Employment Status by Educational Attainment in Collierville
According to labor force statistics for Collierville, 80.2% of individuals (21,351) out of the total population between 25 and 64 years of age (26,622) are in the labor force, with 2.1% or 448 of them being unemployed. The group with the highest labor force participation rate are those with the educational attainment of bachelor's degree or higher, with 83.8% or 14,492 individuals in the labor force. Within the labor force, individuals with high school diploma education have the highest percentage of unemployment, with 4.0% or 79 of them being unemployed.
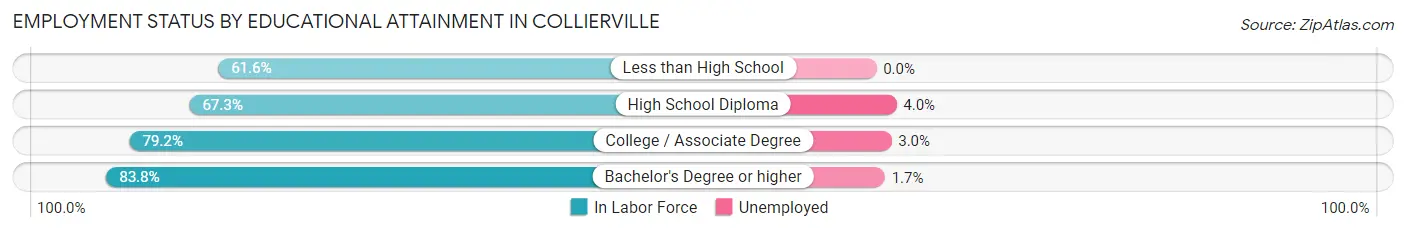
| Educational Attainment | In Labor Force | Unemployed |
| Less than High School | 620 (61.6%) | 0 (0.0%) |
| High School Diploma | 1,966 (67.3%) | 117 (4.0%) |
| College / Associate Degree | 4,277 (79.2%) | 162 (3.0%) |
| Bachelor's Degree or higher | 14,492 (83.8%) | 294 (1.7%) |
| Total | 21,351 (80.2%) | 559 (2.1%) |
Employment Occupations by Sex in Collierville
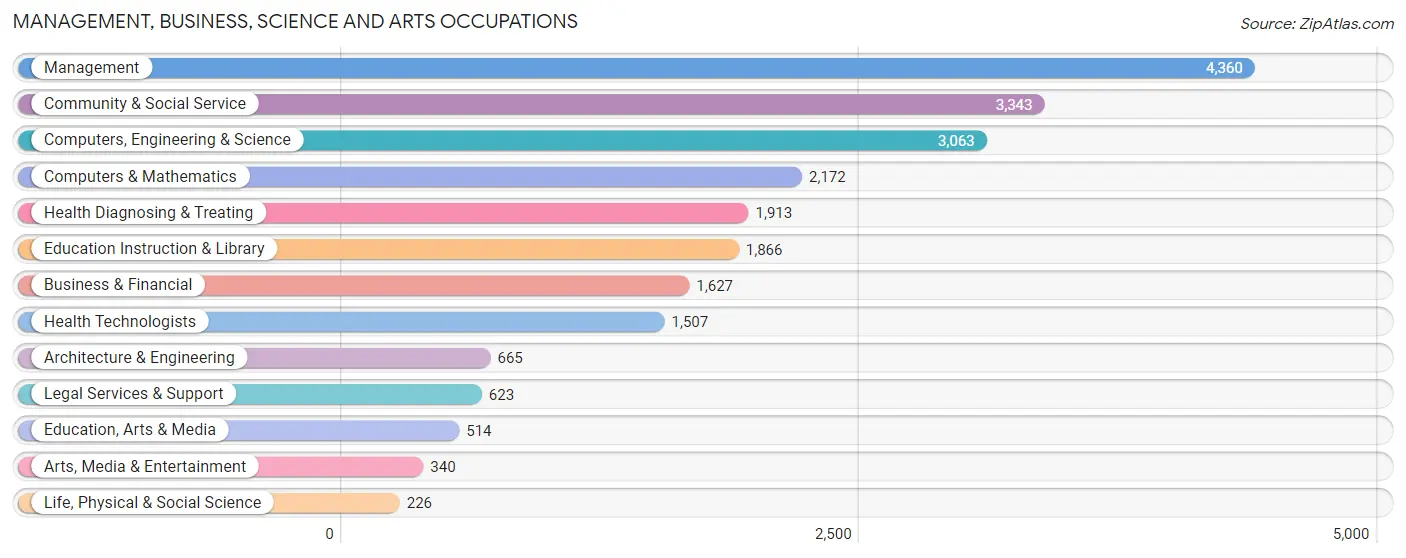
Management, Business, Science and Arts Occupations
The most common Management, Business, Science and Arts occupations in Collierville are Management (4,360 | 17.0%), Community & Social Service (3,343 | 13.1%), Computers, Engineering & Science (3,063 | 12.0%), Computers & Mathematics (2,172 | 8.5%), and Health Diagnosing & Treating (1,913 | 7.5%).
Management, Business, Science and Arts Occupations by Sex
Within the Management, Business, Science and Arts occupations in Collierville, the most male-oriented occupations are Life, Physical & Social Science (91.6%), Architecture & Engineering (85.0%), and Computers, Engineering & Science (78.9%), while the most female-oriented occupations are Health Diagnosing & Treating (75.7%), Health Technologists (75.3%), and Education Instruction & Library (72.0%).
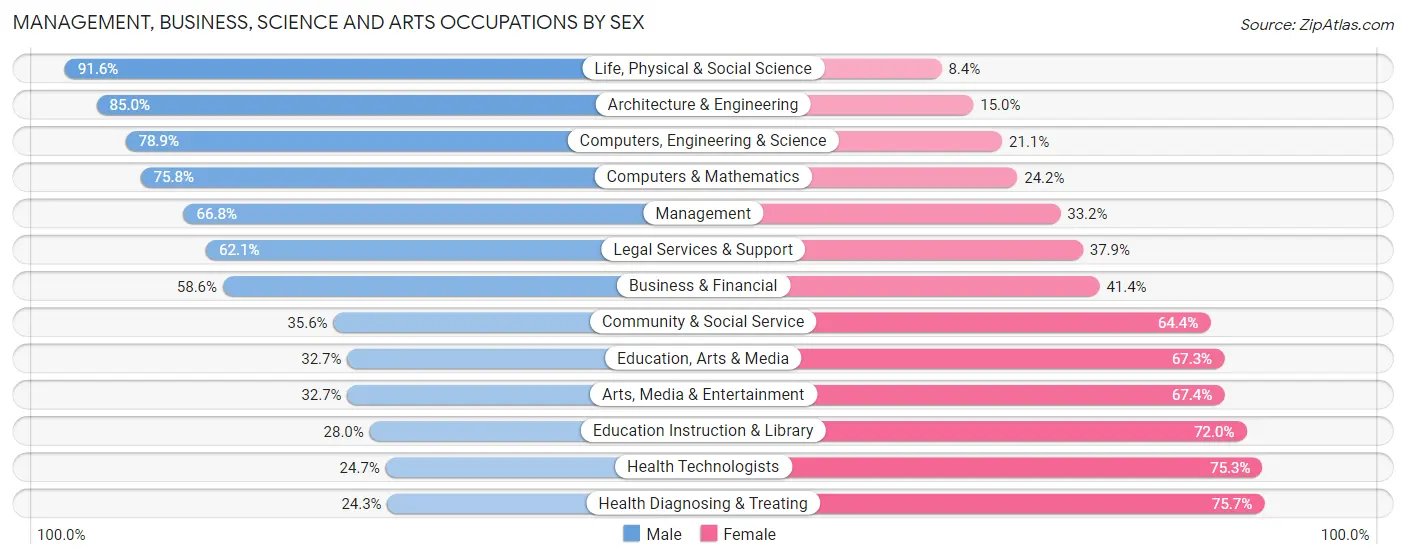
| Occupation | Male | Female |
| Management | 2,913 (66.8%) | 1,447 (33.2%) |
| Business & Financial | 954 (58.6%) | 673 (41.4%) |
| Computers, Engineering & Science | 2,418 (78.9%) | 645 (21.1%) |
| Computers & Mathematics | 1,646 (75.8%) | 526 (24.2%) |
| Architecture & Engineering | 565 (85.0%) | 100 (15.0%) |
| Life, Physical & Social Science | 207 (91.6%) | 19 (8.4%) |
| Community & Social Service | 1,189 (35.6%) | 2,154 (64.4%) |
| Education, Arts & Media | 168 (32.7%) | 346 (67.3%) |
| Legal Services & Support | 387 (62.1%) | 236 (37.9%) |
| Education Instruction & Library | 523 (28.0%) | 1,343 (72.0%) |
| Arts, Media & Entertainment | 111 (32.7%) | 229 (67.3%) |
| Health Diagnosing & Treating | 465 (24.3%) | 1,448 (75.7%) |
| Health Technologists | 372 (24.7%) | 1,135 (75.3%) |
| Total (Category) | 7,939 (55.5%) | 6,367 (44.5%) |
| Total (Overall) | 14,047 (54.9%) | 11,559 (45.1%) |
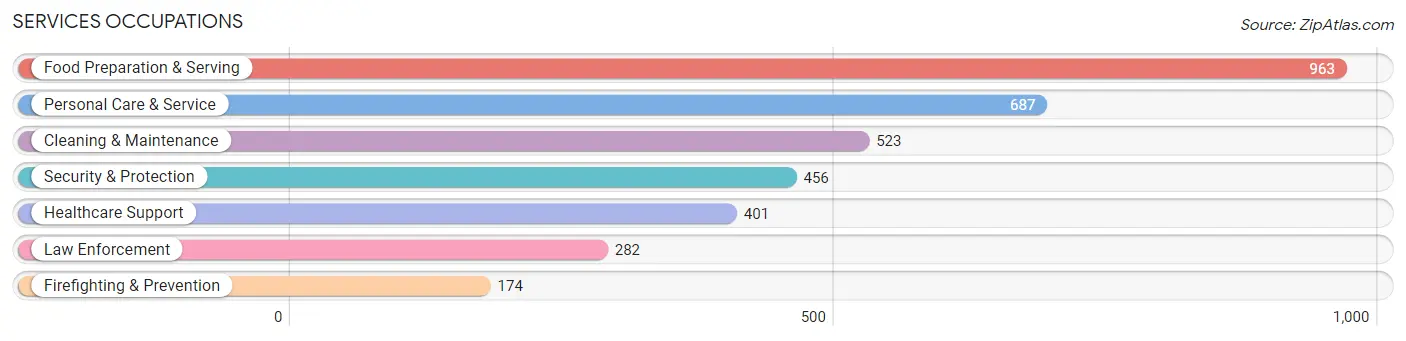
Services Occupations
The most common Services occupations in Collierville are Food Preparation & Serving (963 | 3.8%), Personal Care & Service (687 | 2.7%), Cleaning & Maintenance (523 | 2.0%), Security & Protection (456 | 1.8%), and Healthcare Support (401 | 1.6%).
Services Occupations by Sex
Within the Services occupations in Collierville, the most male-oriented occupations are Cleaning & Maintenance (90.8%), Firefighting & Prevention (87.4%), and Security & Protection (85.8%), while the most female-oriented occupations are Healthcare Support (94.8%), Personal Care & Service (79.2%), and Food Preparation & Serving (62.6%).
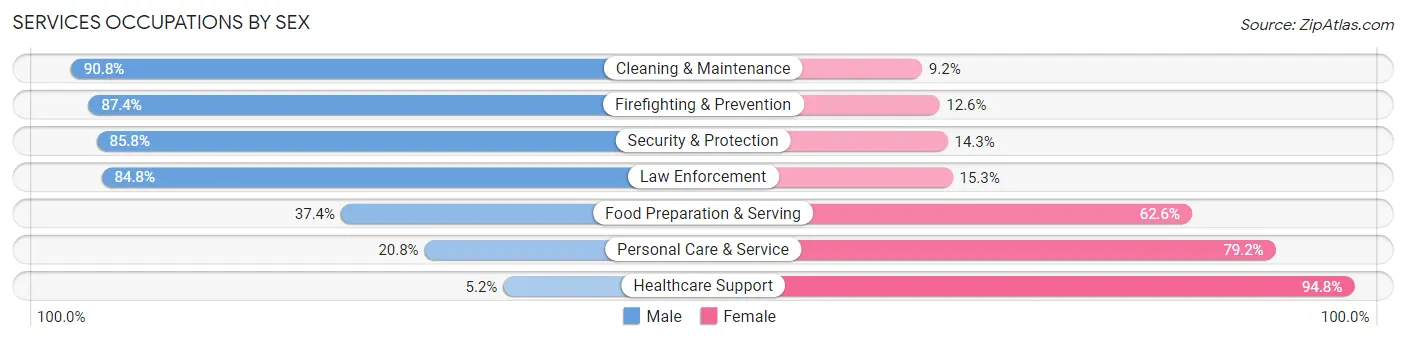
| Occupation | Male | Female |
| Healthcare Support | 21 (5.2%) | 380 (94.8%) |
| Security & Protection | 391 (85.8%) | 65 (14.2%) |
| Firefighting & Prevention | 152 (87.4%) | 22 (12.6%) |
| Law Enforcement | 239 (84.8%) | 43 (15.2%) |
| Food Preparation & Serving | 360 (37.4%) | 603 (62.6%) |
| Cleaning & Maintenance | 475 (90.8%) | 48 (9.2%) |
| Personal Care & Service | 143 (20.8%) | 544 (79.2%) |
| Total (Category) | 1,390 (45.9%) | 1,640 (54.1%) |
| Total (Overall) | 14,047 (54.9%) | 11,559 (45.1%) |
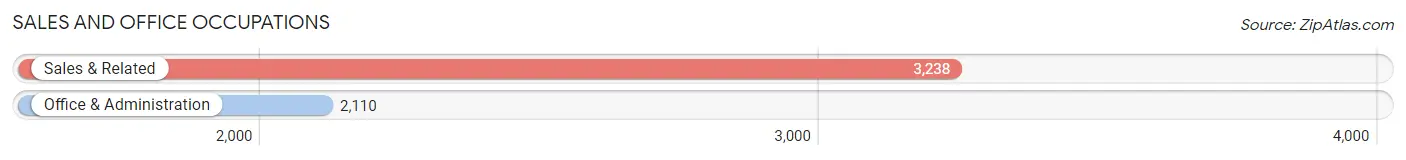
Sales and Office Occupations
The most common Sales and Office occupations in Collierville are Sales & Related (3,238 | 12.7%), and Office & Administration (2,110 | 8.2%).
Sales and Office Occupations by Sex
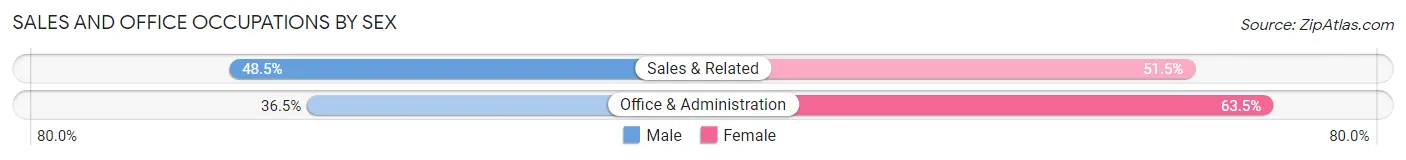
| Occupation | Male | Female |
| Sales & Related | 1,571 (48.5%) | 1,667 (51.5%) |
| Office & Administration | 771 (36.5%) | 1,339 (63.5%) |
| Total (Category) | 2,342 (43.8%) | 3,006 (56.2%) |
| Total (Overall) | 14,047 (54.9%) | 11,559 (45.1%) |
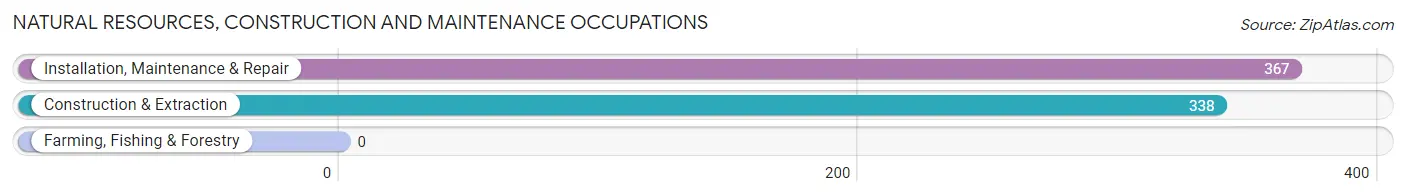
Natural Resources, Construction and Maintenance Occupations
The most common Natural Resources, Construction and Maintenance occupations in Collierville are Installation, Maintenance & Repair (367 | 1.4%), and Construction & Extraction (338 | 1.3%).
Natural Resources, Construction and Maintenance Occupations by Sex
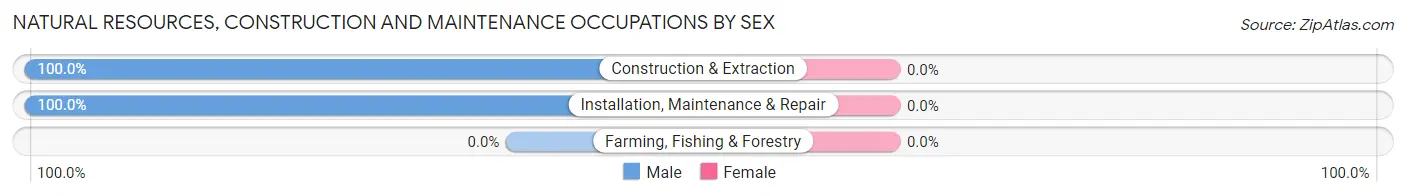
| Occupation | Male | Female |
| Farming, Fishing & Forestry | 0 (0.0%) | 0 (0.0%) |
| Construction & Extraction | 338 (100.0%) | 0 (0.0%) |
| Installation, Maintenance & Repair | 367 (100.0%) | 0 (0.0%) |
| Total (Category) | 705 (100.0%) | 0 (0.0%) |
| Total (Overall) | 14,047 (54.9%) | 11,559 (45.1%) |
Production, Transportation and Moving Occupations
The most common Production, Transportation and Moving occupations in Collierville are Transportation (868 | 3.4%), Production (682 | 2.7%), and Material Moving (667 | 2.6%).
Production, Transportation and Moving Occupations by Sex
| Occupation | Male | Female |
| Production | 494 (72.4%) | 188 (27.6%) |
| Transportation | 792 (91.2%) | 76 (8.8%) |
| Material Moving | 385 (57.7%) | 282 (42.3%) |
| Total (Category) | 1,671 (75.4%) | 546 (24.6%) |
| Total (Overall) | 14,047 (54.9%) | 11,559 (45.1%) |
Employment Industries by Sex in Collierville
Employment Industries in Collierville
The major employment industries in Collierville include Transportation & Warehousing (3,792 | 14.8%), Health Care & Social Assistance (3,424 | 13.4%), Manufacturing (2,969 | 11.6%), Retail Trade (2,401 | 9.4%), and Educational Services (2,060 | 8.0%).
Employment Industries by Sex in Collierville
The Collierville industries that see more men than women are Mining, Quarrying, & Extraction (100.0%), Utilities (100.0%), and Construction (85.1%), whereas the industries that tend to have a higher number of women are Health Care & Social Assistance (78.6%), Educational Services (68.2%), and Real Estate, Rental & Leasing (60.3%).
| Industry | Male | Female |
| Agriculture, Fishing & Hunting | 67 (67.0%) | 33 (33.0%) |
| Mining, Quarrying, & Extraction | 20 (100.0%) | 0 (0.0%) |
| Construction | 683 (85.1%) | 120 (14.9%) |
| Manufacturing | 2,114 (71.2%) | 855 (28.8%) |
| Wholesale Trade | 623 (74.5%) | 213 (25.5%) |
| Retail Trade | 1,128 (47.0%) | 1,273 (53.0%) |
| Transportation & Warehousing | 2,837 (74.8%) | 955 (25.2%) |
| Utilities | 139 (100.0%) | 0 (0.0%) |
| Information | 169 (62.6%) | 101 (37.4%) |
| Finance & Insurance | 756 (61.6%) | 472 (38.4%) |
| Real Estate, Rental & Leasing | 196 (39.7%) | 298 (60.3%) |
| Professional & Scientific | 1,092 (64.7%) | 595 (35.3%) |
| Enterprise Management | 53 (76.8%) | 16 (23.2%) |
| Administrative & Support | 525 (63.7%) | 299 (36.3%) |
| Educational Services | 656 (31.8%) | 1,404 (68.2%) |
| Health Care & Social Assistance | 734 (21.4%) | 2,690 (78.6%) |
| Arts, Entertainment & Recreation | 241 (60.0%) | 161 (40.1%) |
| Accommodation & Food Services | 768 (43.0%) | 1,018 (57.0%) |
| Public Administration | 545 (67.1%) | 267 (32.9%) |
| Total | 14,047 (54.9%) | 11,559 (45.1%) |
Education in Collierville
School Enrollment in Collierville
The most common levels of schooling among the 14,454 students in Collierville are middle school (3,881 | 26.9%), high school (3,562 | 24.6%), and elementary school (3,088 | 21.4%).
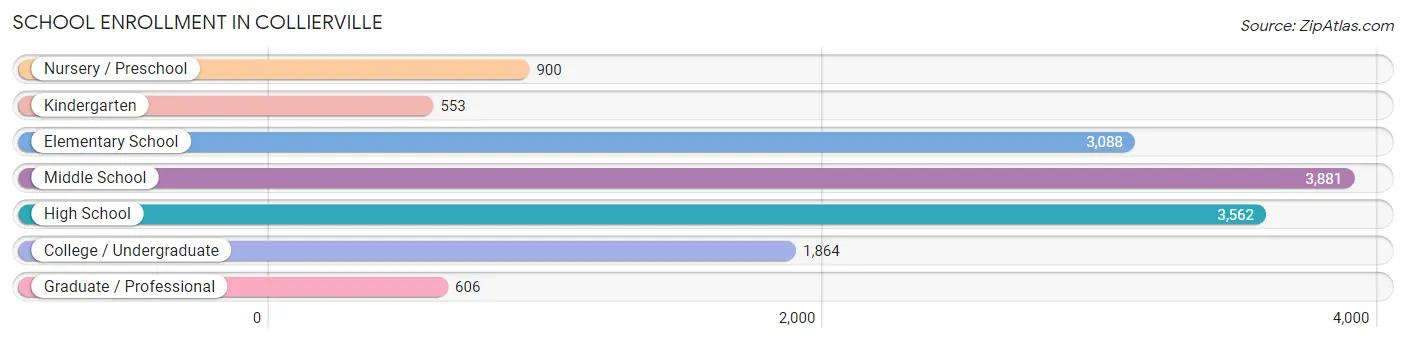
| School Level | # Students | % Students |
| Nursery / Preschool | 900 | 6.2% |
| Kindergarten | 553 | 3.8% |
| Elementary School | 3,088 | 21.4% |
| Middle School | 3,881 | 26.9% |
| High School | 3,562 | 24.6% |
| College / Undergraduate | 1,864 | 12.9% |
| Graduate / Professional | 606 | 4.2% |
| Total | 14,454 | 100.0% |
School Enrollment by Age by Funding Source in Collierville
Out of a total of 14,454 students who are enrolled in schools in Collierville, 3,527 (24.4%) attend a private institution, while the remaining 10,927 (75.6%) are enrolled in public schools. The age group of 3 to 4 year olds has the highest likelihood of being enrolled in private schools, with 495 (73.1% in the age bracket) enrolled. Conversely, the age group of 10 to 14 year olds has the lowest likelihood of being enrolled in a private school, with 3,759 (82.2% in the age bracket) attending a public institution.
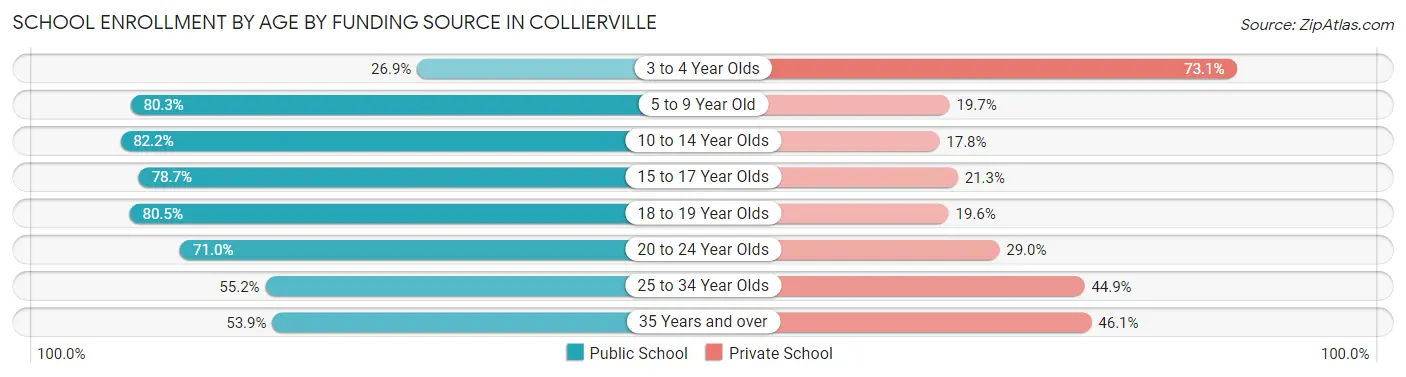
| Age Bracket | Public School | Private School |
| 3 to 4 Year Olds | 182 (26.9%) | 495 (73.1%) |
| 5 to 9 Year Old | 2,776 (80.3%) | 682 (19.7%) |
| 10 to 14 Year Olds | 3,759 (82.2%) | 815 (17.8%) |
| 15 to 17 Year Olds | 2,092 (78.7%) | 565 (21.3%) |
| 18 to 19 Year Olds | 893 (80.4%) | 217 (19.6%) |
| 20 to 24 Year Olds | 625 (71.0%) | 255 (29.0%) |
| 25 to 34 Year Olds | 284 (55.1%) | 231 (44.9%) |
| 35 Years and over | 314 (53.9%) | 269 (46.1%) |
| Total | 10,927 (75.6%) | 3,527 (24.4%) |
Educational Attainment by Field of Study in Collierville
Business (5,723 | 26.0%), education (2,946 | 13.4%), engineering (2,597 | 11.8%), science & technology (2,076 | 9.4%), and arts & humanities (1,229 | 5.6%) are the most common fields of study among 22,040 individuals in Collierville who have obtained a bachelor's degree or higher.
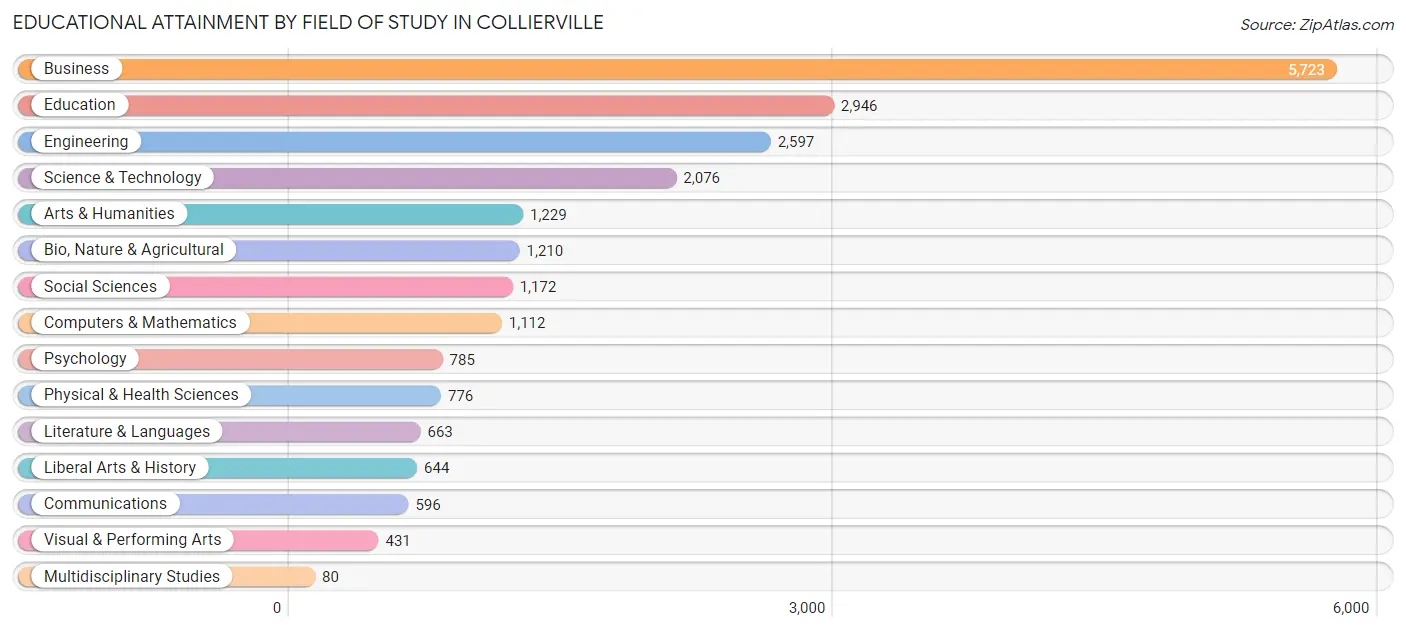
| Field of Study | # Graduates | % Graduates |
| Computers & Mathematics | 1,112 | 5.1% |
| Bio, Nature & Agricultural | 1,210 | 5.5% |
| Physical & Health Sciences | 776 | 3.5% |
| Psychology | 785 | 3.6% |
| Social Sciences | 1,172 | 5.3% |
| Engineering | 2,597 | 11.8% |
| Multidisciplinary Studies | 80 | 0.4% |
| Science & Technology | 2,076 | 9.4% |
| Business | 5,723 | 26.0% |
| Education | 2,946 | 13.4% |
| Literature & Languages | 663 | 3.0% |
| Liberal Arts & History | 644 | 2.9% |
| Visual & Performing Arts | 431 | 2.0% |
| Communications | 596 | 2.7% |
| Arts & Humanities | 1,229 | 5.6% |
| Total | 22,040 | 100.0% |
Transportation & Commute in Collierville
Vehicle Availability by Sex in Collierville
The most prevalent vehicle ownership categories in Collierville are males with 2 vehicles (6,446, accounting for 46.2%) and females with 2 vehicles (5,141, making up 57.2%).
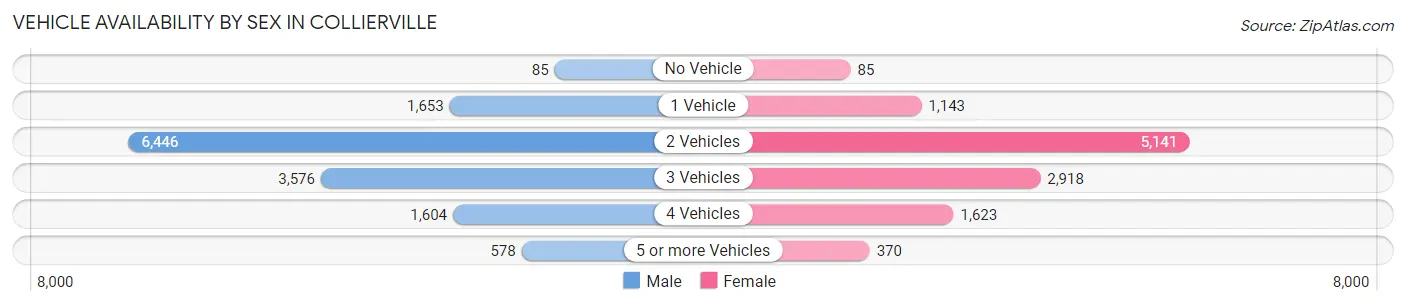
| Vehicles Available | Male | Female |
| No Vehicle | 85 (0.6%) | 85 (0.7%) |
| 1 Vehicle | 1,653 (11.9%) | 1,143 (10.1%) |
| 2 Vehicles | 6,446 (46.2%) | 5,141 (45.6%) |
| 3 Vehicles | 3,576 (25.7%) | 2,918 (25.9%) |
| 4 Vehicles | 1,604 (11.5%) | 1,623 (14.4%) |
| 5 or more Vehicles | 578 (4.2%) | 370 (3.3%) |
| Total | 13,942 (100.0%) | 11,280 (100.0%) |
Commute Time in Collierville
The most frequently occuring commute durations in Collierville are 30 to 34 minutes (4,407 commuters, 20.5%), 10 to 14 minutes (2,913 commuters, 13.6%), and 20 to 24 minutes (2,790 commuters, 13.0%).
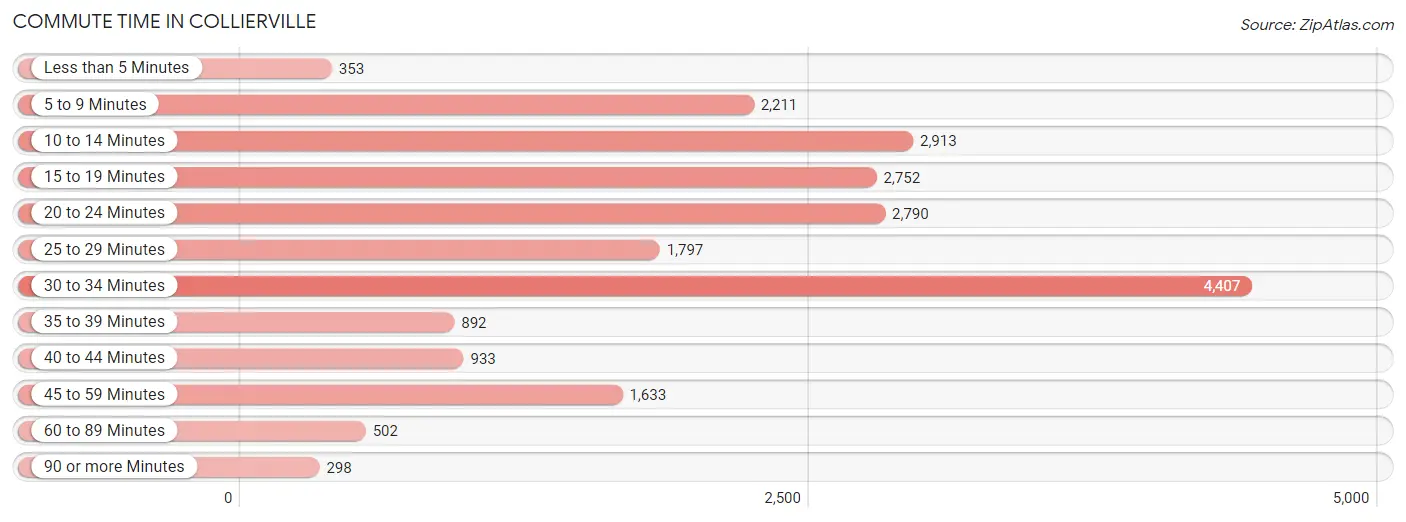
| Commute Time | # Commuters | % Commuters |
| Less than 5 Minutes | 353 | 1.6% |
| 5 to 9 Minutes | 2,211 | 10.3% |
| 10 to 14 Minutes | 2,913 | 13.6% |
| 15 to 19 Minutes | 2,752 | 12.8% |
| 20 to 24 Minutes | 2,790 | 13.0% |
| 25 to 29 Minutes | 1,797 | 8.4% |
| 30 to 34 Minutes | 4,407 | 20.5% |
| 35 to 39 Minutes | 892 | 4.2% |
| 40 to 44 Minutes | 933 | 4.3% |
| 45 to 59 Minutes | 1,633 | 7.6% |
| 60 to 89 Minutes | 502 | 2.3% |
| 90 or more Minutes | 298 | 1.4% |
Commute Time by Sex in Collierville
The most common commute times in Collierville are 30 to 34 minutes (2,642 commuters, 22.6%) for males and 10 to 14 minutes (1,782 commuters, 18.2%) for females.
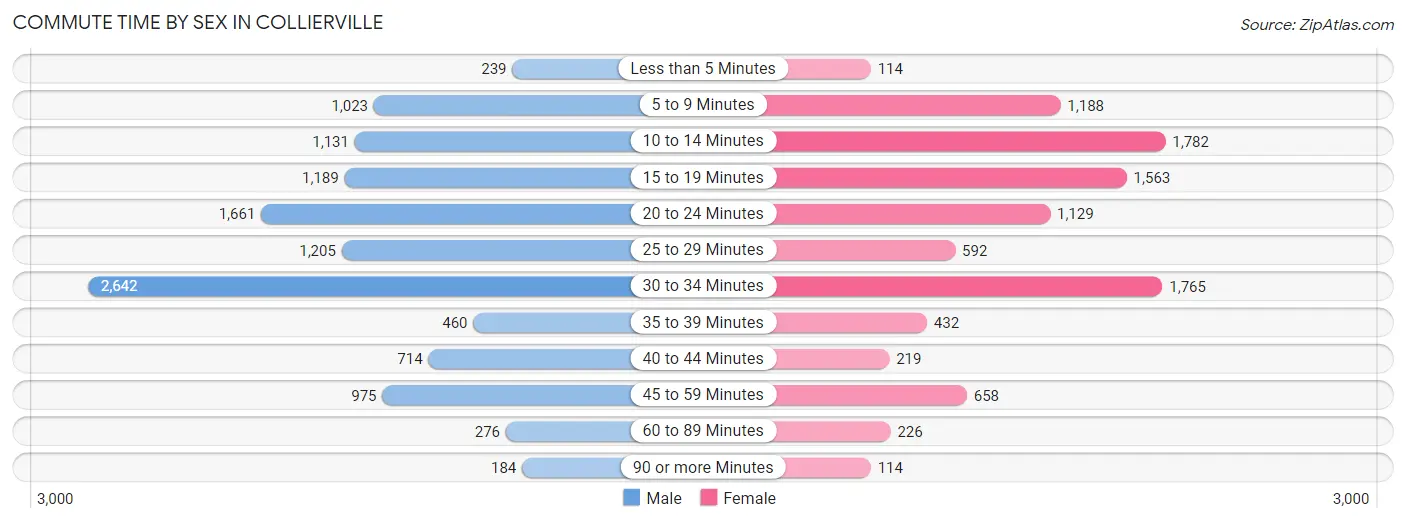
| Commute Time | Male | Female |
| Less than 5 Minutes | 239 (2.0%) | 114 (1.2%) |
| 5 to 9 Minutes | 1,023 (8.7%) | 1,188 (12.1%) |
| 10 to 14 Minutes | 1,131 (9.7%) | 1,782 (18.2%) |
| 15 to 19 Minutes | 1,189 (10.2%) | 1,563 (16.0%) |
| 20 to 24 Minutes | 1,661 (14.2%) | 1,129 (11.5%) |
| 25 to 29 Minutes | 1,205 (10.3%) | 592 (6.0%) |
| 30 to 34 Minutes | 2,642 (22.6%) | 1,765 (18.0%) |
| 35 to 39 Minutes | 460 (3.9%) | 432 (4.4%) |
| 40 to 44 Minutes | 714 (6.1%) | 219 (2.2%) |
| 45 to 59 Minutes | 975 (8.3%) | 658 (6.7%) |
| 60 to 89 Minutes | 276 (2.4%) | 226 (2.3%) |
| 90 or more Minutes | 184 (1.6%) | 114 (1.2%) |
Time of Departure to Work by Sex in Collierville
The most frequent times of departure to work in Collierville are 7:00 AM to 7:29 AM (2,107, 18.0%) for males and 8:00 AM to 8:29 AM (1,963, 20.1%) for females.
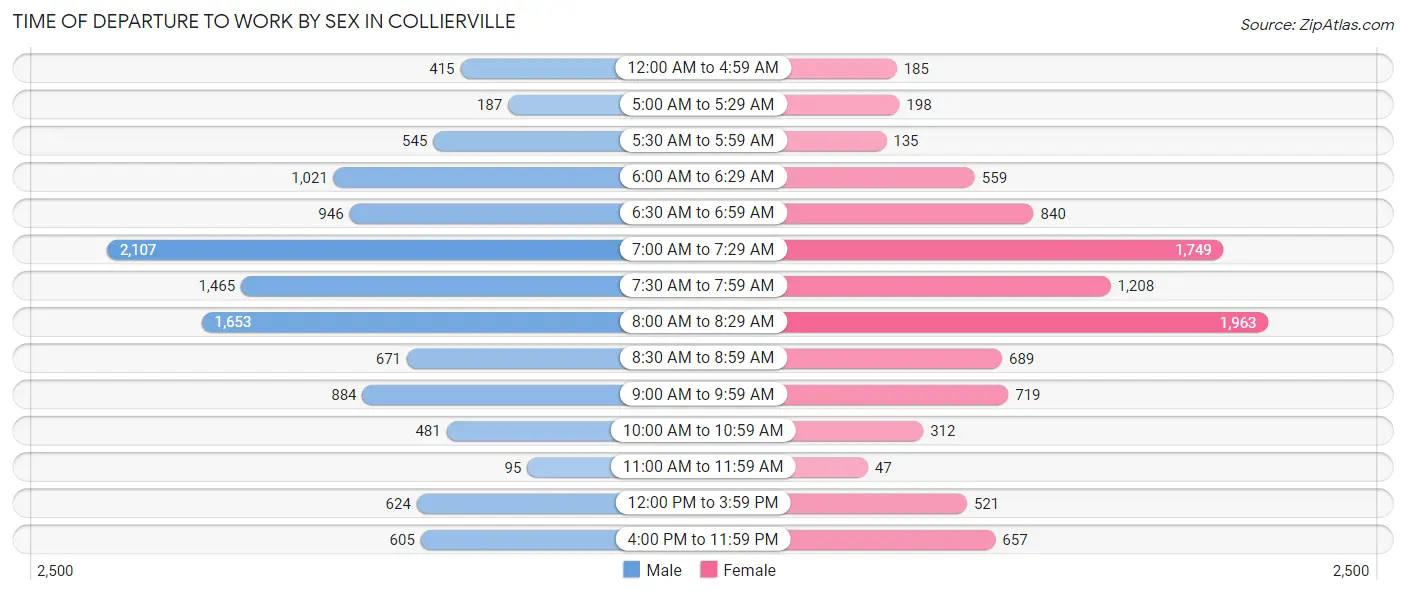
| Time of Departure | Male | Female |
| 12:00 AM to 4:59 AM | 415 (3.5%) | 185 (1.9%) |
| 5:00 AM to 5:29 AM | 187 (1.6%) | 198 (2.0%) |
| 5:30 AM to 5:59 AM | 545 (4.7%) | 135 (1.4%) |
| 6:00 AM to 6:29 AM | 1,021 (8.7%) | 559 (5.7%) |
| 6:30 AM to 6:59 AM | 946 (8.1%) | 840 (8.6%) |
| 7:00 AM to 7:29 AM | 2,107 (18.0%) | 1,749 (17.9%) |
| 7:30 AM to 7:59 AM | 1,465 (12.5%) | 1,208 (12.3%) |
| 8:00 AM to 8:29 AM | 1,653 (14.1%) | 1,963 (20.1%) |
| 8:30 AM to 8:59 AM | 671 (5.7%) | 689 (7.0%) |
| 9:00 AM to 9:59 AM | 884 (7.6%) | 719 (7.3%) |
| 10:00 AM to 10:59 AM | 481 (4.1%) | 312 (3.2%) |
| 11:00 AM to 11:59 AM | 95 (0.8%) | 47 (0.5%) |
| 12:00 PM to 3:59 PM | 624 (5.3%) | 521 (5.3%) |
| 4:00 PM to 11:59 PM | 605 (5.2%) | 657 (6.7%) |
| Total | 11,699 (100.0%) | 9,782 (100.0%) |
Housing Occupancy in Collierville
Occupancy by Ownership in Collierville
Of the total 17,755 dwellings in Collierville, owner-occupied units account for 14,293 (80.5%), while renter-occupied units make up 3,462 (19.5%).
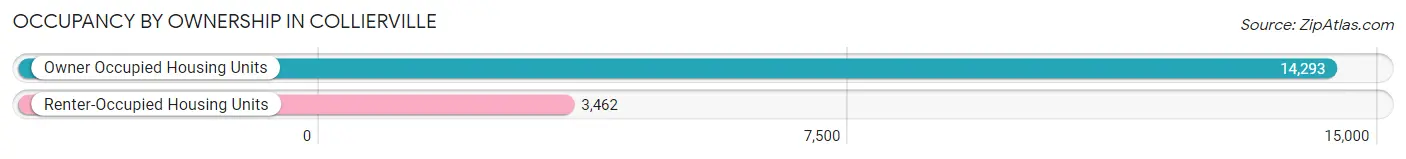
| Occupancy | # Housing Units | % Housing Units |
| Owner Occupied Housing Units | 14,293 | 80.5% |
| Renter-Occupied Housing Units | 3,462 | 19.5% |
| Total Occupied Housing Units | 17,755 | 100.0% |
Occupancy by Household Size in Collierville
| Household Size | # Housing Units | % Housing Units |
| 1-Person Household | 3,179 | 17.9% |
| 2-Person Household | 6,159 | 34.7% |
| 3-Person Household | 2,977 | 16.8% |
| 4+ Person Household | 5,440 | 30.6% |
| Total Housing Units | 17,755 | 100.0% |
Occupancy by Ownership by Household Size in Collierville
| Household Size | Owner-occupied | Renter-occupied |
| 1-Person Household | 2,118 (66.6%) | 1,061 (33.4%) |
| 2-Person Household | 5,173 (84.0%) | 986 (16.0%) |
| 3-Person Household | 2,322 (78.0%) | 655 (22.0%) |
| 4+ Person Household | 4,680 (86.0%) | 760 (14.0%) |
| Total Housing Units | 14,293 (80.5%) | 3,462 (19.5%) |
Occupancy by Educational Attainment in Collierville
| Household Size | Owner-occupied | Renter-occupied |
| Less than High School | 285 (42.9%) | 380 (57.1%) |
| High School Diploma | 1,410 (69.3%) | 626 (30.7%) |
| College/Associate Degree | 3,228 (79.6%) | 828 (20.4%) |
| Bachelor's Degree or higher | 9,370 (85.2%) | 1,628 (14.8%) |
Occupancy by Age of Householder in Collierville
| Age Bracket | # Households | % Households |
| Under 35 Years | 1,809 | 10.2% |
| 35 to 44 Years | 3,321 | 18.7% |
| 45 to 54 Years | 4,317 | 24.3% |
| 55 to 64 Years | 3,859 | 21.7% |
| 65 to 74 Years | 2,755 | 15.5% |
| 75 to 84 Years | 1,068 | 6.0% |
| 85 Years and Over | 626 | 3.5% |
| Total | 17,755 | 100.0% |
Housing Finances in Collierville
Median Income by Occupancy in Collierville
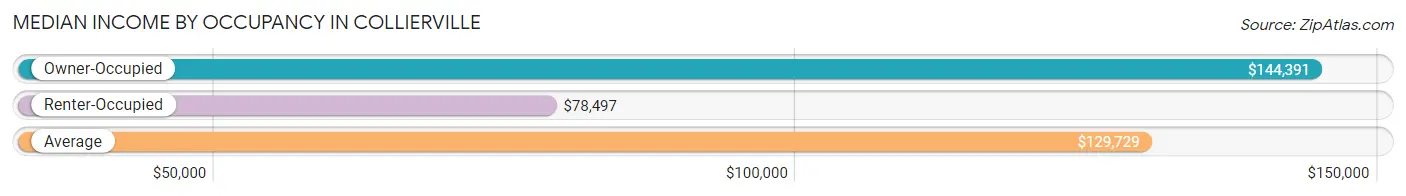
| Occupancy Type | # Households | Median Income |
| Owner-Occupied | 14,293 (80.5%) | $144,391 |
| Renter-Occupied | 3,462 (19.5%) | $78,497 |
| Average | 17,755 (100.0%) | $129,729 |
Occupancy by Householder Income Bracket in Collierville
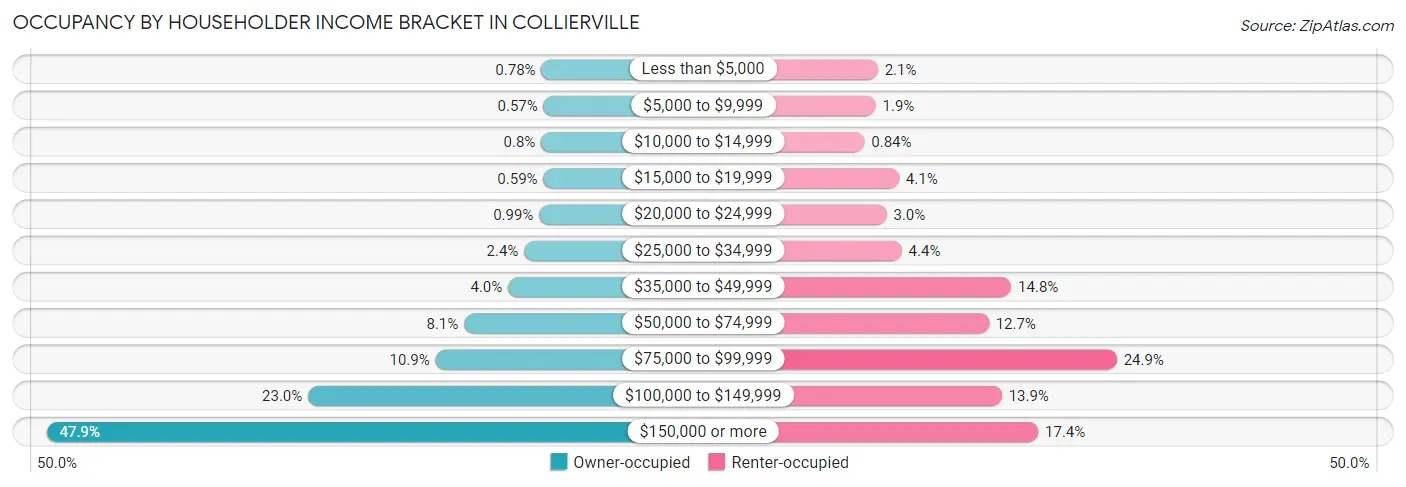
| Income Bracket | Owner-occupied | Renter-occupied |
| Less than $5,000 | 112 (0.8%) | 73 (2.1%) |
| $5,000 to $9,999 | 82 (0.6%) | 66 (1.9%) |
| $10,000 to $14,999 | 114 (0.8%) | 29 (0.8%) |
| $15,000 to $19,999 | 85 (0.6%) | 143 (4.1%) |
| $20,000 to $24,999 | 141 (1.0%) | 102 (2.9%) |
| $25,000 to $34,999 | 346 (2.4%) | 152 (4.4%) |
| $35,000 to $49,999 | 564 (4.0%) | 513 (14.8%) |
| $50,000 to $74,999 | 1,164 (8.1%) | 439 (12.7%) |
| $75,000 to $99,999 | 1,552 (10.9%) | 861 (24.9%) |
| $100,000 to $149,999 | 3,287 (23.0%) | 482 (13.9%) |
| $150,000 or more | 6,846 (47.9%) | 602 (17.4%) |
| Total | 14,293 (100.0%) | 3,462 (100.0%) |
Monthly Housing Cost Tiers in Collierville
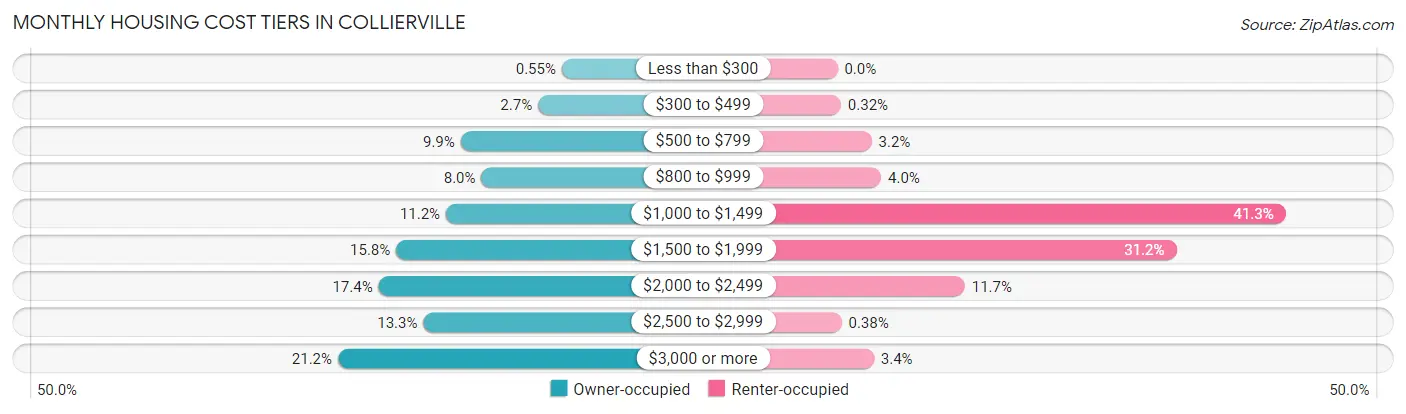
| Monthly Cost | Owner-occupied | Renter-occupied |
| Less than $300 | 79 (0.5%) | 0 (0.0%) |
| $300 to $499 | 392 (2.7%) | 11 (0.3%) |
| $500 to $799 | 1,410 (9.9%) | 109 (3.2%) |
| $800 to $999 | 1,137 (8.0%) | 139 (4.0%) |
| $1,000 to $1,499 | 1,602 (11.2%) | 1,428 (41.2%) |
| $1,500 to $1,999 | 2,258 (15.8%) | 1,080 (31.2%) |
| $2,000 to $2,499 | 2,490 (17.4%) | 406 (11.7%) |
| $2,500 to $2,999 | 1,901 (13.3%) | 13 (0.4%) |
| $3,000 or more | 3,024 (21.2%) | 116 (3.4%) |
| Total | 14,293 (100.0%) | 3,462 (100.0%) |
Physical Housing Characteristics in Collierville
Housing Structures in Collierville
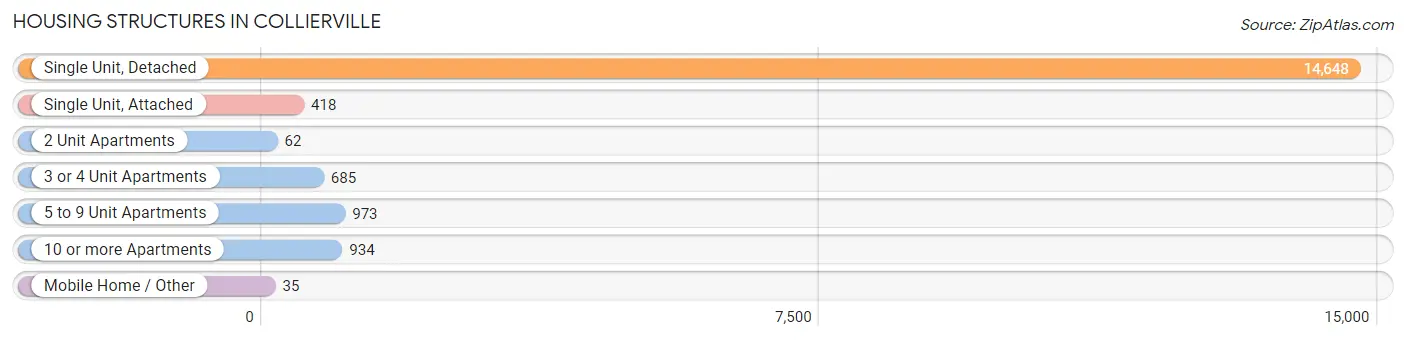
| Structure Type | # Housing Units | % Housing Units |
| Single Unit, Detached | 14,648 | 82.5% |
| Single Unit, Attached | 418 | 2.4% |
| 2 Unit Apartments | 62 | 0.4% |
| 3 or 4 Unit Apartments | 685 | 3.9% |
| 5 to 9 Unit Apartments | 973 | 5.5% |
| 10 or more Apartments | 934 | 5.3% |
| Mobile Home / Other | 35 | 0.2% |
| Total | 17,755 | 100.0% |
Housing Structures by Occupancy in Collierville
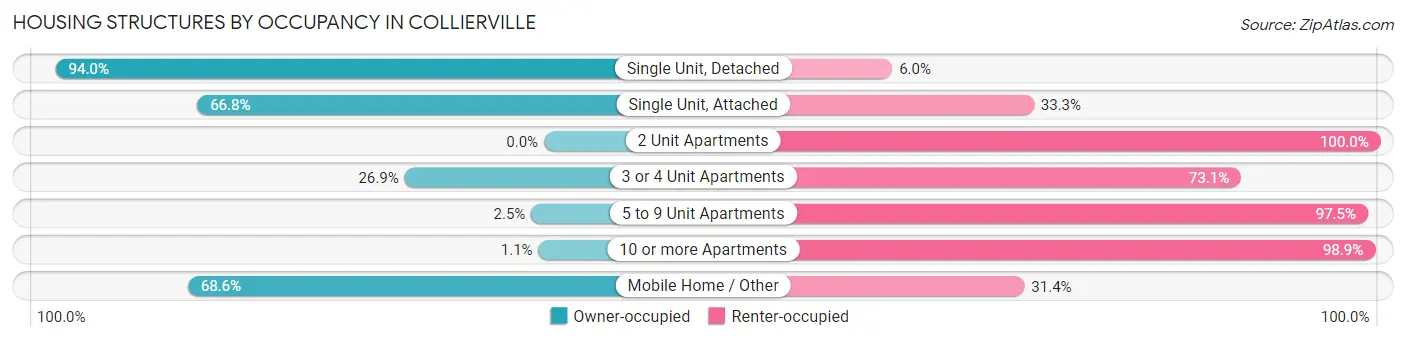
| Structure Type | Owner-occupied | Renter-occupied |
| Single Unit, Detached | 13,772 (94.0%) | 876 (6.0%) |
| Single Unit, Attached | 279 (66.7%) | 139 (33.3%) |
| 2 Unit Apartments | 0 (0.0%) | 62 (100.0%) |
| 3 or 4 Unit Apartments | 184 (26.9%) | 501 (73.1%) |
| 5 to 9 Unit Apartments | 24 (2.5%) | 949 (97.5%) |
| 10 or more Apartments | 10 (1.1%) | 924 (98.9%) |
| Mobile Home / Other | 24 (68.6%) | 11 (31.4%) |
| Total | 14,293 (80.5%) | 3,462 (19.5%) |
Housing Structures by Number of Rooms in Collierville
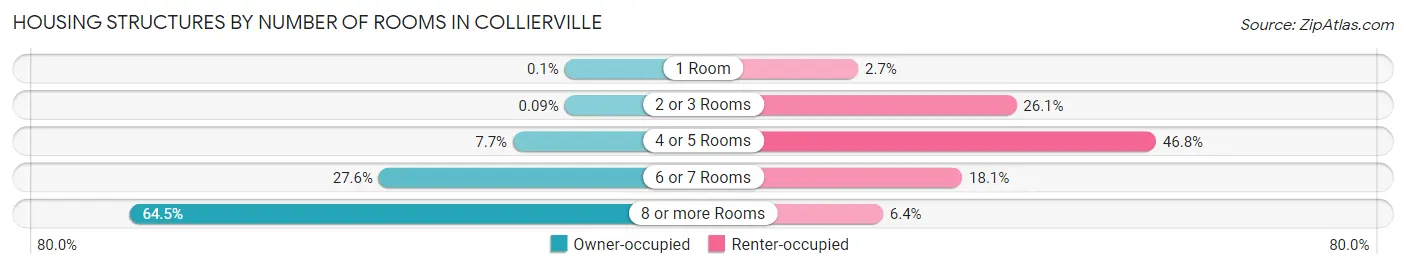
| Number of Rooms | Owner-occupied | Renter-occupied |
| 1 Room | 15 (0.1%) | 93 (2.7%) |
| 2 or 3 Rooms | 13 (0.1%) | 904 (26.1%) |
| 4 or 5 Rooms | 1,106 (7.7%) | 1,619 (46.8%) |
| 6 or 7 Rooms | 3,944 (27.6%) | 626 (18.1%) |
| 8 or more Rooms | 9,215 (64.5%) | 220 (6.4%) |
| Total | 14,293 (100.0%) | 3,462 (100.0%) |
Housing Structure by Heating Type in Collierville
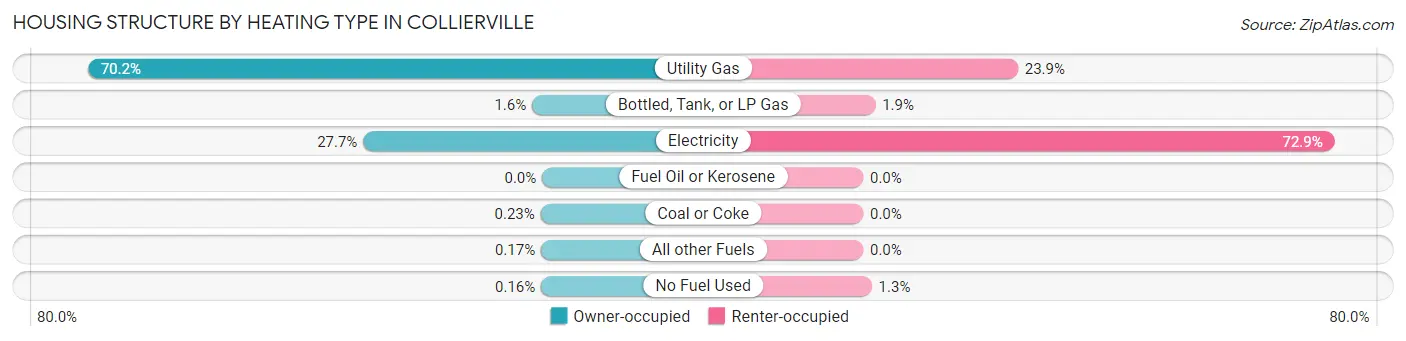
| Heating Type | Owner-occupied | Renter-occupied |
| Utility Gas | 10,039 (70.2%) | 828 (23.9%) |
| Bottled, Tank, or LP Gas | 221 (1.5%) | 65 (1.9%) |
| Electricity | 3,953 (27.7%) | 2,523 (72.9%) |
| Fuel Oil or Kerosene | 0 (0.0%) | 0 (0.0%) |
| Coal or Coke | 33 (0.2%) | 0 (0.0%) |
| All other Fuels | 24 (0.2%) | 0 (0.0%) |
| No Fuel Used | 23 (0.2%) | 46 (1.3%) |
| Total | 14,293 (100.0%) | 3,462 (100.0%) |
Household Vehicle Usage in Collierville
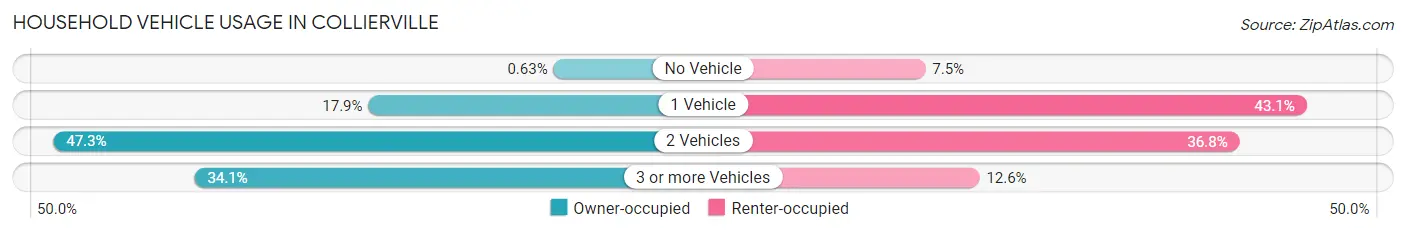
| Vehicles per Household | Owner-occupied | Renter-occupied |
| No Vehicle | 90 (0.6%) | 260 (7.5%) |
| 1 Vehicle | 2,560 (17.9%) | 1,492 (43.1%) |
| 2 Vehicles | 6,764 (47.3%) | 1,275 (36.8%) |
| 3 or more Vehicles | 4,879 (34.1%) | 435 (12.6%) |
| Total | 14,293 (100.0%) | 3,462 (100.0%) |
Real Estate & Mortgages in Collierville
Real Estate and Mortgage Overview in Collierville
| Characteristic | Without Mortgage | With Mortgage |
| Housing Units | 4,245 | 10,048 |
| Median Property Value | $386,700 | $419,200 |
| Median Household Income | $112,238 | $5,454 |
| Monthly Housing Costs | $874 | $2,990 |
| Real Estate Taxes | $4,417 | $105 |
Property Value by Mortgage Status in Collierville
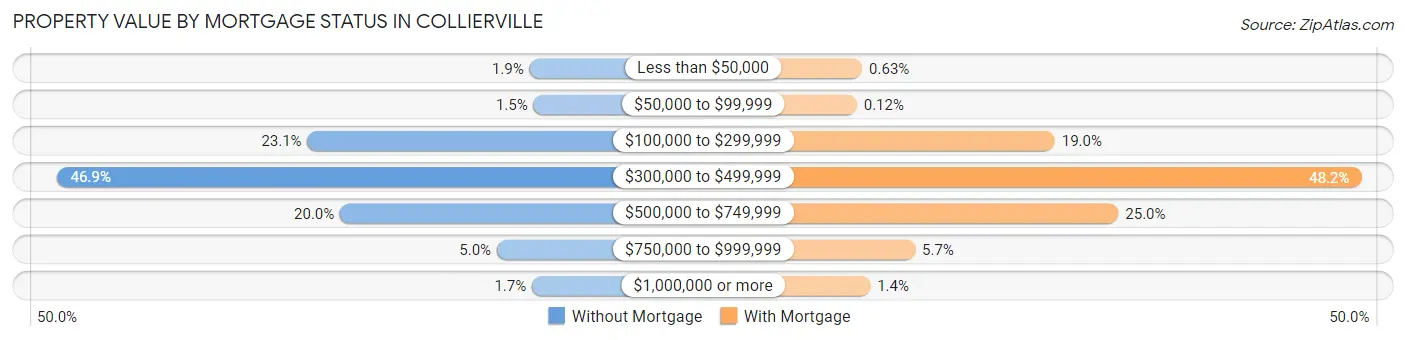
| Property Value | Without Mortgage | With Mortgage |
| Less than $50,000 | 81 (1.9%) | 63 (0.6%) |
| $50,000 to $99,999 | 65 (1.5%) | 12 (0.1%) |
| $100,000 to $299,999 | 979 (23.1%) | 1,907 (19.0%) |
| $300,000 to $499,999 | 1,989 (46.9%) | 4,840 (48.2%) |
| $500,000 to $749,999 | 847 (20.0%) | 2,515 (25.0%) |
| $750,000 to $999,999 | 213 (5.0%) | 570 (5.7%) |
| $1,000,000 or more | 71 (1.7%) | 141 (1.4%) |
| Total | 4,245 (100.0%) | 10,048 (100.0%) |
Household Income by Mortgage Status in Collierville
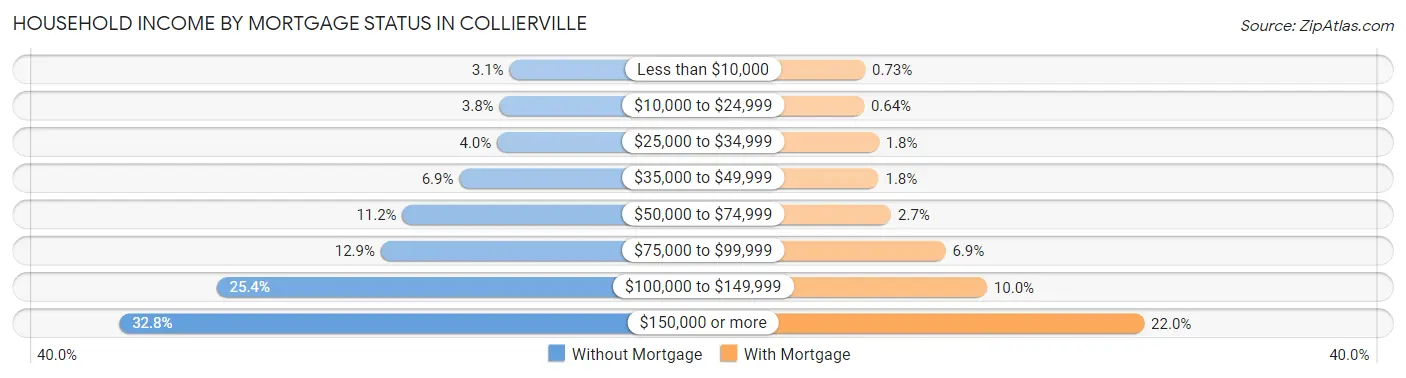
| Household Income | Without Mortgage | With Mortgage |
| Less than $10,000 | 130 (3.1%) | 73 (0.7%) |
| $10,000 to $24,999 | 162 (3.8%) | 64 (0.6%) |
| $25,000 to $34,999 | 170 (4.0%) | 178 (1.8%) |
| $35,000 to $49,999 | 292 (6.9%) | 176 (1.8%) |
| $50,000 to $74,999 | 476 (11.2%) | 272 (2.7%) |
| $75,000 to $99,999 | 546 (12.9%) | 688 (6.9%) |
| $100,000 to $149,999 | 1,077 (25.4%) | 1,006 (10.0%) |
| $150,000 or more | 1,392 (32.8%) | 2,210 (22.0%) |
| Total | 4,245 (100.0%) | 10,048 (100.0%) |
Property Value to Household Income Ratio in Collierville
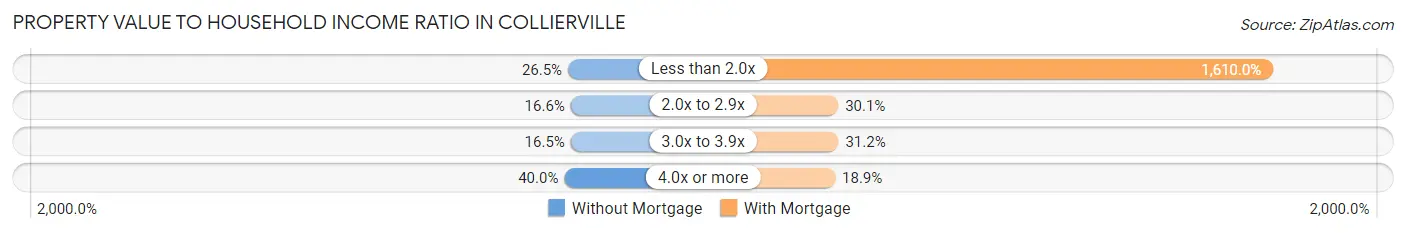
| Value-to-Income Ratio | Without Mortgage | With Mortgage |
| Less than 2.0x | 1,124 (26.5%) | 161,774 (1,610.0%) |
| 2.0x to 2.9x | 705 (16.6%) | 3,020 (30.1%) |
| 3.0x to 3.9x | 702 (16.5%) | 3,130 (31.1%) |
| 4.0x or more | 1,697 (40.0%) | 1,899 (18.9%) |
| Total | 4,245 (100.0%) | 10,048 (100.0%) |
Real Estate Taxes by Mortgage Status in Collierville

| Property Taxes | Without Mortgage | With Mortgage |
| Less than $800 | 94 (2.2%) | 46 (0.5%) |
| $800 to $1,499 | 136 (3.2%) | 104 (1.0%) |
| $800 to $1,499 | 3,941 (92.8%) | 381 (3.8%) |
| Total | 4,245 (100.0%) | 10,048 (100.0%) |
Health & Disability in Collierville
Health Insurance Coverage by Age in Collierville
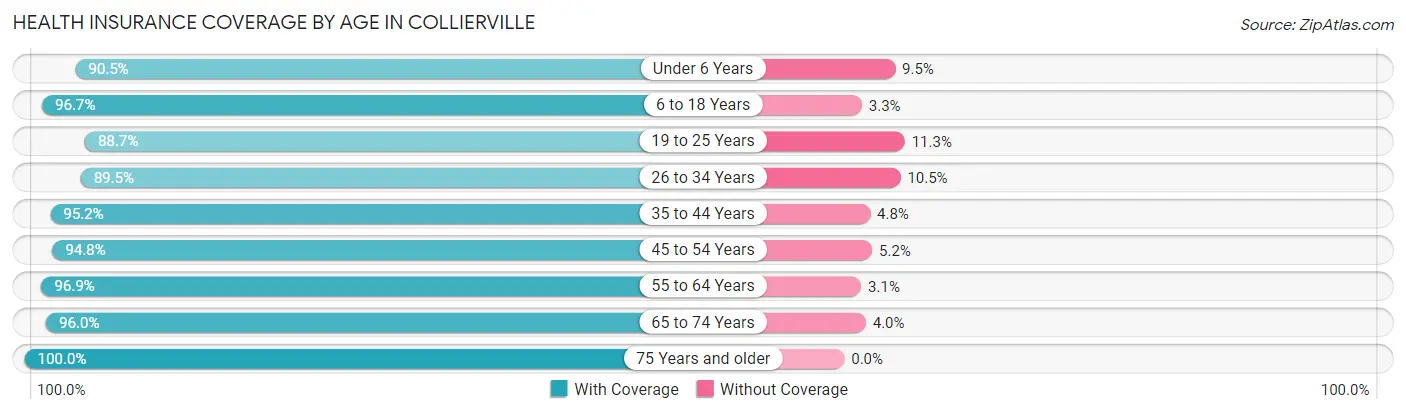
| Age Bracket | With Coverage | Without Coverage |
| Under 6 Years | 3,095 (90.5%) | 324 (9.5%) |
| 6 to 18 Years | 10,738 (96.7%) | 363 (3.3%) |
| 19 to 25 Years | 2,795 (88.7%) | 355 (11.3%) |
| 26 to 34 Years | 3,875 (89.5%) | 453 (10.5%) |
| 35 to 44 Years | 6,426 (95.2%) | 325 (4.8%) |
| 45 to 54 Years | 7,516 (94.8%) | 411 (5.2%) |
| 55 to 64 Years | 6,667 (96.9%) | 216 (3.1%) |
| 65 to 74 Years | 4,690 (96.0%) | 196 (4.0%) |
| 75 Years and older | 2,551 (100.0%) | 0 (0.0%) |
| Total | 48,353 (94.8%) | 2,643 (5.2%) |
Health Insurance Coverage by Citizenship Status in Collierville
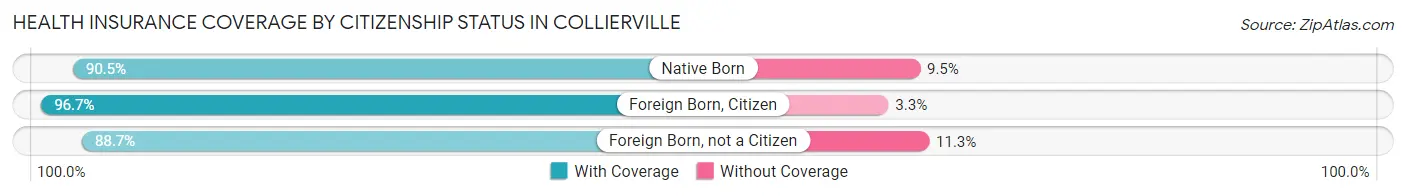
| Citizenship Status | With Coverage | Without Coverage |
| Native Born | 3,095 (90.5%) | 324 (9.5%) |
| Foreign Born, Citizen | 10,738 (96.7%) | 363 (3.3%) |
| Foreign Born, not a Citizen | 2,795 (88.7%) | 355 (11.3%) |
Health Insurance Coverage by Household Income in Collierville
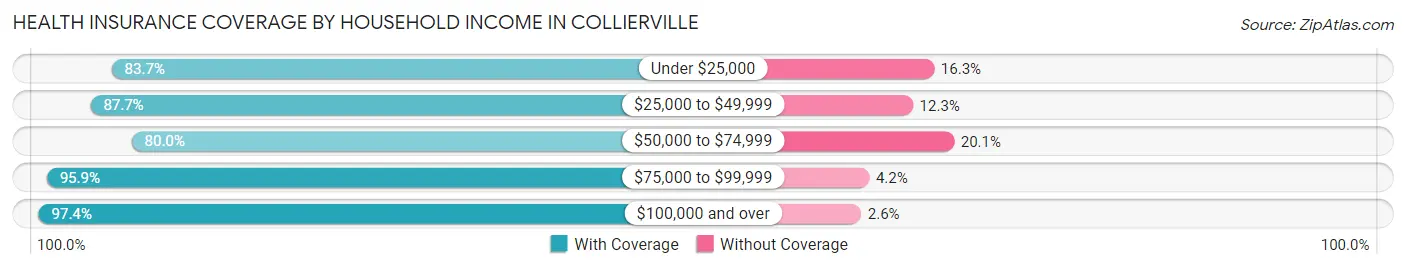
| Household Income | With Coverage | Without Coverage |
| Under $25,000 | 1,231 (83.7%) | 240 (16.3%) |
| $25,000 to $49,999 | 2,472 (87.7%) | 348 (12.3%) |
| $50,000 to $74,999 | 3,358 (79.9%) | 842 (20.1%) |
| $75,000 to $99,999 | 5,912 (95.9%) | 256 (4.2%) |
| $100,000 and over | 35,375 (97.4%) | 957 (2.6%) |
Public vs Private Health Insurance Coverage by Age in Collierville
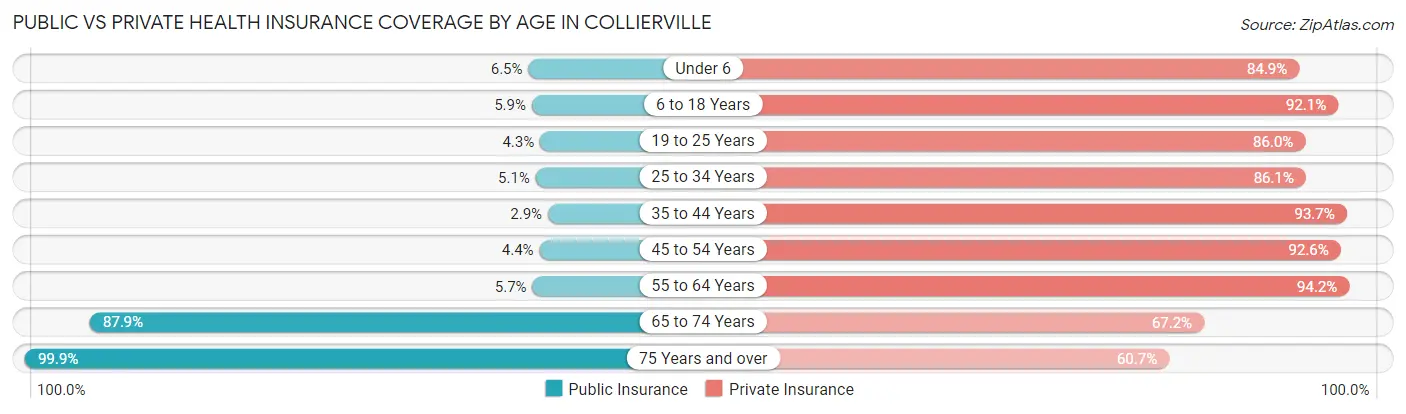
| Age Bracket | Public Insurance | Private Insurance |
| Under 6 | 222 (6.5%) | 2,902 (84.9%) |
| 6 to 18 Years | 649 (5.9%) | 10,224 (92.1%) |
| 19 to 25 Years | 136 (4.3%) | 2,709 (86.0%) |
| 25 to 34 Years | 222 (5.1%) | 3,727 (86.1%) |
| 35 to 44 Years | 193 (2.9%) | 6,324 (93.7%) |
| 45 to 54 Years | 352 (4.4%) | 7,339 (92.6%) |
| 55 to 64 Years | 395 (5.7%) | 6,482 (94.2%) |
| 65 to 74 Years | 4,294 (87.9%) | 3,284 (67.2%) |
| 75 Years and over | 2,549 (99.9%) | 1,549 (60.7%) |
| Total | 9,012 (17.7%) | 44,540 (87.3%) |
Disability Status by Sex by Age in Collierville
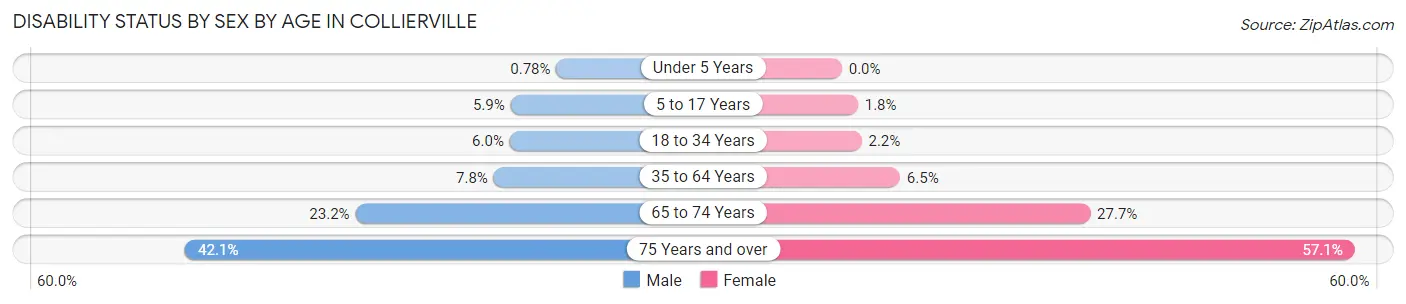
| Age Bracket | Male | Female |
| Under 5 Years | 10 (0.8%) | 0 (0.0%) |
| 5 to 17 Years | 325 (5.9%) | 94 (1.8%) |
| 18 to 34 Years | 224 (6.0%) | 101 (2.2%) |
| 35 to 64 Years | 832 (7.8%) | 702 (6.5%) |
| 65 to 74 Years | 496 (23.2%) | 759 (27.7%) |
| 75 Years and over | 396 (42.1%) | 920 (57.1%) |
Disability Class by Sex by Age in Collierville
Disability Class: Hearing Difficulty
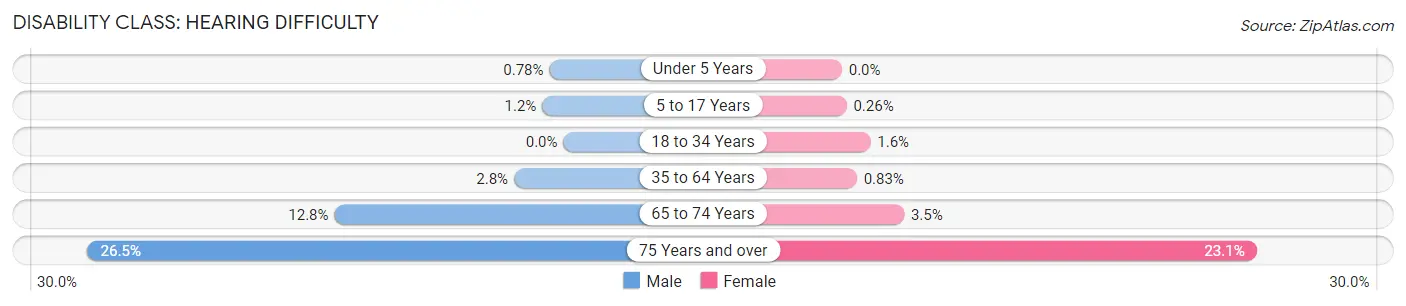
| Age Bracket | Male | Female |
| Under 5 Years | 10 (0.8%) | 0 (0.0%) |
| 5 to 17 Years | 65 (1.2%) | 14 (0.3%) |
| 18 to 34 Years | 0 (0.0%) | 73 (1.6%) |
| 35 to 64 Years | 295 (2.8%) | 90 (0.8%) |
| 65 to 74 Years | 273 (12.8%) | 95 (3.5%) |
| 75 Years and over | 249 (26.5%) | 372 (23.1%) |
Disability Class: Vision Difficulty
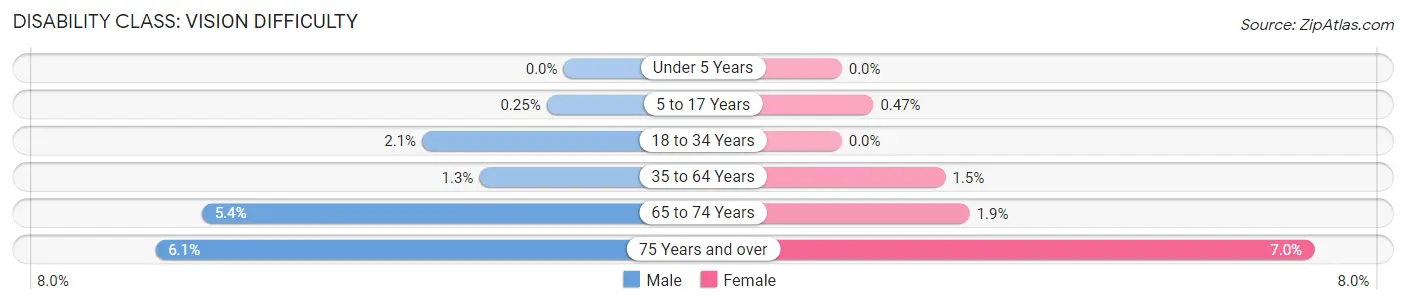
| Age Bracket | Male | Female |
| Under 5 Years | 0 (0.0%) | 0 (0.0%) |
| 5 to 17 Years | 14 (0.3%) | 25 (0.5%) |
| 18 to 34 Years | 79 (2.1%) | 0 (0.0%) |
| 35 to 64 Years | 134 (1.3%) | 167 (1.5%) |
| 65 to 74 Years | 115 (5.4%) | 52 (1.9%) |
| 75 Years and over | 57 (6.1%) | 113 (7.0%) |
Disability Class: Cognitive Difficulty
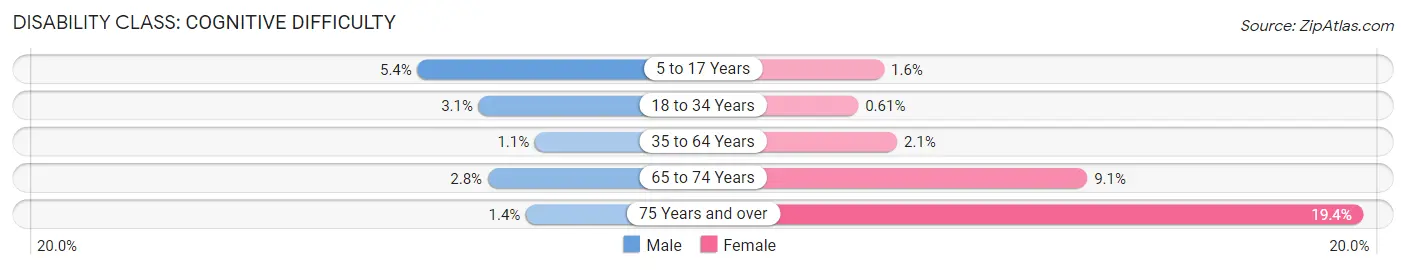
| Age Bracket | Male | Female |
| 5 to 17 Years | 299 (5.4%) | 83 (1.6%) |
| 18 to 34 Years | 118 (3.1%) | 28 (0.6%) |
| 35 to 64 Years | 112 (1.1%) | 222 (2.1%) |
| 65 to 74 Years | 60 (2.8%) | 250 (9.1%) |
| 75 Years and over | 13 (1.4%) | 312 (19.4%) |
Disability Class: Ambulatory Difficulty
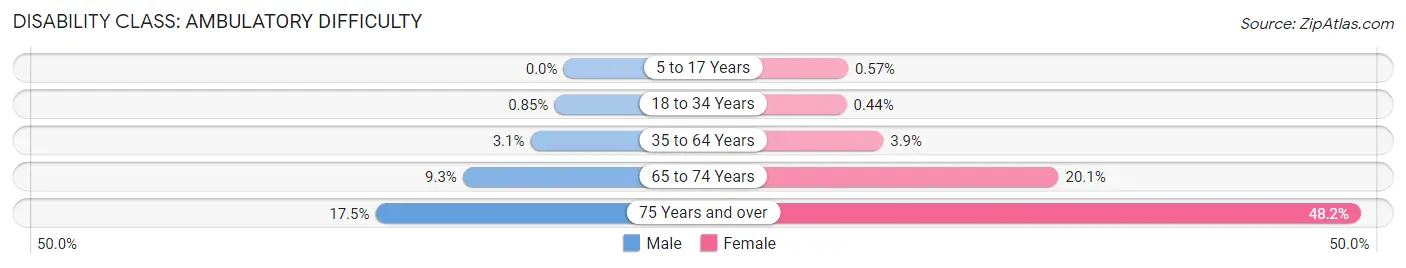
| Age Bracket | Male | Female |
| 5 to 17 Years | 0 (0.0%) | 30 (0.6%) |
| 18 to 34 Years | 32 (0.9%) | 20 (0.4%) |
| 35 to 64 Years | 329 (3.1%) | 417 (3.8%) |
| 65 to 74 Years | 200 (9.3%) | 552 (20.1%) |
| 75 Years and over | 164 (17.4%) | 776 (48.2%) |
Disability Class: Self-Care Difficulty
| Age Bracket | Male | Female |
| 5 to 17 Years | 102 (1.8%) | 36 (0.7%) |
| 18 to 34 Years | 32 (0.9%) | 20 (0.4%) |
| 35 to 64 Years | 21 (0.2%) | 165 (1.5%) |
| 65 to 74 Years | 60 (2.8%) | 103 (3.7%) |
| 75 Years and over | 15 (1.6%) | 149 (9.2%) |
Technology Access in Collierville
Computing Device Access in Collierville
| Device Type | # Households | % Households |
| Desktop or Laptop | 16,017 | 90.2% |
| Smartphone | 16,785 | 94.5% |
| Tablet | 14,055 | 79.2% |
| No Computing Device | 366 | 2.1% |
| Total | 17,755 | 100.0% |
Internet Access in Collierville
| Internet Type | # Households | % Households |
| Dial-Up Internet | 0 | 0.0% |
| Broadband Home | 15,490 | 87.2% |
| Cellular Data Only | 1,221 | 6.9% |
| Satellite Internet | 1,518 | 8.6% |
| No Internet | 610 | 3.4% |
| Total | 17,755 | 100.0% |
Collierville Summary
Collierville, Tennessee is a town located in Shelby County, Tennessee, United States. It is a suburb of Memphis, located approximately 15 miles east of the city. The town had a population of 43,965 as of the 2010 census, making it the largest town in Tennessee.
History
The area that is now Collierville was first settled in 1834 by John and Abner Savage. The town was named after the Savage family’s plantation, which was named for the many colliers (coal miners) who worked in the area. The town was officially incorporated in 1845.
In the late 19th century, Collierville was a major railroad hub, with the Memphis and Charleston Railroad running through the town. The town was also home to a number of cotton gins and other businesses.
In the early 20th century, Collierville was a popular destination for tourists, with a number of resorts and hotels located in the area. The town was also home to a number of prominent citizens, including the founder of the Holiday Inn chain, Kemmons Wilson.
Geography
Collierville is located in the southeastern corner of Shelby County, Tennessee. It is bordered by the cities of Germantown to the north, Bartlett to the east, and Memphis to the west. The town is situated on the banks of the Wolf River, which flows through the town.
The town has a total area of 24.3 square miles, of which 24.2 square miles is land and 0.1 square miles is water. The town is located at an elevation of 393 feet above sea level.
Economy
Collierville’s economy is largely based on retail and services. The town is home to a number of large retail stores, including Walmart, Target, and Lowe’s. The town is also home to a number of restaurants, banks, and other businesses.
The town is also home to a number of corporate headquarters, including FedEx, AutoZone, and International Paper. The town is also home to a number of manufacturing companies, including the Collierville Manufacturing Company, which produces automotive parts.
Demographics
As of the 2010 census, Collierville had a population of 43,965. The racial makeup of the town was 79.3% White, 15.2% African American, 0.3% Native American, 2.2% Asian, 0.1% Pacific Islander, 1.2% from other races, and 1.9% from two or more races. Hispanic or Latino of any race were 4.2% of the population.
The median income for a household in the town was $76,843, and the median income for a family was $90,945. The per capita income for the town was $37,945. About 4.2% of families and 5.7% of the population were below the poverty line, including 6.7% of those under age 18 and 4.2% of those age 65 or over.
Common Questions
What is Per Capita Income in Collierville?
Per Capita income in Collierville is $59,856.
What is the Median Family Income in Collierville?
Median Family Income in Collierville is $143,894.
What is the Median Household income in Collierville?
Median Household Income in Collierville is $129,729.
What is Income or Wage Gap in Collierville?
Income or Wage Gap in Collierville is 54.2%.
Women in Collierville earn 45.8 cents for every dollar earned by a man.
What is Family Income Deficit in Collierville?
Family Income Deficit in Collierville is $10,682.
Families that are below poverty line in Collierville earn $10,682 less on average than the poverty threshold level.
What is Inequality or Gini Index in Collierville?
Inequality or Gini Index in Collierville is 0.42.
What is the Total Population of Collierville?
Total Population of Collierville is 51,170.
What is the Total Male Population of Collierville?
Total Male Population of Collierville is 24,458.
What is the Total Female Population of Collierville?
Total Female Population of Collierville is 26,712.
What is the Ratio of Males per 100 Females in Collierville?
There are 91.56 Males per 100 Females in Collierville.
What is the Ratio of Females per 100 Males in Collierville?
There are 109.22 Females per 100 Males in Collierville.
What is the Median Population Age in Collierville?
Median Population Age in Collierville is 40.2 Years.
What is the Average Family Size in Collierville
Average Family Size in Collierville is 3.3 People.
What is the Average Household Size in Collierville
Average Household Size in Collierville is 2.9 People.
How Large is the Labor Force in Collierville?
There are 26,344 People in the Labor Forcein in Collierville.
What is the Percentage of People in the Labor Force in Collierville?
66.6% of People are in the Labor Force in Collierville.
What is the Unemployment Rate in Collierville?
Unemployment Rate in Collierville is 2.6%.