Coppell, TX Map & Demographics
Coppell Map
Coppell Overview
$71,363
PER CAPITA INCOME
$170,333
AVG FAMILY INCOME
$143,817
AVG HOUSEHOLD INCOME
44.6%
WAGE / INCOME GAP [ % ]
55.4¢/ $1
WAGE / INCOME GAP [ $ ]
0.43
INEQUALITY / GINI INDEX
42,513
TOTAL POPULATION
21,308
MALE POPULATION
21,205
FEMALE POPULATION
100.49
MALES / 100 FEMALES
99.52
FEMALES / 100 MALES
39.6
MEDIAN AGE
3.1
AVG FAMILY SIZE
2.7
AVG HOUSEHOLD SIZE
23,799
LABOR FORCE [ PEOPLE ]
73.8%
PERCENT IN LABOR FORCE
1.9%
UNEMPLOYMENT RATE
Coppell Zip Codes
Coppell Area Codes
Income in Coppell
Income Overview in Coppell
Per Capita Income in Coppell is $71,363, while median incomes of families and households are $170,333 and $143,817 respectively.
| Characteristic | Number | Measure |
| Per Capita Income | 42,513 | $71,363 |
| Median Family Income | 12,338 | $170,333 |
| Mean Family Income | 12,338 | $216,482 |
| Median Household Income | 15,618 | $143,817 |
| Mean Household Income | 15,618 | $193,636 |
| Income Deficit | 12,338 | $0 |
| Wage / Income Gap (%) | 42,513 | 44.56% |
| Wage / Income Gap ($) | 42,513 | 55.44¢ per $1 |
| Gini / Inequality Index | 42,513 | 0.43 |
Earnings by Sex in Coppell
Average Earnings in Coppell are $81,990, $108,560 for men and $60,182 for women, a difference of 44.6%.
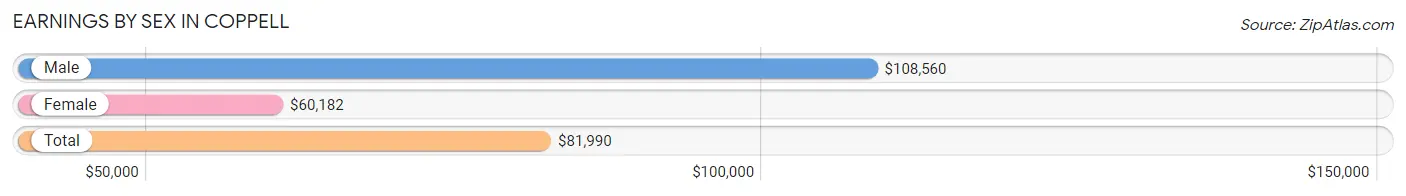
| Sex | Number | Average Earnings |
| Male | 13,348 (53.5%) | $108,560 |
| Female | 11,585 (46.5%) | $60,182 |
| Total | 24,933 (100.0%) | $81,990 |
Earnings by Sex by Income Bracket in Coppell
The most common earnings brackets in Coppell are $100,000+ for men (7,269 | 54.5%) and $100,000+ for women (3,007 | 26.0%).
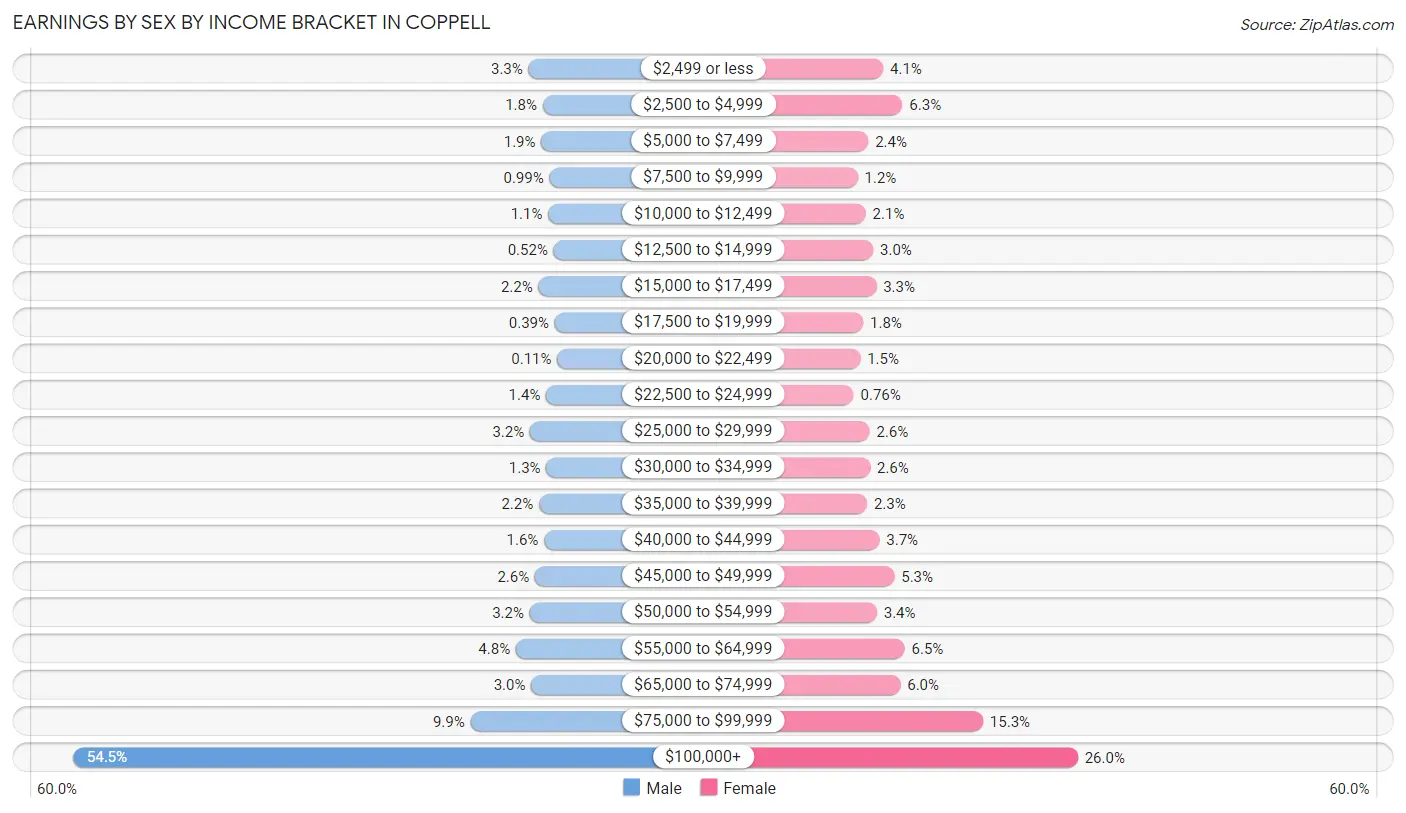
| Income | Male | Female |
| $2,499 or less | 446 (3.3%) | 473 (4.1%) |
| $2,500 to $4,999 | 234 (1.8%) | 724 (6.2%) |
| $5,000 to $7,499 | 255 (1.9%) | 279 (2.4%) |
| $7,500 to $9,999 | 132 (1.0%) | 140 (1.2%) |
| $10,000 to $12,499 | 151 (1.1%) | 246 (2.1%) |
| $12,500 to $14,999 | 69 (0.5%) | 343 (3.0%) |
| $15,000 to $17,499 | 298 (2.2%) | 383 (3.3%) |
| $17,500 to $19,999 | 52 (0.4%) | 212 (1.8%) |
| $20,000 to $22,499 | 15 (0.1%) | 175 (1.5%) |
| $22,500 to $24,999 | 182 (1.4%) | 88 (0.8%) |
| $25,000 to $29,999 | 425 (3.2%) | 296 (2.6%) |
| $30,000 to $34,999 | 179 (1.3%) | 302 (2.6%) |
| $35,000 to $39,999 | 290 (2.2%) | 263 (2.3%) |
| $40,000 to $44,999 | 212 (1.6%) | 424 (3.7%) |
| $45,000 to $49,999 | 350 (2.6%) | 619 (5.3%) |
| $50,000 to $54,999 | 429 (3.2%) | 390 (3.4%) |
| $55,000 to $64,999 | 636 (4.8%) | 753 (6.5%) |
| $65,000 to $74,999 | 406 (3.0%) | 696 (6.0%) |
| $75,000 to $99,999 | 1,318 (9.9%) | 1,772 (15.3%) |
| $100,000+ | 7,269 (54.5%) | 3,007 (26.0%) |
| Total | 13,348 (100.0%) | 11,585 (100.0%) |
Earnings by Sex by Educational Attainment in Coppell
Average earnings in Coppell are $116,301 for men and $67,838 for women, a difference of 41.7%. Men with an educational attainment of graduate degree enjoy the highest average annual earnings of $146,482, while those with less than high school education earn the least with $33,675. Women with an educational attainment of graduate degree earn the most with the average annual earnings of $91,882, while those with less than high school education have the smallest earnings of $19,481.
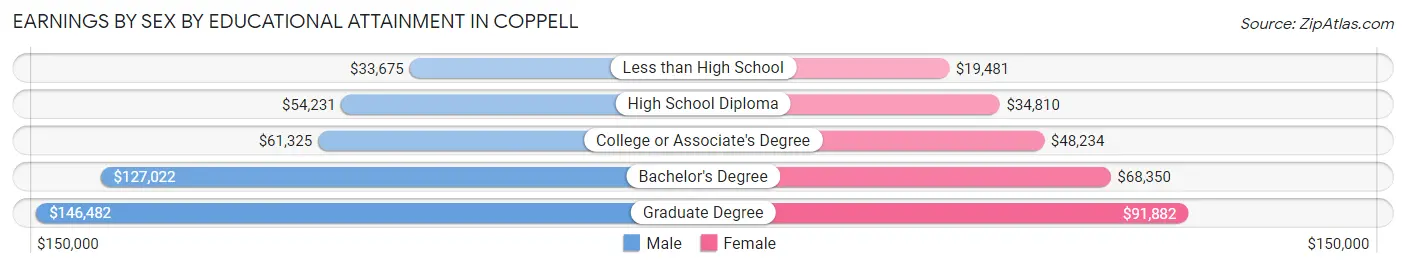
| Educational Attainment | Male Income | Female Income |
| Less than High School | $33,675 | $19,481 |
| High School Diploma | $54,231 | $34,810 |
| College or Associate's Degree | $61,325 | $48,234 |
| Bachelor's Degree | $127,022 | $68,350 |
| Graduate Degree | $146,482 | $91,882 |
| Total | $116,301 | $67,838 |
Family Income in Coppell
Family Income Brackets in Coppell
According to the Coppell family income data, there are 5,071 families falling into the $200,000+ income range, which is the most common income bracket and makes up 41.1% of all families.
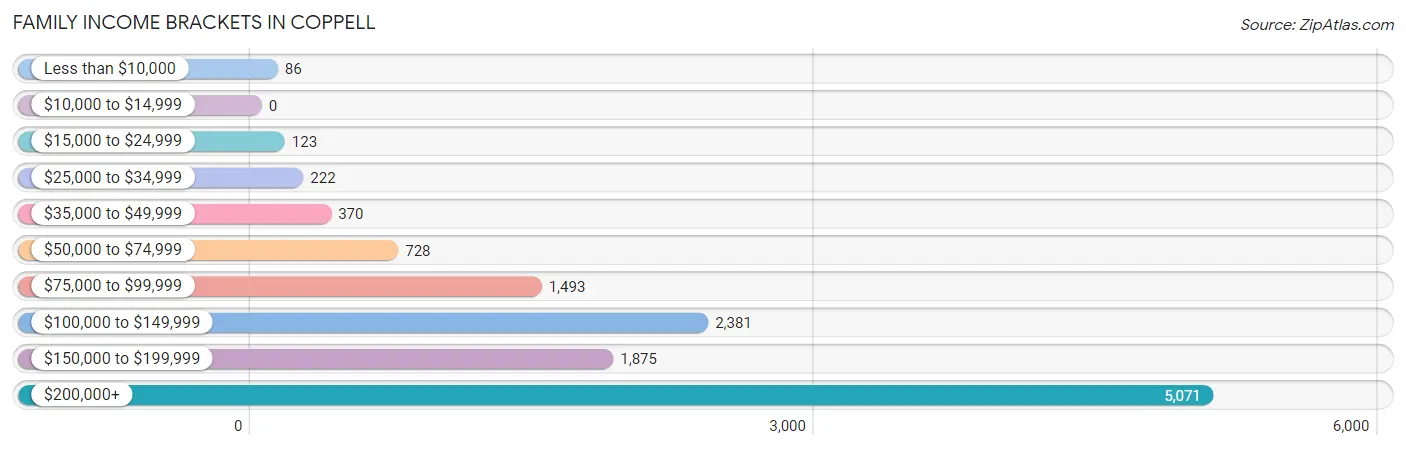
| Income Bracket | # Families | % Families |
| Less than $10,000 | 86 | 0.7% |
| $10,000 to $14,999 | 0 | 0.0% |
| $15,000 to $24,999 | 123 | 1.0% |
| $25,000 to $34,999 | 222 | 1.8% |
| $35,000 to $49,999 | 370 | 3.0% |
| $50,000 to $74,999 | 728 | 5.9% |
| $75,000 to $99,999 | 1,493 | 12.1% |
| $100,000 to $149,999 | 2,381 | 19.3% |
| $150,000 to $199,999 | 1,875 | 15.2% |
| $200,000+ | 5,071 | 41.1% |
Family Income by Famaliy Size in Coppell
6-person families (297 | 2.4%) account for the highest median family income in Coppell with $242,396 per family, while 2-person families (4,811 | 39.0%) have the highest median income of $81,508 per family member.
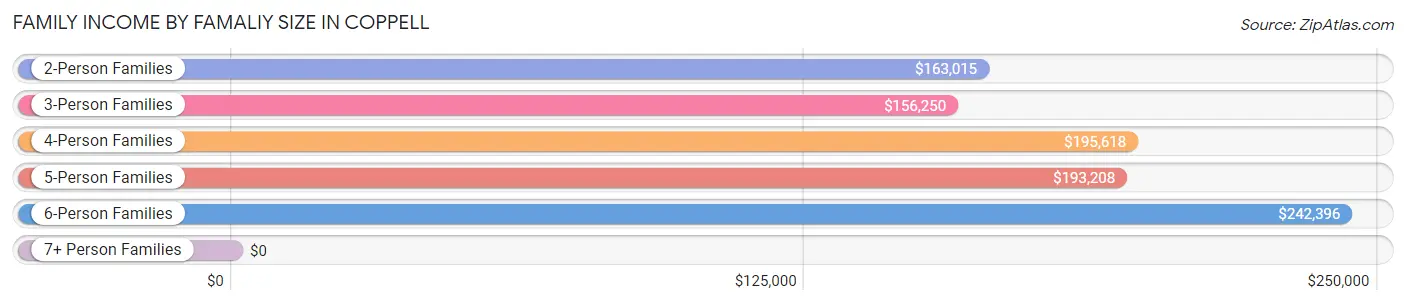
| Income Bracket | # Families | Median Income |
| 2-Person Families | 4,811 (39.0%) | $163,015 |
| 3-Person Families | 3,047 (24.7%) | $156,250 |
| 4-Person Families | 3,357 (27.2%) | $195,618 |
| 5-Person Families | 810 (6.6%) | $193,208 |
| 6-Person Families | 297 (2.4%) | $242,396 |
| 7+ Person Families | 16 (0.1%) | $0 |
| Total | 12,338 (100.0%) | $170,333 |
Family Income by Number of Earners in Coppell
The median family income in Coppell is $170,333, with families comprising 2 earners (6,535) having the highest median family income of $212,401, while families with no earners (563) have the lowest median family income of $79,769, accounting for 53.0% and 4.6% of families, respectively.
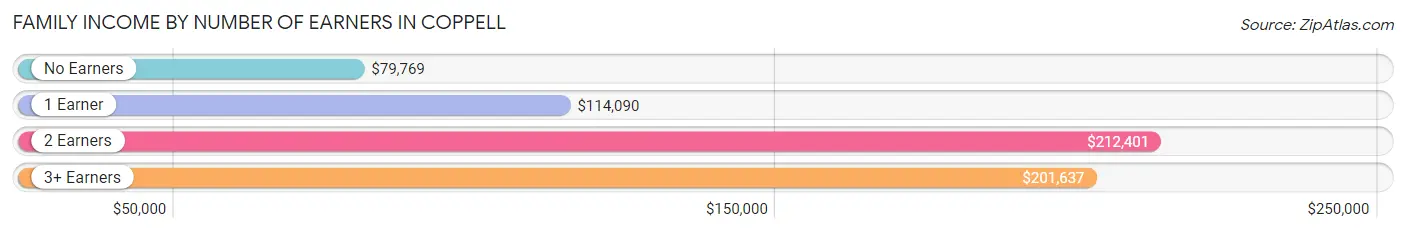
| Number of Earners | # Families | Median Income |
| No Earners | 563 (4.6%) | $79,769 |
| 1 Earner | 3,695 (29.9%) | $114,090 |
| 2 Earners | 6,535 (53.0%) | $212,401 |
| 3+ Earners | 1,545 (12.5%) | $201,637 |
| Total | 12,338 (100.0%) | $170,333 |
Household Income in Coppell
Household Income Brackets in Coppell
With 5,295 households falling in the category, the $200,000+ income range is the most frequent in Coppell, accounting for 33.9% of all households. In contrast, only 94 households (0.6%) fall into the $10,000 to $14,999 income bracket, making it the least populous group.
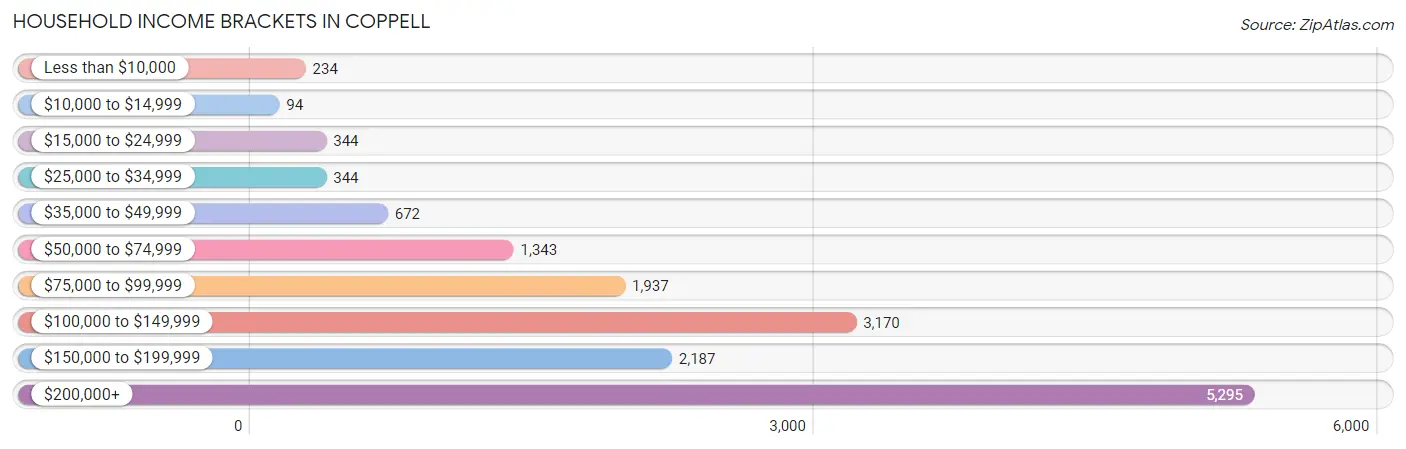
| Income Bracket | # Households | % Households |
| Less than $10,000 | 234 | 1.5% |
| $10,000 to $14,999 | 94 | 0.6% |
| $15,000 to $24,999 | 344 | 2.2% |
| $25,000 to $34,999 | 344 | 2.2% |
| $35,000 to $49,999 | 672 | 4.3% |
| $50,000 to $74,999 | 1,343 | 8.6% |
| $75,000 to $99,999 | 1,937 | 12.4% |
| $100,000 to $149,999 | 3,170 | 20.3% |
| $150,000 to $199,999 | 2,187 | 14.0% |
| $200,000+ | 5,295 | 33.9% |
Household Income by Householder Age in Coppell
The median household income in Coppell is $143,817, with the highest median household income of $182,049 found in the 45 to 64 years age bracket for the primary householder. A total of 7,526 households (48.2%) fall into this category. Meanwhile, the 15 to 24 years age bracket for the primary householder has the lowest median household income of $69,000, with 154 households (1.0%) in this group.
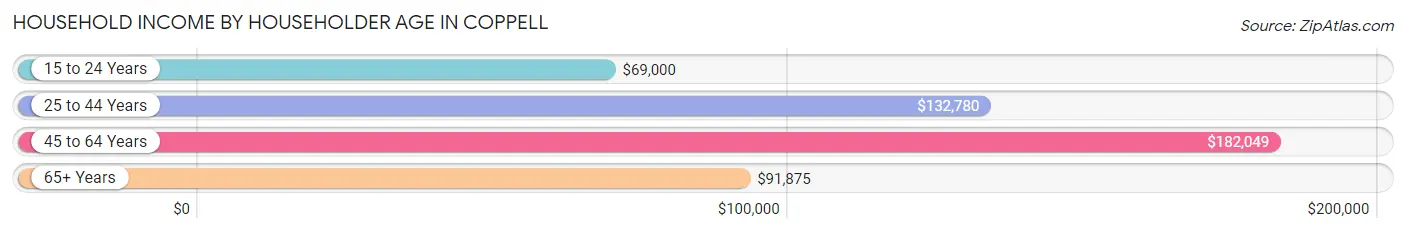
| Income Bracket | # Households | Median Income |
| 15 to 24 Years | 154 (1.0%) | $69,000 |
| 25 to 44 Years | 5,572 (35.7%) | $132,780 |
| 45 to 64 Years | 7,526 (48.2%) | $182,049 |
| 65+ Years | 2,366 (15.1%) | $91,875 |
| Total | 15,618 (100.0%) | $143,817 |
Poverty in Coppell
Income Below Poverty by Sex and Age in Coppell
With 2.1% poverty level for males and 3.2% for females among the residents of Coppell, 16 and 17 year old males and 75 year old and over females are the most vulnerable to poverty, with 34 males (4.4%) and 70 females (9.3%) in their respective age groups living below the poverty level.
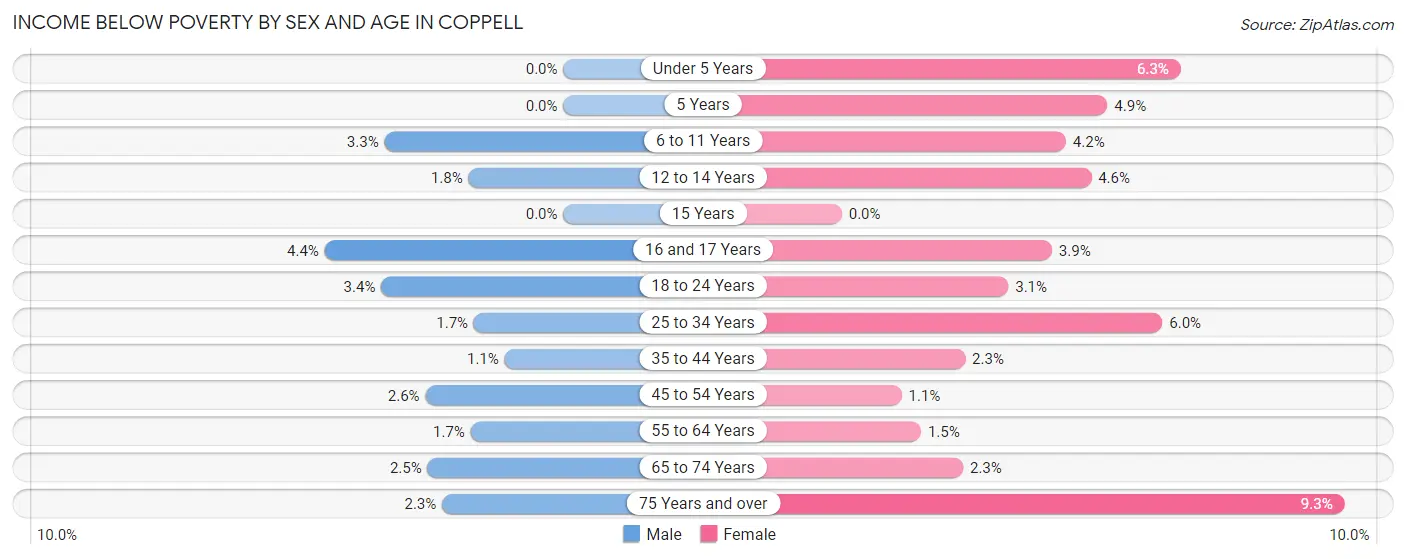
| Age Bracket | Male | Female |
| Under 5 Years | 0 (0.0%) | 80 (6.3%) |
| 5 Years | 0 (0.0%) | 14 (4.9%) |
| 6 to 11 Years | 78 (3.3%) | 68 (4.2%) |
| 12 to 14 Years | 21 (1.8%) | 57 (4.6%) |
| 15 Years | 0 (0.0%) | 0 (0.0%) |
| 16 and 17 Years | 34 (4.4%) | 31 (3.9%) |
| 18 to 24 Years | 39 (3.4%) | 37 (3.1%) |
| 25 to 34 Years | 32 (1.7%) | 122 (5.9%) |
| 35 to 44 Years | 35 (1.1%) | 86 (2.3%) |
| 45 to 54 Years | 97 (2.6%) | 39 (1.1%) |
| 55 to 64 Years | 53 (1.7%) | 41 (1.5%) |
| 65 to 74 Years | 38 (2.5%) | 33 (2.2%) |
| 75 Years and over | 10 (2.2%) | 70 (9.3%) |
| Total | 437 (2.1%) | 678 (3.2%) |
Income Above Poverty by Sex and Age in Coppell
According to the poverty statistics in Coppell, males aged under 5 years and females aged 15 years are the age groups that are most secure financially, with 100.0% of males and 100.0% of females in these age groups living above the poverty line.
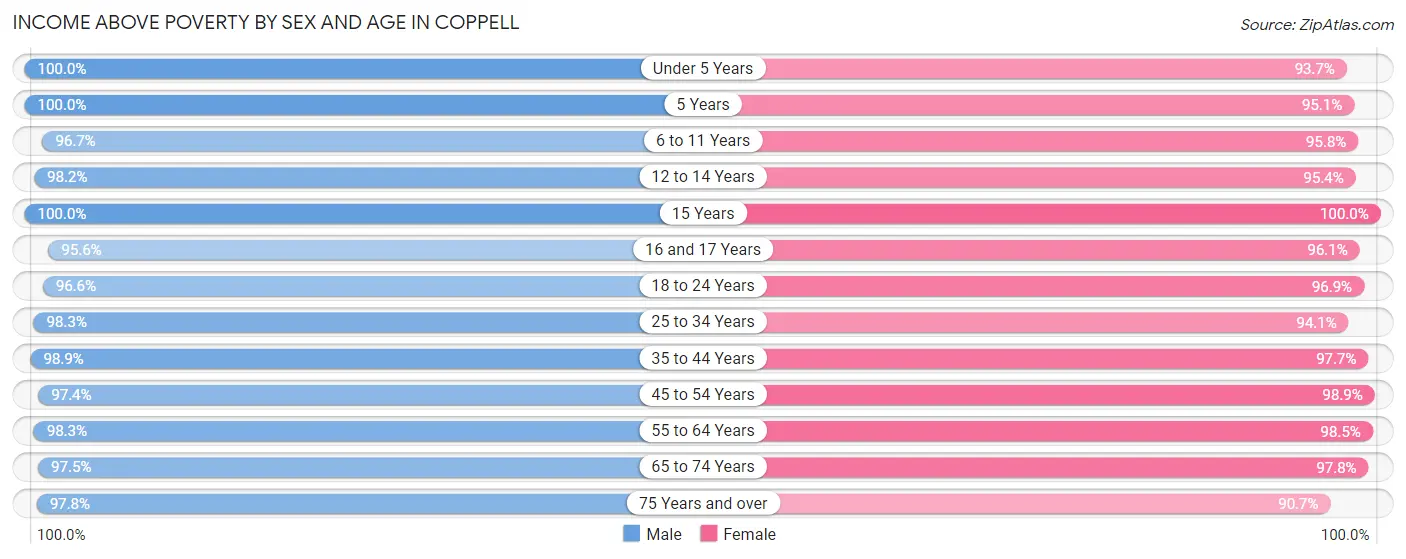
| Age Bracket | Male | Female |
| Under 5 Years | 1,384 (100.0%) | 1,192 (93.7%) |
| 5 Years | 230 (100.0%) | 270 (95.1%) |
| 6 to 11 Years | 2,269 (96.7%) | 1,568 (95.8%) |
| 12 to 14 Years | 1,171 (98.2%) | 1,174 (95.4%) |
| 15 Years | 255 (100.0%) | 400 (100.0%) |
| 16 and 17 Years | 734 (95.6%) | 764 (96.1%) |
| 18 to 24 Years | 1,116 (96.6%) | 1,162 (96.9%) |
| 25 to 34 Years | 1,895 (98.3%) | 1,930 (94.1%) |
| 35 to 44 Years | 3,181 (98.9%) | 3,668 (97.7%) |
| 45 to 54 Years | 3,692 (97.4%) | 3,488 (98.9%) |
| 55 to 64 Years | 3,025 (98.3%) | 2,741 (98.5%) |
| 65 to 74 Years | 1,472 (97.5%) | 1,436 (97.8%) |
| 75 Years and over | 434 (97.8%) | 680 (90.7%) |
| Total | 20,858 (98.0%) | 20,473 (96.8%) |
Income Below Poverty Among Married-Couple Families in Coppell
The poverty statistics for married-couple families in Coppell show that 1.4% or 151 of the total 10,542 families live below the poverty line. Families with 3 or 4 children have the highest poverty rate of 7.0%, comprising of 42 families. On the other hand, families with 5 or more children have the lowest poverty rate of 0.0%, which includes 0 families.
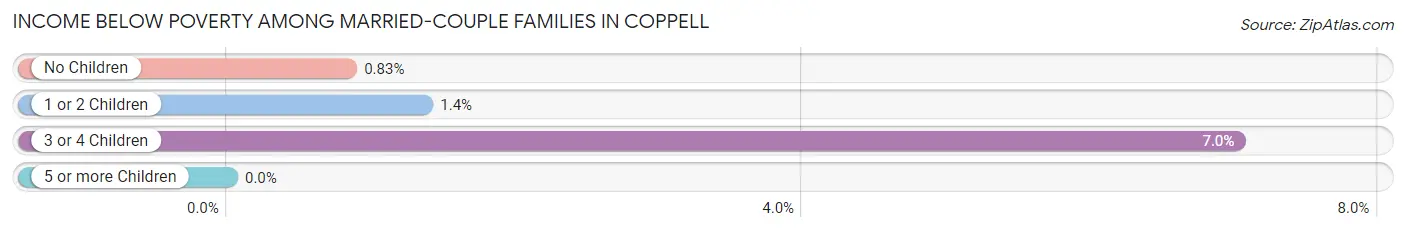
| Children | Above Poverty | Below Poverty |
| No Children | 4,874 (99.2%) | 41 (0.8%) |
| 1 or 2 Children | 4,945 (98.6%) | 68 (1.4%) |
| 3 or 4 Children | 556 (93.0%) | 42 (7.0%) |
| 5 or more Children | 16 (100.0%) | 0 (0.0%) |
| Total | 10,391 (98.6%) | 151 (1.4%) |
Income Below Poverty Among Single-Parent Households in Coppell
According to the poverty data in Coppell, 9.9% or 54 single-father households and 1.1% or 14 single-mother households are living below the poverty line. Among single-father households, those with 1 or 2 children have the highest poverty rate, with 43 households (11.7%) experiencing poverty. Likewise, among single-mother households, those with 3 or 4 children have the highest poverty rate, with 14 households (14.6%) falling below the poverty line.
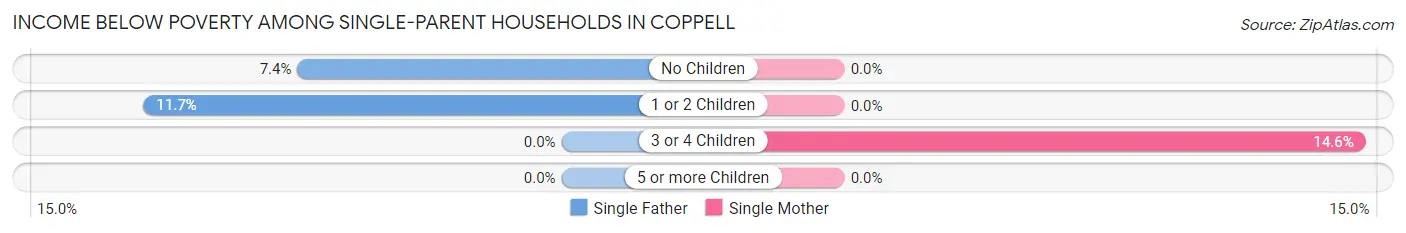
| Children | Single Father | Single Mother |
| No Children | 11 (7.4%) | 0 (0.0%) |
| 1 or 2 Children | 43 (11.7%) | 0 (0.0%) |
| 3 or 4 Children | 0 (0.0%) | 14 (14.6%) |
| 5 or more Children | 0 (0.0%) | 0 (0.0%) |
| Total | 54 (9.9%) | 14 (1.1%) |
Income Below Poverty Among Married-Couple vs Single-Parent Households in Coppell
The poverty data for Coppell shows that 151 of the married-couple family households (1.4%) and 68 of the single-parent households (3.8%) are living below the poverty level. Within the married-couple family households, those with 3 or 4 children have the highest poverty rate, with 42 households (7.0%) falling below the poverty line. Among the single-parent households, those with 3 or 4 children have the highest poverty rate, with 14 household (11.3%) living below poverty.
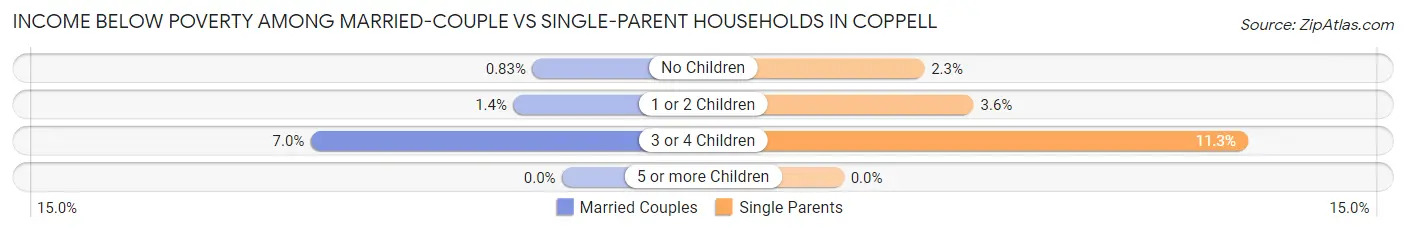
| Children | Married-Couple Families | Single-Parent Households |
| No Children | 41 (0.8%) | 11 (2.2%) |
| 1 or 2 Children | 68 (1.4%) | 43 (3.6%) |
| 3 or 4 Children | 42 (7.0%) | 14 (11.3%) |
| 5 or more Children | 0 (0.0%) | 0 (0.0%) |
| Total | 151 (1.4%) | 68 (3.8%) |
Race in Coppell
The most populous races in Coppell are White / Caucasian (23,371 | 55.0%), Asian (13,217 | 31.1%), and Hispanic or Latino (5,858 | 13.8%).
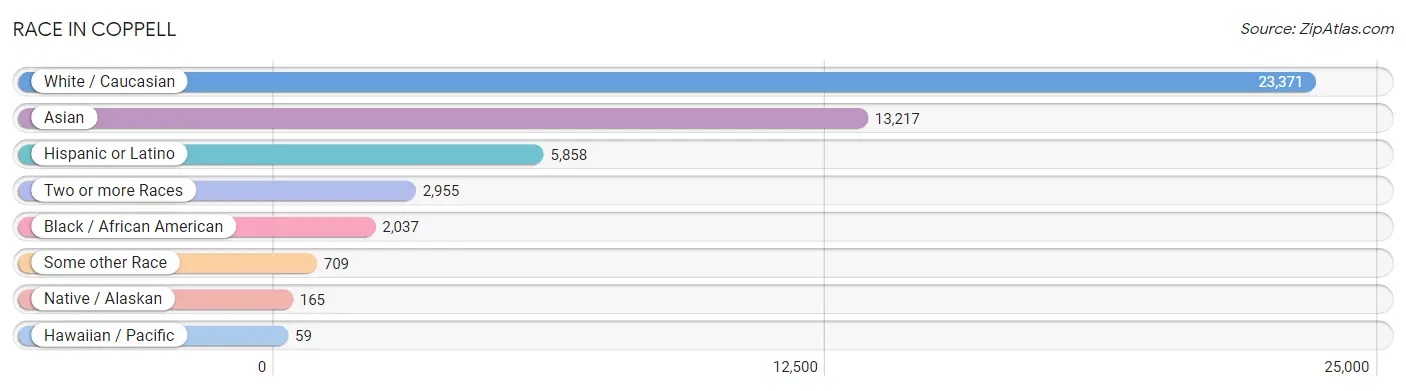
| Race | # Population | % Population |
| Asian | 13,217 | 31.1% |
| Black / African American | 2,037 | 4.8% |
| Hawaiian / Pacific | 59 | 0.1% |
| Hispanic or Latino | 5,858 | 13.8% |
| Native / Alaskan | 165 | 0.4% |
| White / Caucasian | 23,371 | 55.0% |
| Two or more Races | 2,955 | 7.0% |
| Some other Race | 709 | 1.7% |
| Total | 42,513 | 100.0% |
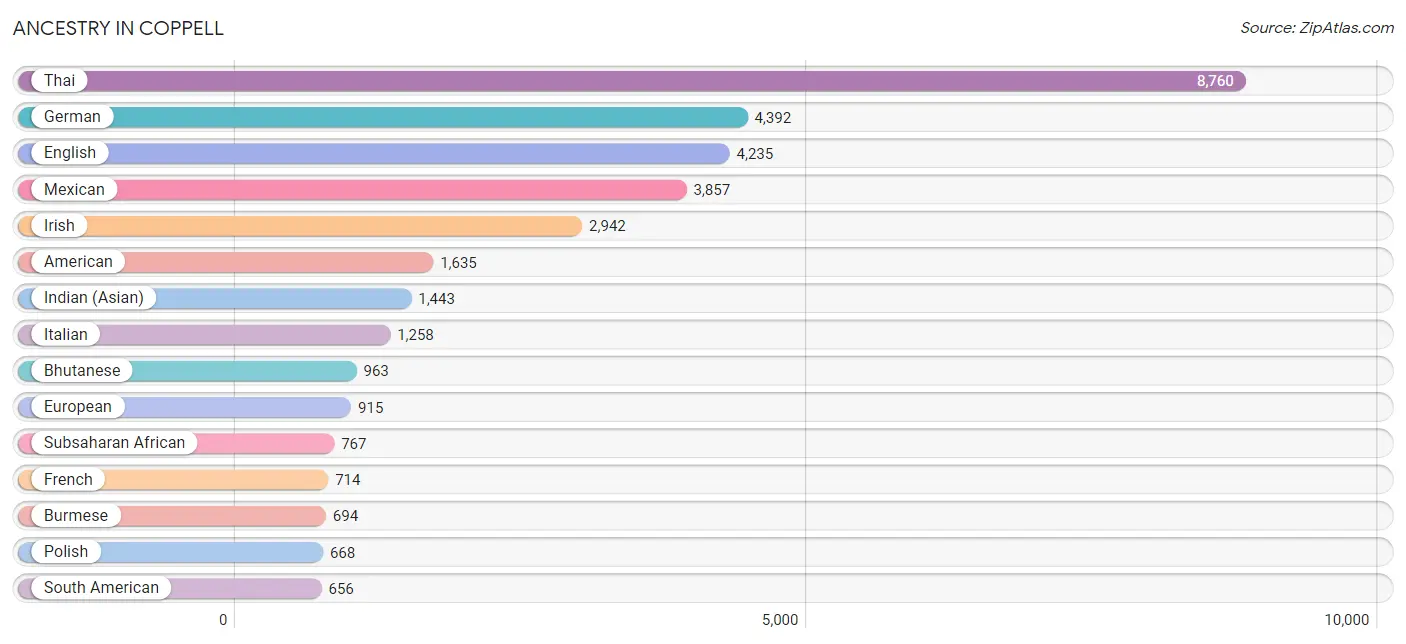
Ancestry in Coppell
The most populous ancestries reported in Coppell are Thai (8,760 | 20.6%), German (4,392 | 10.3%), English (4,235 | 10.0%), Mexican (3,857 | 9.1%), and Irish (2,942 | 6.9%), together accounting for 56.9% of all Coppell residents.
| Ancestry | # Population | % Population |
| African | 567 | 1.3% |
| American | 1,635 | 3.8% |
| Apache | 37 | 0.1% |
| Arab | 216 | 0.5% |
| Argentinean | 184 | 0.4% |
| Armenian | 55 | 0.1% |
| Austrian | 31 | 0.1% |
| Basque | 7 | 0.0% |
| Belgian | 37 | 0.1% |
| Bhutanese | 963 | 2.3% |
| Bolivian | 46 | 0.1% |
| Brazilian | 55 | 0.1% |
| British | 355 | 0.8% |
| Burmese | 694 | 1.6% |
| Canadian | 59 | 0.1% |
| Central American | 288 | 0.7% |
| Central American Indian | 11 | 0.0% |
| Cherokee | 35 | 0.1% |
| Chickasaw | 25 | 0.1% |
| Chilean | 46 | 0.1% |
| Colombian | 78 | 0.2% |
| Cuban | 29 | 0.1% |
| Czech | 177 | 0.4% |
| Czechoslovakian | 6 | 0.0% |
| Danish | 115 | 0.3% |
| Dominican | 83 | 0.2% |
| Dutch | 215 | 0.5% |
| Eastern European | 132 | 0.3% |
| Ecuadorian | 62 | 0.2% |
| Egyptian | 10 | 0.0% |
| English | 4,235 | 10.0% |
| European | 915 | 2.1% |
| Filipino | 91 | 0.2% |
| Finnish | 262 | 0.6% |
| French | 714 | 1.7% |
| French Canadian | 70 | 0.2% |
| German | 4,392 | 10.3% |
| Greek | 133 | 0.3% |
| Guatemalan | 25 | 0.1% |
| Honduran | 135 | 0.3% |
| Hungarian | 127 | 0.3% |
| Indian (Asian) | 1,443 | 3.4% |
| Iranian | 137 | 0.3% |
| Irish | 2,942 | 6.9% |
| Israeli | 10 | 0.0% |
| Italian | 1,258 | 3.0% |
| Japanese | 70 | 0.2% |
| Jordanian | 29 | 0.1% |
| Korean | 314 | 0.7% |
| Laotian | 37 | 0.1% |
| Lebanese | 44 | 0.1% |
| Lithuanian | 184 | 0.4% |
| Luxembourger | 7 | 0.0% |
| Macedonian | 34 | 0.1% |
| Mexican | 3,857 | 9.1% |
| Mexican American Indian | 143 | 0.3% |
| Mongolian | 21 | 0.1% |
| Native Hawaiian | 22 | 0.1% |
| Nicaraguan | 51 | 0.1% |
| Nigerian | 93 | 0.2% |
| Northern European | 190 | 0.4% |
| Norwegian | 295 | 0.7% |
| Pakistani | 309 | 0.7% |
| Panamanian | 77 | 0.2% |
| Peruvian | 90 | 0.2% |
| Polish | 668 | 1.6% |
| Portuguese | 78 | 0.2% |
| Puerto Rican | 412 | 1.0% |
| Romanian | 237 | 0.6% |
| Russian | 144 | 0.3% |
| Samoan | 53 | 0.1% |
| Scandinavian | 98 | 0.2% |
| Scotch-Irish | 262 | 0.6% |
| Scottish | 612 | 1.4% |
| Slavic | 12 | 0.0% |
| Slovak | 72 | 0.2% |
| Slovene | 18 | 0.0% |
| South African | 107 | 0.3% |
| South American | 656 | 1.5% |
| Spaniard | 157 | 0.4% |
| Spanish | 35 | 0.1% |
| Sri Lankan | 474 | 1.1% |
| Subsaharan African | 767 | 1.8% |
| Swedish | 121 | 0.3% |
| Swiss | 100 | 0.2% |
| Syrian | 55 | 0.1% |
| Thai | 8,760 | 20.6% |
| Trinidadian and Tobagonian | 10 | 0.0% |
| Turkish | 45 | 0.1% |
| Ukrainian | 147 | 0.4% |
| Venezuelan | 111 | 0.3% |
| Vietnamese | 28 | 0.1% |
| Welsh | 343 | 0.8% |
| West Indian | 14 | 0.0% |
| Yugoslavian | 11 | 0.0% | View All 95 Rows |
Immigrants in Coppell
The most numerous immigrant groups reported in Coppell came from Asia (8,790 | 20.7%), South Central Asia (5,785 | 13.6%), India (5,248 | 12.3%), Eastern Asia (2,025 | 4.8%), and Latin America (1,682 | 4.0%), together accounting for 55.3% of all Coppell residents.
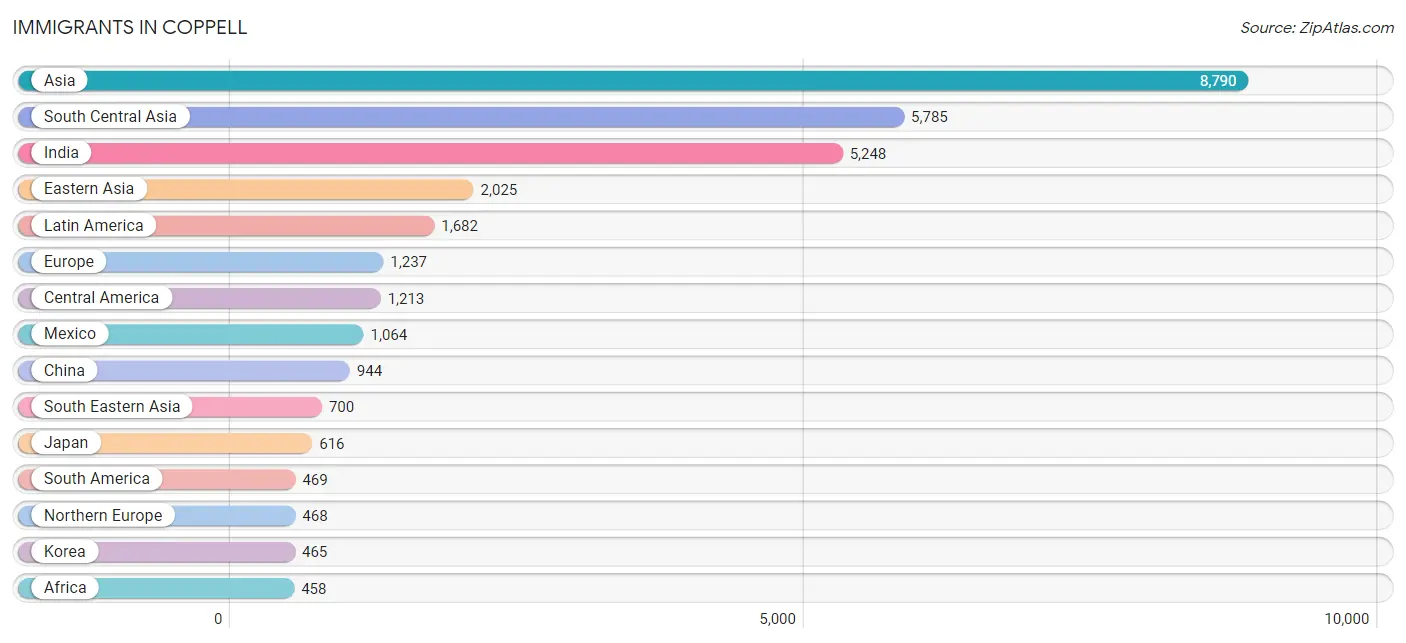
| Immigration Origin | # Population | % Population |
| Africa | 458 | 1.1% |
| Argentina | 88 | 0.2% |
| Armenia | 56 | 0.1% |
| Asia | 8,790 | 20.7% |
| Australia | 80 | 0.2% |
| Bangladesh | 22 | 0.1% |
| Belarus | 12 | 0.0% |
| Belgium | 10 | 0.0% |
| Bolivia | 21 | 0.1% |
| Brazil | 58 | 0.1% |
| Cambodia | 48 | 0.1% |
| Canada | 153 | 0.4% |
| Central America | 1,213 | 2.9% |
| Chile | 30 | 0.1% |
| China | 944 | 2.2% |
| Colombia | 44 | 0.1% |
| Eastern Africa | 24 | 0.1% |
| Eastern Asia | 2,025 | 4.8% |
| Eastern Europe | 327 | 0.8% |
| Ecuador | 12 | 0.0% |
| Egypt | 10 | 0.0% |
| England | 53 | 0.1% |
| Europe | 1,237 | 2.9% |
| France | 154 | 0.4% |
| Germany | 154 | 0.4% |
| Guatemala | 25 | 0.1% |
| Guyana | 53 | 0.1% |
| Hong Kong | 38 | 0.1% |
| Hungary | 7 | 0.0% |
| India | 5,248 | 12.3% |
| Indonesia | 70 | 0.2% |
| Iran | 104 | 0.2% |
| Ireland | 101 | 0.2% |
| Japan | 616 | 1.5% |
| Korea | 465 | 1.1% |
| Latin America | 1,682 | 4.0% |
| Lebanon | 20 | 0.1% |
| Lithuania | 30 | 0.1% |
| Malaysia | 10 | 0.0% |
| Mexico | 1,064 | 2.5% |
| Nepal | 127 | 0.3% |
| Nicaragua | 51 | 0.1% |
| Nigeria | 117 | 0.3% |
| Northern Africa | 15 | 0.0% |
| Northern Europe | 468 | 1.1% |
| Oceania | 80 | 0.2% |
| Pakistan | 208 | 0.5% |
| Panama | 73 | 0.2% |
| Peru | 50 | 0.1% |
| Philippines | 188 | 0.4% |
| Poland | 19 | 0.0% |
| Romania | 193 | 0.4% |
| Russia | 55 | 0.1% |
| Saudi Arabia | 78 | 0.2% |
| Scotland | 7 | 0.0% |
| Singapore | 19 | 0.0% |
| South Africa | 157 | 0.4% |
| South America | 469 | 1.1% |
| South Central Asia | 5,785 | 13.6% |
| South Eastern Asia | 700 | 1.7% |
| Southern Europe | 99 | 0.2% |
| Spain | 99 | 0.2% |
| Sri Lanka | 61 | 0.1% |
| Switzerland | 12 | 0.0% |
| Syria | 24 | 0.1% |
| Taiwan | 88 | 0.2% |
| Thailand | 181 | 0.4% |
| Turkey | 48 | 0.1% |
| Uzbekistan | 15 | 0.0% |
| Venezuela | 113 | 0.3% |
| Vietnam | 184 | 0.4% |
| Western Africa | 154 | 0.4% |
| Western Asia | 280 | 0.7% |
| Western Europe | 330 | 0.8% |
| Yemen | 8 | 0.0% |
| Zimbabwe | 12 | 0.0% | View All 76 Rows |
Sex and Age in Coppell
Sex and Age in Coppell
The most populous age groups in Coppell are 10 to 14 Years (2,009 | 9.4%) for men and 35 to 39 Years (1,879 | 8.9%) for women.
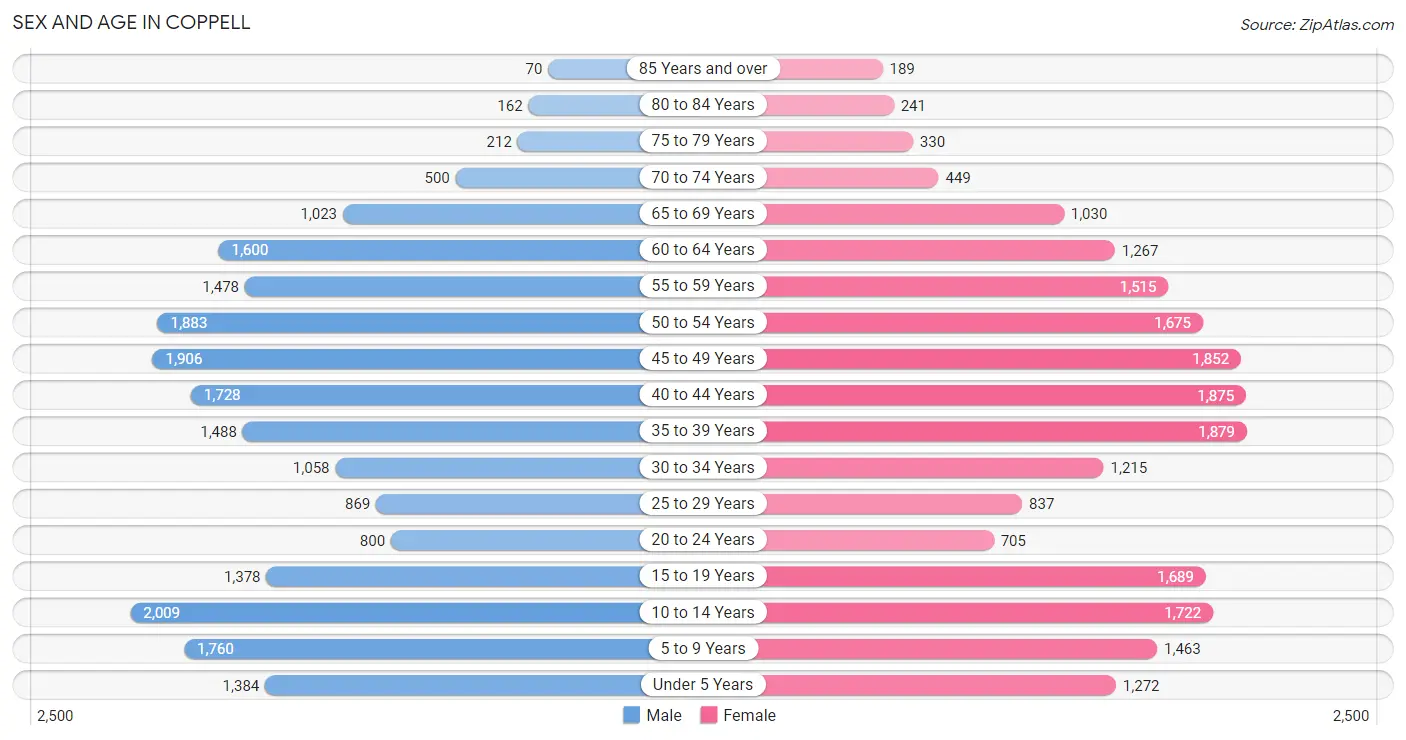
| Age Bracket | Male | Female |
| Under 5 Years | 1,384 (6.5%) | 1,272 (6.0%) |
| 5 to 9 Years | 1,760 (8.3%) | 1,463 (6.9%) |
| 10 to 14 Years | 2,009 (9.4%) | 1,722 (8.1%) |
| 15 to 19 Years | 1,378 (6.5%) | 1,689 (8.0%) |
| 20 to 24 Years | 800 (3.7%) | 705 (3.3%) |
| 25 to 29 Years | 869 (4.1%) | 837 (4.0%) |
| 30 to 34 Years | 1,058 (5.0%) | 1,215 (5.7%) |
| 35 to 39 Years | 1,488 (7.0%) | 1,879 (8.9%) |
| 40 to 44 Years | 1,728 (8.1%) | 1,875 (8.8%) |
| 45 to 49 Years | 1,906 (8.9%) | 1,852 (8.7%) |
| 50 to 54 Years | 1,883 (8.8%) | 1,675 (7.9%) |
| 55 to 59 Years | 1,478 (6.9%) | 1,515 (7.1%) |
| 60 to 64 Years | 1,600 (7.5%) | 1,267 (6.0%) |
| 65 to 69 Years | 1,023 (4.8%) | 1,030 (4.9%) |
| 70 to 74 Years | 500 (2.4%) | 449 (2.1%) |
| 75 to 79 Years | 212 (1.0%) | 330 (1.6%) |
| 80 to 84 Years | 162 (0.8%) | 241 (1.1%) |
| 85 Years and over | 70 (0.3%) | 189 (0.9%) |
| Total | 21,308 (100.0%) | 21,205 (100.0%) |
Families and Households in Coppell
Median Family Size in Coppell
The median family size in Coppell is 3.13 persons per family, with married-couple families (10,542 | 85.4%) accounting for the largest median family size of 3.19 persons per family. On the other hand, single male/father families (545 | 4.4%) represent the smallest median family size with 2.62 persons per family.
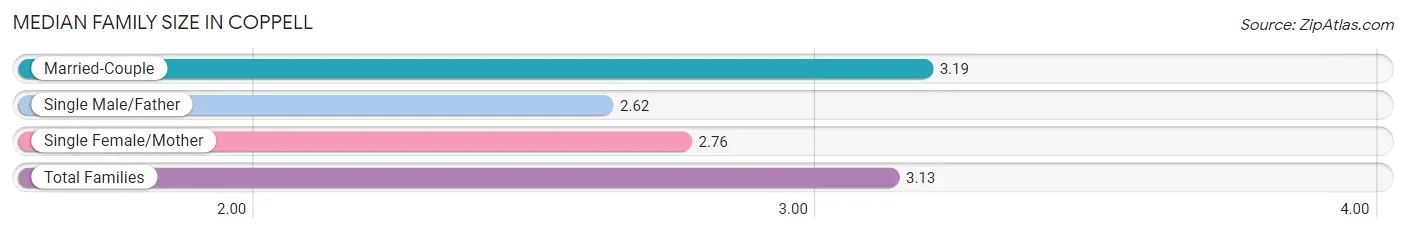
| Family Type | # Families | Family Size |
| Married-Couple | 10,542 (85.4%) | 3.19 |
| Single Male/Father | 545 (4.4%) | 2.62 |
| Single Female/Mother | 1,251 (10.1%) | 2.76 |
| Total Families | 12,338 (100.0%) | 3.13 |
Median Household Size in Coppell
The median household size in Coppell is 2.72 persons per household, with married-couple households (10,542 | 67.5%) accounting for the largest median household size of 3.2 persons per household. non-family households (3,280 | 21.0%) represent the smallest median household size with 1.11 persons per household.
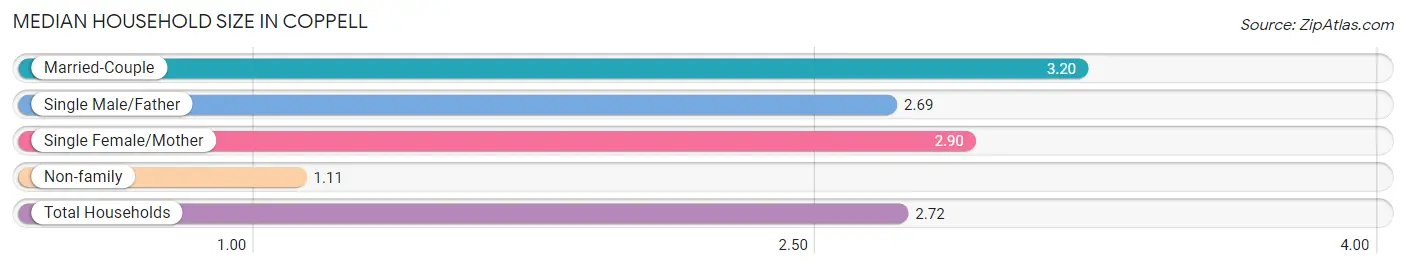
| Household Type | # Households | Household Size |
| Married-Couple | 10,542 (67.5%) | 3.20 |
| Single Male/Father | 545 (3.5%) | 2.69 |
| Single Female/Mother | 1,251 (8.0%) | 2.90 |
| Non-family | 3,280 (21.0%) | 1.11 |
| Total Households | 15,618 (100.0%) | 2.72 |
Household Size by Marriage Status in Coppell
Out of a total of 15,618 households in Coppell, 12,338 (79.0%) are family households, while 3,280 (21.0%) are nonfamily households. The most numerous type of family households are 2-person households, comprising 4,638, and the most common type of nonfamily households are 1-person households, comprising 2,974.
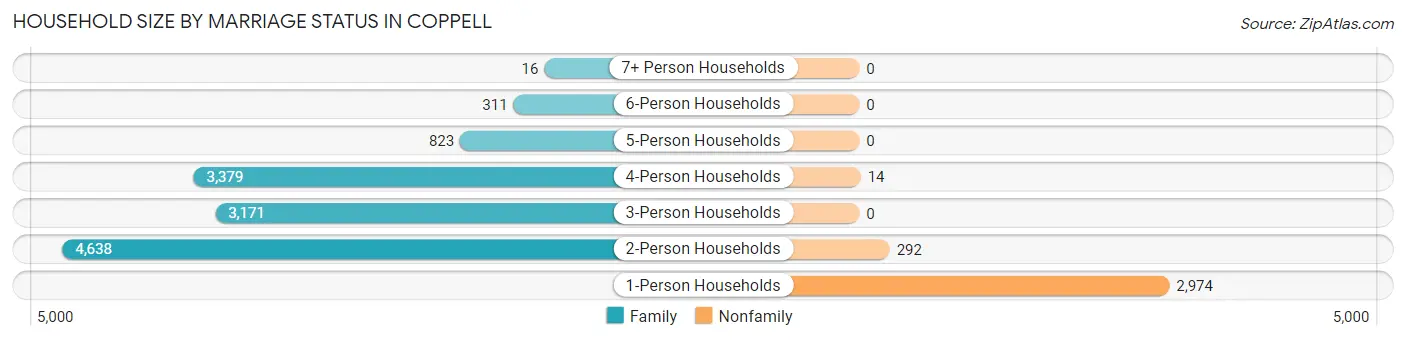
| Household Size | Family Households | Nonfamily Households |
| 1-Person Households | - | 2,974 (19.0%) |
| 2-Person Households | 4,638 (29.7%) | 292 (1.9%) |
| 3-Person Households | 3,171 (20.3%) | 0 (0.0%) |
| 4-Person Households | 3,379 (21.6%) | 14 (0.1%) |
| 5-Person Households | 823 (5.3%) | 0 (0.0%) |
| 6-Person Households | 311 (2.0%) | 0 (0.0%) |
| 7+ Person Households | 16 (0.1%) | 0 (0.0%) |
| Total | 12,338 (79.0%) | 3,280 (21.0%) |
Female Fertility in Coppell
Fertility by Age in Coppell
Average fertility rate in Coppell is 57.0 births per 1,000 women. Women in the age bracket of 20 to 34 years have the highest fertility rate with 93.0 births per 1,000 women. Women in the age bracket of 35 to 50 years acount for 57.3% of all women with births.
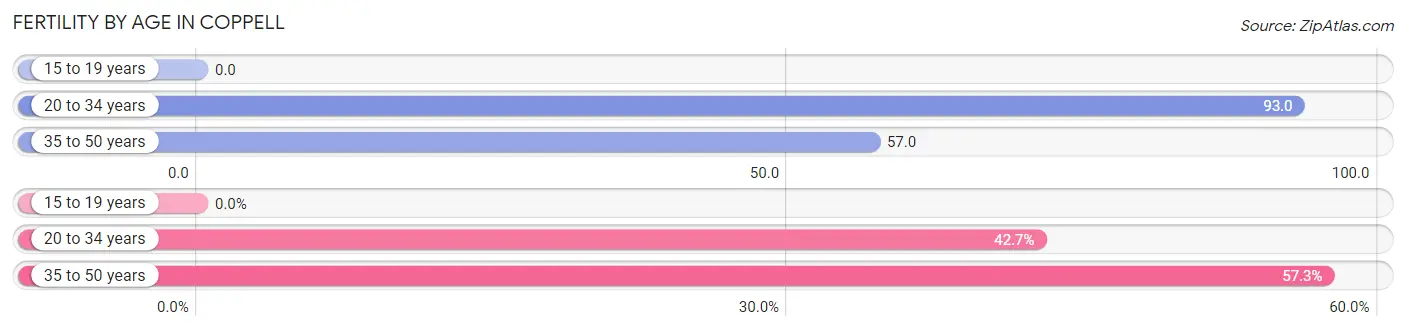
| Age Bracket | Women with Births | Births / 1,000 Women |
| 15 to 19 years | 0 (0.0%) | 0.0 |
| 20 to 34 years | 256 (42.7%) | 93.0 |
| 35 to 50 years | 344 (57.3%) | 57.0 |
| Total | 600 (100.0%) | 57.0 |
Fertility by Age by Marriage Status in Coppell
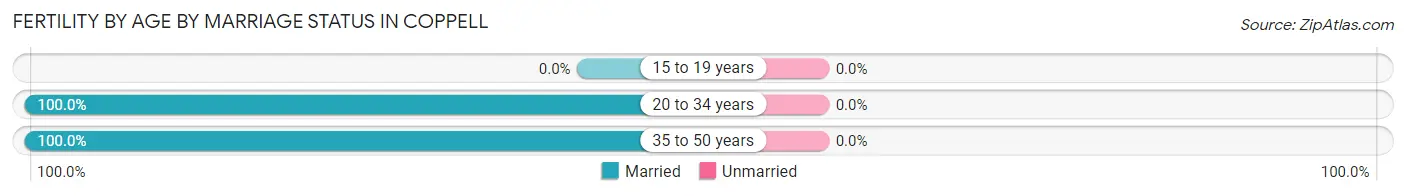
| Age Bracket | Married | Unmarried |
| 15 to 19 years | 0 (0.0%) | 0 (0.0%) |
| 20 to 34 years | 256 (100.0%) | 0 (0.0%) |
| 35 to 50 years | 344 (100.0%) | 0 (0.0%) |
| Total | 600 (100.0%) | 0 (0.0%) |
Fertility by Education in Coppell
Average fertility rate in Coppell is 57.0 births per 1,000 women. Women with the education attainment of high school diploma have the highest fertility rate of 135.0 births per 1,000 women, while women with the education attainment of less than high school have the lowest fertility at 4.0 births per 1,000 women. Women with the education attainment of bachelor's degree represent 47.5% of all women with births.
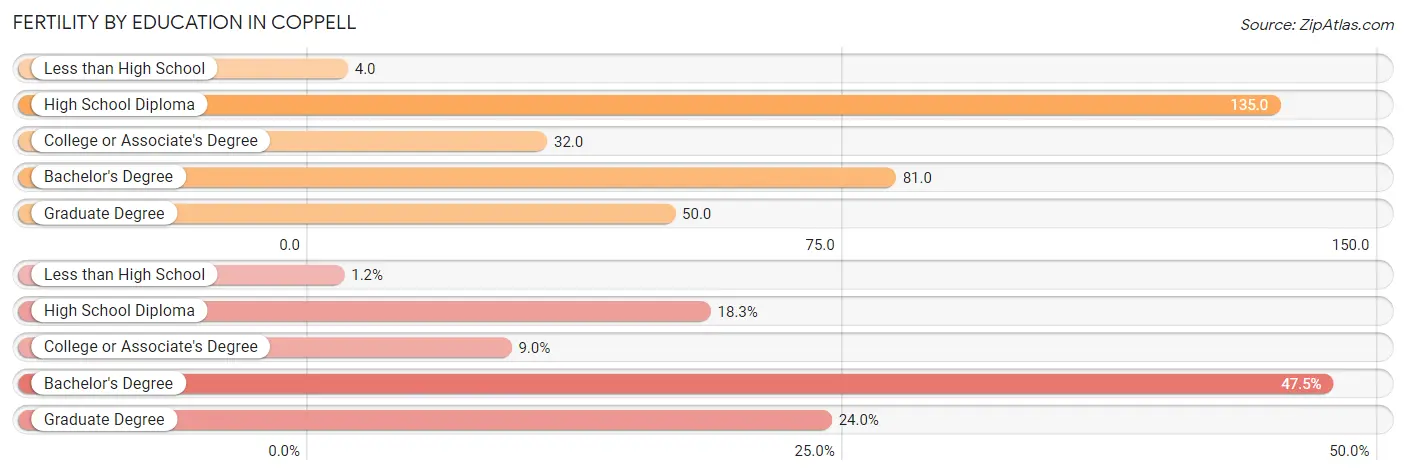
| Educational Attainment | Women with Births | Births / 1,000 Women |
| Less than High School | 7 (1.2%) | 4.0 |
| High School Diploma | 110 (18.3%) | 135.0 |
| College or Associate's Degree | 54 (9.0%) | 32.0 |
| Bachelor's Degree | 285 (47.5%) | 81.0 |
| Graduate Degree | 144 (24.0%) | 50.0 |
| Total | 600 (100.0%) | 57.0 |
Fertility by Education by Marriage Status in Coppell
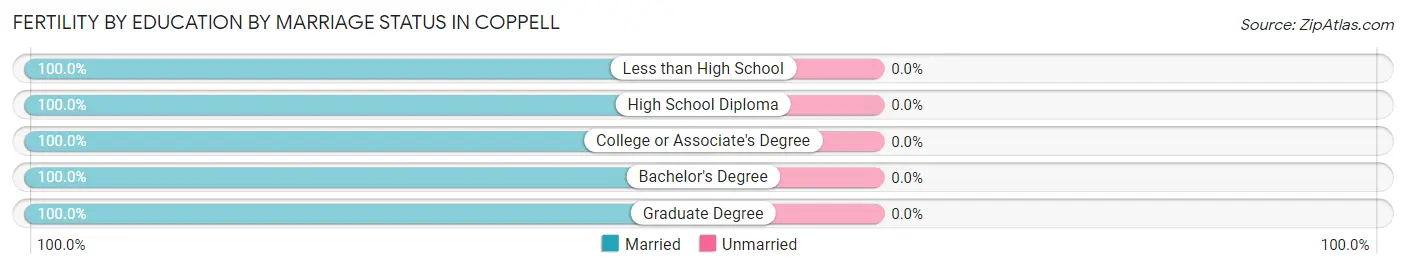
| Educational Attainment | Married | Unmarried |
| Less than High School | 7 (100.0%) | 0 (0.0%) |
| High School Diploma | 110 (100.0%) | 0 (0.0%) |
| College or Associate's Degree | 54 (100.0%) | 0 (0.0%) |
| Bachelor's Degree | 285 (100.0%) | 0 (0.0%) |
| Graduate Degree | 144 (100.0%) | 0 (0.0%) |
| Total | 600 (100.0%) | 0 (0.0%) |
Employment Characteristics in Coppell
Employment by Class of Employer in Coppell
Among the 23,054 employed individuals in Coppell, private company employees (17,350 | 75.3%), not-for-profit organizations (1,320 | 5.7%), and self-employed (not incorporated) (1,316 | 5.7%) make up the most common classes of employment.
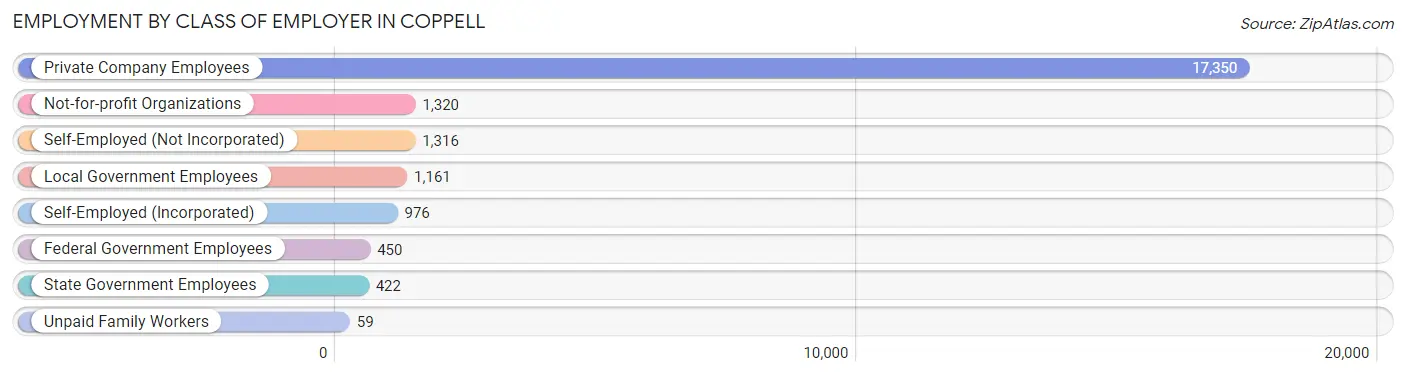
| Employer Class | # Employees | % Employees |
| Private Company Employees | 17,350 | 75.3% |
| Self-Employed (Incorporated) | 976 | 4.2% |
| Self-Employed (Not Incorporated) | 1,316 | 5.7% |
| Not-for-profit Organizations | 1,320 | 5.7% |
| Local Government Employees | 1,161 | 5.0% |
| State Government Employees | 422 | 1.8% |
| Federal Government Employees | 450 | 1.9% |
| Unpaid Family Workers | 59 | 0.3% |
| Total | 23,054 | 100.0% |
Employment Status by Age in Coppell
According to the labor force statistics for Coppell, out of the total population over 16 years of age (32,248), 73.8% or 23,799 individuals are in the labor force, with 1.9% or 452 of them unemployed. The age group with the highest labor force participation rate is 45 to 54 years, with 88.1% or 6,445 individuals in the labor force. Within the labor force, the 20 to 24 years age range has the highest percentage of unemployed individuals, with 10.9% or 103 of them being unemployed.
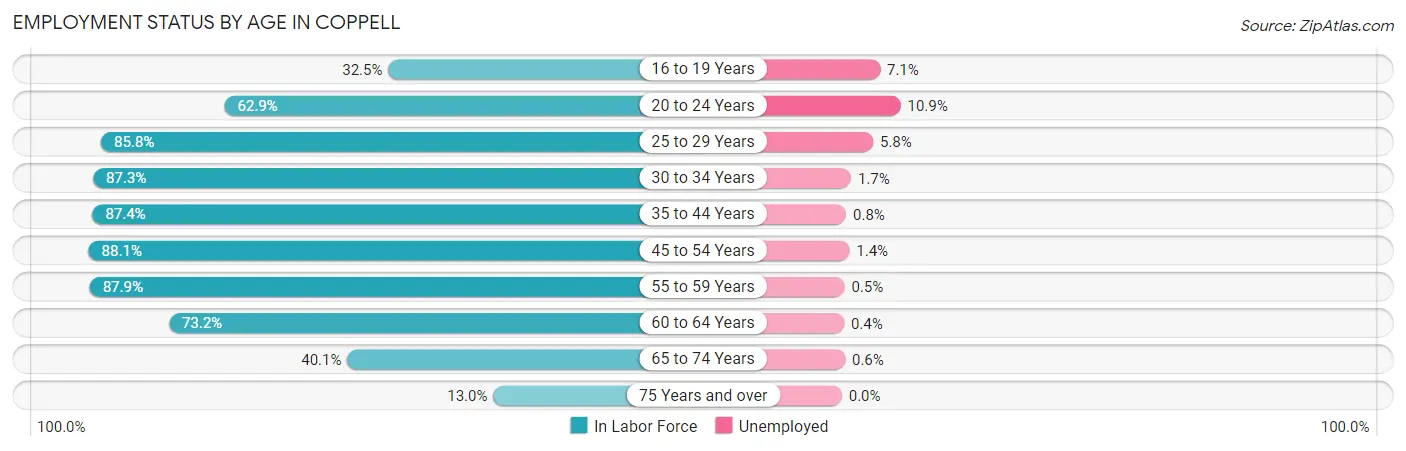
| Age Bracket | In Labor Force | Unemployed |
| 16 to 19 Years | 784 (32.5%) | 56 (7.1%) |
| 20 to 24 Years | 947 (62.9%) | 103 (10.9%) |
| 25 to 29 Years | 1,464 (85.8%) | 85 (5.8%) |
| 30 to 34 Years | 1,984 (87.3%) | 34 (1.7%) |
| 35 to 44 Years | 6,092 (87.4%) | 49 (0.8%) |
| 45 to 54 Years | 6,445 (88.1%) | 90 (1.4%) |
| 55 to 59 Years | 2,631 (87.9%) | 13 (0.5%) |
| 60 to 64 Years | 2,099 (73.2%) | 8 (0.4%) |
| 65 to 74 Years | 1,204 (40.1%) | 7 (0.6%) |
| 75 Years and over | 157 (13.0%) | 0 (0.0%) |
| Total | 23,799 (73.8%) | 452 (1.9%) |
Employment Status by Educational Attainment in Coppell
According to labor force statistics for Coppell, 85.9% of individuals (20,723) out of the total population between 25 and 64 years of age (24,125) are in the labor force, with 1.4% or 290 of them being unemployed. The group with the highest labor force participation rate are those with the educational attainment of bachelor's degree or higher, with 86.5% or 15,252 individuals in the labor force. Within the labor force, individuals with bachelor's degree or higher education have the highest percentage of unemployment, with 1.4% or 214 of them being unemployed.
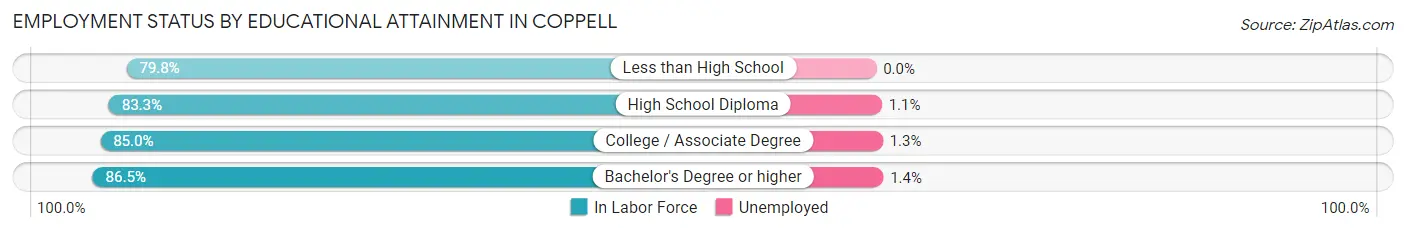
| Educational Attainment | In Labor Force | Unemployed |
| Less than High School | 431 (79.8%) | 0 (0.0%) |
| High School Diploma | 1,514 (83.3%) | 20 (1.1%) |
| College / Associate Degree | 3,516 (85.0%) | 54 (1.3%) |
| Bachelor's Degree or higher | 15,252 (86.5%) | 247 (1.4%) |
| Total | 20,723 (85.9%) | 338 (1.4%) |
Employment Occupations by Sex in Coppell
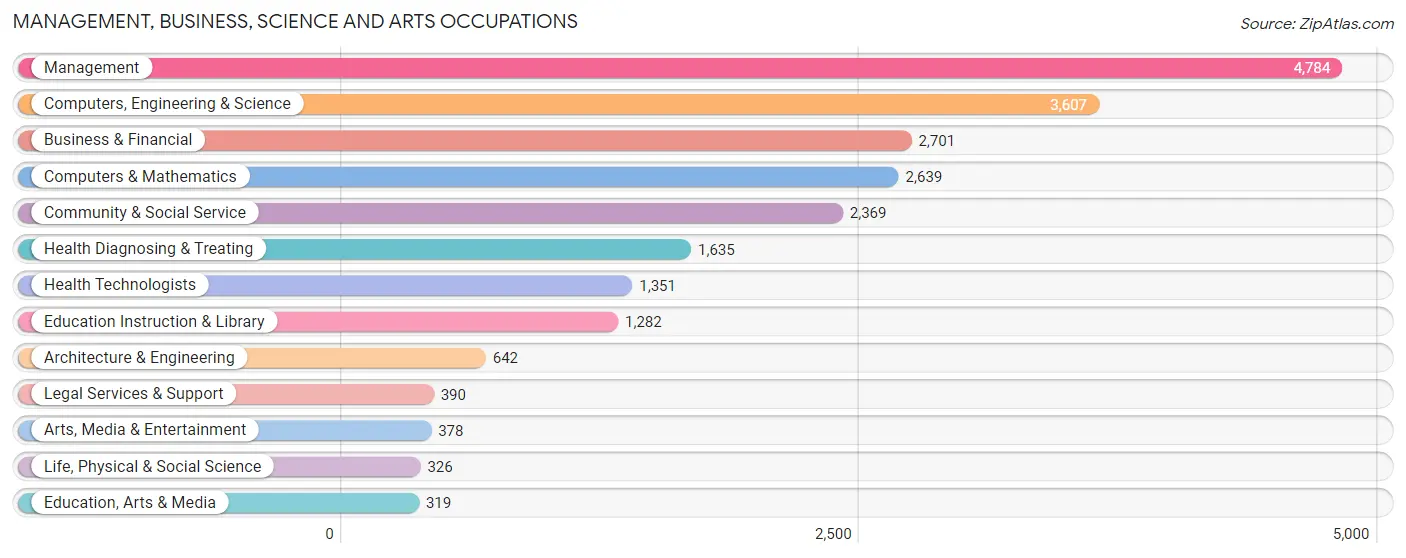
Management, Business, Science and Arts Occupations
The most common Management, Business, Science and Arts occupations in Coppell are Management (4,784 | 20.5%), Computers, Engineering & Science (3,607 | 15.4%), Business & Financial (2,701 | 11.6%), Computers & Mathematics (2,639 | 11.3%), and Community & Social Service (2,369 | 10.1%).
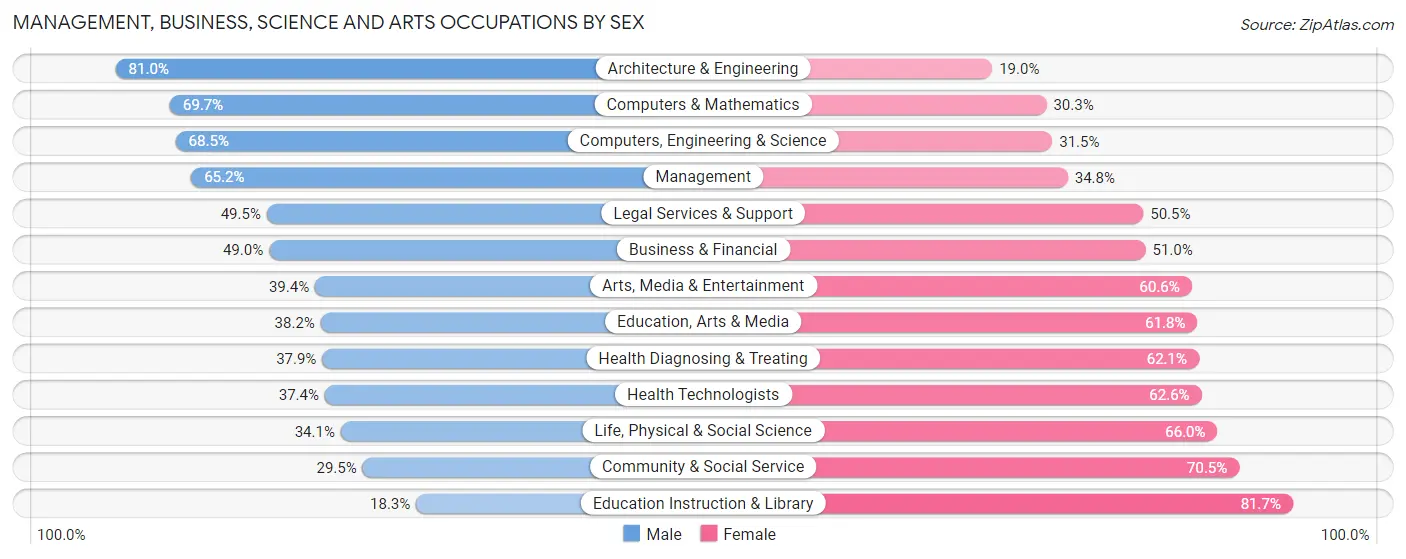
Management, Business, Science and Arts Occupations by Sex
Within the Management, Business, Science and Arts occupations in Coppell, the most male-oriented occupations are Architecture & Engineering (81.0%), Computers & Mathematics (69.7%), and Computers, Engineering & Science (68.5%), while the most female-oriented occupations are Education Instruction & Library (81.7%), Community & Social Service (70.5%), and Life, Physical & Social Science (65.9%).
| Occupation | Male | Female |
| Management | 3,121 (65.2%) | 1,663 (34.8%) |
| Business & Financial | 1,324 (49.0%) | 1,377 (51.0%) |
| Computers, Engineering & Science | 2,470 (68.5%) | 1,137 (31.5%) |
| Computers & Mathematics | 1,839 (69.7%) | 800 (30.3%) |
| Architecture & Engineering | 520 (81.0%) | 122 (19.0%) |
| Life, Physical & Social Science | 111 (34.1%) | 215 (65.9%) |
| Community & Social Service | 699 (29.5%) | 1,670 (70.5%) |
| Education, Arts & Media | 122 (38.2%) | 197 (61.8%) |
| Legal Services & Support | 193 (49.5%) | 197 (50.5%) |
| Education Instruction & Library | 235 (18.3%) | 1,047 (81.7%) |
| Arts, Media & Entertainment | 149 (39.4%) | 229 (60.6%) |
| Health Diagnosing & Treating | 620 (37.9%) | 1,015 (62.1%) |
| Health Technologists | 505 (37.4%) | 846 (62.6%) |
| Total (Category) | 8,234 (54.5%) | 6,862 (45.5%) |
| Total (Overall) | 12,677 (54.3%) | 10,683 (45.7%) |
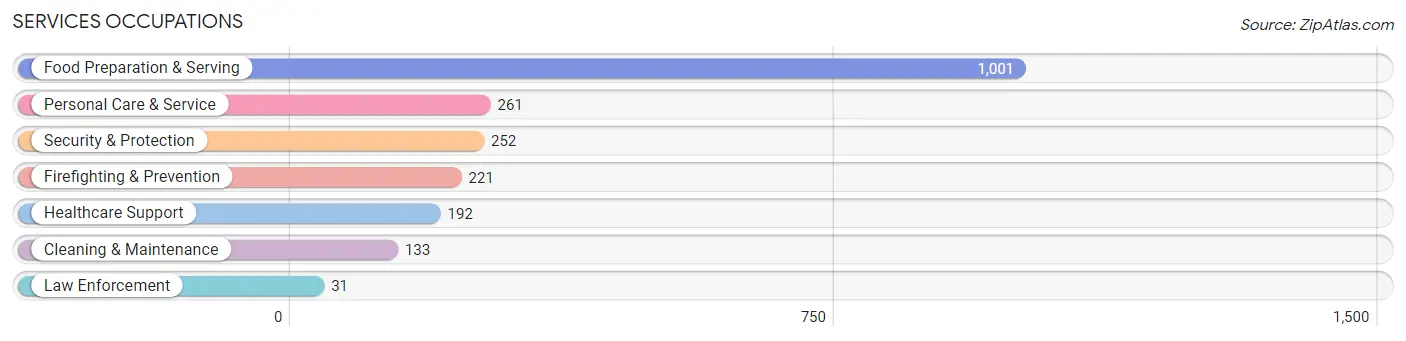
Services Occupations
The most common Services occupations in Coppell are Food Preparation & Serving (1,001 | 4.3%), Personal Care & Service (261 | 1.1%), Security & Protection (252 | 1.1%), Firefighting & Prevention (221 | 0.9%), and Healthcare Support (192 | 0.8%).
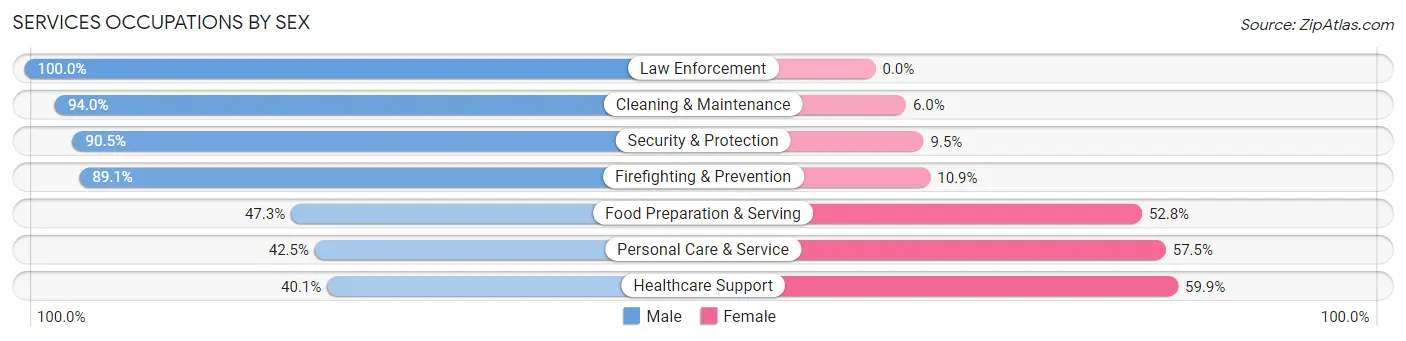
Services Occupations by Sex
Within the Services occupations in Coppell, the most male-oriented occupations are Law Enforcement (100.0%), Cleaning & Maintenance (94.0%), and Security & Protection (90.5%), while the most female-oriented occupations are Healthcare Support (59.9%), Personal Care & Service (57.5%), and Food Preparation & Serving (52.7%).
| Occupation | Male | Female |
| Healthcare Support | 77 (40.1%) | 115 (59.9%) |
| Security & Protection | 228 (90.5%) | 24 (9.5%) |
| Firefighting & Prevention | 197 (89.1%) | 24 (10.9%) |
| Law Enforcement | 31 (100.0%) | 0 (0.0%) |
| Food Preparation & Serving | 473 (47.2%) | 528 (52.7%) |
| Cleaning & Maintenance | 125 (94.0%) | 8 (6.0%) |
| Personal Care & Service | 111 (42.5%) | 150 (57.5%) |
| Total (Category) | 1,014 (55.1%) | 825 (44.9%) |
| Total (Overall) | 12,677 (54.3%) | 10,683 (45.7%) |
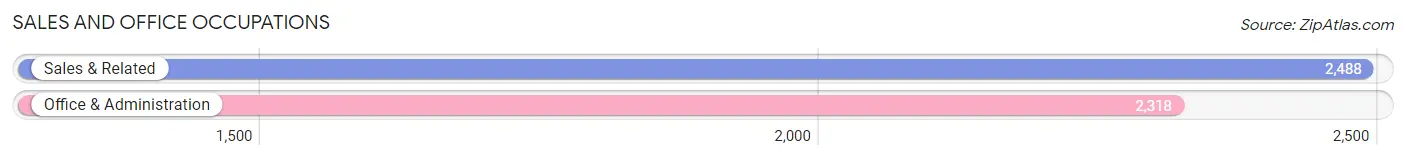
Sales and Office Occupations
The most common Sales and Office occupations in Coppell are Sales & Related (2,488 | 10.6%), and Office & Administration (2,318 | 9.9%).
Sales and Office Occupations by Sex
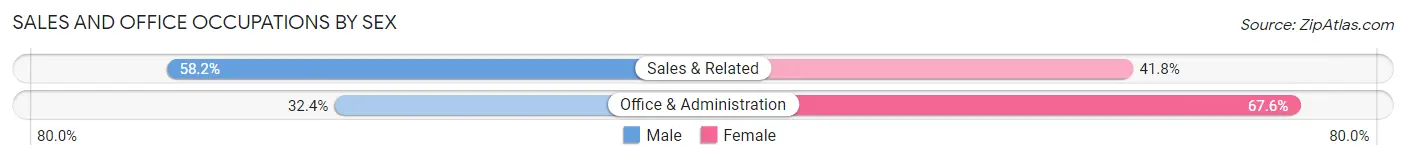
| Occupation | Male | Female |
| Sales & Related | 1,447 (58.2%) | 1,041 (41.8%) |
| Office & Administration | 751 (32.4%) | 1,567 (67.6%) |
| Total (Category) | 2,198 (45.7%) | 2,608 (54.3%) |
| Total (Overall) | 12,677 (54.3%) | 10,683 (45.7%) |
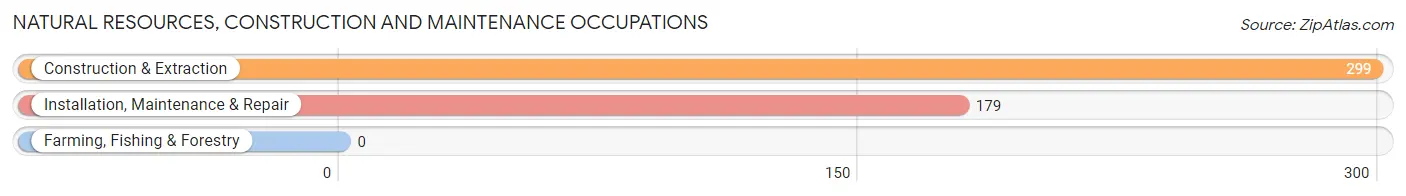
Natural Resources, Construction and Maintenance Occupations
The most common Natural Resources, Construction and Maintenance occupations in Coppell are Construction & Extraction (299 | 1.3%), and Installation, Maintenance & Repair (179 | 0.8%).
Natural Resources, Construction and Maintenance Occupations by Sex
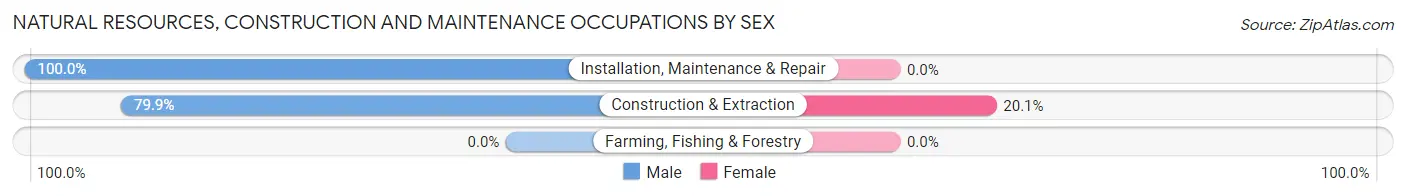
| Occupation | Male | Female |
| Farming, Fishing & Forestry | 0 (0.0%) | 0 (0.0%) |
| Construction & Extraction | 239 (79.9%) | 60 (20.1%) |
| Installation, Maintenance & Repair | 179 (100.0%) | 0 (0.0%) |
| Total (Category) | 418 (87.5%) | 60 (12.6%) |
| Total (Overall) | 12,677 (54.3%) | 10,683 (45.7%) |
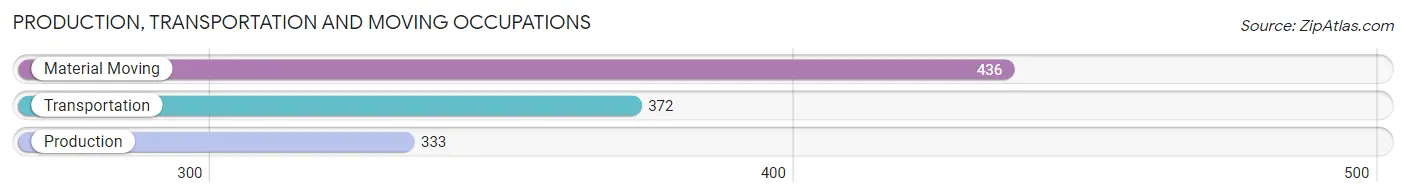
Production, Transportation and Moving Occupations
The most common Production, Transportation and Moving occupations in Coppell are Material Moving (436 | 1.9%), Transportation (372 | 1.6%), and Production (333 | 1.4%).
Production, Transportation and Moving Occupations by Sex
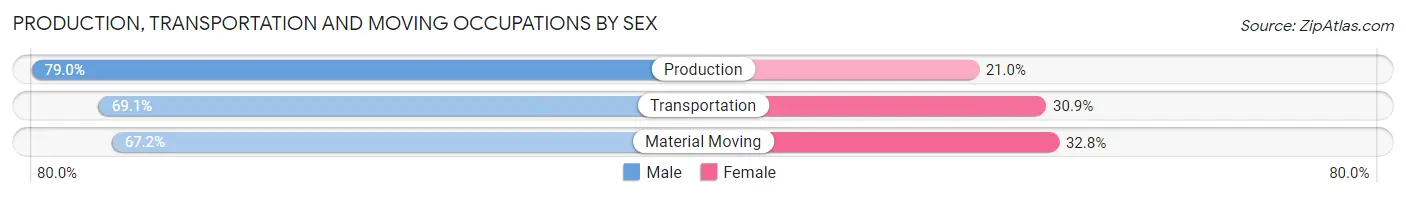
| Occupation | Male | Female |
| Production | 263 (79.0%) | 70 (21.0%) |
| Transportation | 257 (69.1%) | 115 (30.9%) |
| Material Moving | 293 (67.2%) | 143 (32.8%) |
| Total (Category) | 813 (71.3%) | 328 (28.7%) |
| Total (Overall) | 12,677 (54.3%) | 10,683 (45.7%) |
Employment Industries by Sex in Coppell
Employment Industries in Coppell
The major employment industries in Coppell include Professional & Scientific (4,313 | 18.5%), Health Care & Social Assistance (2,848 | 12.2%), Finance & Insurance (2,364 | 10.1%), Retail Trade (2,056 | 8.8%), and Educational Services (1,660 | 7.1%).
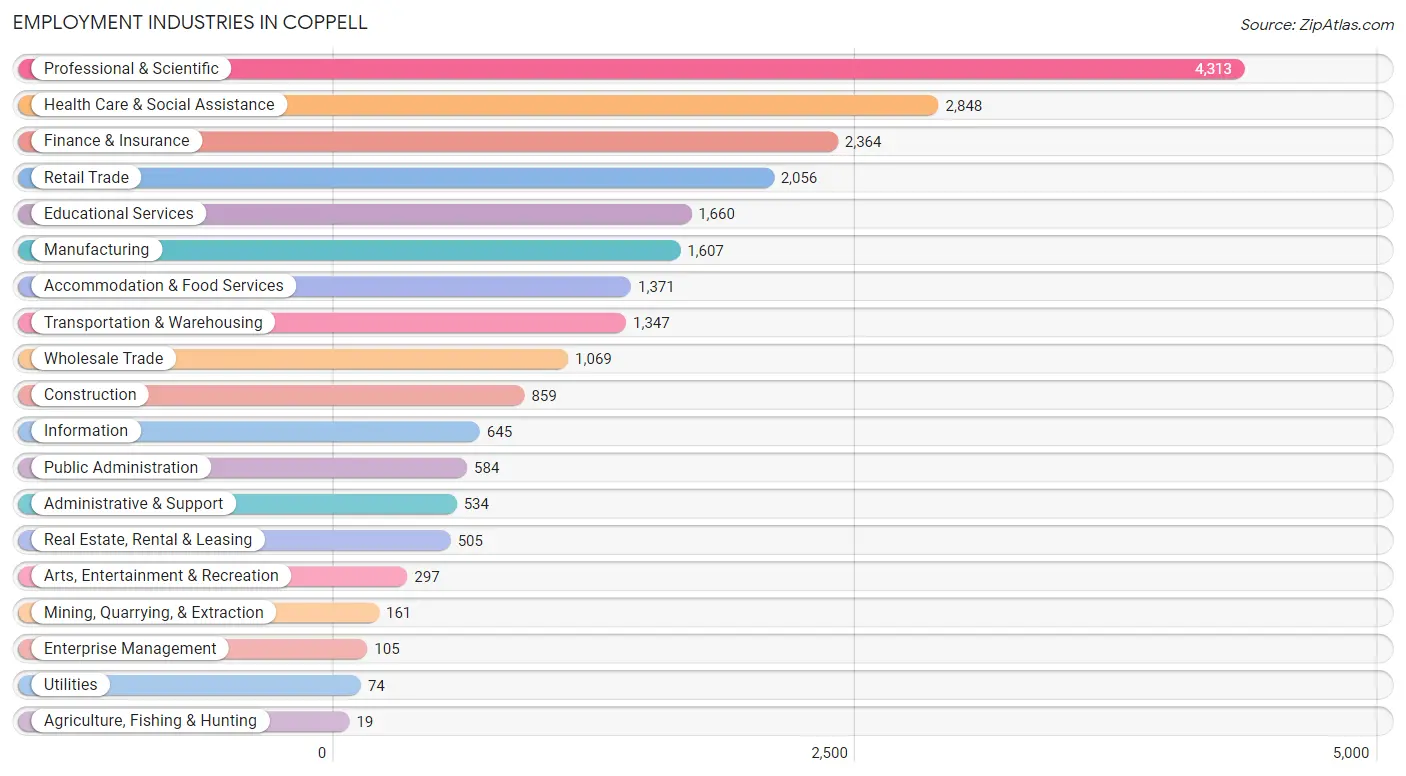
Employment Industries by Sex in Coppell
The Coppell industries that see more men than women are Mining, Quarrying, & Extraction (93.8%), Utilities (85.1%), and Manufacturing (71.9%), whereas the industries that tend to have a higher number of women are Enterprise Management (90.5%), Educational Services (74.5%), and Public Administration (70.9%).
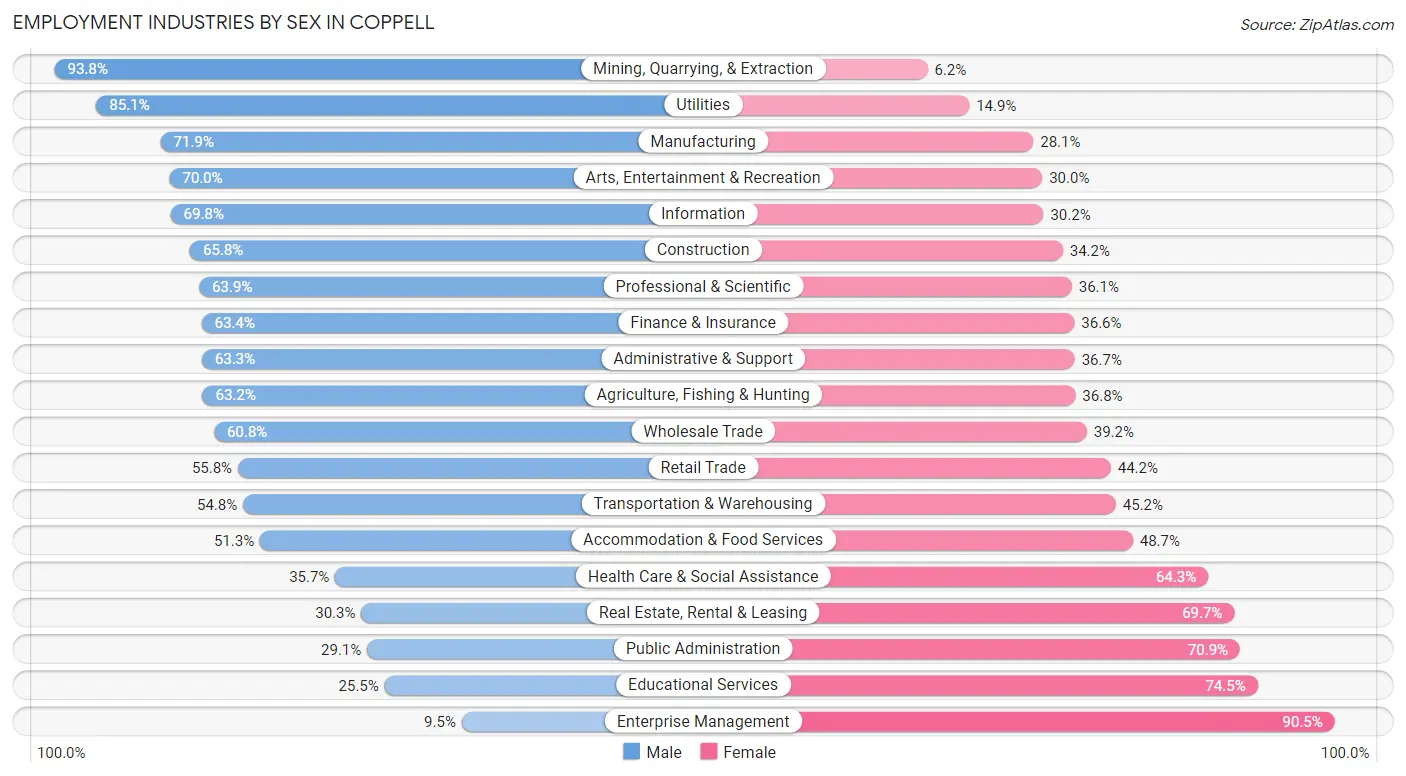
| Industry | Male | Female |
| Agriculture, Fishing & Hunting | 12 (63.2%) | 7 (36.8%) |
| Mining, Quarrying, & Extraction | 151 (93.8%) | 10 (6.2%) |
| Construction | 565 (65.8%) | 294 (34.2%) |
| Manufacturing | 1,155 (71.9%) | 452 (28.1%) |
| Wholesale Trade | 650 (60.8%) | 419 (39.2%) |
| Retail Trade | 1,148 (55.8%) | 908 (44.2%) |
| Transportation & Warehousing | 738 (54.8%) | 609 (45.2%) |
| Utilities | 63 (85.1%) | 11 (14.9%) |
| Information | 450 (69.8%) | 195 (30.2%) |
| Finance & Insurance | 1,498 (63.4%) | 866 (36.6%) |
| Real Estate, Rental & Leasing | 153 (30.3%) | 352 (69.7%) |
| Professional & Scientific | 2,756 (63.9%) | 1,557 (36.1%) |
| Enterprise Management | 10 (9.5%) | 95 (90.5%) |
| Administrative & Support | 338 (63.3%) | 196 (36.7%) |
| Educational Services | 423 (25.5%) | 1,237 (74.5%) |
| Health Care & Social Assistance | 1,017 (35.7%) | 1,831 (64.3%) |
| Arts, Entertainment & Recreation | 208 (70.0%) | 89 (30.0%) |
| Accommodation & Food Services | 703 (51.3%) | 668 (48.7%) |
| Public Administration | 170 (29.1%) | 414 (70.9%) |
| Total | 12,677 (54.3%) | 10,683 (45.7%) |
Education in Coppell
School Enrollment in Coppell
The most common levels of schooling among the 12,120 students in Coppell are high school (3,192 | 26.3%), middle school (2,885 | 23.8%), and elementary school (2,521 | 20.8%).
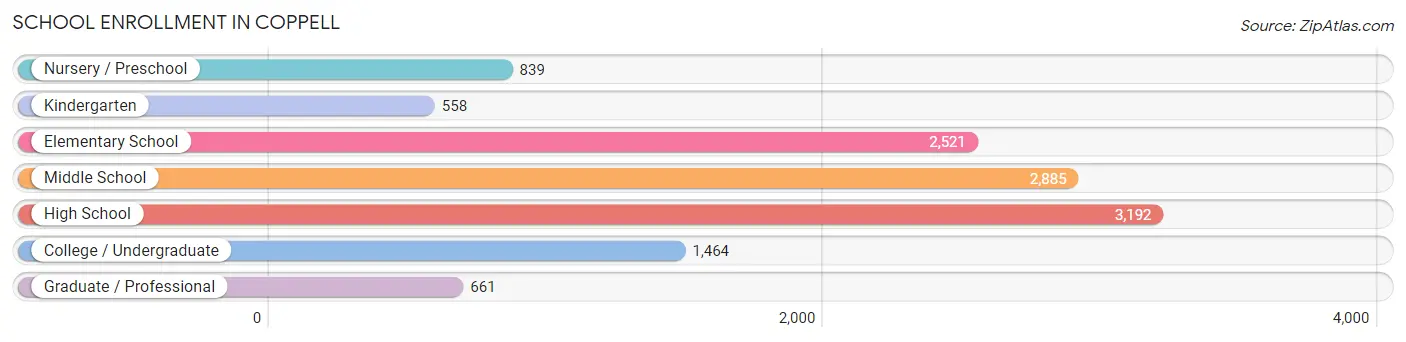
| School Level | # Students | % Students |
| Nursery / Preschool | 839 | 6.9% |
| Kindergarten | 558 | 4.6% |
| Elementary School | 2,521 | 20.8% |
| Middle School | 2,885 | 23.8% |
| High School | 3,192 | 26.3% |
| College / Undergraduate | 1,464 | 12.1% |
| Graduate / Professional | 661 | 5.4% |
| Total | 12,120 | 100.0% |
School Enrollment by Age by Funding Source in Coppell
Out of a total of 12,120 students who are enrolled in schools in Coppell, 1,624 (13.4%) attend a private institution, while the remaining 10,496 (86.6%) are enrolled in public schools. The age group of 3 to 4 year olds has the highest likelihood of being enrolled in private schools, with 368 (62.0% in the age bracket) enrolled. Conversely, the age group of 15 to 17 year olds has the lowest likelihood of being enrolled in a private school, with 2,120 (96.6% in the age bracket) attending a public institution.
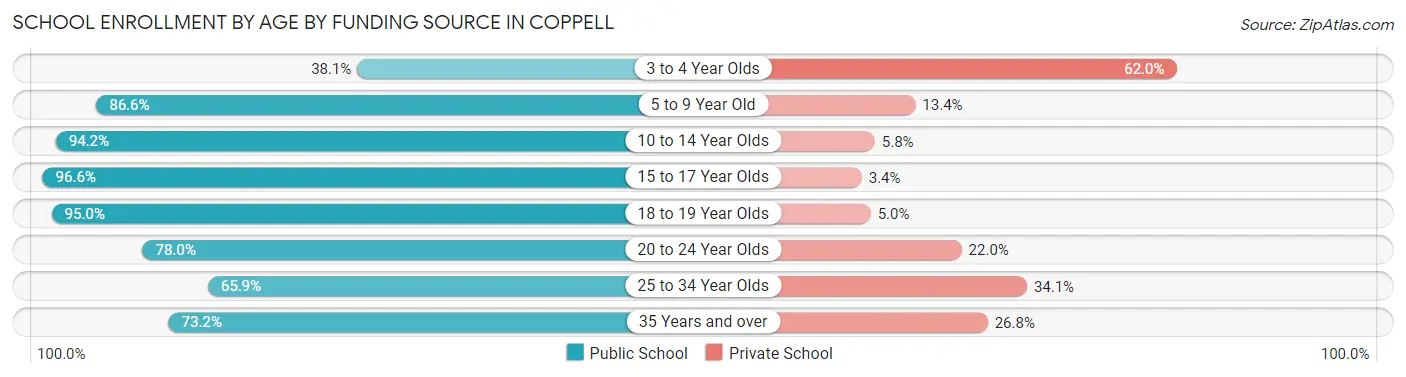
| Age Bracket | Public School | Private School |
| 3 to 4 Year Olds | 226 (38.1%) | 368 (62.0%) |
| 5 to 9 Year Old | 2,619 (86.6%) | 404 (13.4%) |
| 10 to 14 Year Olds | 3,451 (94.2%) | 213 (5.8%) |
| 15 to 17 Year Olds | 2,120 (96.6%) | 74 (3.4%) |
| 18 to 19 Year Olds | 697 (95.0%) | 37 (5.0%) |
| 20 to 24 Year Olds | 536 (78.0%) | 151 (22.0%) |
| 25 to 34 Year Olds | 438 (65.9%) | 227 (34.1%) |
| 35 Years and over | 409 (73.2%) | 150 (26.8%) |
| Total | 10,496 (86.6%) | 1,624 (13.4%) |
Educational Attainment by Field of Study in Coppell
Business (5,531 | 26.1%), engineering (3,417 | 16.1%), computers & mathematics (1,795 | 8.5%), social sciences (1,612 | 7.6%), and science & technology (1,493 | 7.0%) are the most common fields of study among 21,209 individuals in Coppell who have obtained a bachelor's degree or higher.
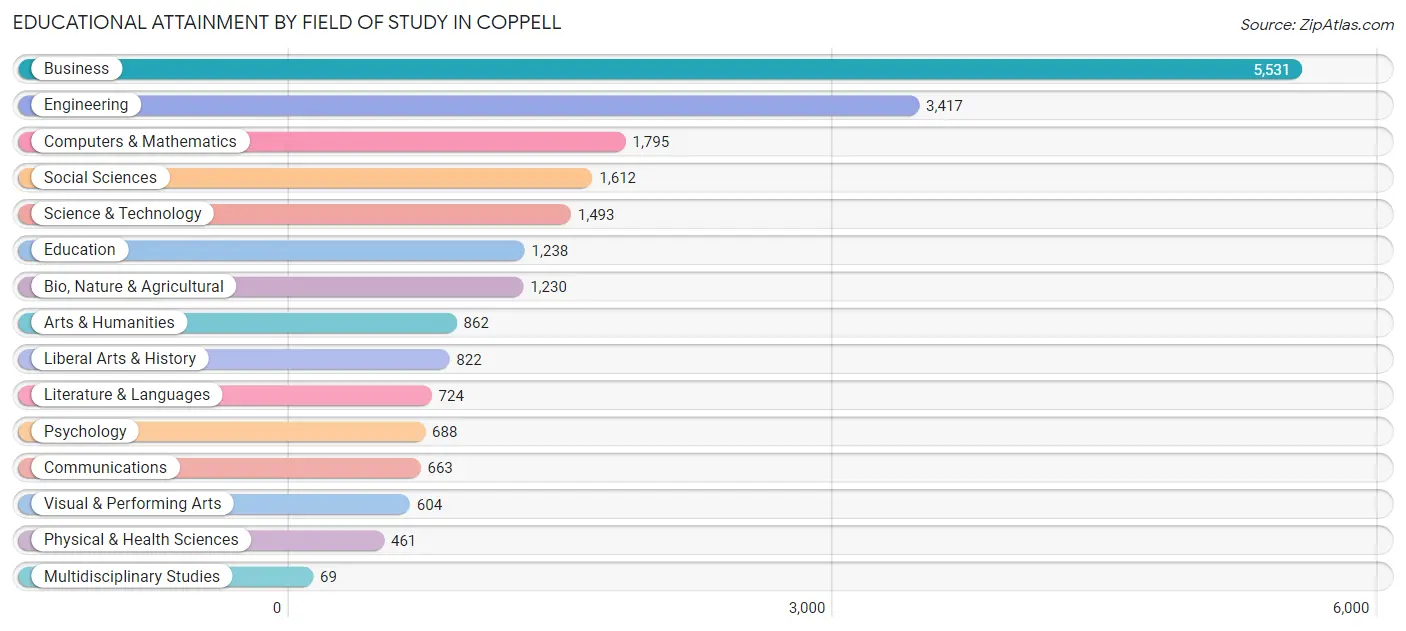
| Field of Study | # Graduates | % Graduates |
| Computers & Mathematics | 1,795 | 8.5% |
| Bio, Nature & Agricultural | 1,230 | 5.8% |
| Physical & Health Sciences | 461 | 2.2% |
| Psychology | 688 | 3.2% |
| Social Sciences | 1,612 | 7.6% |
| Engineering | 3,417 | 16.1% |
| Multidisciplinary Studies | 69 | 0.3% |
| Science & Technology | 1,493 | 7.0% |
| Business | 5,531 | 26.1% |
| Education | 1,238 | 5.8% |
| Literature & Languages | 724 | 3.4% |
| Liberal Arts & History | 822 | 3.9% |
| Visual & Performing Arts | 604 | 2.9% |
| Communications | 663 | 3.1% |
| Arts & Humanities | 862 | 4.1% |
| Total | 21,209 | 100.0% |
Transportation & Commute in Coppell
Vehicle Availability by Sex in Coppell
The most prevalent vehicle ownership categories in Coppell are males with 2 vehicles (7,055, accounting for 56.2%) and females with 2 vehicles (5,301, making up 67.2%).
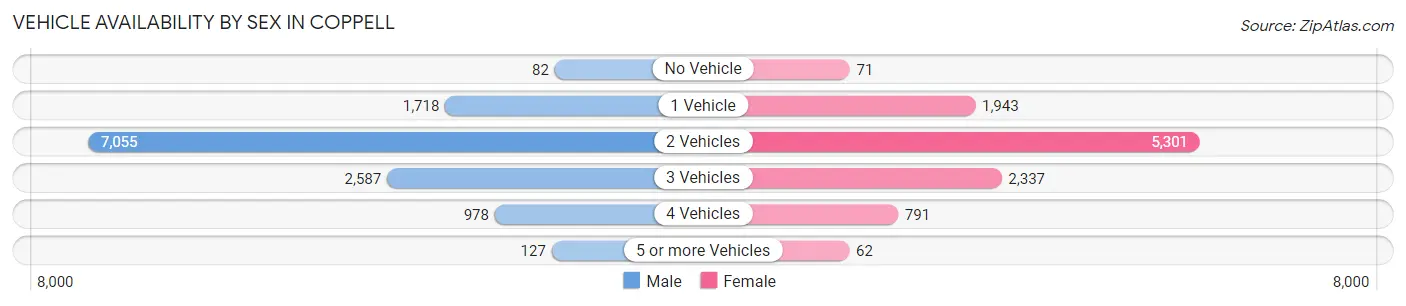
| Vehicles Available | Male | Female |
| No Vehicle | 82 (0.6%) | 71 (0.7%) |
| 1 Vehicle | 1,718 (13.7%) | 1,943 (18.5%) |
| 2 Vehicles | 7,055 (56.2%) | 5,301 (50.5%) |
| 3 Vehicles | 2,587 (20.6%) | 2,337 (22.3%) |
| 4 Vehicles | 978 (7.8%) | 791 (7.5%) |
| 5 or more Vehicles | 127 (1.0%) | 62 (0.6%) |
| Total | 12,547 (100.0%) | 10,505 (100.0%) |
Commute Time in Coppell
The most frequently occuring commute durations in Coppell are 20 to 24 minutes (3,765 commuters, 21.7%), 30 to 34 minutes (3,256 commuters, 18.8%), and 15 to 19 minutes (2,255 commuters, 13.0%).
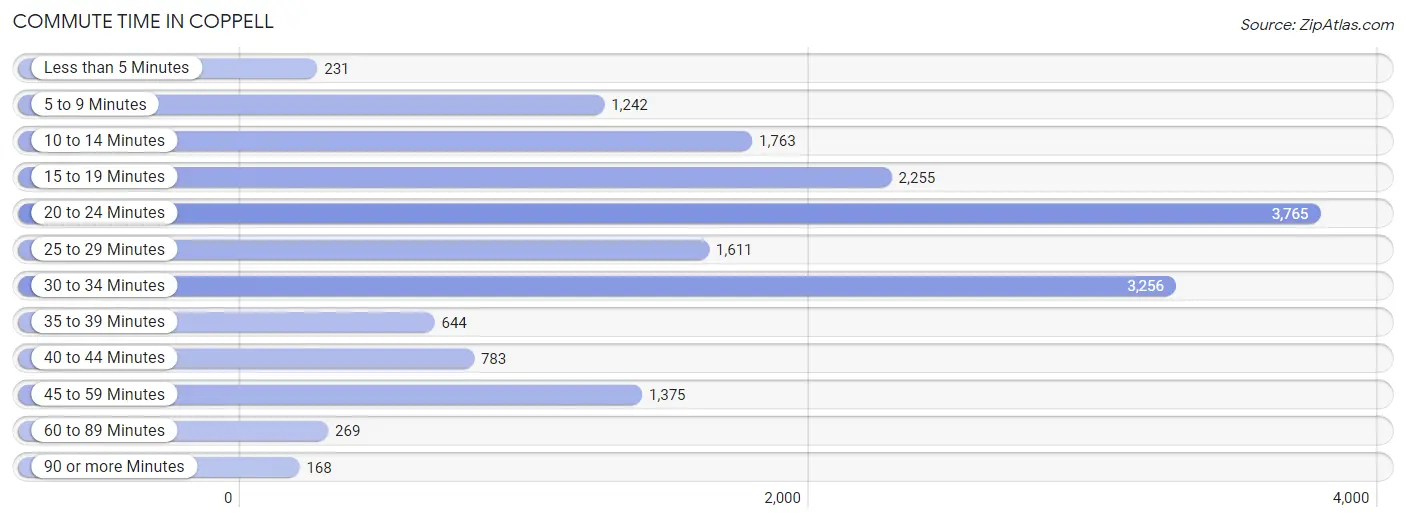
| Commute Time | # Commuters | % Commuters |
| Less than 5 Minutes | 231 | 1.3% |
| 5 to 9 Minutes | 1,242 | 7.1% |
| 10 to 14 Minutes | 1,763 | 10.2% |
| 15 to 19 Minutes | 2,255 | 13.0% |
| 20 to 24 Minutes | 3,765 | 21.7% |
| 25 to 29 Minutes | 1,611 | 9.3% |
| 30 to 34 Minutes | 3,256 | 18.8% |
| 35 to 39 Minutes | 644 | 3.7% |
| 40 to 44 Minutes | 783 | 4.5% |
| 45 to 59 Minutes | 1,375 | 7.9% |
| 60 to 89 Minutes | 269 | 1.5% |
| 90 or more Minutes | 168 | 1.0% |
Commute Time by Sex in Coppell
The most common commute times in Coppell are 30 to 34 minutes (2,009 commuters, 21.3%) for males and 20 to 24 minutes (1,902 commuters, 23.9%) for females.
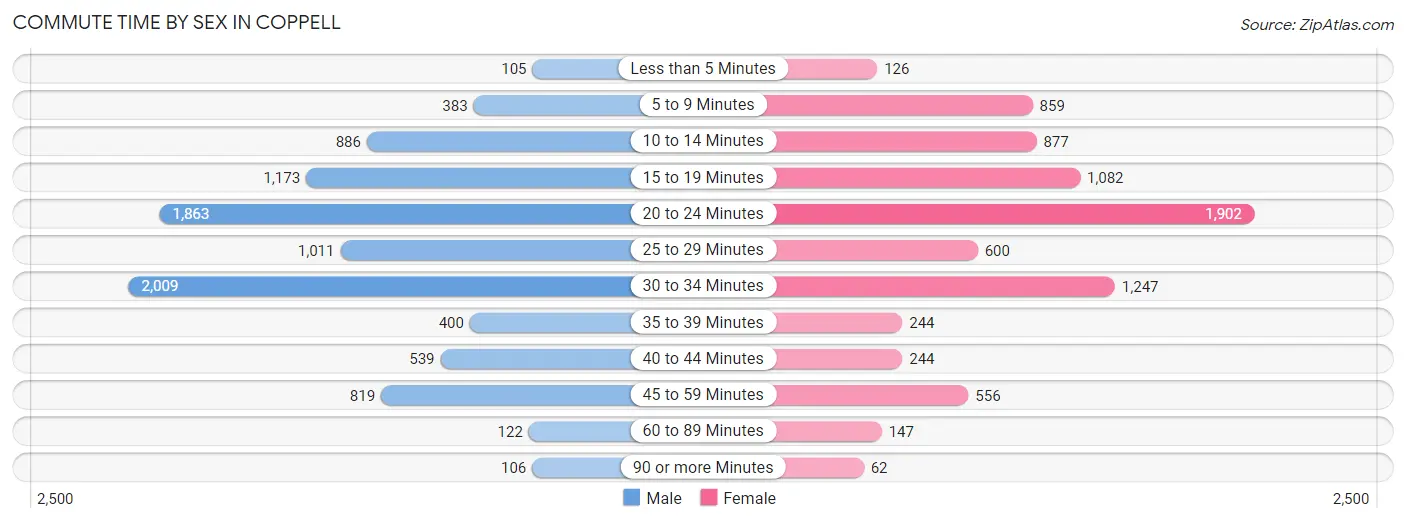
| Commute Time | Male | Female |
| Less than 5 Minutes | 105 (1.1%) | 126 (1.6%) |
| 5 to 9 Minutes | 383 (4.1%) | 859 (10.8%) |
| 10 to 14 Minutes | 886 (9.4%) | 877 (11.0%) |
| 15 to 19 Minutes | 1,173 (12.5%) | 1,082 (13.6%) |
| 20 to 24 Minutes | 1,863 (19.8%) | 1,902 (23.9%) |
| 25 to 29 Minutes | 1,011 (10.7%) | 600 (7.5%) |
| 30 to 34 Minutes | 2,009 (21.3%) | 1,247 (15.7%) |
| 35 to 39 Minutes | 400 (4.3%) | 244 (3.1%) |
| 40 to 44 Minutes | 539 (5.7%) | 244 (3.1%) |
| 45 to 59 Minutes | 819 (8.7%) | 556 (7.0%) |
| 60 to 89 Minutes | 122 (1.3%) | 147 (1.8%) |
| 90 or more Minutes | 106 (1.1%) | 62 (0.8%) |
Time of Departure to Work by Sex in Coppell
The most frequent times of departure to work in Coppell are 8:00 AM to 8:29 AM (2,078, 22.1%) for males and 8:00 AM to 8:29 AM (1,599, 20.1%) for females.
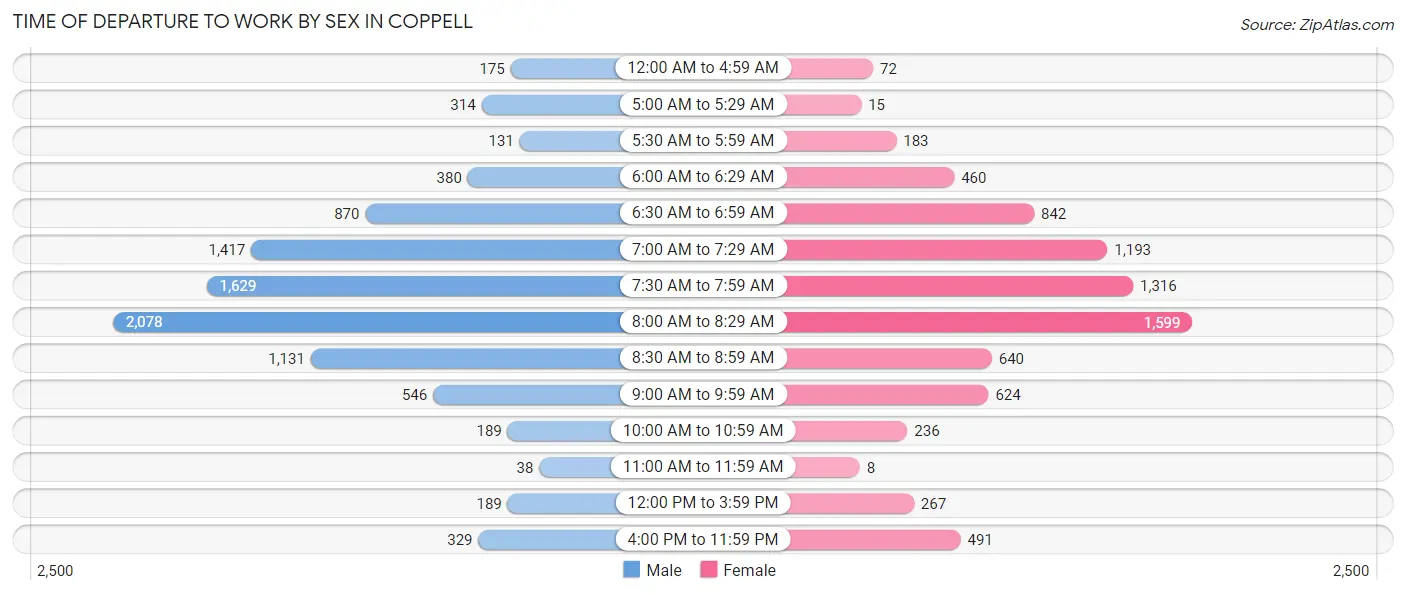
| Time of Departure | Male | Female |
| 12:00 AM to 4:59 AM | 175 (1.9%) | 72 (0.9%) |
| 5:00 AM to 5:29 AM | 314 (3.3%) | 15 (0.2%) |
| 5:30 AM to 5:59 AM | 131 (1.4%) | 183 (2.3%) |
| 6:00 AM to 6:29 AM | 380 (4.0%) | 460 (5.8%) |
| 6:30 AM to 6:59 AM | 870 (9.2%) | 842 (10.6%) |
| 7:00 AM to 7:29 AM | 1,417 (15.0%) | 1,193 (15.0%) |
| 7:30 AM to 7:59 AM | 1,629 (17.3%) | 1,316 (16.6%) |
| 8:00 AM to 8:29 AM | 2,078 (22.1%) | 1,599 (20.1%) |
| 8:30 AM to 8:59 AM | 1,131 (12.0%) | 640 (8.1%) |
| 9:00 AM to 9:59 AM | 546 (5.8%) | 624 (7.9%) |
| 10:00 AM to 10:59 AM | 189 (2.0%) | 236 (3.0%) |
| 11:00 AM to 11:59 AM | 38 (0.4%) | 8 (0.1%) |
| 12:00 PM to 3:59 PM | 189 (2.0%) | 267 (3.4%) |
| 4:00 PM to 11:59 PM | 329 (3.5%) | 491 (6.2%) |
| Total | 9,416 (100.0%) | 7,946 (100.0%) |
Housing Occupancy in Coppell
Occupancy by Ownership in Coppell
Of the total 15,618 dwellings in Coppell, owner-occupied units account for 11,012 (70.5%), while renter-occupied units make up 4,606 (29.5%).
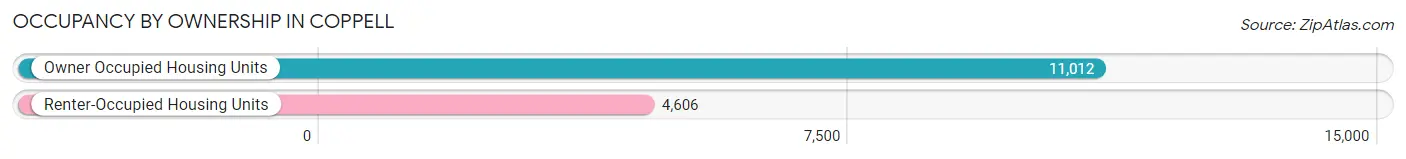
| Occupancy | # Housing Units | % Housing Units |
| Owner Occupied Housing Units | 11,012 | 70.5% |
| Renter-Occupied Housing Units | 4,606 | 29.5% |
| Total Occupied Housing Units | 15,618 | 100.0% |
Occupancy by Household Size in Coppell
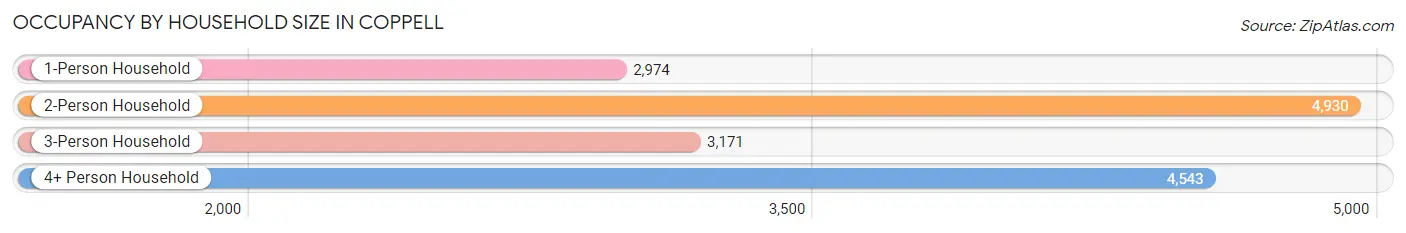
| Household Size | # Housing Units | % Housing Units |
| 1-Person Household | 2,974 | 19.0% |
| 2-Person Household | 4,930 | 31.6% |
| 3-Person Household | 3,171 | 20.3% |
| 4+ Person Household | 4,543 | 29.1% |
| Total Housing Units | 15,618 | 100.0% |
Occupancy by Ownership by Household Size in Coppell
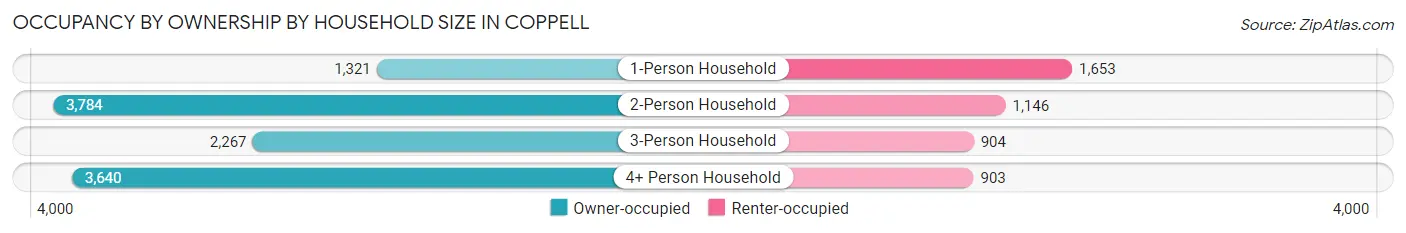
| Household Size | Owner-occupied | Renter-occupied |
| 1-Person Household | 1,321 (44.4%) | 1,653 (55.6%) |
| 2-Person Household | 3,784 (76.7%) | 1,146 (23.3%) |
| 3-Person Household | 2,267 (71.5%) | 904 (28.5%) |
| 4+ Person Household | 3,640 (80.1%) | 903 (19.9%) |
| Total Housing Units | 11,012 (70.5%) | 4,606 (29.5%) |
Occupancy by Educational Attainment in Coppell
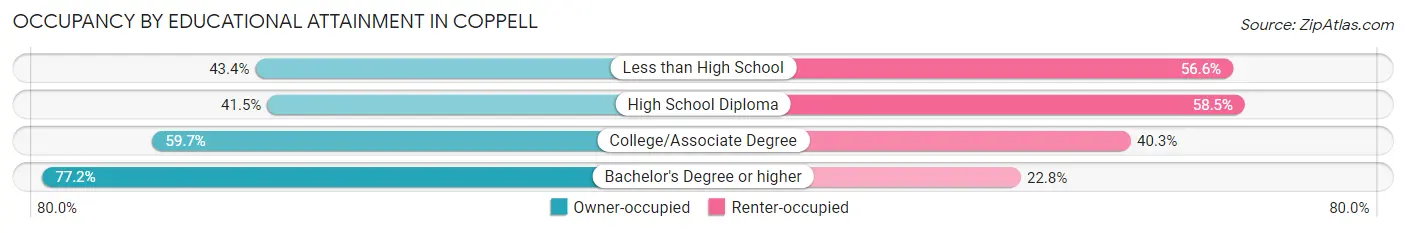
| Household Size | Owner-occupied | Renter-occupied |
| Less than High School | 132 (43.4%) | 172 (56.6%) |
| High School Diploma | 493 (41.5%) | 694 (58.5%) |
| College/Associate Degree | 1,766 (59.7%) | 1,191 (40.3%) |
| Bachelor's Degree or higher | 8,621 (77.2%) | 2,549 (22.8%) |
Occupancy by Age of Householder in Coppell
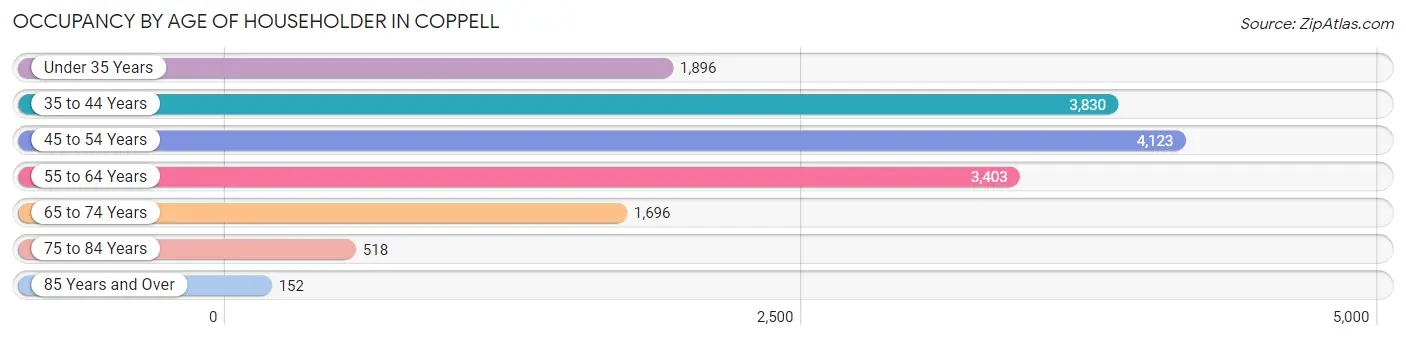
| Age Bracket | # Households | % Households |
| Under 35 Years | 1,896 | 12.1% |
| 35 to 44 Years | 3,830 | 24.5% |
| 45 to 54 Years | 4,123 | 26.4% |
| 55 to 64 Years | 3,403 | 21.8% |
| 65 to 74 Years | 1,696 | 10.9% |
| 75 to 84 Years | 518 | 3.3% |
| 85 Years and Over | 152 | 1.0% |
| Total | 15,618 | 100.0% |
Housing Finances in Coppell
Median Income by Occupancy in Coppell
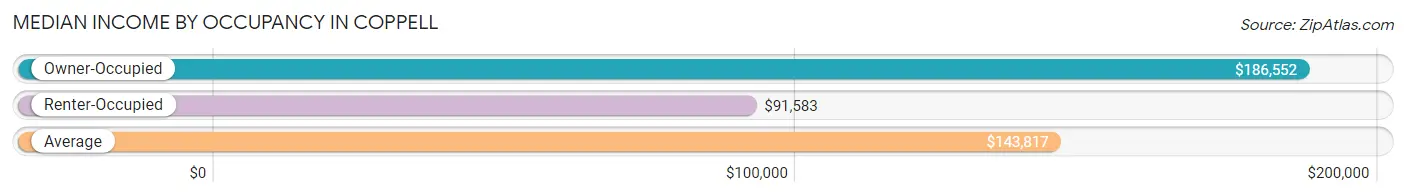
| Occupancy Type | # Households | Median Income |
| Owner-Occupied | 11,012 (70.5%) | $186,552 |
| Renter-Occupied | 4,606 (29.5%) | $91,583 |
| Average | 15,618 (100.0%) | $143,817 |
Occupancy by Householder Income Bracket in Coppell
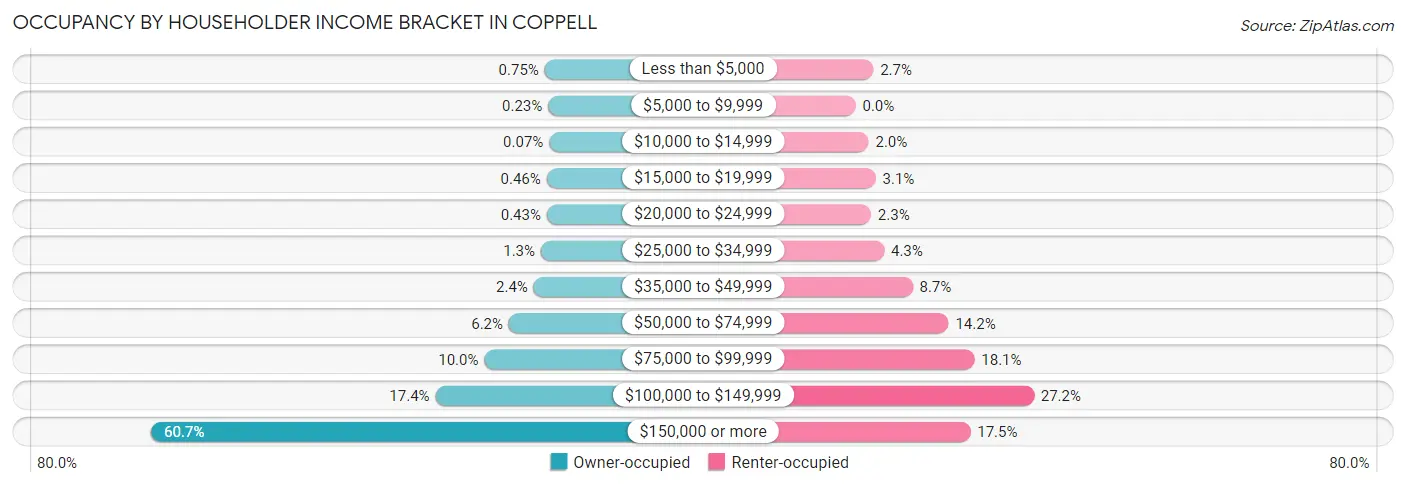
| Income Bracket | Owner-occupied | Renter-occupied |
| Less than $5,000 | 83 (0.7%) | 124 (2.7%) |
| $5,000 to $9,999 | 25 (0.2%) | 0 (0.0%) |
| $10,000 to $14,999 | 8 (0.1%) | 91 (2.0%) |
| $15,000 to $19,999 | 51 (0.5%) | 141 (3.1%) |
| $20,000 to $24,999 | 47 (0.4%) | 108 (2.3%) |
| $25,000 to $34,999 | 146 (1.3%) | 200 (4.3%) |
| $35,000 to $49,999 | 268 (2.4%) | 400 (8.7%) |
| $50,000 to $74,999 | 684 (6.2%) | 652 (14.2%) |
| $75,000 to $99,999 | 1,096 (10.0%) | 834 (18.1%) |
| $100,000 to $149,999 | 1,916 (17.4%) | 1,251 (27.2%) |
| $150,000 or more | 6,688 (60.7%) | 805 (17.5%) |
| Total | 11,012 (100.0%) | 4,606 (100.0%) |
Monthly Housing Cost Tiers in Coppell
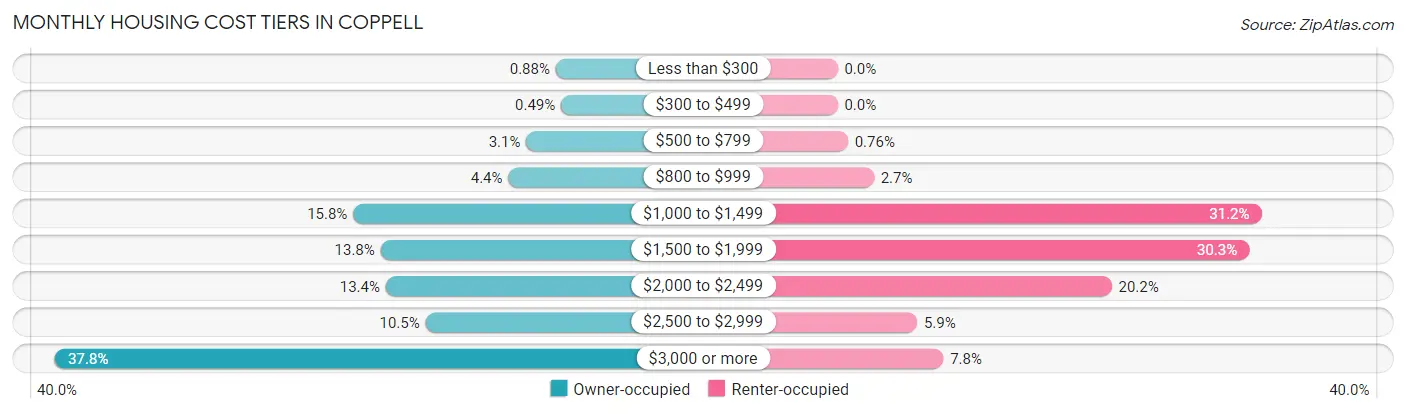
| Monthly Cost | Owner-occupied | Renter-occupied |
| Less than $300 | 97 (0.9%) | 0 (0.0%) |
| $300 to $499 | 54 (0.5%) | 0 (0.0%) |
| $500 to $799 | 336 (3.0%) | 35 (0.8%) |
| $800 to $999 | 481 (4.4%) | 123 (2.7%) |
| $1,000 to $1,499 | 1,740 (15.8%) | 1,438 (31.2%) |
| $1,500 to $1,999 | 1,517 (13.8%) | 1,396 (30.3%) |
| $2,000 to $2,499 | 1,476 (13.4%) | 930 (20.2%) |
| $2,500 to $2,999 | 1,153 (10.5%) | 270 (5.9%) |
| $3,000 or more | 4,158 (37.8%) | 359 (7.8%) |
| Total | 11,012 (100.0%) | 4,606 (100.0%) |
Physical Housing Characteristics in Coppell
Housing Structures in Coppell
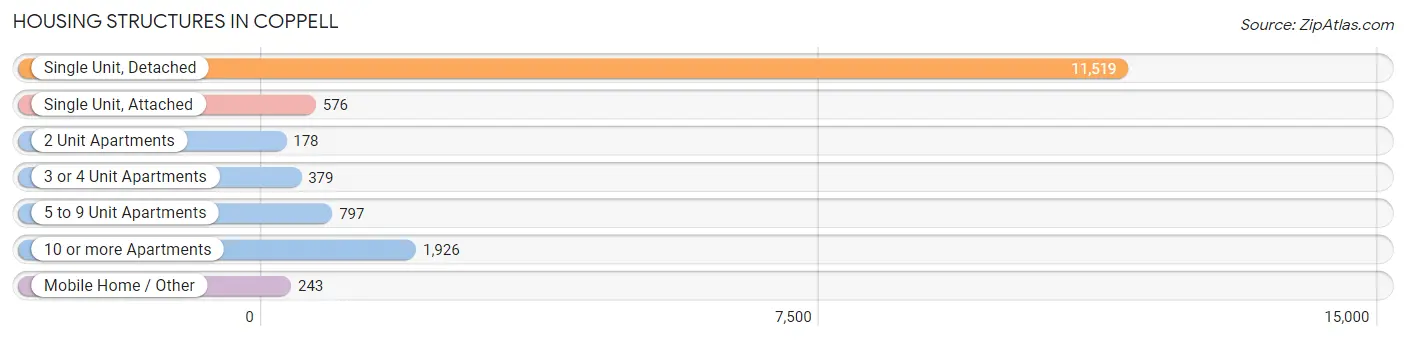
| Structure Type | # Housing Units | % Housing Units |
| Single Unit, Detached | 11,519 | 73.8% |
| Single Unit, Attached | 576 | 3.7% |
| 2 Unit Apartments | 178 | 1.1% |
| 3 or 4 Unit Apartments | 379 | 2.4% |
| 5 to 9 Unit Apartments | 797 | 5.1% |
| 10 or more Apartments | 1,926 | 12.3% |
| Mobile Home / Other | 243 | 1.6% |
| Total | 15,618 | 100.0% |
Housing Structures by Occupancy in Coppell
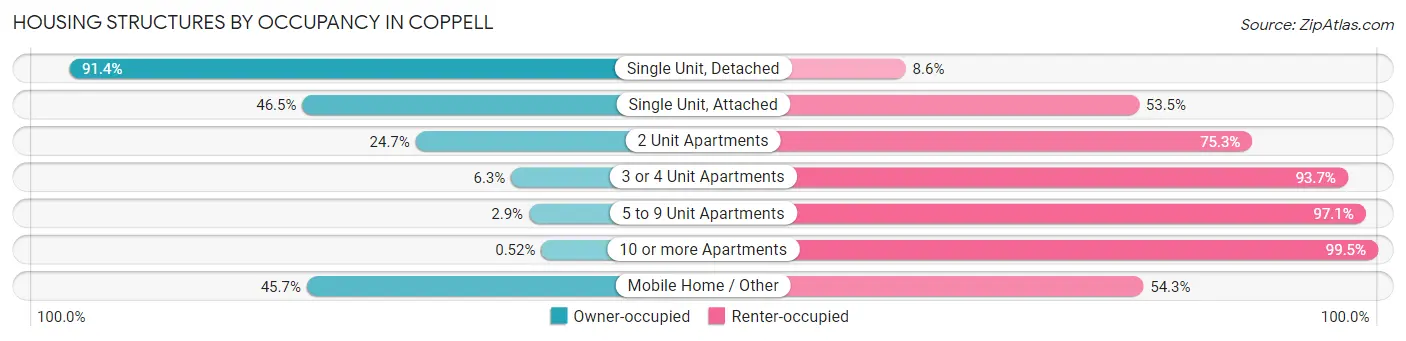
| Structure Type | Owner-occupied | Renter-occupied |
| Single Unit, Detached | 10,532 (91.4%) | 987 (8.6%) |
| Single Unit, Attached | 268 (46.5%) | 308 (53.5%) |
| 2 Unit Apartments | 44 (24.7%) | 134 (75.3%) |
| 3 or 4 Unit Apartments | 24 (6.3%) | 355 (93.7%) |
| 5 to 9 Unit Apartments | 23 (2.9%) | 774 (97.1%) |
| 10 or more Apartments | 10 (0.5%) | 1,916 (99.5%) |
| Mobile Home / Other | 111 (45.7%) | 132 (54.3%) |
| Total | 11,012 (70.5%) | 4,606 (29.5%) |
Housing Structures by Number of Rooms in Coppell
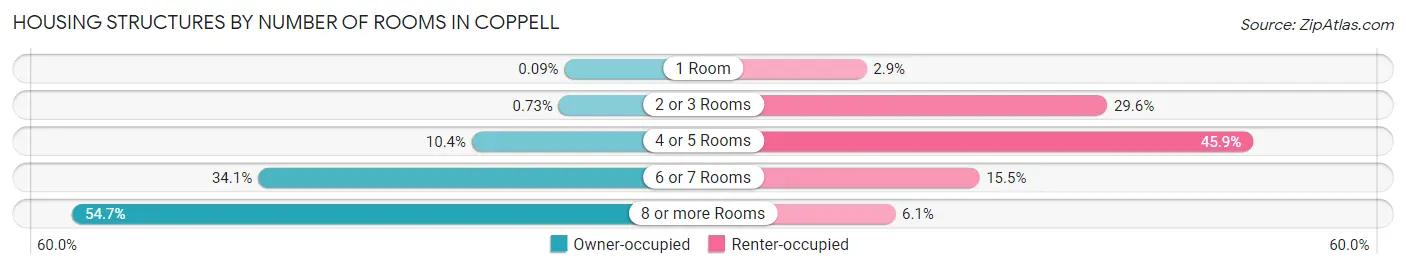
| Number of Rooms | Owner-occupied | Renter-occupied |
| 1 Room | 10 (0.1%) | 135 (2.9%) |
| 2 or 3 Rooms | 80 (0.7%) | 1,365 (29.6%) |
| 4 or 5 Rooms | 1,141 (10.4%) | 2,112 (45.9%) |
| 6 or 7 Rooms | 3,755 (34.1%) | 712 (15.5%) |
| 8 or more Rooms | 6,026 (54.7%) | 282 (6.1%) |
| Total | 11,012 (100.0%) | 4,606 (100.0%) |
Housing Structure by Heating Type in Coppell
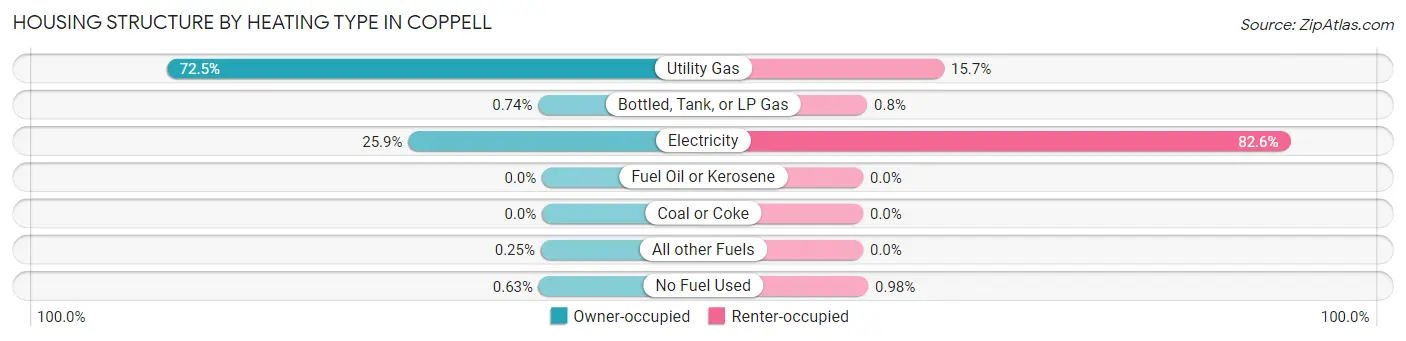
| Heating Type | Owner-occupied | Renter-occupied |
| Utility Gas | 7,988 (72.5%) | 721 (15.7%) |
| Bottled, Tank, or LP Gas | 81 (0.7%) | 37 (0.8%) |
| Electricity | 2,847 (25.9%) | 3,803 (82.6%) |
| Fuel Oil or Kerosene | 0 (0.0%) | 0 (0.0%) |
| Coal or Coke | 0 (0.0%) | 0 (0.0%) |
| All other Fuels | 27 (0.3%) | 0 (0.0%) |
| No Fuel Used | 69 (0.6%) | 45 (1.0%) |
| Total | 11,012 (100.0%) | 4,606 (100.0%) |
Household Vehicle Usage in Coppell
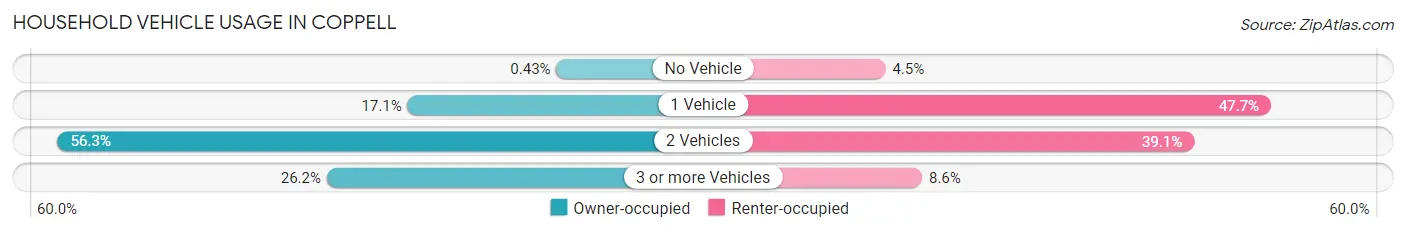
| Vehicles per Household | Owner-occupied | Renter-occupied |
| No Vehicle | 47 (0.4%) | 209 (4.5%) |
| 1 Vehicle | 1,884 (17.1%) | 2,198 (47.7%) |
| 2 Vehicles | 6,201 (56.3%) | 1,801 (39.1%) |
| 3 or more Vehicles | 2,880 (26.2%) | 398 (8.6%) |
| Total | 11,012 (100.0%) | 4,606 (100.0%) |
Real Estate & Mortgages in Coppell
Real Estate and Mortgage Overview in Coppell
| Characteristic | Without Mortgage | With Mortgage |
| Housing Units | 3,699 | 7,313 |
| Median Property Value | $474,700 | $496,700 |
| Median Household Income | $176,458 | $4,660 |
| Monthly Housing Costs | $1,313 | $4,146 |
| Real Estate Taxes | $9,310 | $14 |
Property Value by Mortgage Status in Coppell
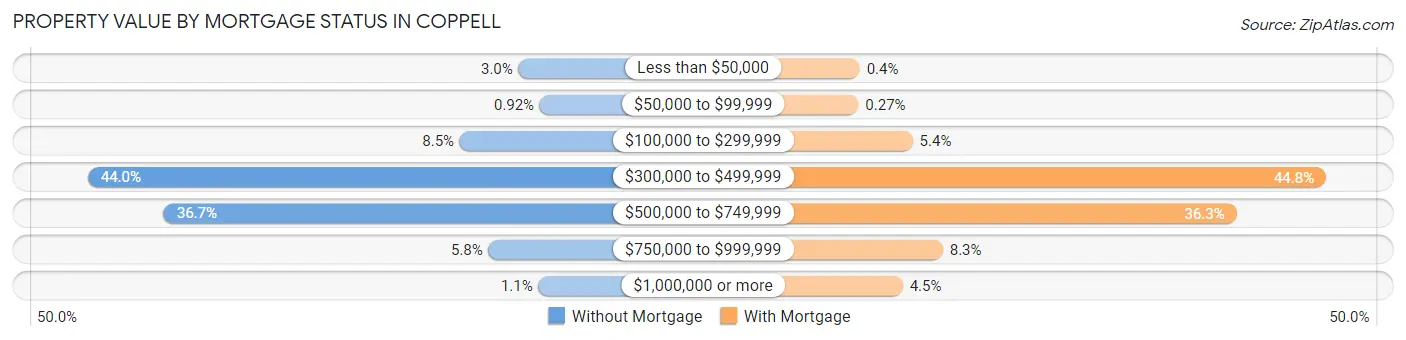
| Property Value | Without Mortgage | With Mortgage |
| Less than $50,000 | 109 (2.9%) | 29 (0.4%) |
| $50,000 to $99,999 | 34 (0.9%) | 20 (0.3%) |
| $100,000 to $299,999 | 316 (8.5%) | 398 (5.4%) |
| $300,000 to $499,999 | 1,627 (44.0%) | 3,276 (44.8%) |
| $500,000 to $749,999 | 1,359 (36.7%) | 2,654 (36.3%) |
| $750,000 to $999,999 | 215 (5.8%) | 608 (8.3%) |
| $1,000,000 or more | 39 (1.1%) | 328 (4.5%) |
| Total | 3,699 (100.0%) | 7,313 (100.0%) |
Household Income by Mortgage Status in Coppell
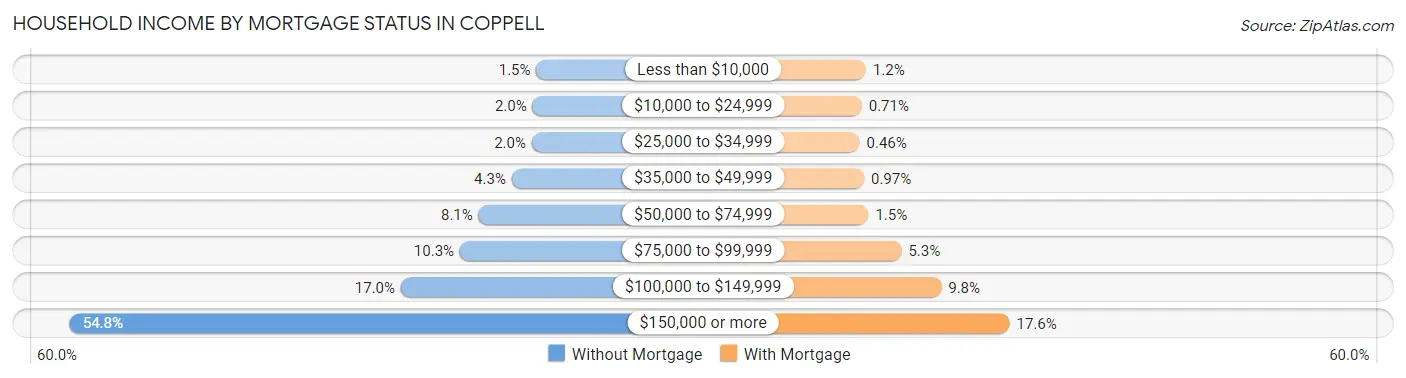
| Household Income | Without Mortgage | With Mortgage |
| Less than $10,000 | 56 (1.5%) | 87 (1.2%) |
| $10,000 to $24,999 | 72 (1.9%) | 52 (0.7%) |
| $25,000 to $34,999 | 75 (2.0%) | 34 (0.5%) |
| $35,000 to $49,999 | 160 (4.3%) | 71 (1.0%) |
| $50,000 to $74,999 | 300 (8.1%) | 108 (1.5%) |
| $75,000 to $99,999 | 379 (10.2%) | 384 (5.2%) |
| $100,000 to $149,999 | 629 (17.0%) | 717 (9.8%) |
| $150,000 or more | 2,028 (54.8%) | 1,287 (17.6%) |
| Total | 3,699 (100.0%) | 7,313 (100.0%) |
Property Value to Household Income Ratio in Coppell
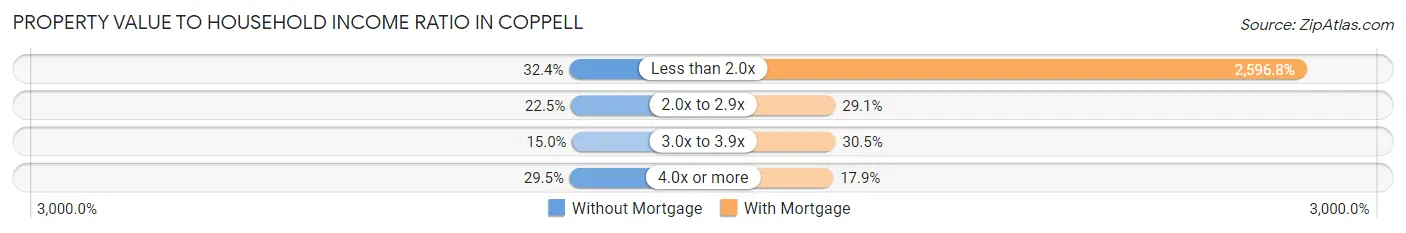
| Value-to-Income Ratio | Without Mortgage | With Mortgage |
| Less than 2.0x | 1,199 (32.4%) | 189,906 (2,596.8%) |
| 2.0x to 2.9x | 833 (22.5%) | 2,130 (29.1%) |
| 3.0x to 3.9x | 556 (15.0%) | 2,227 (30.4%) |
| 4.0x or more | 1,092 (29.5%) | 1,312 (17.9%) |
| Total | 3,699 (100.0%) | 7,313 (100.0%) |
Real Estate Taxes by Mortgage Status in Coppell
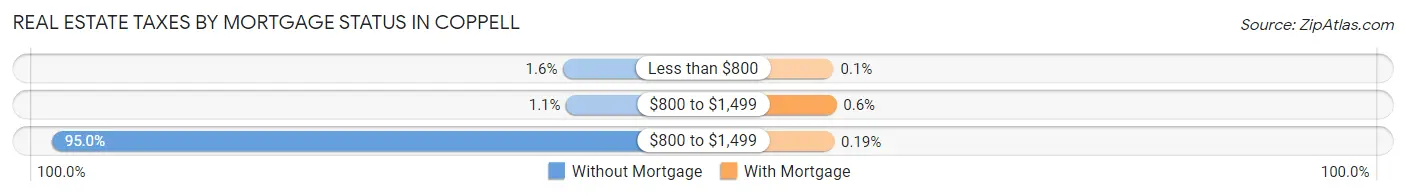
| Property Taxes | Without Mortgage | With Mortgage |
| Less than $800 | 60 (1.6%) | 7 (0.1%) |
| $800 to $1,499 | 39 (1.1%) | 44 (0.6%) |
| $800 to $1,499 | 3,515 (95.0%) | 14 (0.2%) |
| Total | 3,699 (100.0%) | 7,313 (100.0%) |
Health & Disability in Coppell
Health Insurance Coverage by Age in Coppell
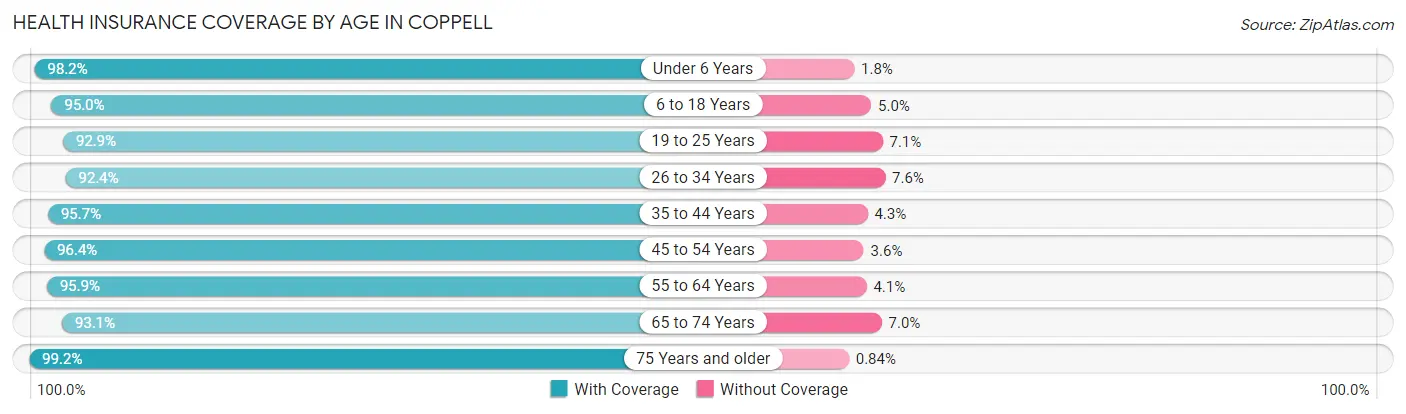
| Age Bracket | With Coverage | Without Coverage |
| Under 6 Years | 3,112 (98.2%) | 58 (1.8%) |
| 6 to 18 Years | 8,786 (95.0%) | 462 (5.0%) |
| 19 to 25 Years | 1,966 (92.9%) | 151 (7.1%) |
| 26 to 34 Years | 3,350 (92.4%) | 276 (7.6%) |
| 35 to 44 Years | 6,669 (95.7%) | 301 (4.3%) |
| 45 to 54 Years | 7,052 (96.4%) | 264 (3.6%) |
| 55 to 64 Years | 5,618 (95.9%) | 242 (4.1%) |
| 65 to 74 Years | 2,772 (93.0%) | 207 (7.0%) |
| 75 Years and older | 1,184 (99.2%) | 10 (0.8%) |
| Total | 40,509 (95.4%) | 1,971 (4.6%) |
Health Insurance Coverage by Citizenship Status in Coppell
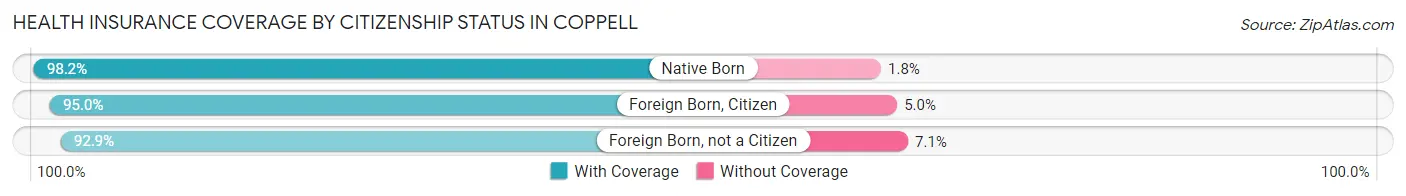
| Citizenship Status | With Coverage | Without Coverage |
| Native Born | 3,112 (98.2%) | 58 (1.8%) |
| Foreign Born, Citizen | 8,786 (95.0%) | 462 (5.0%) |
| Foreign Born, not a Citizen | 1,966 (92.9%) | 151 (7.1%) |
Health Insurance Coverage by Household Income in Coppell
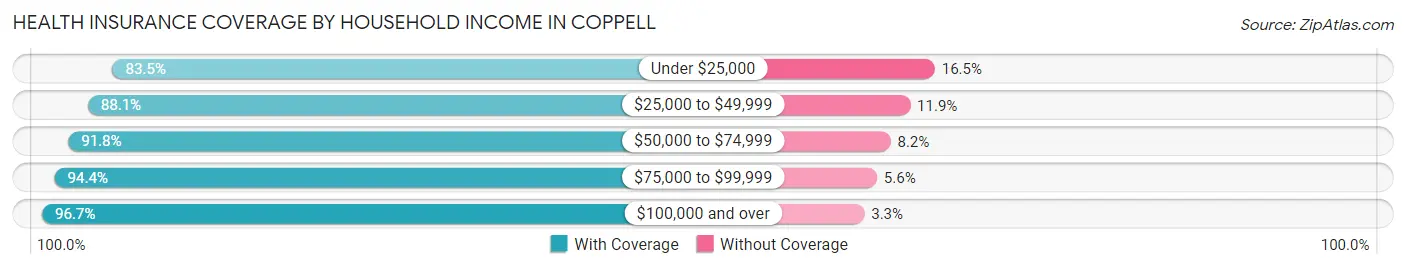
| Household Income | With Coverage | Without Coverage |
| Under $25,000 | 805 (83.5%) | 159 (16.5%) |
| $25,000 to $49,999 | 1,937 (88.1%) | 261 (11.9%) |
| $50,000 to $74,999 | 2,473 (91.8%) | 221 (8.2%) |
| $75,000 to $99,999 | 4,969 (94.4%) | 297 (5.6%) |
| $100,000 and over | 30,314 (96.7%) | 1,029 (3.3%) |
Public vs Private Health Insurance Coverage by Age in Coppell
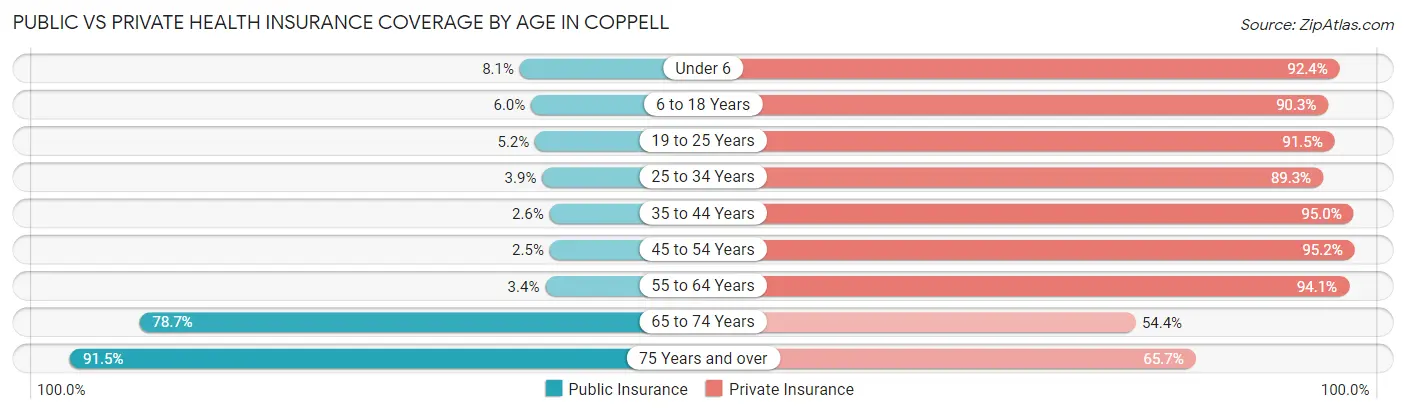
| Age Bracket | Public Insurance | Private Insurance |
| Under 6 | 256 (8.1%) | 2,929 (92.4%) |
| 6 to 18 Years | 553 (6.0%) | 8,349 (90.3%) |
| 19 to 25 Years | 111 (5.2%) | 1,936 (91.4%) |
| 25 to 34 Years | 142 (3.9%) | 3,238 (89.3%) |
| 35 to 44 Years | 178 (2.5%) | 6,620 (95.0%) |
| 45 to 54 Years | 185 (2.5%) | 6,962 (95.2%) |
| 55 to 64 Years | 197 (3.4%) | 5,516 (94.1%) |
| 65 to 74 Years | 2,344 (78.7%) | 1,621 (54.4%) |
| 75 Years and over | 1,093 (91.5%) | 784 (65.7%) |
| Total | 5,059 (11.9%) | 37,955 (89.3%) |
Disability Status by Sex by Age in Coppell
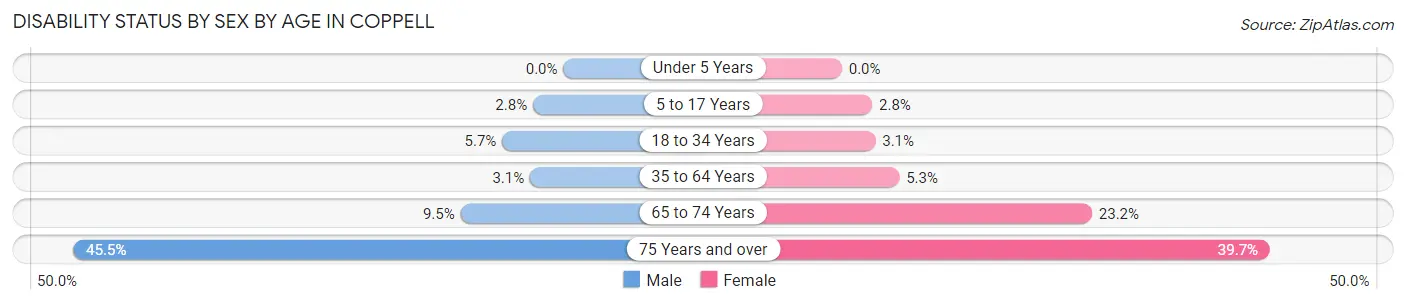
| Age Bracket | Male | Female |
| Under 5 Years | 0 (0.0%) | 0 (0.0%) |
| 5 to 17 Years | 135 (2.8%) | 123 (2.8%) |
| 18 to 34 Years | 175 (5.7%) | 101 (3.1%) |
| 35 to 64 Years | 312 (3.1%) | 536 (5.3%) |
| 65 to 74 Years | 144 (9.5%) | 341 (23.2%) |
| 75 Years and over | 202 (45.5%) | 298 (39.7%) |
Disability Class by Sex by Age in Coppell
Disability Class: Hearing Difficulty
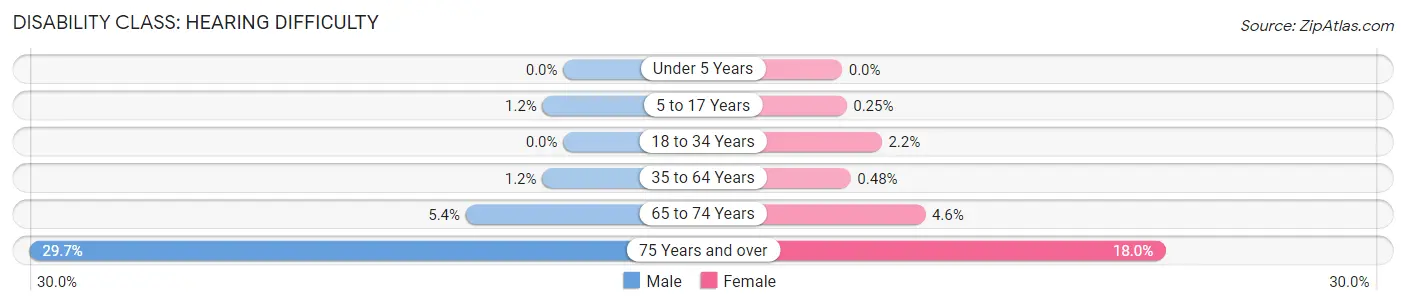
| Age Bracket | Male | Female |
| Under 5 Years | 0 (0.0%) | 0 (0.0%) |
| 5 to 17 Years | 55 (1.1%) | 11 (0.3%) |
| 18 to 34 Years | 0 (0.0%) | 72 (2.2%) |
| 35 to 64 Years | 118 (1.2%) | 48 (0.5%) |
| 65 to 74 Years | 82 (5.4%) | 68 (4.6%) |
| 75 Years and over | 132 (29.7%) | 135 (18.0%) |
Disability Class: Vision Difficulty
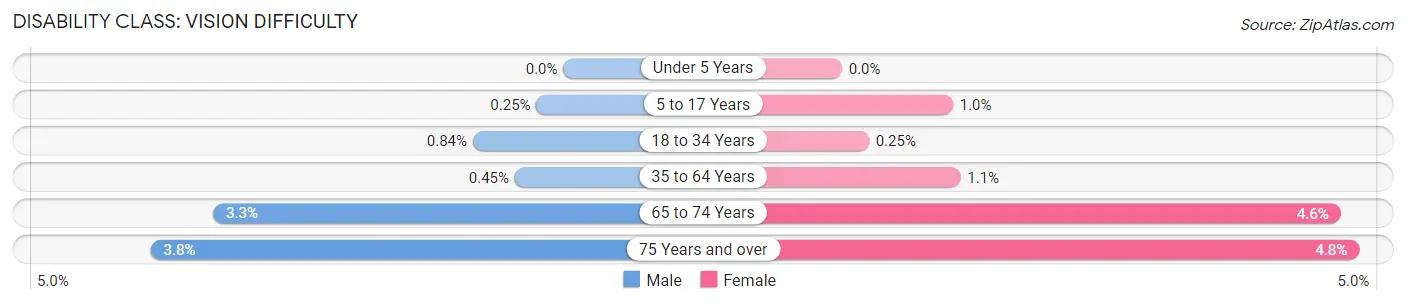
| Age Bracket | Male | Female |
| Under 5 Years | 0 (0.0%) | 0 (0.0%) |
| 5 to 17 Years | 12 (0.3%) | 45 (1.0%) |
| 18 to 34 Years | 26 (0.8%) | 8 (0.3%) |
| 35 to 64 Years | 45 (0.4%) | 111 (1.1%) |
| 65 to 74 Years | 49 (3.3%) | 68 (4.6%) |
| 75 Years and over | 17 (3.8%) | 36 (4.8%) |
Disability Class: Cognitive Difficulty

| Age Bracket | Male | Female |
| 5 to 17 Years | 94 (2.0%) | 51 (1.2%) |
| 18 to 34 Years | 149 (4.8%) | 29 (0.9%) |
| 35 to 64 Years | 146 (1.5%) | 149 (1.5%) |
| 65 to 74 Years | 21 (1.4%) | 35 (2.4%) |
| 75 Years and over | 56 (12.6%) | 67 (8.9%) |
Disability Class: Ambulatory Difficulty
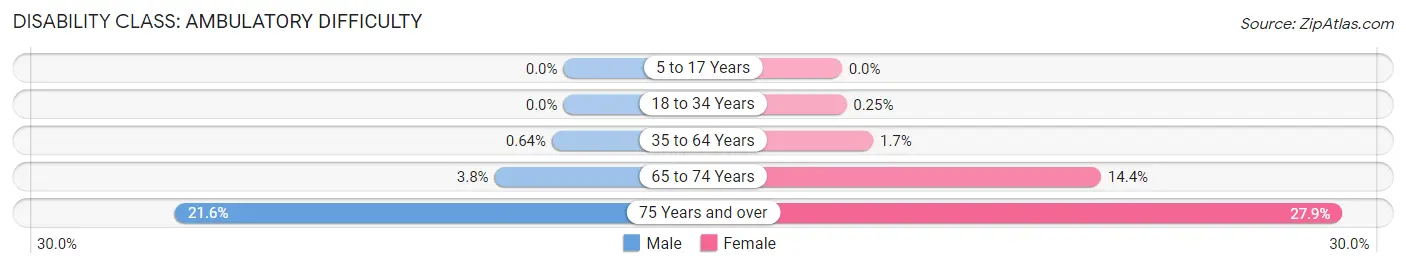
| Age Bracket | Male | Female |
| 5 to 17 Years | 0 (0.0%) | 0 (0.0%) |
| 18 to 34 Years | 0 (0.0%) | 8 (0.3%) |
| 35 to 64 Years | 65 (0.6%) | 175 (1.7%) |
| 65 to 74 Years | 58 (3.8%) | 212 (14.4%) |
| 75 Years and over | 96 (21.6%) | 209 (27.9%) |
Disability Class: Self-Care Difficulty
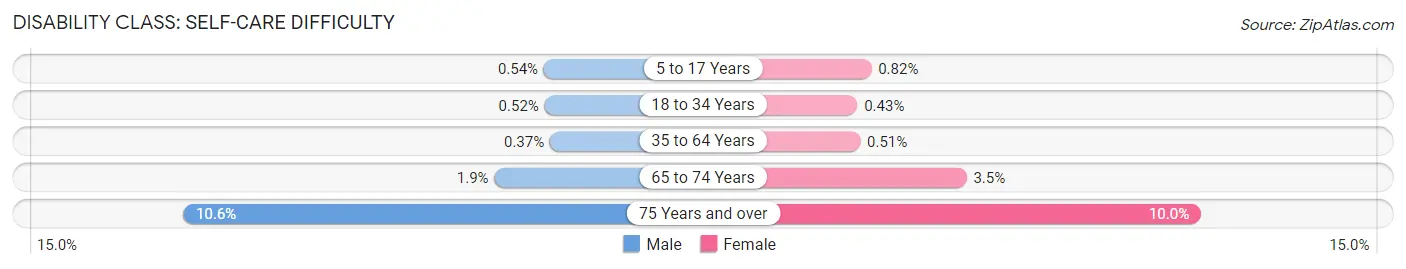
| Age Bracket | Male | Female |
| 5 to 17 Years | 26 (0.5%) | 36 (0.8%) |
| 18 to 34 Years | 16 (0.5%) | 14 (0.4%) |
| 35 to 64 Years | 37 (0.4%) | 51 (0.5%) |
| 65 to 74 Years | 29 (1.9%) | 51 (3.5%) |
| 75 Years and over | 47 (10.6%) | 75 (10.0%) |
Technology Access in Coppell
Computing Device Access in Coppell
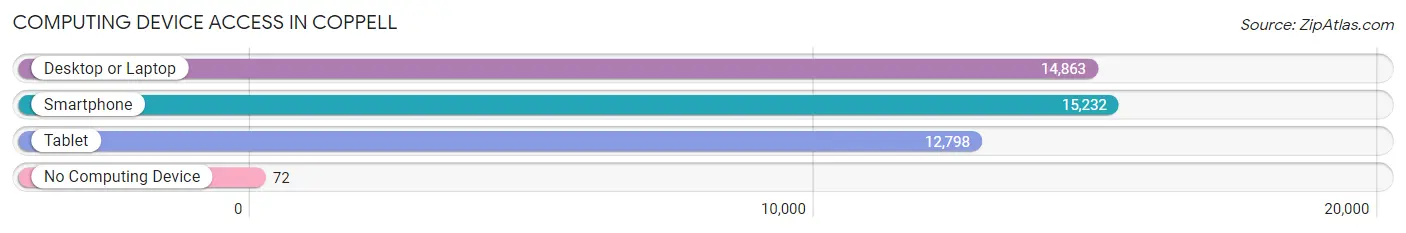
| Device Type | # Households | % Households |
| Desktop or Laptop | 14,863 | 95.2% |
| Smartphone | 15,232 | 97.5% |
| Tablet | 12,798 | 81.9% |
| No Computing Device | 72 | 0.5% |
| Total | 15,618 | 100.0% |
Internet Access in Coppell
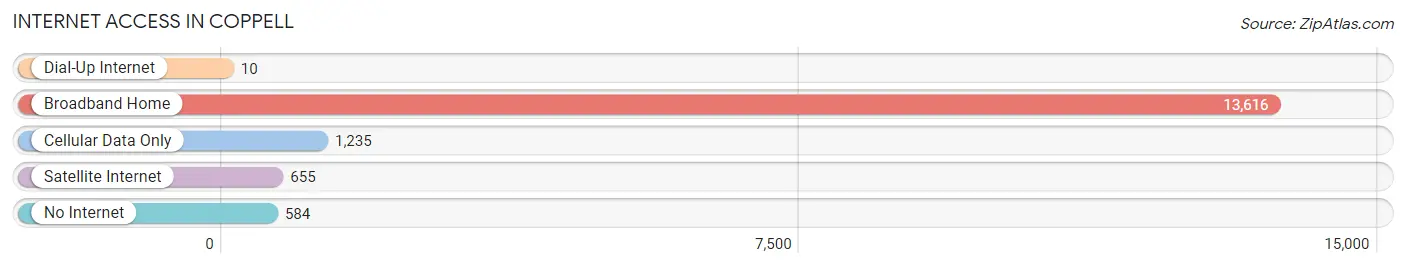
| Internet Type | # Households | % Households |
| Dial-Up Internet | 10 | 0.1% |
| Broadband Home | 13,616 | 87.2% |
| Cellular Data Only | 1,235 | 7.9% |
| Satellite Internet | 655 | 4.2% |
| No Internet | 584 | 3.7% |
| Total | 15,618 | 100.0% |
Coppell Summary
Coppell, Texas is a city located in Dallas County, Texas, United States. It is a suburb of Dallas and part of the Dallas-Fort Worth metropolitan area. The population was 38,659 at the 2010 census.
History
Coppell was founded in 1892 by German and French immigrants. The town was named after George Coppell, a prominent local businessman. The town was originally a farming community, but it began to grow rapidly in the late 19th century. By the early 20th century, Coppell had become a thriving community with a population of over 1,000.
The town continued to grow throughout the 20th century, and by the 2000 census, the population had grown to over 30,000. The city has experienced a population boom in recent years, and the population is now estimated to be over 40,000.
Geography
Coppell is located in Dallas County, Texas, and is part of the Dallas-Fort Worth metropolitan area. The city is situated on the northern edge of the Dallas-Fort Worth metroplex, and is bordered by the cities of Irving, Carrollton, and Grapevine. The city covers an area of approximately 11.5 square miles, and has a population density of 3,541 people per square mile.
The city is located in the humid subtropical climate zone, and experiences hot, humid summers and mild winters. The average annual temperature is 68 degrees Fahrenheit, and the average annual precipitation is 37 inches.
Economy
Coppell is a major economic center in the Dallas-Fort Worth metroplex. The city is home to a number of large corporations, including AT&T, Bank of America, and Frito-Lay. The city also has a thriving retail sector, with a number of shopping centers and malls.
The city is also home to a number of small businesses, including restaurants, boutiques, and specialty stores. The city is also home to a number of technology companies, including Oracle, Microsoft, and Dell.
Demographics
As of the 2010 census, the population of Coppell was 38,659. The racial makeup of the city was 75.3% White, 8.2% African American, 0.4% Native American, 8.2% Asian, 0.1% Pacific Islander, 4.2% from other races, and 3.6% from two or more races. Hispanic or Latino of any race were 15.3% of the population.
The median income for a household in the city was $90,945, and the median income for a family was $103,945. The per capita income for the city was $41,945. About 3.2% of families and 4.3% of the population were below the poverty line, including 5.2% of those under age 18 and 4.2% of those age 65 or over.
Common Questions
What is Per Capita Income in Coppell?
Per Capita income in Coppell is $71,363.
What is the Median Family Income in Coppell?
Median Family Income in Coppell is $170,333.
What is the Median Household income in Coppell?
Median Household Income in Coppell is $143,817.
What is Income or Wage Gap in Coppell?
Income or Wage Gap in Coppell is 44.6%.
Women in Coppell earn 55.4 cents for every dollar earned by a man.
What is Inequality or Gini Index in Coppell?
Inequality or Gini Index in Coppell is 0.43.
What is the Total Population of Coppell?
Total Population of Coppell is 42,513.
What is the Total Male Population of Coppell?
Total Male Population of Coppell is 21,308.
What is the Total Female Population of Coppell?
Total Female Population of Coppell is 21,205.
What is the Ratio of Males per 100 Females in Coppell?
There are 100.49 Males per 100 Females in Coppell.
What is the Ratio of Females per 100 Males in Coppell?
There are 99.52 Females per 100 Males in Coppell.
What is the Median Population Age in Coppell?
Median Population Age in Coppell is 39.6 Years.
What is the Average Family Size in Coppell
Average Family Size in Coppell is 3.1 People.
What is the Average Household Size in Coppell
Average Household Size in Coppell is 2.7 People.
How Large is the Labor Force in Coppell?
There are 23,799 People in the Labor Forcein in Coppell.
What is the Percentage of People in the Labor Force in Coppell?
73.8% of People are in the Labor Force in Coppell.
What is the Unemployment Rate in Coppell?
Unemployment Rate in Coppell is 1.9%.