Pascagoula, MS Map & Demographics
Pascagoula Map
Pascagoula Overview
$24,827
PER CAPITA INCOME
$56,858
AVG FAMILY INCOME
$41,679
AVG HOUSEHOLD INCOME
41.3%
WAGE / INCOME GAP [ % ]
58.7¢/ $1
WAGE / INCOME GAP [ $ ]
$10,173
FAMILY INCOME DEFICIT
0.51
INEQUALITY / GINI INDEX
21,904
TOTAL POPULATION
10,571
MALE POPULATION
11,333
FEMALE POPULATION
93.28
MALES / 100 FEMALES
107.21
FEMALES / 100 MALES
34.8
MEDIAN AGE
3.4
AVG FAMILY SIZE
2.5
AVG HOUSEHOLD SIZE
9,207
LABOR FORCE [ PEOPLE ]
54.6%
PERCENT IN LABOR FORCE
12.0%
UNEMPLOYMENT RATE
Pascagoula Area Codes
Income in Pascagoula
Income Overview in Pascagoula
Per Capita Income in Pascagoula is $24,827, while median incomes of families and households are $56,858 and $41,679 respectively.
| Characteristic | Number | Measure |
| Per Capita Income | 21,904 | $24,827 |
| Median Family Income | 5,029 | $56,858 |
| Mean Family Income | 5,029 | $78,551 |
| Median Household Income | 8,595 | $41,679 |
| Mean Household Income | 8,595 | $60,846 |
| Income Deficit | 5,029 | $10,173 |
| Wage / Income Gap (%) | 21,904 | 41.29% |
| Wage / Income Gap ($) | 21,904 | 58.71¢ per $1 |
| Gini / Inequality Index | 21,904 | 0.51 |
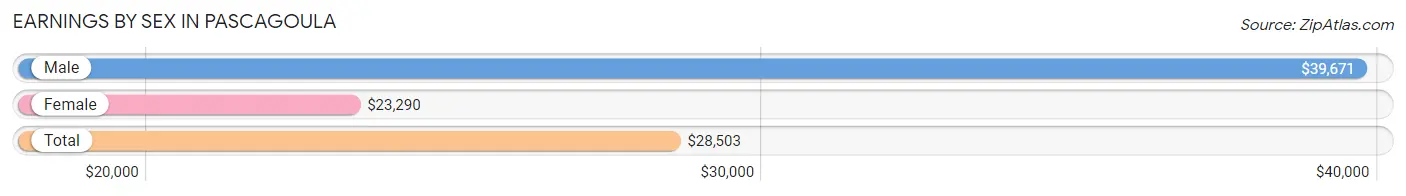
Earnings by Sex in Pascagoula
Average Earnings in Pascagoula are $28,503, $39,671 for men and $23,290 for women, a difference of 41.3%.
| Sex | Number | Average Earnings |
| Male | 4,682 (49.5%) | $39,671 |
| Female | 4,770 (50.5%) | $23,290 |
| Total | 9,452 (100.0%) | $28,503 |
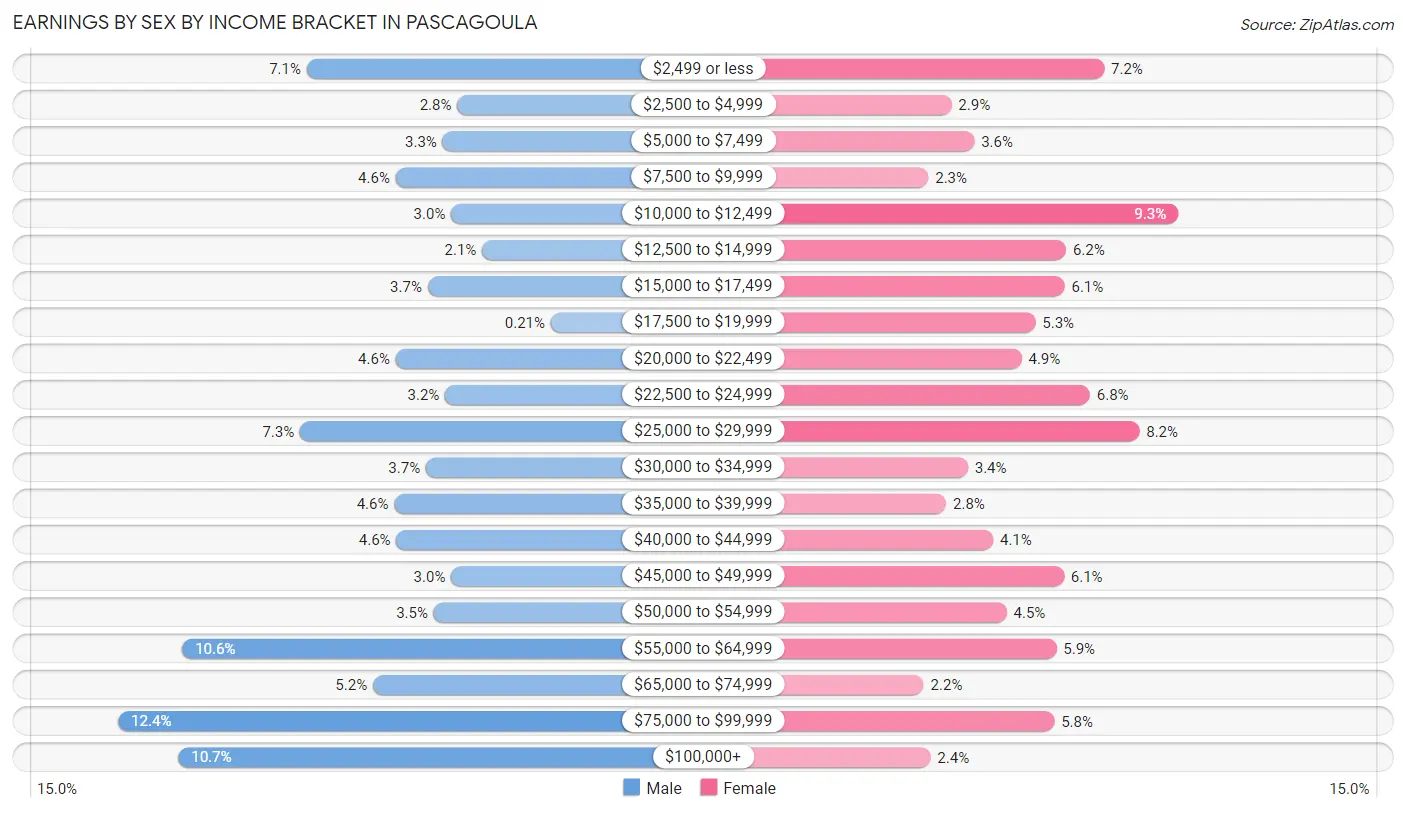
Earnings by Sex by Income Bracket in Pascagoula
The most common earnings brackets in Pascagoula are $75,000 to $99,999 for men (579 | 12.4%) and $10,000 to $12,499 for women (444 | 9.3%).
| Income | Male | Female |
| $2,499 or less | 331 (7.1%) | 345 (7.2%) |
| $2,500 to $4,999 | 133 (2.8%) | 140 (2.9%) |
| $5,000 to $7,499 | 152 (3.3%) | 171 (3.6%) |
| $7,500 to $9,999 | 214 (4.6%) | 109 (2.3%) |
| $10,000 to $12,499 | 141 (3.0%) | 444 (9.3%) |
| $12,500 to $14,999 | 100 (2.1%) | 294 (6.2%) |
| $15,000 to $17,499 | 172 (3.7%) | 292 (6.1%) |
| $17,500 to $19,999 | 10 (0.2%) | 253 (5.3%) |
| $20,000 to $22,499 | 214 (4.6%) | 234 (4.9%) |
| $22,500 to $24,999 | 149 (3.2%) | 326 (6.8%) |
| $25,000 to $29,999 | 340 (7.3%) | 392 (8.2%) |
| $30,000 to $34,999 | 174 (3.7%) | 162 (3.4%) |
| $35,000 to $39,999 | 216 (4.6%) | 133 (2.8%) |
| $40,000 to $44,999 | 213 (4.5%) | 196 (4.1%) |
| $45,000 to $49,999 | 141 (3.0%) | 291 (6.1%) |
| $50,000 to $54,999 | 164 (3.5%) | 214 (4.5%) |
| $55,000 to $64,999 | 495 (10.6%) | 281 (5.9%) |
| $65,000 to $74,999 | 244 (5.2%) | 103 (2.2%) |
| $75,000 to $99,999 | 579 (12.4%) | 278 (5.8%) |
| $100,000+ | 500 (10.7%) | 112 (2.4%) |
| Total | 4,682 (100.0%) | 4,770 (100.0%) |
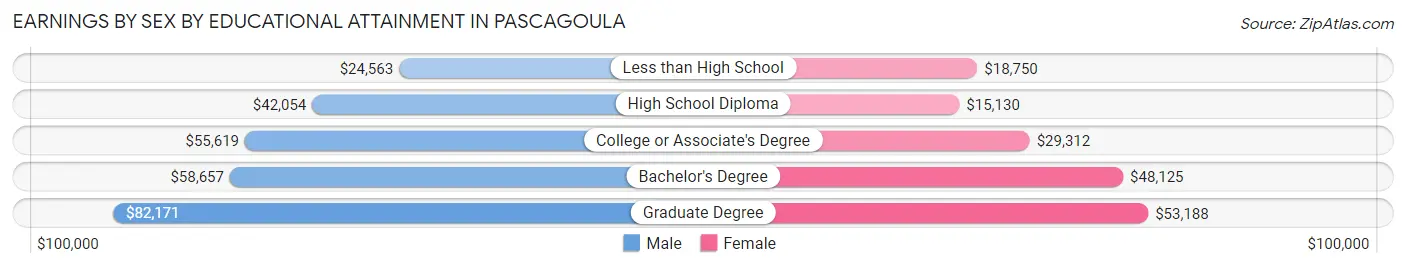
Earnings by Sex by Educational Attainment in Pascagoula
Average earnings in Pascagoula are $50,552 for men and $26,615 for women, a difference of 47.3%. Men with an educational attainment of graduate degree enjoy the highest average annual earnings of $82,171, while those with less than high school education earn the least with $24,563. Women with an educational attainment of graduate degree earn the most with the average annual earnings of $53,188, while those with high school diploma education have the smallest earnings of $15,130.
| Educational Attainment | Male Income | Female Income |
| Less than High School | $24,563 | $18,750 |
| High School Diploma | $42,054 | $15,130 |
| College or Associate's Degree | $55,619 | $29,312 |
| Bachelor's Degree | $58,657 | $48,125 |
| Graduate Degree | $82,171 | $53,188 |
| Total | $50,552 | $26,615 |
Family Income in Pascagoula
Family Income Brackets in Pascagoula
According to the Pascagoula family income data, there are 945 families falling into the $100,000 to $149,999 income range, which is the most common income bracket and makes up 18.8% of all families. Conversely, the $150,000 to $199,999 income bracket is the least frequent group with only 246 families (4.9%) belonging to this category.
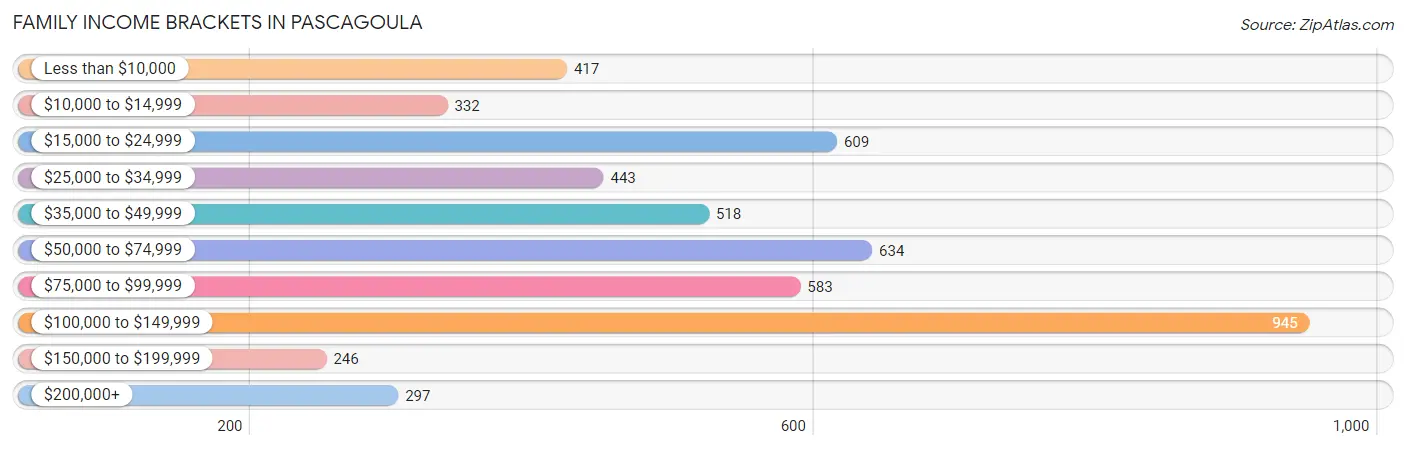
| Income Bracket | # Families | % Families |
| Less than $10,000 | 417 | 8.3% |
| $10,000 to $14,999 | 332 | 6.6% |
| $15,000 to $24,999 | 609 | 12.1% |
| $25,000 to $34,999 | 443 | 8.8% |
| $35,000 to $49,999 | 518 | 10.3% |
| $50,000 to $74,999 | 634 | 12.6% |
| $75,000 to $99,999 | 583 | 11.6% |
| $100,000 to $149,999 | 945 | 18.8% |
| $150,000 to $199,999 | 246 | 4.9% |
| $200,000+ | 297 | 5.9% |
Family Income by Famaliy Size in Pascagoula
4-person families (1,222 | 24.3%) account for the highest median family income in Pascagoula with $91,250 per family, while 4-person families (1,222 | 24.3%) have the highest median income of $22,812 per family member.
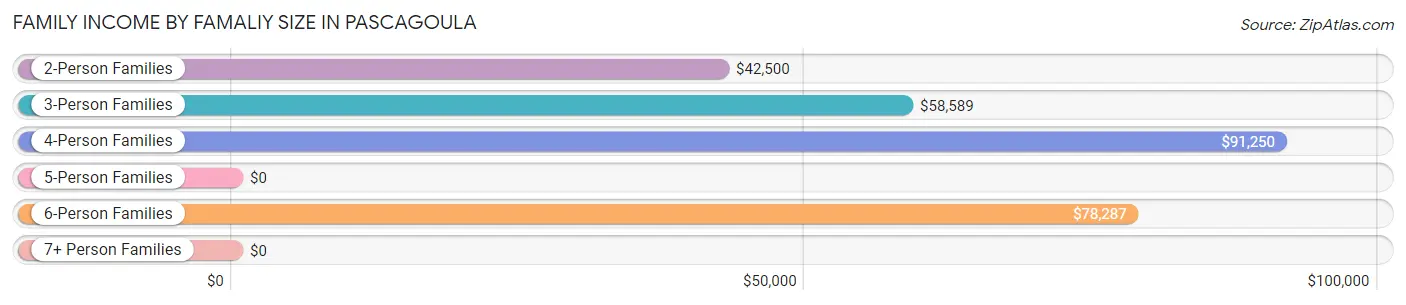
| Income Bracket | # Families | Median Income |
| 2-Person Families | 2,080 (41.4%) | $42,500 |
| 3-Person Families | 1,081 (21.5%) | $58,589 |
| 4-Person Families | 1,222 (24.3%) | $91,250 |
| 5-Person Families | 457 (9.1%) | $0 |
| 6-Person Families | 117 (2.3%) | $78,287 |
| 7+ Person Families | 72 (1.4%) | $0 |
| Total | 5,029 (100.0%) | $56,858 |
Family Income by Number of Earners in Pascagoula
The median family income in Pascagoula is $56,858, with families comprising 2 earners (1,725) having the highest median family income of $103,542, while families with no earners (834) have the lowest median family income of $21,128, accounting for 34.3% and 16.6% of families, respectively.
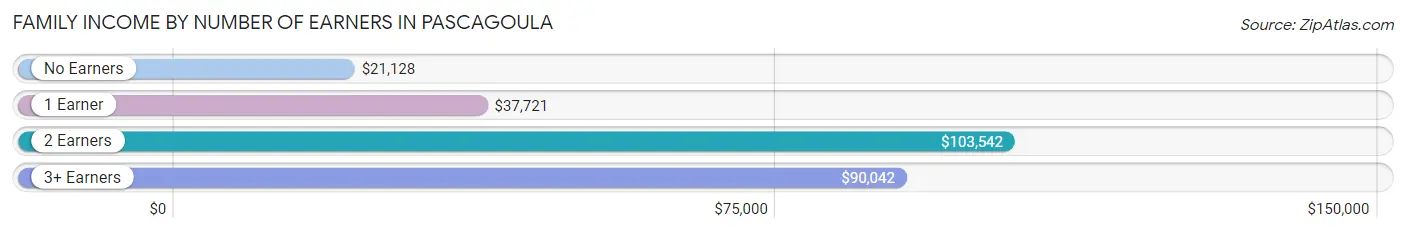
| Number of Earners | # Families | Median Income |
| No Earners | 834 (16.6%) | $21,128 |
| 1 Earner | 2,095 (41.7%) | $37,721 |
| 2 Earners | 1,725 (34.3%) | $103,542 |
| 3+ Earners | 375 (7.5%) | $90,042 |
| Total | 5,029 (100.0%) | $56,858 |
Household Income in Pascagoula
Household Income Brackets in Pascagoula
With 1,272 households falling in the category, the $50,000 to $74,999 income range is the most frequent in Pascagoula, accounting for 14.8% of all households. In contrast, only 249 households (2.9%) fall into the $150,000 to $199,999 income bracket, making it the least populous group.
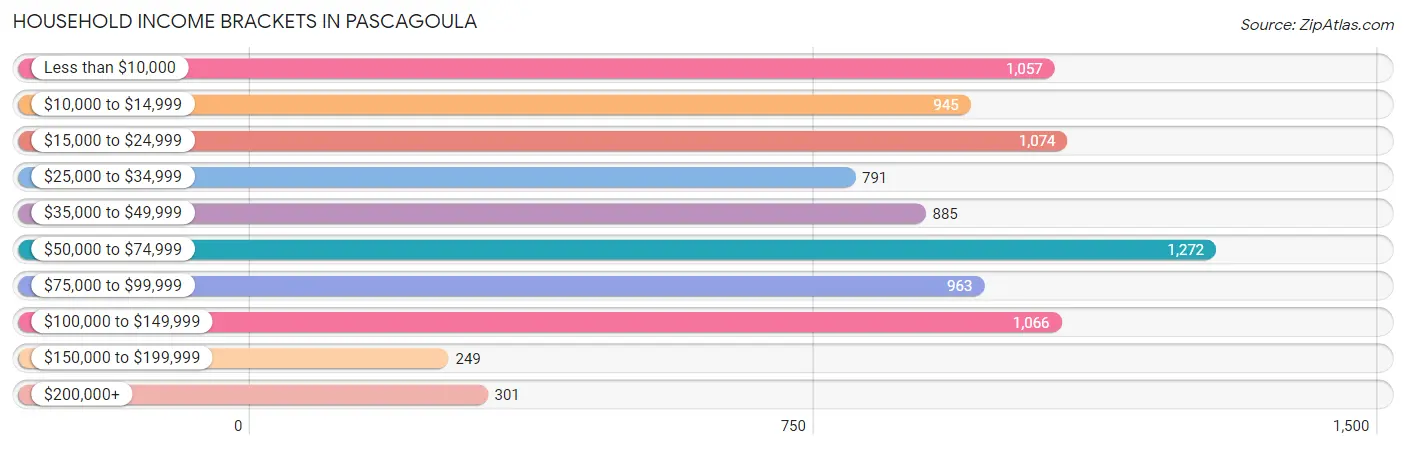
| Income Bracket | # Households | % Households |
| Less than $10,000 | 1,057 | 12.3% |
| $10,000 to $14,999 | 945 | 11.0% |
| $15,000 to $24,999 | 1,074 | 12.5% |
| $25,000 to $34,999 | 791 | 9.2% |
| $35,000 to $49,999 | 885 | 10.3% |
| $50,000 to $74,999 | 1,272 | 14.8% |
| $75,000 to $99,999 | 963 | 11.2% |
| $100,000 to $149,999 | 1,066 | 12.4% |
| $150,000 to $199,999 | 249 | 2.9% |
| $200,000+ | 301 | 3.5% |
Household Income by Householder Age in Pascagoula
The median household income in Pascagoula is $41,679, with the highest median household income of $56,547 found in the 45 to 64 years age bracket for the primary householder. A total of 2,889 households (33.6%) fall into this category. Meanwhile, the 15 to 24 years age bracket for the primary householder has the lowest median household income of $22,718, with 479 households (5.6%) in this group.
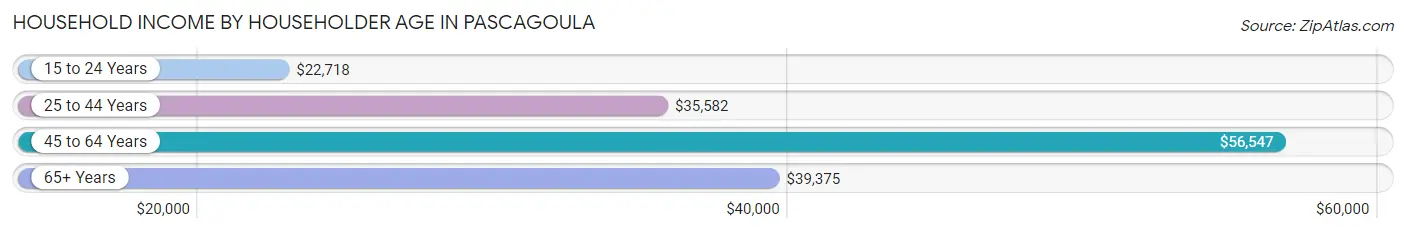
| Income Bracket | # Households | Median Income |
| 15 to 24 Years | 479 (5.6%) | $22,718 |
| 25 to 44 Years | 2,829 (32.9%) | $35,582 |
| 45 to 64 Years | 2,889 (33.6%) | $56,547 |
| 65+ Years | 2,398 (27.9%) | $39,375 |
| Total | 8,595 (100.0%) | $41,679 |
Poverty in Pascagoula
Income Below Poverty by Sex and Age in Pascagoula
With 27.3% poverty level for males and 30.3% for females among the residents of Pascagoula, under 5 year old males and 5 year old females are the most vulnerable to poverty, with 549 males (59.2%) and 131 females (73.6%) in their respective age groups living below the poverty level.
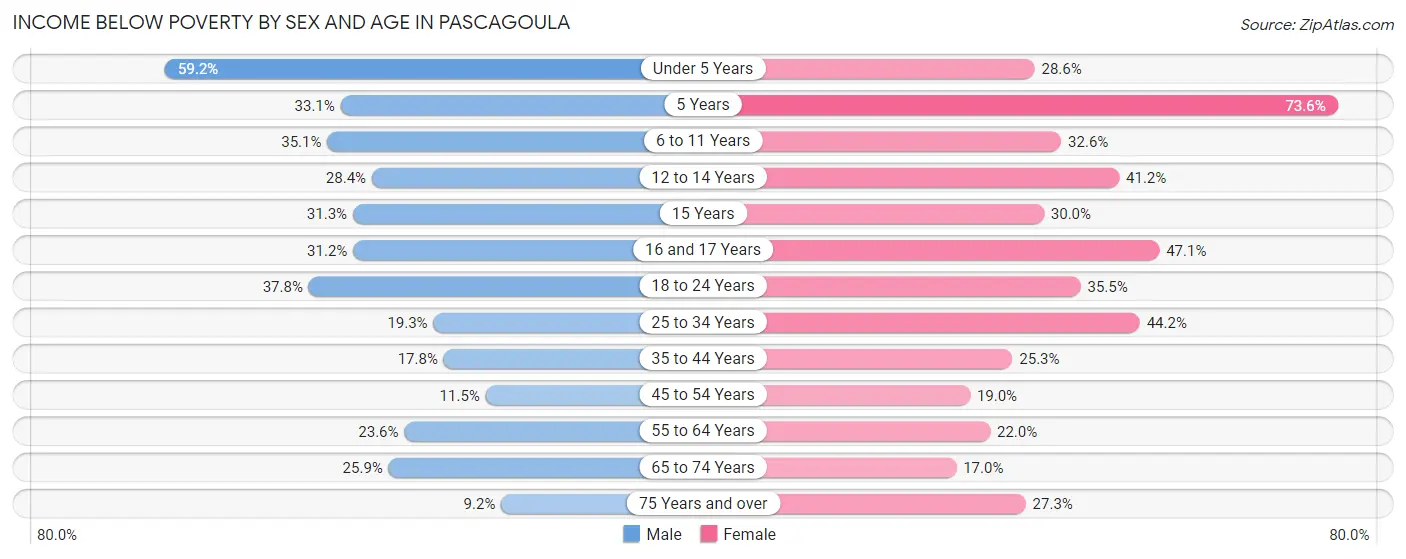
| Age Bracket | Male | Female |
| Under 5 Years | 549 (59.2%) | 338 (28.6%) |
| 5 Years | 44 (33.1%) | 131 (73.6%) |
| 6 to 11 Years | 279 (35.0%) | 255 (32.6%) |
| 12 to 14 Years | 170 (28.4%) | 119 (41.2%) |
| 15 Years | 10 (31.2%) | 27 (30.0%) |
| 16 and 17 Years | 98 (31.2%) | 140 (47.1%) |
| 18 to 24 Years | 453 (37.8%) | 429 (35.4%) |
| 25 to 34 Years | 208 (19.3%) | 722 (44.2%) |
| 35 to 44 Years | 181 (17.8%) | 406 (25.3%) |
| 45 to 54 Years | 134 (11.5%) | 176 (19.0%) |
| 55 to 64 Years | 271 (23.6%) | 291 (22.0%) |
| 65 to 74 Years | 276 (25.9%) | 176 (17.0%) |
| 75 Years and over | 46 (9.2%) | 172 (27.3%) |
| Total | 2,719 (27.3%) | 3,382 (30.3%) |
Income Above Poverty by Sex and Age in Pascagoula
According to the poverty statistics in Pascagoula, males aged 75 years and over and females aged 65 to 74 years are the age groups that are most secure financially, with 90.8% of males and 83.0% of females in these age groups living above the poverty line.
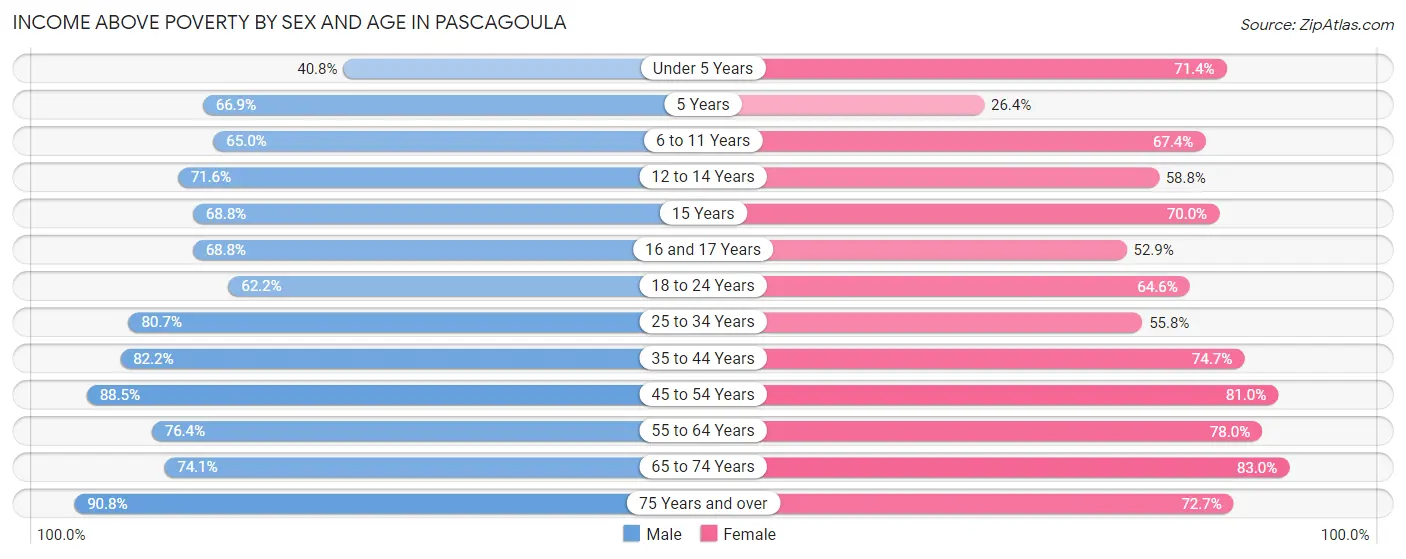
| Age Bracket | Male | Female |
| Under 5 Years | 379 (40.8%) | 843 (71.4%) |
| 5 Years | 89 (66.9%) | 47 (26.4%) |
| 6 to 11 Years | 517 (64.9%) | 528 (67.4%) |
| 12 to 14 Years | 428 (71.6%) | 170 (58.8%) |
| 15 Years | 22 (68.8%) | 63 (70.0%) |
| 16 and 17 Years | 216 (68.8%) | 157 (52.9%) |
| 18 to 24 Years | 745 (62.2%) | 781 (64.5%) |
| 25 to 34 Years | 870 (80.7%) | 910 (55.8%) |
| 35 to 44 Years | 838 (82.2%) | 1,197 (74.7%) |
| 45 to 54 Years | 1,027 (88.5%) | 749 (81.0%) |
| 55 to 64 Years | 877 (76.4%) | 1,031 (78.0%) |
| 65 to 74 Years | 788 (74.1%) | 860 (83.0%) |
| 75 Years and over | 453 (90.8%) | 458 (72.7%) |
| Total | 7,249 (72.7%) | 7,794 (69.7%) |
Income Below Poverty Among Married-Couple Families in Pascagoula
The poverty statistics for married-couple families in Pascagoula show that 8.4% or 237 of the total 2,815 families live below the poverty line. Families with 3 or 4 children have the highest poverty rate of 10.6%, comprising of 15 families. On the other hand, families with 1 or 2 children have the lowest poverty rate of 6.0%, which includes 69 families.
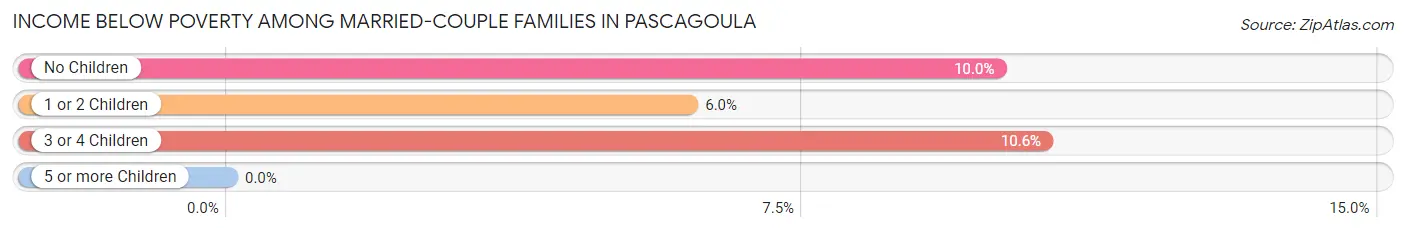
| Children | Above Poverty | Below Poverty |
| No Children | 1,373 (90.0%) | 153 (10.0%) |
| 1 or 2 Children | 1,079 (94.0%) | 69 (6.0%) |
| 3 or 4 Children | 126 (89.4%) | 15 (10.6%) |
| 5 or more Children | 0 (0.0%) | 0 (0.0%) |
| Total | 2,578 (91.6%) | 237 (8.4%) |
Income Below Poverty Among Single-Parent Households in Pascagoula
According to the poverty data in Pascagoula, 20.5% or 67 single-father households and 54.0% or 1,019 single-mother households are living below the poverty line. Among single-father households, those with 5 or more children have the highest poverty rate, with 37 households (100.0%) experiencing poverty. Likewise, among single-mother households, those with 5 or more children have the highest poverty rate, with 8 households (100.0%) falling below the poverty line.
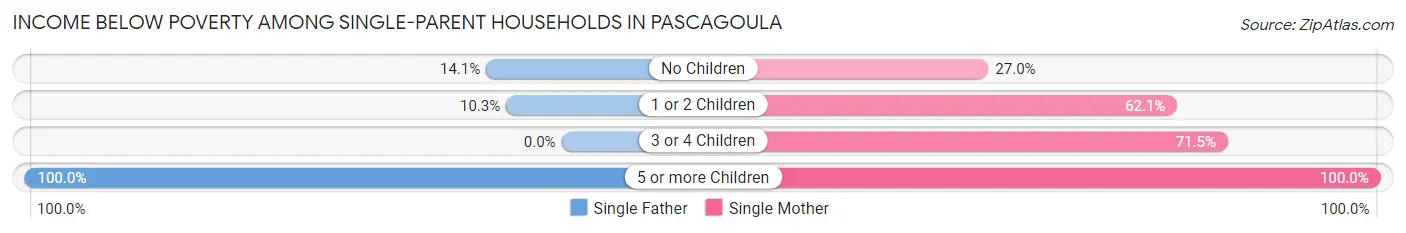
| Children | Single Father | Single Mother |
| No Children | 17 (14.1%) | 151 (27.0%) |
| 1 or 2 Children | 13 (10.3%) | 551 (62.1%) |
| 3 or 4 Children | 0 (0.0%) | 309 (71.5%) |
| 5 or more Children | 37 (100.0%) | 8 (100.0%) |
| Total | 67 (20.5%) | 1,019 (54.0%) |
Income Below Poverty Among Married-Couple vs Single-Parent Households in Pascagoula
The poverty data for Pascagoula shows that 237 of the married-couple family households (8.4%) and 1,086 of the single-parent households (49.0%) are living below the poverty level. Within the married-couple family households, those with 3 or 4 children have the highest poverty rate, with 15 households (10.6%) falling below the poverty line. Among the single-parent households, those with 5 or more children have the highest poverty rate, with 45 household (100.0%) living below poverty.
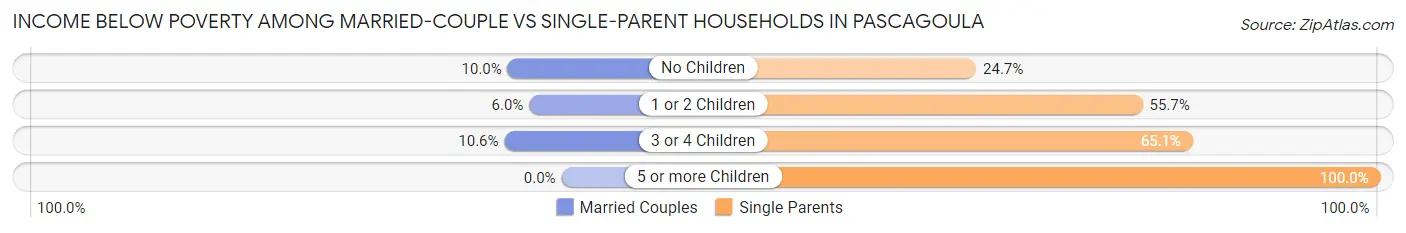
| Children | Married-Couple Families | Single-Parent Households |
| No Children | 153 (10.0%) | 168 (24.7%) |
| 1 or 2 Children | 69 (6.0%) | 564 (55.7%) |
| 3 or 4 Children | 15 (10.6%) | 309 (65.0%) |
| 5 or more Children | 0 (0.0%) | 45 (100.0%) |
| Total | 237 (8.4%) | 1,086 (49.0%) |
Race in Pascagoula
The most populous races in Pascagoula are White / Caucasian (11,254 | 51.4%), Black / African American (8,054 | 36.8%), and Hispanic or Latino (2,894 | 13.2%).
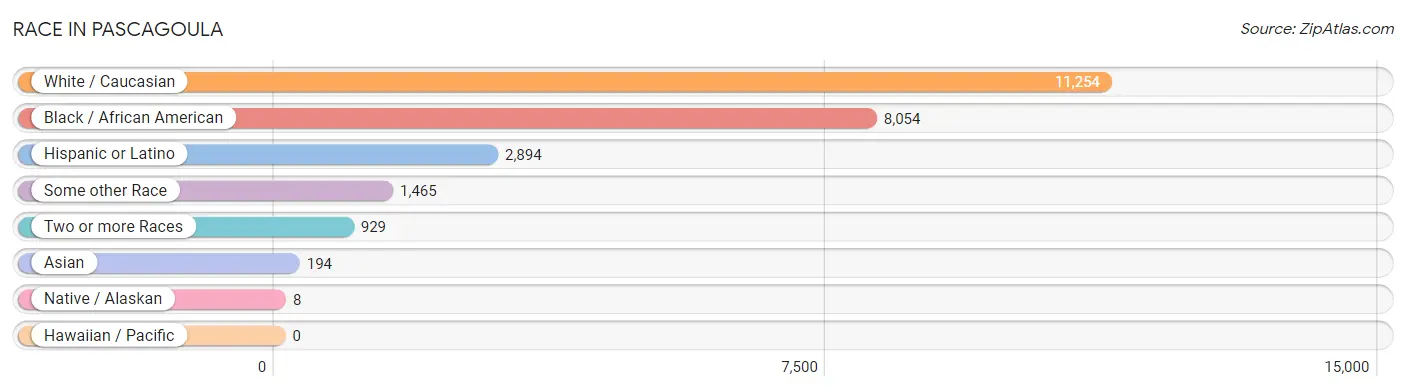
| Race | # Population | % Population |
| Asian | 194 | 0.9% |
| Black / African American | 8,054 | 36.8% |
| Hawaiian / Pacific | 0 | 0.0% |
| Hispanic or Latino | 2,894 | 13.2% |
| Native / Alaskan | 8 | 0.0% |
| White / Caucasian | 11,254 | 51.4% |
| Two or more Races | 929 | 4.2% |
| Some other Race | 1,465 | 6.7% |
| Total | 21,904 | 100.0% |
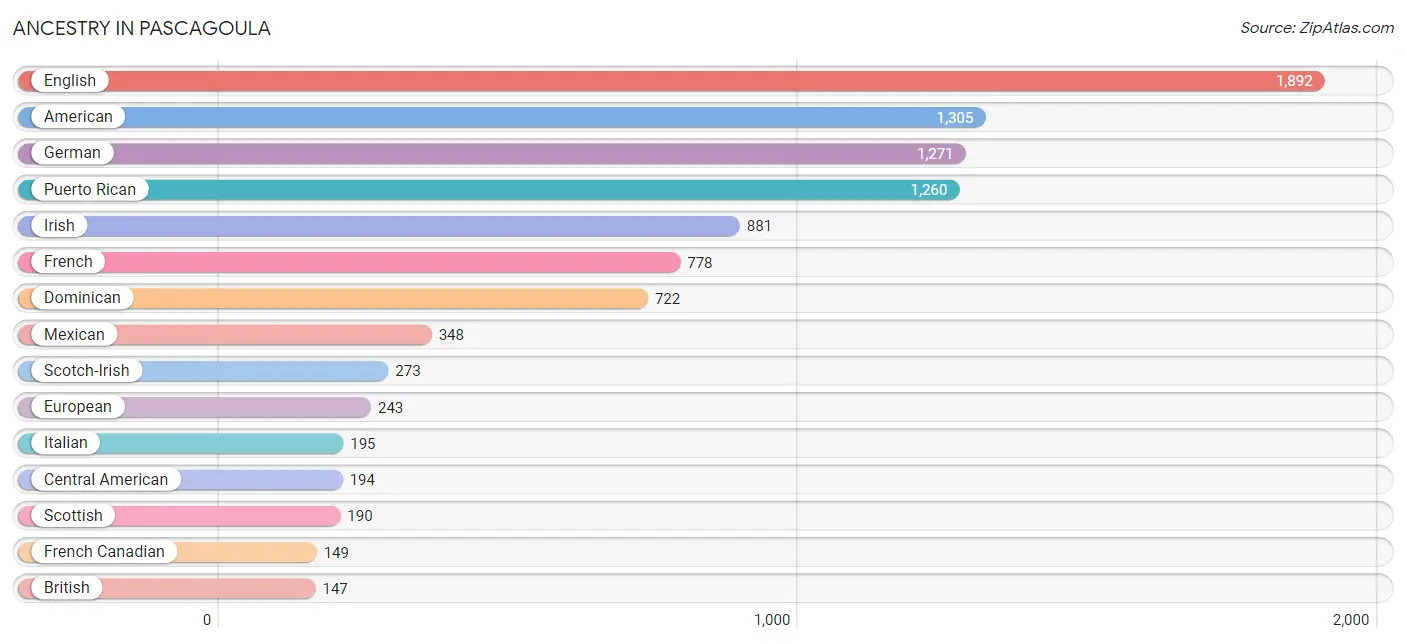
Ancestry in Pascagoula
The most populous ancestries reported in Pascagoula are English (1,892 | 8.6%), American (1,305 | 6.0%), German (1,271 | 5.8%), Puerto Rican (1,260 | 5.8%), and Irish (881 | 4.0%), together accounting for 30.2% of all Pascagoula residents.
| Ancestry | # Population | % Population |
| African | 146 | 0.7% |
| American | 1,305 | 6.0% |
| Arab | 64 | 0.3% |
| Belizean | 3 | 0.0% |
| British | 147 | 0.7% |
| Burmese | 34 | 0.2% |
| Canadian | 25 | 0.1% |
| Celtic | 22 | 0.1% |
| Central American | 194 | 0.9% |
| Cherokee | 13 | 0.1% |
| Choctaw | 53 | 0.2% |
| Colombian | 28 | 0.1% |
| Comanche | 13 | 0.1% |
| Costa Rican | 48 | 0.2% |
| Cuban | 33 | 0.2% |
| Czech | 46 | 0.2% |
| Dominican | 722 | 3.3% |
| Dutch | 121 | 0.5% |
| Dutch West Indian | 11 | 0.1% |
| English | 1,892 | 8.6% |
| European | 243 | 1.1% |
| Finnish | 9 | 0.0% |
| French | 778 | 3.5% |
| French American Indian | 12 | 0.1% |
| French Canadian | 149 | 0.7% |
| German | 1,271 | 5.8% |
| Greek | 55 | 0.3% |
| Guatemalan | 23 | 0.1% |
| Guyanese | 38 | 0.2% |
| Honduran | 123 | 0.6% |
| Hungarian | 24 | 0.1% |
| Indian (Asian) | 4 | 0.0% |
| Irish | 881 | 4.0% |
| Iroquois | 9 | 0.0% |
| Italian | 195 | 0.9% |
| Jamaican | 7 | 0.0% |
| Korean | 75 | 0.3% |
| Lithuanian | 43 | 0.2% |
| Mexican | 348 | 1.6% |
| Northern European | 9 | 0.0% |
| Norwegian | 14 | 0.1% |
| Pennsylvania German | 15 | 0.1% |
| Polish | 69 | 0.3% |
| Portuguese | 15 | 0.1% |
| Puerto Rican | 1,260 | 5.8% |
| Russian | 19 | 0.1% |
| Scandinavian | 56 | 0.3% |
| Scotch-Irish | 273 | 1.3% |
| Scottish | 190 | 0.9% |
| South American | 28 | 0.1% |
| Spaniard | 29 | 0.1% |
| Spanish | 142 | 0.6% |
| Subsaharan African | 146 | 0.7% |
| Swedish | 28 | 0.1% |
| Swiss | 13 | 0.1% |
| Thai | 54 | 0.3% |
| Turkish | 7 | 0.0% |
| Welsh | 118 | 0.5% |
| West Indian | 35 | 0.2% | View All 59 Rows |
Immigrants in Pascagoula
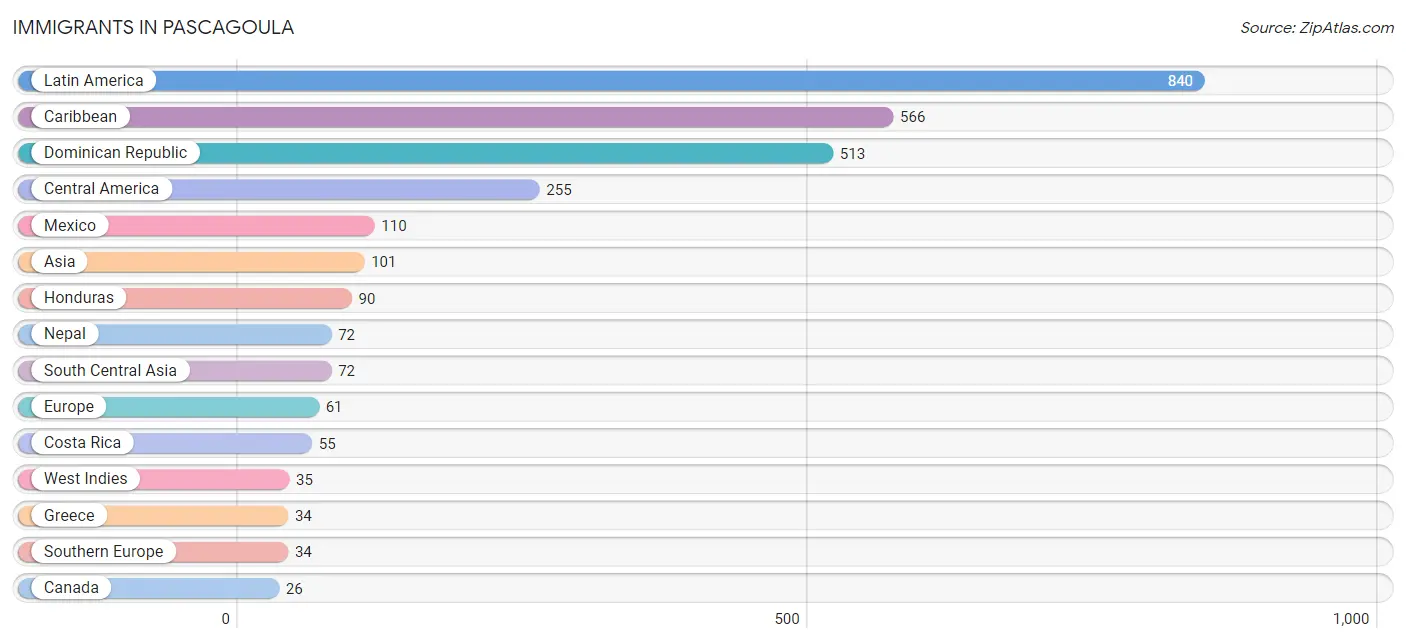
The most numerous immigrant groups reported in Pascagoula came from Latin America (840 | 3.8%), Caribbean (566 | 2.6%), Dominican Republic (513 | 2.3%), Central America (255 | 1.2%), and Mexico (110 | 0.5%), together accounting for 10.4% of all Pascagoula residents.
| Immigration Origin | # Population | % Population |
| Africa | 24 | 0.1% |
| Asia | 101 | 0.5% |
| Brazil | 6 | 0.0% |
| Canada | 26 | 0.1% |
| Caribbean | 566 | 2.6% |
| Central America | 255 | 1.2% |
| China | 4 | 0.0% |
| Colombia | 13 | 0.1% |
| Costa Rica | 55 | 0.3% |
| Cuba | 15 | 0.1% |
| Dominican Republic | 513 | 2.3% |
| Eastern Africa | 6 | 0.0% |
| Eastern Asia | 22 | 0.1% |
| Ethiopia | 6 | 0.0% |
| Europe | 61 | 0.3% |
| Germany | 13 | 0.1% |
| Greece | 34 | 0.2% |
| Honduras | 90 | 0.4% |
| Ireland | 8 | 0.0% |
| Jamaica | 3 | 0.0% |
| Korea | 18 | 0.1% |
| Latin America | 840 | 3.8% |
| Liberia | 3 | 0.0% |
| Mexico | 110 | 0.5% |
| Nepal | 72 | 0.3% |
| Netherlands | 6 | 0.0% |
| Nigeria | 15 | 0.1% |
| Northern Europe | 8 | 0.0% |
| South America | 19 | 0.1% |
| South Central Asia | 72 | 0.3% |
| Southern Europe | 34 | 0.2% |
| Turkey | 7 | 0.0% |
| West Indies | 35 | 0.2% |
| Western Africa | 18 | 0.1% |
| Western Asia | 7 | 0.0% |
| Western Europe | 19 | 0.1% | View All 36 Rows |
Sex and Age in Pascagoula
Sex and Age in Pascagoula
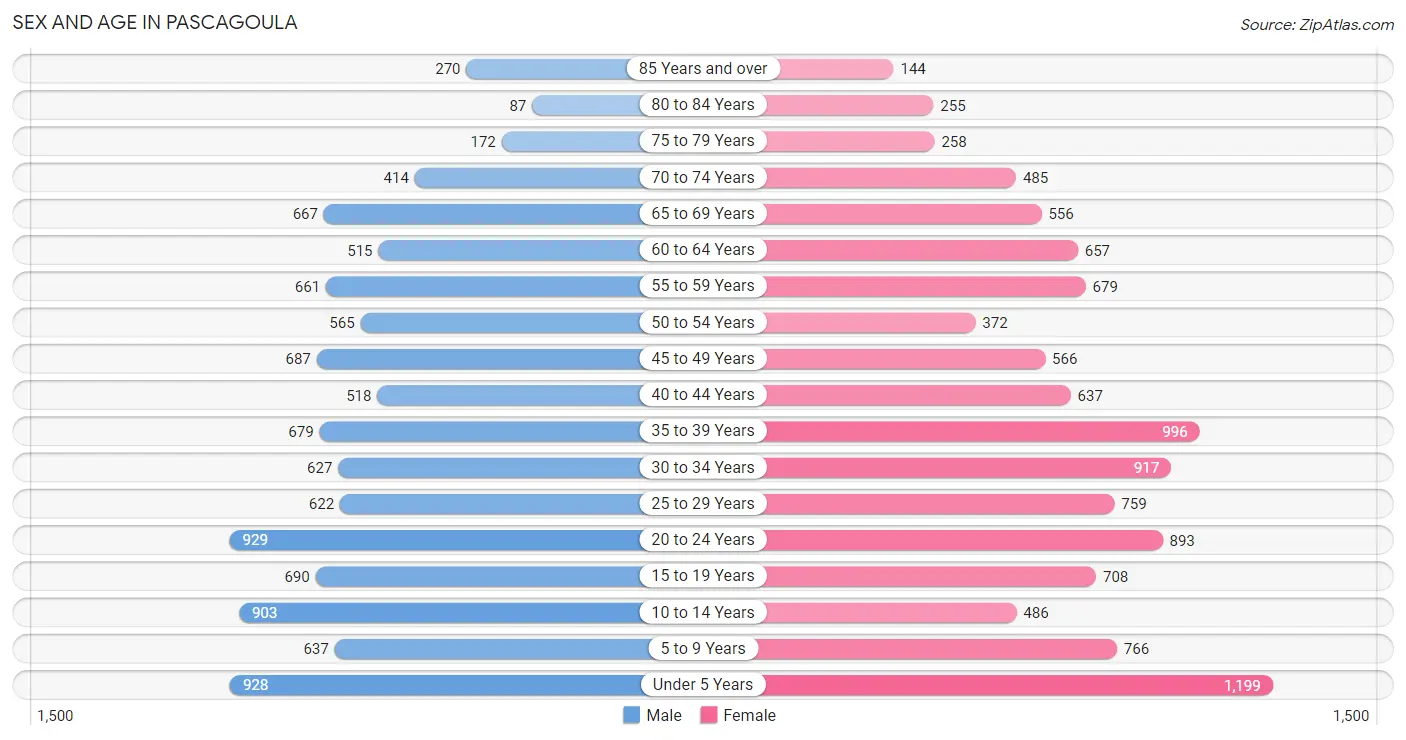
The most populous age groups in Pascagoula are 20 to 24 Years (929 | 8.8%) for men and Under 5 Years (1,199 | 10.6%) for women.
| Age Bracket | Male | Female |
| Under 5 Years | 928 (8.8%) | 1,199 (10.6%) |
| 5 to 9 Years | 637 (6.0%) | 766 (6.8%) |
| 10 to 14 Years | 903 (8.5%) | 486 (4.3%) |
| 15 to 19 Years | 690 (6.5%) | 708 (6.2%) |
| 20 to 24 Years | 929 (8.8%) | 893 (7.9%) |
| 25 to 29 Years | 622 (5.9%) | 759 (6.7%) |
| 30 to 34 Years | 627 (5.9%) | 917 (8.1%) |
| 35 to 39 Years | 679 (6.4%) | 996 (8.8%) |
| 40 to 44 Years | 518 (4.9%) | 637 (5.6%) |
| 45 to 49 Years | 687 (6.5%) | 566 (5.0%) |
| 50 to 54 Years | 565 (5.3%) | 372 (3.3%) |
| 55 to 59 Years | 661 (6.2%) | 679 (6.0%) |
| 60 to 64 Years | 515 (4.9%) | 657 (5.8%) |
| 65 to 69 Years | 667 (6.3%) | 556 (4.9%) |
| 70 to 74 Years | 414 (3.9%) | 485 (4.3%) |
| 75 to 79 Years | 172 (1.6%) | 258 (2.3%) |
| 80 to 84 Years | 87 (0.8%) | 255 (2.2%) |
| 85 Years and over | 270 (2.5%) | 144 (1.3%) |
| Total | 10,571 (100.0%) | 11,333 (100.0%) |
Families and Households in Pascagoula
Median Family Size in Pascagoula
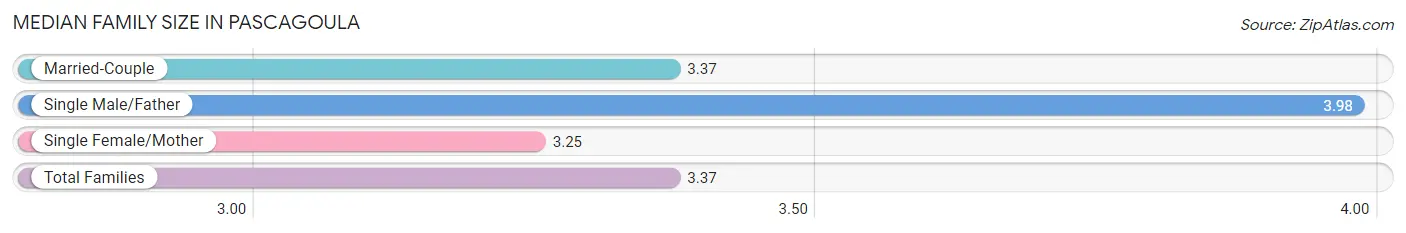
The median family size in Pascagoula is 3.37 persons per family, with single male/father families (327 | 6.5%) accounting for the largest median family size of 3.98 persons per family. On the other hand, single female/mother families (1,887 | 37.5%) represent the smallest median family size with 3.25 persons per family.
| Family Type | # Families | Family Size |
| Married-Couple | 2,815 (56.0%) | 3.37 |
| Single Male/Father | 327 (6.5%) | 3.98 |
| Single Female/Mother | 1,887 (37.5%) | 3.25 |
| Total Families | 5,029 (100.0%) | 3.37 |
Median Household Size in Pascagoula
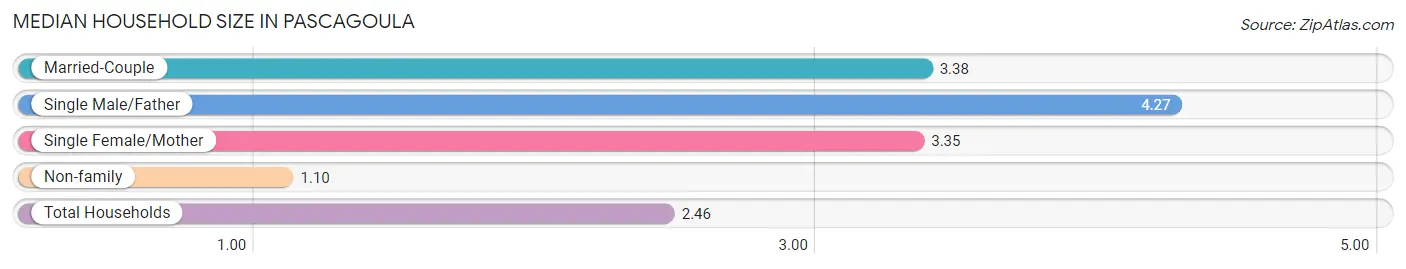
The median household size in Pascagoula is 2.46 persons per household, with single male/father households (327 | 3.8%) accounting for the largest median household size of 4.27 persons per household. non-family households (3,566 | 41.5%) represent the smallest median household size with 1.10 persons per household.
| Household Type | # Households | Household Size |
| Married-Couple | 2,815 (32.8%) | 3.38 |
| Single Male/Father | 327 (3.8%) | 4.27 |
| Single Female/Mother | 1,887 (22.0%) | 3.35 |
| Non-family | 3,566 (41.5%) | 1.10 |
| Total Households | 8,595 (100.0%) | 2.46 |
Household Size by Marriage Status in Pascagoula
Out of a total of 8,595 households in Pascagoula, 5,029 (58.5%) are family households, while 3,566 (41.5%) are nonfamily households. The most numerous type of family households are 2-person households, comprising 1,942, and the most common type of nonfamily households are 1-person households, comprising 3,345.
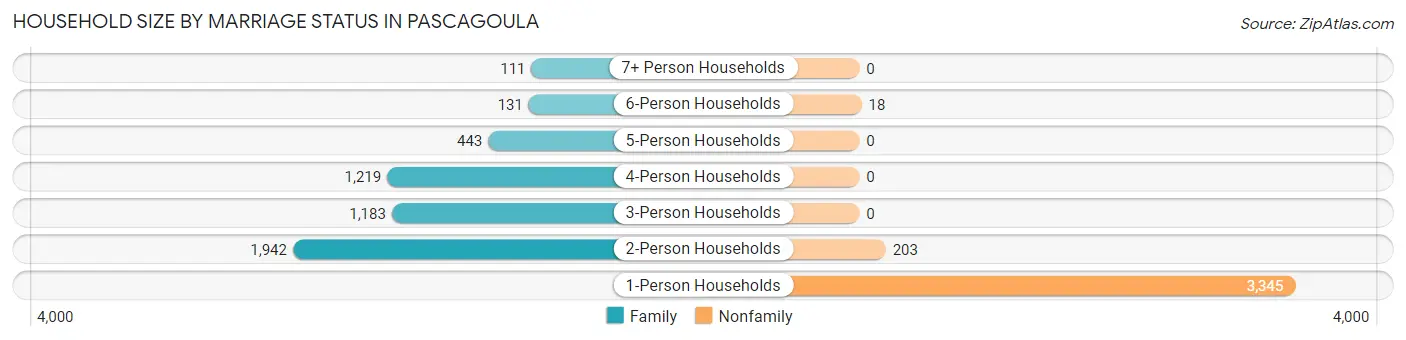
| Household Size | Family Households | Nonfamily Households |
| 1-Person Households | - | 3,345 (38.9%) |
| 2-Person Households | 1,942 (22.6%) | 203 (2.4%) |
| 3-Person Households | 1,183 (13.8%) | 0 (0.0%) |
| 4-Person Households | 1,219 (14.2%) | 0 (0.0%) |
| 5-Person Households | 443 (5.1%) | 0 (0.0%) |
| 6-Person Households | 131 (1.5%) | 18 (0.2%) |
| 7+ Person Households | 111 (1.3%) | 0 (0.0%) |
| Total | 5,029 (58.5%) | 3,566 (41.5%) |
Female Fertility in Pascagoula
Fertility by Age in Pascagoula
Average fertility rate in Pascagoula is 44.0 births per 1,000 women. Women in the age bracket of 20 to 34 years have the highest fertility rate with 70.0 births per 1,000 women. Women in the age bracket of 20 to 34 years acount for 73.8% of all women with births.
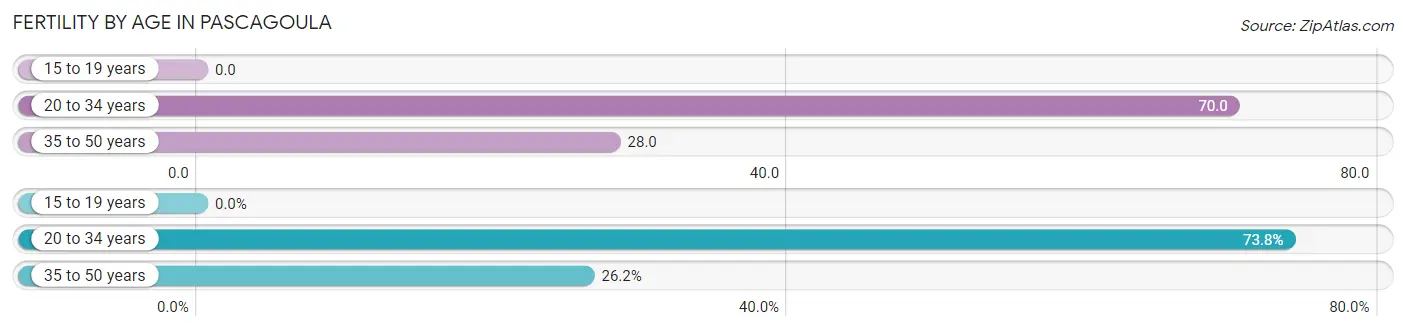
| Age Bracket | Women with Births | Births / 1,000 Women |
| 15 to 19 years | 0 (0.0%) | 0.0 |
| 20 to 34 years | 180 (73.8%) | 70.0 |
| 35 to 50 years | 64 (26.2%) | 28.0 |
| Total | 244 (100.0%) | 44.0 |
Fertility by Age by Marriage Status in Pascagoula
65.2% of women with births (244) in Pascagoula are married. The highest percentage of unmarried women with births falls into 20 to 34 years age bracket with 45.6% of them unmarried at the time of birth, while the lowest percentage of unmarried women with births belong to 35 to 50 years age bracket with 4.7% of them unmarried.
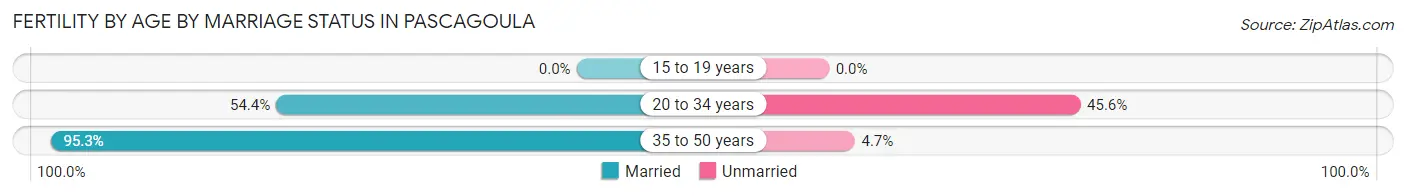
| Age Bracket | Married | Unmarried |
| 15 to 19 years | 0 (0.0%) | 0 (0.0%) |
| 20 to 34 years | 98 (54.4%) | 82 (45.6%) |
| 35 to 50 years | 61 (95.3%) | 3 (4.7%) |
| Total | 159 (65.2%) | 85 (34.8%) |
Fertility by Education in Pascagoula
Average fertility rate in Pascagoula is 44.0 births per 1,000 women. Women with the education attainment of high school diploma have the highest fertility rate of 73.0 births per 1,000 women, while women with the education attainment of less than high school have the lowest fertility at 20.0 births per 1,000 women. Women with the education attainment of high school diploma represent 54.9% of all women with births.
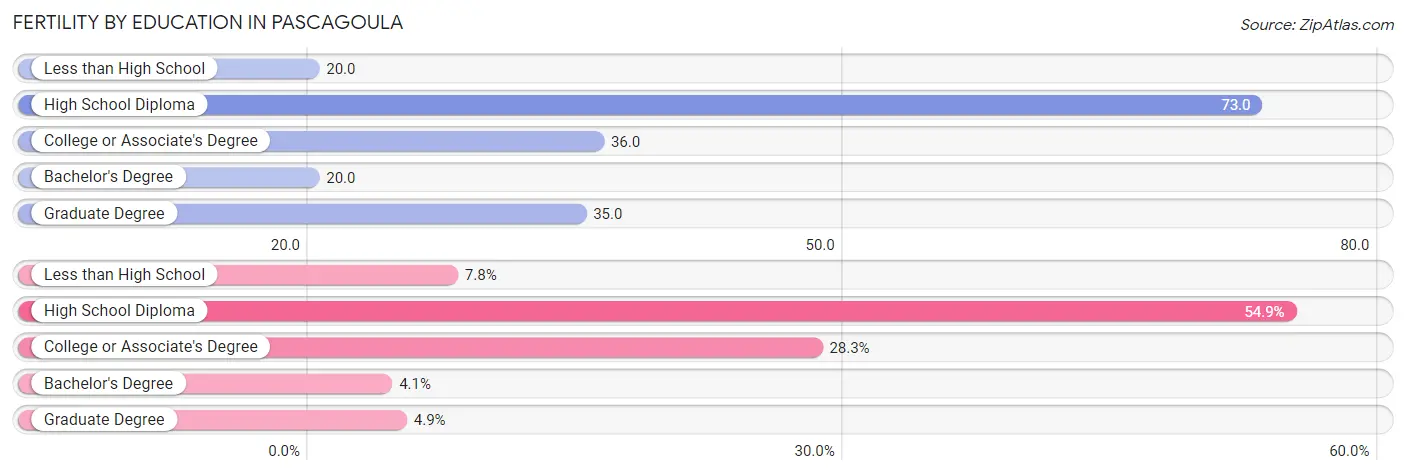
| Educational Attainment | Women with Births | Births / 1,000 Women |
| Less than High School | 19 (7.8%) | 20.0 |
| High School Diploma | 134 (54.9%) | 73.0 |
| College or Associate's Degree | 69 (28.3%) | 36.0 |
| Bachelor's Degree | 10 (4.1%) | 20.0 |
| Graduate Degree | 12 (4.9%) | 35.0 |
| Total | 244 (100.0%) | 44.0 |
Fertility by Education by Marriage Status in Pascagoula
34.8% of women with births in Pascagoula are unmarried. Women with the educational attainment of less than high school are most likely to be married with 100.0% of them married at childbirth, while women with the educational attainment of college or associate's degree are least likely to be married with 62.3% of them unmarried at childbirth.
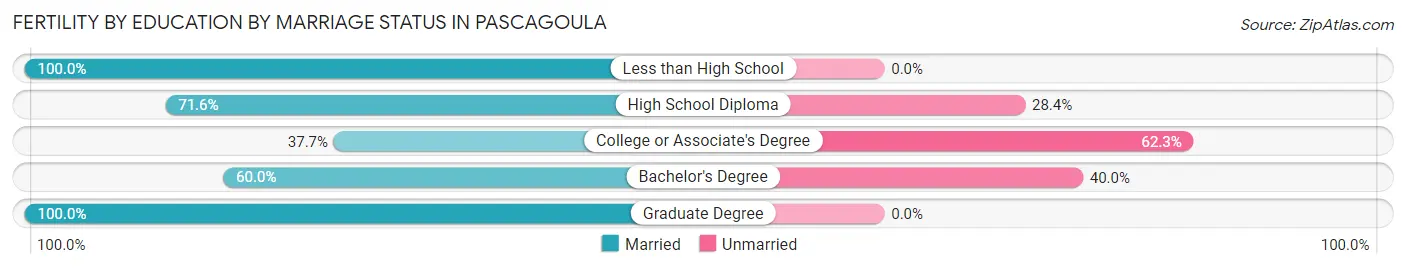
| Educational Attainment | Married | Unmarried |
| Less than High School | 19 (100.0%) | 0 (0.0%) |
| High School Diploma | 96 (71.6%) | 38 (28.4%) |
| College or Associate's Degree | 26 (37.7%) | 43 (62.3%) |
| Bachelor's Degree | 6 (60.0%) | 4 (40.0%) |
| Graduate Degree | 12 (100.0%) | 0 (0.0%) |
| Total | 159 (65.2%) | 85 (34.8%) |
Employment Characteristics in Pascagoula
Employment by Class of Employer in Pascagoula
Among the 8,017 employed individuals in Pascagoula, private company employees (5,482 | 68.4%), local government employees (802 | 10.0%), and state government employees (390 | 4.9%) make up the most common classes of employment.
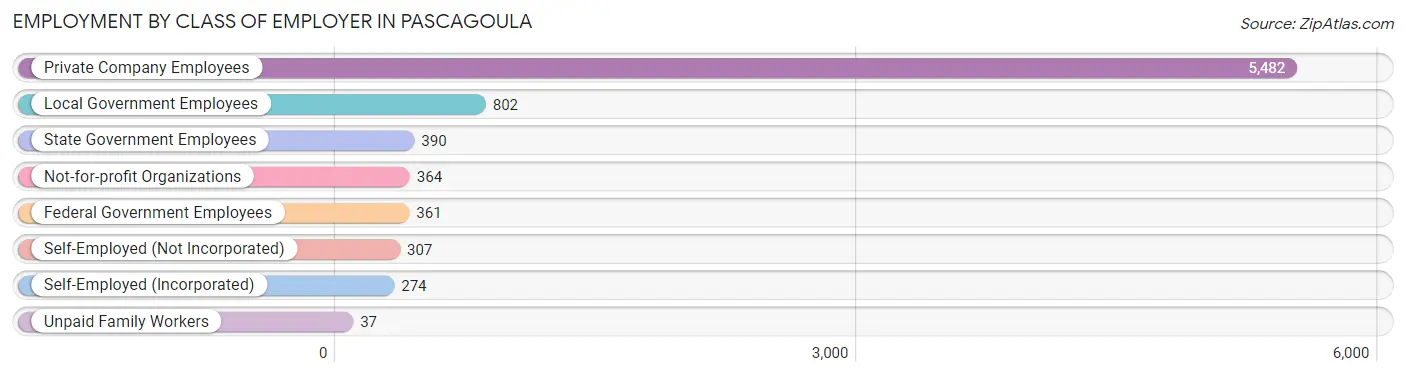
| Employer Class | # Employees | % Employees |
| Private Company Employees | 5,482 | 68.4% |
| Self-Employed (Incorporated) | 274 | 3.4% |
| Self-Employed (Not Incorporated) | 307 | 3.8% |
| Not-for-profit Organizations | 364 | 4.5% |
| Local Government Employees | 802 | 10.0% |
| State Government Employees | 390 | 4.9% |
| Federal Government Employees | 361 | 4.5% |
| Unpaid Family Workers | 37 | 0.5% |
| Total | 8,017 | 100.0% |
Employment Status by Age in Pascagoula
According to the labor force statistics for Pascagoula, out of the total population over 16 years of age (16,863), 54.6% or 9,207 individuals are in the labor force, with 12.0% or 1,105 of them unemployed. The age group with the highest labor force participation rate is 45 to 54 years, with 77.9% or 1,706 individuals in the labor force. Within the labor force, the 16 to 19 years age range has the highest percentage of unemployed individuals, with 31.8% or 150 of them being unemployed.
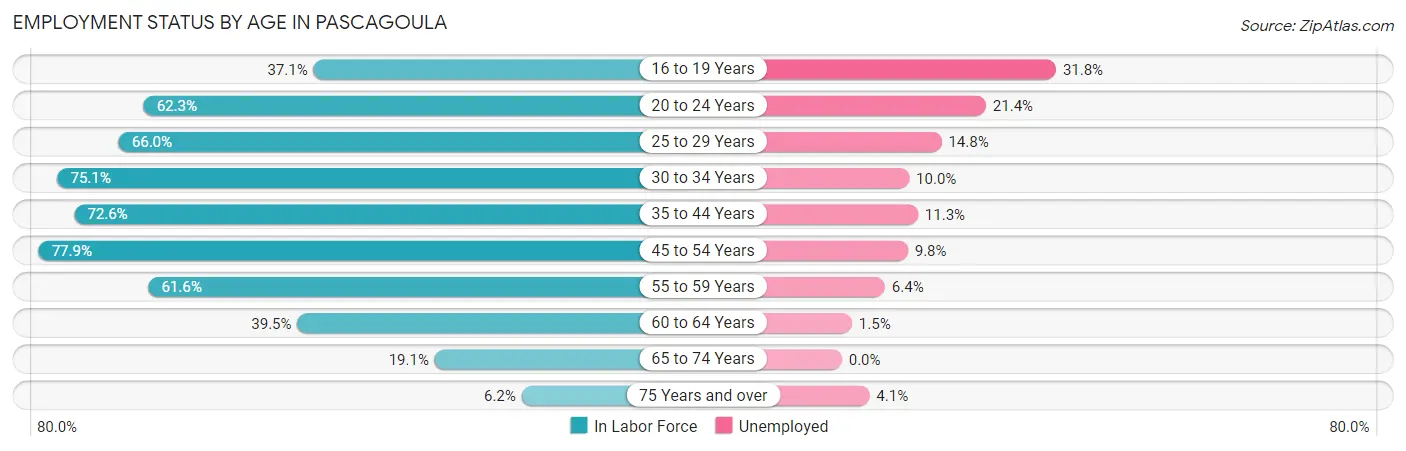
| Age Bracket | In Labor Force | Unemployed |
| 16 to 19 Years | 473 (37.1%) | 150 (31.8%) |
| 20 to 24 Years | 1,135 (62.3%) | 243 (21.4%) |
| 25 to 29 Years | 911 (66.0%) | 135 (14.8%) |
| 30 to 34 Years | 1,160 (75.1%) | 116 (10.0%) |
| 35 to 44 Years | 2,055 (72.6%) | 232 (11.3%) |
| 45 to 54 Years | 1,706 (77.9%) | 167 (9.8%) |
| 55 to 59 Years | 825 (61.6%) | 53 (6.4%) |
| 60 to 64 Years | 463 (39.5%) | 7 (1.5%) |
| 65 to 74 Years | 405 (19.1%) | 0 (0.0%) |
| 75 Years and over | 74 (6.2%) | 3 (4.1%) |
| Total | 9,207 (54.6%) | 1,105 (12.0%) |
Employment Status by Educational Attainment in Pascagoula
According to labor force statistics for Pascagoula, 68.1% of individuals (7,121) out of the total population between 25 and 64 years of age (10,457) are in the labor force, with 10.0% or 712 of them being unemployed. The group with the highest labor force participation rate are those with the educational attainment of bachelor's degree or higher, with 83.5% or 1,636 individuals in the labor force. Within the labor force, individuals with less than high school education have the highest percentage of unemployment, with 17.7% or 102 of them being unemployed.
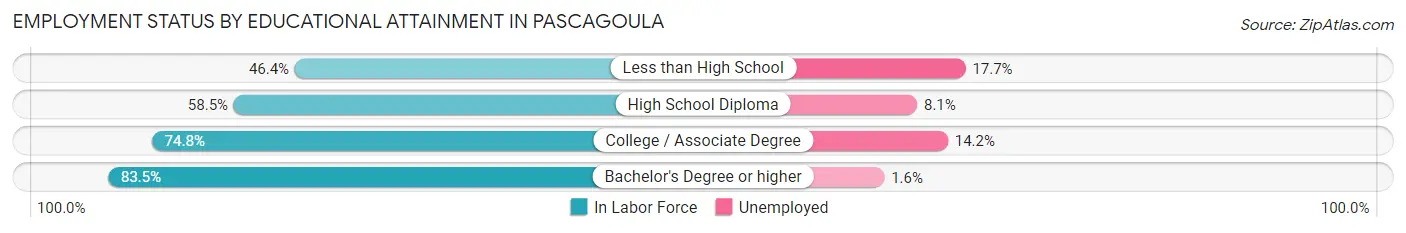
| Educational Attainment | In Labor Force | Unemployed |
| Less than High School | 577 (46.4%) | 220 (17.7%) |
| High School Diploma | 1,874 (58.5%) | 259 (8.1%) |
| College / Associate Degree | 3,030 (74.8%) | 575 (14.2%) |
| Bachelor's Degree or higher | 1,636 (83.5%) | 31 (1.6%) |
| Total | 7,121 (68.1%) | 1,046 (10.0%) |
Employment Occupations by Sex in Pascagoula
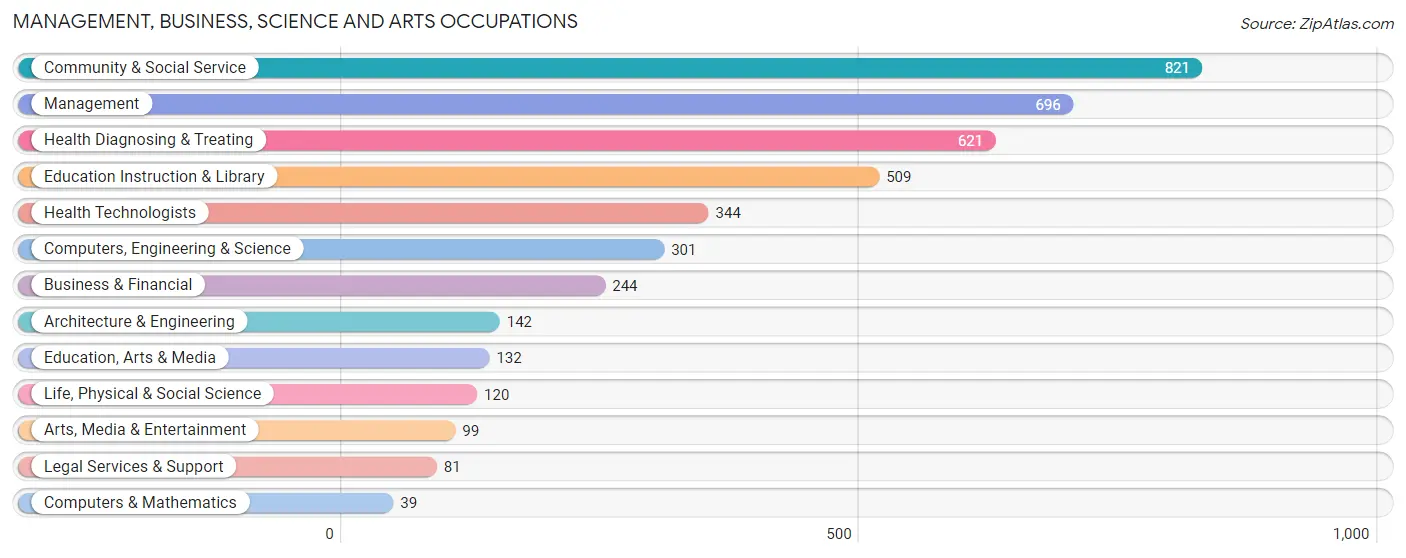
Management, Business, Science and Arts Occupations
The most common Management, Business, Science and Arts occupations in Pascagoula are Community & Social Service (821 | 10.2%), Management (696 | 8.6%), Health Diagnosing & Treating (621 | 7.7%), Education Instruction & Library (509 | 6.3%), and Health Technologists (344 | 4.3%).
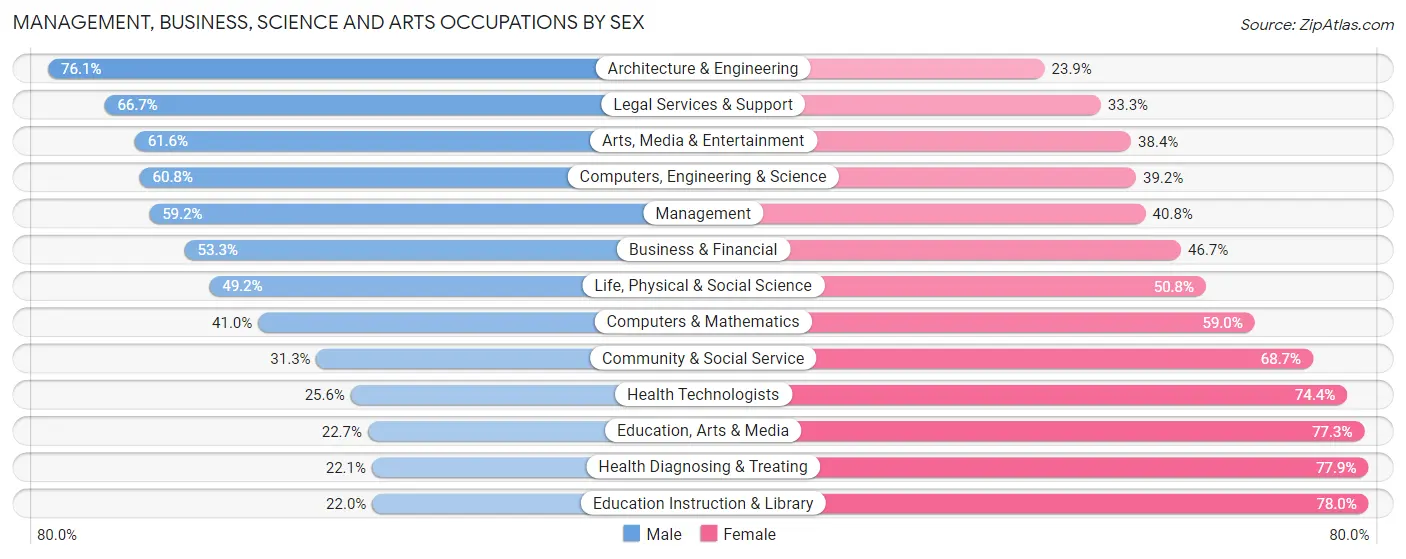
Management, Business, Science and Arts Occupations by Sex
Within the Management, Business, Science and Arts occupations in Pascagoula, the most male-oriented occupations are Architecture & Engineering (76.1%), Legal Services & Support (66.7%), and Arts, Media & Entertainment (61.6%), while the most female-oriented occupations are Education Instruction & Library (78.0%), Health Diagnosing & Treating (77.9%), and Education, Arts & Media (77.3%).
| Occupation | Male | Female |
| Management | 412 (59.2%) | 284 (40.8%) |
| Business & Financial | 130 (53.3%) | 114 (46.7%) |
| Computers, Engineering & Science | 183 (60.8%) | 118 (39.2%) |
| Computers & Mathematics | 16 (41.0%) | 23 (59.0%) |
| Architecture & Engineering | 108 (76.1%) | 34 (23.9%) |
| Life, Physical & Social Science | 59 (49.2%) | 61 (50.8%) |
| Community & Social Service | 257 (31.3%) | 564 (68.7%) |
| Education, Arts & Media | 30 (22.7%) | 102 (77.3%) |
| Legal Services & Support | 54 (66.7%) | 27 (33.3%) |
| Education Instruction & Library | 112 (22.0%) | 397 (78.0%) |
| Arts, Media & Entertainment | 61 (61.6%) | 38 (38.4%) |
| Health Diagnosing & Treating | 137 (22.1%) | 484 (77.9%) |
| Health Technologists | 88 (25.6%) | 256 (74.4%) |
| Total (Category) | 1,119 (41.7%) | 1,564 (58.3%) |
| Total (Overall) | 4,030 (50.0%) | 4,023 (50.0%) |
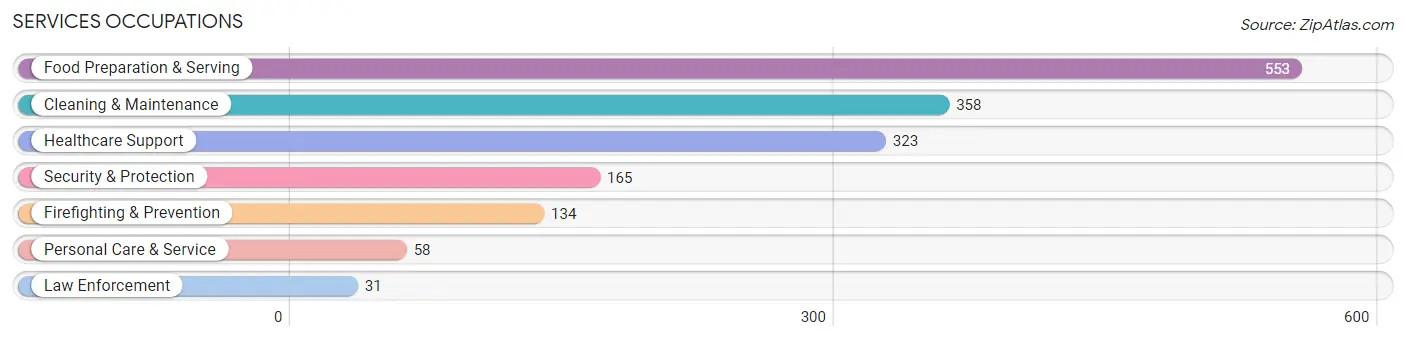
Services Occupations
The most common Services occupations in Pascagoula are Food Preparation & Serving (553 | 6.9%), Cleaning & Maintenance (358 | 4.4%), Healthcare Support (323 | 4.0%), Security & Protection (165 | 2.1%), and Firefighting & Prevention (134 | 1.7%).
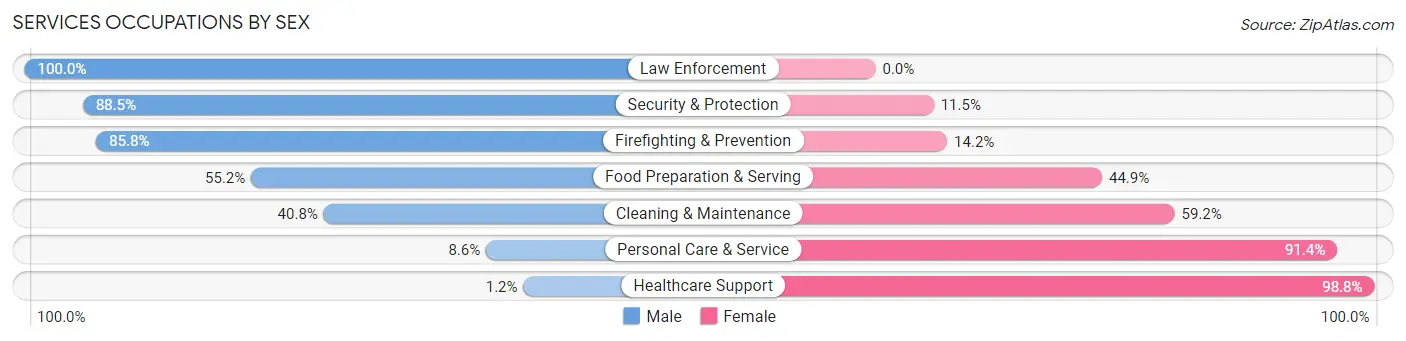
Services Occupations by Sex
Within the Services occupations in Pascagoula, the most male-oriented occupations are Law Enforcement (100.0%), Security & Protection (88.5%), and Firefighting & Prevention (85.8%), while the most female-oriented occupations are Healthcare Support (98.8%), Personal Care & Service (91.4%), and Cleaning & Maintenance (59.2%).
| Occupation | Male | Female |
| Healthcare Support | 4 (1.2%) | 319 (98.8%) |
| Security & Protection | 146 (88.5%) | 19 (11.5%) |
| Firefighting & Prevention | 115 (85.8%) | 19 (14.2%) |
| Law Enforcement | 31 (100.0%) | 0 (0.0%) |
| Food Preparation & Serving | 305 (55.1%) | 248 (44.9%) |
| Cleaning & Maintenance | 146 (40.8%) | 212 (59.2%) |
| Personal Care & Service | 5 (8.6%) | 53 (91.4%) |
| Total (Category) | 606 (41.6%) | 851 (58.4%) |
| Total (Overall) | 4,030 (50.0%) | 4,023 (50.0%) |
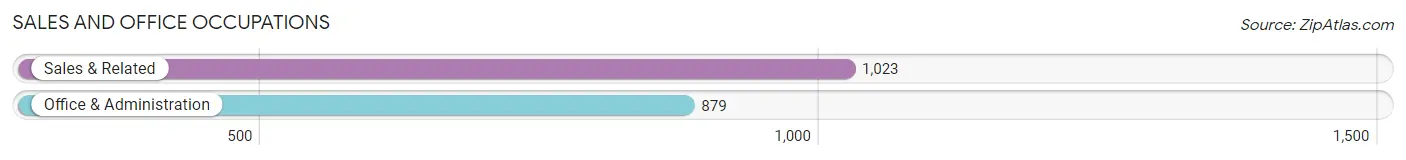
Sales and Office Occupations
The most common Sales and Office occupations in Pascagoula are Sales & Related (1,023 | 12.7%), and Office & Administration (879 | 10.9%).
Sales and Office Occupations by Sex
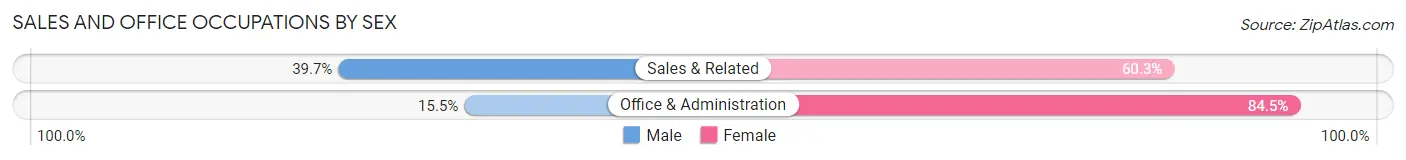
| Occupation | Male | Female |
| Sales & Related | 406 (39.7%) | 617 (60.3%) |
| Office & Administration | 136 (15.5%) | 743 (84.5%) |
| Total (Category) | 542 (28.5%) | 1,360 (71.5%) |
| Total (Overall) | 4,030 (50.0%) | 4,023 (50.0%) |
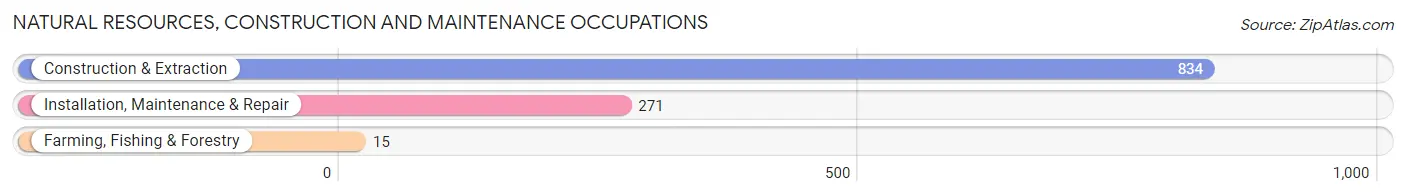
Natural Resources, Construction and Maintenance Occupations
The most common Natural Resources, Construction and Maintenance occupations in Pascagoula are Construction & Extraction (834 | 10.4%), Installation, Maintenance & Repair (271 | 3.4%), and Farming, Fishing & Forestry (15 | 0.2%).
Natural Resources, Construction and Maintenance Occupations by Sex
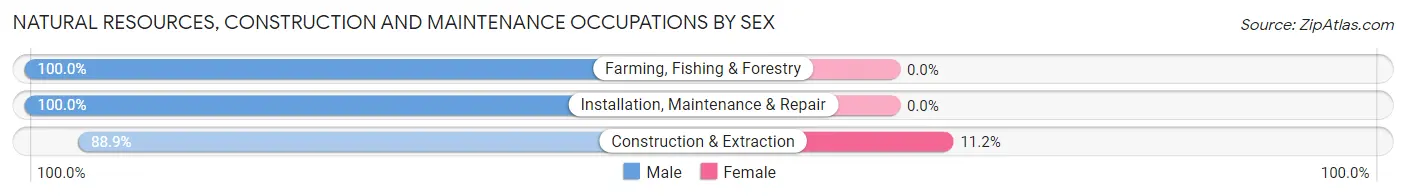
| Occupation | Male | Female |
| Farming, Fishing & Forestry | 15 (100.0%) | 0 (0.0%) |
| Construction & Extraction | 741 (88.8%) | 93 (11.2%) |
| Installation, Maintenance & Repair | 271 (100.0%) | 0 (0.0%) |
| Total (Category) | 1,027 (91.7%) | 93 (8.3%) |
| Total (Overall) | 4,030 (50.0%) | 4,023 (50.0%) |
Production, Transportation and Moving Occupations
The most common Production, Transportation and Moving occupations in Pascagoula are Production (496 | 6.2%), Transportation (203 | 2.5%), and Material Moving (192 | 2.4%).
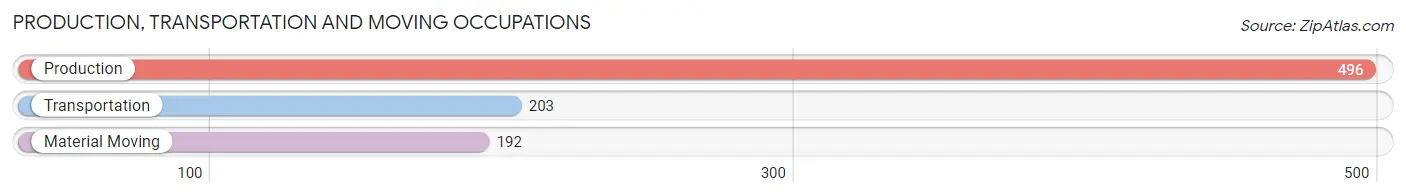
Production, Transportation and Moving Occupations by Sex
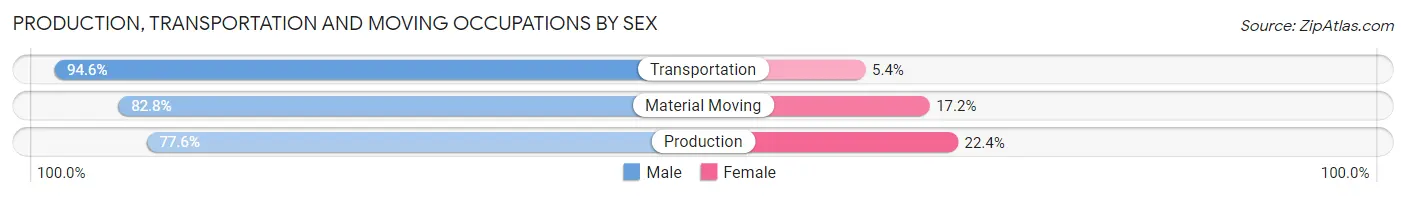
| Occupation | Male | Female |
| Production | 385 (77.6%) | 111 (22.4%) |
| Transportation | 192 (94.6%) | 11 (5.4%) |
| Material Moving | 159 (82.8%) | 33 (17.2%) |
| Total (Category) | 736 (82.6%) | 155 (17.4%) |
| Total (Overall) | 4,030 (50.0%) | 4,023 (50.0%) |
Employment Industries by Sex in Pascagoula
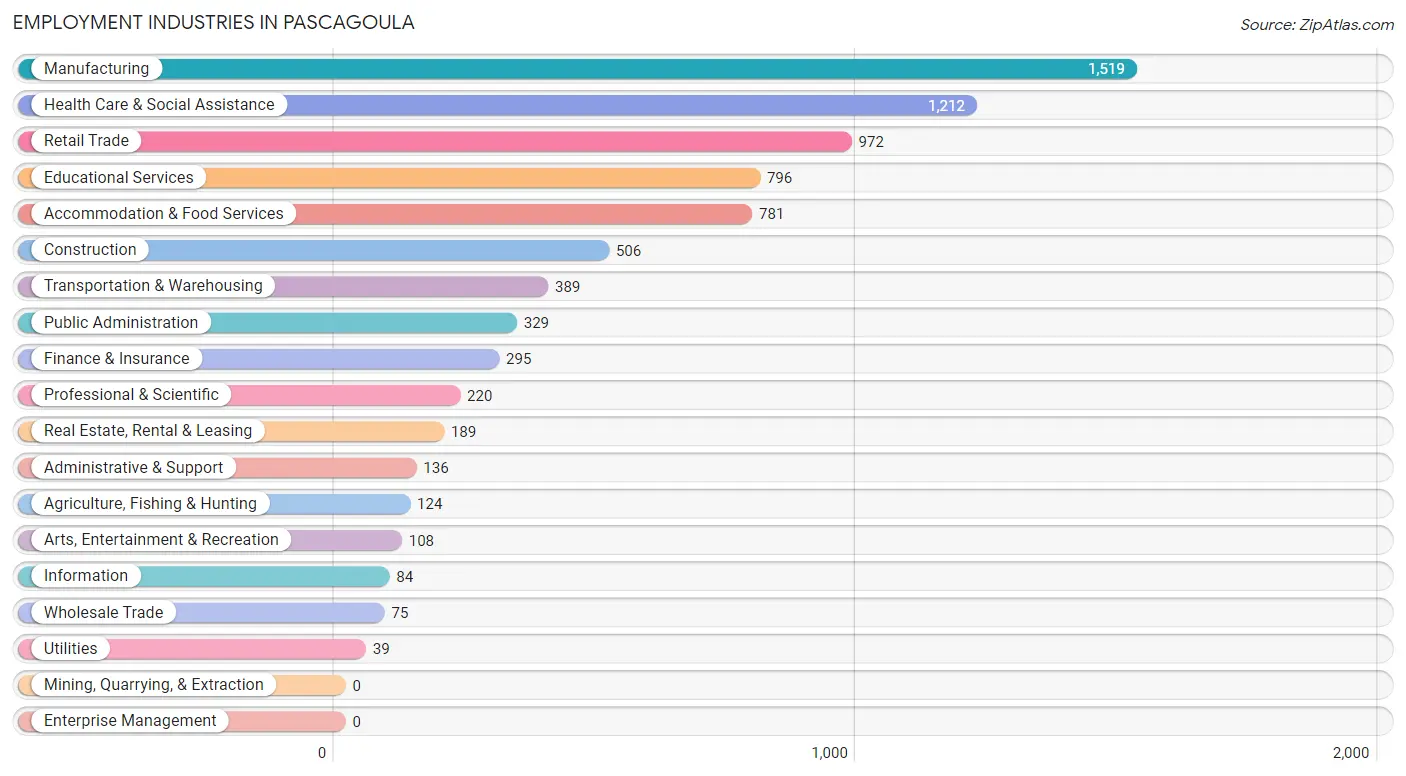
Employment Industries in Pascagoula
The major employment industries in Pascagoula include Manufacturing (1,519 | 18.9%), Health Care & Social Assistance (1,212 | 15.0%), Retail Trade (972 | 12.1%), Educational Services (796 | 9.9%), and Accommodation & Food Services (781 | 9.7%).
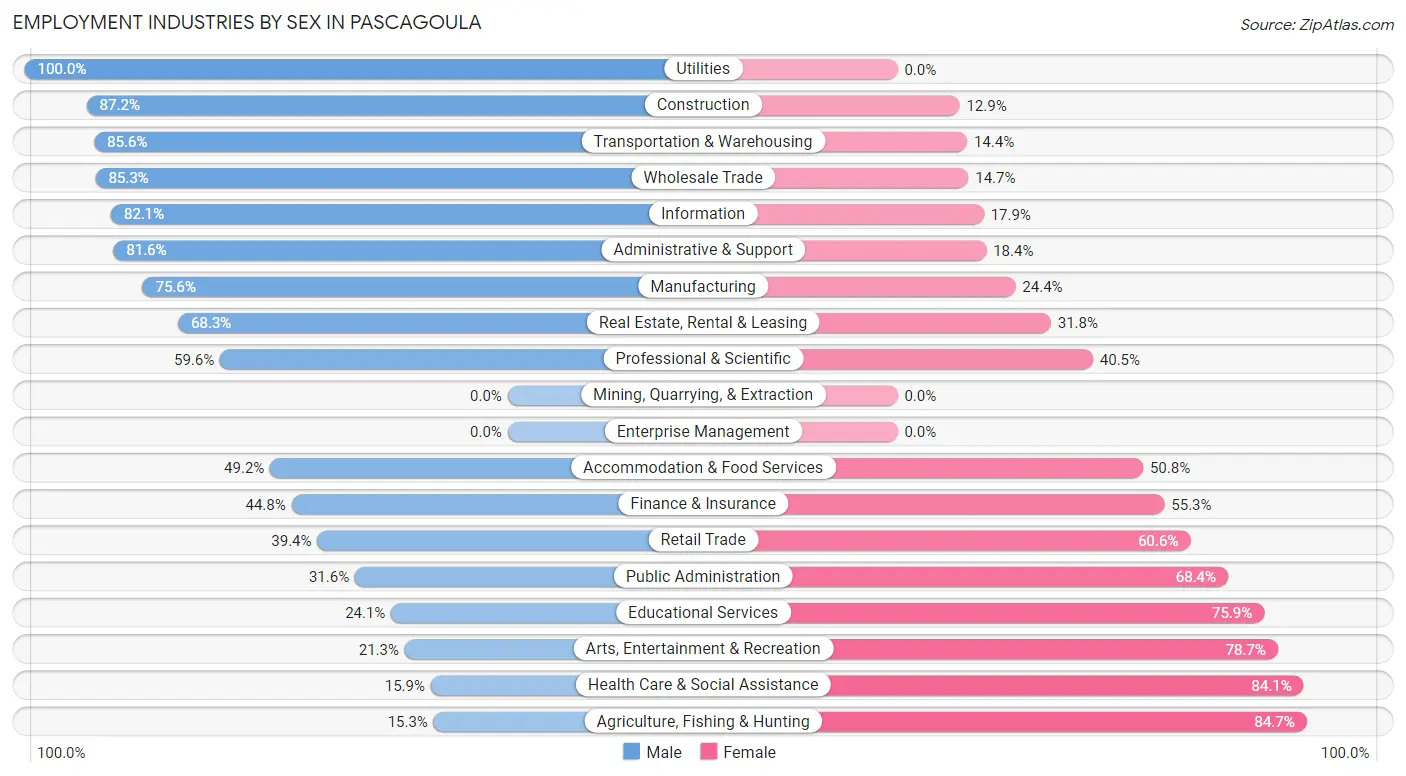
Employment Industries by Sex in Pascagoula
The Pascagoula industries that see more men than women are Utilities (100.0%), Construction (87.2%), and Transportation & Warehousing (85.6%), whereas the industries that tend to have a higher number of women are Agriculture, Fishing & Hunting (84.7%), Health Care & Social Assistance (84.1%), and Arts, Entertainment & Recreation (78.7%).
| Industry | Male | Female |
| Agriculture, Fishing & Hunting | 19 (15.3%) | 105 (84.7%) |
| Mining, Quarrying, & Extraction | 0 (0.0%) | 0 (0.0%) |
| Construction | 441 (87.2%) | 65 (12.9%) |
| Manufacturing | 1,148 (75.6%) | 371 (24.4%) |
| Wholesale Trade | 64 (85.3%) | 11 (14.7%) |
| Retail Trade | 383 (39.4%) | 589 (60.6%) |
| Transportation & Warehousing | 333 (85.6%) | 56 (14.4%) |
| Utilities | 39 (100.0%) | 0 (0.0%) |
| Information | 69 (82.1%) | 15 (17.9%) |
| Finance & Insurance | 132 (44.8%) | 163 (55.2%) |
| Real Estate, Rental & Leasing | 129 (68.2%) | 60 (31.8%) |
| Professional & Scientific | 131 (59.6%) | 89 (40.5%) |
| Enterprise Management | 0 (0.0%) | 0 (0.0%) |
| Administrative & Support | 111 (81.6%) | 25 (18.4%) |
| Educational Services | 192 (24.1%) | 604 (75.9%) |
| Health Care & Social Assistance | 193 (15.9%) | 1,019 (84.1%) |
| Arts, Entertainment & Recreation | 23 (21.3%) | 85 (78.7%) |
| Accommodation & Food Services | 384 (49.2%) | 397 (50.8%) |
| Public Administration | 104 (31.6%) | 225 (68.4%) |
| Total | 4,030 (50.0%) | 4,023 (50.0%) |
Education in Pascagoula
School Enrollment in Pascagoula
The most common levels of schooling among the 4,731 students in Pascagoula are elementary school (1,044 | 22.1%), middle school (964 | 20.4%), and high school (951 | 20.1%).
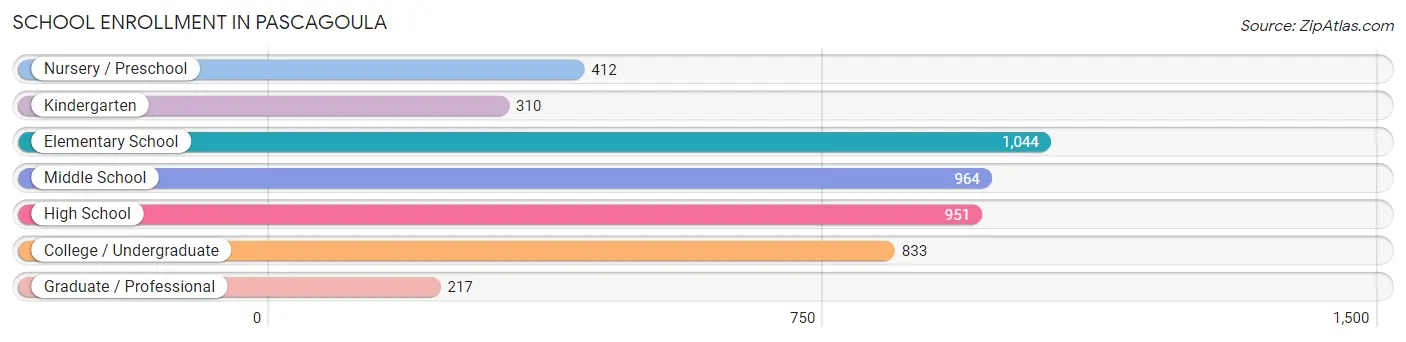
| School Level | # Students | % Students |
| Nursery / Preschool | 412 | 8.7% |
| Kindergarten | 310 | 6.6% |
| Elementary School | 1,044 | 22.1% |
| Middle School | 964 | 20.4% |
| High School | 951 | 20.1% |
| College / Undergraduate | 833 | 17.6% |
| Graduate / Professional | 217 | 4.6% |
| Total | 4,731 | 100.0% |
School Enrollment by Age by Funding Source in Pascagoula
Out of a total of 4,731 students who are enrolled in schools in Pascagoula, 880 (18.6%) attend a private institution, while the remaining 3,851 (81.4%) are enrolled in public schools. The age group of 3 to 4 year olds has the highest likelihood of being enrolled in private schools, with 157 (56.1% in the age bracket) enrolled. Conversely, the age group of 35 years and over has the lowest likelihood of being enrolled in a private school, with 263 (96.7% in the age bracket) attending a public institution.
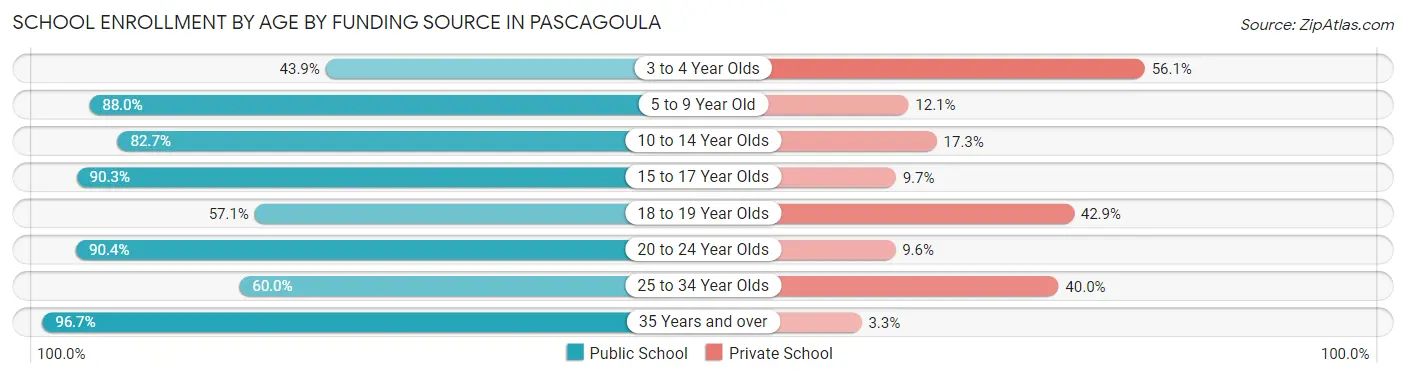
| Age Bracket | Public School | Private School |
| 3 to 4 Year Olds | 123 (43.9%) | 157 (56.1%) |
| 5 to 9 Year Old | 1,190 (87.9%) | 163 (12.0%) |
| 10 to 14 Year Olds | 979 (82.7%) | 205 (17.3%) |
| 15 to 17 Year Olds | 662 (90.3%) | 71 (9.7%) |
| 18 to 19 Year Olds | 232 (57.1%) | 174 (42.9%) |
| 20 to 24 Year Olds | 292 (90.4%) | 31 (9.6%) |
| 25 to 34 Year Olds | 108 (60.0%) | 72 (40.0%) |
| 35 Years and over | 263 (96.7%) | 9 (3.3%) |
| Total | 3,851 (81.4%) | 880 (18.6%) |
Educational Attainment by Field of Study in Pascagoula
Education (556 | 20.8%), business (494 | 18.5%), science & technology (390 | 14.6%), arts & humanities (196 | 7.3%), and social sciences (170 | 6.4%) are the most common fields of study among 2,676 individuals in Pascagoula who have obtained a bachelor's degree or higher.
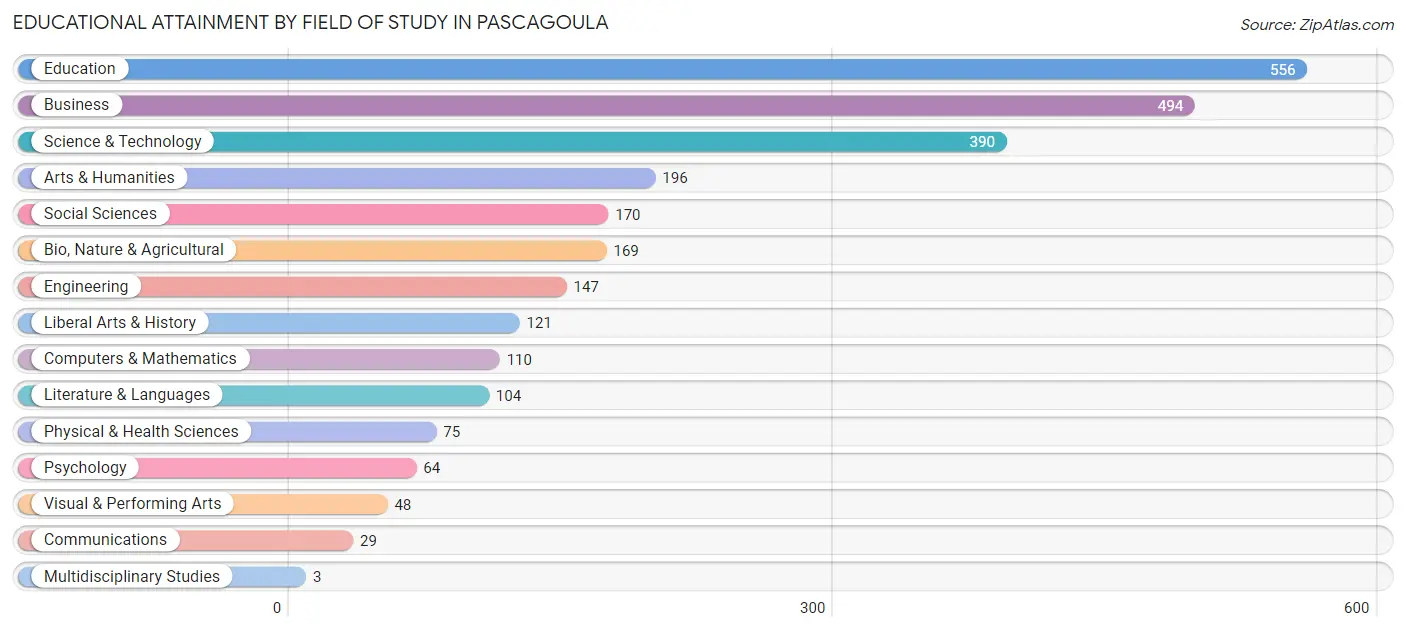
| Field of Study | # Graduates | % Graduates |
| Computers & Mathematics | 110 | 4.1% |
| Bio, Nature & Agricultural | 169 | 6.3% |
| Physical & Health Sciences | 75 | 2.8% |
| Psychology | 64 | 2.4% |
| Social Sciences | 170 | 6.4% |
| Engineering | 147 | 5.5% |
| Multidisciplinary Studies | 3 | 0.1% |
| Science & Technology | 390 | 14.6% |
| Business | 494 | 18.5% |
| Education | 556 | 20.8% |
| Literature & Languages | 104 | 3.9% |
| Liberal Arts & History | 121 | 4.5% |
| Visual & Performing Arts | 48 | 1.8% |
| Communications | 29 | 1.1% |
| Arts & Humanities | 196 | 7.3% |
| Total | 2,676 | 100.0% |
Transportation & Commute in Pascagoula
Vehicle Availability by Sex in Pascagoula
The most prevalent vehicle ownership categories in Pascagoula are males with 2 vehicles (1,505, accounting for 37.9%) and females with 2 vehicles (1,585, making up 37.7%).
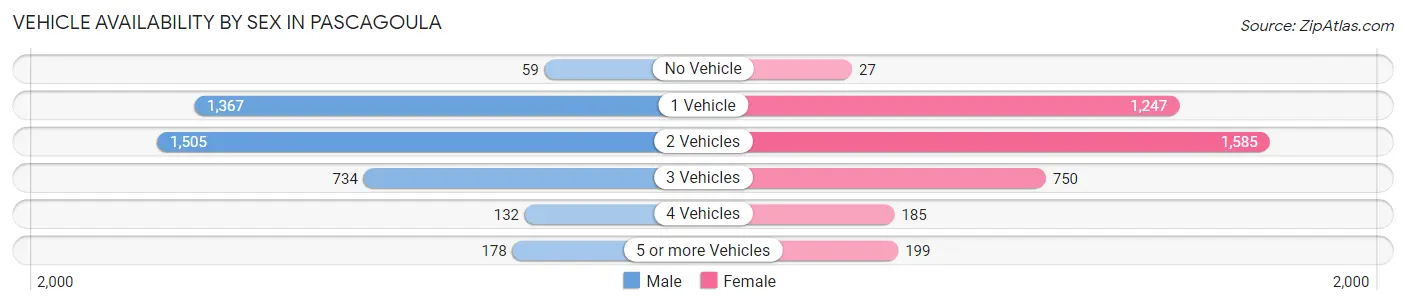
| Vehicles Available | Male | Female |
| No Vehicle | 59 (1.5%) | 27 (0.7%) |
| 1 Vehicle | 1,367 (34.4%) | 1,247 (31.2%) |
| 2 Vehicles | 1,505 (37.9%) | 1,585 (39.7%) |
| 3 Vehicles | 734 (18.5%) | 750 (18.8%) |
| 4 Vehicles | 132 (3.3%) | 185 (4.6%) |
| 5 or more Vehicles | 178 (4.5%) | 199 (5.0%) |
| Total | 3,975 (100.0%) | 3,993 (100.0%) |
Commute Time in Pascagoula
The most frequently occuring commute durations in Pascagoula are 10 to 14 minutes (1,875 commuters, 23.9%), 15 to 19 minutes (1,483 commuters, 18.9%), and 5 to 9 minutes (1,444 commuters, 18.4%).
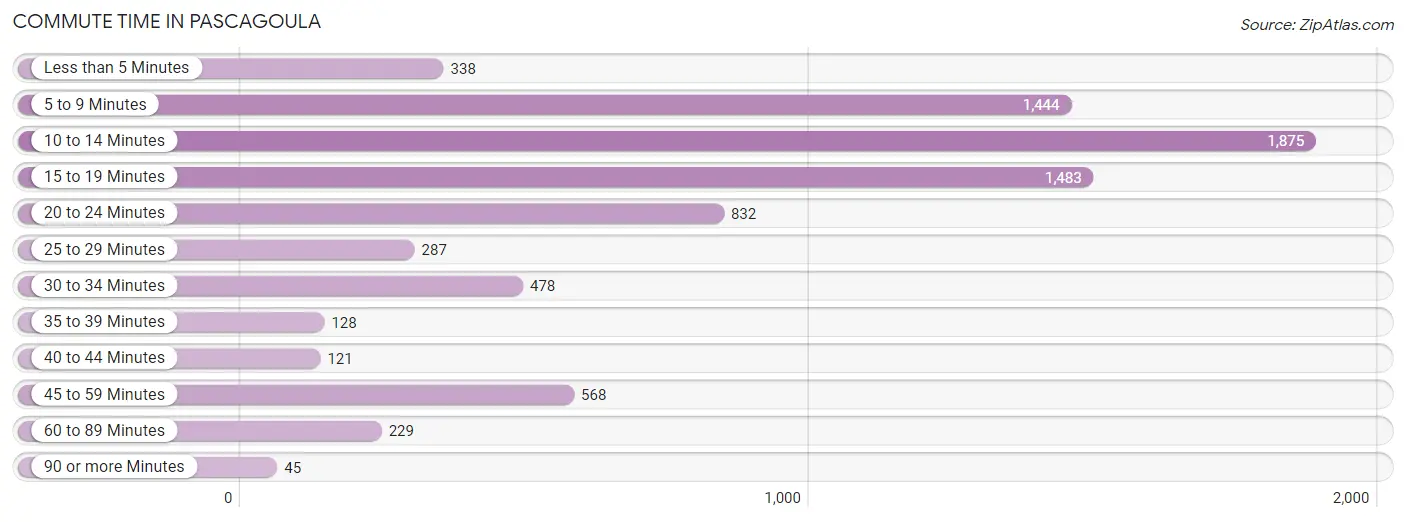
| Commute Time | # Commuters | % Commuters |
| Less than 5 Minutes | 338 | 4.3% |
| 5 to 9 Minutes | 1,444 | 18.4% |
| 10 to 14 Minutes | 1,875 | 23.9% |
| 15 to 19 Minutes | 1,483 | 18.9% |
| 20 to 24 Minutes | 832 | 10.6% |
| 25 to 29 Minutes | 287 | 3.7% |
| 30 to 34 Minutes | 478 | 6.1% |
| 35 to 39 Minutes | 128 | 1.6% |
| 40 to 44 Minutes | 121 | 1.5% |
| 45 to 59 Minutes | 568 | 7.3% |
| 60 to 89 Minutes | 229 | 2.9% |
| 90 or more Minutes | 45 | 0.6% |
Commute Time by Sex in Pascagoula
The most common commute times in Pascagoula are 10 to 14 minutes (899 commuters, 23.1%) for males and 10 to 14 minutes (976 commuters, 24.8%) for females.
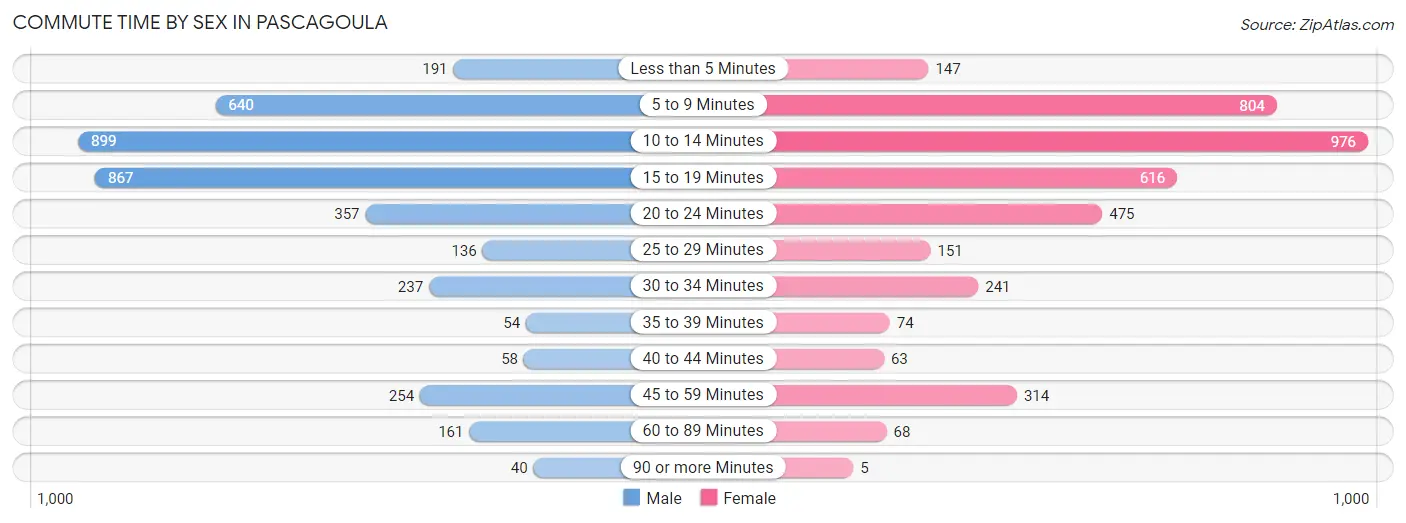
| Commute Time | Male | Female |
| Less than 5 Minutes | 191 (4.9%) | 147 (3.7%) |
| 5 to 9 Minutes | 640 (16.4%) | 804 (20.4%) |
| 10 to 14 Minutes | 899 (23.1%) | 976 (24.8%) |
| 15 to 19 Minutes | 867 (22.3%) | 616 (15.7%) |
| 20 to 24 Minutes | 357 (9.2%) | 475 (12.1%) |
| 25 to 29 Minutes | 136 (3.5%) | 151 (3.8%) |
| 30 to 34 Minutes | 237 (6.1%) | 241 (6.1%) |
| 35 to 39 Minutes | 54 (1.4%) | 74 (1.9%) |
| 40 to 44 Minutes | 58 (1.5%) | 63 (1.6%) |
| 45 to 59 Minutes | 254 (6.5%) | 314 (8.0%) |
| 60 to 89 Minutes | 161 (4.1%) | 68 (1.7%) |
| 90 or more Minutes | 40 (1.0%) | 5 (0.1%) |
Time of Departure to Work by Sex in Pascagoula
The most frequent times of departure to work in Pascagoula are 12:00 AM to 4:59 AM (734, 18.9%) for males and 7:00 AM to 7:29 AM (1,027, 26.1%) for females.
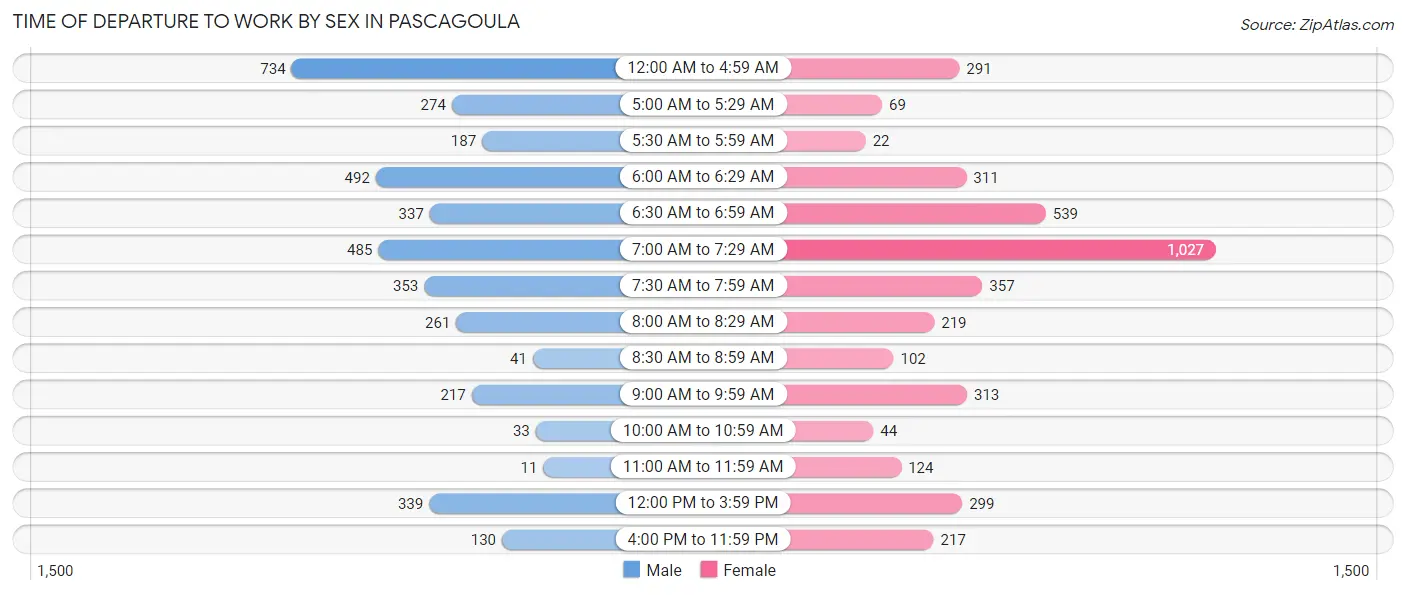
| Time of Departure | Male | Female |
| 12:00 AM to 4:59 AM | 734 (18.9%) | 291 (7.4%) |
| 5:00 AM to 5:29 AM | 274 (7.0%) | 69 (1.8%) |
| 5:30 AM to 5:59 AM | 187 (4.8%) | 22 (0.6%) |
| 6:00 AM to 6:29 AM | 492 (12.6%) | 311 (7.9%) |
| 6:30 AM to 6:59 AM | 337 (8.6%) | 539 (13.7%) |
| 7:00 AM to 7:29 AM | 485 (12.5%) | 1,027 (26.1%) |
| 7:30 AM to 7:59 AM | 353 (9.1%) | 357 (9.1%) |
| 8:00 AM to 8:29 AM | 261 (6.7%) | 219 (5.6%) |
| 8:30 AM to 8:59 AM | 41 (1.1%) | 102 (2.6%) |
| 9:00 AM to 9:59 AM | 217 (5.6%) | 313 (8.0%) |
| 10:00 AM to 10:59 AM | 33 (0.9%) | 44 (1.1%) |
| 11:00 AM to 11:59 AM | 11 (0.3%) | 124 (3.2%) |
| 12:00 PM to 3:59 PM | 339 (8.7%) | 299 (7.6%) |
| 4:00 PM to 11:59 PM | 130 (3.3%) | 217 (5.5%) |
| Total | 3,894 (100.0%) | 3,934 (100.0%) |
Housing Occupancy in Pascagoula
Occupancy by Ownership in Pascagoula
Of the total 8,595 dwellings in Pascagoula, owner-occupied units account for 4,409 (51.3%), while renter-occupied units make up 4,186 (48.7%).
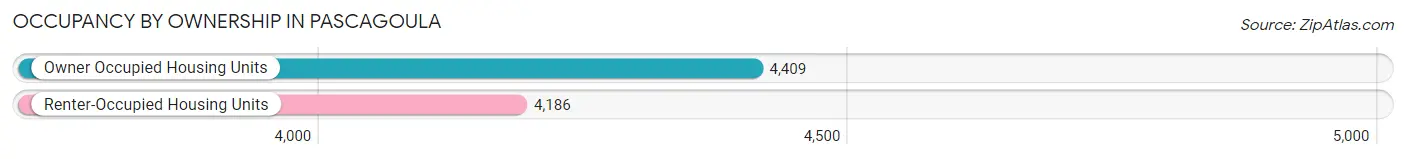
| Occupancy | # Housing Units | % Housing Units |
| Owner Occupied Housing Units | 4,409 | 51.3% |
| Renter-Occupied Housing Units | 4,186 | 48.7% |
| Total Occupied Housing Units | 8,595 | 100.0% |
Occupancy by Household Size in Pascagoula
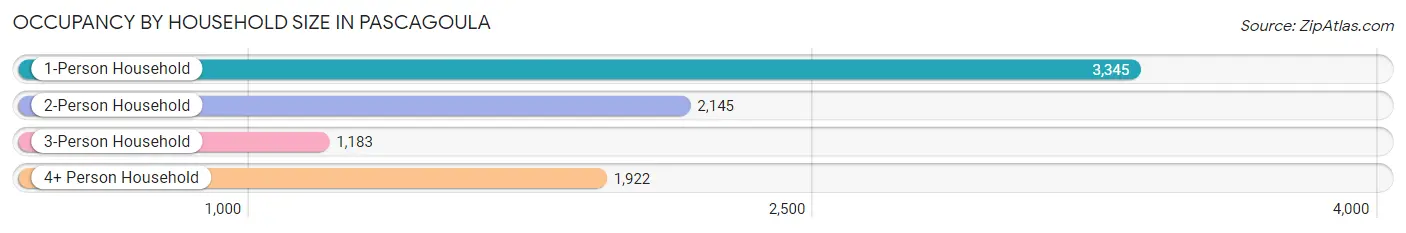
| Household Size | # Housing Units | % Housing Units |
| 1-Person Household | 3,345 | 38.9% |
| 2-Person Household | 2,145 | 25.0% |
| 3-Person Household | 1,183 | 13.8% |
| 4+ Person Household | 1,922 | 22.4% |
| Total Housing Units | 8,595 | 100.0% |
Occupancy by Ownership by Household Size in Pascagoula
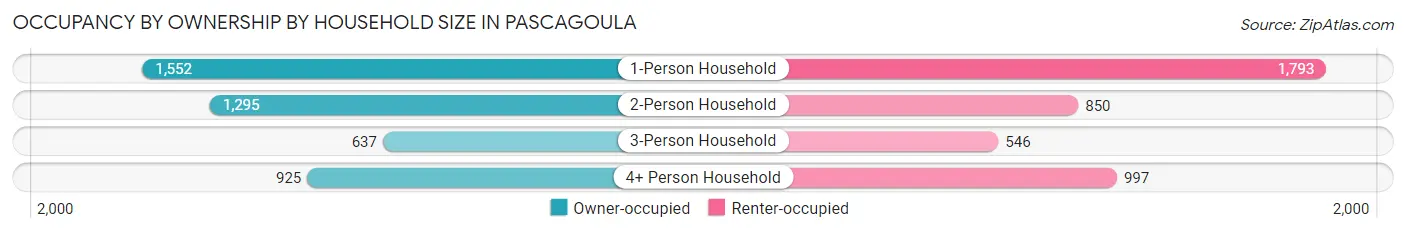
| Household Size | Owner-occupied | Renter-occupied |
| 1-Person Household | 1,552 (46.4%) | 1,793 (53.6%) |
| 2-Person Household | 1,295 (60.4%) | 850 (39.6%) |
| 3-Person Household | 637 (53.8%) | 546 (46.2%) |
| 4+ Person Household | 925 (48.1%) | 997 (51.9%) |
| Total Housing Units | 4,409 (51.3%) | 4,186 (48.7%) |
Occupancy by Educational Attainment in Pascagoula
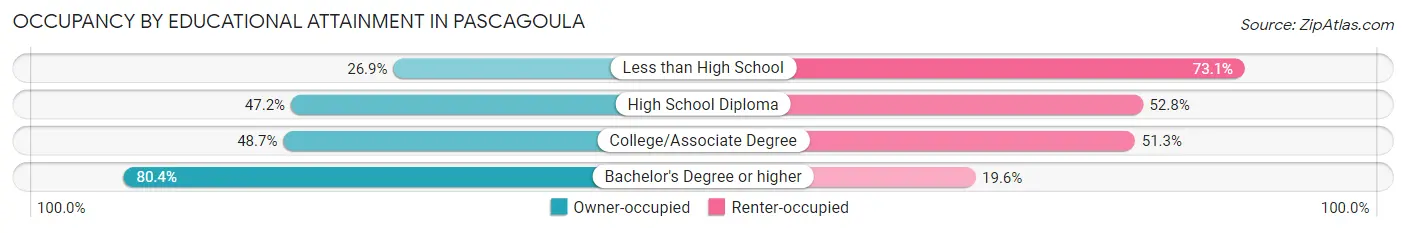
| Household Size | Owner-occupied | Renter-occupied |
| Less than High School | 298 (26.9%) | 810 (73.1%) |
| High School Diploma | 1,095 (47.2%) | 1,225 (52.8%) |
| College/Associate Degree | 1,750 (48.7%) | 1,842 (51.3%) |
| Bachelor's Degree or higher | 1,266 (80.4%) | 309 (19.6%) |
Occupancy by Age of Householder in Pascagoula
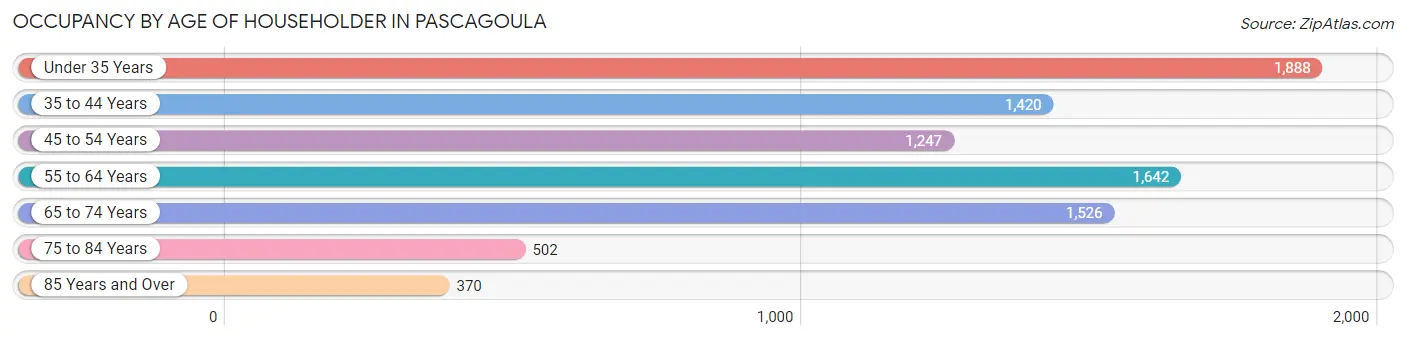
| Age Bracket | # Households | % Households |
| Under 35 Years | 1,888 | 22.0% |
| 35 to 44 Years | 1,420 | 16.5% |
| 45 to 54 Years | 1,247 | 14.5% |
| 55 to 64 Years | 1,642 | 19.1% |
| 65 to 74 Years | 1,526 | 17.7% |
| 75 to 84 Years | 502 | 5.8% |
| 85 Years and Over | 370 | 4.3% |
| Total | 8,595 | 100.0% |
Housing Finances in Pascagoula
Median Income by Occupancy in Pascagoula
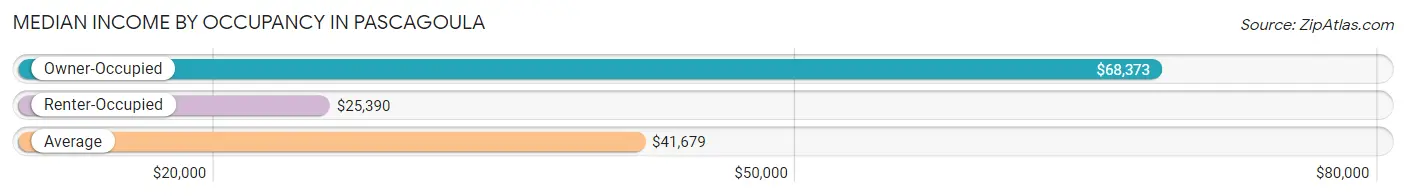
| Occupancy Type | # Households | Median Income |
| Owner-Occupied | 4,409 (51.3%) | $68,373 |
| Renter-Occupied | 4,186 (48.7%) | $25,390 |
| Average | 8,595 (100.0%) | $41,679 |
Occupancy by Householder Income Bracket in Pascagoula
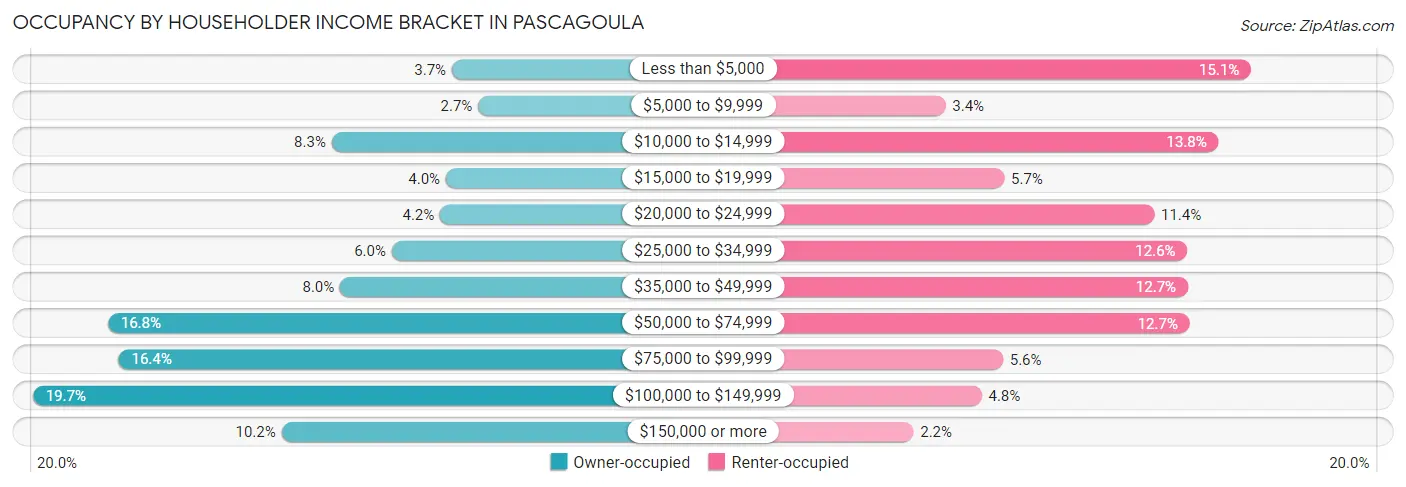
| Income Bracket | Owner-occupied | Renter-occupied |
| Less than $5,000 | 164 (3.7%) | 631 (15.1%) |
| $5,000 to $9,999 | 120 (2.7%) | 143 (3.4%) |
| $10,000 to $14,999 | 366 (8.3%) | 579 (13.8%) |
| $15,000 to $19,999 | 174 (4.0%) | 237 (5.7%) |
| $20,000 to $24,999 | 184 (4.2%) | 476 (11.4%) |
| $25,000 to $34,999 | 265 (6.0%) | 529 (12.6%) |
| $35,000 to $49,999 | 352 (8.0%) | 530 (12.7%) |
| $50,000 to $74,999 | 742 (16.8%) | 533 (12.7%) |
| $75,000 to $99,999 | 724 (16.4%) | 235 (5.6%) |
| $100,000 to $149,999 | 868 (19.7%) | 201 (4.8%) |
| $150,000 or more | 450 (10.2%) | 92 (2.2%) |
| Total | 4,409 (100.0%) | 4,186 (100.0%) |
Monthly Housing Cost Tiers in Pascagoula
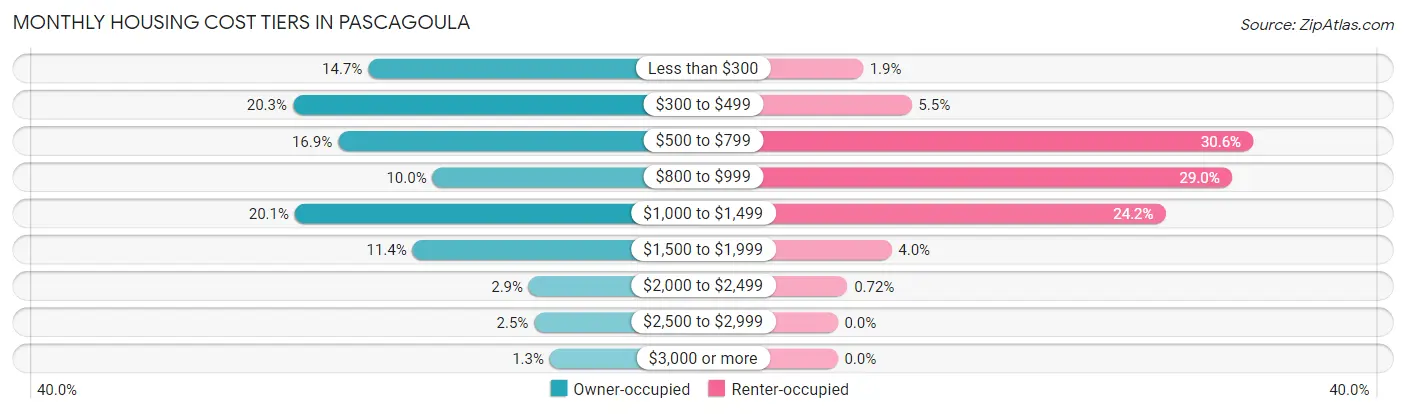
| Monthly Cost | Owner-occupied | Renter-occupied |
| Less than $300 | 648 (14.7%) | 78 (1.9%) |
| $300 to $499 | 893 (20.3%) | 228 (5.4%) |
| $500 to $799 | 746 (16.9%) | 1,281 (30.6%) |
| $800 to $999 | 439 (10.0%) | 1,215 (29.0%) |
| $1,000 to $1,499 | 886 (20.1%) | 1,011 (24.1%) |
| $1,500 to $1,999 | 504 (11.4%) | 166 (4.0%) |
| $2,000 to $2,499 | 126 (2.9%) | 30 (0.7%) |
| $2,500 to $2,999 | 109 (2.5%) | 0 (0.0%) |
| $3,000 or more | 58 (1.3%) | 0 (0.0%) |
| Total | 4,409 (100.0%) | 4,186 (100.0%) |
Physical Housing Characteristics in Pascagoula
Housing Structures in Pascagoula
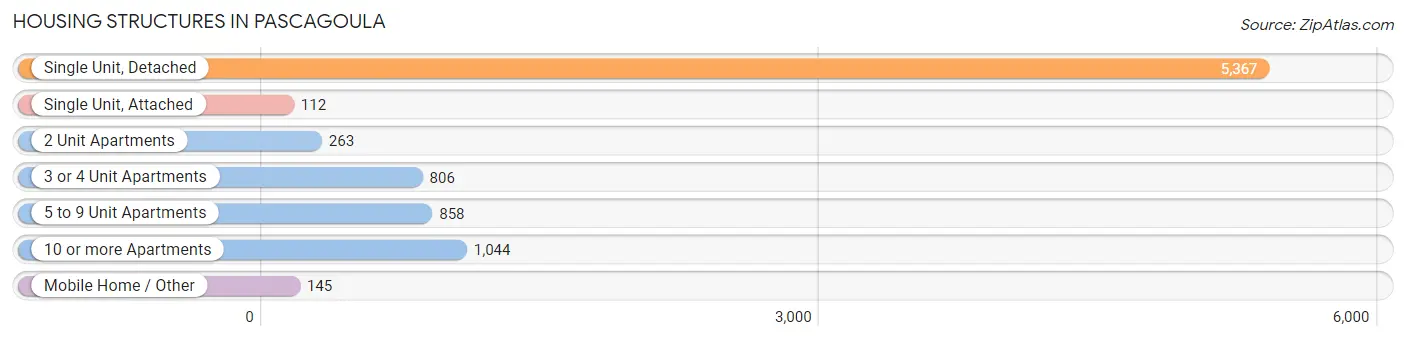
| Structure Type | # Housing Units | % Housing Units |
| Single Unit, Detached | 5,367 | 62.4% |
| Single Unit, Attached | 112 | 1.3% |
| 2 Unit Apartments | 263 | 3.1% |
| 3 or 4 Unit Apartments | 806 | 9.4% |
| 5 to 9 Unit Apartments | 858 | 10.0% |
| 10 or more Apartments | 1,044 | 12.1% |
| Mobile Home / Other | 145 | 1.7% |
| Total | 8,595 | 100.0% |
Housing Structures by Occupancy in Pascagoula
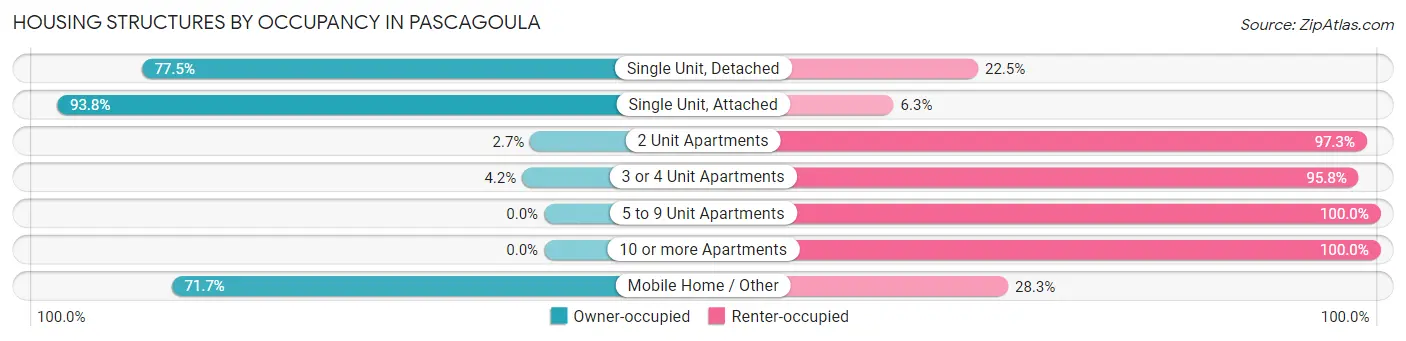
| Structure Type | Owner-occupied | Renter-occupied |
| Single Unit, Detached | 4,159 (77.5%) | 1,208 (22.5%) |
| Single Unit, Attached | 105 (93.8%) | 7 (6.2%) |
| 2 Unit Apartments | 7 (2.7%) | 256 (97.3%) |
| 3 or 4 Unit Apartments | 34 (4.2%) | 772 (95.8%) |
| 5 to 9 Unit Apartments | 0 (0.0%) | 858 (100.0%) |
| 10 or more Apartments | 0 (0.0%) | 1,044 (100.0%) |
| Mobile Home / Other | 104 (71.7%) | 41 (28.3%) |
| Total | 4,409 (51.3%) | 4,186 (48.7%) |
Housing Structures by Number of Rooms in Pascagoula
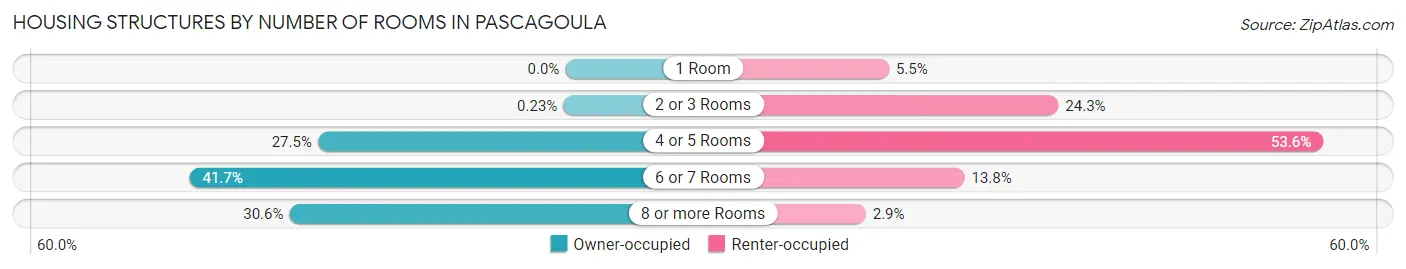
| Number of Rooms | Owner-occupied | Renter-occupied |
| 1 Room | 0 (0.0%) | 228 (5.4%) |
| 2 or 3 Rooms | 10 (0.2%) | 1,015 (24.2%) |
| 4 or 5 Rooms | 1,211 (27.5%) | 2,244 (53.6%) |
| 6 or 7 Rooms | 1,838 (41.7%) | 579 (13.8%) |
| 8 or more Rooms | 1,350 (30.6%) | 120 (2.9%) |
| Total | 4,409 (100.0%) | 4,186 (100.0%) |
Housing Structure by Heating Type in Pascagoula
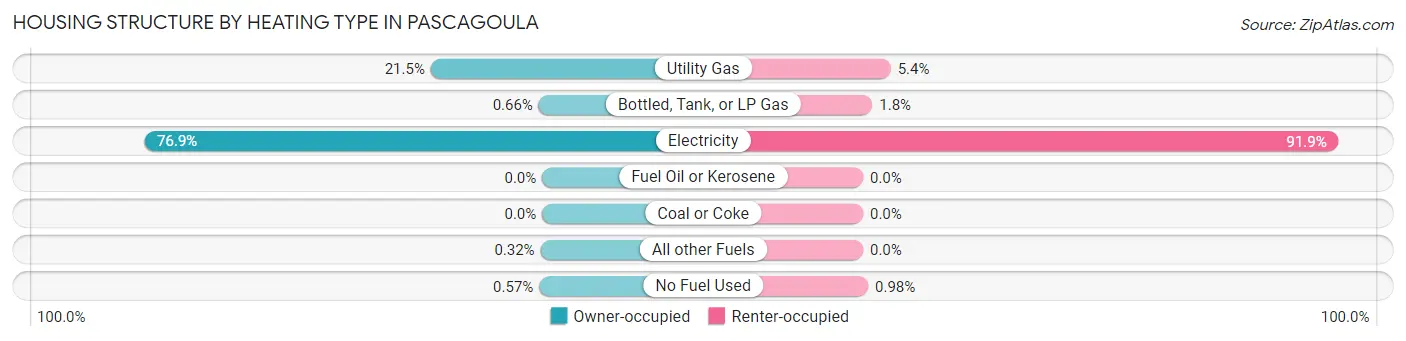
| Heating Type | Owner-occupied | Renter-occupied |
| Utility Gas | 949 (21.5%) | 224 (5.3%) |
| Bottled, Tank, or LP Gas | 29 (0.7%) | 75 (1.8%) |
| Electricity | 3,392 (76.9%) | 3,846 (91.9%) |
| Fuel Oil or Kerosene | 0 (0.0%) | 0 (0.0%) |
| Coal or Coke | 0 (0.0%) | 0 (0.0%) |
| All other Fuels | 14 (0.3%) | 0 (0.0%) |
| No Fuel Used | 25 (0.6%) | 41 (1.0%) |
| Total | 4,409 (100.0%) | 4,186 (100.0%) |
Household Vehicle Usage in Pascagoula
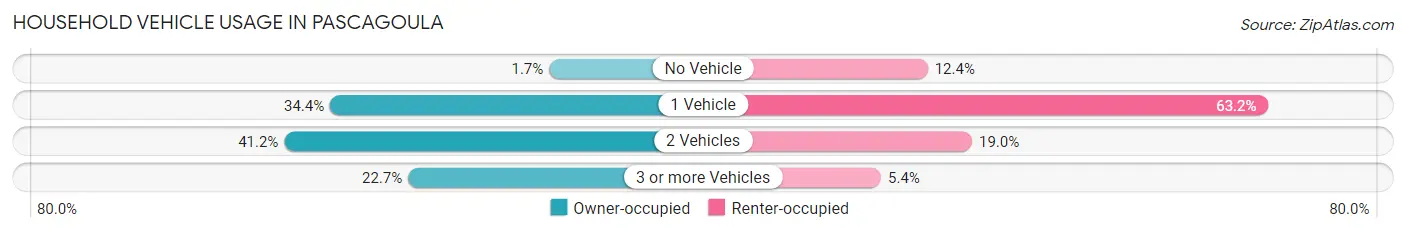
| Vehicles per Household | Owner-occupied | Renter-occupied |
| No Vehicle | 73 (1.7%) | 518 (12.4%) |
| 1 Vehicle | 1,516 (34.4%) | 2,647 (63.2%) |
| 2 Vehicles | 1,818 (41.2%) | 795 (19.0%) |
| 3 or more Vehicles | 1,002 (22.7%) | 226 (5.4%) |
| Total | 4,409 (100.0%) | 4,186 (100.0%) |
Real Estate & Mortgages in Pascagoula
Real Estate and Mortgage Overview in Pascagoula
| Characteristic | Without Mortgage | With Mortgage |
| Housing Units | 2,300 | 2,109 |
| Median Property Value | $118,300 | $143,400 |
| Median Household Income | $52,361 | $298 |
| Monthly Housing Costs | $427 | $58 |
| Real Estate Taxes | $813 | $171 |
Property Value by Mortgage Status in Pascagoula
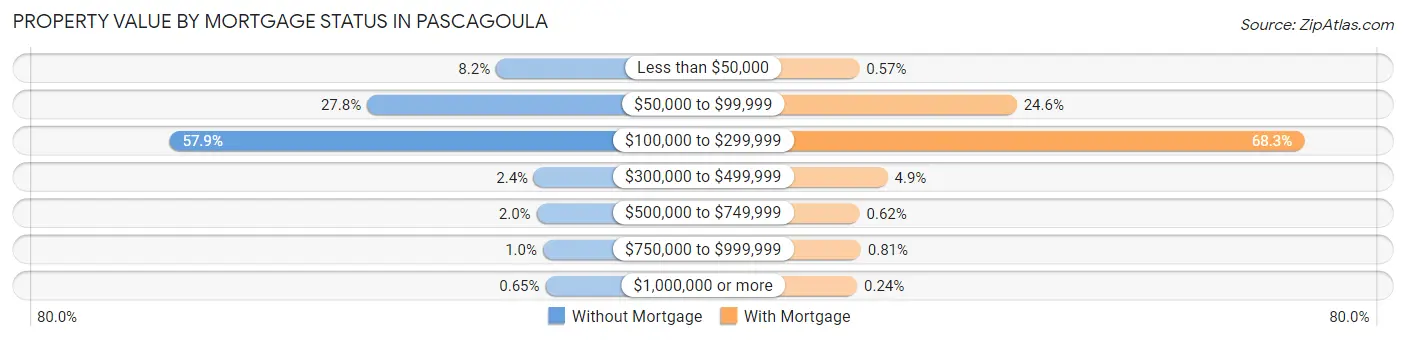
| Property Value | Without Mortgage | With Mortgage |
| Less than $50,000 | 188 (8.2%) | 12 (0.6%) |
| $50,000 to $99,999 | 640 (27.8%) | 518 (24.6%) |
| $100,000 to $299,999 | 1,332 (57.9%) | 1,441 (68.3%) |
| $300,000 to $499,999 | 55 (2.4%) | 103 (4.9%) |
| $500,000 to $749,999 | 46 (2.0%) | 13 (0.6%) |
| $750,000 to $999,999 | 24 (1.0%) | 17 (0.8%) |
| $1,000,000 or more | 15 (0.6%) | 5 (0.2%) |
| Total | 2,300 (100.0%) | 2,109 (100.0%) |
Household Income by Mortgage Status in Pascagoula
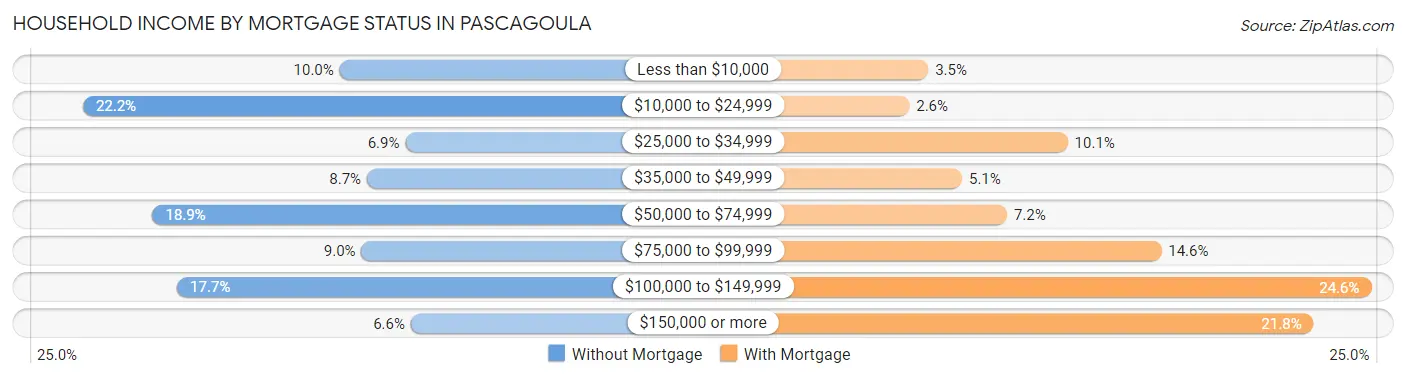
| Household Income | Without Mortgage | With Mortgage |
| Less than $10,000 | 230 (10.0%) | 73 (3.5%) |
| $10,000 to $24,999 | 511 (22.2%) | 54 (2.6%) |
| $25,000 to $34,999 | 158 (6.9%) | 213 (10.1%) |
| $35,000 to $49,999 | 200 (8.7%) | 107 (5.1%) |
| $50,000 to $74,999 | 435 (18.9%) | 152 (7.2%) |
| $75,000 to $99,999 | 206 (9.0%) | 307 (14.6%) |
| $100,000 to $149,999 | 408 (17.7%) | 518 (24.6%) |
| $150,000 or more | 152 (6.6%) | 460 (21.8%) |
| Total | 2,300 (100.0%) | 2,109 (100.0%) |
Property Value to Household Income Ratio in Pascagoula
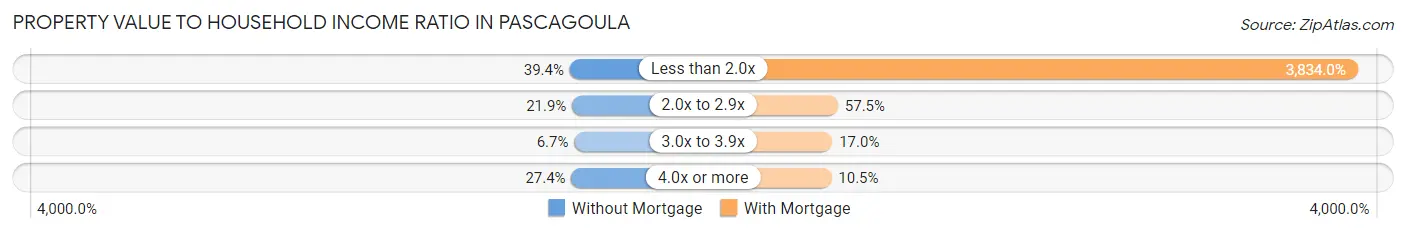
| Value-to-Income Ratio | Without Mortgage | With Mortgage |
| Less than 2.0x | 907 (39.4%) | 80,859 (3,834.0%) |
| 2.0x to 2.9x | 503 (21.9%) | 1,213 (57.5%) |
| 3.0x to 3.9x | 153 (6.7%) | 358 (17.0%) |
| 4.0x or more | 630 (27.4%) | 222 (10.5%) |
| Total | 2,300 (100.0%) | 2,109 (100.0%) |
Real Estate Taxes by Mortgage Status in Pascagoula
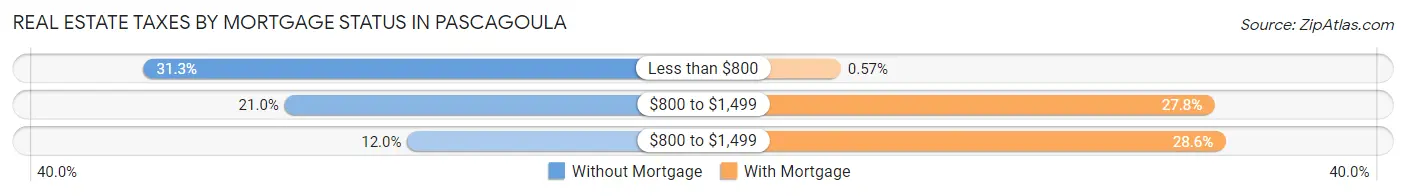
| Property Taxes | Without Mortgage | With Mortgage |
| Less than $800 | 720 (31.3%) | 12 (0.6%) |
| $800 to $1,499 | 483 (21.0%) | 587 (27.8%) |
| $800 to $1,499 | 277 (12.0%) | 604 (28.6%) |
| Total | 2,300 (100.0%) | 2,109 (100.0%) |
Health & Disability in Pascagoula
Health Insurance Coverage by Age in Pascagoula
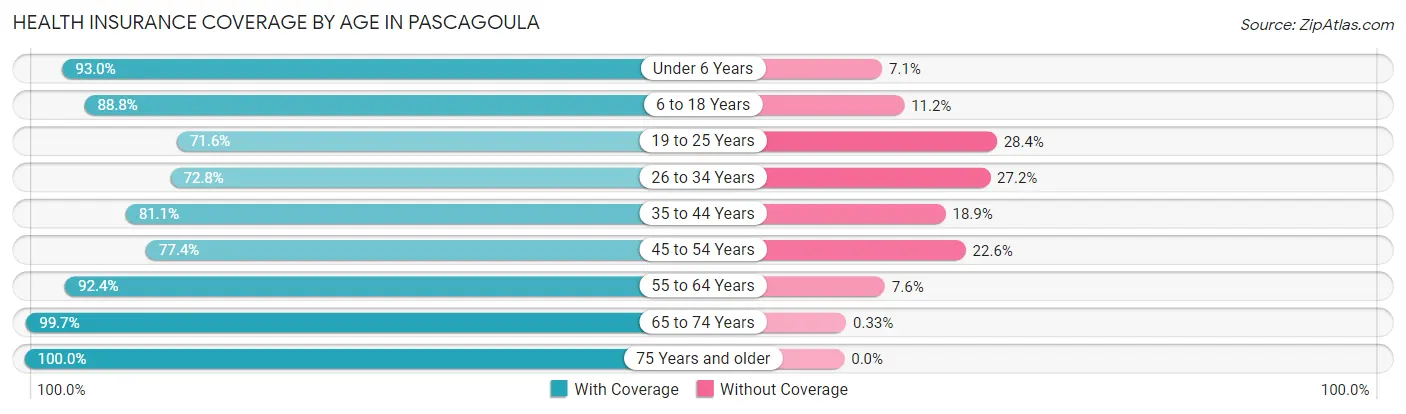
| Age Bracket | With Coverage | Without Coverage |
| Under 6 Years | 2,266 (92.9%) | 172 (7.0%) |
| 6 to 18 Years | 3,276 (88.8%) | 412 (11.2%) |
| 19 to 25 Years | 1,549 (71.6%) | 615 (28.4%) |
| 26 to 34 Years | 1,799 (72.8%) | 672 (27.2%) |
| 35 to 44 Years | 2,127 (81.1%) | 495 (18.9%) |
| 45 to 54 Years | 1,614 (77.4%) | 472 (22.6%) |
| 55 to 64 Years | 2,283 (92.4%) | 187 (7.6%) |
| 65 to 74 Years | 2,093 (99.7%) | 7 (0.3%) |
| 75 Years and older | 1,129 (100.0%) | 0 (0.0%) |
| Total | 18,136 (85.7%) | 3,032 (14.3%) |
Health Insurance Coverage by Citizenship Status in Pascagoula
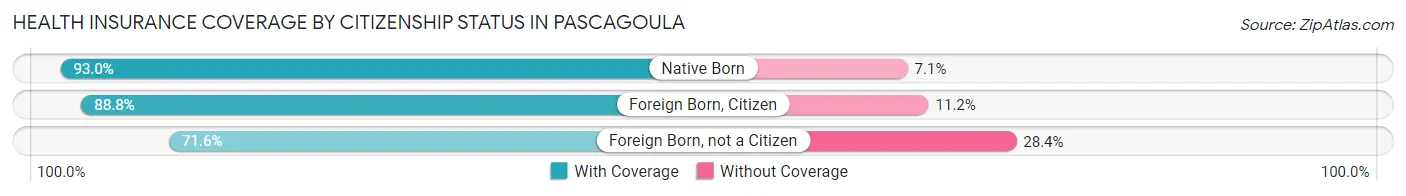
| Citizenship Status | With Coverage | Without Coverage |
| Native Born | 2,266 (92.9%) | 172 (7.0%) |
| Foreign Born, Citizen | 3,276 (88.8%) | 412 (11.2%) |
| Foreign Born, not a Citizen | 1,549 (71.6%) | 615 (28.4%) |
Health Insurance Coverage by Household Income in Pascagoula
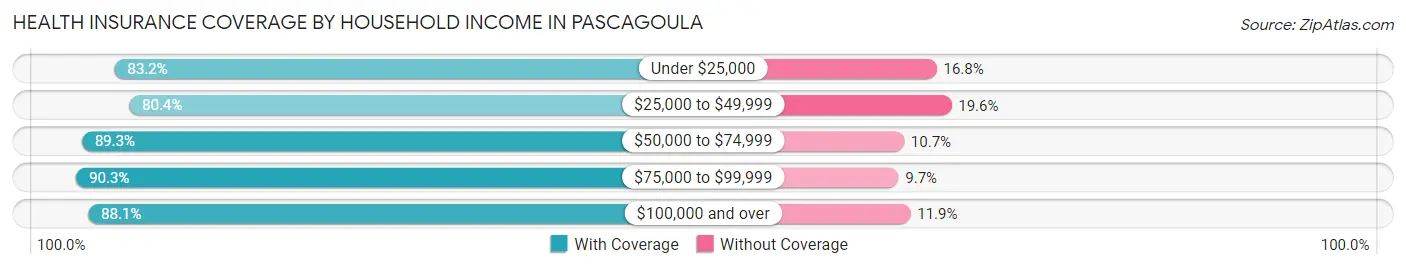
| Household Income | With Coverage | Without Coverage |
| Under $25,000 | 4,603 (83.2%) | 931 (16.8%) |
| $25,000 to $49,999 | 3,514 (80.4%) | 855 (19.6%) |
| $50,000 to $74,999 | 2,696 (89.3%) | 323 (10.7%) |
| $75,000 to $99,999 | 3,020 (90.3%) | 323 (9.7%) |
| $100,000 and over | 4,295 (88.1%) | 580 (11.9%) |
Public vs Private Health Insurance Coverage by Age in Pascagoula
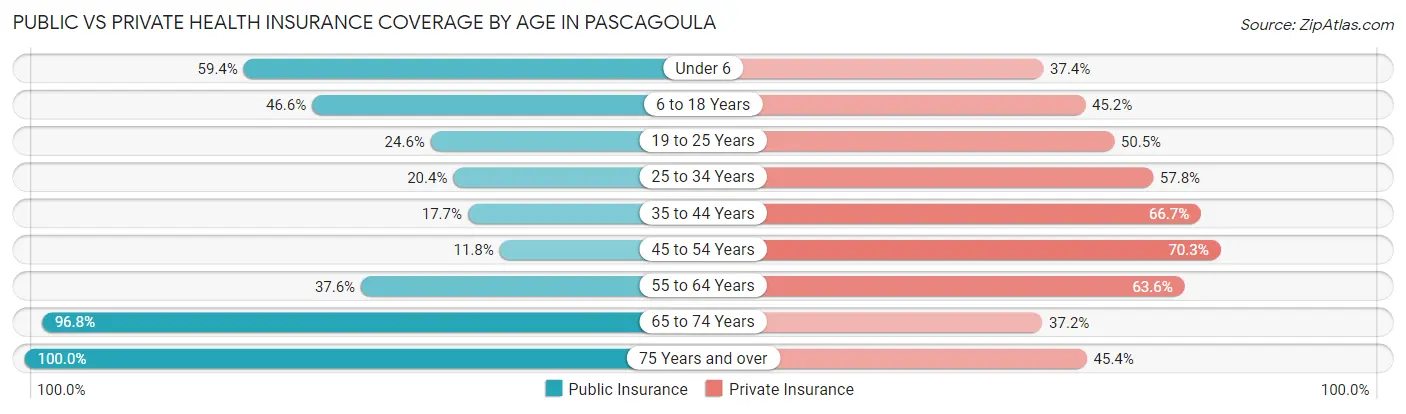
| Age Bracket | Public Insurance | Private Insurance |
| Under 6 | 1,447 (59.4%) | 911 (37.4%) |
| 6 to 18 Years | 1,720 (46.6%) | 1,665 (45.2%) |
| 19 to 25 Years | 533 (24.6%) | 1,093 (50.5%) |
| 25 to 34 Years | 505 (20.4%) | 1,427 (57.8%) |
| 35 to 44 Years | 465 (17.7%) | 1,748 (66.7%) |
| 45 to 54 Years | 247 (11.8%) | 1,466 (70.3%) |
| 55 to 64 Years | 928 (37.6%) | 1,571 (63.6%) |
| 65 to 74 Years | 2,033 (96.8%) | 781 (37.2%) |
| 75 Years and over | 1,129 (100.0%) | 513 (45.4%) |
| Total | 9,007 (42.5%) | 11,175 (52.8%) |
Disability Status by Sex by Age in Pascagoula
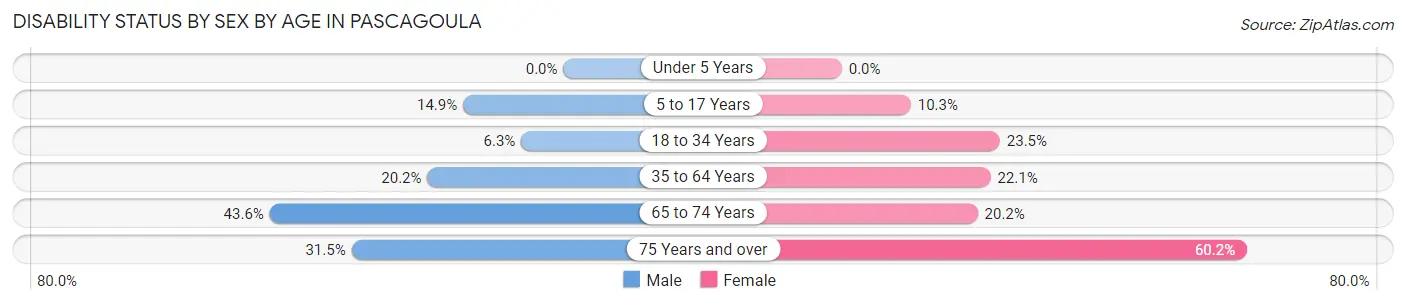
| Age Bracket | Male | Female |
| Under 5 Years | 0 (0.0%) | 0 (0.0%) |
| 5 to 17 Years | 281 (14.9%) | 168 (10.2%) |
| 18 to 34 Years | 142 (6.3%) | 667 (23.5%) |
| 35 to 64 Years | 672 (20.2%) | 850 (22.1%) |
| 65 to 74 Years | 464 (43.6%) | 209 (20.2%) |
| 75 Years and over | 157 (31.5%) | 379 (60.2%) |
Disability Class by Sex by Age in Pascagoula
Disability Class: Hearing Difficulty
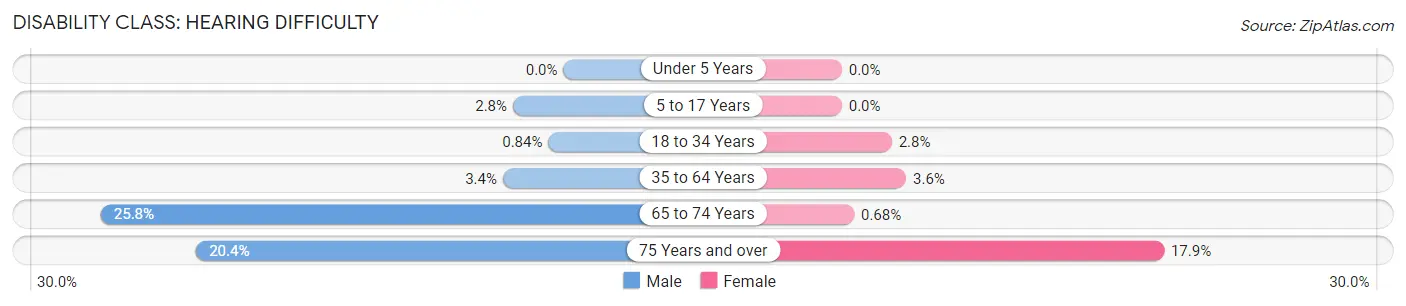
| Age Bracket | Male | Female |
| Under 5 Years | 0 (0.0%) | 0 (0.0%) |
| 5 to 17 Years | 53 (2.8%) | 0 (0.0%) |
| 18 to 34 Years | 19 (0.8%) | 79 (2.8%) |
| 35 to 64 Years | 112 (3.4%) | 138 (3.6%) |
| 65 to 74 Years | 274 (25.8%) | 7 (0.7%) |
| 75 Years and over | 102 (20.4%) | 113 (17.9%) |
Disability Class: Vision Difficulty
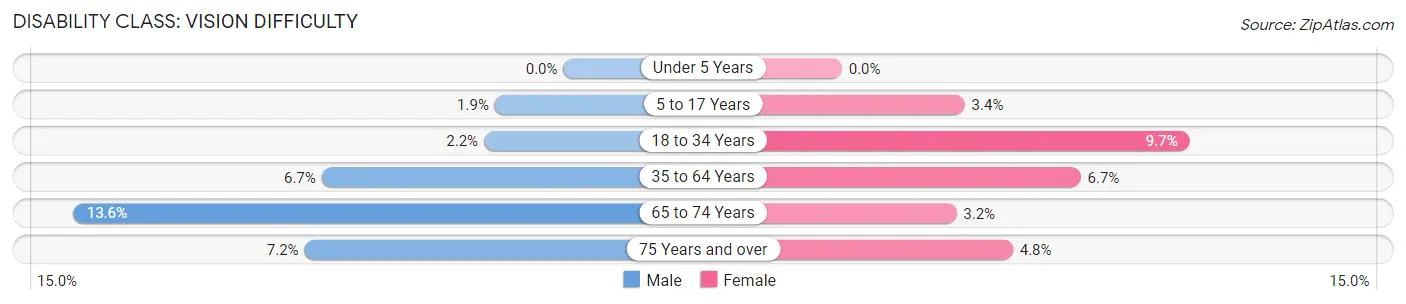
| Age Bracket | Male | Female |
| Under 5 Years | 0 (0.0%) | 0 (0.0%) |
| 5 to 17 Years | 36 (1.9%) | 56 (3.4%) |
| 18 to 34 Years | 50 (2.2%) | 275 (9.7%) |
| 35 to 64 Years | 224 (6.7%) | 256 (6.7%) |
| 65 to 74 Years | 145 (13.6%) | 33 (3.2%) |
| 75 Years and over | 36 (7.2%) | 30 (4.8%) |
Disability Class: Cognitive Difficulty
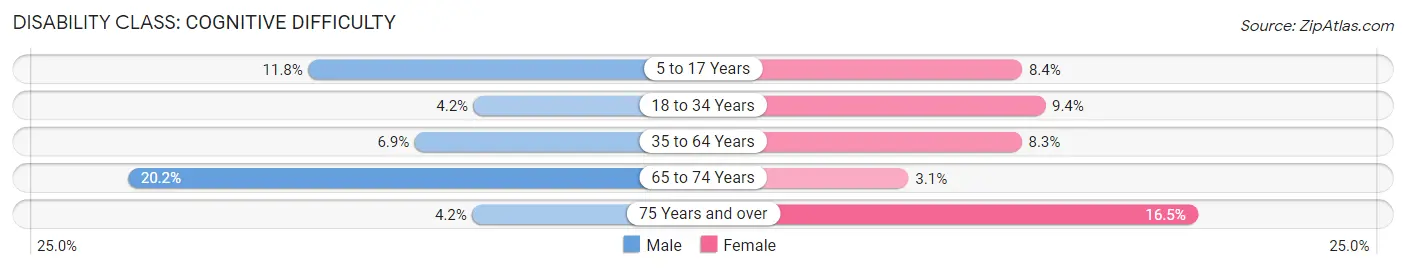
| Age Bracket | Male | Female |
| 5 to 17 Years | 223 (11.8%) | 137 (8.4%) |
| 18 to 34 Years | 94 (4.2%) | 268 (9.4%) |
| 35 to 64 Years | 229 (6.9%) | 321 (8.3%) |
| 65 to 74 Years | 215 (20.2%) | 32 (3.1%) |
| 75 Years and over | 21 (4.2%) | 104 (16.5%) |
Disability Class: Ambulatory Difficulty
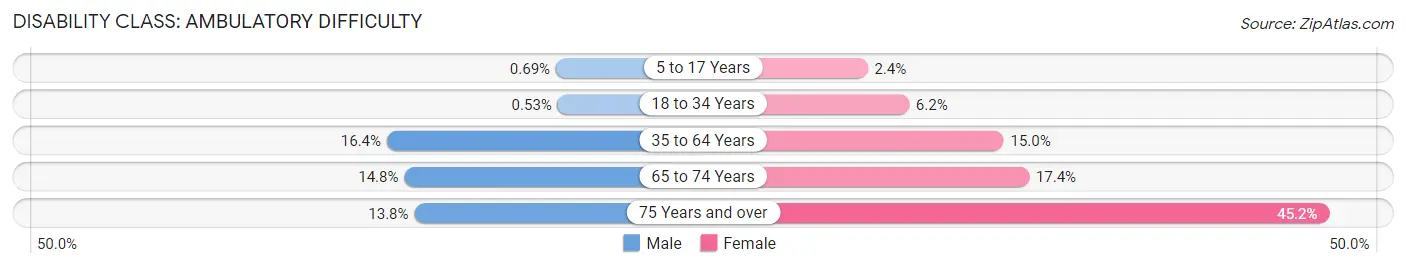
| Age Bracket | Male | Female |
| 5 to 17 Years | 13 (0.7%) | 39 (2.4%) |
| 18 to 34 Years | 12 (0.5%) | 177 (6.2%) |
| 35 to 64 Years | 545 (16.4%) | 578 (15.0%) |
| 65 to 74 Years | 157 (14.8%) | 180 (17.4%) |
| 75 Years and over | 69 (13.8%) | 285 (45.2%) |
Disability Class: Self-Care Difficulty
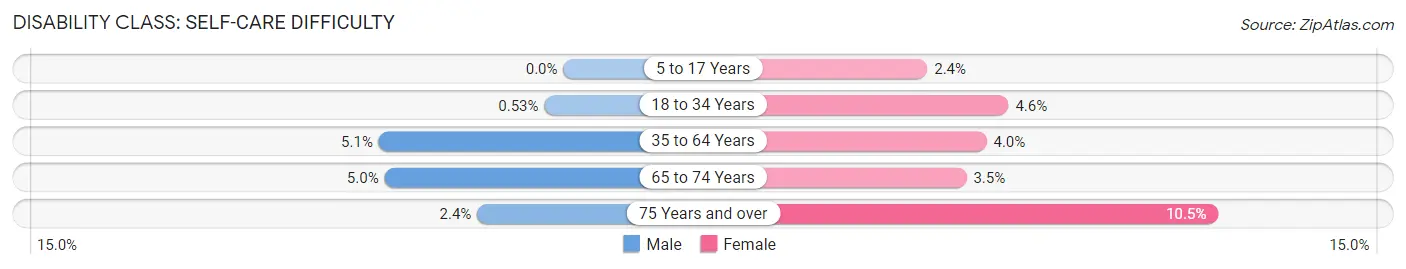
| Age Bracket | Male | Female |
| 5 to 17 Years | 0 (0.0%) | 39 (2.4%) |
| 18 to 34 Years | 12 (0.5%) | 132 (4.6%) |
| 35 to 64 Years | 171 (5.1%) | 155 (4.0%) |
| 65 to 74 Years | 53 (5.0%) | 36 (3.5%) |
| 75 Years and over | 12 (2.4%) | 66 (10.5%) |
Technology Access in Pascagoula
Computing Device Access in Pascagoula
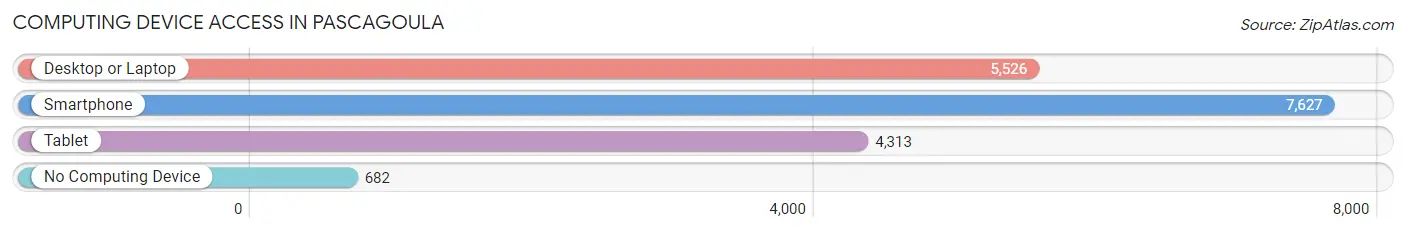
| Device Type | # Households | % Households |
| Desktop or Laptop | 5,526 | 64.3% |
| Smartphone | 7,627 | 88.7% |
| Tablet | 4,313 | 50.2% |
| No Computing Device | 682 | 7.9% |
| Total | 8,595 | 100.0% |
Internet Access in Pascagoula
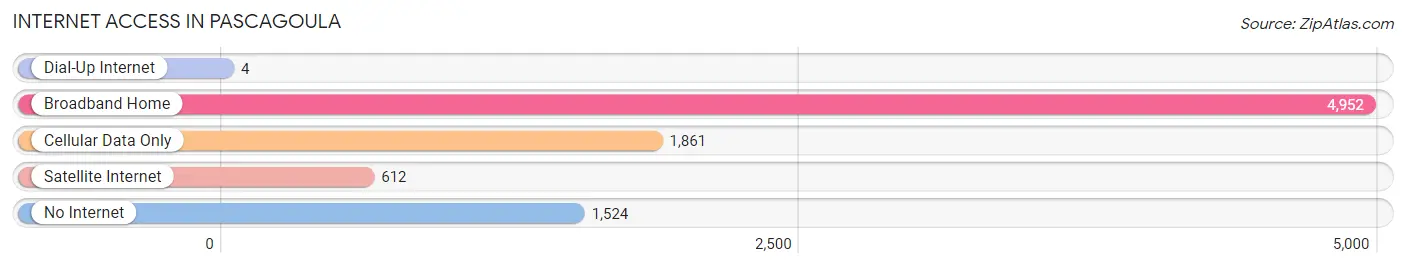
| Internet Type | # Households | % Households |
| Dial-Up Internet | 4 | 0.1% |
| Broadband Home | 4,952 | 57.6% |
| Cellular Data Only | 1,861 | 21.6% |
| Satellite Internet | 612 | 7.1% |
| No Internet | 1,524 | 17.7% |
| Total | 8,595 | 100.0% |
Pascagoula Summary
Pascagoula is a city located in Jackson County, Mississippi, United States. It is the county seat of Jackson County and the largest city in the state of Mississippi. The population of Pascagoula was estimated to be 22,392 in 2019.
History
The area that is now Pascagoula was originally inhabited by the Choctaw Indians. The first European settlers arrived in the area in the late 1700s. The city was founded in 1854 and was named after the Pascagoula River, which was named by the French explorer Pierre Le Moyne d'Iberville. The city was incorporated in 1857 and was the first city in Jackson County.
During the Civil War, Pascagoula was a major port for the Confederate Navy. After the war, the city experienced a period of growth and development. In the late 1800s, the city was home to several large lumber mills and shipyards.
In the early 1900s, Pascagoula was a major port for the shipping of lumber and other goods. The city was also home to several large shipbuilding companies. During World War II, the city was home to several military bases and was a major shipbuilding center.
Geography
Pascagoula is located in Jackson County, Mississippi, on the Gulf of Mexico. The city is situated on the Pascagoula River, which is the largest river in the state. The city is located approximately 50 miles east of Mobile, Alabama, and approximately 90 miles west of New Orleans, Louisiana.
The city has a total area of 24.3 square miles, of which 22.7 square miles is land and 1.6 square miles is water. The city is located at an elevation of 10 feet above sea level.
Economy
The economy of Pascagoula is largely based on the shipping and shipbuilding industries. The city is home to several large shipbuilding companies, including Ingalls Shipbuilding, which is the largest private employer in the city. The city is also home to several large oil refineries and chemical plants.
The city is also home to several large retail stores, including Walmart, Target, and Lowe's. The city is also home to several restaurants, bars, and other entertainment venues.
Demographics
As of the 2019 census, the population of Pascagoula was estimated to be 22,392. The racial makeup of the city was 68.2% White, 28.2% African American, 0.7% Native American, 0.7% Asian, 0.2% Pacific Islander, 0.7% from other races, and 1.9% from two or more races. Hispanic or Latino of any race were 2.3% of the population.
The median household income in Pascagoula was $41,945 in 2019. The per capita income in the city was $21,945. The poverty rate in the city was 19.2%.
Conclusion
Pascagoula is a city located in Jackson County, Mississippi, United States. It is the county seat of Jackson County and the largest city in the state of Mississippi. The city was founded in 1854 and was named after the Pascagoula River. The economy of Pascagoula is largely based on the shipping and shipbuilding industries. As of the 2019 census, the population of Pascagoula was estimated to be 22,392. The median household income in Pascagoula was $41,945 in 2019.
Common Questions
What is Per Capita Income in Pascagoula?
Per Capita income in Pascagoula is $24,827.
What is the Median Family Income in Pascagoula?
Median Family Income in Pascagoula is $56,858.
What is the Median Household income in Pascagoula?
Median Household Income in Pascagoula is $41,679.
What is Income or Wage Gap in Pascagoula?
Income or Wage Gap in Pascagoula is 41.3%.
Women in Pascagoula earn 58.7 cents for every dollar earned by a man.
What is Family Income Deficit in Pascagoula?
Family Income Deficit in Pascagoula is $10,173.
Families that are below poverty line in Pascagoula earn $10,173 less on average than the poverty threshold level.
What is Inequality or Gini Index in Pascagoula?
Inequality or Gini Index in Pascagoula is 0.51.
What is the Total Population of Pascagoula?
Total Population of Pascagoula is 21,904.
What is the Total Male Population of Pascagoula?
Total Male Population of Pascagoula is 10,571.
What is the Total Female Population of Pascagoula?
Total Female Population of Pascagoula is 11,333.
What is the Ratio of Males per 100 Females in Pascagoula?
There are 93.28 Males per 100 Females in Pascagoula.
What is the Ratio of Females per 100 Males in Pascagoula?
There are 107.21 Females per 100 Males in Pascagoula.
What is the Median Population Age in Pascagoula?
Median Population Age in Pascagoula is 34.8 Years.
What is the Average Family Size in Pascagoula
Average Family Size in Pascagoula is 3.4 People.
What is the Average Household Size in Pascagoula
Average Household Size in Pascagoula is 2.5 People.
How Large is the Labor Force in Pascagoula?
There are 9,207 People in the Labor Forcein in Pascagoula.
What is the Percentage of People in the Labor Force in Pascagoula?
54.6% of People are in the Labor Force in Pascagoula.
What is the Unemployment Rate in Pascagoula?
Unemployment Rate in Pascagoula is 12.0%.