Columbus, IN Map & Demographics
Columbus Map
Columbus Overview
$40,925
PER CAPITA INCOME
$91,399
AVG FAMILY INCOME
$75,114
AVG HOUSEHOLD INCOME
40.0%
WAGE / INCOME GAP [ % ]
60.0¢/ $1
WAGE / INCOME GAP [ $ ]
$11,217
FAMILY INCOME DEFICIT
0.44
INEQUALITY / GINI INDEX
50,896
TOTAL POPULATION
25,872
MALE POPULATION
25,024
FEMALE POPULATION
103.39
MALES / 100 FEMALES
96.72
FEMALES / 100 MALES
35.8
MEDIAN AGE
3.0
AVG FAMILY SIZE
2.4
AVG HOUSEHOLD SIZE
26,616
LABOR FORCE [ PEOPLE ]
65.9%
PERCENT IN LABOR FORCE
4.0%
UNEMPLOYMENT RATE
Columbus Area Codes
Income in Columbus
Income Overview in Columbus
Per Capita Income in Columbus is $40,925, while median incomes of families and households are $91,399 and $75,114 respectively.
| Characteristic | Number | Measure |
| Per Capita Income | 50,896 | $40,925 |
| Median Family Income | 12,776 | $91,399 |
| Mean Family Income | 12,776 | $117,109 |
| Median Household Income | 21,194 | $75,114 |
| Mean Household Income | 21,194 | $96,490 |
| Income Deficit | 12,776 | $11,217 |
| Wage / Income Gap (%) | 50,896 | 40.03% |
| Wage / Income Gap ($) | 50,896 | 59.97¢ per $1 |
| Gini / Inequality Index | 50,896 | 0.44 |
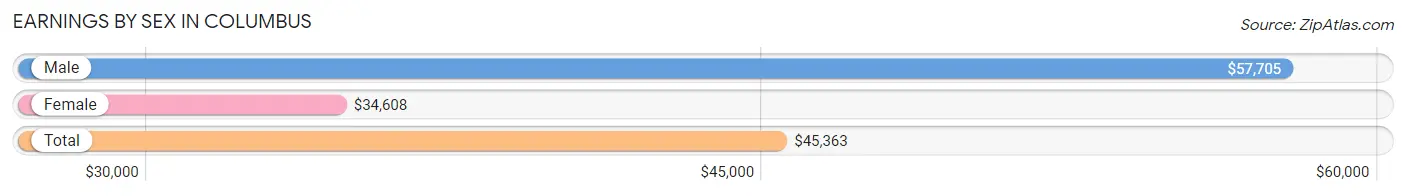
Earnings by Sex in Columbus
Average Earnings in Columbus are $45,363, $57,705 for men and $34,608 for women, a difference of 40.0%.
| Sex | Number | Average Earnings |
| Male | 15,912 (56.1%) | $57,705 |
| Female | 12,471 (43.9%) | $34,608 |
| Total | 28,383 (100.0%) | $45,363 |
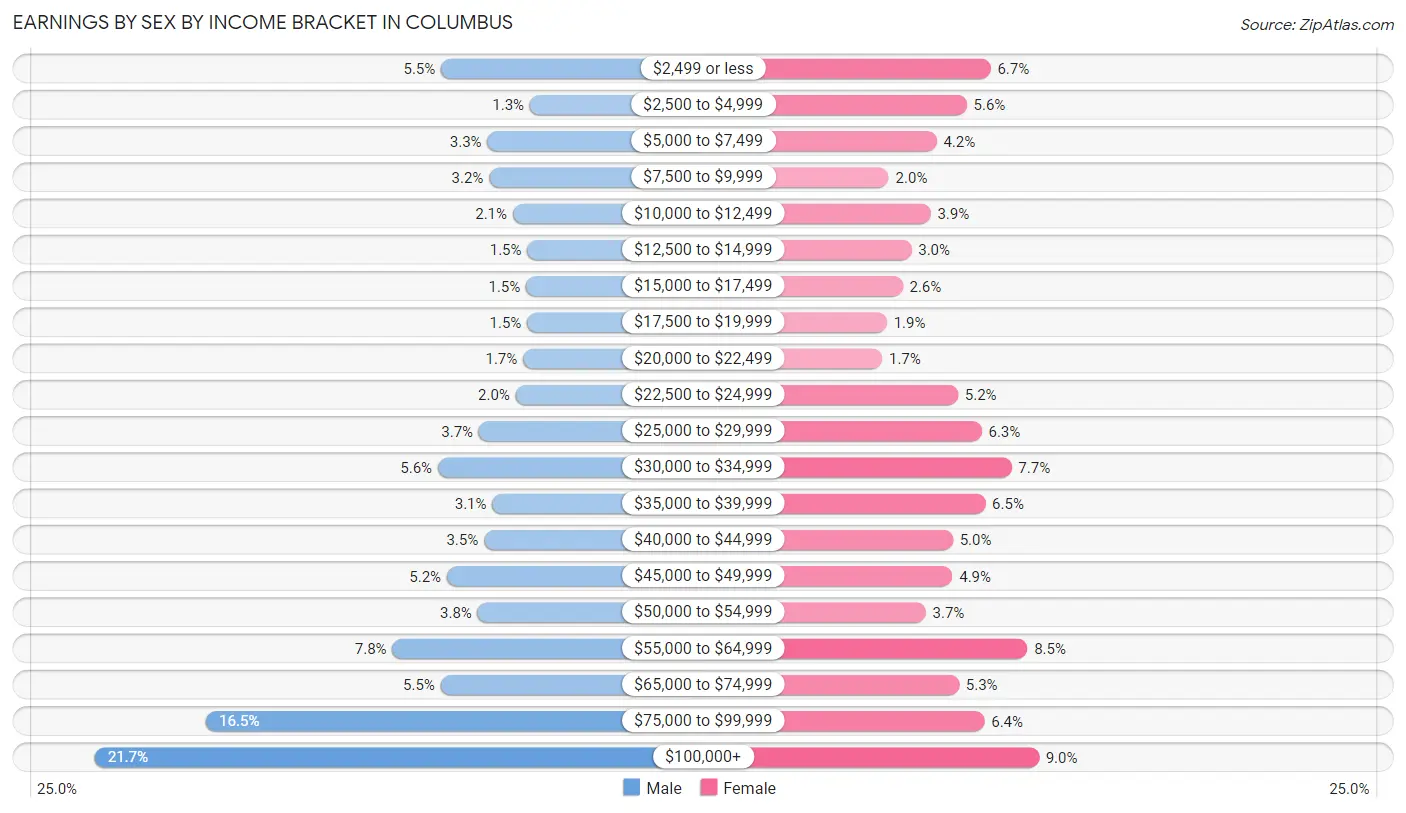
Earnings by Sex by Income Bracket in Columbus
The most common earnings brackets in Columbus are $100,000+ for men (3,455 | 21.7%) and $100,000+ for women (1,121 | 9.0%).
| Income | Male | Female |
| $2,499 or less | 873 (5.5%) | 839 (6.7%) |
| $2,500 to $4,999 | 211 (1.3%) | 700 (5.6%) |
| $5,000 to $7,499 | 529 (3.3%) | 524 (4.2%) |
| $7,500 to $9,999 | 516 (3.2%) | 245 (2.0%) |
| $10,000 to $12,499 | 339 (2.1%) | 489 (3.9%) |
| $12,500 to $14,999 | 231 (1.5%) | 377 (3.0%) |
| $15,000 to $17,499 | 241 (1.5%) | 325 (2.6%) |
| $17,500 to $19,999 | 233 (1.5%) | 233 (1.9%) |
| $20,000 to $22,499 | 263 (1.7%) | 206 (1.7%) |
| $22,500 to $24,999 | 318 (2.0%) | 648 (5.2%) |
| $25,000 to $29,999 | 592 (3.7%) | 787 (6.3%) |
| $30,000 to $34,999 | 898 (5.6%) | 962 (7.7%) |
| $35,000 to $39,999 | 492 (3.1%) | 808 (6.5%) |
| $40,000 to $44,999 | 553 (3.5%) | 619 (5.0%) |
| $45,000 to $49,999 | 830 (5.2%) | 616 (4.9%) |
| $50,000 to $54,999 | 601 (3.8%) | 460 (3.7%) |
| $55,000 to $64,999 | 1,236 (7.8%) | 1,054 (8.5%) |
| $65,000 to $74,999 | 876 (5.5%) | 655 (5.2%) |
| $75,000 to $99,999 | 2,625 (16.5%) | 803 (6.4%) |
| $100,000+ | 3,455 (21.7%) | 1,121 (9.0%) |
| Total | 15,912 (100.0%) | 12,471 (100.0%) |
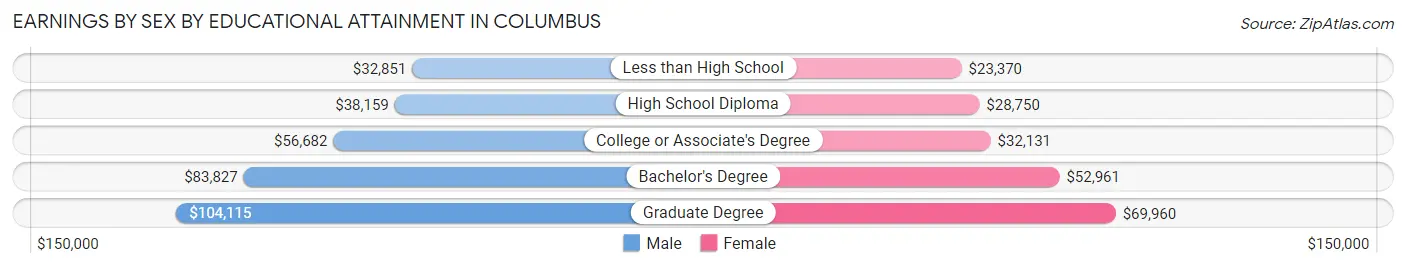
Earnings by Sex by Educational Attainment in Columbus
Average earnings in Columbus are $64,231 for men and $38,446 for women, a difference of 40.1%. Men with an educational attainment of graduate degree enjoy the highest average annual earnings of $104,115, while those with less than high school education earn the least with $32,851. Women with an educational attainment of graduate degree earn the most with the average annual earnings of $69,960, while those with less than high school education have the smallest earnings of $23,370.
| Educational Attainment | Male Income | Female Income |
| Less than High School | $32,851 | $23,370 |
| High School Diploma | $38,159 | $28,750 |
| College or Associate's Degree | $56,682 | $32,131 |
| Bachelor's Degree | $83,827 | $52,961 |
| Graduate Degree | $104,115 | $69,960 |
| Total | $64,231 | $38,446 |
Family Income in Columbus
Family Income Brackets in Columbus
According to the Columbus family income data, there are 2,606 families falling into the $100,000 to $149,999 income range, which is the most common income bracket and makes up 20.4% of all families. Conversely, the $10,000 to $14,999 income bracket is the least frequent group with only 166 families (1.3%) belonging to this category.
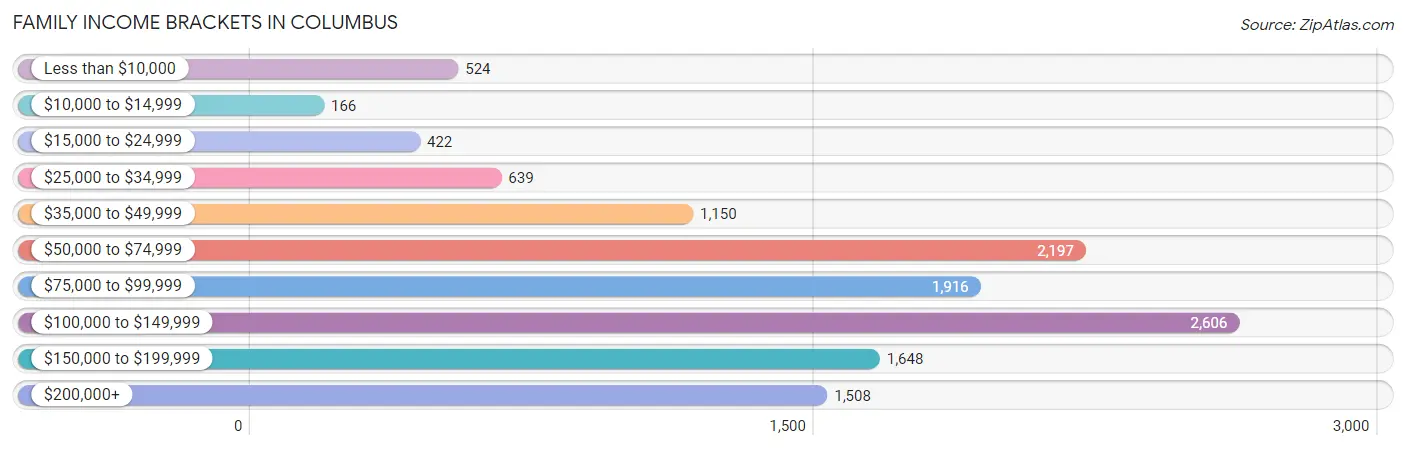
| Income Bracket | # Families | % Families |
| Less than $10,000 | 524 | 4.1% |
| $10,000 to $14,999 | 166 | 1.3% |
| $15,000 to $24,999 | 422 | 3.3% |
| $25,000 to $34,999 | 639 | 5.0% |
| $35,000 to $49,999 | 1,150 | 9.0% |
| $50,000 to $74,999 | 2,197 | 17.2% |
| $75,000 to $99,999 | 1,916 | 15.0% |
| $100,000 to $149,999 | 2,606 | 20.4% |
| $150,000 to $199,999 | 1,648 | 12.9% |
| $200,000+ | 1,508 | 11.8% |
Family Income by Famaliy Size in Columbus
4-person families (2,553 | 20.0%) account for the highest median family income in Columbus with $121,779 per family, while 2-person families (6,061 | 47.4%) have the highest median income of $42,322 per family member.
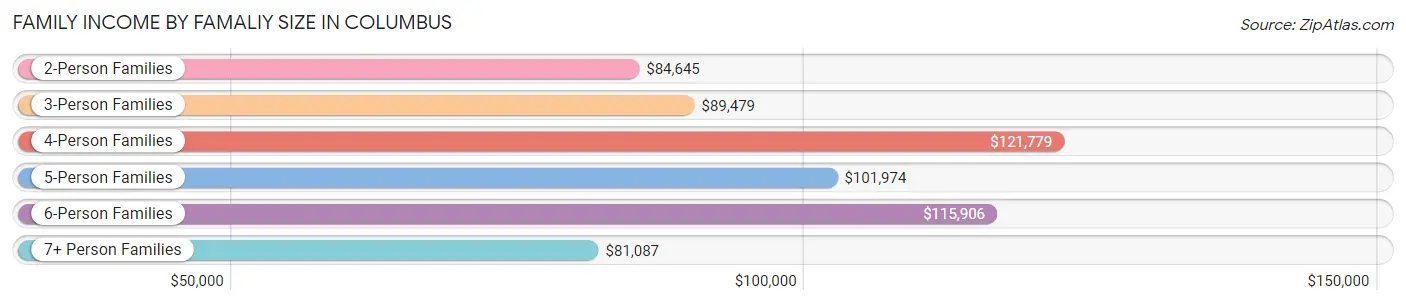
| Income Bracket | # Families | Median Income |
| 2-Person Families | 6,061 (47.4%) | $84,645 |
| 3-Person Families | 3,085 (24.1%) | $89,479 |
| 4-Person Families | 2,553 (20.0%) | $121,779 |
| 5-Person Families | 682 (5.3%) | $101,974 |
| 6-Person Families | 177 (1.4%) | $115,906 |
| 7+ Person Families | 218 (1.7%) | $81,087 |
| Total | 12,776 (100.0%) | $91,399 |
Family Income by Number of Earners in Columbus
The median family income in Columbus is $91,399, with families comprising 3+ earners (1,164) having the highest median family income of $146,818, while families with no earners (1,581) have the lowest median family income of $48,323, accounting for 9.1% and 12.4% of families, respectively.
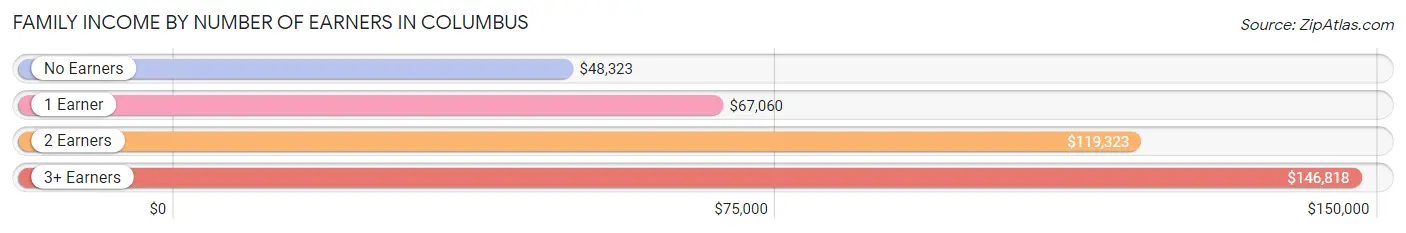
| Number of Earners | # Families | Median Income |
| No Earners | 1,581 (12.4%) | $48,323 |
| 1 Earner | 4,274 (33.5%) | $67,060 |
| 2 Earners | 5,757 (45.1%) | $119,323 |
| 3+ Earners | 1,164 (9.1%) | $146,818 |
| Total | 12,776 (100.0%) | $91,399 |
Household Income in Columbus
Household Income Brackets in Columbus
With 3,751 households falling in the category, the $100,000 to $149,999 income range is the most frequent in Columbus, accounting for 17.7% of all households. In contrast, only 551 households (2.6%) fall into the $10,000 to $14,999 income bracket, making it the least populous group.
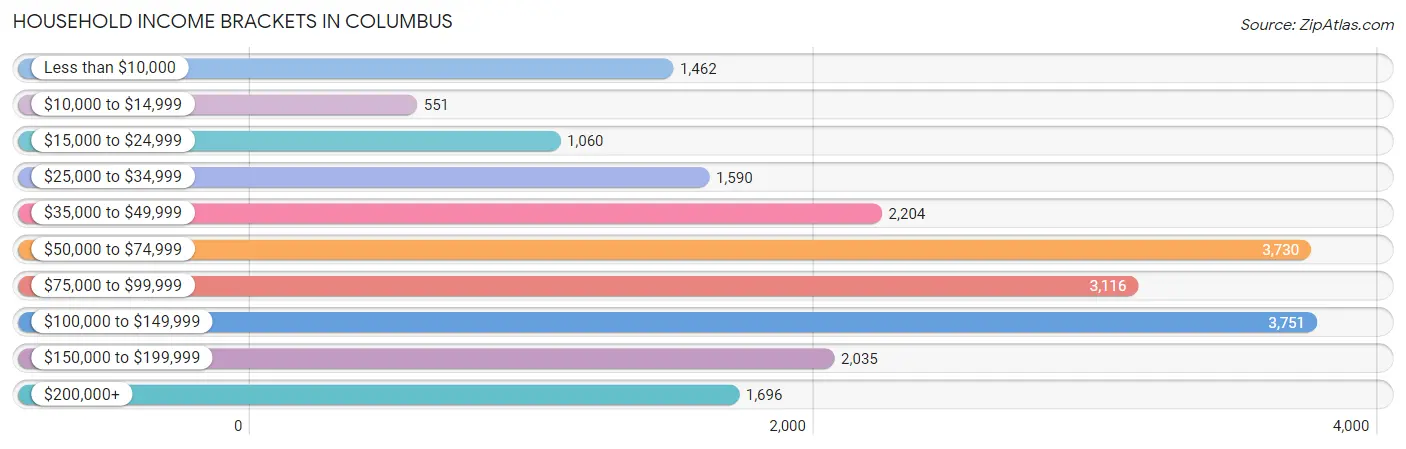
| Income Bracket | # Households | % Households |
| Less than $10,000 | 1,462 | 6.9% |
| $10,000 to $14,999 | 551 | 2.6% |
| $15,000 to $24,999 | 1,060 | 5.0% |
| $25,000 to $34,999 | 1,590 | 7.5% |
| $35,000 to $49,999 | 2,204 | 10.4% |
| $50,000 to $74,999 | 3,730 | 17.6% |
| $75,000 to $99,999 | 3,116 | 14.7% |
| $100,000 to $149,999 | 3,751 | 17.7% |
| $150,000 to $199,999 | 2,035 | 9.6% |
| $200,000+ | 1,696 | 8.0% |
Household Income by Householder Age in Columbus
The median household income in Columbus is $75,114, with the highest median household income of $97,283 found in the 45 to 64 years age bracket for the primary householder. A total of 6,804 households (32.1%) fall into this category. Meanwhile, the 15 to 24 years age bracket for the primary householder has the lowest median household income of $46,576, with 1,416 households (6.7%) in this group.
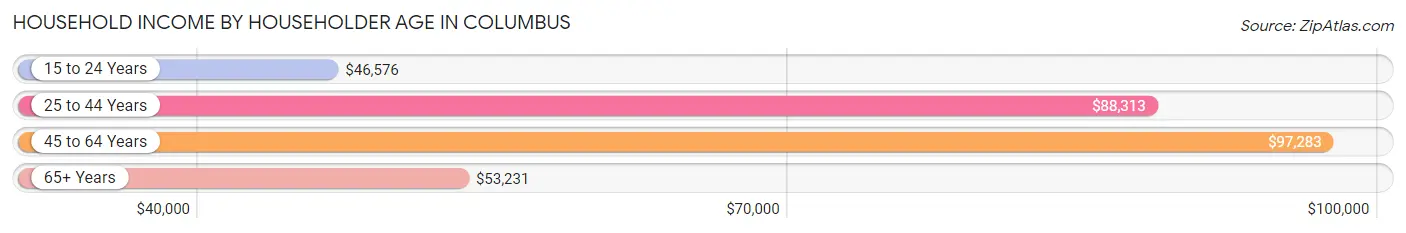
| Income Bracket | # Households | Median Income |
| 15 to 24 Years | 1,416 (6.7%) | $46,576 |
| 25 to 44 Years | 7,752 (36.6%) | $88,313 |
| 45 to 64 Years | 6,804 (32.1%) | $97,283 |
| 65+ Years | 5,222 (24.6%) | $53,231 |
| Total | 21,194 (100.0%) | $75,114 |
Poverty in Columbus
Income Below Poverty by Sex and Age in Columbus
With 11.1% poverty level for males and 12.9% for females among the residents of Columbus, 16 and 17 year old males and 15 year old females are the most vulnerable to poverty, with 159 males (22.3%) and 71 females (44.4%) in their respective age groups living below the poverty level.
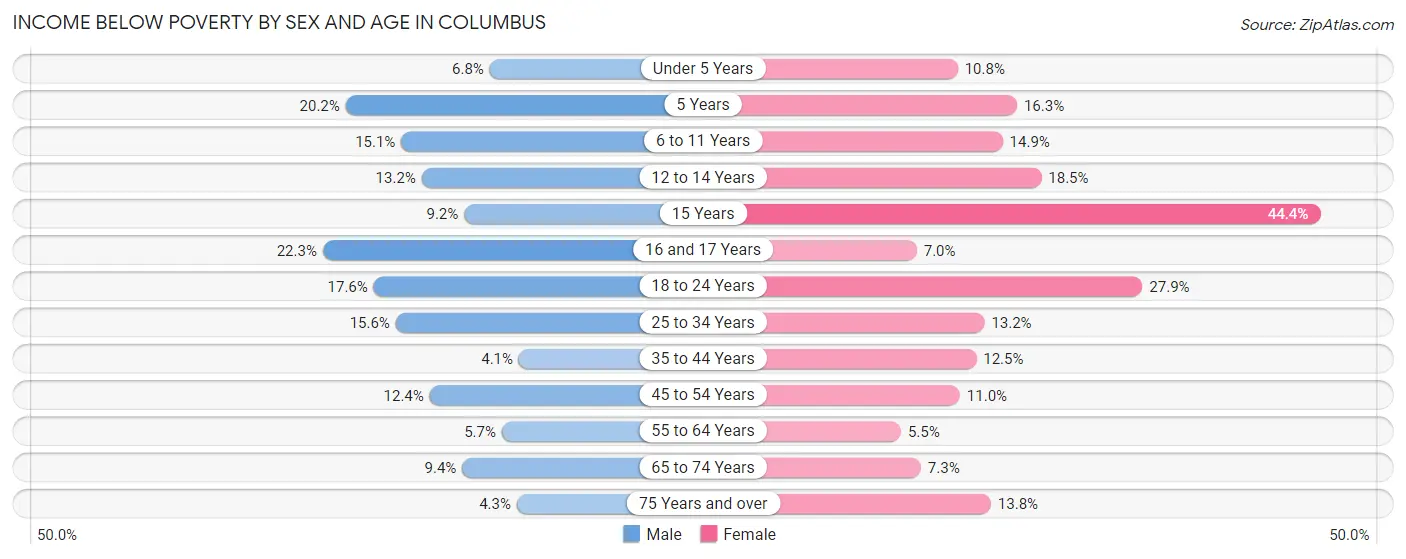
| Age Bracket | Male | Female |
| Under 5 Years | 133 (6.8%) | 186 (10.8%) |
| 5 Years | 59 (20.2%) | 40 (16.3%) |
| 6 to 11 Years | 300 (15.0%) | 324 (14.9%) |
| 12 to 14 Years | 114 (13.2%) | 138 (18.5%) |
| 15 Years | 21 (9.2%) | 71 (44.4%) |
| 16 and 17 Years | 159 (22.3%) | 47 (7.0%) |
| 18 to 24 Years | 410 (17.6%) | 575 (27.9%) |
| 25 to 34 Years | 673 (15.6%) | 518 (13.2%) |
| 35 to 44 Years | 133 (4.1%) | 401 (12.5%) |
| 45 to 54 Years | 396 (12.4%) | 276 (11.0%) |
| 55 to 64 Years | 160 (5.7%) | 170 (5.5%) |
| 65 to 74 Years | 211 (9.4%) | 169 (7.3%) |
| 75 Years and over | 52 (4.3%) | 246 (13.8%) |
| Total | 2,821 (11.1%) | 3,161 (12.9%) |
Income Above Poverty by Sex and Age in Columbus
According to the poverty statistics in Columbus, males aged 35 to 44 years and females aged 55 to 64 years are the age groups that are most secure financially, with 95.9% of males and 94.5% of females in these age groups living above the poverty line.
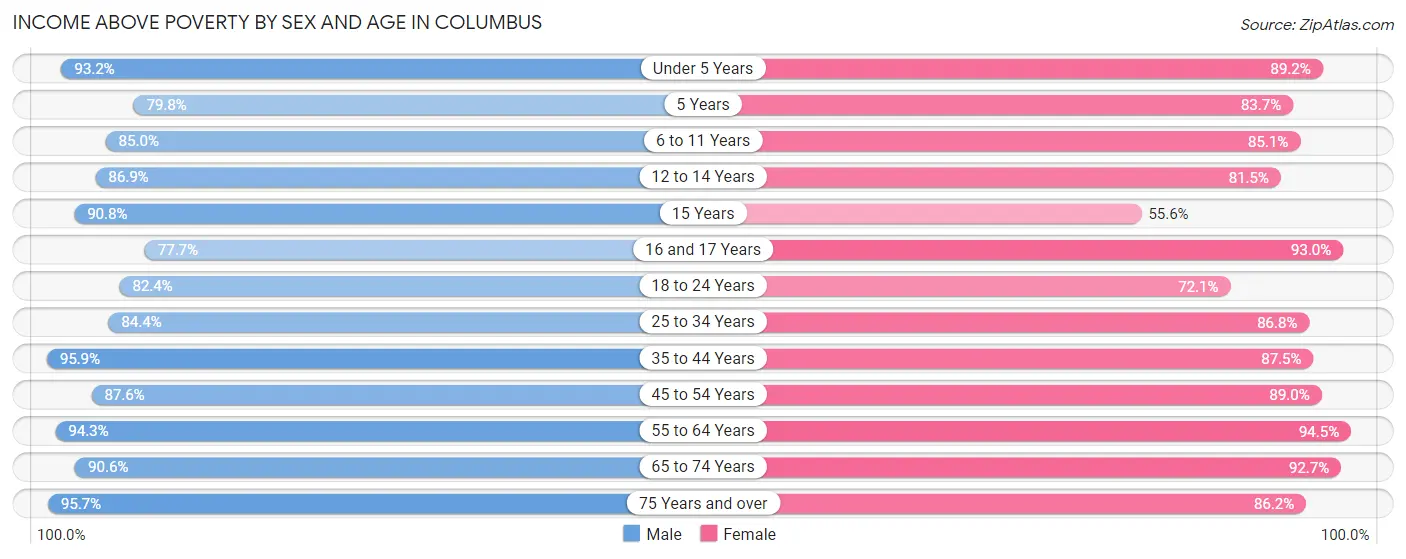
| Age Bracket | Male | Female |
| Under 5 Years | 1,812 (93.2%) | 1,542 (89.2%) |
| 5 Years | 233 (79.8%) | 206 (83.7%) |
| 6 to 11 Years | 1,694 (85.0%) | 1,846 (85.1%) |
| 12 to 14 Years | 753 (86.9%) | 607 (81.5%) |
| 15 Years | 207 (90.8%) | 89 (55.6%) |
| 16 and 17 Years | 553 (77.7%) | 628 (93.0%) |
| 18 to 24 Years | 1,918 (82.4%) | 1,486 (72.1%) |
| 25 to 34 Years | 3,651 (84.4%) | 3,394 (86.8%) |
| 35 to 44 Years | 3,088 (95.9%) | 2,813 (87.5%) |
| 45 to 54 Years | 2,794 (87.6%) | 2,242 (89.0%) |
| 55 to 64 Years | 2,642 (94.3%) | 2,929 (94.5%) |
| 65 to 74 Years | 2,037 (90.6%) | 2,133 (92.7%) |
| 75 Years and over | 1,153 (95.7%) | 1,531 (86.2%) |
| Total | 22,535 (88.9%) | 21,446 (87.2%) |
Income Below Poverty Among Married-Couple Families in Columbus
The poverty statistics for married-couple families in Columbus show that 3.4% or 339 of the total 9,846 families live below the poverty line. Families with 5 or more children have the highest poverty rate of 13.6%, comprising of 14 families. On the other hand, families with 1 or 2 children have the lowest poverty rate of 2.9%, which includes 104 families.
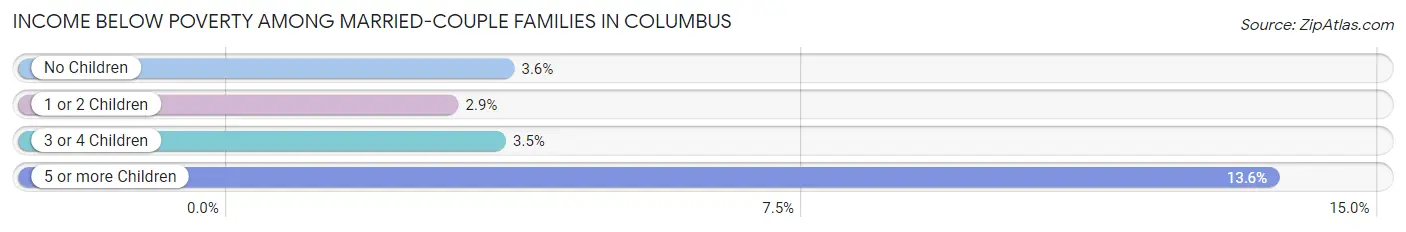
| Children | Above Poverty | Below Poverty |
| No Children | 5,311 (96.4%) | 199 (3.6%) |
| 1 or 2 Children | 3,501 (97.1%) | 104 (2.9%) |
| 3 or 4 Children | 606 (96.5%) | 22 (3.5%) |
| 5 or more Children | 89 (86.4%) | 14 (13.6%) |
| Total | 9,507 (96.6%) | 339 (3.4%) |
Income Below Poverty Among Single-Parent Households in Columbus
According to the poverty data in Columbus, 15.9% or 114 single-father households and 30.0% or 663 single-mother households are living below the poverty line. Among single-father households, those with no children have the highest poverty rate, with 46 households (16.2%) experiencing poverty. Likewise, among single-mother households, those with 3 or 4 children have the highest poverty rate, with 141 households (47.8%) falling below the poverty line.
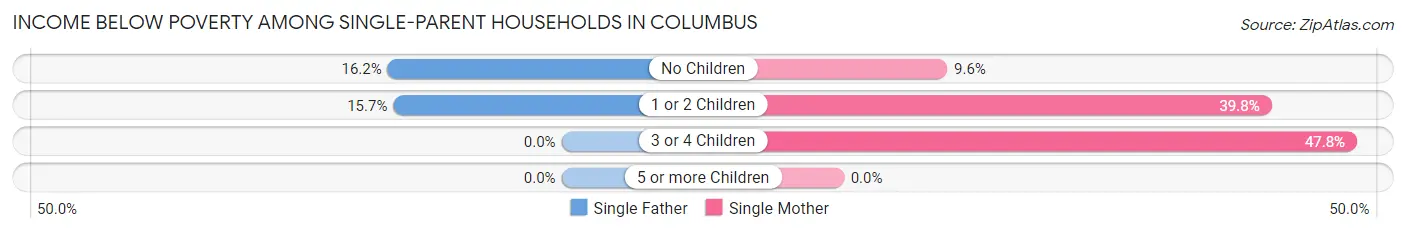
| Children | Single Father | Single Mother |
| No Children | 46 (16.2%) | 73 (9.6%) |
| 1 or 2 Children | 68 (15.7%) | 449 (39.8%) |
| 3 or 4 Children | 0 (0.0%) | 141 (47.8%) |
| 5 or more Children | 0 (0.0%) | 0 (0.0%) |
| Total | 114 (15.9%) | 663 (30.0%) |
Income Below Poverty Among Married-Couple vs Single-Parent Households in Columbus
The poverty data for Columbus shows that 339 of the married-couple family households (3.4%) and 777 of the single-parent households (26.5%) are living below the poverty level. Within the married-couple family households, those with 5 or more children have the highest poverty rate, with 14 households (13.6%) falling below the poverty line. Among the single-parent households, those with 3 or 4 children have the highest poverty rate, with 141 household (47.8%) living below poverty.
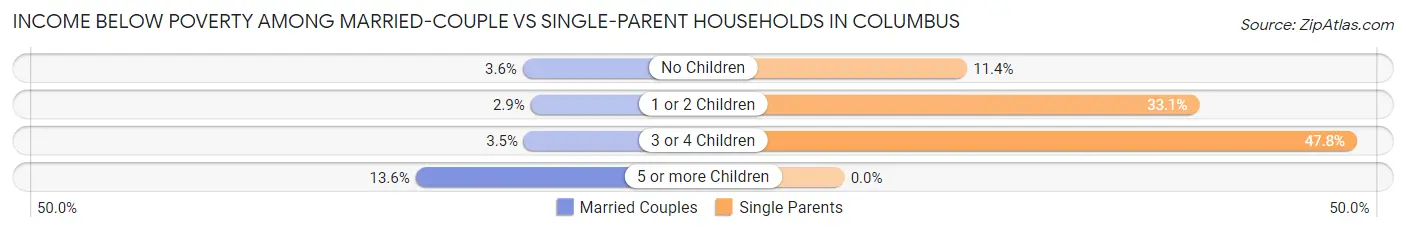
| Children | Married-Couple Families | Single-Parent Households |
| No Children | 199 (3.6%) | 119 (11.4%) |
| 1 or 2 Children | 104 (2.9%) | 517 (33.1%) |
| 3 or 4 Children | 22 (3.5%) | 141 (47.8%) |
| 5 or more Children | 14 (13.6%) | 0 (0.0%) |
| Total | 339 (3.4%) | 777 (26.5%) |
Race in Columbus
The most populous races in Columbus are White / Caucasian (38,713 | 76.1%), Asian (6,450 | 12.7%), and Hispanic or Latino (4,554 | 8.9%).
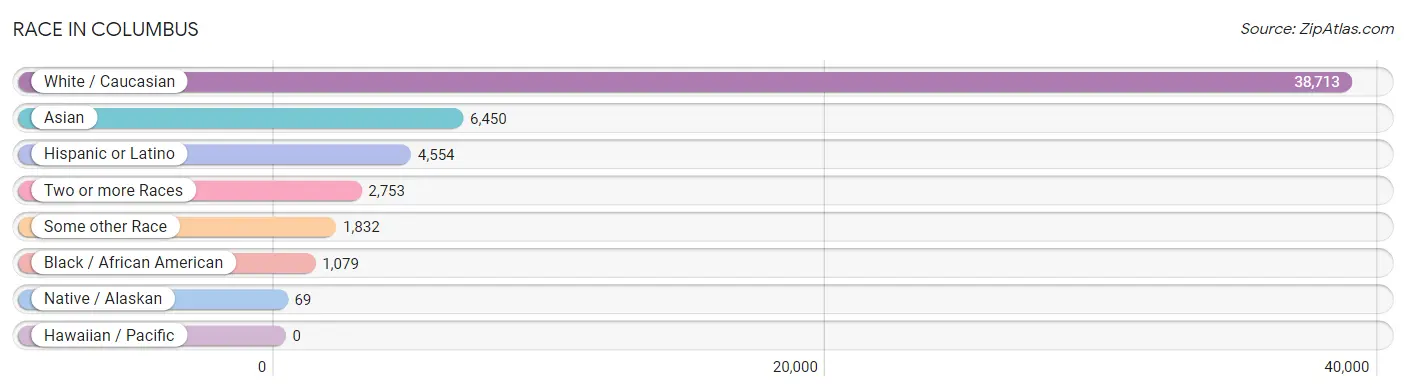
| Race | # Population | % Population |
| Asian | 6,450 | 12.7% |
| Black / African American | 1,079 | 2.1% |
| Hawaiian / Pacific | 0 | 0.0% |
| Hispanic or Latino | 4,554 | 8.9% |
| Native / Alaskan | 69 | 0.1% |
| White / Caucasian | 38,713 | 76.1% |
| Two or more Races | 2,753 | 5.4% |
| Some other Race | 1,832 | 3.6% |
| Total | 50,896 | 100.0% |
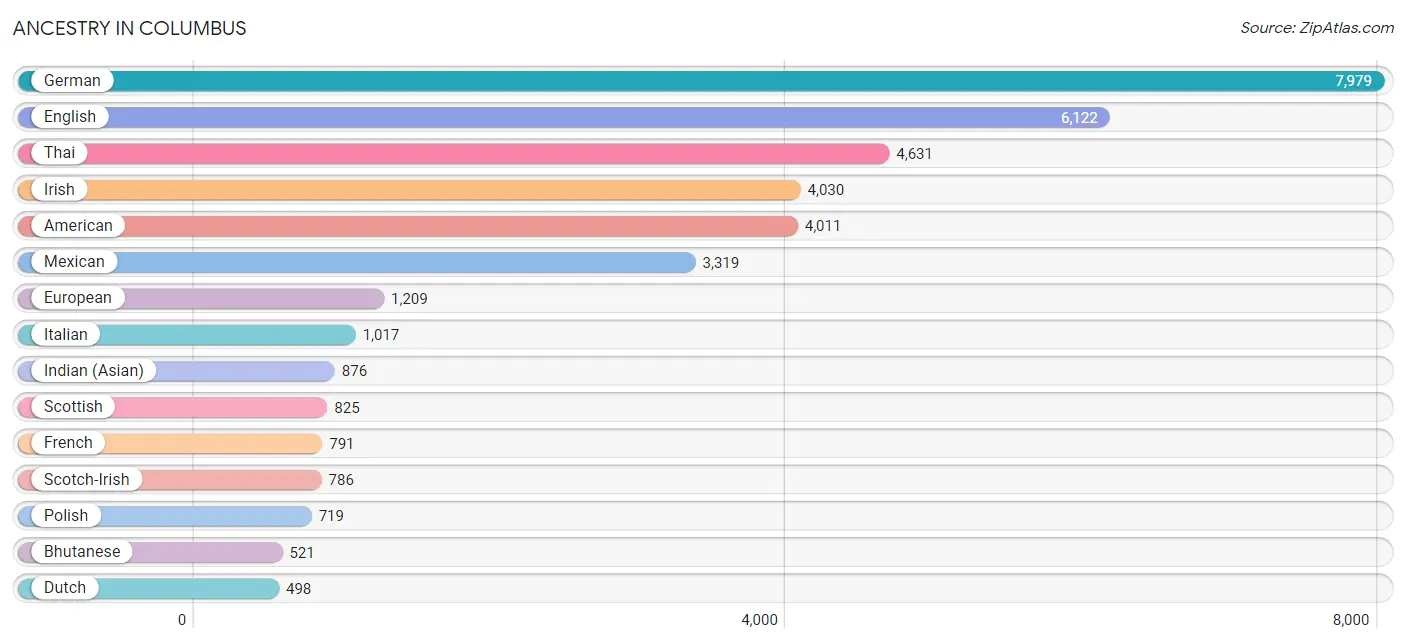
Ancestry in Columbus
The most populous ancestries reported in Columbus are German (7,979 | 15.7%), English (6,122 | 12.0%), Thai (4,631 | 9.1%), Irish (4,030 | 7.9%), and American (4,011 | 7.9%), together accounting for 52.6% of all Columbus residents.
| Ancestry | # Population | % Population |
| African | 33 | 0.1% |
| Alaska Native | 7 | 0.0% |
| American | 4,011 | 7.9% |
| Arab | 181 | 0.4% |
| Argentinean | 19 | 0.0% |
| Austrian | 46 | 0.1% |
| Belgian | 23 | 0.1% |
| Bhutanese | 521 | 1.0% |
| Blackfeet | 1 | 0.0% |
| British | 335 | 0.7% |
| British West Indian | 33 | 0.1% |
| Burmese | 349 | 0.7% |
| Cajun | 71 | 0.1% |
| Canadian | 13 | 0.0% |
| Central American | 238 | 0.5% |
| Cherokee | 97 | 0.2% |
| Costa Rican | 7 | 0.0% |
| Croatian | 14 | 0.0% |
| Cuban | 36 | 0.1% |
| Czech | 43 | 0.1% |
| Czechoslovakian | 14 | 0.0% |
| Danish | 94 | 0.2% |
| Delaware | 13 | 0.0% |
| Dutch | 498 | 1.0% |
| Dutch West Indian | 20 | 0.0% |
| Eastern European | 144 | 0.3% |
| Ecuadorian | 278 | 0.5% |
| Egyptian | 67 | 0.1% |
| English | 6,122 | 12.0% |
| Ethiopian | 78 | 0.2% |
| European | 1,209 | 2.4% |
| Finnish | 9 | 0.0% |
| French | 791 | 1.5% |
| French Canadian | 145 | 0.3% |
| German | 7,979 | 15.7% |
| Greek | 162 | 0.3% |
| Guatemalan | 153 | 0.3% |
| Haitian | 10 | 0.0% |
| Hmong | 55 | 0.1% |
| Honduran | 44 | 0.1% |
| Hungarian | 60 | 0.1% |
| Indian (Asian) | 876 | 1.7% |
| Indonesian | 43 | 0.1% |
| Irish | 4,030 | 7.9% |
| Italian | 1,017 | 2.0% |
| Jamaican | 45 | 0.1% |
| Korean | 142 | 0.3% |
| Laotian | 44 | 0.1% |
| Lithuanian | 27 | 0.1% |
| Mexican | 3,319 | 6.5% |
| Native Hawaiian | 50 | 0.1% |
| Nicaraguan | 21 | 0.0% |
| Nigerian | 111 | 0.2% |
| Northern European | 155 | 0.3% |
| Norwegian | 210 | 0.4% |
| Palestinian | 12 | 0.0% |
| Polish | 719 | 1.4% |
| Portuguese | 95 | 0.2% |
| Puerto Rican | 309 | 0.6% |
| Romanian | 16 | 0.0% |
| Russian | 215 | 0.4% |
| Salvadoran | 13 | 0.0% |
| Scandinavian | 220 | 0.4% |
| Scotch-Irish | 786 | 1.5% |
| Scottish | 825 | 1.6% |
| Serbian | 11 | 0.0% |
| Sioux | 20 | 0.0% |
| Slavic | 15 | 0.0% |
| Slovak | 15 | 0.0% |
| Slovene | 16 | 0.0% |
| South African | 88 | 0.2% |
| South American | 342 | 0.7% |
| Spaniard | 138 | 0.3% |
| Spanish | 161 | 0.3% |
| Sri Lankan | 162 | 0.3% |
| Subsaharan African | 340 | 0.7% |
| Swedish | 220 | 0.4% |
| Swiss | 221 | 0.4% |
| Syrian | 14 | 0.0% |
| Thai | 4,631 | 9.1% |
| Turkish | 111 | 0.2% |
| Ukrainian | 117 | 0.2% |
| Venezuelan | 45 | 0.1% |
| Welsh | 305 | 0.6% |
| West Indian | 14 | 0.0% |
| Zimbabwean | 30 | 0.1% | View All 86 Rows |
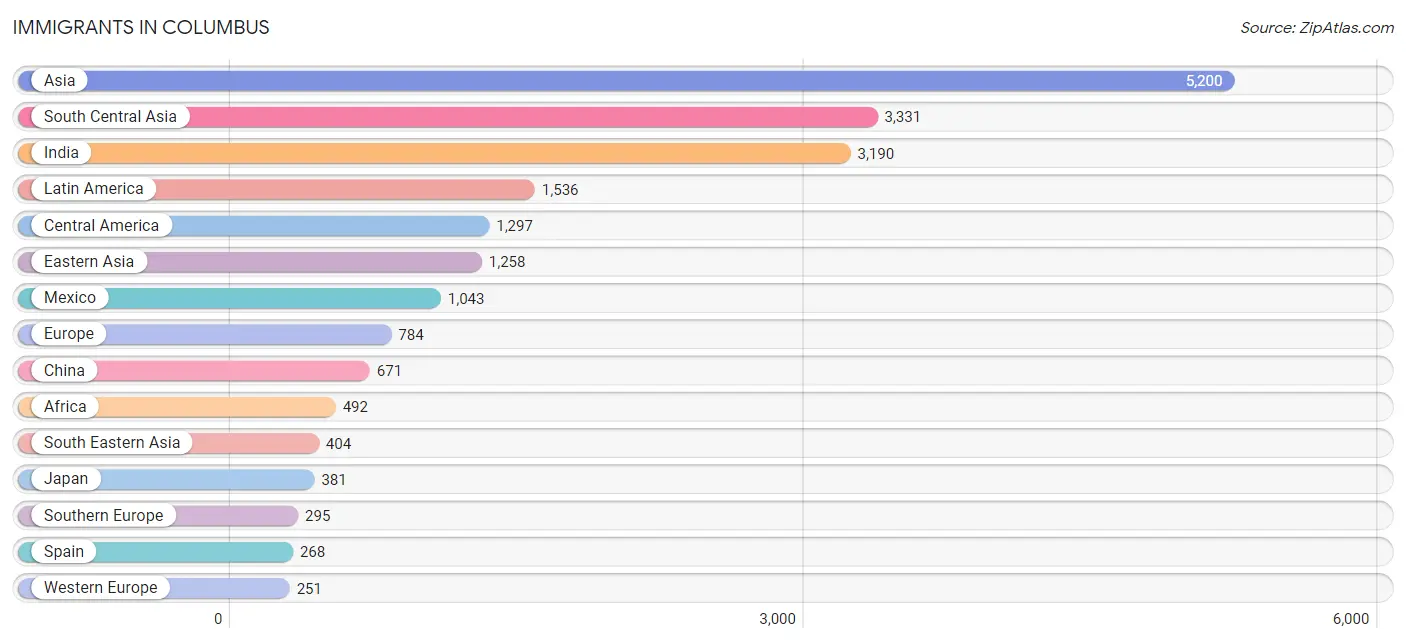
Immigrants in Columbus
The most numerous immigrant groups reported in Columbus came from Asia (5,200 | 10.2%), South Central Asia (3,331 | 6.5%), India (3,190 | 6.3%), Latin America (1,536 | 3.0%), and Central America (1,297 | 2.5%), together accounting for 28.6% of all Columbus residents.
| Immigration Origin | # Population | % Population |
| Africa | 492 | 1.0% |
| Argentina | 19 | 0.0% |
| Asia | 5,200 | 10.2% |
| Austria | 15 | 0.0% |
| Bangladesh | 55 | 0.1% |
| Belgium | 24 | 0.1% |
| Brazil | 105 | 0.2% |
| Canada | 54 | 0.1% |
| Caribbean | 80 | 0.2% |
| Central America | 1,297 | 2.5% |
| China | 671 | 1.3% |
| Costa Rica | 7 | 0.0% |
| Cuba | 8 | 0.0% |
| Eastern Africa | 132 | 0.3% |
| Eastern Asia | 1,258 | 2.5% |
| Eastern Europe | 20 | 0.0% |
| Egypt | 67 | 0.1% |
| England | 49 | 0.1% |
| Ethiopia | 22 | 0.0% |
| Europe | 784 | 1.5% |
| France | 115 | 0.2% |
| Germany | 58 | 0.1% |
| Ghana | 47 | 0.1% |
| Greece | 27 | 0.1% |
| Grenada | 33 | 0.1% |
| Guatemala | 197 | 0.4% |
| Honduras | 2 | 0.0% |
| India | 3,190 | 6.3% |
| Indonesia | 13 | 0.0% |
| Jamaica | 19 | 0.0% |
| Japan | 381 | 0.7% |
| Korea | 206 | 0.4% |
| Latin America | 1,536 | 3.0% |
| Mexico | 1,043 | 2.1% |
| Nepal | 59 | 0.1% |
| Nicaragua | 48 | 0.1% |
| Nigeria | 111 | 0.2% |
| Northern Africa | 67 | 0.1% |
| Northern Europe | 218 | 0.4% |
| Pakistan | 27 | 0.1% |
| Philippines | 130 | 0.3% |
| Saudi Arabia | 35 | 0.1% |
| Scotland | 16 | 0.0% |
| South Africa | 100 | 0.2% |
| South America | 159 | 0.3% |
| South Central Asia | 3,331 | 6.5% |
| South Eastern Asia | 404 | 0.8% |
| Southern Europe | 295 | 0.6% |
| Spain | 268 | 0.5% |
| Switzerland | 39 | 0.1% |
| Taiwan | 95 | 0.2% |
| Turkey | 111 | 0.2% |
| Ukraine | 9 | 0.0% |
| Venezuela | 35 | 0.1% |
| Vietnam | 218 | 0.4% |
| Western Africa | 193 | 0.4% |
| Western Asia | 207 | 0.4% |
| Western Europe | 251 | 0.5% |
| Zimbabwe | 54 | 0.1% | View All 59 Rows |
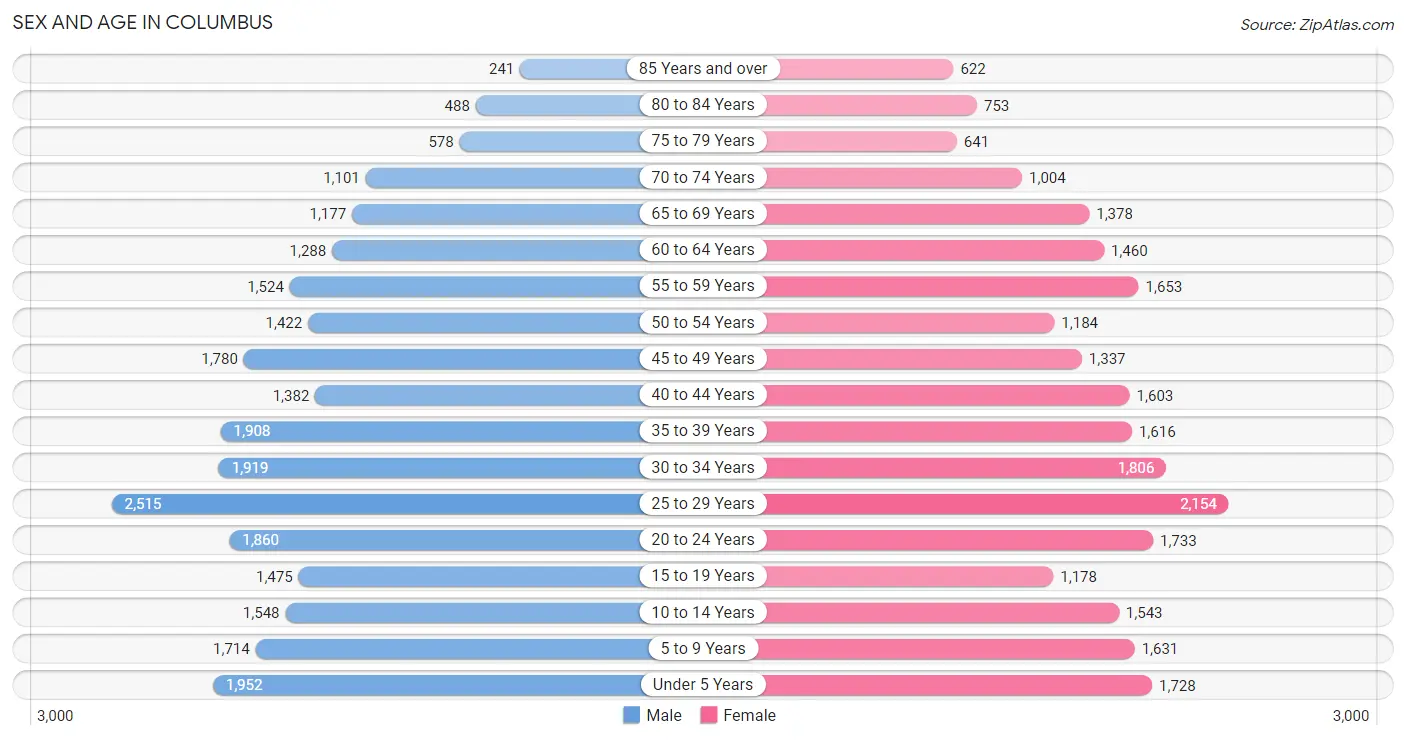
Sex and Age in Columbus
Sex and Age in Columbus
The most populous age groups in Columbus are 25 to 29 Years (2,515 | 9.7%) for men and 25 to 29 Years (2,154 | 8.6%) for women.
| Age Bracket | Male | Female |
| Under 5 Years | 1,952 (7.5%) | 1,728 (6.9%) |
| 5 to 9 Years | 1,714 (6.6%) | 1,631 (6.5%) |
| 10 to 14 Years | 1,548 (6.0%) | 1,543 (6.2%) |
| 15 to 19 Years | 1,475 (5.7%) | 1,178 (4.7%) |
| 20 to 24 Years | 1,860 (7.2%) | 1,733 (6.9%) |
| 25 to 29 Years | 2,515 (9.7%) | 2,154 (8.6%) |
| 30 to 34 Years | 1,919 (7.4%) | 1,806 (7.2%) |
| 35 to 39 Years | 1,908 (7.4%) | 1,616 (6.5%) |
| 40 to 44 Years | 1,382 (5.3%) | 1,603 (6.4%) |
| 45 to 49 Years | 1,780 (6.9%) | 1,337 (5.3%) |
| 50 to 54 Years | 1,422 (5.5%) | 1,184 (4.7%) |
| 55 to 59 Years | 1,524 (5.9%) | 1,653 (6.6%) |
| 60 to 64 Years | 1,288 (5.0%) | 1,460 (5.8%) |
| 65 to 69 Years | 1,177 (4.5%) | 1,378 (5.5%) |
| 70 to 74 Years | 1,101 (4.3%) | 1,004 (4.0%) |
| 75 to 79 Years | 578 (2.2%) | 641 (2.6%) |
| 80 to 84 Years | 488 (1.9%) | 753 (3.0%) |
| 85 Years and over | 241 (0.9%) | 622 (2.5%) |
| Total | 25,872 (100.0%) | 25,024 (100.0%) |
Families and Households in Columbus
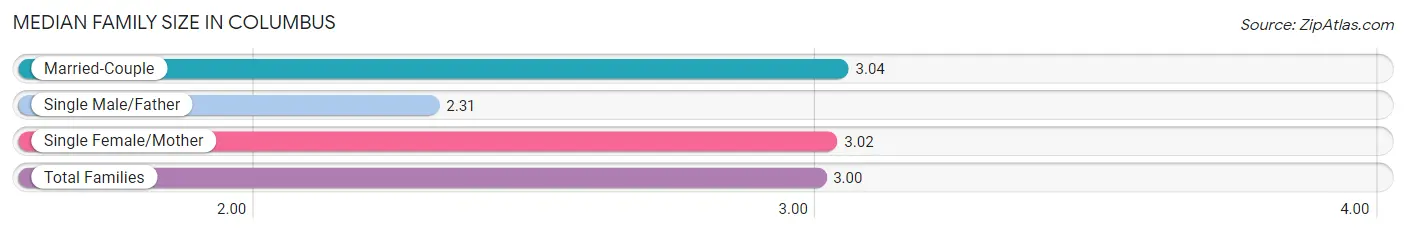
Median Family Size in Columbus
The median family size in Columbus is 3.00 persons per family, with married-couple families (9,846 | 77.1%) accounting for the largest median family size of 3.04 persons per family. On the other hand, single male/father families (718 | 5.6%) represent the smallest median family size with 2.31 persons per family.
| Family Type | # Families | Family Size |
| Married-Couple | 9,846 (77.1%) | 3.04 |
| Single Male/Father | 718 (5.6%) | 2.31 |
| Single Female/Mother | 2,212 (17.3%) | 3.02 |
| Total Families | 12,776 (100.0%) | 3.00 |
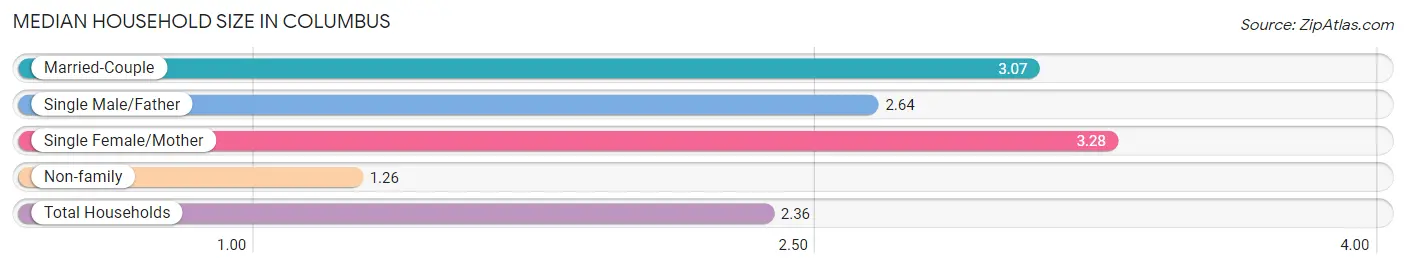
Median Household Size in Columbus
The median household size in Columbus is 2.36 persons per household, with single female/mother households (2,212 | 10.4%) accounting for the largest median household size of 3.28 persons per household. non-family households (8,418 | 39.7%) represent the smallest median household size with 1.26 persons per household.
| Household Type | # Households | Household Size |
| Married-Couple | 9,846 (46.5%) | 3.07 |
| Single Male/Father | 718 (3.4%) | 2.64 |
| Single Female/Mother | 2,212 (10.4%) | 3.28 |
| Non-family | 8,418 (39.7%) | 1.26 |
| Total Households | 21,194 (100.0%) | 2.36 |
Household Size by Marriage Status in Columbus
Out of a total of 21,194 households in Columbus, 12,776 (60.3%) are family households, while 8,418 (39.7%) are nonfamily households. The most numerous type of family households are 2-person households, comprising 5,642, and the most common type of nonfamily households are 1-person households, comprising 6,860.
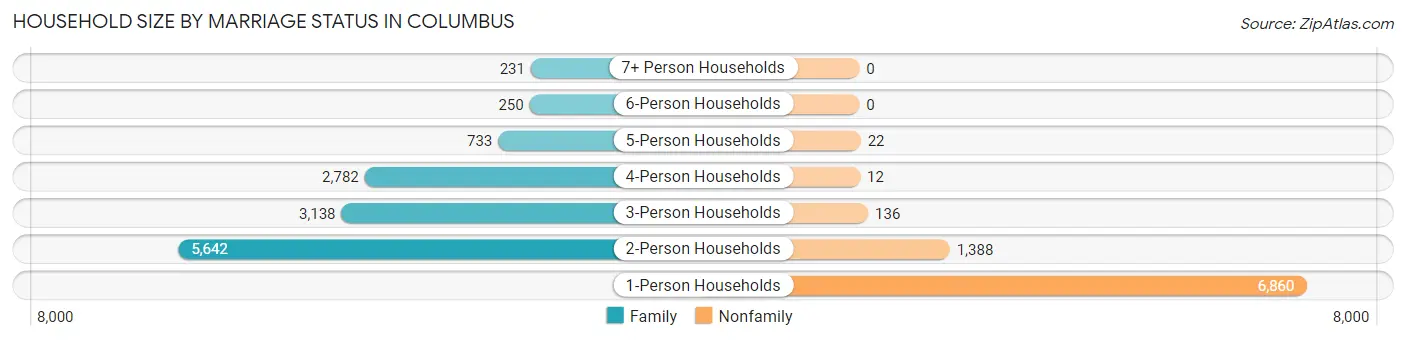
| Household Size | Family Households | Nonfamily Households |
| 1-Person Households | - | 6,860 (32.4%) |
| 2-Person Households | 5,642 (26.6%) | 1,388 (6.6%) |
| 3-Person Households | 3,138 (14.8%) | 136 (0.6%) |
| 4-Person Households | 2,782 (13.1%) | 12 (0.1%) |
| 5-Person Households | 733 (3.5%) | 22 (0.1%) |
| 6-Person Households | 250 (1.2%) | 0 (0.0%) |
| 7+ Person Households | 231 (1.1%) | 0 (0.0%) |
| Total | 12,776 (60.3%) | 8,418 (39.7%) |
Female Fertility in Columbus
Fertility by Age in Columbus
Average fertility rate in Columbus is 67.0 births per 1,000 women. Women in the age bracket of 20 to 34 years have the highest fertility rate with 118.0 births per 1,000 women. Women in the age bracket of 20 to 34 years acount for 86.2% of all women with births.
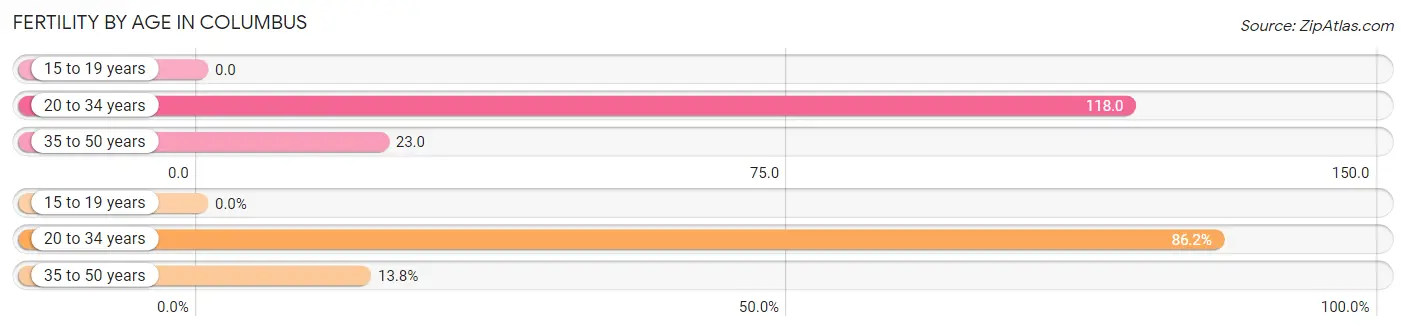
| Age Bracket | Women with Births | Births / 1,000 Women |
| 15 to 19 years | 0 (0.0%) | 0.0 |
| 20 to 34 years | 673 (86.2%) | 118.0 |
| 35 to 50 years | 108 (13.8%) | 23.0 |
| Total | 781 (100.0%) | 67.0 |
Fertility by Age by Marriage Status in Columbus
70.2% of women with births (781) in Columbus are married. The highest percentage of unmarried women with births falls into 20 to 34 years age bracket with 34.6% of them unmarried at the time of birth, while the lowest percentage of unmarried women with births belong to 35 to 50 years age bracket with 0.0% of them unmarried.
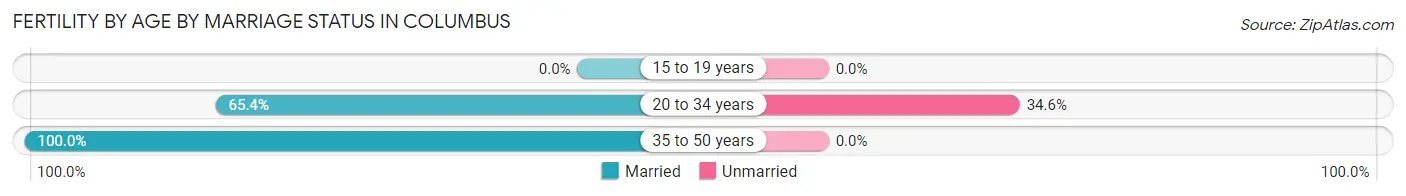
| Age Bracket | Married | Unmarried |
| 15 to 19 years | 0 (0.0%) | 0 (0.0%) |
| 20 to 34 years | 440 (65.4%) | 233 (34.6%) |
| 35 to 50 years | 108 (100.0%) | 0 (0.0%) |
| Total | 548 (70.2%) | 233 (29.8%) |
Fertility by Education in Columbus
Average fertility rate in Columbus is 67.0 births per 1,000 women. Women with the education attainment of high school diploma have the highest fertility rate of 87.0 births per 1,000 women, while women with the education attainment of graduate degree have the lowest fertility at 43.0 births per 1,000 women. Women with the education attainment of bachelor's degree represent 30.0% of all women with births.
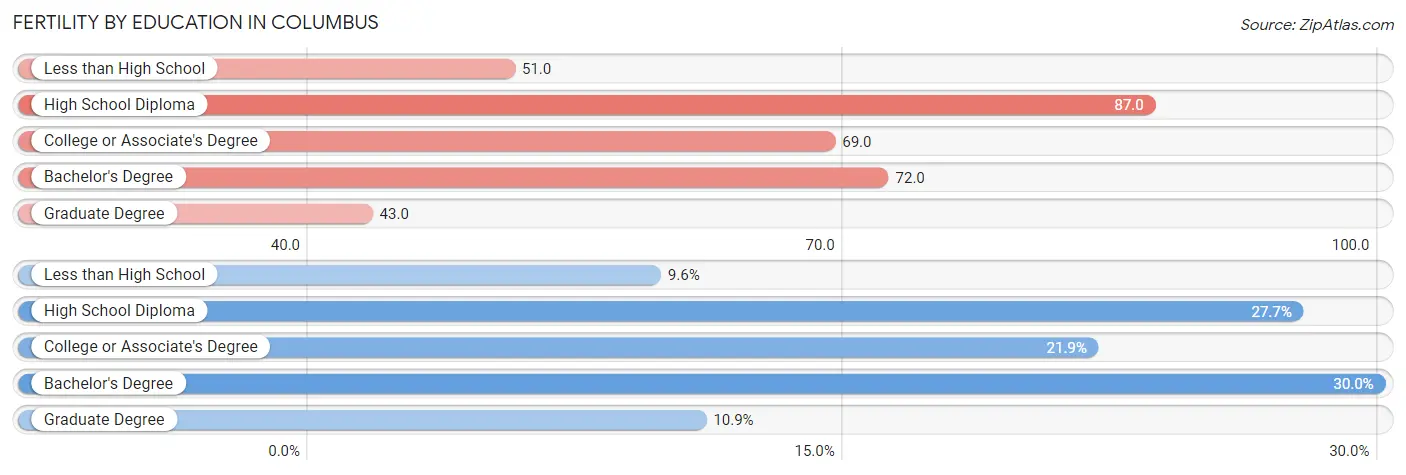
| Educational Attainment | Women with Births | Births / 1,000 Women |
| Less than High School | 75 (9.6%) | 51.0 |
| High School Diploma | 216 (27.7%) | 87.0 |
| College or Associate's Degree | 171 (21.9%) | 69.0 |
| Bachelor's Degree | 234 (30.0%) | 72.0 |
| Graduate Degree | 85 (10.9%) | 43.0 |
| Total | 781 (100.0%) | 67.0 |
Fertility by Education by Marriage Status in Columbus
29.8% of women with births in Columbus are unmarried. Women with the educational attainment of bachelor's degree are most likely to be married with 100.0% of them married at childbirth, while women with the educational attainment of college or associate's degree are least likely to be married with 69.6% of them unmarried at childbirth.
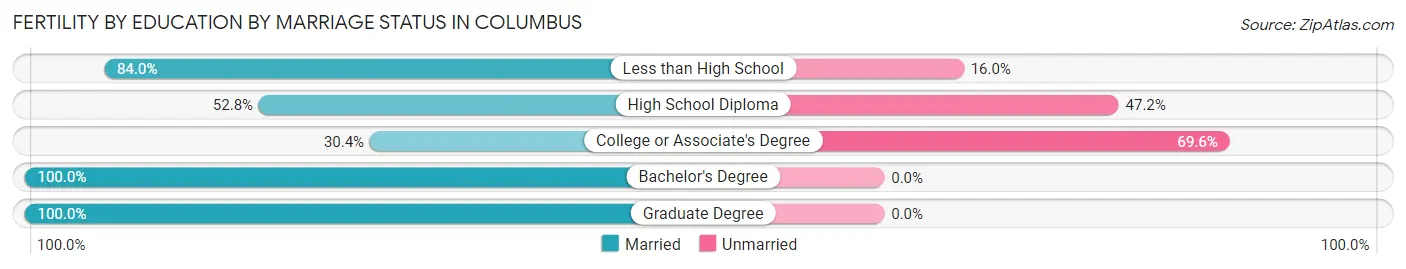
| Educational Attainment | Married | Unmarried |
| Less than High School | 63 (84.0%) | 12 (16.0%) |
| High School Diploma | 114 (52.8%) | 102 (47.2%) |
| College or Associate's Degree | 52 (30.4%) | 119 (69.6%) |
| Bachelor's Degree | 234 (100.0%) | 0 (0.0%) |
| Graduate Degree | 85 (100.0%) | 0 (0.0%) |
| Total | 548 (70.2%) | 233 (29.8%) |
Employment Characteristics in Columbus
Employment by Class of Employer in Columbus
Among the 25,263 employed individuals in Columbus, private company employees (19,433 | 76.9%), not-for-profit organizations (2,159 | 8.6%), and local government employees (1,309 | 5.2%) make up the most common classes of employment.
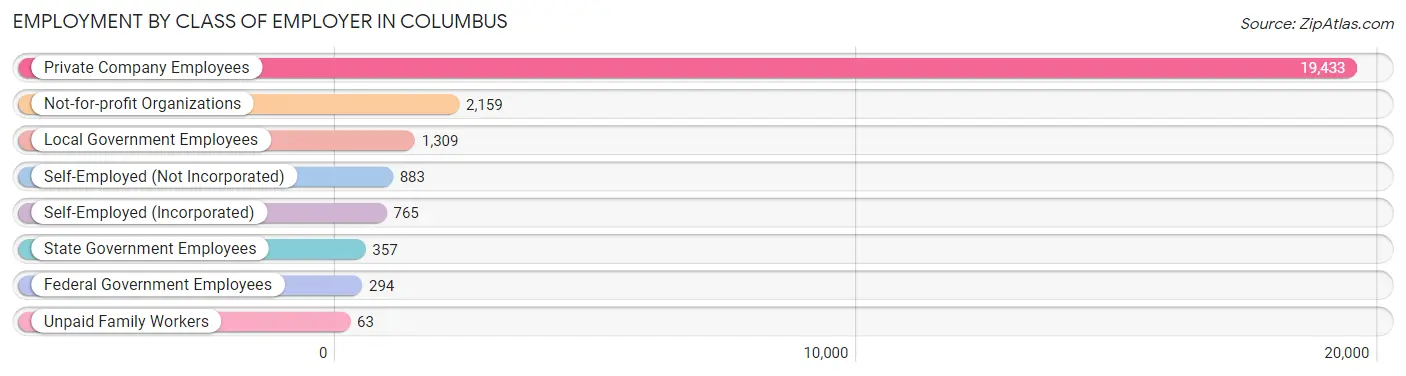
| Employer Class | # Employees | % Employees |
| Private Company Employees | 19,433 | 76.9% |
| Self-Employed (Incorporated) | 765 | 3.0% |
| Self-Employed (Not Incorporated) | 883 | 3.5% |
| Not-for-profit Organizations | 2,159 | 8.6% |
| Local Government Employees | 1,309 | 5.2% |
| State Government Employees | 357 | 1.4% |
| Federal Government Employees | 294 | 1.2% |
| Unpaid Family Workers | 63 | 0.3% |
| Total | 25,263 | 100.0% |
Employment Status by Age in Columbus
According to the labor force statistics for Columbus, out of the total population over 16 years of age (40,389), 65.9% or 26,616 individuals are in the labor force, with 4.0% or 1,065 of them unemployed. The age group with the highest labor force participation rate is 55 to 59 years, with 83.9% or 2,666 individuals in the labor force. Within the labor force, the 16 to 19 years age range has the highest percentage of unemployed individuals, with 9.2% or 92 of them being unemployed.
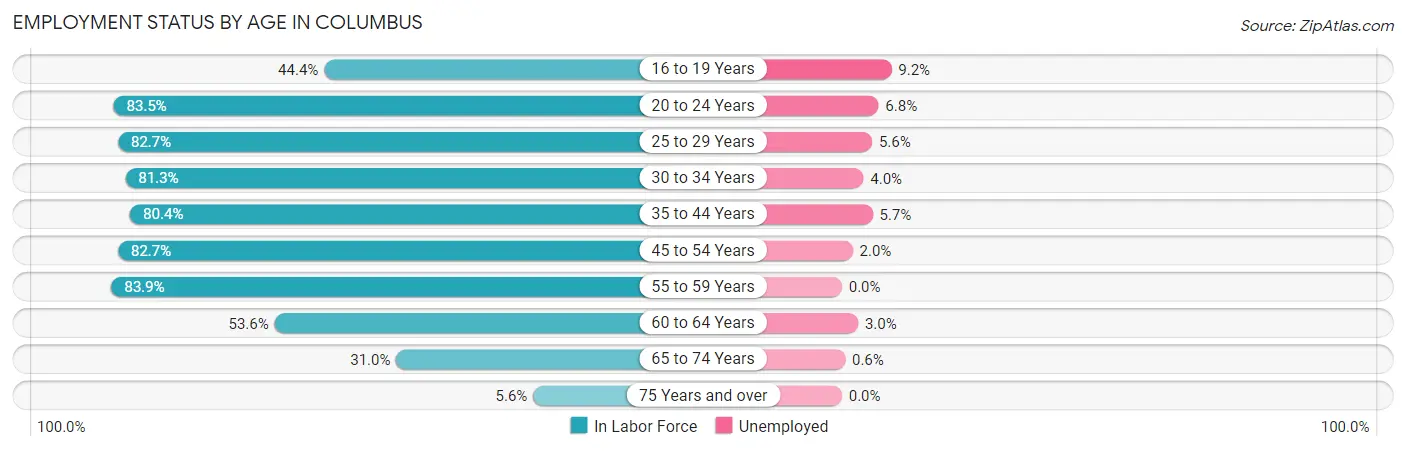
| Age Bracket | In Labor Force | Unemployed |
| 16 to 19 Years | 1,004 (44.4%) | 92 (9.2%) |
| 20 to 24 Years | 3,000 (83.5%) | 204 (6.8%) |
| 25 to 29 Years | 3,861 (82.7%) | 216 (5.6%) |
| 30 to 34 Years | 3,028 (81.3%) | 121 (4.0%) |
| 35 to 44 Years | 5,233 (80.4%) | 298 (5.7%) |
| 45 to 54 Years | 4,733 (82.7%) | 95 (2.0%) |
| 55 to 59 Years | 2,666 (83.9%) | 0 (0.0%) |
| 60 to 64 Years | 1,473 (53.6%) | 44 (3.0%) |
| 65 to 74 Years | 1,445 (31.0%) | 9 (0.6%) |
| 75 Years and over | 186 (5.6%) | 0 (0.0%) |
| Total | 26,616 (65.9%) | 1,065 (4.0%) |
Employment Status by Educational Attainment in Columbus
According to labor force statistics for Columbus, 79.1% of individuals (21,002) out of the total population between 25 and 64 years of age (26,551) are in the labor force, with 3.7% or 777 of them being unemployed. The group with the highest labor force participation rate are those with the educational attainment of bachelor's degree or higher, with 85.9% or 10,484 individuals in the labor force. Within the labor force, individuals with high school diploma education have the highest percentage of unemployment, with 8.3% or 383 of them being unemployed.
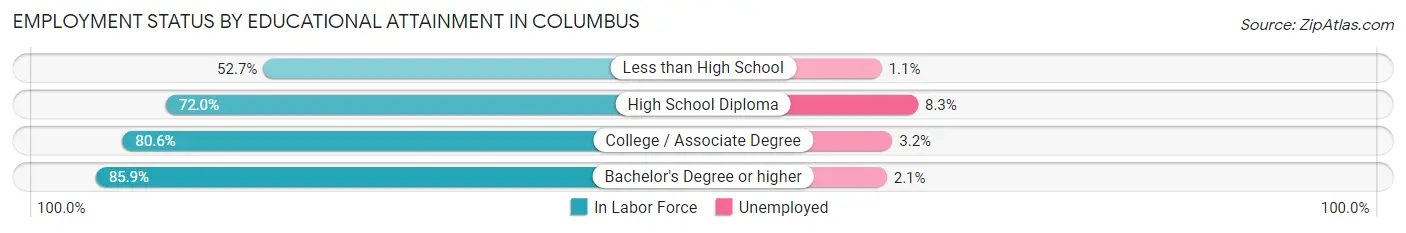
| Educational Attainment | In Labor Force | Unemployed |
| Less than High School | 959 (52.7%) | 20 (1.1%) |
| High School Diploma | 4,611 (72.0%) | 532 (8.3%) |
| College / Associate Degree | 4,934 (80.6%) | 196 (3.2%) |
| Bachelor's Degree or higher | 10,484 (85.9%) | 256 (2.1%) |
| Total | 21,002 (79.1%) | 982 (3.7%) |
Employment Occupations by Sex in Columbus
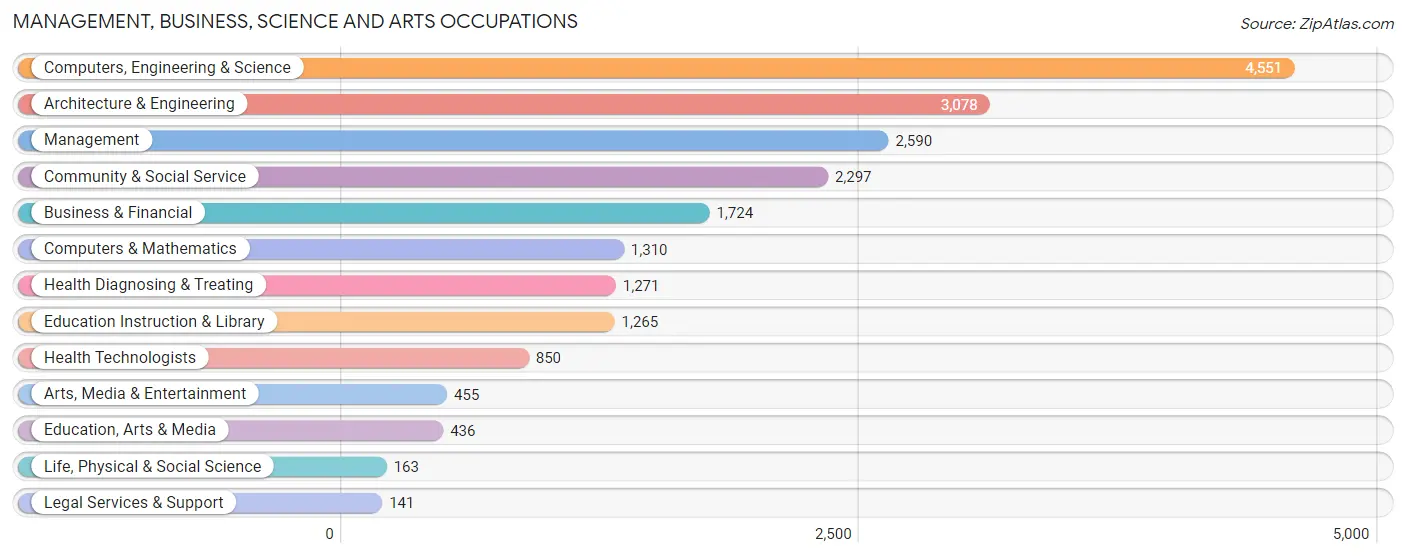
Management, Business, Science and Arts Occupations
The most common Management, Business, Science and Arts occupations in Columbus are Computers, Engineering & Science (4,551 | 17.9%), Architecture & Engineering (3,078 | 12.1%), Management (2,590 | 10.2%), Community & Social Service (2,297 | 9.0%), and Business & Financial (1,724 | 6.8%).
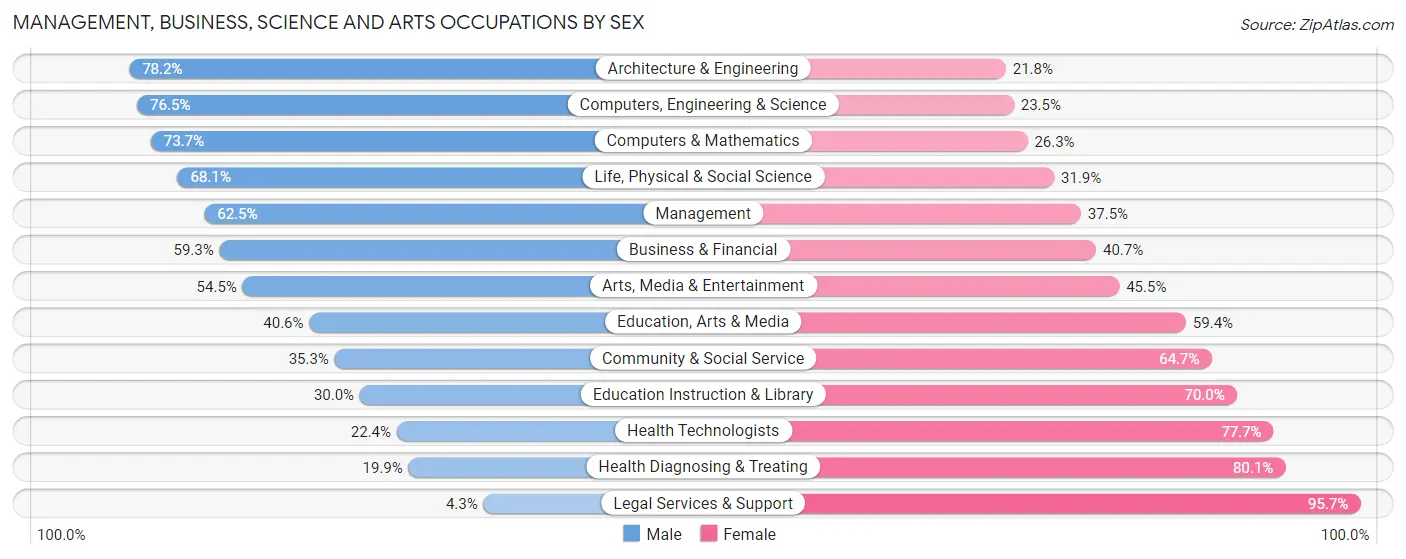
Management, Business, Science and Arts Occupations by Sex
Within the Management, Business, Science and Arts occupations in Columbus, the most male-oriented occupations are Architecture & Engineering (78.2%), Computers, Engineering & Science (76.5%), and Computers & Mathematics (73.7%), while the most female-oriented occupations are Legal Services & Support (95.7%), Health Diagnosing & Treating (80.1%), and Health Technologists (77.6%).
| Occupation | Male | Female |
| Management | 1,619 (62.5%) | 971 (37.5%) |
| Business & Financial | 1,023 (59.3%) | 701 (40.7%) |
| Computers, Engineering & Science | 3,482 (76.5%) | 1,069 (23.5%) |
| Computers & Mathematics | 965 (73.7%) | 345 (26.3%) |
| Architecture & Engineering | 2,406 (78.2%) | 672 (21.8%) |
| Life, Physical & Social Science | 111 (68.1%) | 52 (31.9%) |
| Community & Social Service | 811 (35.3%) | 1,486 (64.7%) |
| Education, Arts & Media | 177 (40.6%) | 259 (59.4%) |
| Legal Services & Support | 6 (4.3%) | 135 (95.7%) |
| Education Instruction & Library | 380 (30.0%) | 885 (70.0%) |
| Arts, Media & Entertainment | 248 (54.5%) | 207 (45.5%) |
| Health Diagnosing & Treating | 253 (19.9%) | 1,018 (80.1%) |
| Health Technologists | 190 (22.4%) | 660 (77.6%) |
| Total (Category) | 7,188 (57.8%) | 5,245 (42.2%) |
| Total (Overall) | 14,379 (56.6%) | 11,039 (43.4%) |
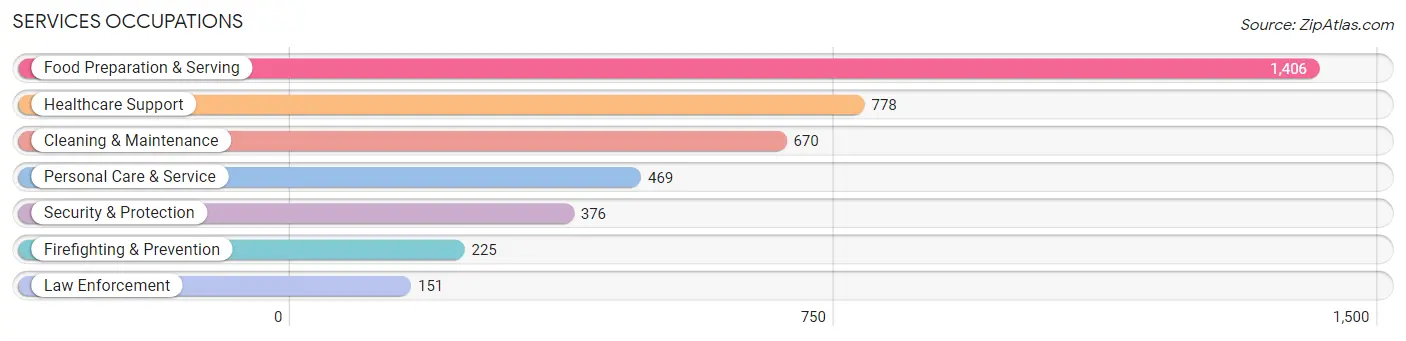
Services Occupations
The most common Services occupations in Columbus are Food Preparation & Serving (1,406 | 5.5%), Healthcare Support (778 | 3.1%), Cleaning & Maintenance (670 | 2.6%), Personal Care & Service (469 | 1.8%), and Security & Protection (376 | 1.5%).
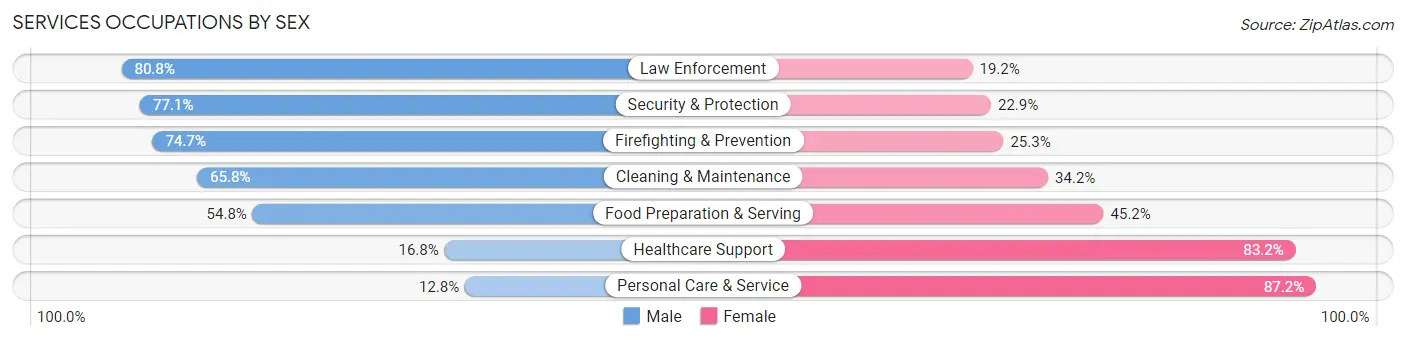
Services Occupations by Sex
Within the Services occupations in Columbus, the most male-oriented occupations are Law Enforcement (80.8%), Security & Protection (77.1%), and Firefighting & Prevention (74.7%), while the most female-oriented occupations are Personal Care & Service (87.2%), Healthcare Support (83.2%), and Food Preparation & Serving (45.2%).
| Occupation | Male | Female |
| Healthcare Support | 131 (16.8%) | 647 (83.2%) |
| Security & Protection | 290 (77.1%) | 86 (22.9%) |
| Firefighting & Prevention | 168 (74.7%) | 57 (25.3%) |
| Law Enforcement | 122 (80.8%) | 29 (19.2%) |
| Food Preparation & Serving | 771 (54.8%) | 635 (45.2%) |
| Cleaning & Maintenance | 441 (65.8%) | 229 (34.2%) |
| Personal Care & Service | 60 (12.8%) | 409 (87.2%) |
| Total (Category) | 1,693 (45.8%) | 2,006 (54.2%) |
| Total (Overall) | 14,379 (56.6%) | 11,039 (43.4%) |
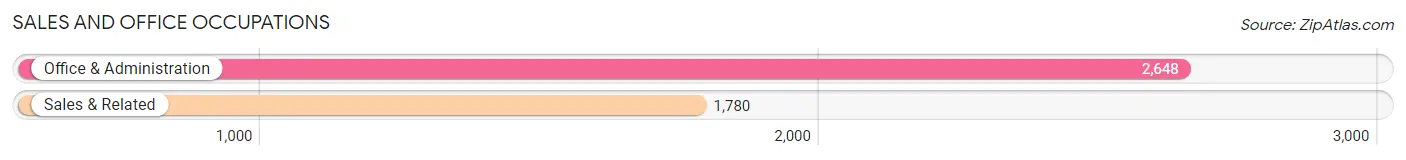
Sales and Office Occupations
The most common Sales and Office occupations in Columbus are Office & Administration (2,648 | 10.4%), and Sales & Related (1,780 | 7.0%).
Sales and Office Occupations by Sex
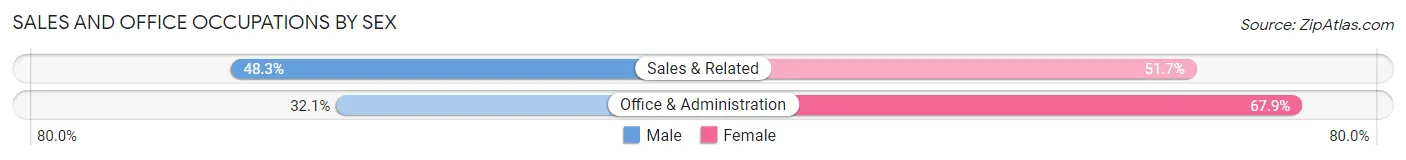
| Occupation | Male | Female |
| Sales & Related | 860 (48.3%) | 920 (51.7%) |
| Office & Administration | 849 (32.1%) | 1,799 (67.9%) |
| Total (Category) | 1,709 (38.6%) | 2,719 (61.4%) |
| Total (Overall) | 14,379 (56.6%) | 11,039 (43.4%) |
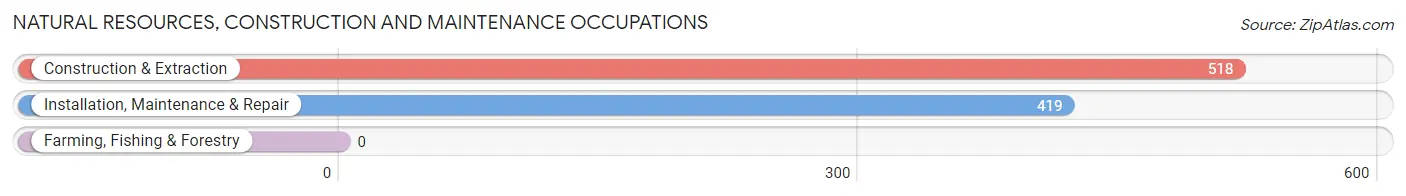
Natural Resources, Construction and Maintenance Occupations
The most common Natural Resources, Construction and Maintenance occupations in Columbus are Construction & Extraction (518 | 2.0%), and Installation, Maintenance & Repair (419 | 1.7%).
Natural Resources, Construction and Maintenance Occupations by Sex
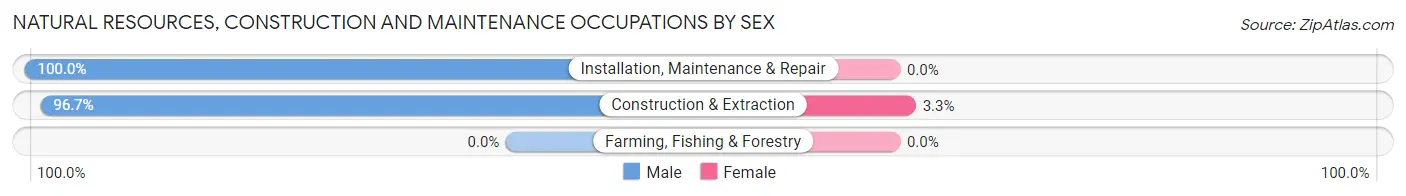
| Occupation | Male | Female |
| Farming, Fishing & Forestry | 0 (0.0%) | 0 (0.0%) |
| Construction & Extraction | 501 (96.7%) | 17 (3.3%) |
| Installation, Maintenance & Repair | 419 (100.0%) | 0 (0.0%) |
| Total (Category) | 920 (98.2%) | 17 (1.8%) |
| Total (Overall) | 14,379 (56.6%) | 11,039 (43.4%) |
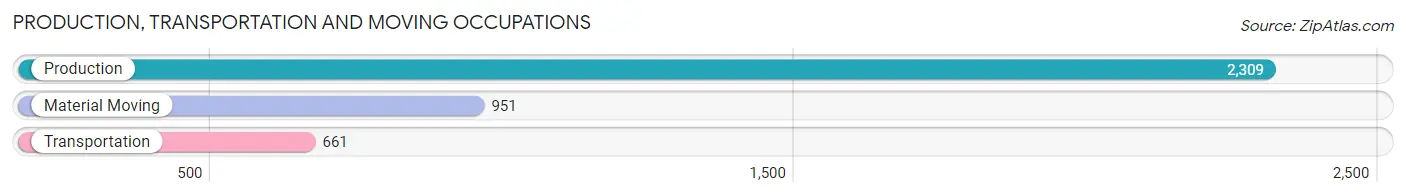
Production, Transportation and Moving Occupations
The most common Production, Transportation and Moving occupations in Columbus are Production (2,309 | 9.1%), Material Moving (951 | 3.7%), and Transportation (661 | 2.6%).
Production, Transportation and Moving Occupations by Sex
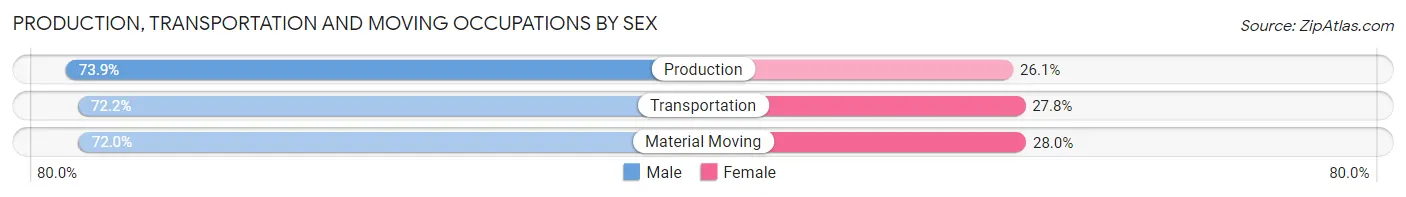
| Occupation | Male | Female |
| Production | 1,707 (73.9%) | 602 (26.1%) |
| Transportation | 477 (72.2%) | 184 (27.8%) |
| Material Moving | 685 (72.0%) | 266 (28.0%) |
| Total (Category) | 2,869 (73.2%) | 1,052 (26.8%) |
| Total (Overall) | 14,379 (56.6%) | 11,039 (43.4%) |
Employment Industries by Sex in Columbus
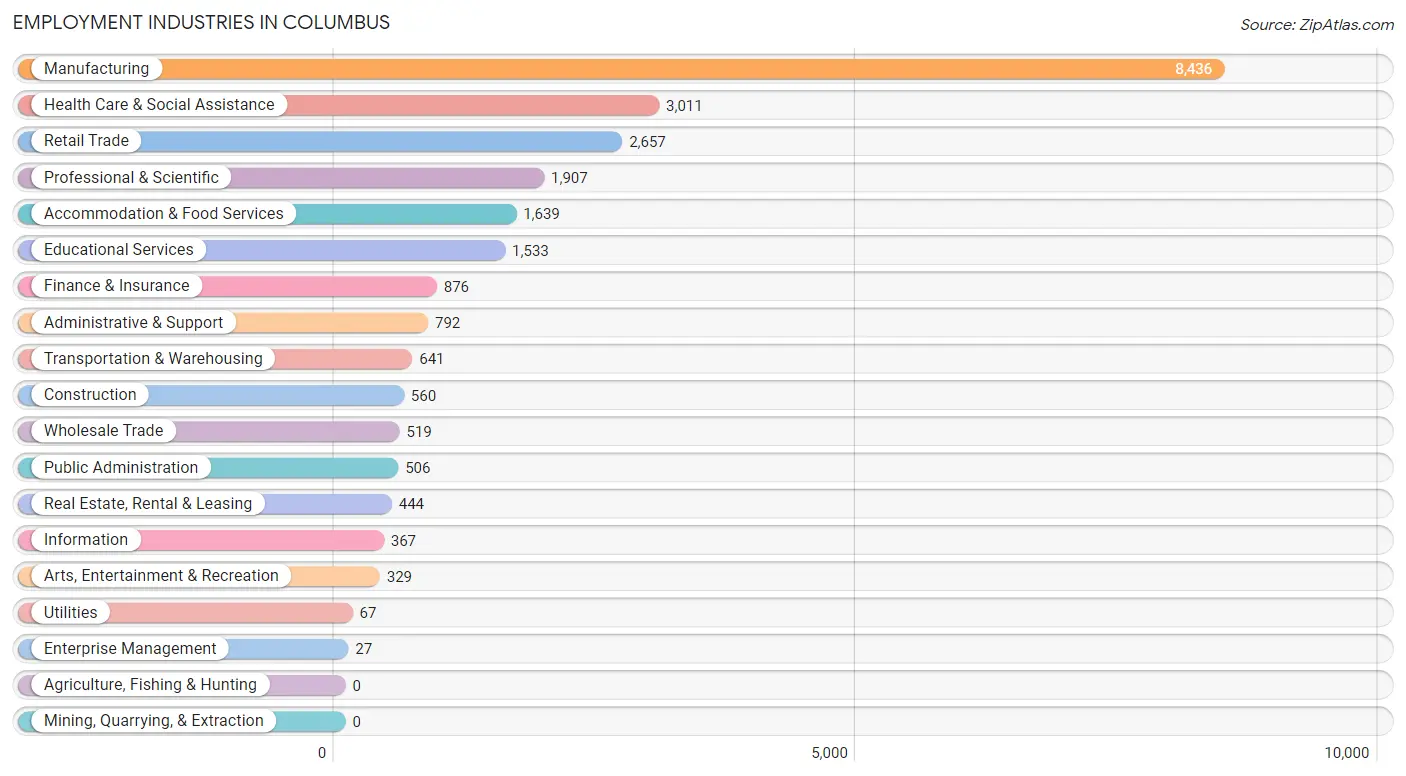
Employment Industries in Columbus
The major employment industries in Columbus include Manufacturing (8,436 | 33.2%), Health Care & Social Assistance (3,011 | 11.8%), Retail Trade (2,657 | 10.4%), Professional & Scientific (1,907 | 7.5%), and Accommodation & Food Services (1,639 | 6.5%).
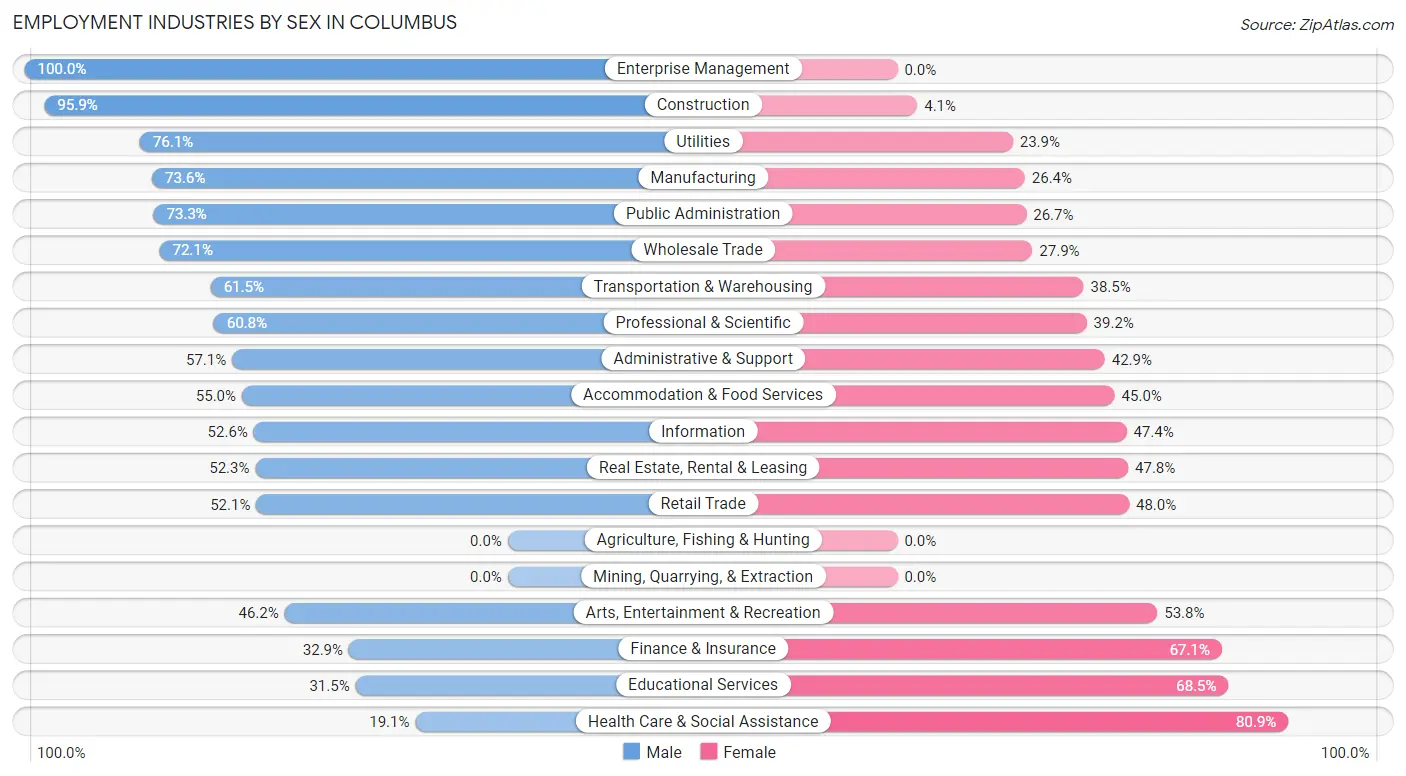
Employment Industries by Sex in Columbus
The Columbus industries that see more men than women are Enterprise Management (100.0%), Construction (95.9%), and Utilities (76.1%), whereas the industries that tend to have a higher number of women are Health Care & Social Assistance (80.9%), Educational Services (68.5%), and Finance & Insurance (67.1%).
| Industry | Male | Female |
| Agriculture, Fishing & Hunting | 0 (0.0%) | 0 (0.0%) |
| Mining, Quarrying, & Extraction | 0 (0.0%) | 0 (0.0%) |
| Construction | 537 (95.9%) | 23 (4.1%) |
| Manufacturing | 6,211 (73.6%) | 2,225 (26.4%) |
| Wholesale Trade | 374 (72.1%) | 145 (27.9%) |
| Retail Trade | 1,383 (52.0%) | 1,274 (47.9%) |
| Transportation & Warehousing | 394 (61.5%) | 247 (38.5%) |
| Utilities | 51 (76.1%) | 16 (23.9%) |
| Information | 193 (52.6%) | 174 (47.4%) |
| Finance & Insurance | 288 (32.9%) | 588 (67.1%) |
| Real Estate, Rental & Leasing | 232 (52.2%) | 212 (47.7%) |
| Professional & Scientific | 1,160 (60.8%) | 747 (39.2%) |
| Enterprise Management | 27 (100.0%) | 0 (0.0%) |
| Administrative & Support | 452 (57.1%) | 340 (42.9%) |
| Educational Services | 483 (31.5%) | 1,050 (68.5%) |
| Health Care & Social Assistance | 576 (19.1%) | 2,435 (80.9%) |
| Arts, Entertainment & Recreation | 152 (46.2%) | 177 (53.8%) |
| Accommodation & Food Services | 902 (55.0%) | 737 (45.0%) |
| Public Administration | 371 (73.3%) | 135 (26.7%) |
| Total | 14,379 (56.6%) | 11,039 (43.4%) |
Education in Columbus
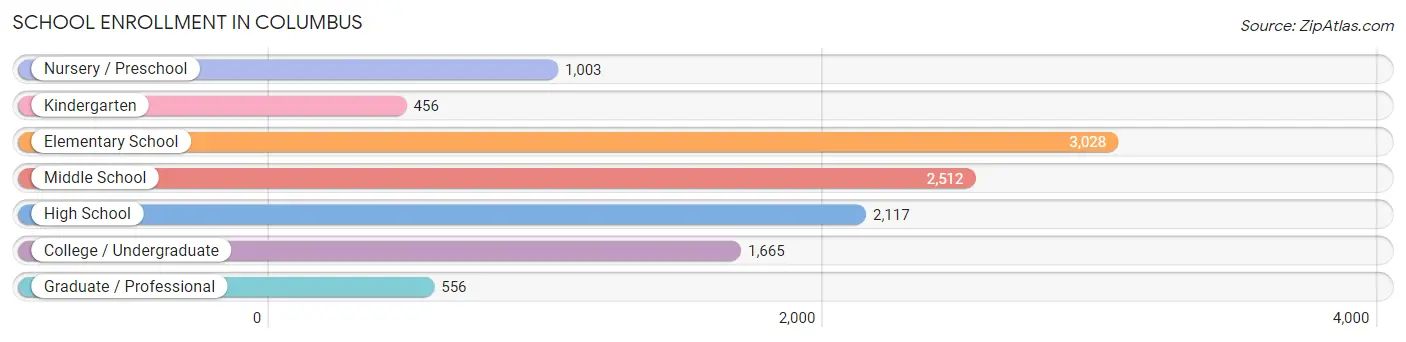
School Enrollment in Columbus
The most common levels of schooling among the 11,337 students in Columbus are elementary school (3,028 | 26.7%), middle school (2,512 | 22.2%), and high school (2,117 | 18.7%).
| School Level | # Students | % Students |
| Nursery / Preschool | 1,003 | 8.8% |
| Kindergarten | 456 | 4.0% |
| Elementary School | 3,028 | 26.7% |
| Middle School | 2,512 | 22.2% |
| High School | 2,117 | 18.7% |
| College / Undergraduate | 1,665 | 14.7% |
| Graduate / Professional | 556 | 4.9% |
| Total | 11,337 | 100.0% |
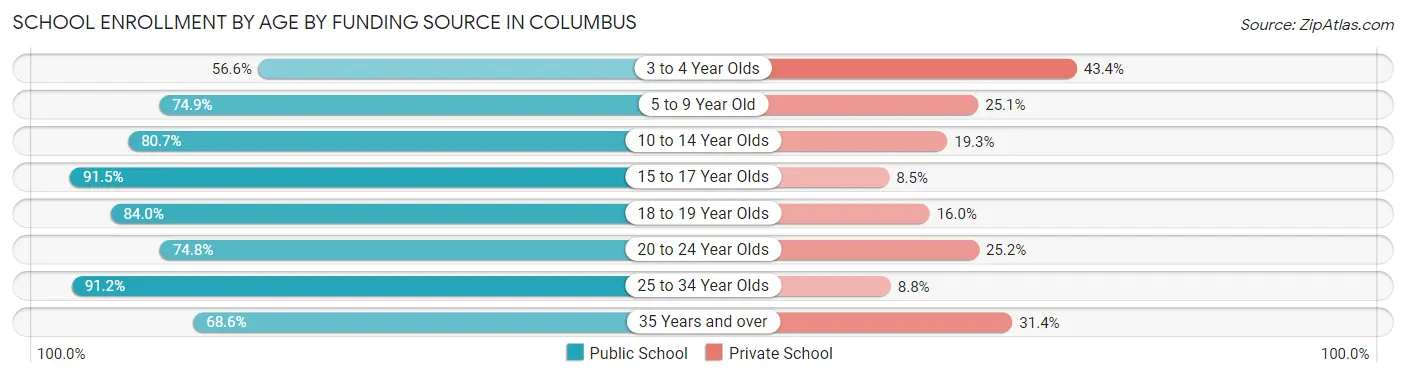
School Enrollment by Age by Funding Source in Columbus
Out of a total of 11,337 students who are enrolled in schools in Columbus, 2,392 (21.1%) attend a private institution, while the remaining 8,945 (78.9%) are enrolled in public schools. The age group of 3 to 4 year olds has the highest likelihood of being enrolled in private schools, with 364 (43.4% in the age bracket) enrolled. Conversely, the age group of 15 to 17 year olds has the lowest likelihood of being enrolled in a private school, with 1,574 (91.5% in the age bracket) attending a public institution.
| Age Bracket | Public School | Private School |
| 3 to 4 Year Olds | 474 (56.6%) | 364 (43.4%) |
| 5 to 9 Year Old | 2,411 (74.9%) | 807 (25.1%) |
| 10 to 14 Year Olds | 2,484 (80.7%) | 594 (19.3%) |
| 15 to 17 Year Olds | 1,574 (91.5%) | 146 (8.5%) |
| 18 to 19 Year Olds | 372 (84.0%) | 71 (16.0%) |
| 20 to 24 Year Olds | 599 (74.8%) | 202 (25.2%) |
| 25 to 34 Year Olds | 747 (91.2%) | 72 (8.8%) |
| 35 Years and over | 288 (68.6%) | 132 (31.4%) |
| Total | 8,945 (78.9%) | 2,392 (21.1%) |
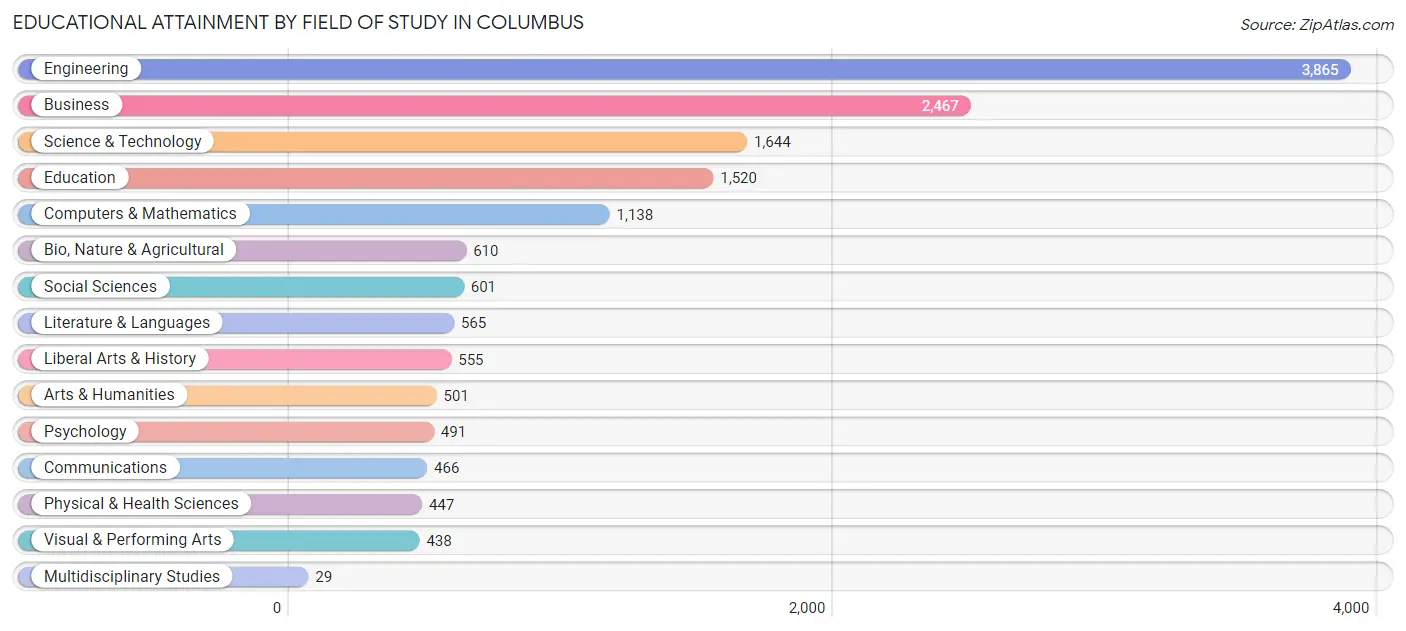
Educational Attainment by Field of Study in Columbus
Engineering (3,865 | 25.2%), business (2,467 | 16.1%), science & technology (1,644 | 10.7%), education (1,520 | 9.9%), and computers & mathematics (1,138 | 7.4%) are the most common fields of study among 15,337 individuals in Columbus who have obtained a bachelor's degree or higher.
| Field of Study | # Graduates | % Graduates |
| Computers & Mathematics | 1,138 | 7.4% |
| Bio, Nature & Agricultural | 610 | 4.0% |
| Physical & Health Sciences | 447 | 2.9% |
| Psychology | 491 | 3.2% |
| Social Sciences | 601 | 3.9% |
| Engineering | 3,865 | 25.2% |
| Multidisciplinary Studies | 29 | 0.2% |
| Science & Technology | 1,644 | 10.7% |
| Business | 2,467 | 16.1% |
| Education | 1,520 | 9.9% |
| Literature & Languages | 565 | 3.7% |
| Liberal Arts & History | 555 | 3.6% |
| Visual & Performing Arts | 438 | 2.9% |
| Communications | 466 | 3.0% |
| Arts & Humanities | 501 | 3.3% |
| Total | 15,337 | 100.0% |
Transportation & Commute in Columbus
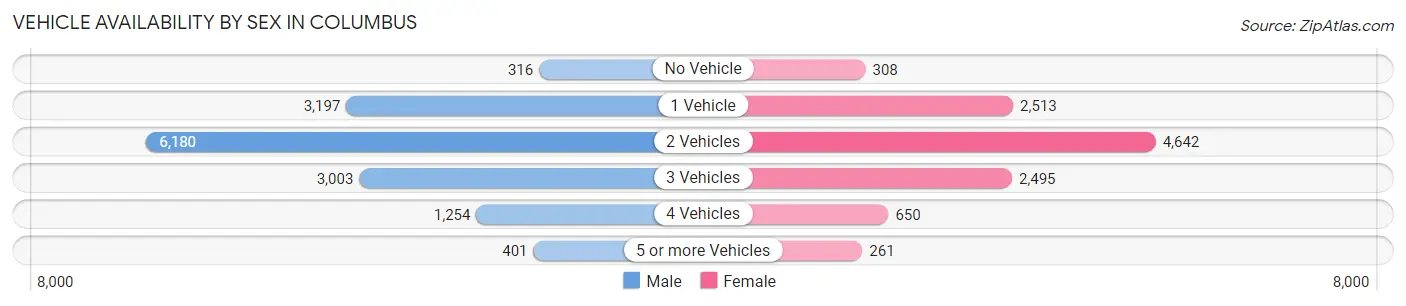
Vehicle Availability by Sex in Columbus
The most prevalent vehicle ownership categories in Columbus are males with 2 vehicles (6,180, accounting for 43.1%) and females with 2 vehicles (4,642, making up 56.9%).
| Vehicles Available | Male | Female |
| No Vehicle | 316 (2.2%) | 308 (2.8%) |
| 1 Vehicle | 3,197 (22.3%) | 2,513 (23.1%) |
| 2 Vehicles | 6,180 (43.1%) | 4,642 (42.7%) |
| 3 Vehicles | 3,003 (20.9%) | 2,495 (23.0%) |
| 4 Vehicles | 1,254 (8.7%) | 650 (6.0%) |
| 5 or more Vehicles | 401 (2.8%) | 261 (2.4%) |
| Total | 14,351 (100.0%) | 10,869 (100.0%) |
Commute Time in Columbus
The most frequently occuring commute durations in Columbus are 10 to 14 minutes (5,293 commuters, 23.7%), 5 to 9 minutes (4,570 commuters, 20.5%), and 15 to 19 minutes (3,970 commuters, 17.8%).
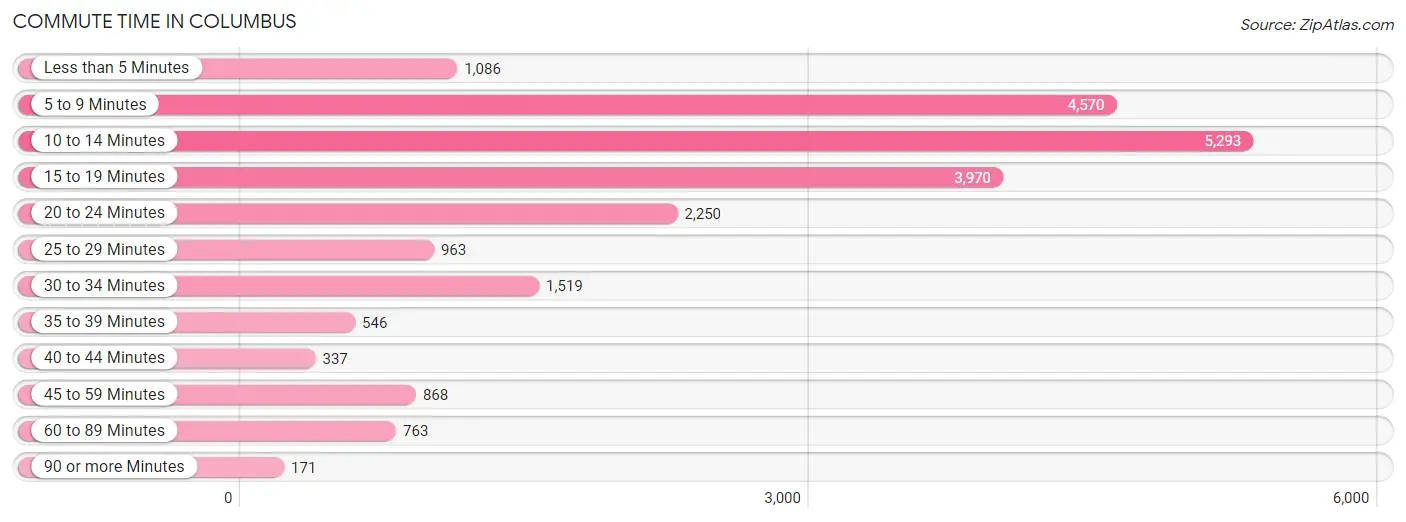
| Commute Time | # Commuters | % Commuters |
| Less than 5 Minutes | 1,086 | 4.9% |
| 5 to 9 Minutes | 4,570 | 20.5% |
| 10 to 14 Minutes | 5,293 | 23.7% |
| 15 to 19 Minutes | 3,970 | 17.8% |
| 20 to 24 Minutes | 2,250 | 10.1% |
| 25 to 29 Minutes | 963 | 4.3% |
| 30 to 34 Minutes | 1,519 | 6.8% |
| 35 to 39 Minutes | 546 | 2.4% |
| 40 to 44 Minutes | 337 | 1.5% |
| 45 to 59 Minutes | 868 | 3.9% |
| 60 to 89 Minutes | 763 | 3.4% |
| 90 or more Minutes | 171 | 0.8% |
Commute Time by Sex in Columbus
The most common commute times in Columbus are 10 to 14 minutes (2,837 commuters, 22.3%) for males and 10 to 14 minutes (2,456 commuters, 25.6%) for females.
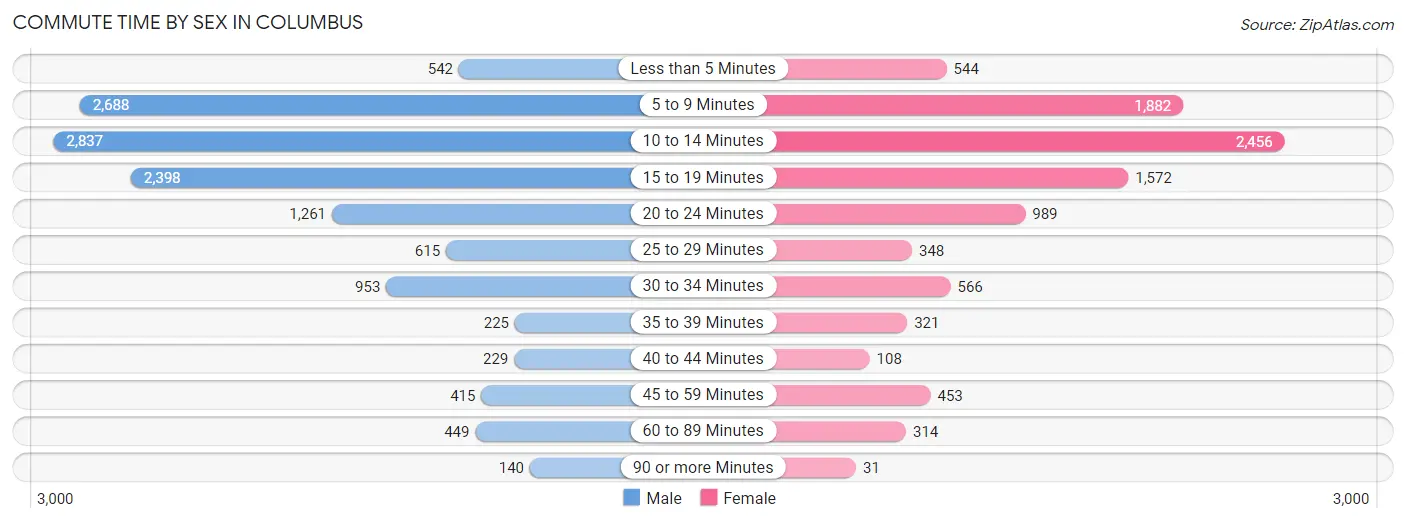
| Commute Time | Male | Female |
| Less than 5 Minutes | 542 (4.3%) | 544 (5.7%) |
| 5 to 9 Minutes | 2,688 (21.1%) | 1,882 (19.6%) |
| 10 to 14 Minutes | 2,837 (22.3%) | 2,456 (25.6%) |
| 15 to 19 Minutes | 2,398 (18.8%) | 1,572 (16.4%) |
| 20 to 24 Minutes | 1,261 (9.9%) | 989 (10.3%) |
| 25 to 29 Minutes | 615 (4.8%) | 348 (3.6%) |
| 30 to 34 Minutes | 953 (7.5%) | 566 (5.9%) |
| 35 to 39 Minutes | 225 (1.8%) | 321 (3.4%) |
| 40 to 44 Minutes | 229 (1.8%) | 108 (1.1%) |
| 45 to 59 Minutes | 415 (3.3%) | 453 (4.7%) |
| 60 to 89 Minutes | 449 (3.5%) | 314 (3.3%) |
| 90 or more Minutes | 140 (1.1%) | 31 (0.3%) |
Time of Departure to Work by Sex in Columbus
The most frequent times of departure to work in Columbus are 7:30 AM to 7:59 AM (2,247, 17.6%) for males and 7:30 AM to 7:59 AM (1,909, 19.9%) for females.
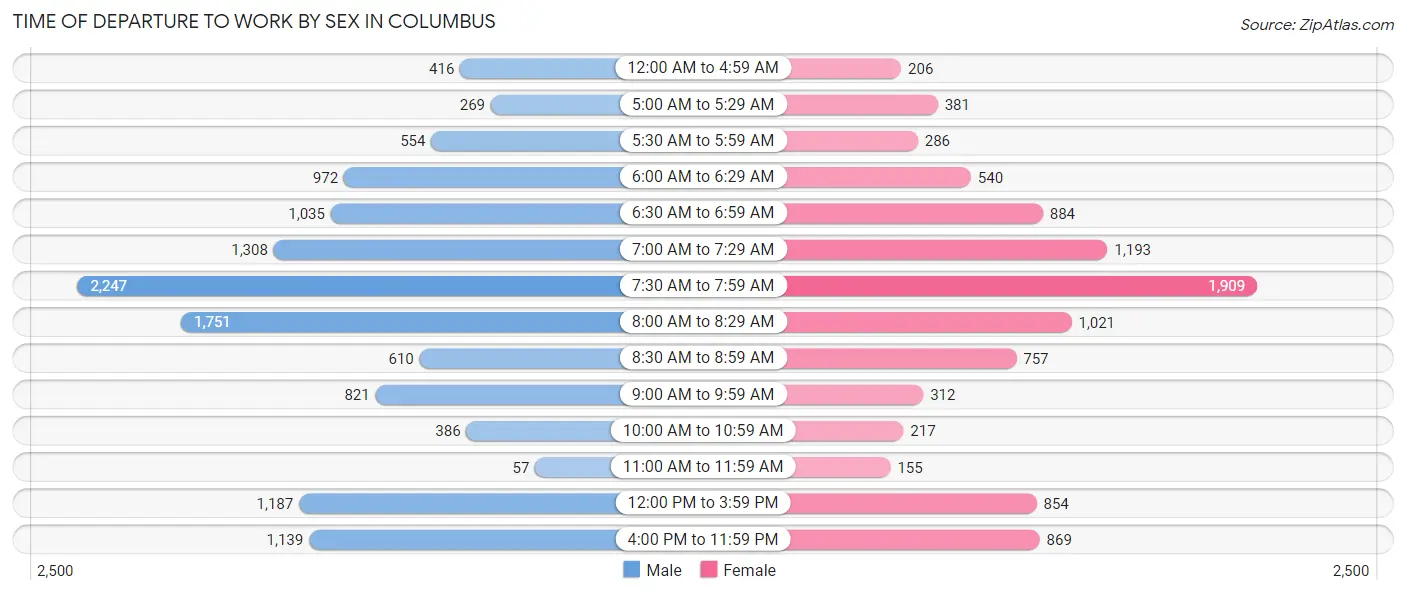
| Time of Departure | Male | Female |
| 12:00 AM to 4:59 AM | 416 (3.3%) | 206 (2.1%) |
| 5:00 AM to 5:29 AM | 269 (2.1%) | 381 (4.0%) |
| 5:30 AM to 5:59 AM | 554 (4.3%) | 286 (3.0%) |
| 6:00 AM to 6:29 AM | 972 (7.6%) | 540 (5.6%) |
| 6:30 AM to 6:59 AM | 1,035 (8.1%) | 884 (9.2%) |
| 7:00 AM to 7:29 AM | 1,308 (10.3%) | 1,193 (12.4%) |
| 7:30 AM to 7:59 AM | 2,247 (17.6%) | 1,909 (19.9%) |
| 8:00 AM to 8:29 AM | 1,751 (13.7%) | 1,021 (10.6%) |
| 8:30 AM to 8:59 AM | 610 (4.8%) | 757 (7.9%) |
| 9:00 AM to 9:59 AM | 821 (6.4%) | 312 (3.3%) |
| 10:00 AM to 10:59 AM | 386 (3.0%) | 217 (2.3%) |
| 11:00 AM to 11:59 AM | 57 (0.4%) | 155 (1.6%) |
| 12:00 PM to 3:59 PM | 1,187 (9.3%) | 854 (8.9%) |
| 4:00 PM to 11:59 PM | 1,139 (8.9%) | 869 (9.1%) |
| Total | 12,752 (100.0%) | 9,584 (100.0%) |
Housing Occupancy in Columbus
Occupancy by Ownership in Columbus
Of the total 21,194 dwellings in Columbus, owner-occupied units account for 12,751 (60.2%), while renter-occupied units make up 8,443 (39.8%).
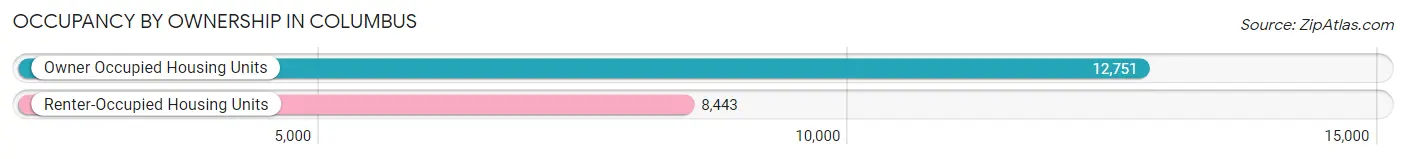
| Occupancy | # Housing Units | % Housing Units |
| Owner Occupied Housing Units | 12,751 | 60.2% |
| Renter-Occupied Housing Units | 8,443 | 39.8% |
| Total Occupied Housing Units | 21,194 | 100.0% |
Occupancy by Household Size in Columbus
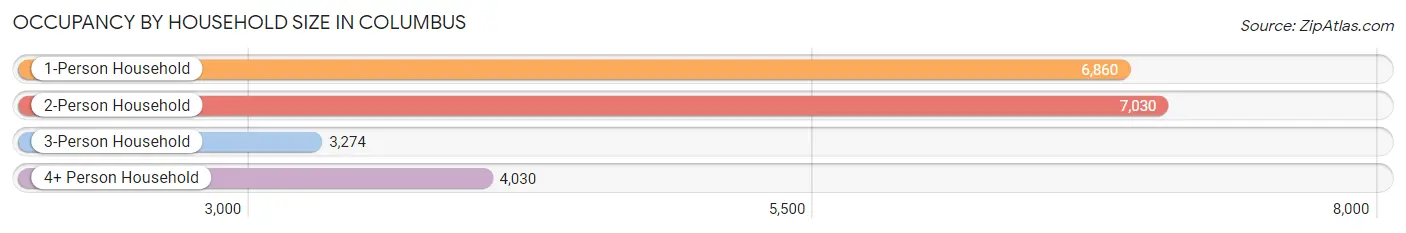
| Household Size | # Housing Units | % Housing Units |
| 1-Person Household | 6,860 | 32.4% |
| 2-Person Household | 7,030 | 33.2% |
| 3-Person Household | 3,274 | 15.4% |
| 4+ Person Household | 4,030 | 19.0% |
| Total Housing Units | 21,194 | 100.0% |
Occupancy by Ownership by Household Size in Columbus
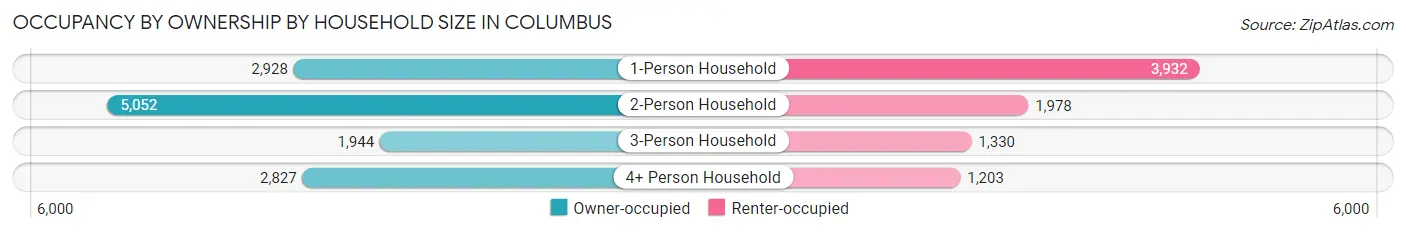
| Household Size | Owner-occupied | Renter-occupied |
| 1-Person Household | 2,928 (42.7%) | 3,932 (57.3%) |
| 2-Person Household | 5,052 (71.9%) | 1,978 (28.1%) |
| 3-Person Household | 1,944 (59.4%) | 1,330 (40.6%) |
| 4+ Person Household | 2,827 (70.2%) | 1,203 (29.8%) |
| Total Housing Units | 12,751 (60.2%) | 8,443 (39.8%) |
Occupancy by Educational Attainment in Columbus
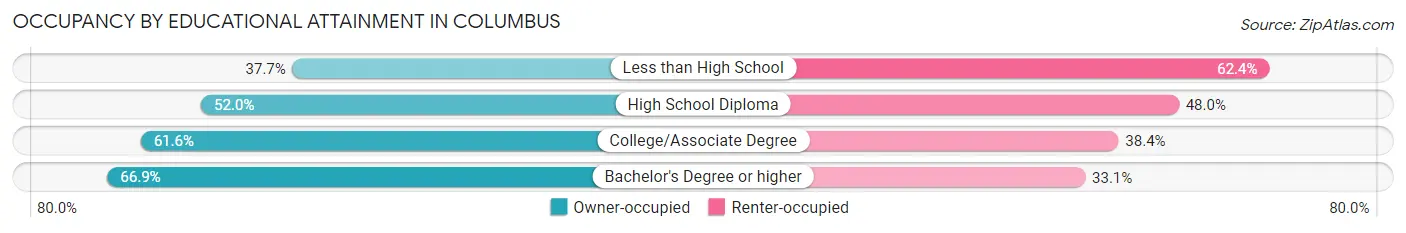
| Household Size | Owner-occupied | Renter-occupied |
| Less than High School | 468 (37.7%) | 775 (62.4%) |
| High School Diploma | 2,710 (52.0%) | 2,501 (48.0%) |
| College/Associate Degree | 3,294 (61.6%) | 2,055 (38.4%) |
| Bachelor's Degree or higher | 6,279 (66.9%) | 3,112 (33.1%) |
Occupancy by Age of Householder in Columbus
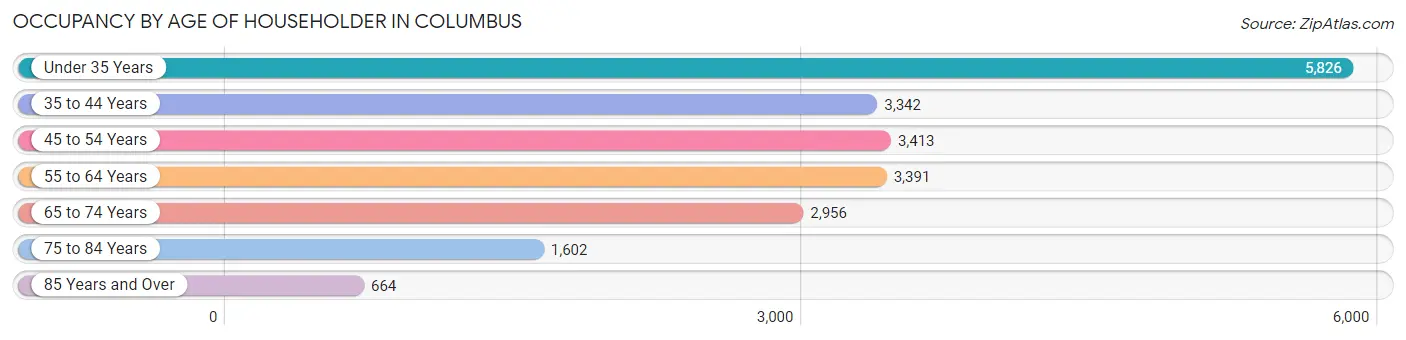
| Age Bracket | # Households | % Households |
| Under 35 Years | 5,826 | 27.5% |
| 35 to 44 Years | 3,342 | 15.8% |
| 45 to 54 Years | 3,413 | 16.1% |
| 55 to 64 Years | 3,391 | 16.0% |
| 65 to 74 Years | 2,956 | 14.0% |
| 75 to 84 Years | 1,602 | 7.6% |
| 85 Years and Over | 664 | 3.1% |
| Total | 21,194 | 100.0% |
Housing Finances in Columbus
Median Income by Occupancy in Columbus
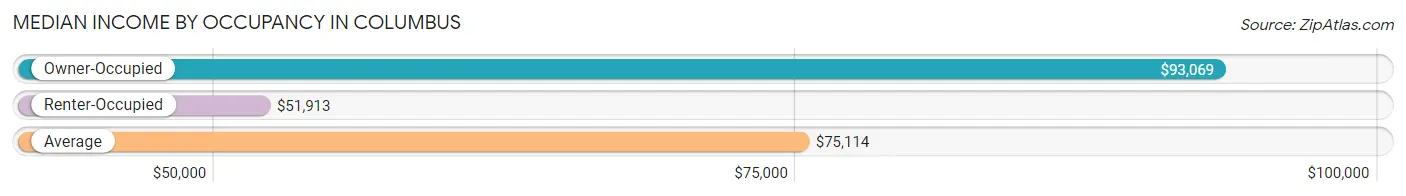
| Occupancy Type | # Households | Median Income |
| Owner-Occupied | 12,751 (60.2%) | $93,069 |
| Renter-Occupied | 8,443 (39.8%) | $51,913 |
| Average | 21,194 (100.0%) | $75,114 |
Occupancy by Householder Income Bracket in Columbus
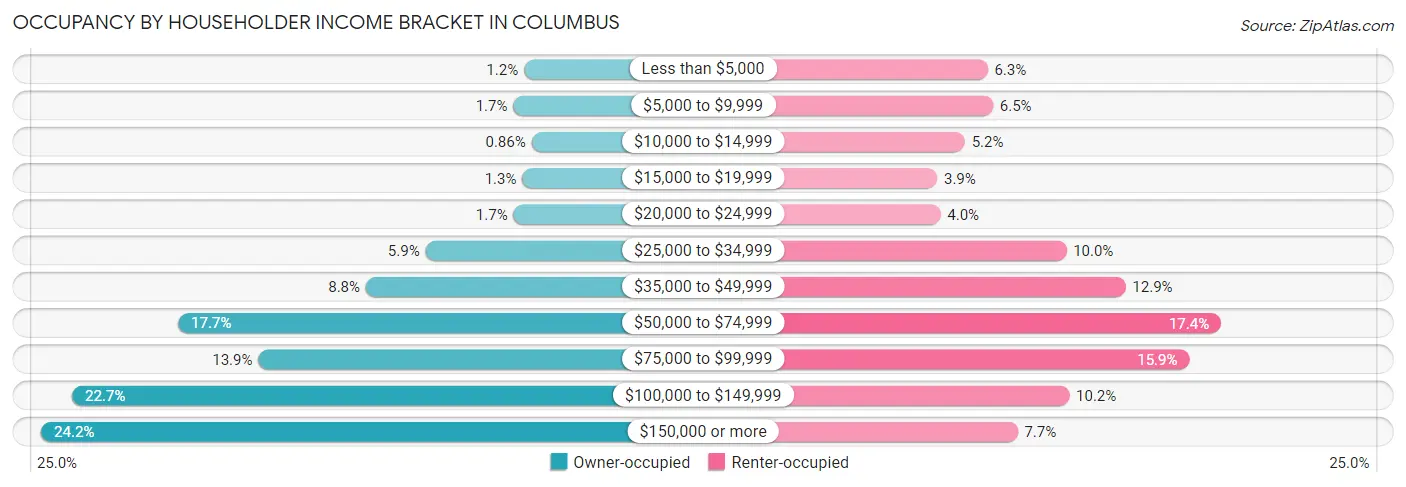
| Income Bracket | Owner-occupied | Renter-occupied |
| Less than $5,000 | 156 (1.2%) | 530 (6.3%) |
| $5,000 to $9,999 | 220 (1.7%) | 552 (6.5%) |
| $10,000 to $14,999 | 110 (0.9%) | 439 (5.2%) |
| $15,000 to $19,999 | 166 (1.3%) | 328 (3.9%) |
| $20,000 to $24,999 | 219 (1.7%) | 341 (4.0%) |
| $25,000 to $34,999 | 753 (5.9%) | 847 (10.0%) |
| $35,000 to $49,999 | 1,116 (8.7%) | 1,085 (12.9%) |
| $50,000 to $74,999 | 2,256 (17.7%) | 1,469 (17.4%) |
| $75,000 to $99,999 | 1,768 (13.9%) | 1,342 (15.9%) |
| $100,000 to $149,999 | 2,900 (22.7%) | 859 (10.2%) |
| $150,000 or more | 3,087 (24.2%) | 651 (7.7%) |
| Total | 12,751 (100.0%) | 8,443 (100.0%) |
Monthly Housing Cost Tiers in Columbus
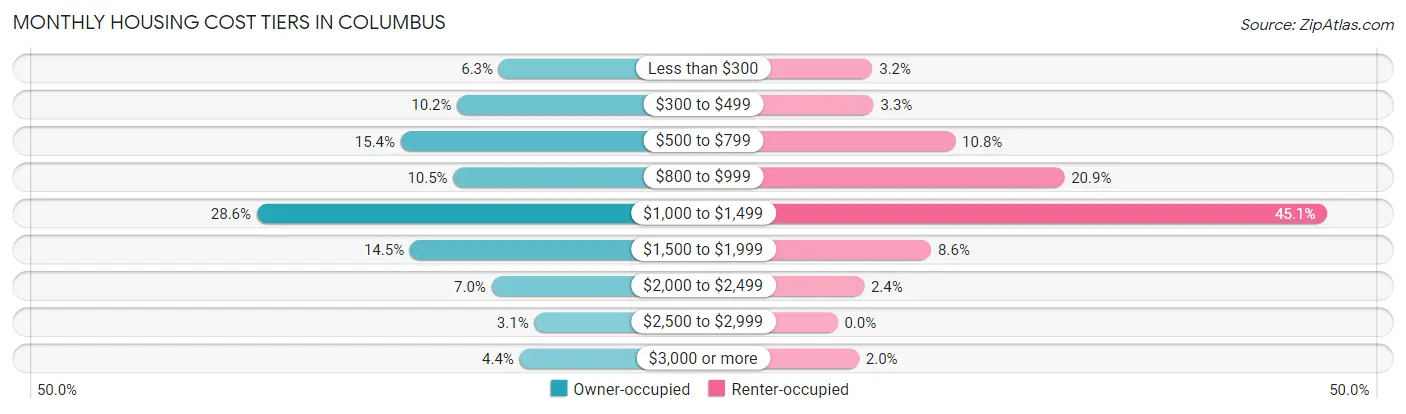
| Monthly Cost | Owner-occupied | Renter-occupied |
| Less than $300 | 808 (6.3%) | 271 (3.2%) |
| $300 to $499 | 1,295 (10.2%) | 281 (3.3%) |
| $500 to $799 | 1,959 (15.4%) | 915 (10.8%) |
| $800 to $999 | 1,341 (10.5%) | 1,763 (20.9%) |
| $1,000 to $1,499 | 3,649 (28.6%) | 3,807 (45.1%) |
| $1,500 to $1,999 | 1,852 (14.5%) | 729 (8.6%) |
| $2,000 to $2,499 | 893 (7.0%) | 206 (2.4%) |
| $2,500 to $2,999 | 390 (3.1%) | 0 (0.0%) |
| $3,000 or more | 564 (4.4%) | 166 (2.0%) |
| Total | 12,751 (100.0%) | 8,443 (100.0%) |
Physical Housing Characteristics in Columbus
Housing Structures in Columbus
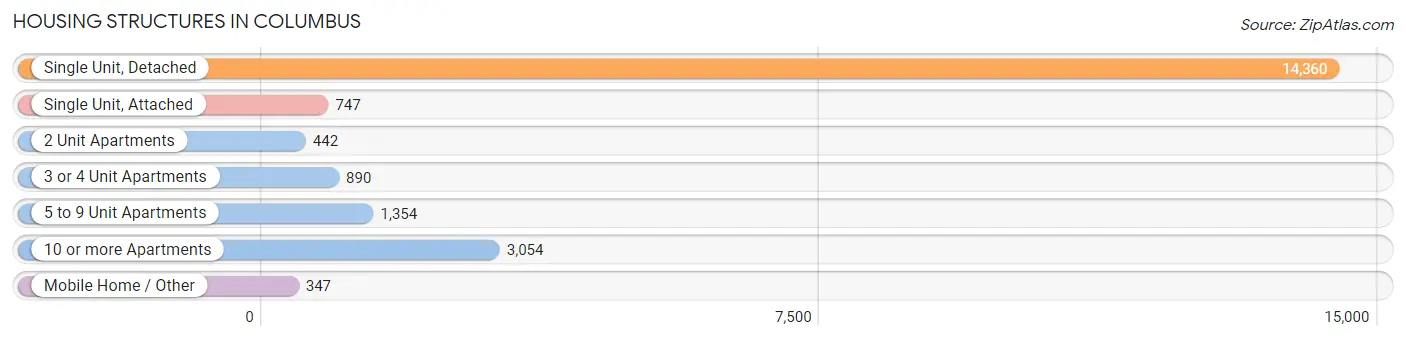
| Structure Type | # Housing Units | % Housing Units |
| Single Unit, Detached | 14,360 | 67.8% |
| Single Unit, Attached | 747 | 3.5% |
| 2 Unit Apartments | 442 | 2.1% |
| 3 or 4 Unit Apartments | 890 | 4.2% |
| 5 to 9 Unit Apartments | 1,354 | 6.4% |
| 10 or more Apartments | 3,054 | 14.4% |
| Mobile Home / Other | 347 | 1.6% |
| Total | 21,194 | 100.0% |
Housing Structures by Occupancy in Columbus
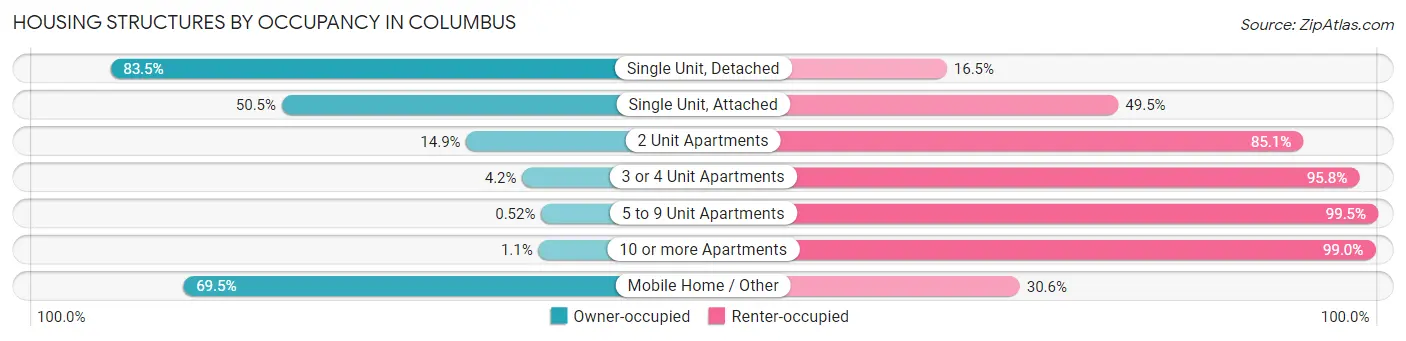
| Structure Type | Owner-occupied | Renter-occupied |
| Single Unit, Detached | 11,991 (83.5%) | 2,369 (16.5%) |
| Single Unit, Attached | 377 (50.5%) | 370 (49.5%) |
| 2 Unit Apartments | 66 (14.9%) | 376 (85.1%) |
| 3 or 4 Unit Apartments | 37 (4.2%) | 853 (95.8%) |
| 5 to 9 Unit Apartments | 7 (0.5%) | 1,347 (99.5%) |
| 10 or more Apartments | 32 (1.1%) | 3,022 (99.0%) |
| Mobile Home / Other | 241 (69.5%) | 106 (30.5%) |
| Total | 12,751 (60.2%) | 8,443 (39.8%) |
Housing Structures by Number of Rooms in Columbus
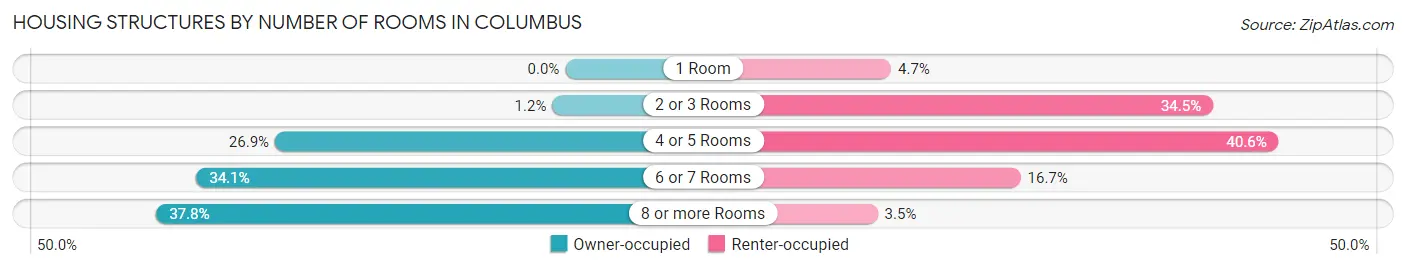
| Number of Rooms | Owner-occupied | Renter-occupied |
| 1 Room | 0 (0.0%) | 399 (4.7%) |
| 2 or 3 Rooms | 153 (1.2%) | 2,913 (34.5%) |
| 4 or 5 Rooms | 3,424 (26.9%) | 3,425 (40.6%) |
| 6 or 7 Rooms | 4,351 (34.1%) | 1,411 (16.7%) |
| 8 or more Rooms | 4,823 (37.8%) | 295 (3.5%) |
| Total | 12,751 (100.0%) | 8,443 (100.0%) |
Housing Structure by Heating Type in Columbus
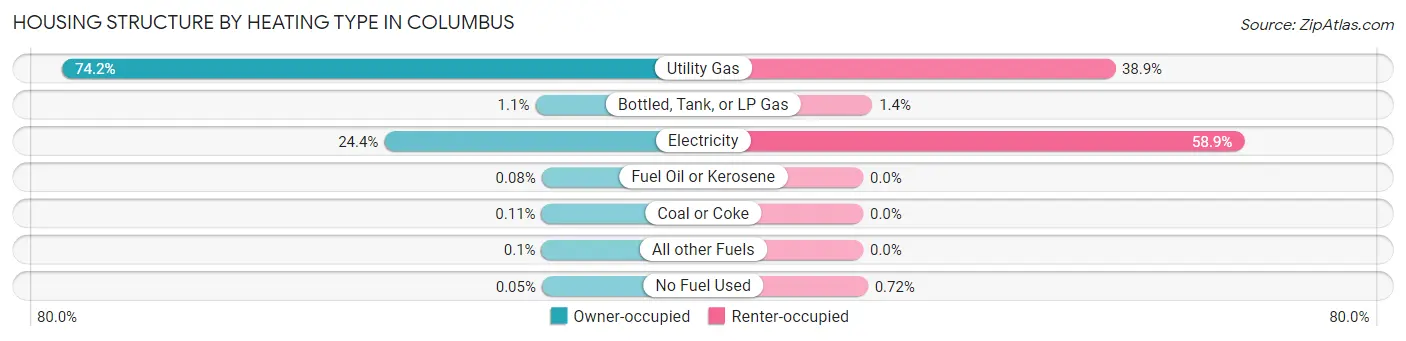
| Heating Type | Owner-occupied | Renter-occupied |
| Utility Gas | 9,460 (74.2%) | 3,288 (38.9%) |
| Bottled, Tank, or LP Gas | 135 (1.1%) | 120 (1.4%) |
| Electricity | 3,112 (24.4%) | 4,974 (58.9%) |
| Fuel Oil or Kerosene | 10 (0.1%) | 0 (0.0%) |
| Coal or Coke | 14 (0.1%) | 0 (0.0%) |
| All other Fuels | 13 (0.1%) | 0 (0.0%) |
| No Fuel Used | 7 (0.1%) | 61 (0.7%) |
| Total | 12,751 (100.0%) | 8,443 (100.0%) |
Household Vehicle Usage in Columbus
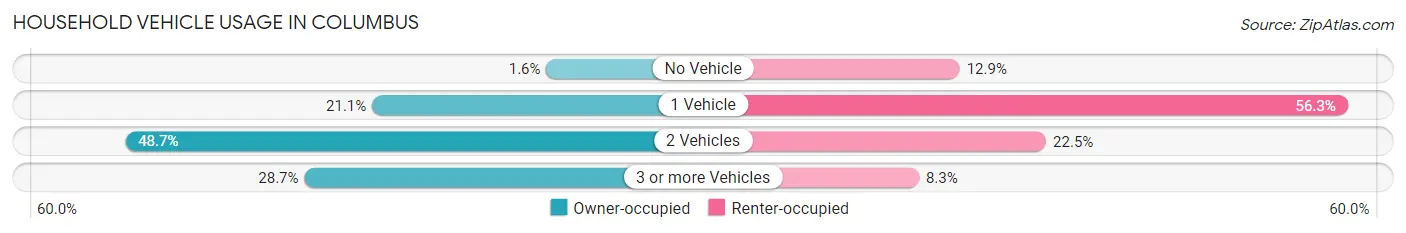
| Vehicles per Household | Owner-occupied | Renter-occupied |
| No Vehicle | 198 (1.5%) | 1,086 (12.9%) |
| 1 Vehicle | 2,686 (21.1%) | 4,754 (56.3%) |
| 2 Vehicles | 6,213 (48.7%) | 1,903 (22.5%) |
| 3 or more Vehicles | 3,654 (28.7%) | 700 (8.3%) |
| Total | 12,751 (100.0%) | 8,443 (100.0%) |
Real Estate & Mortgages in Columbus
Real Estate and Mortgage Overview in Columbus
| Characteristic | Without Mortgage | With Mortgage |
| Housing Units | 3,849 | 8,902 |
| Median Property Value | $189,100 | $224,300 |
| Median Household Income | $63,750 | $2,458 |
| Monthly Housing Costs | $483 | $564 |
| Real Estate Taxes | $1,610 | $226 |
Property Value by Mortgage Status in Columbus
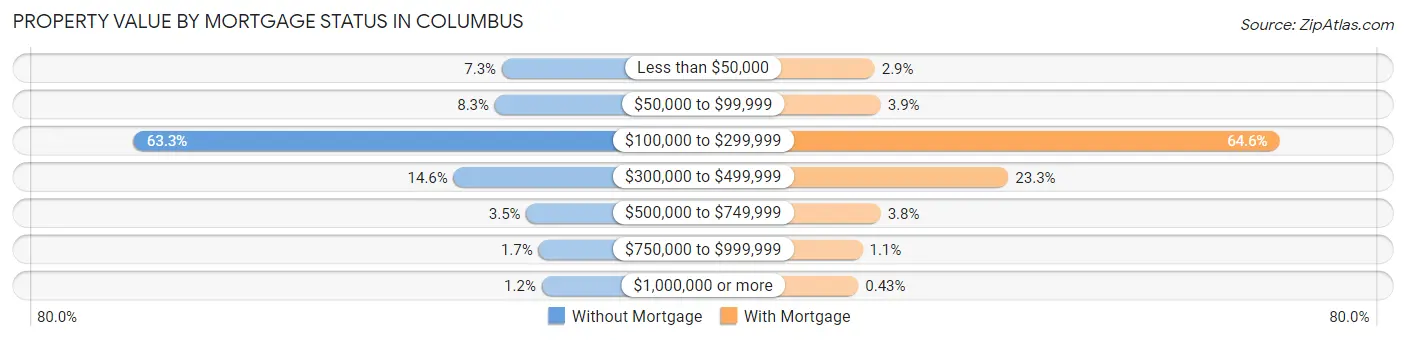
| Property Value | Without Mortgage | With Mortgage |
| Less than $50,000 | 280 (7.3%) | 261 (2.9%) |
| $50,000 to $99,999 | 321 (8.3%) | 344 (3.9%) |
| $100,000 to $299,999 | 2,438 (63.3%) | 5,750 (64.6%) |
| $300,000 to $499,999 | 563 (14.6%) | 2,073 (23.3%) |
| $500,000 to $749,999 | 136 (3.5%) | 342 (3.8%) |
| $750,000 to $999,999 | 65 (1.7%) | 94 (1.1%) |
| $1,000,000 or more | 46 (1.2%) | 38 (0.4%) |
| Total | 3,849 (100.0%) | 8,902 (100.0%) |
Household Income by Mortgage Status in Columbus
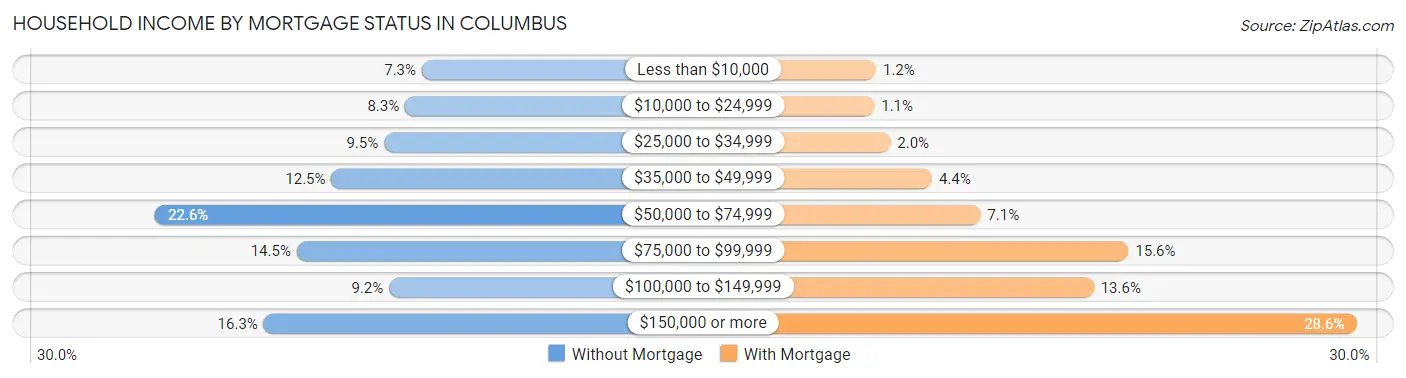
| Household Income | Without Mortgage | With Mortgage |
| Less than $10,000 | 281 (7.3%) | 104 (1.2%) |
| $10,000 to $24,999 | 318 (8.3%) | 95 (1.1%) |
| $25,000 to $34,999 | 364 (9.5%) | 177 (2.0%) |
| $35,000 to $49,999 | 480 (12.5%) | 389 (4.4%) |
| $50,000 to $74,999 | 868 (22.6%) | 636 (7.1%) |
| $75,000 to $99,999 | 556 (14.4%) | 1,388 (15.6%) |
| $100,000 to $149,999 | 353 (9.2%) | 1,212 (13.6%) |
| $150,000 or more | 629 (16.3%) | 2,547 (28.6%) |
| Total | 3,849 (100.0%) | 8,902 (100.0%) |
Property Value to Household Income Ratio in Columbus
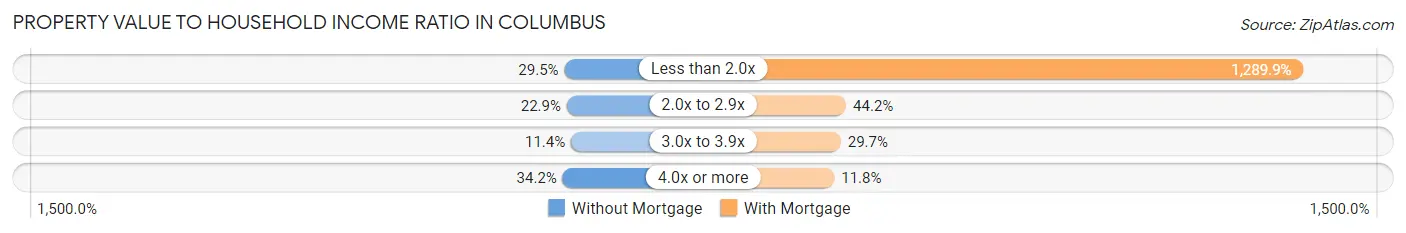
| Value-to-Income Ratio | Without Mortgage | With Mortgage |
| Less than 2.0x | 1,135 (29.5%) | 114,823 (1,289.9%) |
| 2.0x to 2.9x | 881 (22.9%) | 3,935 (44.2%) |
| 3.0x to 3.9x | 438 (11.4%) | 2,647 (29.7%) |
| 4.0x or more | 1,317 (34.2%) | 1,052 (11.8%) |
| Total | 3,849 (100.0%) | 8,902 (100.0%) |
Real Estate Taxes by Mortgage Status in Columbus
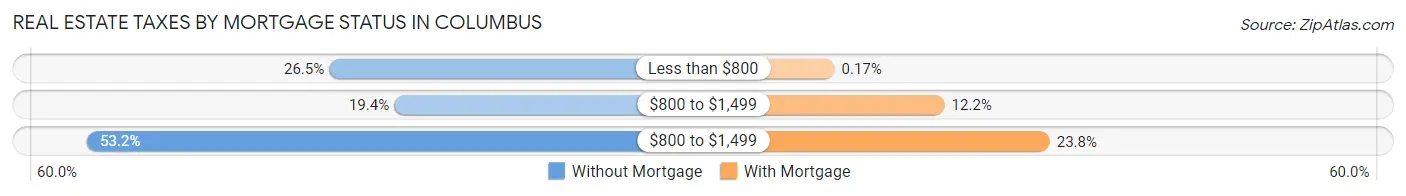
| Property Taxes | Without Mortgage | With Mortgage |
| Less than $800 | 1,021 (26.5%) | 15 (0.2%) |
| $800 to $1,499 | 747 (19.4%) | 1,089 (12.2%) |
| $800 to $1,499 | 2,046 (53.2%) | 2,114 (23.7%) |
| Total | 3,849 (100.0%) | 8,902 (100.0%) |
Health & Disability in Columbus
Health Insurance Coverage by Age in Columbus
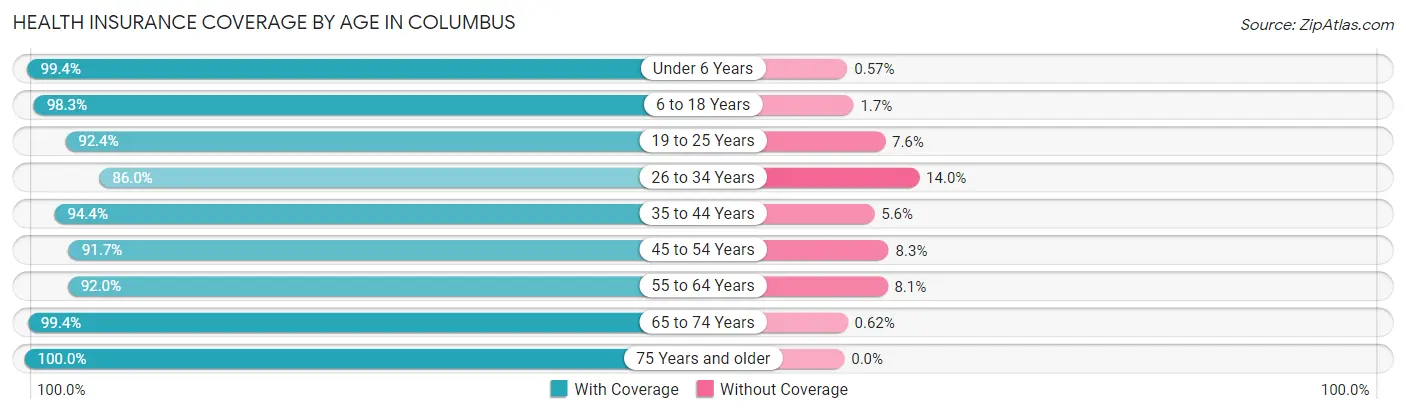
| Age Bracket | With Coverage | Without Coverage |
| Under 6 Years | 4,194 (99.4%) | 24 (0.6%) |
| 6 to 18 Years | 7,913 (98.3%) | 138 (1.7%) |
| 19 to 25 Years | 4,192 (92.4%) | 345 (7.6%) |
| 26 to 34 Years | 6,637 (86.0%) | 1,077 (14.0%) |
| 35 to 44 Years | 5,942 (94.4%) | 352 (5.6%) |
| 45 to 54 Years | 5,236 (91.7%) | 472 (8.3%) |
| 55 to 64 Years | 5,426 (91.9%) | 475 (8.1%) |
| 65 to 74 Years | 4,522 (99.4%) | 28 (0.6%) |
| 75 Years and older | 2,982 (100.0%) | 0 (0.0%) |
| Total | 47,044 (94.2%) | 2,911 (5.8%) |
Health Insurance Coverage by Citizenship Status in Columbus
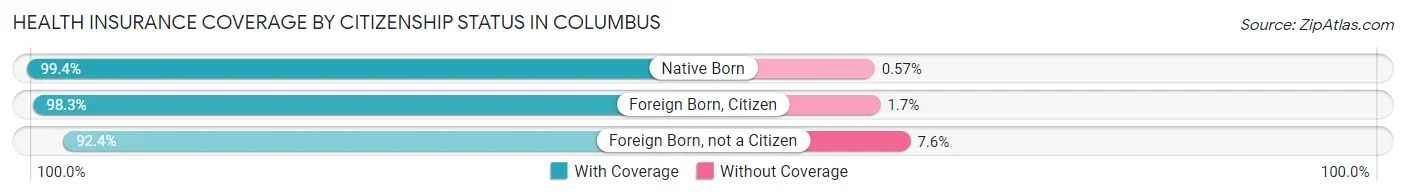
| Citizenship Status | With Coverage | Without Coverage |
| Native Born | 4,194 (99.4%) | 24 (0.6%) |
| Foreign Born, Citizen | 7,913 (98.3%) | 138 (1.7%) |
| Foreign Born, not a Citizen | 4,192 (92.4%) | 345 (7.6%) |
Health Insurance Coverage by Household Income in Columbus
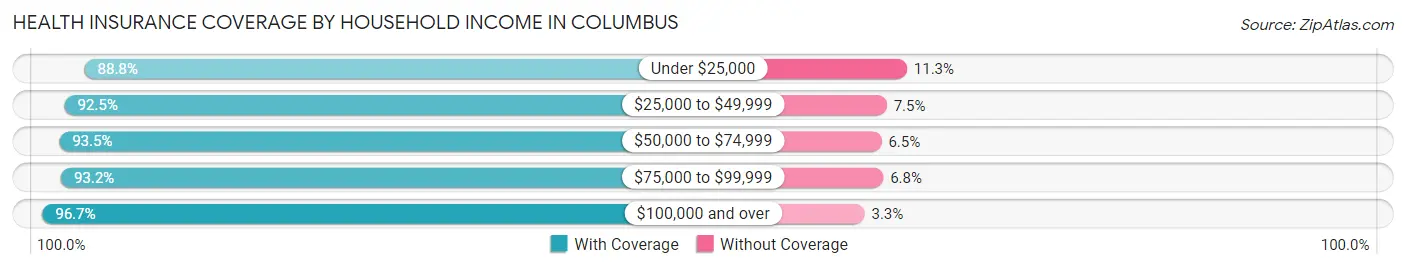
| Household Income | With Coverage | Without Coverage |
| Under $25,000 | 4,388 (88.7%) | 556 (11.3%) |
| $25,000 to $49,999 | 6,757 (92.5%) | 546 (7.5%) |
| $50,000 to $74,999 | 8,152 (93.5%) | 566 (6.5%) |
| $75,000 to $99,999 | 7,431 (93.2%) | 544 (6.8%) |
| $100,000 and over | 20,198 (96.7%) | 693 (3.3%) |
Public vs Private Health Insurance Coverage by Age in Columbus
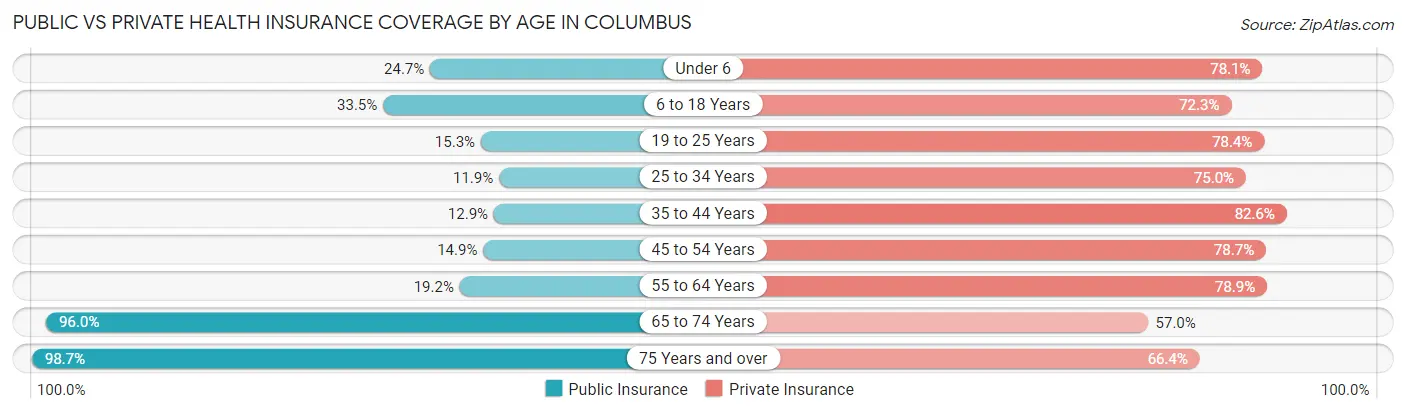
| Age Bracket | Public Insurance | Private Insurance |
| Under 6 | 1,043 (24.7%) | 3,293 (78.1%) |
| 6 to 18 Years | 2,694 (33.5%) | 5,819 (72.3%) |
| 19 to 25 Years | 694 (15.3%) | 3,557 (78.4%) |
| 25 to 34 Years | 920 (11.9%) | 5,786 (75.0%) |
| 35 to 44 Years | 811 (12.9%) | 5,197 (82.6%) |
| 45 to 54 Years | 849 (14.9%) | 4,494 (78.7%) |
| 55 to 64 Years | 1,135 (19.2%) | 4,657 (78.9%) |
| 65 to 74 Years | 4,369 (96.0%) | 2,591 (57.0%) |
| 75 Years and over | 2,942 (98.7%) | 1,981 (66.4%) |
| Total | 15,457 (30.9%) | 37,375 (74.8%) |
Disability Status by Sex by Age in Columbus
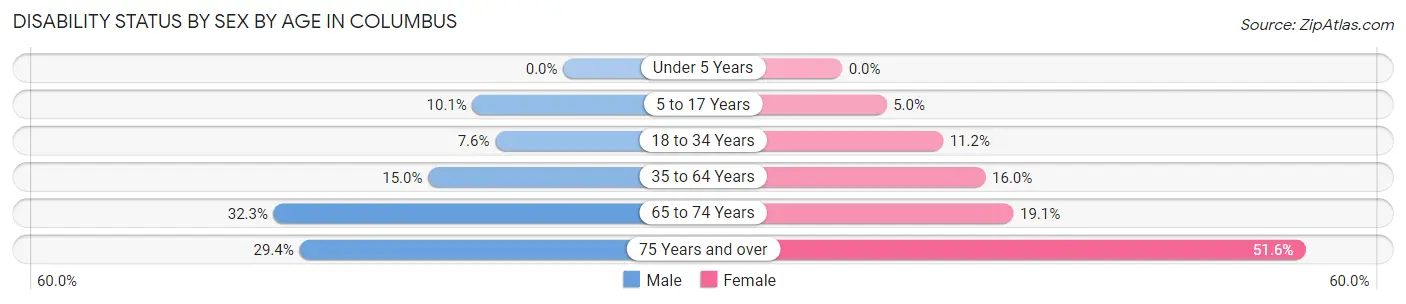
| Age Bracket | Male | Female |
| Under 5 Years | 0 (0.0%) | 0 (0.0%) |
| 5 to 17 Years | 423 (10.1%) | 198 (5.0%) |
| 18 to 34 Years | 506 (7.6%) | 672 (11.2%) |
| 35 to 64 Years | 1,373 (15.0%) | 1,401 (16.0%) |
| 65 to 74 Years | 725 (32.3%) | 439 (19.1%) |
| 75 Years and over | 354 (29.4%) | 917 (51.6%) |
Disability Class by Sex by Age in Columbus
Disability Class: Hearing Difficulty
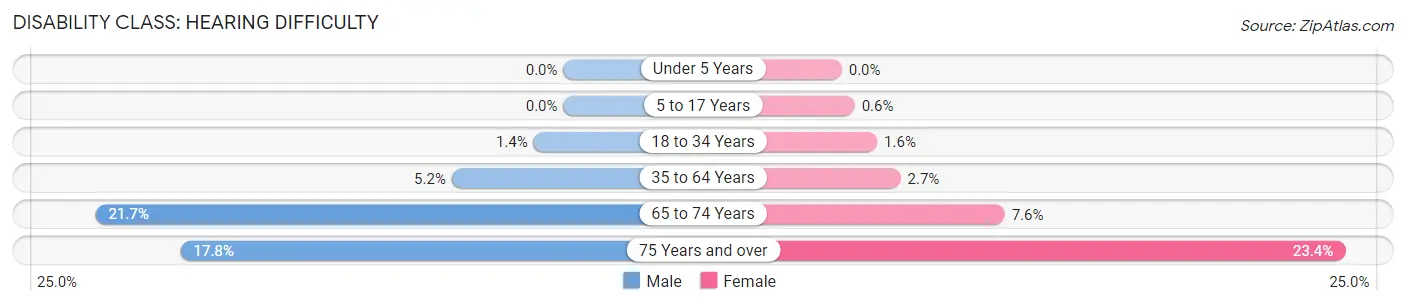
| Age Bracket | Male | Female |
| Under 5 Years | 0 (0.0%) | 0 (0.0%) |
| 5 to 17 Years | 0 (0.0%) | 24 (0.6%) |
| 18 to 34 Years | 92 (1.4%) | 98 (1.6%) |
| 35 to 64 Years | 473 (5.2%) | 240 (2.7%) |
| 65 to 74 Years | 488 (21.7%) | 174 (7.6%) |
| 75 Years and over | 214 (17.8%) | 415 (23.4%) |
Disability Class: Vision Difficulty
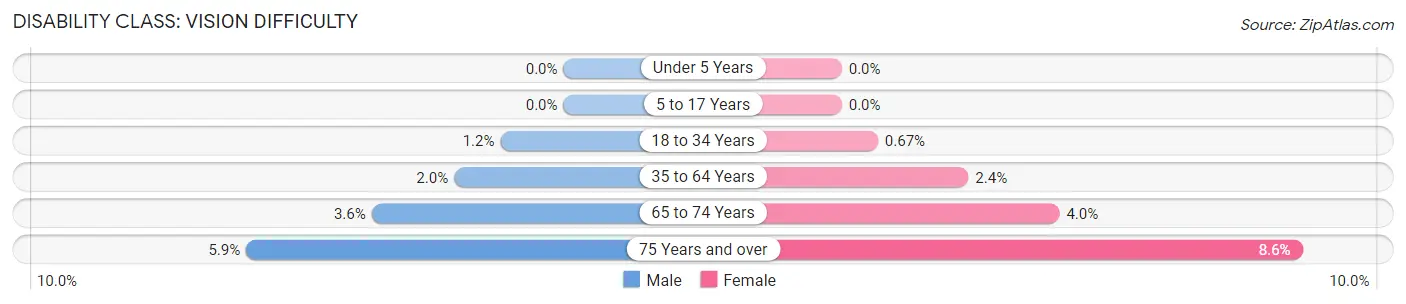
| Age Bracket | Male | Female |
| Under 5 Years | 0 (0.0%) | 0 (0.0%) |
| 5 to 17 Years | 0 (0.0%) | 0 (0.0%) |
| 18 to 34 Years | 78 (1.2%) | 40 (0.7%) |
| 35 to 64 Years | 185 (2.0%) | 206 (2.4%) |
| 65 to 74 Years | 80 (3.6%) | 93 (4.0%) |
| 75 Years and over | 71 (5.9%) | 152 (8.6%) |
Disability Class: Cognitive Difficulty
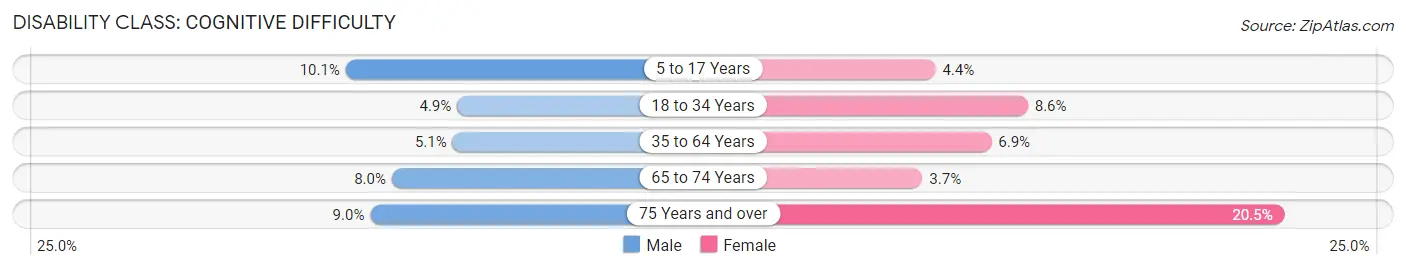
| Age Bracket | Male | Female |
| 5 to 17 Years | 423 (10.1%) | 174 (4.3%) |
| 18 to 34 Years | 329 (4.9%) | 516 (8.6%) |
| 35 to 64 Years | 469 (5.1%) | 609 (6.9%) |
| 65 to 74 Years | 179 (8.0%) | 86 (3.7%) |
| 75 Years and over | 108 (9.0%) | 365 (20.5%) |
Disability Class: Ambulatory Difficulty
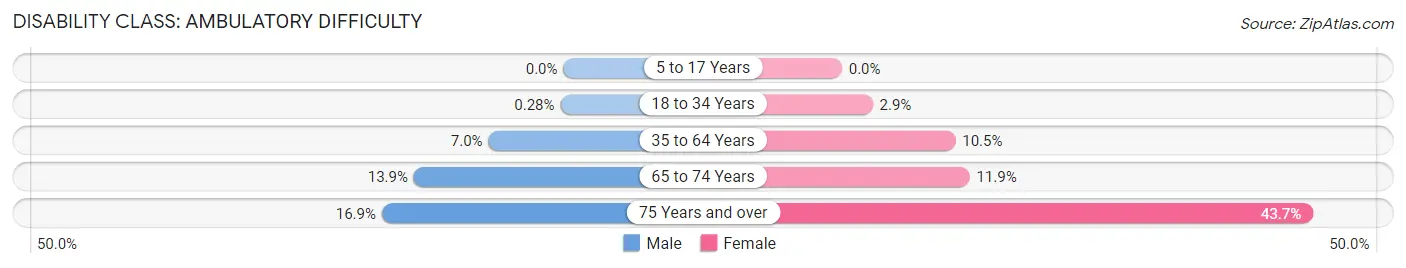
| Age Bracket | Male | Female |
| 5 to 17 Years | 0 (0.0%) | 0 (0.0%) |
| 18 to 34 Years | 19 (0.3%) | 171 (2.9%) |
| 35 to 64 Years | 634 (7.0%) | 924 (10.5%) |
| 65 to 74 Years | 312 (13.9%) | 273 (11.9%) |
| 75 Years and over | 203 (16.9%) | 777 (43.7%) |
Disability Class: Self-Care Difficulty
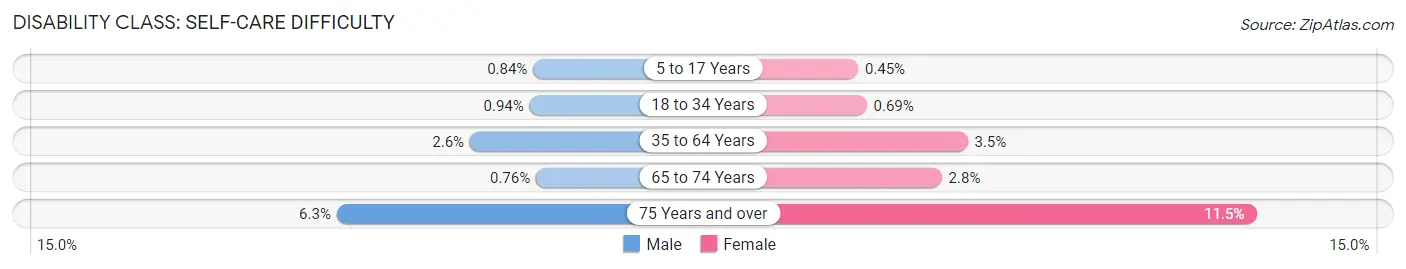
| Age Bracket | Male | Female |
| 5 to 17 Years | 35 (0.8%) | 18 (0.4%) |
| 18 to 34 Years | 63 (0.9%) | 41 (0.7%) |
| 35 to 64 Years | 237 (2.6%) | 307 (3.5%) |
| 65 to 74 Years | 17 (0.8%) | 64 (2.8%) |
| 75 Years and over | 76 (6.3%) | 205 (11.5%) |
Technology Access in Columbus
Computing Device Access in Columbus
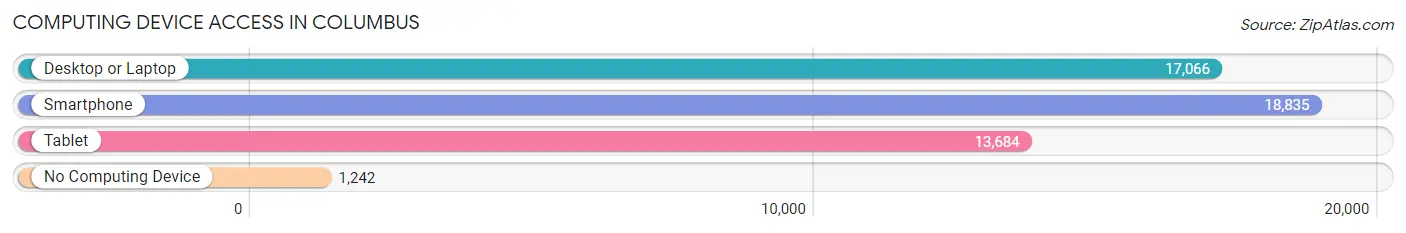
| Device Type | # Households | % Households |
| Desktop or Laptop | 17,066 | 80.5% |
| Smartphone | 18,835 | 88.9% |
| Tablet | 13,684 | 64.6% |
| No Computing Device | 1,242 | 5.9% |
| Total | 21,194 | 100.0% |
Internet Access in Columbus
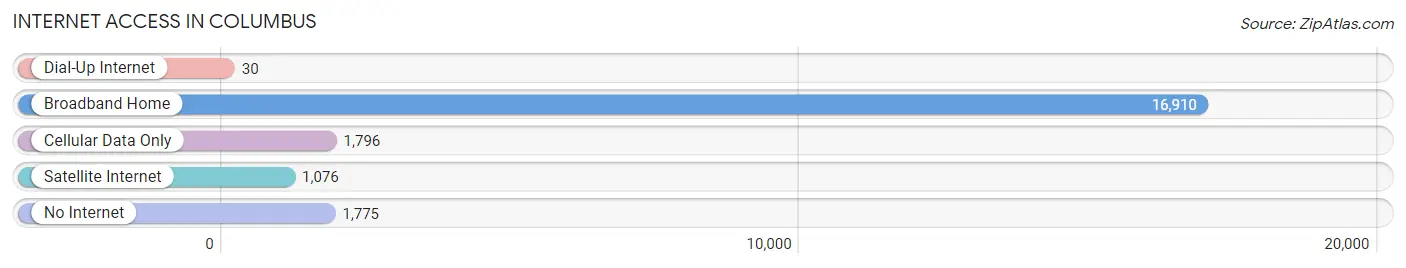
| Internet Type | # Households | % Households |
| Dial-Up Internet | 30 | 0.1% |
| Broadband Home | 16,910 | 79.8% |
| Cellular Data Only | 1,796 | 8.5% |
| Satellite Internet | 1,076 | 5.1% |
| No Internet | 1,775 | 8.4% |
| Total | 21,194 | 100.0% |
Columbus Summary
Columbus, Indiana is a city located in the southeastern part of the state, in Bartholomew County. It is the county seat and the largest city in the county. The city is situated along the east fork of the White River, and is located about 40 miles south of Indianapolis. The city has a population of approximately 46,000 people, and is the 20th largest city in the state.
History
The area that is now Columbus was first settled in 1820 by a group of settlers from Kentucky. The city was founded in 1821 by General John Tipton and named after Christopher Columbus. The city was incorporated in 1864.
In the late 19th century, Columbus became a major industrial center, with several large factories being built in the city. The city was also home to several large companies, such as Cummins Engine Company, which is still headquartered in the city.
Geography
Columbus is located in the southeastern part of the state, in Bartholomew County. The city is situated along the east fork of the White River, and is located about 40 miles south of Indianapolis. The city has a total area of 24.3 square miles, of which 24.2 square miles is land and 0.1 square miles is water.
The city is located in a hilly region, with the highest point being the summit of the hill at the intersection of State Road 46 and State Road 11. The city is also located in a region of limestone formations, which are visible in many of the city's parks and public spaces.
Economy
The economy of Columbus is largely based on manufacturing and services. The city is home to several large companies, such as Cummins Engine Company, which is still headquartered in the city. Other major employers in the city include Arvin Sango, Inc., Columbus Regional Hospital, and the Bartholomew County government.
The city also has a large tourism industry, with several attractions such as the Columbus Zoo and Aquarium, the Miller House and Garden, and the Bartholomew County Historical Society.
Demographics
As of the 2010 census, the population of Columbus was 46,001. The racial makeup of the city was 87.2% White, 8.2% African American, 0.4% Native American, 1.2% Asian, 0.1% Pacific Islander, 1.2% from other races, and 1.9% from two or more races. Hispanic or Latino of any race were 3.2% of the population.
The median income for a household in the city was $45,945, and the median income for a family was $54,945. The per capita income for the city was $24,945. About 8.2% of families and 10.2% of the population were below the poverty line, including 14.2% of those under age 18 and 6.2% of those age 65 or over.
Common Questions
What is Per Capita Income in Columbus?
Per Capita income in Columbus is $40,925.
What is the Median Family Income in Columbus?
Median Family Income in Columbus is $91,399.
What is the Median Household income in Columbus?
Median Household Income in Columbus is $75,114.
What is Income or Wage Gap in Columbus?
Income or Wage Gap in Columbus is 40.0%.
Women in Columbus earn 60.0 cents for every dollar earned by a man.
What is Family Income Deficit in Columbus?
Family Income Deficit in Columbus is $11,217.
Families that are below poverty line in Columbus earn $11,217 less on average than the poverty threshold level.
What is Inequality or Gini Index in Columbus?
Inequality or Gini Index in Columbus is 0.44.
What is the Total Population of Columbus?
Total Population of Columbus is 50,896.
What is the Total Male Population of Columbus?
Total Male Population of Columbus is 25,872.
What is the Total Female Population of Columbus?
Total Female Population of Columbus is 25,024.
What is the Ratio of Males per 100 Females in Columbus?
There are 103.39 Males per 100 Females in Columbus.
What is the Ratio of Females per 100 Males in Columbus?
There are 96.72 Females per 100 Males in Columbus.
What is the Median Population Age in Columbus?
Median Population Age in Columbus is 35.8 Years.
What is the Average Family Size in Columbus
Average Family Size in Columbus is 3.0 People.
What is the Average Household Size in Columbus
Average Household Size in Columbus is 2.4 People.
How Large is the Labor Force in Columbus?
There are 26,616 People in the Labor Forcein in Columbus.
What is the Percentage of People in the Labor Force in Columbus?
65.9% of People are in the Labor Force in Columbus.
What is the Unemployment Rate in Columbus?
Unemployment Rate in Columbus is 4.0%.